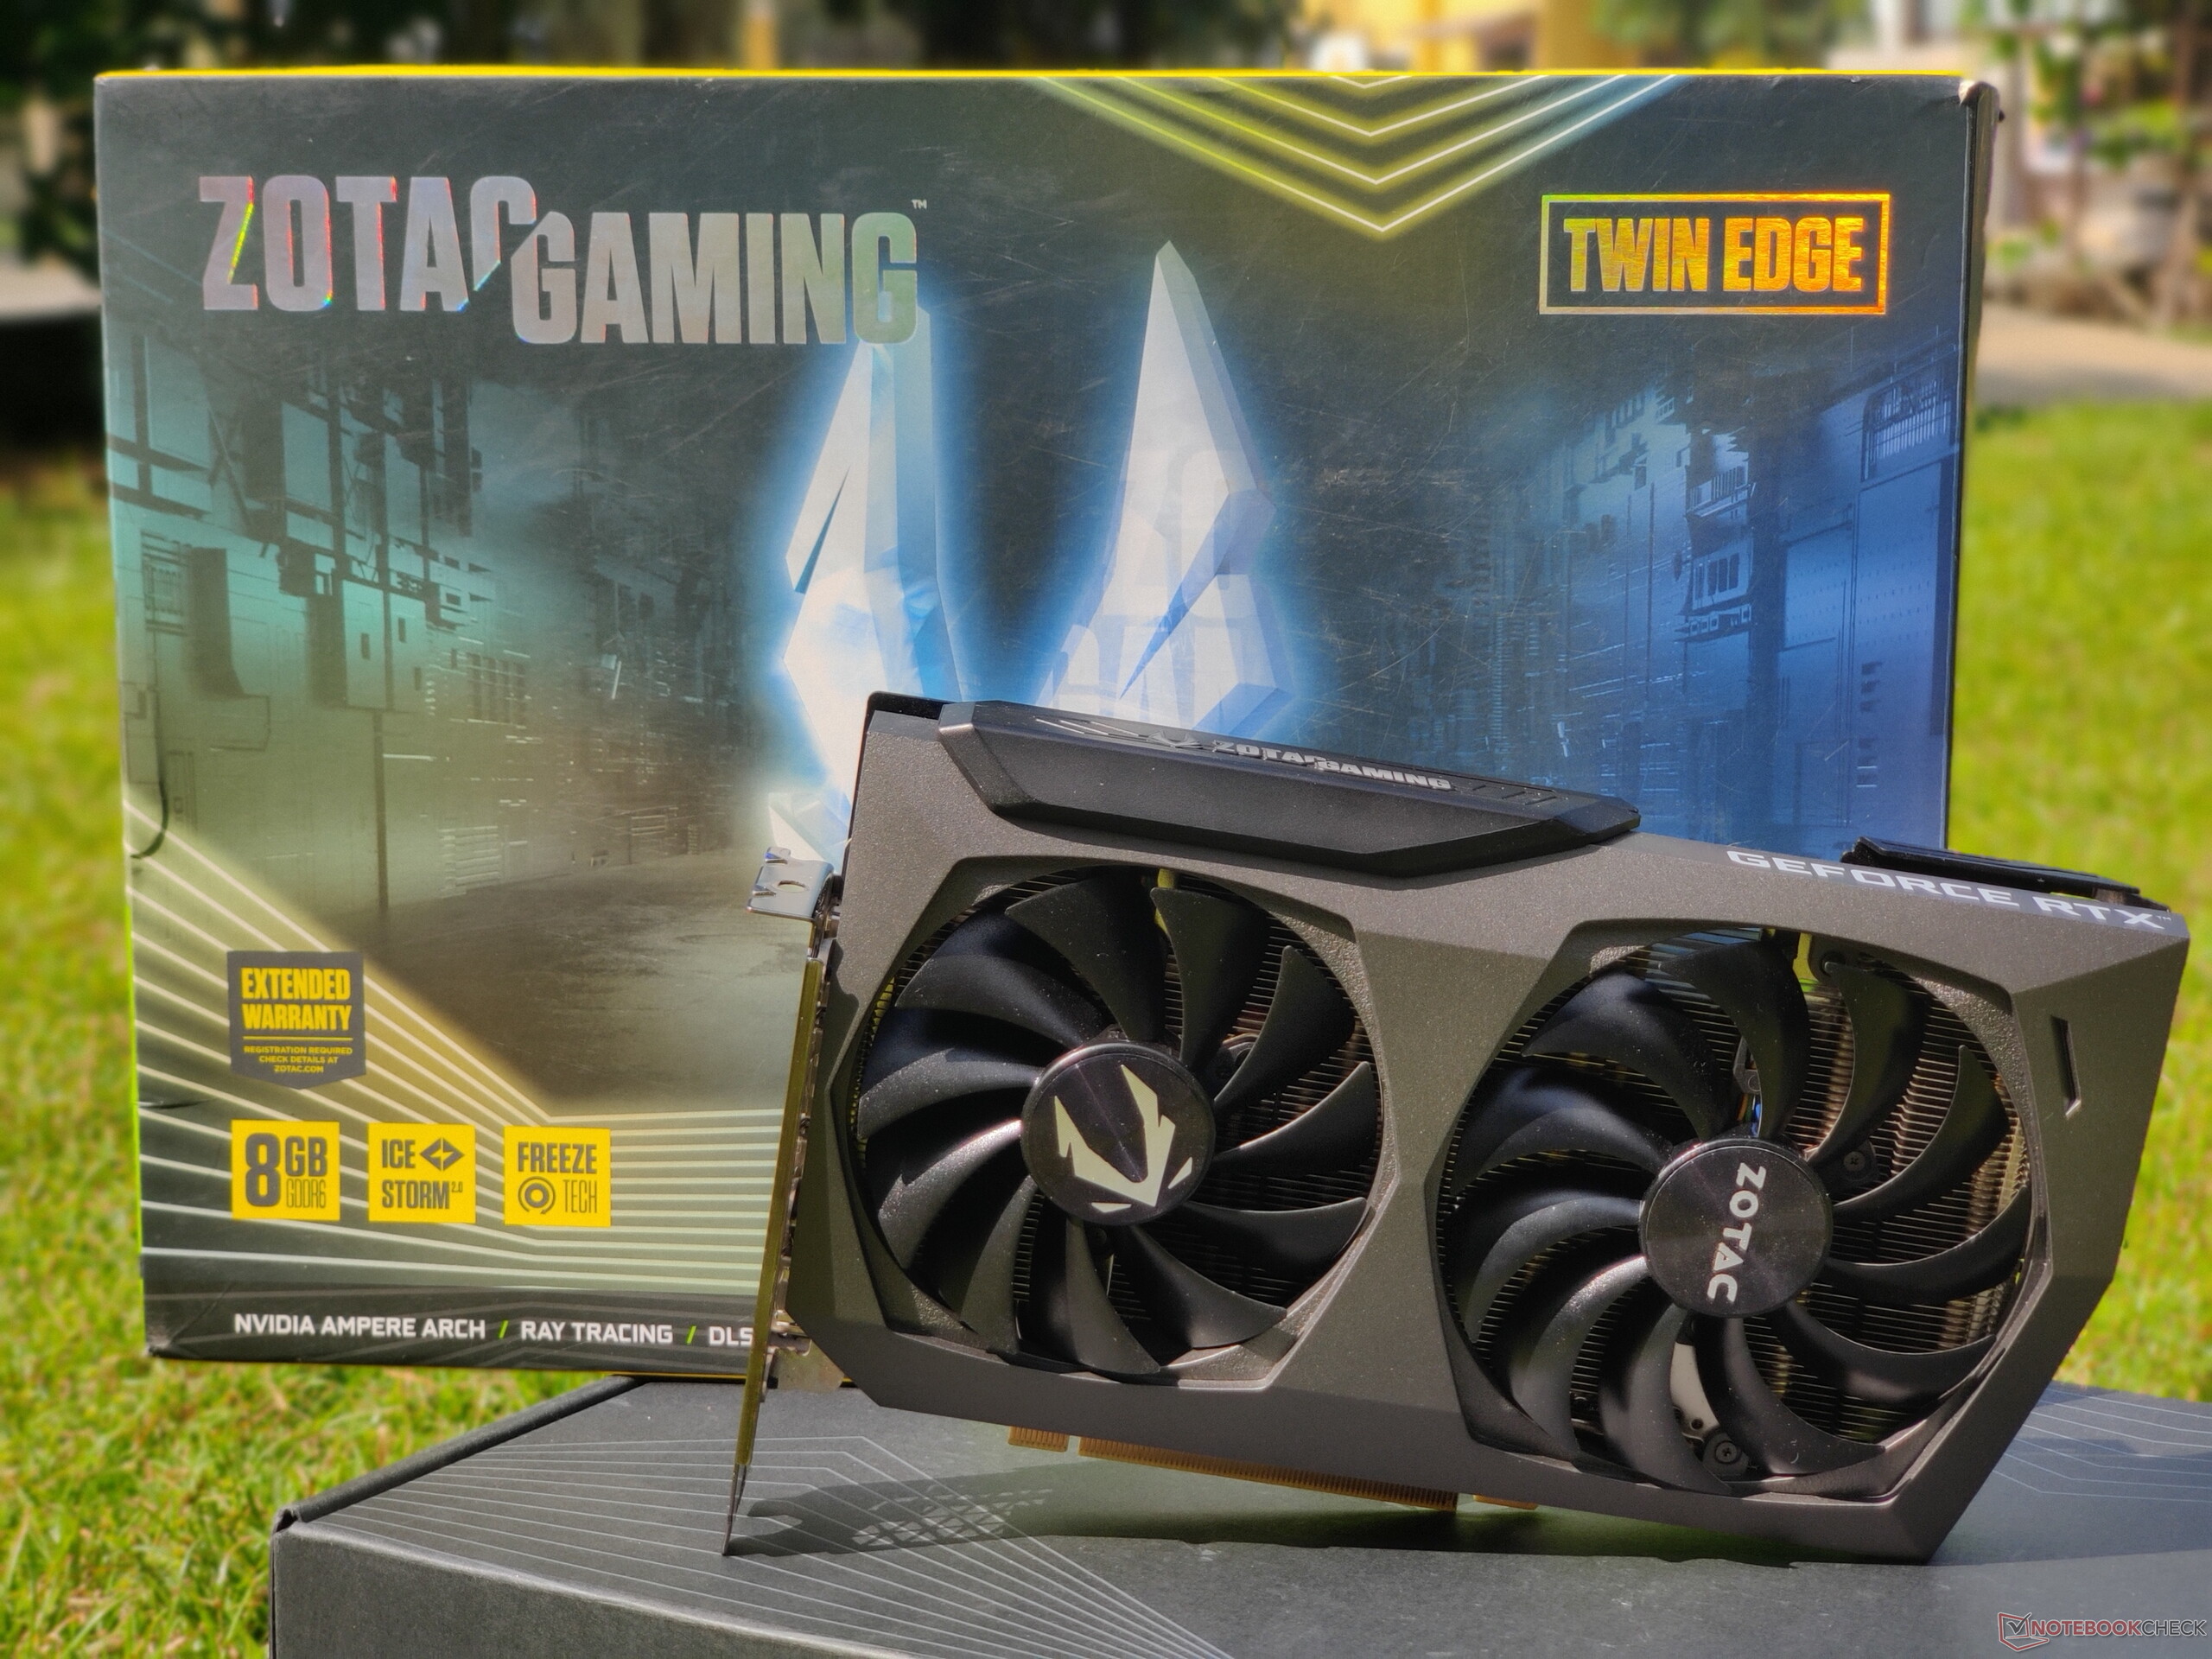
Zotac Gaming GeForce RTX 3070 Twin Edge Review: RTX 2080 Ti performance for everyone
")
During NVIDIA's Ampere launch late last year, much was spoken about how the GeForce RTX 3080 enables mainstream 4K gaming while the RTX 3090 looks to supplant the Titan RTX. In the midst of all this excitement, one card that stood out was the GeForce RTX 3070.
The RTX 3070 comes with the promise of offering RTX 2080 Ti levels of performance for less than half the price. The RTX 3070 does not feature GDDR6X memory and has lesser VRAM and memory bandwidth than the RTX 2080 TI. However, the combination of increased CUDA cores, third generation Tensor cores, second generation RT cores, and higher clocks helps bring the RTX 3070 up to speed with Turing's flagship gaming GPU.
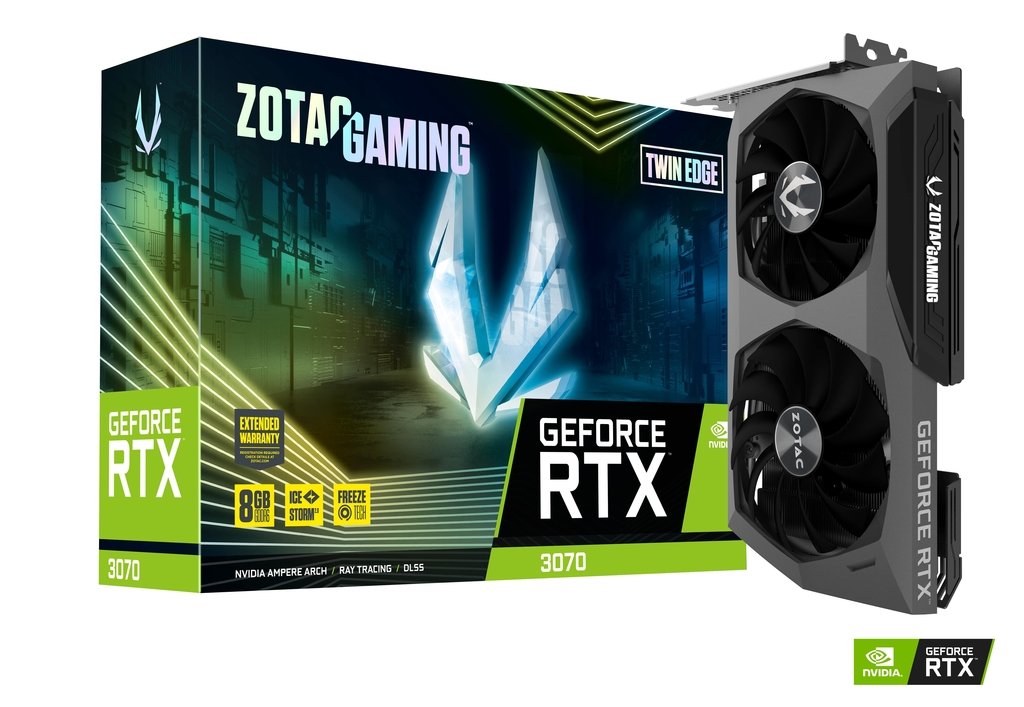
The Zotac Gaming GeForce RTX 3070 Twin Edge, as the name indicates, is a dual-fan card that is available in both OC and non-OC versions. We have the non-OC Twin Edge with us for review. This card is clocked slightly less than the Founders Edition while offering the same 220 W power envelope.
The OC version, on the other hand, is clocked only about 5 MHz higher. Those who prefer higher boosts out-of-the-box can opt for the Zotac RTX 3070 AMP Holo (240 W) and Super Mini (215 W) cards or take a look at the MSI GeForce RTX 3070 Gaming X Trio.
Comparison of the RTX 3070 with other NVIDIA GPUs
| Specification | RTX 3090 | RTX 3080 FE | Zotac RTX 3070 Twin Edge | RTX 3070 FE | Titan RTX | RTX 2080 Ti | RTX 2080 | RTX 2070 S | TITAN X Pascal |
| Chip | GA102 | GA102 | GA104 | GA104 | TU102 | TU102 | TU104 | TU104 | GP102 |
| FinFET process | 8 nm | 8 nm | 8 nm | 8 nm | 12 nm | 12 nm | 12 nm | 12 nm | 16 nm |
| CUDA cores | 10,496 | 8,704 | 5,888 | 5,888 | 4,608 | 4,352 | 2,944 | 2,560 | 3,584 |
| Texture units | 328 | 272 | 184 | 184 | 288 | 272 | 184 | 160 | 224 |
| Tensor cores | 328 3rd Gen. | 272 3rd Gen. | 184 3rd Gen. | 184 3rd Gen. | 576 2nd Gen. | 544 2nd Gen. | 368 2nd Gen. | 320 2nd Gen. | — |
| RT cores | 82 | 68 | 46 | 46 | 72 | 68 | 46 | 40 | — |
| GPU base clock | 1,395 MHz | 1,440 MHz | 1,500 MHz | 1,500 MHz | 1,350 MHz | 1,350 MHz | 1,515 MHz | 1,605 MHz | 1,417 MHz |
| GPU boost clock | 1,695 MHz | 1,710 MHz | 1,725 MHz | 1,750 MHz | 1,770 MHz | 1,545 MHz | 1,710 MHz | 1,770 MHz | 1,531 MHz |
| Memory bus | 384-bit | 320-bit | 256-bit | 256-bit | 384-bit | 352-bit | 256-bit | 256-bit | 384-bit |
| Memory bandwidth | 936 GB/s | 760 GB/s | 448 GB/s | 448 GB/s | 672 GB/s | 616 GB/s | 448 GB/s | 448 GB/s | 480.4 GB/s |
| Video memory | 24 GB GDDR6X | 10 GB GDDR6X | 8 GB GDDR6 | 8 GB GDDR6 | 24 GB GDDR6 | 11 GB GDDR6 | 8 GB GDDR6 | 8 GB GDDR6 | 12 GB GDDR5X |
| Power consumption | 350 W | 320 W | 220 W | 220 W | 280 W | 250 W | 215 W | 215 W | 250 W |
A tour of the Zotac Gaming GeForce RTX 3070 Twin Edge
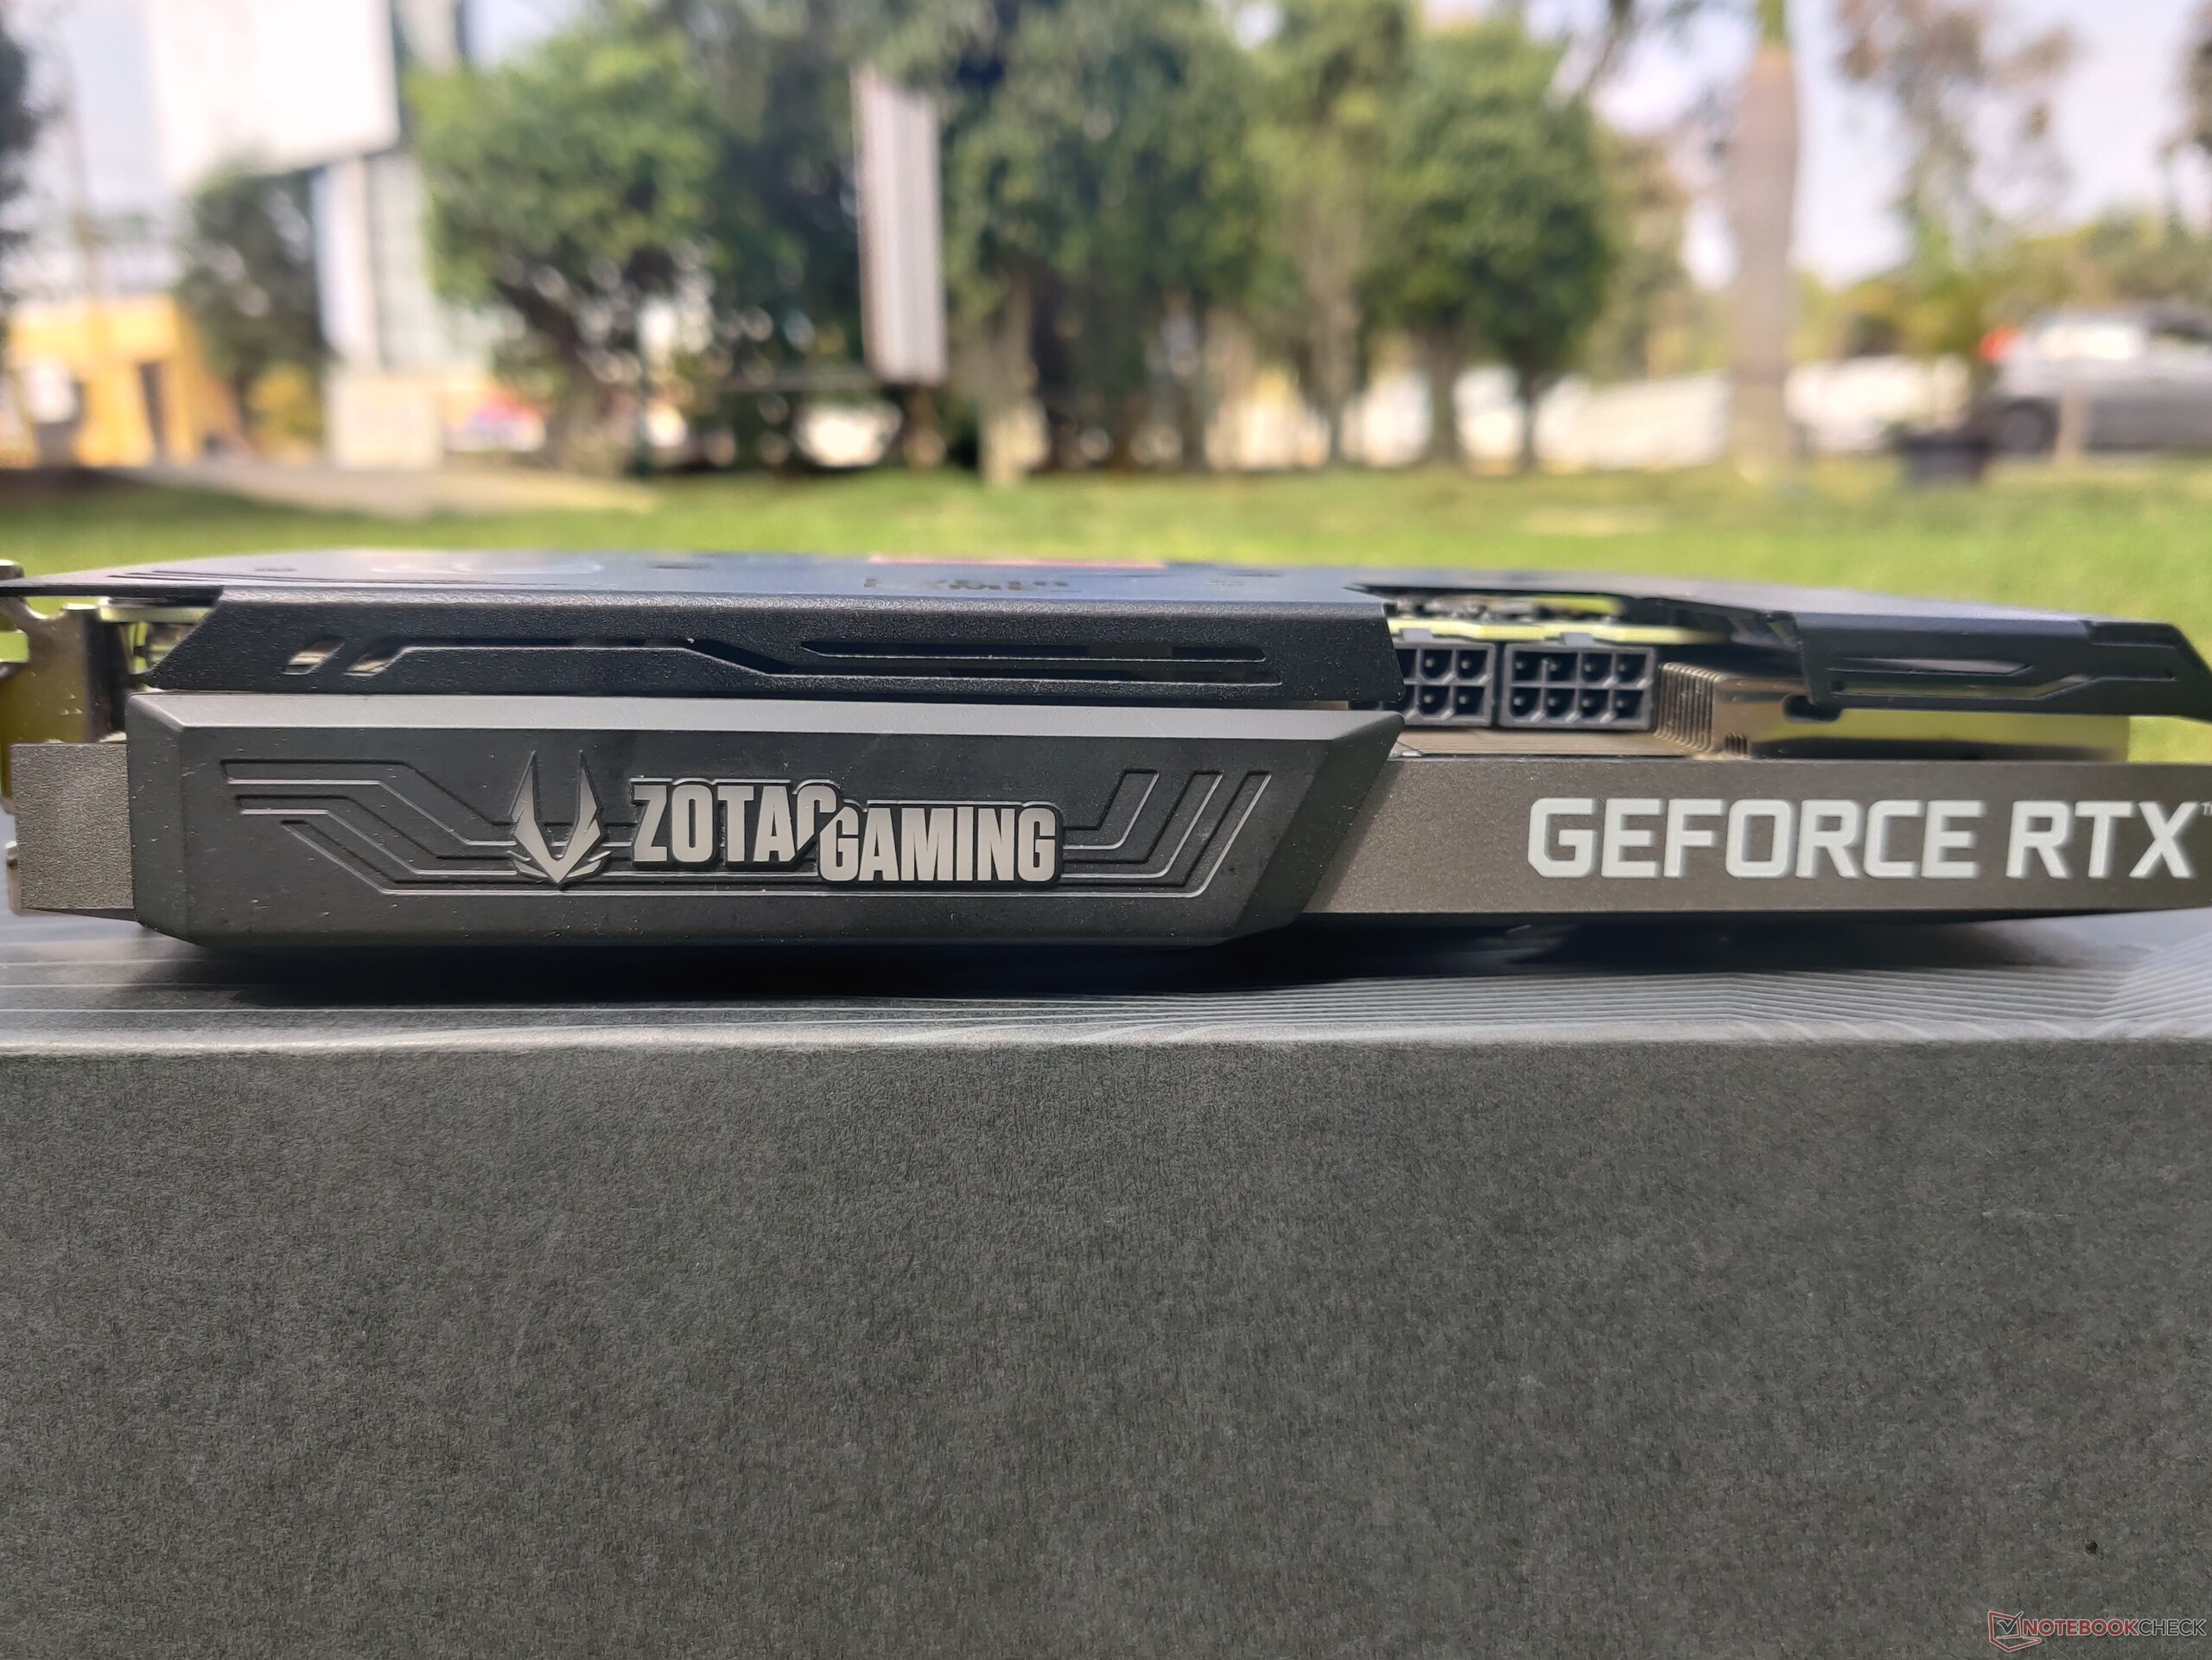
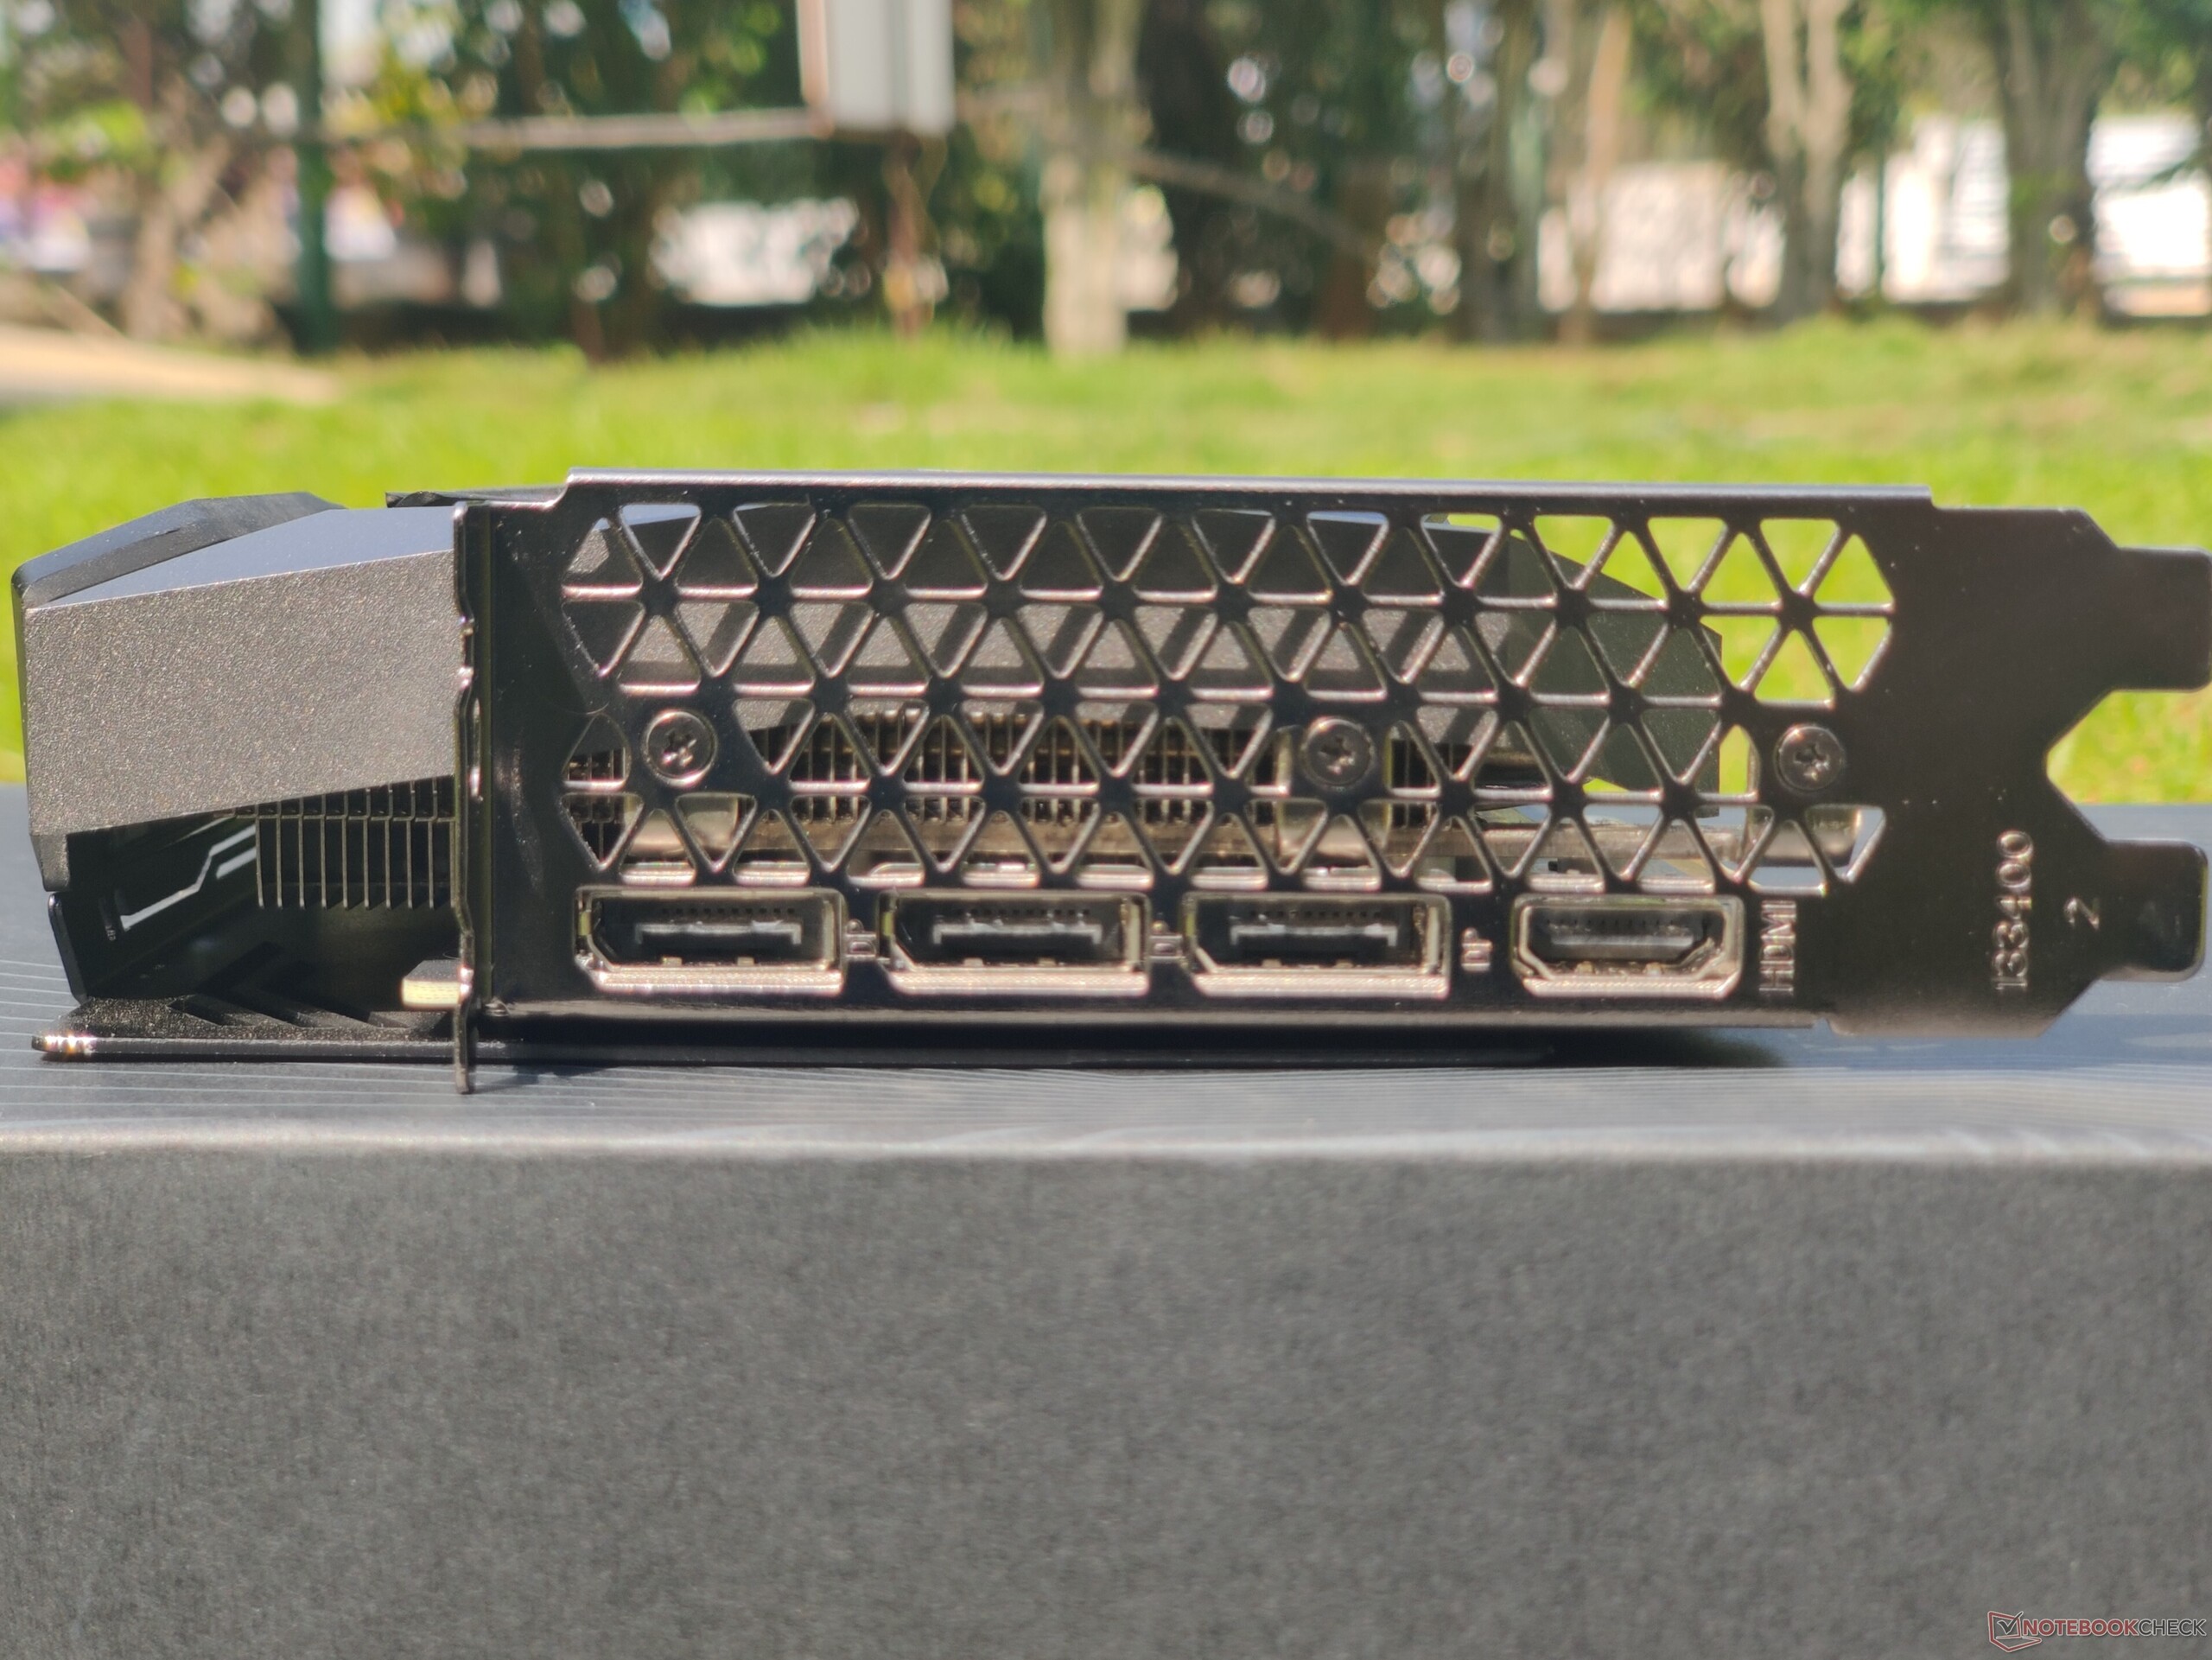
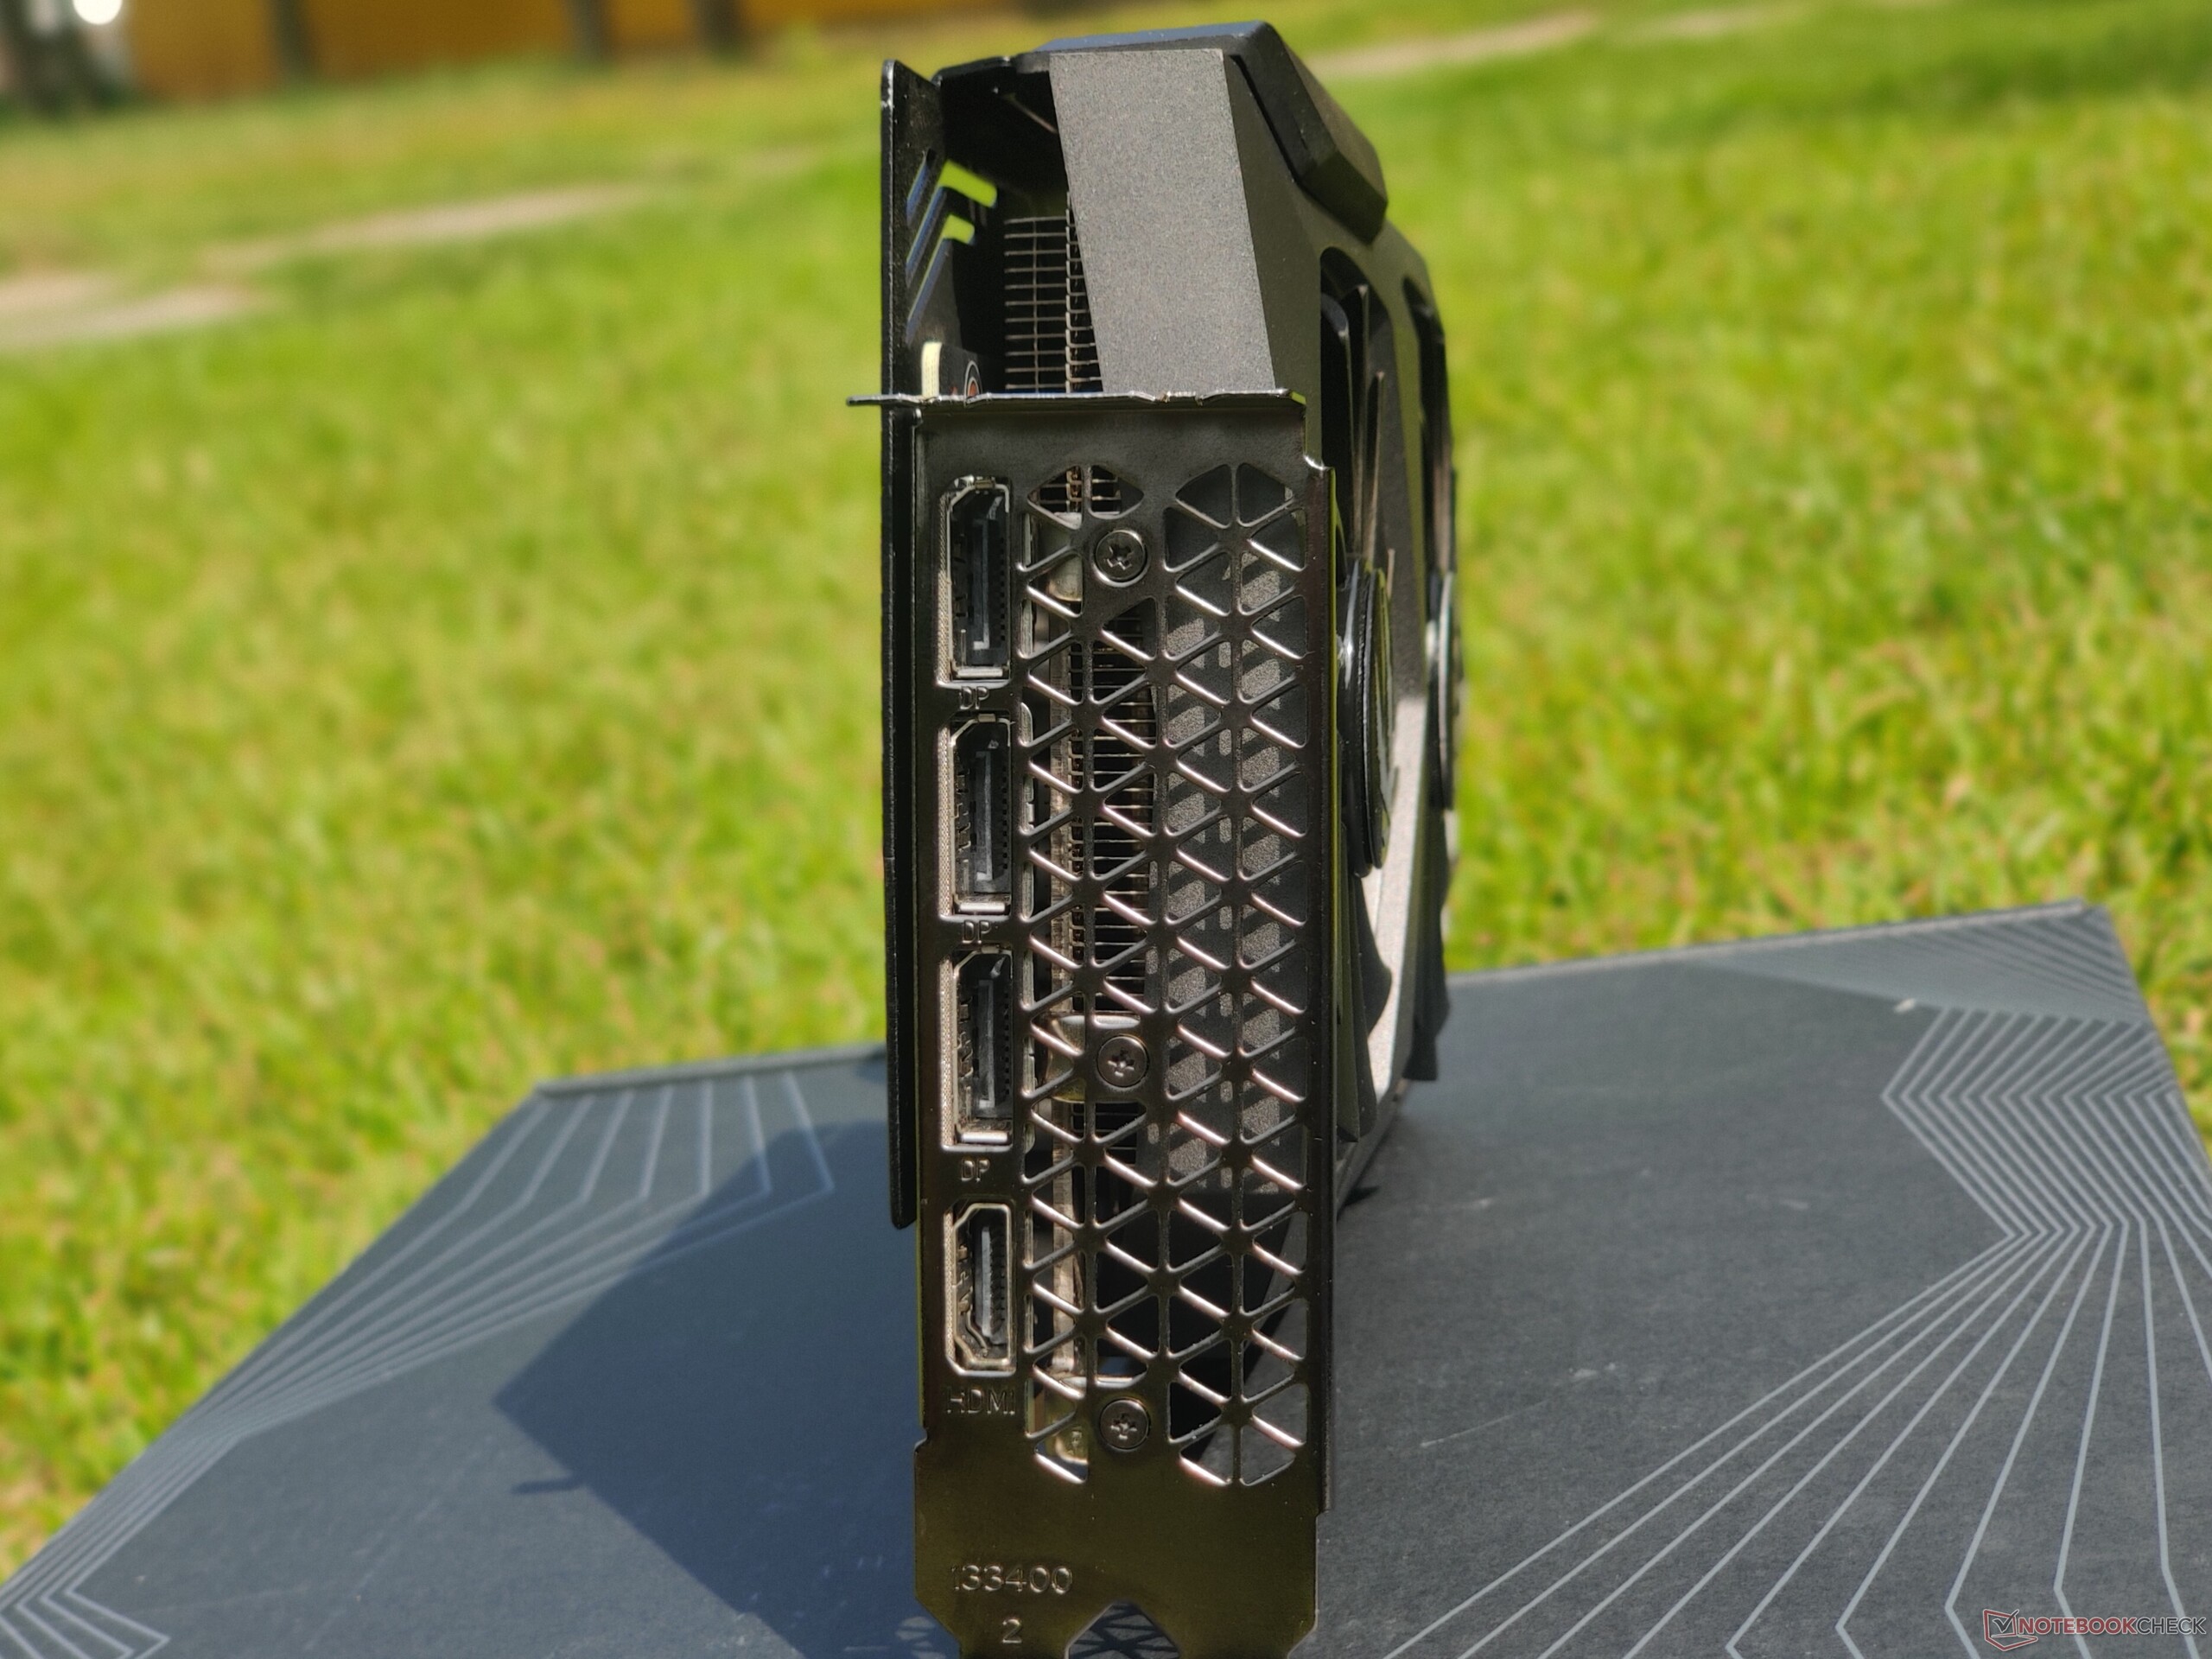
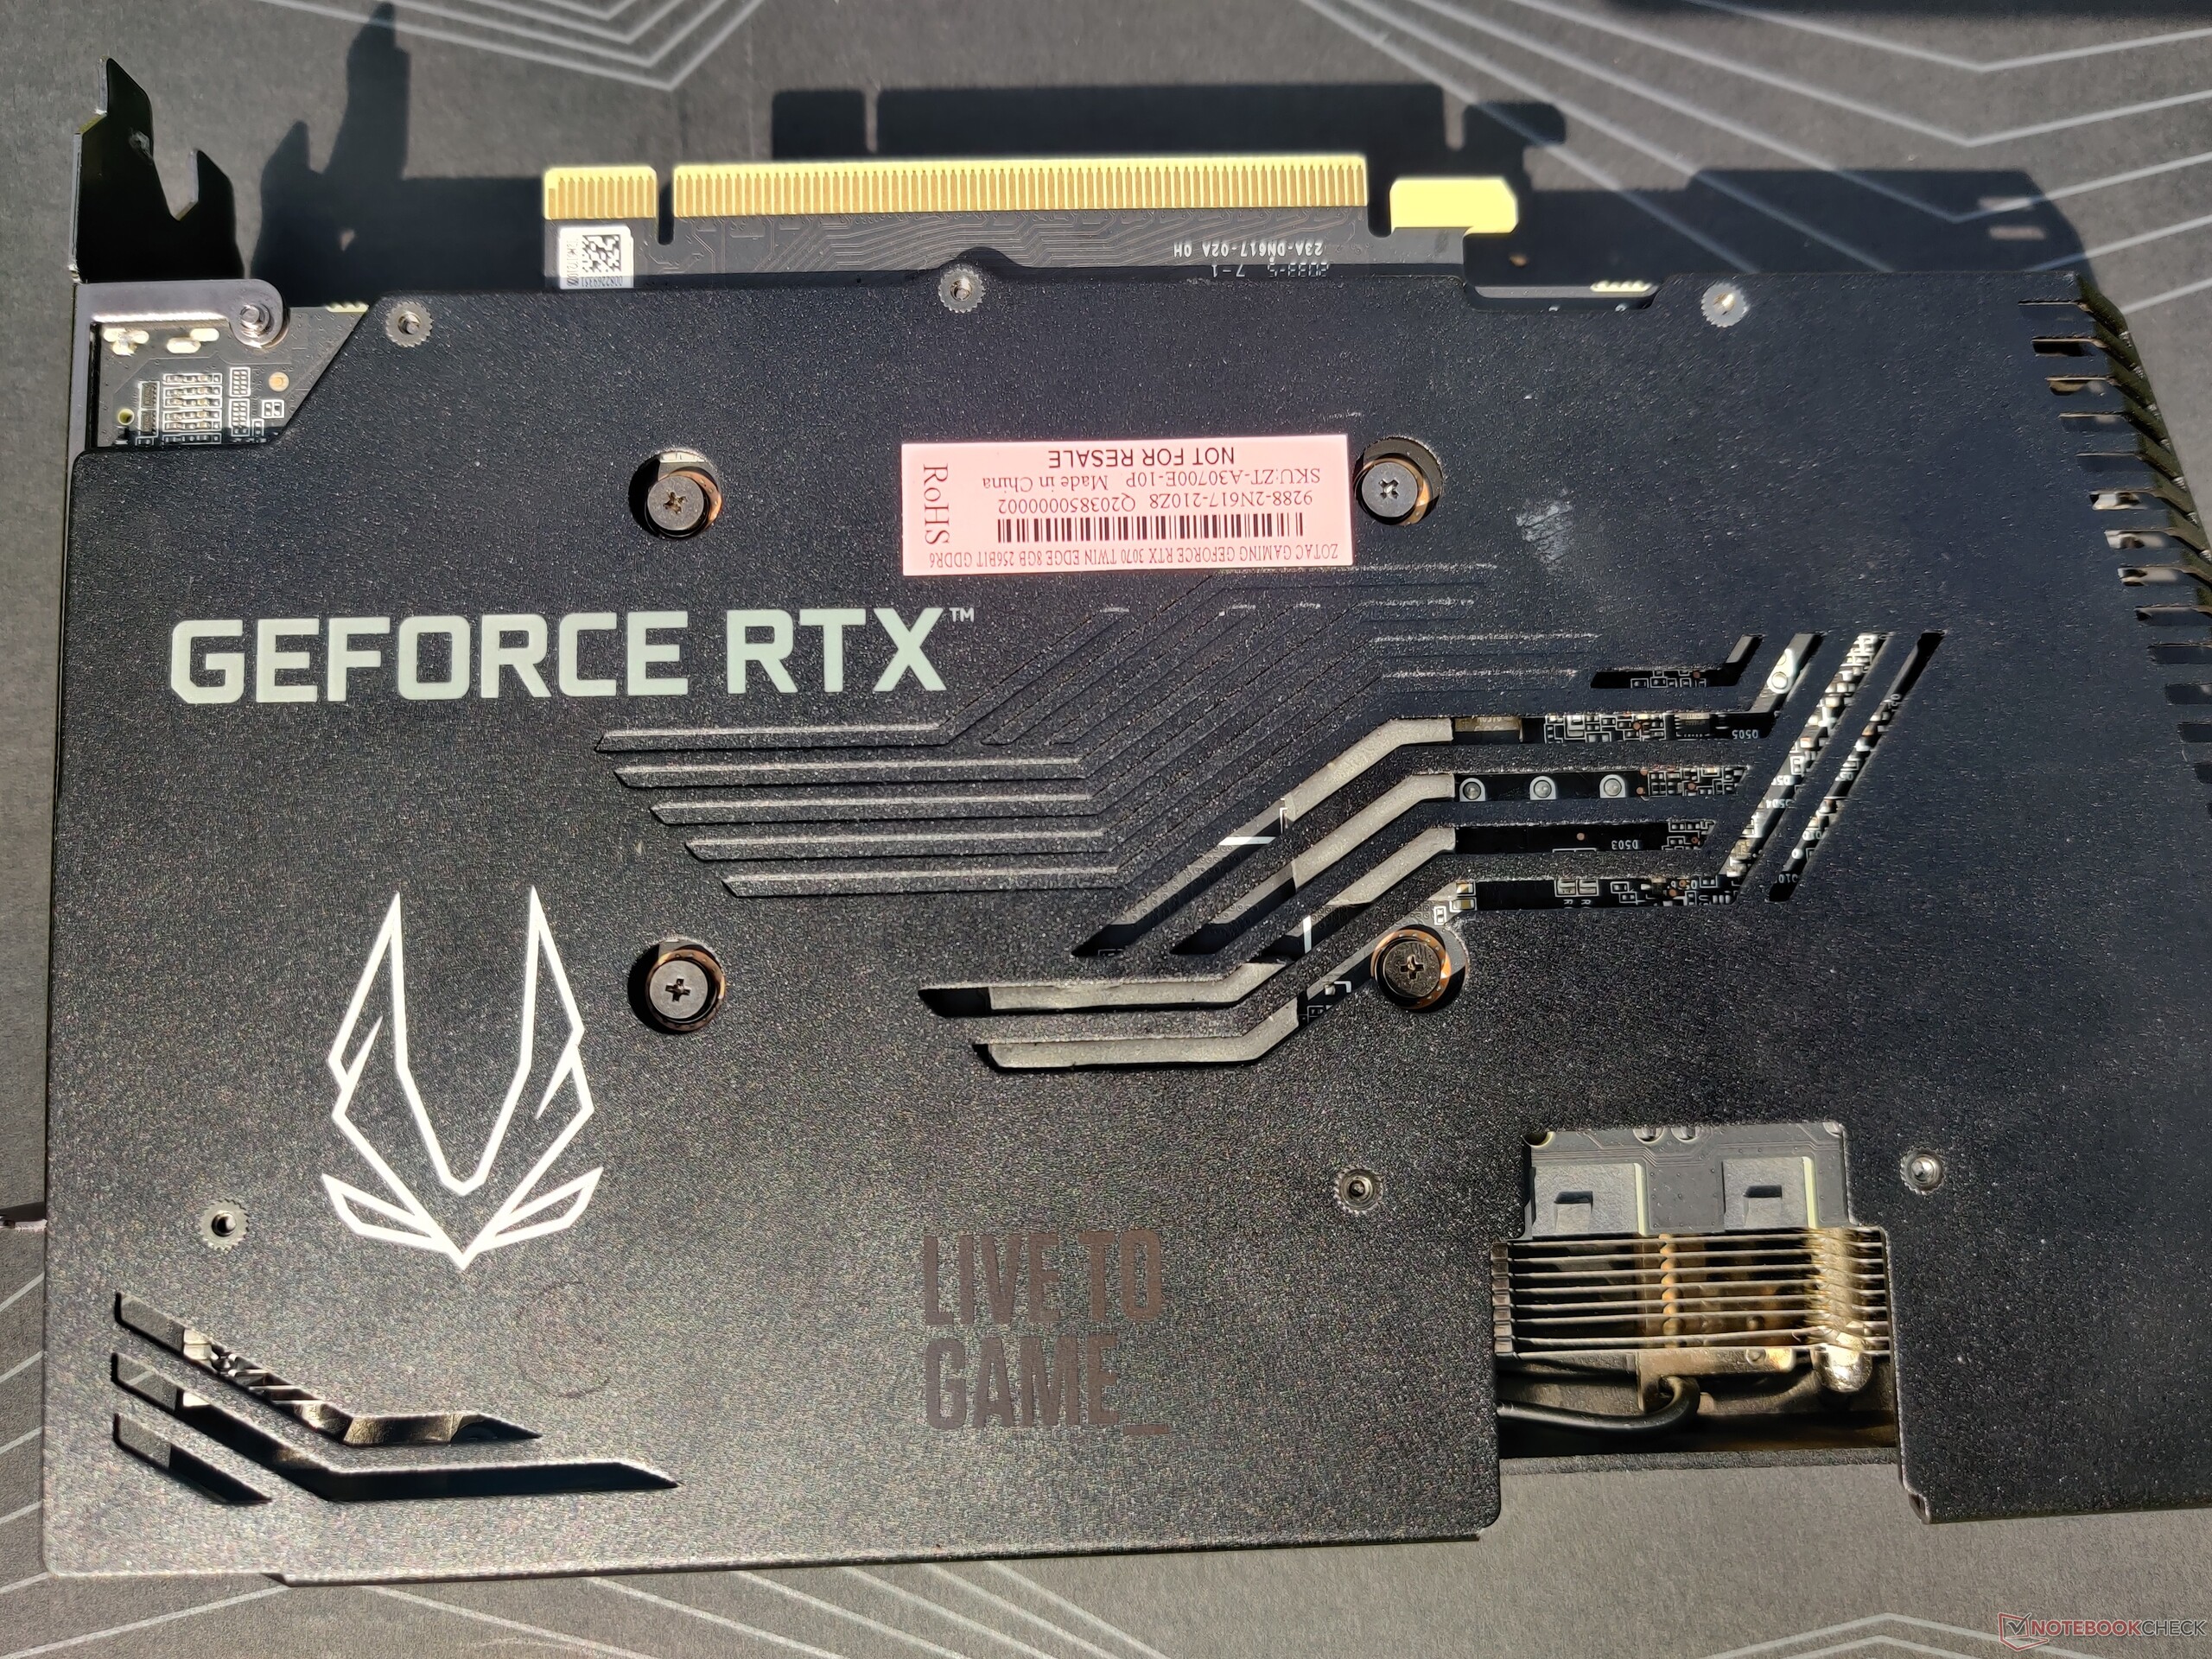
The Zotac Gaming RTX 3070 Twin Edge will not exactly turn heads in terms of looks, but it still offers a clean minimalist design. There's no RGB bling, and Zotac Gaming logo only lights-up in white. The card offers two 8-pin power connectors along with four video-out ports comprised of three DisplayPort 1.4a-out and one HDMI 2.1-out.
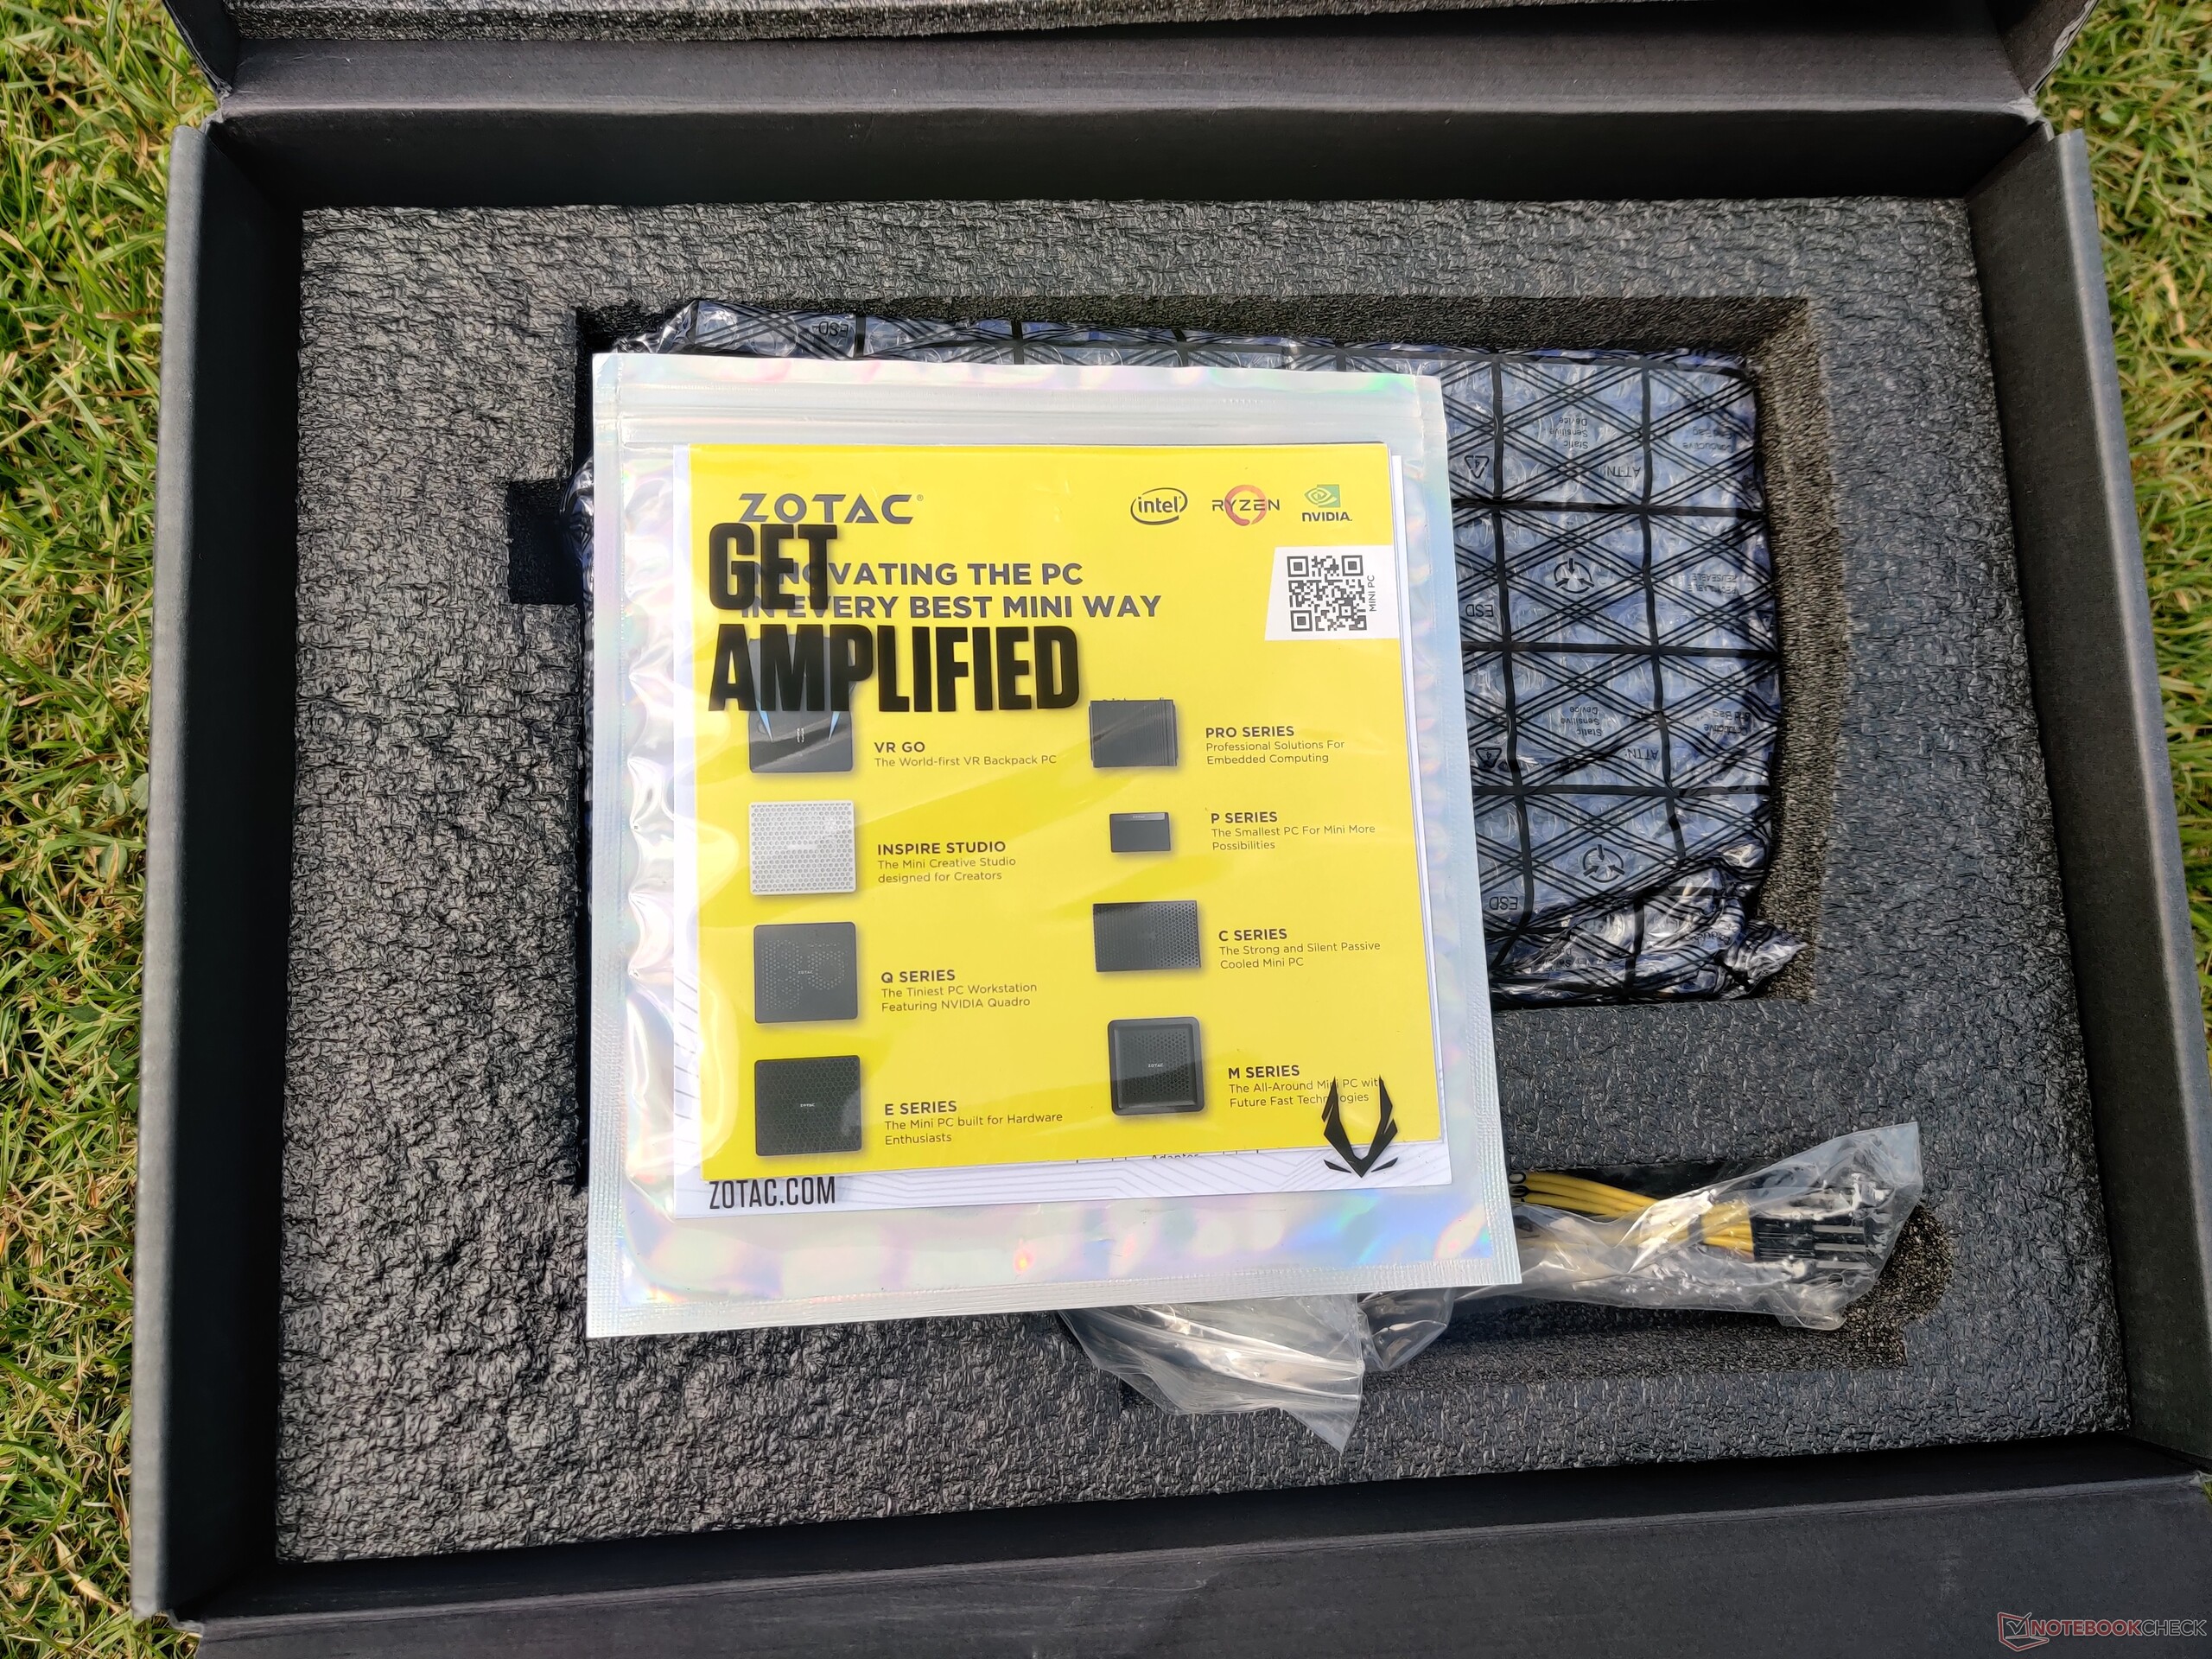
The dual-8-pin power connectors are placed a bit farther inside from the right edge as is the case with most Zotac cards, so some users may find that their PSU cables are a tad bit short. The good thing is that Zotac provides two 6-pin to 8-pin connectors as accessories, which can be used as a workaround. We found no stability issues in running the card using these cables.
The Zotac Gaming GeForce RTX 3070 Twin Edge originally retails for US$619.99 (₹55,000).
Zotac offers a 3-year standard warranty for all RTX 30 cards, which can be extended by an additional two years if the purchase is registered on the Zotac website. However, this warranty policy is applicable only for EMEAI regions.
Buyers in North America (USA and Canada) get a 2-year standard warranty that is extendable by another year if the product is registered on Zotac.com within 30 days of purchase.
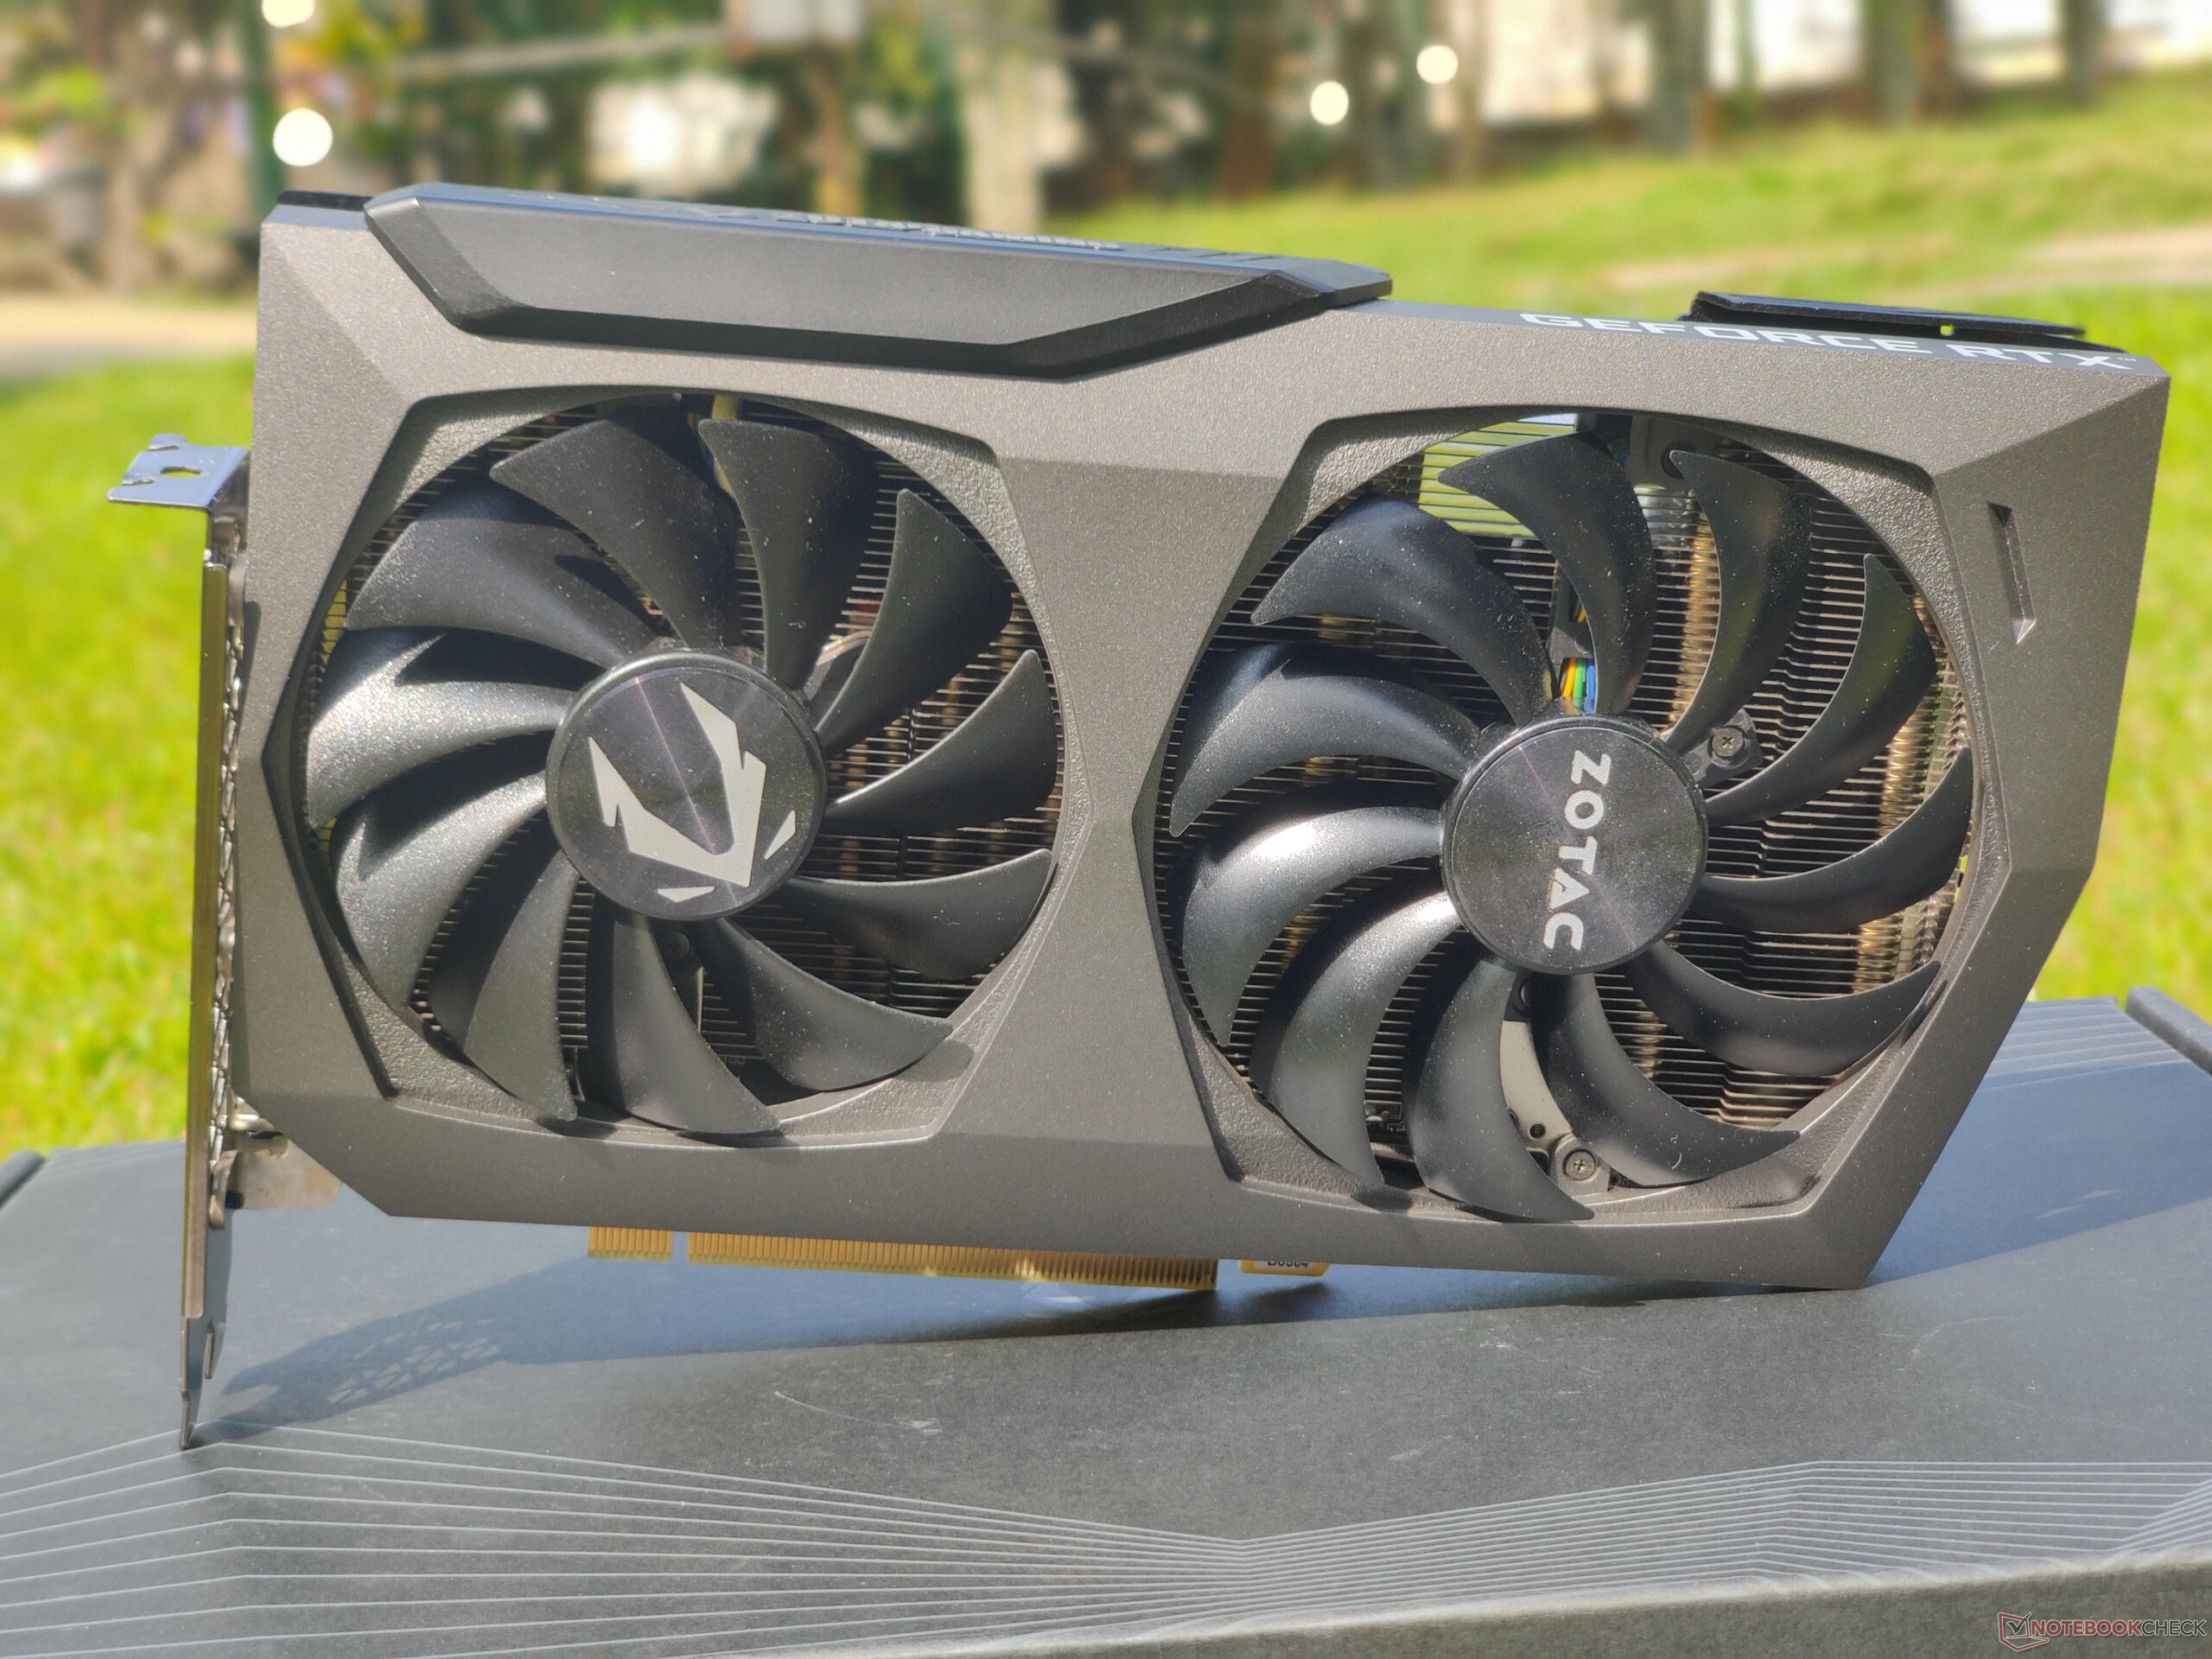
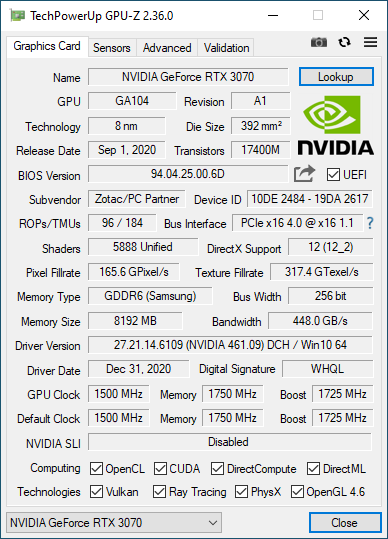
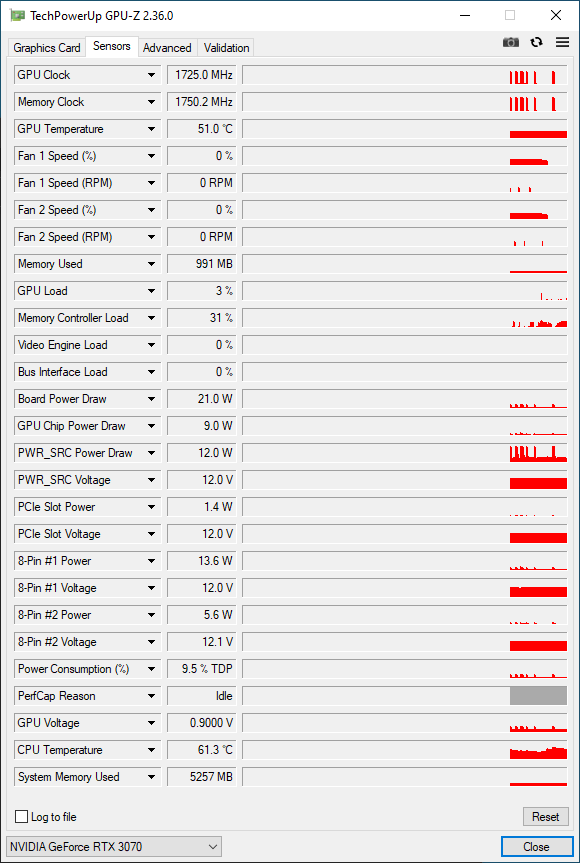
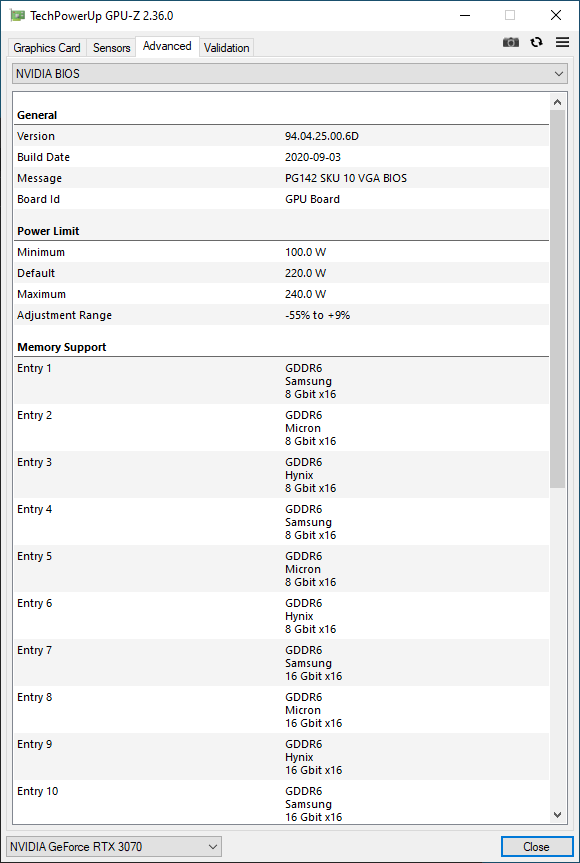
GPU-Z does not throw up any surprises as Zotac hasn't tweaked the Founders Edition specifications much. The RTX 3070 Twin Edge offers a base clock of 1,500 MHz and a boost up to 1,725 MHz. Though the TGP of the RTX 3070 is rated at 220 W, it is possible to increase it by 9% to up to 240 W. A good deal of this additional power is fed to the GPU itself as the card lacks RGB and has just two fans.
The test bench
Our test bench is based on the AMD Ryzen 5000 Zen 3 X570 platform. The AMD Ryzen 9 5950X 16-core processor offers excellent gaming performance that beats the Intel Core i9-10900K and is our processor of choice for this test. A Corsair iCUE H115i Elite Capellix AIO cooler helped keep this mammoth CPU cool.
We used the MSI Prestige X570 Creation motherboard as the base. The Ryzen 9 5950X was paired with 32 GB (16 GB x2) of G.SKILL Trident Z Neo DDR4-3600 RAM with timings 16-19-19-39. Windows 10 20H2 with the latest cumulative updates (Build 19041.662) was installed on a Gigabyte Aorus NVMe Gen4 1 TB SSD and two Crucial MX500 SATA SSDs of 1 TB each were used to run benchmarks and games.
The entire build was housed in a Corsair iCUE 4000X RGB case with a Thermaltake Toughpower Grand 850 W 80 Plus Gold as the power supply of choice. All testing was done with the case closed to be representative of a normal usage scenario.
We would like to thank AMD for providing the Ryzen 9 5950X and Corsair for the iCUE Elite Capellix cooler and iCUE 4000X case.
We paired the RTX 3070 Twin Edge to a OnePlus U Series 55U1 smart TV running at 4K 60 Hz. Color output was set to full 32-bit RGB in the NVIDIA control panel and Windows desktop scaling was set to 100%.
Synthetic benchmarks
The Zotac RTX 3070 Twin Edge performs decently in our synthetic benchmark tests. This card ties with the MSI GeForce RTX 3070 Ventus 3X OC in most 3DMark tests as both practically have the same specs (the Ventus is just 25 MHz faster).
We also see that the overall performance is in line with an RTX 2080 Ti and is between 13% and 20% faster than an RTX 2080 Super.
The performance delta between the RTX 3070 and the Titan RTX is significantly narrowed in Unigine Heaven 4.0 and Valley 1.0 benchmarks. However, the Titan RTX is seen to have an advantage in all subsets of the Superposition test.
| 3DMark 11 Performance | 36313 points | |
| 3DMark Fire Strike Score | 29648 points | |
| 3DMark Fire Strike Extreme Score | 15360 points | |
| 3DMark Time Spy Score | 12696 points | |
Help | ||
Gaming benchmarks
The Zotac RTX 3070 Twin Edge performs on expected lines when it comes to gaming. The RTX 3070 is well-suited for playing modern AAA titles at 1440p Ultra 60+ fps or 1080p Ultra 100+ fps. 4K gaming is very much as possible as we see most titles hitting the late 40s and early 50s fps marks. Tweaking some of the in-game settings should result in being able to play at 4K 60 fps without greatly affecting visual fidelity.
The card offers 8 GB GDDR6 RAM onboard, which should be adequate for most current games. While the 16 GB of RAM in the AMD Radeon RX 6800 may seem enticing, we didn't run in to any VRAM limitation issues with the RTX 3070 while running our suite of games.
The RTX 3070 Twin Edge manages about 123 fps average in The Witcher 3 1080p Ultra preset. This value does drop a bit occasionally, but the card does manage to offer a fairly consistent performance over time and never goes below 120 fps. This indicates that the card's cooling setup is doing its job well to prevent any throttling.
| low | med. | high | ultra | QHD | 4K | |
|---|---|---|---|---|---|---|
| The Witcher 3 (2015) | 548 | 449 | 244 | 123 | 89.6 | |
| Shadow of the Tomb Raider (2018) | 165 | 161 | 157 | 150 | 114 | 62 |
| Assassin´s Creed Odyssey (2018) | 149 | 125 | 107 | 81 | 68 | 48 |
| Metro Exodus (2019) | 197 | 154 | 118 | 93.6 | 75.4 | 48.3 |
| Total War: Three Kingdoms (2019) | 371.5 | 206.4 | 136 | 103.5 | 67.5 | 33.1 |
| Borderlands 3 (2019) | 169 | 150 | 126 | 104 | 79 | 44.5 |
| Red Dead Redemption 2 (2019) | 175 | 160 | 118 | 77.9 | 63.2 | 42.6 |
| Doom Eternal (2020) | 547 | 358 | 322 | 311 | 244 | 136 |
| Gears Tactics (2020) | 342.6 | 204.9 | 150.8 | 136.2 | 98.2 | 53.5 |
| Watch Dogs Legion (2020) | 129 | 127 | 113 | 84.9 | 65.3 | 38.9 |
| Assassin´s Creed Valhalla (2020) | 130 | 100 | 85 | 77 | 65 | 43 |
| Call of Duty Black Ops Cold War (2020) | 239 | 146 | 124 | 120 | 89.5 | 43.8 |
| Immortals Fenyx Rising (2020) | 148 | 109 | 96 | 88 | 76 | 54 |
| Cyberpunk 2077 1.0 (2020) | 125 | 108 | 93.1 | 80.6 | 53.7 | 26.6 |
Emissions
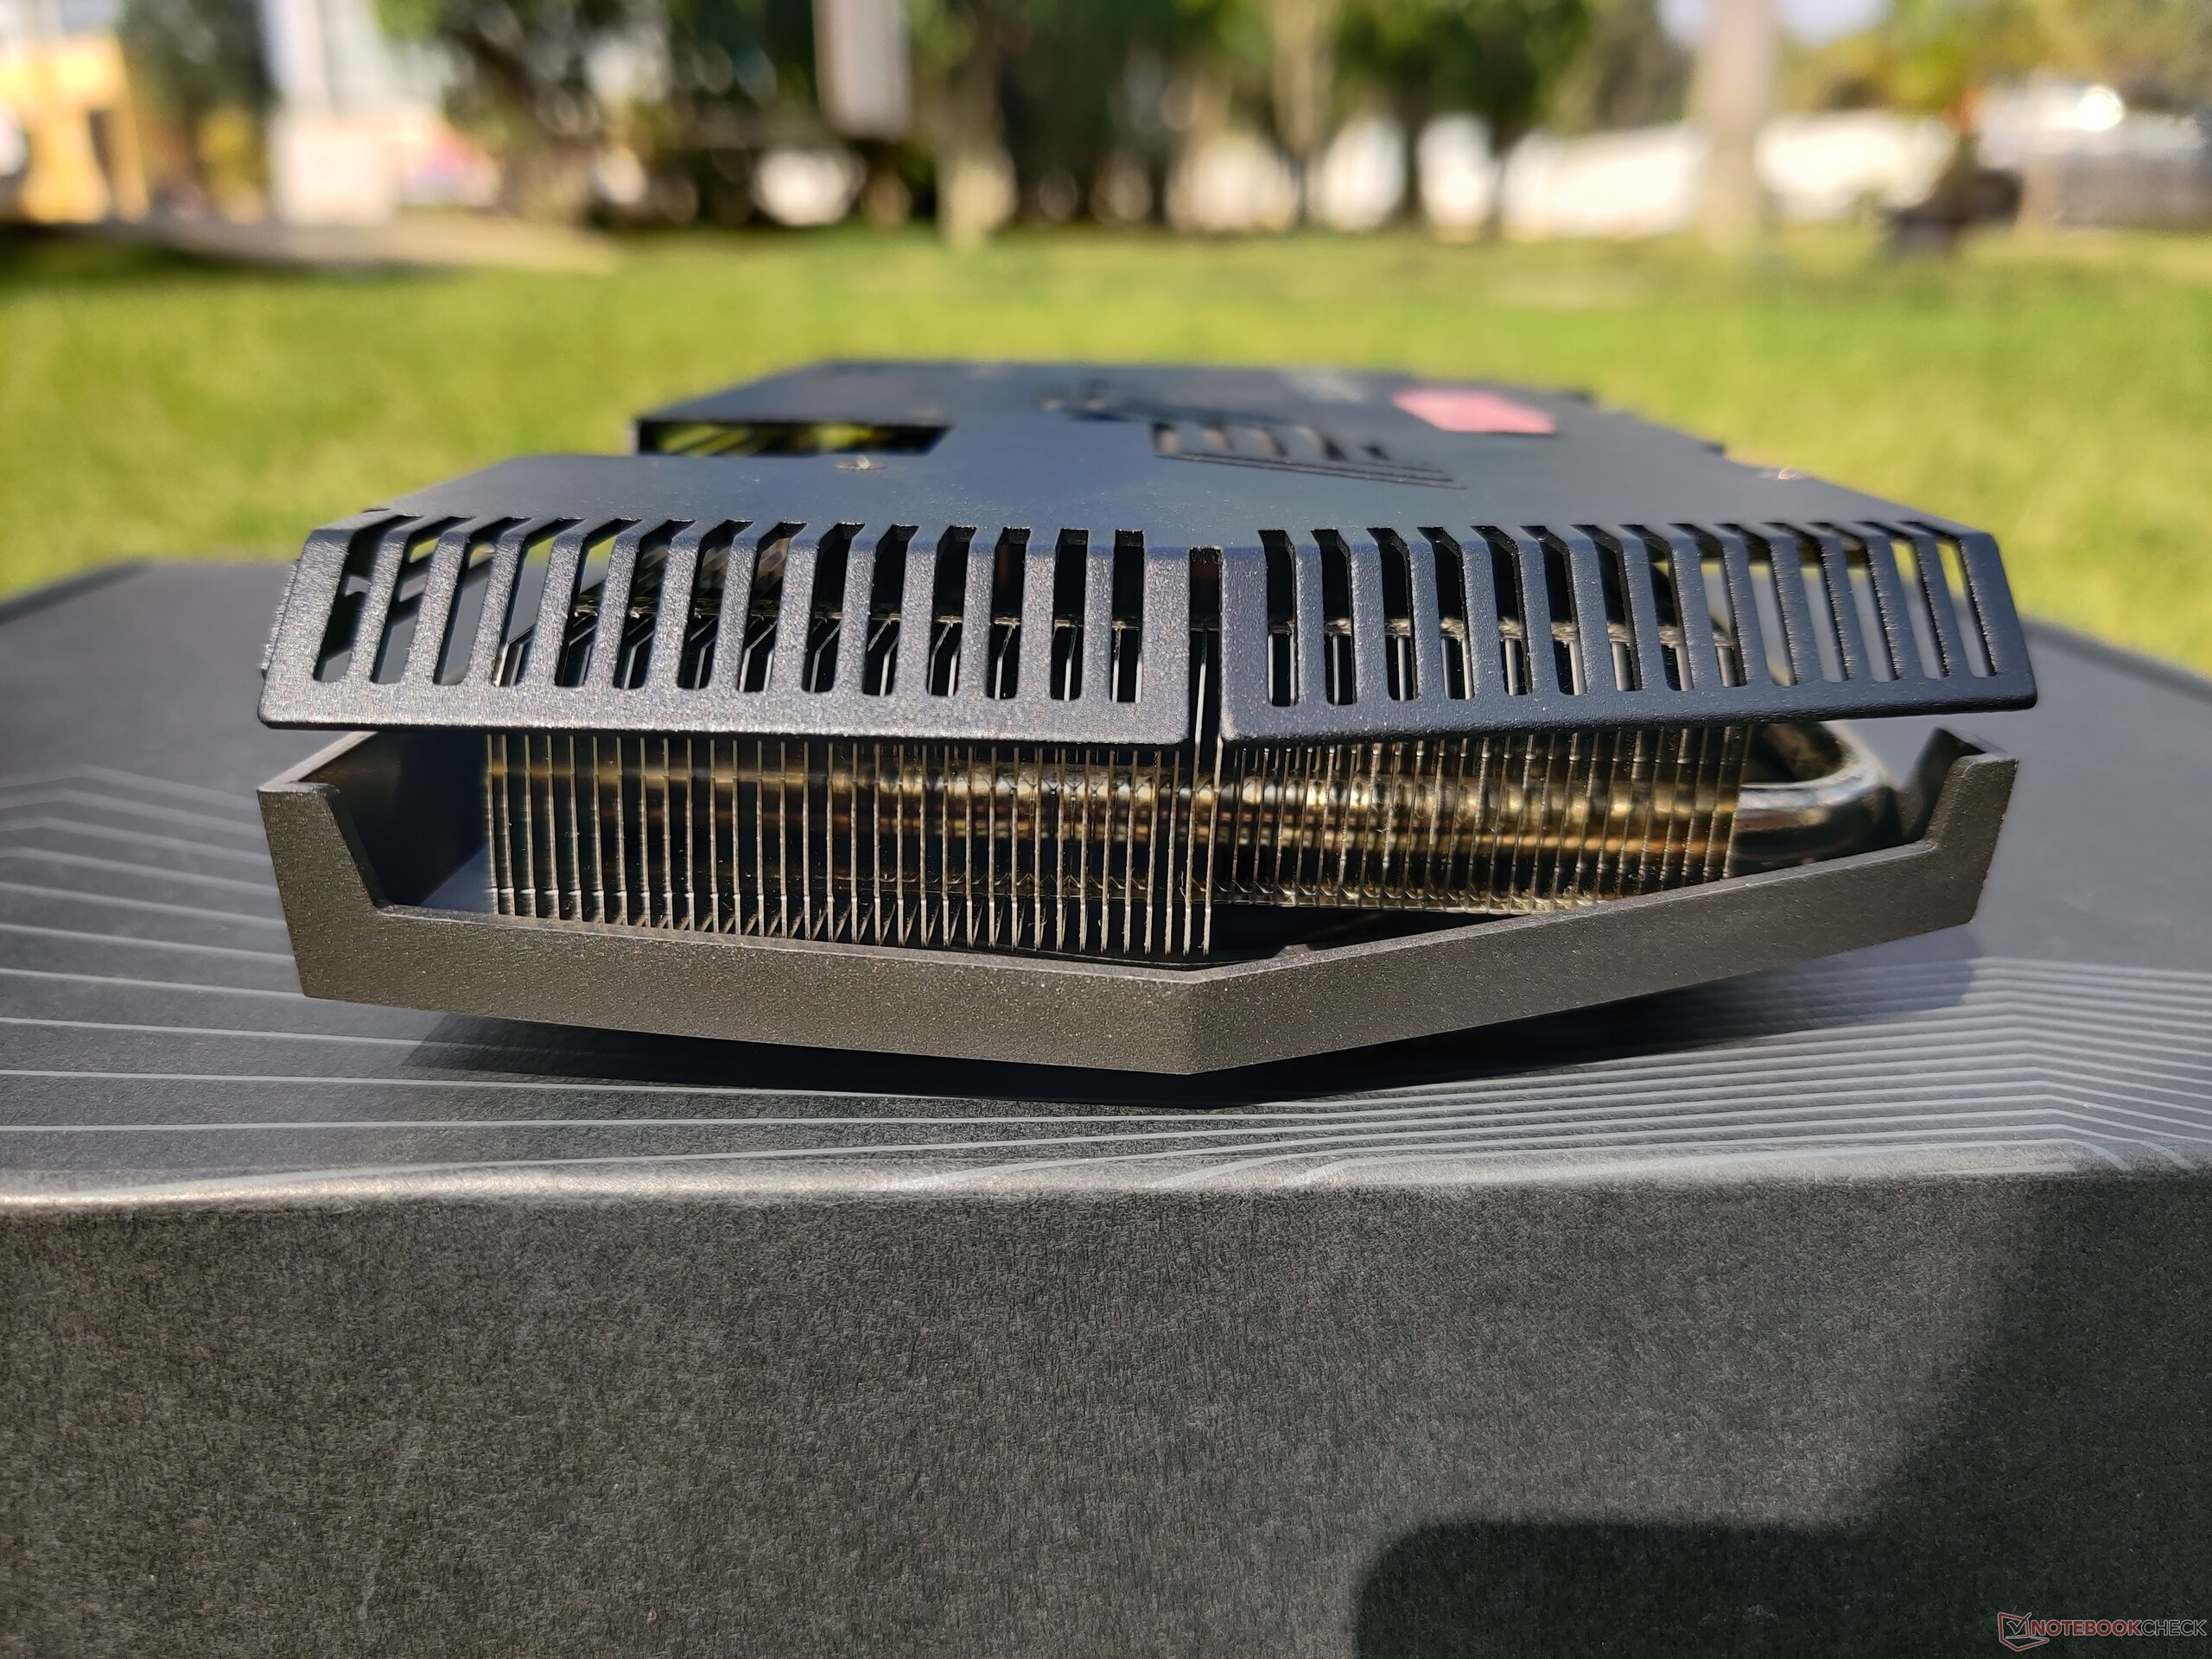
The RTX 3070 is not exactly a conservative GPU when it comes to heat output or power consumption. Zotac, however, does employ a few tricks such as clocking the GPU slightly lower, implementing an improved IceStorm 2.0 cooling system, and using a metal backplate for better heat dissipation.
The stock 220 W TGP can be increased by 9% to 240 W to allow for boosts up to 1,785 MHz bringing it about 45 MHz slower than out-of-the-box OC of the MSI RTX 3070 Gaming X Trio.
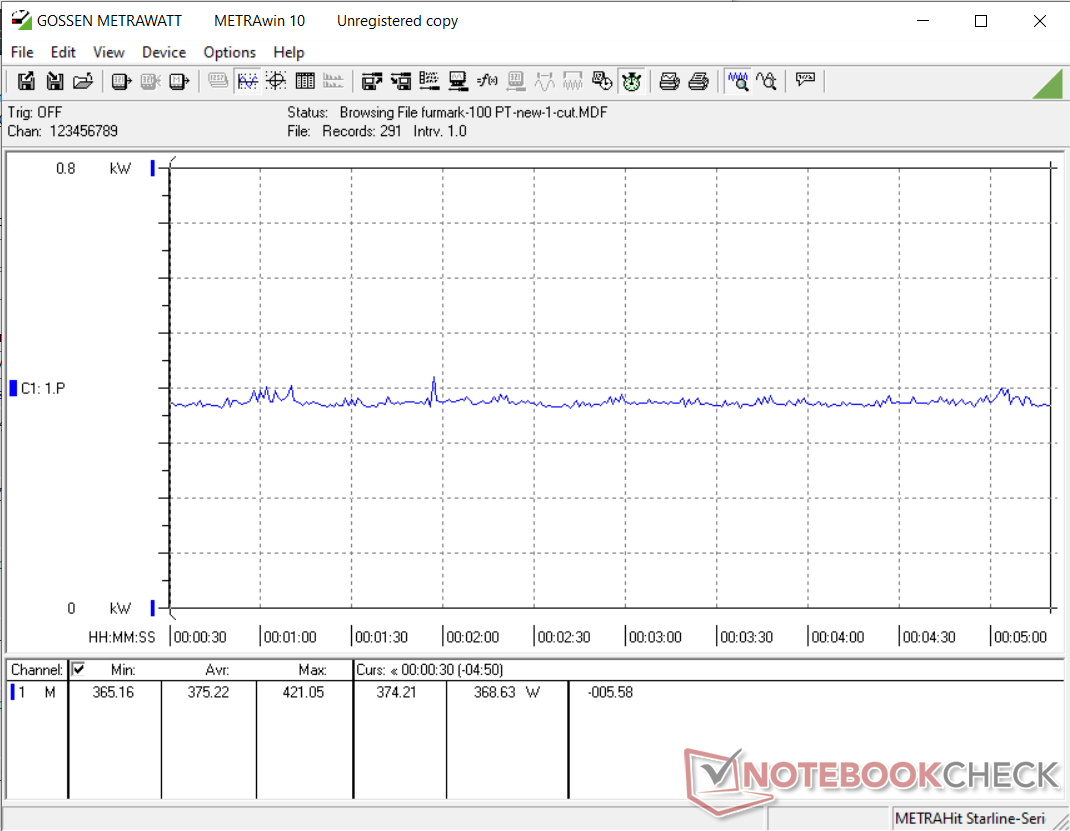
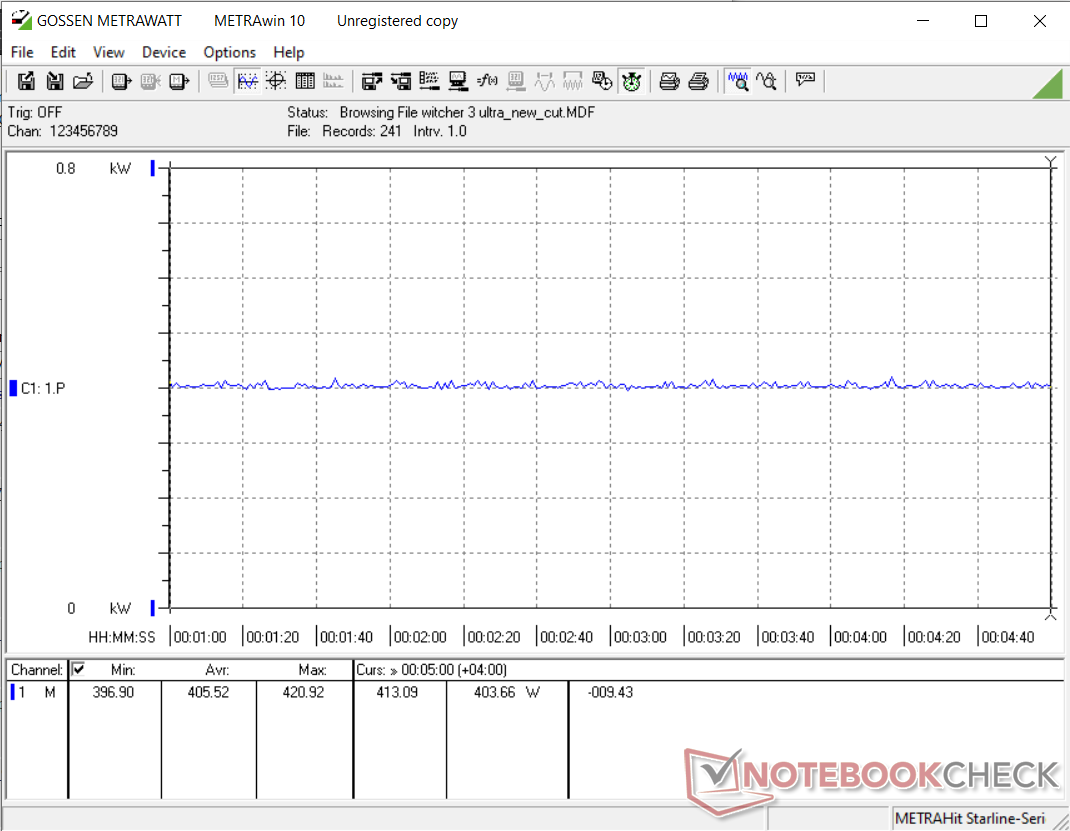
We used the FurMark stress test at both 100% and 109% power targets to determine temperature and noise levels. Total system power consumption was checked while stressing with FurMark and The Witcher 3 at 1080p Ultra preset at both the power targets.
Temperature
The RTX 3070 Twin Edge seems to be a relatively cool customer thanks to the dual 11-blade fans, which Zotac says increases the airflow by 10% more than the previous generation. However, this also means that the fans can get considerably loud as seen in our noise testing below.
The GPU core heats up to 77 °C under full load at the default 220 W TGP. Increasing the TGP to 240 W makes the core run hotter at 81 °C.
We found the surface temperature hitting a maximum of 68.3 °C near the GPU area when under stress while regions away from the center stay relatively cool at about 45 °C as seen in our heat map.
Idling temperatures range between 48 °C and 53 °C during which time the fans are completely turned off.
Power consumption
Our test bench idles at about 115 W with all RGB lighting turned off and a total of five fans (three Corsair SP 120 mm case fans and two Corsair ML 120 radiator fans) and the Elite Capellix pump running in a Balanced profile.
We observed an average total system power consumption of 375 W while running FurMark at the default 100% power target (PT). This is about 6% lower than an RTX 2080 Ti and on par with an RTX 2080 Super. Increasing the PT to 109% results in a 5% higher power consumption at 393 W.
The RTX 3070 Twin Edge draws slightly higher power compared to the MSI RTX 3070 Gaming X Trio in The Witcher 3 at 1080p Ultra preset but is still somewhat economical compared to the RTX 2080 Ti and the Titan RTX.

* ... smaller is better
Noise levels
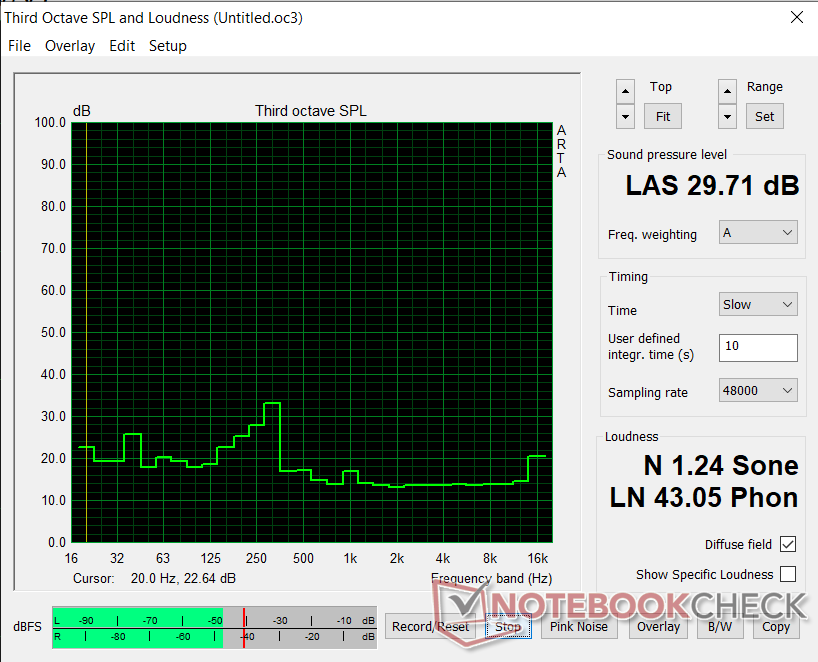
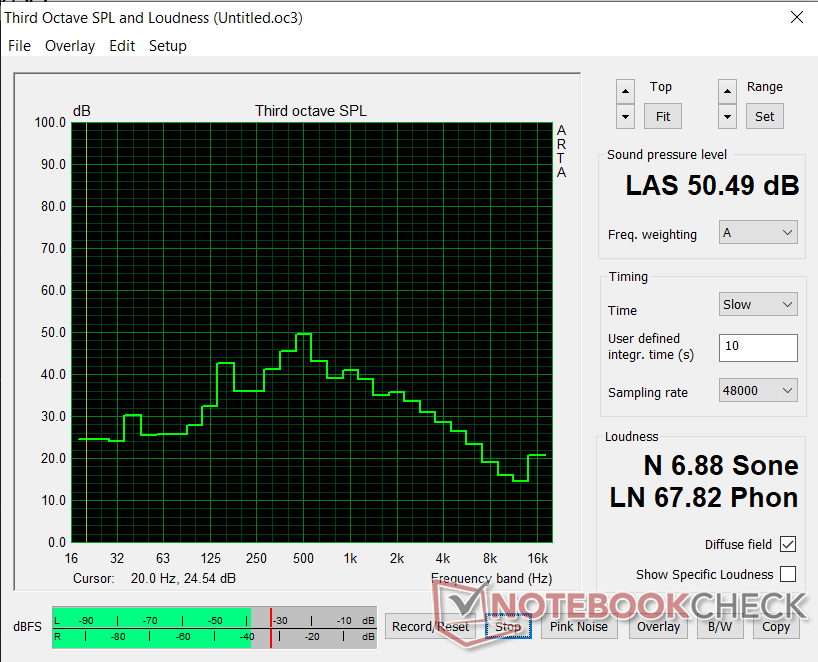
At idle, the Zotac RTX 3070 Twin Edge is a silent card and the sound pressure level (SPL) is more or less equal to the ambient value of 29.71 dB(A) at a distance of 20 cm from the case. However, things start to get loud under stress. After stressing the card using FurMark for about 30 minutes, we observed the fan SPL levels to cross the 50 db(A) mark. This is likely due to the presence of just two fans that work hard to keep temperatures under check and the compact form factor of the card.
Users may still be able to fine-tune the noise levels by manually adjusting the fan curves, but we recommend a good set of headphones to drown out the noise while gaming at maxed-out settings.
Pros
Cons
Verdict
The Zotac Gaming GeForce RTX 3070 Twin Edge is well made with no sharp edges though the plastic shroud could be a bit more firm. The card occupies minimal space and will fit in most cases with ease. The metal backplate is a welcome addition in aiding proper heat dissipation.
RGB connoisseurs will be disappointed that the Twin Edge offers only static white lighting for the Zotac logo. In combination with a five-copper heatpipe array, the dual 11-blade fans help keep the thermals under check. However, these fans can get perceivably loud under load, which can be unpleasant in a quiet environment.
The Zotac Gaming GeForce RTX 3070 Twin Edge ticks all the right boxes for anyone looking at a viable add-in board (AiB) RTX 3070 offering. The performance is enviously close to or sometimes even marginally better than an RTX 2080 Ti, but there is definitely room for further optimizing power consumption and fan noise levels.
The Zotac RTX 3070 Twin Edge performs on par with the RTX 2080 Ti in both synthetic and gaming benchmarks while consuming less power. Zotac allows adding a further 20 W to the TGP, which further boosts the clocks by 60 MHz while increasing the power consumption by about 5%.
Our main gripe with the Zotac RTX 3070 Twin Edge is the current retail pricing. NVIDIA's MSRP for the RTX 3070 is US$499 while the RTX 3070 Twin Edge originally retails for US$620. However, current demand and supply constraints mean that the RTX 3070 Twin Edge is exorbitantly priced at US$950 on Amazon. Unless you have an absolutely pressing need, we suggest keeping a tab on the prices until they drop down to more reasonable levels.
Price and availability
The Zotac Gaming GeForce RTX 3070 Twin Edge can be bought on several online stores including the Zotac Store, Amazon, and Newegg. Newegg currently offers the RTX 3070 Twin Edge for US$649.99 and the Twin Edge OC for US$694.99. Unsurprisingly, the card is listed as out of stock at the time of publication.
The RTX 3070 Twin Edge is currently in stock on Amazon for US$949.99. It is a significantly steep markup that diminishes the value proposition of this card compared to the RTX 2080 Ti.
Limited stocks are also available on Walmart for a RTX 3070 Twin Edge OC White Edition that is retailing for US$899 at the time of publication.
Price comparison
