

Schenker XMG Pro 15 (Clevo PC50HS-D) review: Thin and light 4K gaming laptop

The Schenker XMG Pro 15 from late 2021 is a lightweight, compact 15.6-inch gaming laptop. It is based on the Clevo barebone (PC50HS-D) and powered by a Core-i7-11800H CPU and a mobile GeForce RTX 3080 GPU. It competes directly with devices such as the Lenovo Legion S7 15ACH6, MSI Delta 15, Alienware x15 and the Razer Blade 15 Advanced (Mid 2021).
Potential competitors in comparison
Rating | Date | Model | Weight | Height | Size | Resolution | Price |
|---|---|---|---|---|---|---|---|
| 84.6 % v7 (old) | 01 / 2022 | SCHENKER XMG Pro 15 (Late 2021) i7-11800H, GeForce RTX 3080 Laptop GPU | 2 kg | 19.8 mm | 15.60" | 3840x2160 | |
| 87.9 % v7 (old) | 11 / 2021 | Lenovo Legion S7 15ACH6 82K80030GE R9 5900HX, GeForce RTX 3060 Laptop GPU | 2 kg | 18.9 mm | 15.60" | 3840x2160 | |
| 87.2 % v7 (old) | 09 / 2021 | Alienware x15 RTX 3070 P111F i7-11800H, GeForce RTX 3070 Laptop GPU | 2.4 kg | 15.9 mm | 15.60" | 2560x1440 | |
| 88.9 % v7 (old) | 07 / 2021 | Razer Blade 15 Advanced (Mid 2021) i7-11800H, GeForce RTX 3080 Laptop GPU | 2 kg | 16.99 mm | 15.60" | 1920x1080 |
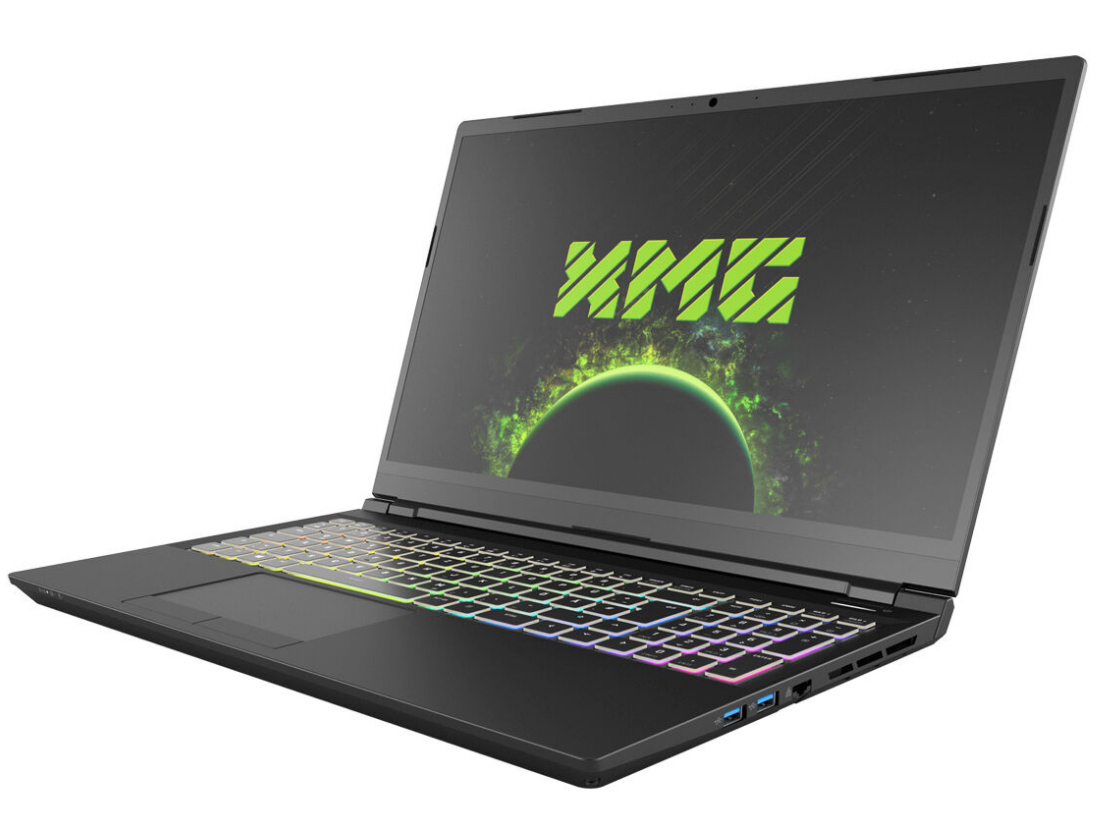
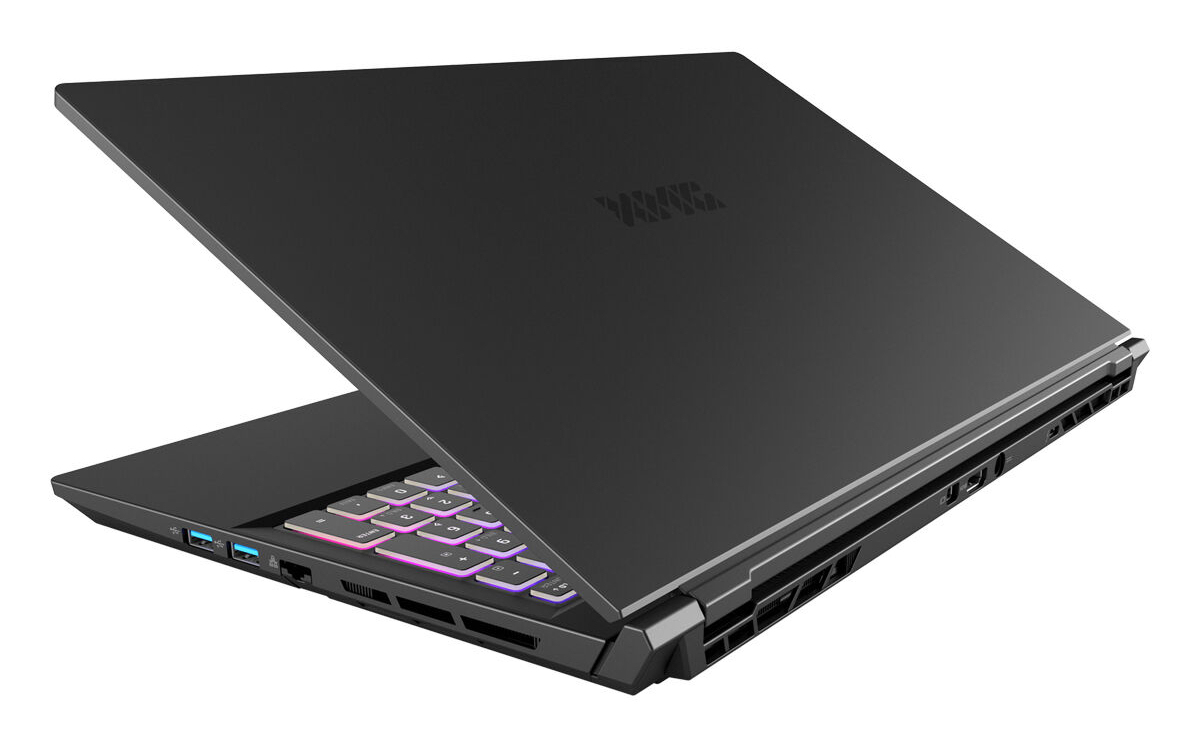
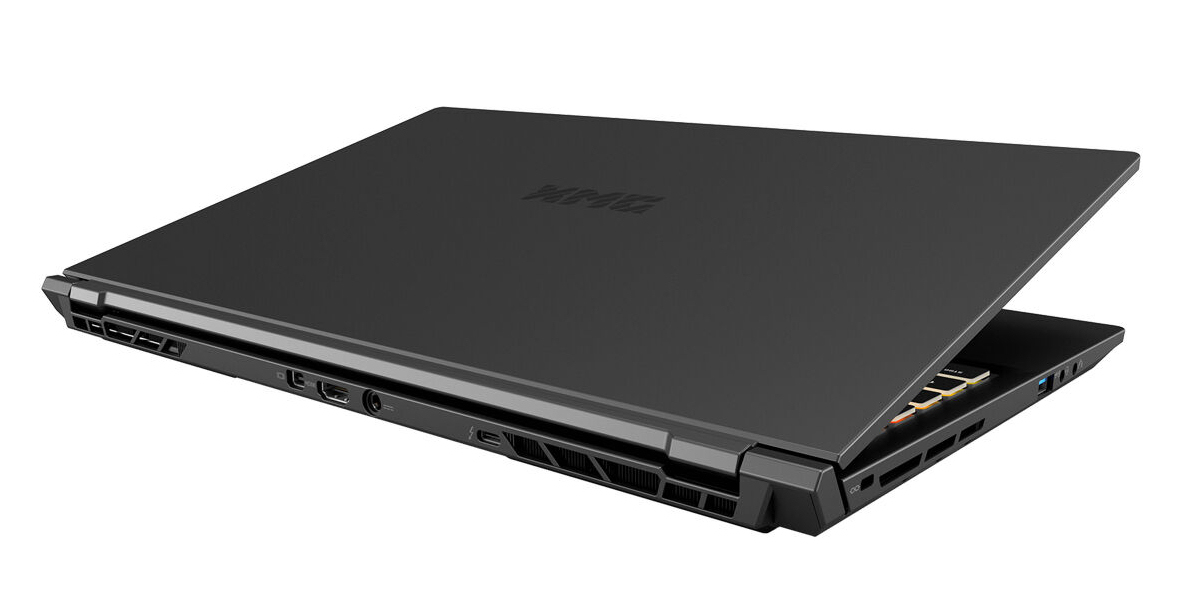
Case - Schenker laptop with a metal chassis
For the XMG Pro, Schenker uses a slim metal chassis in matte black. Since the simple and yet elegant chassis comes without any striking visual accents, it is suitable for professional settings. Compared to the XMG Pro 15 model from early 2021, there are only a few minor differences. There is no maintenance hatch and the battery is fixed.
The construction does not warrant criticism. The clearances are even and there are no undesired material protrusions. While the lid and base unit yield slightly when twisted at the corners, the rigidity is still solid overall. The hinges hold the lid firmly in place, even though they allow for some teetering. The display can be opened to up to 130 degrees. It is possible to open the laptop with just one hand.

The XMG Pro is one of the most compact devices in our comparison and only ever-so-slightly larger than the Blade 15. For the most part, all laptops in our comparison are even in terms of their weight. Only the Alienware x15 deviates from this and weighs around 400 g more.
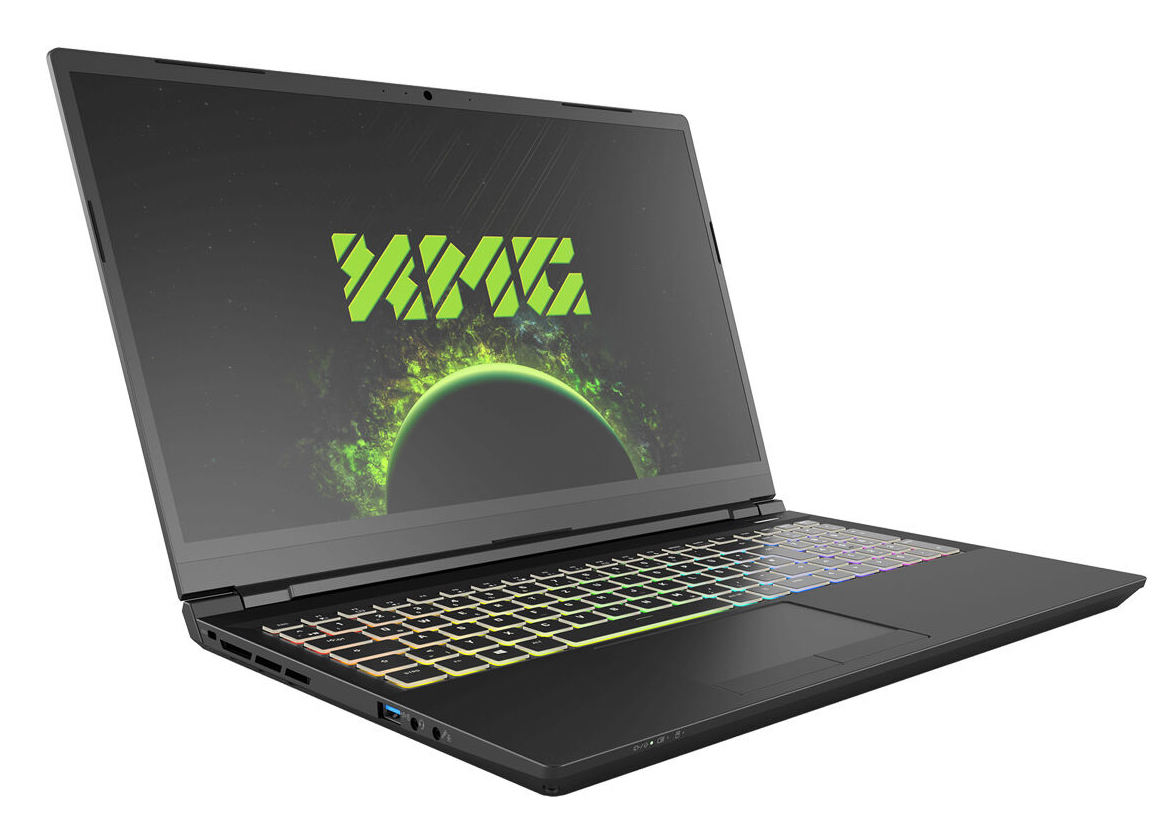
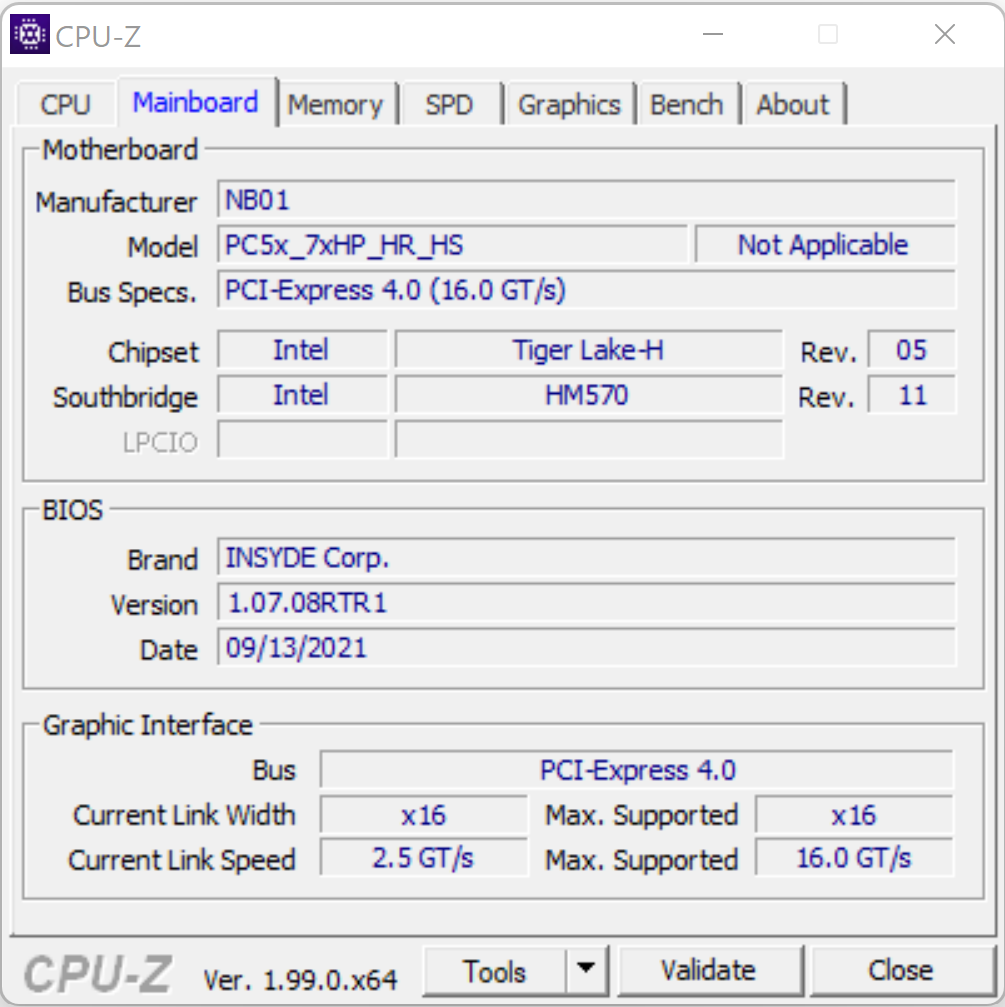
Connectivity - Schenker XMG with Thunderbolt 4
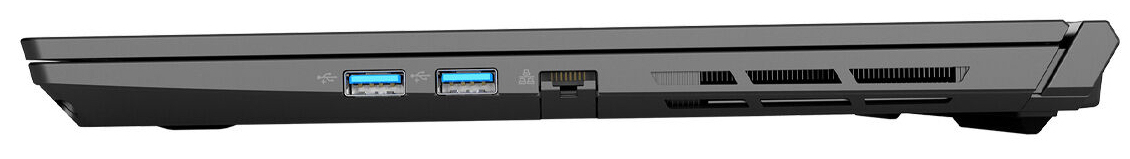
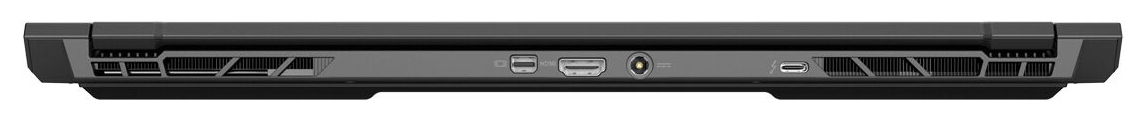
The XMG Pro integrates three USB type-A ports (USB 3.2 Gen 1) and one USB type-C port (Thunderbolt 4). The latter can be connected to a feature-rich docking station or an external GPU. Furthermore, the port supports DisplayPort via USB-C. Combined with the Mini DisplayPort and the HDMI port, there are three video outputs in total. All three video outputs support G-Sync. For the USB type-C port, this has to manually be enabled from within the BIOS. There is no integrated card reader.
The ports are distributed across three sides of the notebook. All three video outputs are located on the back of the device. As a result, connected cables are run along the back and do not get in the way.

Communication
The Wi-Fi module is based on an Intel chip (AX201) and supports the 802.11a/b/g/n/ac/ax standards. Under optimal conditions (no other Wi-Fi devices in the vicinity, notebook and server in close proximity), we observed excellent transfer rates. A Realtek Gigabit Ethernet controller handles wired networking. We did not encounter any issues with it during our testing.
Webcam
The Webcam (0.9 MP) captures images with a maximum resolution of 1280 x 720 pixels. The color accuracy is lacklustre: The colors significantly deviate from their ideal values.

 GeForce RTX 3080 Laptop GPU, i7-11800H, Samsung SSD 980 Pro 1TB MZ-V8P1T0BW")
 GeForce RTX 3080 Laptop GPU, i7-11800H, Samsung SSD 980 Pro 1TB MZ-V8P1T0BW")
Accessories
Aside from warranty information and a manual, there is a recovery DVD, a cleaning cloth, USB thumbdrive and a M.2 screw included in the package.
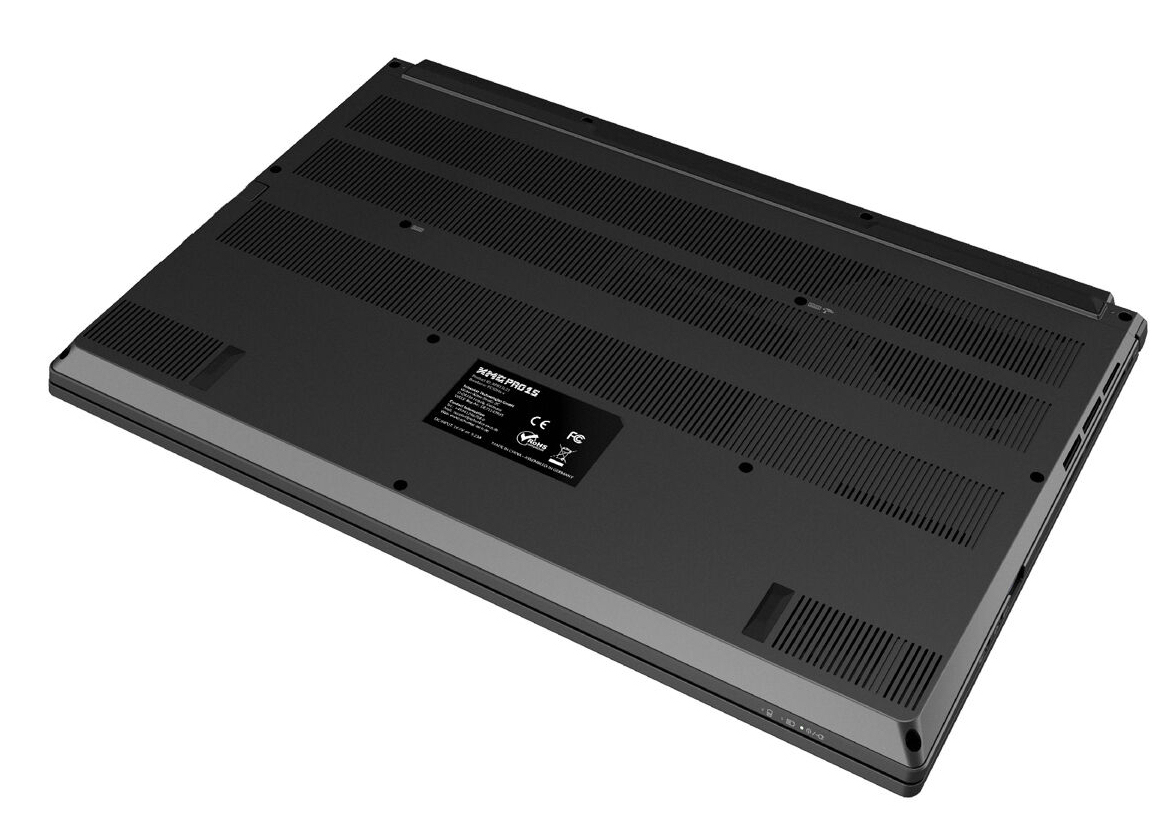
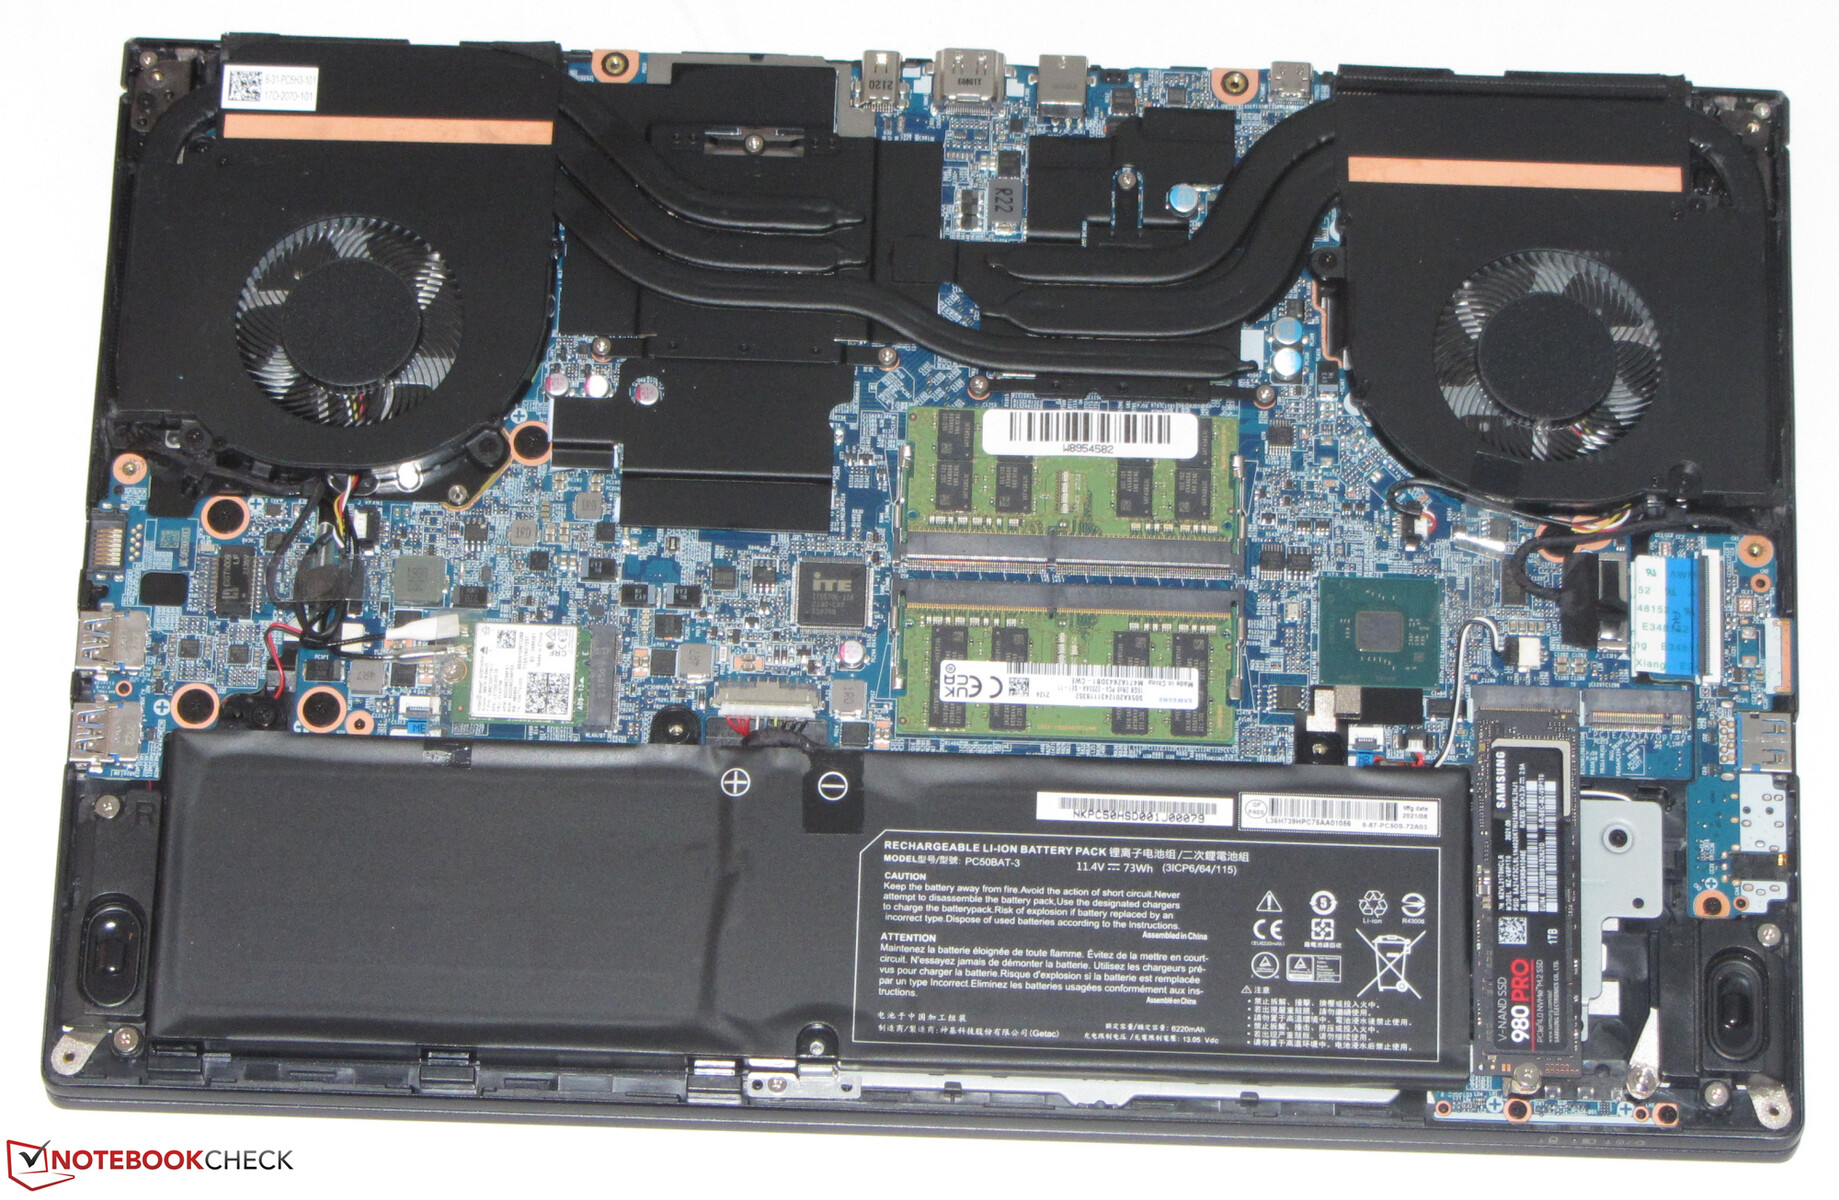
Maintenance
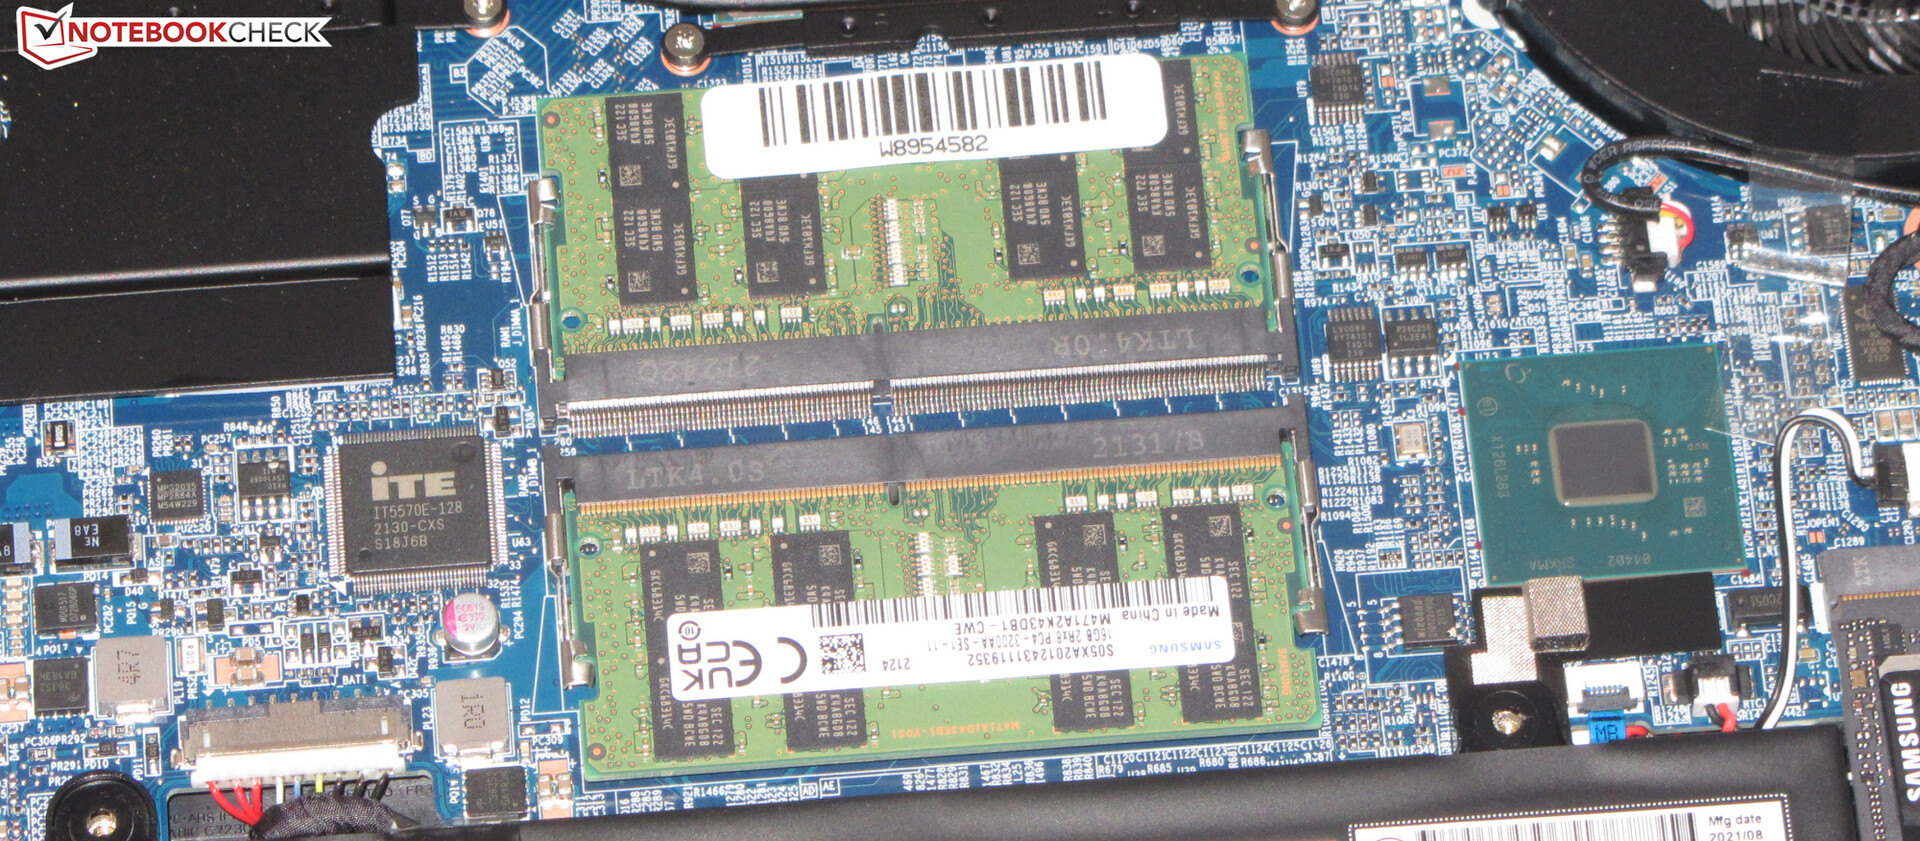
Performing maintenance and upgrading the system is simple. After loosening all screws on the bottom of the device, the bottom plate can be removed with the help of an object with a sharp edge. Subsequently, users can access the SSD, secondary M.2 slot, Wi-Fi module, battery, RAM and the fans.
Warranty
The manufacturer offers a base warranty of two years with pick up and return service in certain European countries as well as a 6-month rapid repair service (repair within 48 hours). A warranty extension to 36 months can cost from 100-149 Euros (~$110-$170) - depending on the rapid repair period.
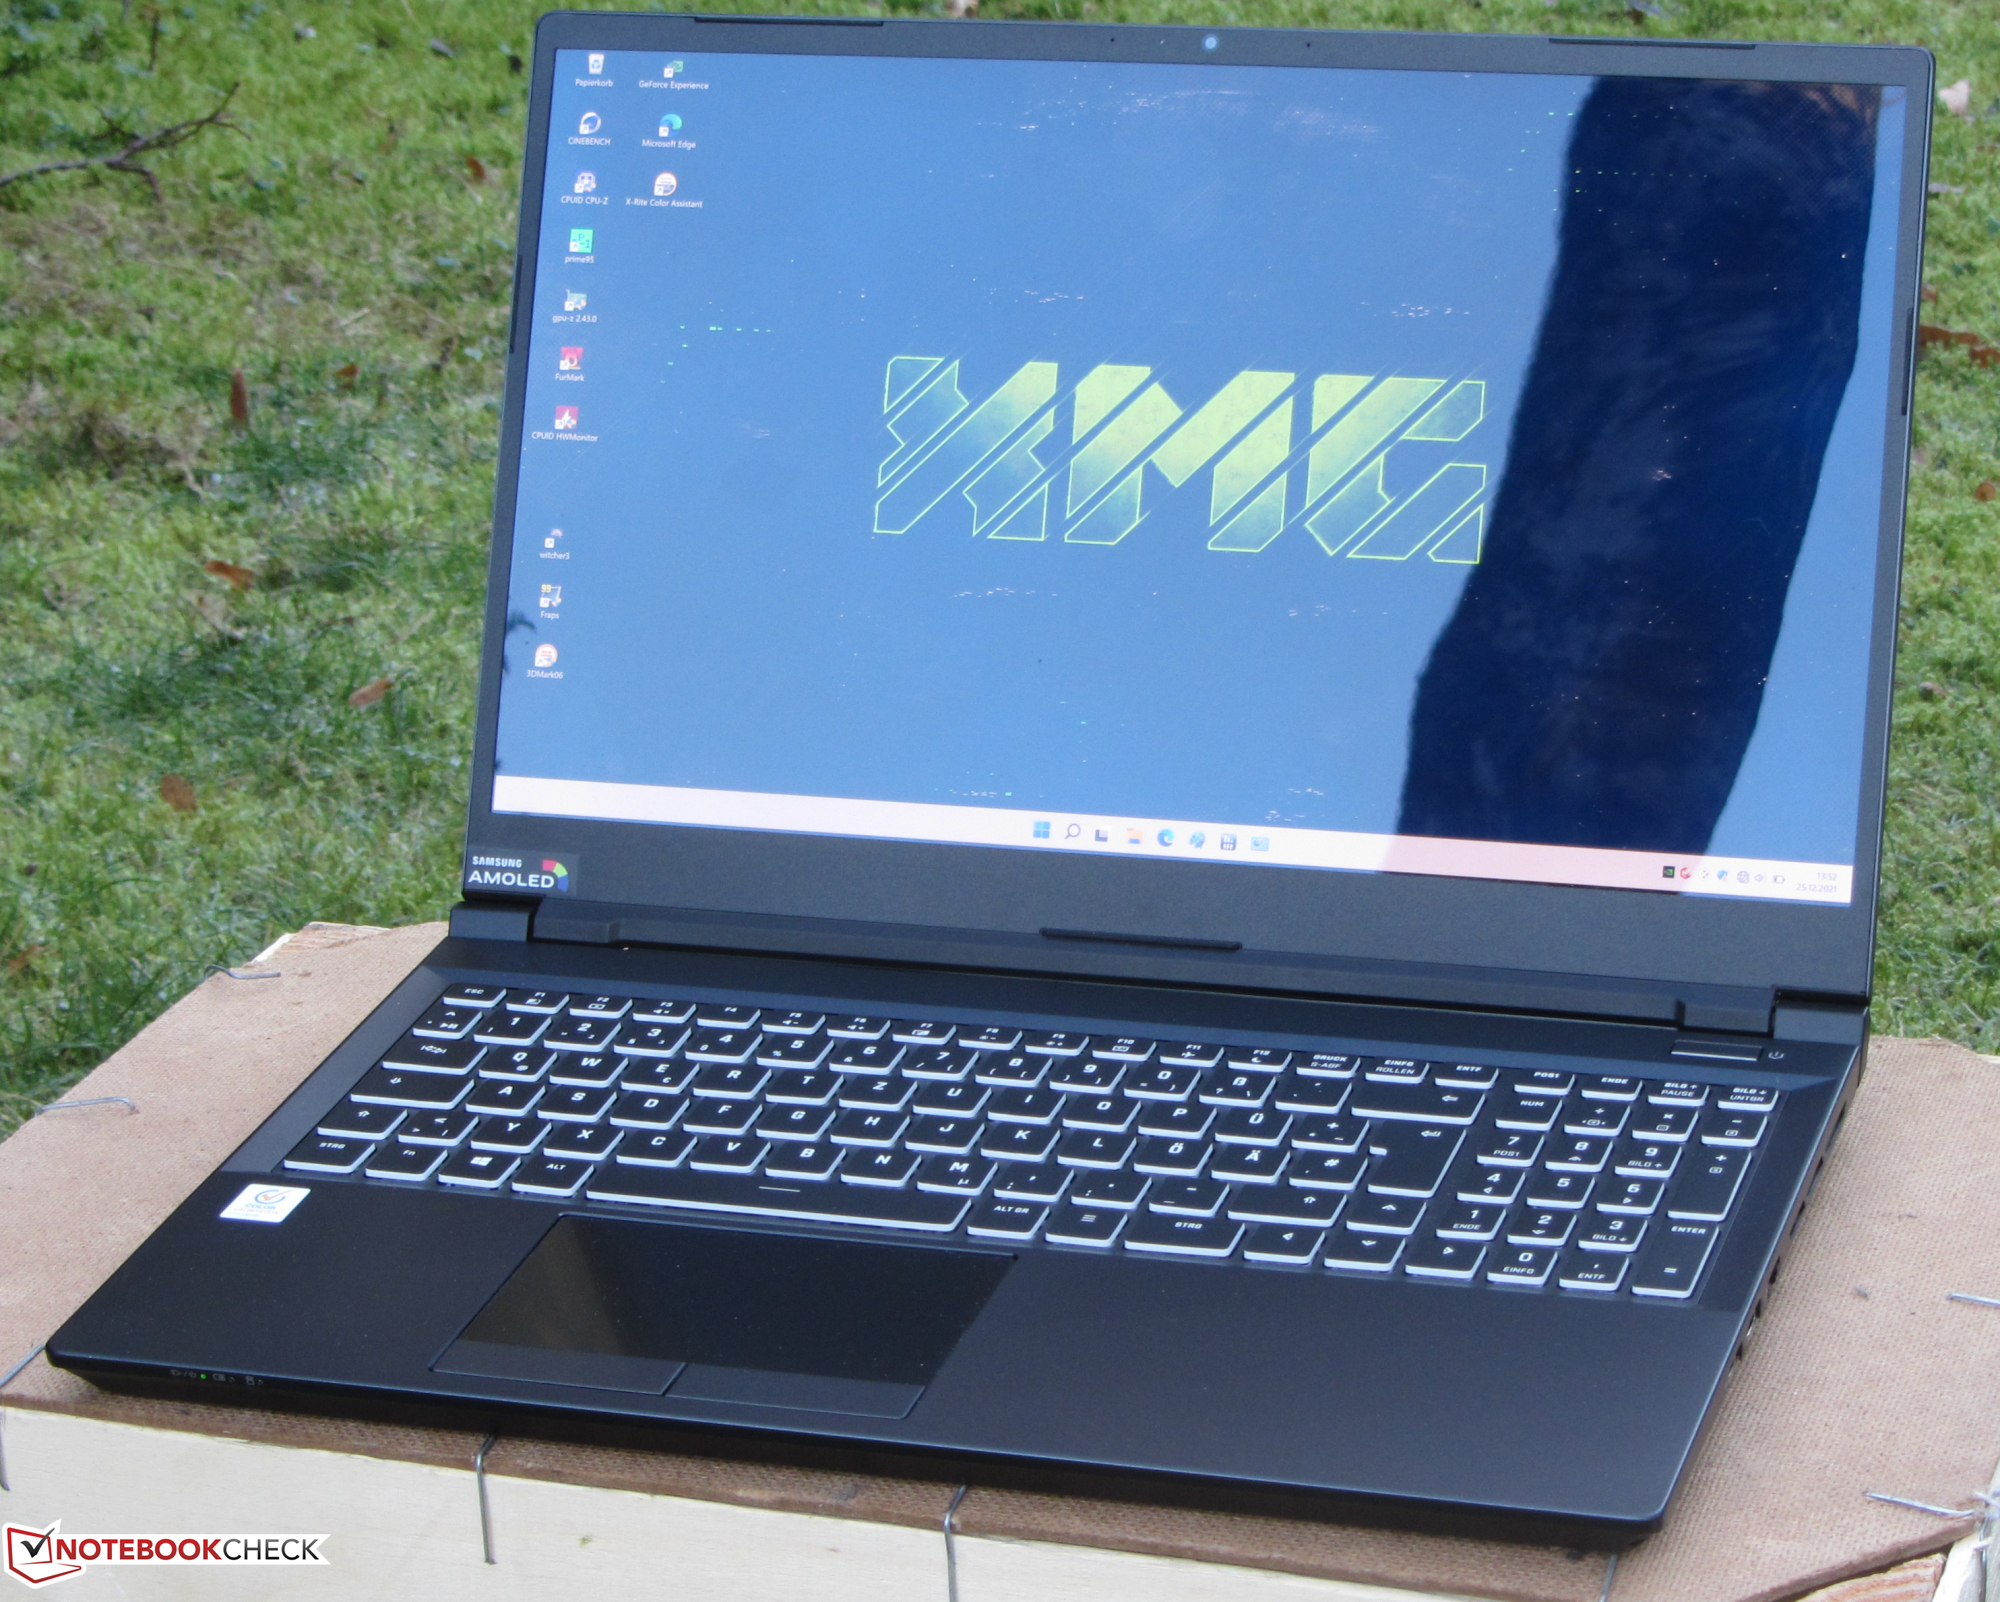
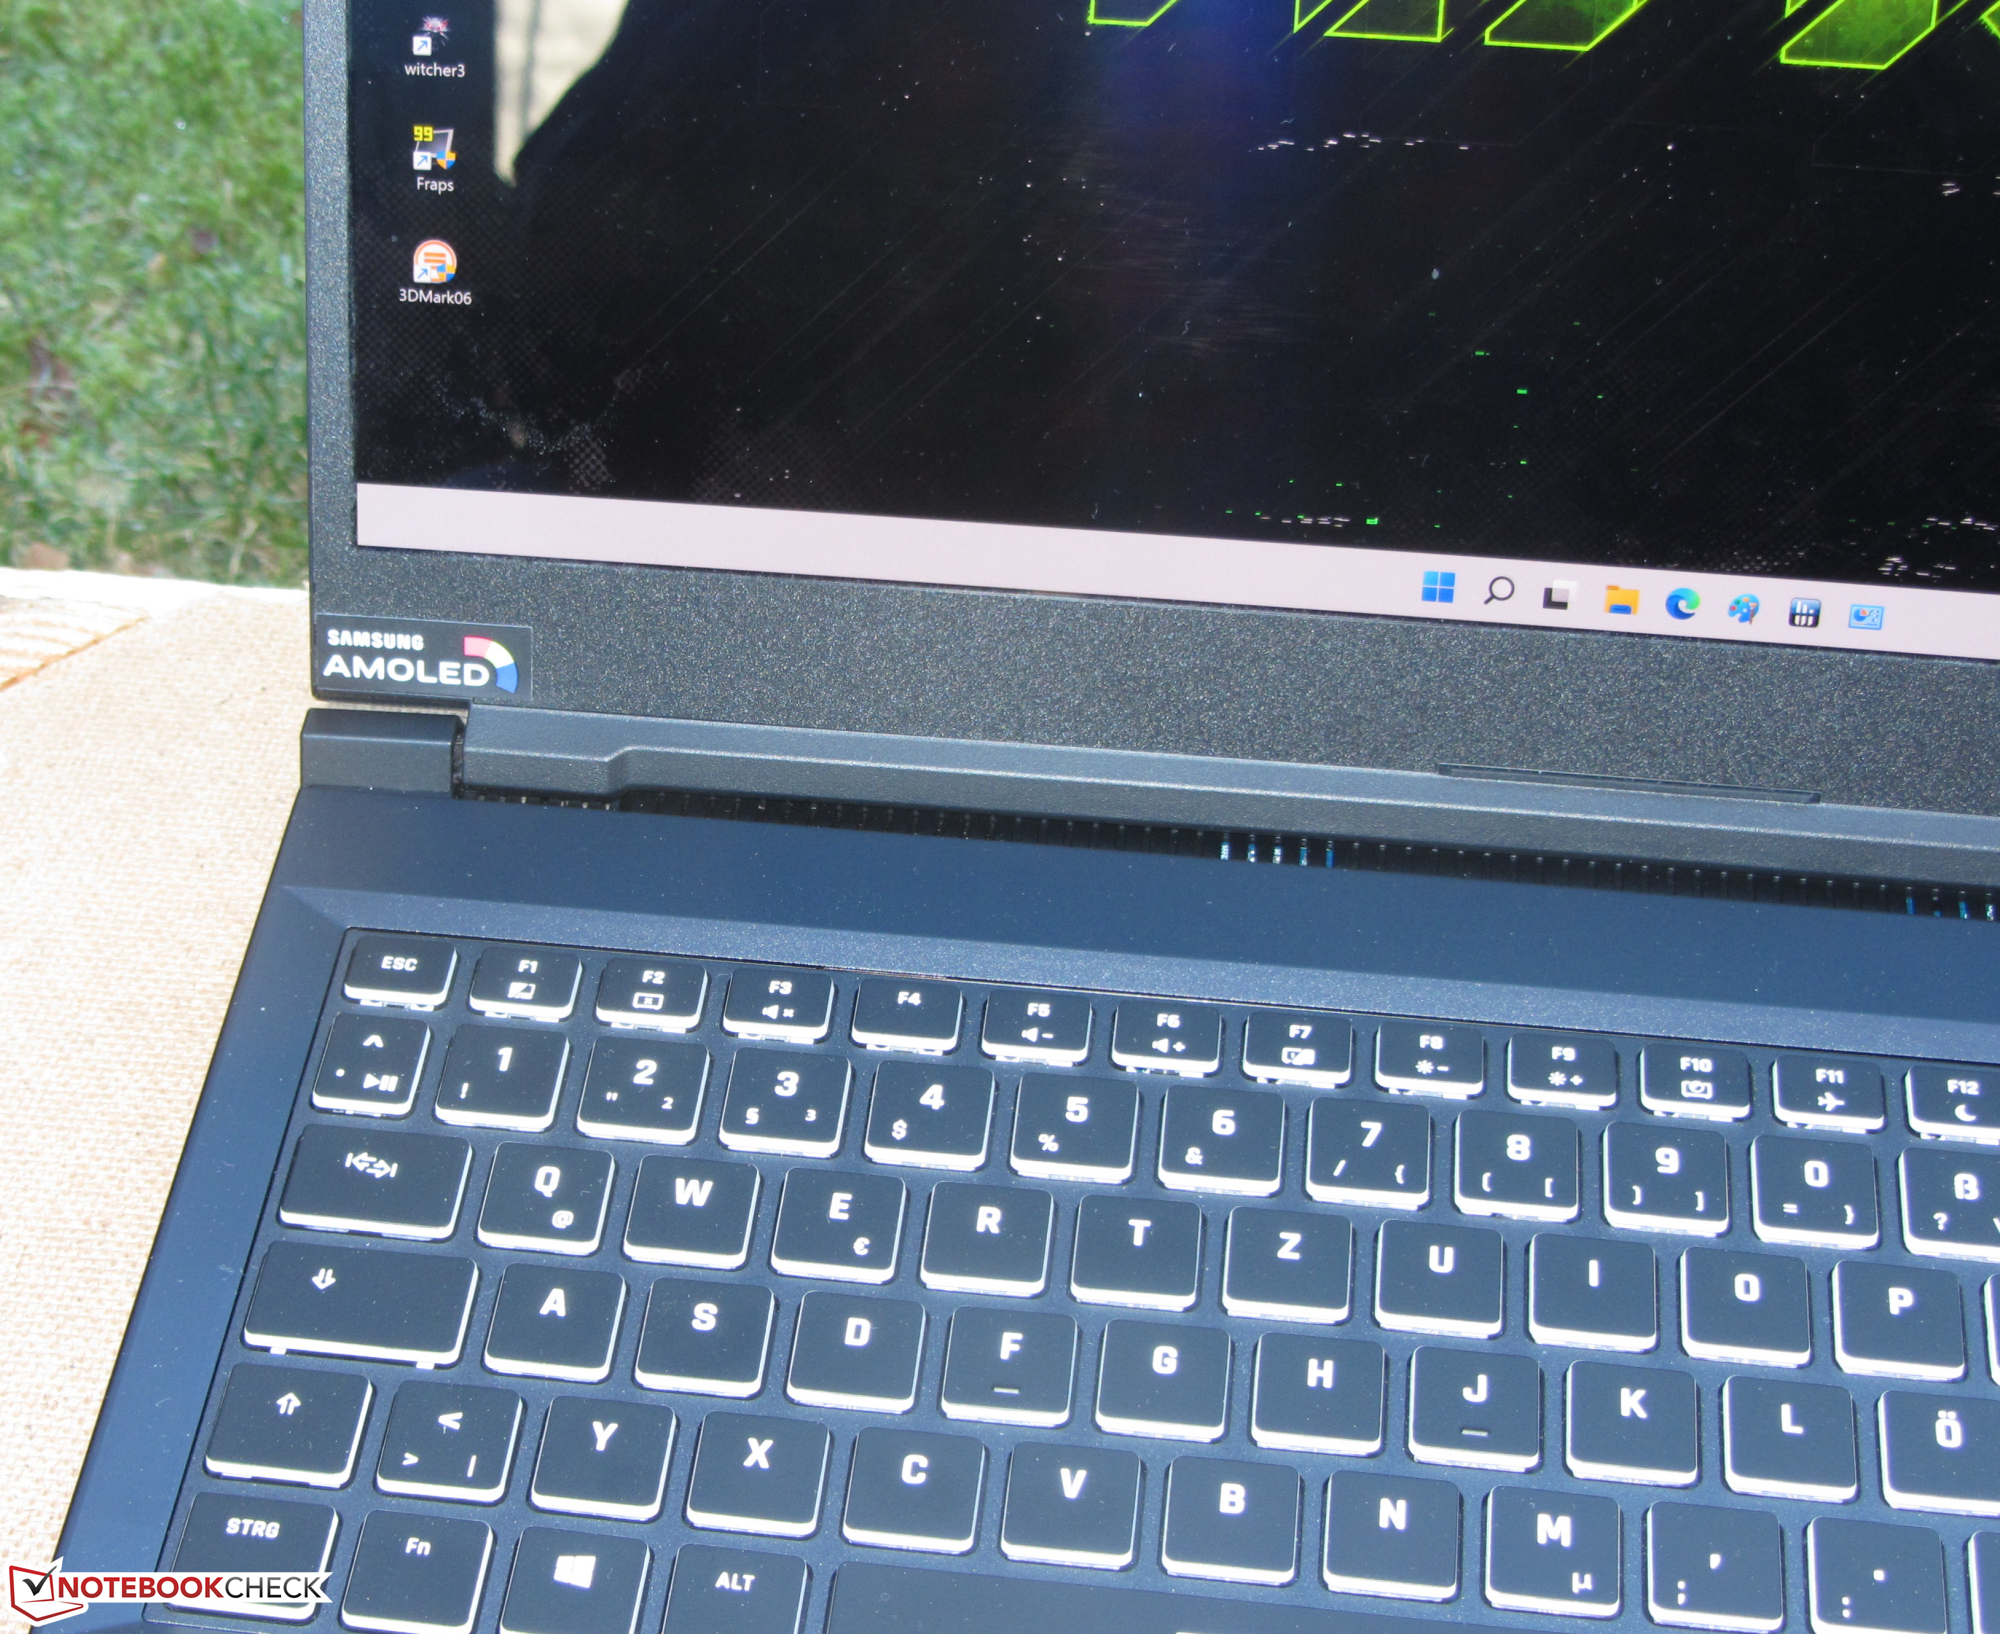
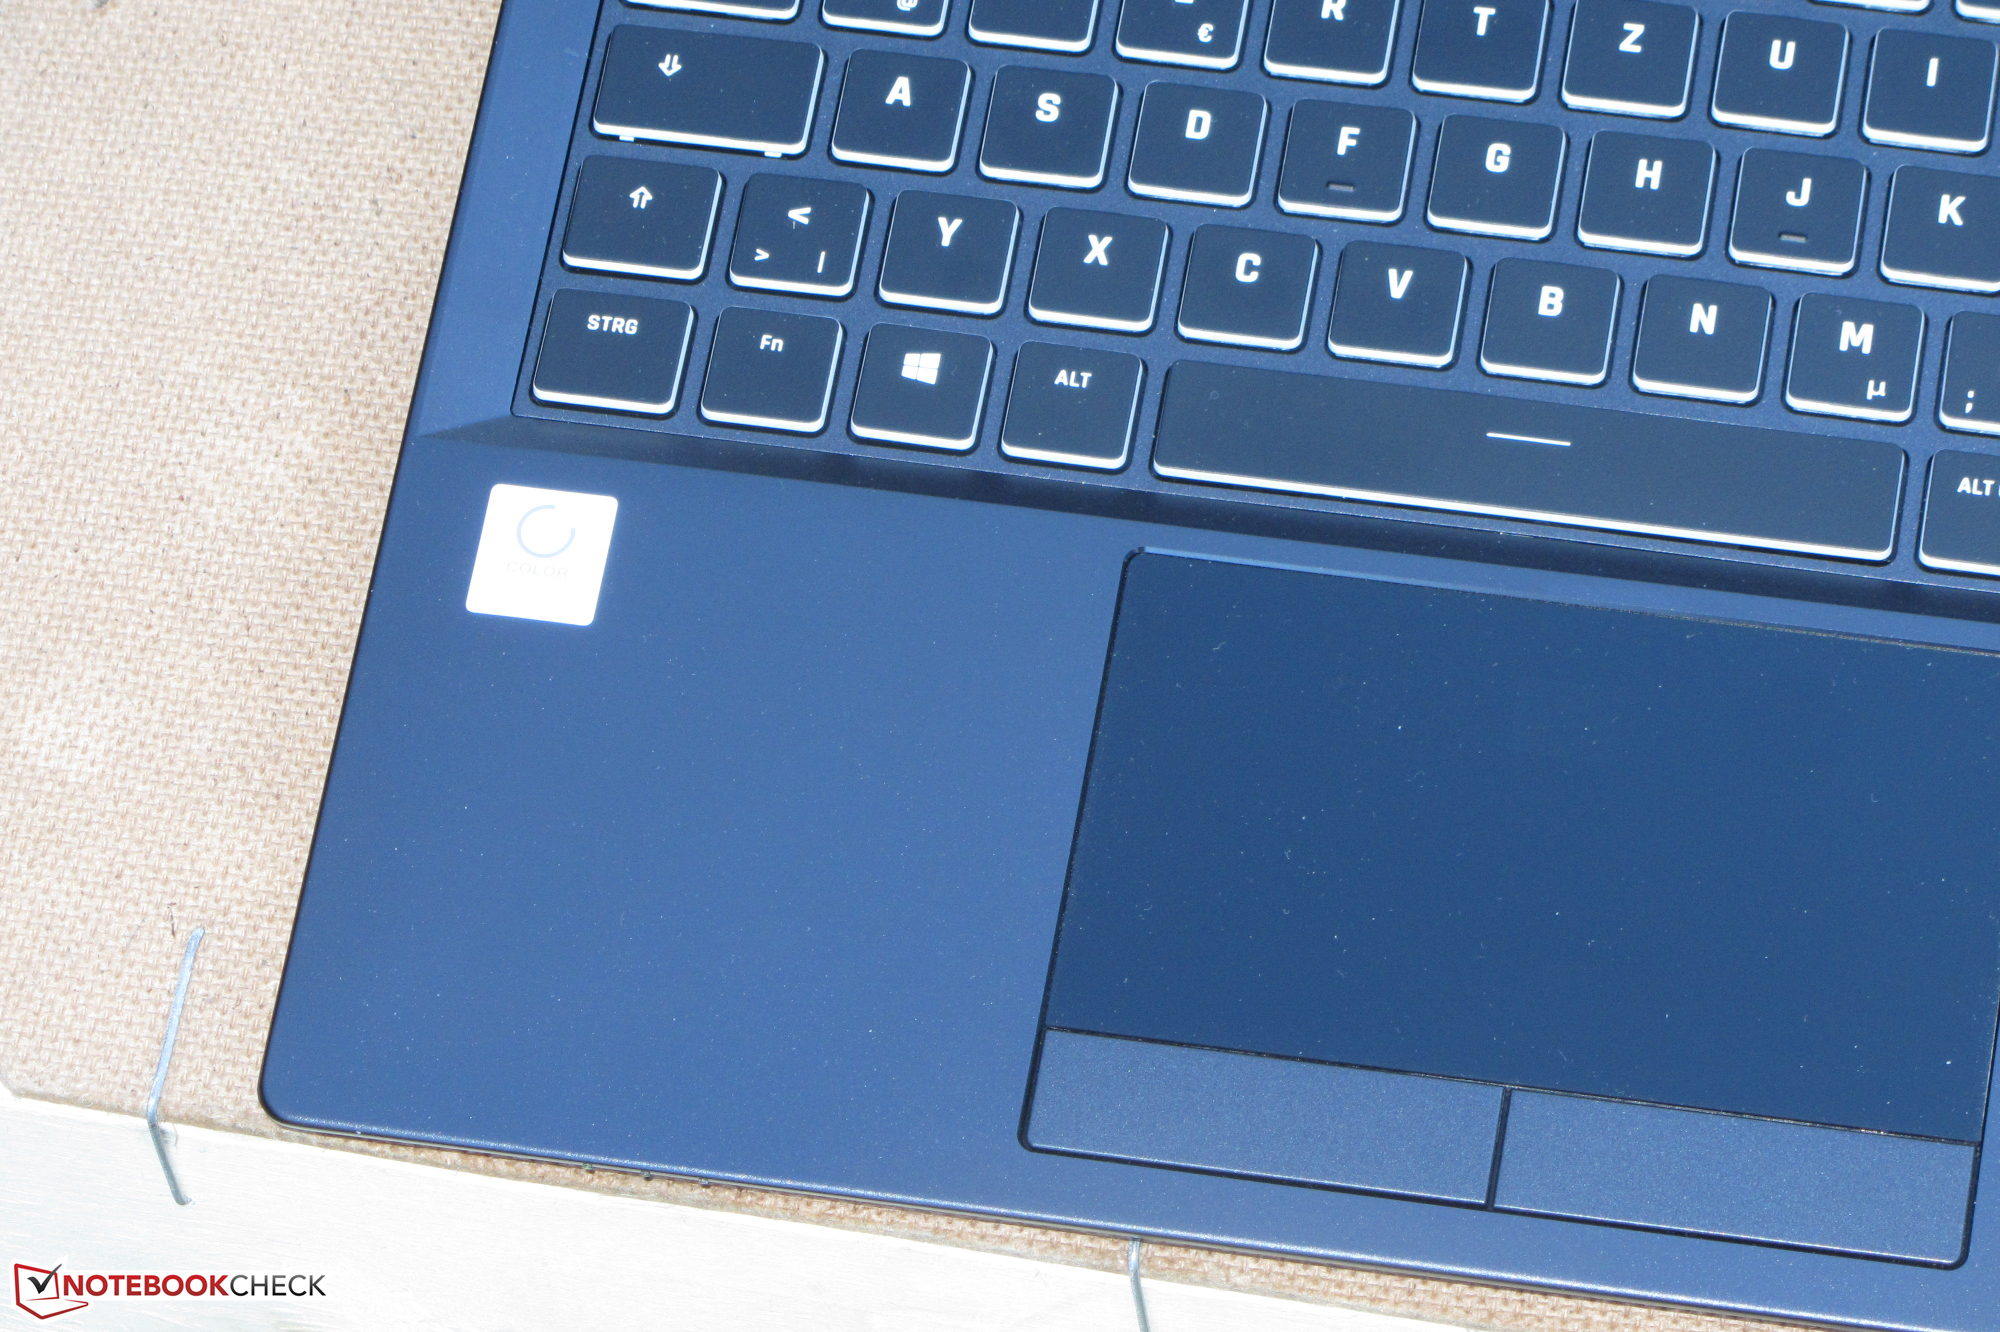
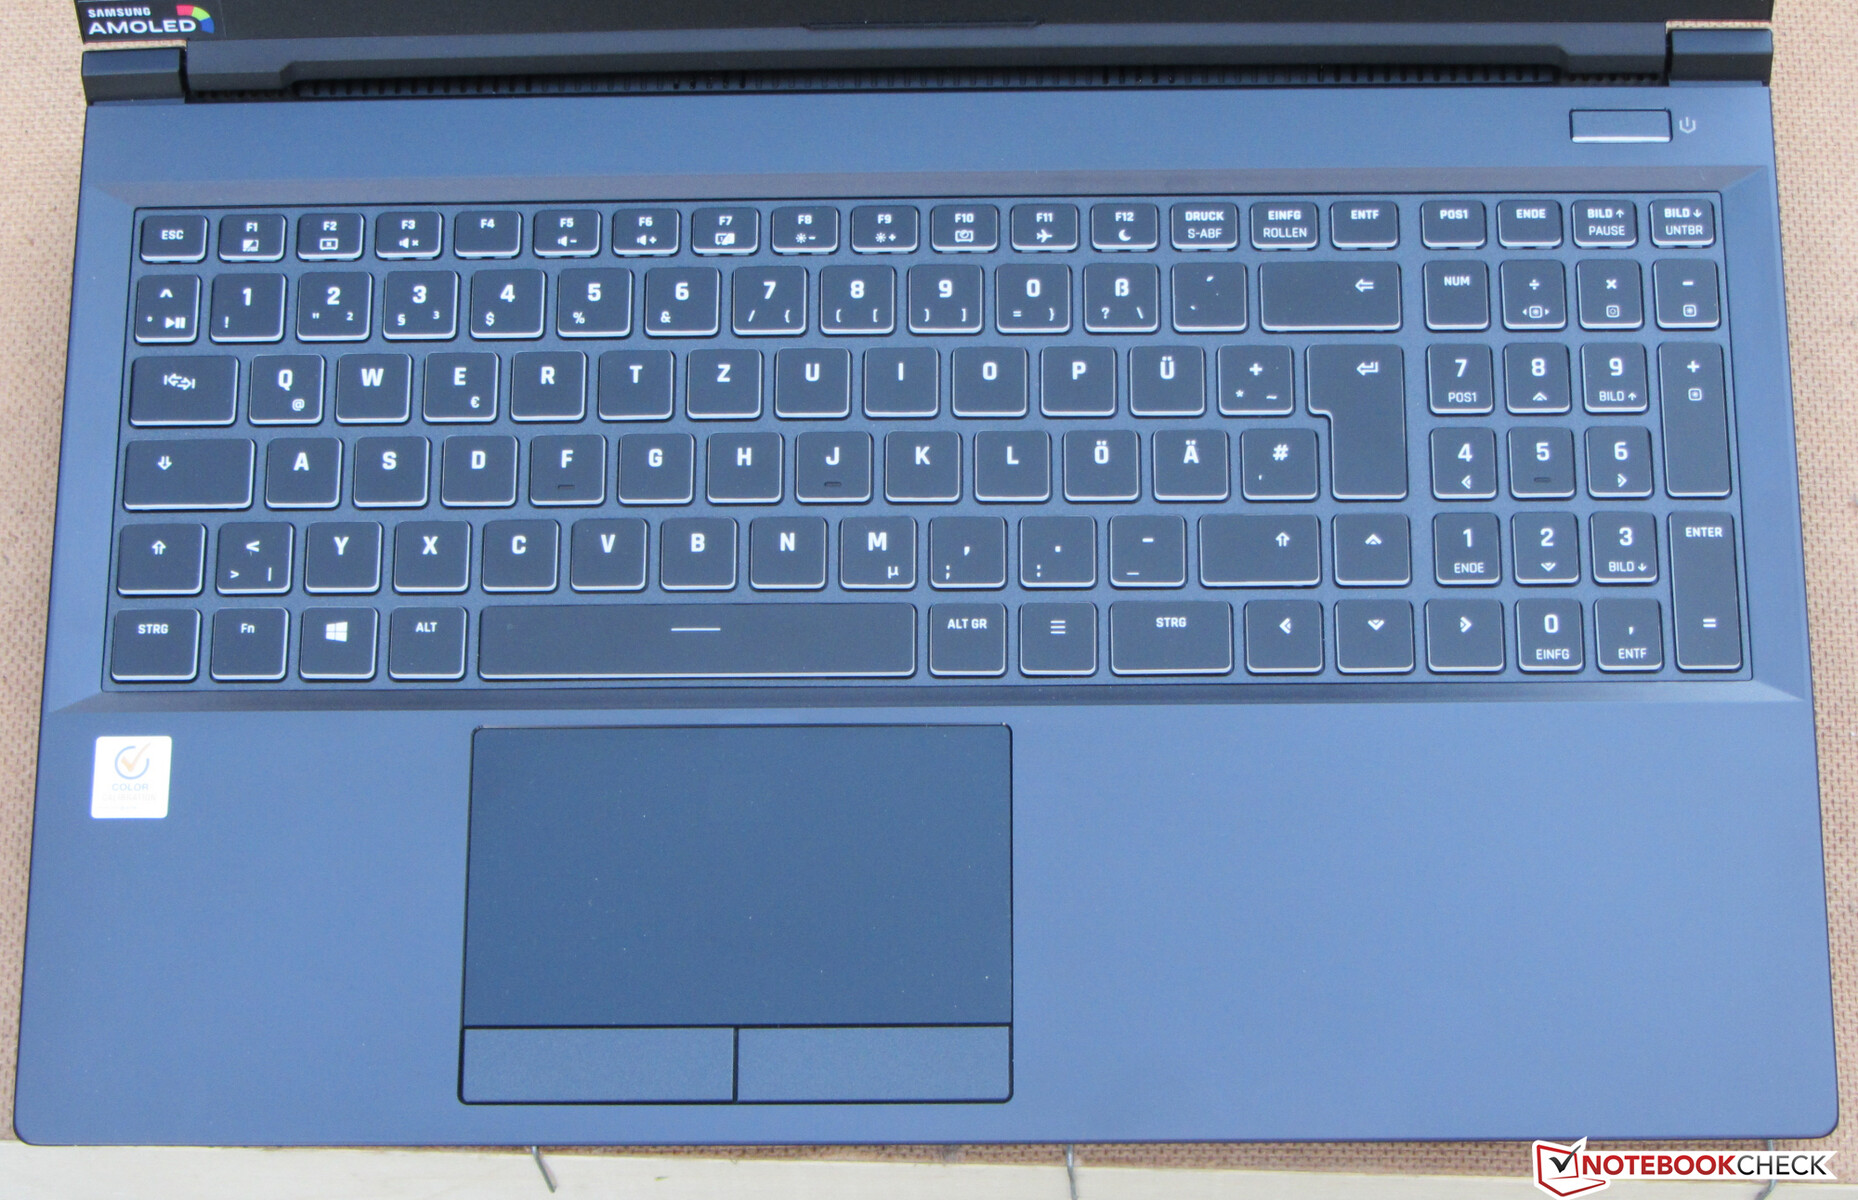
Input Devices - Keyboard with RGB backlight
Keyboard
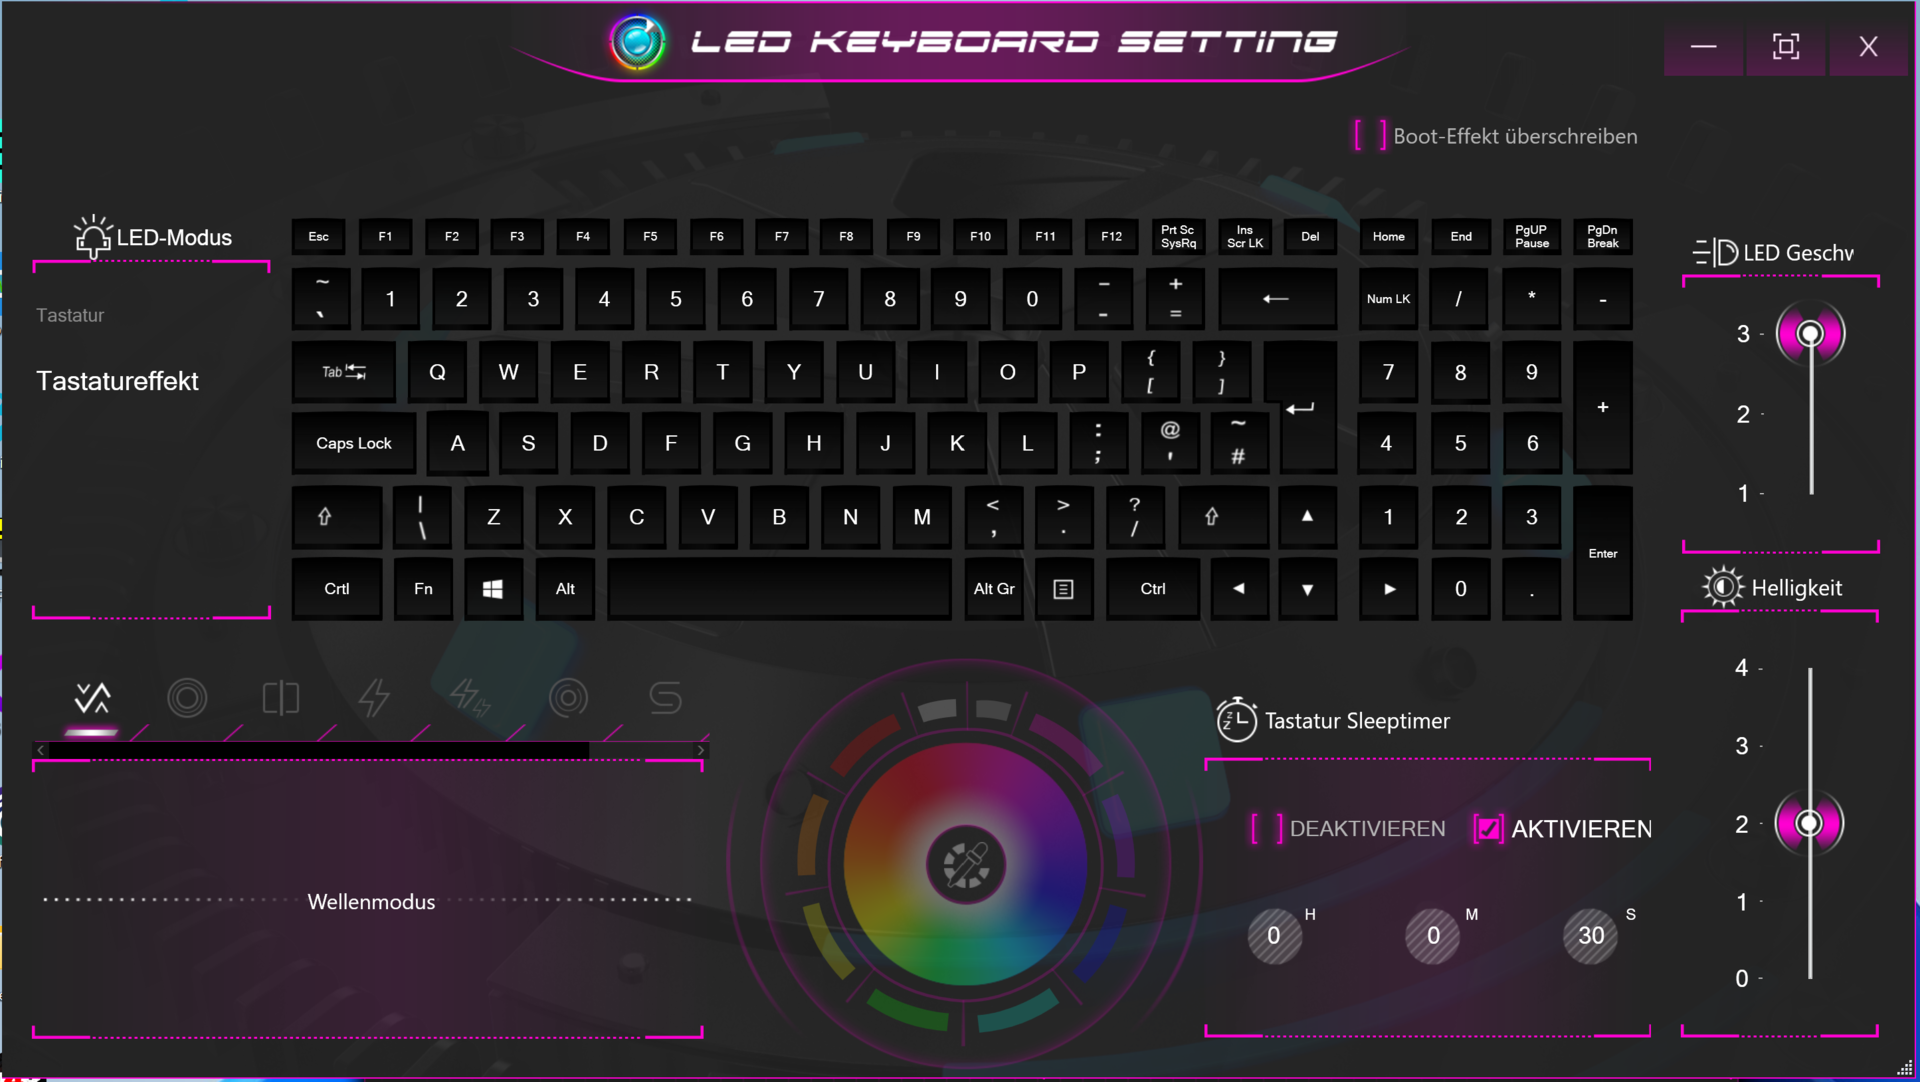
The Schenker laptop is equipped with a backlit RGB chiclet keyboard that includes a numpad. The flat, smooth keys offer medium travel and a distinct actuation point. We are pleased with the key feedback. The keyboard area slightly yields while typing. This did not end up being an issue during our testing. The keyboard backlight has three brightness settings, which can be controlled via two function keys. Overall, the keyboard is well-suited to daily use.
Touchpad
The smooth surface (~10.8x6.1 cm) of the touchpad supports multi-touch gestures and has good gliding properties. It responds well to inputs all the way into the corners. The two dedicated mouse buttons offer medium travel and a distinct actuation point.
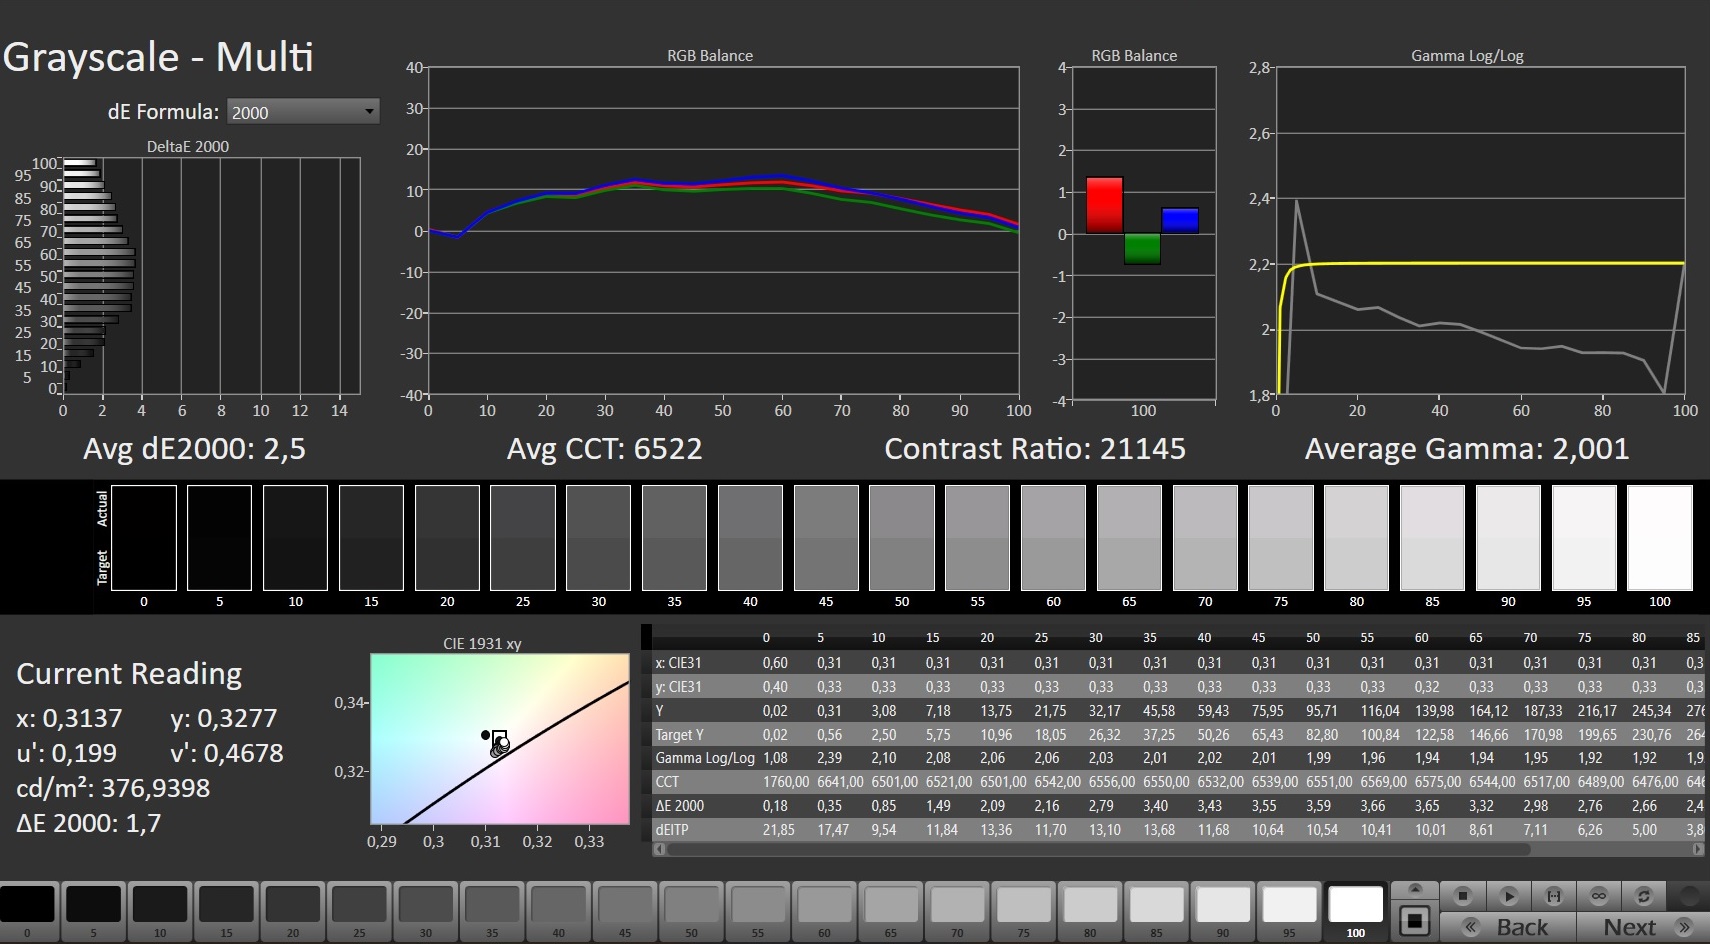
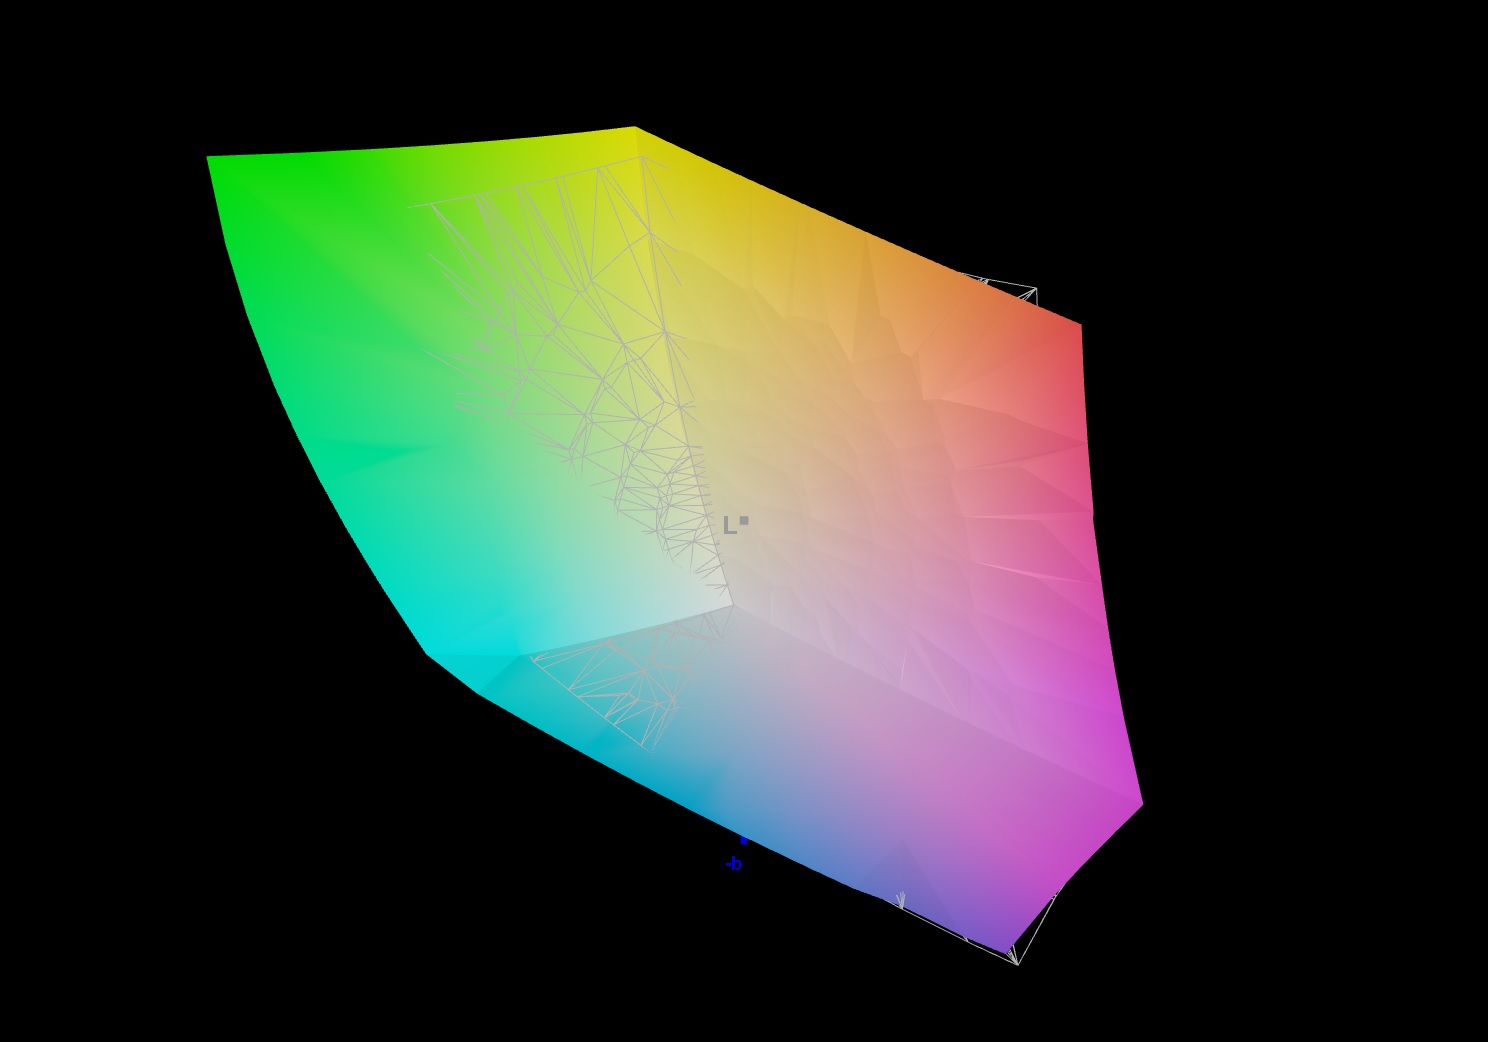
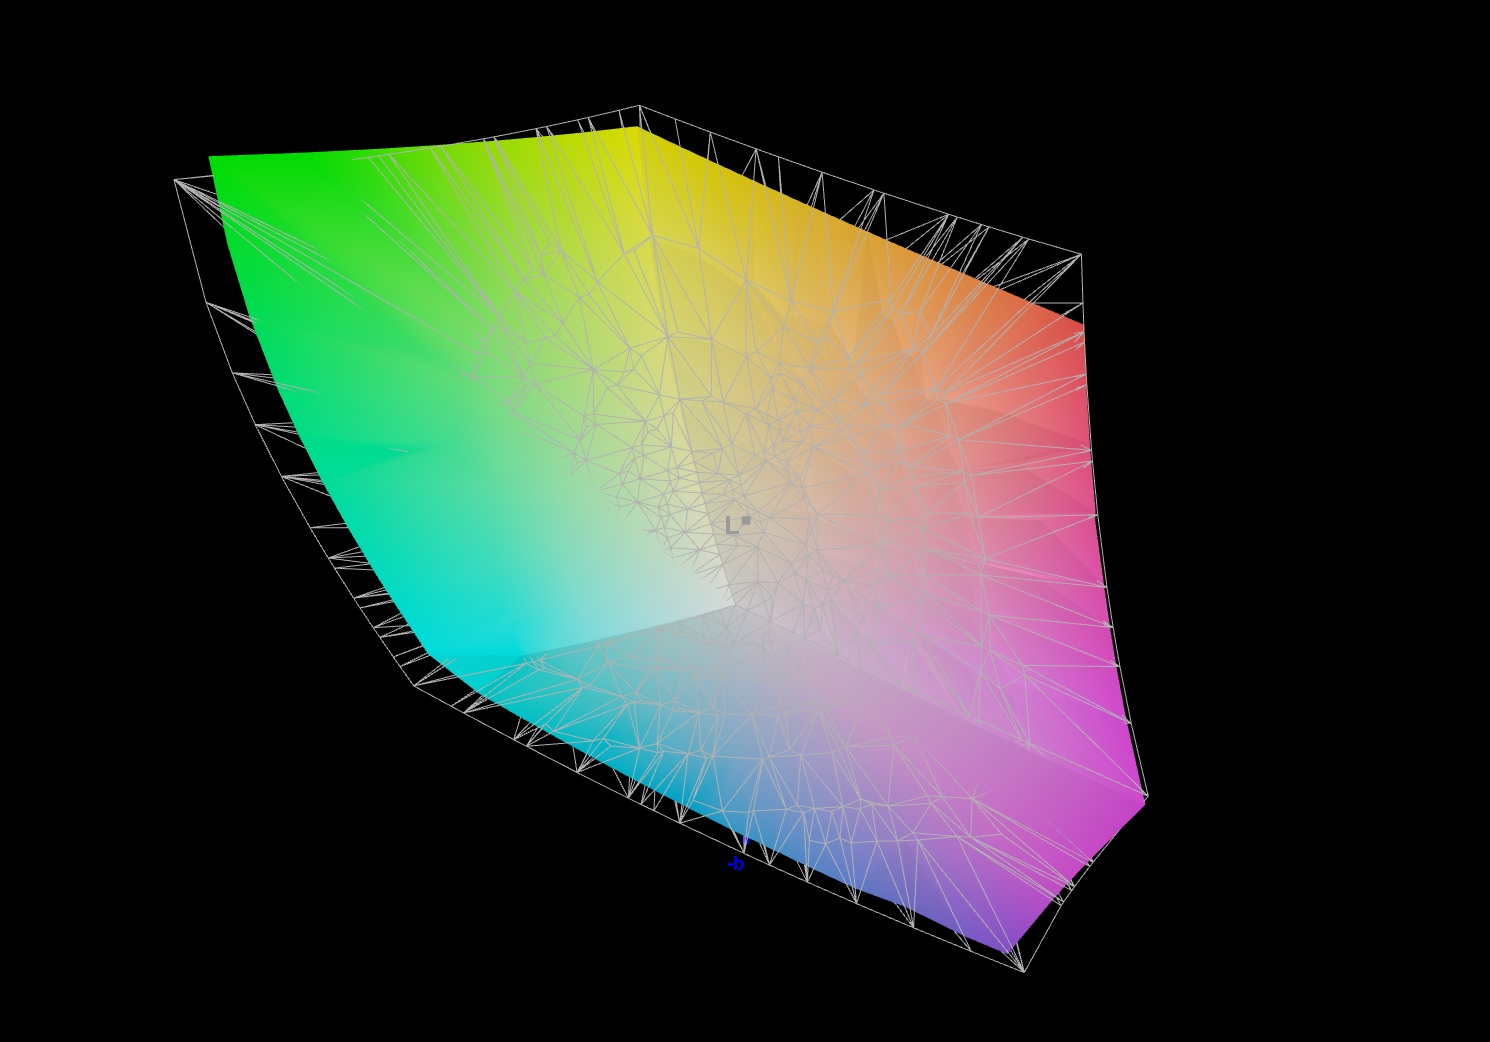
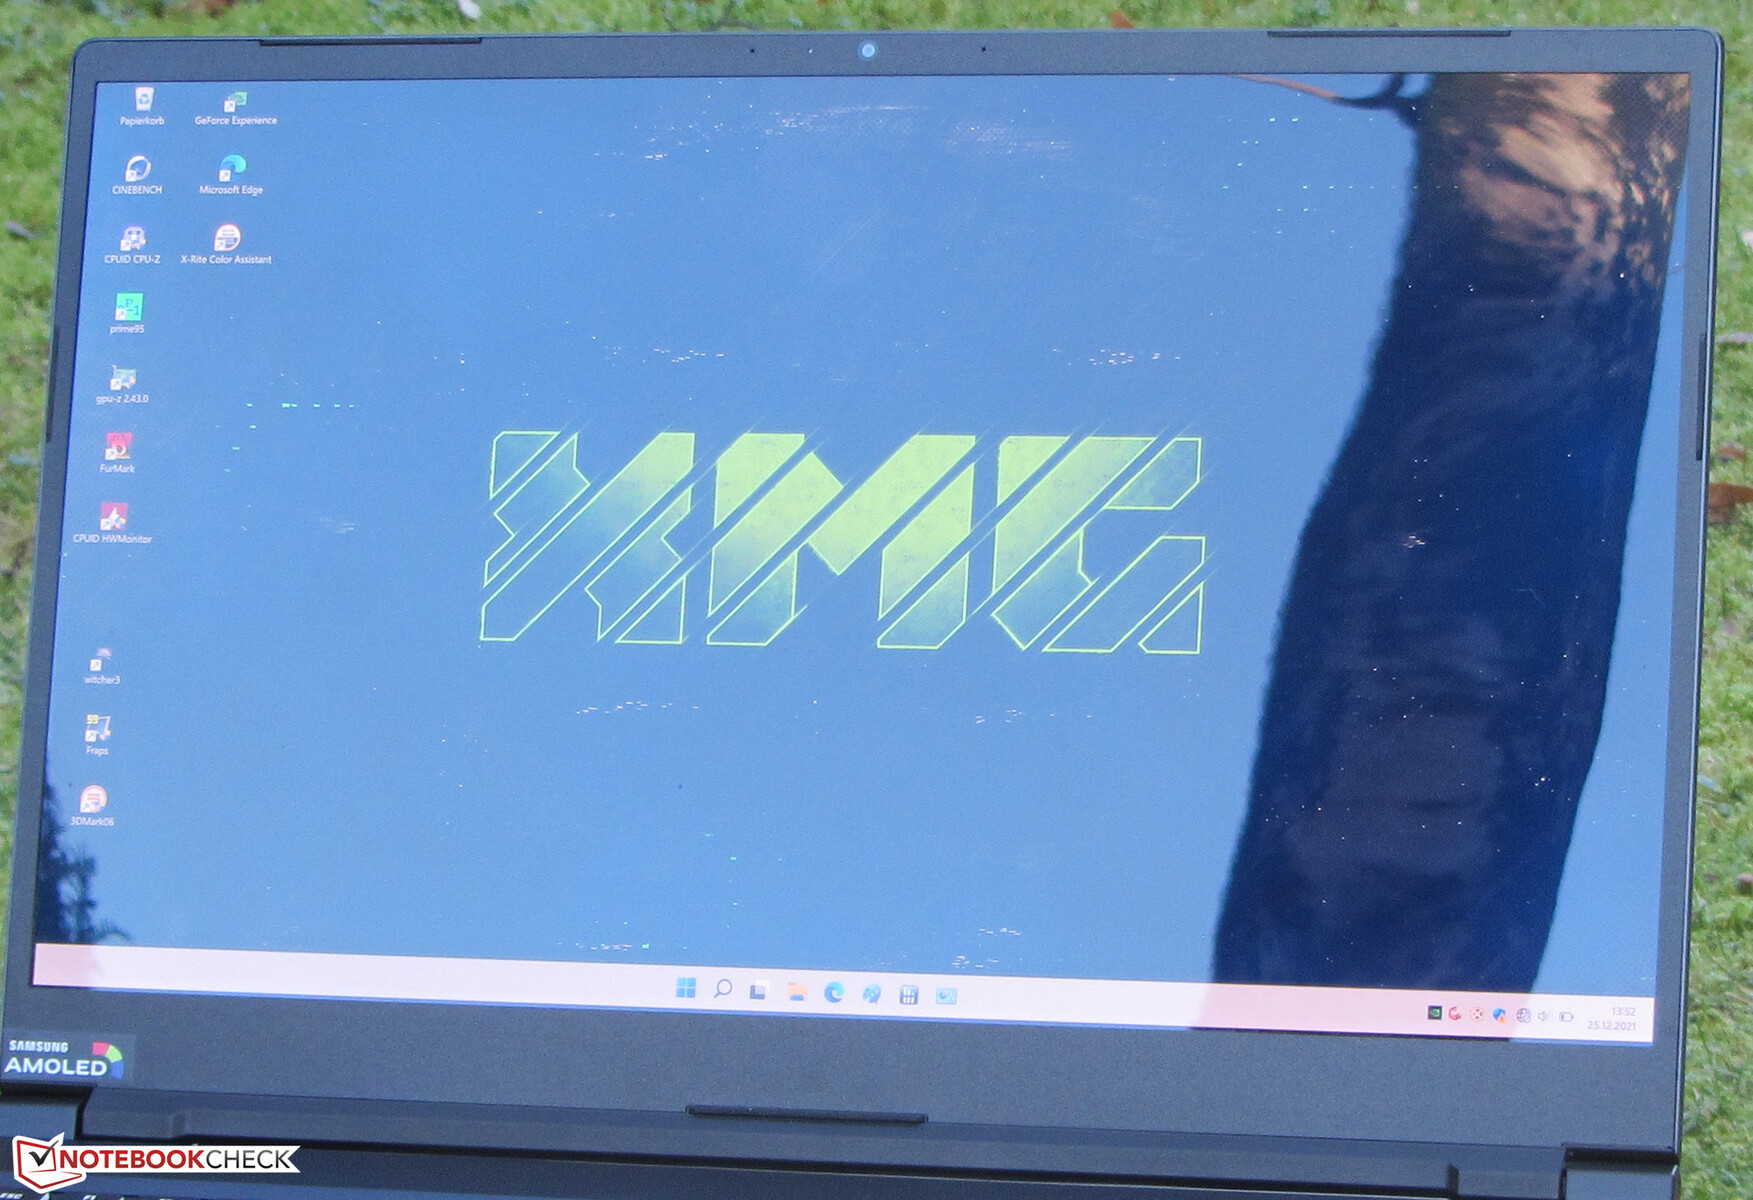
Display - Gaming Notebook with a 4K OLED panel
The reflective OLED screen (3840 x 2160 pixels) offers an excellent contrast ratio (22150:1) as well as black value (0.02) and short response times. The brightness (433.7 nits) is also pleasantly high. At brightness levels of 81 % and lower, our measuring devices detect flickering with a frequency of 60 to 240 Hz. Due to the low frequency, sensitive users may exerpience headaches or eyestrain. As an alternative to the OLED panel, Schenker also has a matte FHD display (IPS, 300 Hz) on offer. The same panel can be found on the Early-2021-Modell des XMG Pro, which we also reviewed.
| |||||||||||||||||||||||||
Brightness Distribution: 94 %
Center on Battery: 443 cd/m²
Contrast: 22150:1 (Black: 0.02 cd/m²)
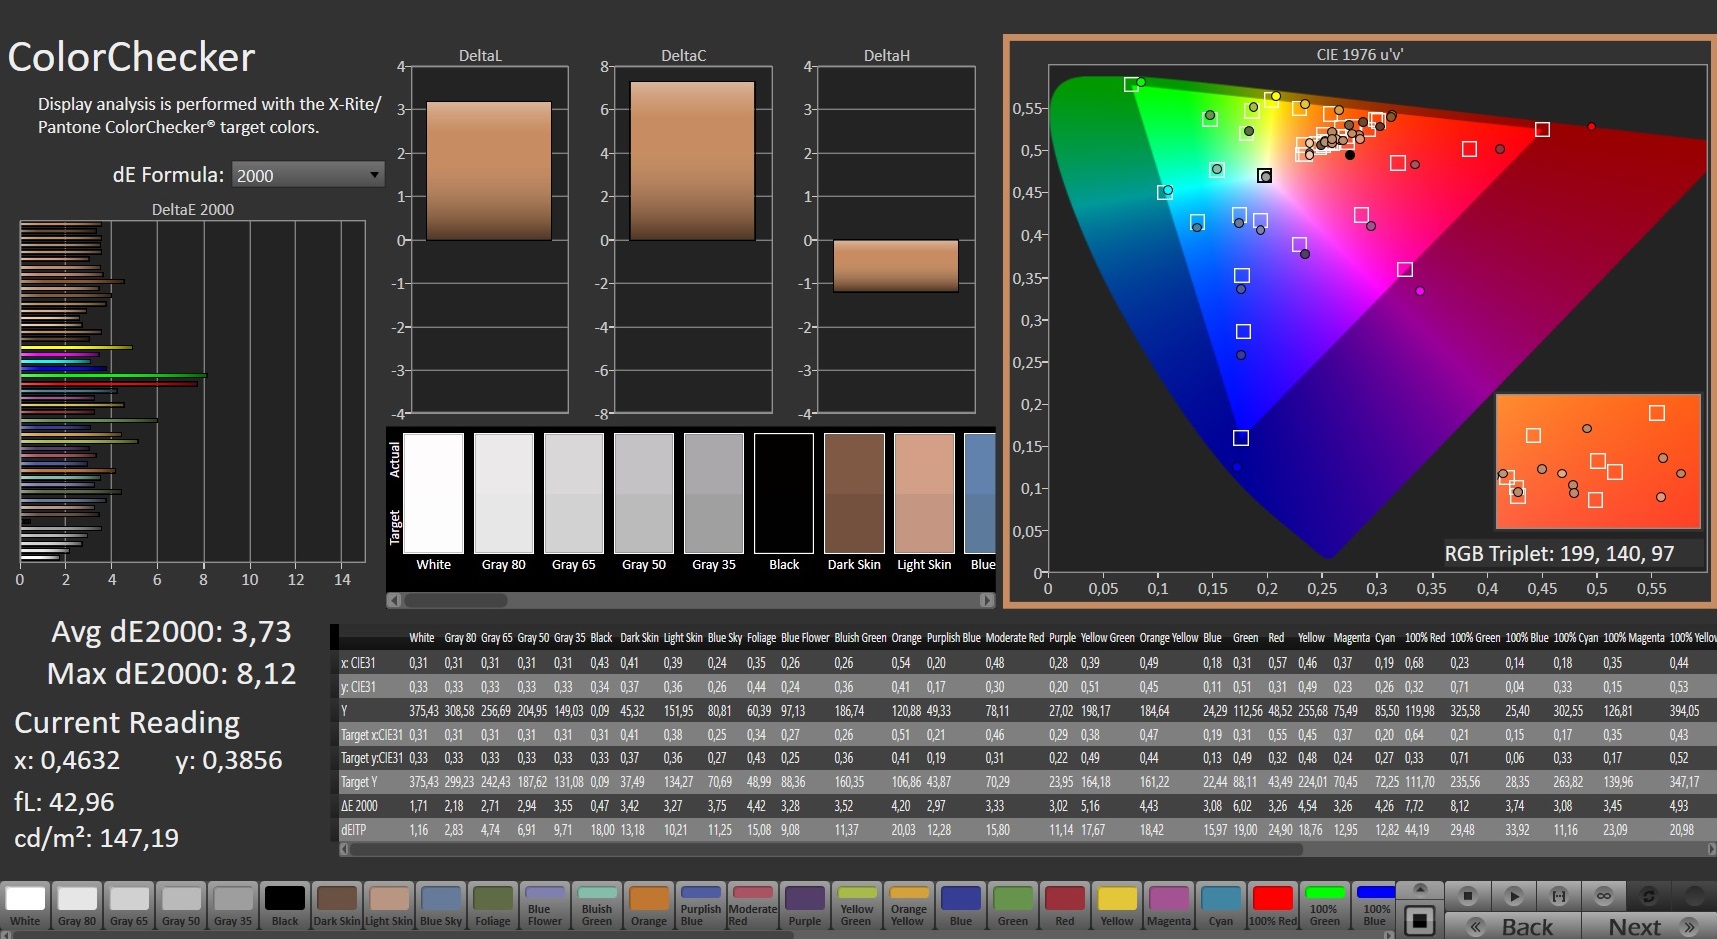
ΔE ColorChecker Calman: 3.73 | ∀{0.5-29.43 Ø4.81}
ΔE Greyscale Calman: 2.5 | ∀{0.09-98 Ø5.1}
89.1% AdobeRGB 1998 (Argyll 3D)
97.7% sRGB (Argyll 3D)
81.2% Display P3 (Argyll 3D)
Gamma: 2.001
CCT: 6522 K
| SCHENKER XMG Pro 15 (Late 2021) Samsung ATNA56WR14-0, OLED, 3840x2160, 15.6" | Lenovo Legion S7 15ACH6 82K80030GE CSOT T3 MNF601EA1-6, IPS, 3840x2160, 15.6" | Alienware x15 RTX 3070 P111F LG Philips 156QHG, IPS, 2560x1440, 15.6" | Razer Blade 15 Advanced (Mid 2021) TL156VDXP02-0, IPS, 1920x1080, 15.6" | SCHENKER XMG Pro 15 (Early 2021, RTX 3080) AU Optronics AUO7A8C (B156HAN12.0), IPS, 1920x1080, 15.6" | MSI Delta 15 A5EFK LQ156M1JW03 (SHP155D), IPS-Level, 1920x1080, 15.6" | |
|---|---|---|---|---|---|---|
| Display | 5% | 11% | -14% | -11% | -14% | |
| Display P3 Coverage (%) | 81.2 | 85.2 5% | 97.8 20% | 66.9 -18% | 69.2 -15% | 66.5 -18% |
| sRGB Coverage (%) | 97.7 | 98.8 1% | 99.9 2% | 97.1 -1% | 99.7 2% | 97.8 0% |
| AdobeRGB 1998 Coverage (%) | 89.1 | 98.2 10% | 69 -23% | 70.8 -21% | 67.6 -24% | |
| Response Times | -894% | -413% | -278% | -269% | -425% | |
| Response Time Grey 50% / Grey 80% * (ms) | 3.2 ? | 31.6 ? -888% | 12 ? -275% | 4.2 ? -31% | 3.6 ? -13% | 12.8 ? -300% |
| Response Time Black / White * (ms) | 1.6 ? | 16 ? -900% | 10.4 ? -550% | 10 ? -525% | 10 ? -525% | 10.4 ? -550% |
| PWM Frequency (Hz) | 60 ? | 23580 ? | ||||
| Screen | -222% | -305% | -194% | -133% | -240% | |
| Brightness middle (cd/m²) | 443 | 607 37% | 409.5 -8% | 353.4 -20% | 327 -26% | 291 -34% |
| Brightness (cd/m²) | 434 | 605 39% | 390 -10% | 340 -22% | 335 -23% | 266 -39% |
| Brightness Distribution (%) | 94 | 93 -1% | 88 -6% | 92 -2% | 89 -5% | 88 -6% |
| Black Level * (cd/m²) | 0.02 | 0.41 -1950% | 0.47 -2250% | 0.31 -1450% | 0.22 -1000% | 0.36 -1700% |
| Contrast (:1) | 22150 | 1480 -93% | 871 -96% | 1140 -95% | 1486 -93% | 808 -96% |
| Colorchecker dE 2000 * | 3.73 | 0.84 77% | 3.48 7% | 2.17 42% | 2.18 42% | 2.98 20% |
| Colorchecker dE 2000 max. * | 8.12 | 3.02 63% | 6.31 22% | 5.69 30% | 4.24 48% | 7.59 7% |
| Greyscale dE 2000 * | 2.5 | 1.1 56% | 5 -100% | 3.4 -36% | 2.6 -4% | 4.2 -68% |
| Gamma | 2.001 110% | 2.131 103% | 2.16 102% | 2.2 100% | 2.123 104% | 2.293 96% |
| CCT | 6522 100% | 6648 98% | 6591 99% | 6830 95% | 6815 95% | 7624 85% |
| Colorchecker dE 2000 calibrated * | 0.69 | 0.89 | 1.05 | 1 | 0.91 | |
| Color Space (Percent of AdobeRGB 1998) (%) | 71 | |||||
| Color Space (Percent of sRGB) (%) | 93 | |||||
| Total Average (Program / Settings) | -370% /
-273% | -236% /
-270% | -162% /
-165% | -138% /
-126% | -226% /
-216% |
* ... smaller is better
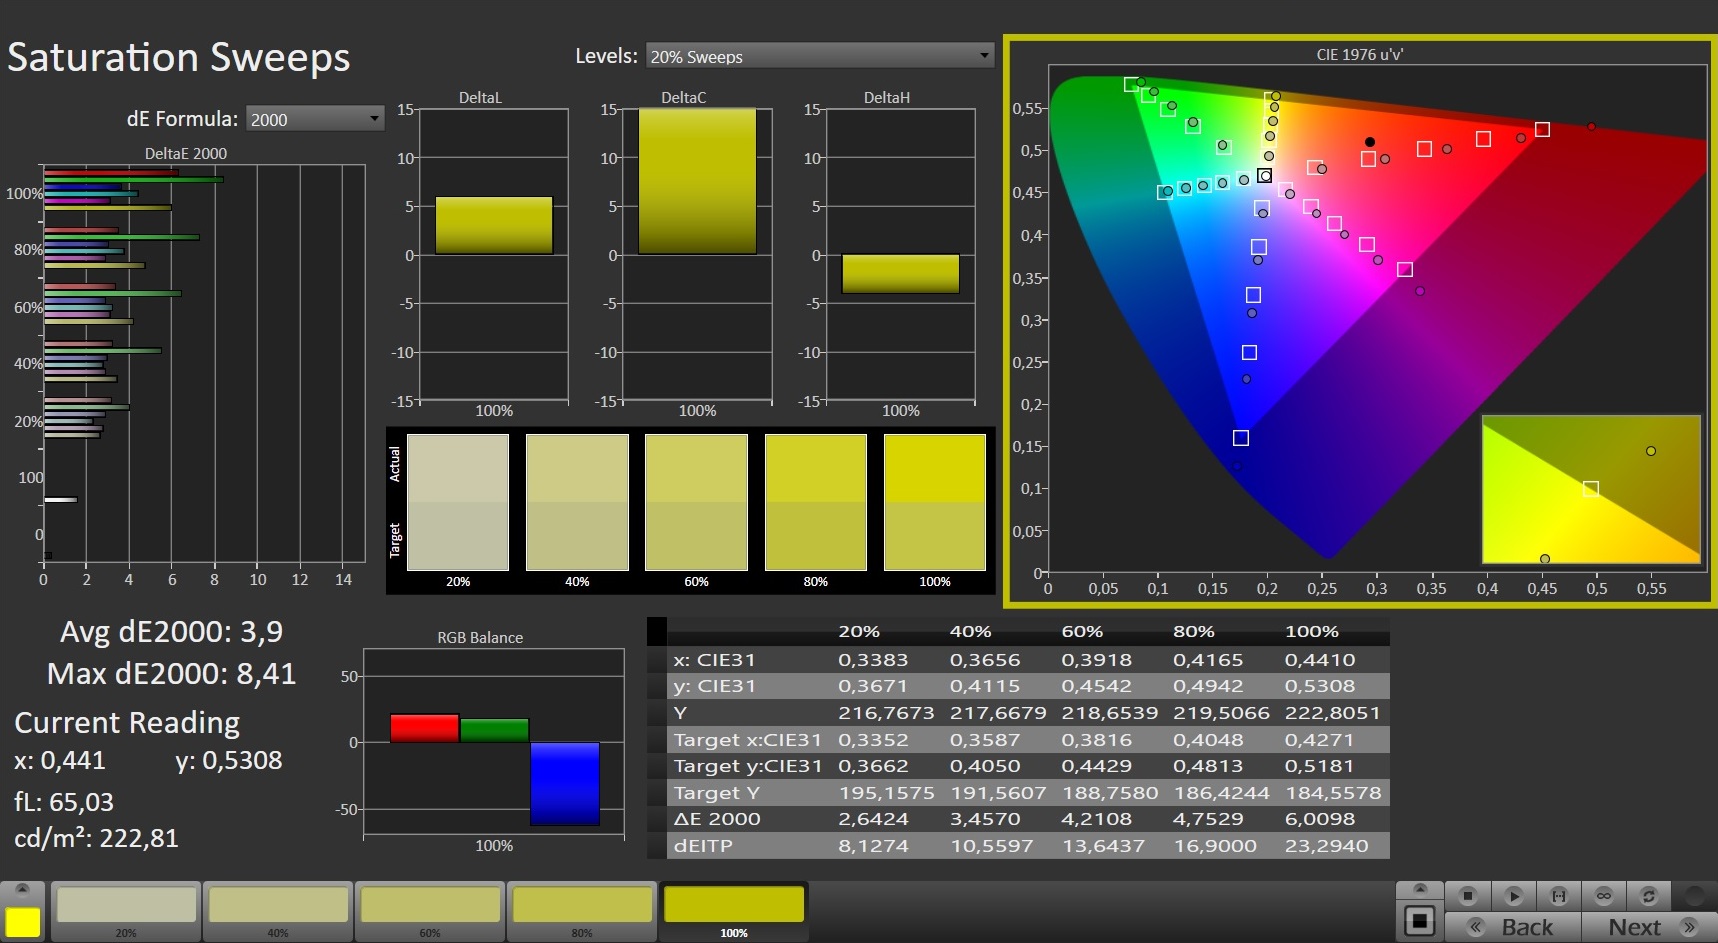
The X-Rite certification of the screen ensures a natural color representation. Even ex-factory, the color deviation is very low and impossible to notice with the naked eye. The display does not suffer from a blue tint. The color space coverage is wide: The screen can display 98 % and 89 % of the sRGB and AdobeRGB color spaces, respectively (we may retest this, since Schenker reaches 100 % in their own testing).
Display Response Times
| ↔ Response Time Black to White | ||
|---|---|---|
| 1.6 ms ... rise ↗ and fall ↘ combined | ↗ 1 ms rise | 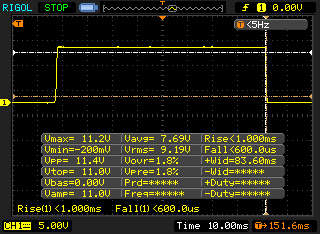 |
| ↘ 0.6 ms fall | ||
| The screen shows very fast response rates in our tests and should be very well suited for fast-paced gaming. In comparison, all tested devices range from 0.1 (minimum) to 240 (maximum) ms. » 7 % of all devices are better. This means that the measured response time is better than the average of all tested devices (20.4 ms). | ||
| ↔ Response Time 50% Grey to 80% Grey | ||
| 3.2 ms ... rise ↗ and fall ↘ combined | ↗ 1.2 ms rise | 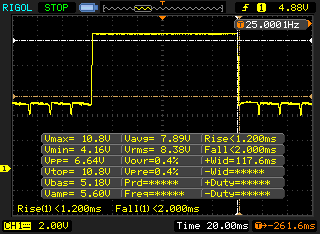 |
| ↘ 2 ms fall | ||
| The screen shows very fast response rates in our tests and should be very well suited for fast-paced gaming. In comparison, all tested devices range from 0.165 (minimum) to 636 (maximum) ms. » 11 % of all devices are better. This means that the measured response time is better than the average of all tested devices (31.9 ms). | ||
Screen Flickering / PWM (Pulse-Width Modulation)
| Screen flickering / PWM detected | 60 Hz | ≤ 81 % brightness setting | 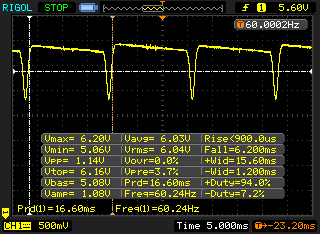 |
The display backlight flickers at 60 Hz (worst case, e.g., utilizing PWM) Flickering detected at a brightness setting of 81 % and below. There should be no flickering or PWM above this brightness setting. The frequency of 60 Hz is very low, so the flickering may cause eyestrain and headaches after extended use. In comparison: 53 % of all tested devices do not use PWM to dim the display. If PWM was detected, an average of 8255 (minimum: 5 - maximum: 343500) Hz was measured. | |||
Since the panel has good viewing angles, it can be read from any position. Outdoors, reading the display's content can be tricky due to its reflective nature.

Performance - Sufficient for years to come
With the XMG Pro 15, Schenker has created a slim, compact 15.6-inch gaming notebook with enough performance reserves to run all current games smoothly.

Testing Conditions
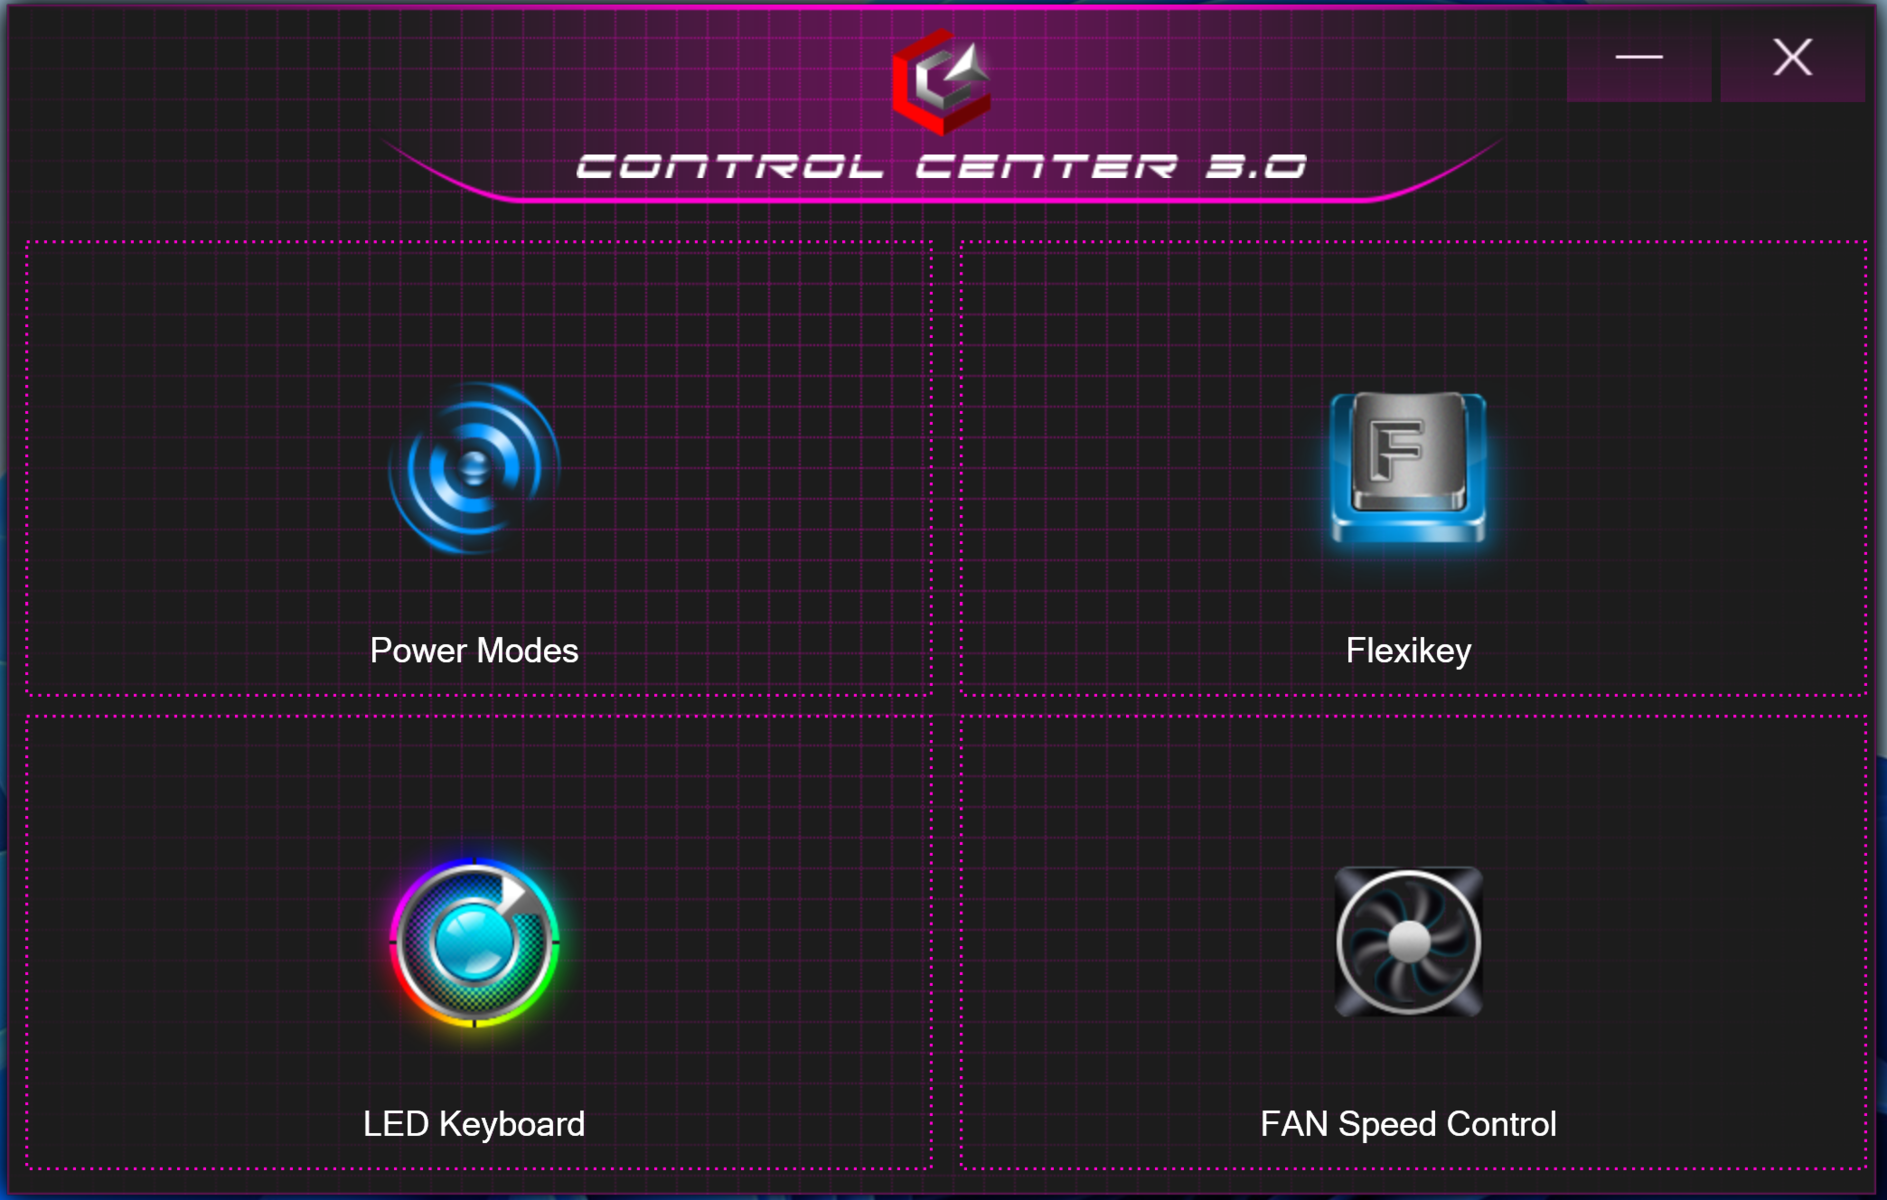
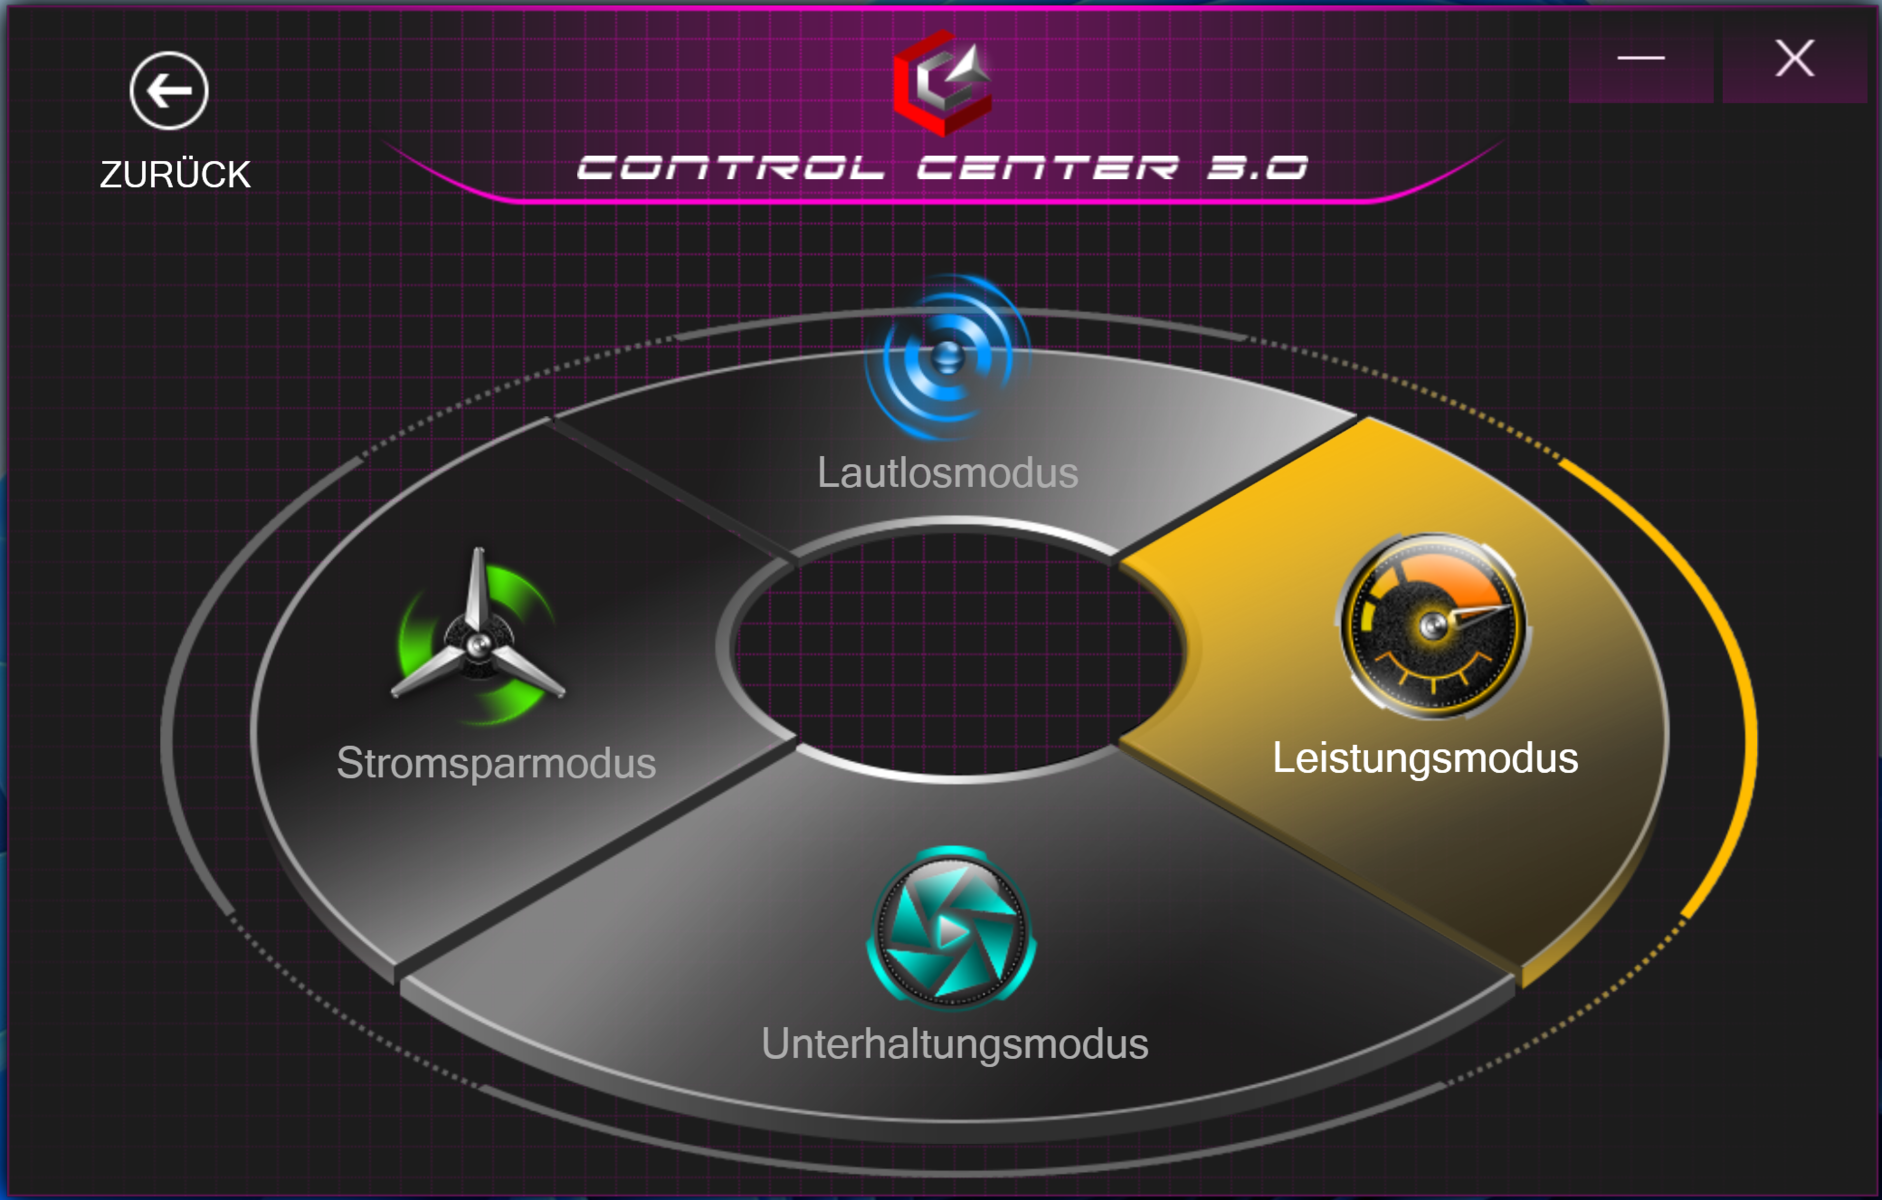
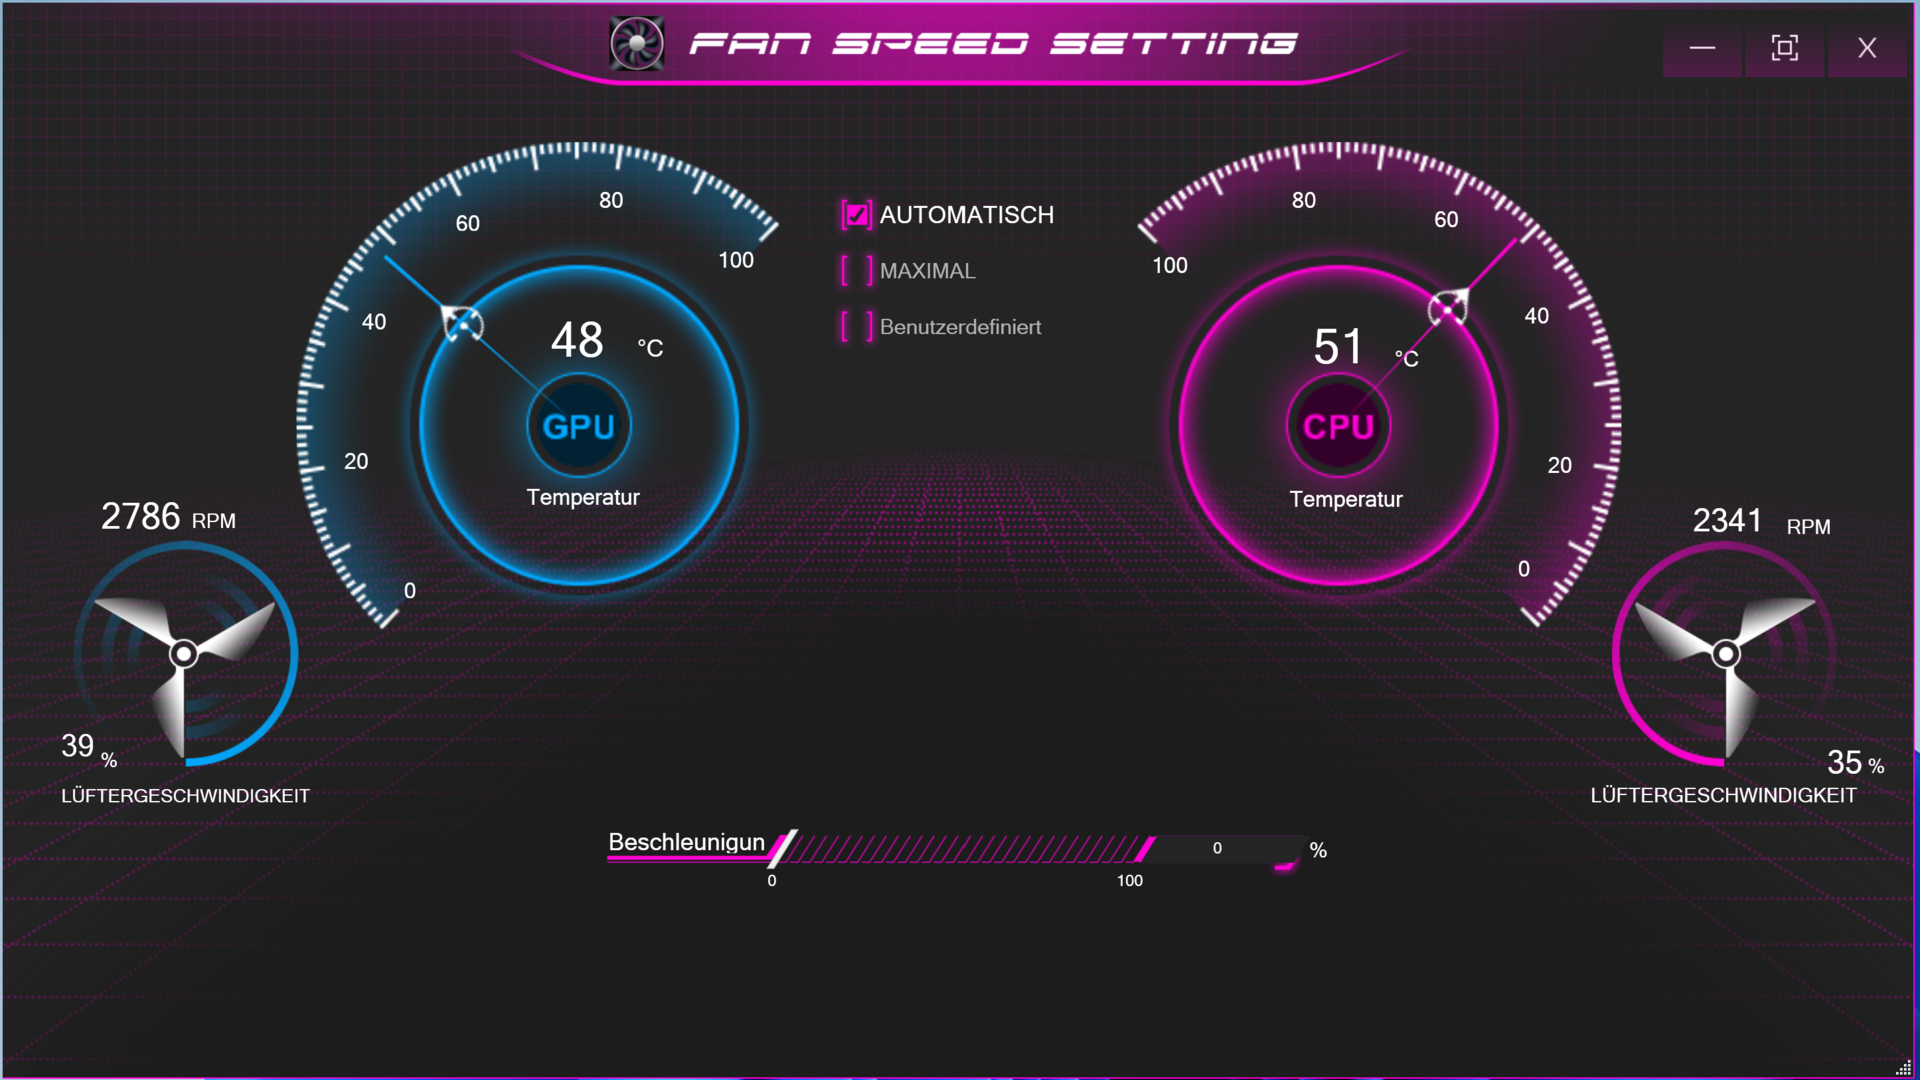
The preinstalled Control Center software allows users to select a power profile (see table), among other things. The performance profile with automatic fan control was selected prior to running any benchmarks. Several benchmarks were also run using the other three profiles. The results can be found in the comparison tables. The battery life tests were run using the "Entertainment mode".
| Performance mode | Entertainment mode | Power saving mode | Silent mode | |
|---|---|---|---|---|
| Power Limit 1 | 55 watts | 45 watts | 20 watts | 15 watts |
| Power Limit 2 | 135 watts | 90 watts | 90 watts | 90 watts |
| max. TGP | 105 watts | 90 watts | 80 watts | 80 watts |
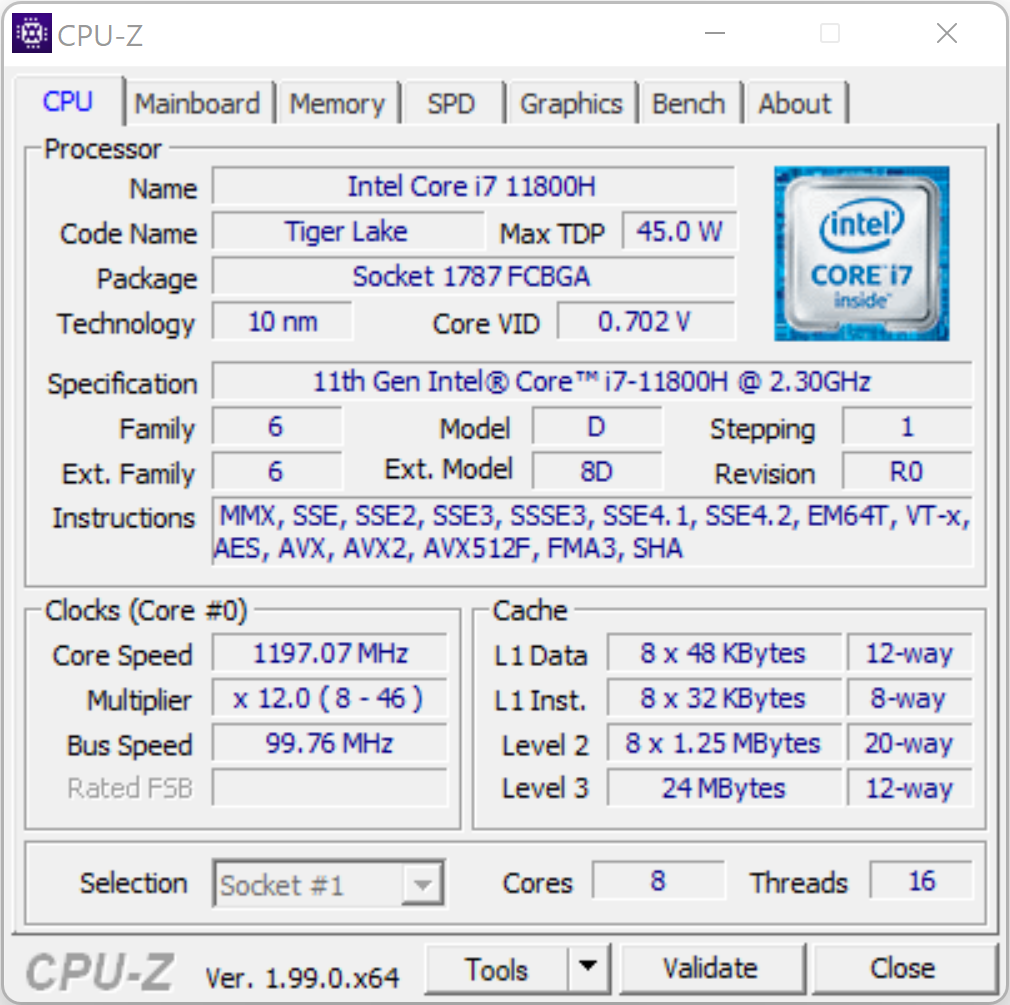
Processor
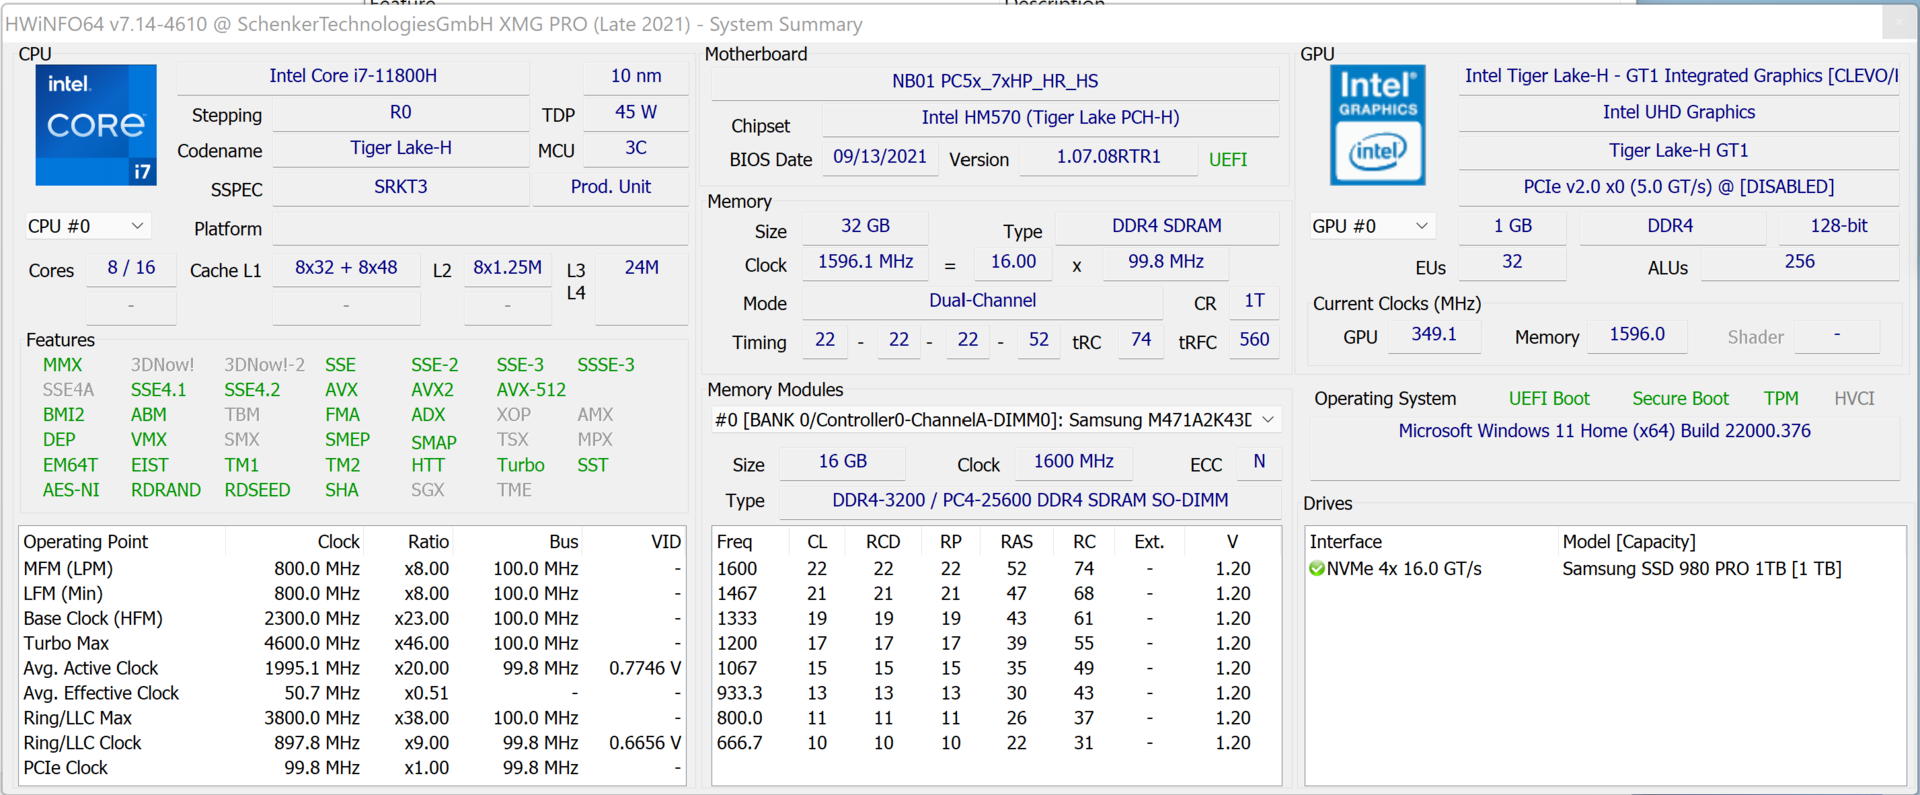
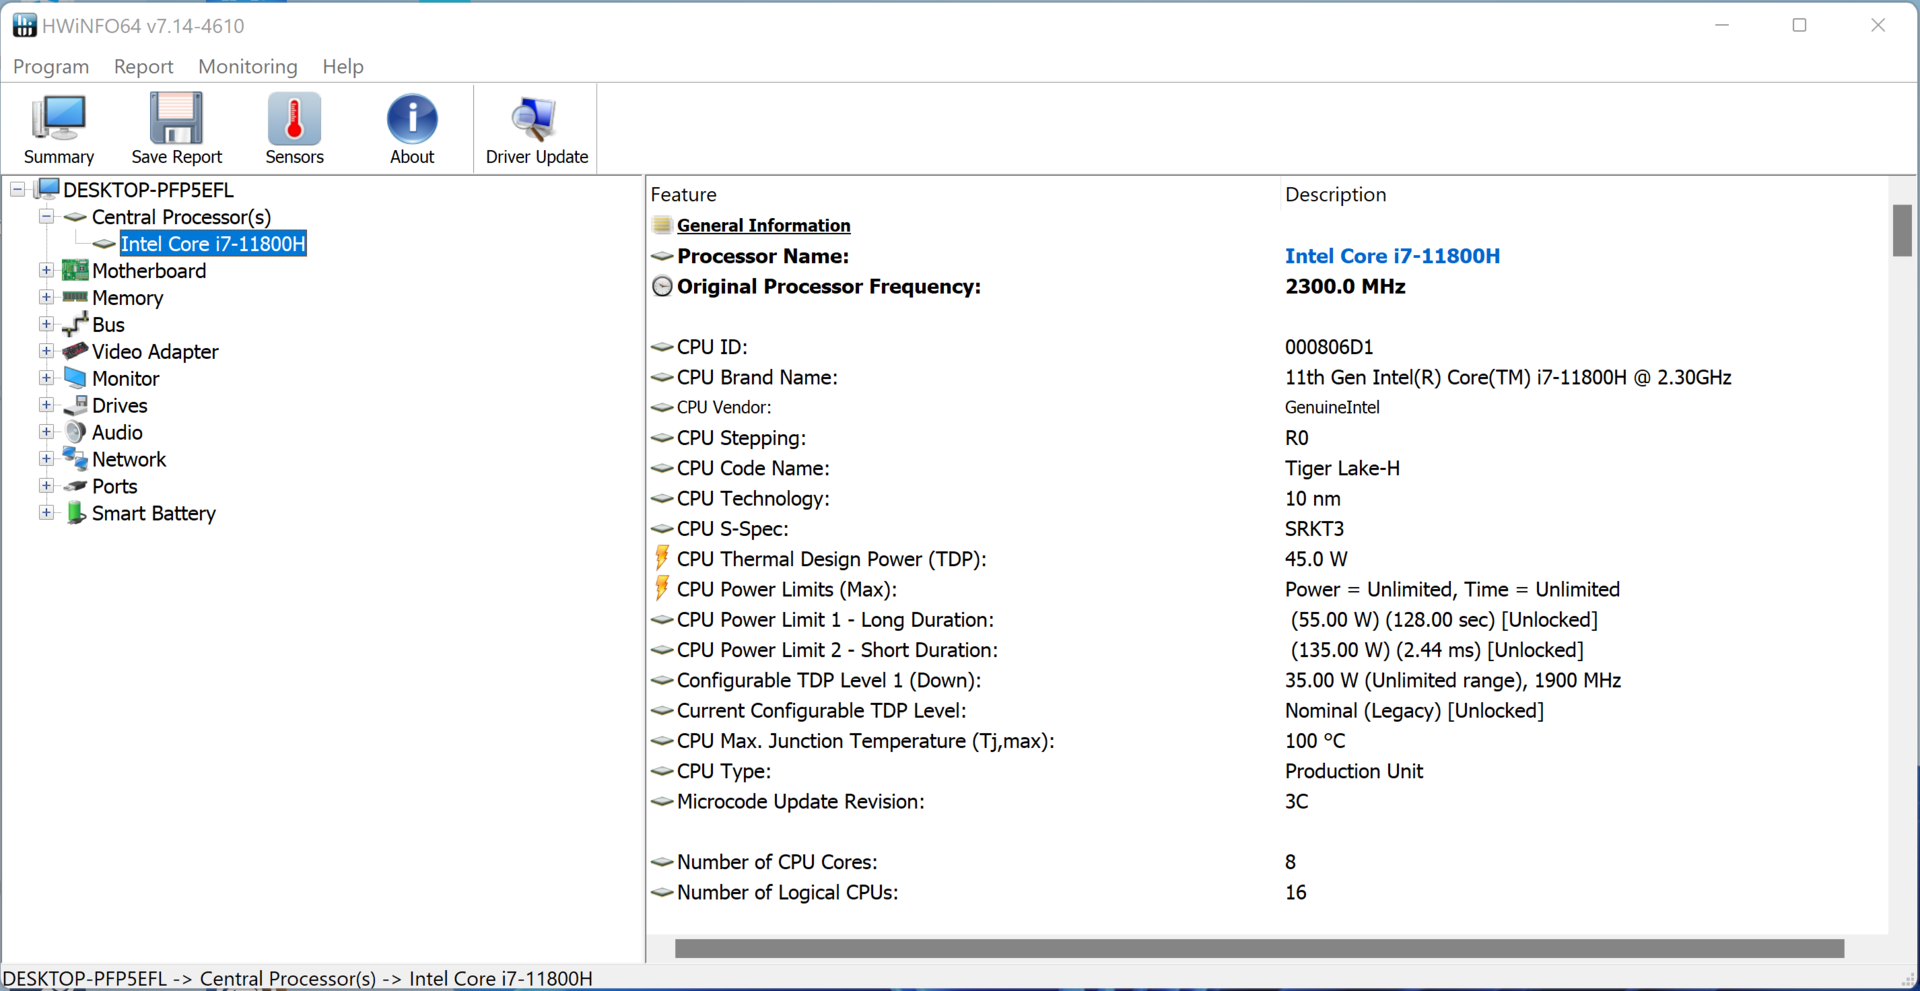
The octa-core processore Core i7-11800H (Tiger Lake) runs at a base clock of 2.3 GHz. With Turbo, it boosts to up to 4.2 GHz (eight cores) or 4.6 GHz (single core). Hyper-Threading (two threads per core) is supported.
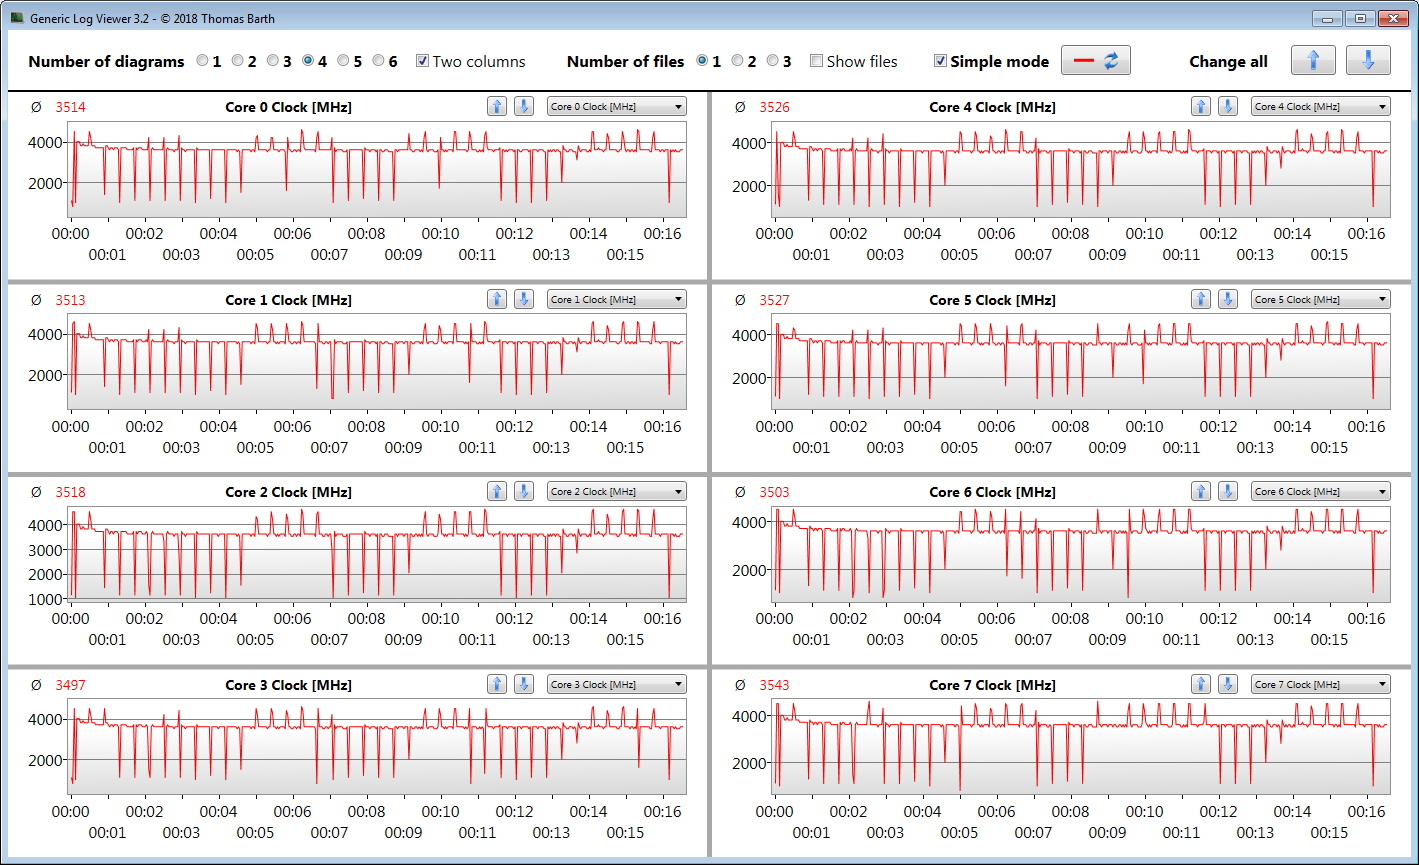
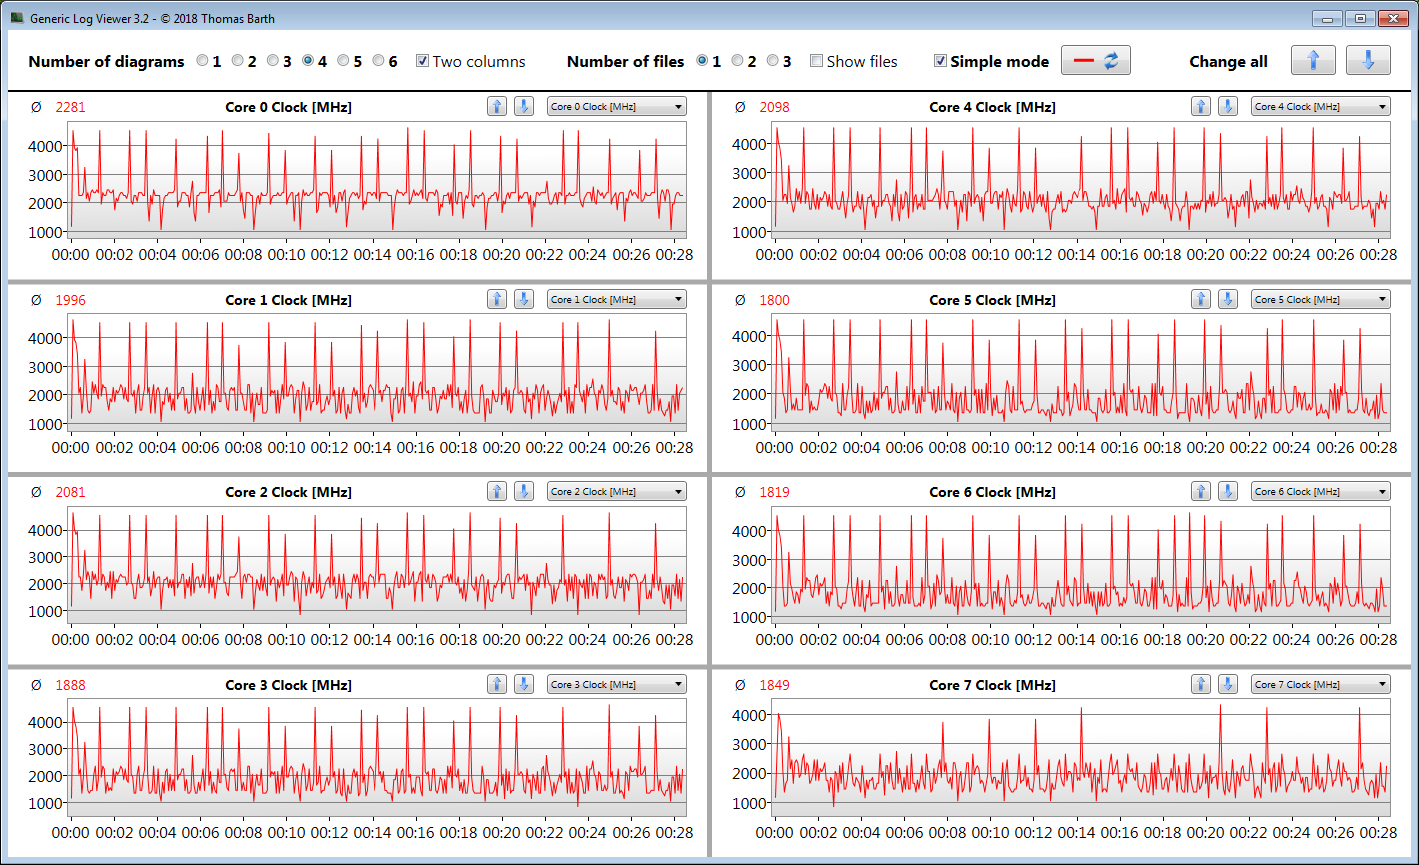
During the Cinebench R15 Multi benchmark, the CPU runs at 4 to 4.1 GHz (on mains) or 1 to 4.1 GHz (battery mode). During the single-thread benchmark, the CPU runs at 1.6 to 4.6 GHz in both cases.
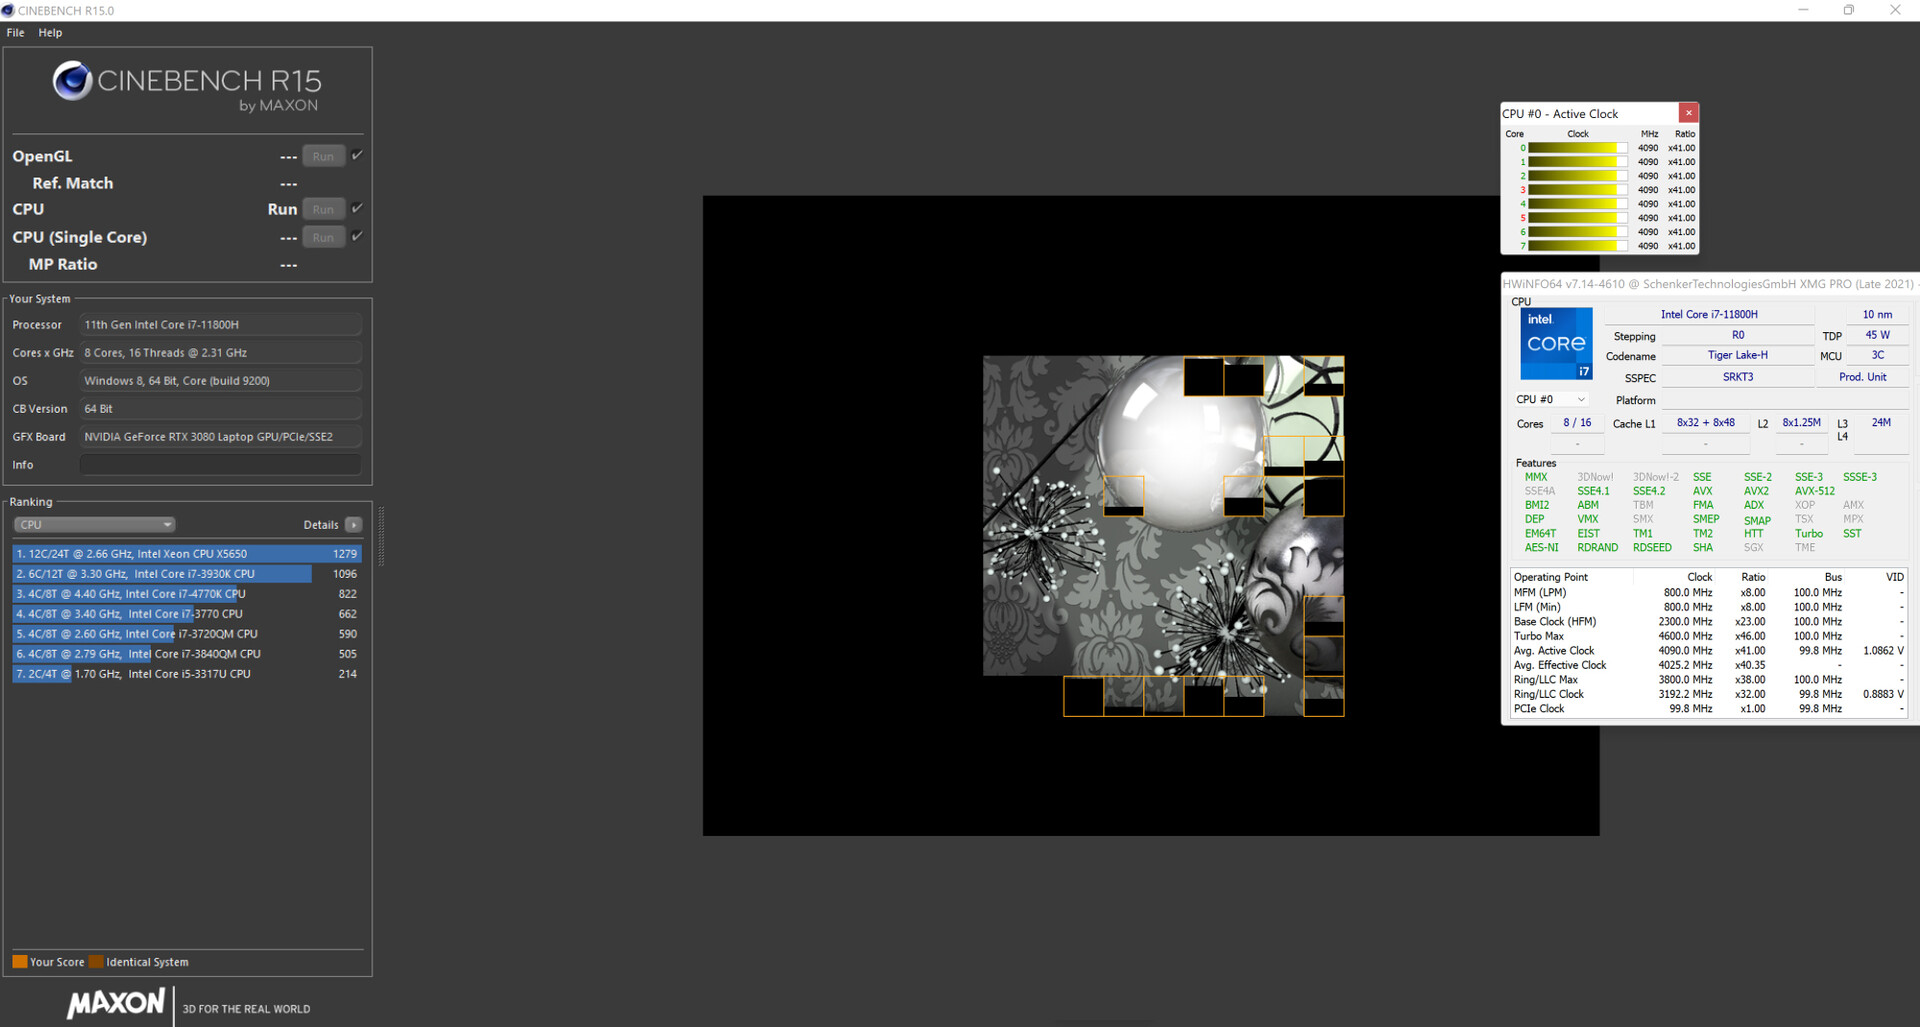
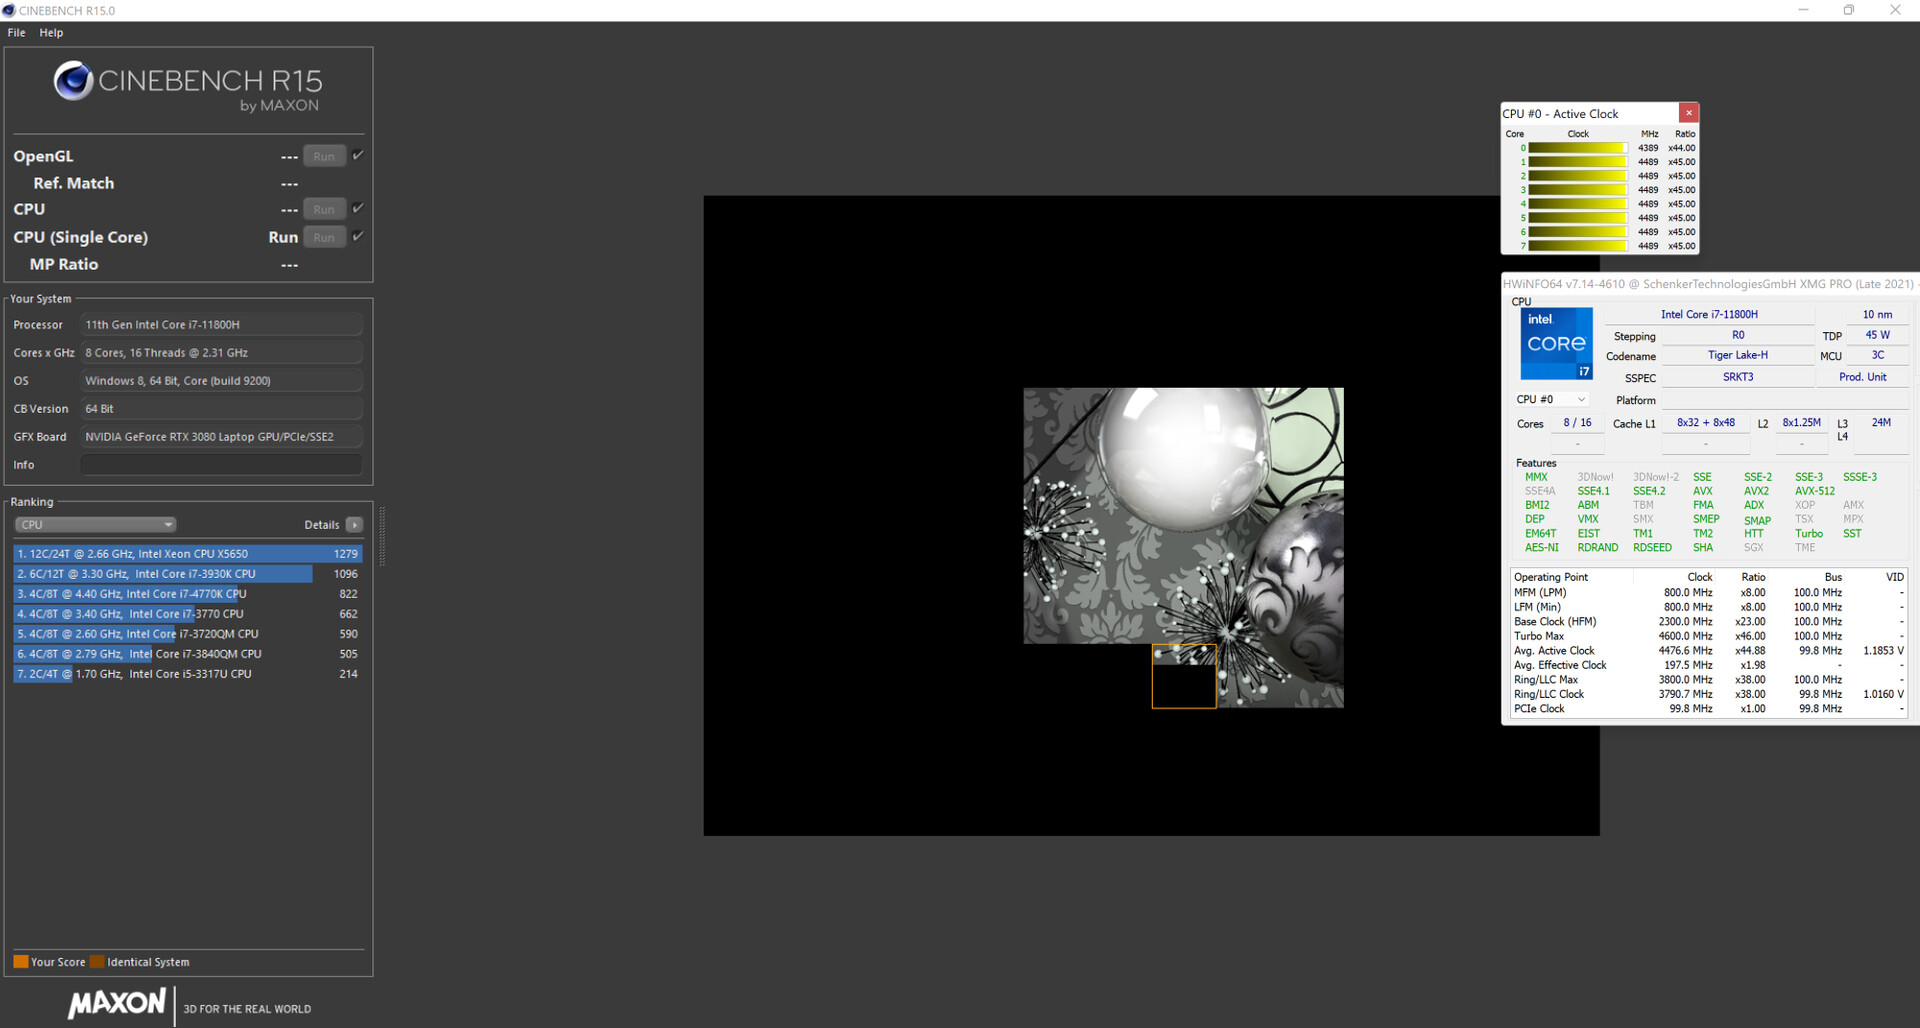
By running the Cinebench R15 multi-thread benchmark in a loop for at least 30 minutes, we determine whether the CPU Turbo Boost is constantly active. This turns out to be the case and the Turbo runs at high clock speeds.
With the silent power profile, the performance drops significantly. High Turbo Boost frequencies are then only achieved intermittently. Regardless, the reduced performance is more than sufficient for office and web-browsing workloads and even light gaming.
Cinebench R15 Multi Loop


| CPU Performance Rating - Percent | |
| Average of class Gaming | |
| MSI Delta 15 A5EFK | |
| SCHENKER XMG Pro 15 (Late 2021) | |
| Alienware x15 RTX 3070 P111F -2! | |
| Lenovo Legion S7 15ACH6 82K80030GE | |
| SCHENKER XMG Pro 15 (Late 2021) | |
| Razer Blade 15 Advanced (Mid 2021) -2! | |
| Average Intel Core i7-11800H | |
| SCHENKER XMG Pro 15 (Late 2021) | |
| SCHENKER XMG Pro 15 (Early 2021, RTX 3080) | |
| SCHENKER XMG Pro 15 (Late 2021) | |
| Cinebench R23 | |
| Multi Core | |
| Average of class Gaming (5668 - 40970, n=141, last 2 years) | |
| Alienware x15 RTX 3070 P111F | |
| Lenovo Legion S7 15ACH6 82K80030GE | |
| SCHENKER XMG Pro 15 (Late 2021) | |
| SCHENKER XMG Pro 15 (Late 2021) (Unterhaltungsmodus) | |
| Razer Blade 15 Advanced (Mid 2021) | |
| MSI Delta 15 A5EFK | |
| Average Intel Core i7-11800H (6508 - 14088, n=48) | |
| SCHENKER XMG Pro 15 (Early 2021, RTX 3080) | |
| SCHENKER XMG Pro 15 (Late 2021) (Stromsparmodus) | |
| SCHENKER XMG Pro 15 (Late 2021) (Lautlosmodus) | |
| Single Core | |
| Average of class Gaming (1136 - 2267, n=141, last 2 years) | |
| Razer Blade 15 Advanced (Mid 2021) | |
| SCHENKER XMG Pro 15 (Late 2021) | |
| Alienware x15 RTX 3070 P111F | |
| SCHENKER XMG Pro 15 (Late 2021) (Unterhaltungsmodus) | |
| SCHENKER XMG Pro 15 (Late 2021) (Stromsparmodus) | |
| SCHENKER XMG Pro 15 (Late 2021) (Lautlosmodus) | |
| Average Intel Core i7-11800H (1386 - 1522, n=45) | |
| Lenovo Legion S7 15ACH6 82K80030GE | |
| MSI Delta 15 A5EFK | |
| SCHENKER XMG Pro 15 (Early 2021, RTX 3080) | |
| Cinebench R20 | |
| CPU (Multi Core) | |
| Average of class Gaming (2179 - 16108, n=140, last 2 years) | |
| Alienware x15 RTX 3070 P111F | |
| Lenovo Legion S7 15ACH6 82K80030GE | |
| SCHENKER XMG Pro 15 (Late 2021) | |
| Razer Blade 15 Advanced (Mid 2021) | |
| SCHENKER XMG Pro 15 (Late 2021) (Unterhaltungsmodus) | |
| MSI Delta 15 A5EFK | |
| Average Intel Core i7-11800H (2498 - 5408, n=50) | |
| SCHENKER XMG Pro 15 (Early 2021, RTX 3080) | |
| SCHENKER XMG Pro 15 (Late 2021) (Stromsparmodus) | |
| SCHENKER XMG Pro 15 (Late 2021) (Lautlosmodus) | |
| CPU (Single Core) | |
| Average of class Gaming (439 - 870, n=140, last 2 years) | |
| SCHENKER XMG Pro 15 (Late 2021) | |
| Razer Blade 15 Advanced (Mid 2021) | |
| SCHENKER XMG Pro 15 (Late 2021) (Unterhaltungsmodus) | |
| SCHENKER XMG Pro 15 (Late 2021) (Stromsparmodus) | |
| Alienware x15 RTX 3070 P111F | |
| SCHENKER XMG Pro 15 (Late 2021) (Lautlosmodus) | |
| Lenovo Legion S7 15ACH6 82K80030GE | |
| MSI Delta 15 A5EFK | |
| Average Intel Core i7-11800H (520 - 586, n=47) | |
| SCHENKER XMG Pro 15 (Early 2021, RTX 3080) | |
| Cinebench R15 | |
| CPU Multi 64Bit | |
| Average of class Gaming (1537 - 6271, n=140, last 2 years) | |
| Lenovo Legion S7 15ACH6 82K80030GE | |
| Alienware x15 RTX 3070 P111F | |
| MSI Delta 15 A5EFK | |
| SCHENKER XMG Pro 15 (Late 2021) | |
| SCHENKER XMG Pro 15 (Late 2021) (Unterhaltungsmodus) | |
| Average Intel Core i7-11800H (1342 - 2173, n=50) | |
| Razer Blade 15 Advanced (Mid 2021) | |
| SCHENKER XMG Pro 15 (Early 2021, RTX 3080) | |
| SCHENKER XMG Pro 15 (Late 2021) (Stromsparmodus) | |
| SCHENKER XMG Pro 15 (Late 2021) (Lautlosmodus) | |
| CPU Single 64Bit | |
| Average of class Gaming (191.9 - 343, n=139, last 2 years) | |
| MSI Delta 15 A5EFK | |
| Lenovo Legion S7 15ACH6 82K80030GE | |
| SCHENKER XMG Pro 15 (Late 2021) (Stromsparmodus) | |
| SCHENKER XMG Pro 15 (Late 2021) (Lautlosmodus) | |
| SCHENKER XMG Pro 15 (Late 2021) (Unterhaltungsmodus) | |
| Razer Blade 15 Advanced (Mid 2021) | |
| Alienware x15 RTX 3070 P111F | |
| SCHENKER XMG Pro 15 (Late 2021) | |
| Average Intel Core i7-11800H (201 - 231, n=46) | |
| SCHENKER XMG Pro 15 (Early 2021, RTX 3080) | |
| Blender - v2.79 BMW27 CPU | |
| SCHENKER XMG Pro 15 (Late 2021) (Lautlosmodus) | |
| SCHENKER XMG Pro 15 (Late 2021) (Stromsparmodus) | |
| SCHENKER XMG Pro 15 (Early 2021, RTX 3080) | |
| Average Intel Core i7-11800H (217 - 454, n=46) | |
| Razer Blade 15 Advanced (Mid 2021) | |
| SCHENKER XMG Pro 15 (Late 2021) (Unterhaltungsmodus) | |
| SCHENKER XMG Pro 15 (Late 2021) | |
| MSI Delta 15 A5EFK | |
| Lenovo Legion S7 15ACH6 82K80030GE | |
| Alienware x15 RTX 3070 P111F | |
| Average of class Gaming (80 - 517, n=136, last 2 years) | |
| 7-Zip 18.03 | |
| 7z b 4 | |
| Average of class Gaming (23795 - 148086, n=138, last 2 years) | |
| Lenovo Legion S7 15ACH6 82K80030GE | |
| MSI Delta 15 A5EFK | |
| SCHENKER XMG Pro 15 (Late 2021) | |
| Razer Blade 15 Advanced (Mid 2021) | |
| SCHENKER XMG Pro 15 (Late 2021) (Unterhaltungsmodus) | |
| Alienware x15 RTX 3070 P111F | |
| Average Intel Core i7-11800H (33718 - 56758, n=46) | |
| SCHENKER XMG Pro 15 (Early 2021, RTX 3080) | |
| SCHENKER XMG Pro 15 (Late 2021) (Stromsparmodus) | |
| SCHENKER XMG Pro 15 (Late 2021) (Lautlosmodus) | |
| 7z b 4 -mmt1 | |
| Average of class Gaming (4199 - 7508, n=138, last 2 years) | |
| Lenovo Legion S7 15ACH6 82K80030GE | |
| MSI Delta 15 A5EFK | |
| SCHENKER XMG Pro 15 (Late 2021) (Lautlosmodus) | |
| SCHENKER XMG Pro 15 (Late 2021) | |
| SCHENKER XMG Pro 15 (Late 2021) (Stromsparmodus) | |
| Average Intel Core i7-11800H (5138 - 5732, n=46) | |
| SCHENKER XMG Pro 15 (Late 2021) (Unterhaltungsmodus) | |
| Razer Blade 15 Advanced (Mid 2021) | |
| Alienware x15 RTX 3070 P111F | |
| SCHENKER XMG Pro 15 (Early 2021, RTX 3080) | |
| Geekbench 5.5 | |
| Multi-Core | |
| Average of class Gaming (4557 - 27010, n=137, last 2 years) | |
| SCHENKER XMG Pro 15 (Late 2021) | |
| SCHENKER XMG Pro 15 (Late 2021) (Unterhaltungsmodus) | |
| SCHENKER XMG Pro 15 (Late 2021) (Stromsparmodus) | |
| MSI Delta 15 A5EFK | |
| Lenovo Legion S7 15ACH6 82K80030GE | |
| Average Intel Core i7-11800H (4655 - 9851, n=40) | |
| SCHENKER XMG Pro 15 (Early 2021, RTX 3080) | |
| SCHENKER XMG Pro 15 (Late 2021) (Lautlosmodus) | |
| Single-Core | |
| Average of class Gaming (986 - 2423, n=137, last 2 years) | |
| SCHENKER XMG Pro 15 (Late 2021) | |
| SCHENKER XMG Pro 15 (Late 2021) (Stromsparmodus) | |
| MSI Delta 15 A5EFK | |
| Average Intel Core i7-11800H (1429 - 1625, n=40) | |
| SCHENKER XMG Pro 15 (Late 2021) (Unterhaltungsmodus) | |
| Lenovo Legion S7 15ACH6 82K80030GE | |
| SCHENKER XMG Pro 15 (Late 2021) (Lautlosmodus) | |
| SCHENKER XMG Pro 15 (Early 2021, RTX 3080) | |
| HWBOT x265 Benchmark v2.2 - 4k Preset | |
| Average of class Gaming (7.7 - 44.3, n=138, last 2 years) | |
| Alienware x15 RTX 3070 P111F | |
| Lenovo Legion S7 15ACH6 82K80030GE | |
| SCHENKER XMG Pro 15 (Late 2021) | |
| MSI Delta 15 A5EFK | |
| Razer Blade 15 Advanced (Mid 2021) | |
| SCHENKER XMG Pro 15 (Late 2021) (Unterhaltungsmodus) | |
| Average Intel Core i7-11800H (7.38 - 17.4, n=46) | |
| SCHENKER XMG Pro 15 (Early 2021, RTX 3080) | |
| SCHENKER XMG Pro 15 (Late 2021) (Stromsparmodus) | |
| SCHENKER XMG Pro 15 (Late 2021) (Lautlosmodus) | |
| LibreOffice - 20 Documents To PDF | |
| Lenovo Legion S7 15ACH6 82K80030GE | |
| SCHENKER XMG Pro 15 (Early 2021, RTX 3080) | |
| SCHENKER XMG Pro 15 (Late 2021) (Unterhaltungsmodus) | |
| MSI Delta 15 A5EFK | |
| Alienware x15 RTX 3070 P111F | |
| SCHENKER XMG Pro 15 (Late 2021) | |
| Average of class Gaming (19 - 85.1, n=137, last 2 years) | |
| Average Intel Core i7-11800H (38.6 - 59.9, n=45) | |
| Razer Blade 15 Advanced (Mid 2021) | |
| SCHENKER XMG Pro 15 (Late 2021) (Lautlosmodus) | |
| SCHENKER XMG Pro 15 (Late 2021) (Stromsparmodus) | |
| R Benchmark 2.5 - Overall mean | |
| SCHENKER XMG Pro 15 (Early 2021, RTX 3080) | |
| SCHENKER XMG Pro 15 (Late 2021) (Lautlosmodus) | |
| SCHENKER XMG Pro 15 (Late 2021) (Stromsparmodus) | |
| Alienware x15 RTX 3070 P111F | |
| Average Intel Core i7-11800H (0.548 - 0.615, n=46) | |
| SCHENKER XMG Pro 15 (Late 2021) (Unterhaltungsmodus) | |
| Razer Blade 15 Advanced (Mid 2021) | |
| SCHENKER XMG Pro 15 (Late 2021) | |
| MSI Delta 15 A5EFK | |
| Lenovo Legion S7 15ACH6 82K80030GE | |
| Average of class Gaming (0.3551 - 0.759, n=139, last 2 years) | |
* ... smaller is better
AIDA64: FP32 Ray-Trace | FPU Julia | CPU SHA3 | CPU Queen | FPU SinJulia | FPU Mandel | CPU AES | CPU ZLib | FP64 Ray-Trace | CPU PhotoWorxx
| Performance Rating | |
| Average of class Gaming | |
| Lenovo Legion S7 15ACH6 82K80030GE | |
| MSI Delta 15 A5EFK | |
| SCHENKER XMG Pro 15 (Late 2021) | |
| Average Intel Core i7-11800H | |
| SCHENKER XMG Pro 15 (Early 2021, RTX 3080) | |
| SCHENKER XMG Pro 15 (Late 2021) | |
| SCHENKER XMG Pro 15 (Late 2021) | |
| Alienware x15 RTX 3070 P111F -9! | |
| Razer Blade 15 Advanced (Mid 2021) -9! | |
| AIDA64 / FP32 Ray-Trace | |
| Average of class Gaming (7192 - 85542, n=137, last 2 years) | |
| Lenovo Legion S7 15ACH6 82K80030GE (v6.33.5700) | |
| SCHENKER XMG Pro 15 (Late 2021) (v6.50.5800) | |
| MSI Delta 15 A5EFK (v6.33.5700) | |
| Average Intel Core i7-11800H (8772 - 15961, n=20) | |
| SCHENKER XMG Pro 15 (Early 2021, RTX 3080) (v6.32.5600) | |
| SCHENKER XMG Pro 15 (Late 2021) (v6.50.5800, Stromsparmodus) | |
| SCHENKER XMG Pro 15 (Late 2021) (v6.50.5800, Lautlosmodus) | |
| AIDA64 / FPU Julia | |
| Average of class Gaming (35040 - 252486, n=137, last 2 years) | |
| Lenovo Legion S7 15ACH6 82K80030GE (v6.33.5700) | |
| MSI Delta 15 A5EFK (v6.33.5700) | |
| SCHENKER XMG Pro 15 (Late 2021) (v6.50.5800) | |
| SCHENKER XMG Pro 15 (Early 2021, RTX 3080) (v6.32.5600) | |
| Average Intel Core i7-11800H (39404 - 65636, n=20) | |
| SCHENKER XMG Pro 15 (Late 2021) (v6.50.5800, Stromsparmodus) | |
| SCHENKER XMG Pro 15 (Late 2021) (v6.50.5800, Lautlosmodus) | |
| AIDA64 / CPU SHA3 | |
| Average of class Gaming (1728 - 10389, n=137, last 2 years) | |
| SCHENKER XMG Pro 15 (Late 2021) (v6.50.5800) | |
| Average Intel Core i7-11800H (2599 - 4439, n=20) | |
| Lenovo Legion S7 15ACH6 82K80030GE (v6.33.5700) | |
| SCHENKER XMG Pro 15 (Early 2021, RTX 3080) (v6.32.5600) | |
| MSI Delta 15 A5EFK (v6.33.5700) | |
| SCHENKER XMG Pro 15 (Late 2021) (v6.50.5800, Stromsparmodus) | |
| SCHENKER XMG Pro 15 (Late 2021) (v6.50.5800, Lautlosmodus) | |
| AIDA64 / CPU Queen | |
| Average of class Gaming (50699 - 200651, n=137, last 2 years) | |
| MSI Delta 15 A5EFK (v6.33.5700) | |
| Lenovo Legion S7 15ACH6 82K80030GE (v6.33.5700) | |
| SCHENKER XMG Pro 15 (Late 2021) (v6.50.5800) | |
| SCHENKER XMG Pro 15 (Late 2021) (v6.50.5800, Lautlosmodus) | |
| SCHENKER XMG Pro 15 (Late 2021) (v6.50.5800, Stromsparmodus) | |
| Average Intel Core i7-11800H (85233 - 91941, n=20) | |
| SCHENKER XMG Pro 15 (Early 2021, RTX 3080) (v6.32.5600) | |
| AIDA64 / FPU SinJulia | |
| Average of class Gaming (5020 - 33636, n=137, last 2 years) | |
| MSI Delta 15 A5EFK (v6.33.5700) | |
| Lenovo Legion S7 15ACH6 82K80030GE (v6.33.5700) | |
| SCHENKER XMG Pro 15 (Late 2021) (v6.50.5800) | |
| SCHENKER XMG Pro 15 (Early 2021, RTX 3080) (v6.32.5600) | |
| Average Intel Core i7-11800H (6420 - 9792, n=20) | |
| SCHENKER XMG Pro 15 (Late 2021) (v6.50.5800, Stromsparmodus) | |
| SCHENKER XMG Pro 15 (Late 2021) (v6.50.5800, Lautlosmodus) | |
| AIDA64 / FPU Mandel | |
| Average of class Gaming (17585 - 134044, n=137, last 2 years) | |
| Lenovo Legion S7 15ACH6 82K80030GE (v6.33.5700) | |
| MSI Delta 15 A5EFK (v6.33.5700) | |
| SCHENKER XMG Pro 15 (Late 2021) (v6.50.5800) | |
| Average Intel Core i7-11800H (23365 - 39464, n=20) | |
| SCHENKER XMG Pro 15 (Early 2021, RTX 3080) (v6.32.5600) | |
| SCHENKER XMG Pro 15 (Late 2021) (v6.50.5800, Stromsparmodus) | |
| SCHENKER XMG Pro 15 (Late 2021) (v6.50.5800, Lautlosmodus) | |
| AIDA64 / CPU AES | |
| SCHENKER XMG Pro 15 (Late 2021) (v6.50.5800) | |
| Lenovo Legion S7 15ACH6 82K80030GE (v6.33.5700) | |
| MSI Delta 15 A5EFK (v6.33.5700) | |
| Average Intel Core i7-11800H (74617 - 149388, n=20) | |
| Average of class Gaming (19065 - 247074, n=137, last 2 years) | |
| SCHENKER XMG Pro 15 (Late 2021) (v6.50.5800, Stromsparmodus) | |
| SCHENKER XMG Pro 15 (Late 2021) (v6.50.5800, Lautlosmodus) | |
| SCHENKER XMG Pro 15 (Early 2021, RTX 3080) (v6.32.5600) | |
| AIDA64 / CPU ZLib | |
| Average of class Gaming (373 - 2531, n=137, last 2 years) | |
| Lenovo Legion S7 15ACH6 82K80030GE (v6.33.5700) | |
| MSI Delta 15 A5EFK (v6.33.5700) | |
| SCHENKER XMG Pro 15 (Late 2021) (v6.50.5800) | |
| SCHENKER XMG Pro 15 (Early 2021, RTX 3080) (v6.32.5600) | |
| SCHENKER XMG Pro 15 (Late 2021) (v6.50.5800, Stromsparmodus) | |
| SCHENKER XMG Pro 15 (Late 2021) (v6.50.5800, Lautlosmodus) | |
| Average Intel Core i7-11800H (461 - 830, n=43) | |
| Razer Blade 15 Advanced (Mid 2021) (v6.33.5700) | |
| Alienware x15 RTX 3070 P111F (v6.33.5700) | |
| AIDA64 / FP64 Ray-Trace | |
| Average of class Gaming (3856 - 45446, n=137, last 2 years) | |
| SCHENKER XMG Pro 15 (Late 2021) (v6.50.5800) | |
| Lenovo Legion S7 15ACH6 82K80030GE (v6.33.5700) | |
| MSI Delta 15 A5EFK (v6.33.5700) | |
| Average Intel Core i7-11800H (4545 - 8717, n=21) | |
| SCHENKER XMG Pro 15 (Early 2021, RTX 3080) (v6.32.5600) | |
| SCHENKER XMG Pro 15 (Late 2021) (v6.50.5800, Stromsparmodus) | |
| SCHENKER XMG Pro 15 (Late 2021) (v6.50.5800, Lautlosmodus) | |
| AIDA64 / CPU PhotoWorxx | |
| Average of class Gaming (10805 - 62916, n=137, last 2 years) | |
| SCHENKER XMG Pro 15 (Late 2021) (v6.50.5800) | |
| SCHENKER XMG Pro 15 (Late 2021) (v6.50.5800, Stromsparmodus) | |
| SCHENKER XMG Pro 15 (Late 2021) (v6.50.5800, Lautlosmodus) | |
| Average Intel Core i7-11800H (11898 - 26757, n=21) | |
| MSI Delta 15 A5EFK (v6.33.5700) | |
| SCHENKER XMG Pro 15 (Early 2021, RTX 3080) (v6.32.5600) | |
| Lenovo Legion S7 15ACH6 82K80030GE (v6.33.5700) | |
System Performance
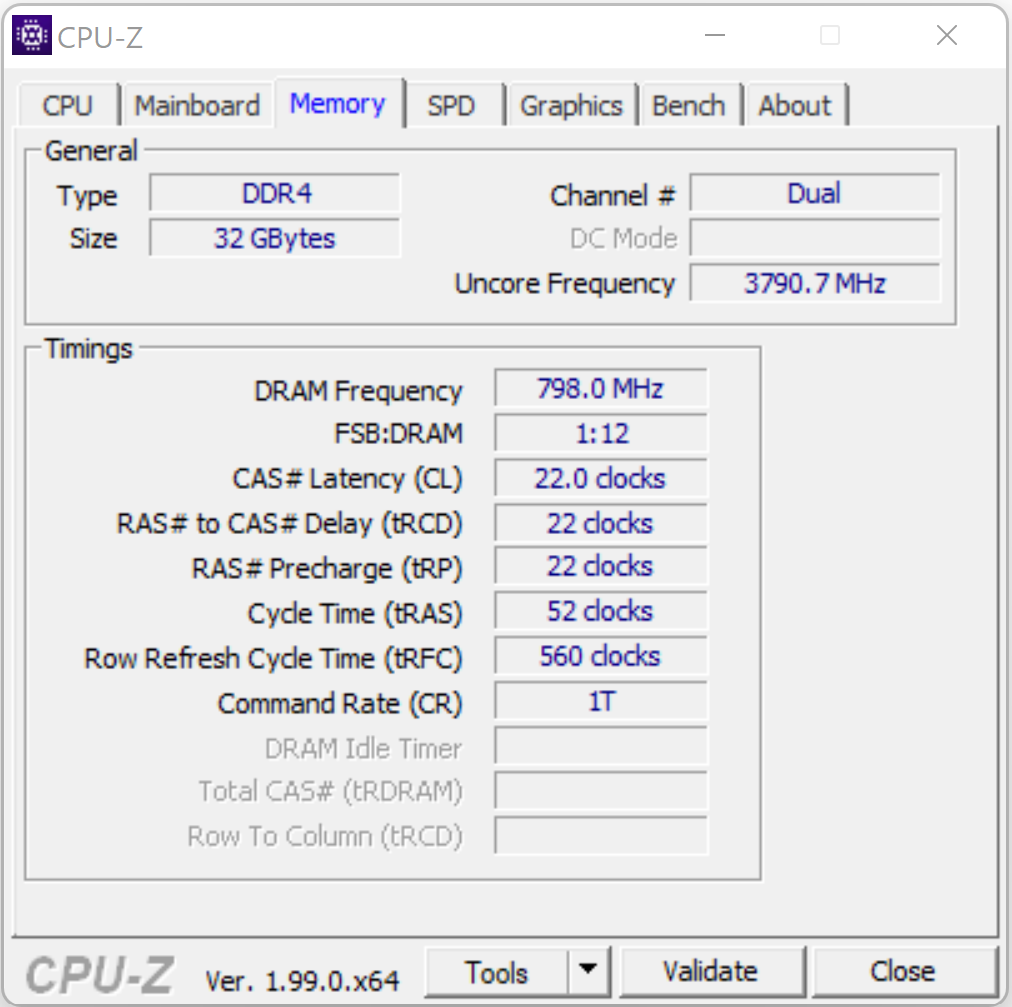
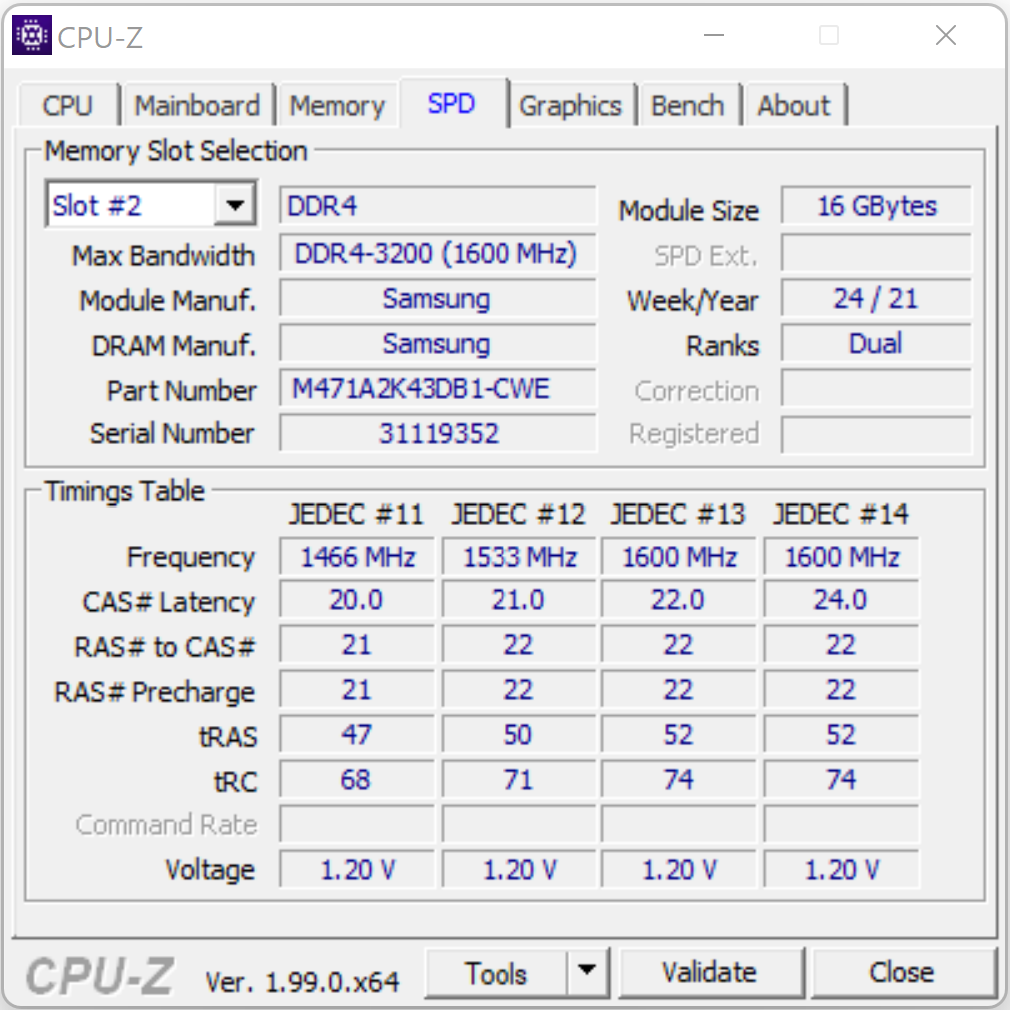
The system feels smooth and responsive. The components are more than sufficient for demanding workloads such as gaming as well as video and photo editing. The transfer rates of the RAM match our expectations for DDR4-3200 RAM. Finally, the PCMark results are excellent.
| PCMark 8 Home Score Accelerated v2 | 3941 points | |
| PCMark 8 Creative Score Accelerated v2 | 6411 points | |
| PCMark 8 Work Score Accelerated v2 | 4756 points | |
| PCMark 10 Score | 6673 points | |
Help | ||
| PCMark 10 / Score | |
| Average of class Gaming (5776 - 9852, n=120, last 2 years) | |
| Razer Blade 15 Advanced (Mid 2021) | |
| MSI Delta 15 A5EFK | |
| Alienware x15 RTX 3070 P111F | |
| Average Intel Core i7-11800H, NVIDIA GeForce RTX 3080 Laptop GPU (6673 - 7470, n=11) | |
| SCHENKER XMG Pro 15 (Late 2021) | |
| Lenovo Legion S7 15ACH6 82K80030GE | |
| SCHENKER XMG Pro 15 (Early 2021, RTX 3080) | |
| PCMark 10 / Essentials | |
| Razer Blade 15 Advanced (Mid 2021) | |
| Average of class Gaming (9057 - 12600, n=121, last 2 years) | |
| MSI Delta 15 A5EFK | |
| Alienware x15 RTX 3070 P111F | |
| Average Intel Core i7-11800H, NVIDIA GeForce RTX 3080 Laptop GPU (9862 - 11064, n=11) | |
| SCHENKER XMG Pro 15 (Late 2021) | |
| Lenovo Legion S7 15ACH6 82K80030GE | |
| SCHENKER XMG Pro 15 (Early 2021, RTX 3080) | |
| PCMark 10 / Productivity | |
| Average of class Gaming (6662 - 14612, n=120, last 2 years) | |
| MSI Delta 15 A5EFK | |
| Average Intel Core i7-11800H, NVIDIA GeForce RTX 3080 Laptop GPU (8278 - 9803, n=11) | |
| Alienware x15 RTX 3070 P111F | |
| Razer Blade 15 Advanced (Mid 2021) | |
| Lenovo Legion S7 15ACH6 82K80030GE | |
| SCHENKER XMG Pro 15 (Early 2021, RTX 3080) | |
| SCHENKER XMG Pro 15 (Late 2021) | |
| PCMark 10 / Digital Content Creation | |
| Average of class Gaming (7440 - 19351, n=120, last 2 years) | |
| Alienware x15 RTX 3070 P111F | |
| Razer Blade 15 Advanced (Mid 2021) | |
| MSI Delta 15 A5EFK | |
| Average Intel Core i7-11800H, NVIDIA GeForce RTX 3080 Laptop GPU (9881 - 11323, n=11) | |
| SCHENKER XMG Pro 15 (Late 2021) | |
| SCHENKER XMG Pro 15 (Early 2021, RTX 3080) | |
| Lenovo Legion S7 15ACH6 82K80030GE | |
| AIDA64 / Memory Copy | |
| Average of class Gaming (21750 - 97515, n=137, last 2 years) | |
| SCHENKER XMG Pro 15 (Late 2021) | |
| Average Intel Core i7-11800H (24508 - 48144, n=21) | |
| MSI Delta 15 A5EFK | |
| Lenovo Legion S7 15ACH6 82K80030GE | |
| SCHENKER XMG Pro 15 (Early 2021, RTX 3080) | |
| AIDA64 / Memory Read | |
| Average of class Gaming (22956 - 104349, n=137, last 2 years) | |
| SCHENKER XMG Pro 15 (Late 2021) | |
| MSI Delta 15 A5EFK | |
| Lenovo Legion S7 15ACH6 82K80030GE | |
| Average Intel Core i7-11800H (25882 - 50365, n=20) | |
| SCHENKER XMG Pro 15 (Early 2021, RTX 3080) | |
| AIDA64 / Memory Write | |
| Average of class Gaming (22297 - 133486, n=137, last 2 years) | |
| SCHENKER XMG Pro 15 (Late 2021) | |
| MSI Delta 15 A5EFK | |
| Average Intel Core i7-11800H (22240 - 46214, n=20) | |
| Lenovo Legion S7 15ACH6 82K80030GE | |
| SCHENKER XMG Pro 15 (Early 2021, RTX 3080) | |
| AIDA64 / Memory Latency | |
| Average of class Gaming (59.5 - 259, n=137, last 2 years) | |
| SCHENKER XMG Pro 15 (Late 2021) | |
| Lenovo Legion S7 15ACH6 82K80030GE | |
| MSI Delta 15 A5EFK | |
| SCHENKER XMG Pro 15 (Early 2021, RTX 3080) | |
| Average Intel Core i7-11800H (71.9 - 104.1, n=44) | |
| Razer Blade 15 Advanced (Mid 2021) | |
| Alienware x15 RTX 3070 P111F | |
* ... smaller is better
DPC Latencies
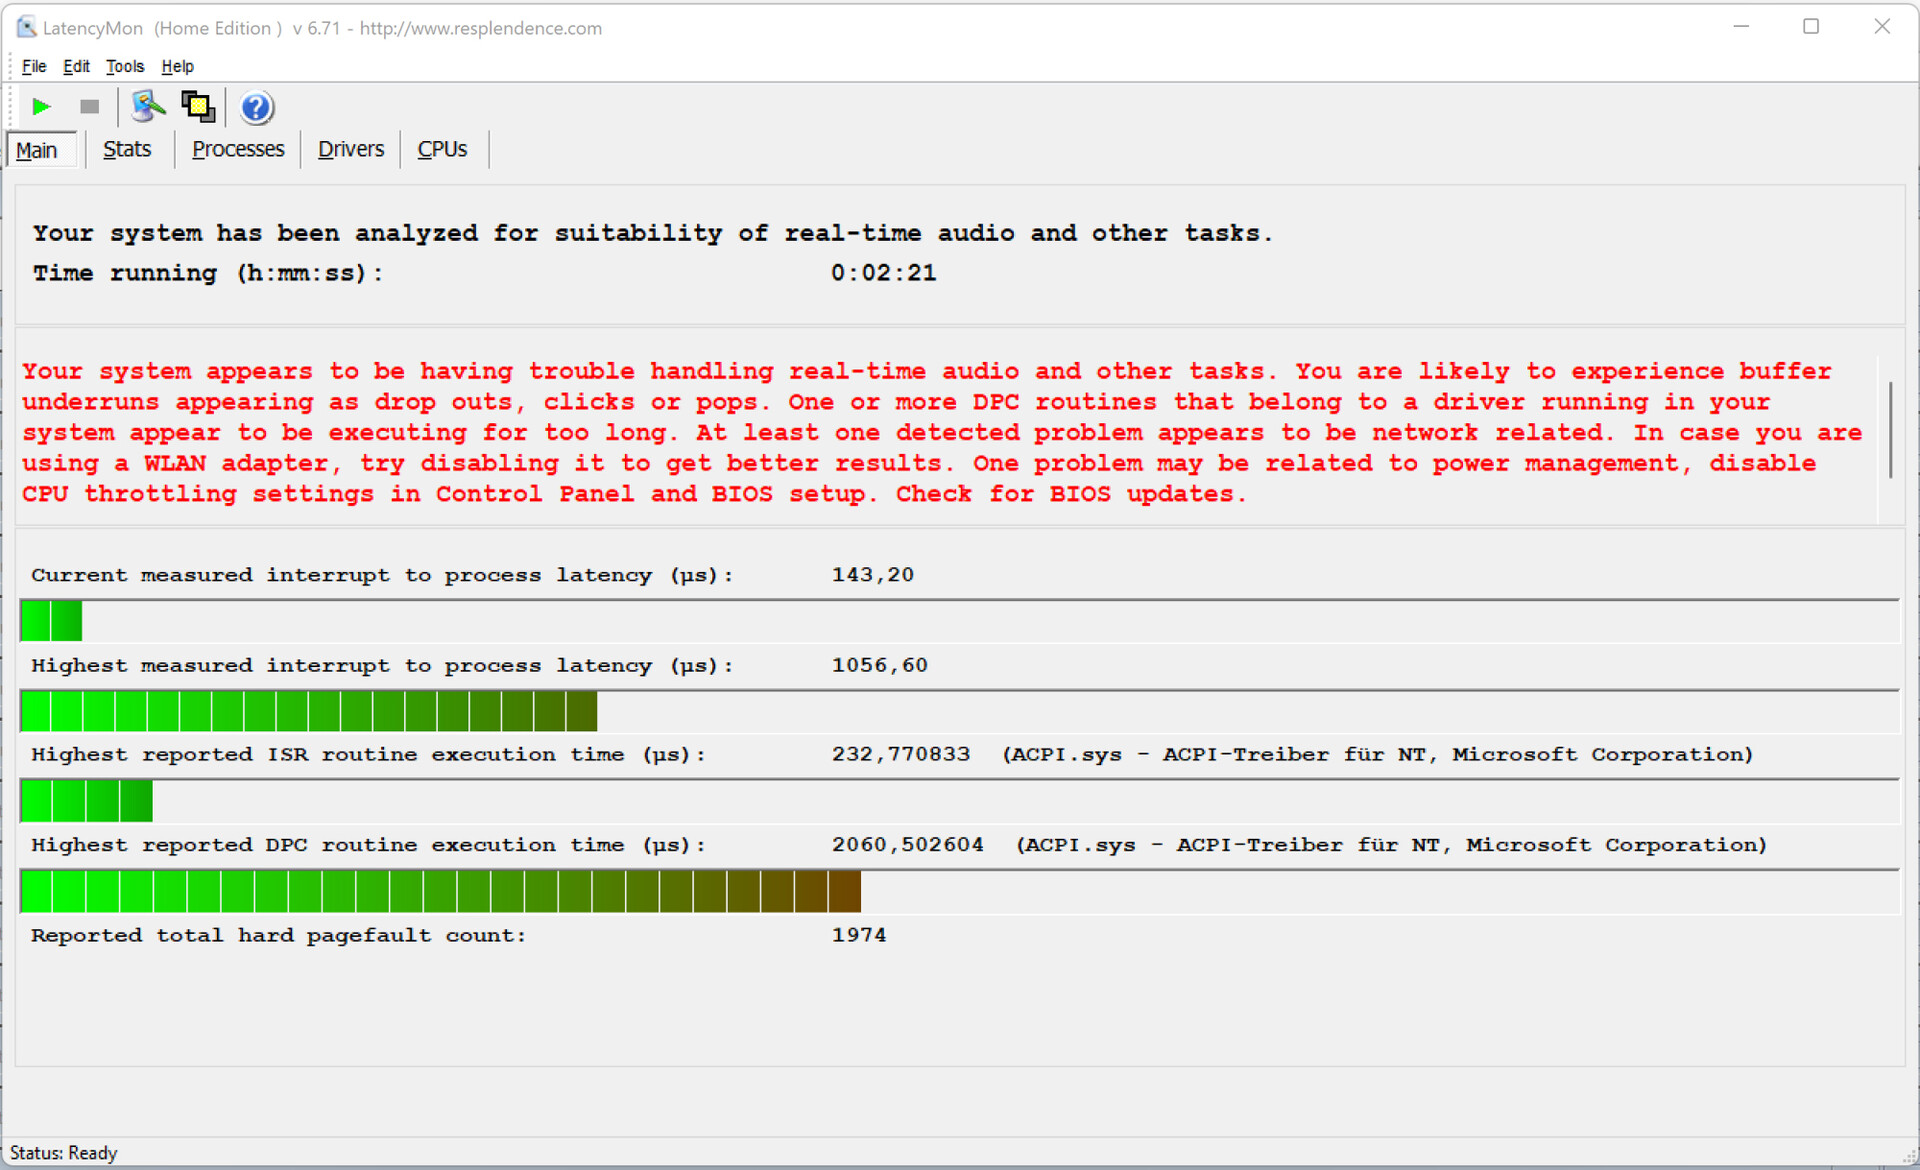
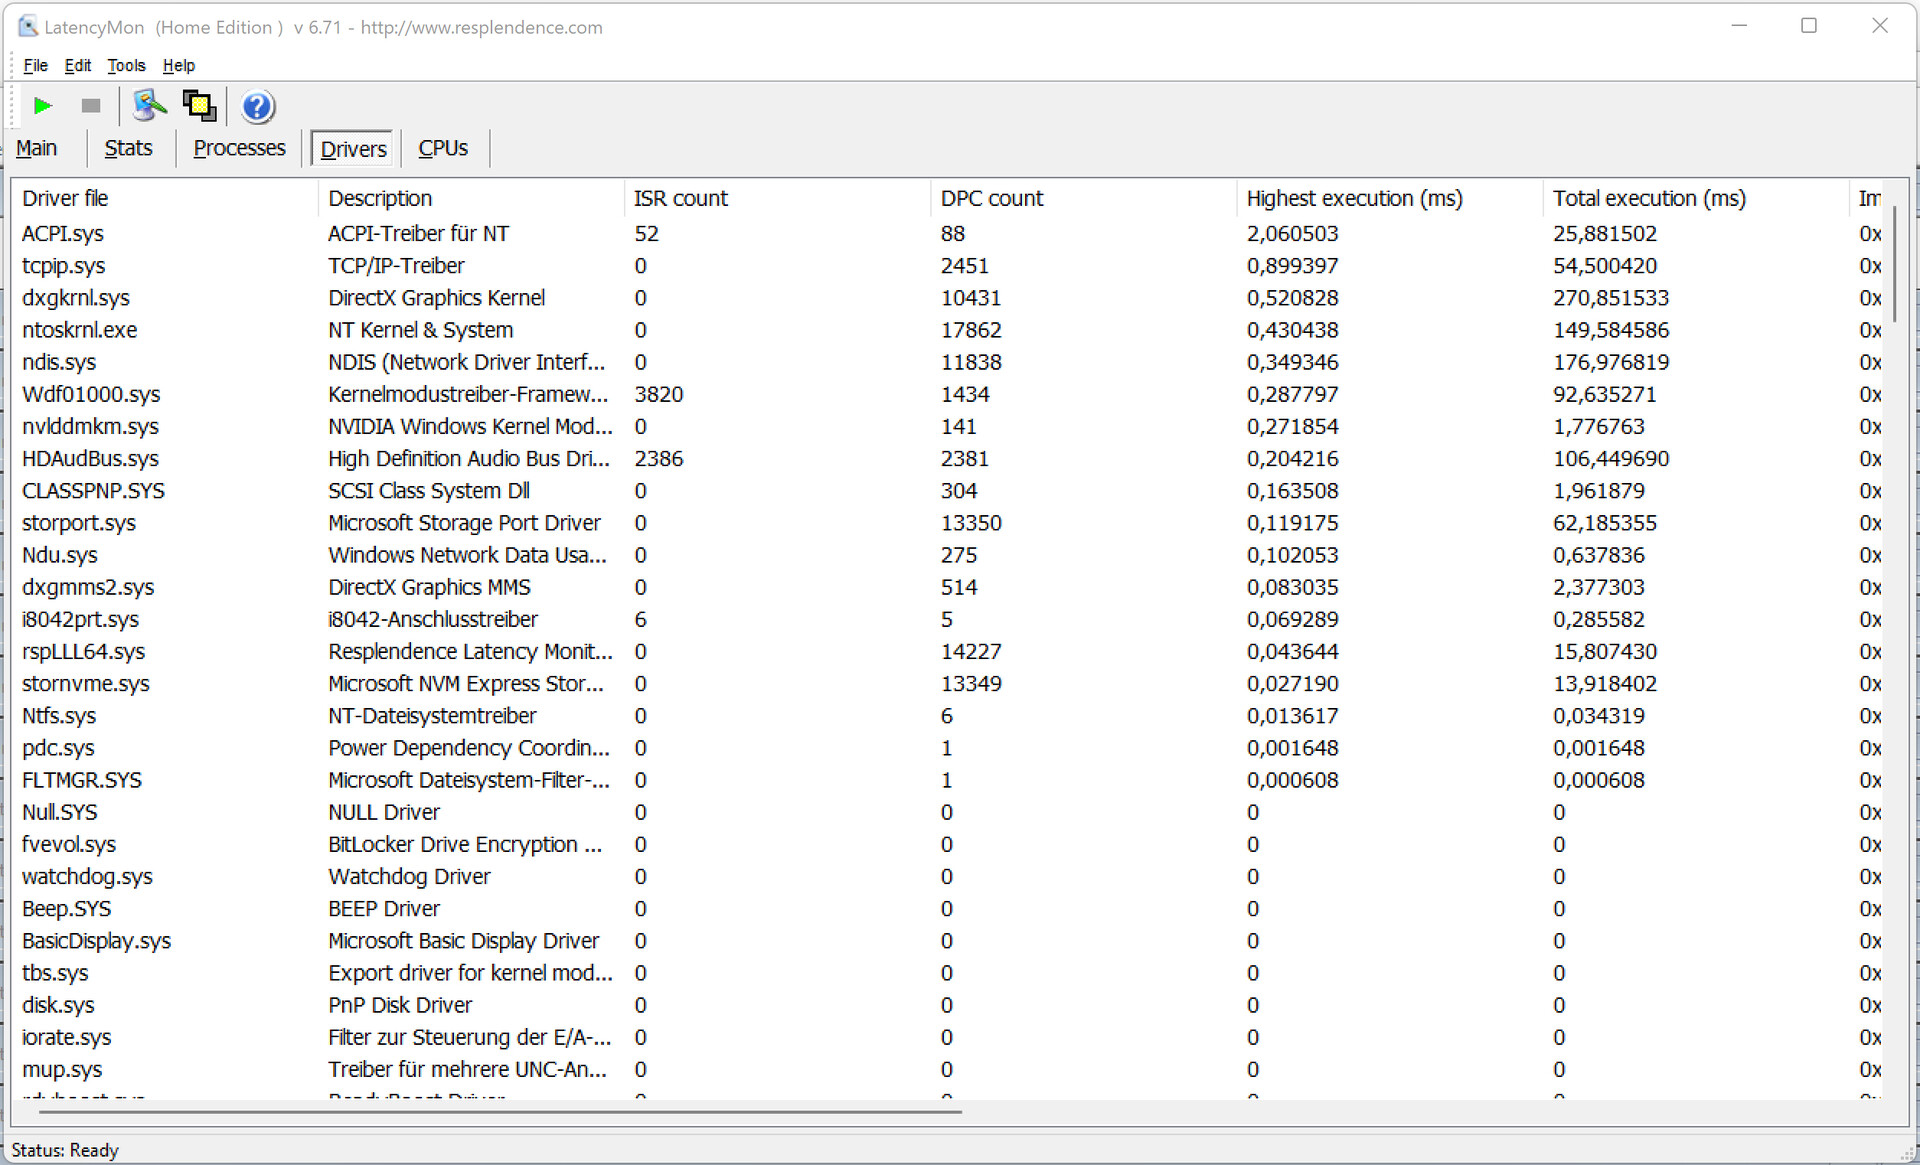
Our standardized LatencyMon test (web browsing, playing 4K video, Prime95 high load) revealed potentially problematic DPC latencies. The system does not appear to be suitable for real-time video and audio editing. Future software updates may improve upon or exacerbate the issue.
| DPC Latencies / LatencyMon - interrupt to process latency (max), Web, Youtube, Prime95 | |
| Razer Blade 15 Advanced (Mid 2021) | |
| MSI Delta 15 A5EFK | |
| Alienware x15 RTX 3070 P111F | |
| SCHENKER XMG Pro 15 (Late 2021) | |
| SCHENKER XMG Pro 15 (Early 2021, RTX 3080) | |
| Lenovo Legion S7 15ACH6 82K80030GE | |
* ... smaller is better
Storage Solution
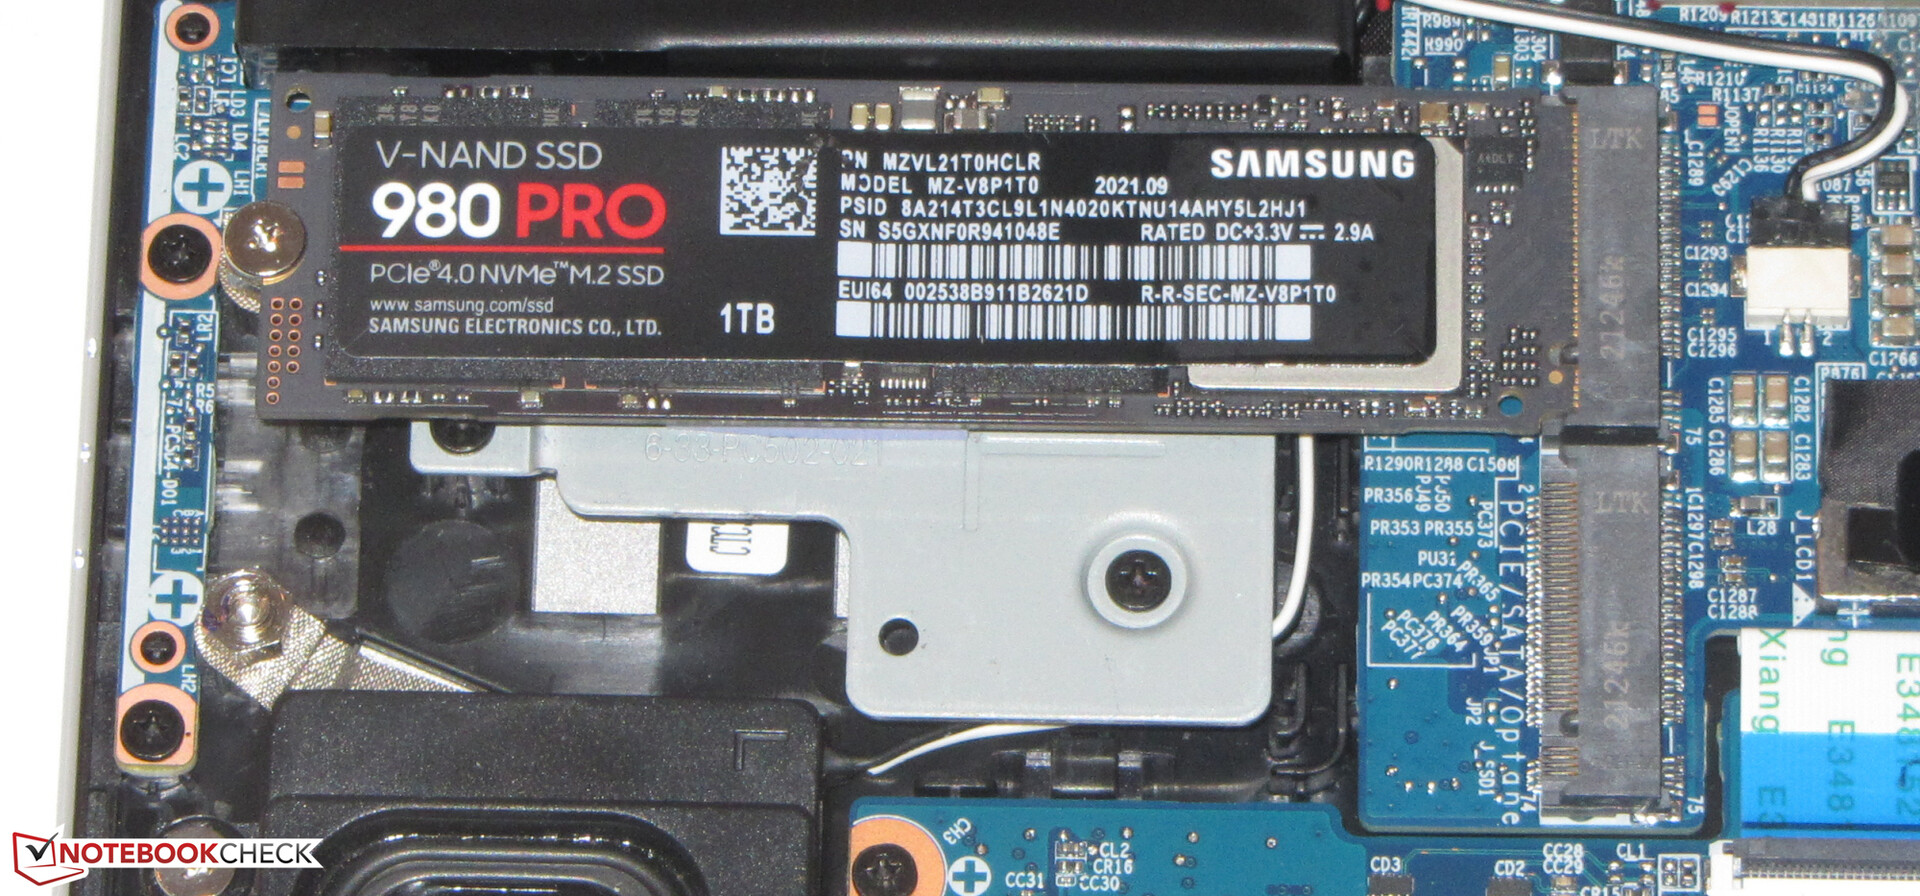
A Samsung 1 TB SSD (NVMe, M.2-2280) serves as the system drive and achieves excellent transfer rates thanks to its PCIe 4 interface. The laptop supports up to two M.2-2280 SSDs (1x PCIe 4.0, 1x PCIe 3.0/SATA) in total. RAID 0/1 is also supported.

* ... smaller is better
Disk Throttling: DiskSpd Read Loop, Queue Depth 8
GPU Performance
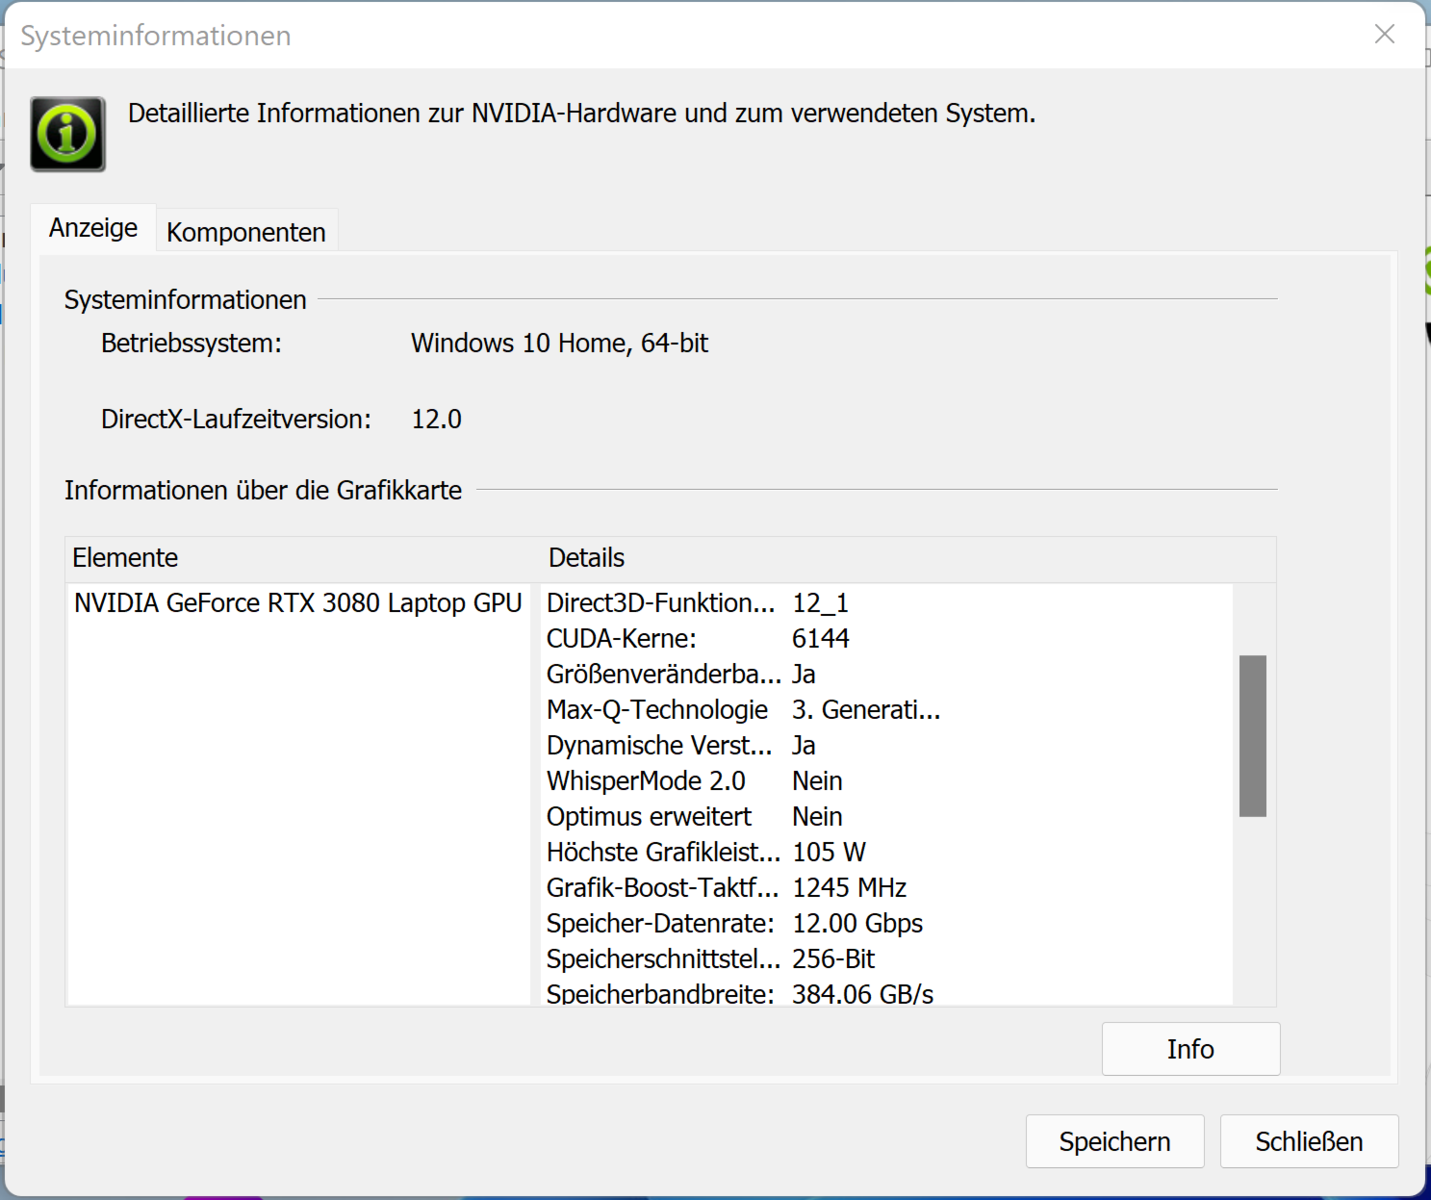
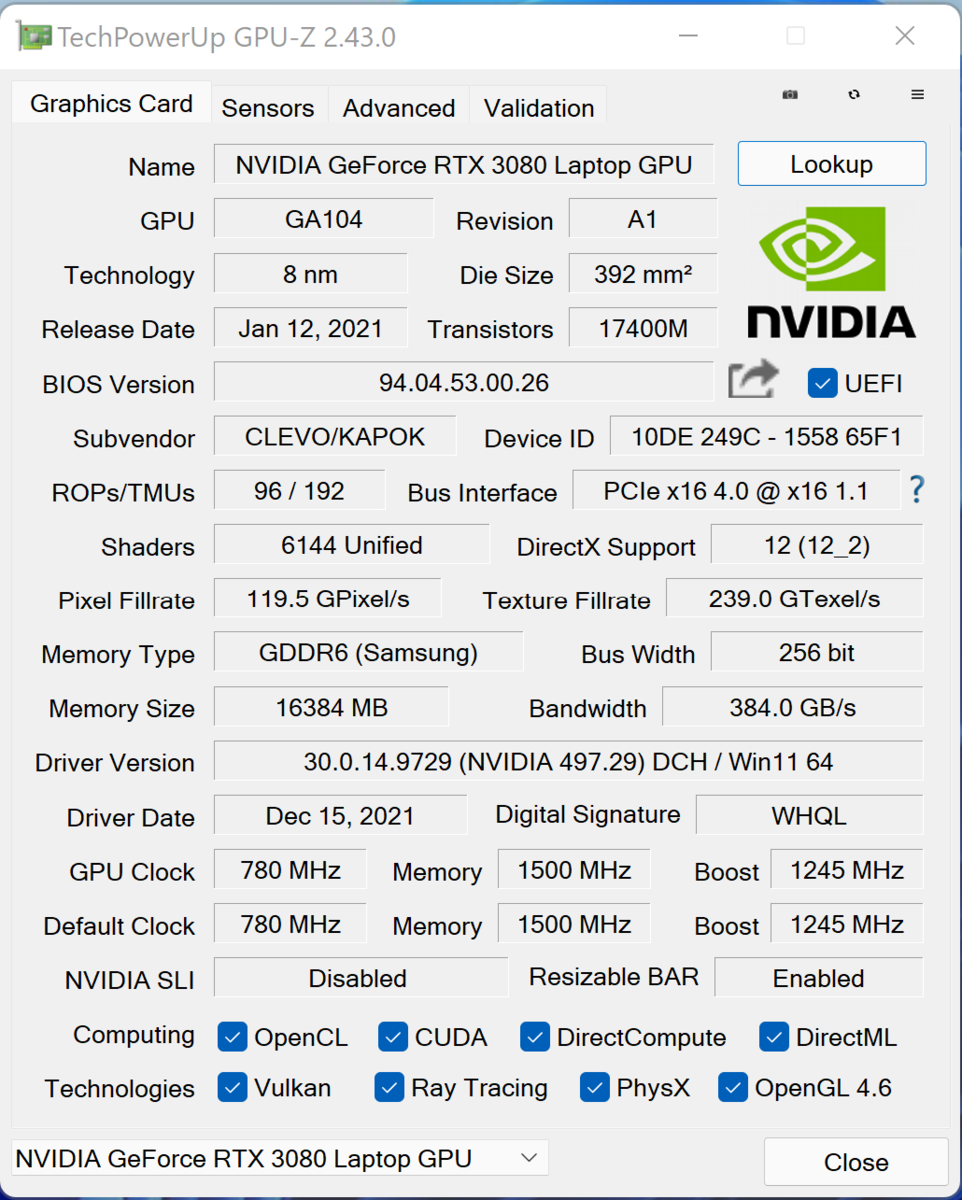
The actual performance of an RTX 3000 GPU depends on numerous factors: The cooling solution, memory configuration and maximum TGP, which the manufacturer can set to a value within a range that is predefined by Nvidia. Schenker set the maximum TGP of the installed, mobile GeForce RTX 3080 GPU (overview of all RTX 3080 laptops and their TGPs) to 105 watts (90 watts + 15 watts Dynamic Boost).
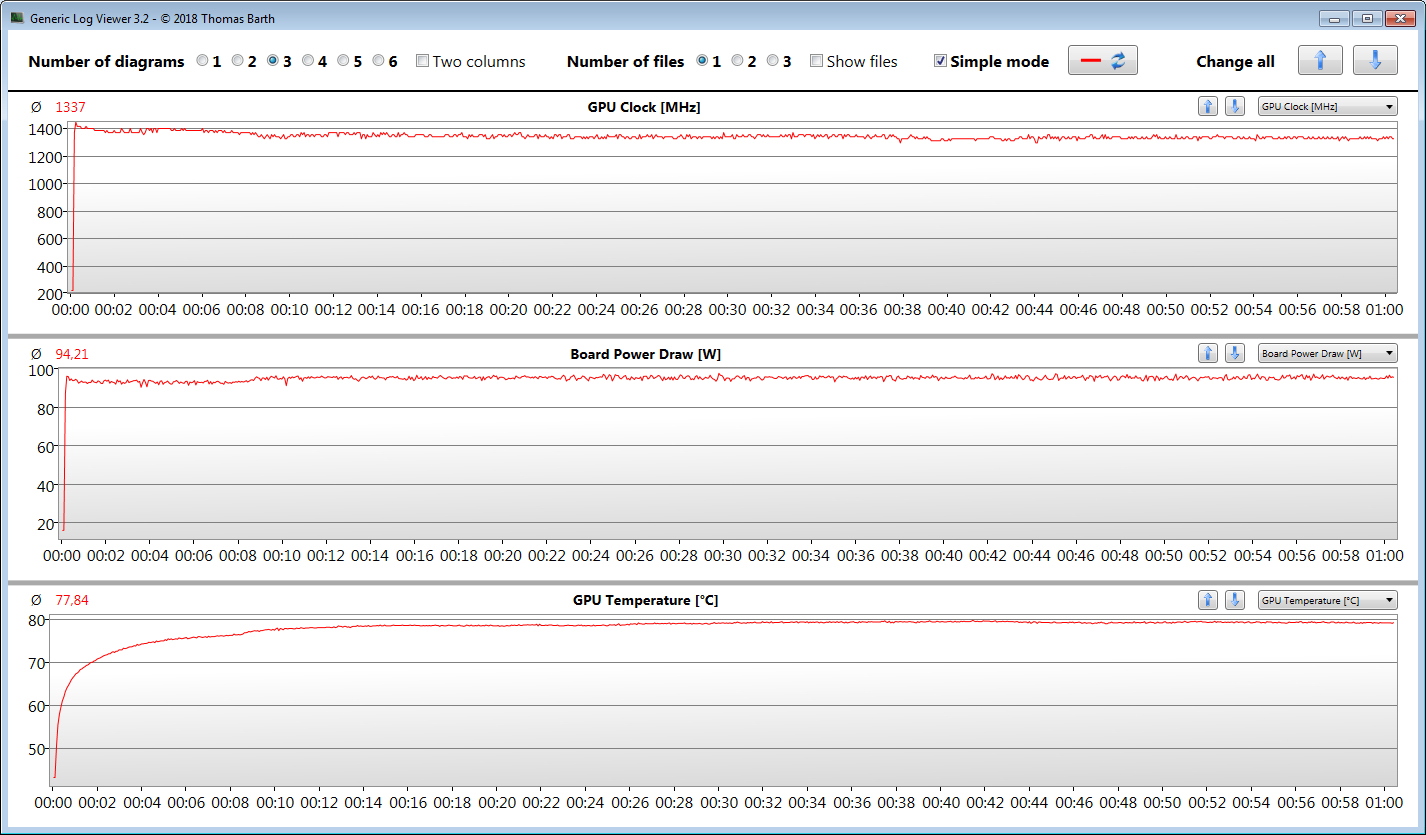
The 3DMark results are lower compared to our previous average for the RTX 3080. Here, the relatively low TGP becomes apparent. The scores of Razer Blade 15 Advanced, which is our test device's direct competitor, are comparable. Our Witcher 3 benchmark shows that the maximum TGP can be maintained over a prolonged period of time.
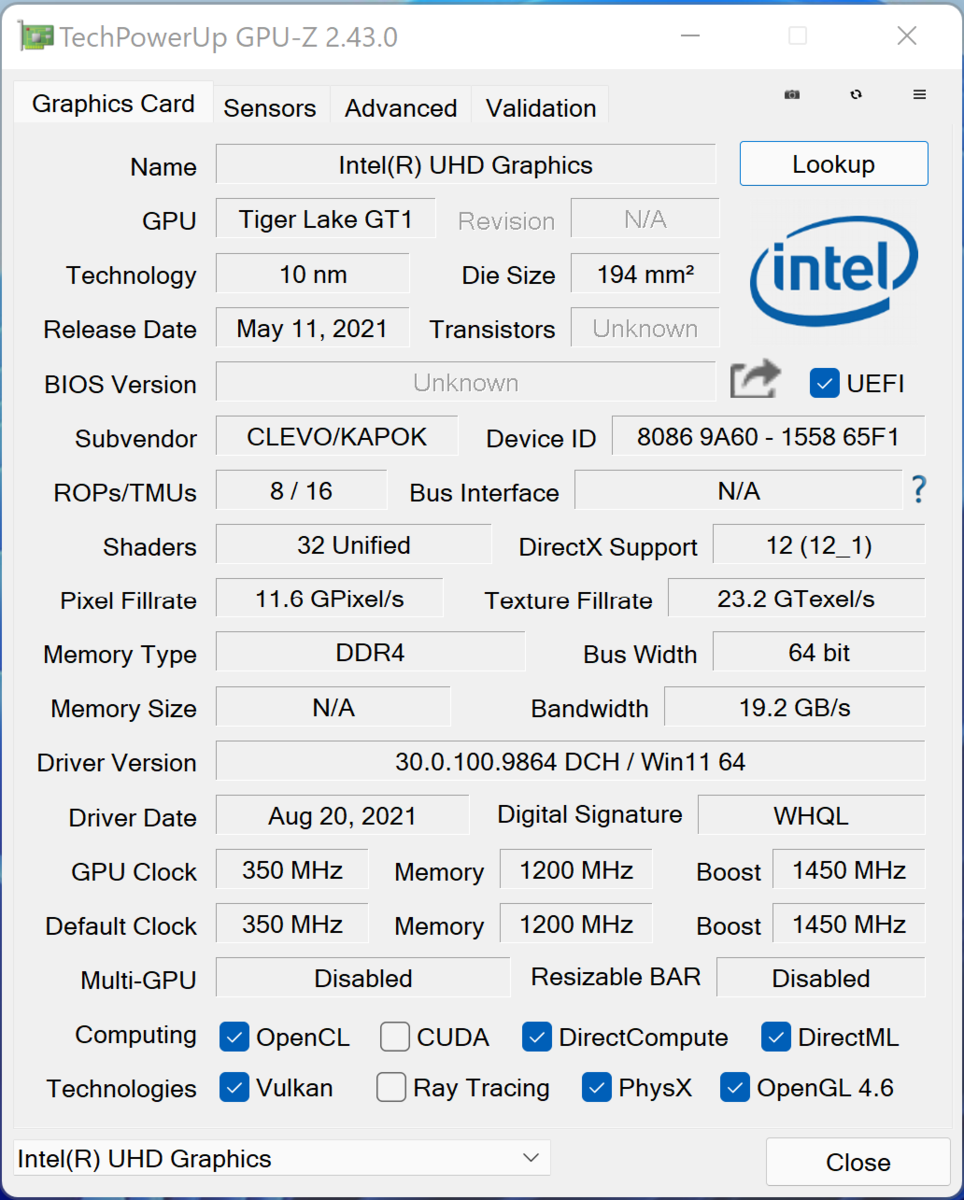
The GPU comes with fast GDDR6 video memory (16384 MB). The integrated UHD Graphics Xe GPU is enabled and the laptop uses Nvidia's graphics switching techonology Optimus.


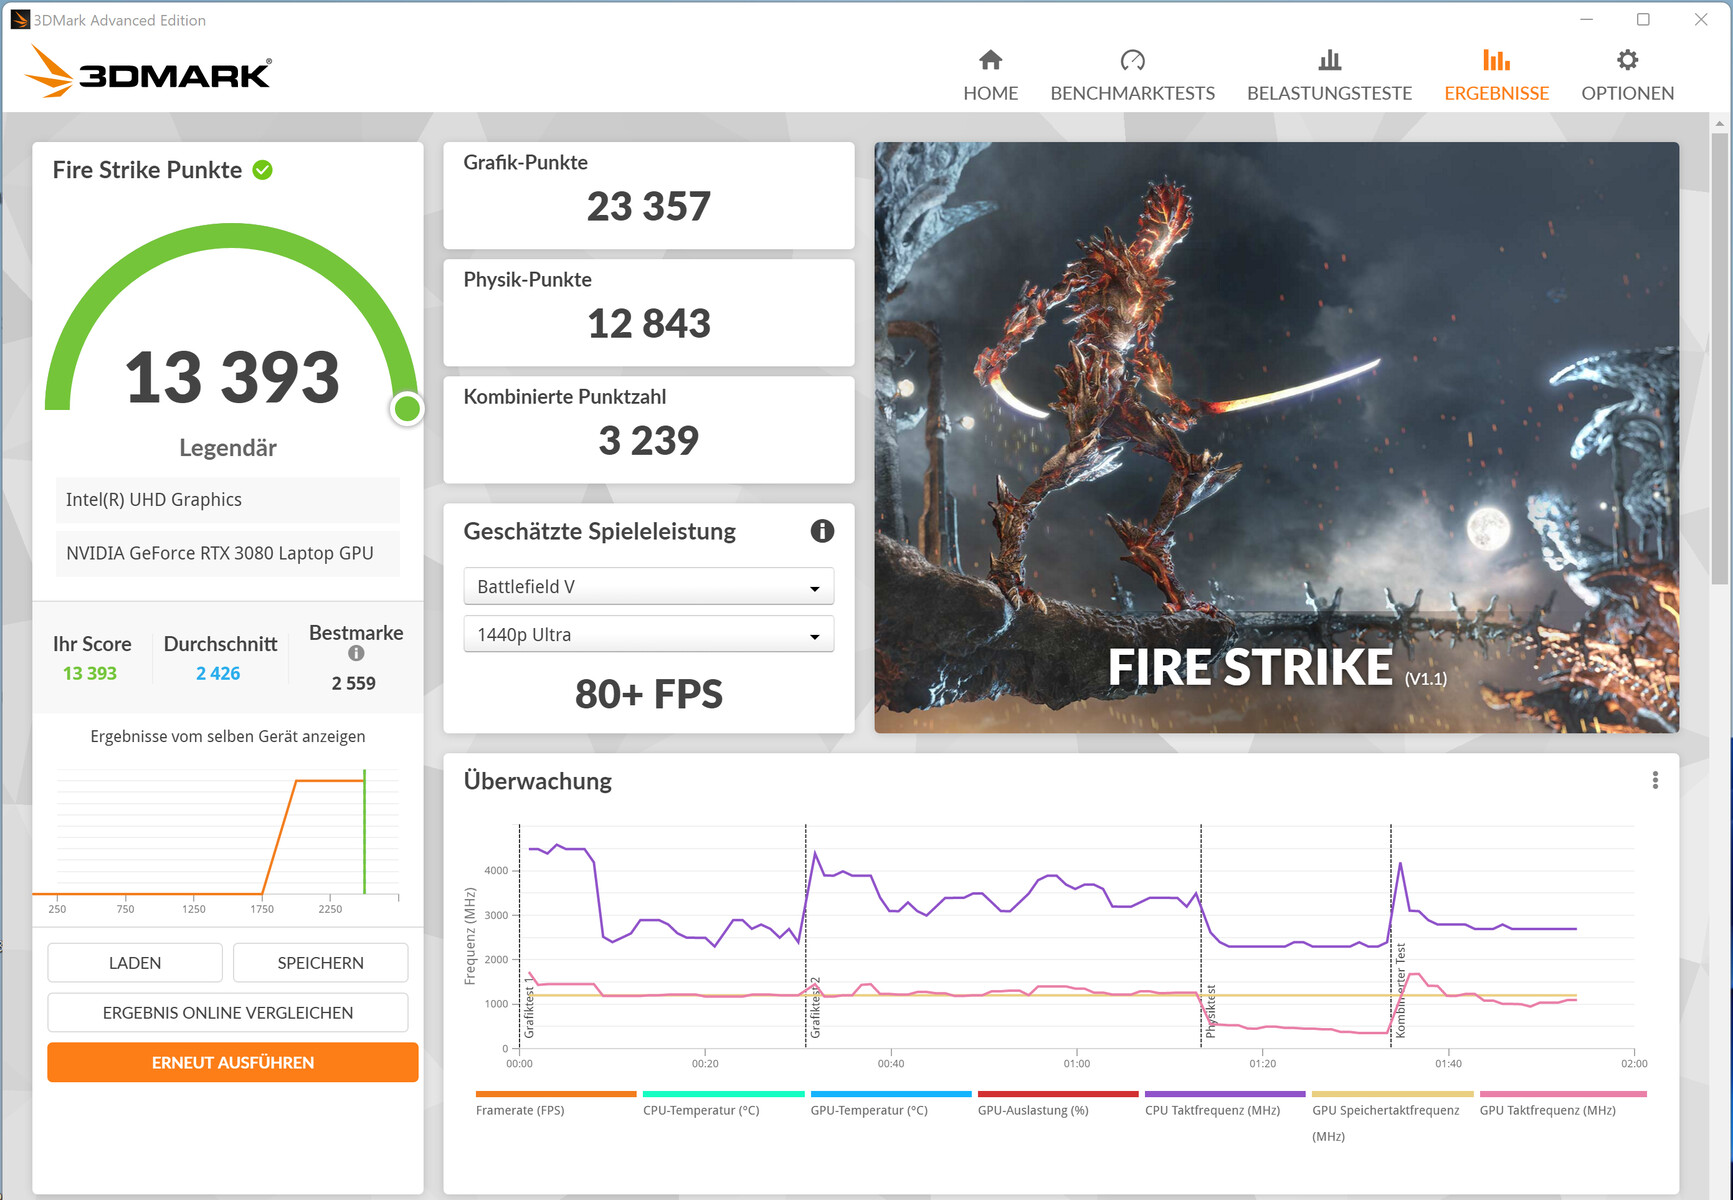
| 3DMark 11 Performance | 29001 points | |
| 3DMark Fire Strike Score | 19449 points | |
| 3DMark Time Spy Score | 9882 points | |
Help | ||
| 3DMark Performance Rating - Percent | |
| Average of class Gaming | |
| Average NVIDIA GeForce RTX 3080 Laptop GPU | |
| Razer Blade 15 Advanced (Mid 2021) | |
| SCHENKER XMG Pro 15 (Late 2021) | |
| SCHENKER XMG Pro 15 (Early 2021, RTX 3080) | |
| MSI Delta 15 A5EFK | |
| Alienware x15 RTX 3070 P111F | |
| SCHENKER XMG Pro 15 (Late 2021) -1! | |
| SCHENKER XMG Pro 15 (Late 2021) -1! | |
| Lenovo Legion S7 15ACH6 82K80030GE | |
| SCHENKER XMG Pro 15 (Late 2021) -1! | |
| 3DMark | |
| 1920x1080 Fire Strike Graphics | |
| Average of class Gaming (2913 - 62849, n=147, last 2 years) | |
| MSI Delta 15 A5EFK | |
| Average NVIDIA GeForce RTX 3080 Laptop GPU (16455 - 32366, n=46) | |
| Razer Blade 15 Advanced (Mid 2021) | |
| SCHENKER XMG Pro 15 (Early 2021, RTX 3080) | |
| SCHENKER XMG Pro 15 (Late 2021) | |
| SCHENKER XMG Pro 15 (Late 2021) (Unterhaltungsmodus) | |
| Alienware x15 RTX 3070 P111F | |
| SCHENKER XMG Pro 15 (Late 2021) (Lautlosmodus) | |
| Lenovo Legion S7 15ACH6 82K80030GE | |
| SCHENKER XMG Pro 15 (Late 2021) (Stromsparmodus) | |
| 2560x1440 Time Spy Graphics | |
| Average of class Gaming (2295 - 25763, n=142, last 2 years) | |
| Average NVIDIA GeForce RTX 3080 Laptop GPU (6407 - 13210, n=45) | |
| Razer Blade 15 Advanced (Mid 2021) | |
| SCHENKER XMG Pro 15 (Early 2021, RTX 3080) | |
| SCHENKER XMG Pro 15 (Late 2021) | |
| Alienware x15 RTX 3070 P111F | |
| SCHENKER XMG Pro 15 (Late 2021) (Unterhaltungsmodus) | |
| MSI Delta 15 A5EFK | |
| SCHENKER XMG Pro 15 (Late 2021) (Lautlosmodus) | |
| Lenovo Legion S7 15ACH6 82K80030GE | |
| SCHENKER XMG Pro 15 (Late 2021) (Stromsparmodus) | |
Gaming Performance
At FHD resolution and maximum quality settings, the hardware effortlessly displays all current games smoothly. Choosing higher resolutions is also possible, albeit at reduced detail settings. The frame rates hover around the average for the RTX 3080 - sometimes the Pro 15 exceeds it, other times it falls behind slightly.
| The Witcher 3 - 1920x1080 Ultra Graphics & Postprocessing (HBAO+) | |
| Average of class Gaming (18.4 - 224, n=68, last 2 years) | |
| Average NVIDIA GeForce RTX 3080 Laptop GPU (85.1 - 123, n=40) | |
| Razer Blade 15 Advanced (Mid 2021) | |
| Alienware x15 RTX 3070 P111F | |
| SCHENKER XMG Pro 15 (Late 2021) | |
| SCHENKER XMG Pro 15 (Early 2021, RTX 3080) | |
| MSI Delta 15 A5EFK | |
| SCHENKER XMG Pro 15 (Late 2021) (Lautlosmodus) | |
| Lenovo Legion S7 15ACH6 82K80030GE | |
| Dota 2 Reborn | |
| 1920x1080 ultra (3/3) best looking | |
| Average of class Gaming (65.1 - 248, n=138, last 2 years) | |
| Razer Blade 15 Advanced (Mid 2021) | |
| SCHENKER XMG Pro 15 (Late 2021) | |
| Alienware x15 RTX 3070 P111F | |
| Average NVIDIA GeForce RTX 3080 Laptop GPU (98 - 156, n=45) | |
| SCHENKER XMG Pro 15 (Late 2021) (Unterhaltungsmodus) | |
| Lenovo Legion S7 15ACH6 82K80030GE | |
| SCHENKER XMG Pro 15 (Early 2021, RTX 3080) | |
| SCHENKER XMG Pro 15 (Late 2021) (Stromsparmodus) | |
| MSI Delta 15 A5EFK | |
| SCHENKER XMG Pro 15 (Late 2021) (Lautlosmodus) | |
| 3840x2160 ultra (3/3) best looking | |
| Average of class Gaming (105.2 - 199.2, n=44, last 2 years) | |
| SCHENKER XMG Pro 15 (Late 2021) | |
| SCHENKER XMG Pro 15 (Late 2021) (Unterhaltungsmodus) | |
| Average NVIDIA GeForce RTX 3080 Laptop GPU (55.2 - 128, n=17) | |
| Lenovo Legion S7 15ACH6 82K80030GE | |
| SCHENKER XMG Pro 15 (Late 2021) (Lautlosmodus) | |
| SCHENKER XMG Pro 15 (Late 2021) (Stromsparmodus) | |
| X-Plane 11.11 | |
| 1920x1080 high (fps_test=3) | |
| Average of class Gaming (33.4 - 150.2, n=141, last 2 years) | |
| Razer Blade 15 Advanced (Mid 2021) | |
| Alienware x15 RTX 3070 P111F | |
| SCHENKER XMG Pro 15 (Late 2021) | |
| SCHENKER XMG Pro 15 (Late 2021) (Unterhaltungsmodus) | |
| Average NVIDIA GeForce RTX 3080 Laptop GPU (65.6 - 113, n=44) | |
| SCHENKER XMG Pro 15 (Early 2021, RTX 3080) | |
| SCHENKER XMG Pro 15 (Late 2021) (Stromsparmodus) | |
| Lenovo Legion S7 15ACH6 82K80030GE | |
| SCHENKER XMG Pro 15 (Late 2021) (Lautlosmodus) | |
| 3840x2160 high (fps_test=3) | |
| Average of class Gaming (62.9 - 145.5, n=44, last 2 years) | |
| SCHENKER XMG Pro 15 (Late 2021) | |
| Average NVIDIA GeForce RTX 3080 Laptop GPU (39.9 - 88.6, n=17) | |
| SCHENKER XMG Pro 15 (Late 2021) (Unterhaltungsmodus) | |
| SCHENKER XMG Pro 15 (Late 2021) (Stromsparmodus) | |
| Lenovo Legion S7 15ACH6 82K80030GE | |
| SCHENKER XMG Pro 15 (Late 2021) (Lautlosmodus) | |
| Strange Brigade | |
| 1920x1080 ultra AA:ultra AF:16 | |
| Average of class Gaming (38.9 - 456, n=125, last 2 years) | |
| Average NVIDIA GeForce RTX 3080 Laptop GPU (117 - 219, n=34) | |
| Razer Blade 15 Advanced (Mid 2021) (1.47.22.14 D3D12) | |
| Alienware x15 RTX 3070 P111F (1.47.22.14 D3D12) | |
| SCHENKER XMG Pro 15 (Late 2021) (1.47.22.14 D3D12) | |
| MSI Delta 15 A5EFK (1.47.22.14 D3D12) | |
| SCHENKER XMG Pro 15 (Late 2021) (1.47.22.14 D3D12, Unterhaltungsmodus) | |
| SCHENKER XMG Pro 15 (Late 2021) (1.47.22.14 D3D12, Lautlosmodus) | |
| Lenovo Legion S7 15ACH6 82K80030GE (1.47.22.14 D3D12) | |
| SCHENKER XMG Pro 15 (Late 2021) (1.47.22.14 D3D12, Stromsparmodus) | |
| 2560x1440 ultra AA:ultra AF:16 | |
| Average of class Gaming (52.8 - 350, n=100, last 2 years) | |
| Average NVIDIA GeForce RTX 3080 Laptop GPU (123 - 165, n=14) | |
| Alienware x15 RTX 3070 P111F (1.47.22.14 D3D12) | |
| SCHENKER XMG Pro 15 (Late 2021) (1.47.22.14 D3D12) | |
| Lenovo Legion S7 15ACH6 82K80030GE (1.47.22.14 D3D12) | |
| 3840x2160 ultra AA:ultra AF:16 | |
| Average of class Gaming (54.5 - 187.2, n=38, last 2 years) | |
| Average NVIDIA GeForce RTX 3080 Laptop GPU (55.9 - 91.7, n=12) | |
| SCHENKER XMG Pro 15 (Late 2021) (1.47.22.14 D3D12) | |
| SCHENKER XMG Pro 15 (Late 2021) (1.47.22.14 D3D12, Unterhaltungsmodus) | |
| SCHENKER XMG Pro 15 (Late 2021) (1.47.22.14 D3D12, Lautlosmodus) | |
| Lenovo Legion S7 15ACH6 82K80030GE (1.47.22.14 D3D12) | |
| SCHENKER XMG Pro 15 (Late 2021) (1.47.22.14 D3D12, Stromsparmodus) | |
| F1 2021 | |
| 1920x1080 Ultra High Preset + Raytracing AA:T AF:16x | |
| Average of class Gaming (123.1 - 146.7, n=3, last 2 years) | |
| SCHENKER XMG Pro 15 (Late 2021) (831795) | |
| SCHENKER XMG Pro 15 (Late 2021) (831795, Unterhaltungsmodus) | |
| Average NVIDIA GeForce RTX 3080 Laptop GPU (74.9 - 123.7, n=9) | |
| MSI Delta 15 A5EFK | |
| SCHENKER XMG Pro 15 (Late 2021) (831795, Lautlosmodus) | |
| Lenovo Legion S7 15ACH6 82K80030GE (815237) | |
| SCHENKER XMG Pro 15 (Late 2021) (831795, Stromsparmodus) | |
| 2560x1440 Ultra High Preset + Raytracing AA:T AF:16x | |
| Average of class Gaming (95.2 - 104.6, n=3, last 2 years) | |
| Average NVIDIA GeForce RTX 3080 Laptop GPU (84 - 90.4, n=4) | |
| SCHENKER XMG Pro 15 (Late 2021) (831795) | |
| Lenovo Legion S7 15ACH6 82K80030GE (815237) | |
| 3840x2160 Ultra High Preset + Raytracing AA:T AF:16x | |
| SCHENKER XMG Pro 15 (Late 2021) (831795) | |
| SCHENKER XMG Pro 15 (Late 2021) (831795, Unterhaltungsmodus) | |
| Average NVIDIA GeForce RTX 3080 Laptop GPU (32.5 - 51.5, n=7) | |
| SCHENKER XMG Pro 15 (Late 2021) (831795, Lautlosmodus) | |
| Lenovo Legion S7 15ACH6 82K80030GE (815237) | |
| SCHENKER XMG Pro 15 (Late 2021) (831795, Stromsparmodus) | |
| Far Cry 6 | |
| 1920x1080 Ultra Graphics Quality + HD Textures AA:T | |
| Average of class Gaming (94 - 156, n=6, last 2 years) | |
| Lenovo Legion S7 15ACH6 82K80030GE | |
| Average NVIDIA GeForce RTX 3080 Laptop GPU (55 - 104.4, n=5) | |
| MSI Delta 15 A5EFK | |
| SCHENKER XMG Pro 15 (Late 2021) | |
| 3840x2160 Ultra Graphics Quality + HD Textures AA:T | |
| Average NVIDIA GeForce RTX 3080 Laptop GPU (40 - 50, n=4) | |
| Average of class Gaming (12.8 - 70, n=2, last 2 years) | |
| SCHENKER XMG Pro 15 (Late 2021) | |
| 1920x1080 Ultra Graphics Quality + HD Textures + DXR AA:T | |
| Average of class Gaming (n=1last 2 years) | |
| Average NVIDIA GeForce RTX 3080 Laptop GPU (59 - 84.7, n=4) | |
| Lenovo Legion S7 15ACH6 82K80030GE | |
| SCHENKER XMG Pro 15 (Late 2021) | |
| MSI Delta 15 A5EFK | |
| Guardians of the Galaxy | |
| 1920x1080 Ultra Preset | |
| Average NVIDIA GeForce RTX 3080 Laptop GPU (122 - 145, n=4) | |
| SCHENKER XMG Pro 15 (Late 2021) | |
| Lenovo Legion S7 15ACH6 82K80030GE | |
| Average of class Gaming (42 - 42, n=2, last 2 years) | |
| 3840x2160 Ultra Preset | |
| Average NVIDIA GeForce RTX 3080 Laptop GPU (55 - 60, n=4) | |
| SCHENKER XMG Pro 15 (Late 2021) | |
| Lenovo Legion S7 15ACH6 82K80030GE | |
| 1920x1080 Ultra Preset + Ultra Ray-Tracing | |
| Average NVIDIA GeForce RTX 3080 Laptop GPU (75 - 85, n=4) | |
| SCHENKER XMG Pro 15 (Late 2021) | |
| Lenovo Legion S7 15ACH6 82K80030GE | |
| Riders Republic | |
| 1920x1080 Ultra Preset | |
| Average NVIDIA GeForce RTX 3080 Laptop GPU (104 - 115, n=2) | |
| SCHENKER XMG Pro 15 (Late 2021) | |
| Lenovo Legion S7 15ACH6 82K80030GE | |
| 3840x2160 Ultra Preset | |
| Average NVIDIA GeForce RTX 3080 Laptop GPU (41 - 47, n=2) | |
| SCHENKER XMG Pro 15 (Late 2021) | |
| Lenovo Legion S7 15ACH6 82K80030GE | |
| Forza Horizon 5 | |
| 1920x1080 Extreme Preset | |
| Average NVIDIA GeForce RTX 3080 Laptop GPU (81 - 84, n=4) | |
| SCHENKER XMG Pro 15 (Late 2021) | |
| 3840x2160 Extreme Preset | |
| Average NVIDIA GeForce RTX 3080 Laptop GPU (48 - 55, n=4) | |
| SCHENKER XMG Pro 15 (Late 2021) | |
| Battlefield 2042 | |
| 1920x1080 Ultra Preset | |
| Average NVIDIA GeForce RTX 3080 Laptop GPU (88.7 - 104, n=2) | |
| SCHENKER XMG Pro 15 (Late 2021) | |
| 3840x2160 Ultra Preset | |
| Average NVIDIA GeForce RTX 3080 Laptop GPU (43 - 50.2, n=2) | |
| SCHENKER XMG Pro 15 (Late 2021) | |
| 1920x1080 Ultra Preset + Ray Tracing | |
| Average NVIDIA GeForce RTX 3080 Laptop GPU (68 - 84.2, n=2) | |
| SCHENKER XMG Pro 15 (Late 2021) | |
| Halo Infinite | |
| 1920x1080 Ultra Preset | |
| Average NVIDIA GeForce RTX 3080 Laptop GPU (96.1 - 106, n=2) | |
| SCHENKER XMG Pro 15 (Late 2021) | |
| 3840x2160 Ultra Preset | |
| Average NVIDIA GeForce RTX 3080 Laptop GPU (40.2 - 46.2, n=2) | |
| SCHENKER XMG Pro 15 (Late 2021) | |
| Alan Wake Remastered | |
| 1920x1080 High Preset | |
| SCHENKER XMG Pro 15 (Late 2021) | |
| Average NVIDIA GeForce RTX 3080 Laptop GPU (95 - 111, n=2) | |
| Lenovo Legion S7 15ACH6 82K80030GE | |
| 3840x2160 High Preset | |
| Average NVIDIA GeForce RTX 3080 Laptop GPU (64.6 - 73.9, n=2) | |
| SCHENKER XMG Pro 15 (Late 2021) | |
| Lenovo Legion S7 15ACH6 82K80030GE | |
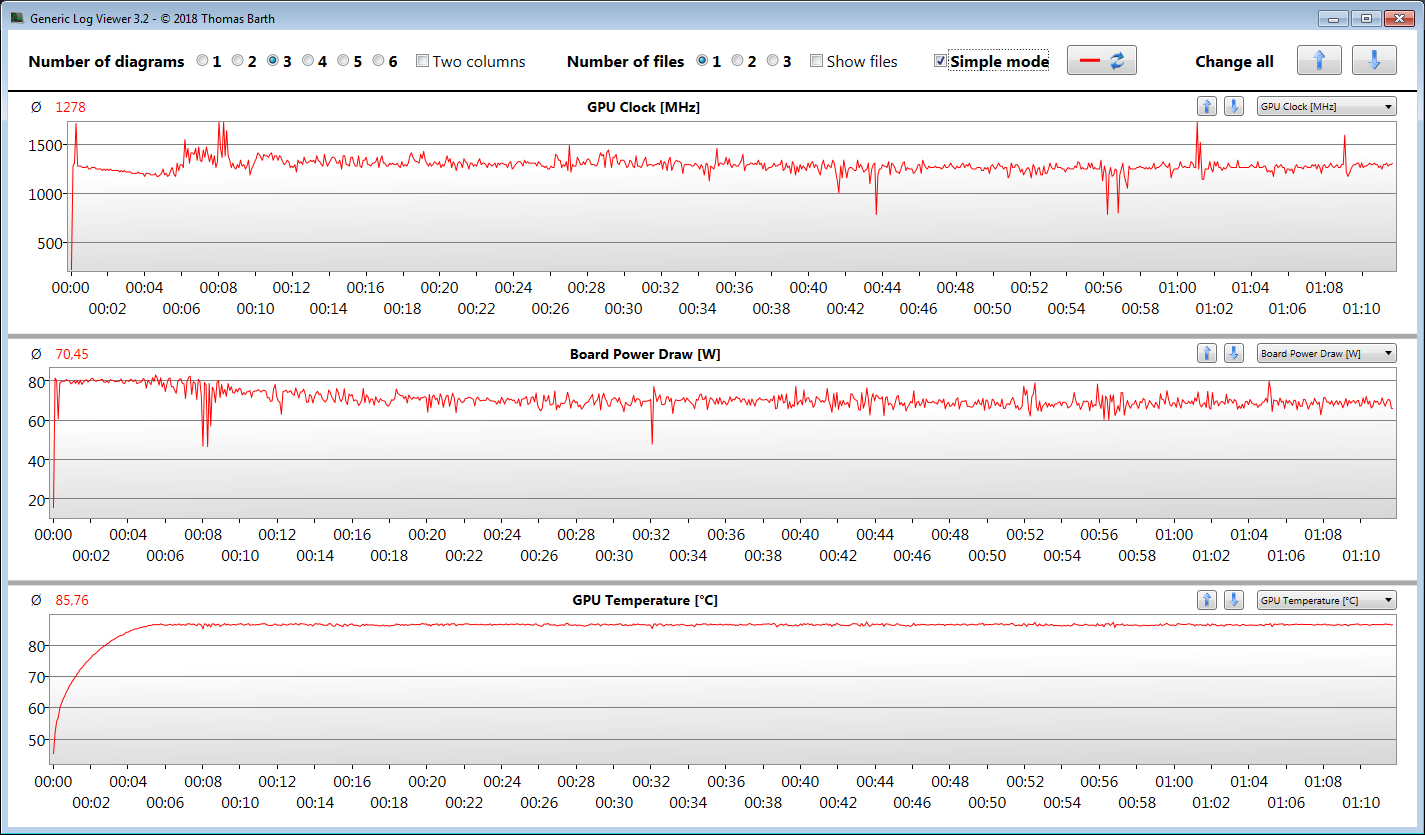
In order to determine whether the frame rates remain constant over a prolonged period, we idled in The Witcher 3 for around 60 minutes at FHD resolution and maximum details. The character was not moved throughout the entire timeframe. With the performance mode selected, we did not observe any frame drops.
Witcher 3 FPS Diagram
| low | med. | high | ultra | QHD | 4K | |
|---|---|---|---|---|---|---|
| GTA V (2015) | 184 | 180 | 166 | 102 | 85.7 | 93 |
| The Witcher 3 (2015) | 399 | 285 | 176 | 100 | 69.6 | |
| Dota 2 Reborn (2015) | 164 | 146 | 137 | 132 | 116 | |
| Final Fantasy XV Benchmark (2018) | 187 | 129 | 97.5 | 74.6 | 44.1 | |
| X-Plane 11.11 (2018) | 128 | 109 | 88.5 | 67.9 | ||
| Far Cry 5 (2018) | 163 | 130 | 123 | 115 | 95 | 54 |
| Strange Brigade (2018) | 465 | 244 | 201 | 176 | 130 | 76 |
| F1 2021 (2021) | 314 | 219 | 190 | 117 | 87.4 | 49.6 |
| Alan Wake Remastered (2021) | 121 | 111 | 108 | 64.6 | ||
| Far Cry 6 (2021) | 101 | 82 | 75 | 70 | 62 | 40 |
| Guardians of the Galaxy (2021) | 130 | 122 | 124 | 122 | 95 | 55 |
| Riders Republic (2021) | 155 | 137 | 113 | 104 | 74 | 41 |
| Forza Horizon 5 (2021) | 214 | 131 | 122 | 81 | 67 | 48 |
| Battlefield 2042 (2021) | 133 | 110 | 99.8 | 88.7 | 69.9 | 43 |
| Halo Infinite (2021) | 118 | 101 | 96.1 | 70.4 | 40.2 |
Emissions - The Schenker Laptop makes a lot of noise
System Noise
During daily use (office, browsing the web), the two fans tend to be reserved and quiet. However, we did notice the fans occasionally ramping up unnecessarily - this increases the noise level to up to 41 dB(A). Under load, things can become very noisy with maximum values of 58 dB(A) (stress test) and 53 dB(A) (Witcher 3 test). The Razer Blade 15 consistently produces less noise regardless of the system load.
The noise levels under load can be reduced by selecting the silent power profile. The fans then spin very quietly. Meanwhile, the CPU and GPU clock rates are severely limited. Although gaming is still possible in this mode, the quality settings or resolution will likely need to be reduced.
Noise Level
| Idle |
| 31 / 37 / 41 dB(A) |
| Load |
| 56 / 58 dB(A) |
 | ||
30 dB silent 40 dB(A) audible 50 dB(A) loud |
||
min: | ||
| SCHENKER XMG Pro 15 (Late 2021) i7-11800H, GeForce RTX 3080 Laptop GPU | Lenovo Legion S7 15ACH6 82K80030GE R9 5900HX, GeForce RTX 3060 Laptop GPU | Alienware x15 RTX 3070 P111F i7-11800H, GeForce RTX 3070 Laptop GPU | Razer Blade 15 Advanced (Mid 2021) i7-11800H, GeForce RTX 3080 Laptop GPU | SCHENKER XMG Pro 15 (Early 2021, RTX 3080) i7-10870H, GeForce RTX 3080 Laptop GPU | MSI Delta 15 A5EFK R9 5900HX, Radeon RX 6700M | |
|---|---|---|---|---|---|---|
| Noise | 11% | 19% | 19% | 4% | 10% | |
| off / environment * (dB) | 24 | 25 -4% | 24.1 -0% | 25.1 -5% | 25 -4% | 25 -4% |
| Idle Minimum * (dB) | 31 | 25 19% | 26.6 14% | 25.3 18% | 33 -6% | 25 19% |
| Idle Average * (dB) | 37 | 30 19% | 26.6 28% | 25.3 32% | 34 8% | 30 19% |
| Idle Maximum * (dB) | 41 | 36 12% | 26.6 35% | 25.3 38% | 35 15% | 40 2% |
| Load Average * (dB) | 56 | 42 25% | 30.9 45% | 42 25% | 51 9% | 47 16% |
| Witcher 3 ultra * (dB) | 53 | 53 -0% | 49.9 6% | 45.6 14% | 52 2% | 48 9% |
| Load Maximum * (dB) | 58 | 54 7% | 53.5 8% | 51.6 11% | 57 2% | 51 12% |
* ... smaller is better
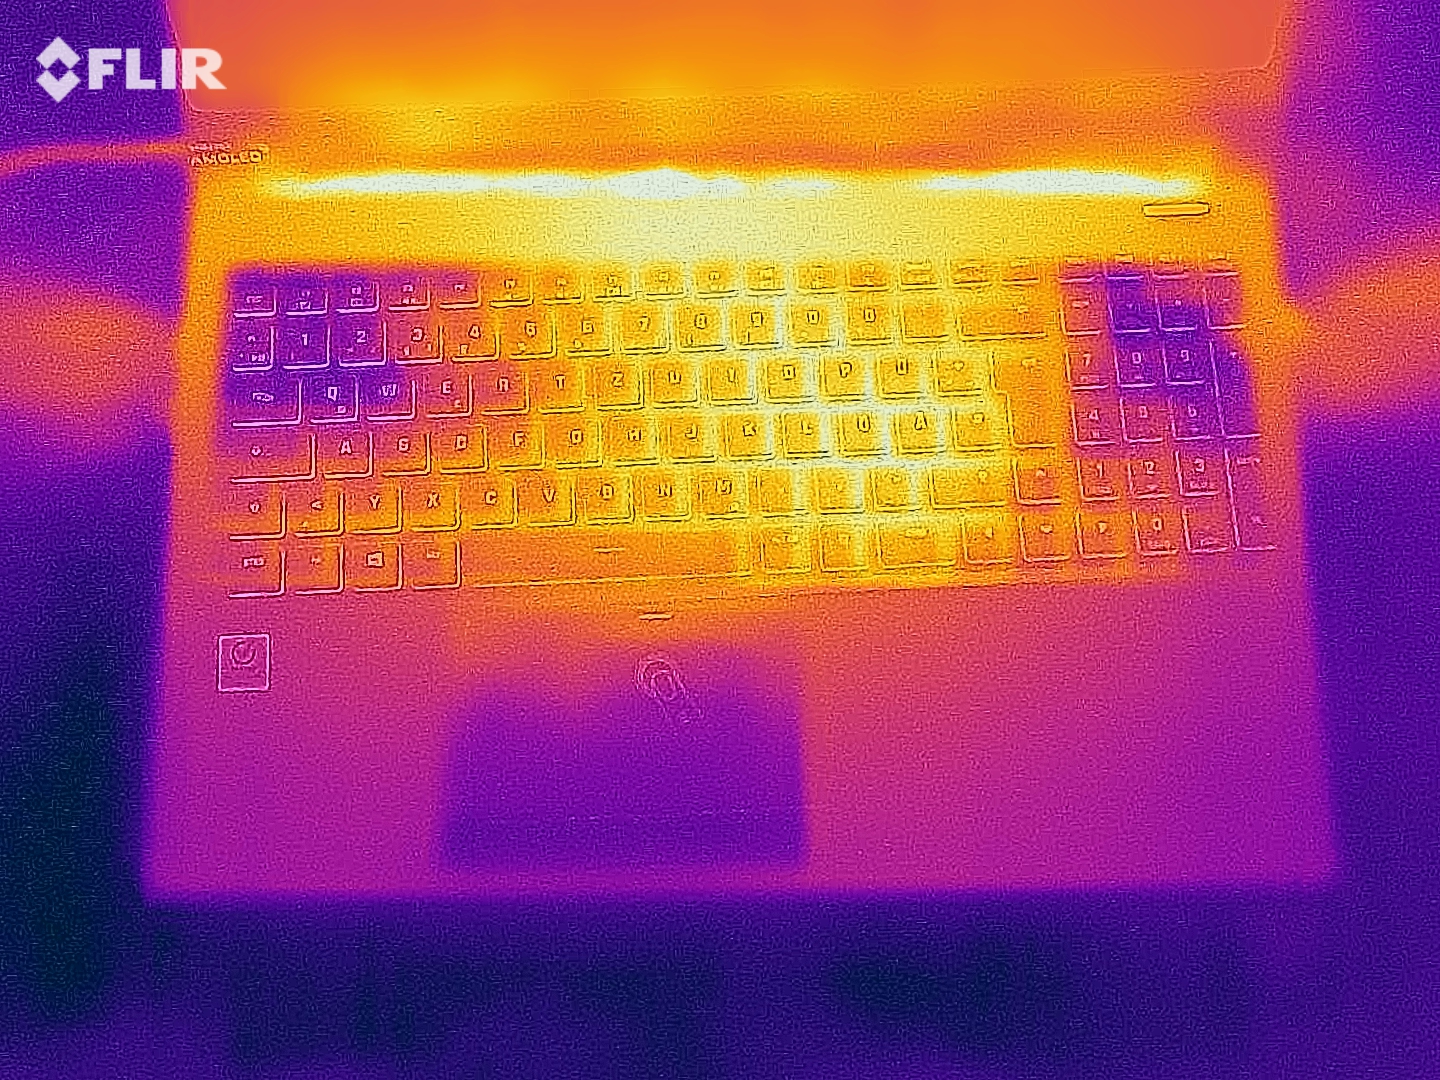
Temperature
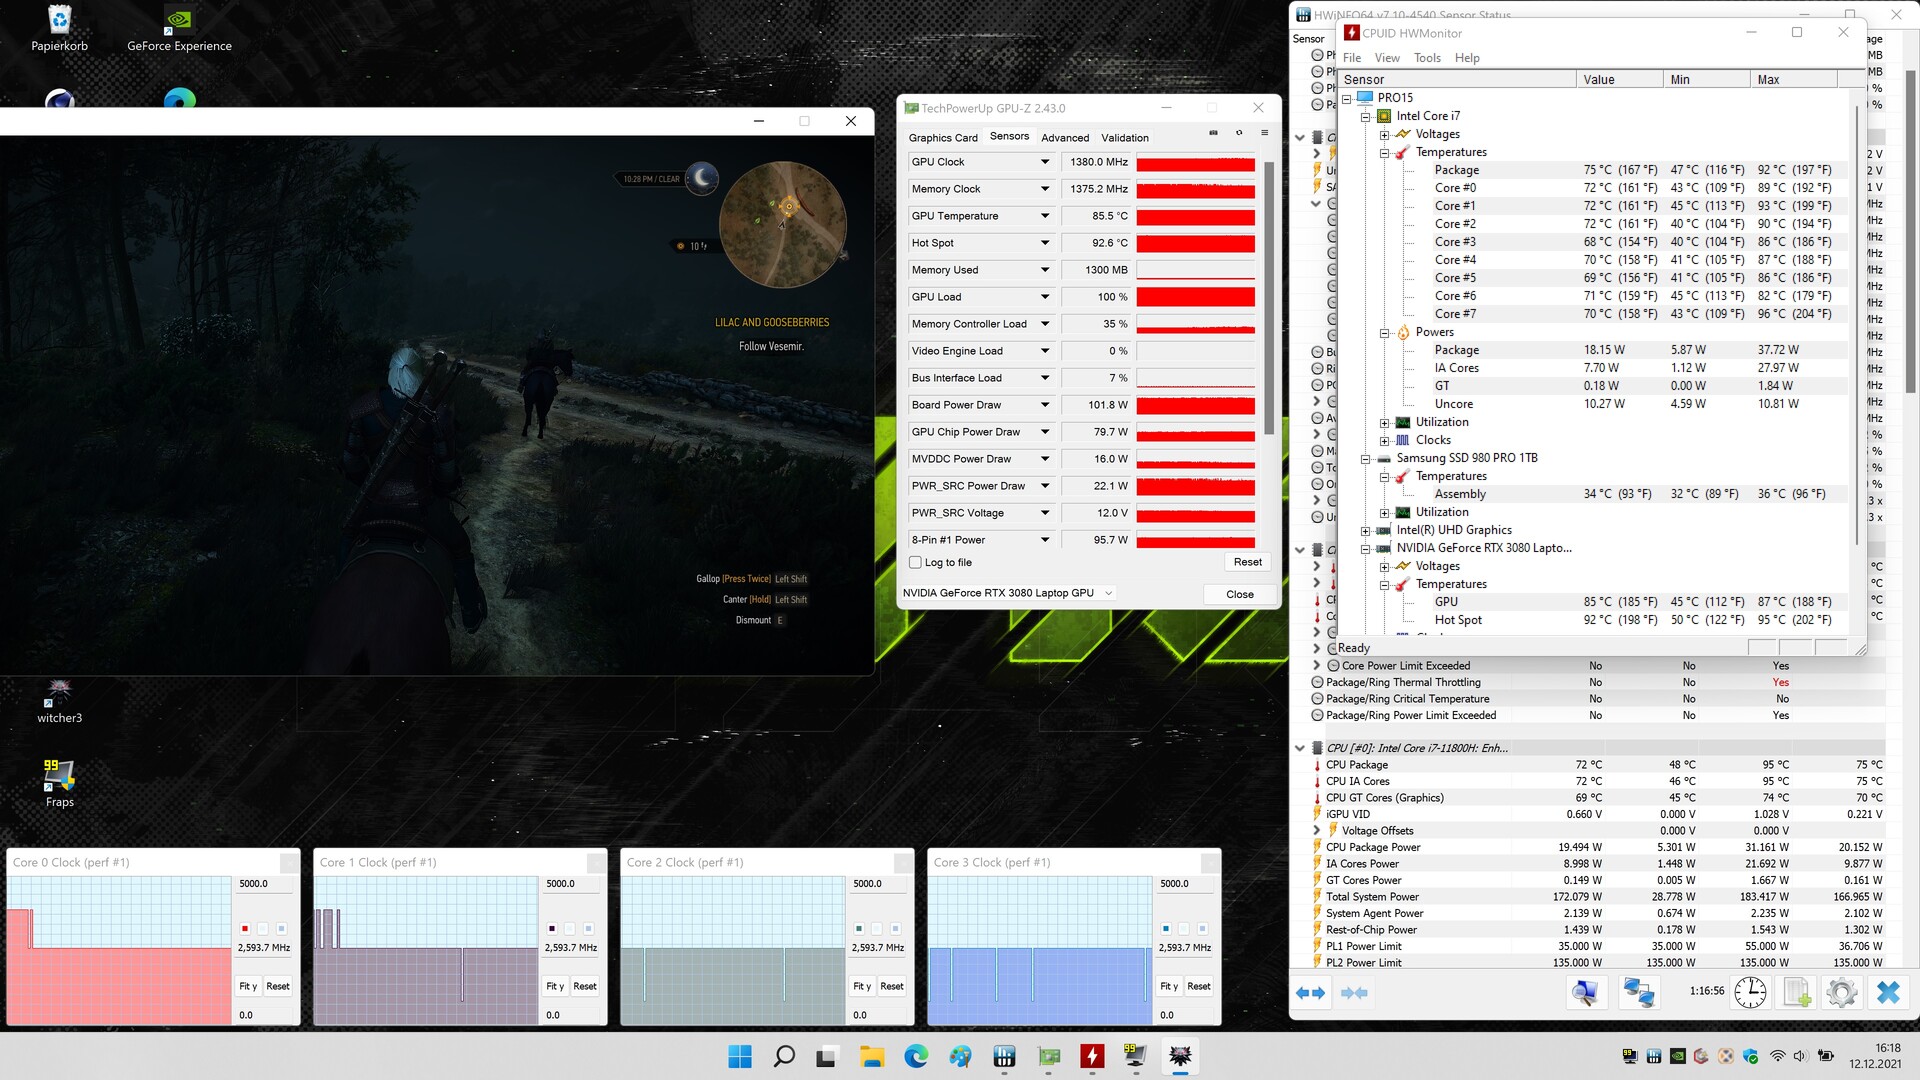
During daily use (office, browsing the web), the surface temperatures remain low. Under load (stress test, Witcher 3), the laptop gets very warm. In some spots, we measured temperatures in excess of 60 °C (140 °F). At the beginning of the test, the CPU reaches a temperature of 100 °C (212 °F) and thus the maximum as specified by Intel. Subsequently, the temperature stabilizes between 90 to 100 °C (194-212 °F).
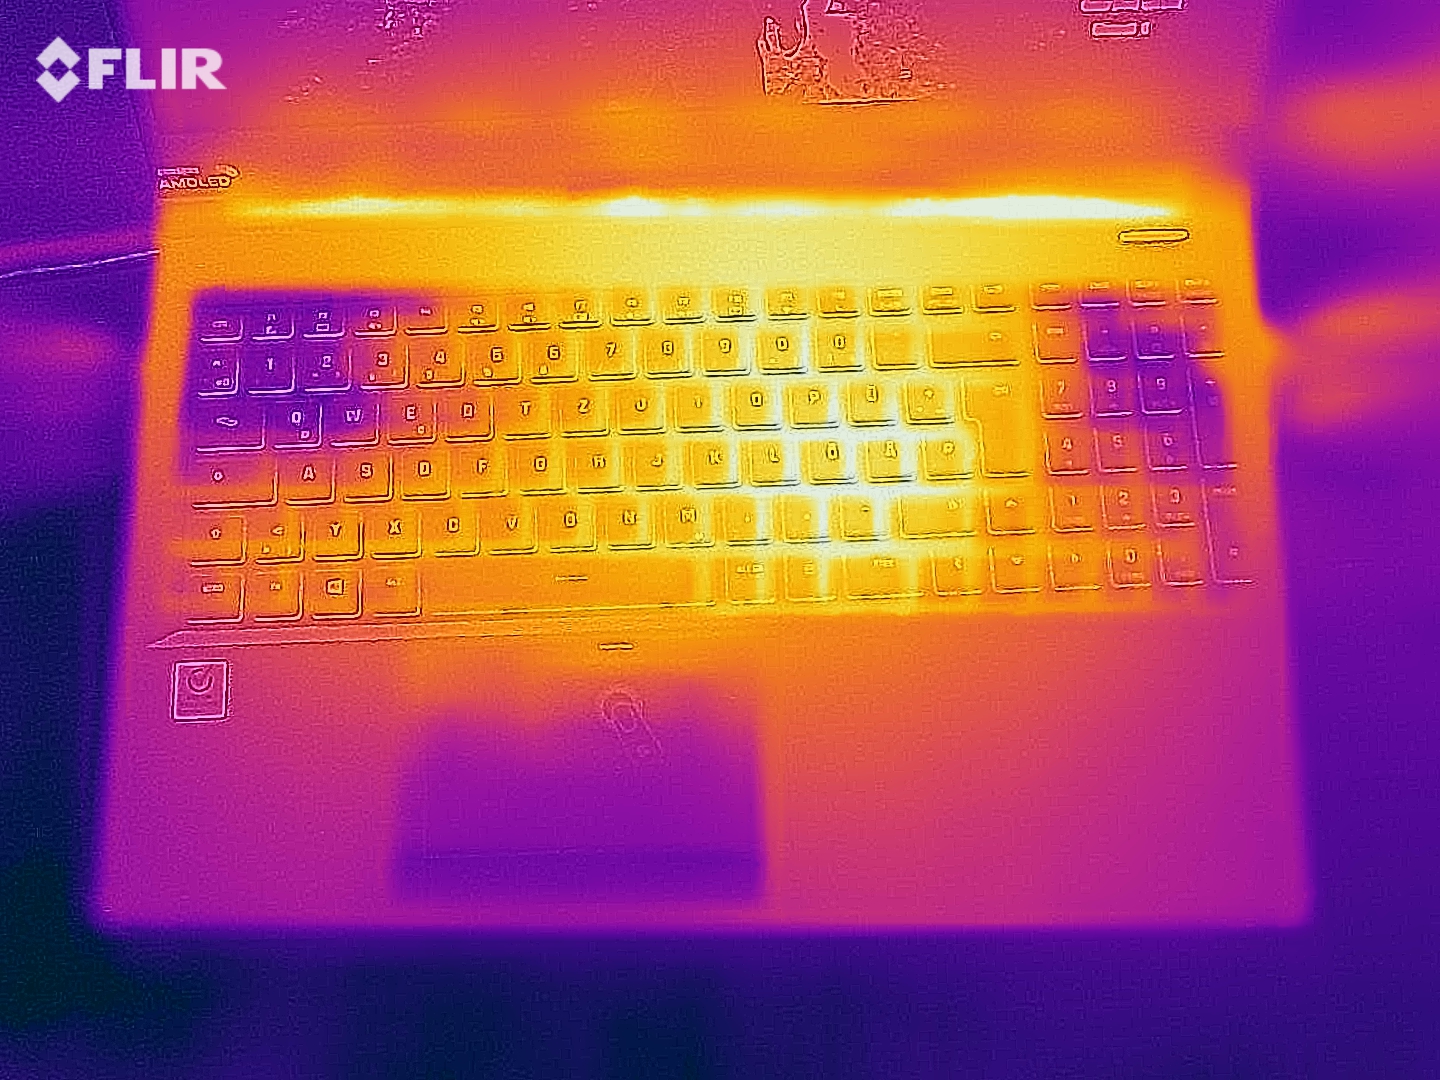
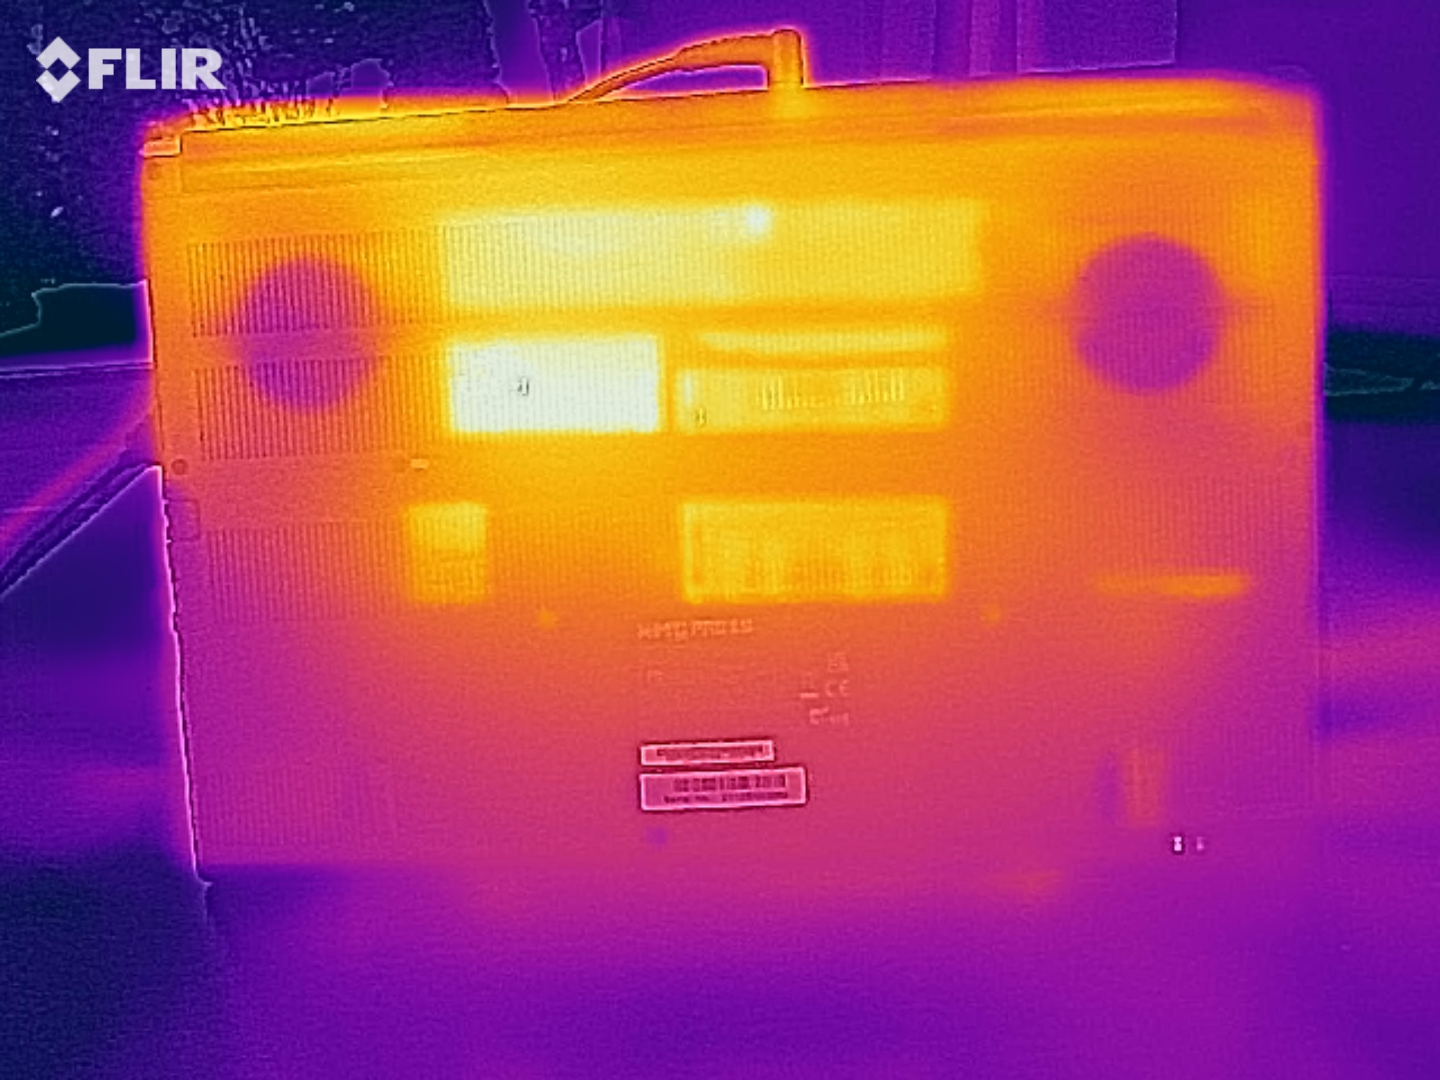
(±) The maximum temperature on the upper side is 44 °C / 111 F, compared to the average of 40.5 °C / 105 F, ranging from 21.2 to 68.8 °C for the class Gaming.
(-) The bottom heats up to a maximum of 60 °C / 140 F, compared to the average of 43.3 °C / 110 F
(+) In idle usage, the average temperature for the upper side is 27.8 °C / 82 F, compared to the device average of 33.9 °C / 93 F.
(-) Playing The Witcher 3, the average temperature for the upper side is 44.2 °C / 112 F, compared to the device average of 33.9 °C / 93 F.
(±) The palmrests and touchpad can get very hot to the touch with a maximum of 38 °C / 100.4 F.
(-) The average temperature of the palmrest area of similar devices was 28.9 °C / 84 F (-9.1 °C / -16.4 F).
| SCHENKER XMG Pro 15 (Late 2021) Intel Core i7-11800H, NVIDIA GeForce RTX 3080 Laptop GPU | Lenovo Legion S7 15ACH6 82K80030GE AMD Ryzen 9 5900HX, NVIDIA GeForce RTX 3060 Laptop GPU | Alienware x15 RTX 3070 P111F Intel Core i7-11800H, NVIDIA GeForce RTX 3070 Laptop GPU | Razer Blade 15 Advanced (Mid 2021) Intel Core i7-11800H, NVIDIA GeForce RTX 3080 Laptop GPU | SCHENKER XMG Pro 15 (Early 2021, RTX 3080) Intel Core i7-10870H, NVIDIA GeForce RTX 3080 Laptop GPU | MSI Delta 15 A5EFK AMD Ryzen 9 5900HX, AMD Radeon RX 6700M | |
|---|---|---|---|---|---|---|
| Heat | 5% | -3% | -8% | -7% | 1% | |
| Maximum Upper Side * (°C) | 44 | 49 -11% | 59.2 -35% | 51 -16% | 51 -16% | 50 -14% |
| Maximum Bottom * (°C) | 60 | 50 17% | 58 3% | 52 13% | 66 -10% | 55 8% |
| Idle Upper Side * (°C) | 30 | 29 3% | 28.4 5% | 35.2 -17% | 32 -7% | 31 -3% |
| Idle Bottom * (°C) | 34 | 30 12% | 29 15% | 37.8 -11% | 32 6% | 30 12% |
* ... smaller is better
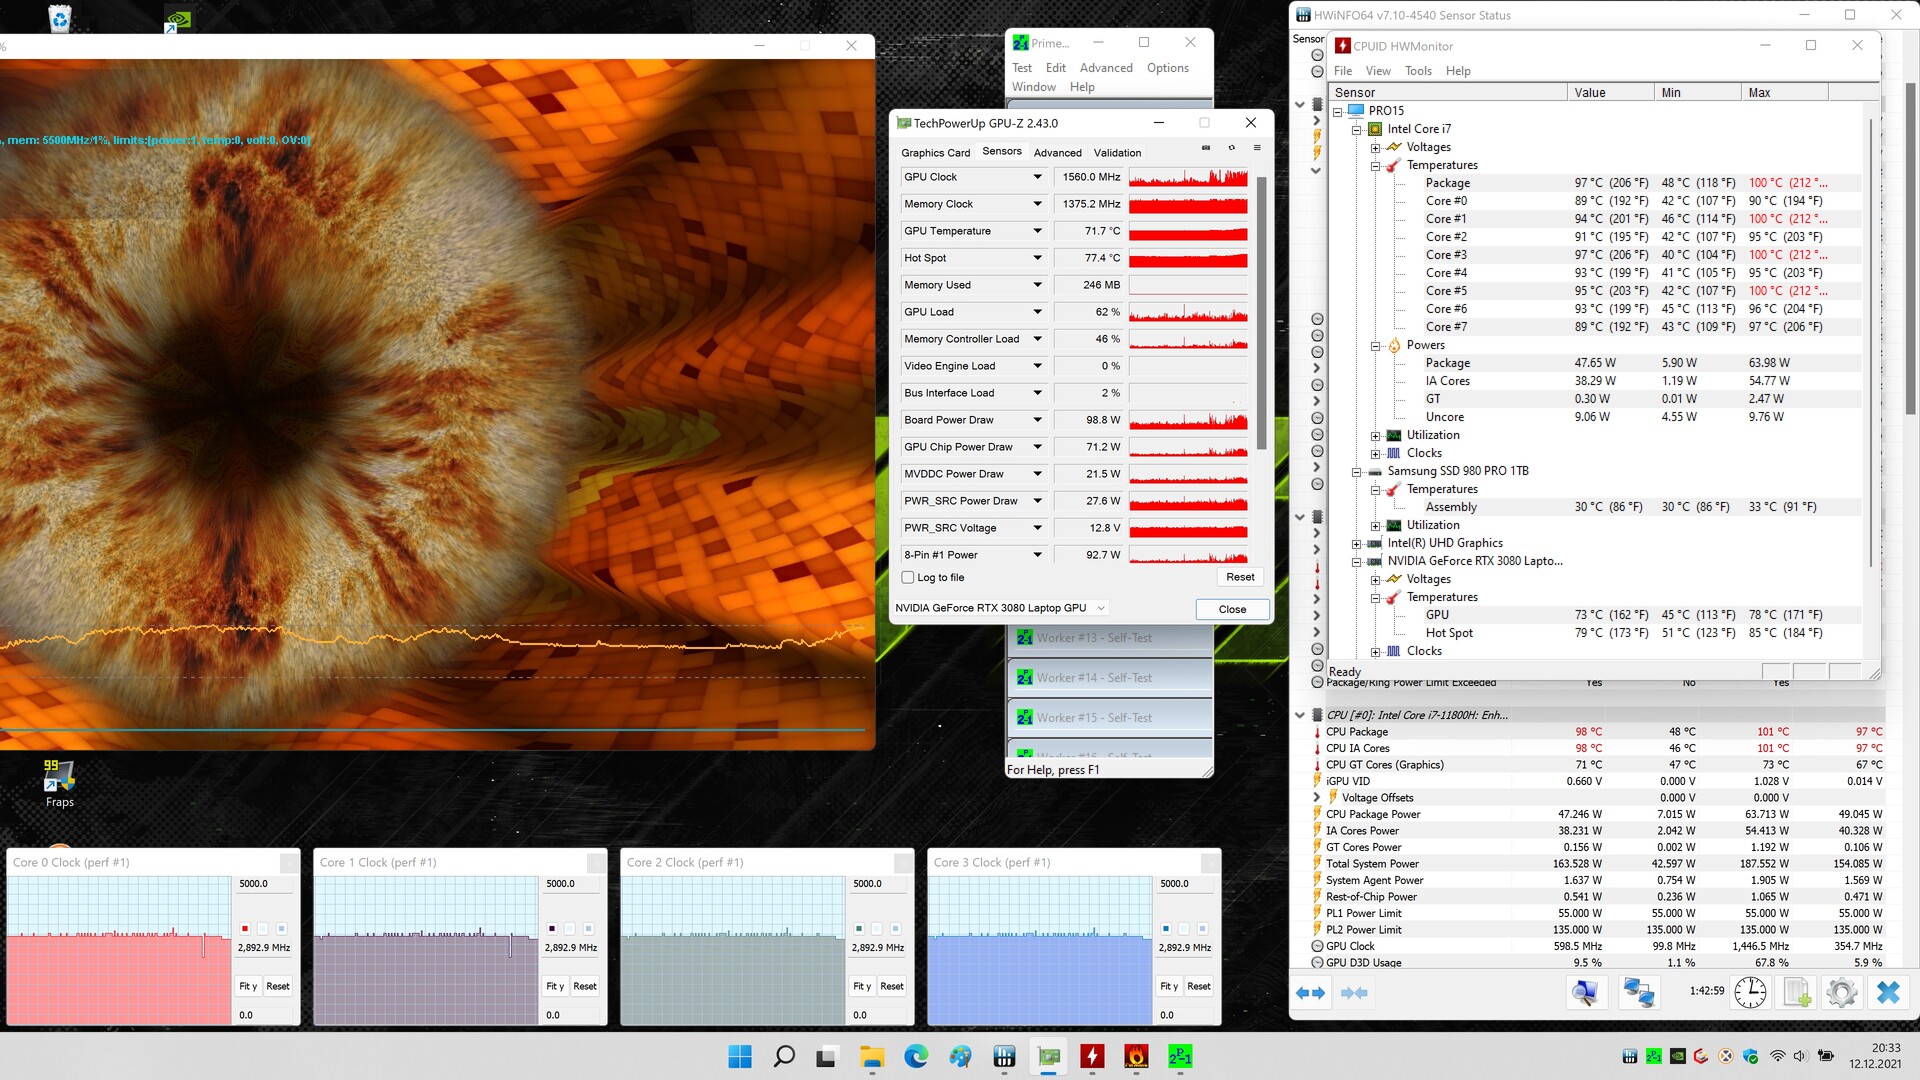
Stress Test
At the start of our stress test (running Prime95 and FurMark for at least one hour) the CPU (3.8 to 4.1 GHz) and GPU (1300 to 1600 MHz) run at fairly high clock speeds. After only a few minutes, the clock rates drop to 2.9 GHz and 500 to 1600 MHz, respectively, where they remain. This stress test represents an extreme scenario. We use this test to determine whether the system remains stable even under maximum load.
Speakers
The stereo speakers produce mediocre sound that is lacking in terms of bass. The maximum volume level is relatively high. We recommend headphones or external speakers for a better sound experience.
SCHENKER XMG Pro 15 (Late 2021) audio analysis
(+) | speakers can play relatively loud (89 dB)
Bass 100 - 315 Hz
(-) | nearly no bass - on average 26% lower than median
(±) | linearity of bass is average (10.4% delta to prev. frequency)
Mids 400 - 2000 Hz
(±) | higher mids - on average 10.2% higher than median
(±) | linearity of mids is average (8% delta to prev. frequency)
Highs 2 - 16 kHz
(±) | higher highs - on average 5.1% higher than median
(+) | highs are linear (5.5% delta to prev. frequency)
Overall 100 - 16.000 Hz
(±) | linearity of overall sound is average (22.5% difference to median)
Compared to same class
» 80% of all tested devices in this class were better, 5% similar, 15% worse
» The best had a delta of 6%, average was 18%, worst was 132%
Compared to all devices tested
» 64% of all tested devices were better, 6% similar, 30% worse
» The best had a delta of 4%, average was 24%, worst was 134%
Razer Blade 15 Advanced (Mid 2021) audio analysis
(+) | speakers can play relatively loud (84.6 dB)
Bass 100 - 315 Hz
(-) | nearly no bass - on average 20.1% lower than median
(±) | linearity of bass is average (12.8% delta to prev. frequency)
Mids 400 - 2000 Hz
(+) | balanced mids - only 3.6% away from median
(+) | mids are linear (4.1% delta to prev. frequency)
Highs 2 - 16 kHz
(+) | balanced highs - only 4.9% away from median
(±) | linearity of highs is average (8.3% delta to prev. frequency)
Overall 100 - 16.000 Hz
(±) | linearity of overall sound is average (15.8% difference to median)
Compared to same class
» 36% of all tested devices in this class were better, 7% similar, 57% worse
» The best had a delta of 6%, average was 18%, worst was 132%
Compared to all devices tested
» 23% of all tested devices were better, 5% similar, 72% worse
» The best had a delta of 4%, average was 24%, worst was 134%
Energy Management - Schenker 15 with decent battery life
Energy Consumption
The Schenker model's power consumption is nothing out of the ordinary. It matches our expectations for the installed hardware. At the beginning of our stress test, the power draw spikes to 218 watts and then quickly drops to around 165 watts. During our Witcher 3 test we observed an average consumption of 186 watts. Since we did not encounter battery drain during this, the included charger appears to be sufficient (rated for 180 watts).
| Off / Standby | |
| Idle | |
| Load |
|
Key:
min: | |
| SCHENKER XMG Pro 15 (Late 2021) i7-11800H, GeForce RTX 3080 Laptop GPU | Lenovo Legion S7 15ACH6 82K80030GE R9 5900HX, GeForce RTX 3060 Laptop GPU | Alienware x15 RTX 3070 P111F i7-11800H, GeForce RTX 3070 Laptop GPU | Razer Blade 15 Advanced (Mid 2021) i7-11800H, GeForce RTX 3080 Laptop GPU | SCHENKER XMG Pro 15 (Early 2021, RTX 3080) i7-10870H, GeForce RTX 3080 Laptop GPU | MSI Delta 15 A5EFK R9 5900HX, Radeon RX 6700M | Average NVIDIA GeForce RTX 3080 Laptop GPU | Average of class Gaming | |
|---|---|---|---|---|---|---|---|---|
| Power Consumption | 18% | -0% | -8% | 21% | 12% | -10% | 1% | |
| Idle Minimum * (Watt) | 20 | 13 35% | 15.7 21% | 19.5 2% | 8 60% | 10 50% | 19.8 ? 1% | 14.3 ? 28% |
| Idle Average * (Watt) | 22 | 16 27% | 20.3 8% | 23.3 -6% | 13 41% | 18 18% | 24.3 ? -10% | 20.4 ? 7% |
| Idle Maximum * (Watt) | 26 | 23 12% | 43 -65% | 40.1 -54% | 22 15% | 25 4% | 33.3 ? -28% | 27.4 ? -5% |
| Load Average * (Watt) | 103 | 95 8% | 94.4 8% | 98.9 4% | 97 6% | 101 2% | 108.1 ? -5% | 110.4 ? -7% |
| Witcher 3 ultra * (Watt) | 186 | 156 16% | 167 10% | 174 6% | 179 4% | 187 -1% | ||
| Load Maximum * (Watt) | 218 | 191 12% | 183.4 16% | 214 2% | 225 -3% | 217 -0% | 230 ? -6% | 262 ? -20% |
* ... smaller is better
Energy Consumption Witcher 3 / Stress Test
Energy Consumption external Monitor
Battery Life
The 15.6-inch laptop reaches runtimes of 5:14 h and 6:32 h in our Wi-Fi (accessing web pages periodically via a script) and video (short film Big Buck Bunny in a loop, H.264 codec, FHD) tests. For both tests, we disabled all energy saving mechanisms of the notebook and set the display's brightness to about 150 cd/m². For the video test, we also disabled the wireless modules.

Pros
Cons
| SCHENKER XMG Pro 15 (Late 2021) i7-11800H, GeForce RTX 3080 Laptop GPU, 73 Wh | Lenovo Legion S7 15ACH6 82K80030GE R9 5900HX, GeForce RTX 3060 Laptop GPU, 71 Wh | Alienware x15 RTX 3070 P111F i7-11800H, GeForce RTX 3070 Laptop GPU, 87 Wh | Razer Blade 15 Advanced (Mid 2021) i7-11800H, GeForce RTX 3080 Laptop GPU, 80 Wh | SCHENKER XMG Pro 15 (Early 2021, RTX 3080) i7-10870H, GeForce RTX 3080 Laptop GPU, 73 Wh | MSI Delta 15 A5EFK R9 5900HX, Radeon RX 6700M, 82 Wh | Average of class Gaming | |
|---|---|---|---|---|---|---|---|
| Battery Runtime | 19% | -7% | 13% | 6% | 27% | 12% | |
| Reader / Idle (h) | 10.6 | 14 32% | 9.7 -8% | 8.4 -21% | 11.1 5% | 9.71 ? -8% | |
| H.264 (h) | 6.5 | 7.5 15% | 5.5 -15% | 7.77 ? 20% | |||
| WiFi v1.3 (h) | 5.2 | 7 35% | 6.1 17% | 5.9 13% | 7.2 38% | 7.9 52% | 6.51 ? 25% |
| Load (h) | 1.3 | 1.2 -8% | 0.9 -31% | 1.6 23% | 1.6 23% | 1.431 ? 10% |
Verdict - The Schenker XMG Pro 15 is a well-constructed, compact Gaming Notebook
The gaming performance of this slim laptop matches the average of an RTX 3080 device. Here, the relatively low TGP of 105 watts becomes apparent. While at FHD, most games can be played at maximum quality settings, running them at the native display resolution (4K) tends to require lowering the quality settings.
PCIe 4, Thunderbolt 4, OLED - The Schenker XMG Pro 15 (late 2021) comes with the latest technologies.
The Core i7-11800H CPU and GeForce RTX 3080 mobile GPU consistently perform well. Under load, the laptop heats up considerably and generates a lot of noise. The silent power profile reduces the noise level at the cost of some performance.
There is space for two M.2-2280 SSDs (1x PCIe 4.0, 1x PCIe 3.0/SATA) and RAID 0/1 support. Our test device is equipped with a blazing-fast PCIe-4 SSD (1 TB). While its real-world Wi-Fi runtime of around 5 to 7 hours is nothing to write home about, it would be unreasonable to expect much more out of a gaming laptop with a 4K screen. Unfortunately, the battery cannot be recharged via the integrated Thunderbolt 4 port.
The OLED screen (3840 x 2160 pixels) is the stand-out feature of the Pro 15. It offers a high maximum brightness, excellent contrast, great viewing angles, short response times, good color accuracy and a wide color gamut. Unfortunately, the screen is reflective. Furthermore, we observed PWM flickering.
An alternative to the XMG Pro is the Razer Blade 15 Advanced. It is even more compact and offers two Thunderbolt 4 ports. Although its battery capacity is greater and it "only" comes with an FHD panel, its battery life does not meaningfully exceed that of our Schenker laptop. Meanwhile, the Lenovo Legion S7 15ACH6 (2000 Euros or ~$2250). While its 3D performance is significantly slower, it shines with a brighter, matte 4K IPS screen, better battery runtimes and a three-year warranty. The biggest weakness is its single, soldered RAM module.
Price and Availability
The Schenker XMG Pro 15 (late 2021) can be configured through the Schenker online shop. Our configuration can be purchased for around 3000 Euros (~$3400). The base model starts at around 2200 Euros (~$2500).
SCHENKER XMG Pro 15 (Late 2021)
- 01/19/2022 v7 (old)
Sascha Mölck
More articles related to this device
SCHENKER XMG Pro 15 (Late 2021) (XMG Pro 15 Series)Related Articles


Price comparison

