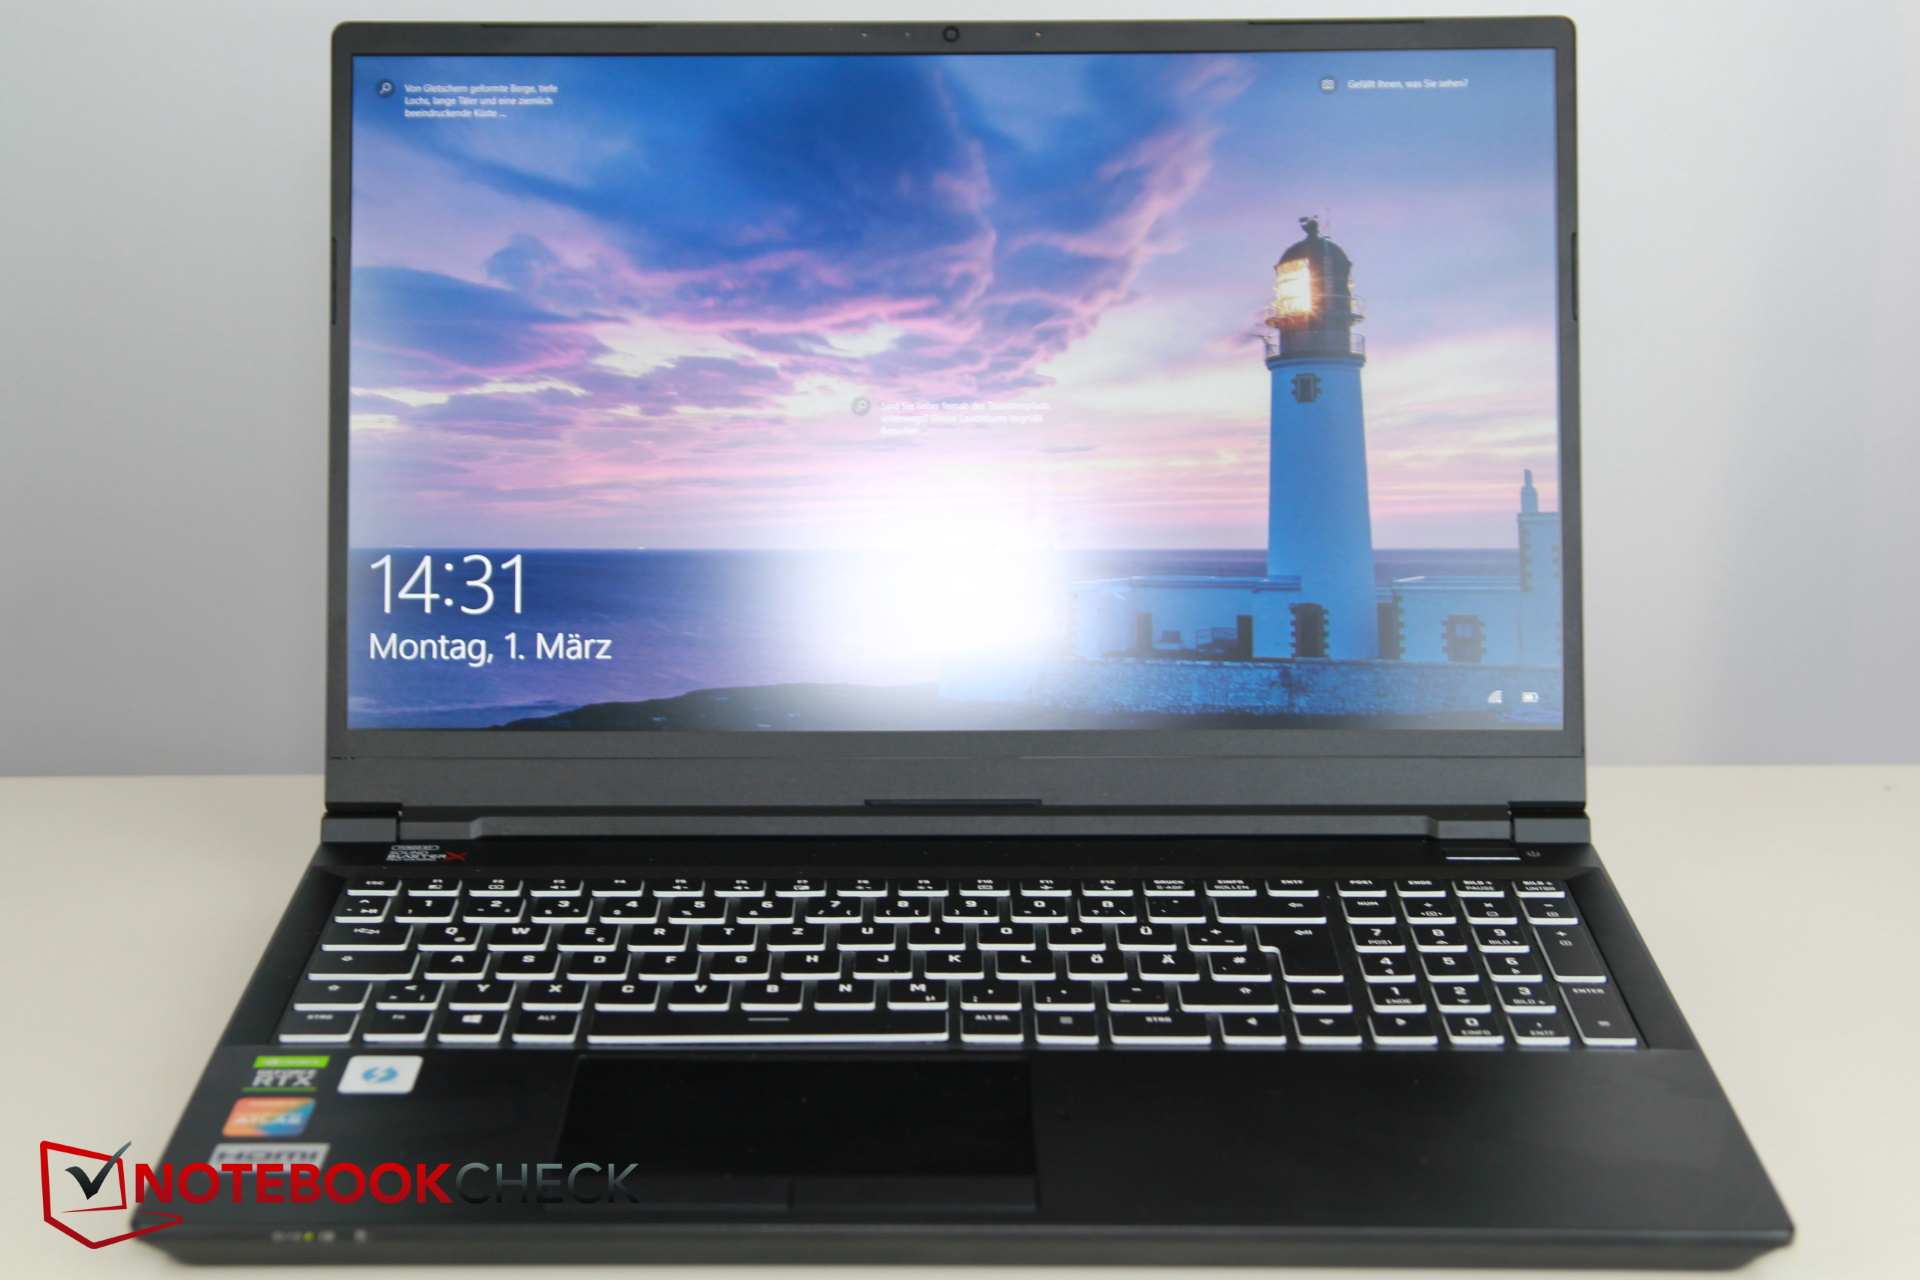
Schenker XMG Pro 15 (Clevo PC50DS) with RTX 3080 in Review: Ultra-Thin and Lightweight High-End All-Rounder
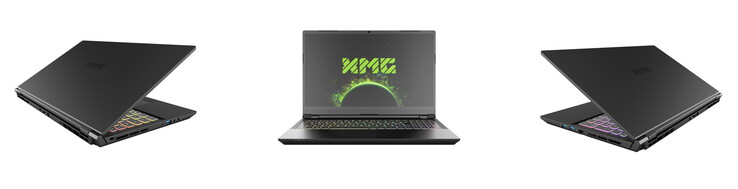
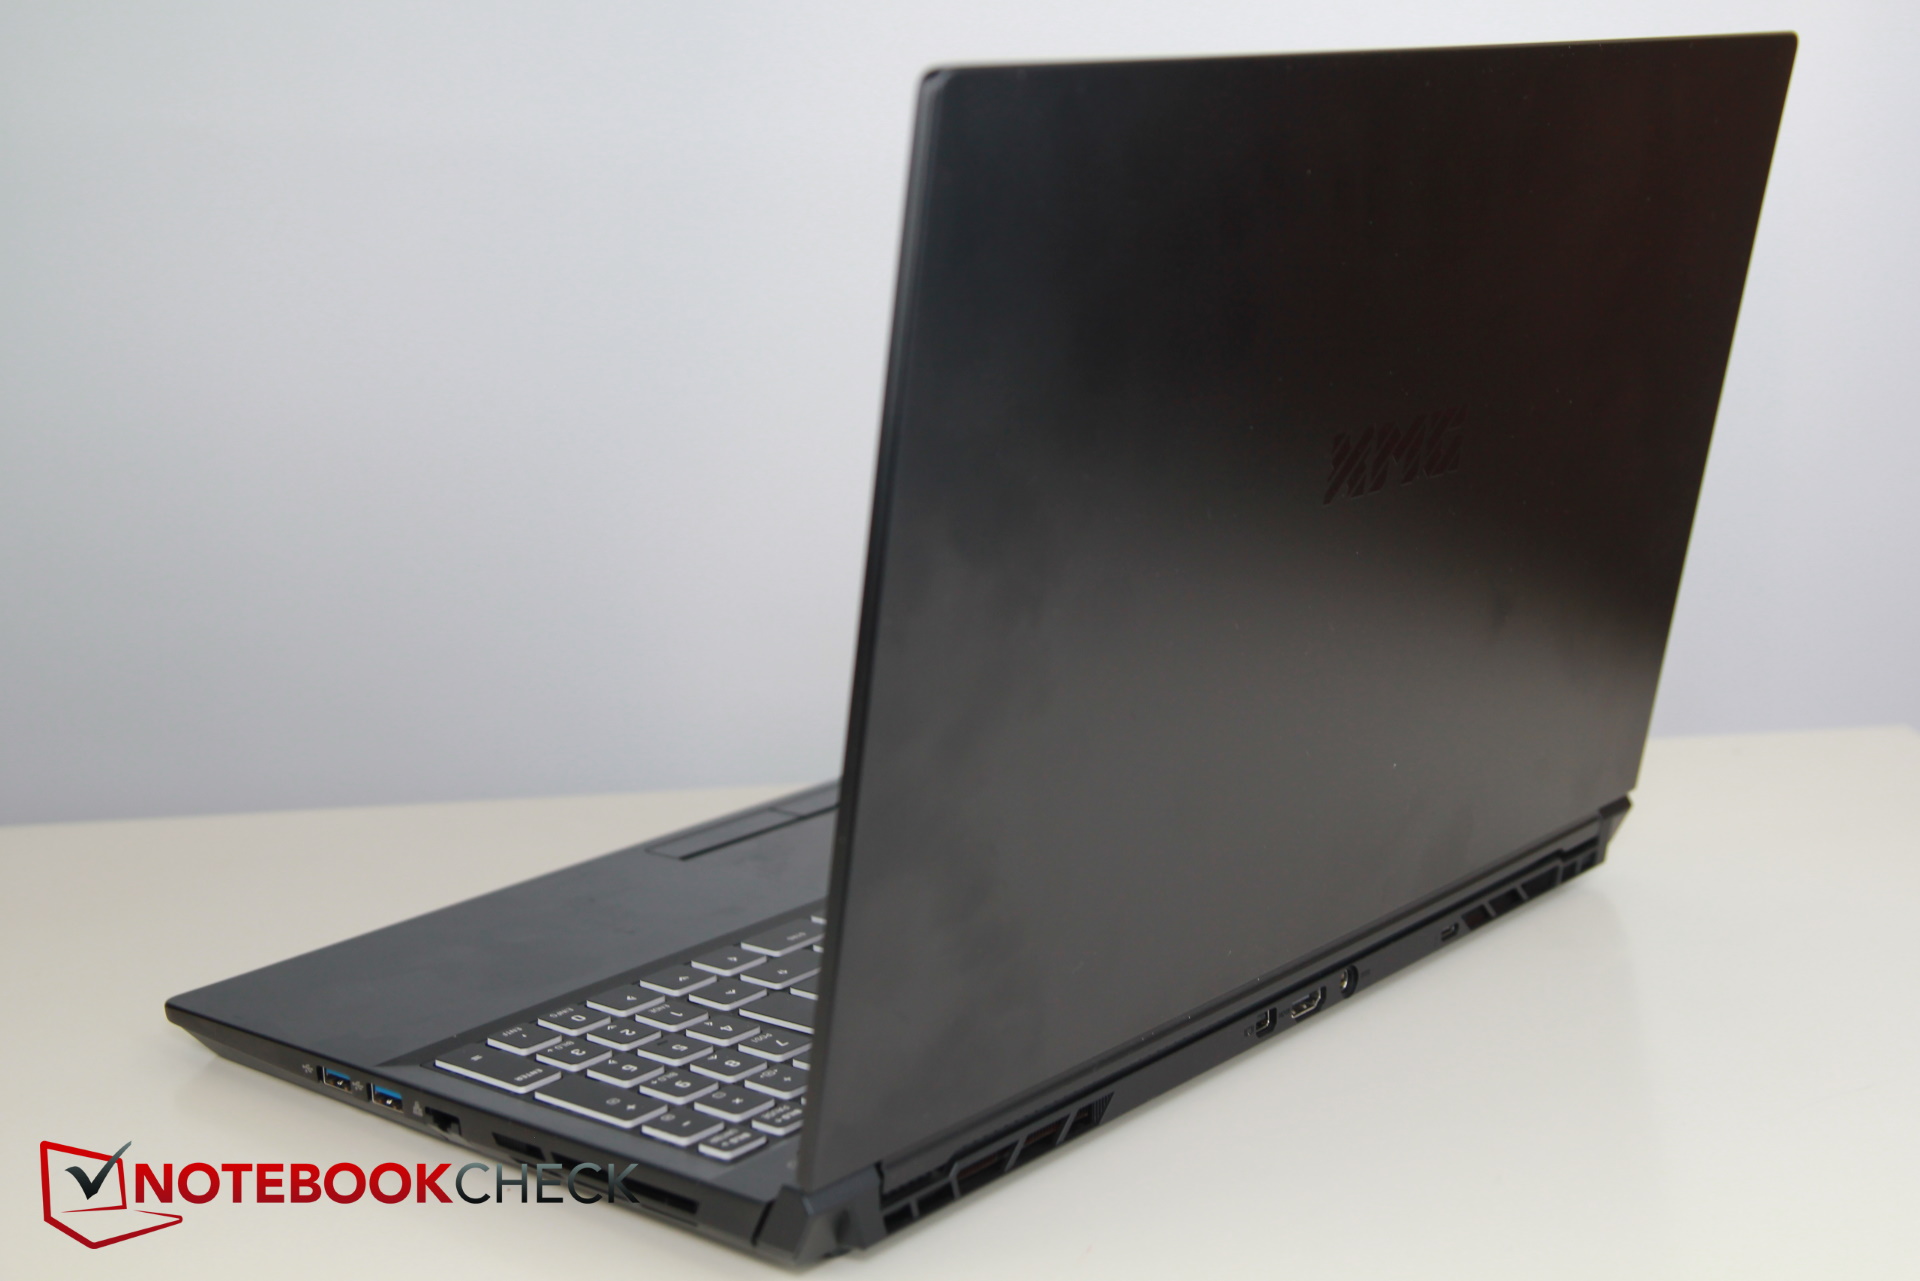
Compared to last year’s Pro 15, the new XMG Pro 15 is a completely different device and much more akin to a refresh of Schenker’s Key 15, Schenker’s blueprint for the Intel-based Pro 15 and the AMD-based Neo 15. Its highlight is the upgrade to Nvidia’s brand-new RTX 3080 generation of GPUs, and the Schenker logo on the lid has been replaced with an XMG logo.
Schenker’s own webstore, bestware.com, allows for a very detailed individualization with the only fixed component being the processor. While our review unit came equipped with an RTX 3080 over the Key 15’s RTX 2080 Super Max-Q you can also select an RTX 3070 instead. Please note that our review unit also came without a valid Windows license. While the operating system was preloaded on the device it will need to be activated with a valid key and license. Schenker will sell you an optional Windows 10 Home license for an additional 100 Euros.
According to the OEM, the Pro 15 is not only a highly portable gaming laptop but also a smart workstation for creative professionals. In other words, a true jack of all trades instead of a pure-bred gaming device.
Our comparison group for this thin performance behemoth consists of its own predecessor, similarly equipped laptops, and laptops with previous generation RTX GPUs.
Potential Competitors in Comparison
Rating | Date | Model | Weight | Height | Size | Resolution | Price |
|---|---|---|---|---|---|---|---|
| 86 % v7 (old) | 03 / 2021 | Schenker XMG Pro 15 (Early 2021, RTX 3080) i7-10870H, GeForce RTX 3080 Laptop GPU | 2 kg | 19.8 mm | 15.60" | 1920x1080 | |
| 84.5 % v7 (old) | 09 / 2020 | Schenker Key 15 Comet Lake i7-10875H, GeForce RTX 2080 Super Max-Q | 2 kg | 19.8 mm | 15.60" | 1920x1080 | |
| 83.3 % v7 (old) | 02 / 2020 | Schenker XMG Pro 15 i7-9750H, GeForce RTX 2070 Mobile | 2.5 kg | 30 mm | 15.60" | 1920x1080 | |
| 83.8 % v7 (old) | 02 / 2021 | Asus ROG Zephyrus G15 GA503Q R9 5900HS, GeForce RTX 3080 Laptop GPU | 2 kg | 20 mm | 15.60" | 2560x1440 | |
| 86.6 % v7 (old) | 02 / 2021 | Asus ROG Zephyrus Duo 15 SE GX551QS R9 5900HX, GeForce RTX 3080 Laptop GPU | 2.5 kg | 20.9 mm | 15.60" | 3840x2160 | |
| 87.8 % v7 (old) | 02 / 2021 | Razer Blade Pro 17 2021 (QHD Touch) i7-10875H, GeForce RTX 3080 Laptop GPU | 3 kg | 19.9 mm | 17.30" | 3840x2160 |
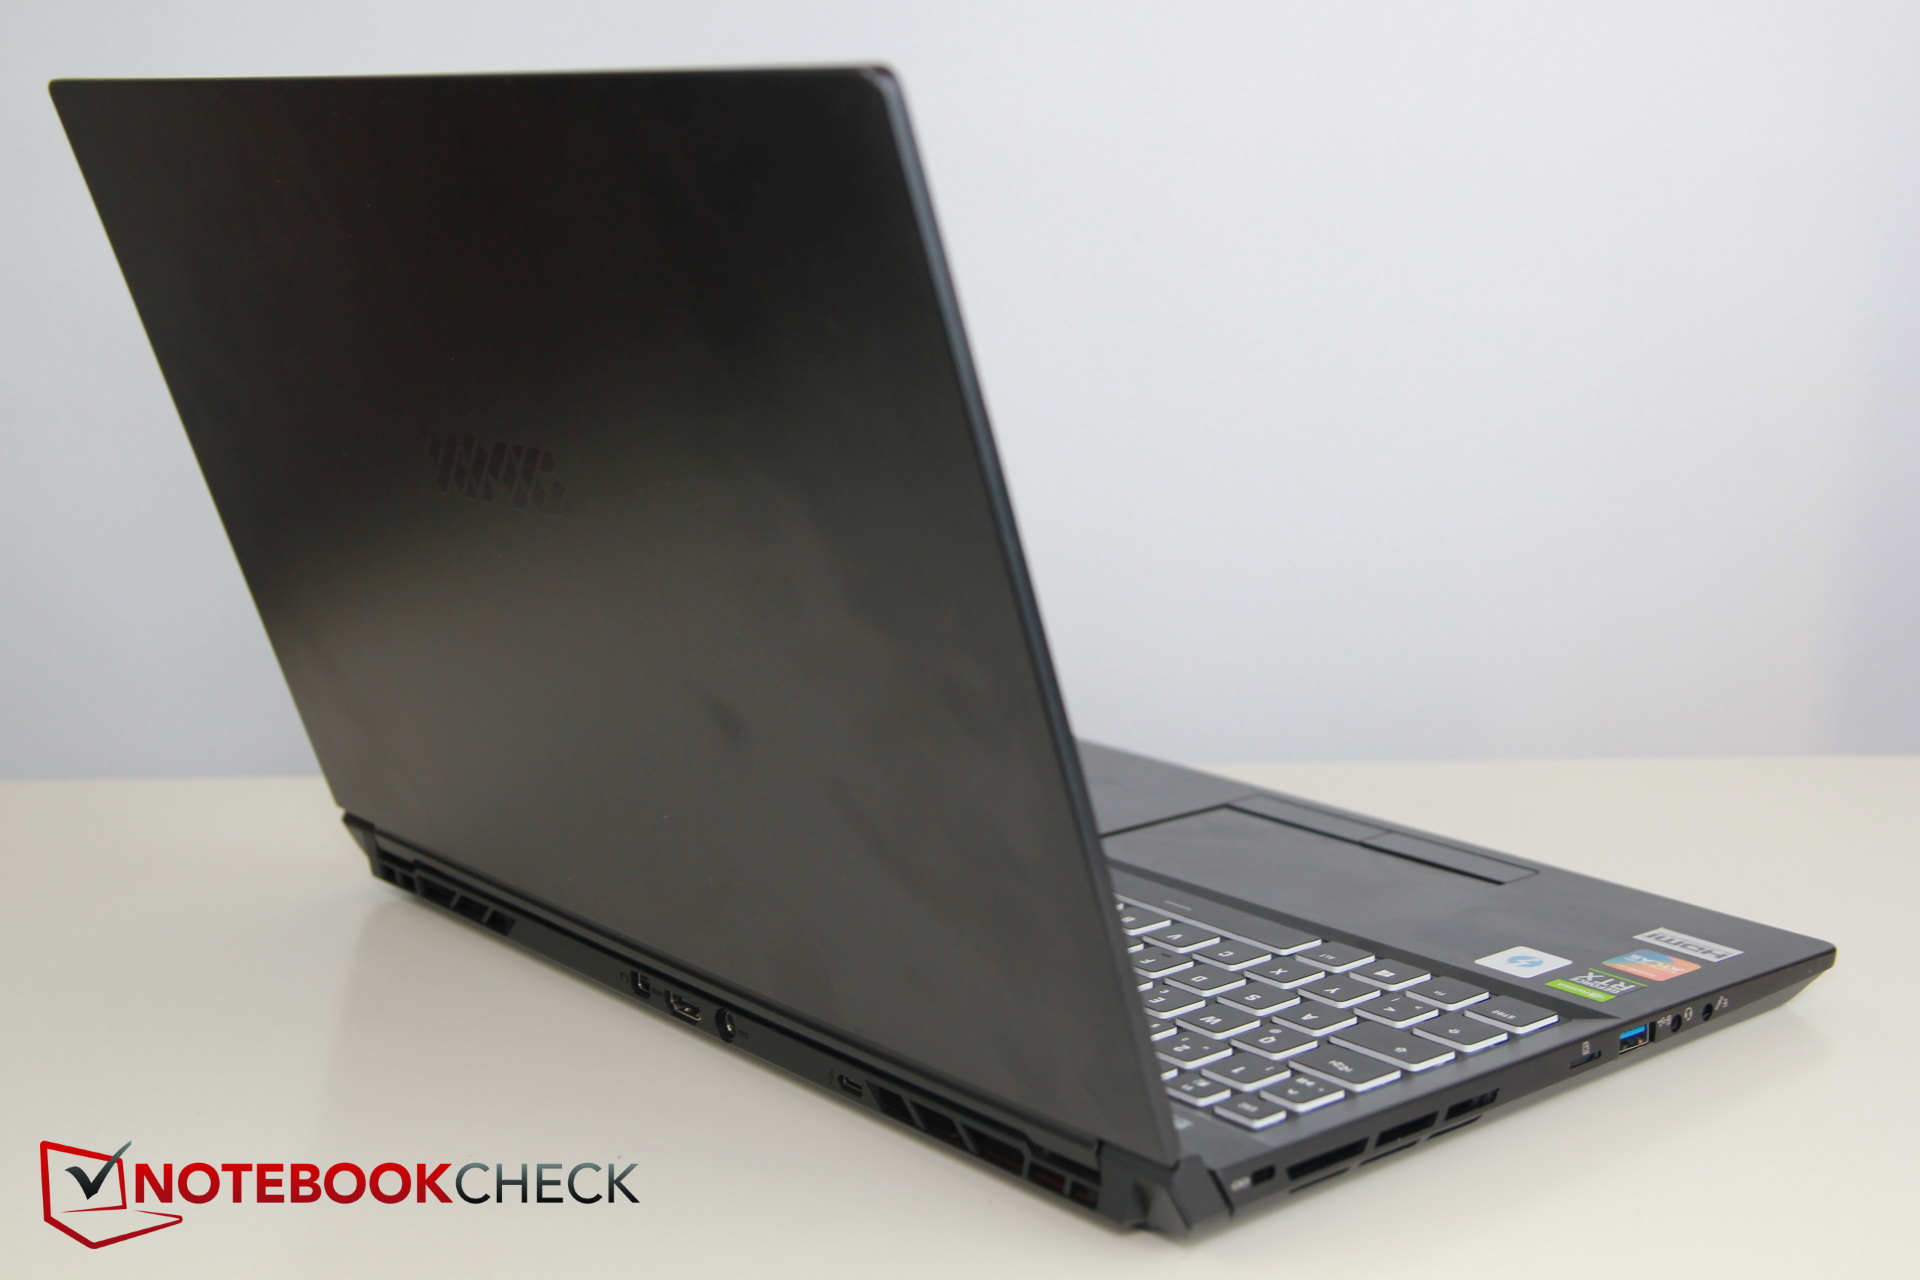
Case – Thin and Light despite the Use of Metal
The case makes no attempts of hiding its Key15 lineage. Visually, the Clevo PC50DS is identical to the Key 15’s Clevo PC50DN2. Compared to last year’s much bulkier Pro 15 it is aimed at a much broader audience and thus lacks the usual bling-bling that OEMs use to attract gamers. As a result, the new model would not look out of place in an office environment. The case consists of dark aluminum, save for the display bezels, and is surprisingly lightweight considering its powerful internal hardware.
Thanks to its metal build it is comparatively sturdy. However, due to the thinness of the aluminum used you can still twist and warp it slightly. As expected, the display lid is not as sturdy and stiff as the base, and we would have wished for stronger hinges as well.
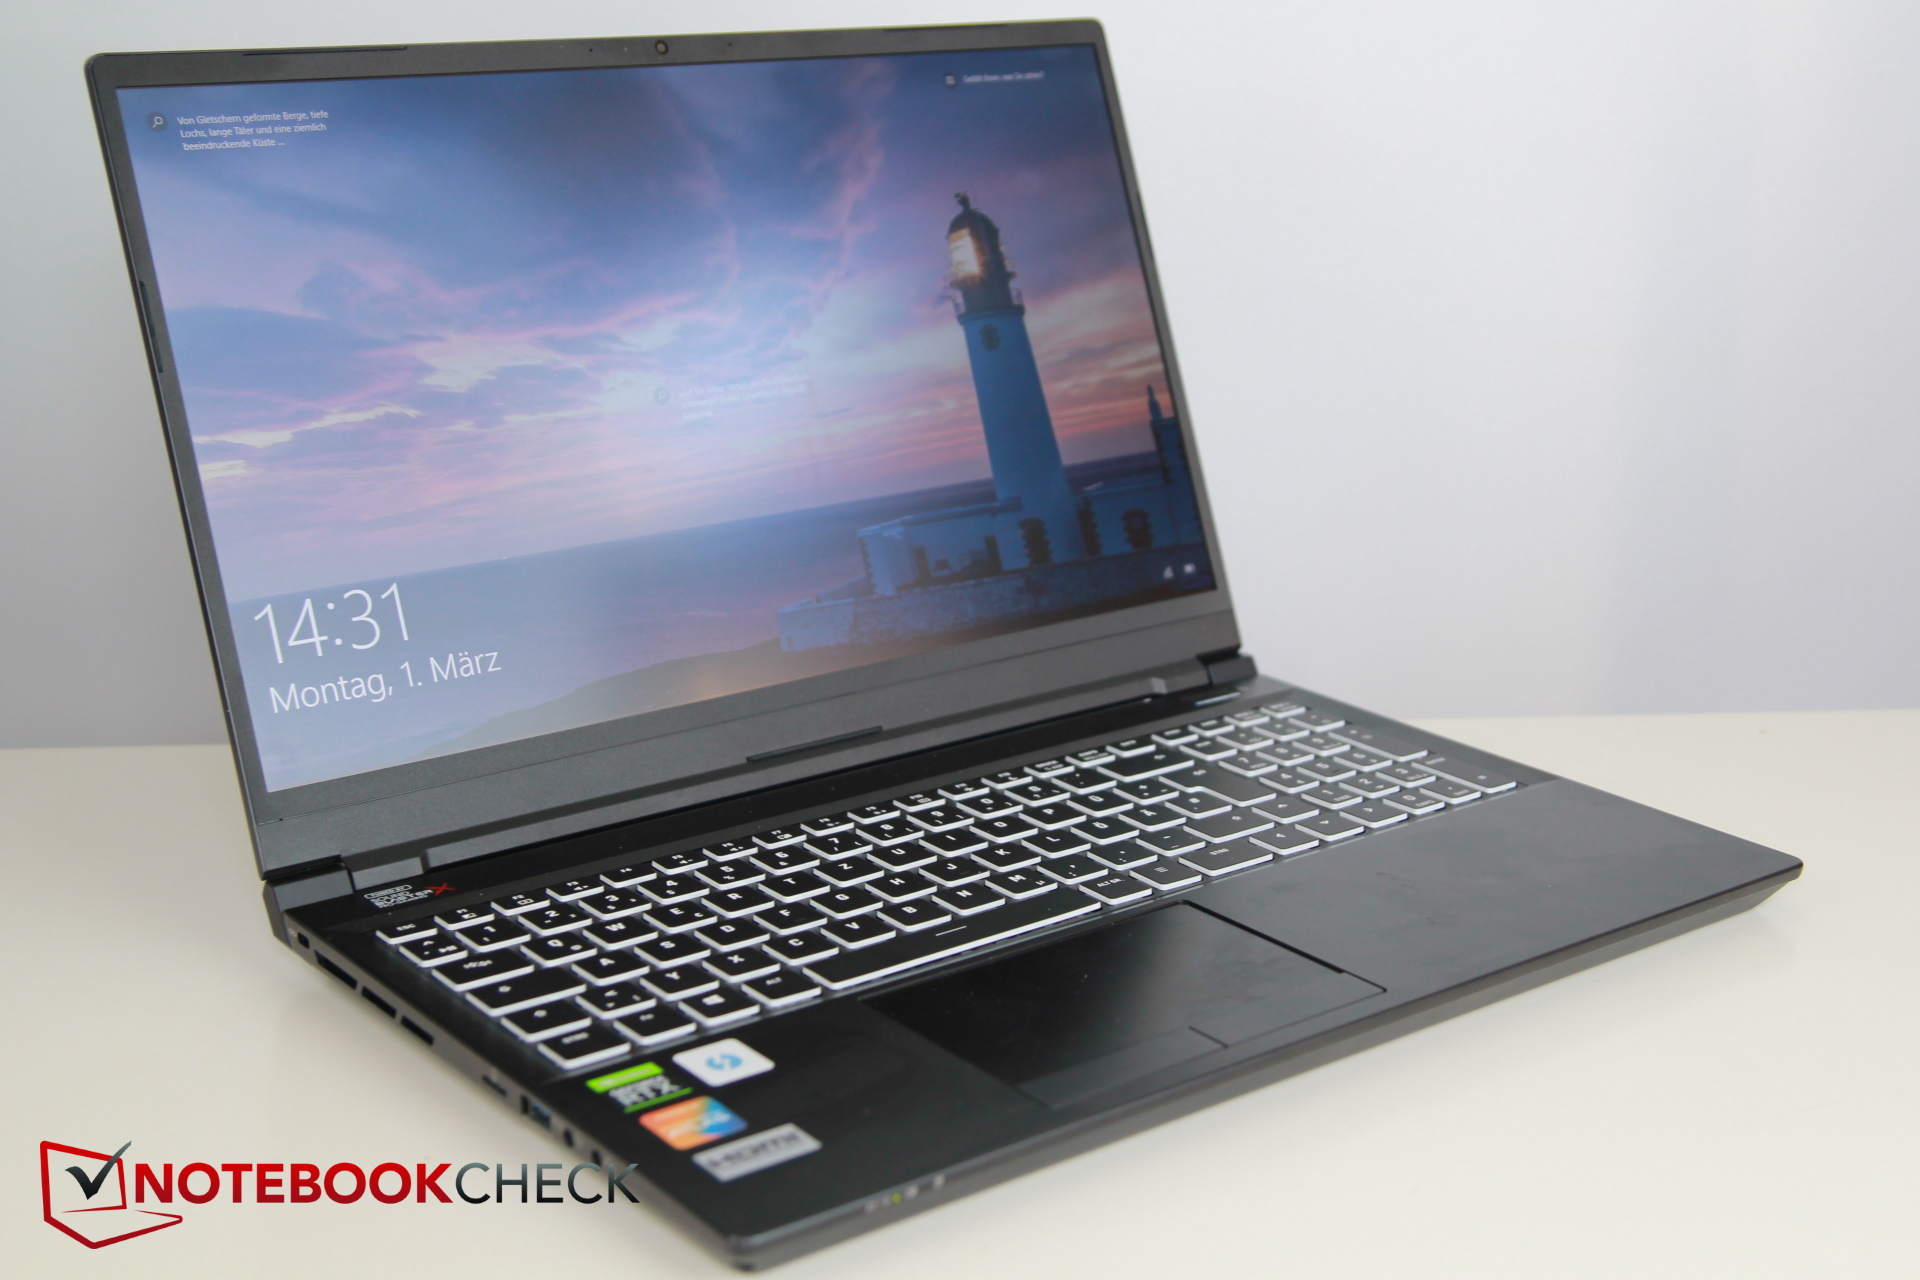
The Pro 15’s footprint and weight are identical to the Key 15. The previous model was around 500 g (1.1 lbs.) heavier and around 1 cm (0.4 inches) thicker and 2 cm (0.8 inches) deeper. The only competitor capable of keeping up in specs, size, and weight is the Asus ROG Zephyrus G15.
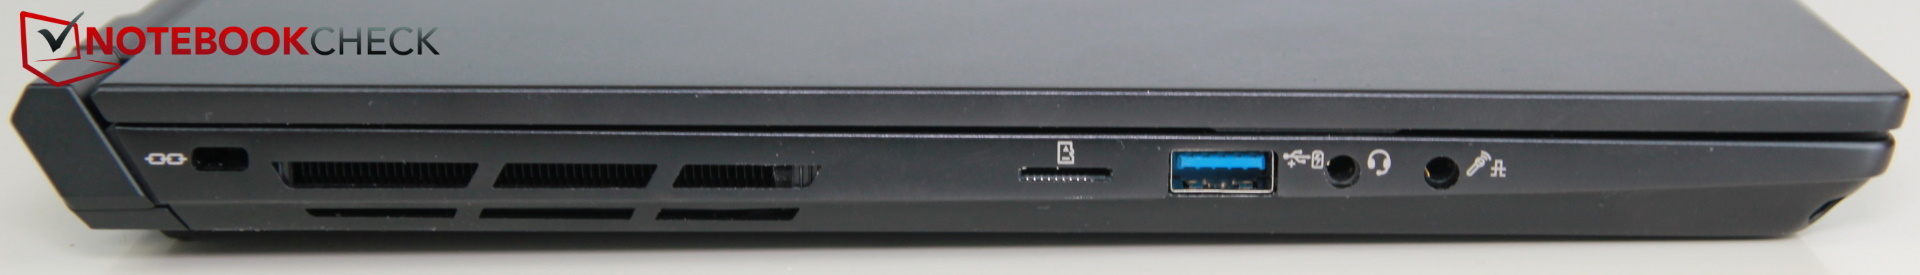
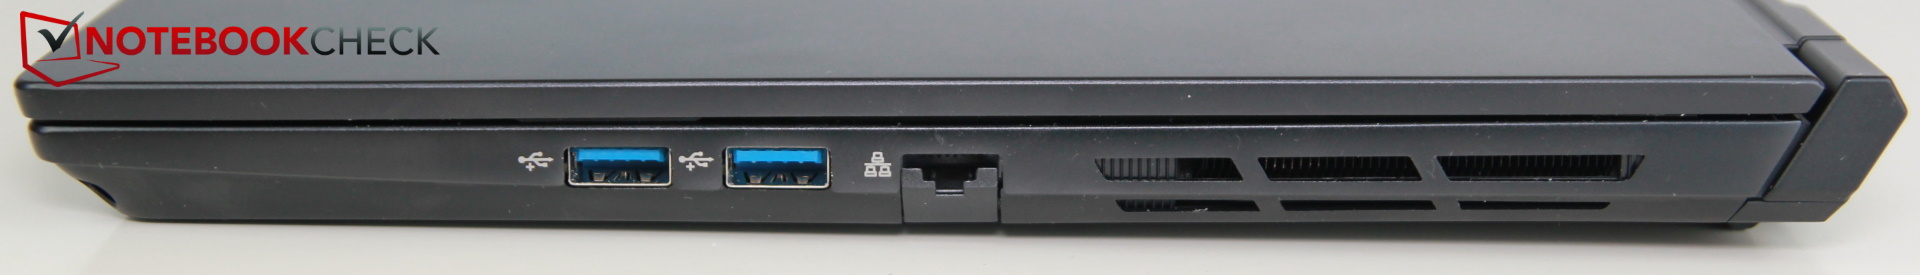
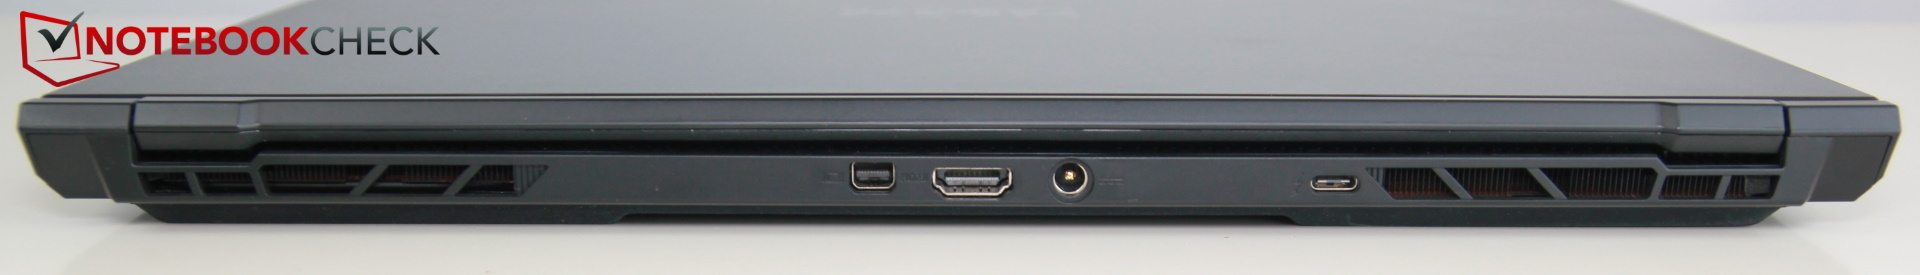
Connectivity – microSD and Thunderbolt 3
Unfortunately, the laptop’s card reader can only take microSD cards. Other ports include four USB ports, HDMI 2.1, miniDP, LAN, and two audio jacks.
Just like on its spiritual predecessor these ports are not only located on the sides but also the rear, which is a big plus as it frees up space on the sides by relocating the often quite beefy display cables to the rear. With that said we would have preferred for the frequently used USB-C port to be located on one of the sides instead.

Communication
Intel’s AX201 provides the device with Wi-Fi 6 and Bluetooth 5.1 capabilities. Wi-Fi performance turned out to be a double-edged sword. While transmitting data was very fast and the Pro 15 stormed to the top of its comparison group its RX performance was abysmal resulting in last place. With that said its RX performance was still well above the gaming class average. The ethernet port was upgraded to 2.5 Gbps.
Webcam
As before the webcam suffers from very high color deviations and is certainly not one of the device’s highlights. There is no dedicated webcam shutter mechanism.


 GeForce RTX 3080 Laptop GPU, i7-10870H, Samsung SSD 970 EVO Plus 1TB")
 GeForce RTX 3080 Laptop GPU, i7-10870H, Samsung SSD 970 EVO Plus 1TB")
 GeForce RTX 3080 Laptop GPU, i7-10875H, Samsung PM981a MZVLB1T0HBLR")
 GeForce RTX 3080 Laptop GPU, i7-10875H, Samsung PM981a MZVLB1T0HBLR")
Security
Given that Schenker clearly positions the Pro 15 as an alternative for content creators we would have wished for more than just a TPM 2.0 chip and a Kensington port.
Accessories
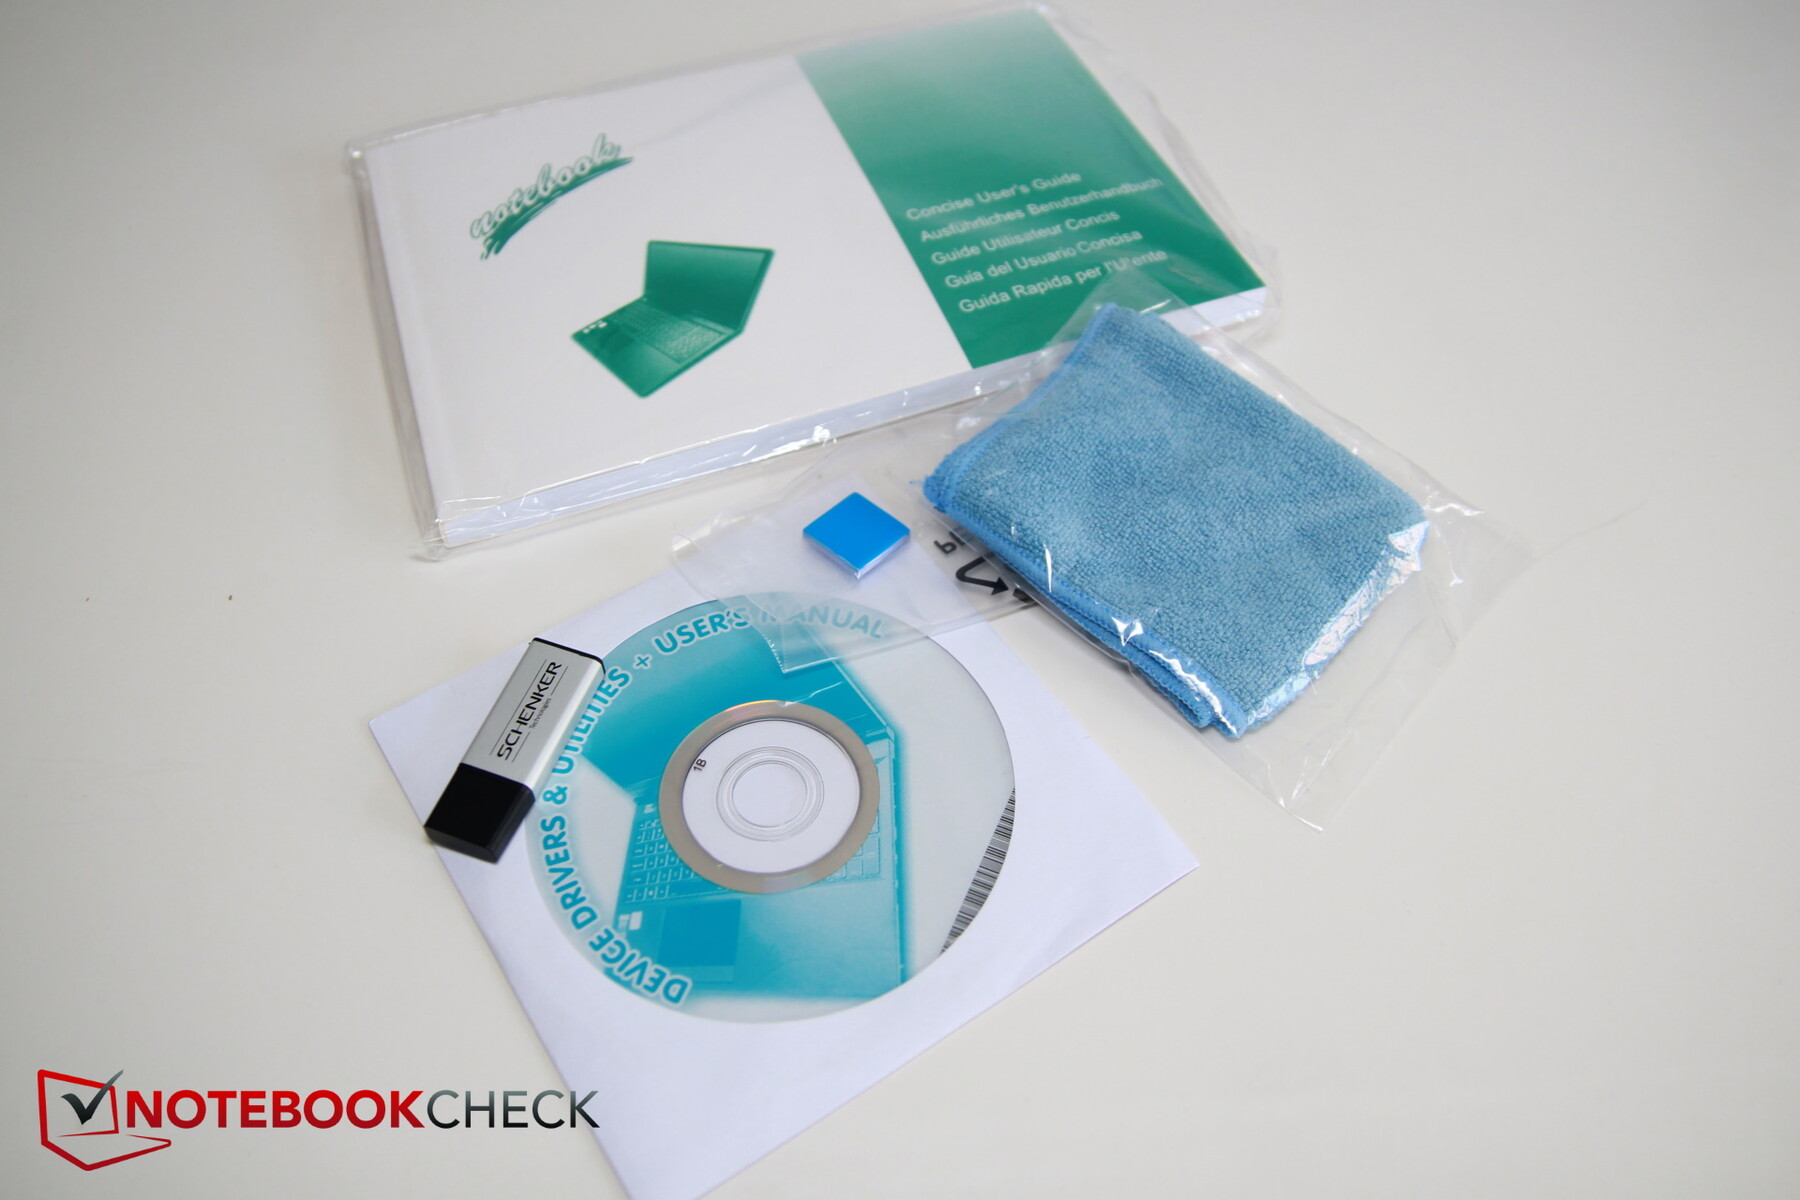
Compared to other OEMs Schenker turned out to be quite generous.
In addition to the device itself and a power supply the box also contains a fairly hefty manual, a driver CD, a thumb drive, a velvet cleaning cloth, and a small thermal conductive pad.
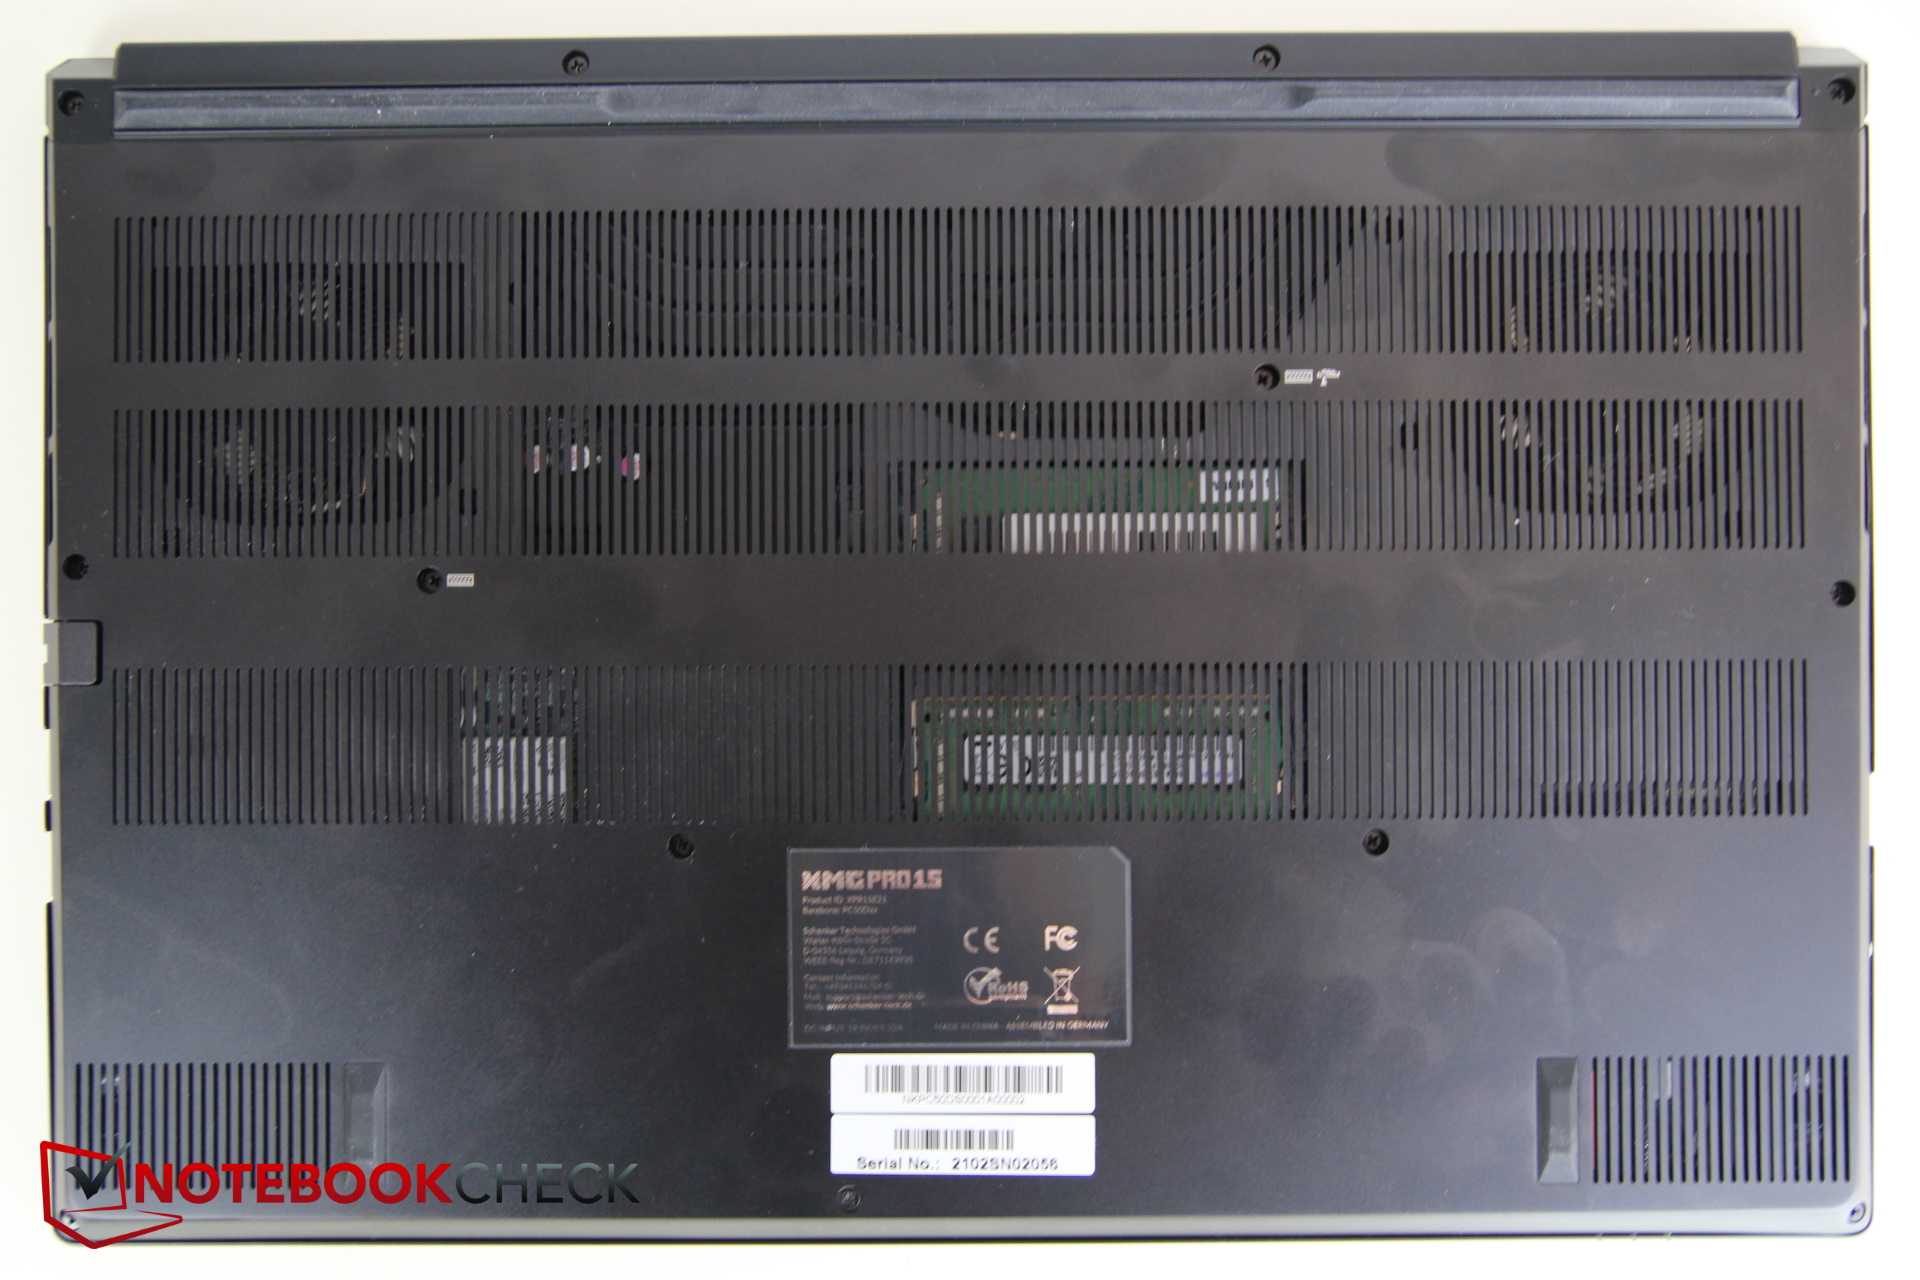
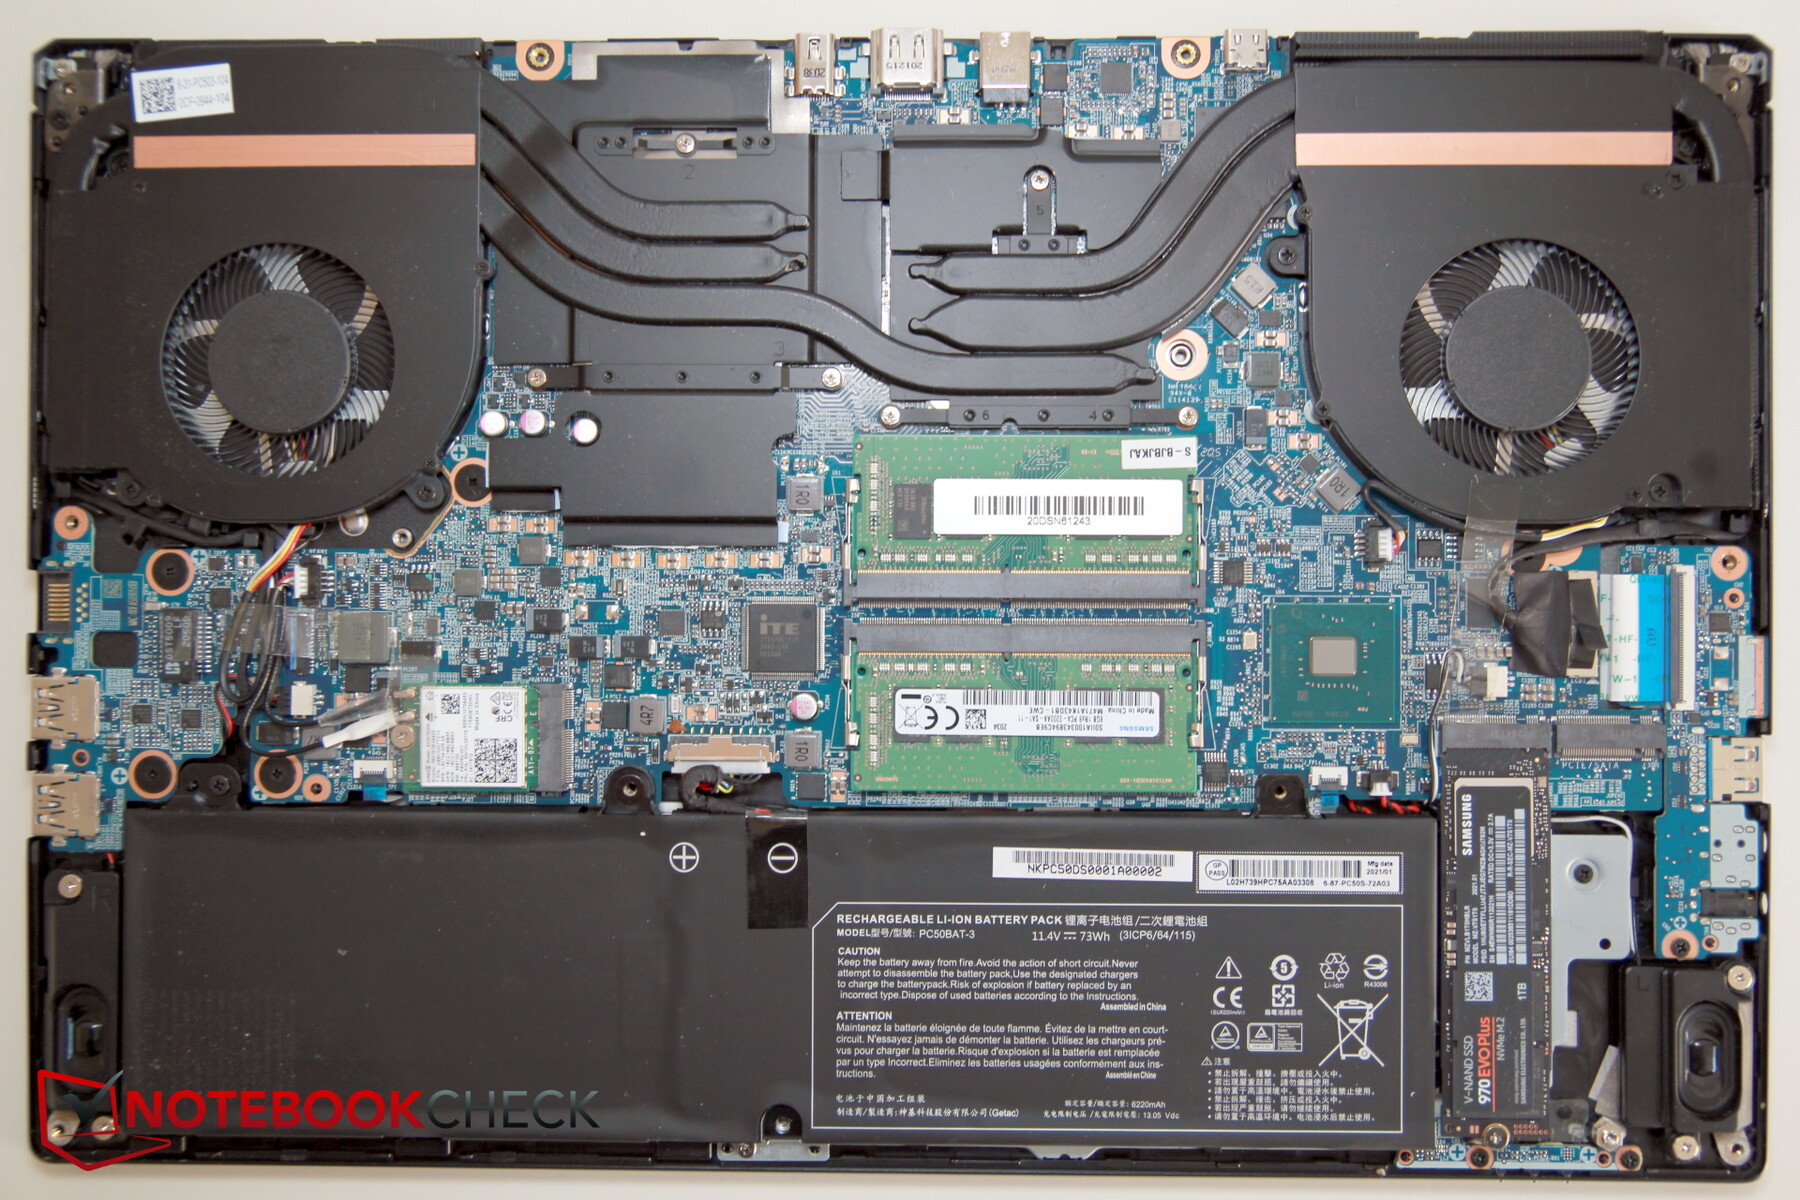
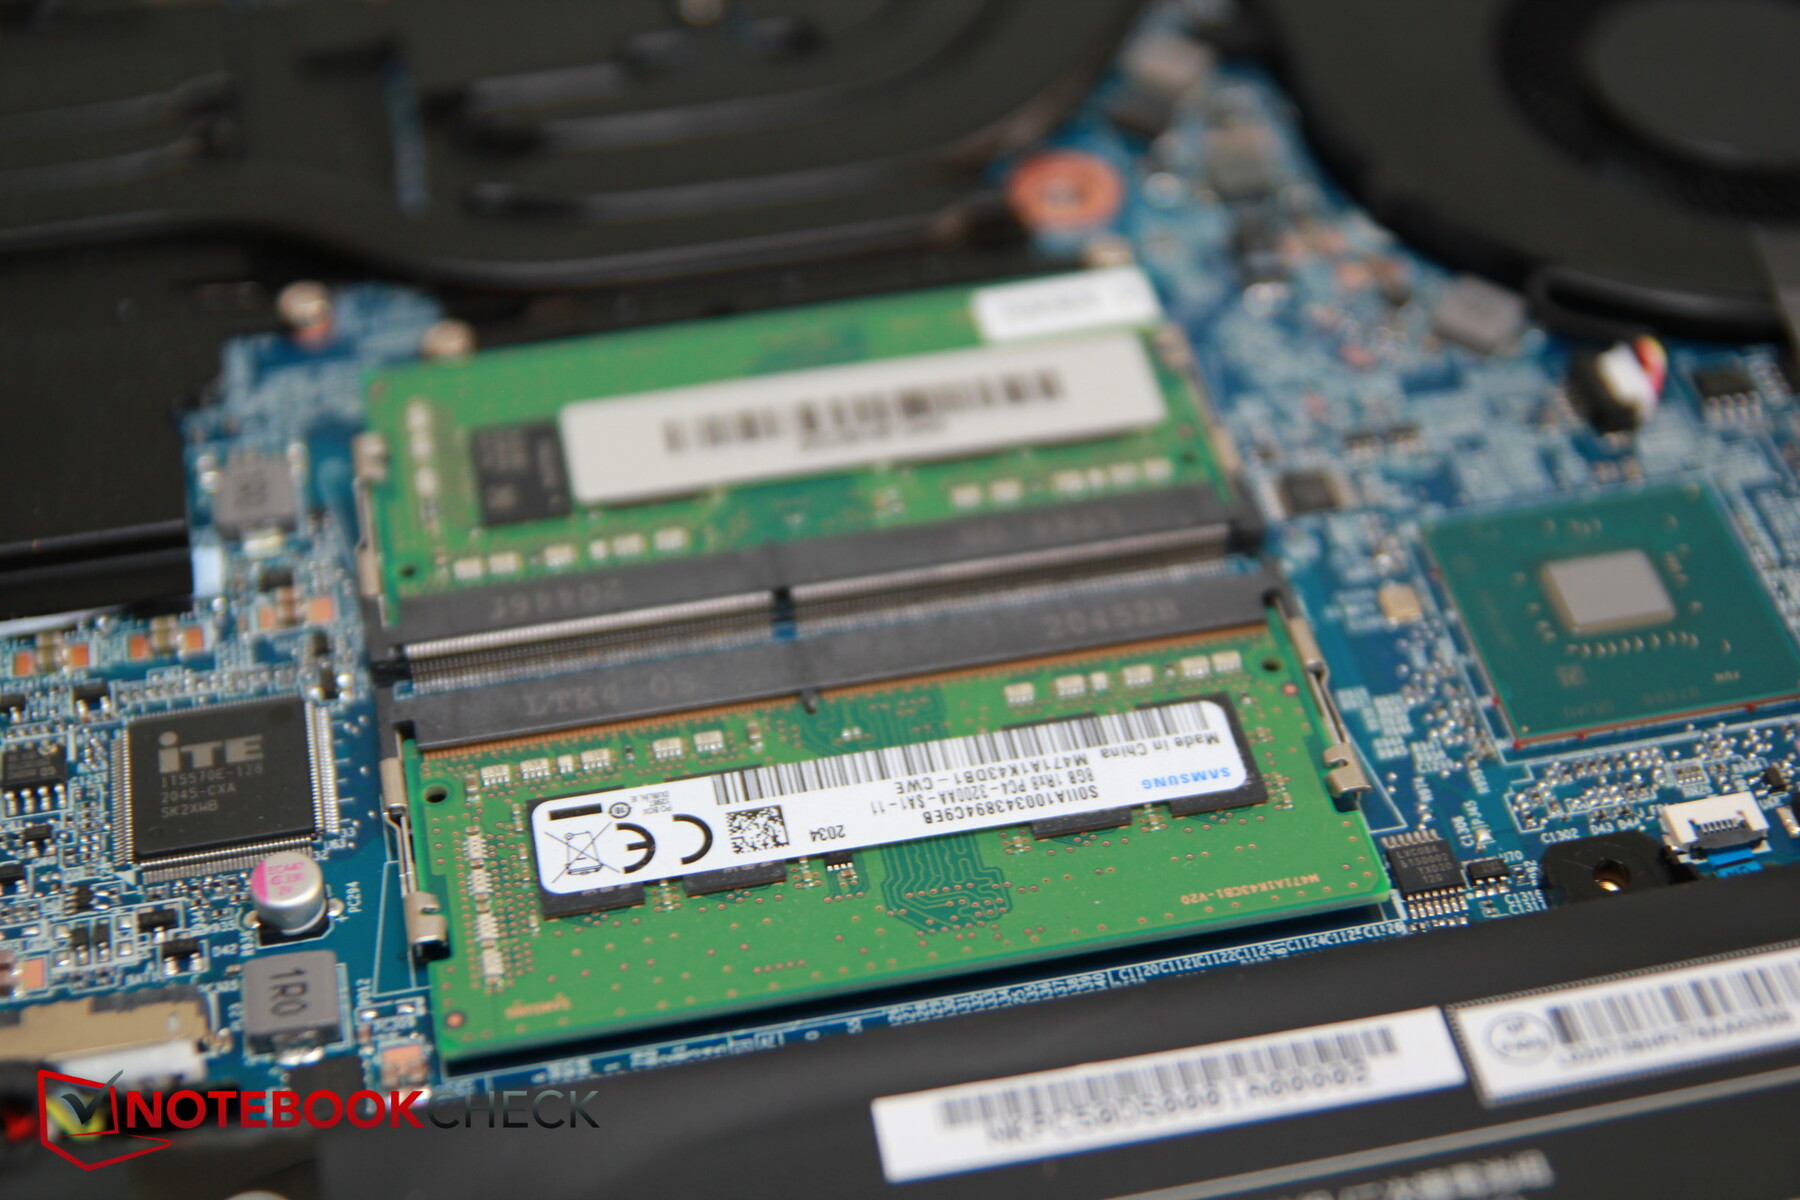
Maintenance
The bottom panel is secured by 13 screws of two differing lengths. Once undone the panel can be removed without additional tools. We found it best to start around the ethernet port or at the front right corner.
Once inside you have access to the RAM, the fans, both SSD slots, the Wi-Fi modem, and the battery. All things considered the Pro 15 is fairly well maintainable.
Warranty
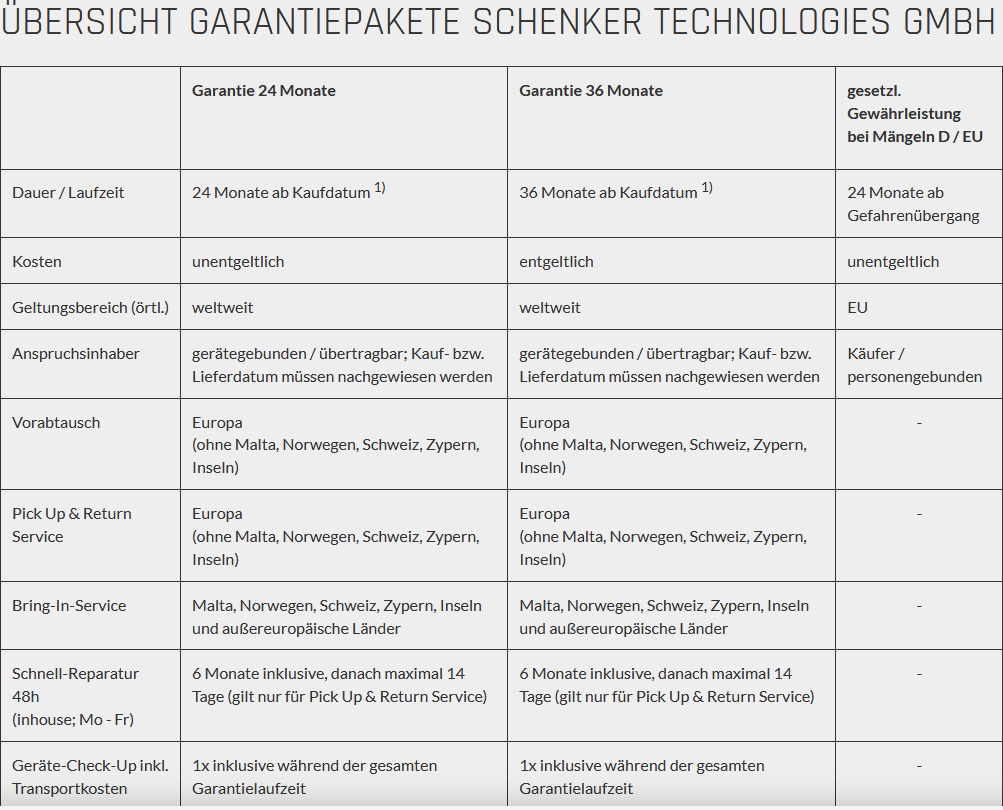
By default, the XMG Pro 15 comes with 24 months of warranty that can be optionally extended to a total of 36 months.
During the first six months, Schenker offers expedited repairs within 48 hours including free shipping and a free system check.
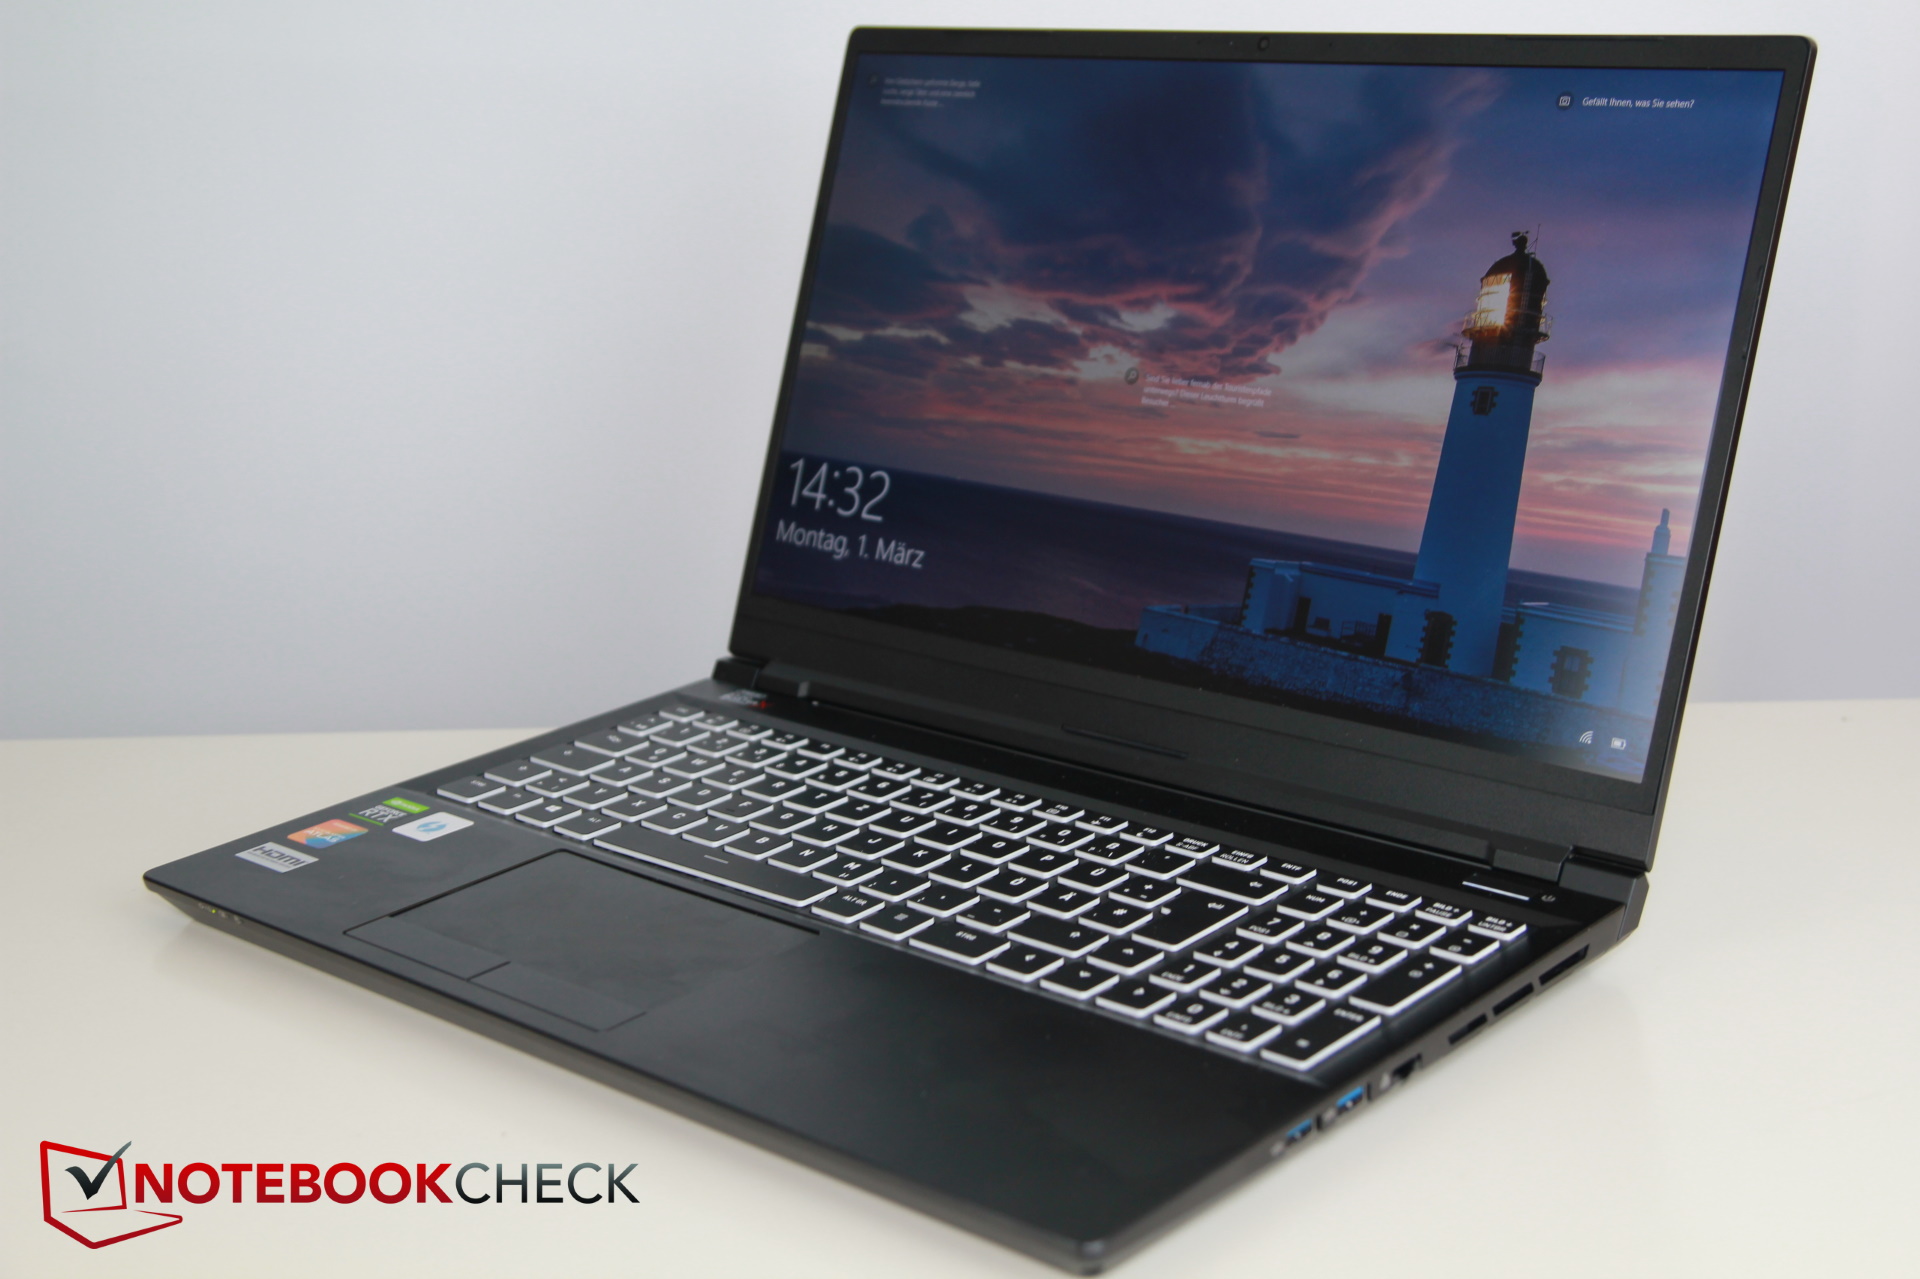
Input Devices – Pro 15 with per-key RGB
Keyboard
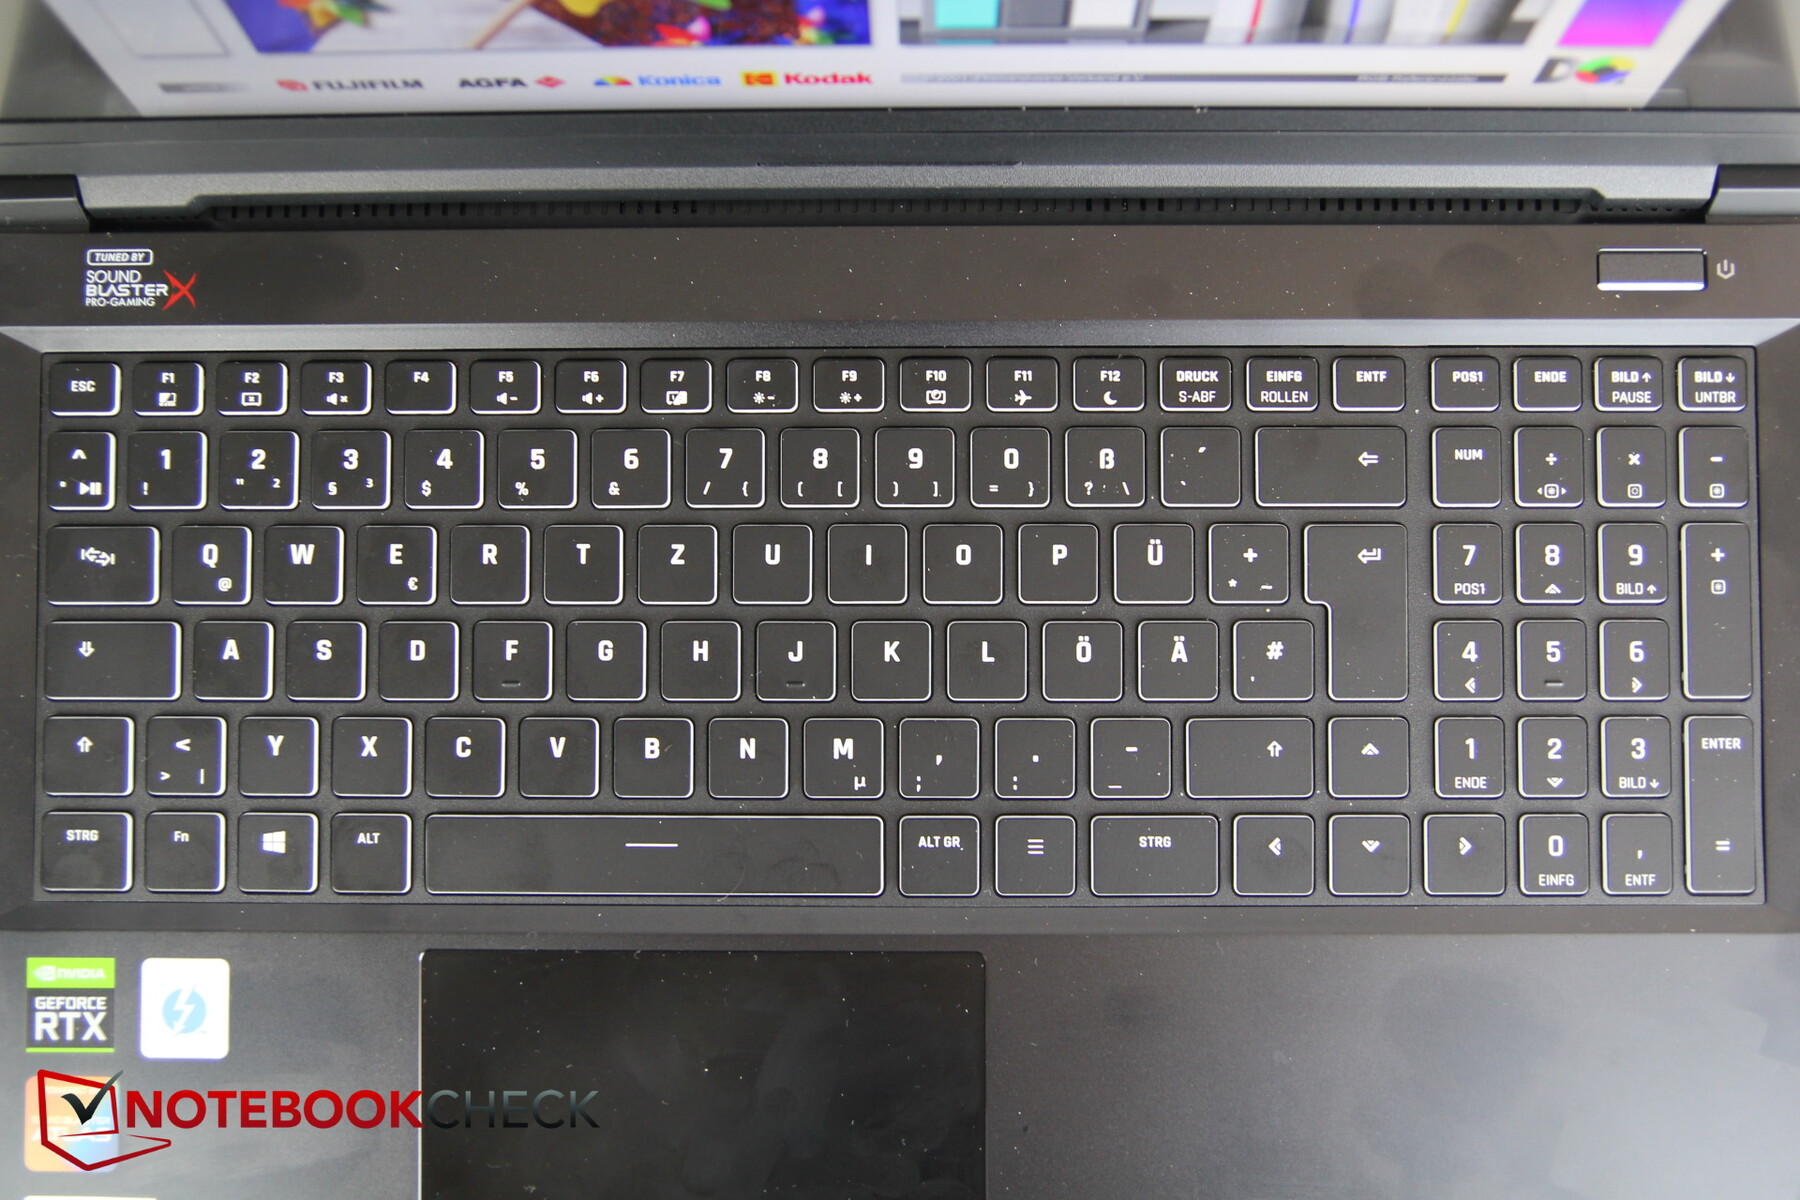
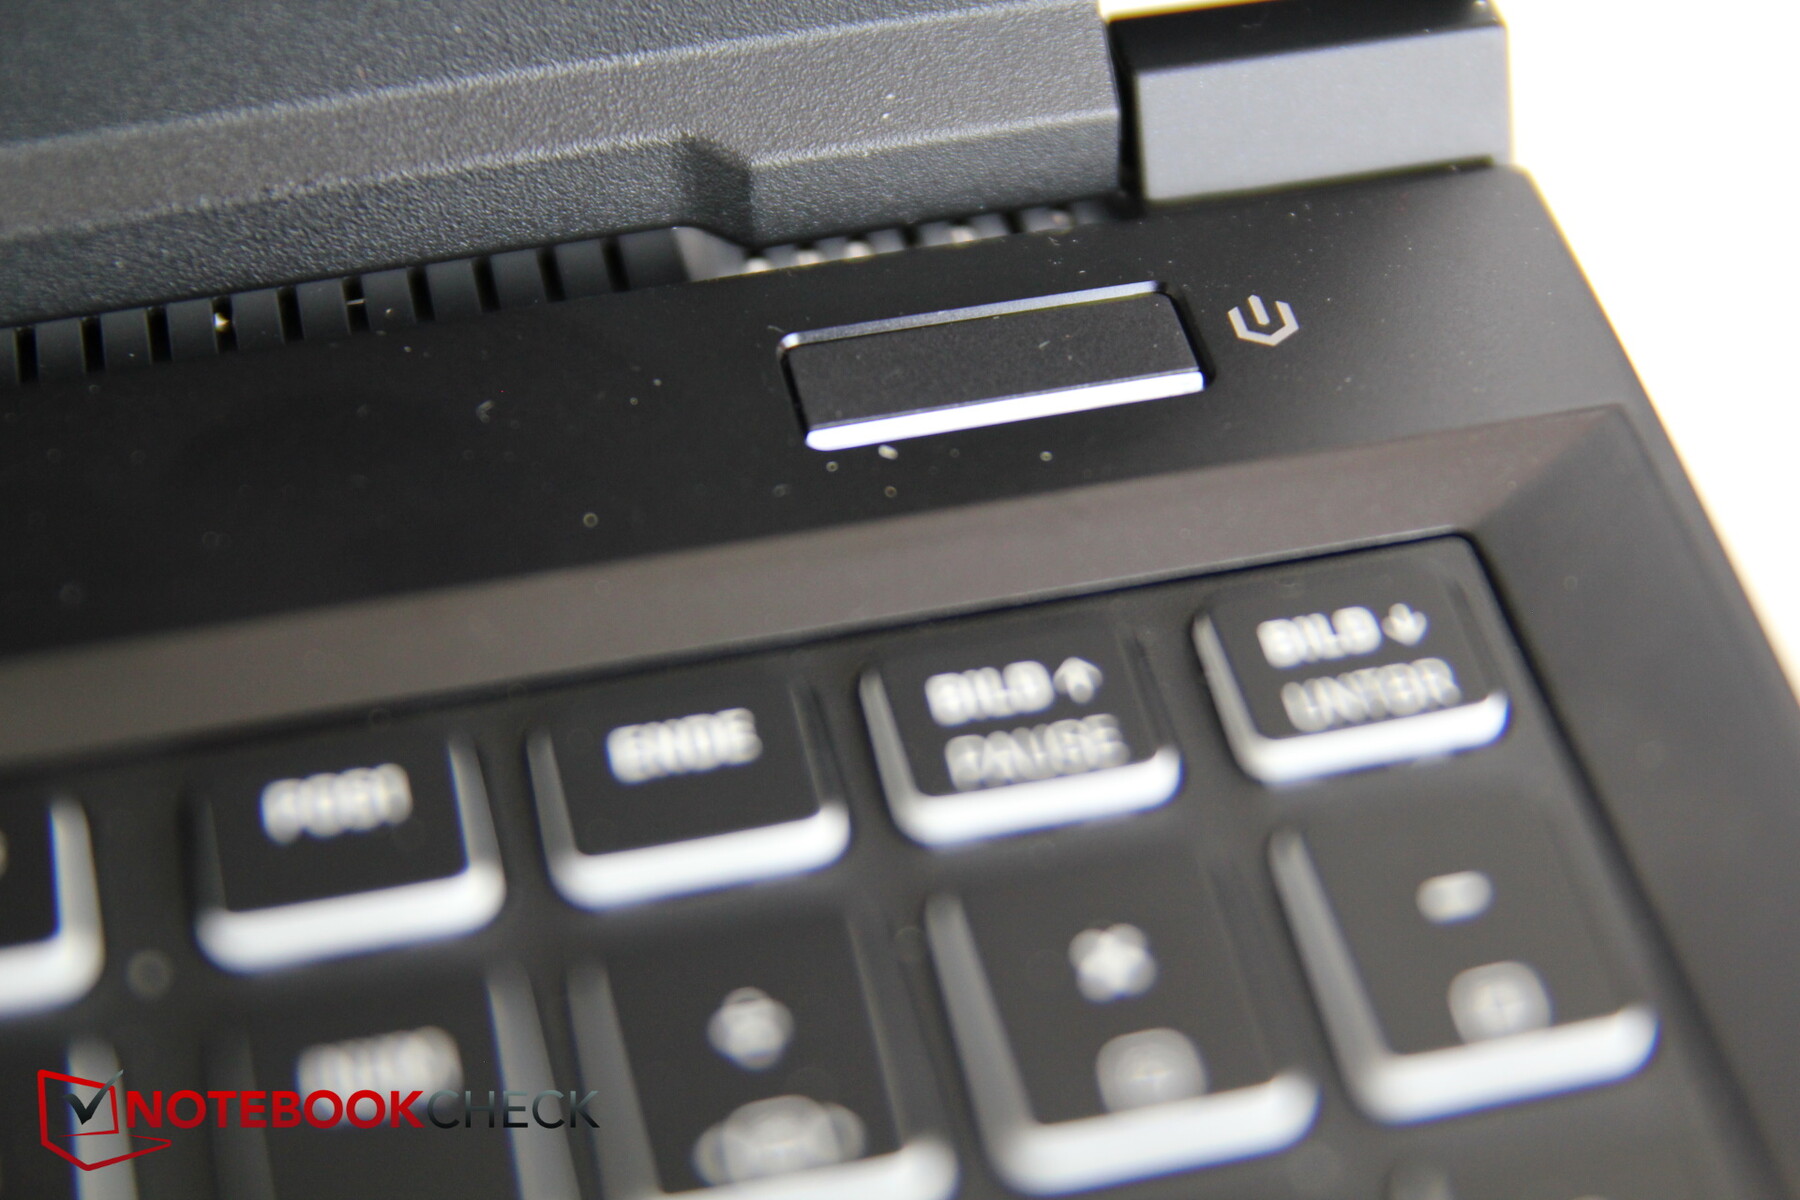
The input devices seem to have been taken straight out of the Pro 15’s predecessor, which is not necessarily a bad thing. The result is a clean layout with regular sized arrow keys and a narrow numpad along the right-hand side. Key travel is decent, feedback is well pronounced, and the overall level of noise and clatter is moderate.
As before, the keyboard tends to flex slightly when used, which did not cause any major issues during everyday use. Its highlight is without a doubt the 4-stage per-key RGB lighting. Macros for single keys as well as key combinations can be defined in the included Control Center software.
Touchpad
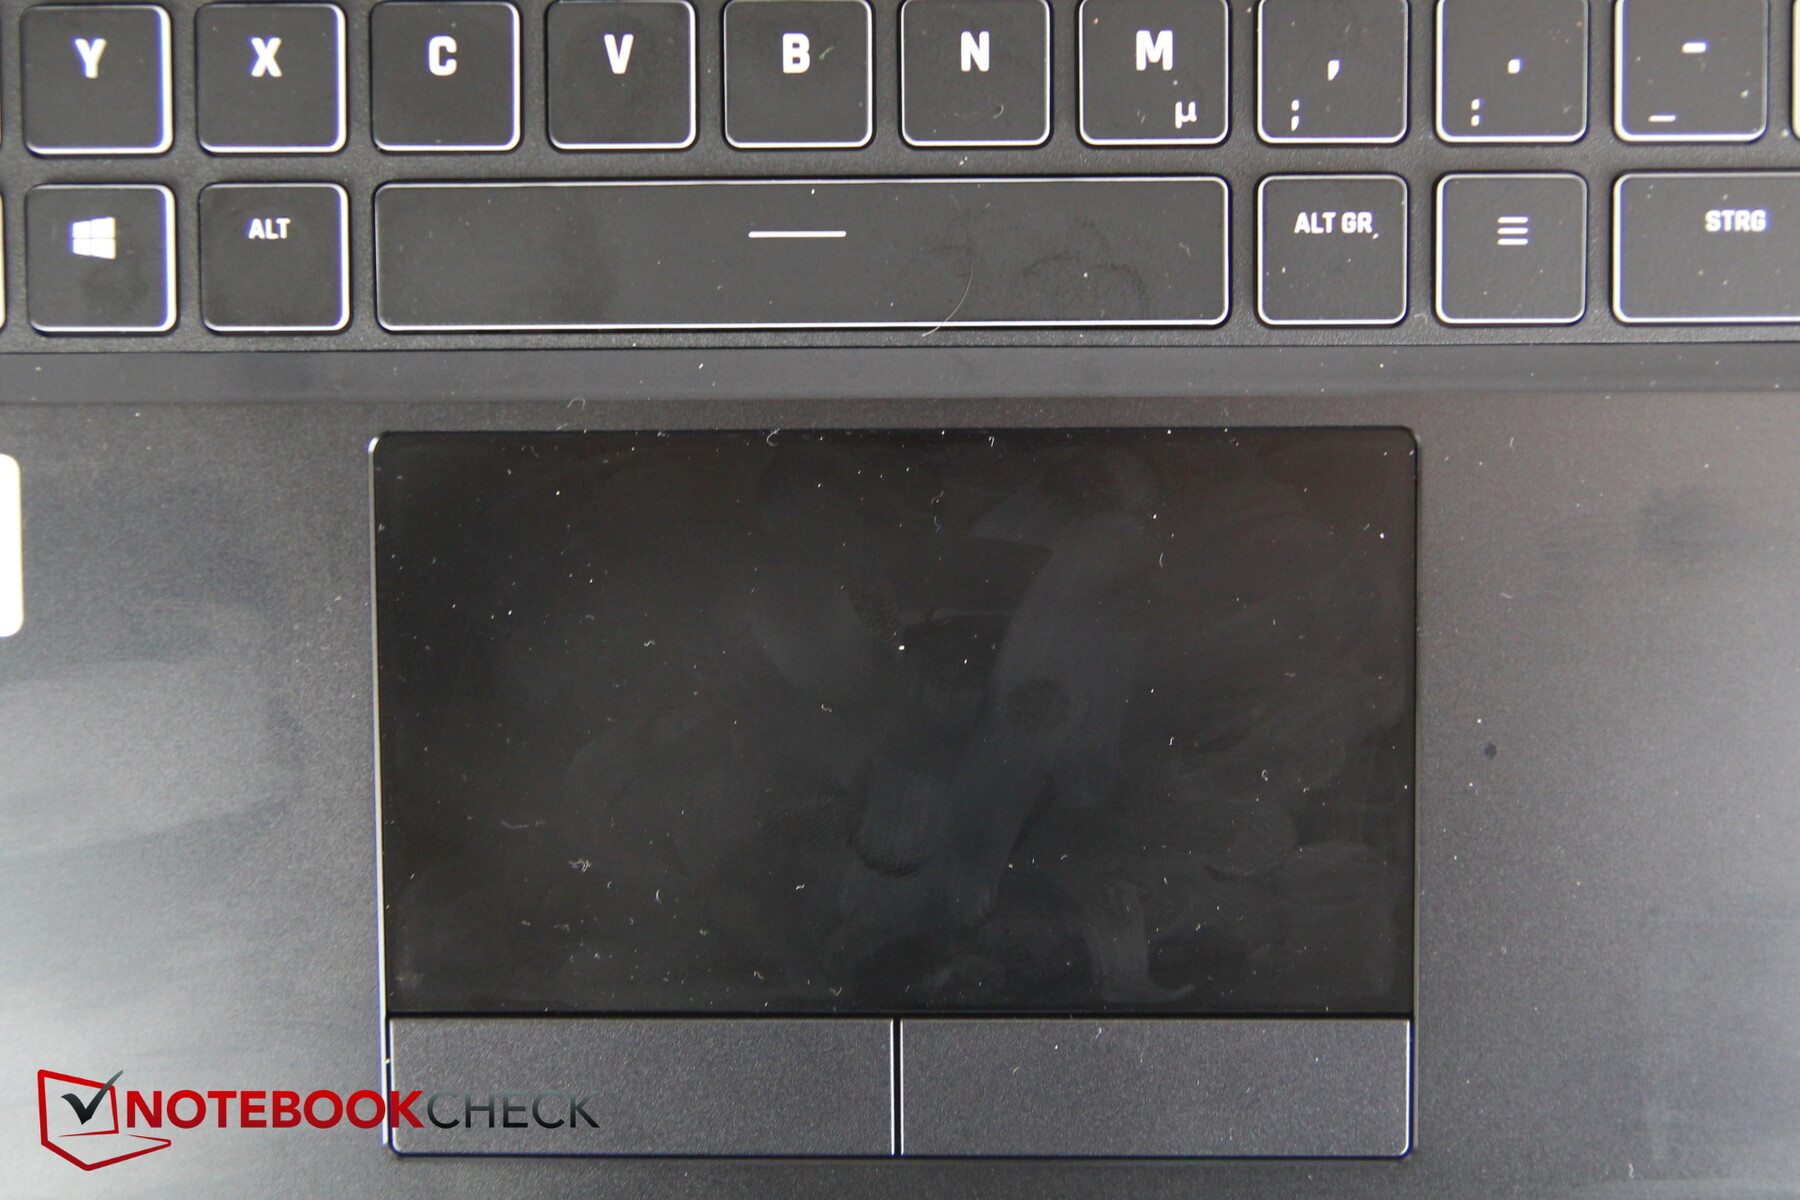
The glass-covered touchpad is very smooth and turned out to be precise even with slow movements of the finger.
The dedicated mouse buttons offer a pleasantly soft accentuation point and are as a result also fairly quiet overall.
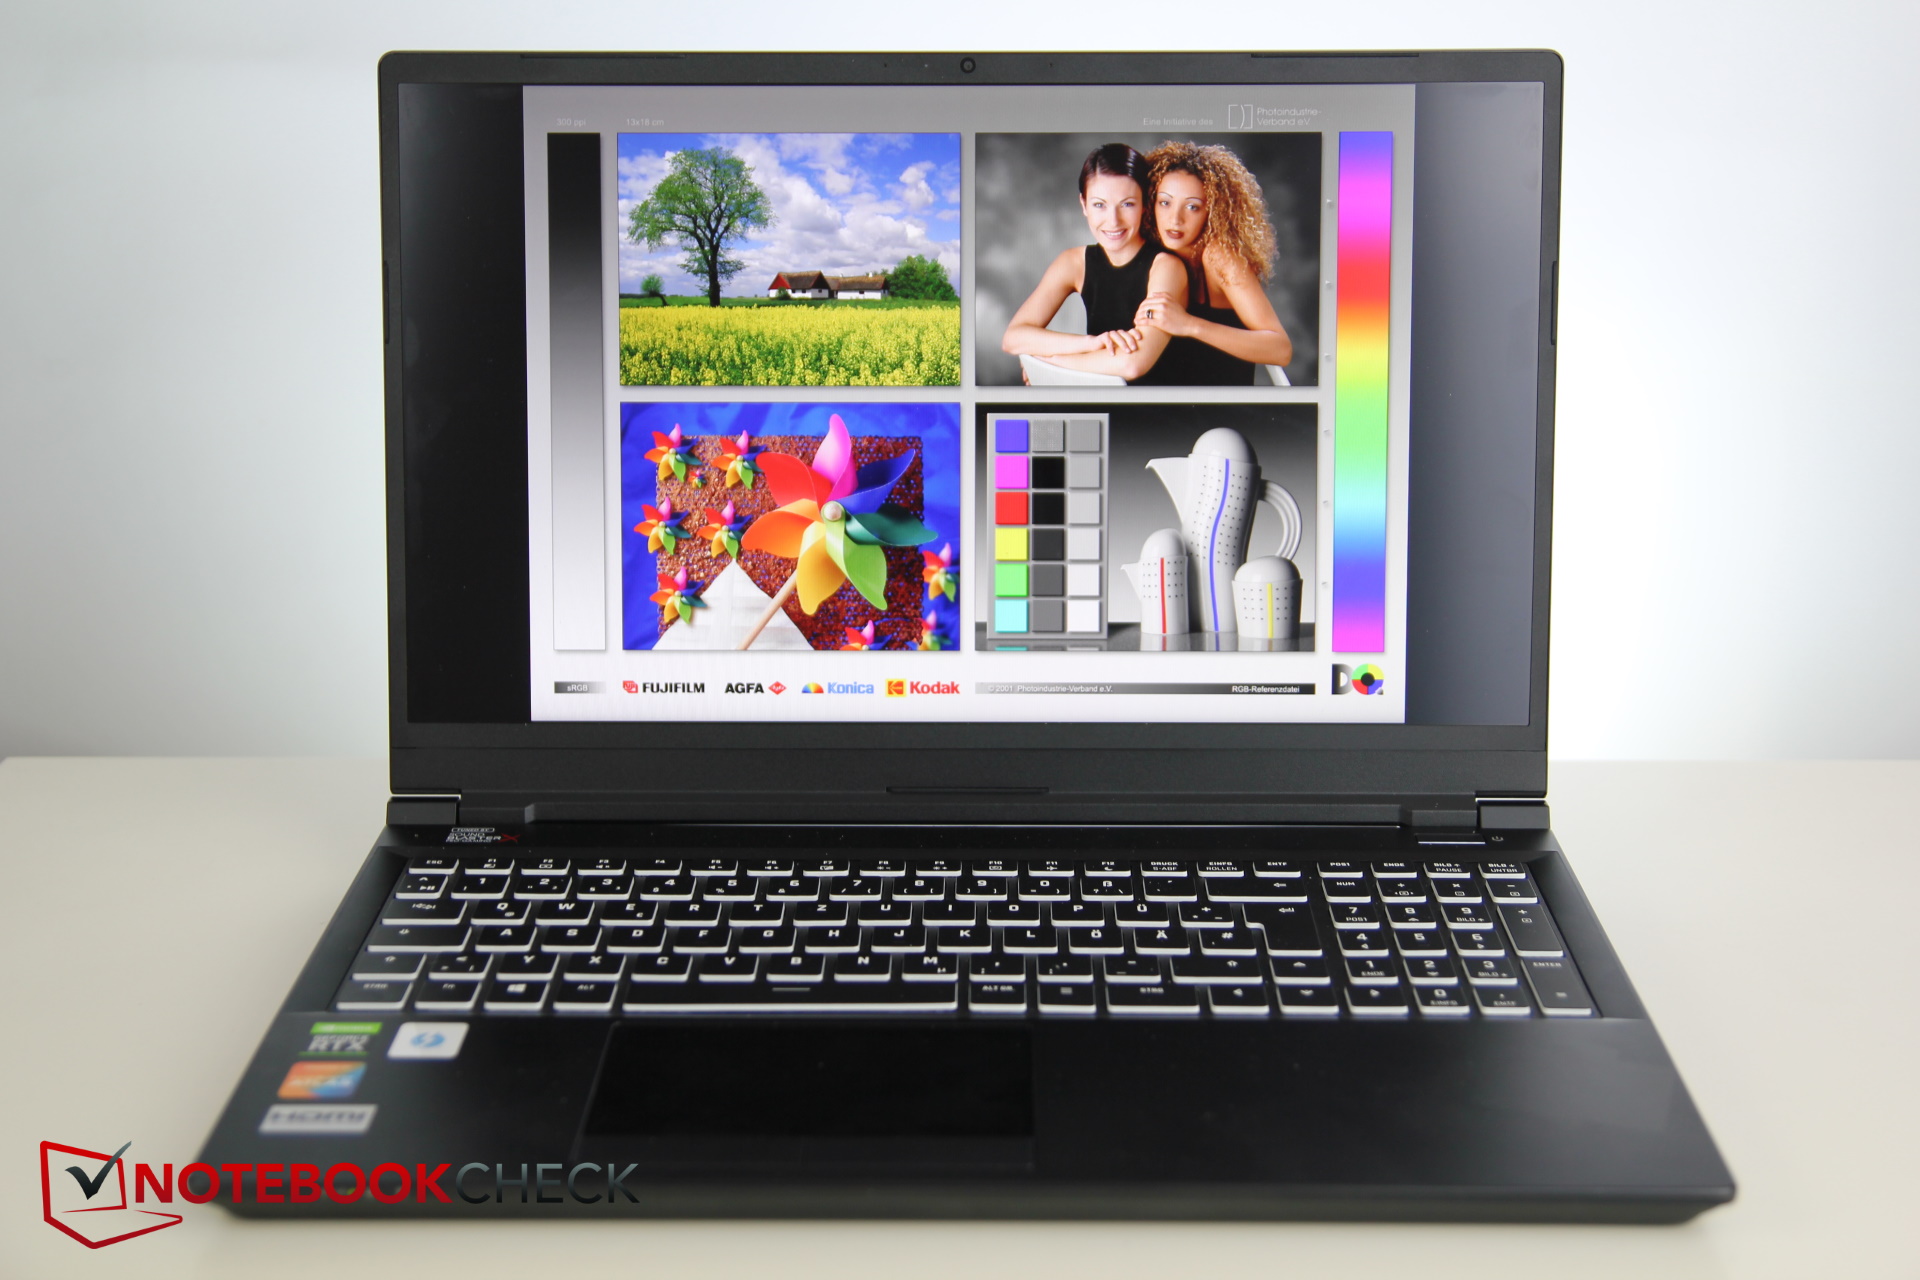
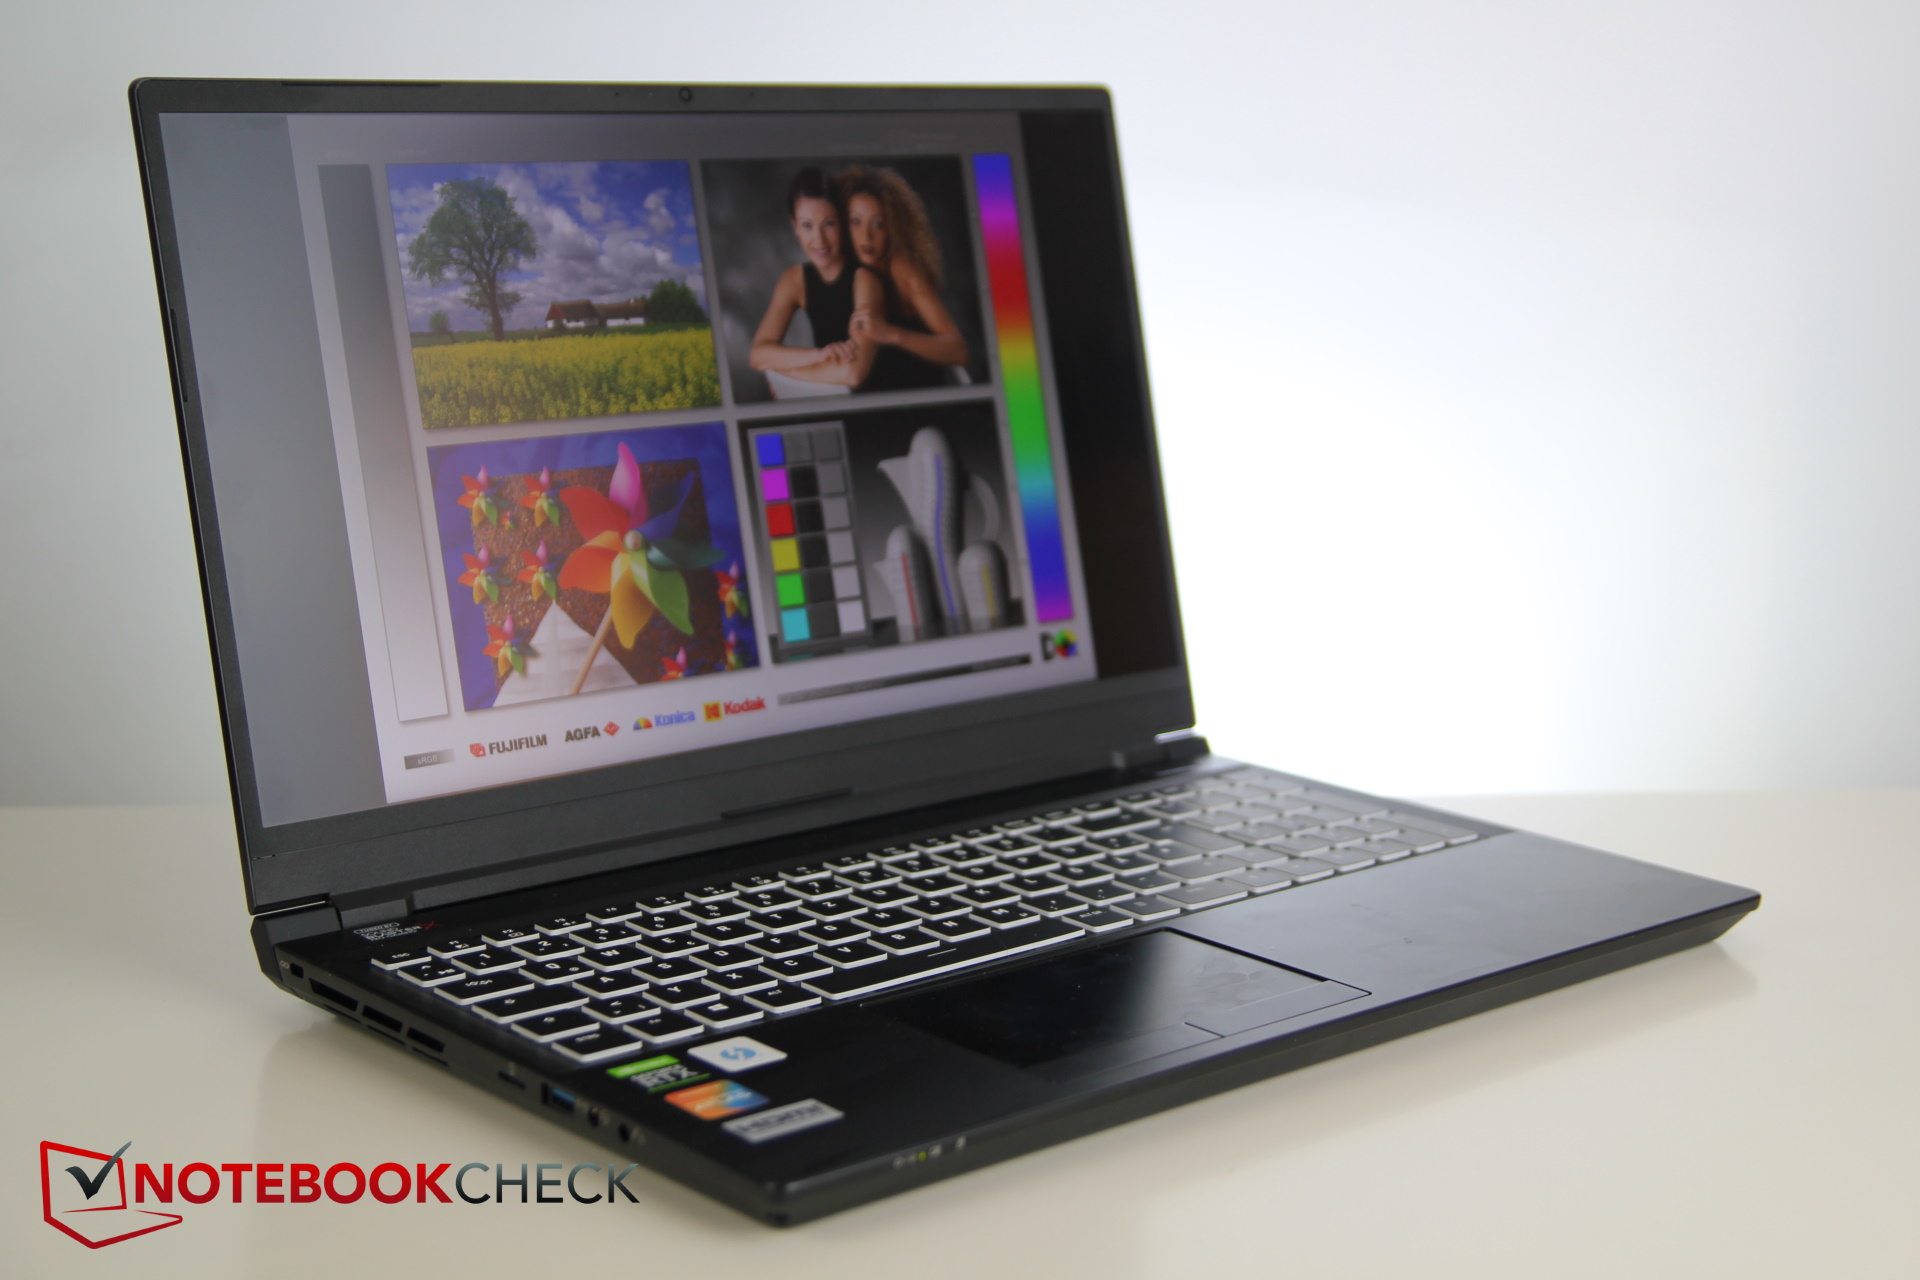
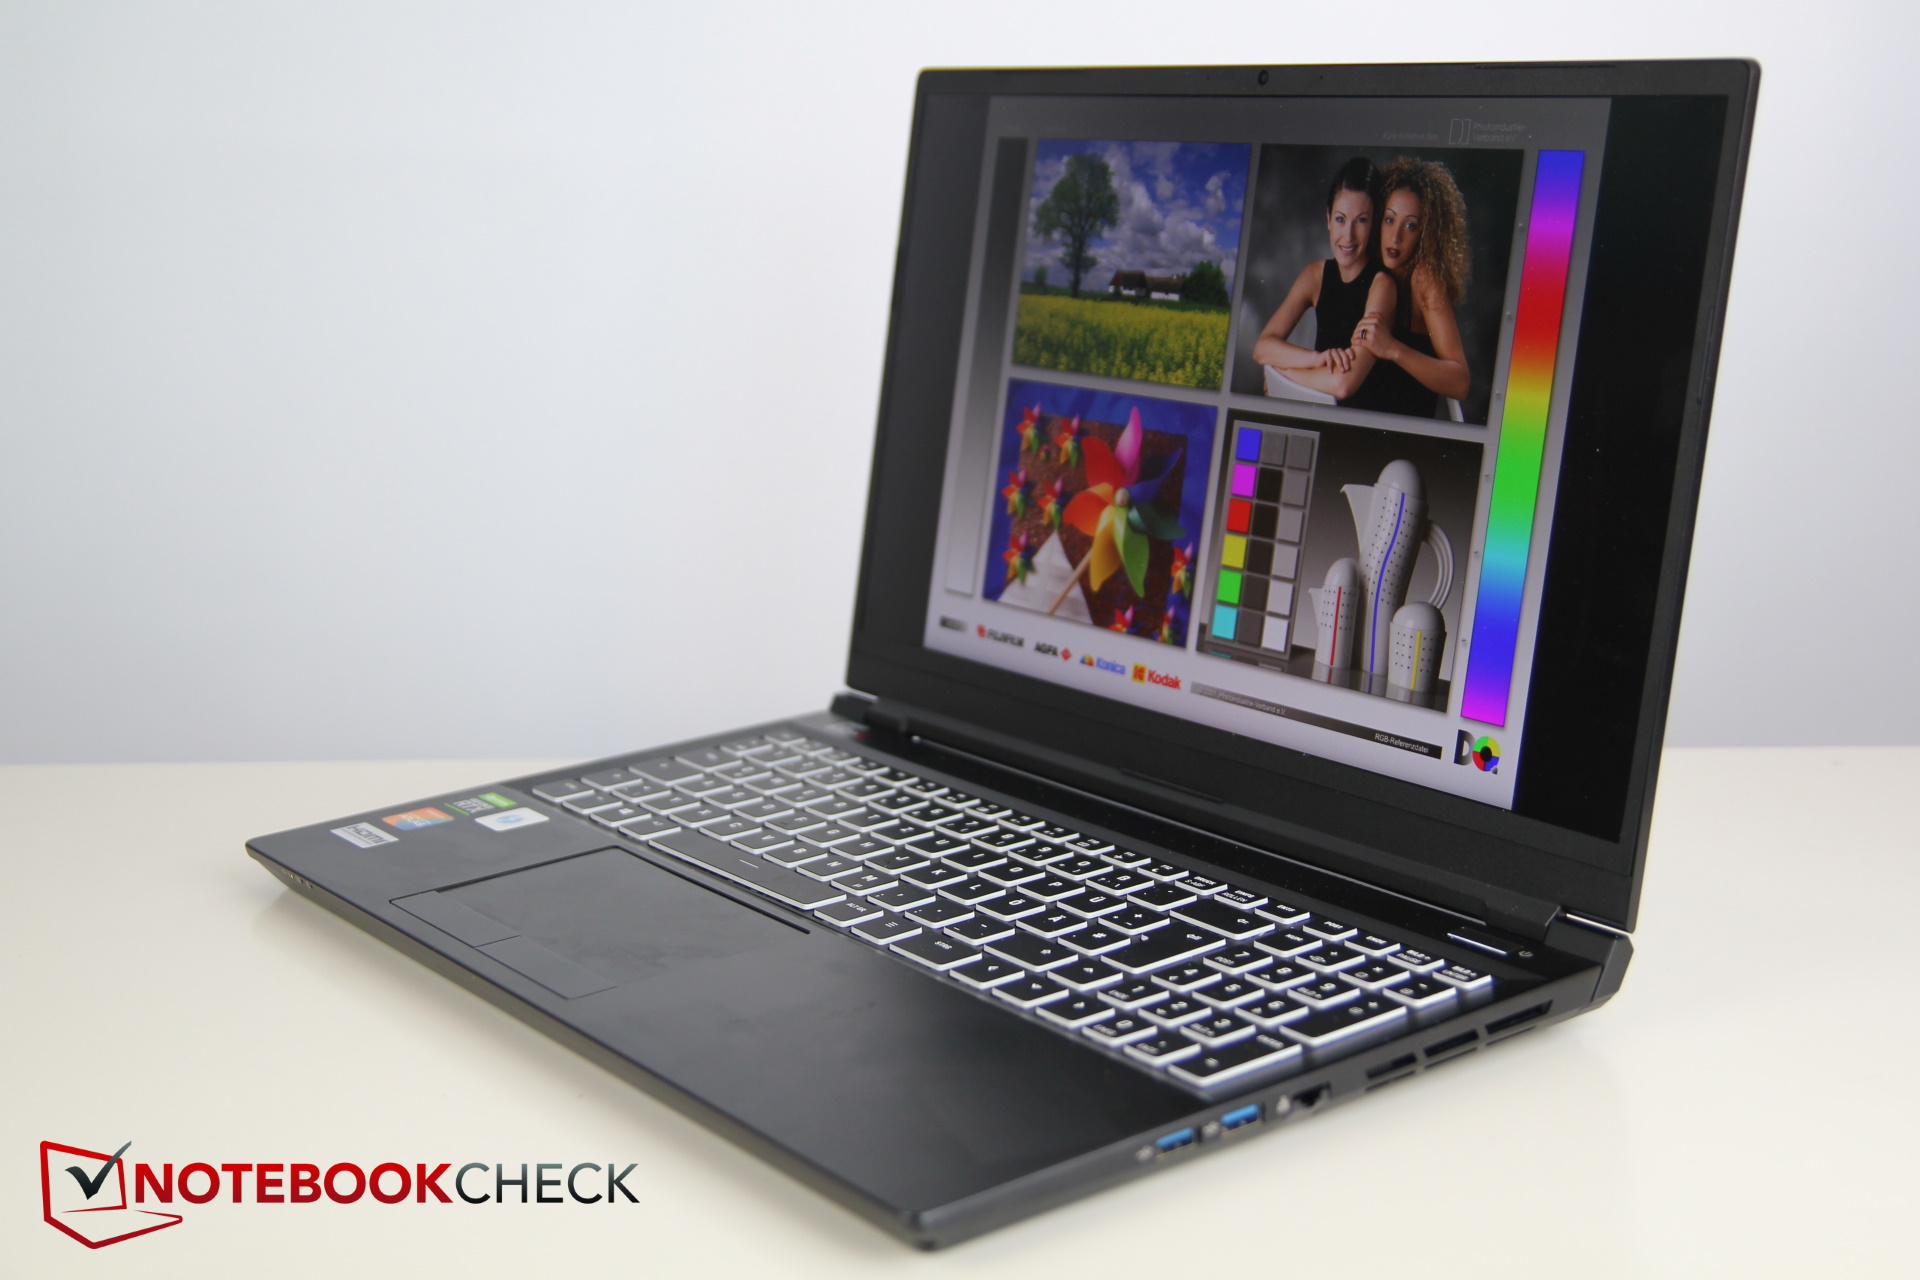
Display – XMG Offers Various Options
A total of five display options are available for the Pro 15. Our review unit came equipped with an AU Optronics FHD IPS panel with a refresh rate of 300 Hz.
Other options include three additional FHD displays with a refresh rate of 144 Hz, two made by LG (one of which is X-Rite/Panton-calibrated) and one made by AU Optronics.
The fifth and final option is a 4K UHD Pantone-calibrated OLED panel made by Samsung. It offers a higher brightness (400 nits) and higher color space coverage but a lower refresh rate of just 60 Hz.
Our review unit’s average display brightness was a decent and acceptable 335 nits with a brightness distribution of 89 percent.
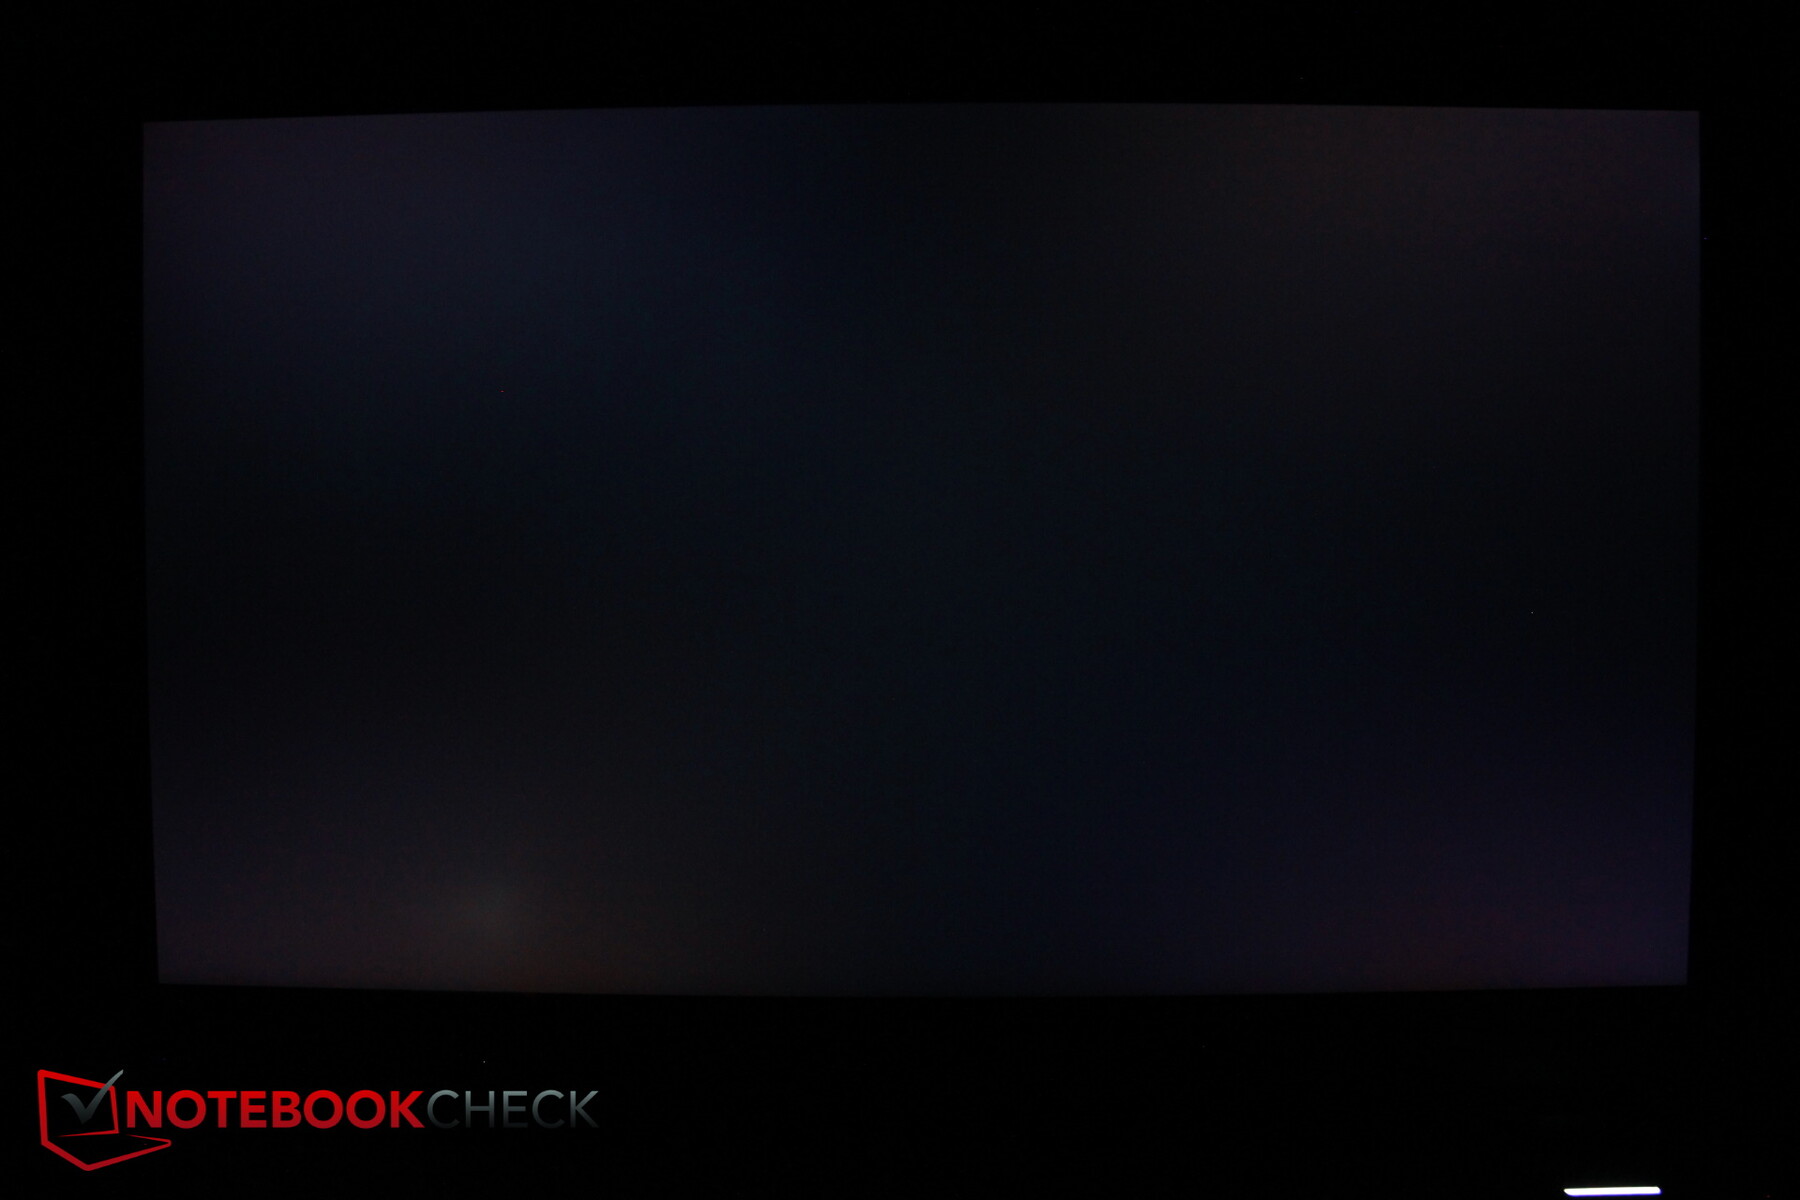
We found no evidence of screen bleeding on our review unit.
| |||||||||||||||||||||||||
Brightness Distribution: 89 %
Center on Battery: 327 cd/m²
Contrast: 1486:1 (Black: 0.22 cd/m²)
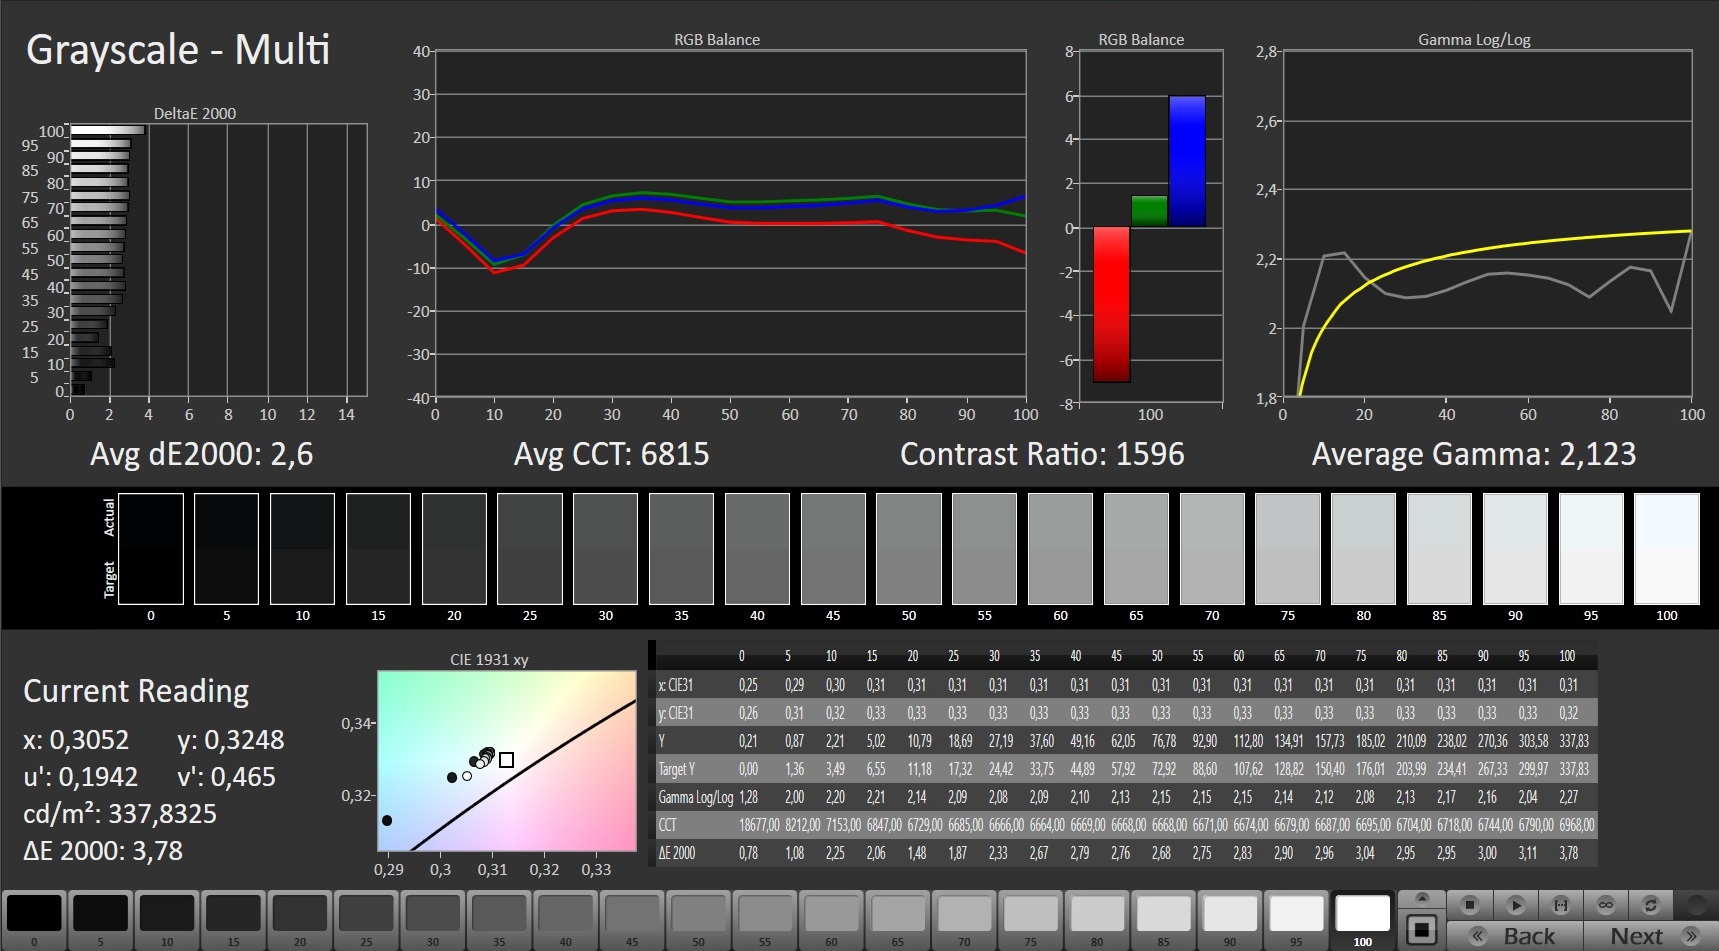
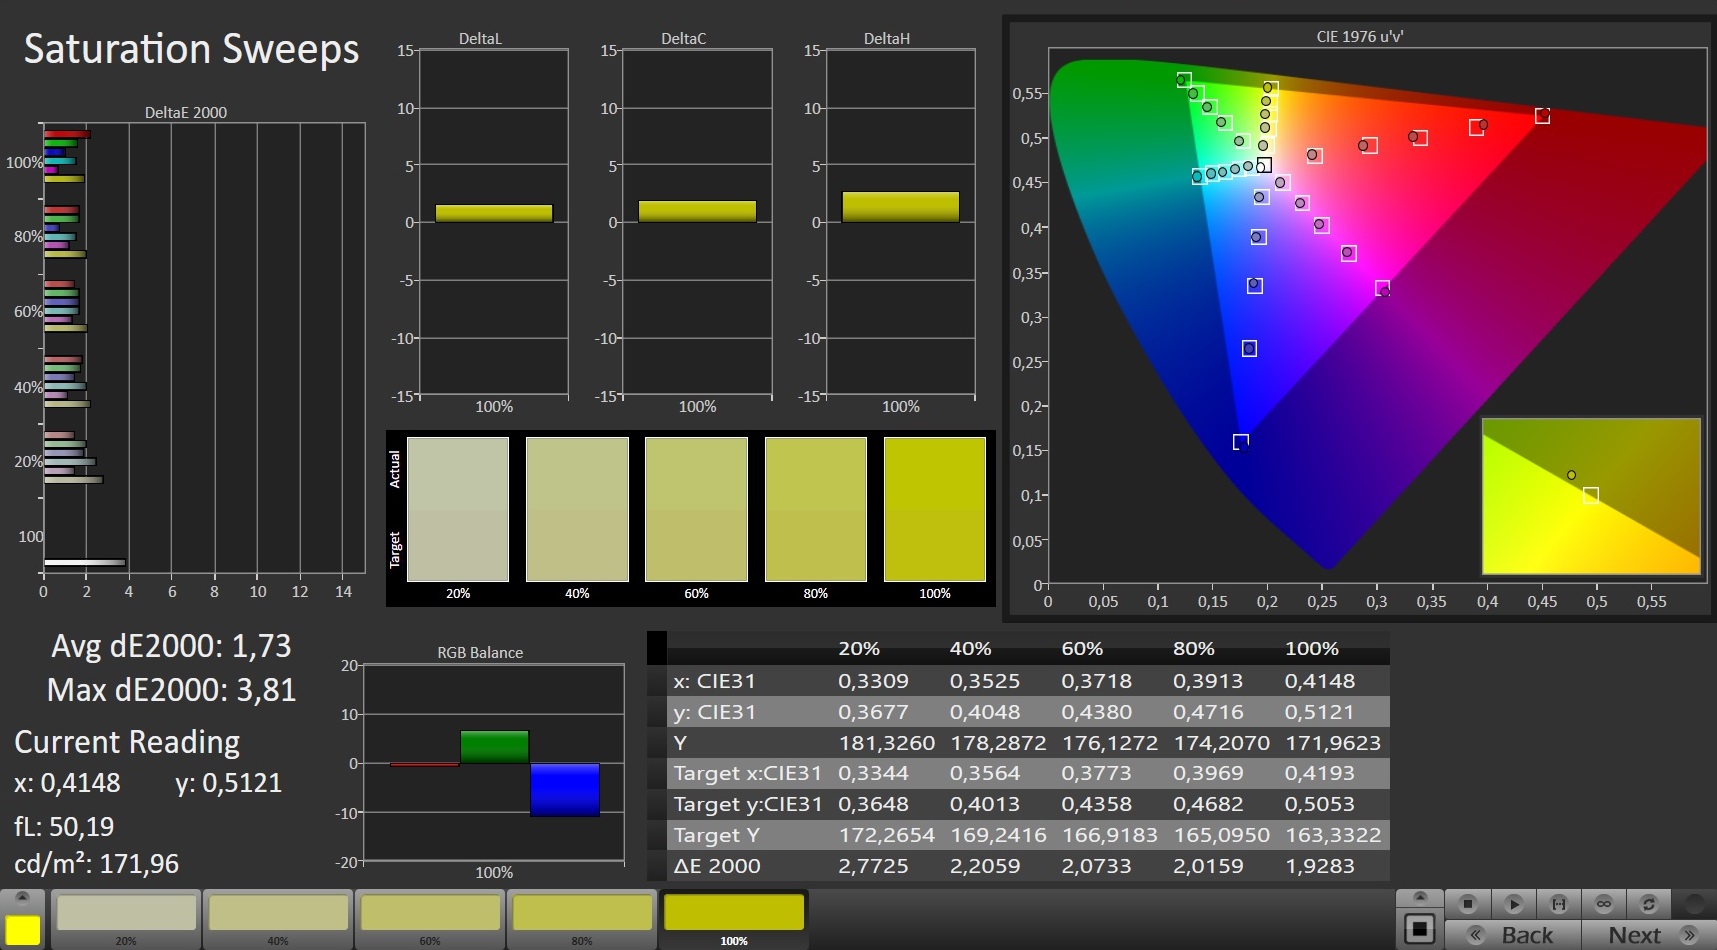
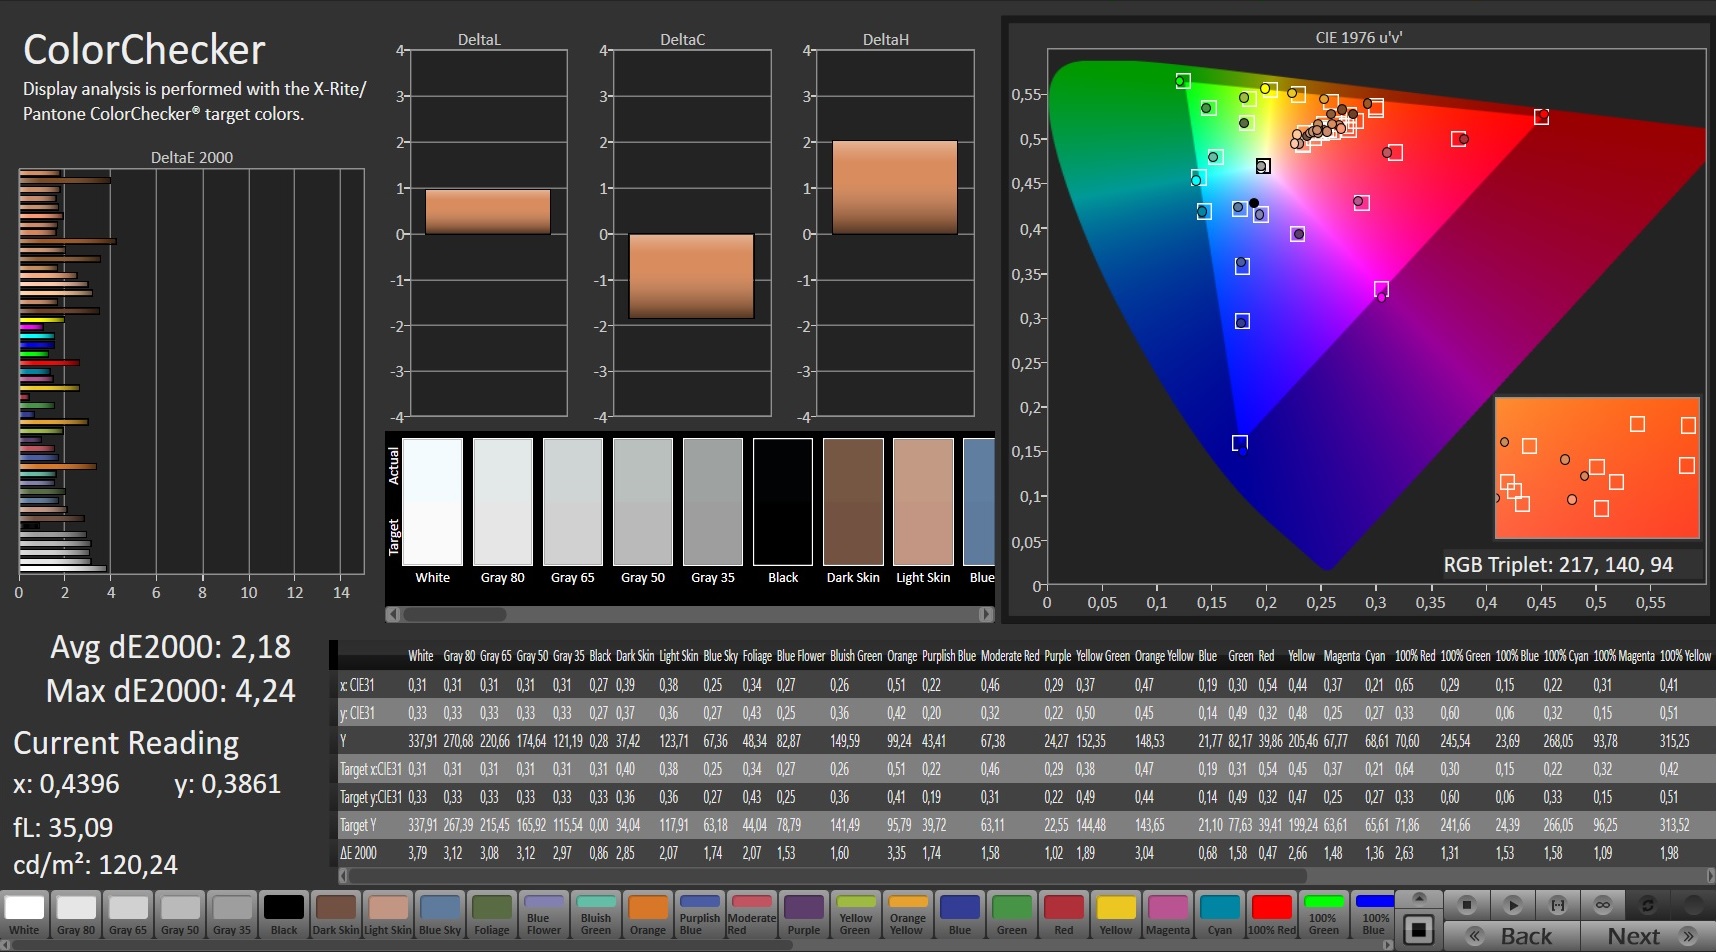
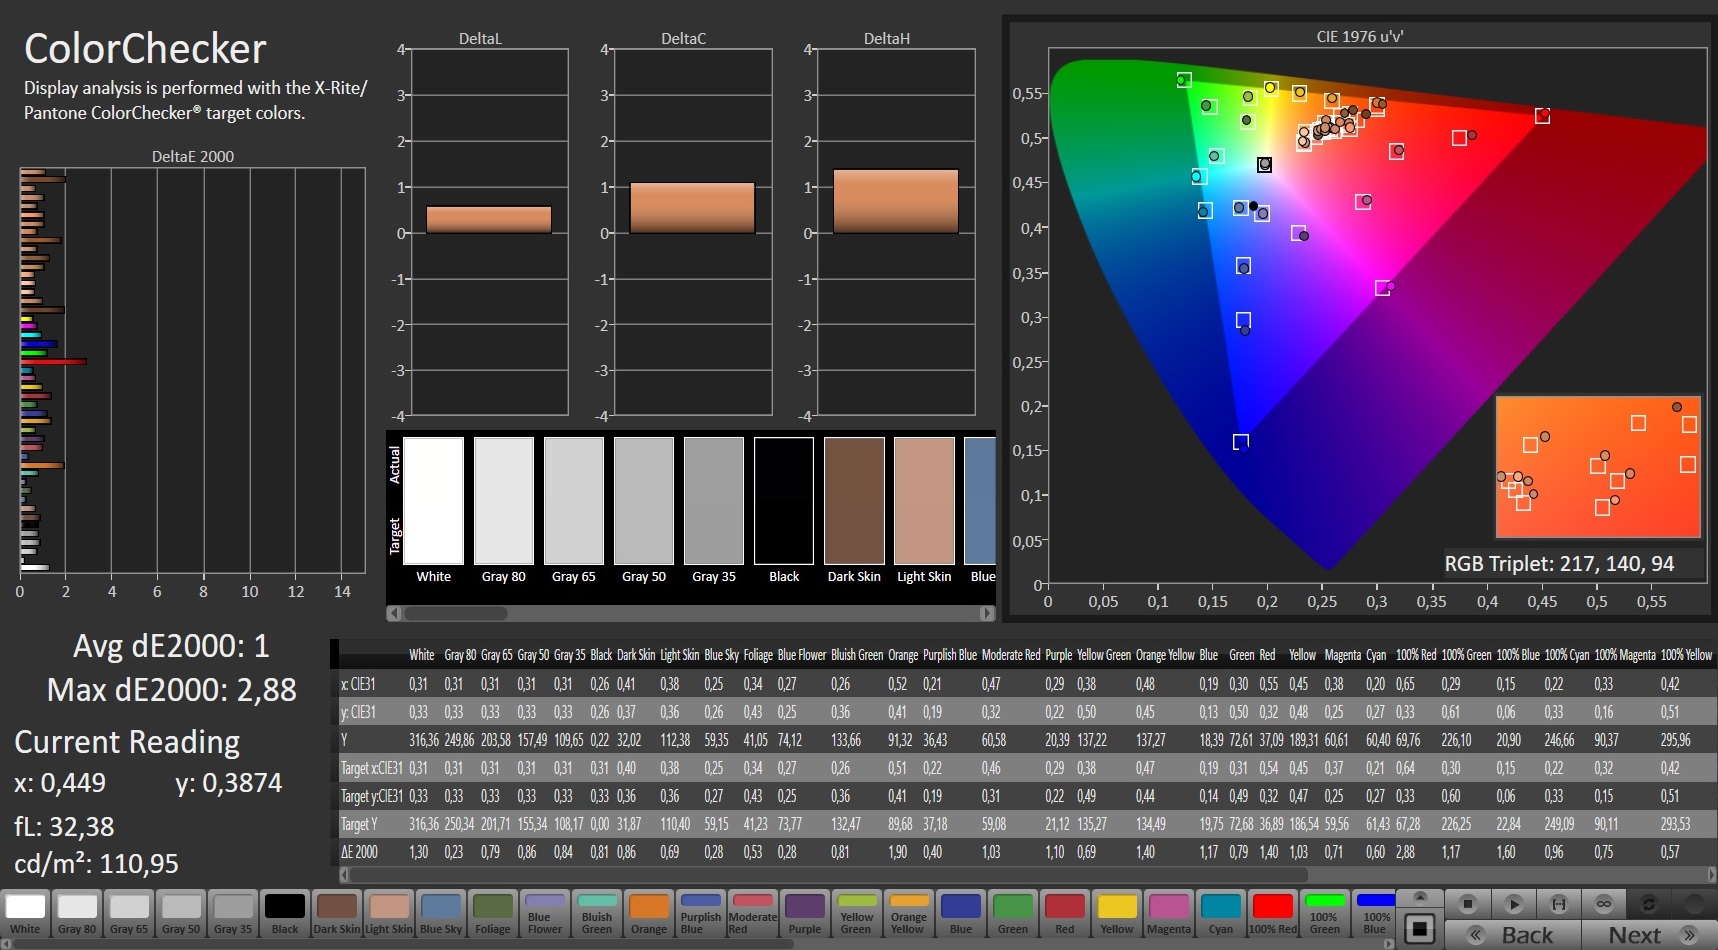
ΔE ColorChecker Calman: 2.18 | ∀{0.5-29.43 Ø4.73}
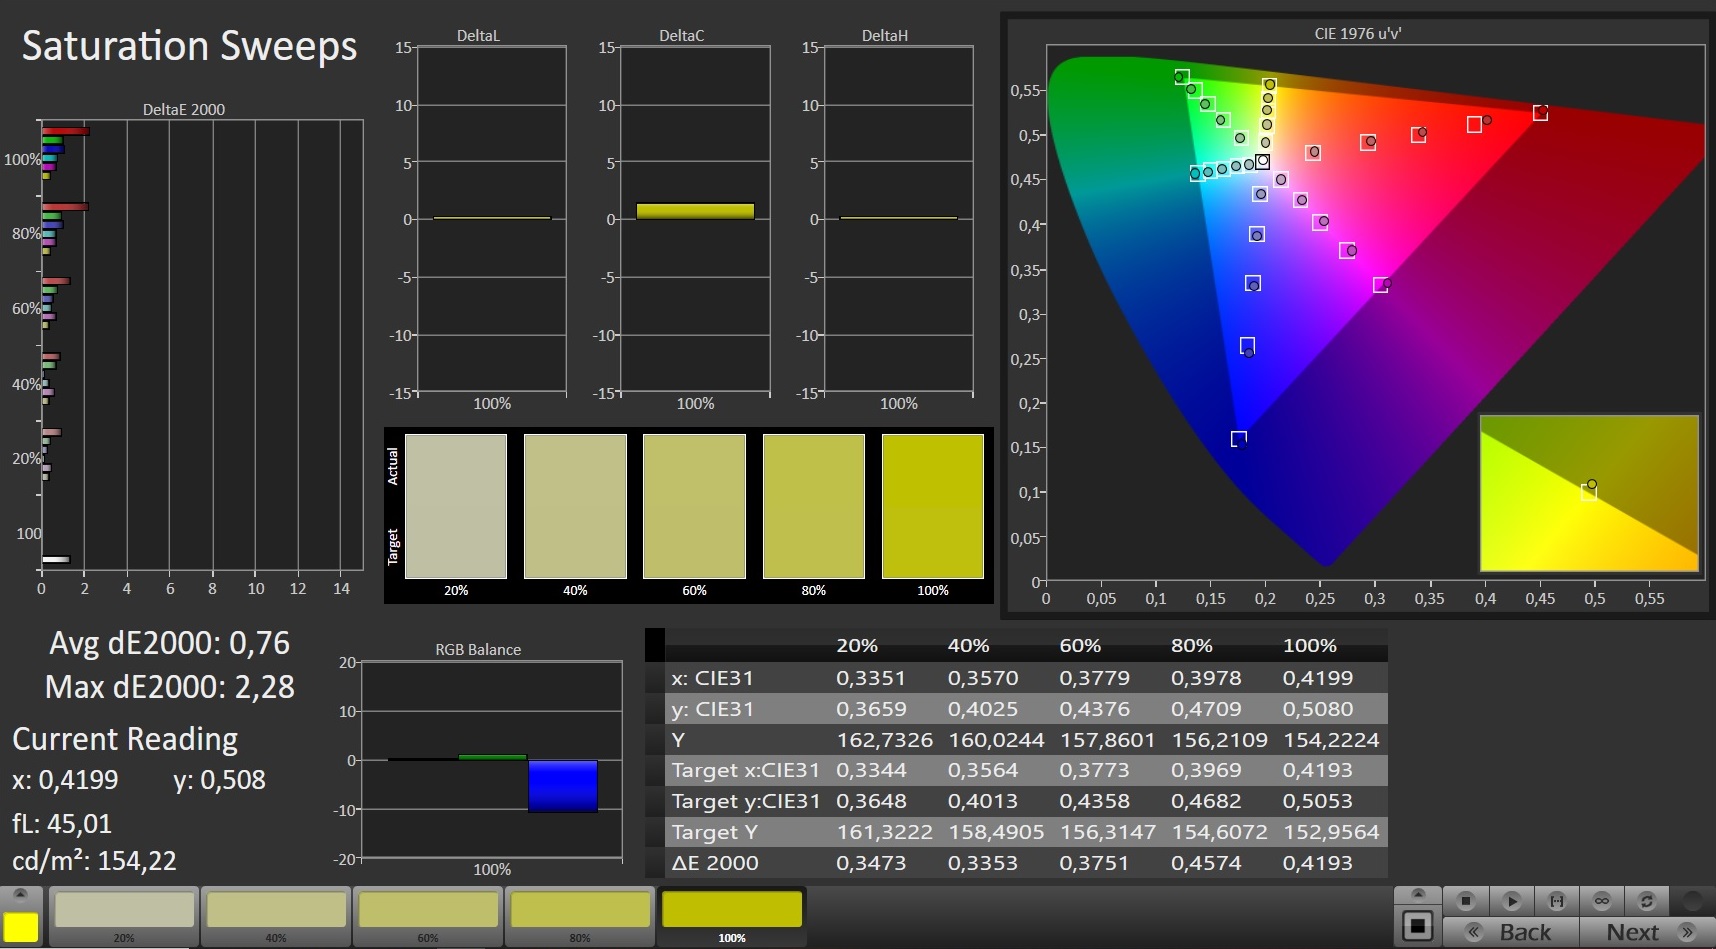
calibrated: 1
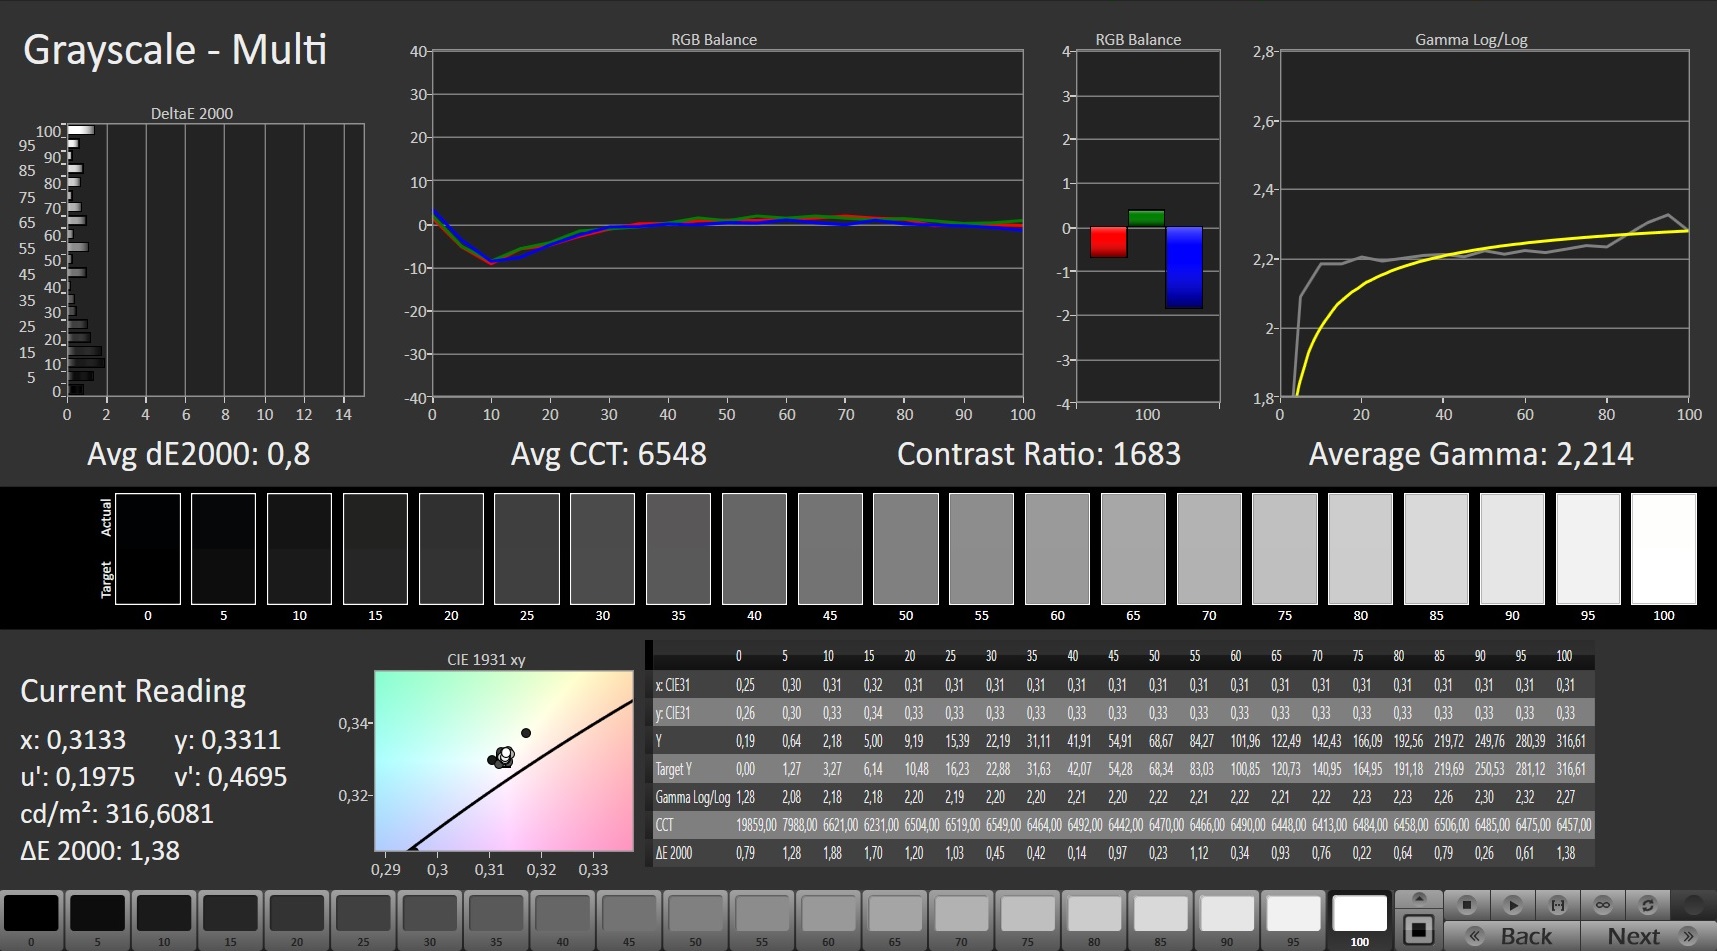
ΔE Greyscale Calman: 2.6 | ∀{0.09-98 Ø4.98}
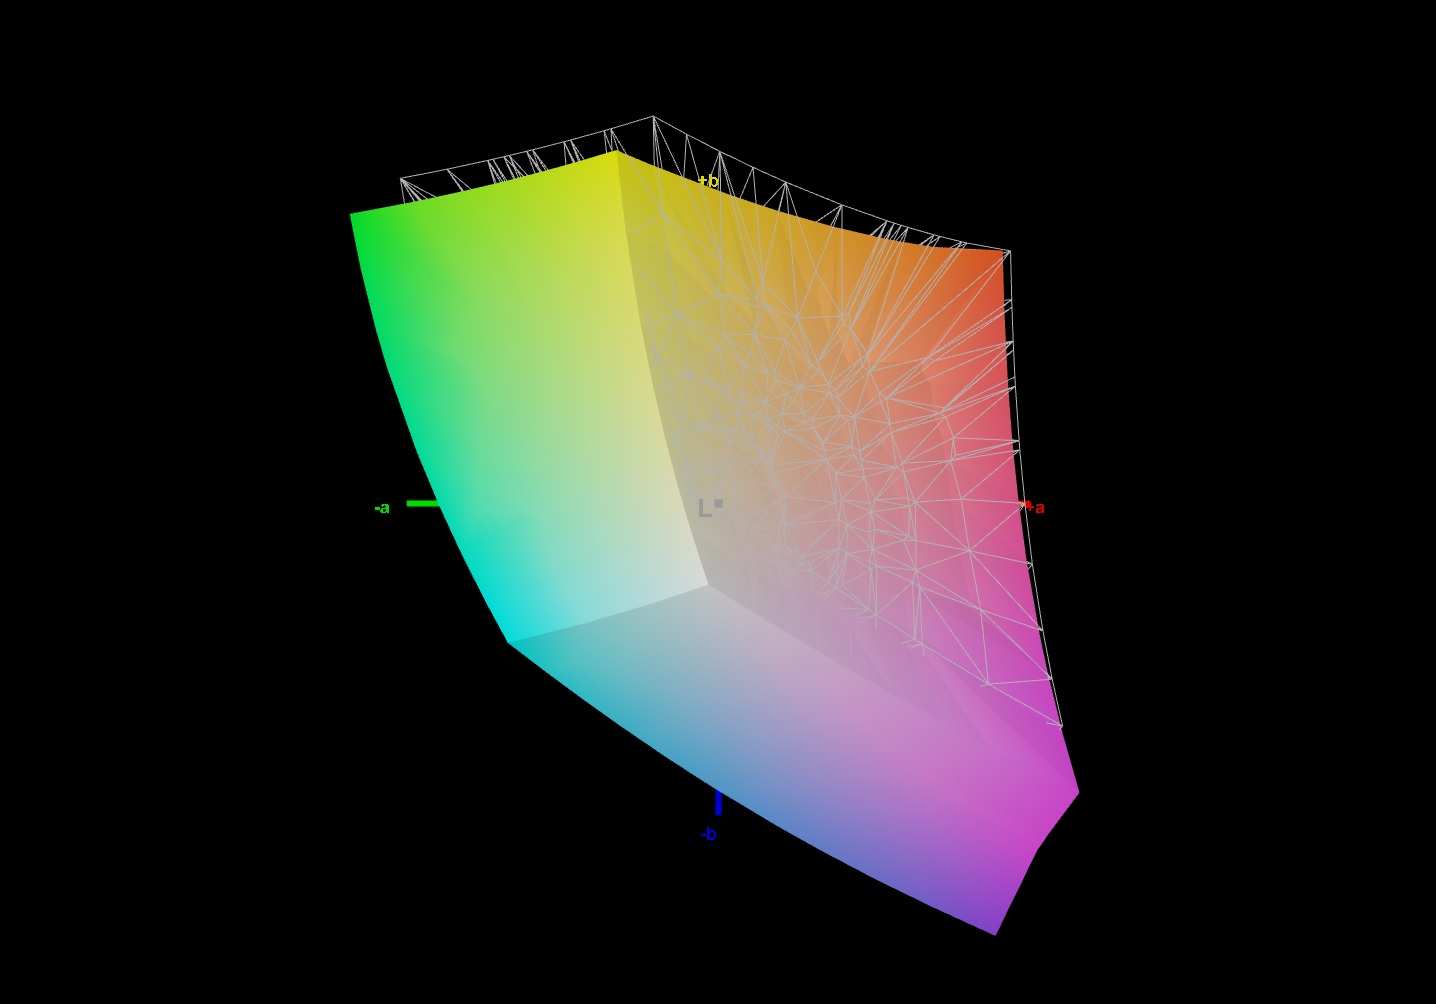
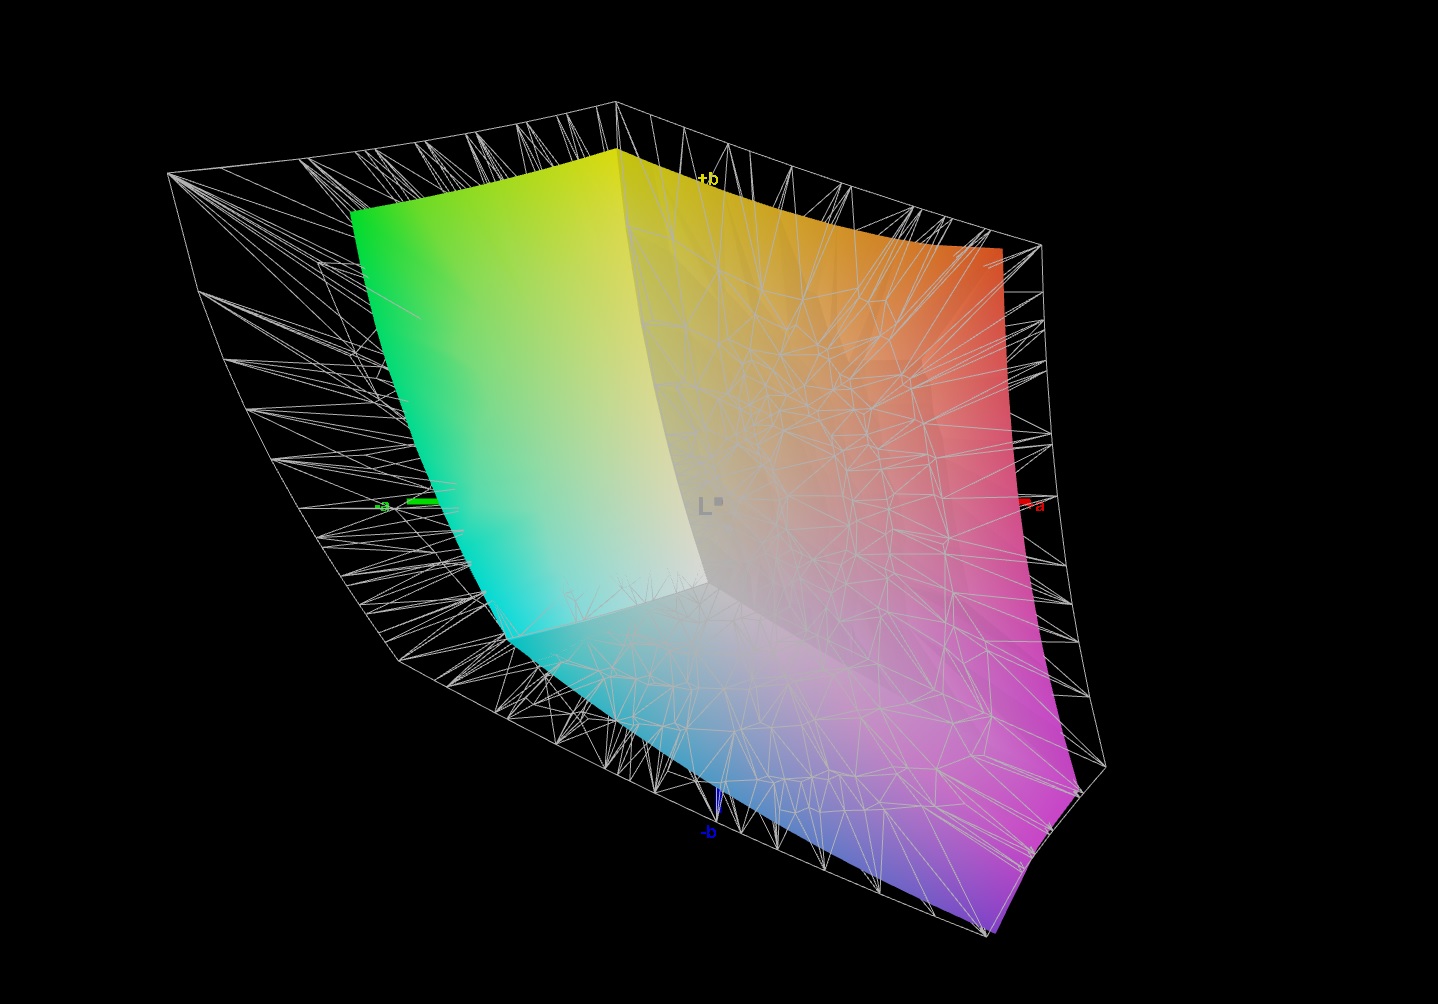
93% sRGB (Argyll 1.6.3 3D)
71% AdobeRGB 1998 (Argyll 1.6.3 3D)
70.8% AdobeRGB 1998 (Argyll 3D)
99.7% sRGB (Argyll 3D)
69.2% Display P3 (Argyll 3D)
Gamma: 2.123
CCT: 6815 K
| Schenker XMG Pro 15 (Early 2021, RTX 3080) AU Optronics AUO7A8C (B156HAN12.0), IPS, 1920x1080, 15.6" | Schenker Key 15 Comet Lake Panda LM156LF-1F02, IPS, 1920x1080, 15.6" | Schenker XMG Pro 15 AU Optronics B156HAN (AUO80ED), IPS, 1920x1080, 15.6" | Asus ROG Zephyrus G15 GA503Q CMN N156KME-GNA (CMN152A), IPS-Level, 2560x1440, 15.6" | Asus ROG Zephyrus Duo 15 SE GX551QS AU Optronics B156ZAN05.1, IPS, 3840x2160, 15.6" | Razer Blade Pro 17 2021 (QHD Touch) AU Optronics B173ZAN03.3, IPS, 3840x2160, 17.3" | |
|---|---|---|---|---|---|---|
| Display | -3% | -4% | 21% | 23% | 23% | |
| Display P3 Coverage (%) | 69.2 | 67.2 -3% | 66.7 -4% | 97.3 41% | 89.1 29% | 88.6 28% |
| sRGB Coverage (%) | 99.7 | 96.2 -4% | 94.4 -5% | 99.9 0% | 99.9 0% | 100 0% |
| AdobeRGB 1998 Coverage (%) | 70.8 | 68.7 -3% | 68.1 -4% | 86.2 22% | 99.1 40% | 99.9 41% |
| Response Times | -85% | -195% | -78% | -66% | -171% | |
| Response Time Grey 50% / Grey 80% * (ms) | 3.6 ? | 10 ? -178% | 17.2 ? -378% | 8.8 ? -144% | 8.2 ? -128% | 15.2 ? -322% |
| Response Time Black / White * (ms) | 10 ? | 9.2 ? 8% | 11.2 ? -12% | 11.2 ? -12% | 10.4 ? -4% | 12 ? -20% |
| PWM Frequency (Hz) | ||||||
| Screen | -76% | -38% | -42% | -47% | -86% | |
| Brightness middle (cd/m²) | 327 | 300 -8% | 346 6% | 327 0% | 406 24% | 407.2 25% |
| Brightness (cd/m²) | 335 | 281 -16% | 346 3% | 309 -8% | 407 21% | 403 20% |
| Brightness Distribution (%) | 89 | 80 -10% | 89 0% | 89 0% | 88 -1% | 90 1% |
| Black Level * (cd/m²) | 0.22 | 0.29 -32% | 0.28 -27% | 0.33 -50% | 0.42 -91% | 0.42 -91% |
| Contrast (:1) | 1486 | 1034 -30% | 1236 -17% | 991 -33% | 967 -35% | 970 -35% |
| Colorchecker dE 2000 * | 2.18 | 5.39 -147% | 4.62 -112% | 4.49 -106% | 4.36 -100% | 7.25 -233% |
| Colorchecker dE 2000 max. * | 4.24 | 14.35 -238% | 8.93 -111% | 8.42 -99% | 7.55 -78% | 12.51 -195% |
| Colorchecker dE 2000 calibrated * | 1 | 1.73 -73% | 1.58 -58% | 2.27 -127% | 3.63 -263% | 3.62 -262% |
| Greyscale dE 2000 * | 2.6 | 9.8 -277% | 4.95 -90% | 4.2 -62% | 3.1 -19% | 8.1 -212% |
| Gamma | 2.123 104% | 2.019 109% | 2.36 93% | 2.173 101% | 2.36 93% | 2.24 98% |
| CCT | 6815 95% | 8174 80% | 7733 84% | 7014 93% | 6371 102% | 5925 110% |
| Color Space (Percent of AdobeRGB 1998) (%) | 71 | 69 -3% | 61 -14% | 86 21% | 86.7 22% | 88.1 24% |
| Color Space (Percent of sRGB) (%) | 93 | 92 -1% | 94 1% | 99 6% | 99.9 7% | 100 8% |
| Total Average (Program / Settings) | -55% /
-63% | -79% /
-51% | -33% /
-34% | -30% /
-36% | -78% /
-76% |
* ... smaller is better
Both contrast and black point were among the best of its class. While the display was fairly well calibrated by default, we were able to further lower color deviations through manual calibration. Overall, the display was very decent and much better than that of many of the Pro 15’s competitors.
Response times were among the fastest among its peers. The internal display is thus very well suited for fast-paced action games.
With 93 % sRGB and 71 % AdobeRGB color space coverage was decent overall. Like most 4K competitors the optional 4K panel will offer higher color gamut levels.
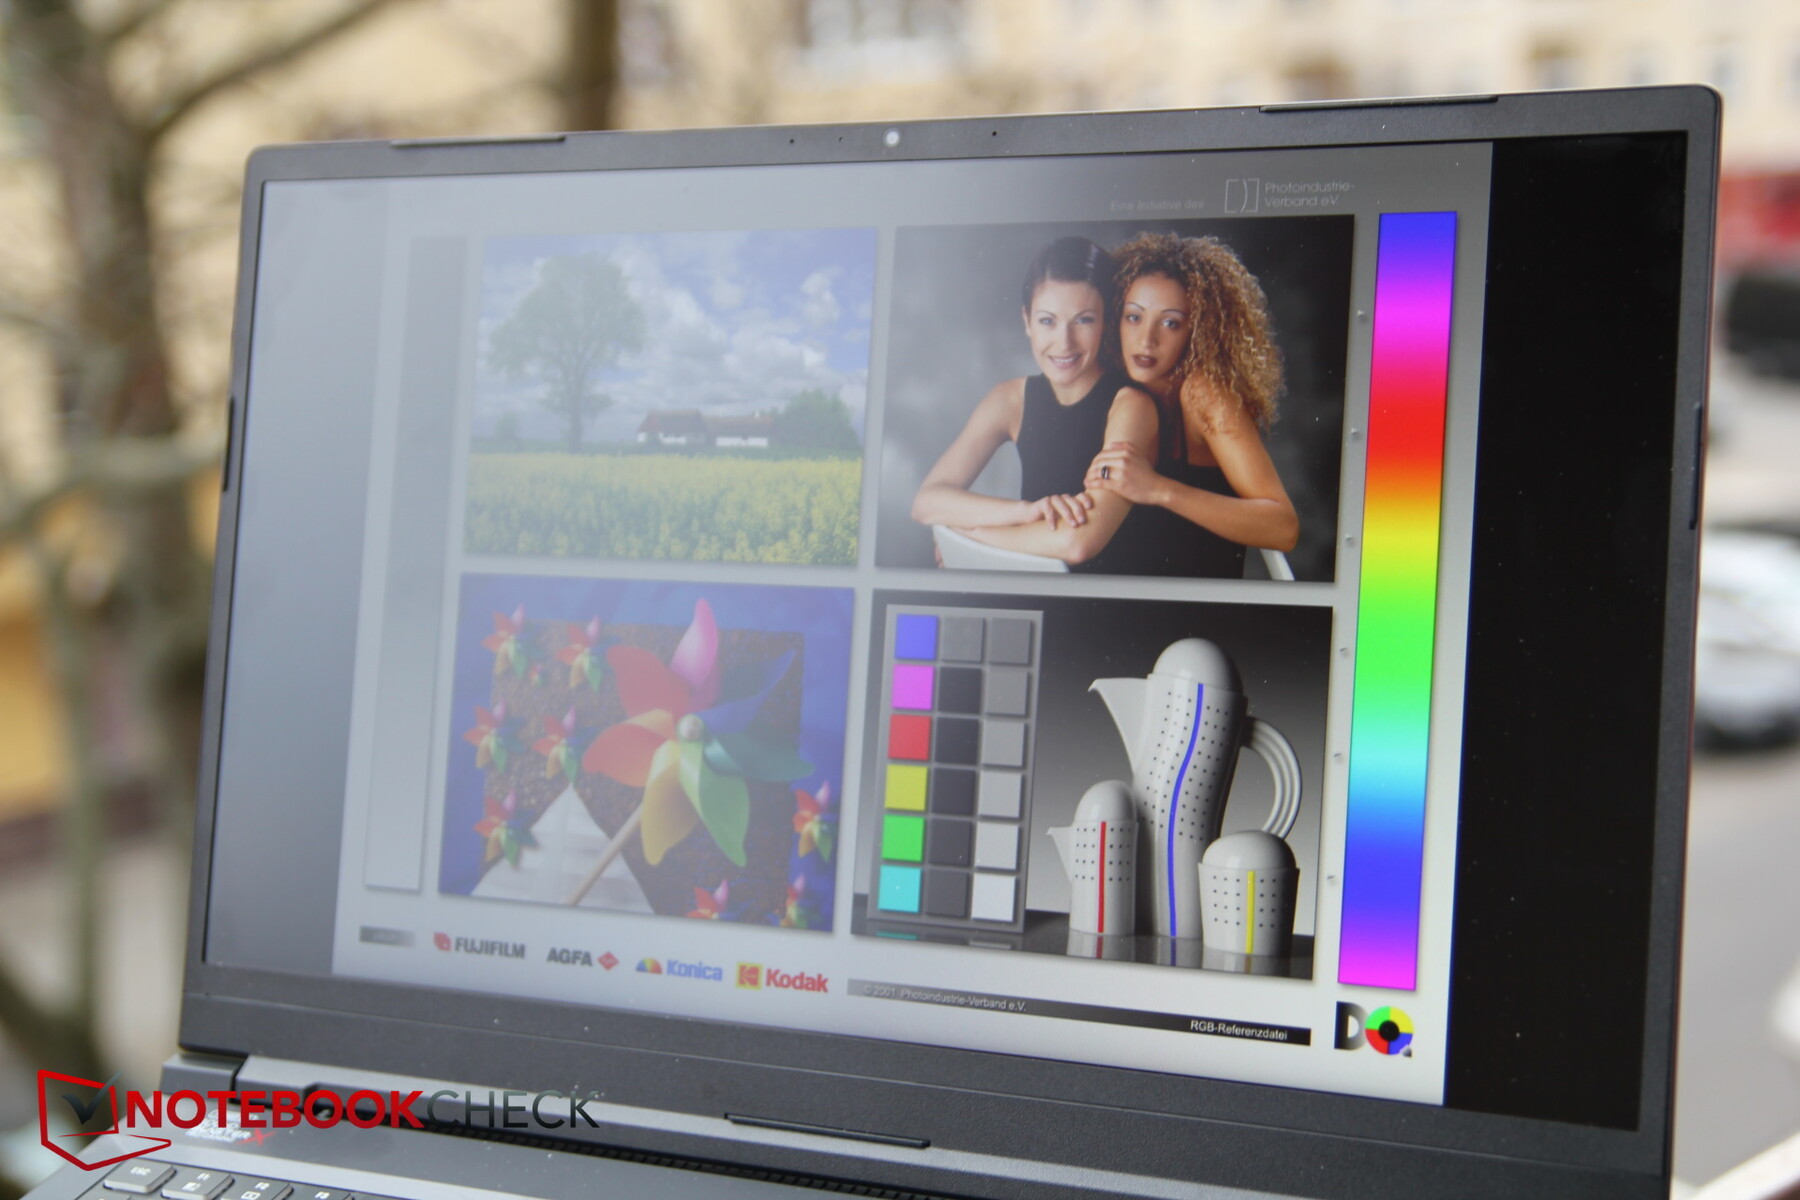
Thanks to its matte surface and its good maximum brightness of more than 300 nits the powerful all-rounder turned out to be well usable outdoors, at least in in the shade.

Display Response Times
| ↔ Response Time Black to White | ||
|---|---|---|
| 10 ms ... rise ↗ and fall ↘ combined | ↗ 5.2 ms rise | 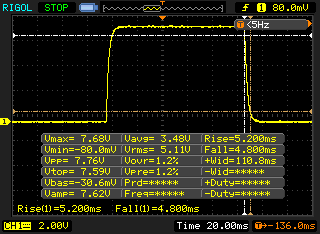 |
| ↘ 4.8 ms fall | ||
| The screen shows good response rates in our tests, but may be too slow for competitive gamers. In comparison, all tested devices range from 0.1 (minimum) to 240 (maximum) ms. » 27 % of all devices are better. This means that the measured response time is better than the average of all tested devices (19.9 ms). | ||
| ↔ Response Time 50% Grey to 80% Grey | ||
| 3.6 ms ... rise ↗ and fall ↘ combined | ↗ 1 ms rise | 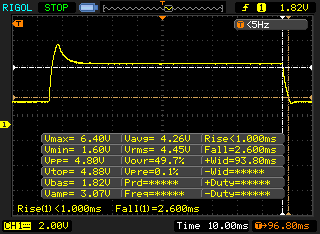 |
| ↘ 2.6 ms fall | ||
| The screen shows very fast response rates in our tests and should be very well suited for fast-paced gaming. In comparison, all tested devices range from 0.165 (minimum) to 636 (maximum) ms. » 14 % of all devices are better. This means that the measured response time is better than the average of all tested devices (31.1 ms). | ||
Screen Flickering / PWM (Pulse-Width Modulation)
| Screen flickering / PWM not detected | 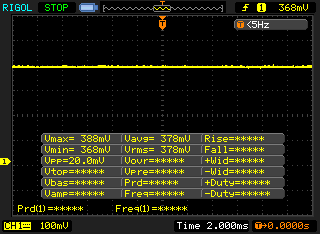 | ||
In comparison: 52 % of all tested devices do not use PWM to dim the display. If PWM was detected, an average of 7822 (minimum: 1.31 - maximum: 343500) Hz was measured. | |||
As expected of an IPS panel viewing angles were fairly wide. With that said we did notice a fair amount of darkening when looked at from the sides that remained consistent with increasing angles.

Performance – RTX 3080 better than RTX 2080 Super?
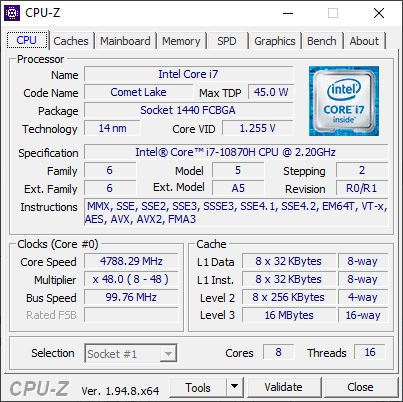
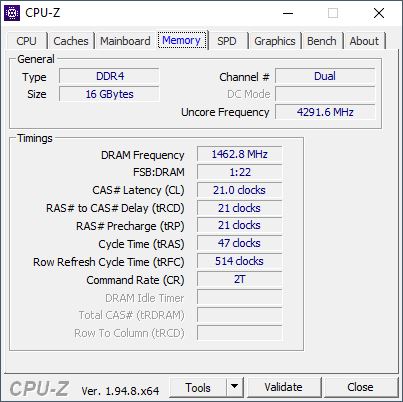
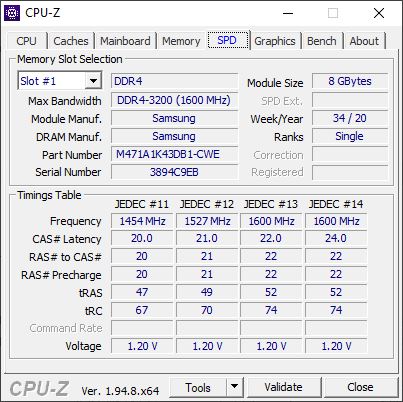
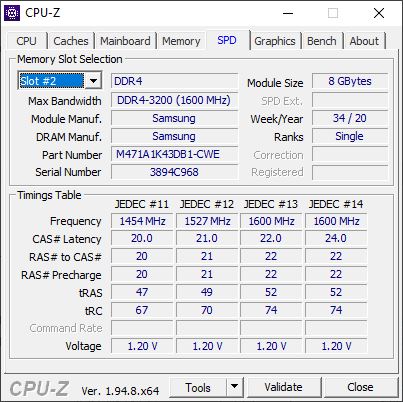
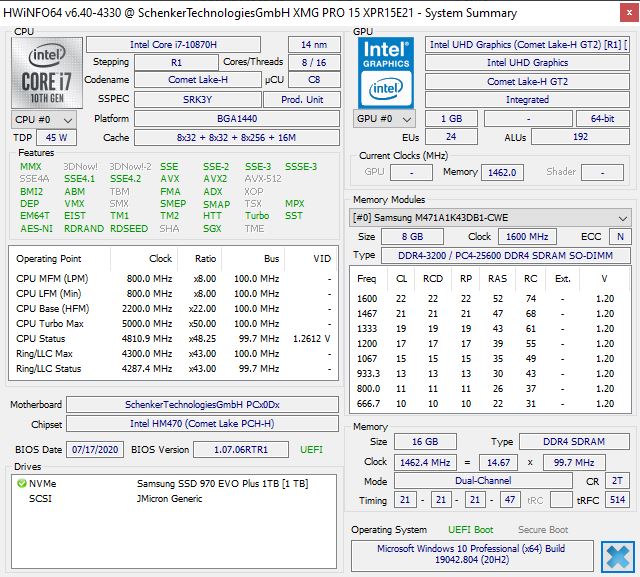
With its Intel Core i7-10870H, an Nvidia RTX 3080, 16 GB of RAM, and a 1 TB SSD the XMG Pro 15 is without a doubt a high-end gamer. However, with its lightweight and thin design it is also aimed at professionals looking for a workstation. In other words, it should cover every single conceivable use case.
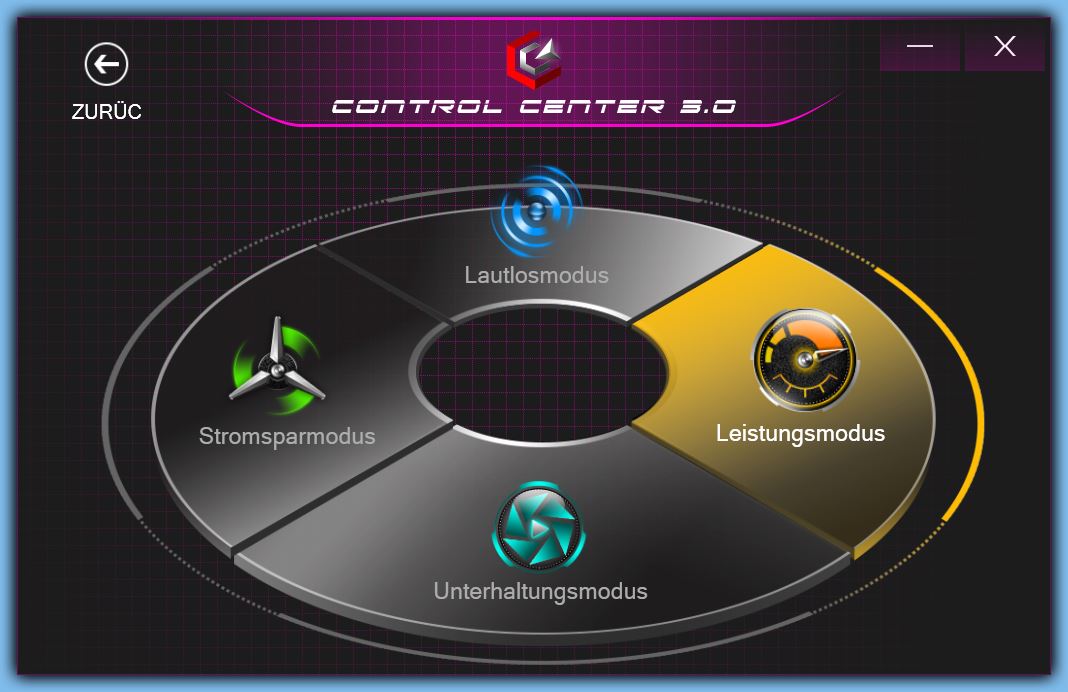
Before running our benchmarks, we enabled the performance mode in Control Center, which increases the TDP threshold for the GPU to 105 W. In the more balanced entertainment mode, the GPU is limited to just 95 W, and even more so in power saver mode. The same applies to the CPU.
Processor
Intel’s Core i7-10870H runs at a base frequency of 2.2 GHz with a turbo boost of up to 5 GHz. It features 8 cores with support for Hyperthreading and can therefore process up to 16 threads simultaneously. Even though it is nominally 100 MHz slower than the Key 15’s Core i7-10875H its Cinebench R15 performance is higher. When compared with the Razer Blade it is initially faster but settles at a similar level in the long run. With that said the AMD CPUs in Asus’s line-up are miles ahead of Intel’s current offerings. Overall, CPU performance was right where we would have expected.
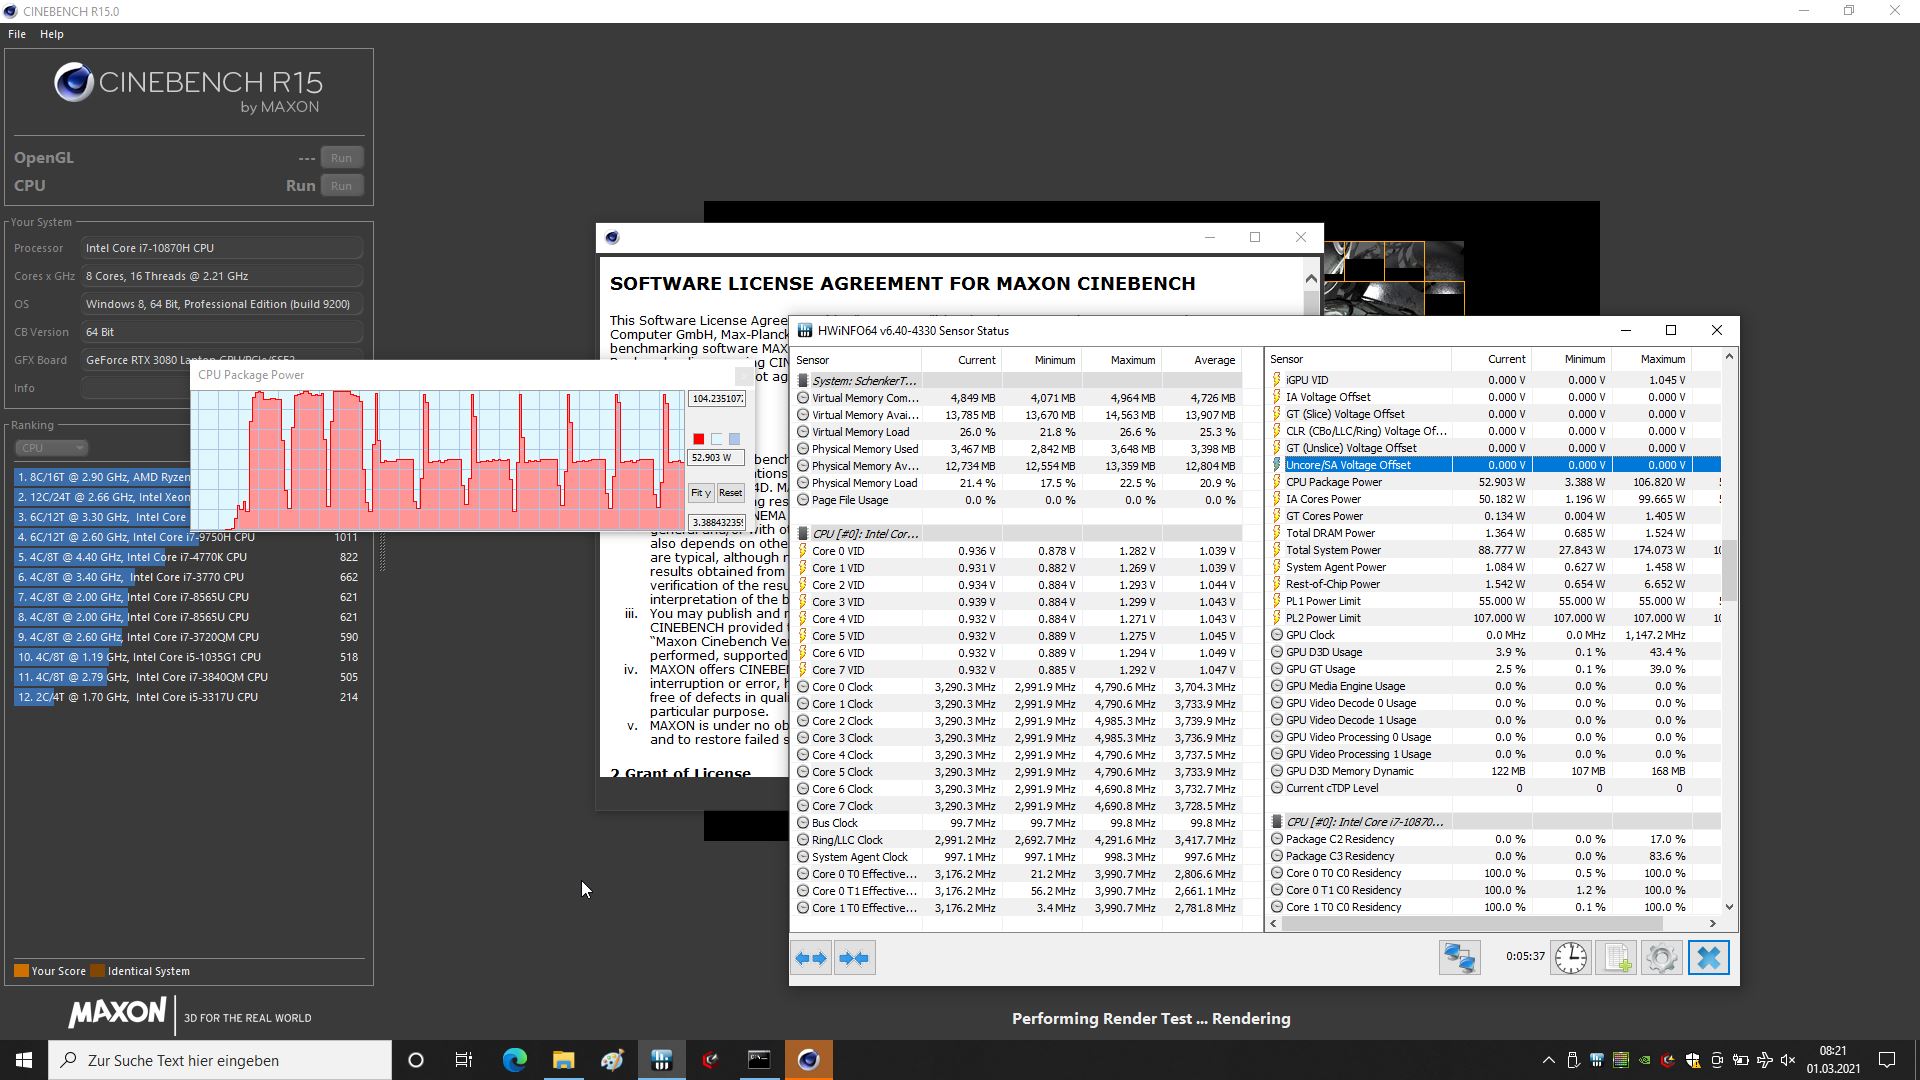
During the first three runs we measured the CPU’s TDP at a constant 104 W. Starting with the fourth iteration, this maximum TDP was only applied for about one second at the very beginning of each run and dropped to around 53 W thereafter.
On battery, CPU performance decreased by around 30 to 40 %, partly because performance mode for the fans is not available on battery.
* ... smaller is better
System Performance
System performance was on a par with the larger 17-inch Razer Blade Pro 17, around 2-20 % faster than on the Key 15, and much faster than on the previous Pro 15. With that said the differences between the various devices in our comparison group were not overly dramatic by and large.
| PCMark 10 Score | 6333 points | |
Help | ||
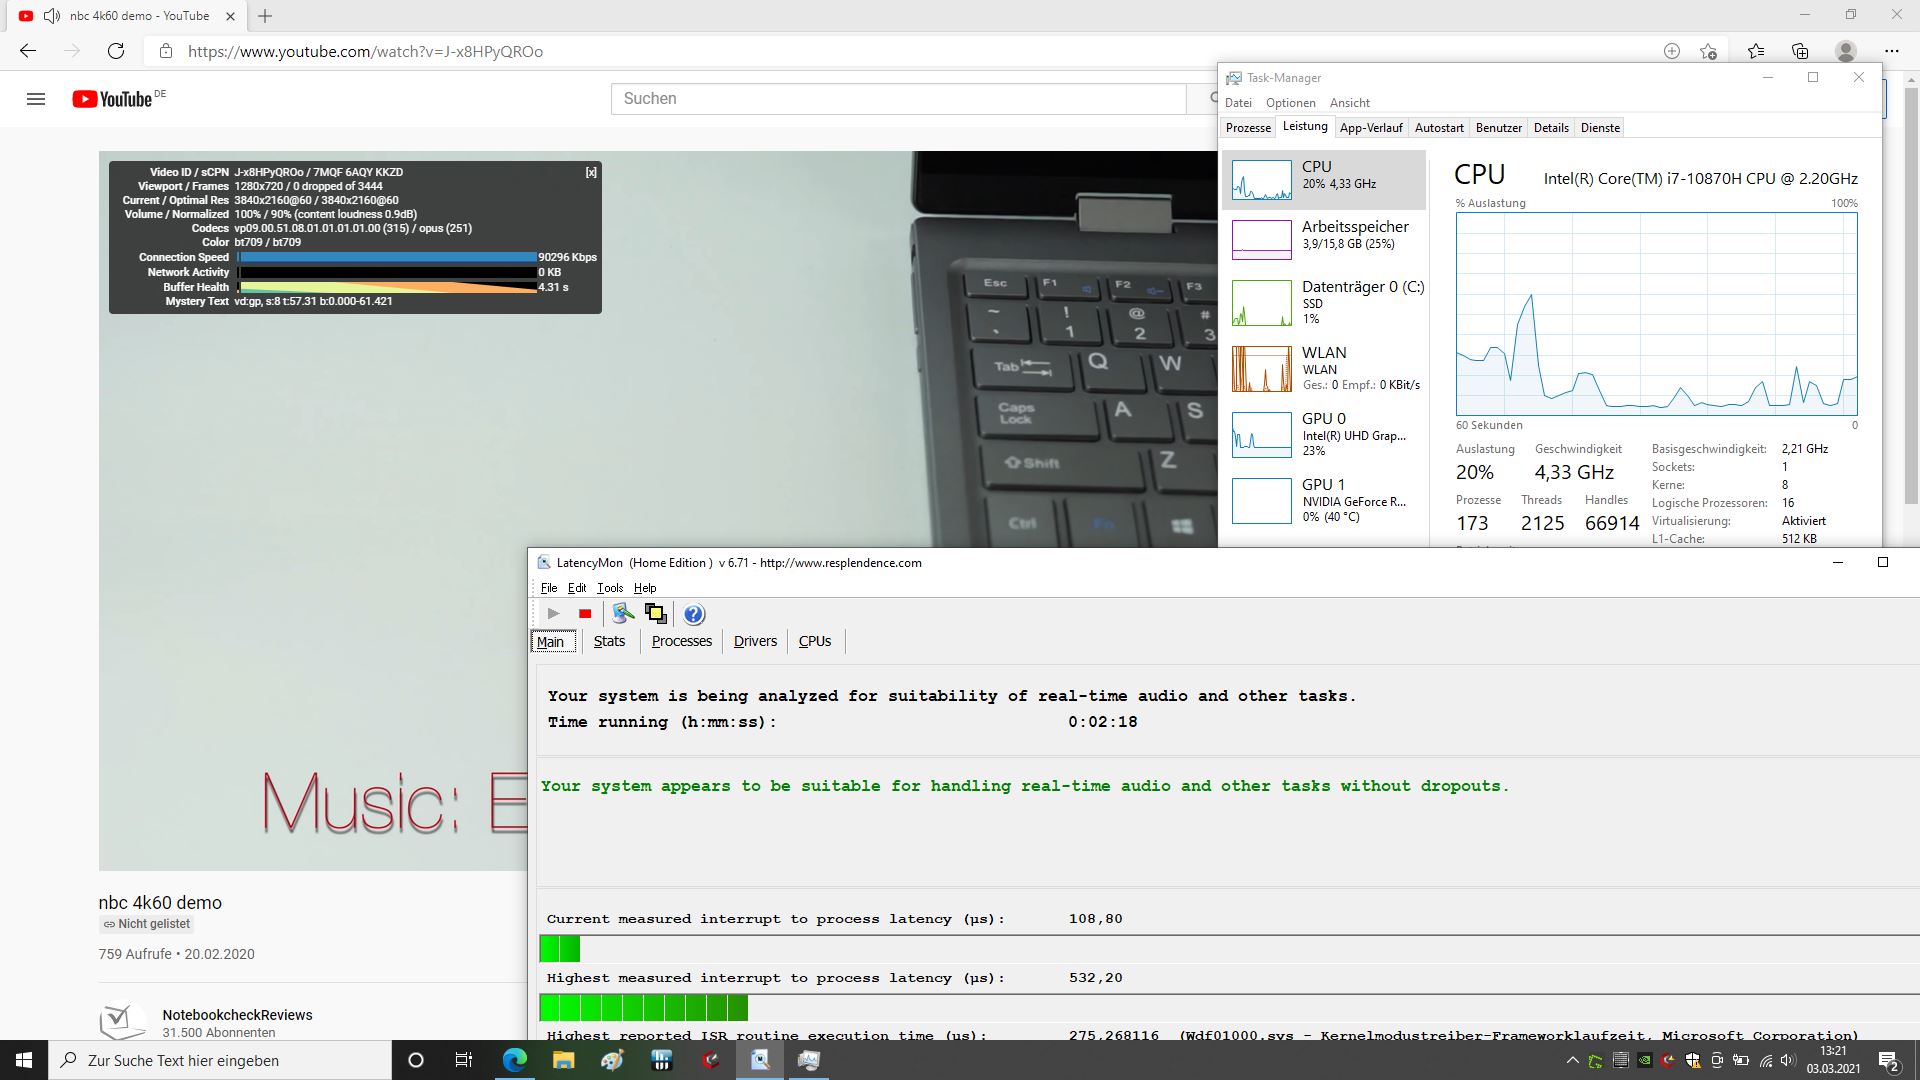
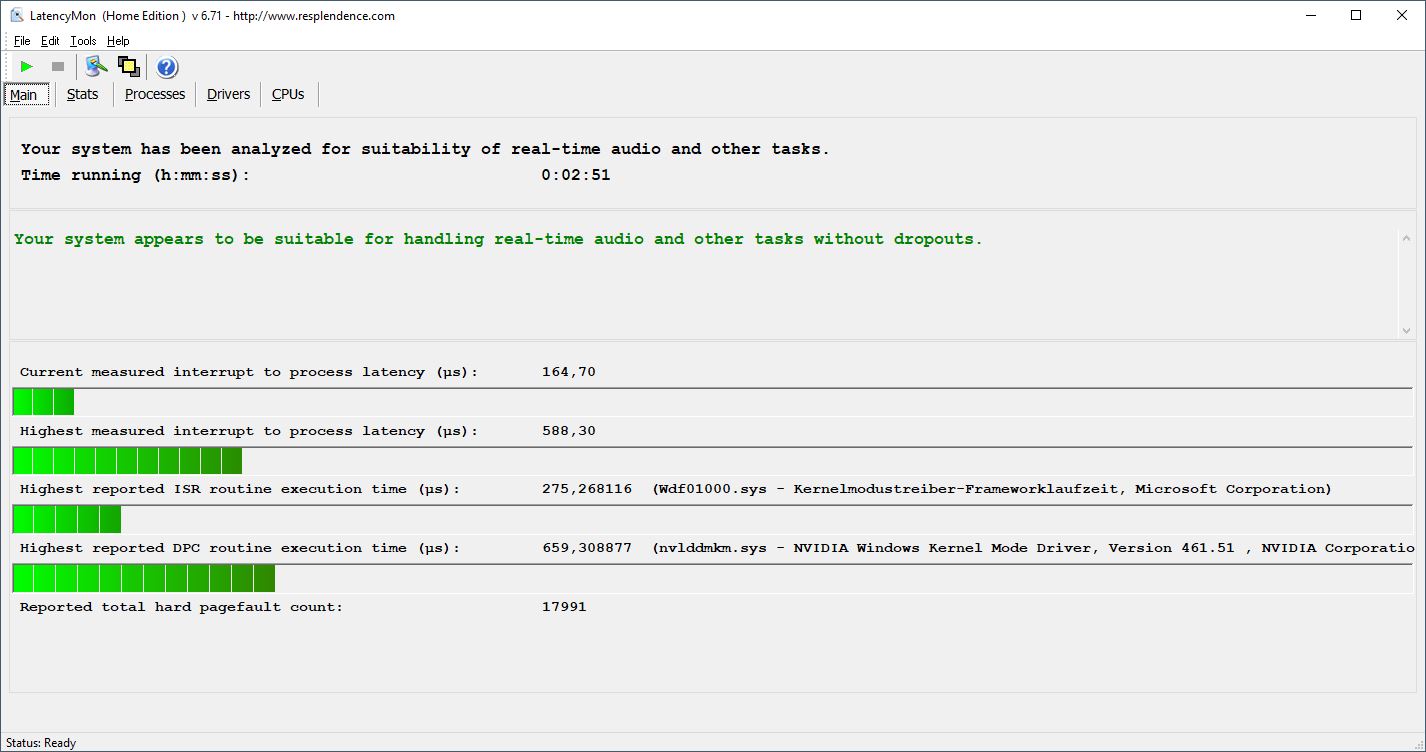
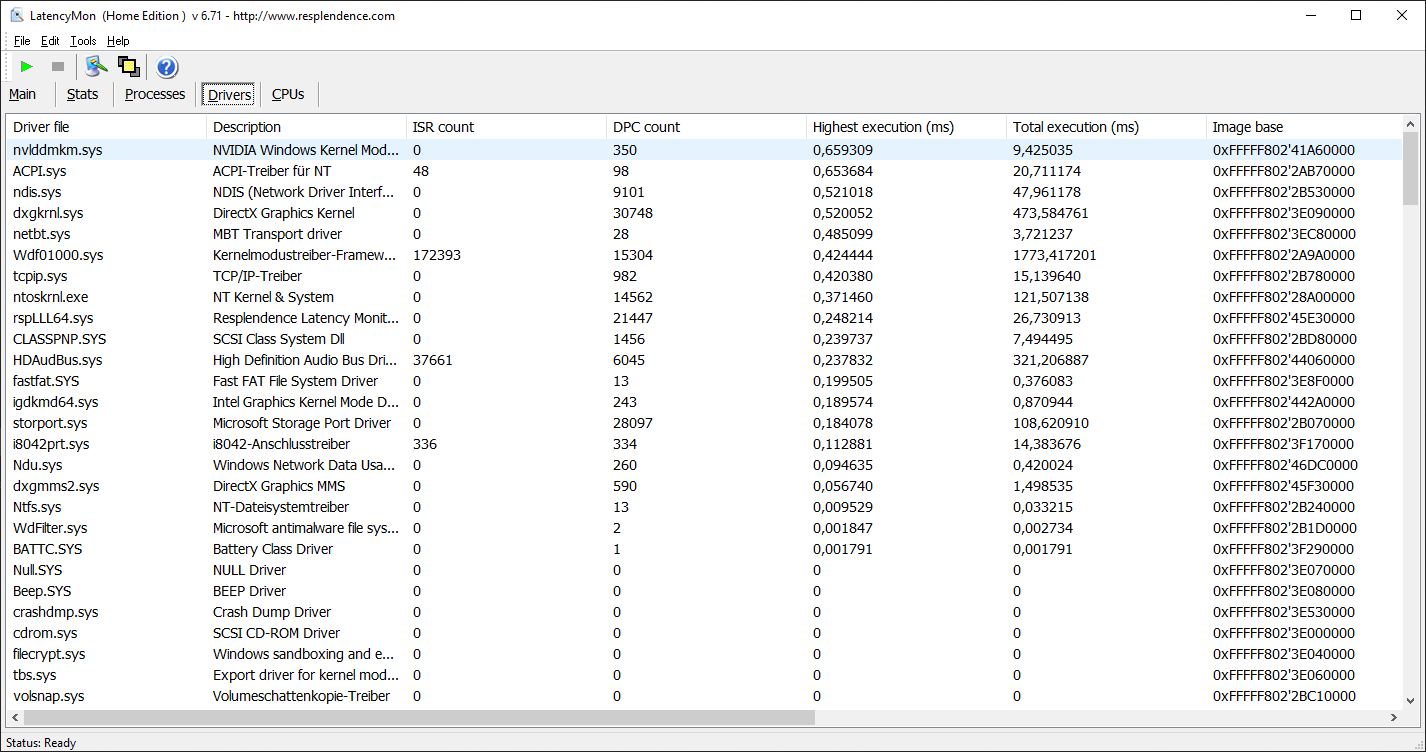
DPC Latencies
Thankfully, the Pro 15 turned out to be free of latency issues. LatencyMon found no evidence thereof when opening multiple tabs or playing our usual 4K 60 fps YouTube video.
| DPC Latencies / LatencyMon - interrupt to process latency (max), Web, Youtube, Prime95 | |
| Razer Blade Pro 17 2021 (QHD Touch) | |
| Asus ROG Zephyrus Duo 15 SE GX551QS | |
| Schenker XMG Pro 15 (Early 2021, RTX 3080) | |
| Asus ROG Zephyrus G15 GA503Q | |
| Schenker Key 15 Comet Lake | |
* ... smaller is better
Storage Devices
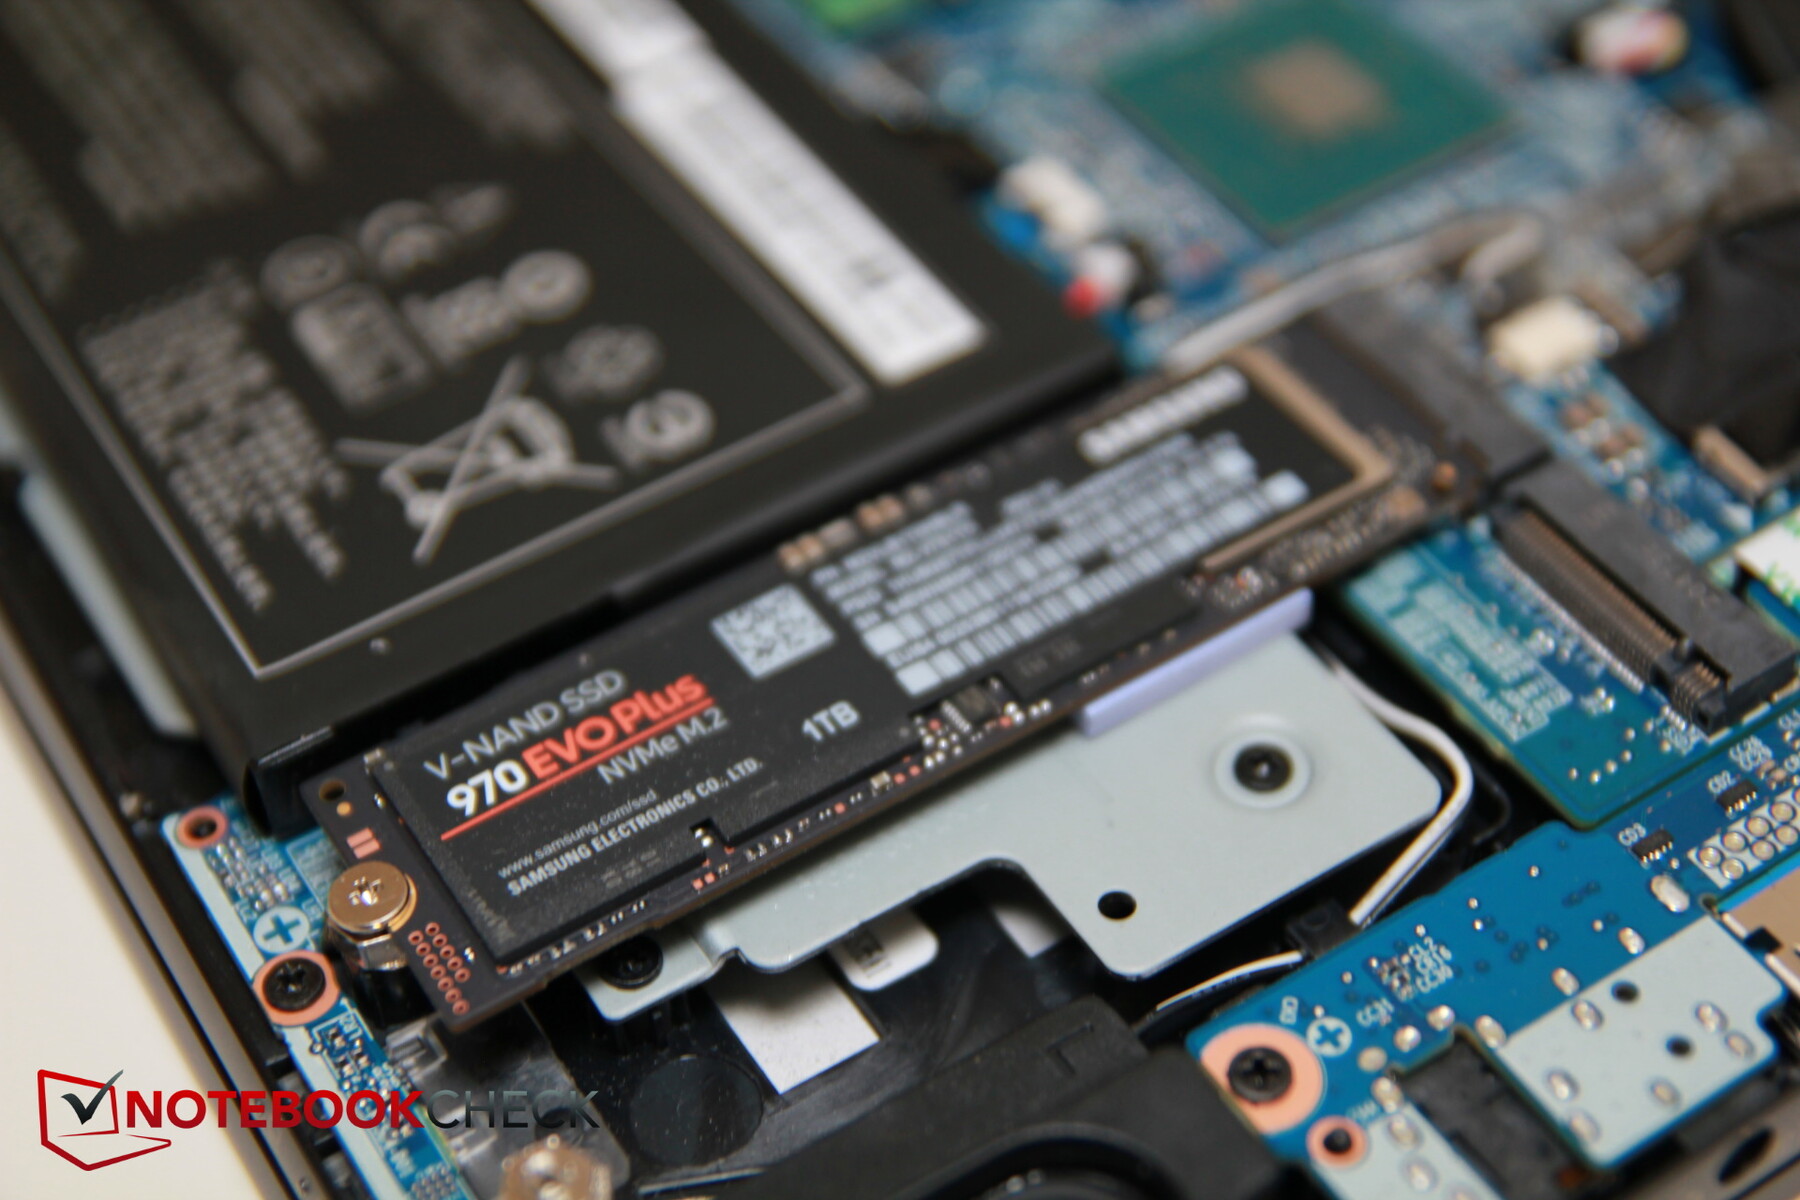
Schenker’s configurator offers various SSDs by numerous manufacturers with different size options to choose from. Our review unit came equipped with a 1 TB Samsung SSD 970 EVO Plus, which can be found on #20 on our SSD/HDD comparison table and can thus be considered a fairly fast SSD overall. Our review unit even managed to outperform our reference unit but was in turn outperformed by the Key 15’s SSD. With that said those differences will be mostly unnoticeable during everyday use.
The secondary slot can be equipped with the same choice of SSDs as the primary. With both slots populated the SSDs can be setup in a RAID 0 or RAID 1 array.
| Schenker XMG Pro 15 (Early 2021, RTX 3080) Samsung SSD 970 EVO Plus 1TB | Schenker Key 15 Comet Lake Samsung SSD 970 EVO Plus 1TB | Schenker XMG Pro 15 Samsung SSD 970 EVO Plus 500GB | Asus ROG Zephyrus G15 GA503Q SK Hynix HFM001TD3JX013N | Asus ROG Zephyrus Duo 15 SE GX551QS 2x Samsung PM981a MZVLB1T0HBLR (RAID 0) | Razer Blade Pro 17 2021 (QHD Touch) Samsung PM981a MZVLB1T0HBLR | Average Samsung SSD 970 EVO Plus 1TB | |
|---|---|---|---|---|---|---|---|
| CrystalDiskMark 5.2 / 6 | 4% | -11% | -6% | 30% | -18% | -6% | |
| Write 4K (MB/s) | 160.9 | 193 20% | 120.6 -25% | 156.4 -3% | 229.7 43% | 123.5 -23% | 155.5 ? -3% |
| Read 4K (MB/s) | 54 | 54.3 1% | 46.13 -15% | 66.7 24% | 47.13 -13% | 45.96 -15% | 51.6 ? -4% |
| Write Seq (MB/s) | 2944 | 2988 1% | 2900 -1% | 2318 -21% | 4455 51% | 1861 -37% | 2660 ? -10% |
| Read Seq (MB/s) | 2781 | 2633 -5% | 2929 5% | 2151 -23% | 2933 5% | 1584 -43% | 2390 ? -14% |
| Write 4K Q32T1 (MB/s) | 495.2 | 540 9% | 372.2 -25% | 525 6% | 597 21% | 466.4 -6% | 447 ? -10% |
| Read 4K Q32T1 (MB/s) | 593 | 620 5% | 422.2 -29% | 452.1 -24% | 387 -35% | 566 -5% | 544 ? -8% |
| Write Seq Q32T1 (MB/s) | 3283 | 3284 0% | 3245 -1% | 3055 -7% | 5623 71% | 2981 -9% | 3296 ? 0% |
| Read Seq Q32T1 (MB/s) | 3549 | 3564 0% | 3565 0% | 3607 2% | 7042 98% | 3260 -8% | 3551 ? 0% |
| AS SSD | -12% | -5% | -22% | -23% | -55% | -10% | |
| Seq Read (MB/s) | 2959 | 2928 -1% | 2975 1% | 2950 0% | 3010 2% | 2068 -30% | 2800 ? -5% |
| Seq Write (MB/s) | 2521 | 2733 8% | 2597 3% | 1600 -37% | 3116 24% | 2047 -19% | 2633 ? 4% |
| 4K Read (MB/s) | 50.9 | 51.6 1% | 62.3 22% | 53.6 5% | 49.58 -3% | 47.85 -6% | 51.2 ? 1% |
| 4K Write (MB/s) | 141.1 | 129.8 -8% | 150.9 7% | 126.8 -10% | 185 31% | 87.4 -38% | 131.2 ? -7% |
| 4K-64 Read (MB/s) | 2110 | 1838 -13% | 1508 -29% | 1429 -32% | 1401 -34% | 1932 -8% | 1839 ? -13% |
| 4K-64 Write (MB/s) | 2329 | 2291 -2% | 2239 -4% | 2177 -7% | 1426 -39% | 2017 -13% | 2144 ? -8% |
| Access Time Read * (ms) | 0.034 | 0.062 -82% | 0.038 -12% | 0.064 -88% | 0.037 -9% | 0.055 -62% | 0.04528 ? -33% |
| Access Time Write * (ms) | 0.026 | 0.029 -12% | 0.025 4% | 0.029 -12% | 0.061 -135% | 0.128 -392% | 0.03128 ? -20% |
| Score Read (Points) | 2457 | 2183 -11% | 1868 -24% | 1778 -28% | 1751 -29% | 2187 -11% | 2171 ? -12% |
| Score Write (Points) | 2722 | 2694 -1% | 2649 -3% | 2464 -9% | 1923 -29% | 2309 -15% | 2539 ? -7% |
| Score Total (Points) | 6412 | 5984 -7% | 5463 -15% | 5090 -21% | 4580 -29% | 5612 -12% | 5812 ? -9% |
| Total Average (Program / Settings) | -4% /
-5% | -8% /
-7% | -14% /
-15% | 4% /
-0% | -37% /
-40% | -8% /
-8% |
* ... smaller is better

Sustained read: DiskSpd Read Loop, Queue Depth 8
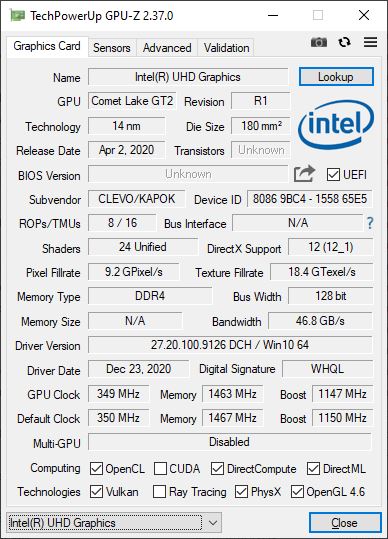
GPU Performance
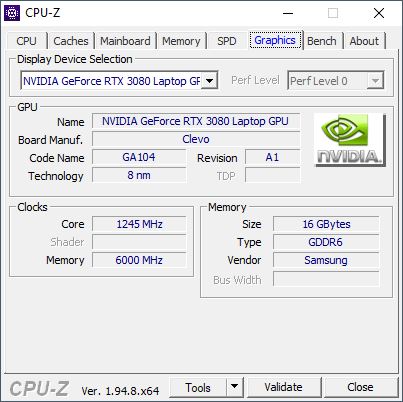
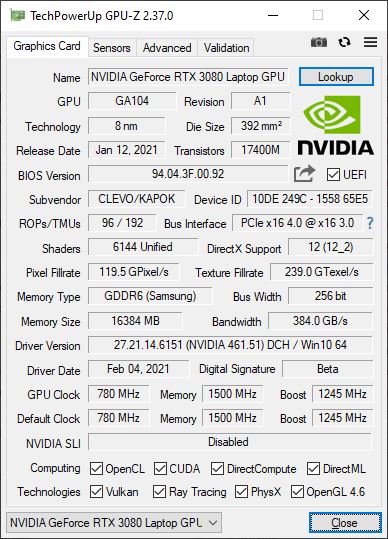
The laptop is equipped with an integrated Intel UHD Graphics 630 as well as a dedicated Nvidia Geforce RTX 3080 GPU, and with Advanced Optimus (DDS) Nvidia has finally found a way to support both Optimus and G-Sync simultaneously. However, only one of the five displays (LG) offers G-Sync support, so our review unit was limited to Optimus support only. Our review unit’s GPU is the most powerful dedicated GPU currently available for use in laptops. However, Nvidia gives OEMs a very wide window of adjustment for the chip’s TGP. The Pro 15’s TGP was configured at 90 W plus 15 W Dynamic Boost 2.0 in performance mode, aka a maximum of 105 W. Nvidia’s specified maximum for the RTX 3080 is a much higher 150+ W.
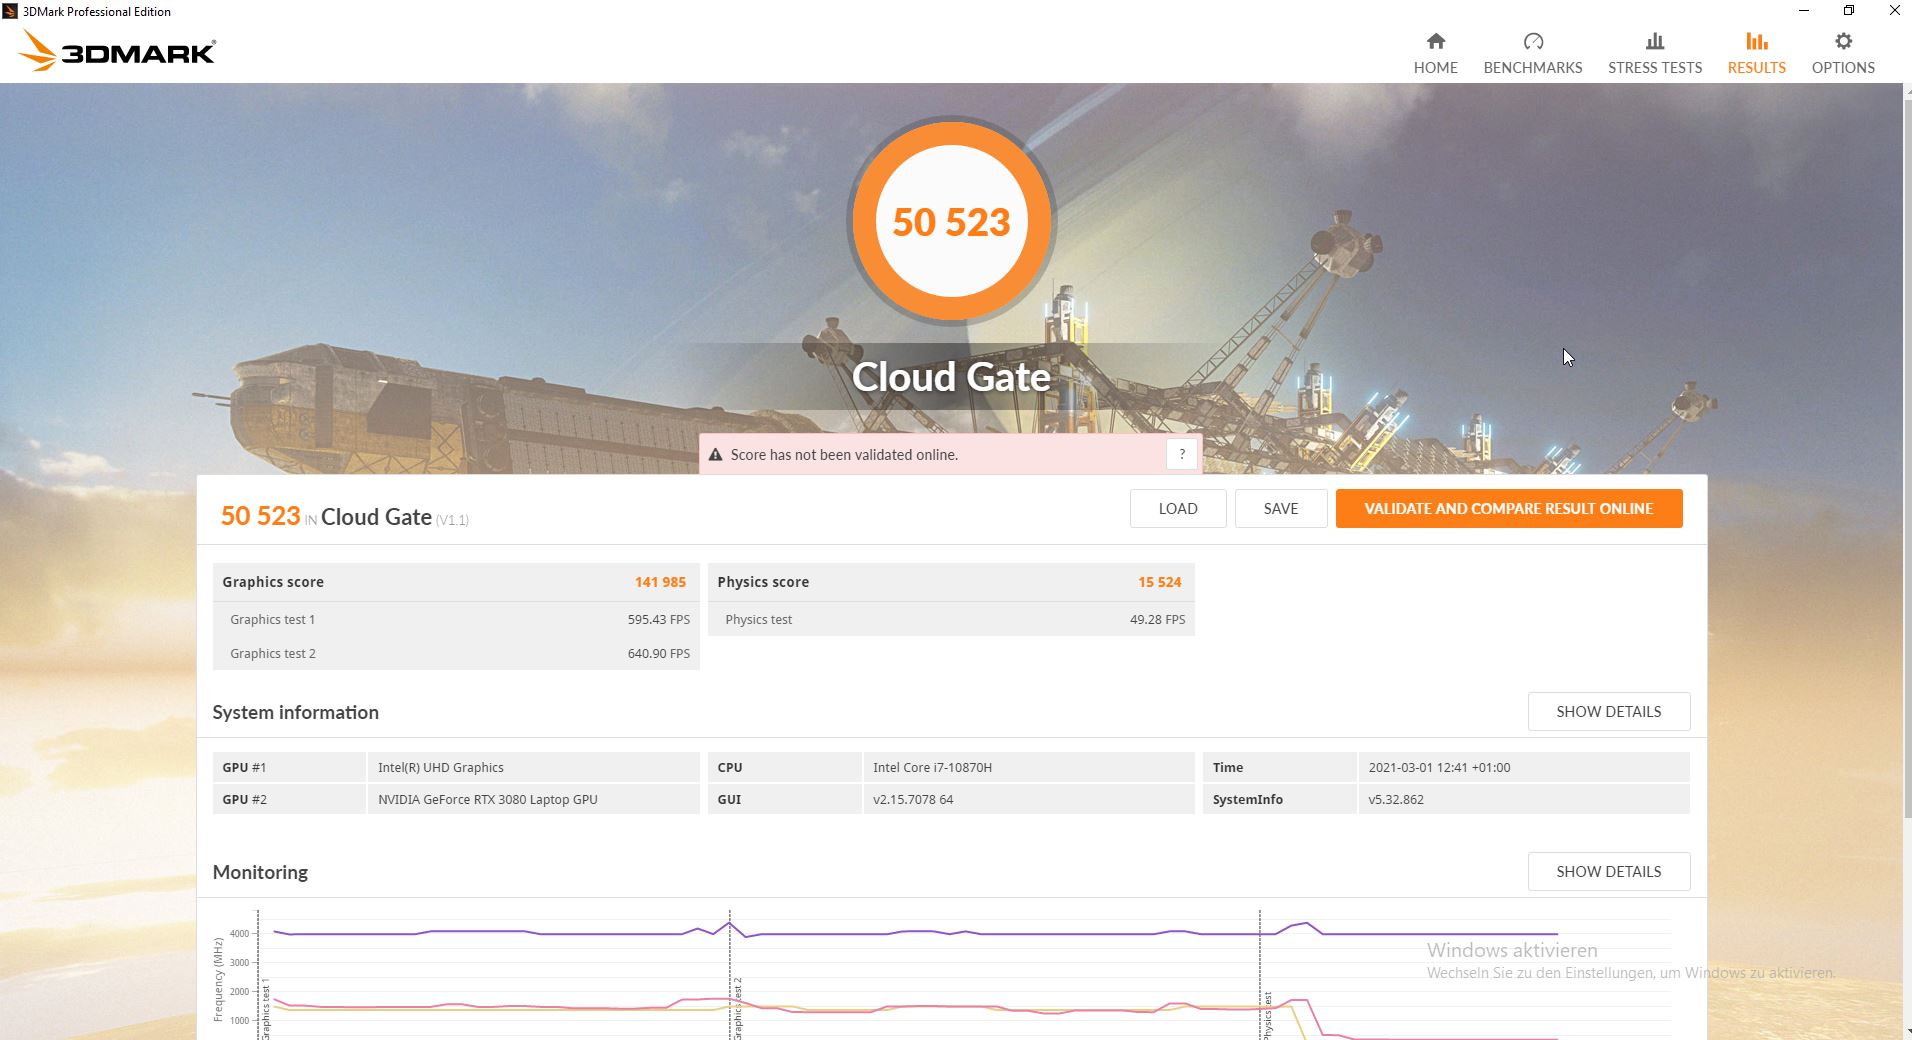
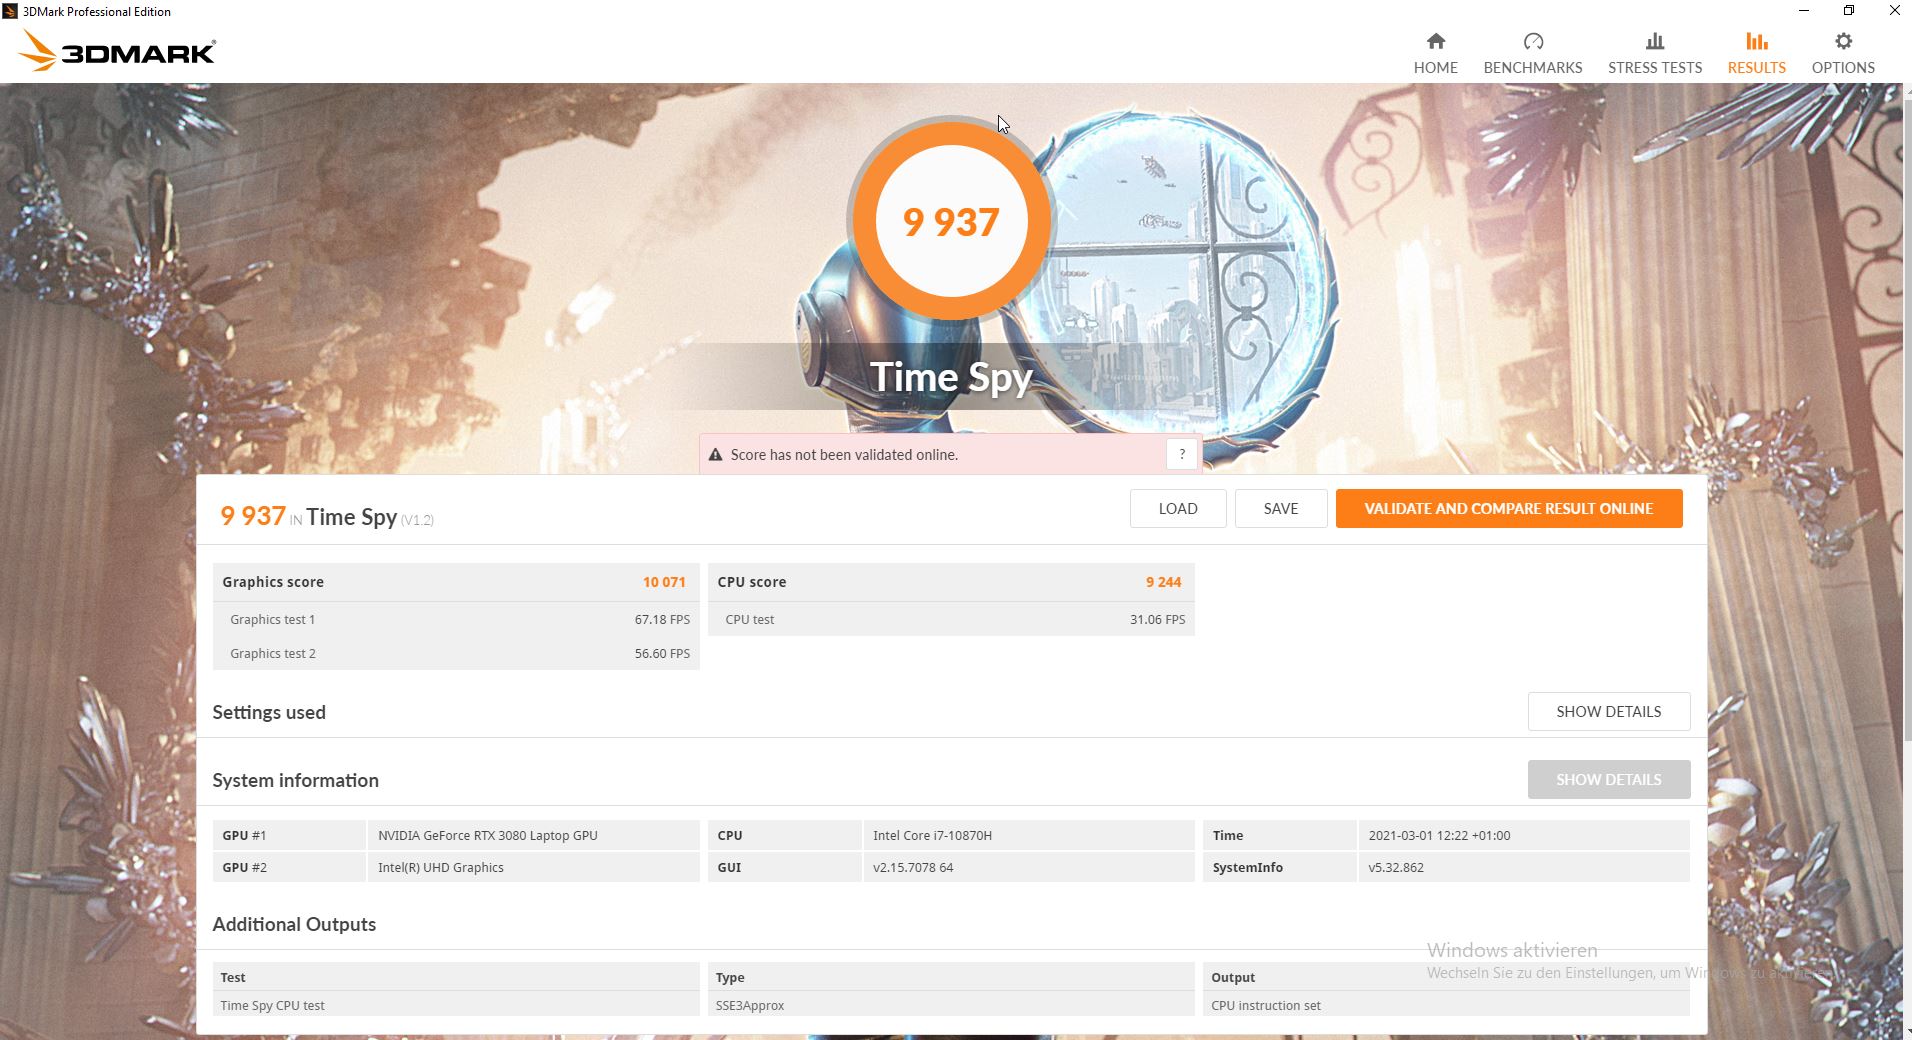
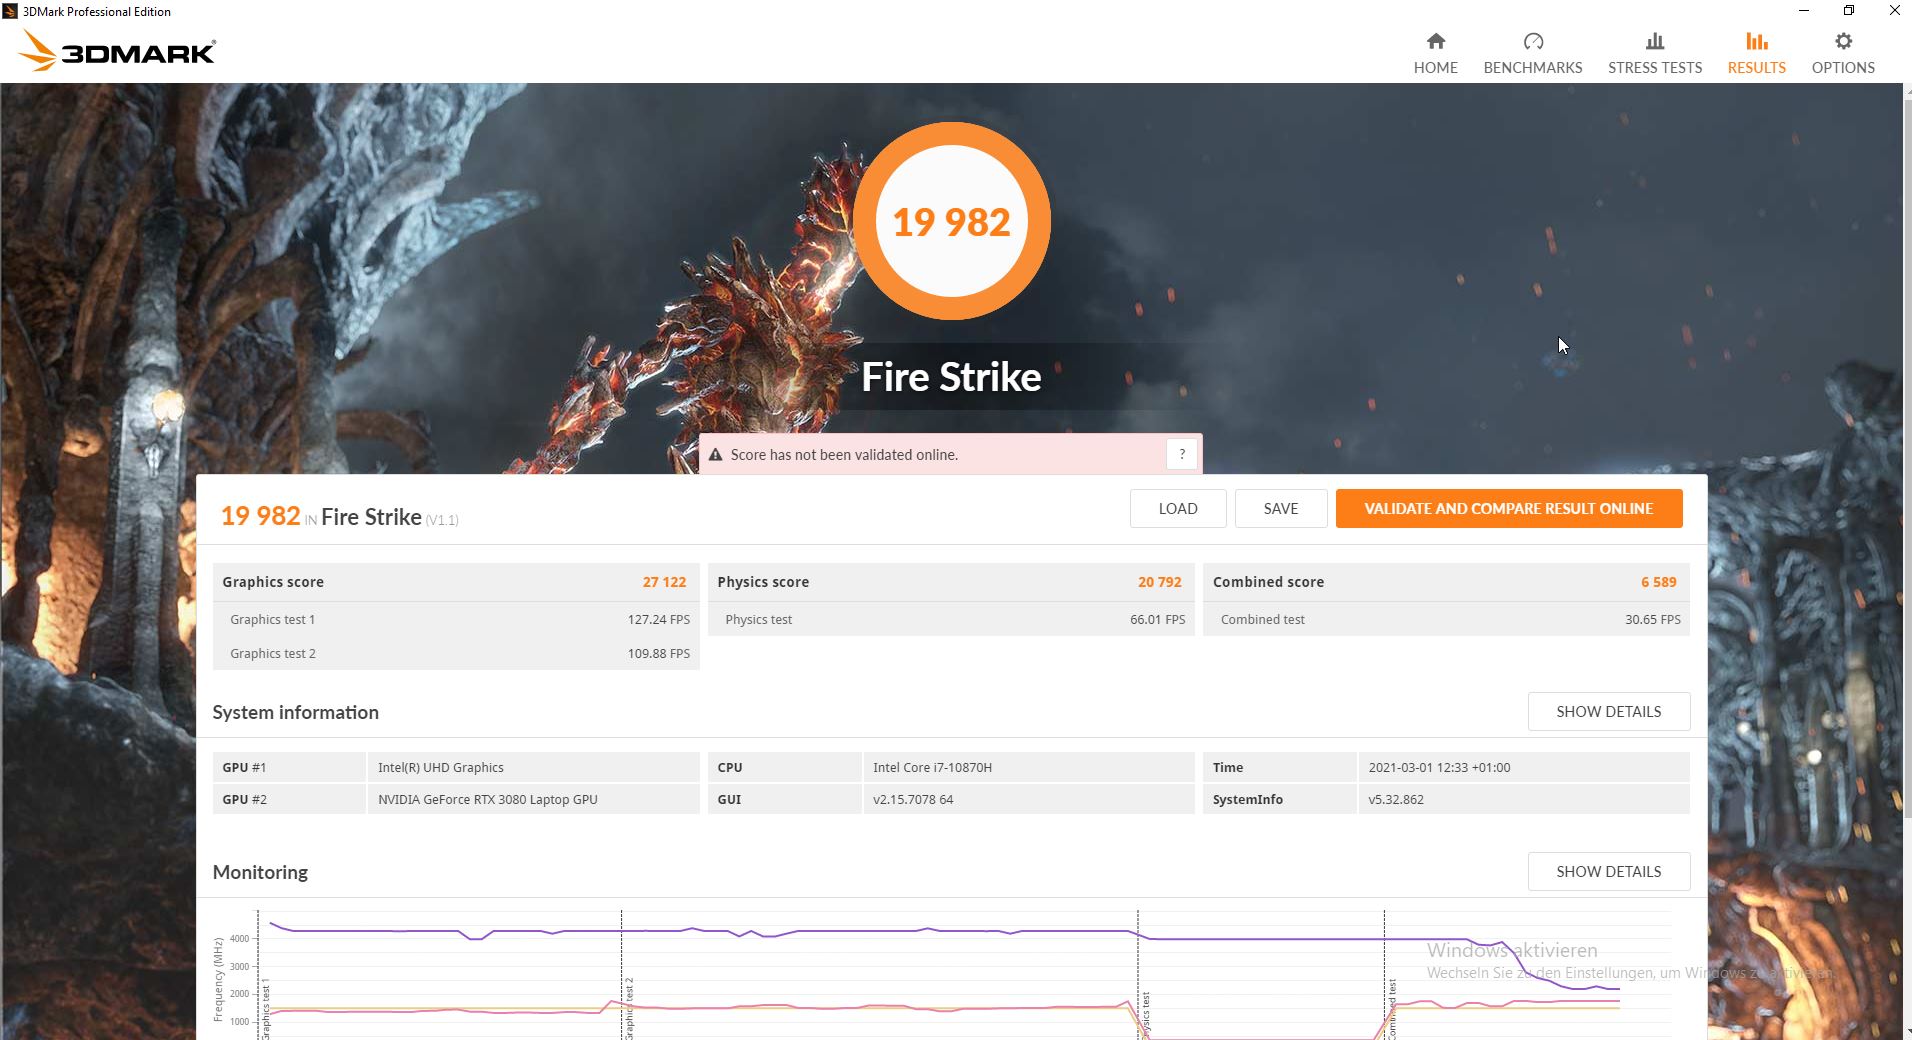
When running 3DMark the new Pro 15 was around 20 % faster than the Key 15. In most tests, the 100 W Razer Blade performed similarly while the 130 W Asus ROG Zephyrus Duo 15 was more often than not slightly faster.
GPU performance plummeted dramatically on battery. Running 3DMark 11 on battery yielded an 86 % lower score than before.

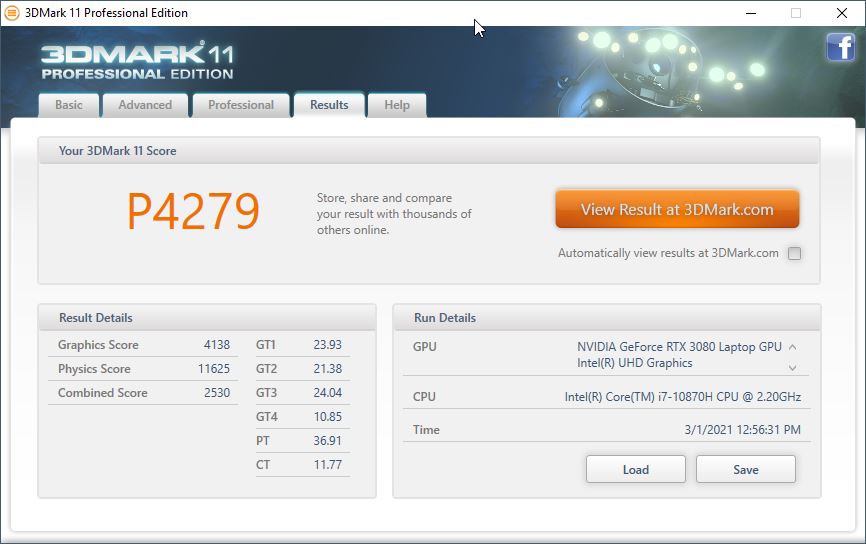
| 3DMark 11 Performance | 26729 points | |
| 3DMark Cloud Gate Standard Score | 50523 points | |
| 3DMark Fire Strike Score | 19982 points | |
| 3DMark Time Spy Score | 9937 points | |
Help | ||
Gaming Performance
When running our gaming benchmarks, the Pro 15’s GPU was between 4 to 8 % slower than the average RTX 3080-equipped laptop. The RTX 2080 Super-equipped Key 15 was at eye level most of the time, and both Asus laptops were noticeably faster.
Nevertheless, overall gaming performance was very high and impressive considering the laptop’s thin design. Even current games will run smoothly at around 100 FPS in FHD on maximum details.
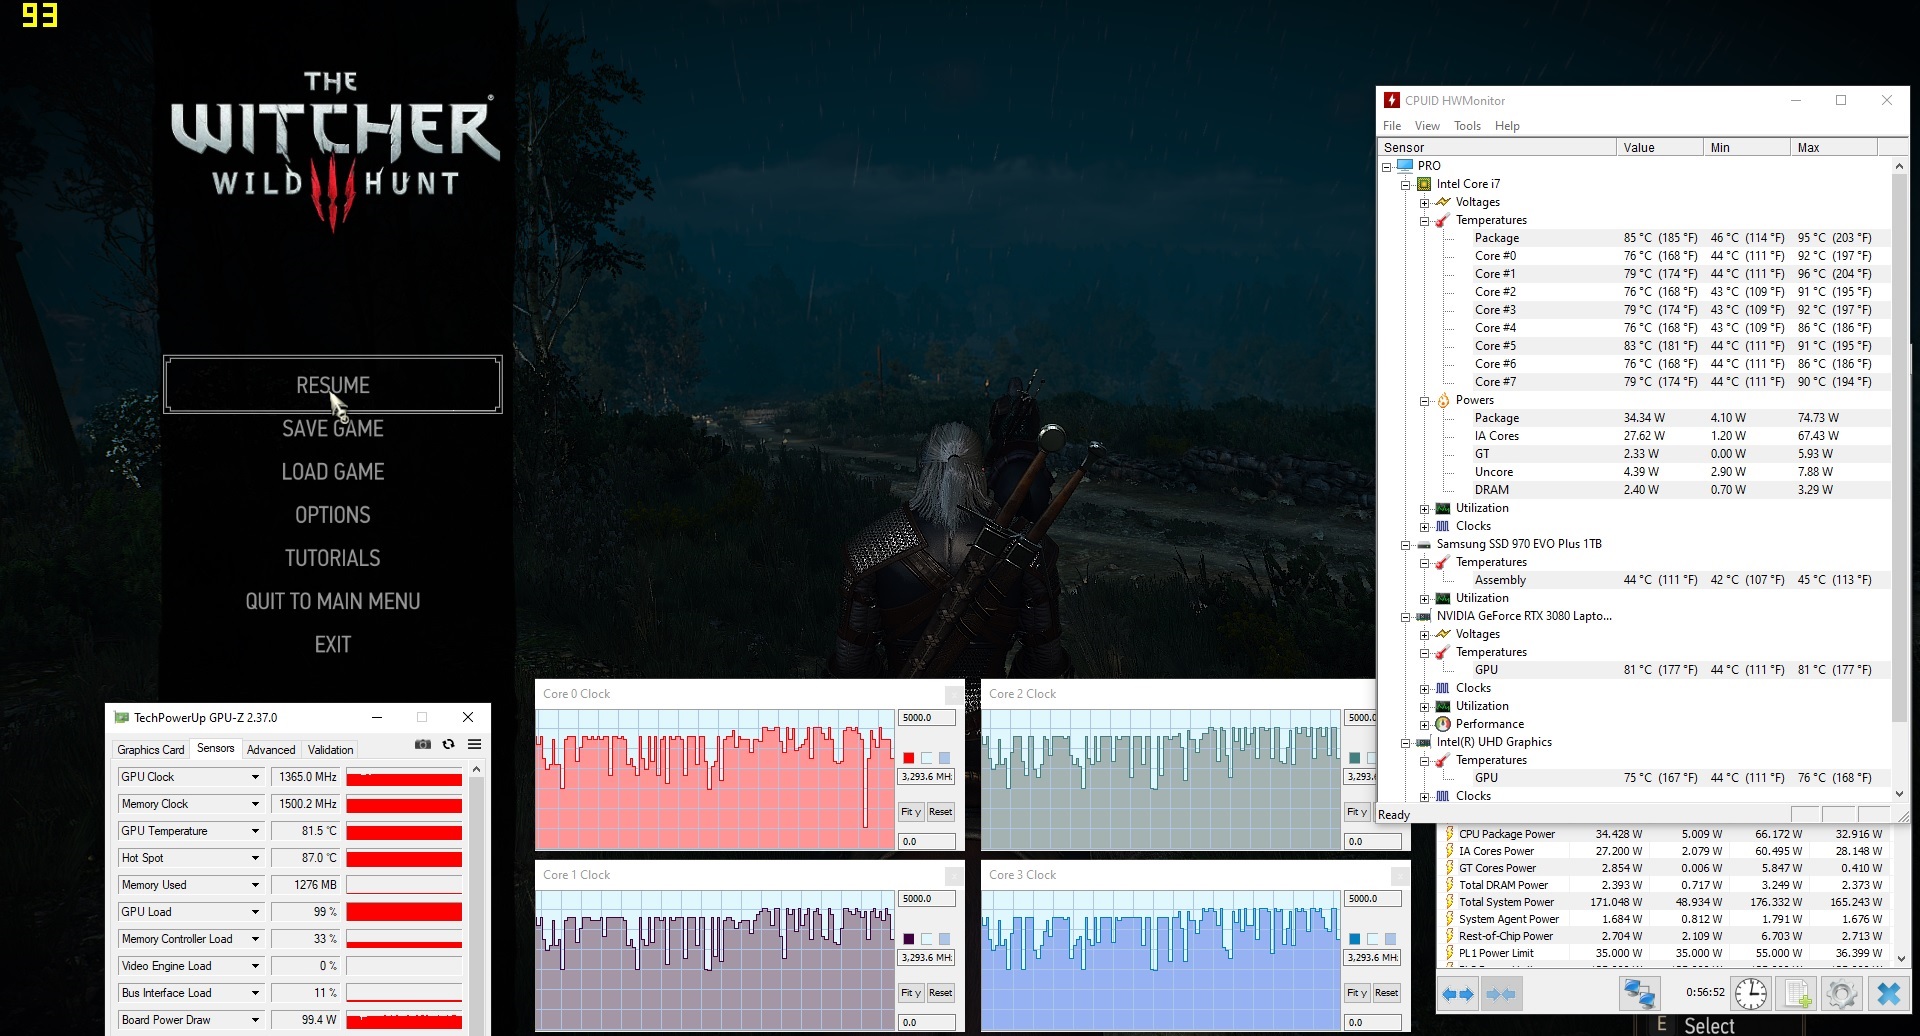
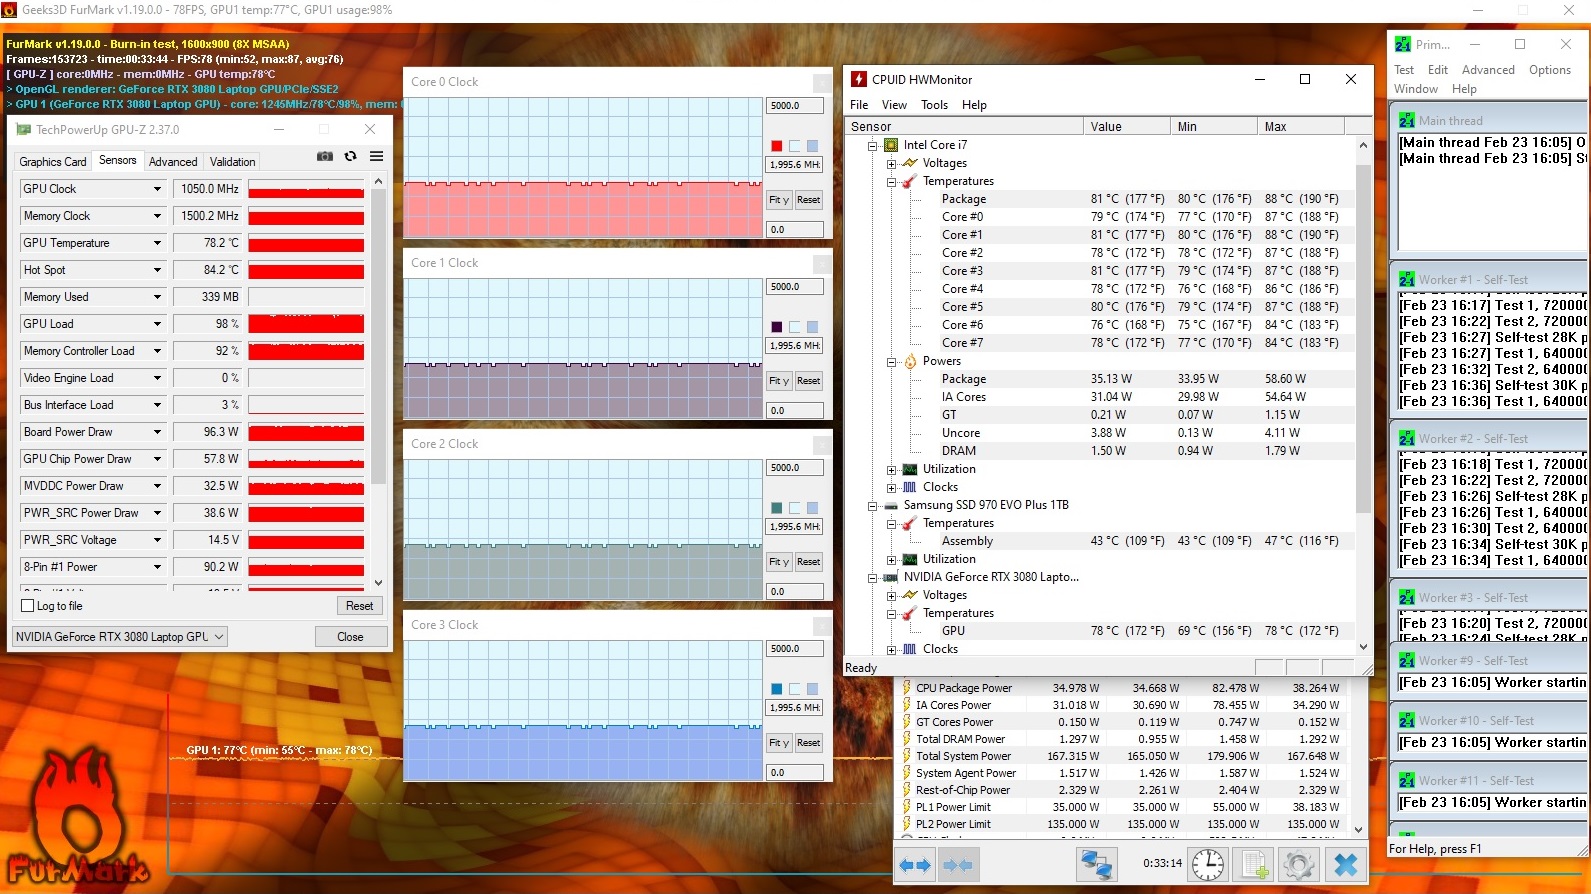
When running our Witcher 3 loop the framerate dropped slightly by around 8 % over time, and the device almost passed but ultimately failed our Fire Strike Ultra stress test with around 95.8 %.
| low | med. | high | ultra | |
|---|---|---|---|---|
| The Witcher 3 (2015) | 320.7 | 259.2 | 165.2 | 97.6 |
| Dota 2 Reborn (2015) | 150 | 133 | 124 | 118 |
| Rise of the Tomb Raider (2016) | 283.7 | 210 | 157.2 | 139.5 |
| X-Plane 11.11 (2018) | 106 | 90.4 | 80 | |
| Shadow of the Tomb Raider (2018) | 140 | 108 | 103 | 100 |
Emissions – Noisy and Hot, as Expected
Noise Emissions
In this day and age and with modern hardware, nobody should expect a silent mode of operation with components this powerful. When gaming the fans ramped up to up to 52 dB(A), and under maximum load they maxed out at an even louder 58 dB(A). Some competitors, both by Schenker and other manufacturers like Razer, were similarly loud while both of Asus’s gaming notebooks were not only quieter but also faster thanks to their Ryzen CPUs. The fans were almost never off and practically always audible even with the device idling, and they were often louder than on the Pro 15’s competitors.
Noise level
| Idle |
| 33 / 34 / 35 dB(A) |
| Load |
| 51 / 57 dB(A) |
 | ||
30 dB silent 40 dB(A) audible 50 dB(A) loud |
||
min: | ||
| Schenker XMG Pro 15 (Early 2021, RTX 3080) i7-10870H, GeForce RTX 3080 Laptop GPU | Schenker Key 15 Comet Lake i7-10875H, GeForce RTX 2080 Super Max-Q | Schenker XMG Pro 15 i7-9750H, GeForce RTX 2070 Mobile | Asus ROG Zephyrus G15 GA503Q R9 5900HS, GeForce RTX 3080 Laptop GPU | Asus ROG Zephyrus Duo 15 SE GX551QS R9 5900HX, GeForce RTX 3080 Laptop GPU | Razer Blade Pro 17 2021 (QHD Touch) i7-10875H, GeForce RTX 3080 Laptop GPU | |
|---|---|---|---|---|---|---|
| Noise | 3% | -5% | 11% | 16% | 9% | |
| off / environment * (dB) | 25 | 25 -0% | 30 -20% | 25 -0% | 27 -8% | 26.1 -4% |
| Idle Minimum * (dB) | 33 | 26 21% | 30 9% | 26 21% | 27 18% | 26.1 21% |
| Idle Average * (dB) | 34 | 27 21% | 32 6% | 27 21% | 27 21% | 26.5 22% |
| Idle Maximum * (dB) | 35 | 44 -26% | 40 -14% | 31 11% | 27 23% | 30.7 12% |
| Load Average * (dB) | 51 | 53 -4% | 56 -10% | 49 4% | 31.2 39% | 43.5 15% |
| Witcher 3 ultra * (dB) | 52 | 51 2% | 55 -6% | 49 6% | 44.5 14% | 54 -4% |
| Load Maximum * (dB) | 57 | 53 7% | 56 2% | 51 11% | 53.5 6% | 55 4% |
* ... smaller is better
Temperature
With up to 66 °C (151 F) at the bottom the Pro 15 turned out to get significantly hotter than the Key 15. With that said we need to keep in mind that most competitors feature larger cases. The similarly thin and small Asus ROG Zephyrus G15 was around 10 °C cooler at the bottom under load (with otherwise similar temperature levels). At least the Pro 15’s palm rests remained comparatively cool.
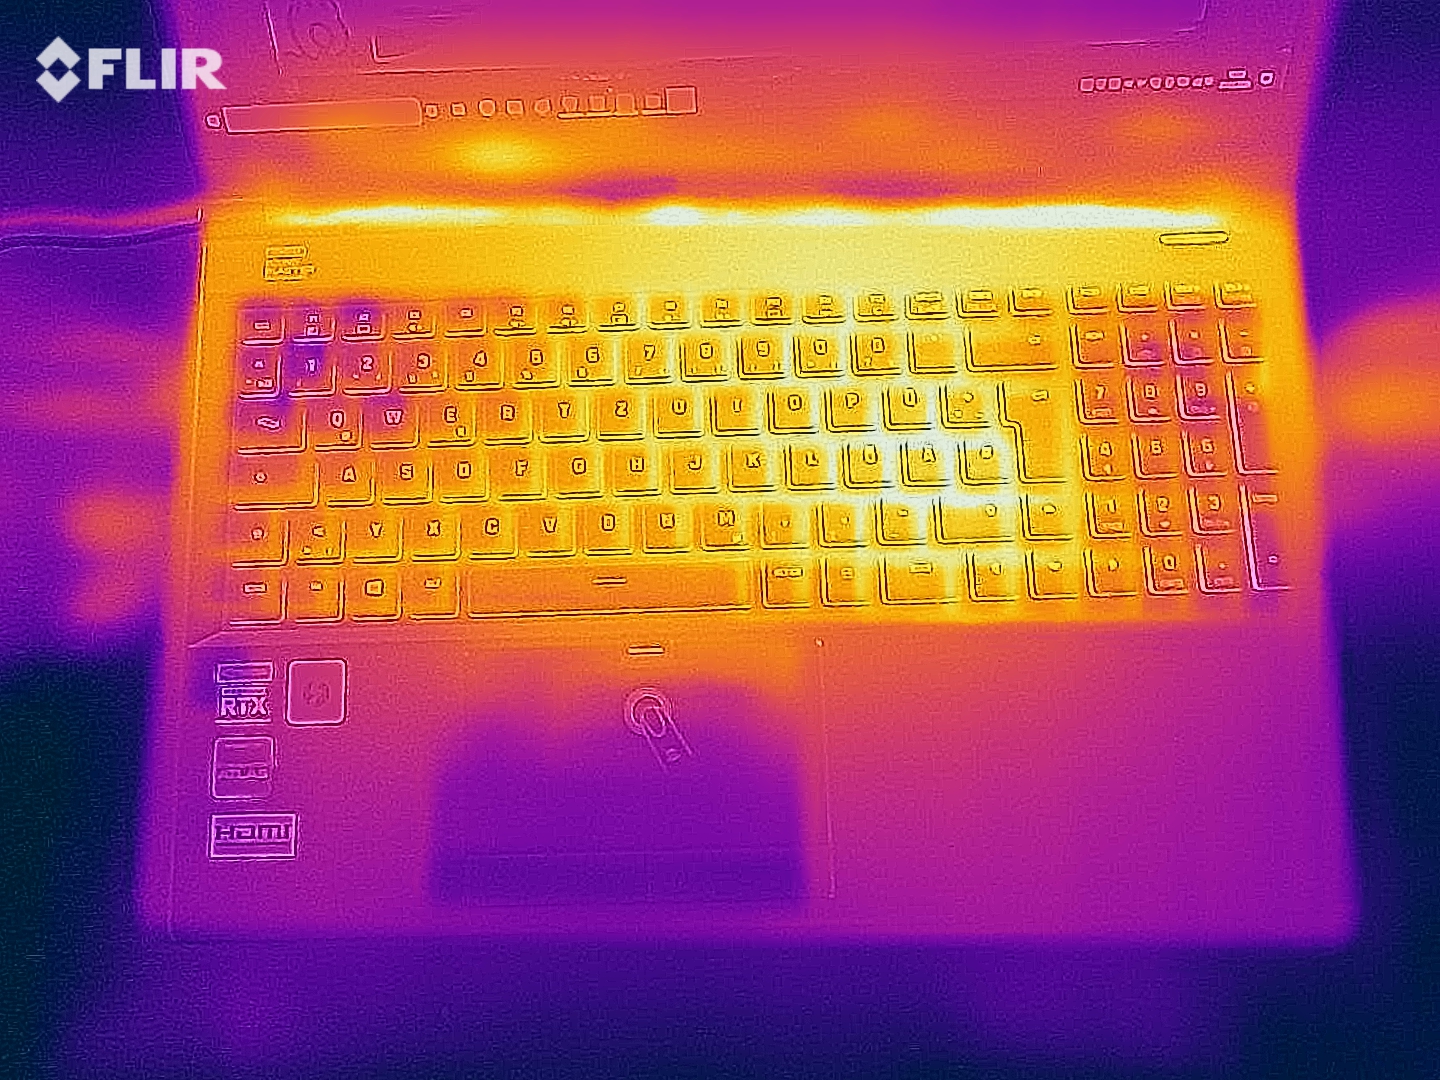
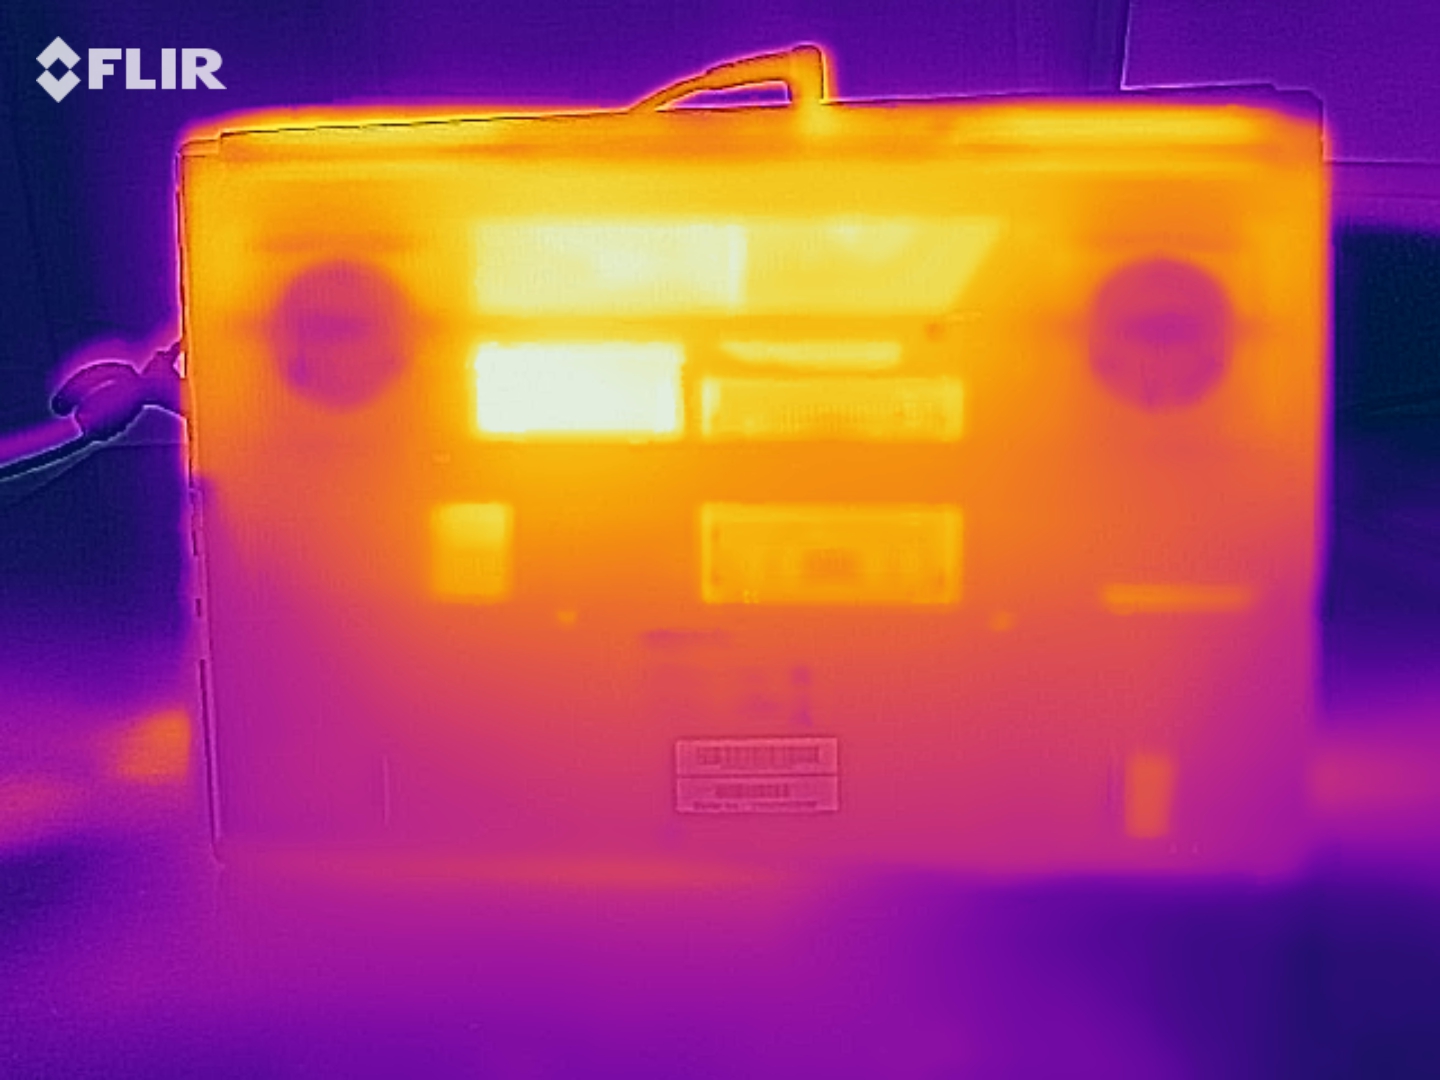
(-) The maximum temperature on the upper side is 51 °C / 124 F, compared to the average of 40.4 °C / 105 F, ranging from 21.2 to 68.8 °C for the class Gaming.
(-) The bottom heats up to a maximum of 66 °C / 151 F, compared to the average of 43.2 °C / 110 F
(+) In idle usage, the average temperature for the upper side is 28.4 °C / 83 F, compared to the device average of 33.9 °C / 93 F.
(-) Playing The Witcher 3, the average temperature for the upper side is 45.3 °C / 114 F, compared to the device average of 33.9 °C / 93 F.
(±) The palmrests and touchpad can get very hot to the touch with a maximum of 39 °C / 102.2 F.
(-) The average temperature of the palmrest area of similar devices was 28.8 °C / 83.8 F (-10.2 °C / -18.4 F).
| Schenker XMG Pro 15 (Early 2021, RTX 3080) i7-10870H, GeForce RTX 3080 Laptop GPU | Schenker Key 15 Comet Lake i7-10875H, GeForce RTX 2080 Super Max-Q | Schenker XMG Pro 15 i7-9750H, GeForce RTX 2070 Mobile | Asus ROG Zephyrus G15 GA503Q R9 5900HS, GeForce RTX 3080 Laptop GPU | Asus ROG Zephyrus Duo 15 SE GX551QS R9 5900HX, GeForce RTX 3080 Laptop GPU | Razer Blade Pro 17 2021 (QHD Touch) i7-10875H, GeForce RTX 3080 Laptop GPU | |
|---|---|---|---|---|---|---|
| Heat | 1% | 17% | 5% | 15% | 11% | |
| Maximum Upper Side * (°C) | 51 | 52 -2% | 43 16% | 51 -0% | 33.4 35% | 38.2 25% |
| Maximum Bottom * (°C) | 66 | 62 6% | 43 35% | 56 15% | 45 32% | 42.2 36% |
| Idle Upper Side * (°C) | 32 | 31 3% | 29 9% | 29 9% | 30.8 4% | 33.6 -5% |
| Idle Bottom * (°C) | 32 | 33 -3% | 30 6% | 34 -6% | 35.4 -11% | 36.2 -13% |
* ... smaller is better
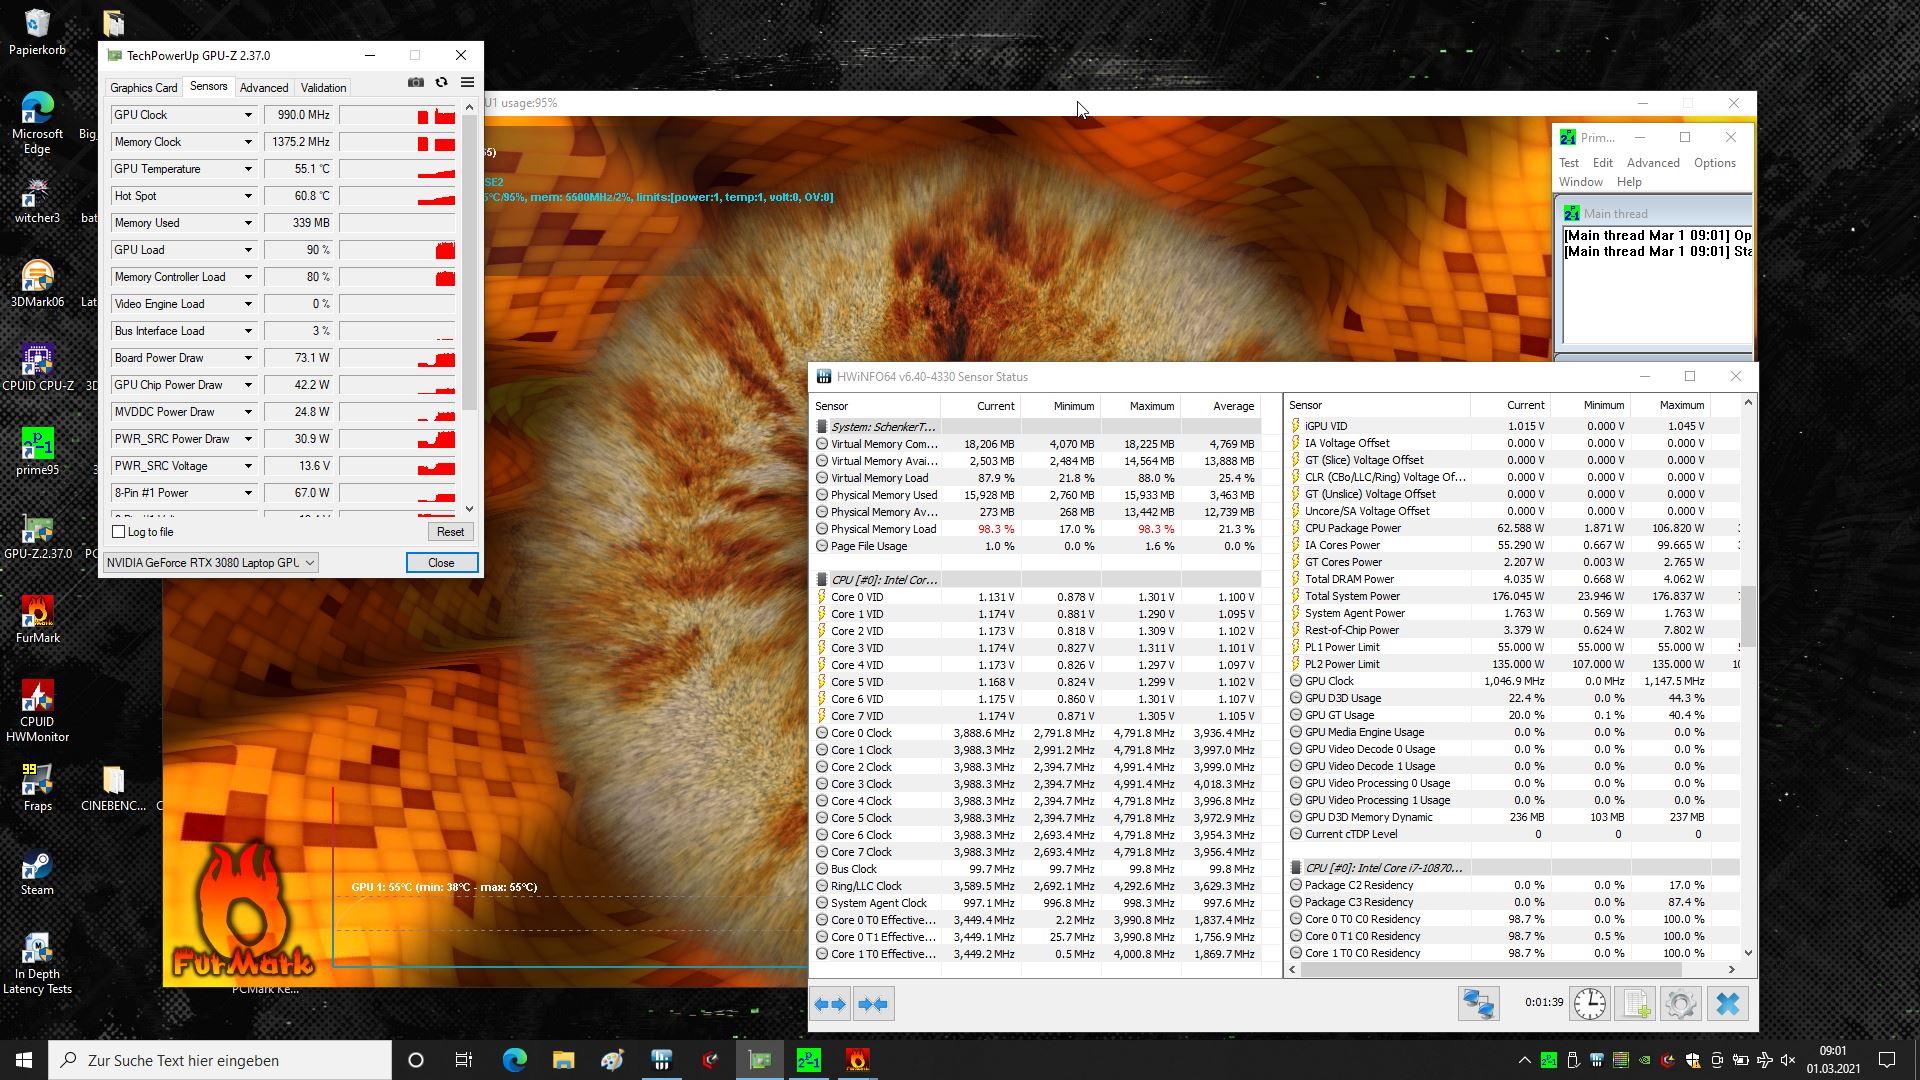
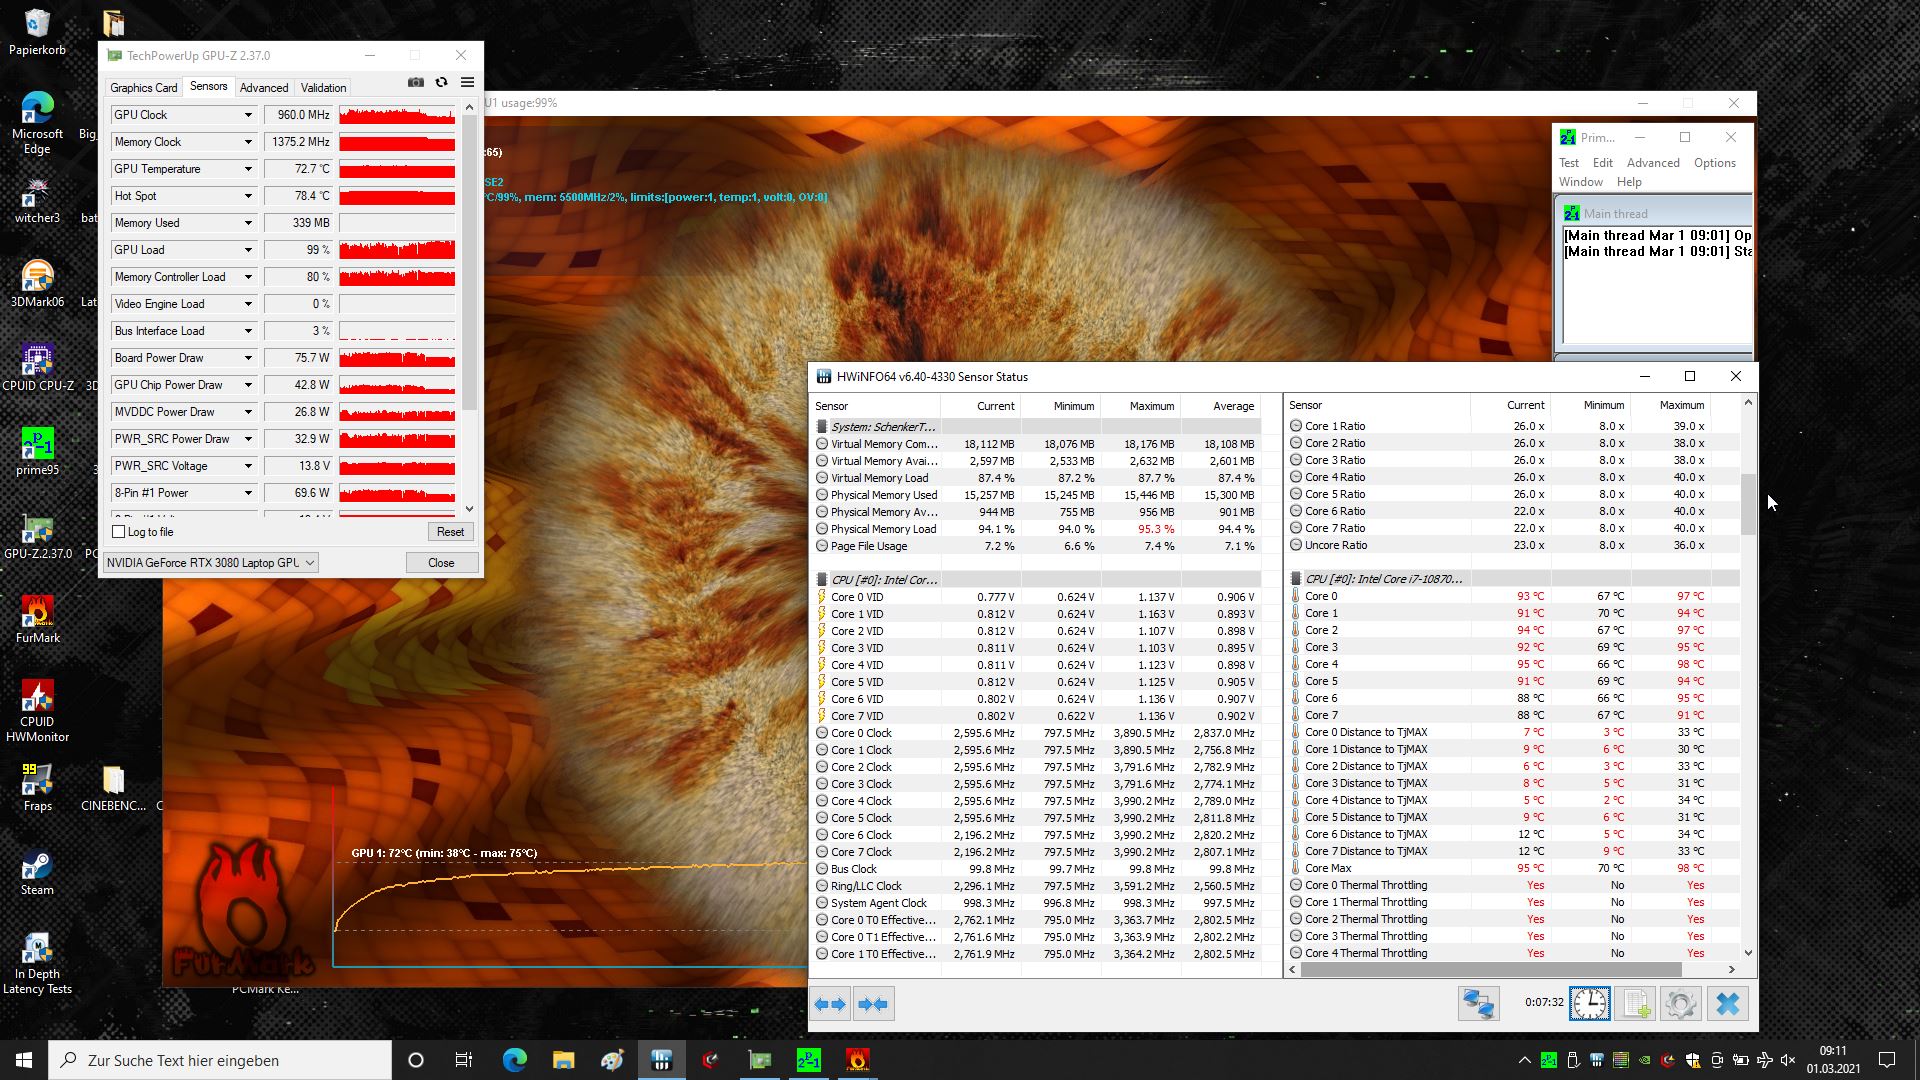
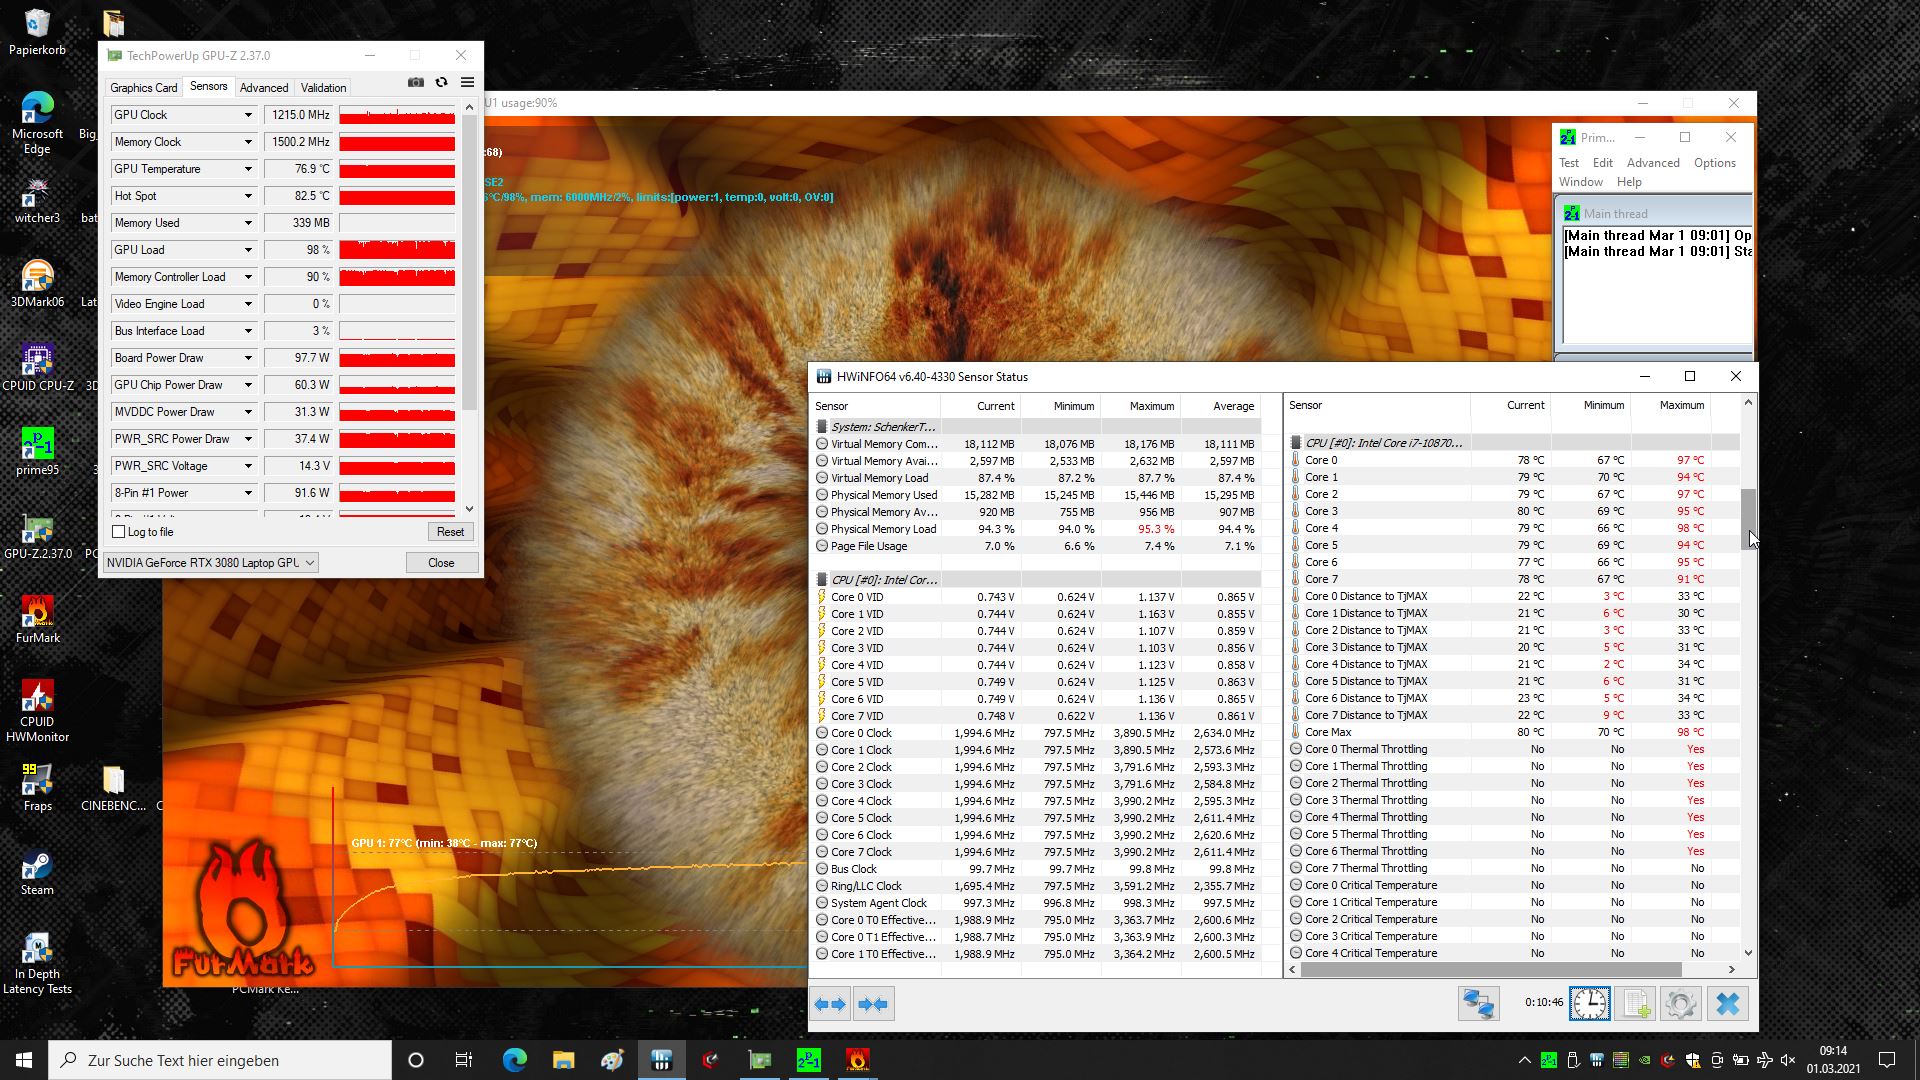
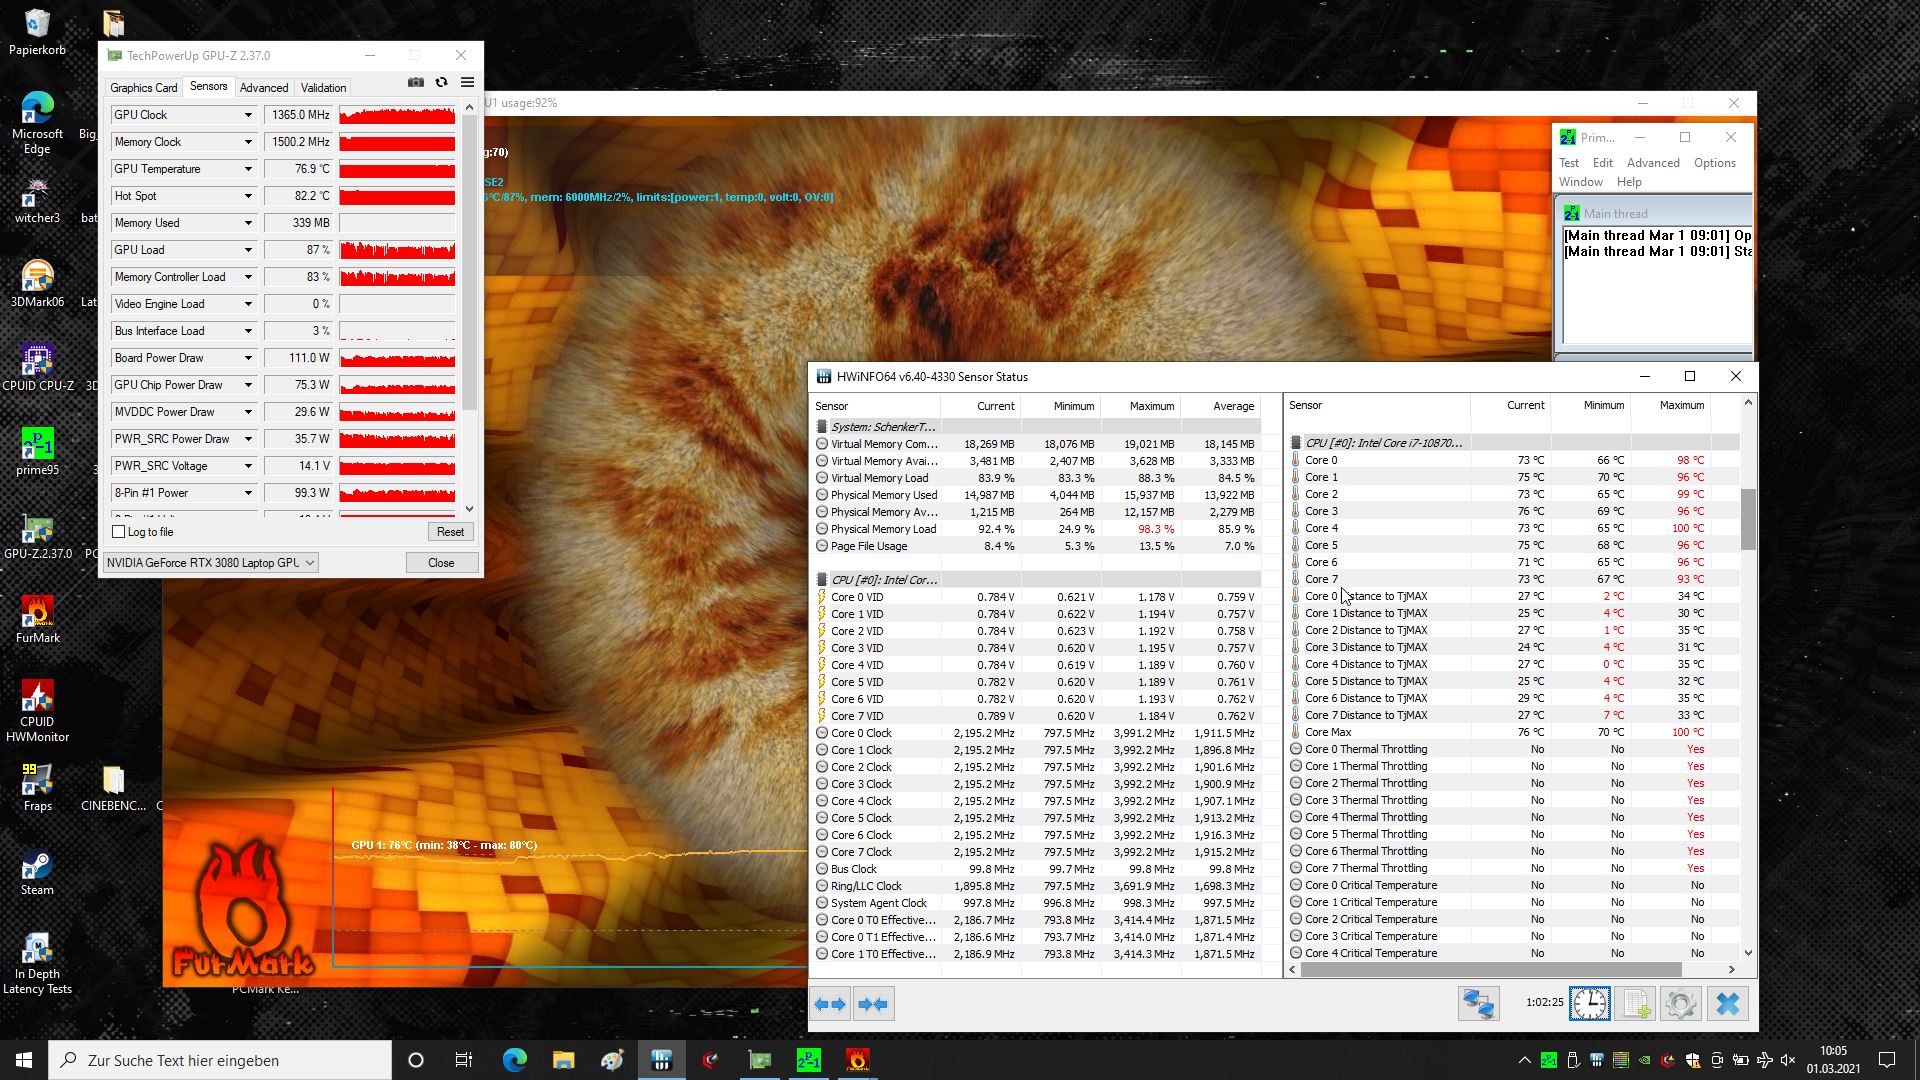
When running our stress test all CPU cores start out at around 4 GHz for around 5 minutes, after which thermal throttling sets in and lowers clock speeds to just 2.2 GHz with major fluctuations afterwards. After around 7 minutes our readings reported core temperatures of up to very hot 97 °C. After thermal throttling sets in temperatures dropped and settled between 65 and 80 °C with clock speeds fluctuating wildly between 800 MHz and 2.2 GHz.
GPU clock speeds were just as inconsistent. While the memory ran at a constant 1,500 MHz the GPU fluctuated between 960 and 1,755 MHz.

Speakers
The stereo speakers are located at the front on both sides and turned out to be pretty loud overall. Unfortunately, bass reproduction was fairly weak and mids were washed out. External audio devices can be connected via HDMI or two audio jacks as the microphone jack optionally supports optical S/PDIF output.
Schenker XMG Pro 15 (Early 2021, RTX 3080) audio analysis
(+) | speakers can play relatively loud (84 dB)
Bass 100 - 315 Hz
(-) | nearly no bass - on average 27.2% lower than median
(+) | bass is linear (6.2% delta to prev. frequency)
Mids 400 - 2000 Hz
(±) | reduced mids - on average 5.7% lower than median
(±) | linearity of mids is average (7% delta to prev. frequency)
Highs 2 - 16 kHz
(+) | balanced highs - only 4.6% away from median
(+) | highs are linear (5.4% delta to prev. frequency)
Overall 100 - 16.000 Hz
(±) | linearity of overall sound is average (20.1% difference to median)
Compared to same class
» 71% of all tested devices in this class were better, 6% similar, 23% worse
» The best had a delta of 6%, average was 18%, worst was 132%
Compared to all devices tested
» 52% of all tested devices were better, 8% similar, 40% worse
» The best had a delta of 4%, average was 24%, worst was 134%
Apple MacBook 12 (Early 2016) 1.1 GHz audio analysis
(+) | speakers can play relatively loud (83.6 dB)
Bass 100 - 315 Hz
(±) | reduced bass - on average 11.3% lower than median
(±) | linearity of bass is average (14.2% delta to prev. frequency)
Mids 400 - 2000 Hz
(+) | balanced mids - only 2.4% away from median
(+) | mids are linear (5.5% delta to prev. frequency)
Highs 2 - 16 kHz
(+) | balanced highs - only 2% away from median
(+) | highs are linear (4.5% delta to prev. frequency)
Overall 100 - 16.000 Hz
(+) | overall sound is linear (10.2% difference to median)
Compared to same class
» 7% of all tested devices in this class were better, 2% similar, 91% worse
» The best had a delta of 5%, average was 18%, worst was 53%
Compared to all devices tested
» 5% of all tested devices were better, 1% similar, 94% worse
» The best had a delta of 4%, average was 24%, worst was 134%
Energy Management – A Matter of Settings
Power Consumption
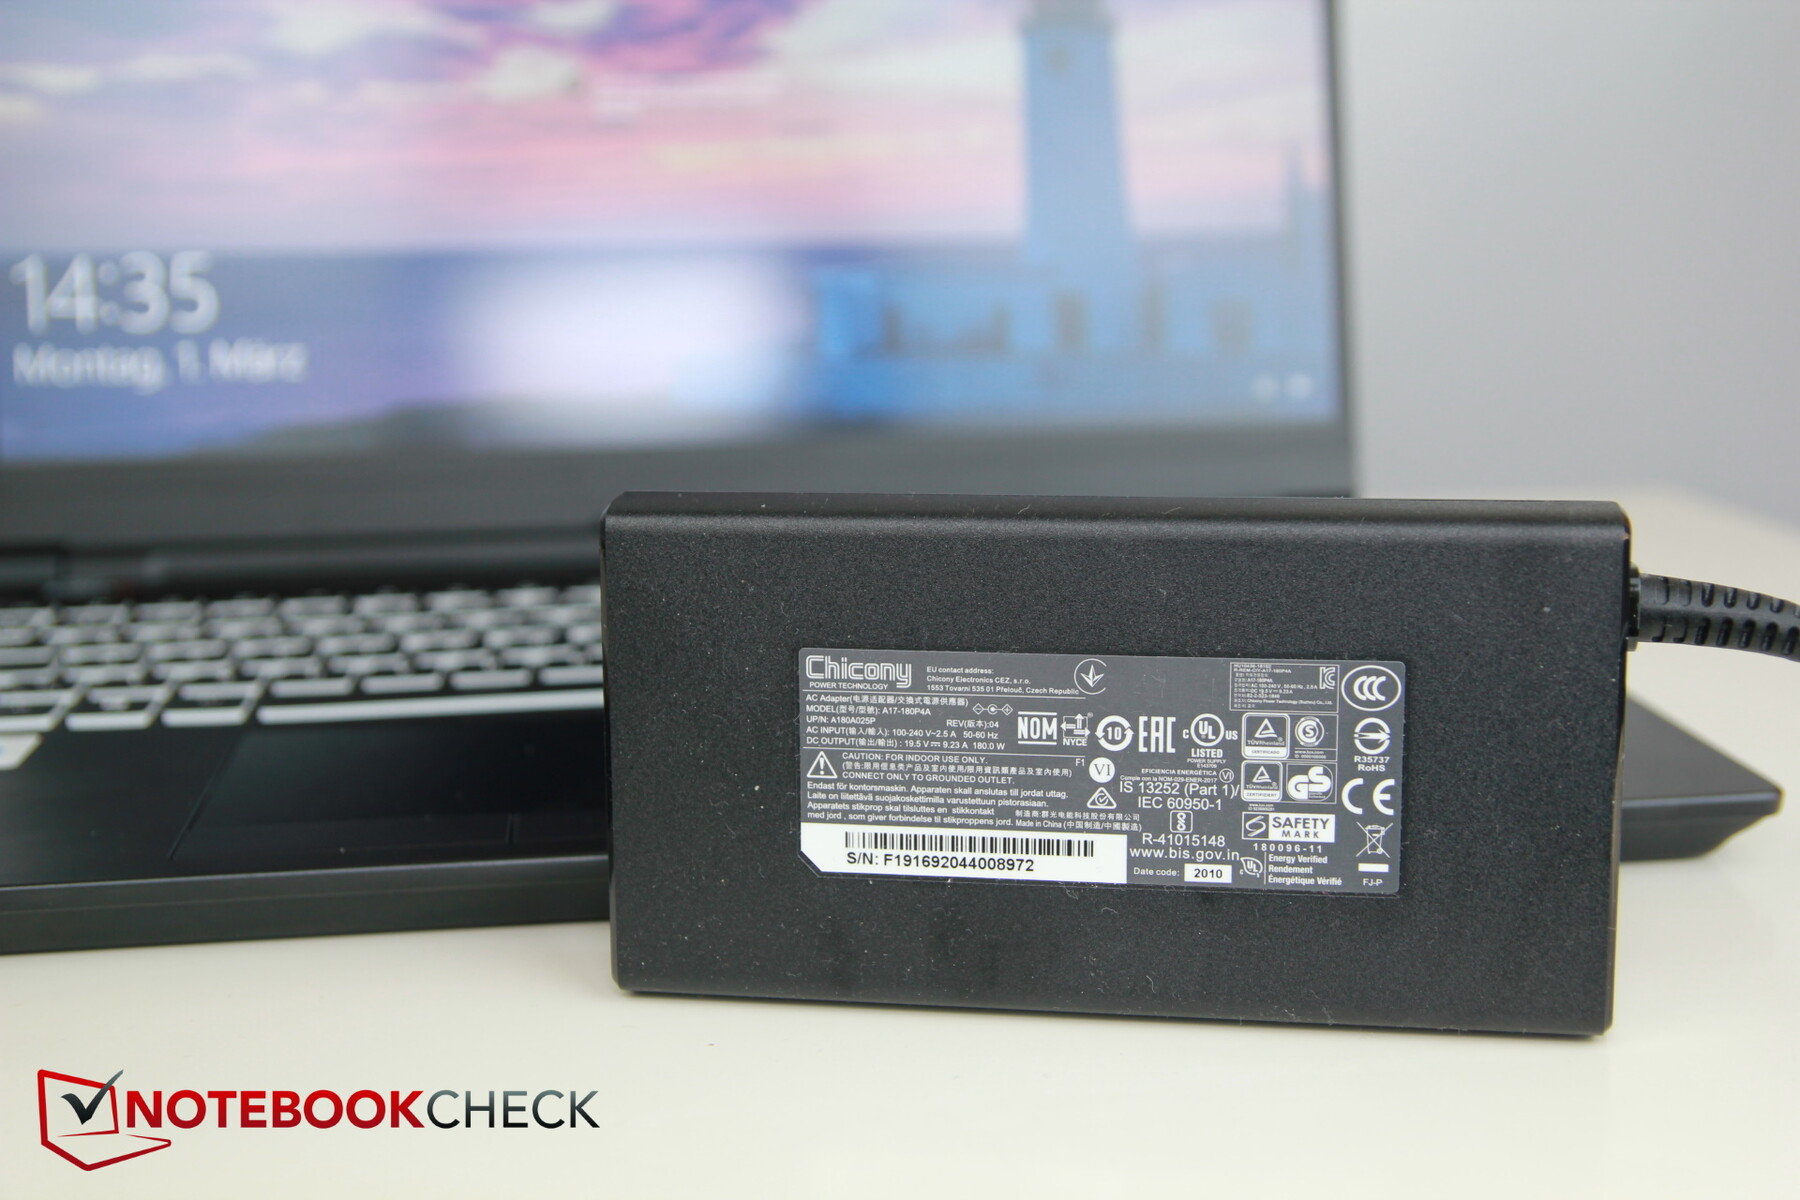
Compared to the Key 15 idle power consumption was improved slightly while power consumption under load (such as gaming) increased somewhat with a short-term peak of up to 225 W and a consistent power consumption of 180 W while gaming (Witcher 3). The power supply is rated at just 180 W, which seems on the low side as it would be unable to charge the battery under high load.
| Off / Standby | |
| Idle | |
| Load |
|
Key:
min: | |
| Schenker XMG Pro 15 (Early 2021, RTX 3080) i7-10870H, GeForce RTX 3080 Laptop GPU | Schenker Key 15 Comet Lake i7-10875H, GeForce RTX 2080 Super Max-Q | Schenker XMG Pro 15 i7-9750H, GeForce RTX 2070 Mobile | Asus ROG Zephyrus G15 GA503Q R9 5900HS, GeForce RTX 3080 Laptop GPU | Asus ROG Zephyrus Duo 15 SE GX551QS R9 5900HX, GeForce RTX 3080 Laptop GPU | Razer Blade Pro 17 2021 (QHD Touch) i7-10875H, GeForce RTX 3080 Laptop GPU | Average of class Gaming | |
|---|---|---|---|---|---|---|---|
| Power Consumption | 1% | -27% | 8% | -44% | -37% | -30% | |
| Idle Minimum * (Watt) | 8 | 10 -25% | 15 -88% | 10 -25% | 16.3 -104% | 15.2 -90% | 13.5 ? -69% |
| Idle Average * (Watt) | 13 | 14 -8% | 19 -46% | 12 8% | 22.5 -73% | 20.3 -56% | 19.2 ? -48% |
| Idle Maximum * (Watt) | 22 | 18 18% | 26 -18% | 17 23% | 39.9 -81% | 37.3 -70% | 24.6 ? -12% |
| Load Average * (Watt) | 97 | 106 -9% | 101 -4% | 108 -11% | 116.1 -20% | 114.9 -18% | 108.1 ? -11% |
| Witcher 3 ultra * (Watt) | 179 | 142 21% | 177 1% | 123 31% | 181.2 -1% | 158.4 12% | |
| Load Maximum * (Watt) | 225 | 210 7% | 245 -9% | 182 19% | 196.7 13% | 223.7 1% | 253 ? -12% |
* ... smaller is better
Battery Life
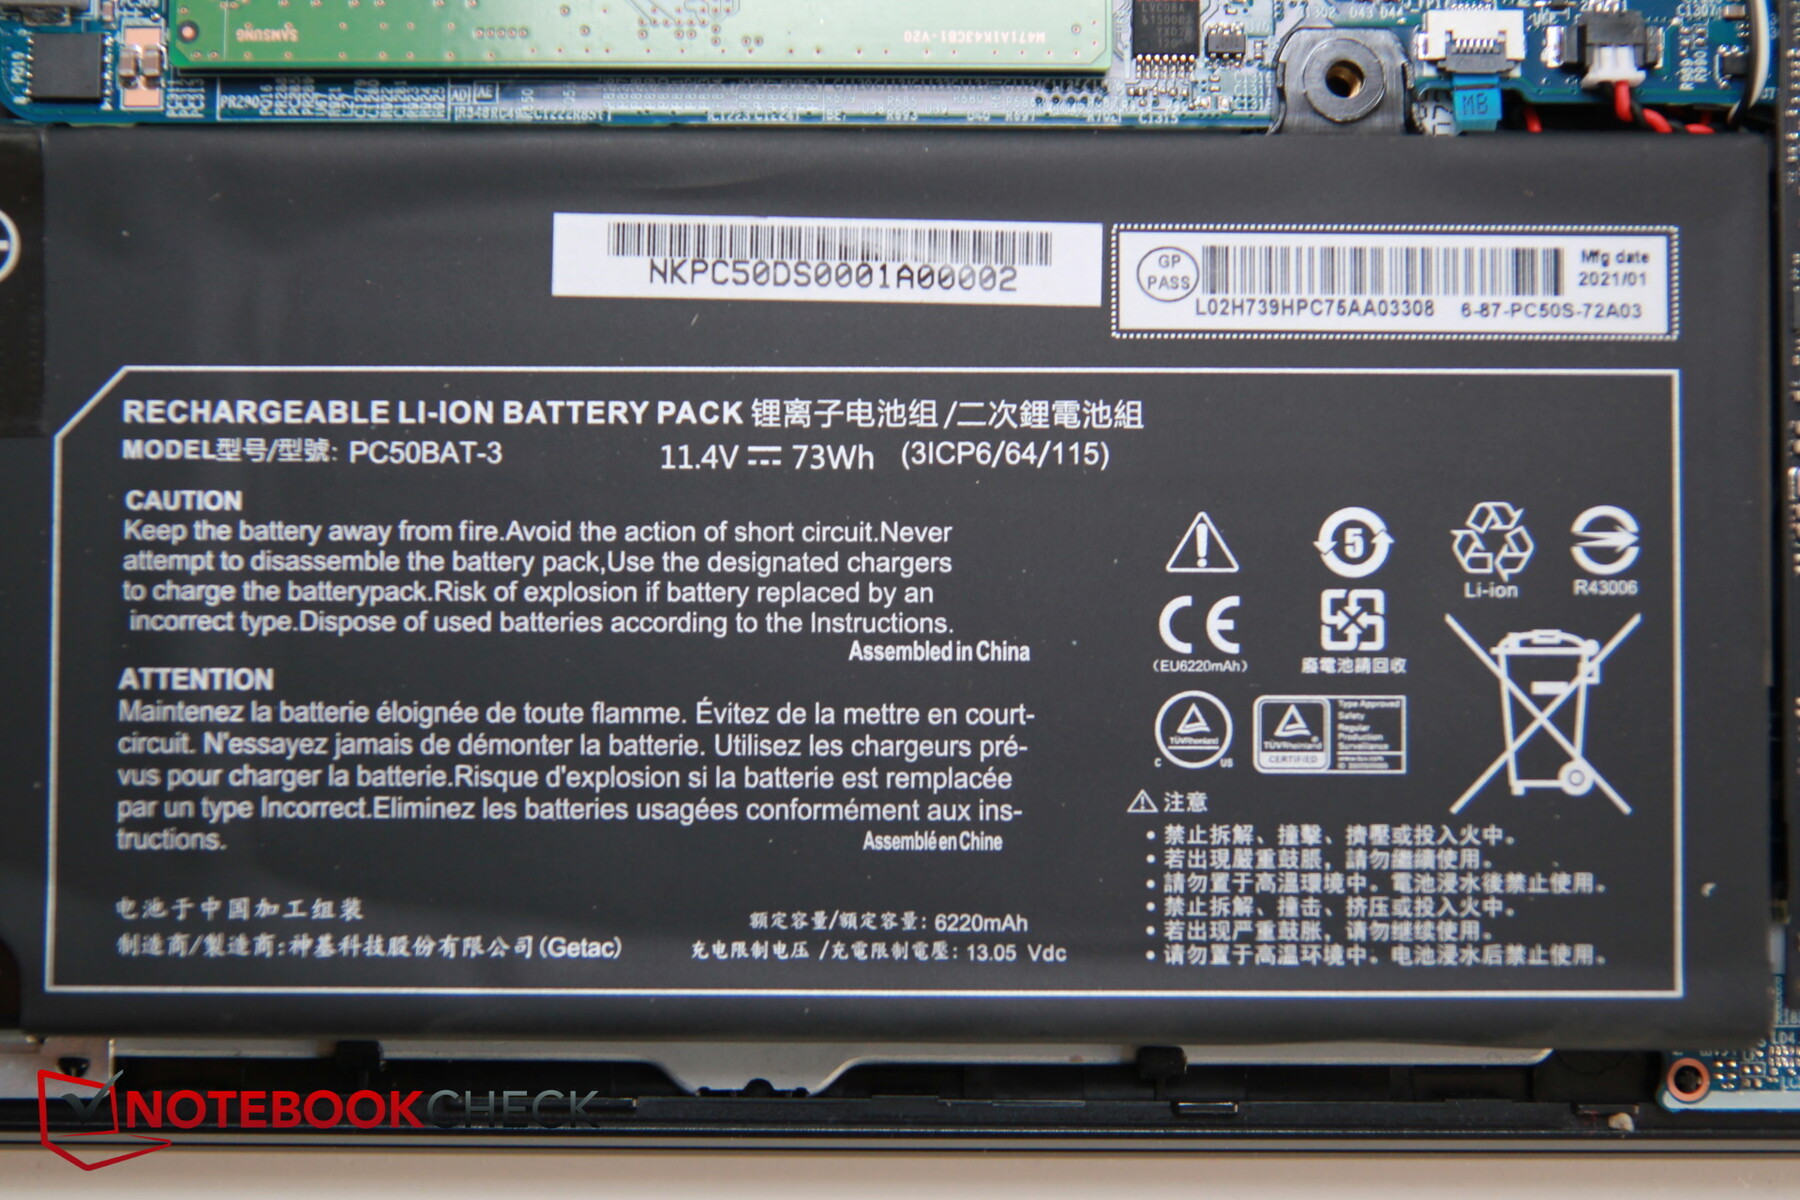
The 73 Wh battery remained unchanged from the Key 15. While the Pro 15 lasted a bit longer under load battery life differed significantly based on the fan mode selected in Control Center. Unlike before, when we were running our benchmarks, we enabled the power saver mode before running our battery Wi-Fi test. With these settings we managed an astounding 7 hours of battery life. Contrary to its name the entertainment mode turned out to be ill suited for watching movies as it resulted in an unnecessarily high power consumption. Overall, battery life can be decent but depends on your settings.
| Schenker XMG Pro 15 (Early 2021, RTX 3080) i7-10870H, GeForce RTX 3080 Laptop GPU, 73 Wh | Schenker Key 15 Comet Lake i7-10875H, GeForce RTX 2080 Super Max-Q, 73 Wh | Schenker XMG Pro 15 i7-9750H, GeForce RTX 2070 Mobile, 62 Wh | Asus ROG Zephyrus G15 GA503Q R9 5900HS, GeForce RTX 3080 Laptop GPU, 90 Wh | Asus ROG Zephyrus Duo 15 SE GX551QS R9 5900HX, GeForce RTX 3080 Laptop GPU, 90 Wh | Razer Blade Pro 17 2021 (QHD Touch) i7-10875H, GeForce RTX 3080 Laptop GPU, 70.5 Wh | Average of class Gaming | |
|---|---|---|---|---|---|---|---|
| Battery runtime | -16% | -38% | 23% | -23% | -4% | 11% | |
| Reader / Idle (h) | 8.4 | 7 -17% | 5.2 -38% | 12.1 44% | 6.8 -19% | 9.9 18% | 8.71 ? 4% |
| H.264 (h) | 5.5 | 5.7 4% | 8.26 ? 50% | ||||
| WiFi v1.3 (h) | 7.2 | 4.8 -33% | 3.5 -51% | 9.4 31% | 5.3 -26% | 5.9 -18% | 6.93 ? -4% |
| Load (h) | 1.6 | 1.3 -19% | 1.2 -25% | 1.5 -6% | 1.2 -25% | 1.4 -13% | 1.47 ? -8% |
Pros
Cons
Verdict – Small, Lightweight, Powerful, and a Good Display

The pros of Schenker’s XMG Pro 15 are its low weight as well as its subtle design that turn an office environment into this powerful gaming notebook’s natural habitat. As expected, the mobile RTX 3080 offers a lot of graphics performance but it was not that much faster than the Key 15’s RTX 2080 Super Max-Q. Nevertheless, the Pro 15 is a better choice primarily for its better display. Our review unit featured one with faster response times, a higher brightness, a higher level of contrast, a lower black level, and last but not least significantly more accurate colors. In other words: an all-around improvement. Please note that this was only one of five possible display options.
Unsurprisingly, the laptop suffers from the same downsides that most ultra-thin powerhouses exhibit. It gets very hot at the bottom and very loud to boot, the latter of which can be addressed by selecting the power saving and no longer deafness-inducing silent mode. That is if you don’t really need maximum performance of course.
The refresh of Schenker’s Key 15 brings a new display, but the new Pro 15 is not necessarily any faster when gaming. In return, the powerful all-rounder continues to offer a sleek and simple design, a low weight, and a small footprint.
Price and Availability
The primary outlet for purchasing Schenker notebooks is Schenker’s own online shop. Keep in mind that Schenker will only ship within Europe. US customers can search for laptops based on the same Clevo PC50DS barebone among others on Amazon or Newegg.
Schenker XMG Pro 15 (Early 2021, RTX 3080)
- 03/06/2021 v7 (old)
Christian Hintze
Price comparison

