 Deutsch
 English
 Español
 Français
 Italiano
 Nederlands
 Polski
 Português
 Русский
 Türkçe
 Svenska
 Chinese
 Magyar
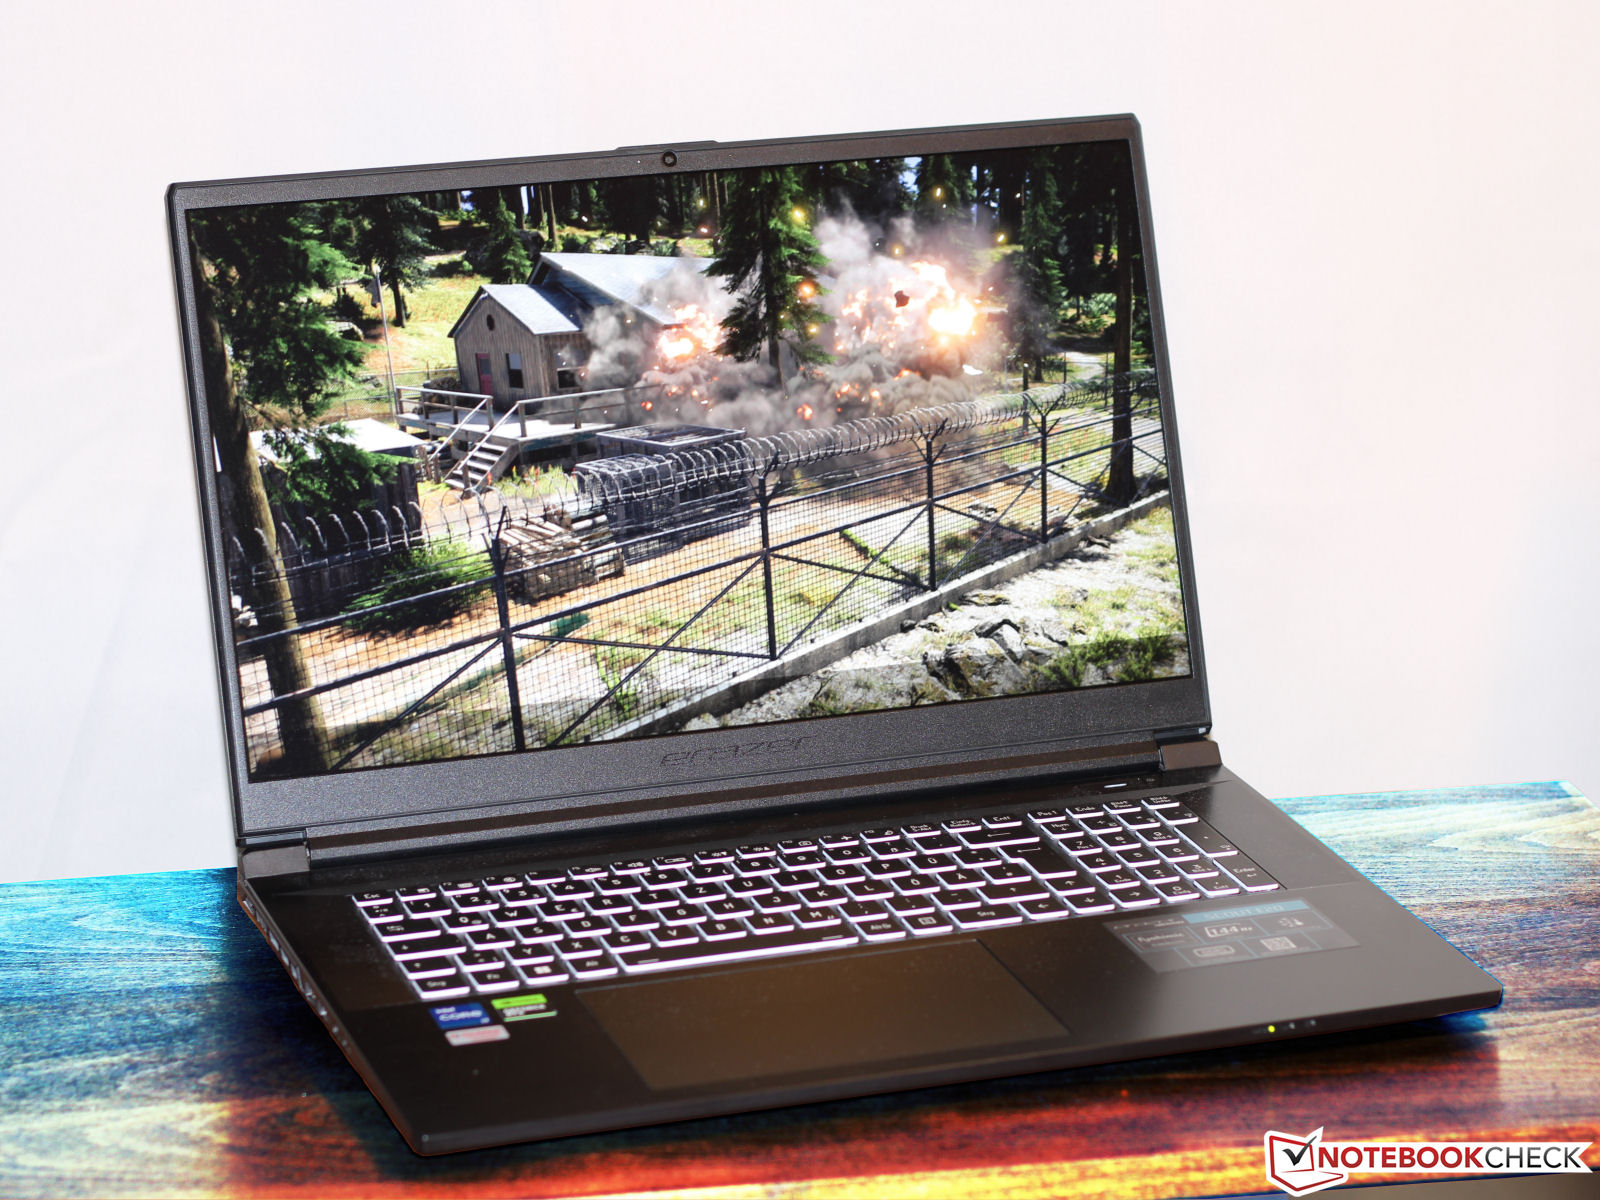
Medion Erazer Scout E20 review: Affordable FHD gaming laptop with RTX 4050
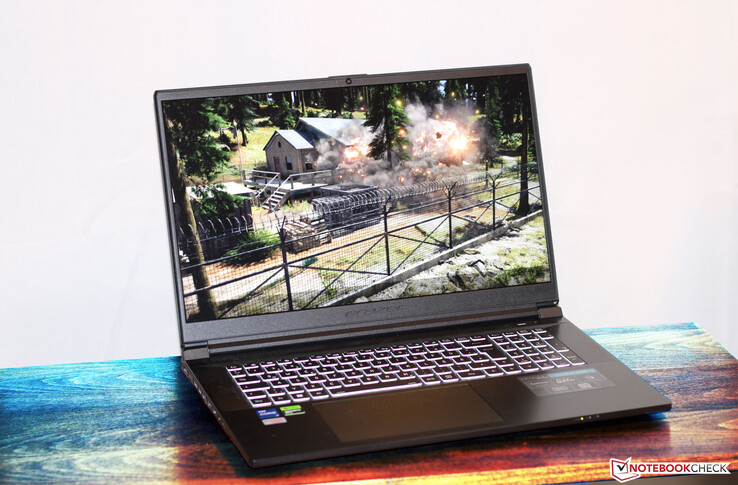
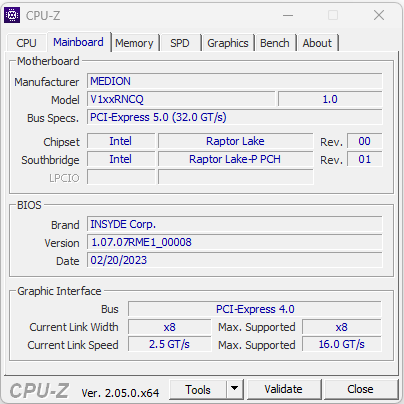
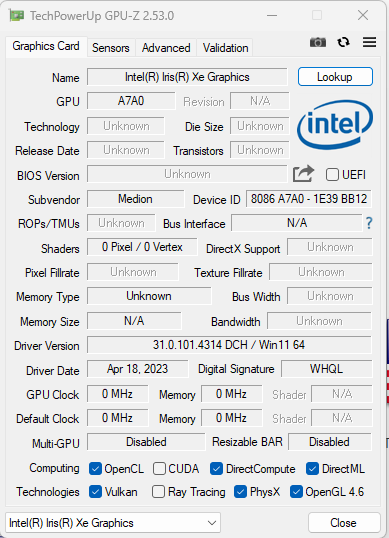
Although the Erazer Scout E20 is primarily considered a gaming laptop from the entry-level segment, it could also be used in other areas that demand a high performance, such as rendering or video processing. Medion combines a Raptor Lake processor with a GeForce RTX 4050 Laptop GPU, asking for about 1,500 Euros (~$1,658) for the whole package. The computer is based on a barebone from Clevo (V170RNCQ). Its competitors include devices such as the Gigabyte G7 KE, the MSI Katana 17 B13VFK, the Asus TUF Gaming A16 FA617, the Lenovo Legion 5 15IAH7H 82RB, and the Acer Nitro 5 AN515-46-R1A1.
Possible Competitors in Comparison
Rating | Date | Model | Weight | Height | Size | Resolution | Best Price |
|---|---|---|---|---|---|---|---|
| 83 % | 05/2023 | Medion Erazer Scout E20 i7-13700H, NVIDIA GeForce RTX 4050 Laptop GPU | 2.8 kg | 29 mm | 17.30" | 1920x1080 | |
| 83.3 % | 01/2023 | Gigabyte G7 KE i5-12500H, GeForce RTX 3060 Laptop GPU | 2.6 kg | 25 mm | 17.30" | 1920x1080 | |
| 82.1 % | 02/2023 | MSI Katana 17 B13VFK i7-13620H, NVIDIA GeForce RTX 4060 Laptop GPU | 2.8 kg | 25.2 mm | 17.30" | 1920x1080 | |
| 86.2 % | 02/2023 | Asus TUF Gaming A16 FA617 R7 7735HS, Radeon RX 7600S | 2.2 kg | 27 mm | 16.00" | 1920x1200 | |
| 87.5 % | 11/2022 | Lenovo Legion 5 15IAH7H 82RB i7-12700H, GeForce RTX 3060 Laptop GPU | 2.4 kg | 19.99 mm | 15.60" | 1920x1080 | |
| 83.9 % | 11/2022 | Acer Nitro 5 AN515-46-R1A1 R7 6800H, GeForce RTX 3070 Ti Laptop GPU | 2.5 kg | 26.8 mm | 15.60" | 1920x1080 |
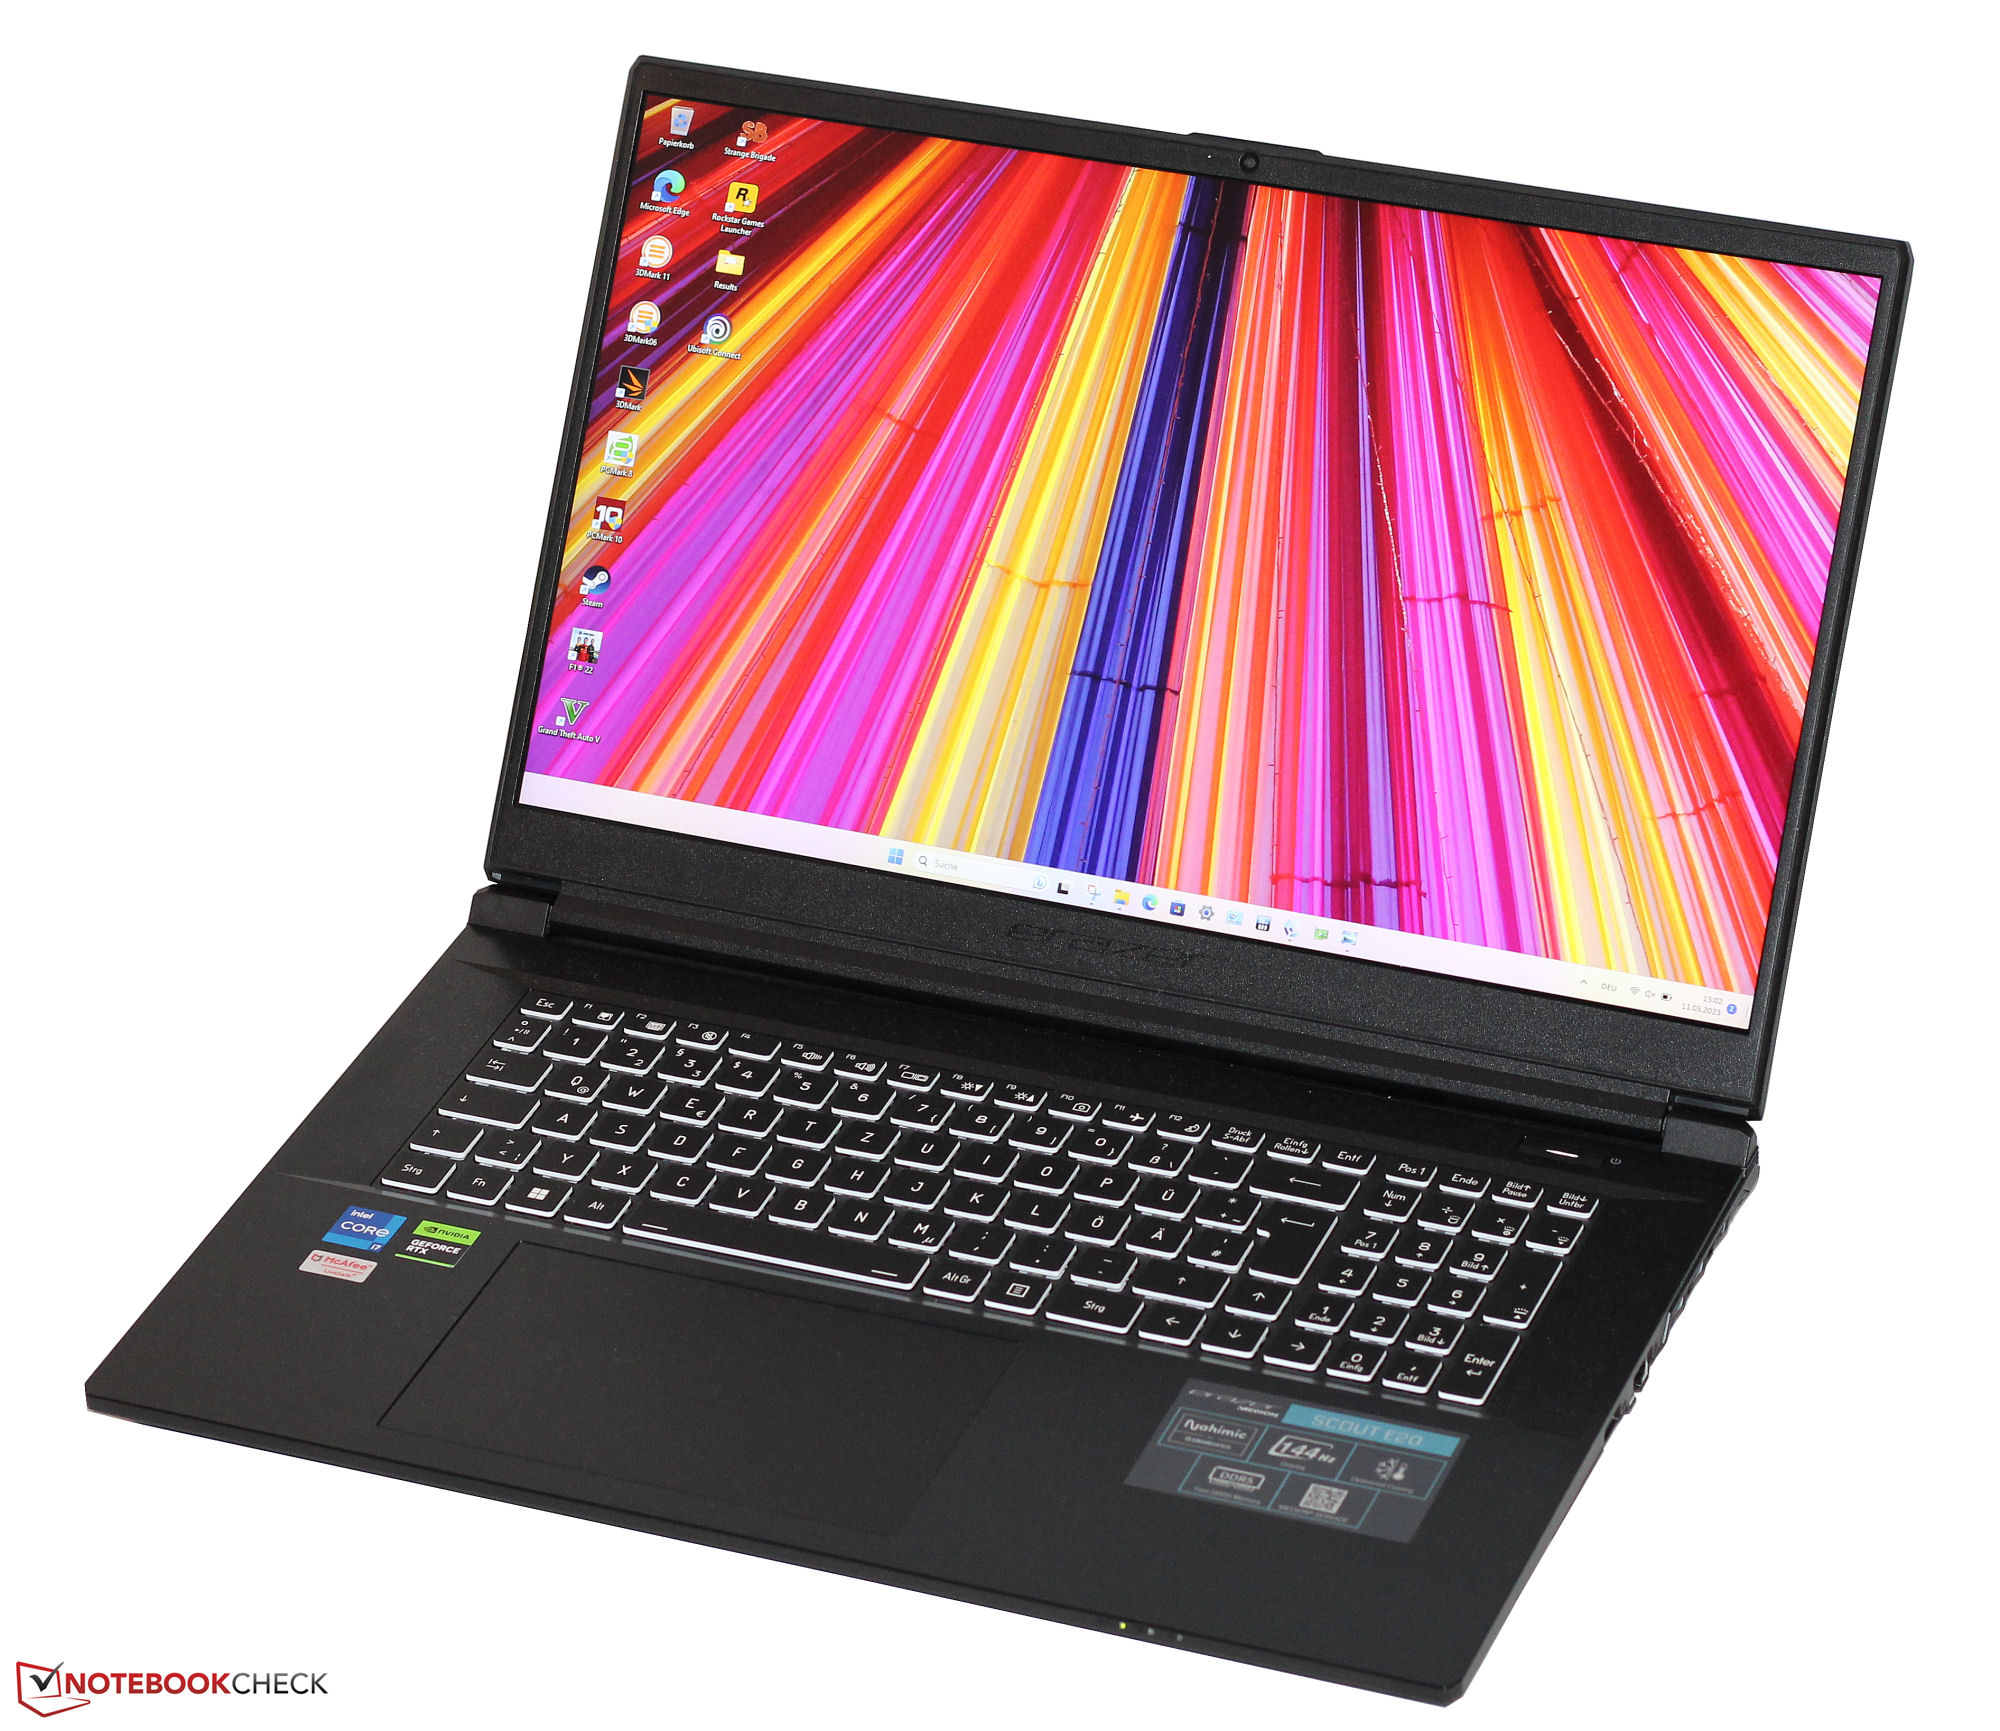
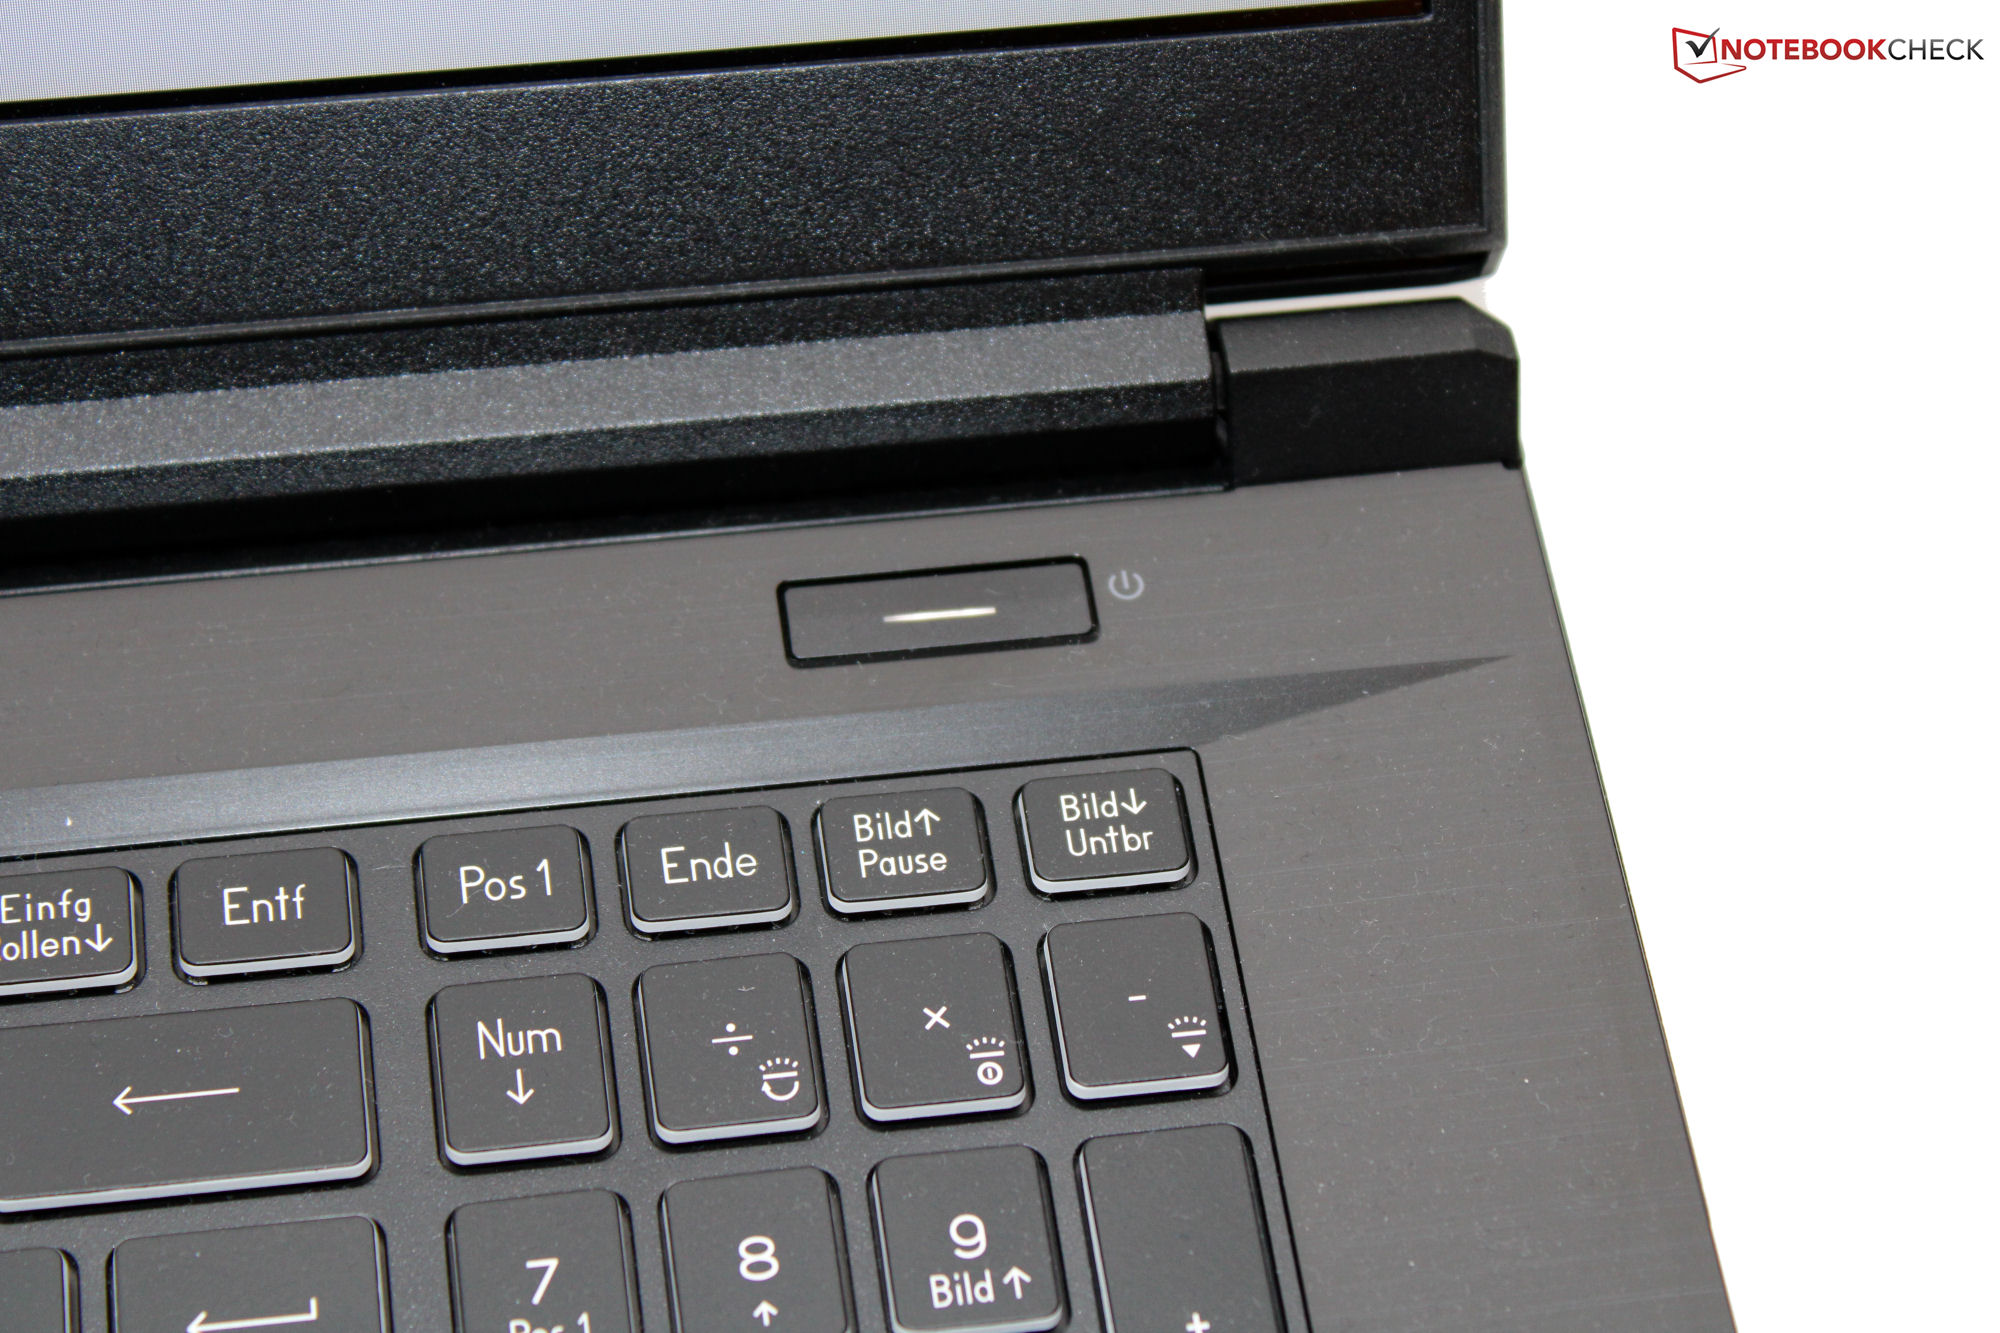
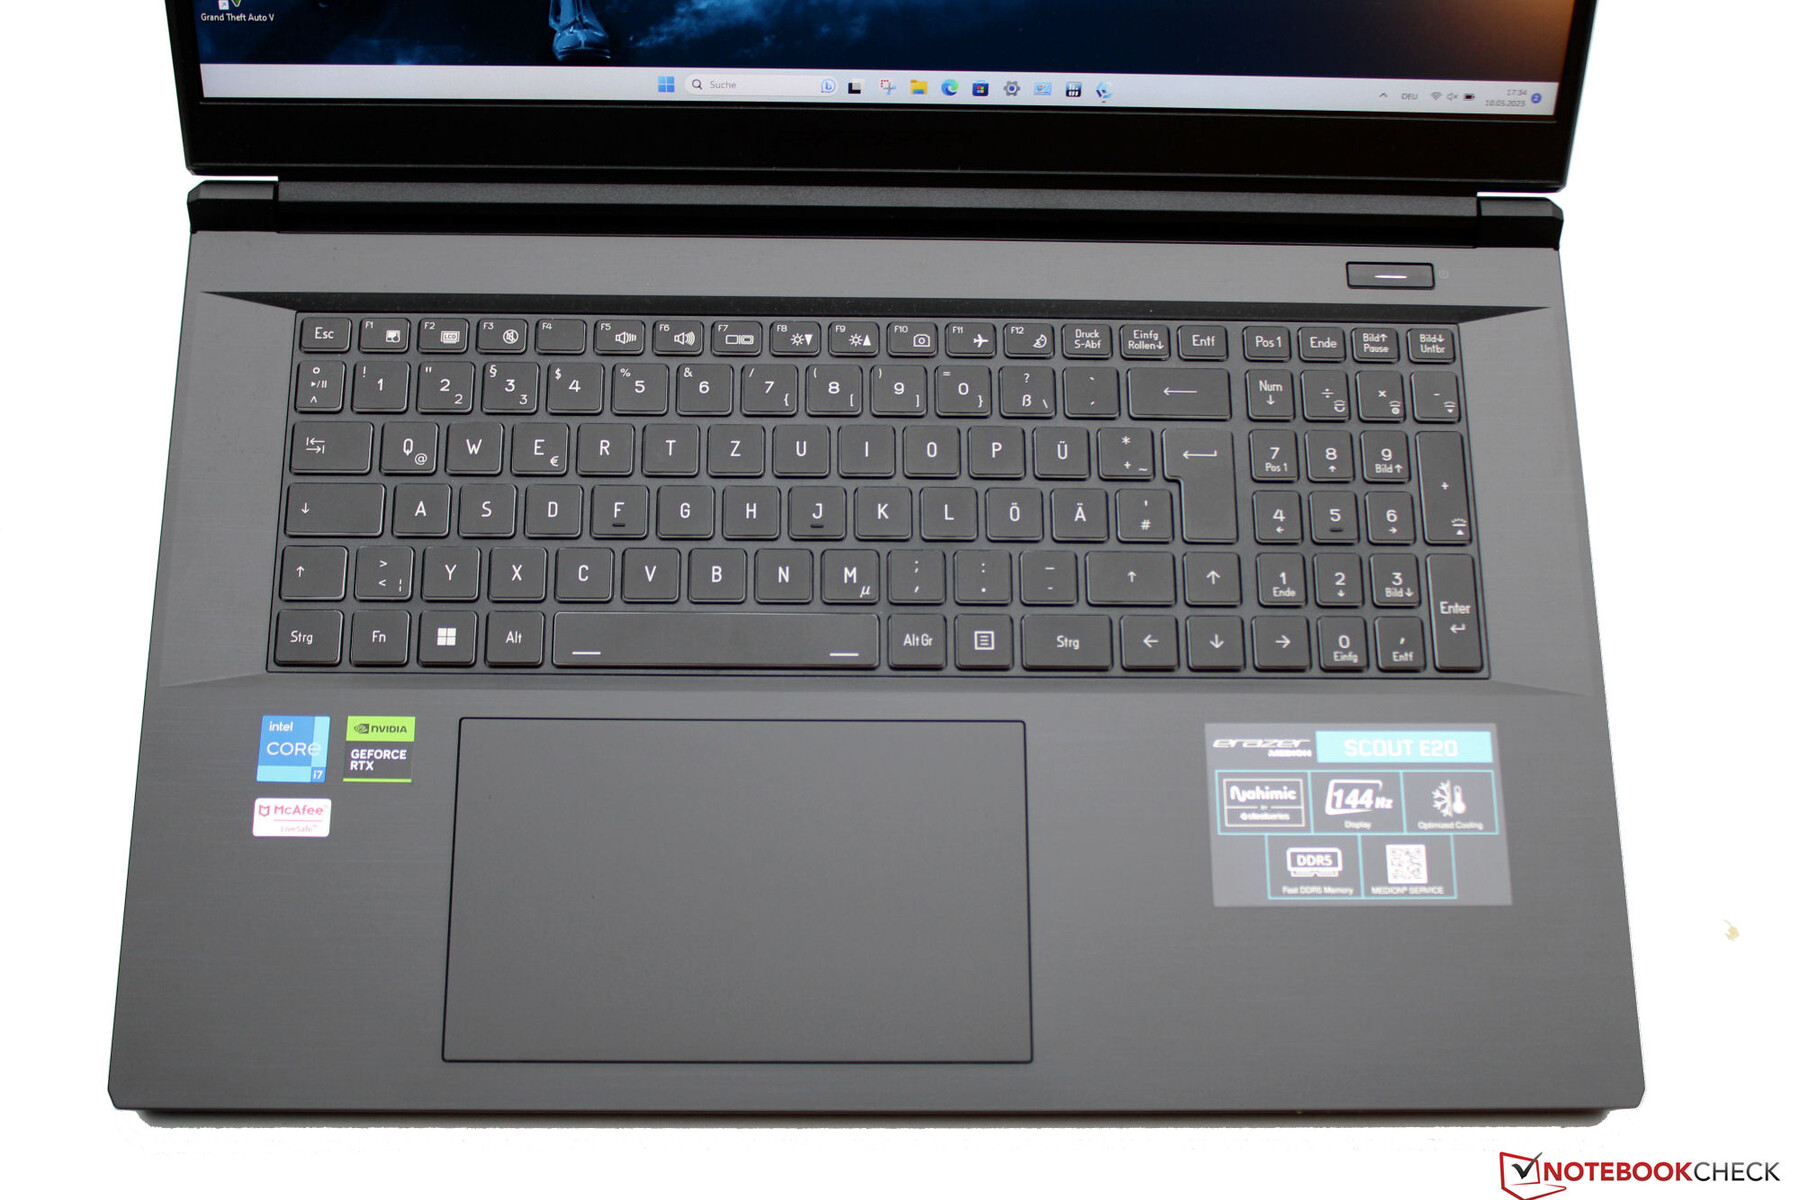
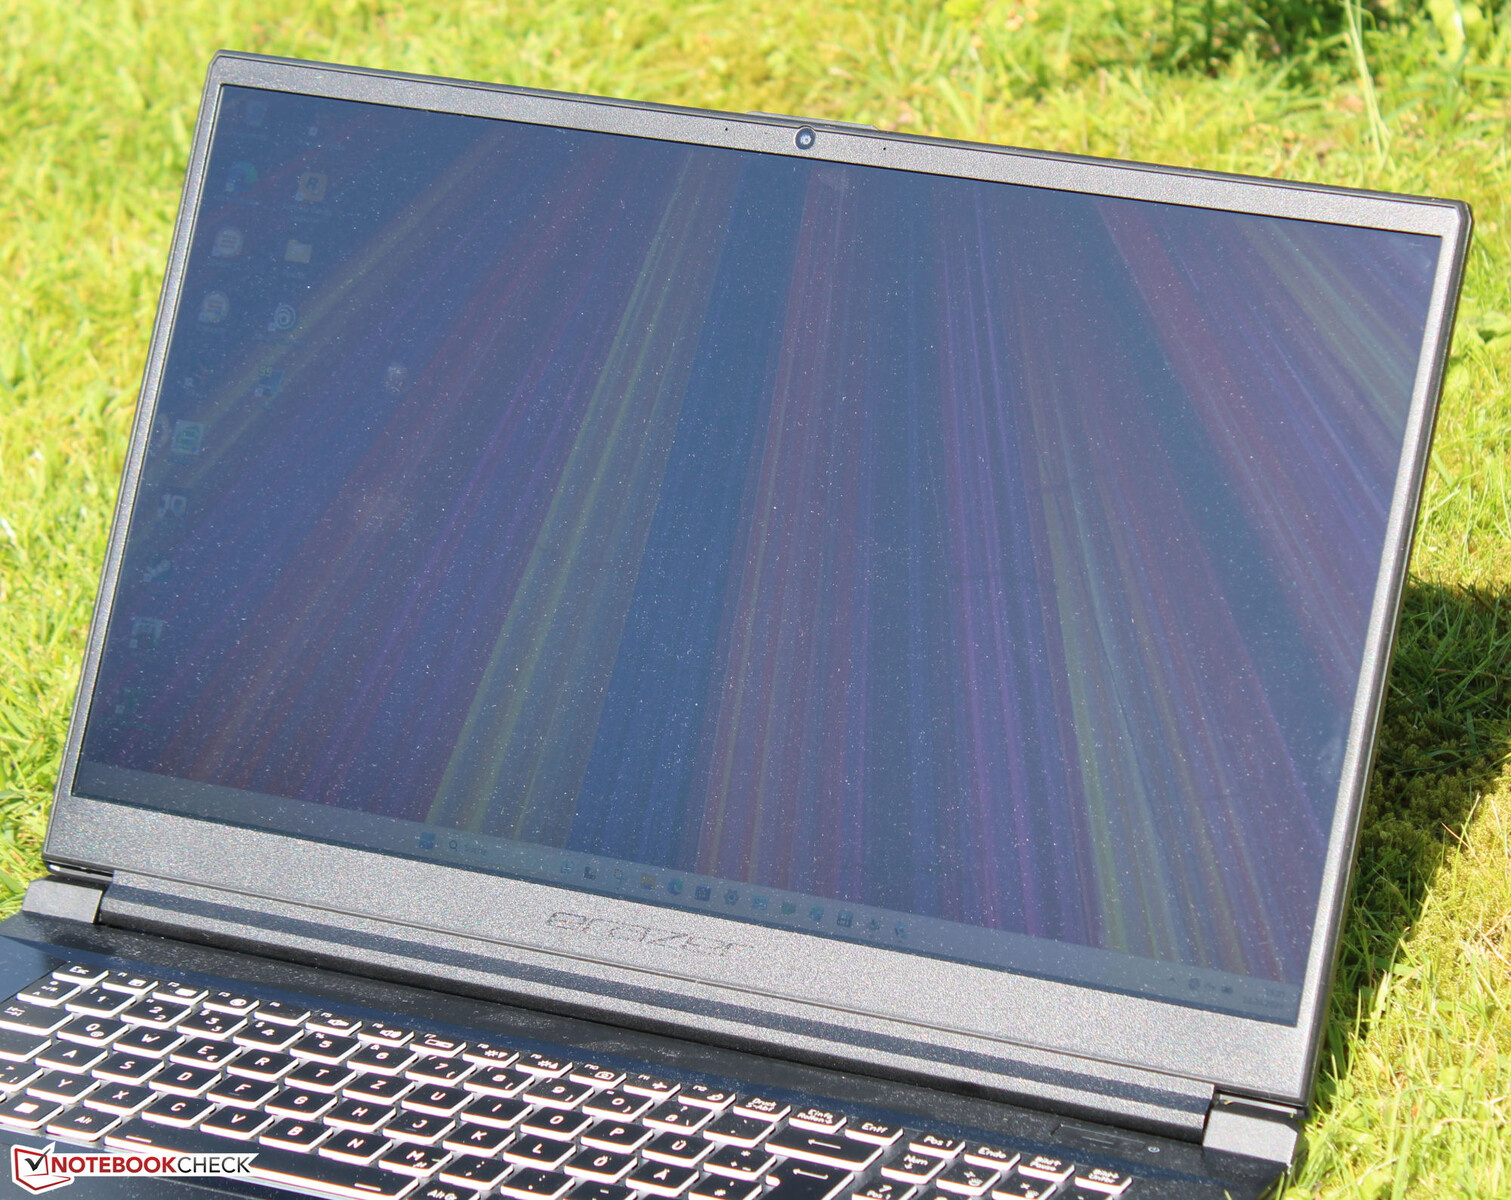
Case - The Medion laptop uses a plastic case
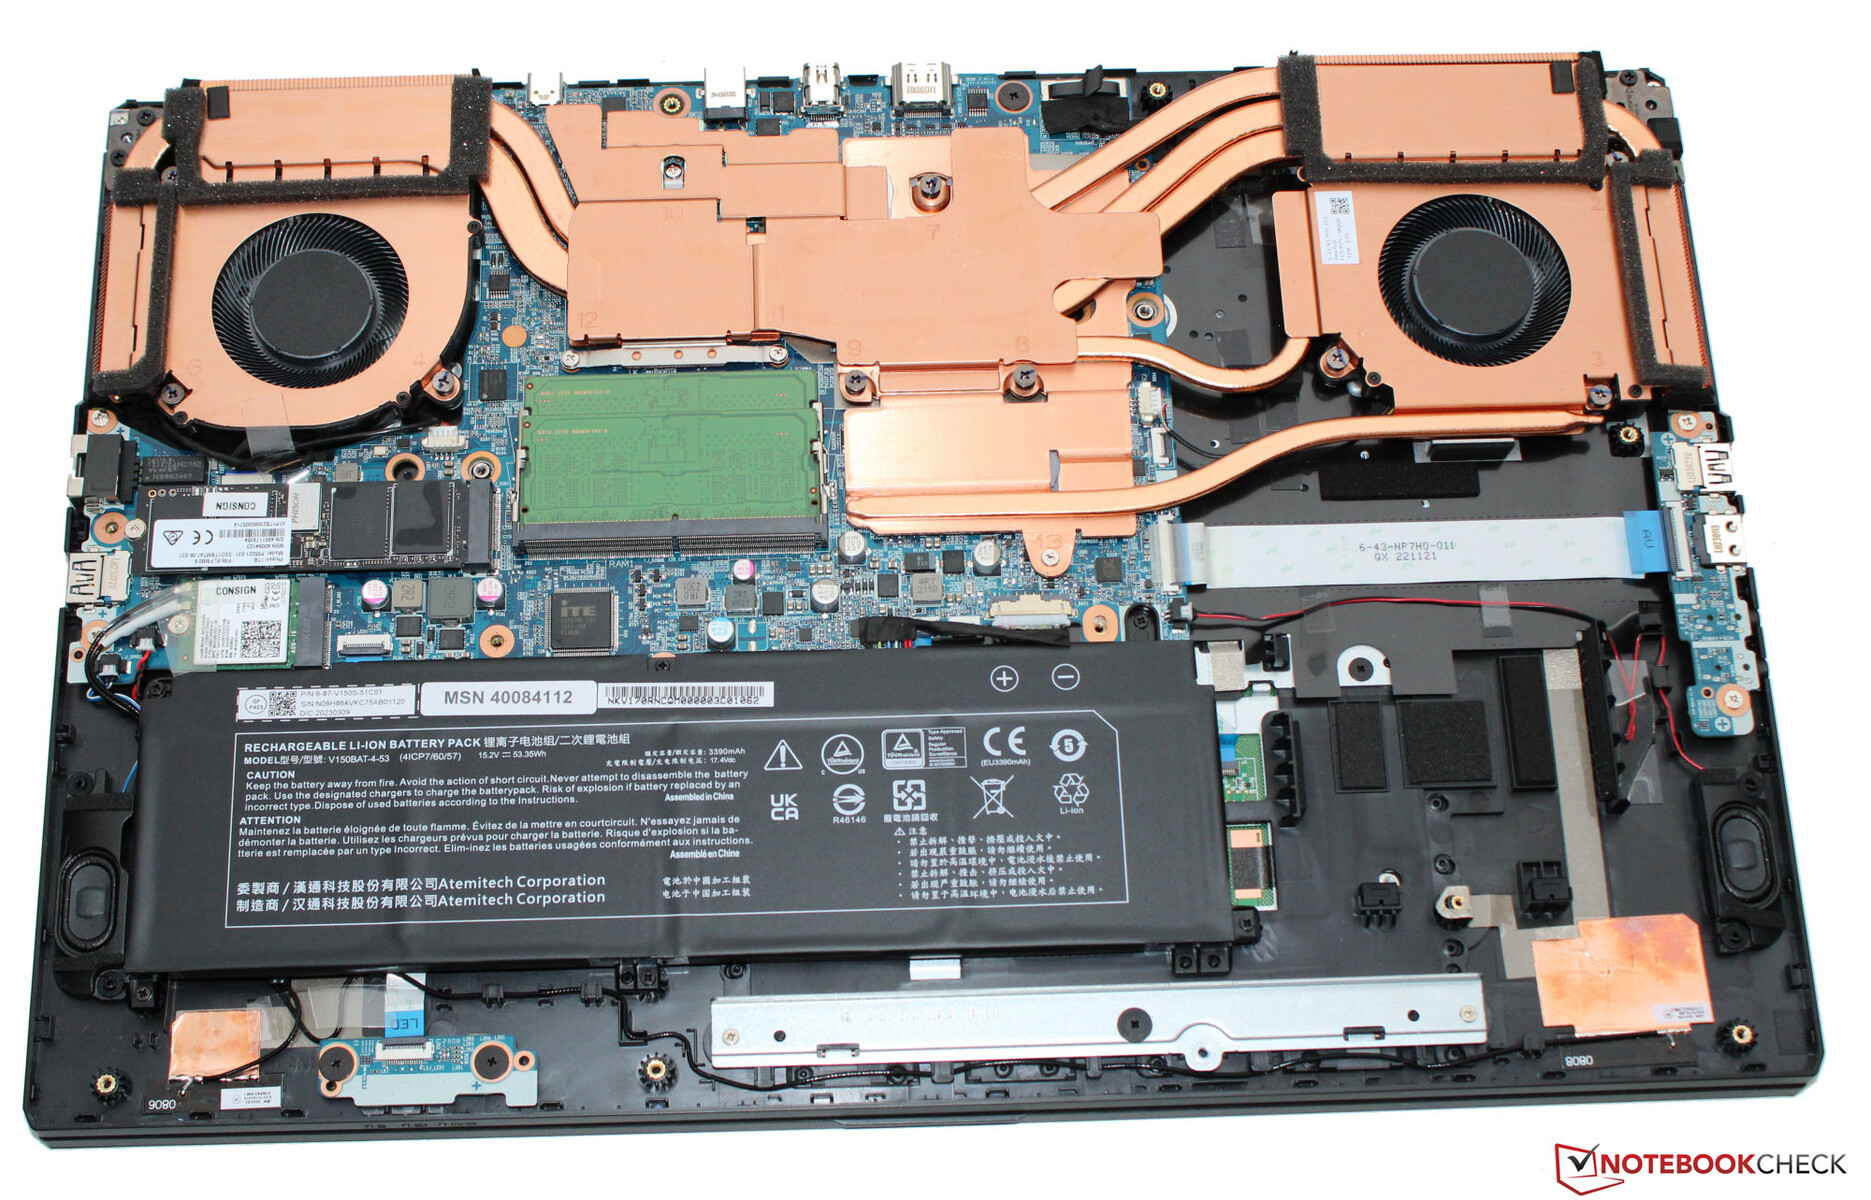
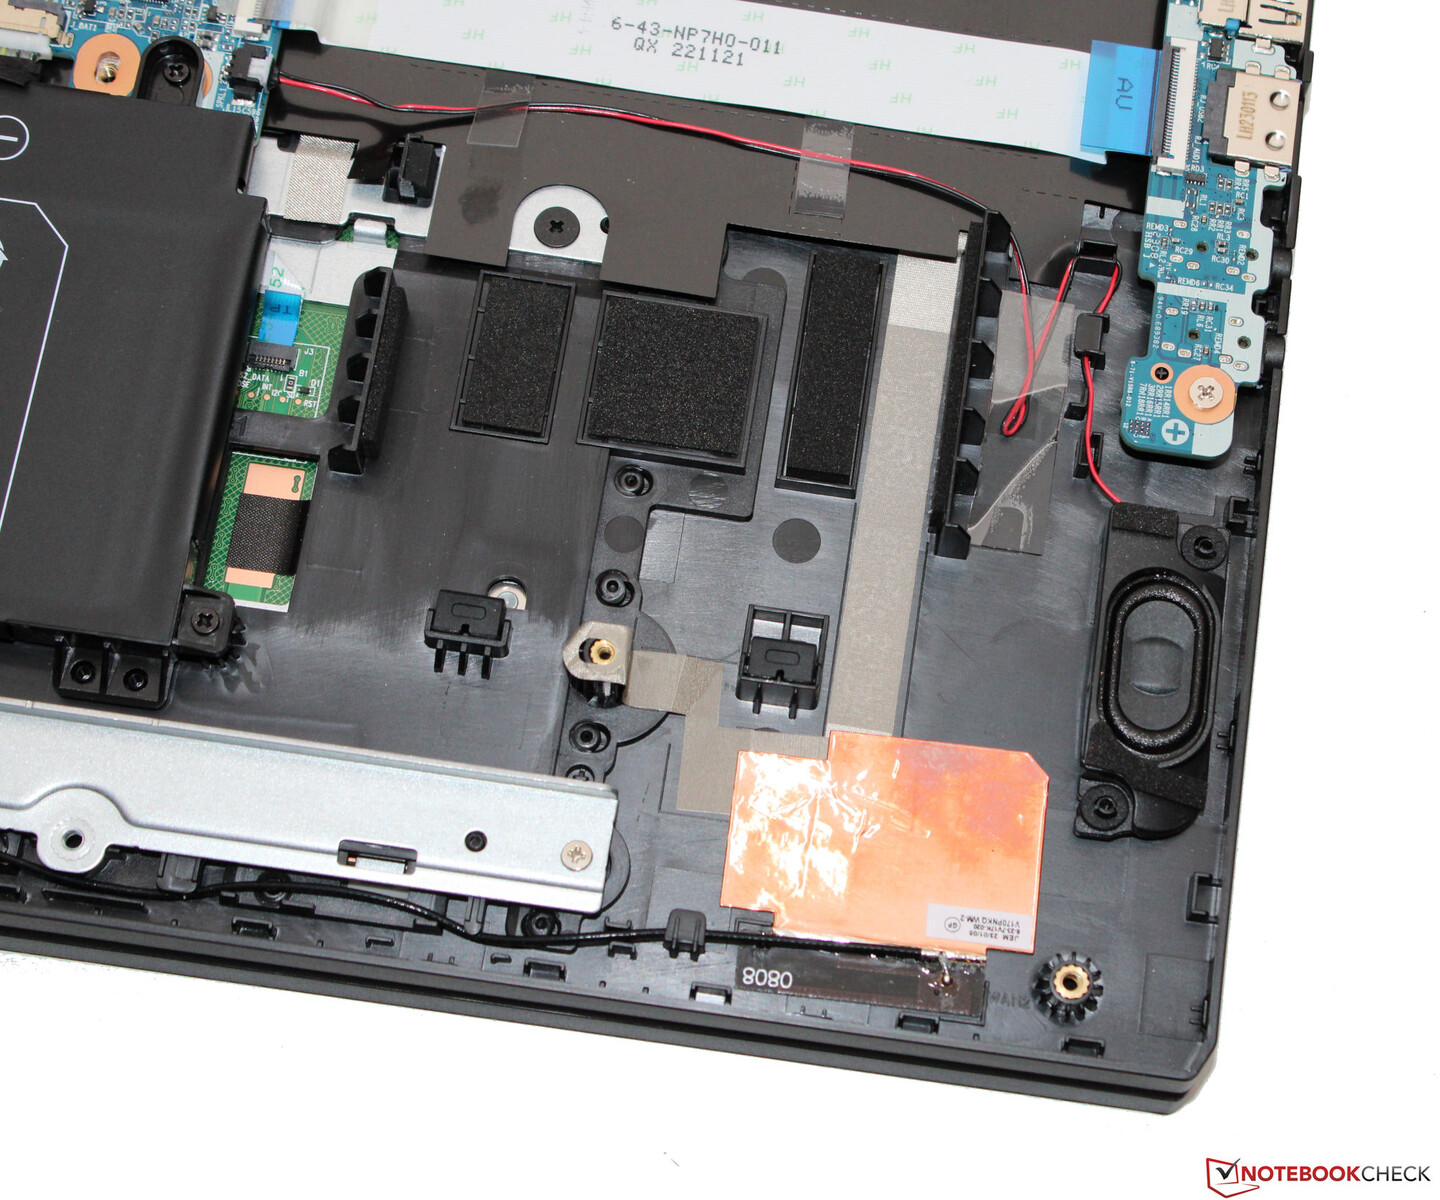
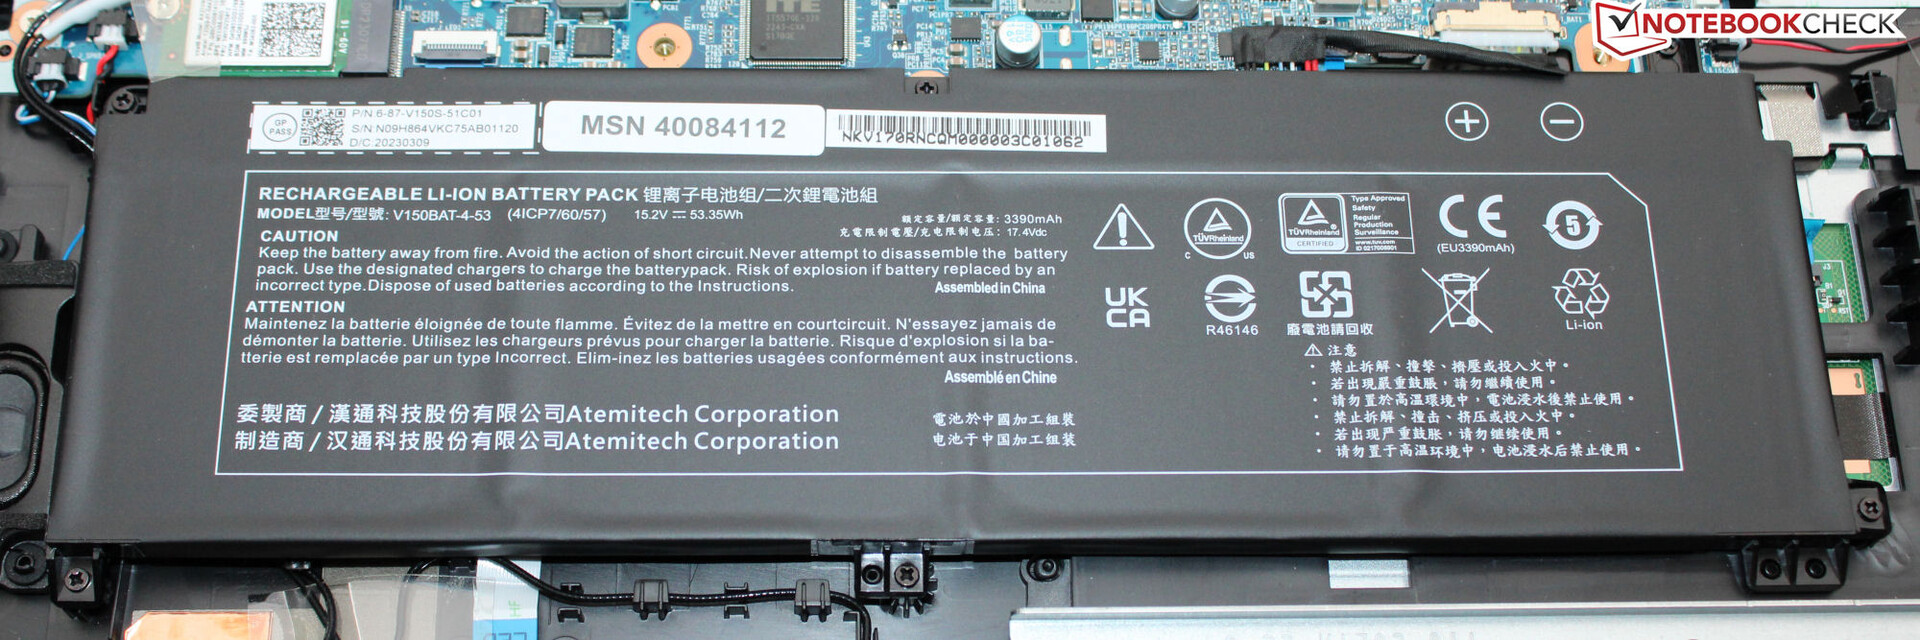
The E20 cannot offer any case materials that give a high-quality appearance, but the whole case is made of black plastic. Medion uses smooth, matte surfaces. The unpretentious design of the laptop would also allow using it in business surroundings. Aside from the keyboard illumination, the laptop does not include any colorful ornamentation in form of LED bands. The battery (which is screwed and not glued in) and the rest of the equipment is accessible after removing the bottom of the case.
The Scout doesn't show any faults in workmanship. The gaps are even and there are no material protrusions. The base unit can only be warped slightly but the lid more significantly, although this still remains within limits. The hinges hold the lid tightly in position, with a maximum opening angle of about 135 degrees. The lid can be opened using a single hand.
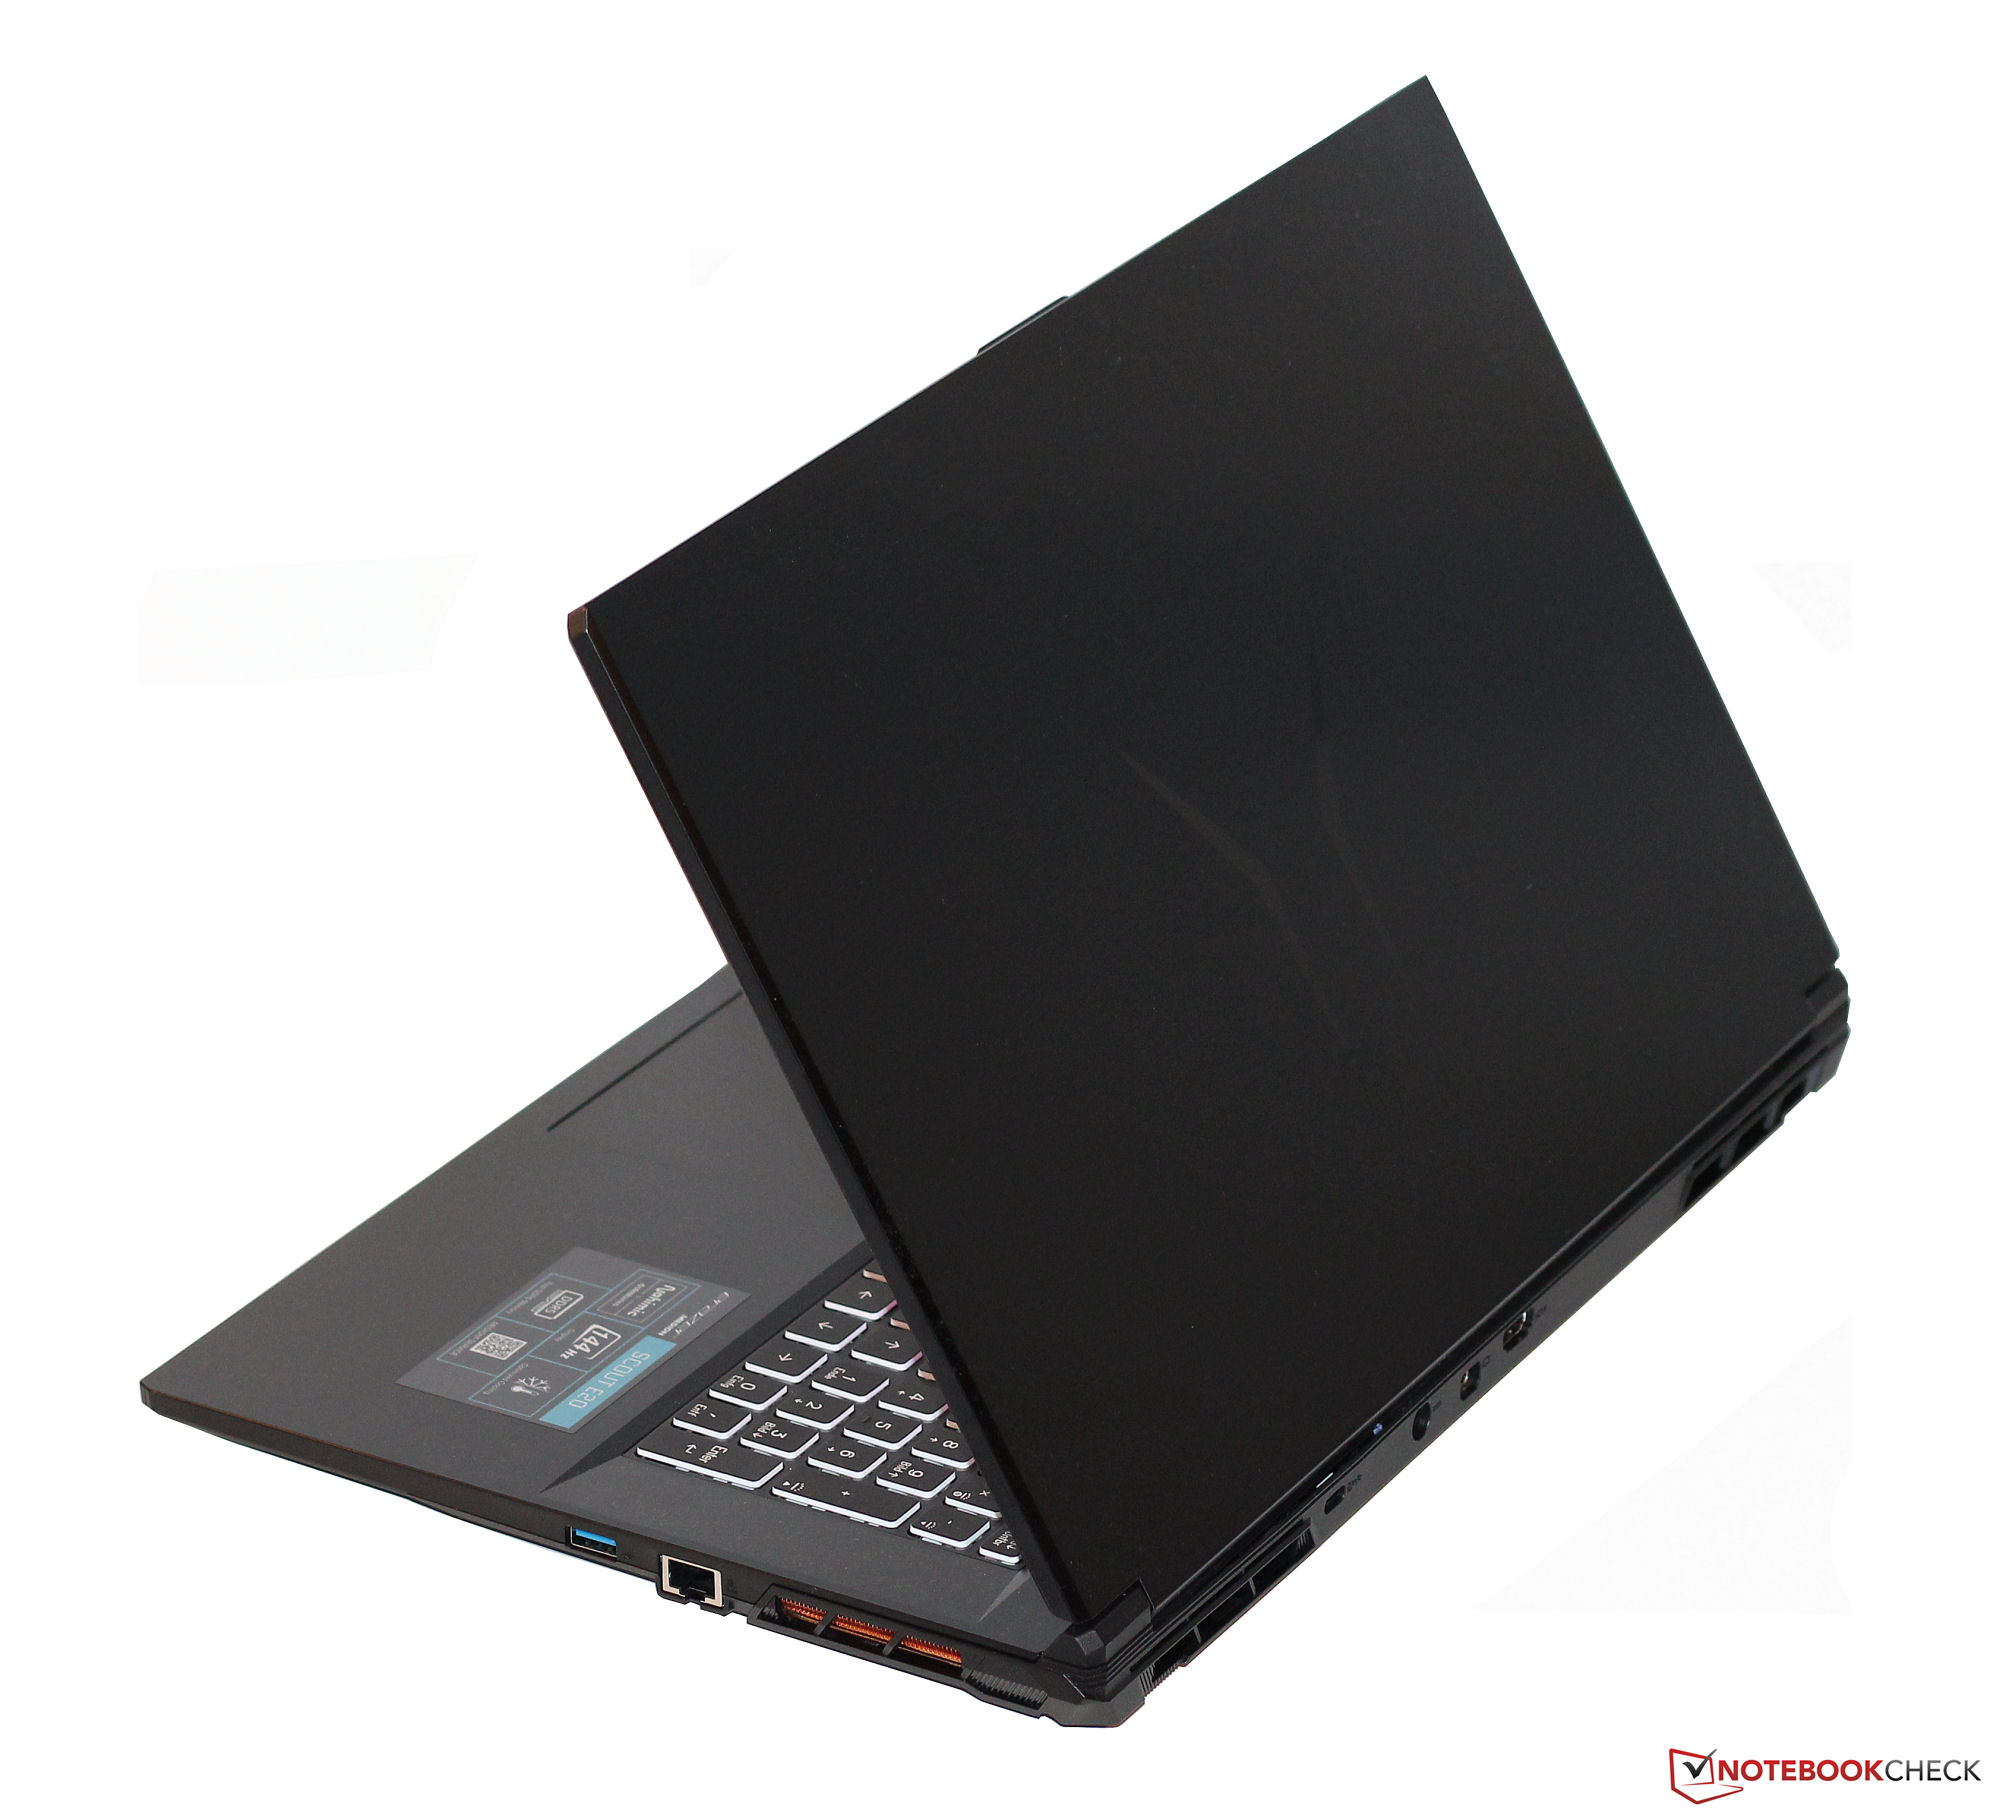

In terms of its size, the E20 measures at the level of comparable 17.3-inch laptops, and the same also goes for its weight to some extent. In our comparison field, it represents the heaviest device - together with the Katana 17 - at 2.8 kg (~6.2 lb). The G7 KE weighs a good 200 grams (7 oz) less than both of those competitors.
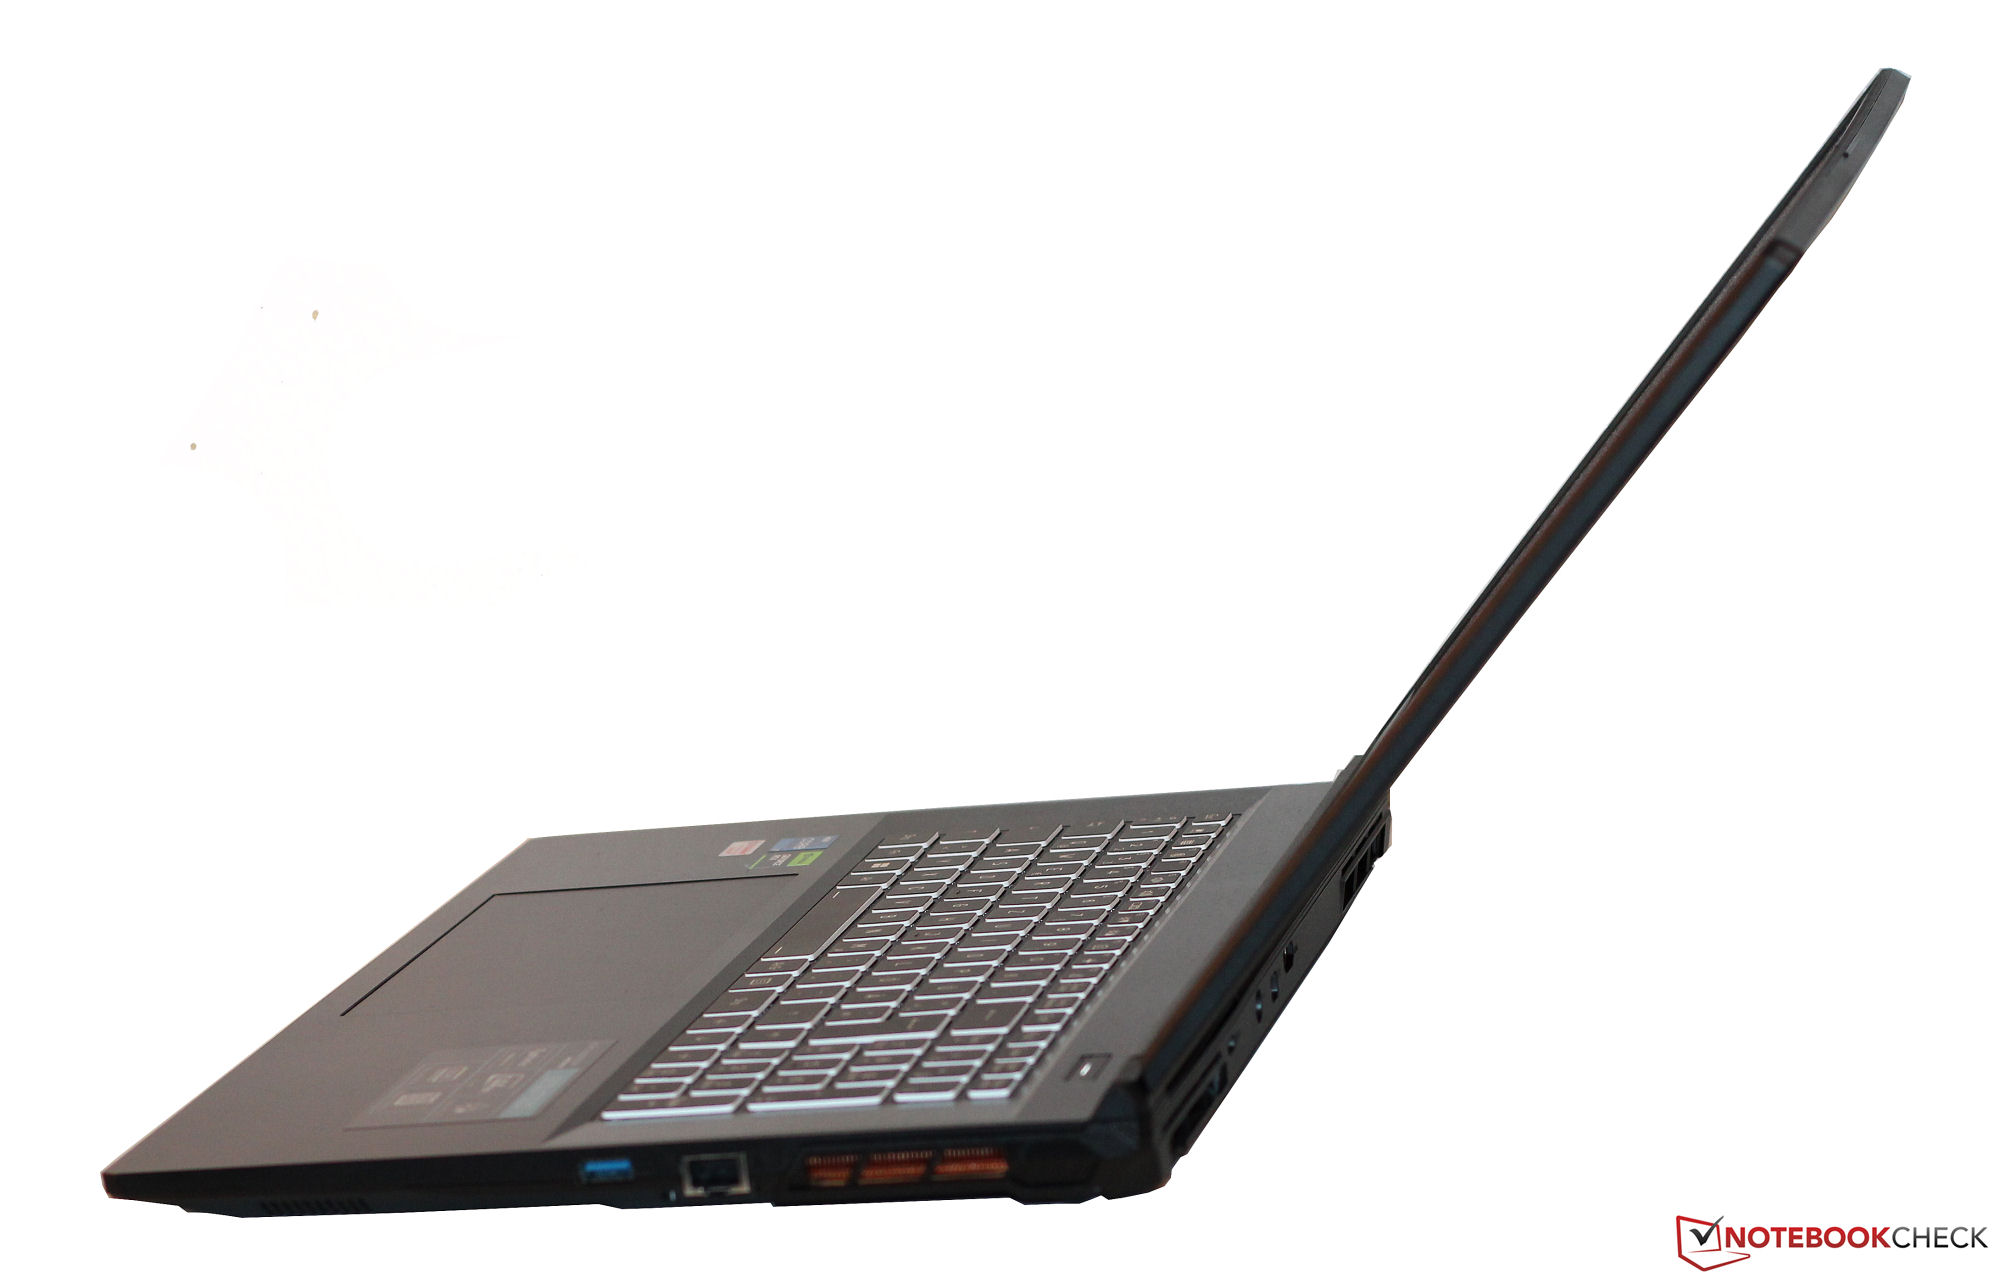
Equipment - No Thunderbolt for the Erazer
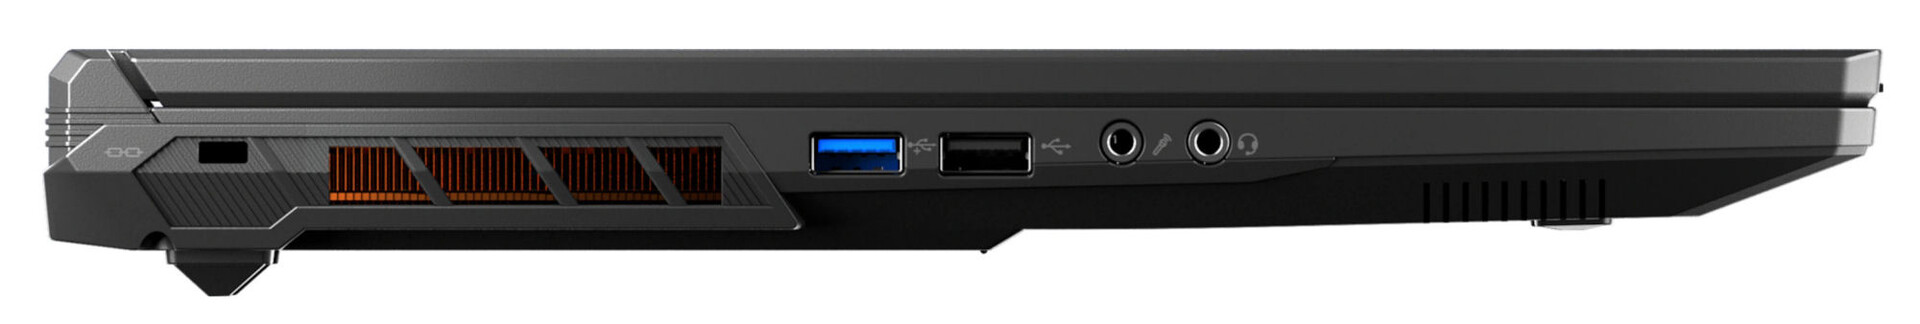
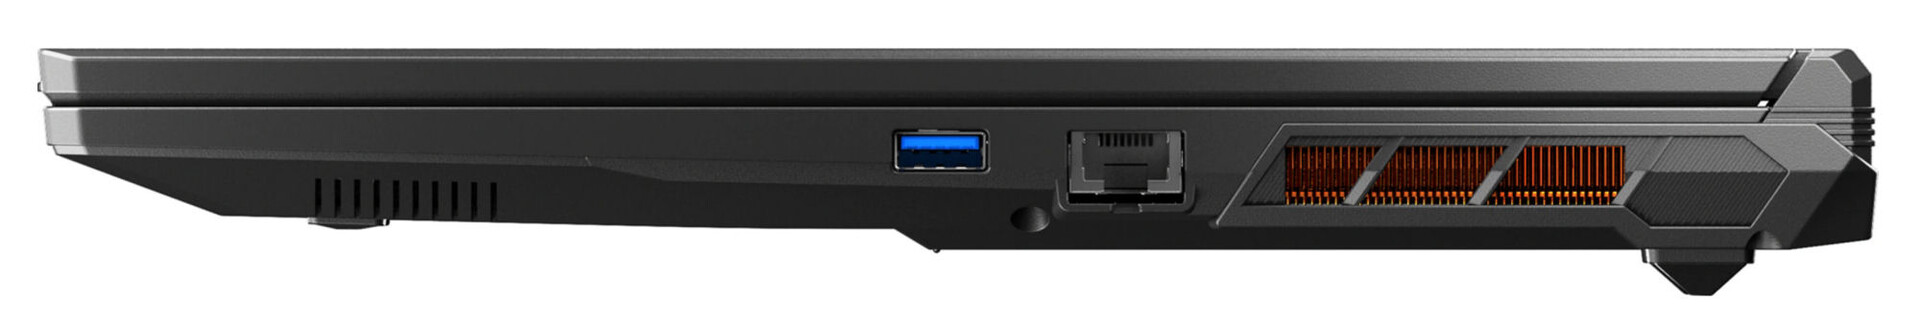
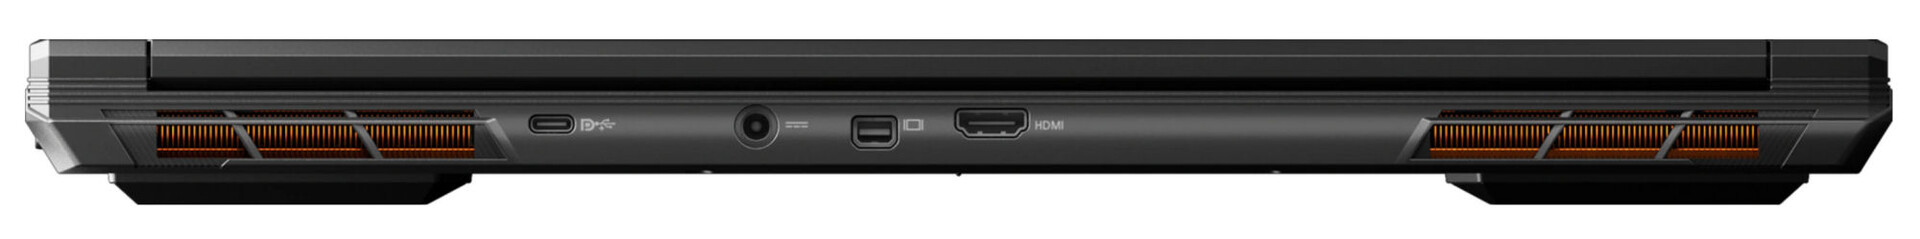
The Erazer offers three USB-A ports (1x USB 2.0, 1x USB 3.2 Gen 1, 1x USB 3.2 Gen 2) and a single USB-C port (USB 3.2 Gen 2). While the latter can output a DisplayPort signal, it doesn't include support for Power Delivery. The Scout E20 includes a total of three video output ports (HDMI 2.1, 2x DP). The connection equipment is completed by two audio ports and a Gigabit Ethernet port. There is no storage card reader.
The video ports and power connection are on the back of the device, so the corresponding cables would run in the back and not be in the way.
Communication
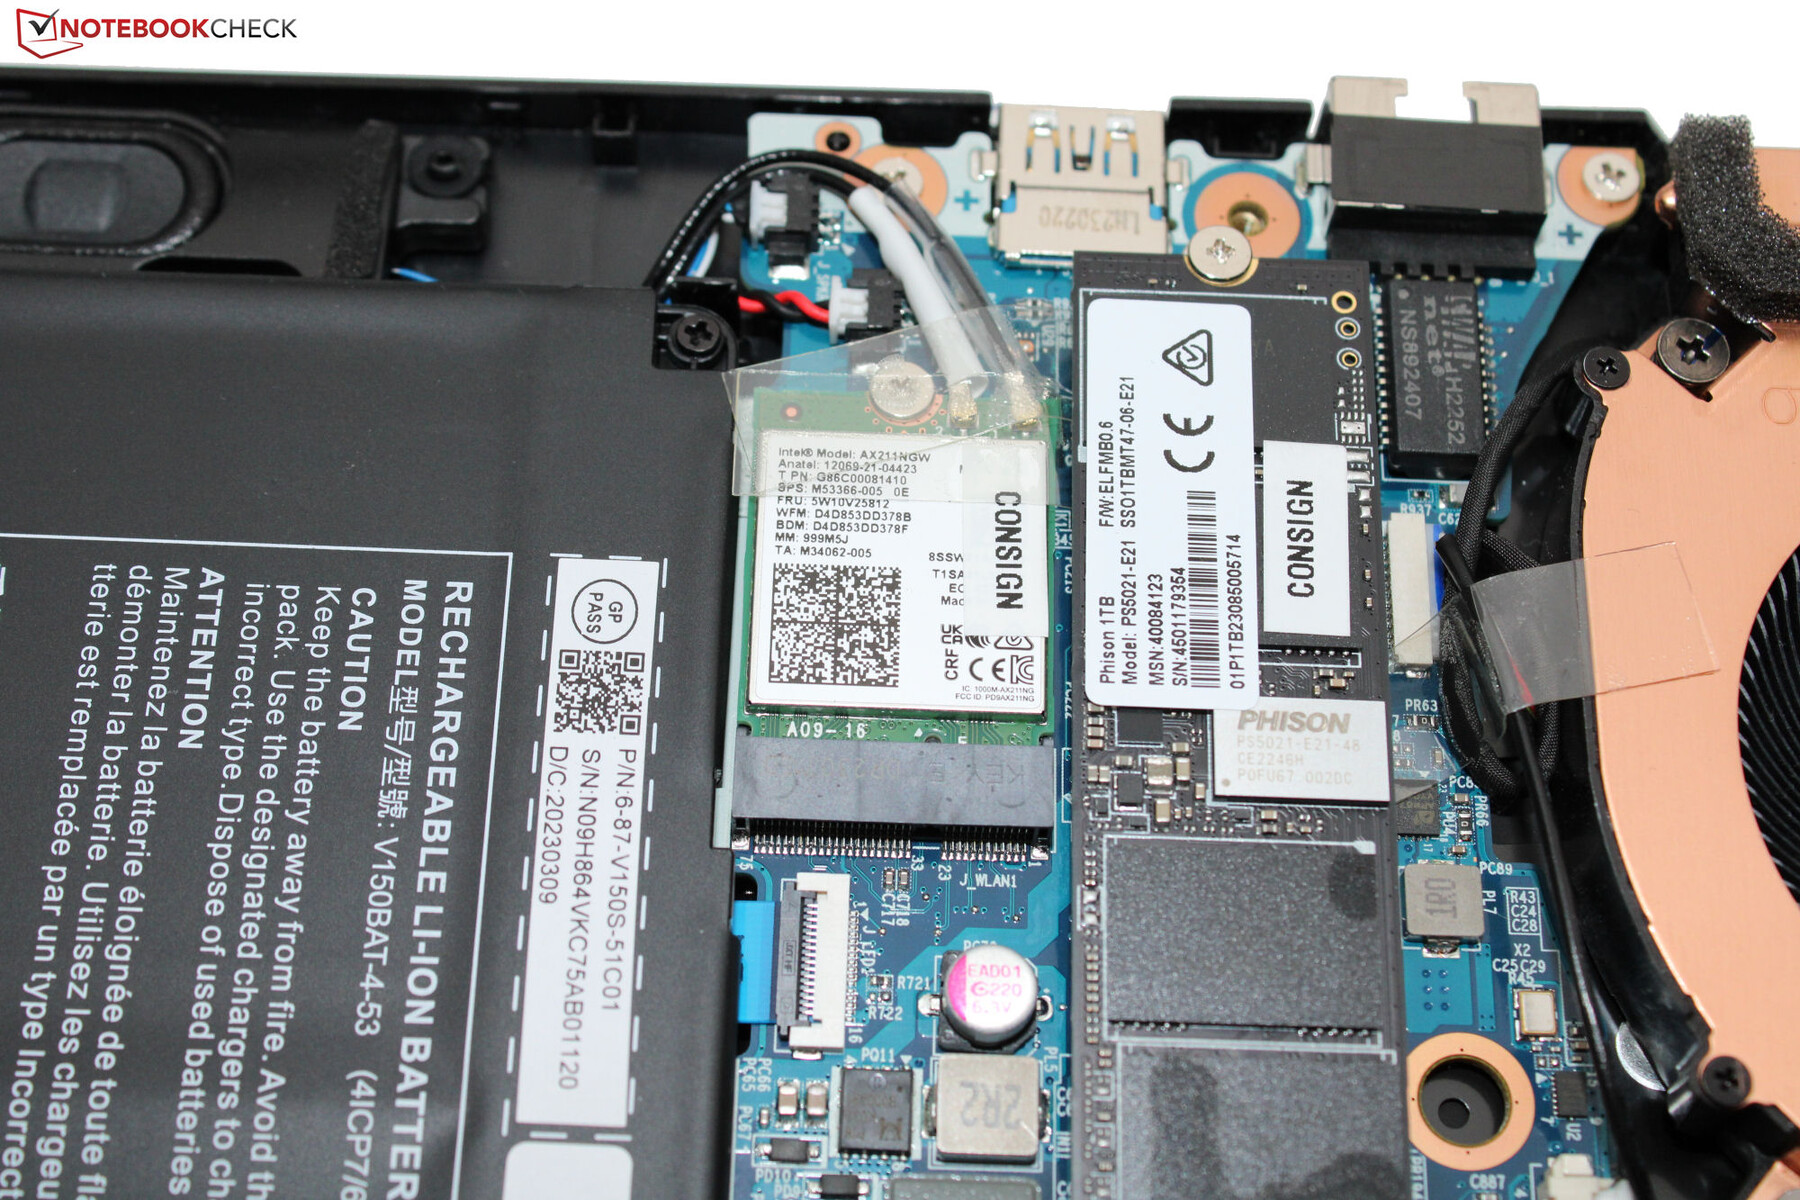
Under optimal conditions (without other WLAN devices in close proximity and close distance between laptop and server PC), excellent WiFi data rates are reached. The Medion laptop uses an Intel AX211 WiFi-6E chip, and wired connections are also handled by an Intel chip (I219-V; 1 Gbit/s).
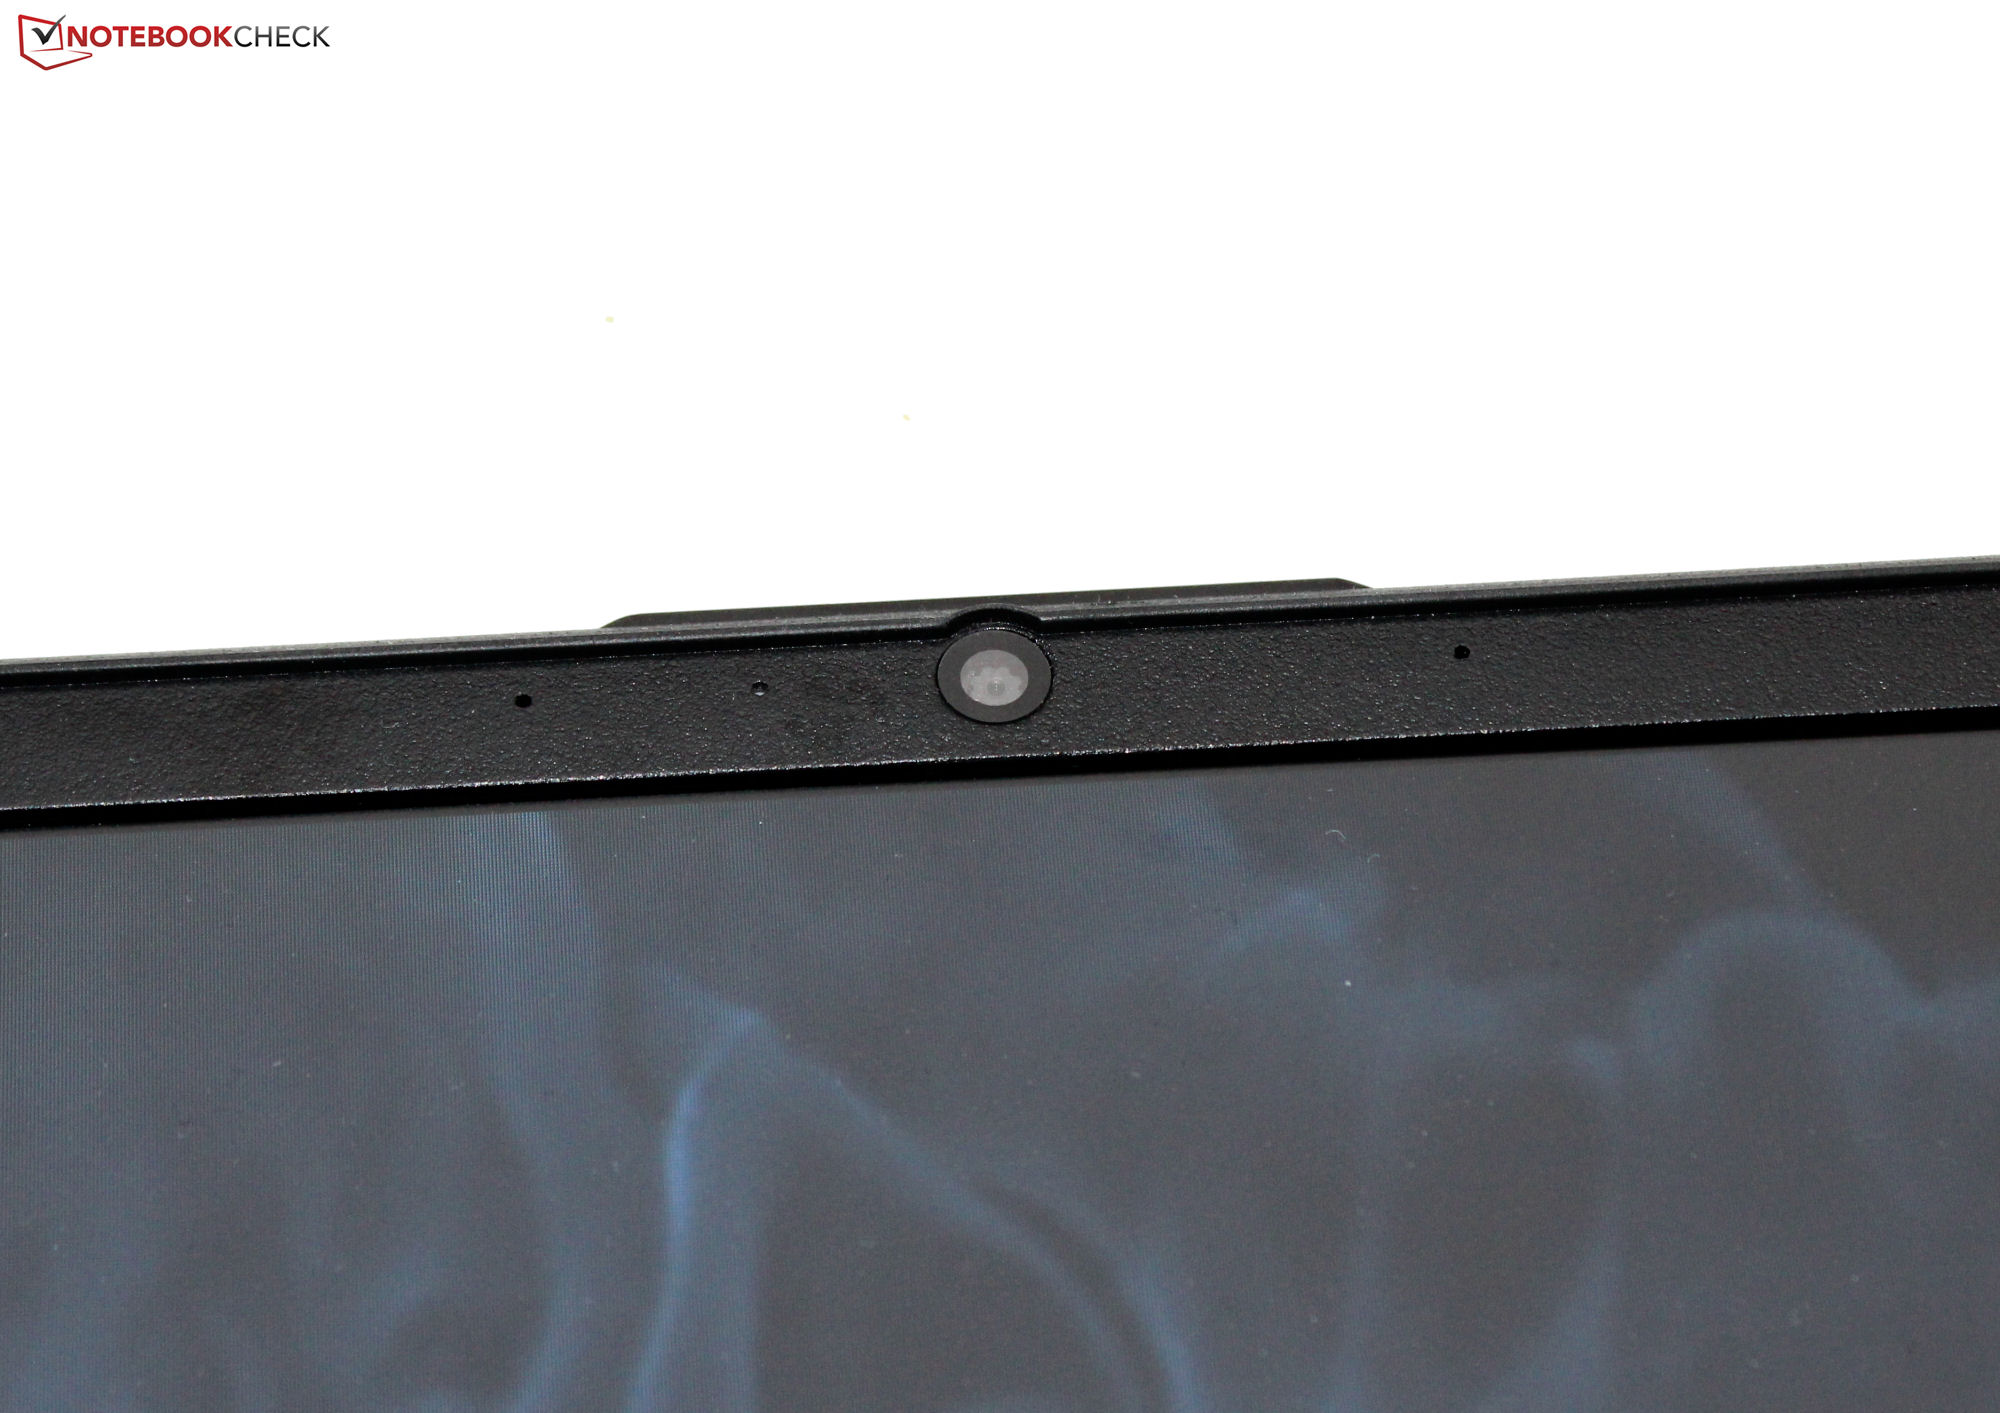
Webcam
The 0.9-MP webcam has a maximum resolution of 1,280 x 720 pixels and doesn't offer a mechanical shutter. The quality it is able to deliver is standard fare, but at least the results only show a relatively low color deviation.


Accessories
The laptop doesn't include any additional accessories besides the usual documentation such as the quick start instructions and warranty information.
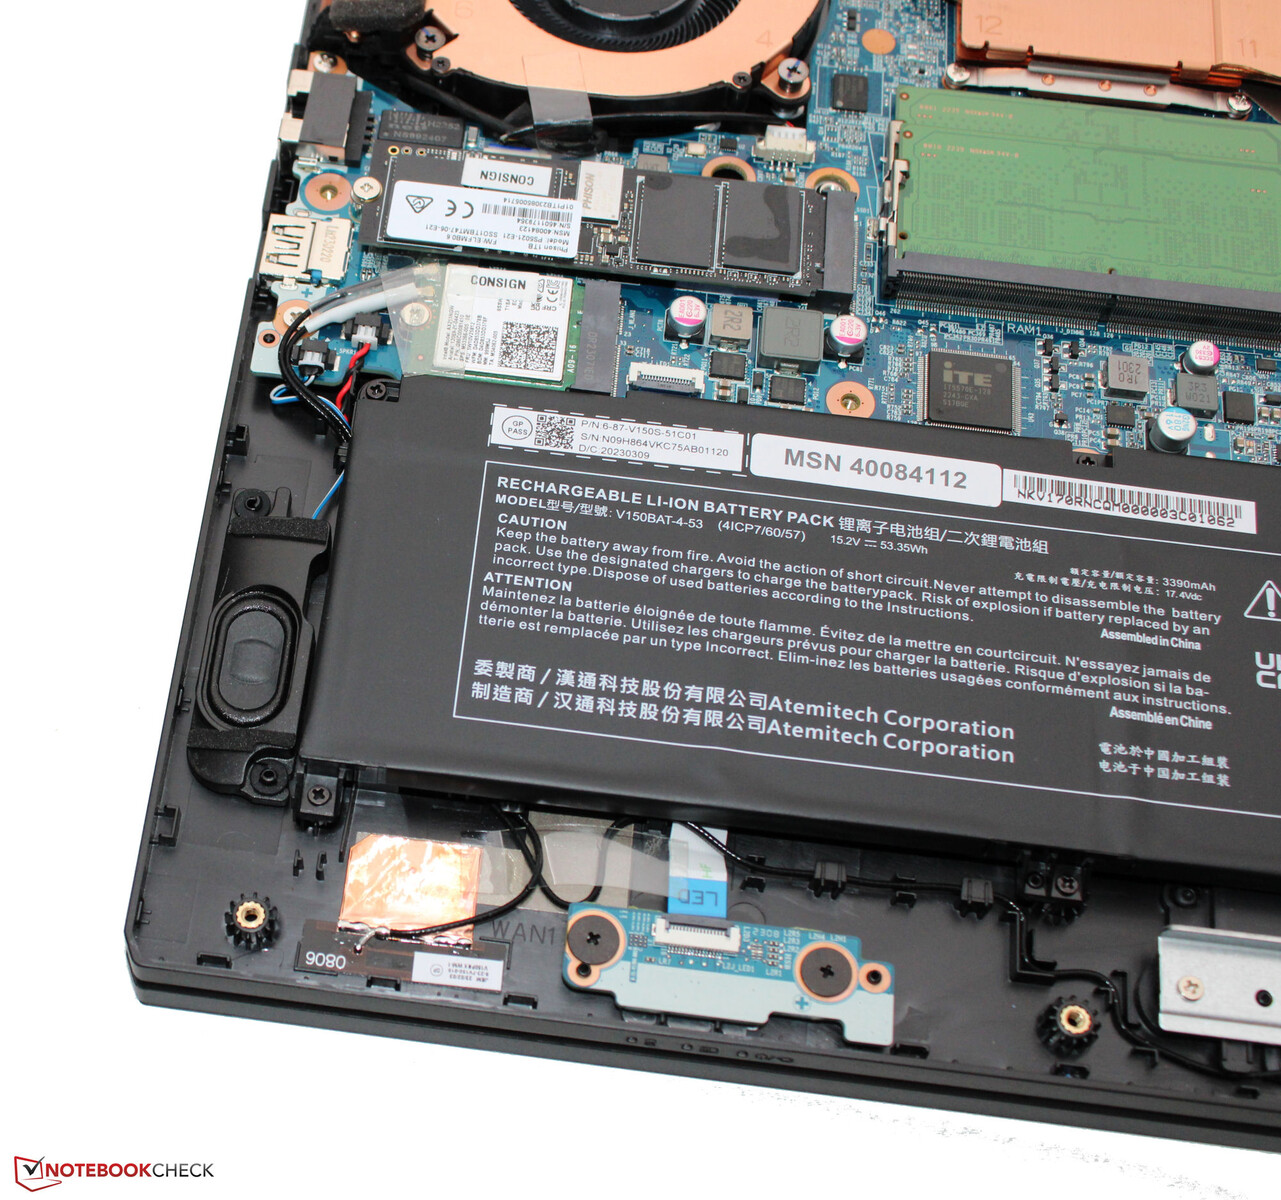
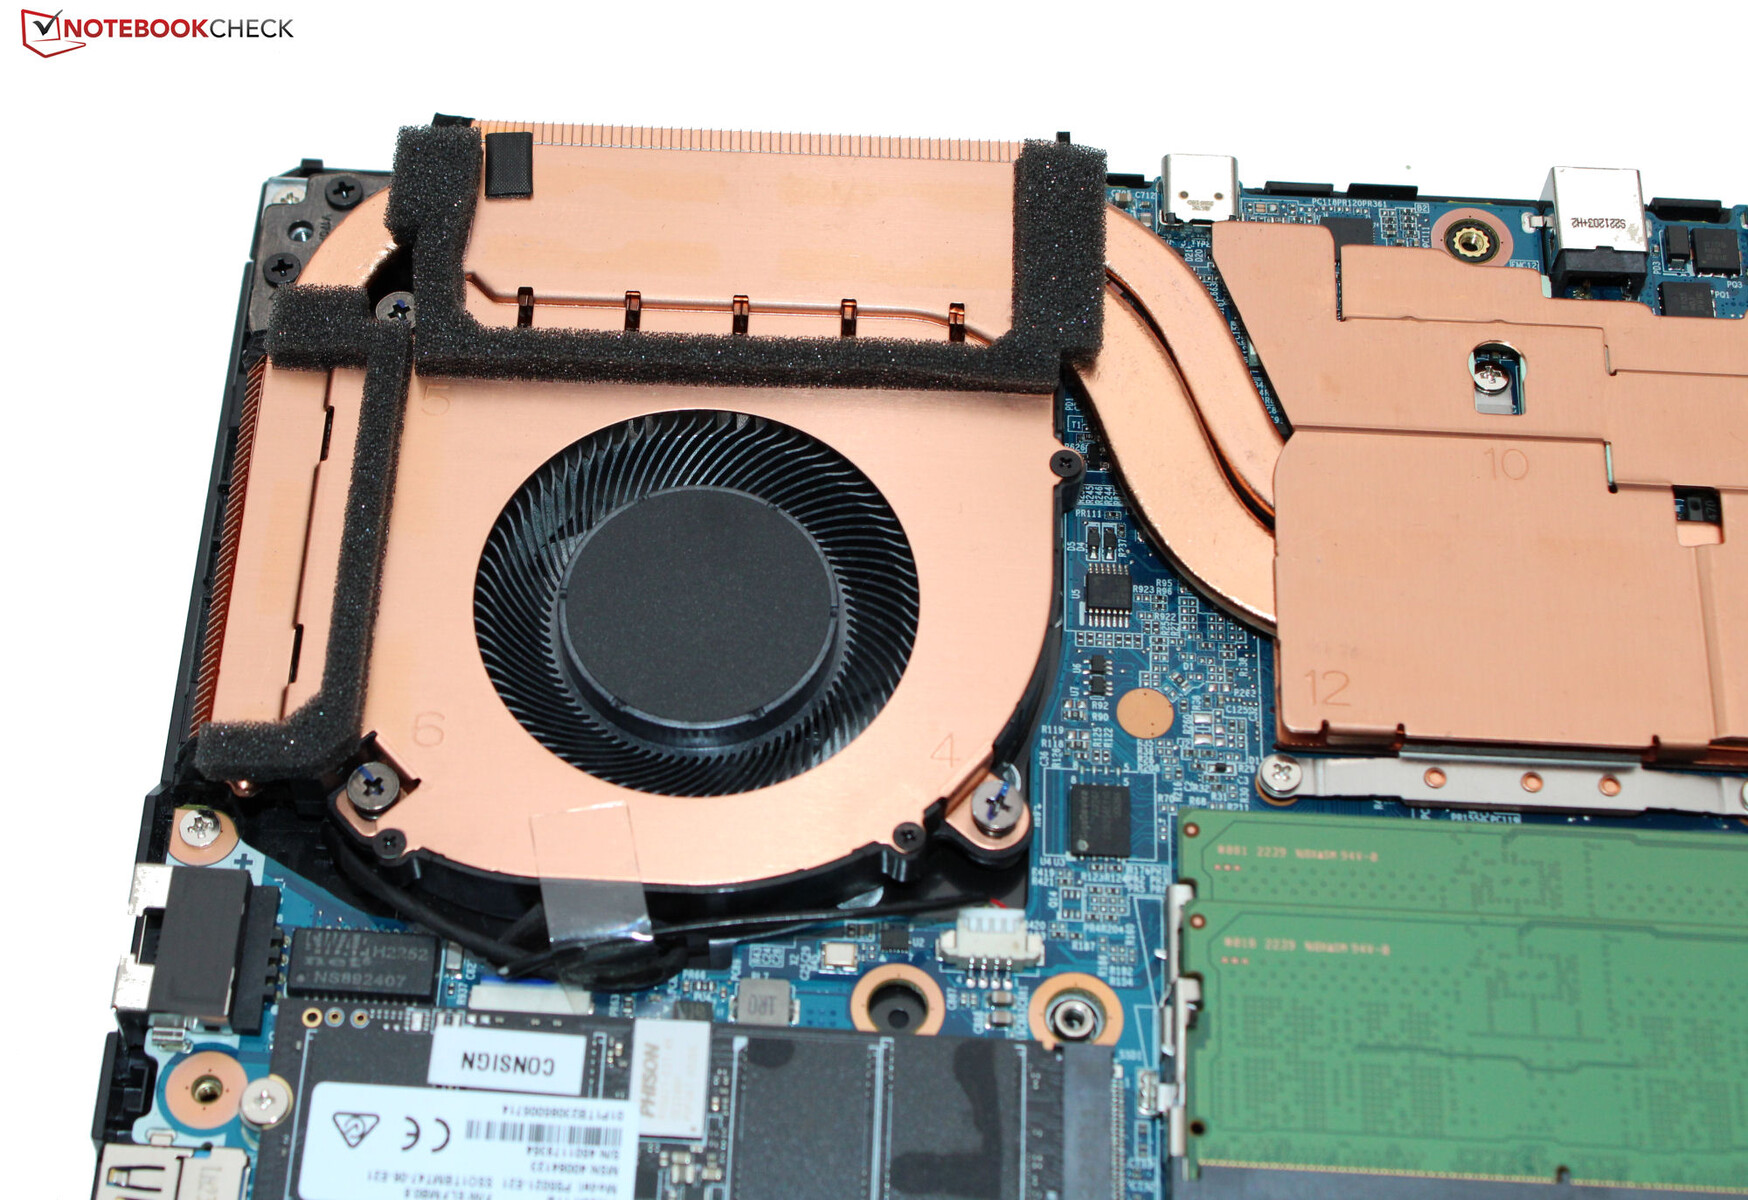
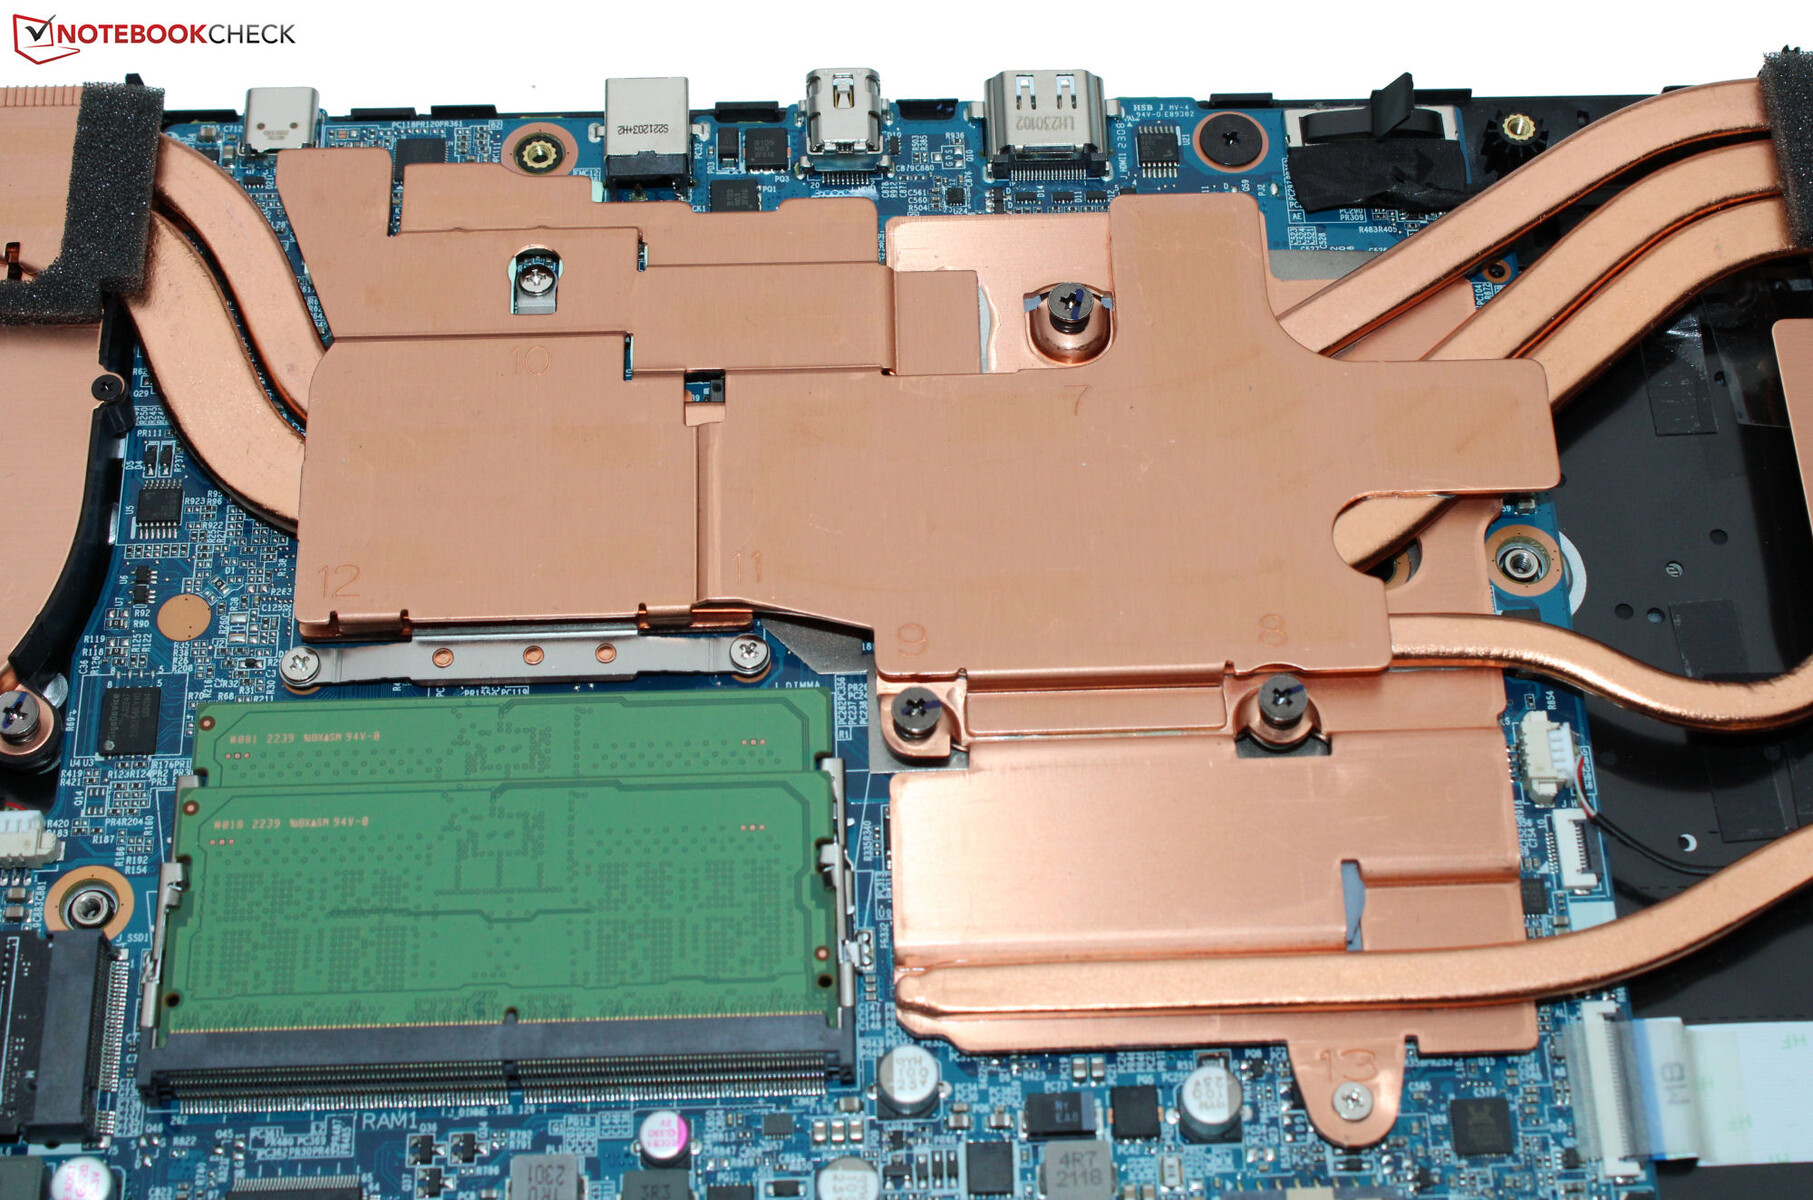
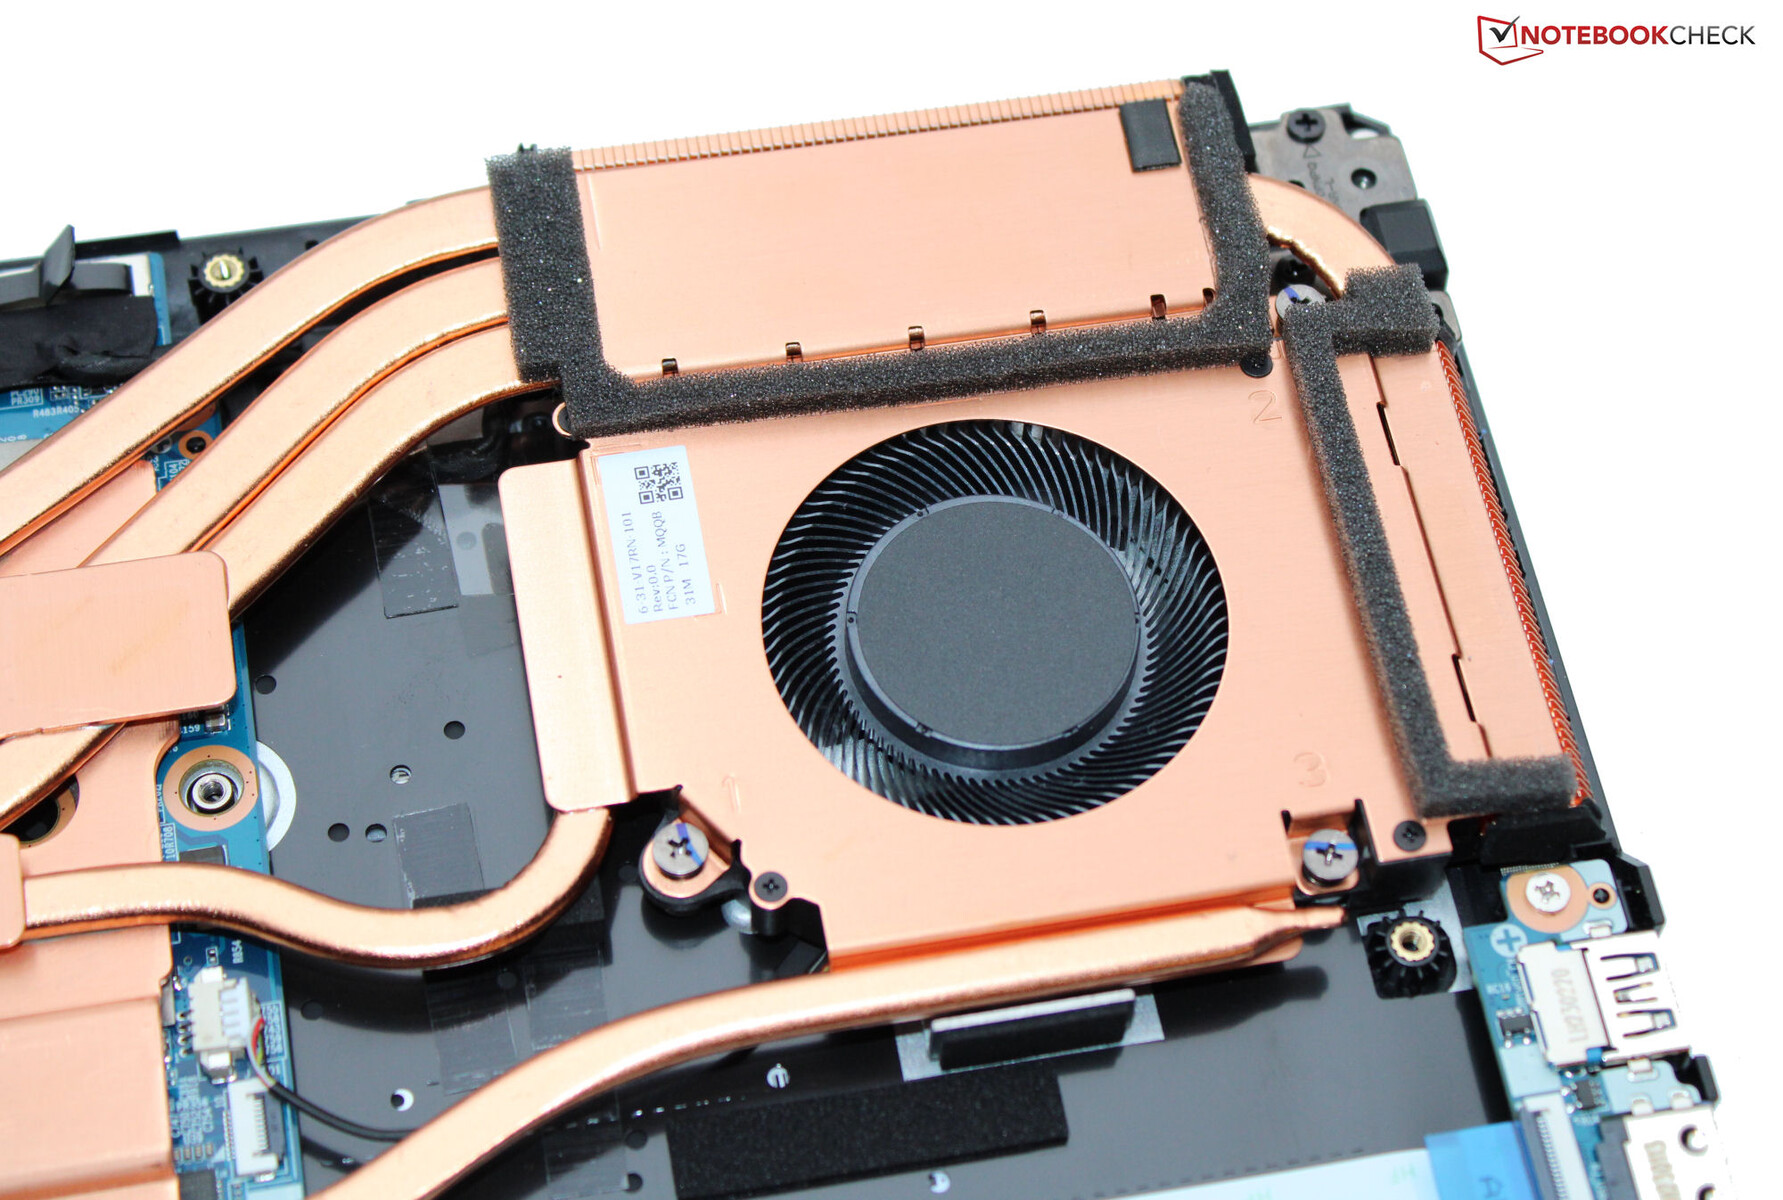
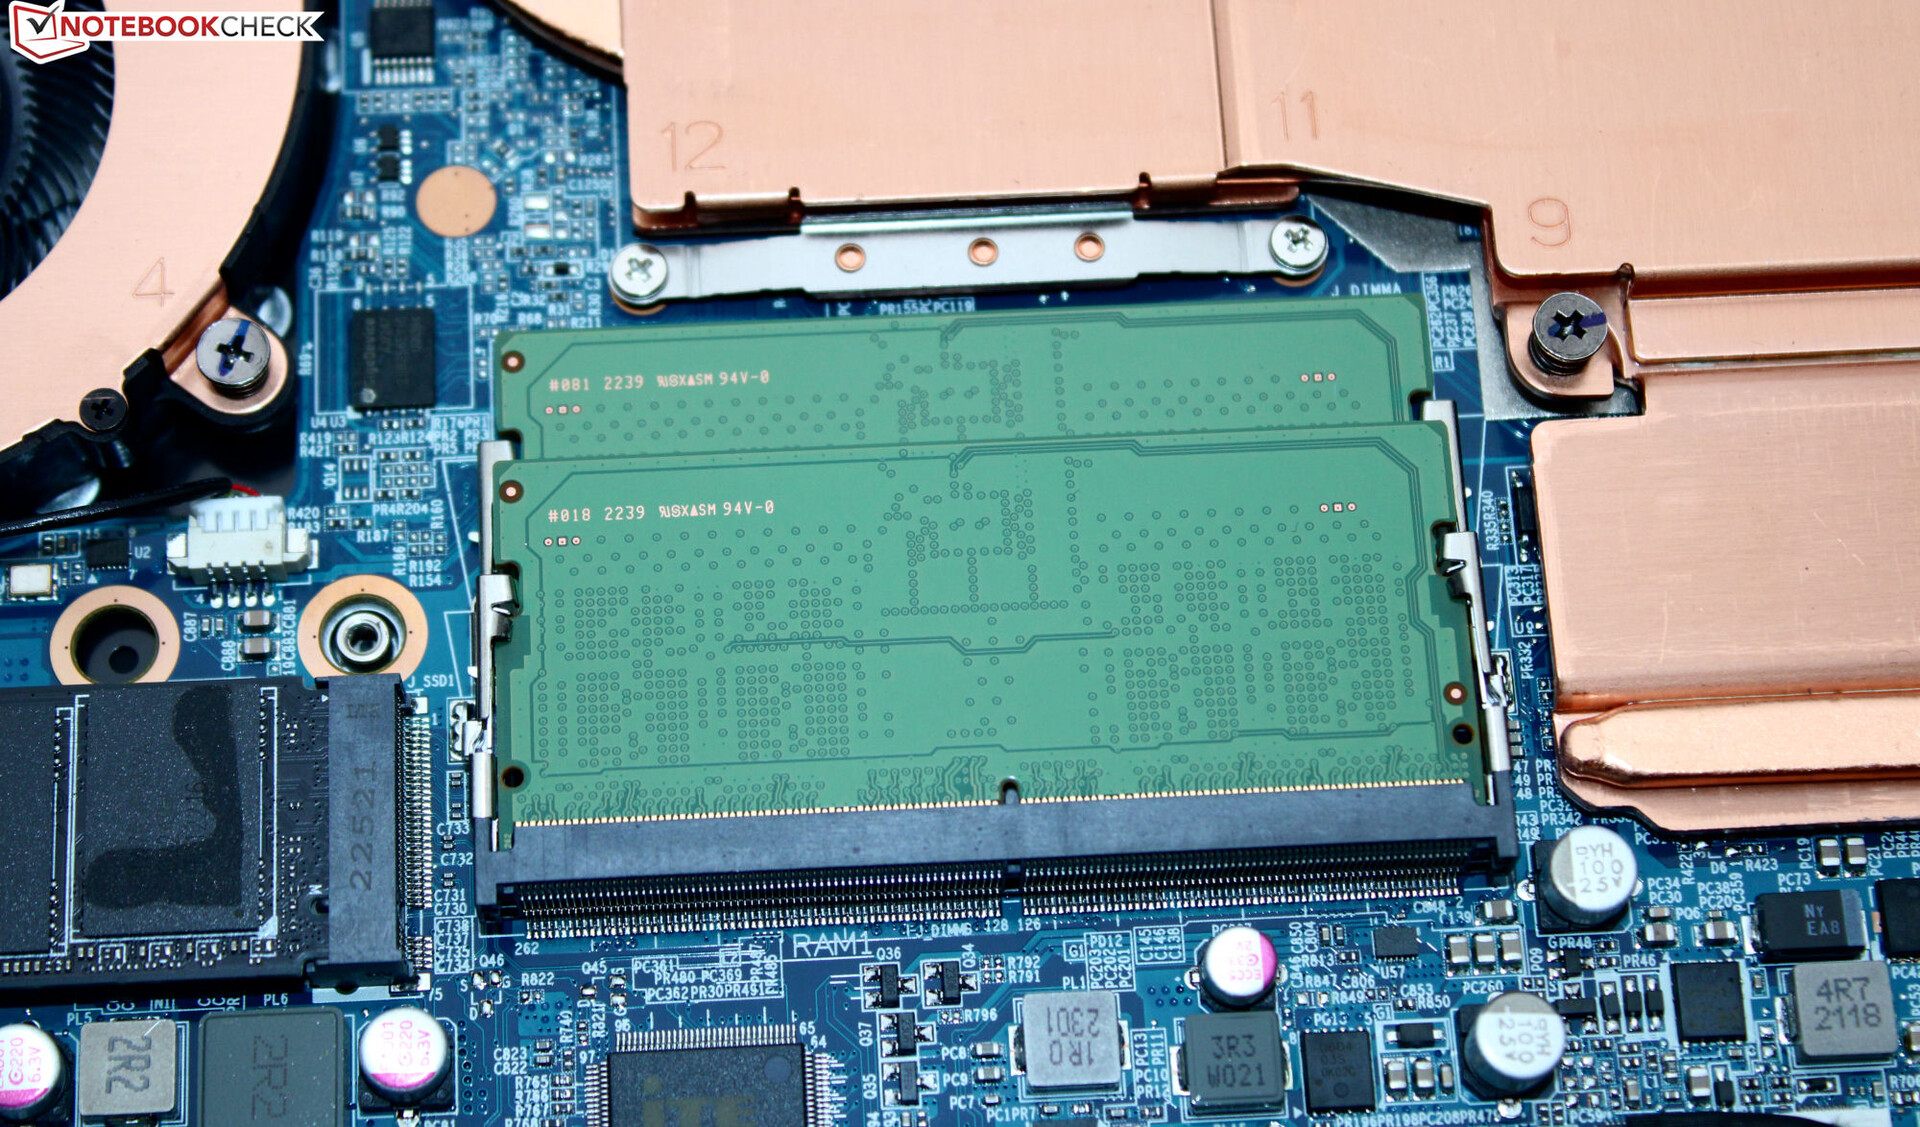
Maintenance
After removing numerous screws on the bottom of the case, you can take off the bottom plate with the help of a prying tool such as a flat spatula. You will then get access to the working memory banks (both of which are occupied), the PCIe 4 M.2-2280 SSD, the WLAN module, the fans, and the battery.
Warranty
Medion offers a two-year warranty for the Erazer. While warranty extensions are available, you have to purchase them together with the laptop from the Medion online shop. It is not possible to purchase them later.
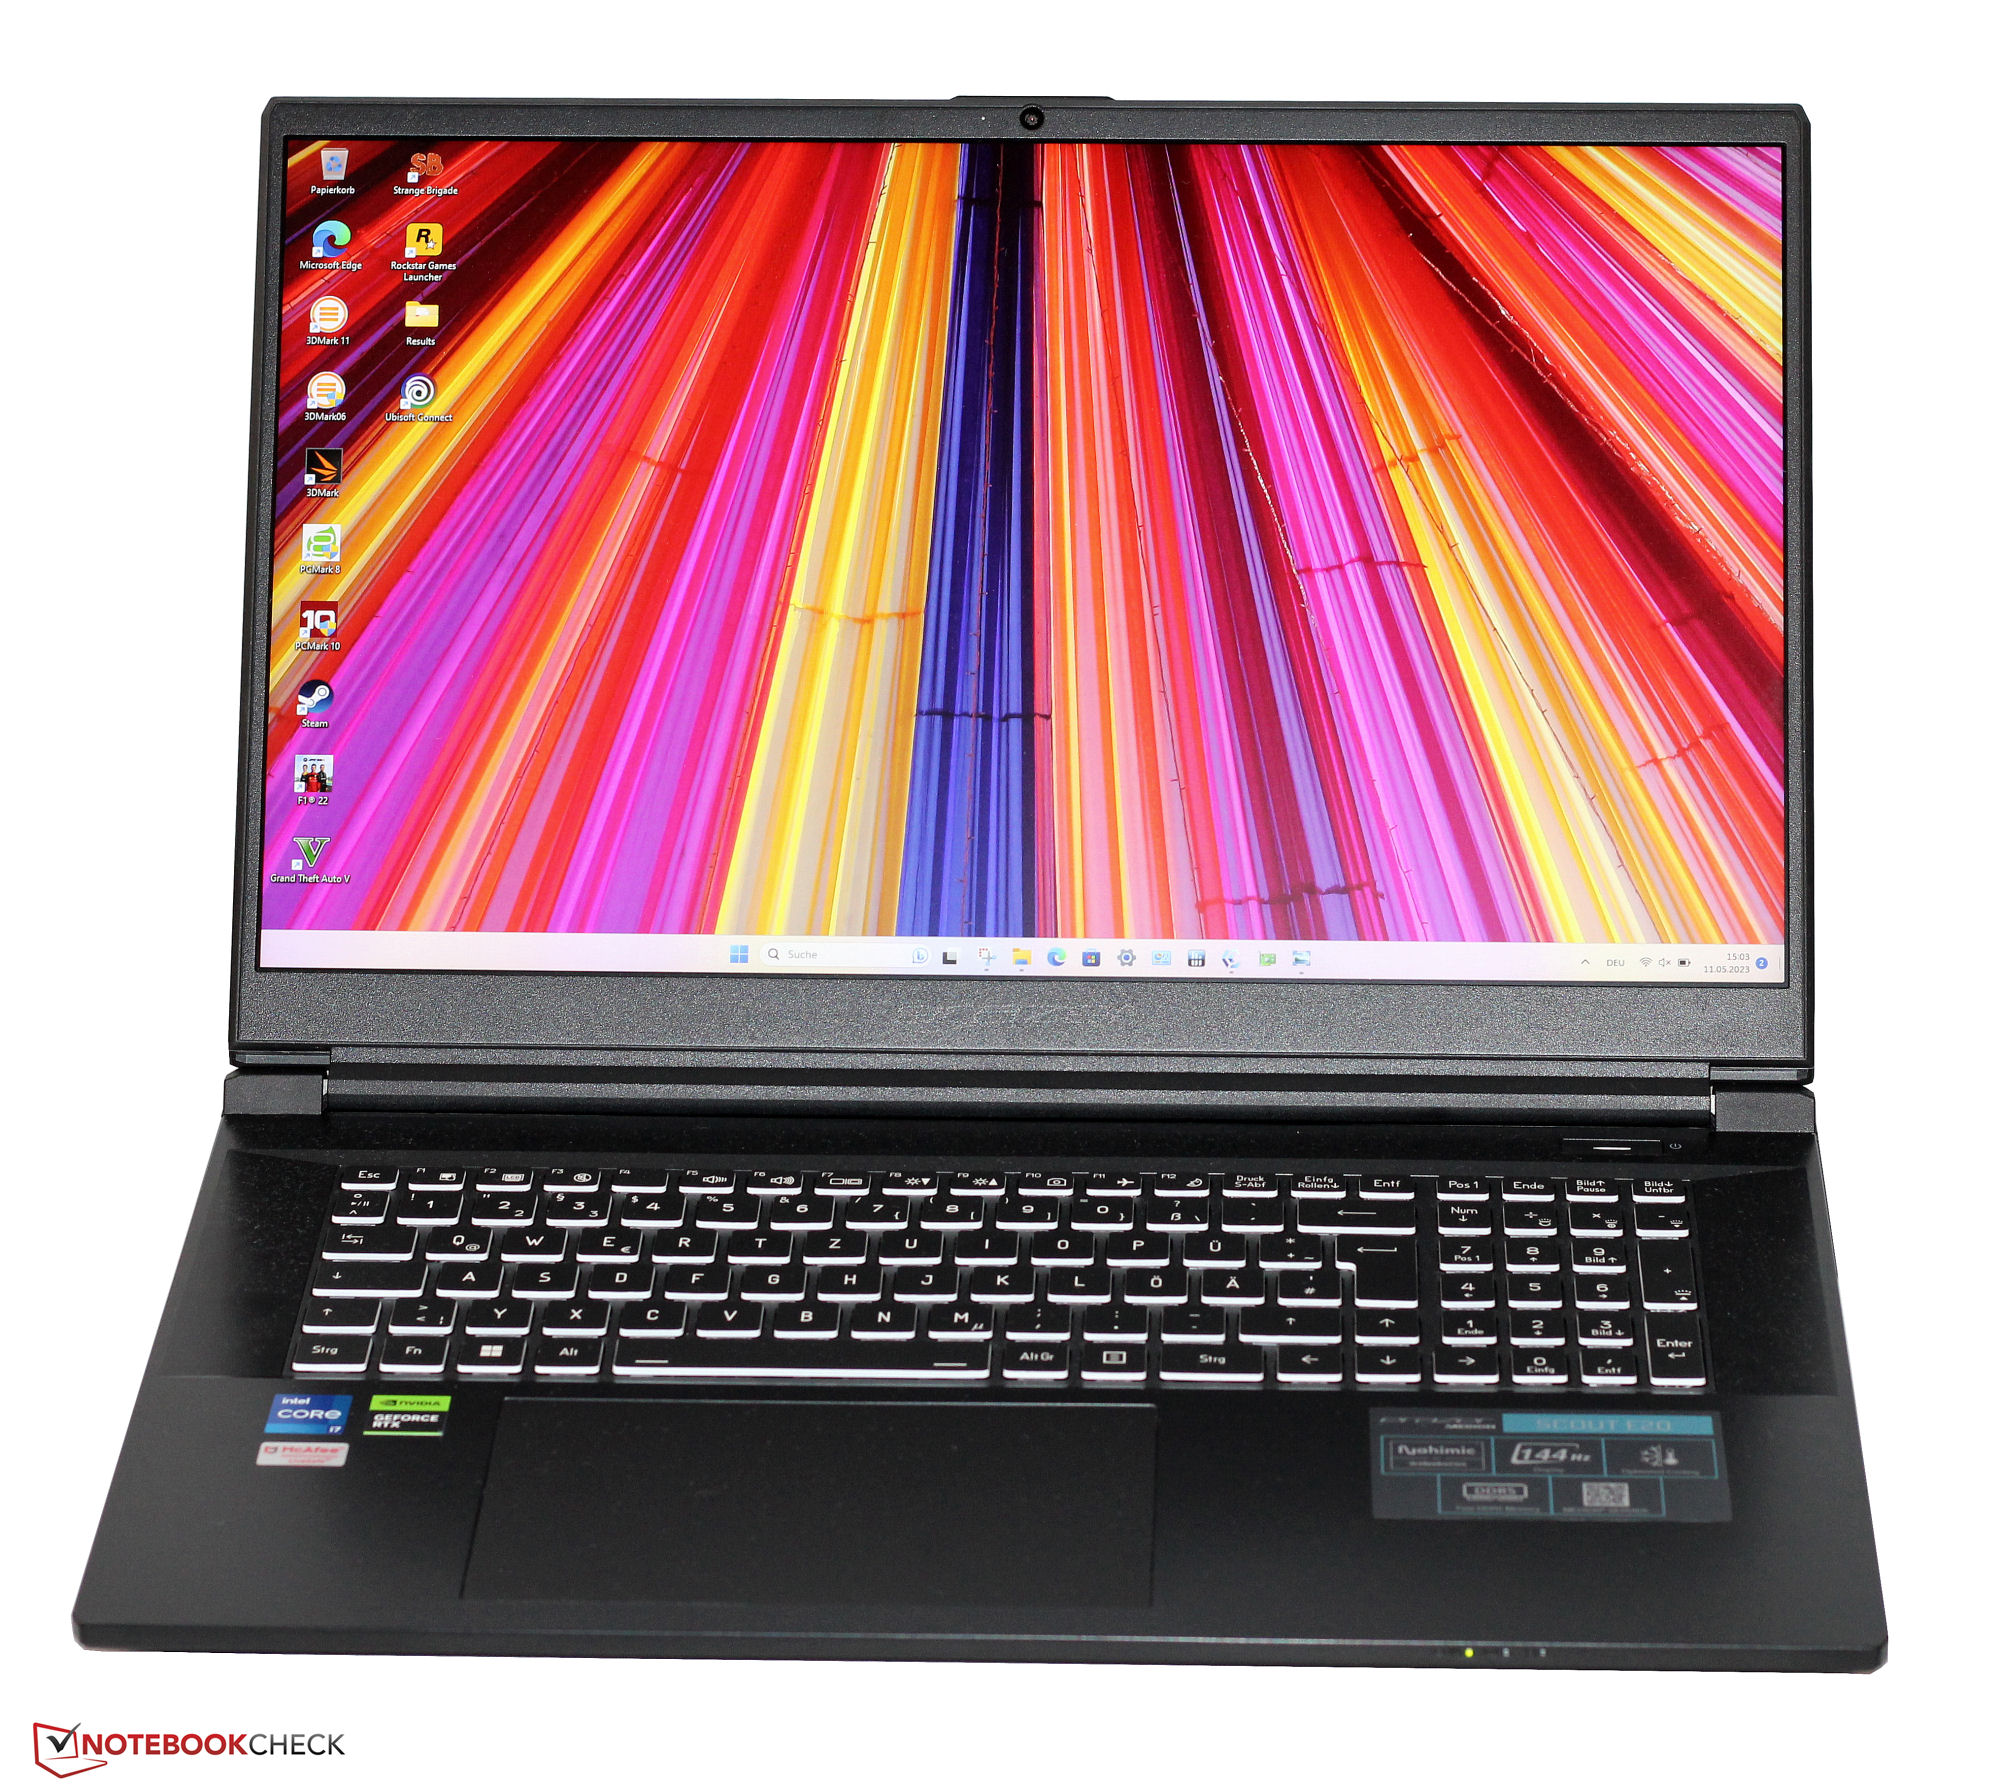
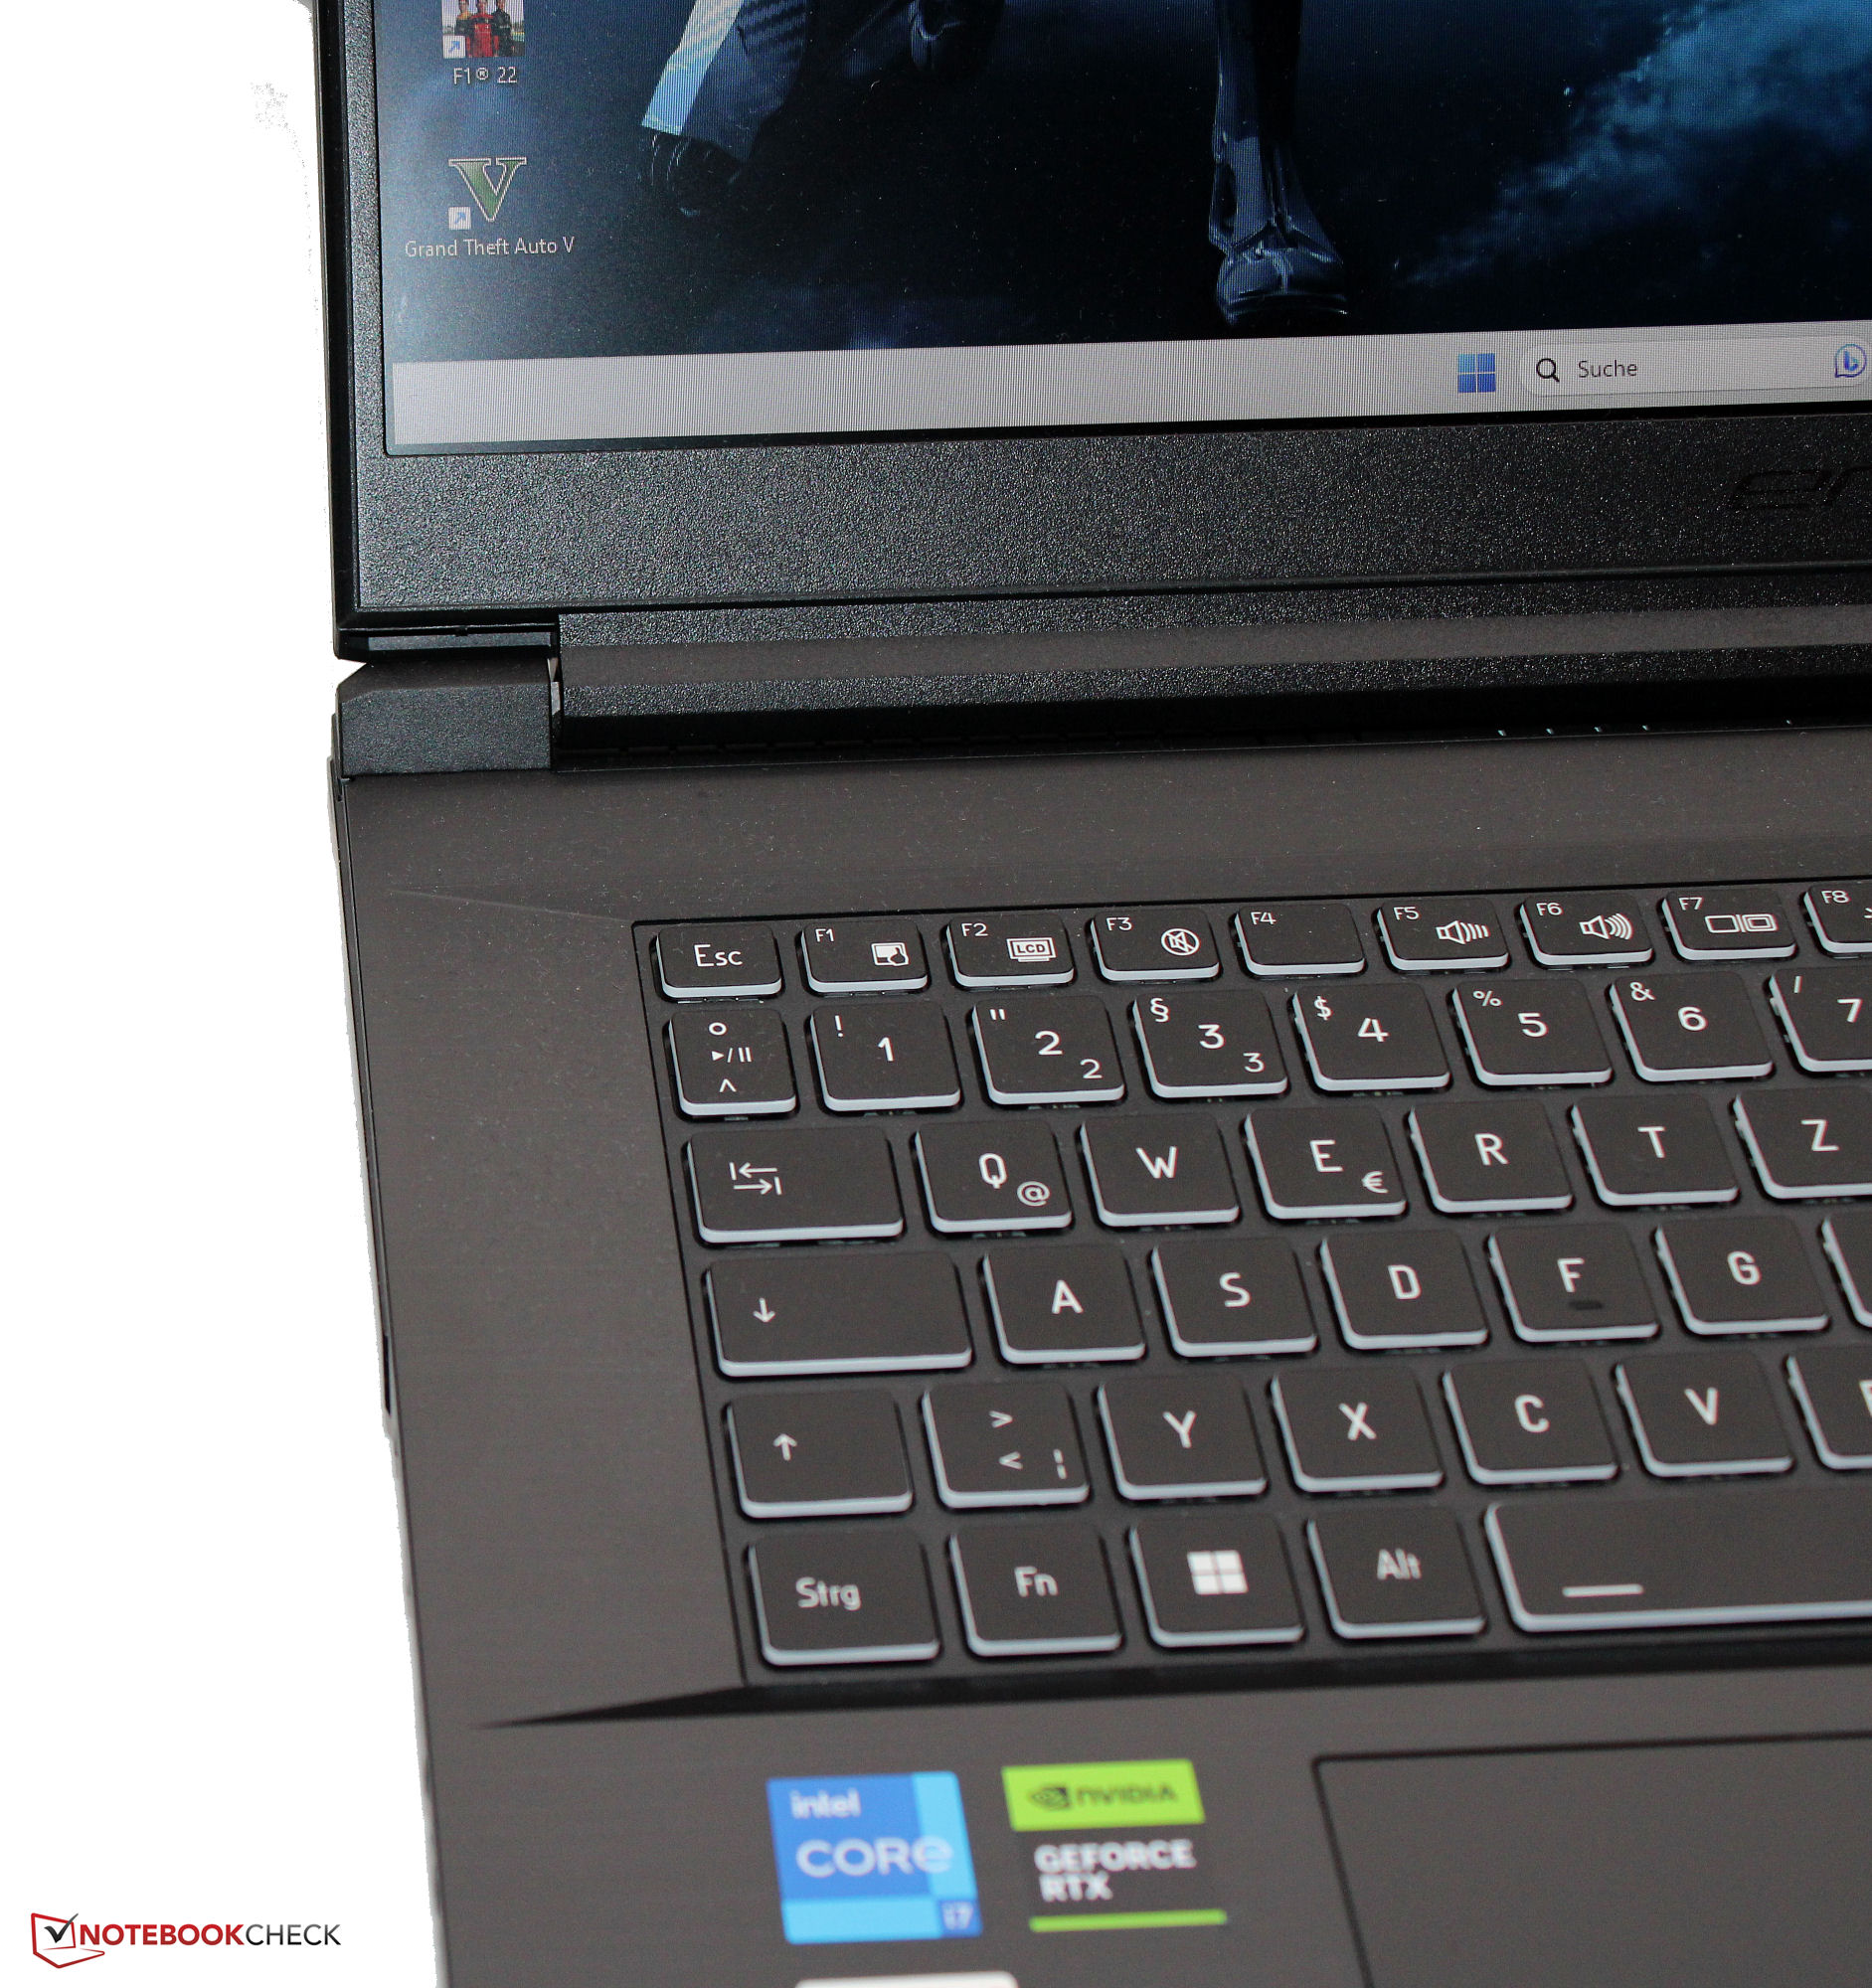
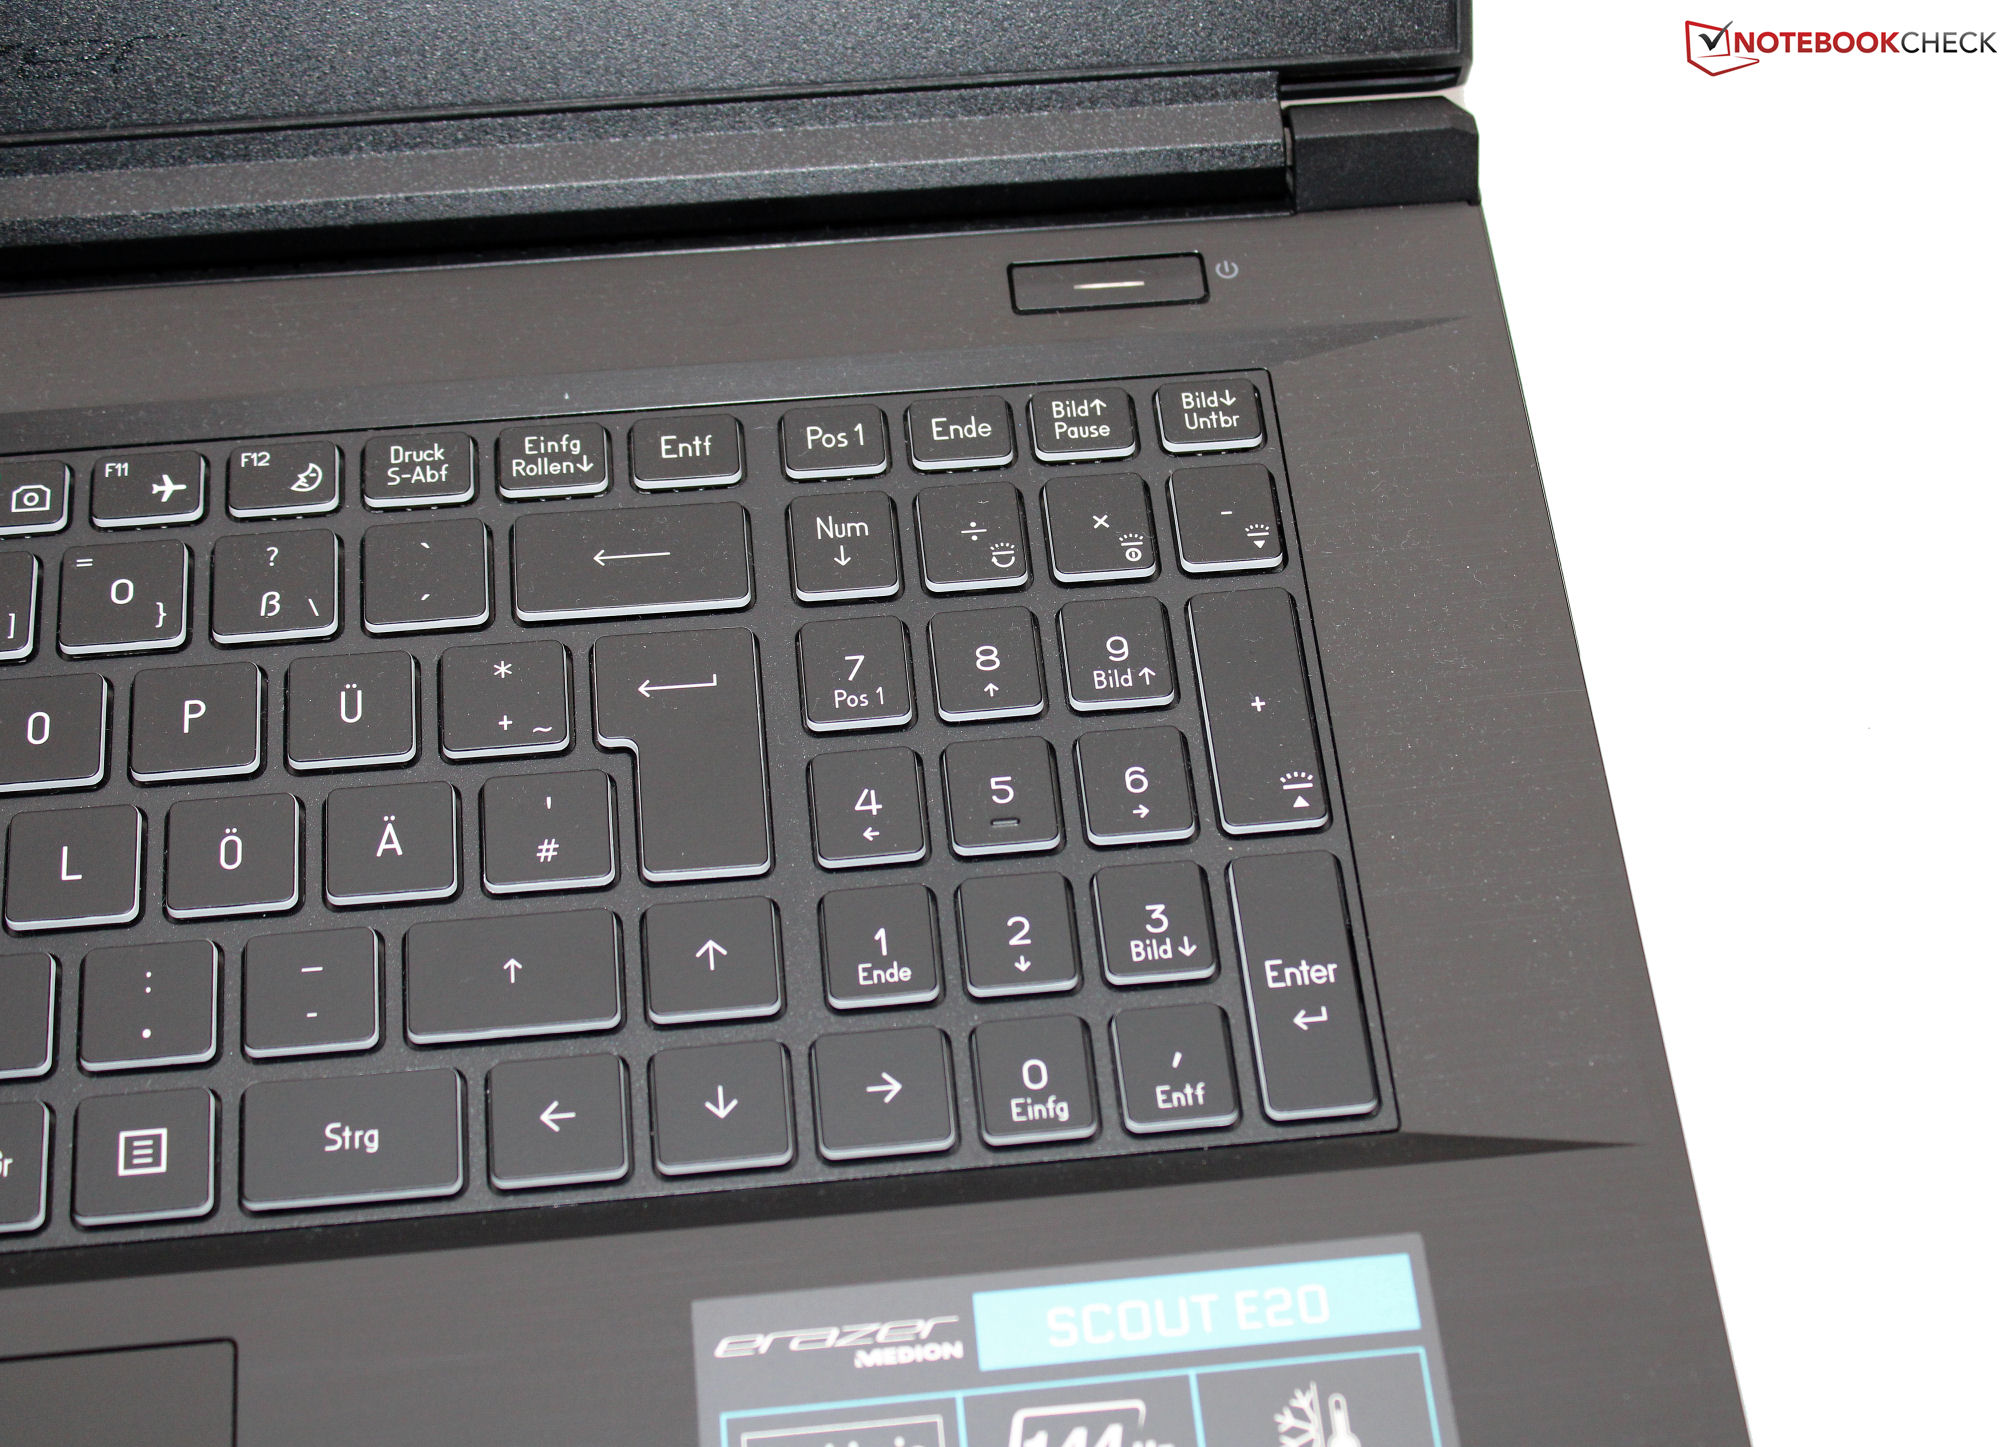
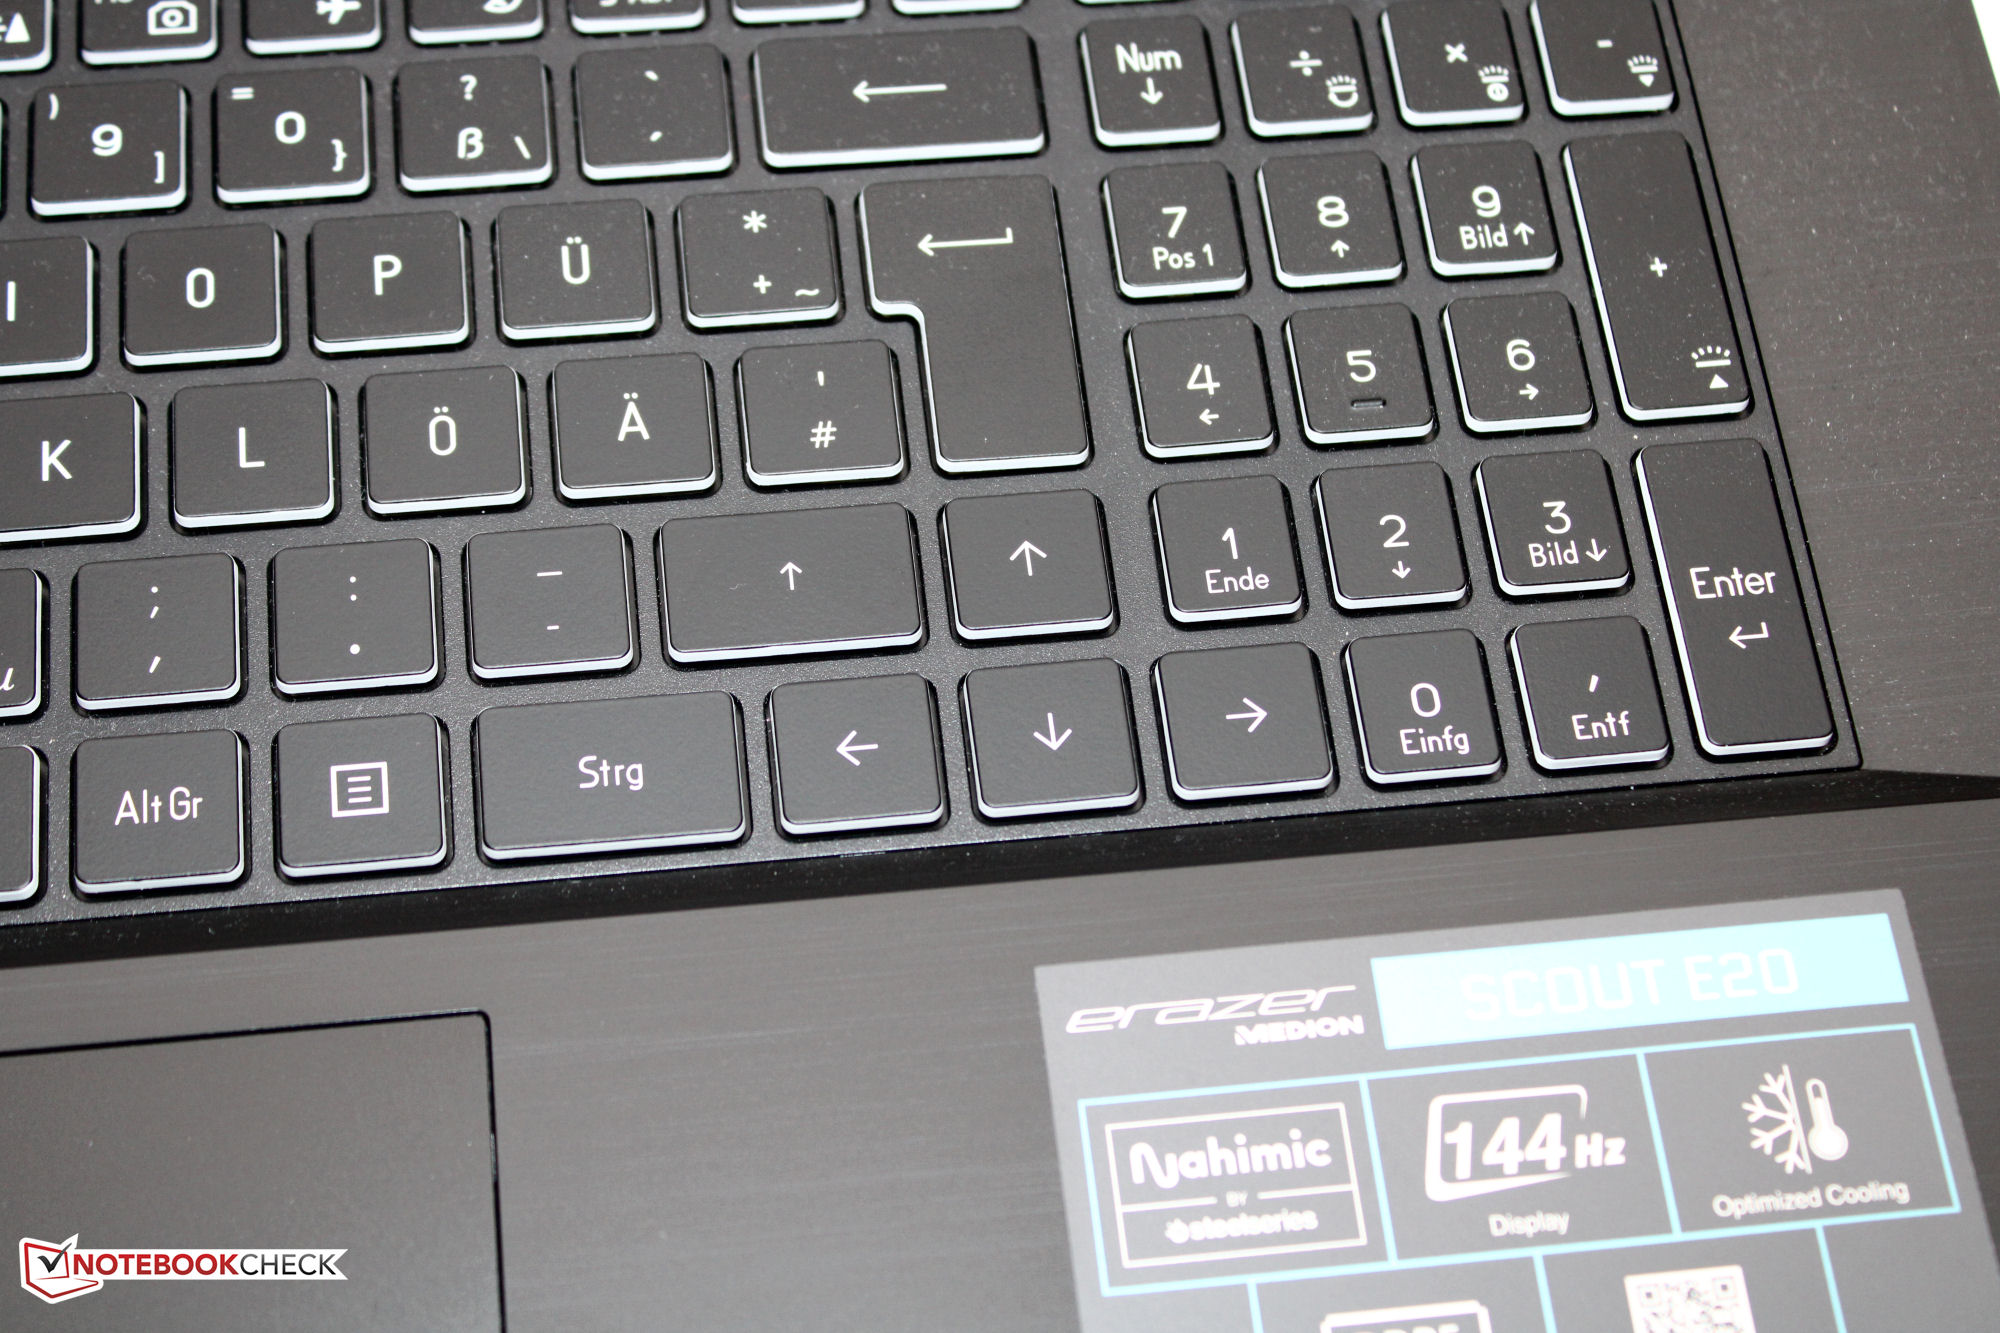
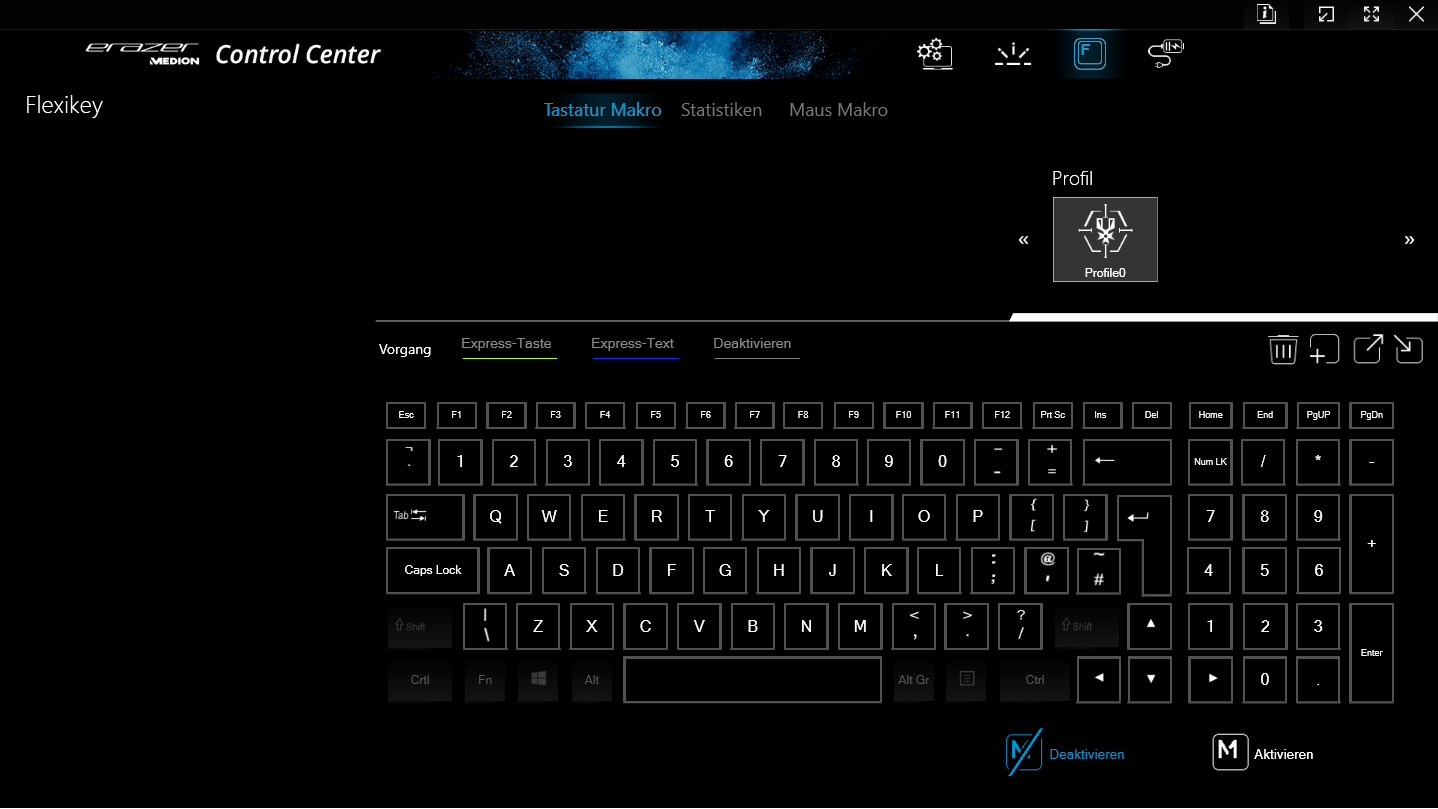
Input Devices - E20 keyboard with RGB illumination
Keyboard
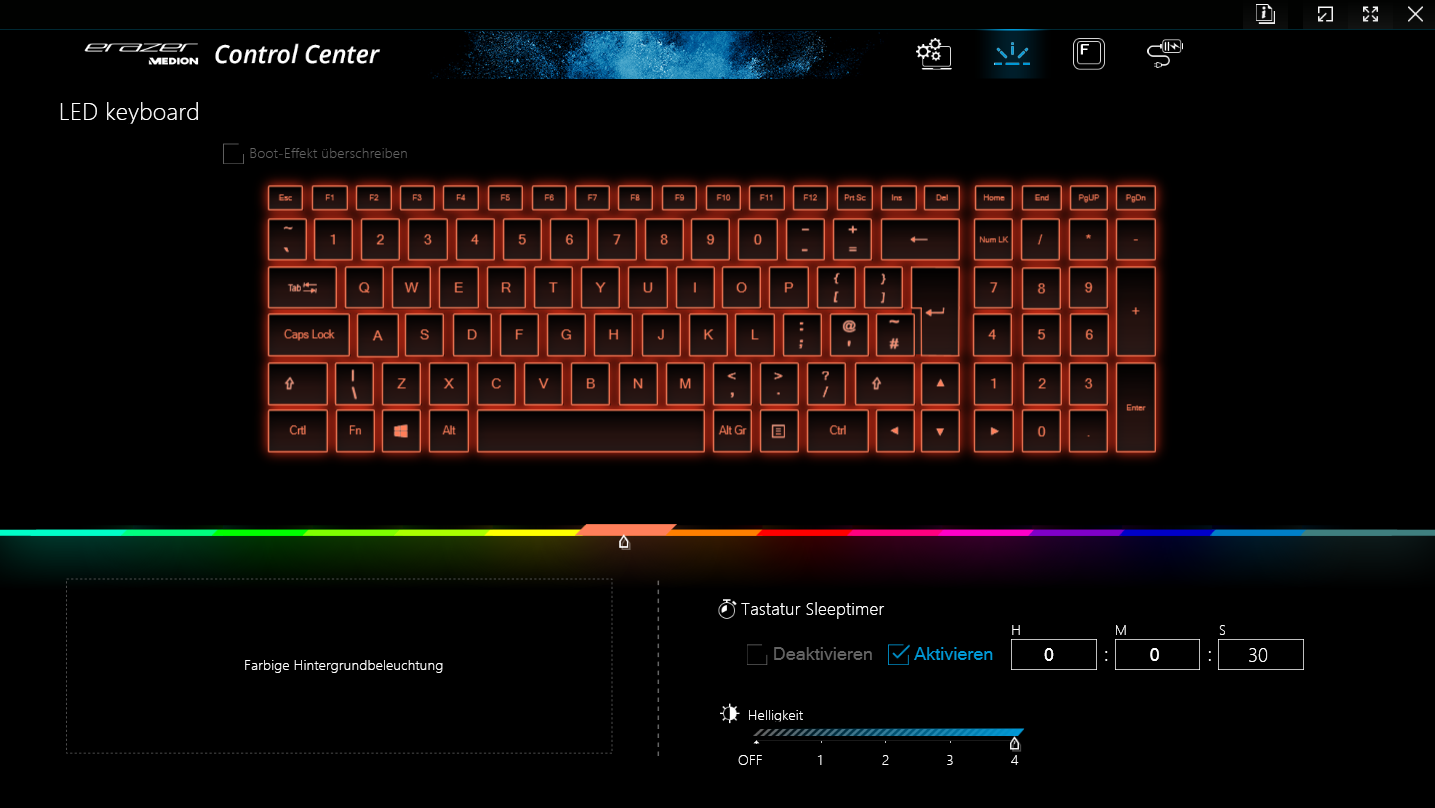
The smooth, flat keys of the chiclet keyboard (which includes a number block) offer a short stroke and clear pressure point. The key resistance is okay. When typing, the keyboard has at most a minimal give, which doesn't turn out to be a hindrance. The keyboard illumination has four levels of brightness. Overall, Medion has delivered a keyboard here that is suitable for everyday tasks.
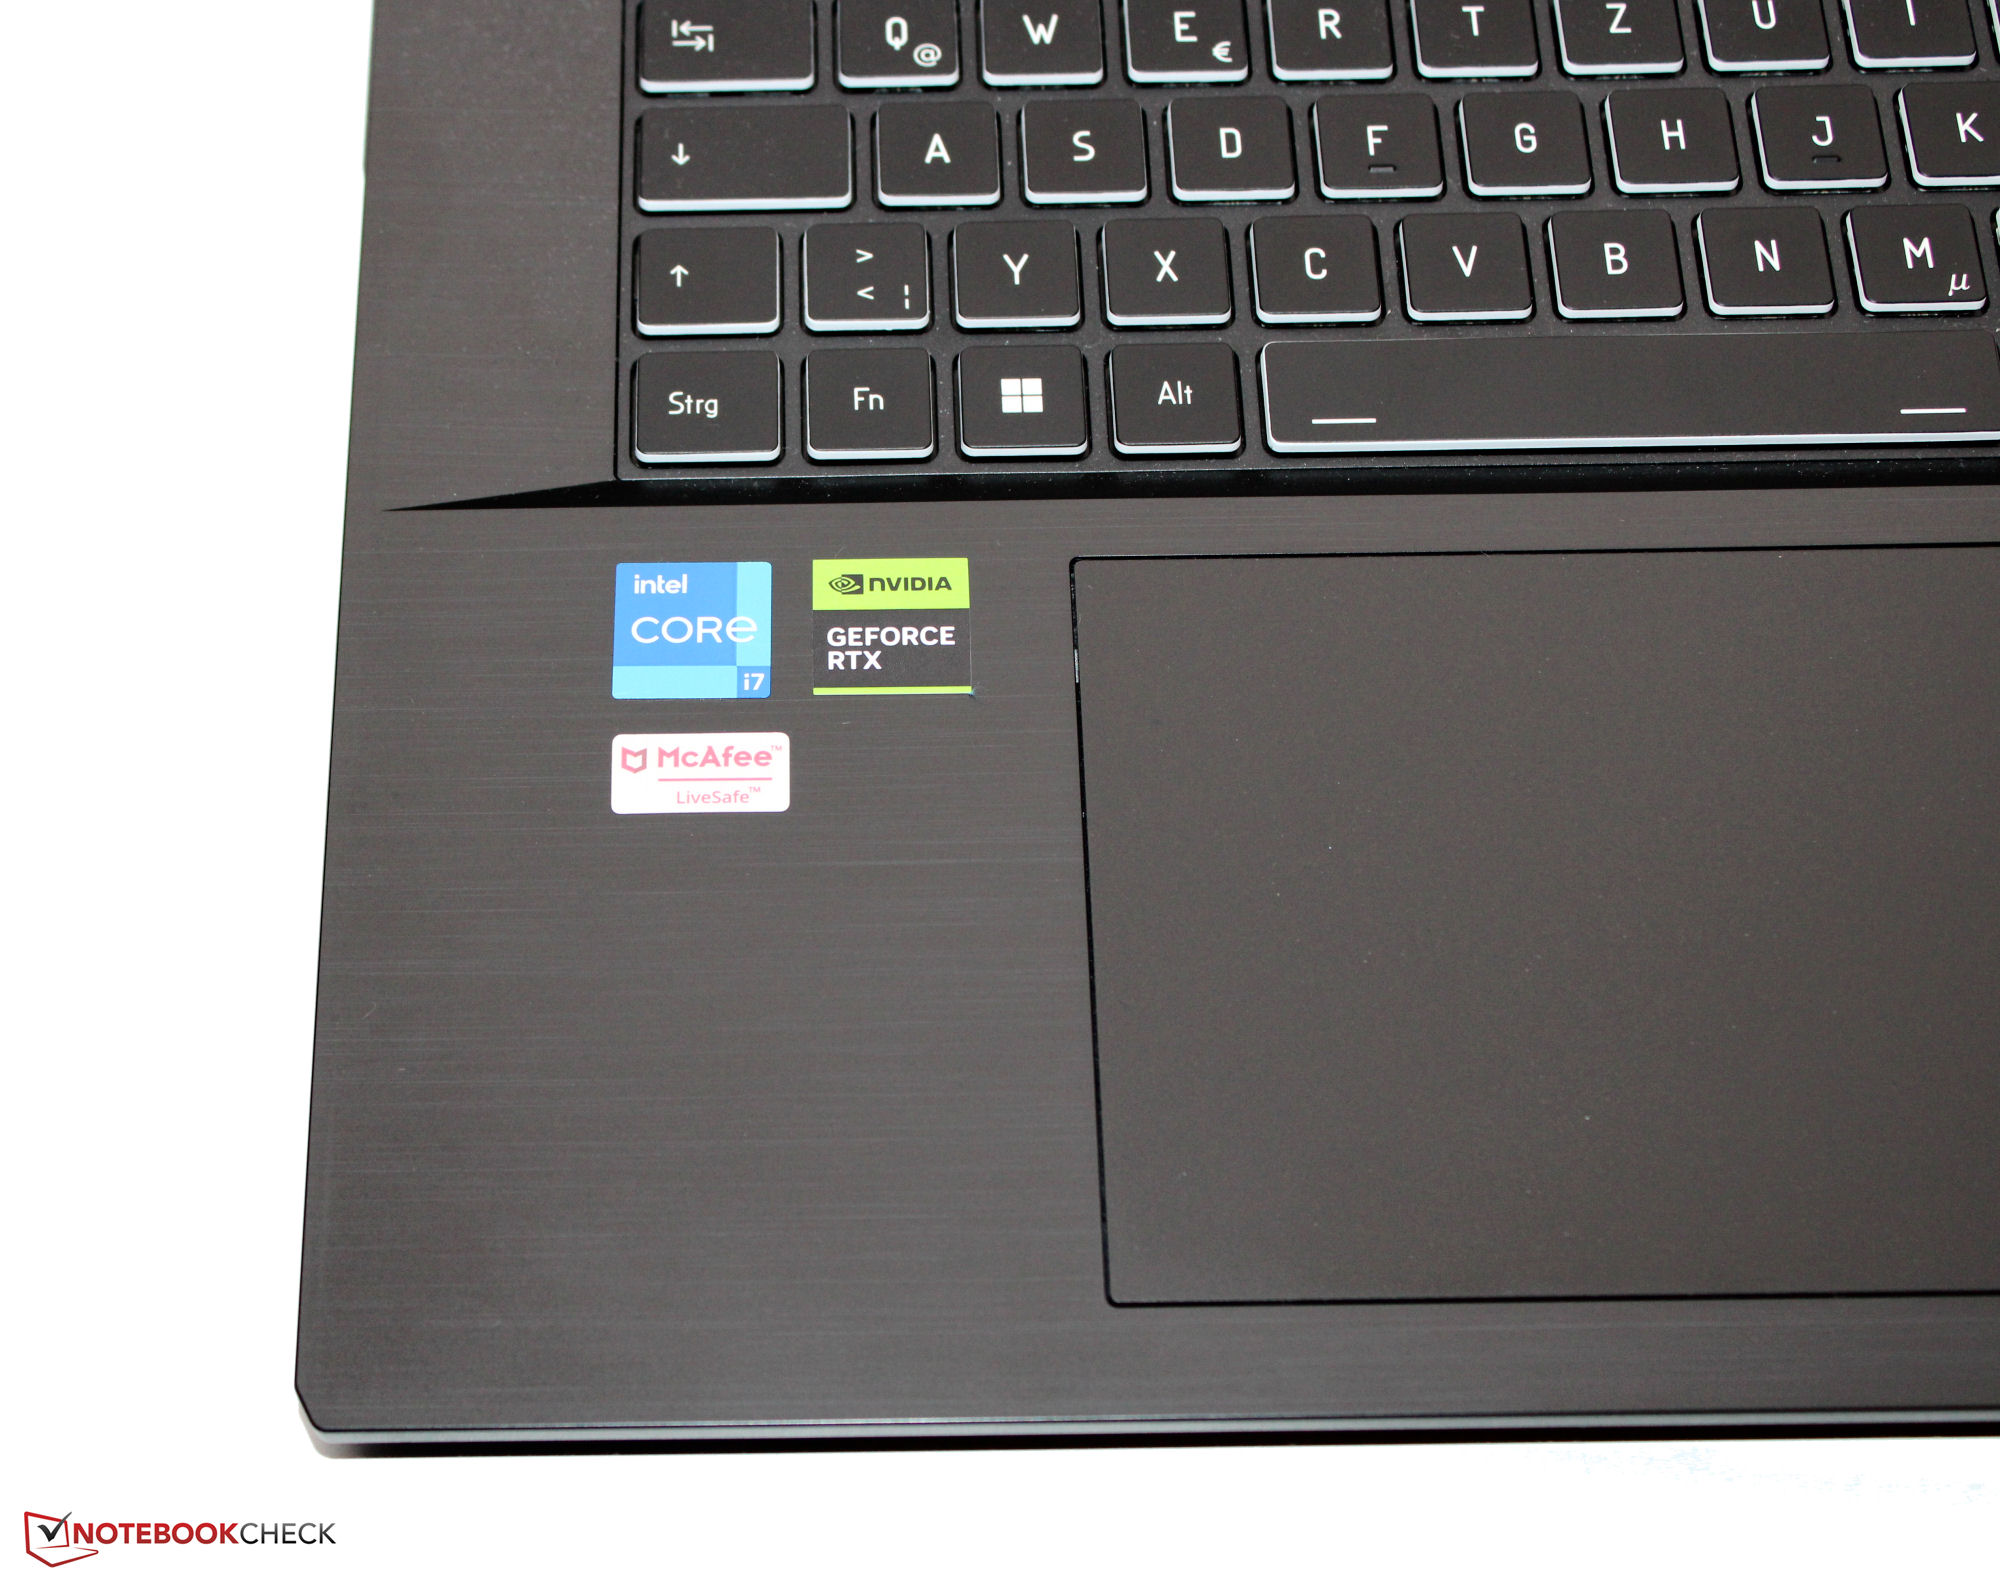
Touchpad
A 15.1 x 9.2 cm (~6 x 3.6 in) ClickPad, whose smooth surface facilitates sliding of the fingers, serves as the mouse replacement. It also responds to inputs in the corners and offers a short stroke and clear pressure point.
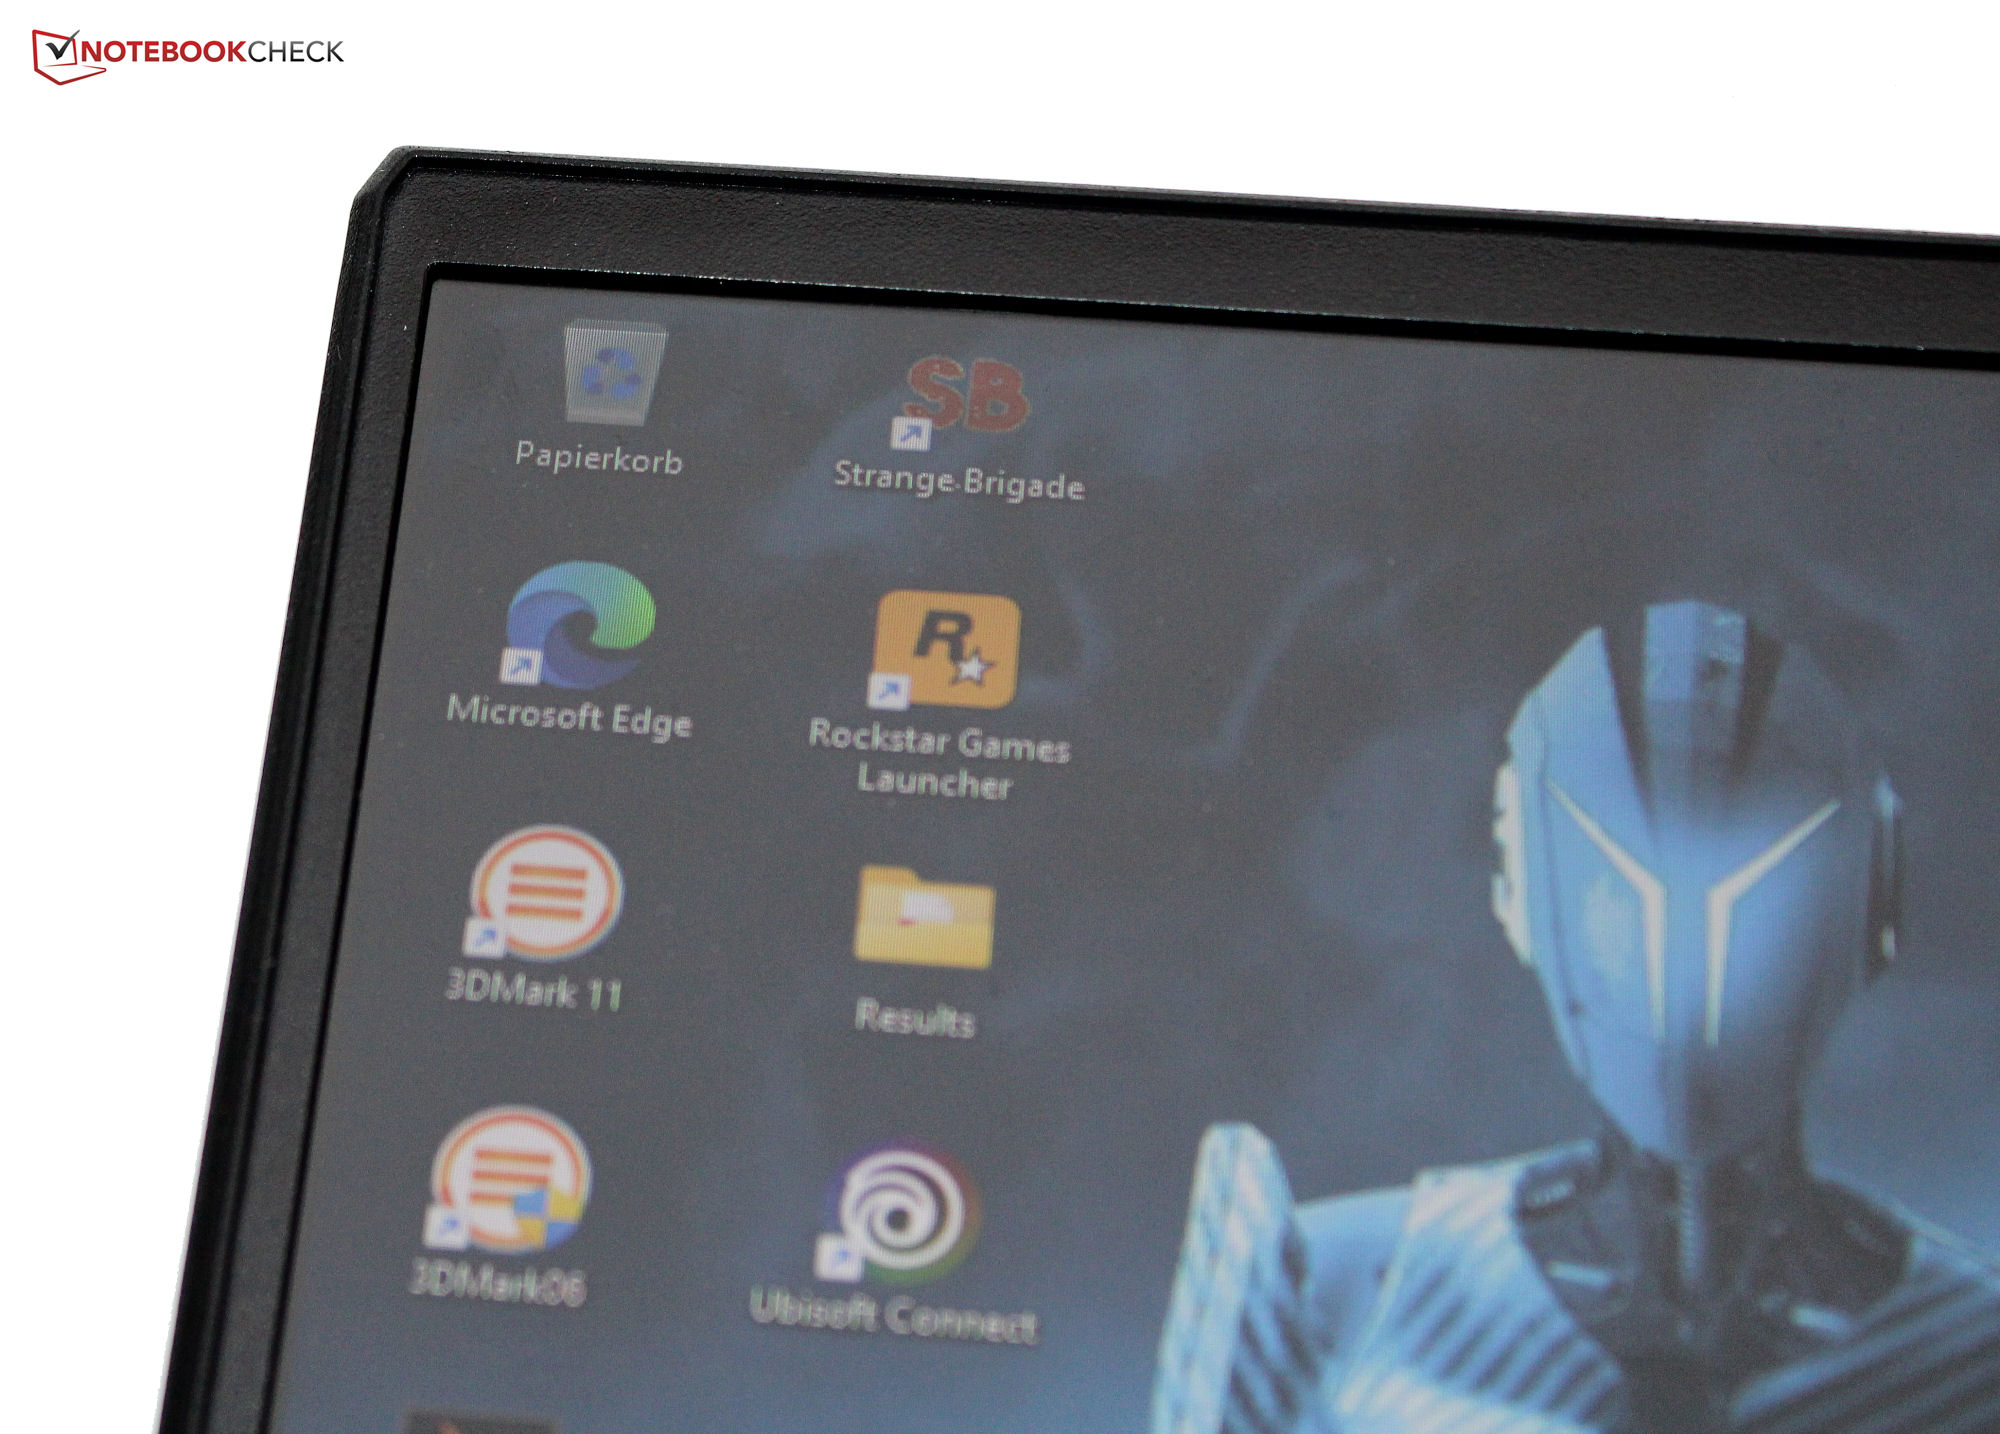
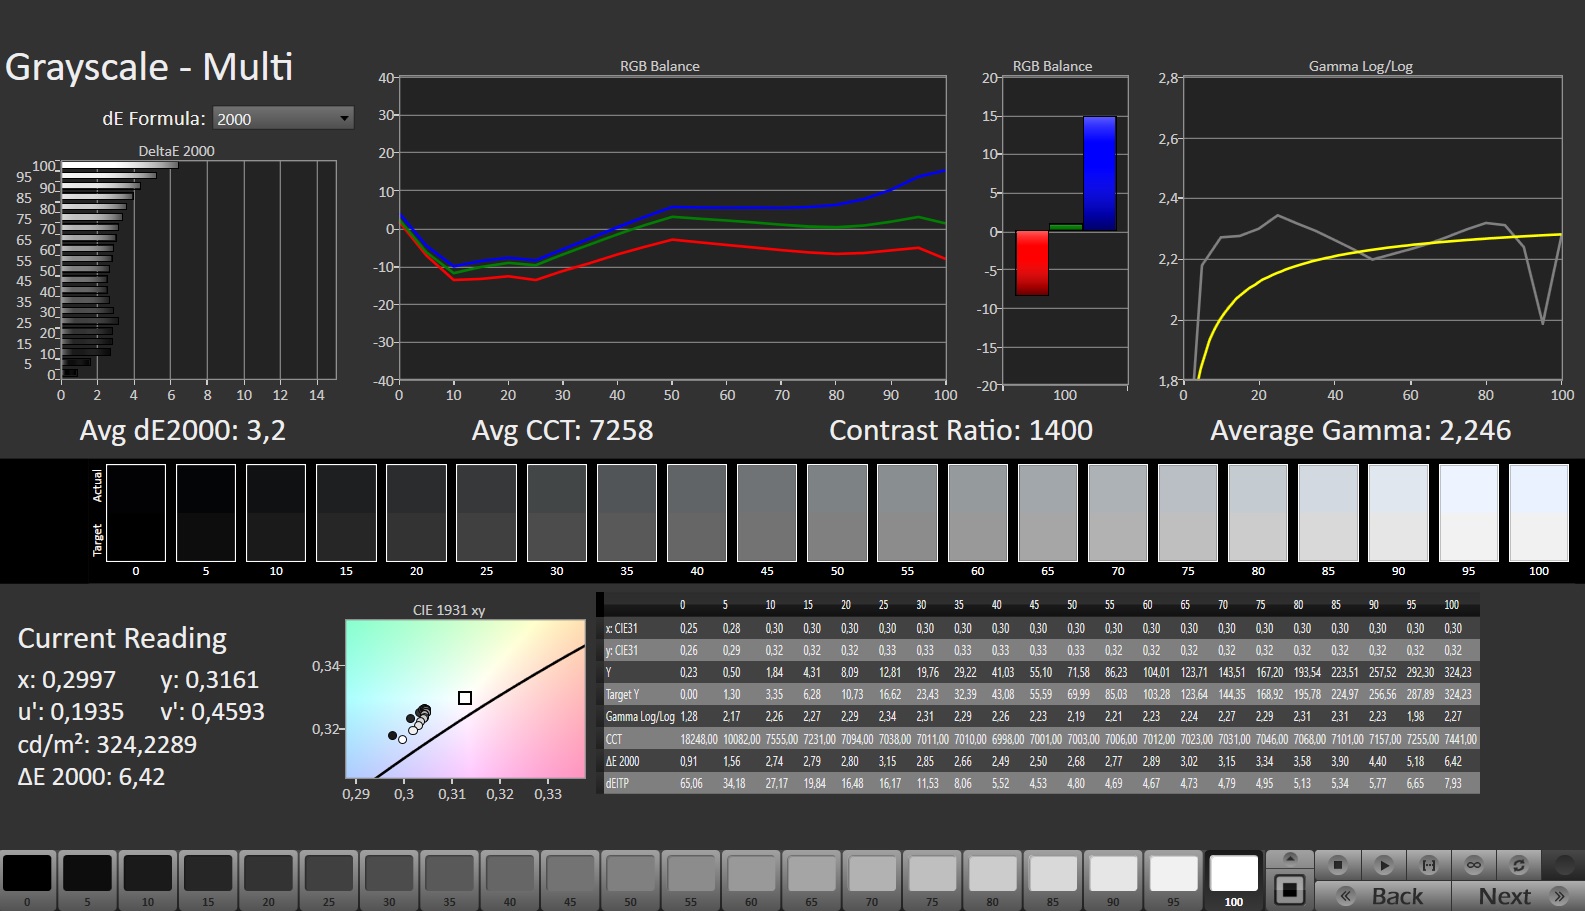
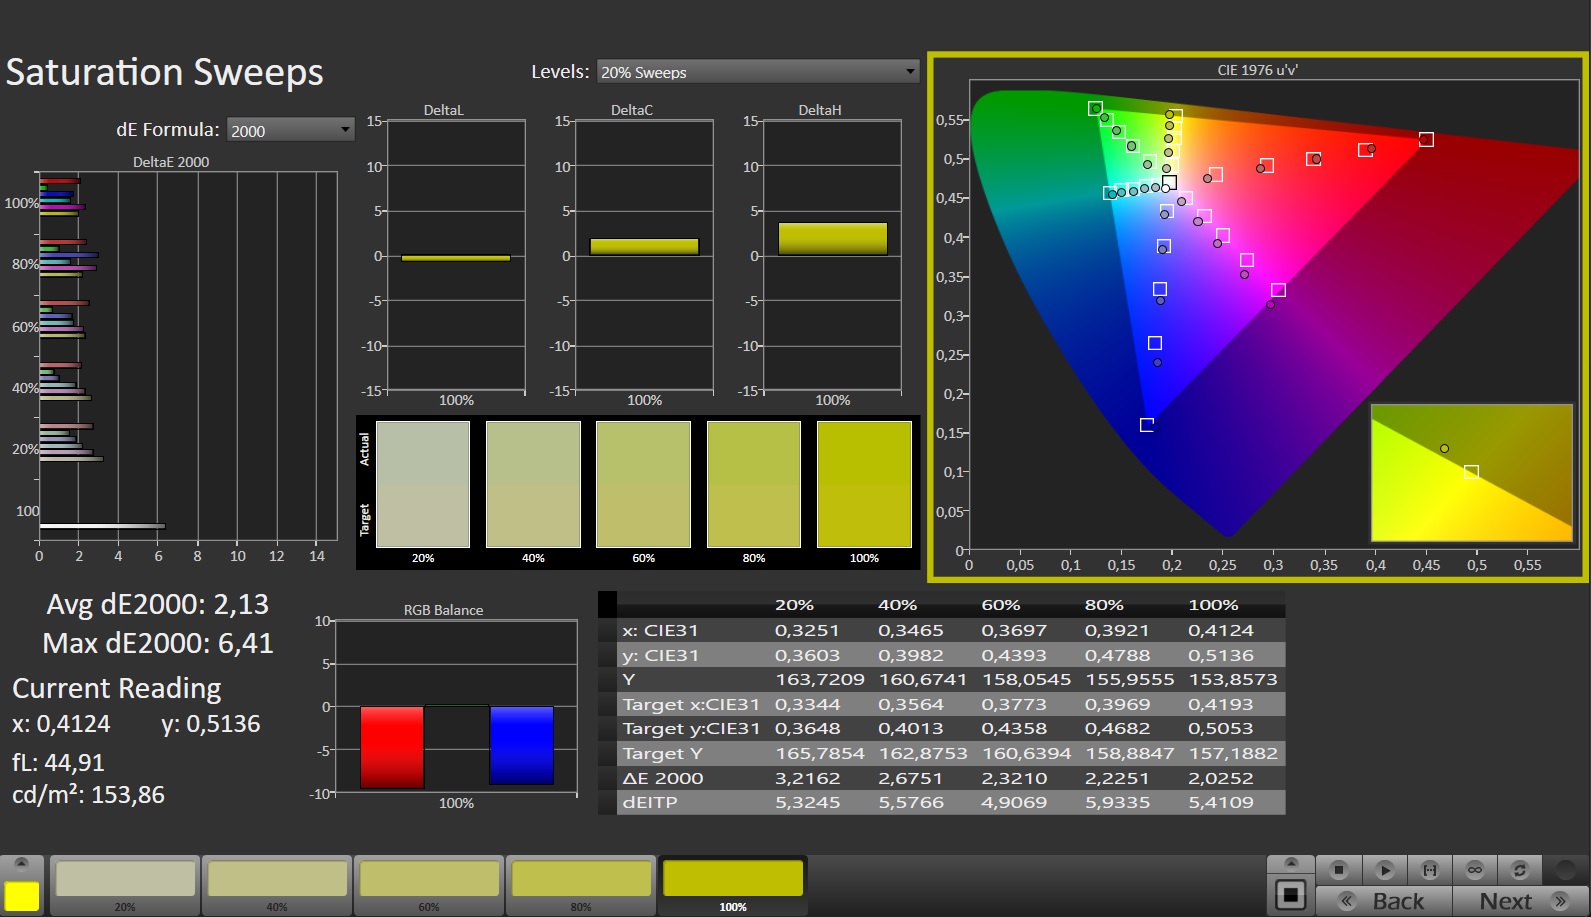
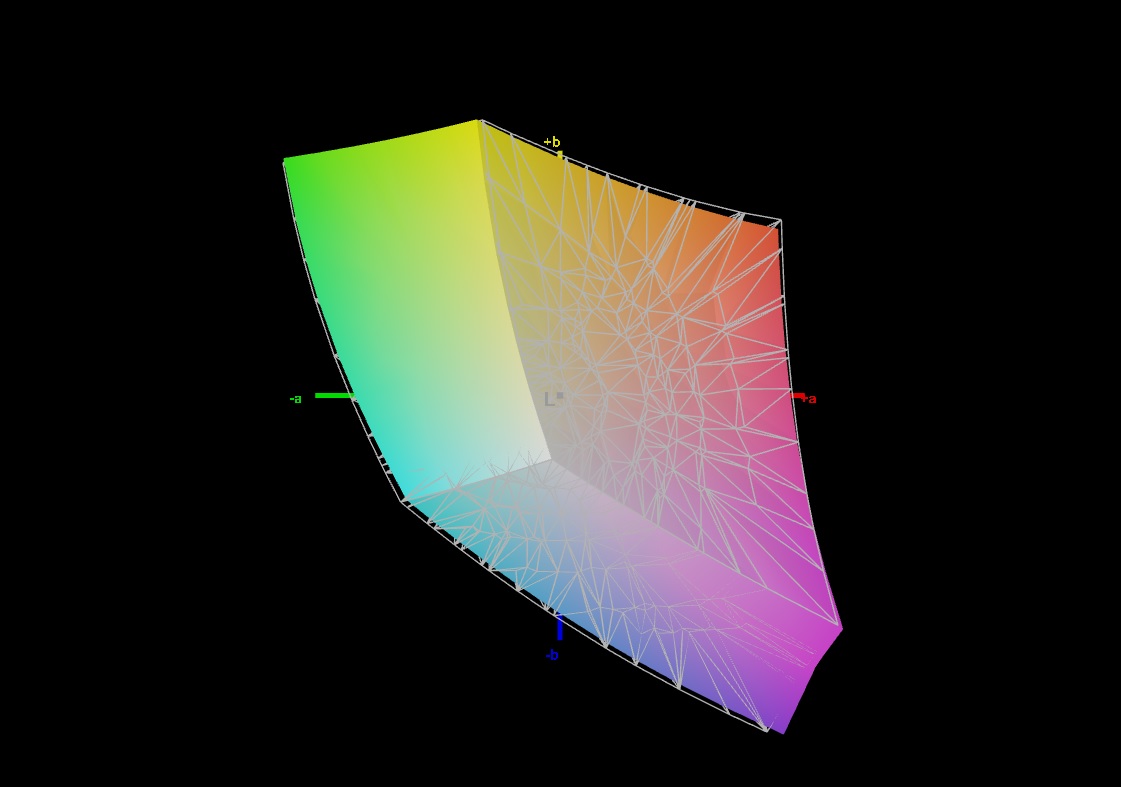
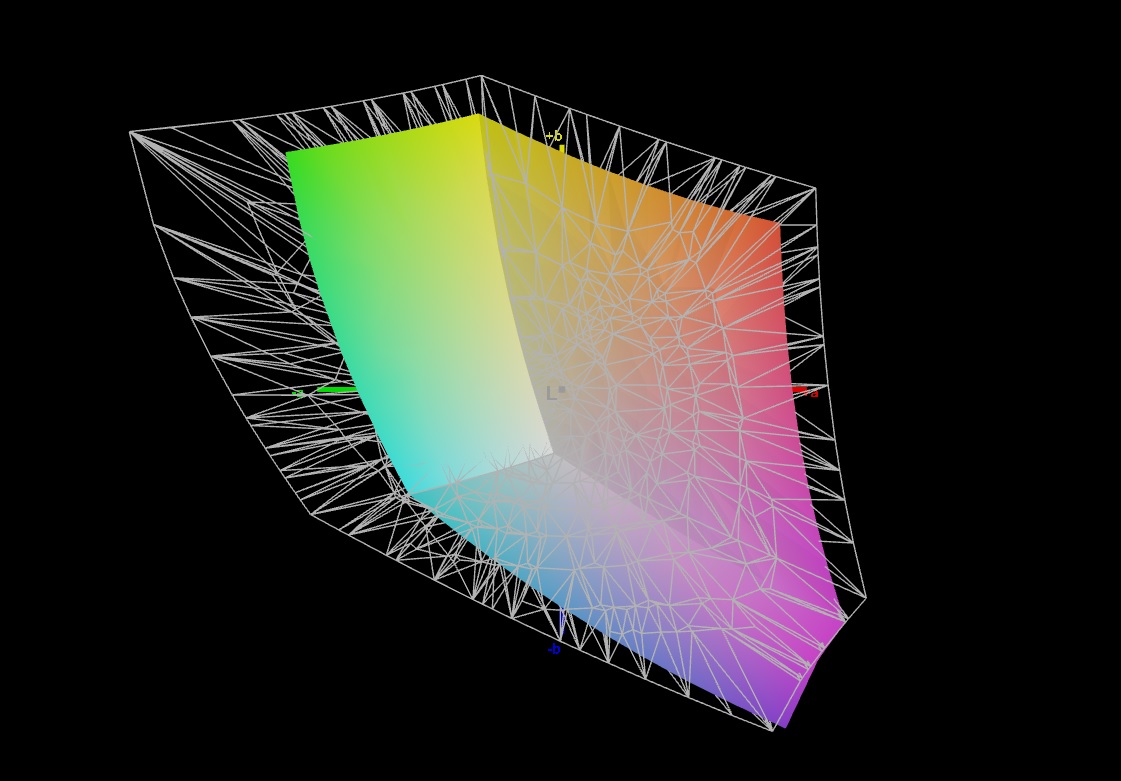
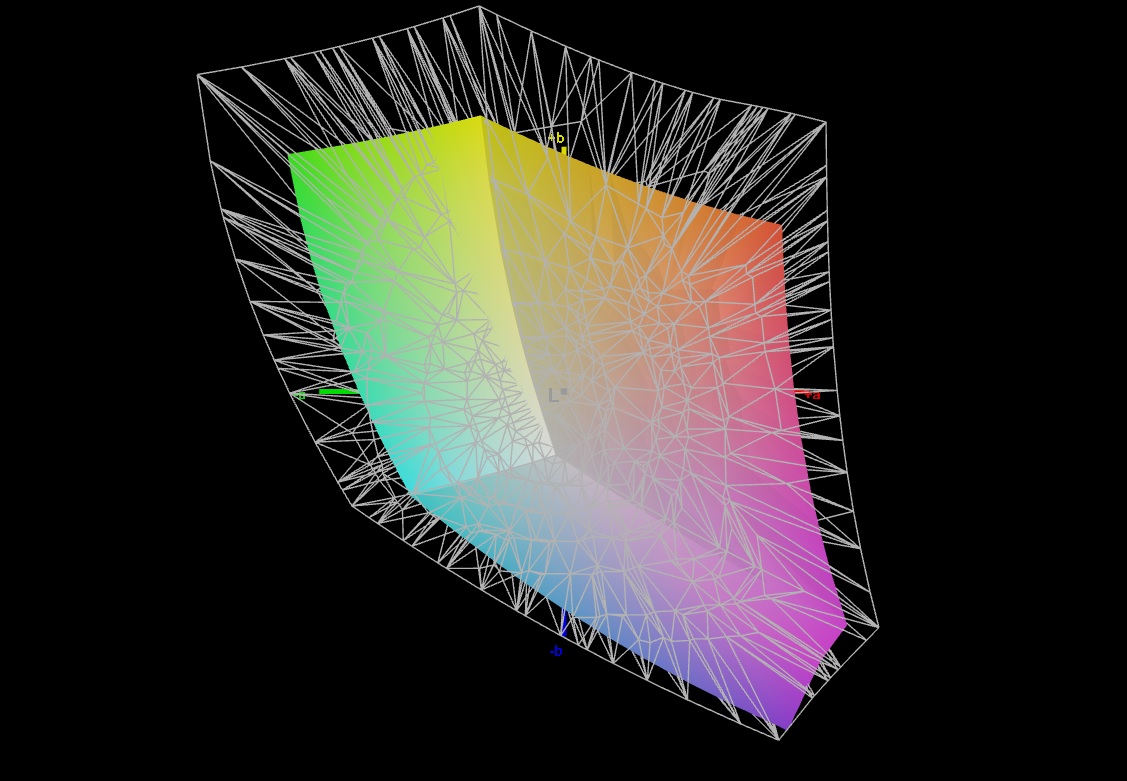
Display - FHD panel with sRGB coverage
Medion has equipped the E20 with a very responsive 144-Hz panel in the 16:9 format that doesn't show any PWM flickering at any brightness level. The brightness and contrast of the matte 17.3-inch display (1,920 x 1,080 pixels) meet their target requirements of >300 cd/m² and 1,000:1 respectively.
| |||||||||||||||||||||||||
Brightness Distribution: 91 %
Center on Battery: 312 cd/m²
Contrast: 1248:1 (Black: 0.25 cd/m²)
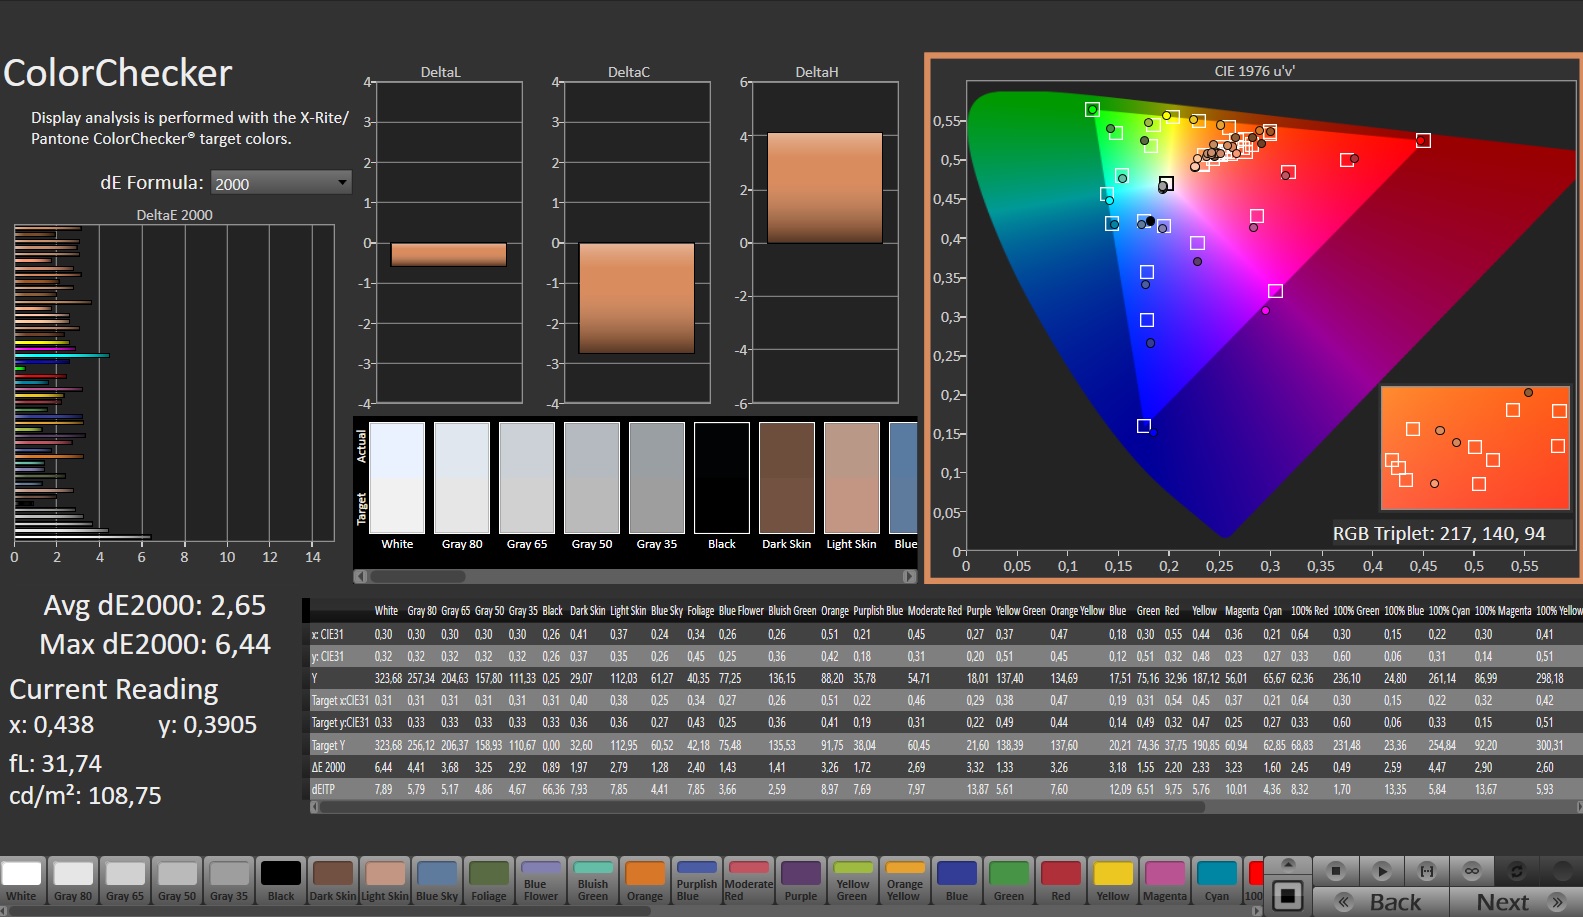
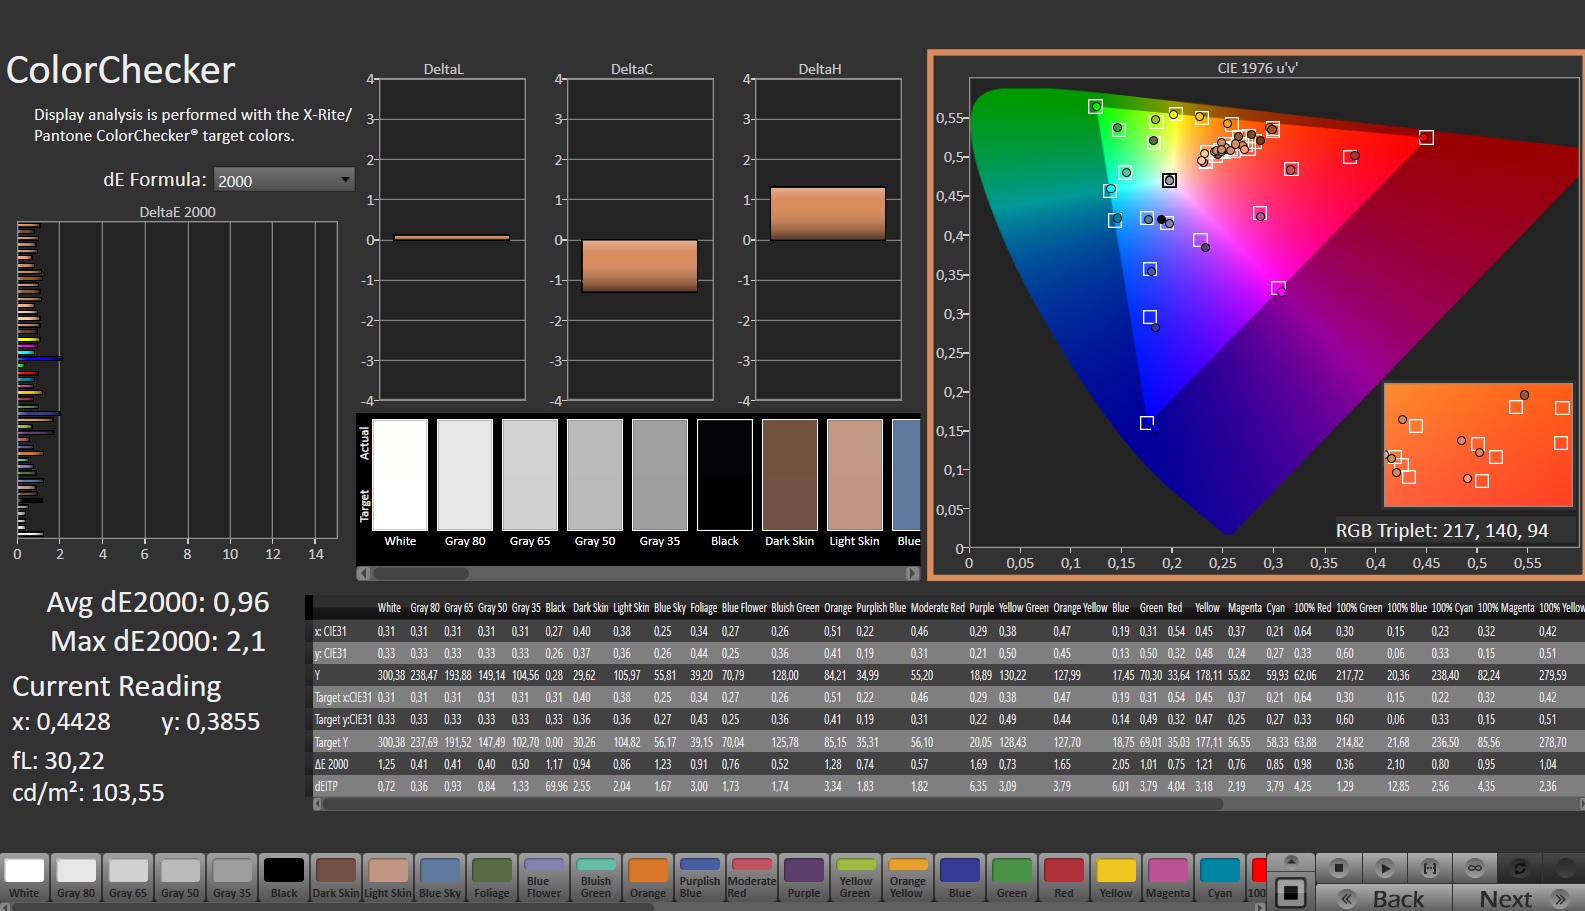
ΔE Color 2.65 | 0.5-29.43 Ø5, calibrated: 0.96
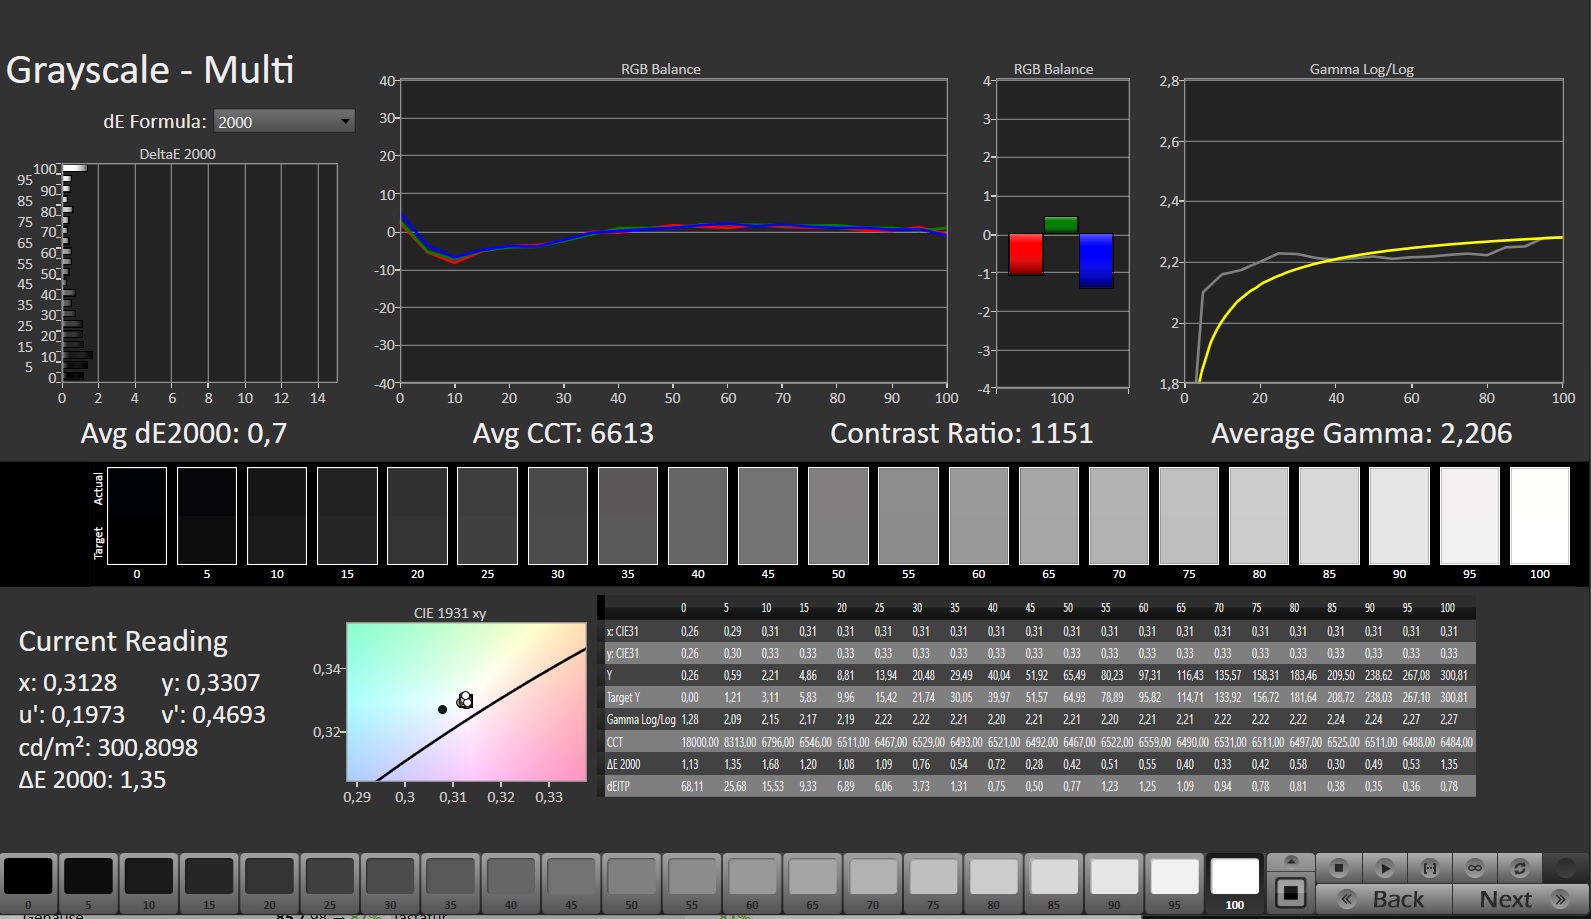
ΔE Greyscale 3.2 | 0.57-98 Ø5.3
66.5% AdobeRGB 1998 (Argyll 2.2.0 3D)
96.7% sRGB (Argyll 2.2.0 3D)
65.1% Display P3 (Argyll 2.2.0 3D)
Gamma: 2.246
| Medion Erazer Scout E20 LG Philips LGD0611, IPS, 1920x1080, 17.30 | Gigabyte G7 KE AU Optronics B173HAN05.1, IPS, 1920x1080, 17.30 | MSI Katana 17 B13VFK B173HAN04.9, IPS LED, 1920x1080, 17.30 | Asus TUF Gaming A16 FA617 NE160WUM-NX2 (BOE0B33), IPS-Level, 1920x1200, 16.00 | Lenovo Legion 5 15IAH7H 82RB CSOT MNF601CA1-3, IPS, 1920x1080, 15.60 | Acer Nitro 5 AN515-46-R1A1 AU Optronics B156HAN12.H, IPS, 1920x1080, 15.60 | |
|---|---|---|---|---|---|---|
| Display | 6% | -37% | 5% | 5% | 4% | |
| Display P3 Coverage | 65.1 | 70.4 8% | 40.8 -37% | 69.4 7% | 69.1 6% | 68.8 6% |
| sRGB Coverage | 96.7 | 99.8 3% | 61 -37% | 97.8 1% | 99.5 3% | 98.1 1% |
| AdobeRGB 1998 Coverage | 66.5 | 71.7 8% | 42.2 -37% | 70.9 7% | 70 5% | 69.7 5% |
| Response Times | 43% | -137% | -6% | -8% | 18% | |
| Response Time Grey 50% / Grey 80% * | 14.8 ? | 5 ? 66% | 33 ? -123% | 17 ? -15% | 14.8 ? -0% | 13 ? 12% |
| Response Time Black / White * | 10.4 ? | 8.3 ? 20% | 26 ? -150% | 10.1 ? 3% | 12 ? -15% | 8 ? 23% |
| PWM Frequency | ||||||
| Screen | 16% | -69% | 15% | -21% | -8% | |
| Brightness middle | 312 | 307 -2% | 267 -14% | 308 -1% | 363.5 17% | 327 5% |
| Brightness | 303 | 301 -1% | 256 -16% | 293 -3% | 350 16% | 320 6% |
| Brightness Distribution | 91 | 93 2% | 93 2% | 90 -1% | 89 -2% | 93 2% |
| Black Level * | 0.25 | 0.2 20% | 0.21 16% | 0.23 8% | 0.39 -56% | 0.24 4% |
| Contrast | 1248 | 1535 23% | 1271 2% | 1339 7% | 932 -25% | 1363 9% |
| Colorchecker dE 2000 * | 2.65 | 1.32 50% | 4.7 -77% | 1.47 45% | 3.68 -39% | 3.26 -23% |
| Colorchecker dE 2000 max. * | 6.44 | 4.6 29% | 20.4 -217% | 2.98 54% | 8.92 -39% | 8.73 -36% |
| Colorchecker dE 2000 calibrated * | 0.96 | 1.03 -7% | 4.5 -369% | 1.02 -6% | 0.53 45% | 0.87 9% |
| Greyscale dE 2000 * | 3.2 | 2.1 34% | 1.5 53% | 2.2 31% | 6.5 -103% | 4.87 -52% |
| Gamma | 2.246 98% | 2.247 98% | 2.12 104% | 2.228 99% | 2.2 100% | 2.3 96% |
| CCT | 7258 90% | 6815 95% | 6552 99% | 6228 104% | 5995 108% | 7070 92% |
| Total Average (Program / Settings) | 22% /
18% | -81% /
-72% | 5% /
10% | -8% /
-13% | 5% /
-2% |
* ... smaller is better
The display shows a good color reproduction already in the state of delivery, and with a deviation of about 2.65, the target of DeltaE < 3 is met. An additional calibration lowers the deviation further to 0.96 and also ensures a more balanced grayscale.
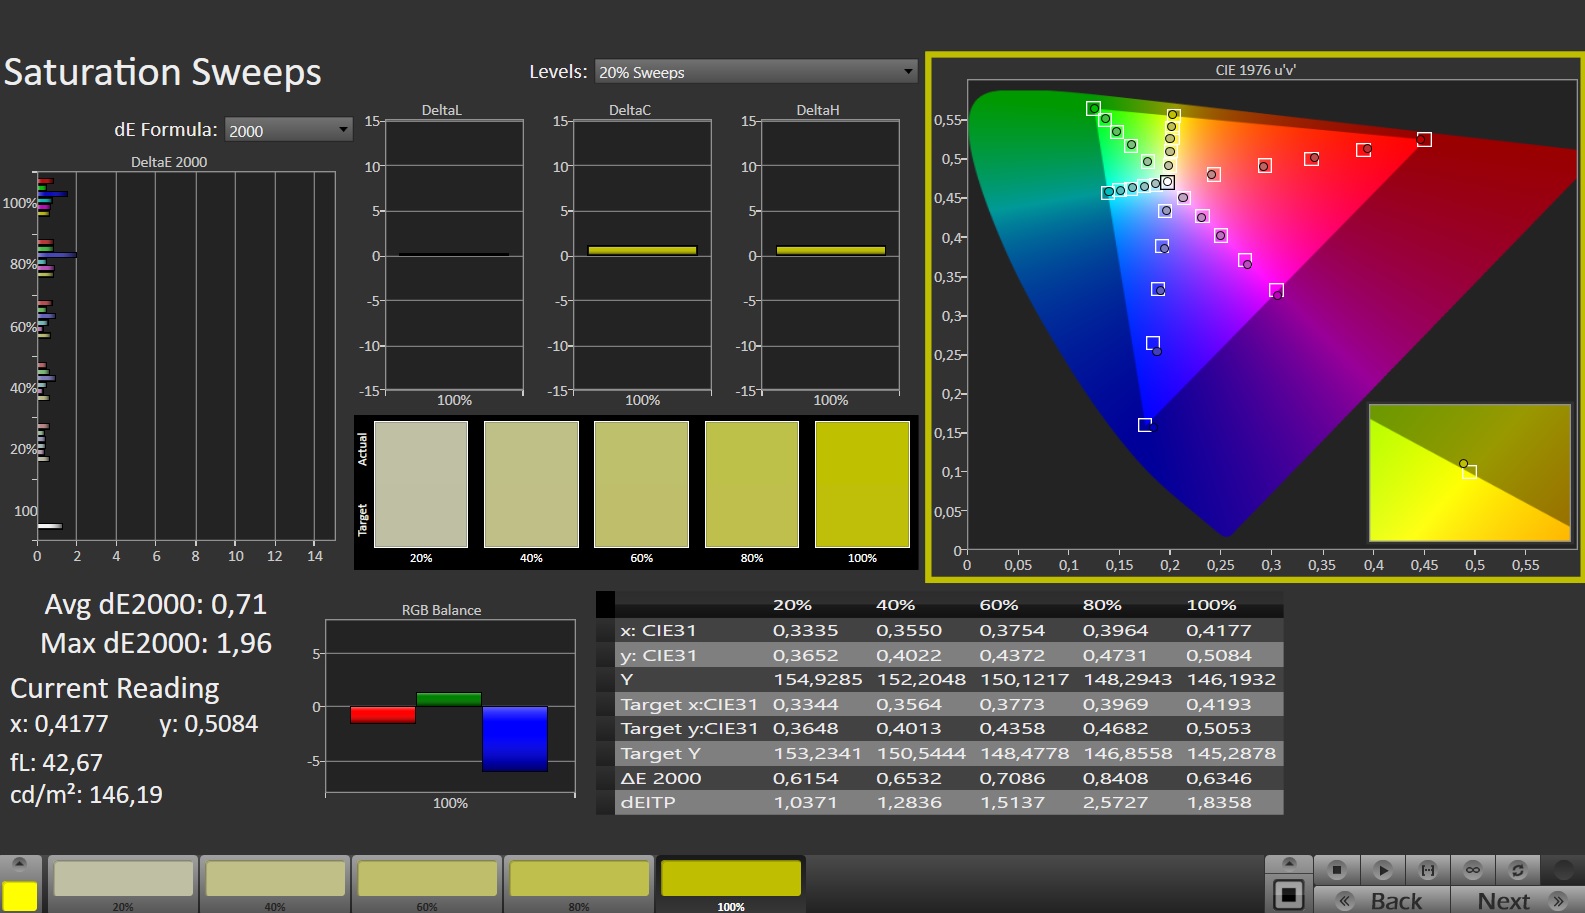
The panel is able to cover the sRGB color space completely but not the AdobeRGB and DCI-P3 color spaces. The displays of most competitors show similar qualities.
Display Response Times
| ↔ Response Time Black to White | ||
|---|---|---|
| 10.4 ms ... rise ↗ and fall ↘ combined | ↗ 5.4 ms rise | 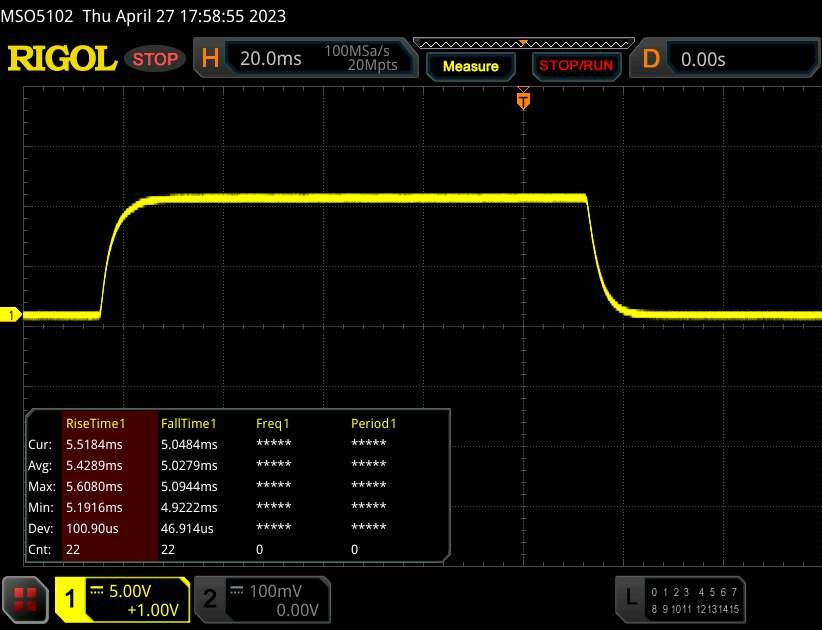 |
| ↘ 5 ms fall | ||
| The screen shows good response rates in our tests, but may be too slow for competitive gamers. In comparison, all tested devices range from 0.1 (minimum) to 240 (maximum) ms. » 23 % of all devices are better. This means that the measured response time is better than the average of all tested devices (21.5 ms). | ||
| ↔ Response Time 50% Grey to 80% Grey | ||
| 14.8 ms ... rise ↗ and fall ↘ combined | ↗ 7.2 ms rise | 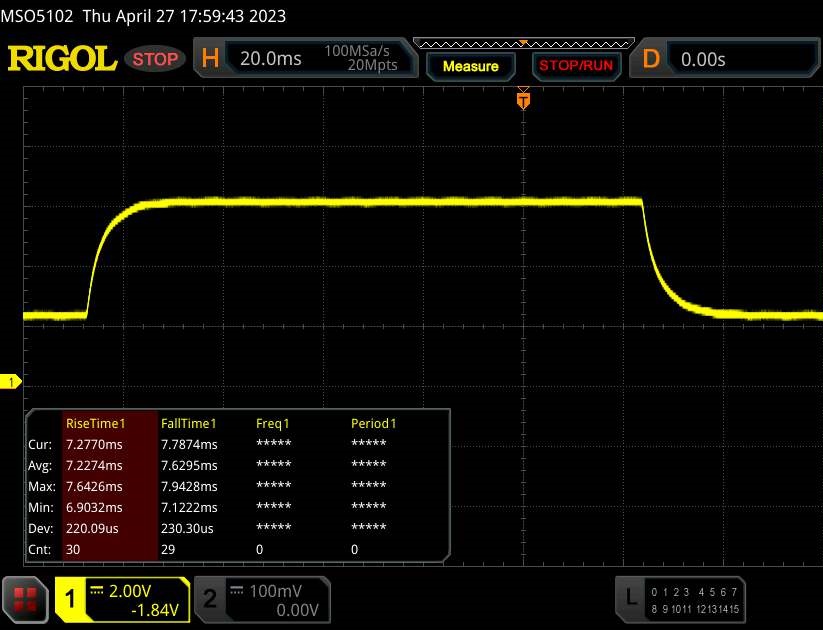 |
| ↘ 7.6 ms fall | ||
| The screen shows good response rates in our tests, but may be too slow for competitive gamers. In comparison, all tested devices range from 0.2 (minimum) to 636 (maximum) ms. » 23 % of all devices are better. This means that the measured response time is better than the average of all tested devices (33.7 ms). | ||
Screen Flickering / PWM (Pulse-Width Modulation)
| Screen flickering / PWM not detected | 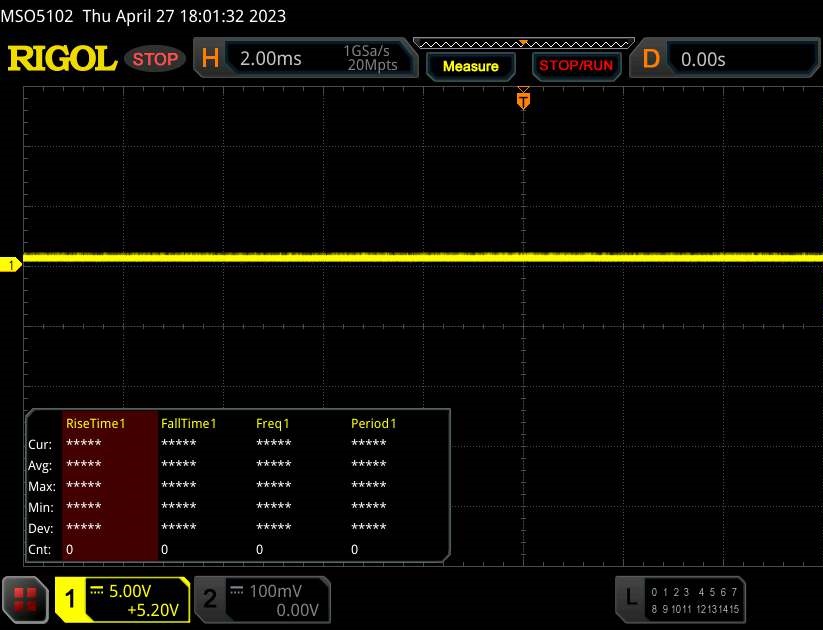 | ||
In comparison: 53 % of all tested devices do not use PWM to dim the display. If PWM was detected, an average of 17853 (minimum: 5 - maximum: 3846000) Hz was measured. | |||
The IPS panel has stable viewing angles and can be read from any position. Outdoors, you can read the display contents when the sunlight isn't too bright.

Performance - The Scout uses Raptor Lake and Ada Lovelace
The Erazer Scout E20 represents a gaming laptop from the entry-level segment. The necessary computing performance is provided by Raptor Lake and Ada Lovelace chips. Our test unit is available for about 1,500 Euros (~$1,658). At the time of this test, we were unable to find any other equipment configurations.
Test Conditions
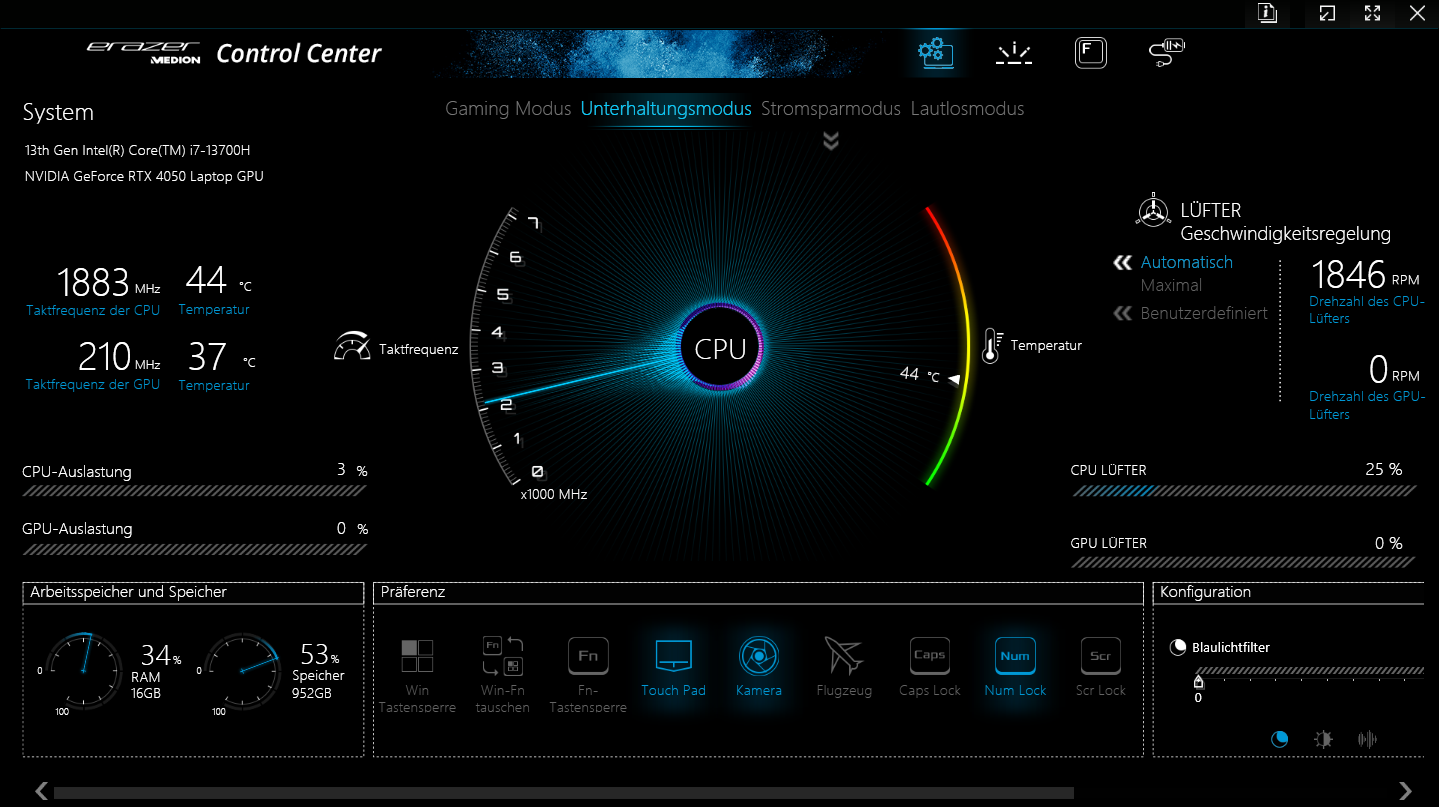
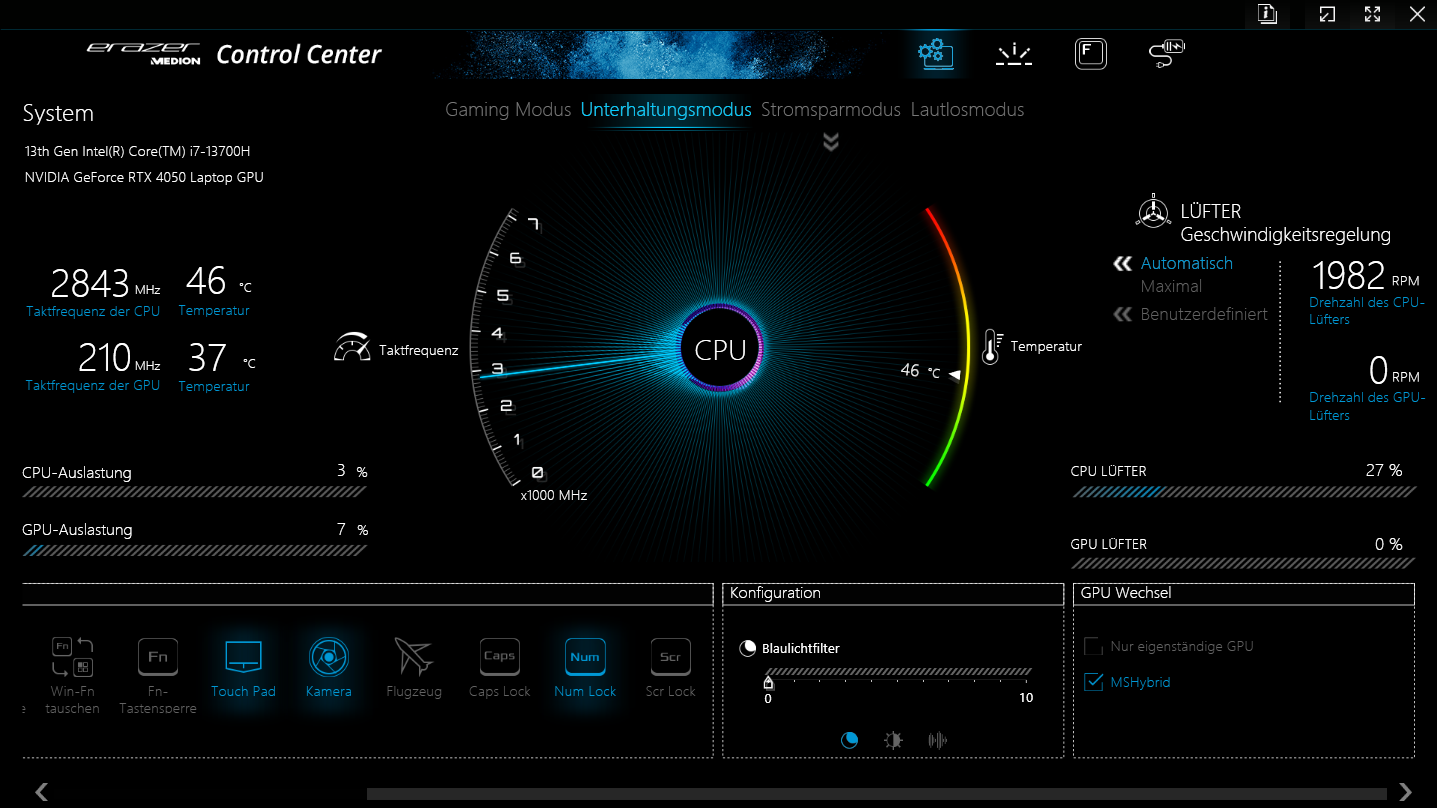
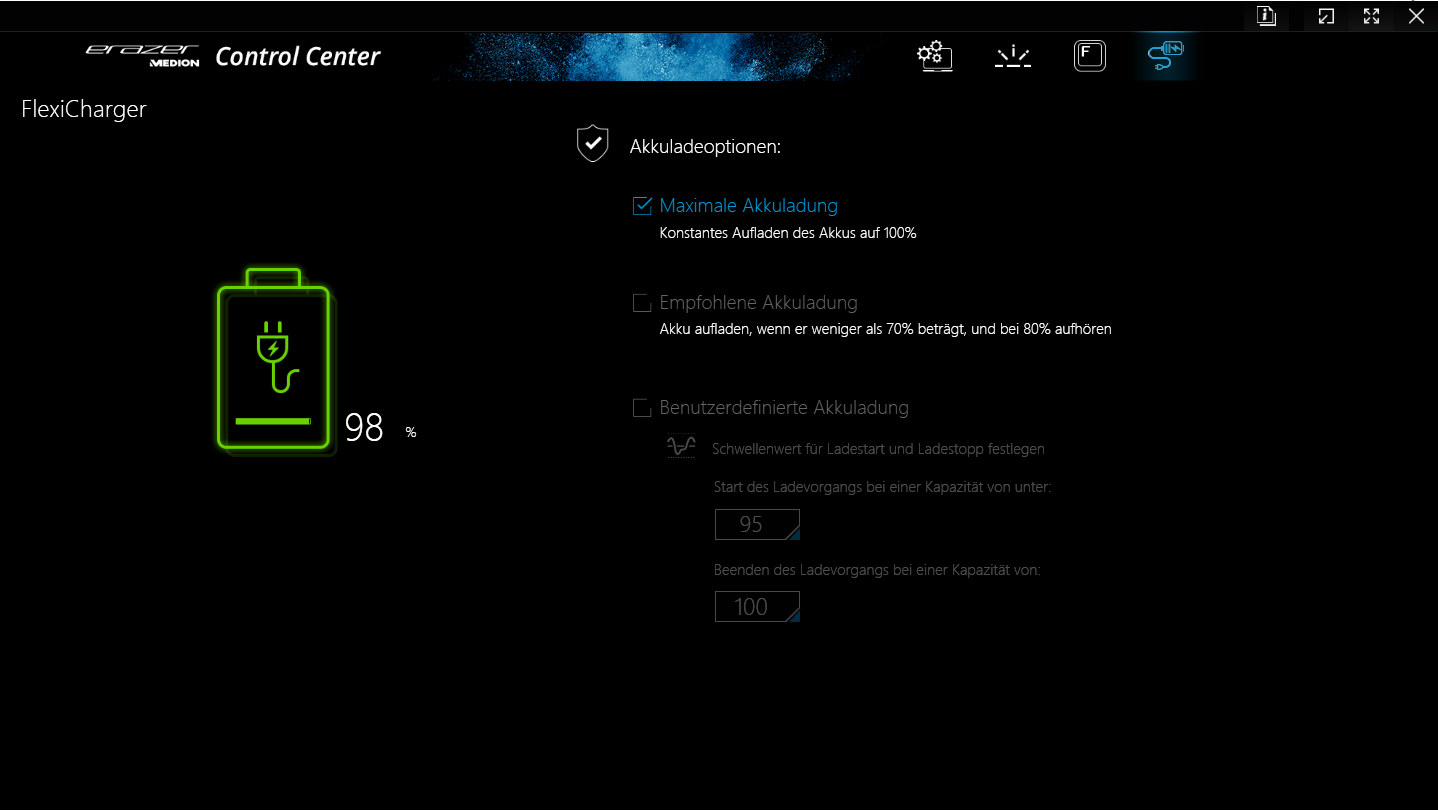
The E20 includes four manufacturer specific performance modes (see table). You can switch between them using the Control Center software, which is the control center of the laptop. We used the "Entertainment mode" for the benchmarks and the "Power saving mode" for the battery tests, with Optimus being active. The Power Saving mode also represents a special case among the modes, since it deactivates the GeForce graphics core.
| Gaming Mode | Entertainment Mode | Power Saving Mode | Silent Mode | |
|---|---|---|---|---|
| Power Limit 1 (HWInfo) | 110 Watts | 50 Watts | 20 Watts | 15 Watts |
| Power Limit 2 (HWInfo) | 115 Watts | 115 Watts | 30 Watts | 30 Watts |
| Noise (The Witcher 3) | 57 dB(A) | 50 dB(A) | - | 34 dB(A) |
| Performance (The Witcher 3) | ~83 fps | ~80 fps | - | 30-50 fps |
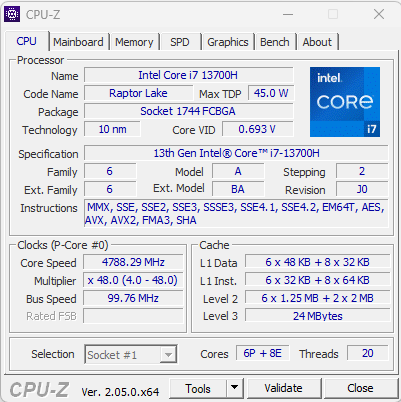
Processor
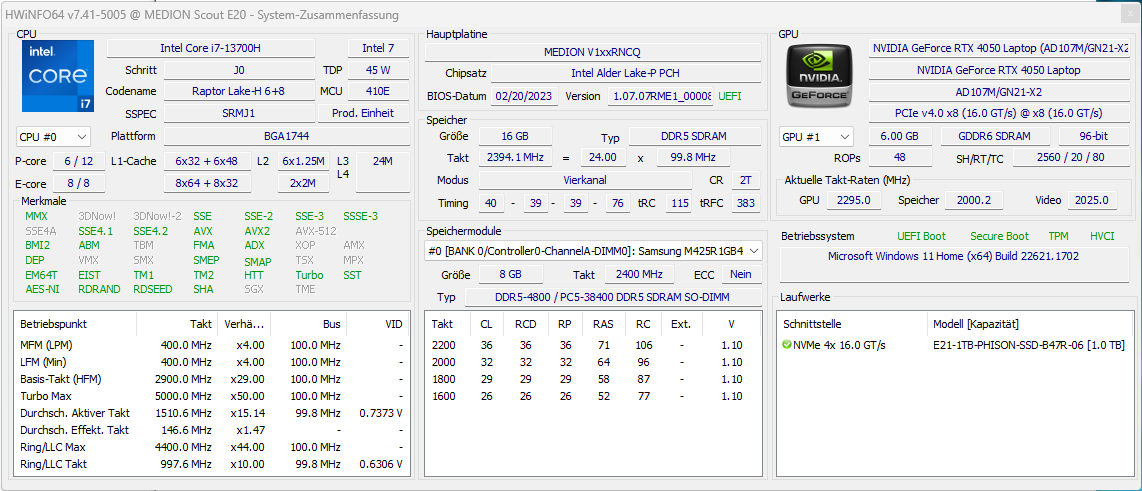
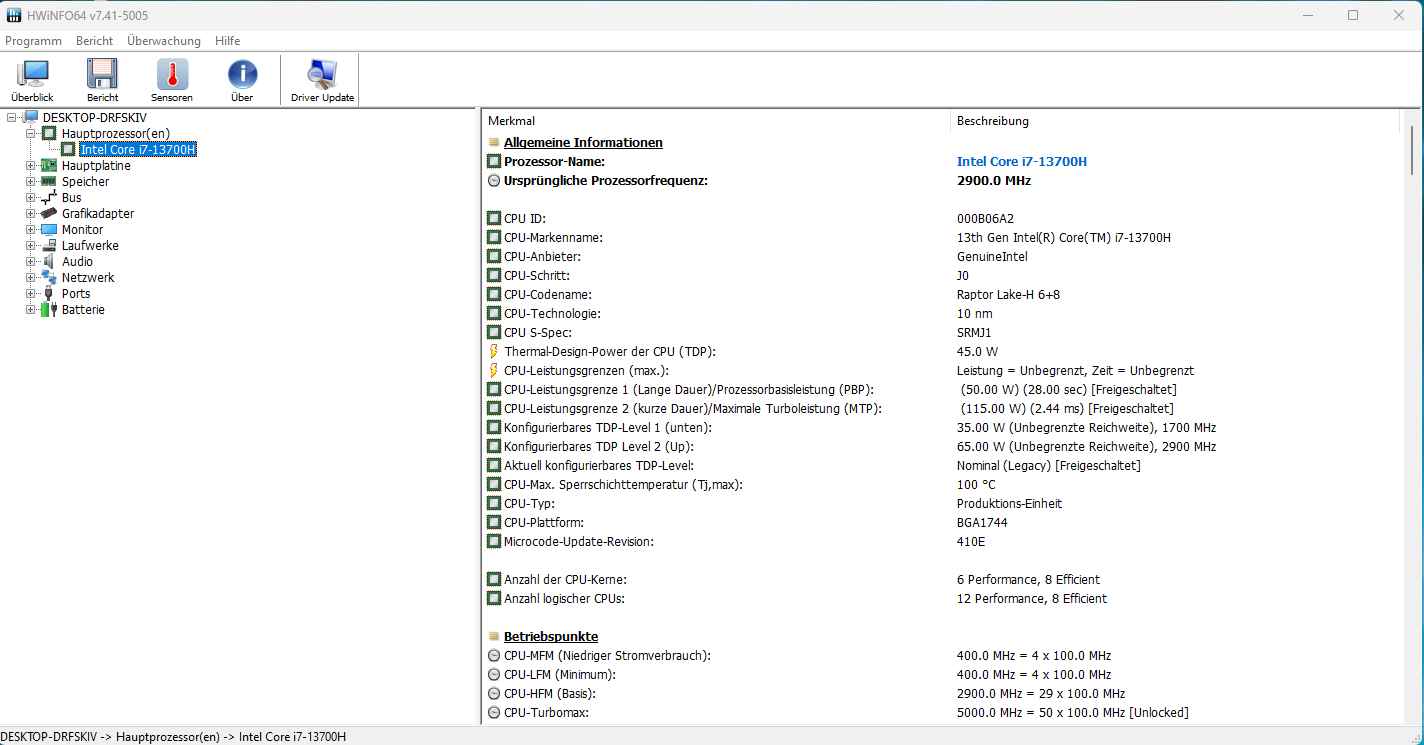
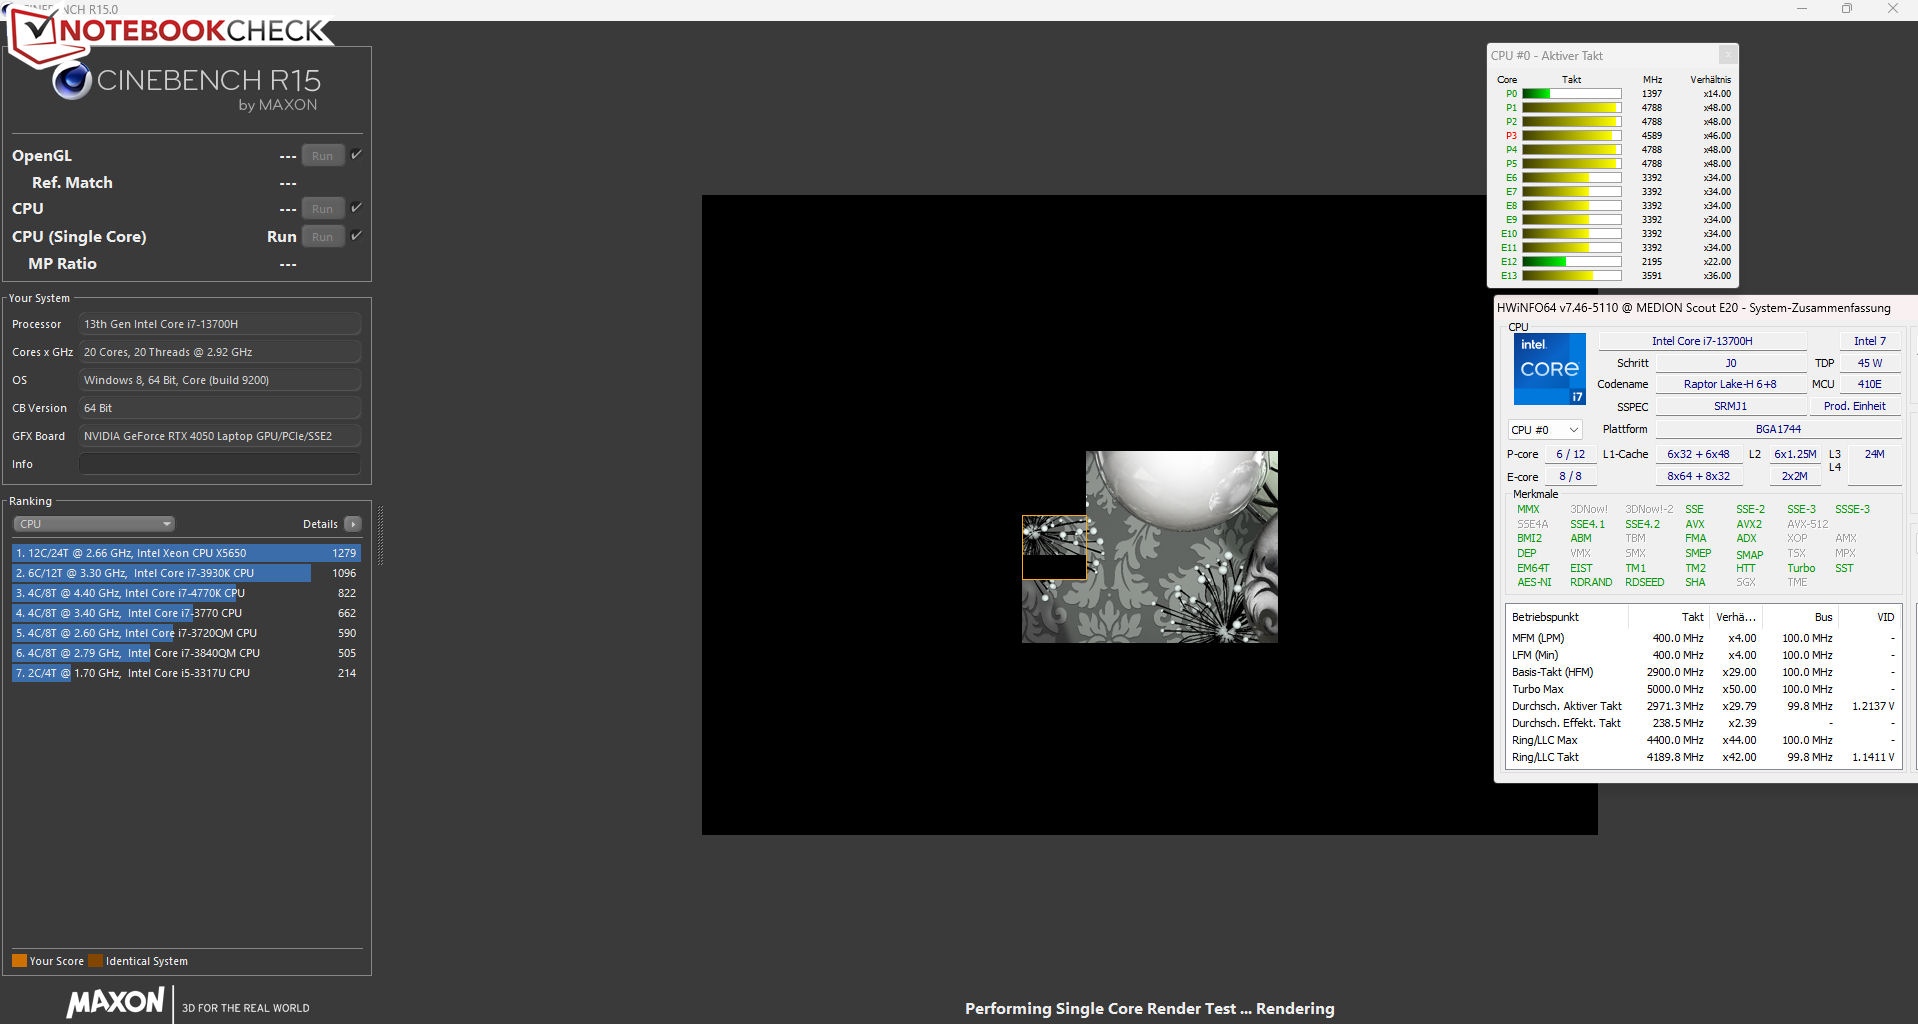
The Raptor Lake Core i7-13700H processor consists of eight Efficiency cores (no hyperthreading, 1.8 to 3.7 GHz) and six Performance cores (hyperthreading, 2.4 to 5 GHz), resulting in a total of 20 logical CPU cores.
The benchmarks deliver results above (Gaming mode, Entertainment mode) and below (other modes) the current average of the CPU until now. The more relevant single thread performance (170 points) is reduced less in battery operation than the multithread performance (1,335 points).
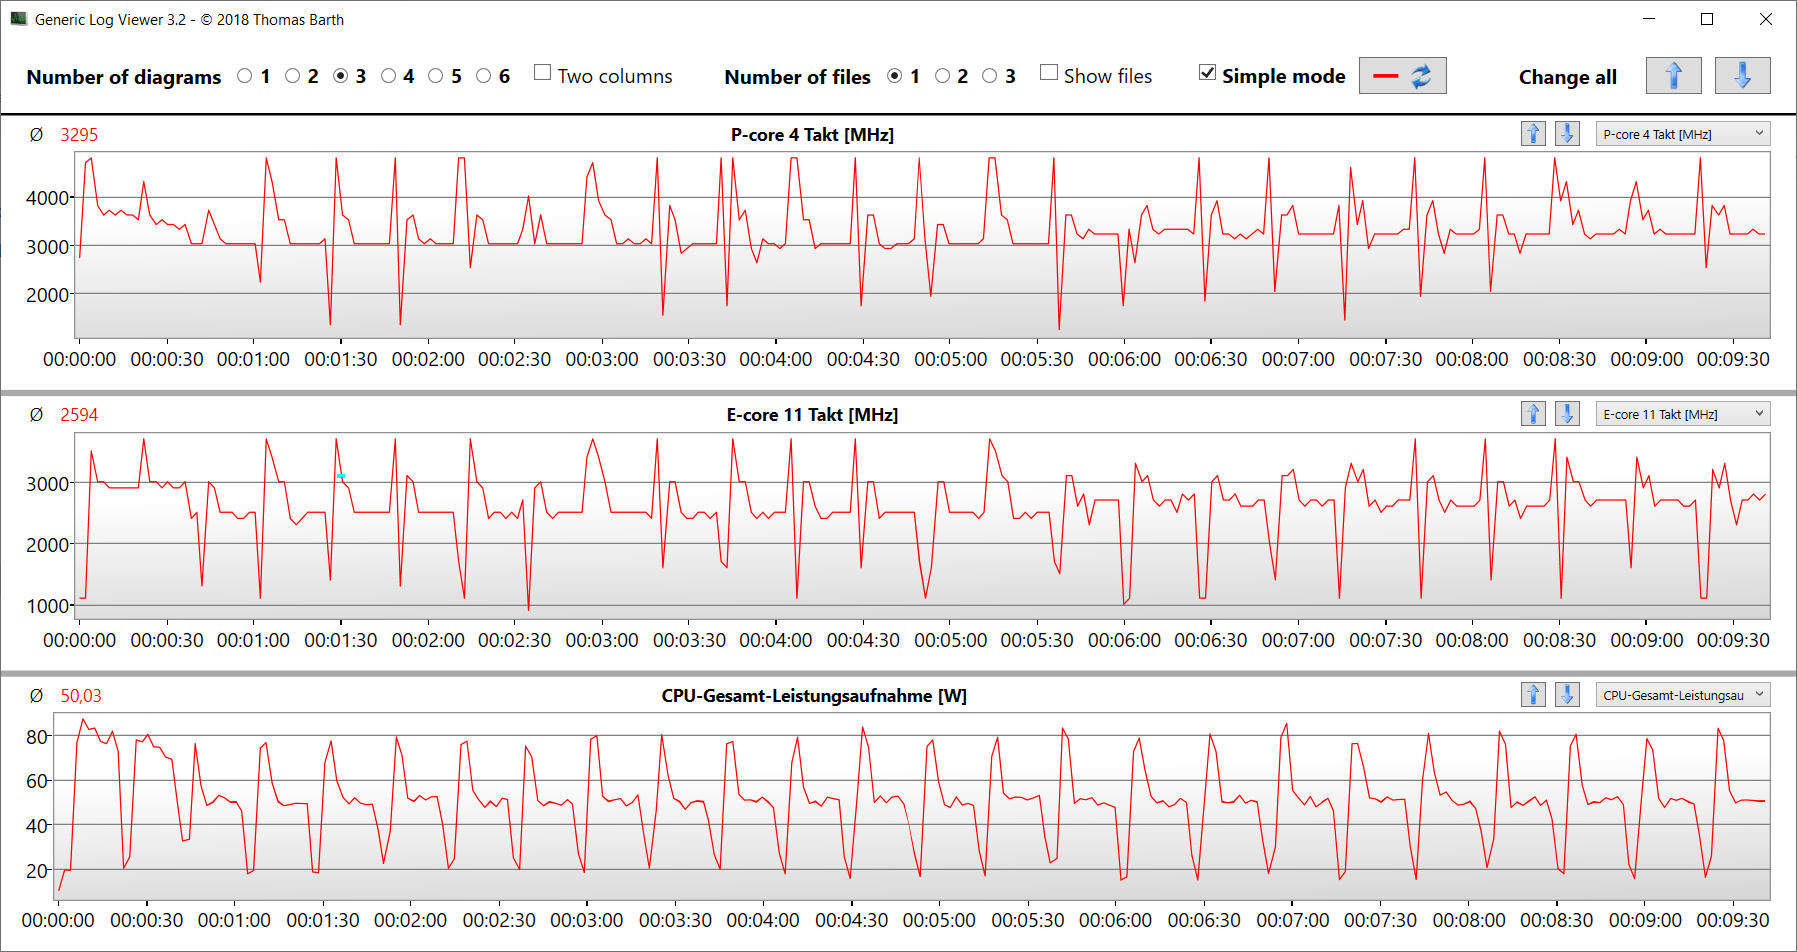
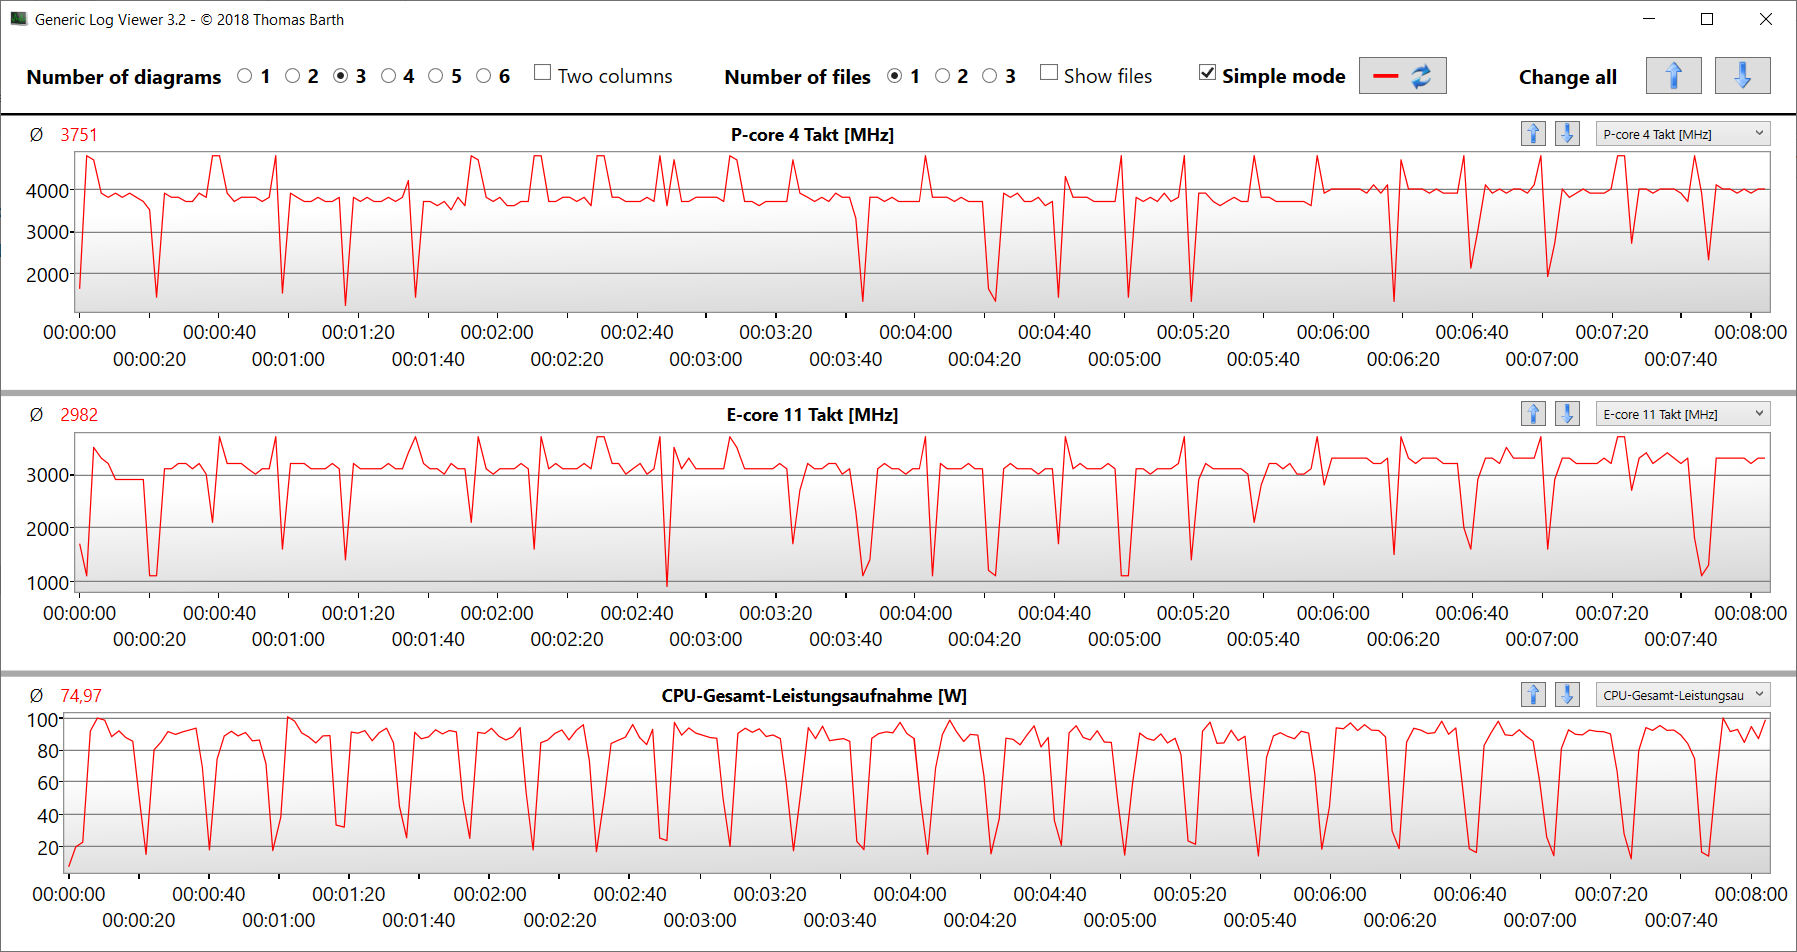
The CB15 loop test shows that constant multithread load causes the Turbo speed to drop from the first to the third run. After that, a constant level can be maintained - at least for a while. The Gaming mode ensures a higher constant clock speed.
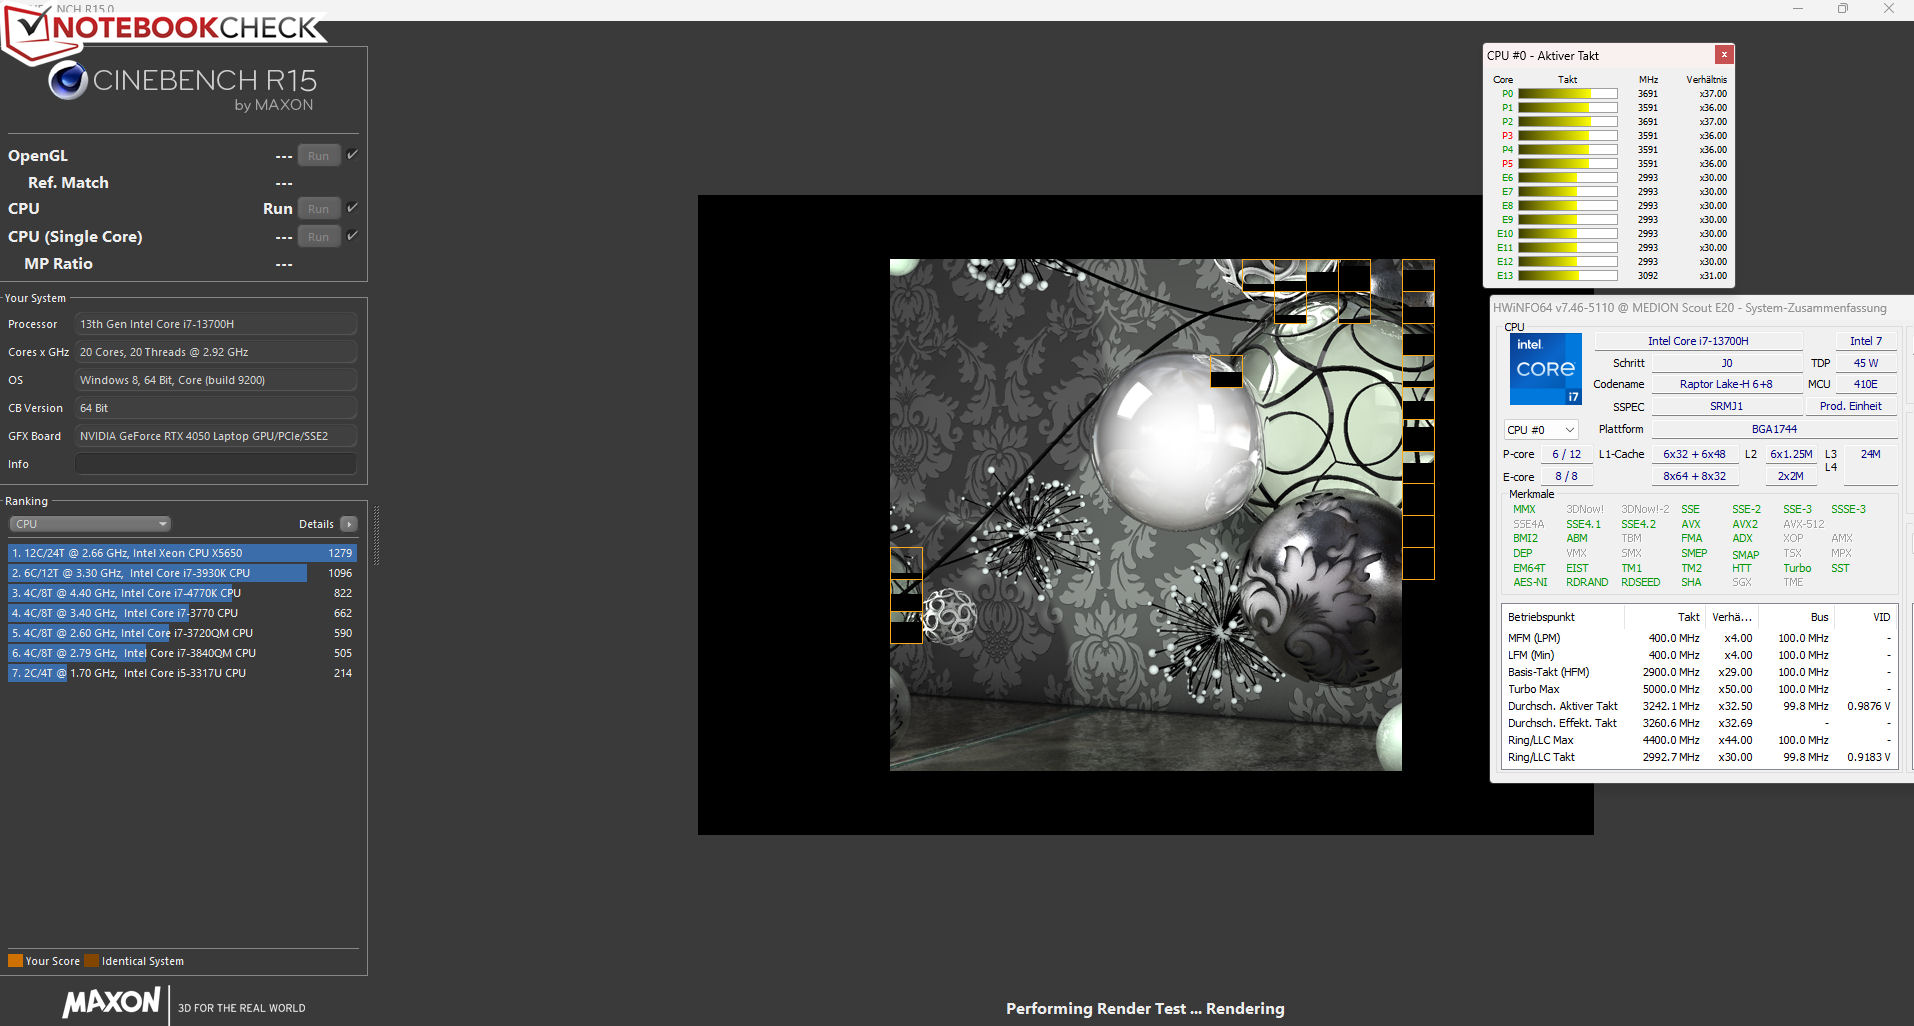
Cinebench R15 Multi Constant Load Test
| CPU Performance Rating - Percent | |
| Average of class Gaming | |
| Lenovo Legion 5 15IAH7H 82RB | |
| Medion Erazer Scout E20 | |
| Medion Erazer Scout E20 | |
| Average Intel Core i7-13700H | |
| MSI Katana 17 B13VFK | |
| Gigabyte G7 KE | |
| Asus TUF Gaming A16 FA617 | |
| Acer Nitro 5 AN515-46-R1A1 | |
| Medion Erazer Scout E20 | |
| Cinebench R23 | |
| Multi Core | |
| Average of class Gaming (2435 - 34613, n=229, last 2 years) | |
| Lenovo Legion 5 15IAH7H 82RB | |
| Medion Erazer Scout E20 (Gaming Modus) | |
| Medion Erazer Scout E20 | |
| MSI Katana 17 B13VFK | |
| Average Intel Core i7-13700H (5890 - 20034, n=27) | |
| Gigabyte G7 KE | |
| Asus TUF Gaming A16 FA617 | |
| Acer Nitro 5 AN515-46-R1A1 | |
| Medion Erazer Scout E20 (Lautlosmodus) | |
| Single Core | |
| Medion Erazer Scout E20 (Gaming Modus) | |
| Medion Erazer Scout E20 | |
| Average of class Gaming (527 - 2235, n=227, last 2 years) | |
| Lenovo Legion 5 15IAH7H 82RB | |
| MSI Katana 17 B13VFK | |
| Average Intel Core i7-13700H (1323 - 1914, n=27) | |
| Gigabyte G7 KE | |
| Asus TUF Gaming A16 FA617 | |
| Acer Nitro 5 AN515-46-R1A1 | |
| Medion Erazer Scout E20 (Lautlosmodus) | |
| Cinebench R20 | |
| CPU (Multi Core) | |
| Average of class Gaming (930 - 13769, n=227, last 2 years) | |
| Lenovo Legion 5 15IAH7H 82RB | |
| Medion Erazer Scout E20 (Gaming Modus) | |
| Medion Erazer Scout E20 | |
| Average Intel Core i7-13700H (2322 - 7674, n=27) | |
| MSI Katana 17 B13VFK | |
| Asus TUF Gaming A16 FA617 | |
| Gigabyte G7 KE | |
| Acer Nitro 5 AN515-46-R1A1 | |
| Medion Erazer Scout E20 (Lautlosmodus) | |
| CPU (Single Core) | |
| Medion Erazer Scout E20 | |
| Medion Erazer Scout E20 (Gaming Modus) | |
| Average of class Gaming (169 - 855, n=227, last 2 years) | |
| Lenovo Legion 5 15IAH7H 82RB | |
| MSI Katana 17 B13VFK | |
| Average Intel Core i7-13700H (508 - 741, n=27) | |
| Gigabyte G7 KE | |
| Asus TUF Gaming A16 FA617 | |
| Acer Nitro 5 AN515-46-R1A1 | |
| Medion Erazer Scout E20 (Lautlosmodus) | |
| Cinebench R15 | |
| CPU Multi 64Bit | |
| Average of class Gaming (400 - 5663, n=231, last 2 years) | |
| Lenovo Legion 5 15IAH7H 82RB | |
| Medion Erazer Scout E20 (Gaming Modus) | |
| Medion Erazer Scout E20 | |
| Average Intel Core i7-13700H (905 - 2982, n=27) | |
| MSI Katana 17 B13VFK | |
| Asus TUF Gaming A16 FA617 | |
| Acer Nitro 5 AN515-46-R1A1 | |
| Gigabyte G7 KE | |
| Medion Erazer Scout E20 (Lautlosmodus) | |
| CPU Single 64Bit | |
| Medion Erazer Scout E20 | |
| Medion Erazer Scout E20 (Gaming Modus) | |
| Average of class Gaming (79.2 - 318, n=230, last 2 years) | |
| Lenovo Legion 5 15IAH7H 82RB | |
| Average Intel Core i7-13700H (213 - 276, n=27) | |
| MSI Katana 17 B13VFK | |
| Gigabyte G7 KE | |
| Acer Nitro 5 AN515-46-R1A1 | |
| Asus TUF Gaming A16 FA617 | |
| Medion Erazer Scout E20 (Lautlosmodus) | |
| Blender - v2.79 BMW27 CPU | |
| Medion Erazer Scout E20 (Lautlosmodus) | |
| Acer Nitro 5 AN515-46-R1A1 | |
| Average Intel Core i7-13700H (169 - 555, n=27) | |
| Gigabyte G7 KE | |
| Asus TUF Gaming A16 FA617 | |
| MSI Katana 17 B13VFK | |
| Medion Erazer Scout E20 | |
| Average of class Gaming (87 - 1259, n=224, last 2 years) | |
| Medion Erazer Scout E20 (Gaming Modus) | |
| Lenovo Legion 5 15IAH7H 82RB | |
| 7-Zip 18.03 | |
| 7z b 4 | |
| Average of class Gaming (11386 - 140932, n=226, last 2 years) | |
| Lenovo Legion 5 15IAH7H 82RB | |
| Medion Erazer Scout E20 (Gaming Modus) | |
| Medion Erazer Scout E20 | |
| MSI Katana 17 B13VFK | |
| Acer Nitro 5 AN515-46-R1A1 | |
| Average Intel Core i7-13700H (27322 - 76344, n=27) | |
| Asus TUF Gaming A16 FA617 | |
| Gigabyte G7 KE | |
| Medion Erazer Scout E20 (Lautlosmodus) | |
| 7z b 4 -mmt1 | |
| Average of class Gaming (2685 - 7581, n=226, last 2 years) | |
| Medion Erazer Scout E20 | |
| Medion Erazer Scout E20 (Gaming Modus) | |
| Average Intel Core i7-13700H (4825 - 6238, n=27) | |
| Lenovo Legion 5 15IAH7H 82RB | |
| Asus TUF Gaming A16 FA617 | |
| MSI Katana 17 B13VFK | |
| Acer Nitro 5 AN515-46-R1A1 | |
| Gigabyte G7 KE | |
| Medion Erazer Scout E20 (Lautlosmodus) | |
| Geekbench 5.5 | |
| Multi-Core | |
| Average of class Gaming (1946 - 22200, n=231, last 2 years) | |
| Lenovo Legion 5 15IAH7H 82RB | |
| Medion Erazer Scout E20 (Gaming Modus) | |
| Medion Erazer Scout E20 | |
| Average Intel Core i7-13700H (6165 - 14215, n=27) | |
| MSI Katana 17 B13VFK | |
| Gigabyte G7 KE | |
| Asus TUF Gaming A16 FA617 | |
| Acer Nitro 5 AN515-46-R1A1 | |
| Medion Erazer Scout E20 (Lautlosmodus) | |
| Single-Core | |
| Medion Erazer Scout E20 (Gaming Modus) | |
| Average of class Gaming (158 - 2210, n=231, last 2 years) | |
| Medion Erazer Scout E20 | |
| MSI Katana 17 B13VFK | |
| Average Intel Core i7-13700H (1362 - 1919, n=27) | |
| Lenovo Legion 5 15IAH7H 82RB | |
| Gigabyte G7 KE | |
| Medion Erazer Scout E20 (Lautlosmodus) | |
| Asus TUF Gaming A16 FA617 | |
| Acer Nitro 5 AN515-46-R1A1 | |
| HWBOT x265 Benchmark v2.2 - 4k Preset | |
| Lenovo Legion 5 15IAH7H 82RB | |
| Average of class Gaming (3 - 37.6, n=229, last 2 years) | |
| Medion Erazer Scout E20 (Gaming Modus) | |
| Asus TUF Gaming A16 FA617 | |
| MSI Katana 17 B13VFK | |
| Medion Erazer Scout E20 | |
| Acer Nitro 5 AN515-46-R1A1 | |
| Average Intel Core i7-13700H (6.72 - 21.2, n=27) | |
| Gigabyte G7 KE | |
| Medion Erazer Scout E20 (Lautlosmodus) | |
| LibreOffice - 20 Documents To PDF | |
| Asus TUF Gaming A16 FA617 | |
| MSI Katana 17 B13VFK | |
| Acer Nitro 5 AN515-46-R1A1 | |
| Average of class Gaming (32.8 - 332, n=223, last 2 years) | |
| Medion Erazer Scout E20 (Lautlosmodus) | |
| Average Intel Core i7-13700H (31.3 - 62.4, n=27) | |
| Gigabyte G7 KE | |
| Medion Erazer Scout E20 | |
| Medion Erazer Scout E20 (Gaming Modus) | |
| Lenovo Legion 5 15IAH7H 82RB | |
| R Benchmark 2.5 - Overall mean | |
| Medion Erazer Scout E20 (Lautlosmodus) | |
| Asus TUF Gaming A16 FA617 | |
| Acer Nitro 5 AN515-46-R1A1 | |
| Gigabyte G7 KE | |
| Average of class Gaming (0.3609 - 4.47, n=226, last 2 years) | |
| Average Intel Core i7-13700H (0.4308 - 0.607, n=27) | |
| Lenovo Legion 5 15IAH7H 82RB | |
| Medion Erazer Scout E20 (Gaming Modus) | |
| Medion Erazer Scout E20 | |
| MSI Katana 17 B13VFK | |
* ... smaller is better
AIDA64: FP32 Ray-Trace | FPU Julia | CPU SHA3 | CPU Queen | FPU SinJulia | FPU Mandel | CPU AES | CPU ZLib | FP64 Ray-Trace | CPU PhotoWorxx
| Performance Rating | |
| Average of class Gaming | |
| Lenovo Legion 5 15IAH7H 82RB | |
| Acer Nitro 5 AN515-46-R1A1 | |
| Asus TUF Gaming A16 FA617 | |
| Medion Erazer Scout E20 | |
| Medion Erazer Scout E20 | |
| Average Intel Core i7-13700H | |
| Gigabyte G7 KE | |
| MSI Katana 17 B13VFK | |
| Medion Erazer Scout E20 | |
| AIDA64 / FP32 Ray-Trace | |
| Average of class Gaming (3069 - 60169, n=222, last 2 years) | |
| Lenovo Legion 5 15IAH7H 82RB (v6.75.6100) | |
| Asus TUF Gaming A16 FA617 (v6.85.6300) | |
| Medion Erazer Scout E20 (v6.75.6100, Gaming Modus) | |
| Acer Nitro 5 AN515-46-R1A1 (v6.75.6100) | |
| Medion Erazer Scout E20 (v6.75.6100) | |
| Average Intel Core i7-13700H (4986 - 18908, n=27) | |
| MSI Katana 17 B13VFK (v6.85.6300) | |
| Gigabyte G7 KE (v6.75.6100) | |
| Medion Erazer Scout E20 (v6.75.6100, Lautlosmodus) | |
| AIDA64 / FPU Julia | |
| Asus TUF Gaming A16 FA617 (v6.85.6300) | |
| Acer Nitro 5 AN515-46-R1A1 (v6.75.6100) | |
| Average of class Gaming (18567 - 252486, n=222, last 2 years) | |
| Lenovo Legion 5 15IAH7H 82RB (v6.75.6100) | |
| Medion Erazer Scout E20 (v6.75.6100, Gaming Modus) | |
| Medion Erazer Scout E20 | |
| Average Intel Core i7-13700H (25360 - 92359, n=27) | |
| MSI Katana 17 B13VFK (v6.85.6300) | |
| Gigabyte G7 KE (v6.75.6100) | |
| Medion Erazer Scout E20 (v6.75.6100, Lautlosmodus) | |
| AIDA64 / CPU SHA3 | |
| Average of class Gaming (629 - 10389, n=222, last 2 years) | |
| Lenovo Legion 5 15IAH7H 82RB (v6.75.6100) | |
| Medion Erazer Scout E20 (v6.75.6100, Gaming Modus) | |
| Asus TUF Gaming A16 FA617 (v6.85.6300) | |
| Acer Nitro 5 AN515-46-R1A1 (v6.75.6100) | |
| Average Intel Core i7-13700H (1339 - 4224, n=27) | |
| Gigabyte G7 KE (v6.75.6100) | |
| Medion Erazer Scout E20 (v6.75.6100) | |
| MSI Katana 17 B13VFK (v6.85.6300) | |
| Medion Erazer Scout E20 (v6.75.6100, Lautlosmodus) | |
| AIDA64 / CPU Queen | |
| Average of class Gaming (15371 - 200651, n=222, last 2 years) | |
| Medion Erazer Scout E20 (v6.75.6100) | |
| Acer Nitro 5 AN515-46-R1A1 (v6.75.6100) | |
| Medion Erazer Scout E20 (v6.75.6100, Gaming Modus) | |
| Asus TUF Gaming A16 FA617 (v6.85.6300) | |
| Lenovo Legion 5 15IAH7H 82RB (v6.75.6100) | |
| Average Intel Core i7-13700H (68763 - 107159, n=27) | |
| Gigabyte G7 KE (v6.75.6100) | |
| MSI Katana 17 B13VFK | |
| Medion Erazer Scout E20 (v6.75.6100, Lautlosmodus) | |
| AIDA64 / FPU SinJulia | |
| Acer Nitro 5 AN515-46-R1A1 (v6.75.6100) | |
| Asus TUF Gaming A16 FA617 (v6.85.6300) | |
| Average of class Gaming (2137 - 32988, n=222, last 2 years) | |
| Medion Erazer Scout E20 (v6.75.6100, Gaming Modus) | |
| Lenovo Legion 5 15IAH7H 82RB (v6.75.6100) | |
| Medion Erazer Scout E20 (v6.75.6100) | |
| Average Intel Core i7-13700H (4800 - 11050, n=27) | |
| MSI Katana 17 B13VFK | |
| Gigabyte G7 KE (v6.75.6100) | |
| Medion Erazer Scout E20 (v6.75.6100, Lautlosmodus) | |
| AIDA64 / FPU Mandel | |
| Acer Nitro 5 AN515-46-R1A1 (v6.75.6100) | |
| Asus TUF Gaming A16 FA617 (v6.85.6300) | |
| Average of class Gaming (10291 - 134044, n=222, last 2 years) | |
| Lenovo Legion 5 15IAH7H 82RB (v6.75.6100) | |
| Medion Erazer Scout E20 (v6.75.6100, Gaming Modus) | |
| Medion Erazer Scout E20 (v6.75.6100) | |
| Average Intel Core i7-13700H (12321 - 45118, n=27) | |
| MSI Katana 17 B13VFK (v6.85.6300) | |
| Gigabyte G7 KE (v6.75.6100) | |
| Medion Erazer Scout E20 (v6.75.6100, Lautlosmodus) | |
| AIDA64 / CPU AES | |
| Lenovo Legion 5 15IAH7H 82RB (v6.75.6100) | |
| Acer Nitro 5 AN515-46-R1A1 | |
| Gigabyte G7 KE (v6.75.6100) | |
| Average of class Gaming (19065 - 328679, n=222, last 2 years) | |
| Average Intel Core i7-13700H (28769 - 151254, n=27) | |
| Medion Erazer Scout E20 (v6.75.6100, Gaming Modus) | |
| Medion Erazer Scout E20 (v6.75.6100) | |
| Asus TUF Gaming A16 FA617 (v6.85.6300) | |
| MSI Katana 17 B13VFK (v6.85.6300) | |
| Medion Erazer Scout E20 (v6.75.6100, Lautlosmodus) | |
| AIDA64 / CPU ZLib | |
| Average of class Gaming (150.9 - 2409, n=222, last 2 years) | |
| Lenovo Legion 5 15IAH7H 82RB (v6.75.6100) | |
| Medion Erazer Scout E20 (v6.75.6100, Gaming Modus) | |
| Medion Erazer Scout E20 (v6.75.6100) | |
| Average Intel Core i7-13700H (389 - 1215, n=27) | |
| Gigabyte G7 KE (v6.75.6100) | |
| Asus TUF Gaming A16 FA617 (v6.85.6300) | |
| Acer Nitro 5 AN515-46-R1A1 (v6.75.6100) | |
| MSI Katana 17 B13VFK (v6.85.6300) | |
| Medion Erazer Scout E20 (v6.75.6100, Lautlosmodus) | |
| AIDA64 / FP64 Ray-Trace | |
| Average of class Gaming (1518 - 31796, n=222, last 2 years) | |
| Lenovo Legion 5 15IAH7H 82RB (v6.75.6100) | |
| Asus TUF Gaming A16 FA617 (v6.85.6300) | |
| Medion Erazer Scout E20 (v6.75.6100, Gaming Modus) | |
| Acer Nitro 5 AN515-46-R1A1 (v6.75.6100) | |
| Medion Erazer Scout E20 (v6.75.6100) | |
| Average Intel Core i7-13700H (2540 - 10135, n=27) | |
| MSI Katana 17 B13VFK (v6.85.6300) | |
| Gigabyte G7 KE (v6.75.6100) | |
| Medion Erazer Scout E20 (v6.75.6100, Lautlosmodus) | |
| AIDA64 / CPU PhotoWorxx | |
| Average Intel Core i7-13700H (19552 - 52727, n=27) | |
| Medion Erazer Scout E20 (v6.75.6100, Gaming Modus) | |
| Medion Erazer Scout E20 (v6.75.6100) | |
| Average of class Gaming (10805 - 60161, n=223, last 2 years) | |
| Lenovo Legion 5 15IAH7H 82RB (v6.75.6100) | |
| MSI Katana 17 B13VFK (v6.85.6300) | |
| Medion Erazer Scout E20 (v6.75.6100, Lautlosmodus) | |
| Gigabyte G7 KE (v6.75.6100) | |
| Acer Nitro 5 AN515-46-R1A1 | |
| Asus TUF Gaming A16 FA617 (v6.85.6300) | |
System Performance
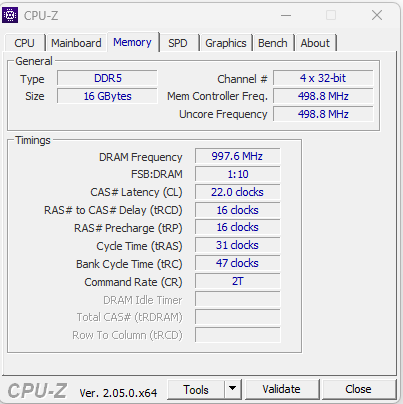
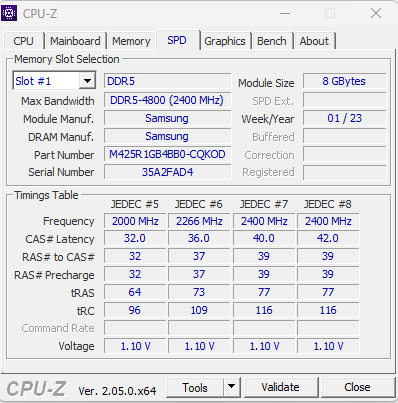
The smoothly running system offers sufficient performance for demanding task areas such as rendering and gaming, which is also confirmed by the good PCMark results. The transfer rates of the working memory range at normal levels for DDR5-4800 storage.
CrossMark: Overall | Productivity | Creativity | Responsiveness
| PCMark 10 / Score | |
| Lenovo Legion 5 15IAH7H 82RB | |
| Average of class Gaming (5235 - 9852, n=197, last 2 years) | |
| Medion Erazer Scout E20 | |
| Asus TUF Gaming A16 FA617 | |
| Average Intel Core i7-13700H, NVIDIA GeForce RTX 4050 Laptop GPU (6822 - 7556, n=7) | |
| MSI Katana 17 B13VFK | |
| Acer Nitro 5 AN515-46-R1A1 | |
| Gigabyte G7 KE | |
| PCMark 10 / Essentials | |
| Lenovo Legion 5 15IAH7H 82RB | |
| Medion Erazer Scout E20 | |
| Average Intel Core i7-13700H, NVIDIA GeForce RTX 4050 Laptop GPU (10283 - 11549, n=7) | |
| MSI Katana 17 B13VFK | |
| Average of class Gaming (8300 - 12334, n=196, last 2 years) | |
| Asus TUF Gaming A16 FA617 | |
| Acer Nitro 5 AN515-46-R1A1 | |
| Gigabyte G7 KE | |
| PCMark 10 / Productivity | |
| Lenovo Legion 5 15IAH7H 82RB | |
| Medion Erazer Scout E20 | |
| Average of class Gaming (6662 - 11833, n=196, last 2 years) | |
| Asus TUF Gaming A16 FA617 | |
| MSI Katana 17 B13VFK | |
| Average Intel Core i7-13700H, NVIDIA GeForce RTX 4050 Laptop GPU (8368 - 9836, n=7) | |
| Gigabyte G7 KE | |
| Acer Nitro 5 AN515-46-R1A1 | |
| PCMark 10 / Digital Content Creation | |
| Lenovo Legion 5 15IAH7H 82RB | |
| Average of class Gaming (6462 - 18475, n=196, last 2 years) | |
| Asus TUF Gaming A16 FA617 | |
| Medion Erazer Scout E20 | |
| Average Intel Core i7-13700H, NVIDIA GeForce RTX 4050 Laptop GPU (9527 - 10643, n=7) | |
| MSI Katana 17 B13VFK | |
| Acer Nitro 5 AN515-46-R1A1 | |
| Gigabyte G7 KE | |
| CrossMark / Overall | |
| Lenovo Legion 5 15IAH7H 82RB | |
| Medion Erazer Scout E20 | |
| Average of class Gaming (1247 - 2334, n=169, last 2 years) | |
| MSI Katana 17 B13VFK | |
| Gigabyte G7 KE | |
| Average Intel Core i7-13700H, NVIDIA GeForce RTX 4050 Laptop GPU (1205 - 1937, n=9) | |
| Acer Nitro 5 AN515-46-R1A1 | |
| CrossMark / Productivity | |
| Lenovo Legion 5 15IAH7H 82RB | |
| Medion Erazer Scout E20 | |
| Gigabyte G7 KE | |
| Average of class Gaming (1299 - 2204, n=169, last 2 years) | |
| MSI Katana 17 B13VFK | |
| Average Intel Core i7-13700H, NVIDIA GeForce RTX 4050 Laptop GPU (1158 - 1877, n=9) | |
| Acer Nitro 5 AN515-46-R1A1 | |
| CrossMark / Creativity | |
| Average of class Gaming (1275 - 2514, n=169, last 2 years) | |
| Medion Erazer Scout E20 | |
| Lenovo Legion 5 15IAH7H 82RB | |
| MSI Katana 17 B13VFK | |
| Average Intel Core i7-13700H, NVIDIA GeForce RTX 4050 Laptop GPU (1293 - 2044, n=9) | |
| Gigabyte G7 KE | |
| Acer Nitro 5 AN515-46-R1A1 | |
| CrossMark / Responsiveness | |
| Lenovo Legion 5 15IAH7H 82RB | |
| Gigabyte G7 KE | |
| Medion Erazer Scout E20 | |
| MSI Katana 17 B13VFK | |
| Average of class Gaming (1030 - 2330, n=169, last 2 years) | |
| Average Intel Core i7-13700H, NVIDIA GeForce RTX 4050 Laptop GPU (1097 - 1929, n=9) | |
| Acer Nitro 5 AN515-46-R1A1 | |
| PCMark 8 Home Score Accelerated v2 | 5486 points | |
| PCMark 8 Work Score Accelerated v2 | 6205 points | |
| PCMark 10 Score | 7556 points | |
Help | ||
| AIDA64 / Memory Copy | |
| Average Intel Core i7-13700H (40018 - 78081, n=27) | |
| Average of class Gaming (21842 - 92565, n=222, last 2 years) | |
| Medion Erazer Scout E20 | |
| MSI Katana 17 B13VFK | |
| Lenovo Legion 5 15IAH7H 82RB | |
| Acer Nitro 5 AN515-46-R1A1 | |
| Asus TUF Gaming A16 FA617 | |
| Gigabyte G7 KE | |
| AIDA64 / Memory Read | |
| Average Intel Core i7-13700H (44583 - 79656, n=27) | |
| Medion Erazer Scout E20 | |
| Average of class Gaming (24879 - 90647, n=222, last 2 years) | |
| MSI Katana 17 B13VFK | |
| Lenovo Legion 5 15IAH7H 82RB | |
| Acer Nitro 5 AN515-46-R1A1 | |
| Asus TUF Gaming A16 FA617 | |
| Gigabyte G7 KE | |
| AIDA64 / Memory Write | |
| Average Intel Core i7-13700H (42710 - 99898, n=27) | |
| Average of class Gaming (21619 - 103259, n=222, last 2 years) | |
| Medion Erazer Scout E20 | |
| Lenovo Legion 5 15IAH7H 82RB | |
| Acer Nitro 5 AN515-46-R1A1 | |
| Asus TUF Gaming A16 FA617 | |
| MSI Katana 17 B13VFK | |
| Gigabyte G7 KE | |
| AIDA64 / Memory Latency | |
| MSI Katana 17 B13VFK | |
| Medion Erazer Scout E20 | |
| Lenovo Legion 5 15IAH7H 82RB | |
| Average Intel Core i7-13700H (82.4 - 136.8, n=27) | |
| Gigabyte G7 KE | |
| Acer Nitro 5 AN515-46-R1A1 | |
| Average of class Gaming (59.5 - 152.5, n=219, last 2 years) | |
| Asus TUF Gaming A16 FA617 | |
* ... smaller is better
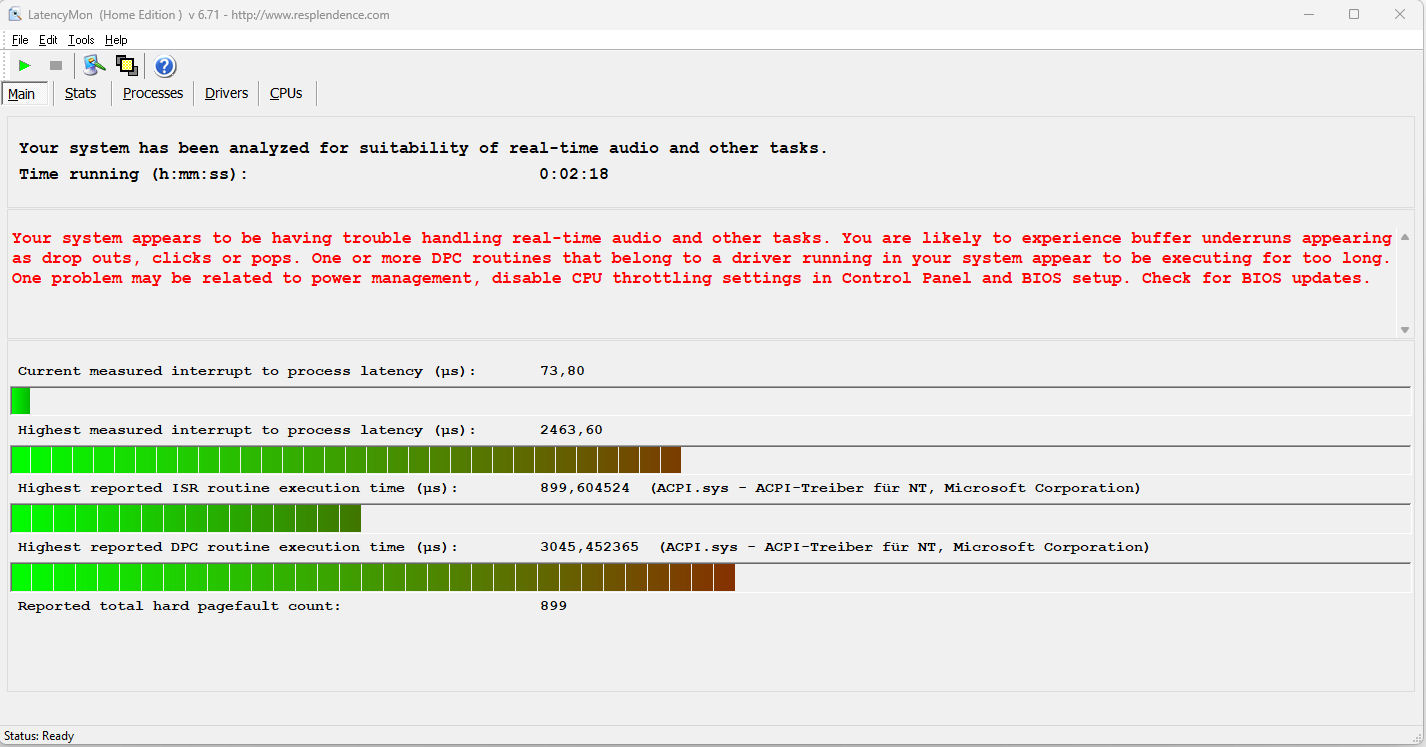
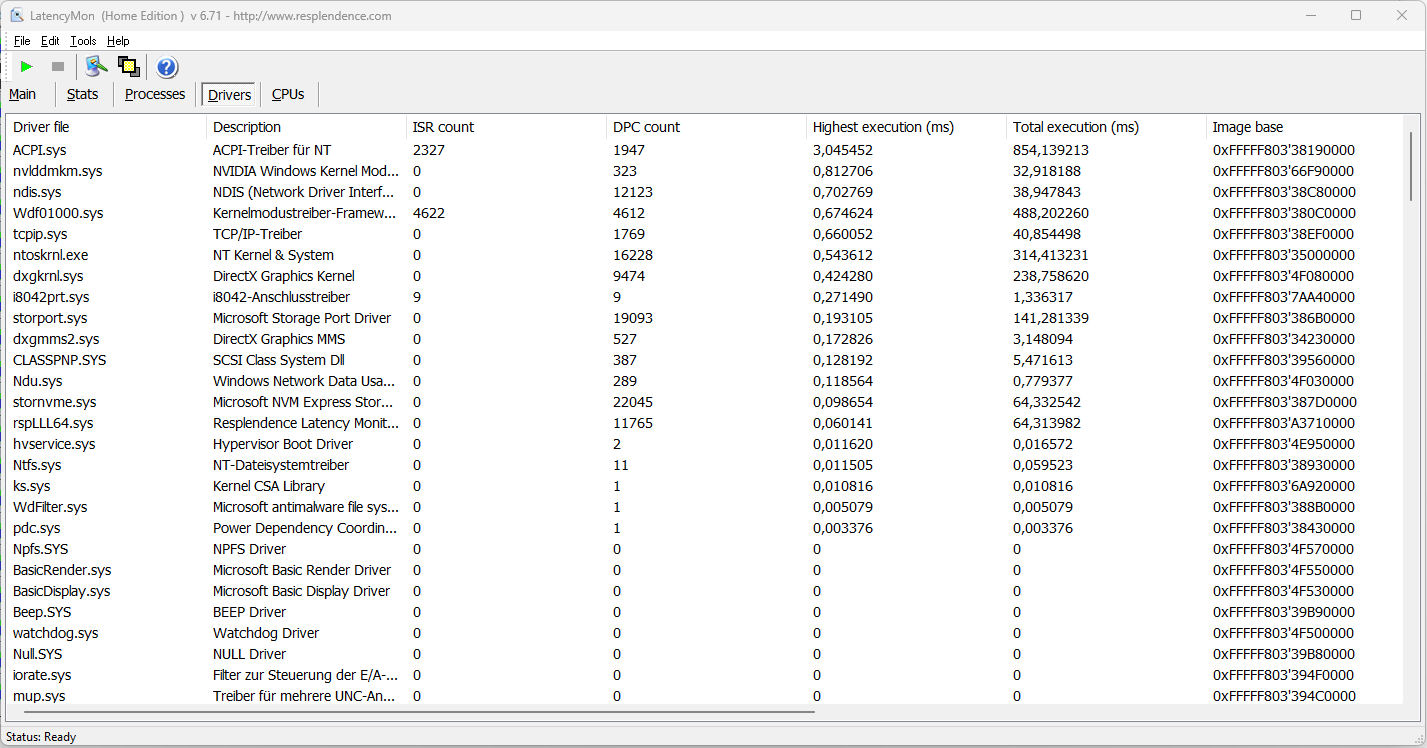
DPC Latencies
The standardized Latency Monitor test (with web surfing, 4k video reproduction, and Prime95 high load) reveals some conspicuous latencies. The system doesn't appear to be suited for real-time video and audio processing. Future software updates might bring some improvements or even make things worse.
| DPC Latencies / LatencyMon - interrupt to process latency (max), Web, Youtube, Prime95 | |
| Acer Nitro 5 AN515-46-R1A1 | |
| Medion Erazer Scout E20 | |
| MSI Katana 17 B13VFK | |
| Gigabyte G7 KE | |
| Lenovo Legion 5 15IAH7H 82RB | |
| Asus TUF Gaming A16 FA617 | |
* ... smaller is better
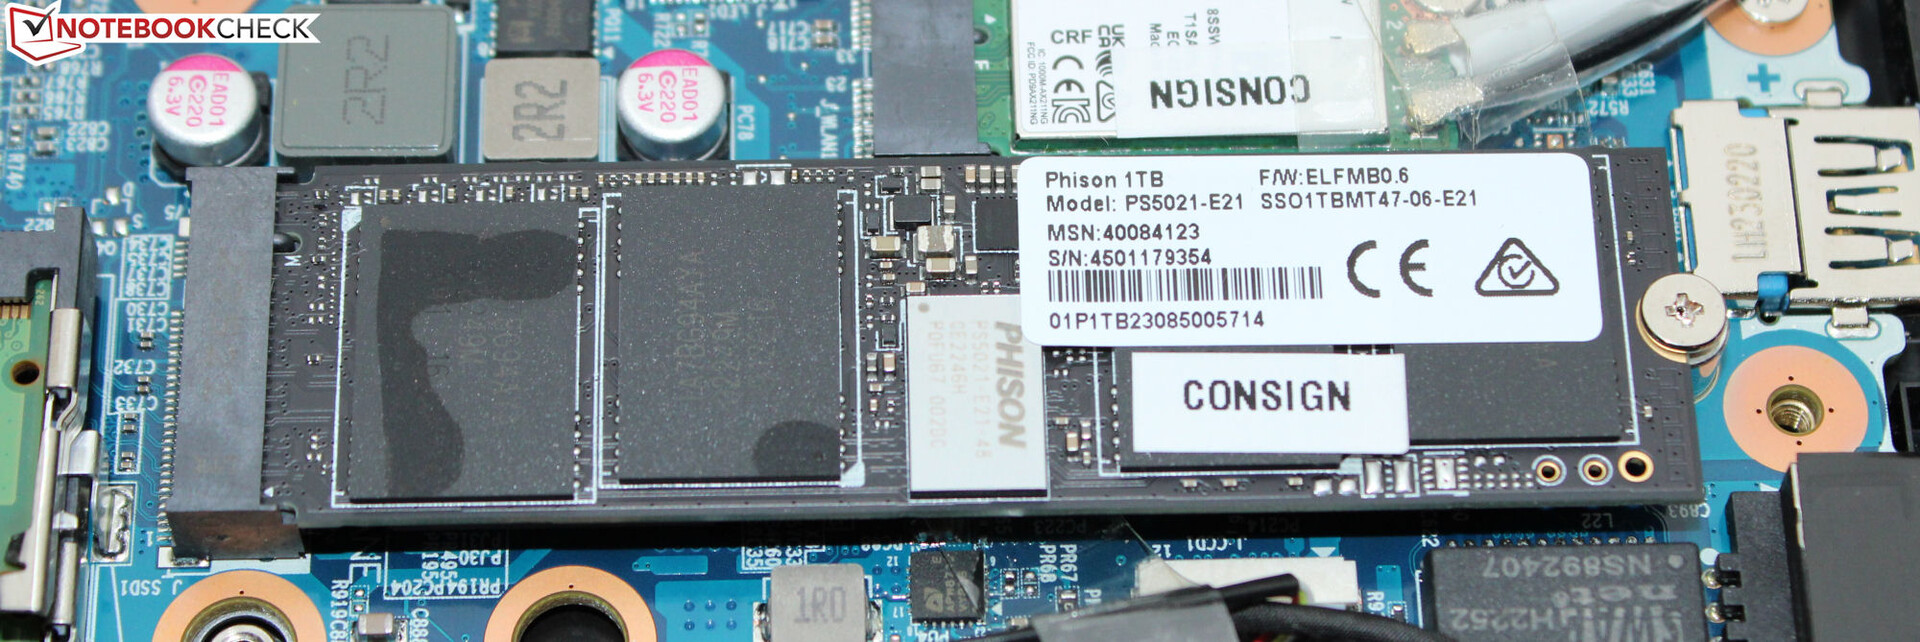
Storage Solution
A 1-TB PCIe 4 SSD in the M.2-2280 format from Phison serves as the system drive. While it delivers very good transfer rates, it is not one of the top models among SSDs. There are no performance drops due to thermal throttling.
According to the Medion website, you can expand the laptop storage by using a 2.5-inch storage medium, but our test unit neither includes the necessary SATA slots nor the insertion frame.

* ... smaller is better
Disk Throttling: DiskSpd Read Loop, Queue Depth 8
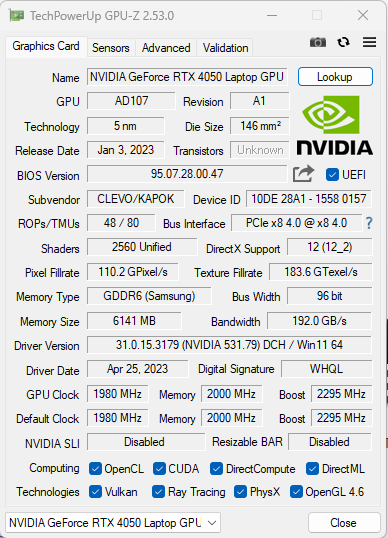
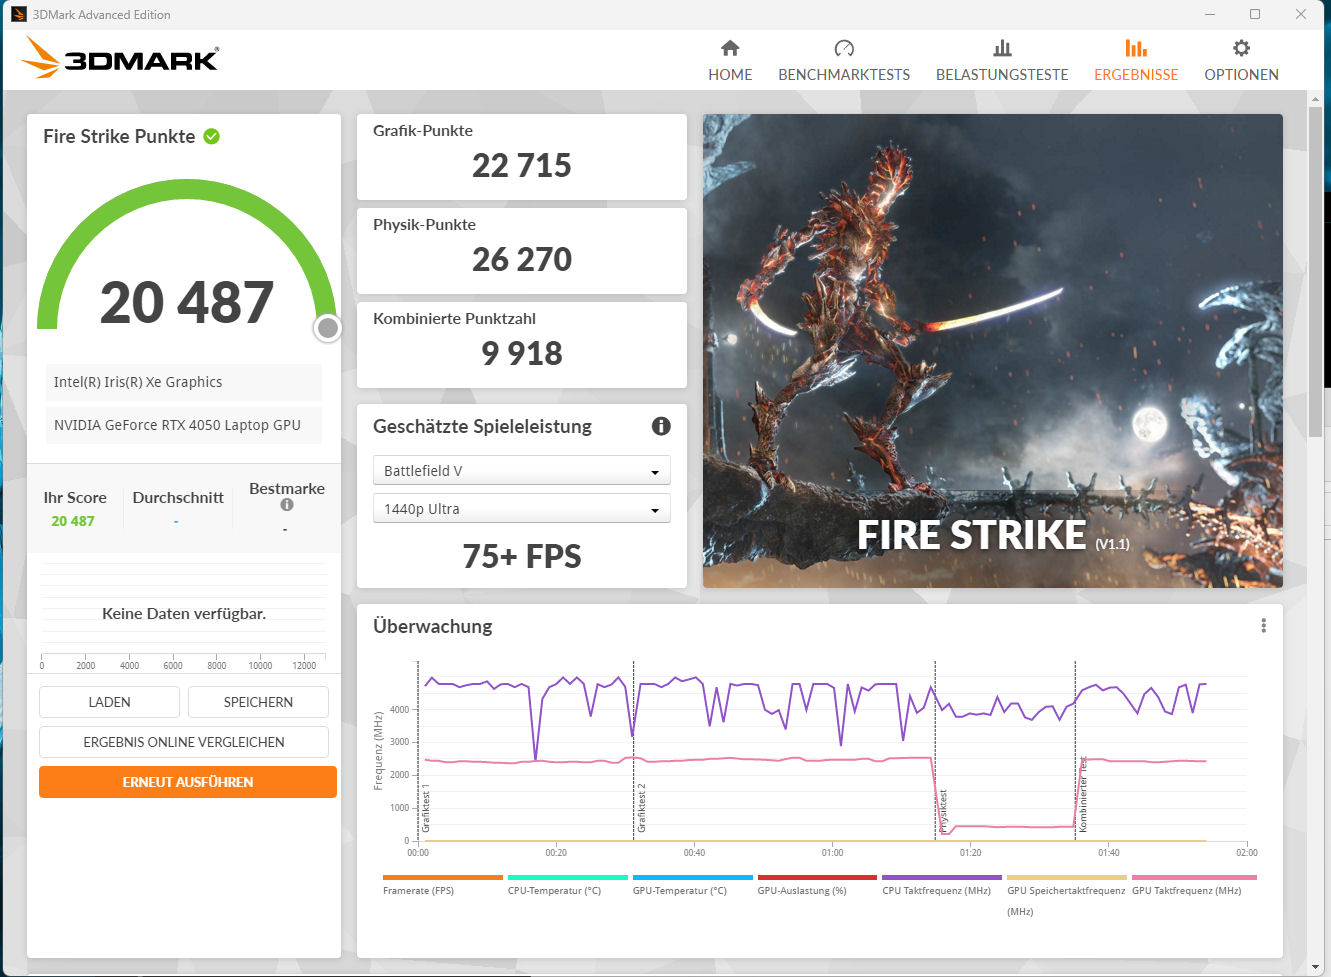
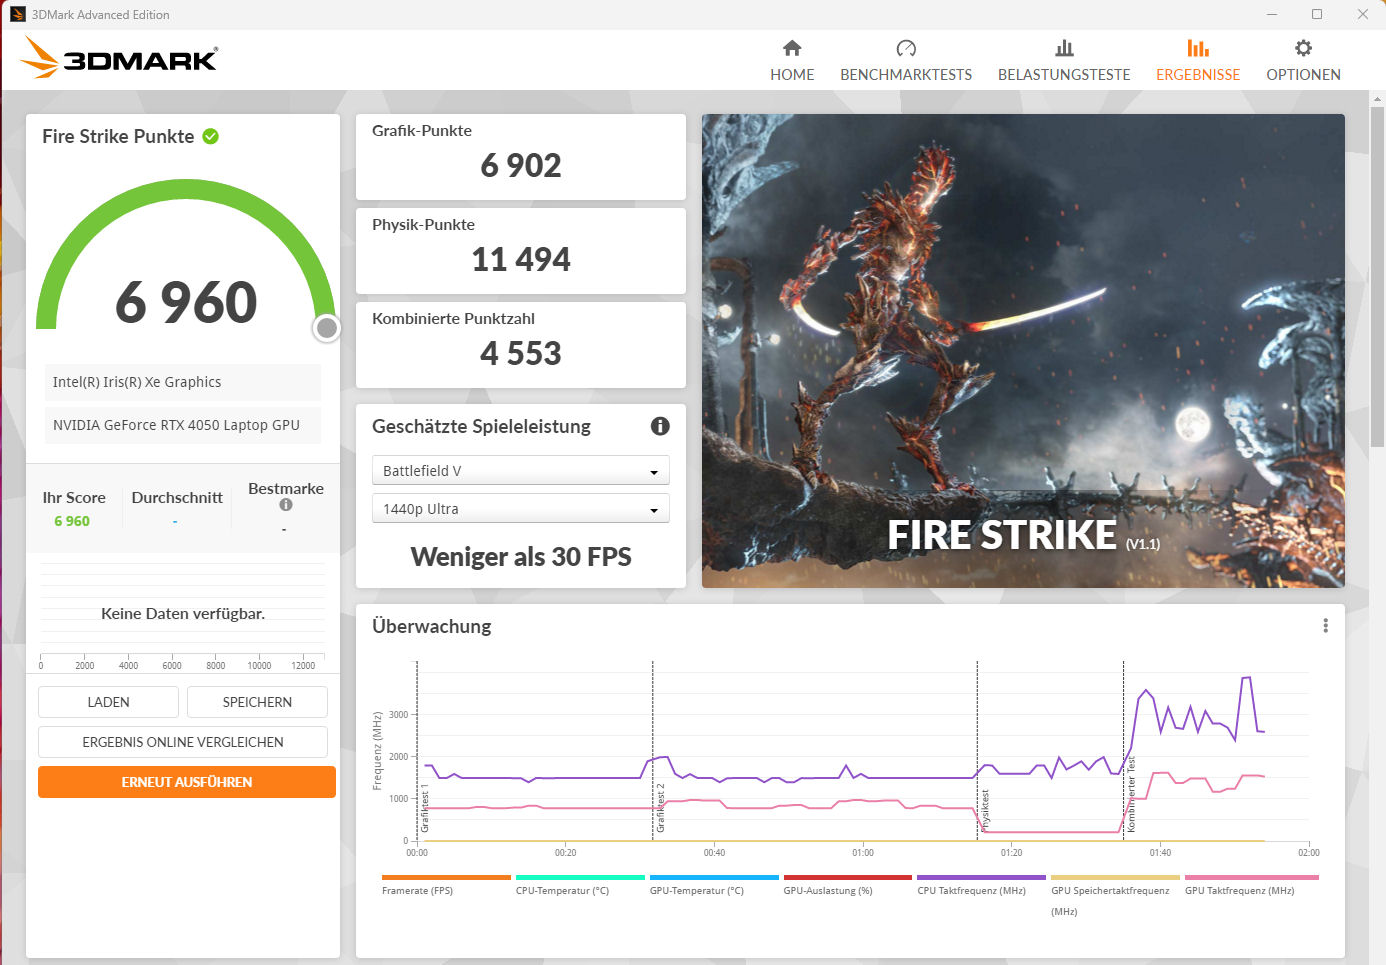
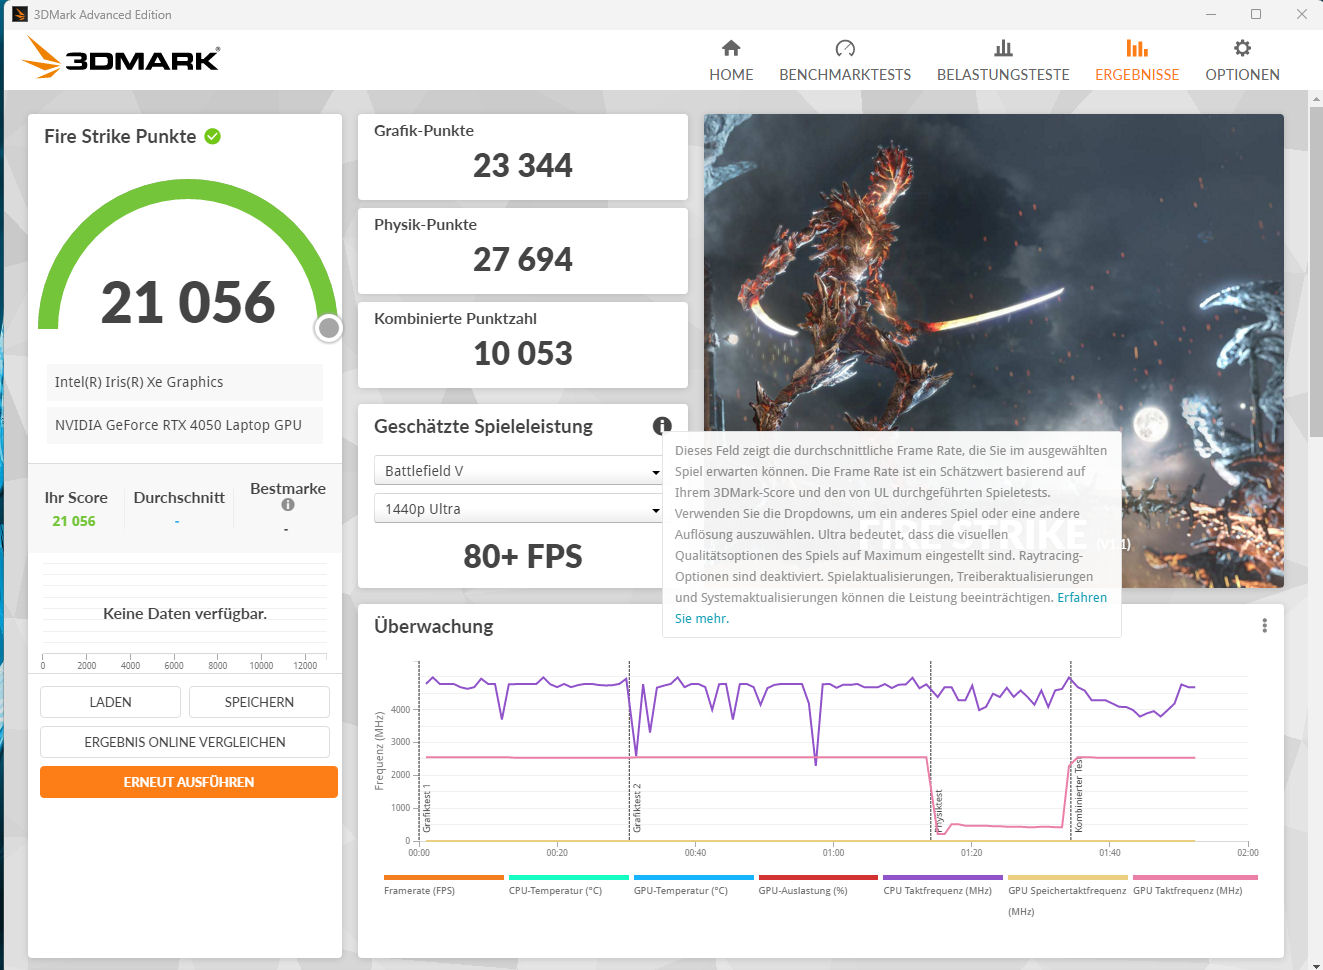
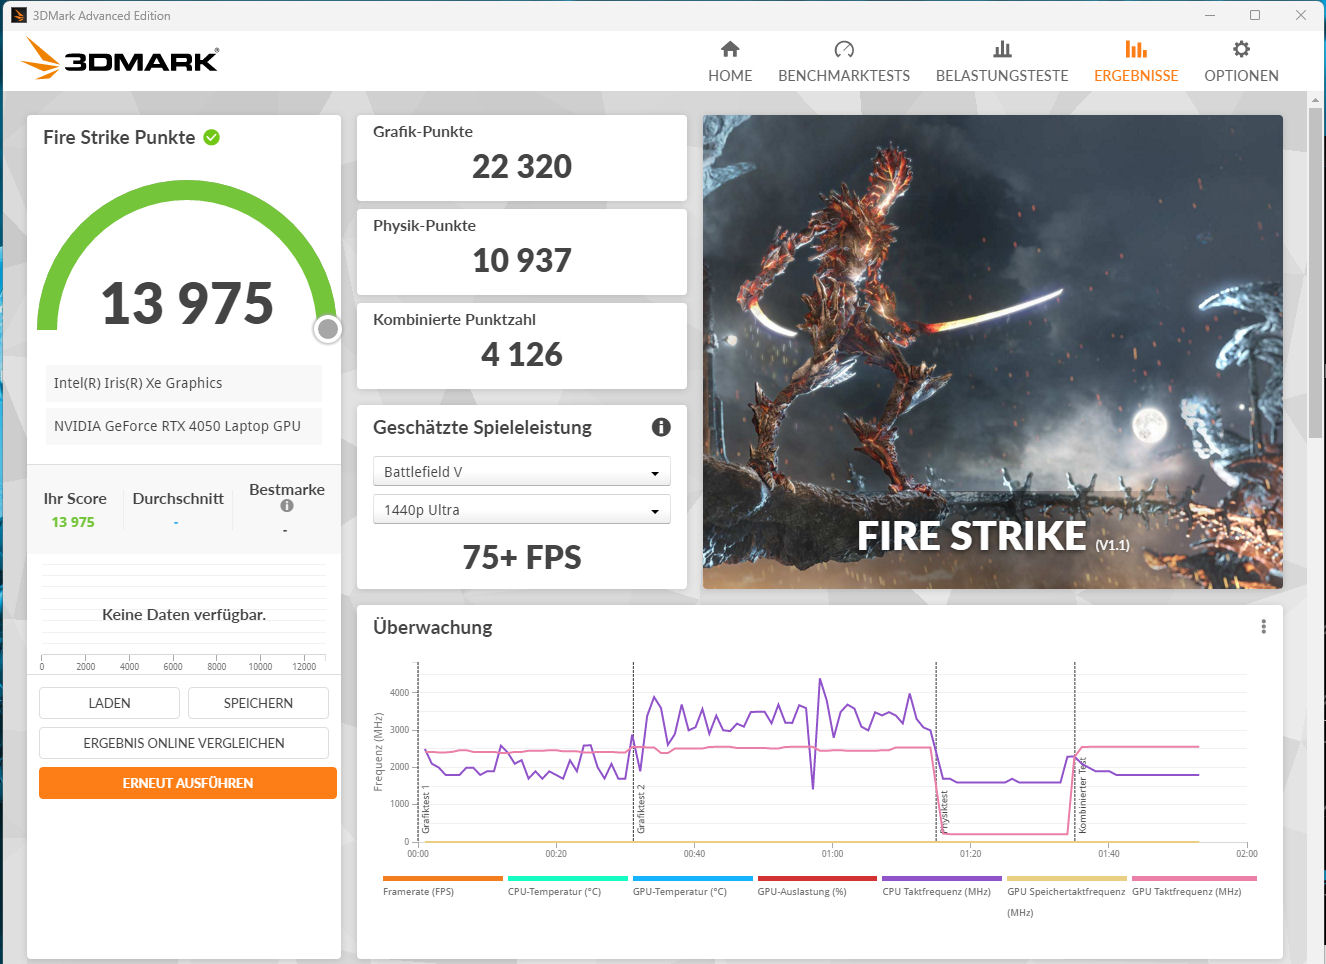
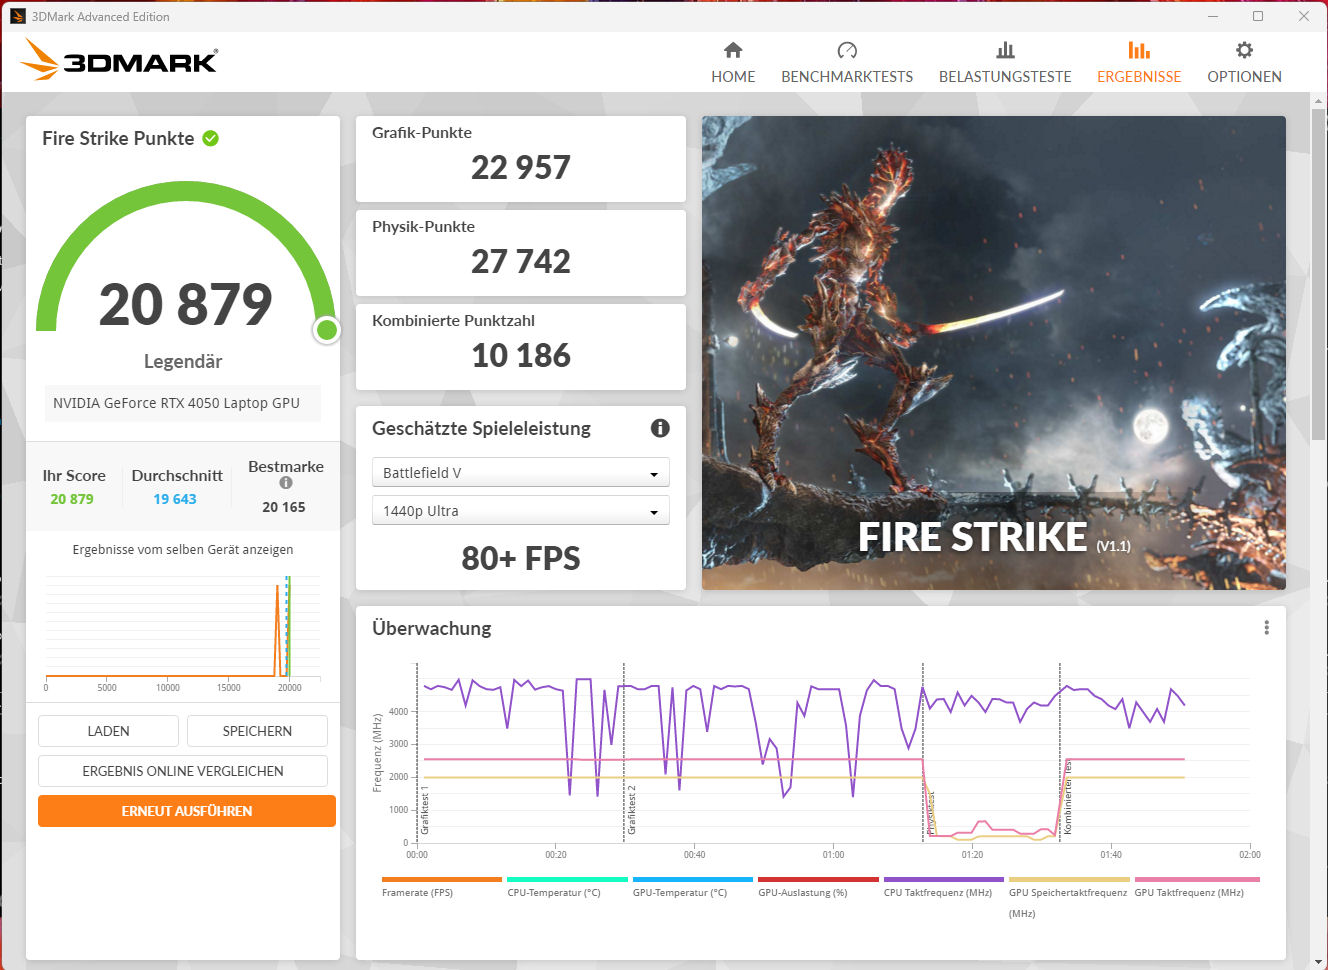
Graphics Card
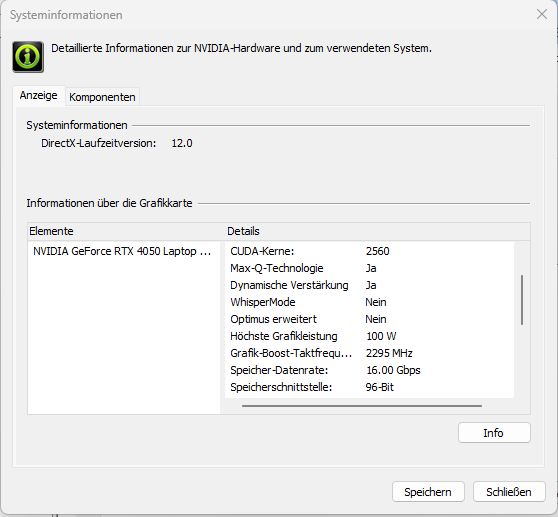
The GeForce RTX 4050 Laptop GPU offers 2,560 shaders, a 96-bit bus, and 6,144 MB of fast GDDR6 storage. Medion allows it a maximum TGP of 100 watts. According to our The Witcher 3 test, the maximum TGP is not fully used.
The benchmark results range above the average for the RTX 4050. The Entertainment and Gaming modes produce almost the same graphics performance. The direct image output via the GeForce GPU doesn't bring a performance increase. Switching between Optimus and dGPU mode is done in the BIOS or via the Control Center. Advanced Optimus is not supported.
| 3DMark Performance Rating - Percent | |
| Average of class Gaming | |
| MSI Katana 17 B13VFK | |
| Acer Nitro 5 AN515-46-R1A1 | |
| Asus TUF Gaming A16 FA617 | |
| Medion Erazer Scout E20 | |
| Medion Erazer Scout E20 | |
| Lenovo Legion 5 15IAH7H 82RB -1! | |
| Average NVIDIA GeForce RTX 4050 Laptop GPU | |
| Medion Erazer Scout E20 | |
| Gigabyte G7 KE | |
| 3DMark 11 - 1280x720 Performance GPU | |
| Average of class Gaming (1029 - 72070, n=227, last 2 years) | |
| Acer Nitro 5 AN515-46-R1A1 | |
| MSI Katana 17 B13VFK | |
| Asus TUF Gaming A16 FA617 | |
| Medion Erazer Scout E20 (Gaming Performance) | |
| Lenovo Legion 5 15IAH7H 82RB | |
| Medion Erazer Scout E20 | |
| Medion Erazer Scout E20 (Lautlosmodus) | |
| Gigabyte G7 KE | |
| Average NVIDIA GeForce RTX 4050 Laptop GPU (13339 - 32642, n=36) | |
| 3DMark 06 Standard Score | 51372 points | |
| 3DMark 11 Performance | 27315 points | |
| 3DMark Cloud Gate Standard Score | 52998 points | |
| 3DMark Fire Strike Score | 20487 points | |
| 3DMark Time Spy Score | 8594 points | |
Help | ||
| Blender | |
| v3.3 Classroom OPTIX/RTX | |
| Gigabyte G7 KE (3.3.2) | |
| Lenovo Legion 5 15IAH7H 82RB (3.3.0) | |
| Medion Erazer Scout E20 (3.3.3) | |
| Medion Erazer Scout E20 (3.3.3, Lautlosmodus) | |
| Average NVIDIA GeForce RTX 4050 Laptop GPU (25 - 37, n=35) | |
| Medion Erazer Scout E20 (3.3.3, Gaming Modus) | |
| Acer Nitro 5 AN515-46-R1A1 (3.3.0) | |
| MSI Katana 17 B13VFK (3.3.3) | |
| Average of class Gaming (9 - 142, n=182, last 2 years) | |
| v3.3 Classroom CUDA | |
| Average NVIDIA GeForce RTX 4050 Laptop GPU (47 - 175, n=35) | |
| Gigabyte G7 KE (3.3.2) | |
| Medion Erazer Scout E20 (3.3.3) | |
| Medion Erazer Scout E20 (3.3.3, Lautlosmodus) | |
| Lenovo Legion 5 15IAH7H 82RB (3.3.0) | |
| Medion Erazer Scout E20 (3.3.3, Gaming Modus) | |
| MSI Katana 17 B13VFK (3.3.3) | |
| Acer Nitro 5 AN515-46-R1A1 (3.3.0) | |
| Average of class Gaming (16 - 175, n=189, last 2 years) | |
| Geekbench 5.5 - OpenCL Score | |
| Acer Nitro 5 AN515-46-R1A1 | |
| Average of class Gaming (5039 - 226512, n=230, last 2 years) | |
| Gigabyte G7 KE | |
| Lenovo Legion 5 15IAH7H 82RB | |
| MSI Katana 17 B13VFK | |
| Medion Erazer Scout E20 (Gaming Modus) | |
| Medion Erazer Scout E20 (Lautlosmodus) | |
| Medion Erazer Scout E20 | |
| Average NVIDIA GeForce RTX 4050 Laptop GPU (63538 - 90075, n=33) | |
| Asus TUF Gaming A16 FA617 | |
| Geekbench 6.0 - GPU OpenCL | |
| Average of class Gaming (30029 - 213472, n=44, last 2 years) | |
| Medion Erazer Scout E20 | |
| Average NVIDIA GeForce RTX 4050 Laptop GPU (66574 - 84452, n=12) | |
| V-Ray 5 Benchmark | |
| GPU RTX | |
| Average of class Gaming (171 - 3824, n=125, last 2 years) | |
| Acer Nitro 5 AN515-46-R1A1 (5.0.1) | |
| Medion Erazer Scout E20 (5.0.1, Gaming Modus) | |
| Medion Erazer Scout E20 (5.0.1) | |
| Average NVIDIA GeForce RTX 4050 Laptop GPU (1021 - 1588, n=20) | |
| Medion Erazer Scout E20 (5.0.1, Lautlosmodus) | |
| Gigabyte G7 KE (5.0.1) | |
| GPU CUDA | |
| Average of class Gaming (120 - 2797, n=128, last 2 years) | |
| Acer Nitro 5 AN515-46-R1A1 (5.0.1) | |
| Medion Erazer Scout E20 (5.0.1, Gaming Modus) | |
| Medion Erazer Scout E20 (5.0.1, Lautlosmodus) | |
| Medion Erazer Scout E20 (5.0.1) | |
| Average NVIDIA GeForce RTX 4050 Laptop GPU (735 - 1123, n=20) | |
| Gigabyte G7 KE (5.0.1) | |
| CPU | |
| Average of class Gaming (1690 - 26944, n=141, last 2 years) | |
| Lenovo Legion 5 15IAH7H 82RB (5.0.1) | |
| Medion Erazer Scout E20 (5.0.1, Gaming Modus) | |
| Medion Erazer Scout E20 (5.0.1) | |
| Average NVIDIA GeForce RTX 4050 Laptop GPU (3562 - 14401, n=20) | |
| Acer Nitro 5 AN515-46-R1A1 (5.0.1) | |
| Gigabyte G7 KE (5.0.1) | |
| Medion Erazer Scout E20 (5.0.1, Lautlosmodus) | |
| V-Ray Benchmark Next 4.10 | |
| GPU | |
| MSI Katana 17 B13VFK (v4.10.07 ) | |
| Average of class Gaming (54 - 1334, n=184, last 2 years) | |
| Acer Nitro 5 AN515-46-R1A1 (v4.10.07 ) | |
| Medion Erazer Scout E20 (v4.10.07, Gaming Modus) | |
| Medion Erazer Scout E20 (v4.10.07, Lautlosmodus) | |
| Medion Erazer Scout E20 (v4.10.07 ) | |
| Average NVIDIA GeForce RTX 4050 Laptop GPU (333 - 529, n=30) | |
| Gigabyte G7 KE (v4.10.07 ) | |
| Asus TUF Gaming A16 FA617 (v4.10.07 ) | |
| CPU | |
| Average of class Gaming (2741 - 37629, n=184, last 2 years) | |
| Medion Erazer Scout E20 (v4.10.07, Gaming Modus) | |
| MSI Katana 17 B13VFK (v4.10.07 ) | |
| Medion Erazer Scout E20 (v4.10.07 ) | |
| Average NVIDIA GeForce RTX 4050 Laptop GPU (5413 - 24181, n=30) | |
| Asus TUF Gaming A16 FA617 (v4.10.07 ) | |
| Gigabyte G7 KE (v4.10.07 ) | |
| Acer Nitro 5 AN515-46-R1A1 (v4.10.07 ) | |
| Medion Erazer Scout E20 (v4.10.07, Lautlosmodus) | |
* ... smaller is better
Gaming Performance
The Scout is set up for FHD gaming at high to maximum settings. The "Silent mode" enables gaming with low operational noise, but you should lower your resolution and settings accordingly. The laptop reaches frame rates above (Gaming mode, Entertainment mode) and below (Silent mode) the average we determined so far for the RTX 4050. Depending on the game, the direct image output via the GeForce GPU can lead to a minimal increase in the frame rates.
| Performance Rating - Percent | |
| Average of class Gaming | |
| MSI Katana 17 B13VFK | |
| Lenovo Legion 5 15IAH7H 82RB | |
| Acer Nitro 5 AN515-46-R1A1 | |
| Medion Erazer Scout E20 | |
| Medion Erazer Scout E20 | |
| Gigabyte G7 KE | |
| Average NVIDIA GeForce RTX 4050 Laptop GPU | |
| Asus TUF Gaming A16 FA617 | |
| Medion Erazer Scout E20 | |
| The Witcher 3 - 1920x1080 Ultra Graphics & Postprocessing (HBAO+) | |
| Average of class Gaming (8.61 - 216, n=224, last 2 years) | |
| Acer Nitro 5 AN515-46-R1A1 | |
| MSI Katana 17 B13VFK | |
| Asus TUF Gaming A16 FA617 | |
| Lenovo Legion 5 15IAH7H 82RB | |
| Medion Erazer Scout E20 (Gaming Modus) | |
| Medion Erazer Scout E20 | |
| Gigabyte G7 KE | |
| Medion Erazer Scout E20 (Lautlosmodus) | |
| Average NVIDIA GeForce RTX 4050 Laptop GPU (18.5 - 94.7, n=38) | |
| GTA V - 1920x1080 Highest Settings possible AA:4xMSAA + FX AF:16x | |
| MSI Katana 17 B13VFK | |
| Lenovo Legion 5 15IAH7H 82RB | |
| Average of class Gaming (6.38 - 167.7, n=214, last 2 years) | |
| Gigabyte G7 KE | |
| Medion Erazer Scout E20 (Gaming Modus) | |
| Medion Erazer Scout E20 | |
| Acer Nitro 5 AN515-46-R1A1 | |
| Asus TUF Gaming A16 FA617 | |
| Average NVIDIA GeForce RTX 4050 Laptop GPU (14.9 - 101.7, n=30) | |
| Medion Erazer Scout E20 (Lautlosmodus) | |
| Final Fantasy XV Benchmark - 1920x1080 High Quality | |
| Average of class Gaming (9.13 - 194.9, n=225, last 2 years) | |
| Acer Nitro 5 AN515-46-R1A1 (1.3) | |
| Lenovo Legion 5 15IAH7H 82RB (1.3) | |
| MSI Katana 17 B13VFK (1.3) | |
| Gigabyte G7 KE (1.3) | |
| Medion Erazer Scout E20 (1.3) | |
| Medion Erazer Scout E20 (1.3, Gaming Modus) | |
| Asus TUF Gaming A16 FA617 (1.3) | |
| Average NVIDIA GeForce RTX 4050 Laptop GPU (15.5 - 122.3, n=34) | |
| Medion Erazer Scout E20 (1.3, Lautlosmodus) | |
| Strange Brigade - 1920x1080 ultra AA:ultra AF:16 | |
| Average of class Gaming (14.6 - 421, n=222, last 2 years) | |
| MSI Katana 17 B13VFK (1.47.22.14 D3D12) | |
| Acer Nitro 5 AN515-46-R1A1 (1.47.22.14 D3D12) | |
| Lenovo Legion 5 15IAH7H 82RB (1.47.22.14 D3D12) | |
| Asus TUF Gaming A16 FA617 (1.47.22.14 D3D12) | |
| Medion Erazer Scout E20 (1.47.22.14 D3D12, Gaming Modus) | |
| Gigabyte G7 KE (1.47.22.14 D3D12) | |
| Medion Erazer Scout E20 (1.47.22.14 D3D12) | |
| Medion Erazer Scout E20 (1.47.22.14 D3D12, Lautlosmodus) | |
| Average NVIDIA GeForce RTX 4050 Laptop GPU (21.2 - 156.6, n=33) | |
| Dota 2 Reborn - 1920x1080 ultra (3/3) best looking | |
| MSI Katana 17 B13VFK | |
| Lenovo Legion 5 15IAH7H 82RB | |
| Medion Erazer Scout E20 (Gaming Modus) | |
| Average of class Gaming (26.9 - 220, n=234, last 2 years) | |
| Medion Erazer Scout E20 | |
| Gigabyte G7 KE | |
| Average NVIDIA GeForce RTX 4050 Laptop GPU (73.5 - 175.6, n=34) | |
| Asus TUF Gaming A16 FA617 | |
| Acer Nitro 5 AN515-46-R1A1 | |
| Medion Erazer Scout E20 (Lautlosmodus) | |
| X-Plane 11.11 - 1920x1080 high (fps_test=3) | |
| MSI Katana 17 B13VFK | |
| Medion Erazer Scout E20 (Gaming Modus) | |
| Lenovo Legion 5 15IAH7H 82RB | |
| Medion Erazer Scout E20 | |
| Average of class Gaming (12.4 - 166.2, n=239, last 2 years) | |
| Average NVIDIA GeForce RTX 4050 Laptop GPU (65 - 117, n=35) | |
| Gigabyte G7 KE | |
| Acer Nitro 5 AN515-46-R1A1 | |
| Medion Erazer Scout E20 (Lautlosmodus) | |
| Asus TUF Gaming A16 FA617 | |
In order to evaluate whether the frame rates remain to a large extent constant over a longer time period, we run the game "The Witcher 3" for about 60 minutes in Full-HD resolution and at maximum quality settings. The gaming character isn't moved during that time. Only when "Silent mode" is activated is there a decrease in the frame rates.
The Witcher 3 FPS Chart
| low | med. | high | ultra | |
| GTA V (2015) | 184.8 | 180.1 | 172.4 | 94.2 |
| The Witcher 3 (2015) | 382.6 | 265.3 | 150.9 | 83.4 |
| Dota 2 Reborn (2015) | 177.6 | 160.3 | 150.3 | 142.5 |
| Final Fantasy XV Benchmark (2018) | 187.5 | 116.9 | 82.6 | |
| X-Plane 11.11 (2018) | 153.9 | 132.7 | 104.4 | |
| Far Cry 5 (2018) | 172 | 136 | 126 | 119 |
| Strange Brigade (2018) | 447 | 206 | 166.5 | 144 |
| Gears Tactics (2020) | 341.6 | 204.1 | 133.9 | 96.7 |
| Death Stranding (2020) | 174.8 | 140.5 | 132 | 128.8 |
| Assassin´s Creed Valhalla (2020) | 184 | 117 | 92 | 70 |
| Immortals Fenyx Rising (2020) | 171 | 112 | 101 | 93 |
| Mass Effect Legendary Edition (2021) | 150.1 | 135.1 | ||
| Far Cry 6 (2021) | 153.2 | 125.3 | 107.3 | 76.7 |
| Back 4 Blood (2021) | 332 | 221 | 166.1 | 155.3 |
| Guardians of the Galaxy (2021) | 144 | 120 | 119 | 113 |
| Riders Republic (2021) | 164 | 131 | 107 | 96 |
| Halo Infinite (2021) | 122.8 | 104.6 | 85.9 | |
| Rainbow Six Extraction (2022) | 208 | 166 | 159 | 125 |
| GRID Legends (2022) | 206.2 | 171.4 | 140.9 | 109.8 |
| Elex 2 (2022) | 116.3 | 115.7 | 103.4 | 81.4 |
| F1 22 (2022) | 215 | 197.2 | 152.3 | 52.5 |
| Uncharted Legacy of Thieves Collection (2022) | 75.1 | 71.1 | 67.2 | 62.6 |
| Dead Island 2 (2023) | 196 | 171.7 | 133.1 | 120.6 |
| Star Wars Jedi Survivor (2023) | 99.2 | 86.3 | 62.9 | 49.4 |
Emissions - The Erazer Scout hardly heats up
Noise Levels
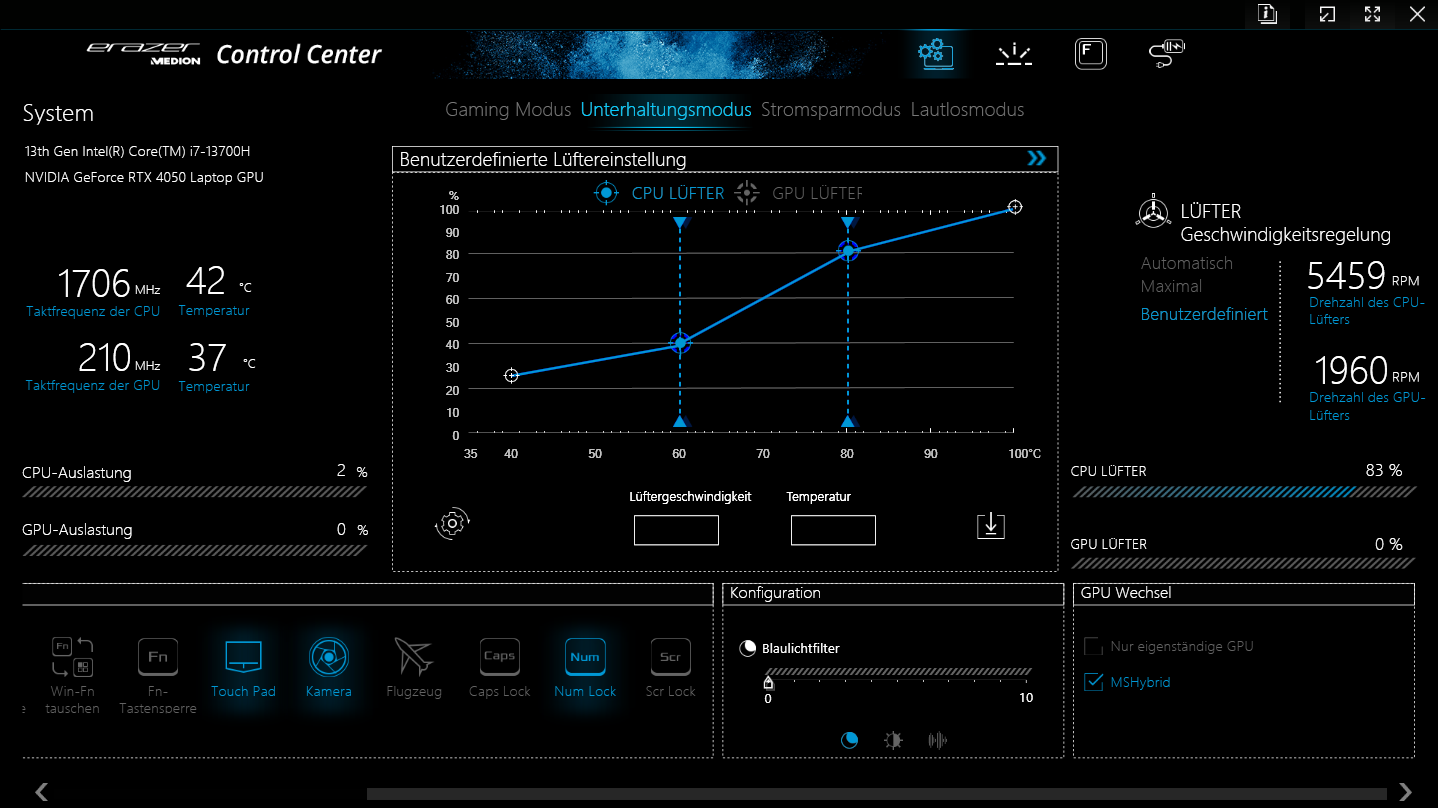
The performance profiles have a strong influence on the noise development of the laptop. While gaming, the "Gaming mode" will produce a noise level of about 57 dB(A), and when "Entertainment mode" is selected, the level is noticeably lower at 50 dB(A). In either case, the values are too high. The CPU und GPU should still be cooled sufficiently even with slower running fans, and Medion still has some work to do on updating the fan control.
The two other modes are considerably more user friendly, since they make the E20 run quieter. Even though "Silent mode" doesn't keep what the name promises, it still allows gaming at a low noise level. For example, the laptop runs through our The Witcher 3 test at about 34 dB(A).
During idle or everyday operation (Office, Internet), the laptop often runs quietly, and sometimes even silently. On the other hand, the fans occasionally also rev up unnecessarily (which is a typical phenomenon with Clevo barebones).
Noise Level
| Idle |
| 26 / 27 / 32 dB(A) |
| Load |
| 57 / 57 dB(A) |
 | ||
30 dB silent 40 dB(A) audible 50 dB(A) loud |
||
min: | ||
| Medion Erazer Scout E20 i7-13700H, NVIDIA GeForce RTX 4050 Laptop GPU | Gigabyte G7 KE i5-12500H, GeForce RTX 3060 Laptop GPU | MSI Katana 17 B13VFK i7-13620H, NVIDIA GeForce RTX 4060 Laptop GPU | Asus TUF Gaming A16 FA617 R7 7735HS, Radeon RX 7600S | Lenovo Legion 5 15IAH7H 82RB i7-12700H, GeForce RTX 3060 Laptop GPU | Acer Nitro 5 AN515-46-R1A1 R7 6800H, GeForce RTX 3070 Ti Laptop GPU | |
|---|---|---|---|---|---|---|
| Noise | -10% | -1% | 10% | 14% | -3% | |
| off / environment * | 25 | 27 -8% | 24.5 2% | 24 4% | 23.3 7% | 25 -0% |
| Idle Minimum * | 26 | 27 -4% | 24.5 6% | 24 8% | 23.5 10% | 25 4% |
| Idle Average * | 27 | 35 -30% | 24.5 9% | 25 7% | 23.5 13% | 28.6 -6% |
| Idle Maximum * | 32 | 38 -19% | 40 -25% | 28 12% | 26.8 16% | 44.3 -38% |
| Load Average * | 57 | 52 9% | 48.3 15% | 42 26% | 29.3 49% | 47.6 16% |
| Witcher 3 ultra * | 50 | 56 -12% | 56 -12% | 50 -0% | 51.4 -3% | |
| Load Maximum * | 57 | 59 -4% | 59.1 -4% | 50 12% | 53 7% | 53.6 6% |
* ... smaller is better
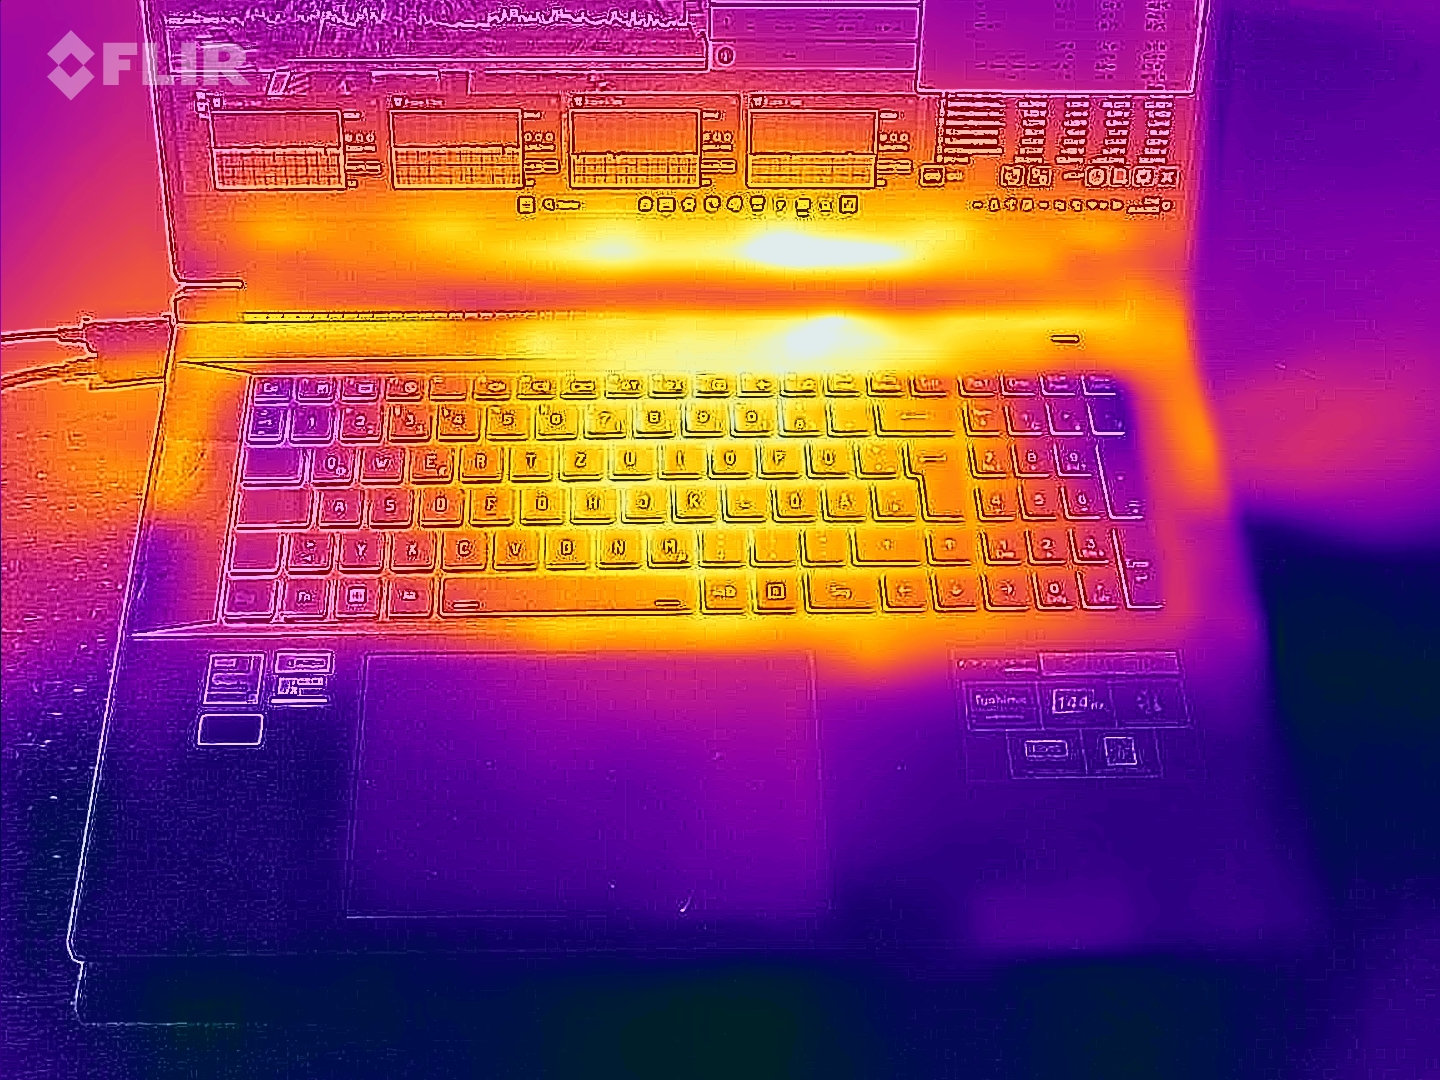
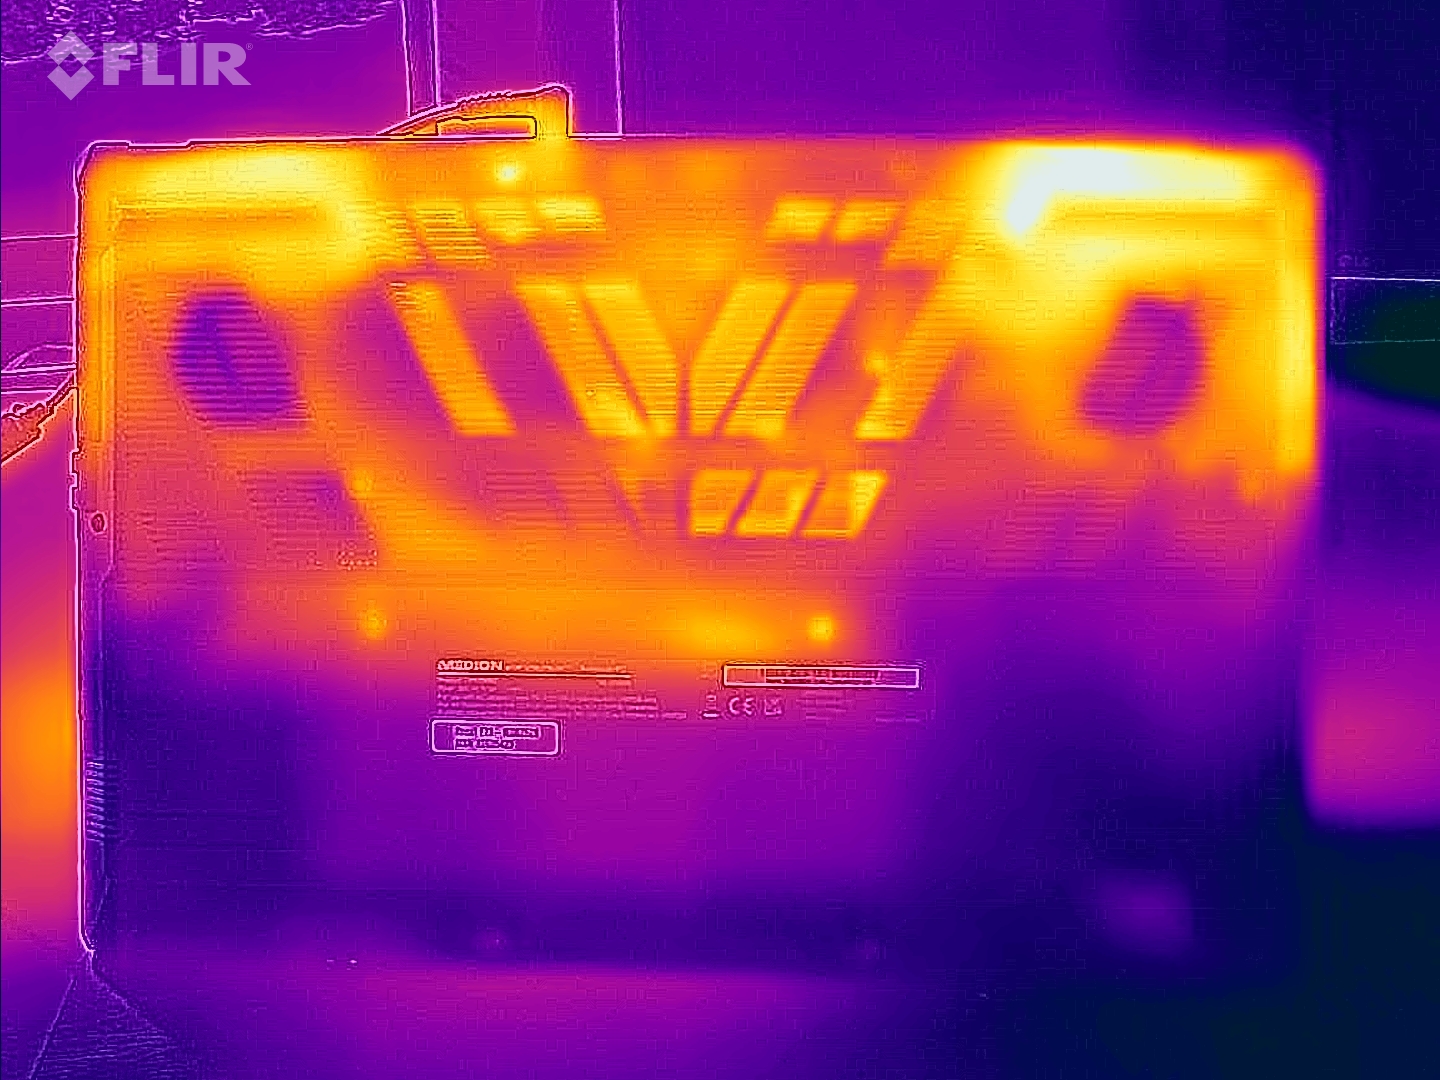
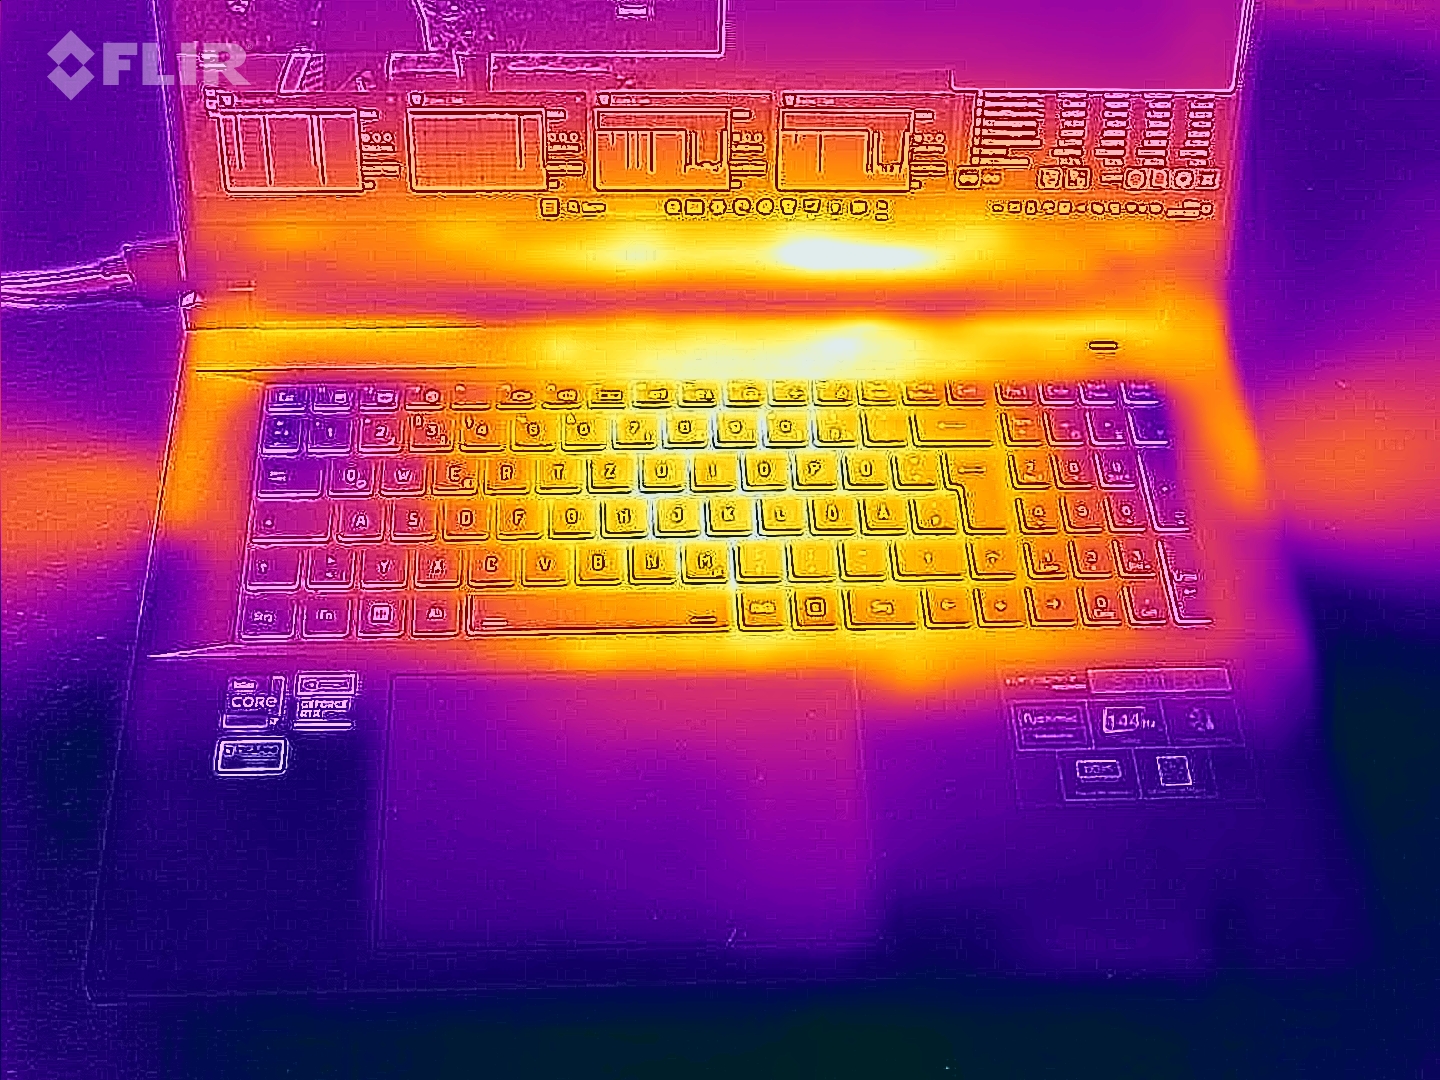
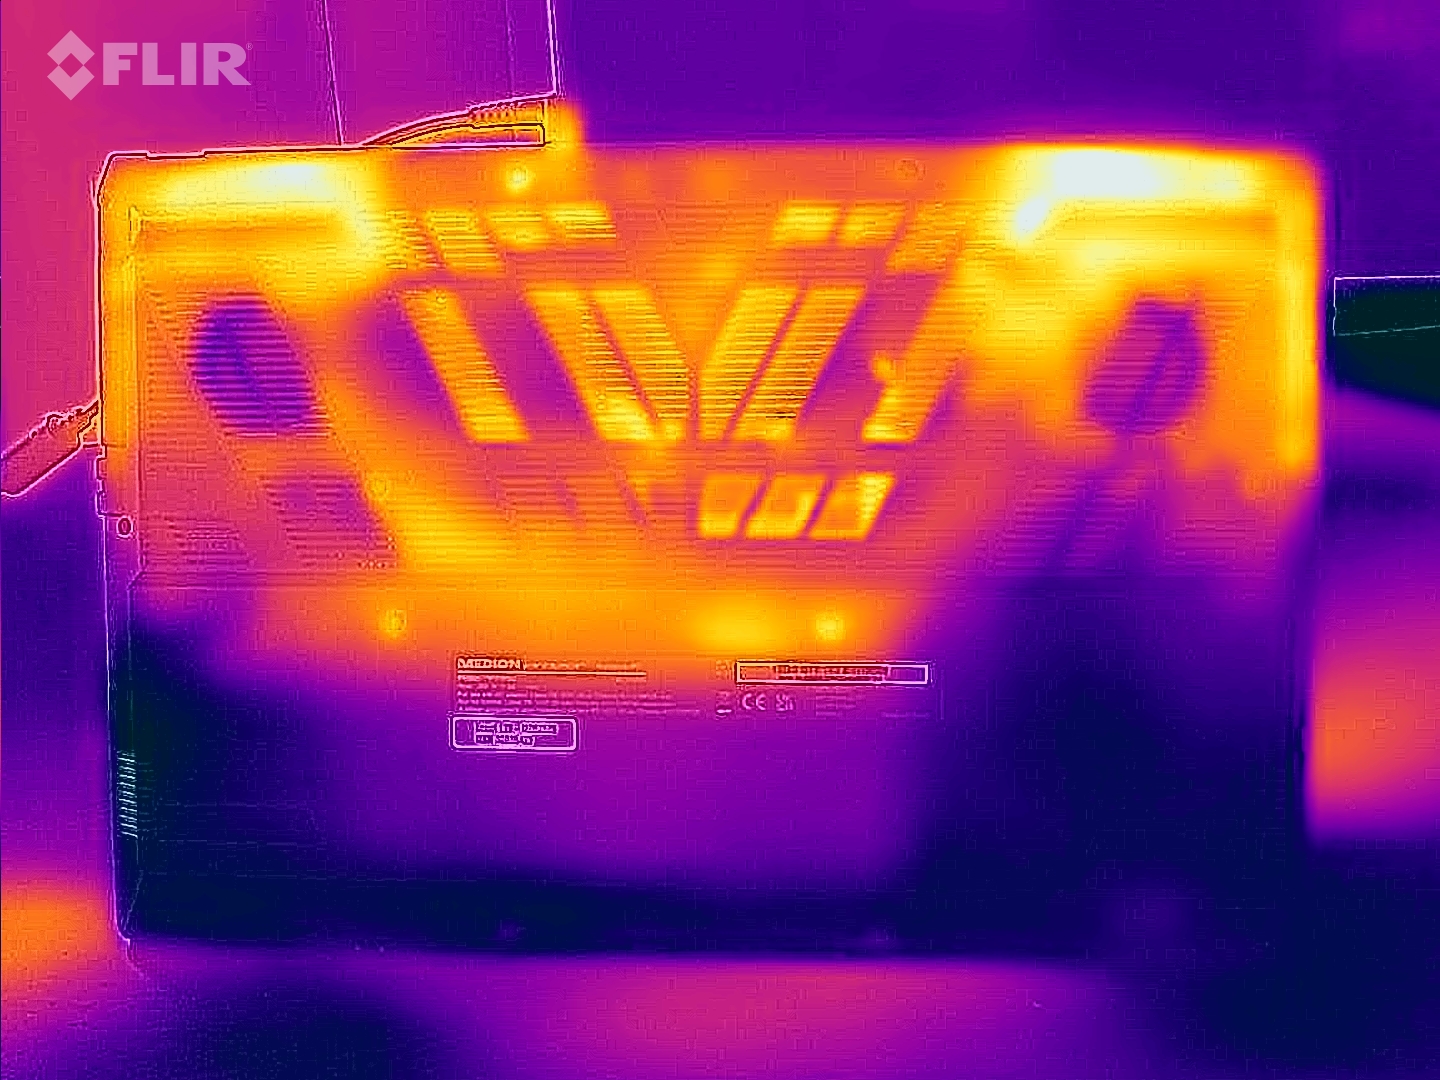
Temperatures
The laptop heats up moderately at most. The highest temperature is reached during the stress test, with 41 °C (106 °F) at a single measurement point. In everyday operation, the temperatures remain within the green range.
(±) The maximum temperature on the upper side is 41 °C / 106 F, compared to the average of 40.4 °C / 105 F, ranging from 21.2 to 68.8 °C for the class Gaming.
(+) The bottom heats up to a maximum of 39 °C / 102 F, compared to the average of 43.2 °C / 110 F
(+) In idle usage, the average temperature for the upper side is 26.8 °C / 80 F, compared to the device average of 33.8 °C / 93 F.
(±) Playing The Witcher 3, the average temperature for the upper side is 34.1 °C / 93 F, compared to the device average of 33.8 °C / 93 F.
(+) The palmrests and touchpad are cooler than skin temperature with a maximum of 26 °C / 78.8 F and are therefore cool to the touch.
(+) The average temperature of the palmrest area of similar devices was 28.9 °C / 84 F (+2.9 °C / 5.2 F).
| Medion Erazer Scout E20 Intel Core i7-13700H, NVIDIA GeForce RTX 4050 Laptop GPU | Gigabyte G7 KE Intel Core i5-12500H, NVIDIA GeForce RTX 3060 Laptop GPU | MSI Katana 17 B13VFK Intel Core i7-13620H, NVIDIA GeForce RTX 4060 Laptop GPU | Asus TUF Gaming A16 FA617 AMD Ryzen 7 7735HS, AMD Radeon RX 7600S | Lenovo Legion 5 15IAH7H 82RB Intel Core i7-12700H, NVIDIA GeForce RTX 3060 Laptop GPU | Acer Nitro 5 AN515-46-R1A1 AMD Ryzen 7 6800H, NVIDIA GeForce RTX 3070 Ti Laptop GPU | |
|---|---|---|---|---|---|---|
| Heat | -16% | -10% | -30% | -1% | -13% | |
| Maximum Upper Side * | 41 | 52 -27% | 41.6 -1% | 54 -32% | 37.8 8% | 48.1 -17% |
| Maximum Bottom * | 39 | 54 -38% | 43.1 -11% | 47 -21% | 51 -31% | 49.7 -27% |
| Idle Upper Side * | 31 | 28 10% | 32 -3% | 40 -29% | 25.8 17% | 30 3% |
| Idle Bottom * | 29 | 32 -10% | 35.8 -23% | 40 -38% | 28.8 1% | 31.7 -9% |
* ... smaller is better
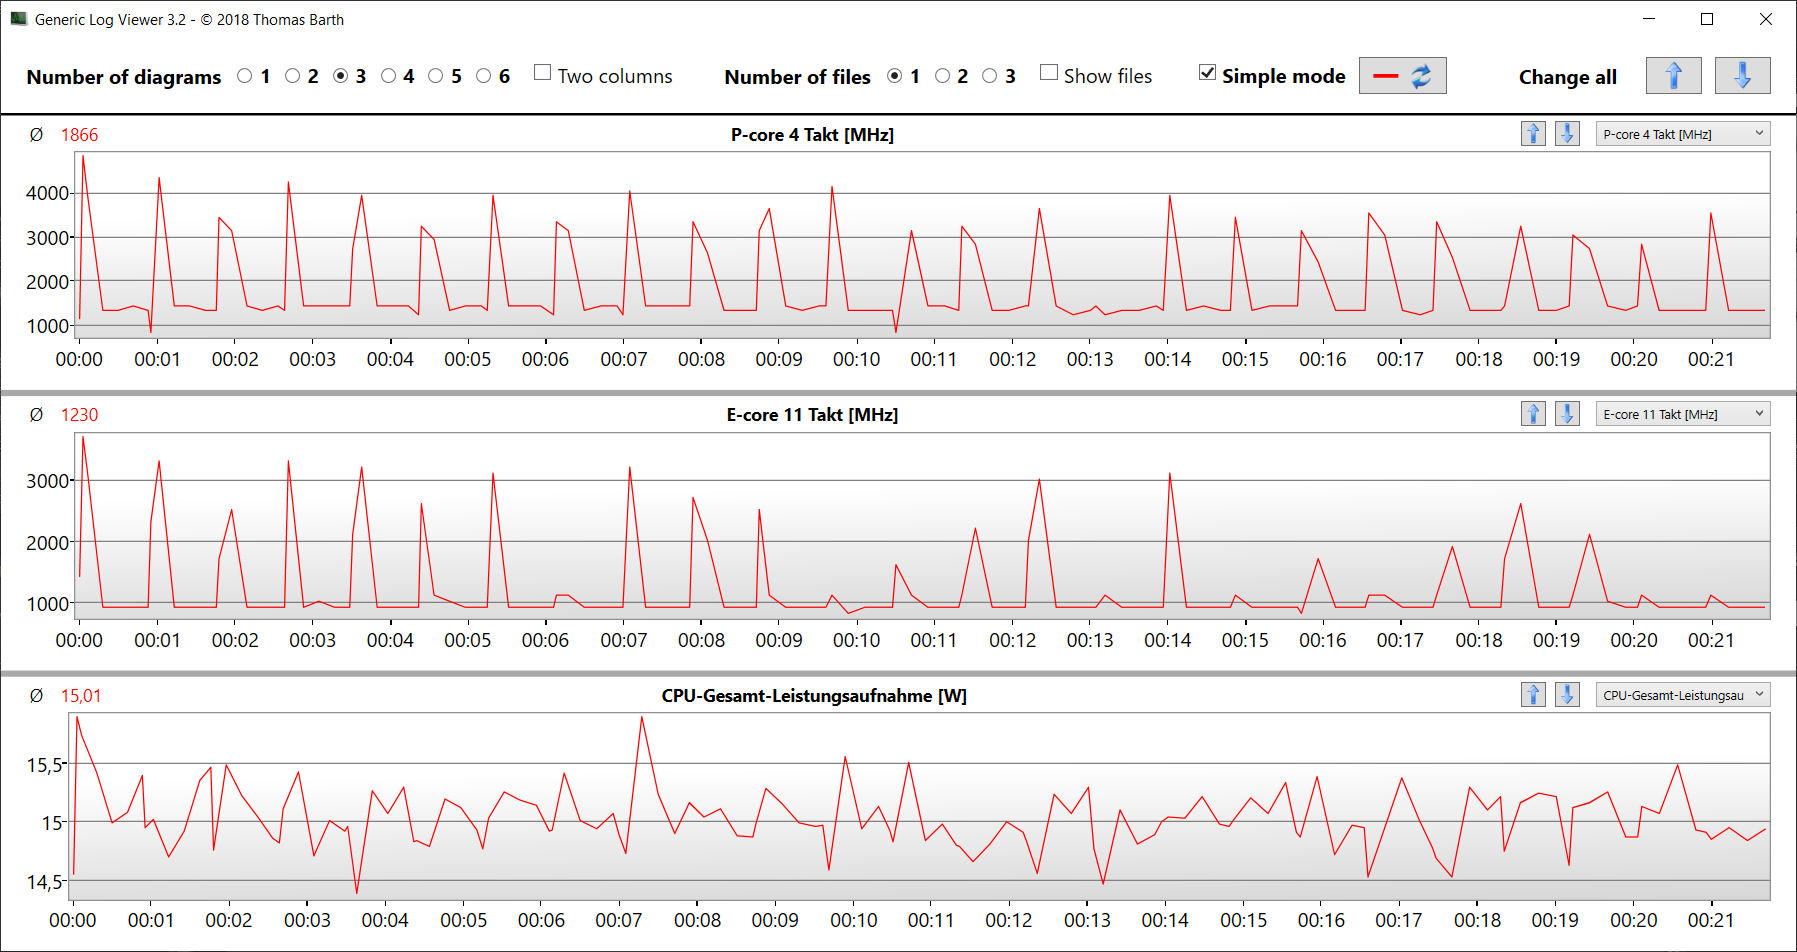
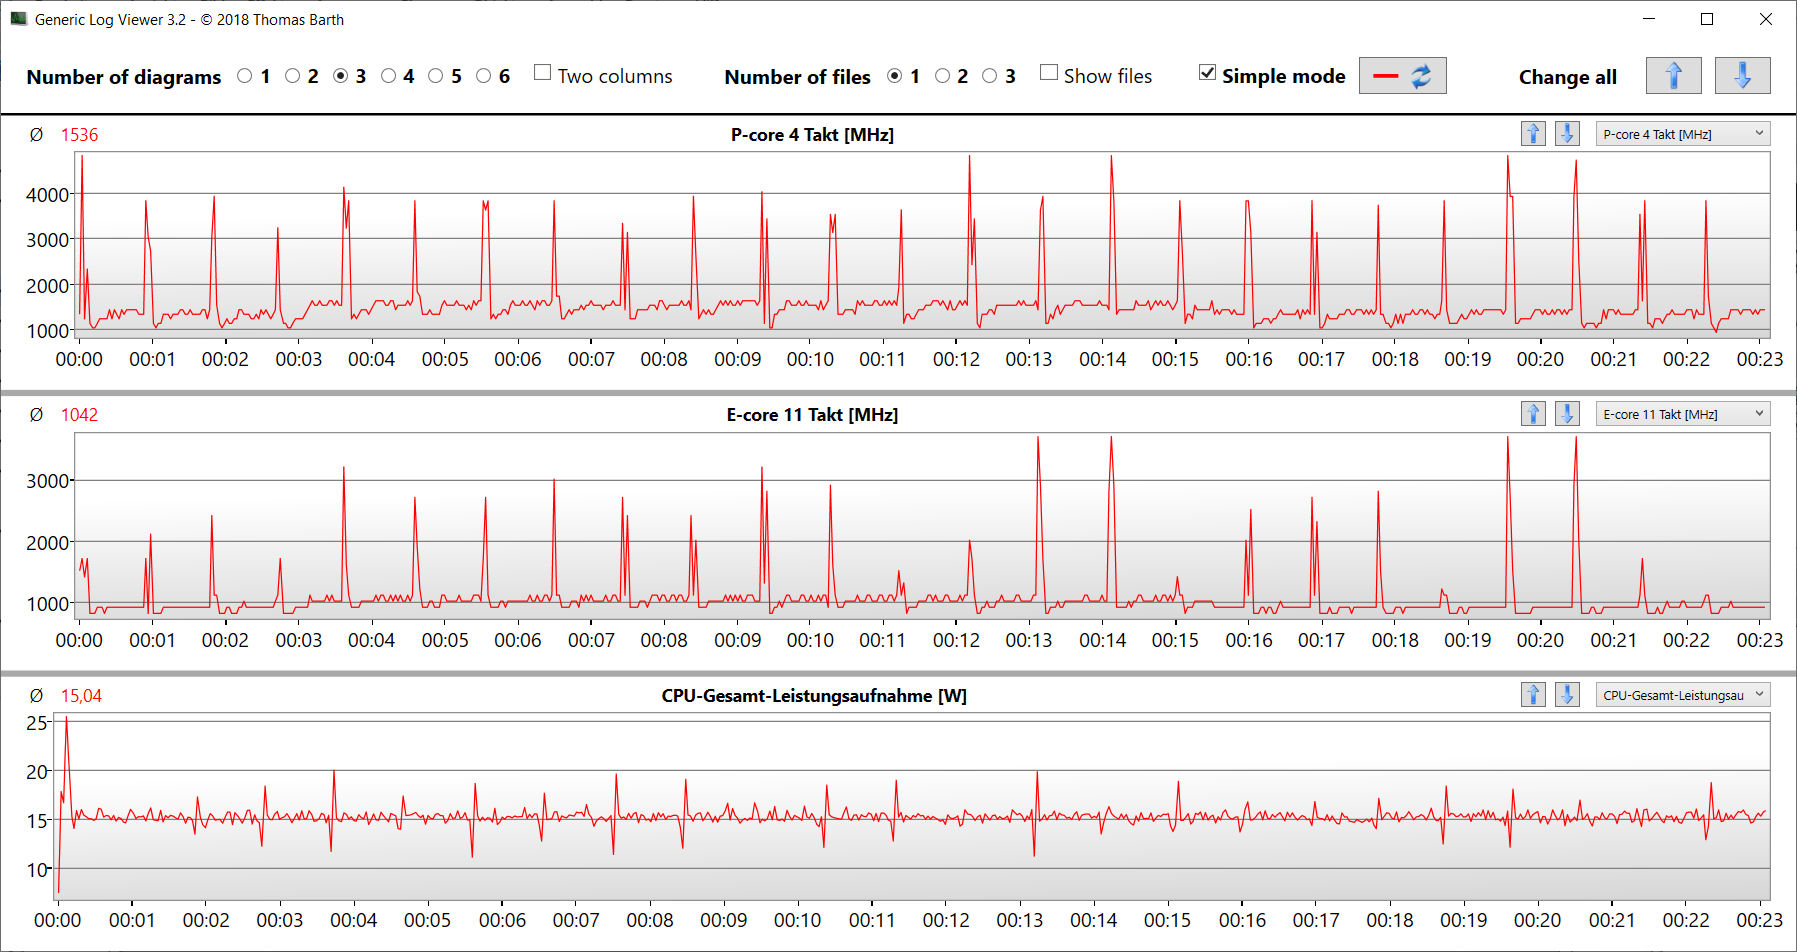
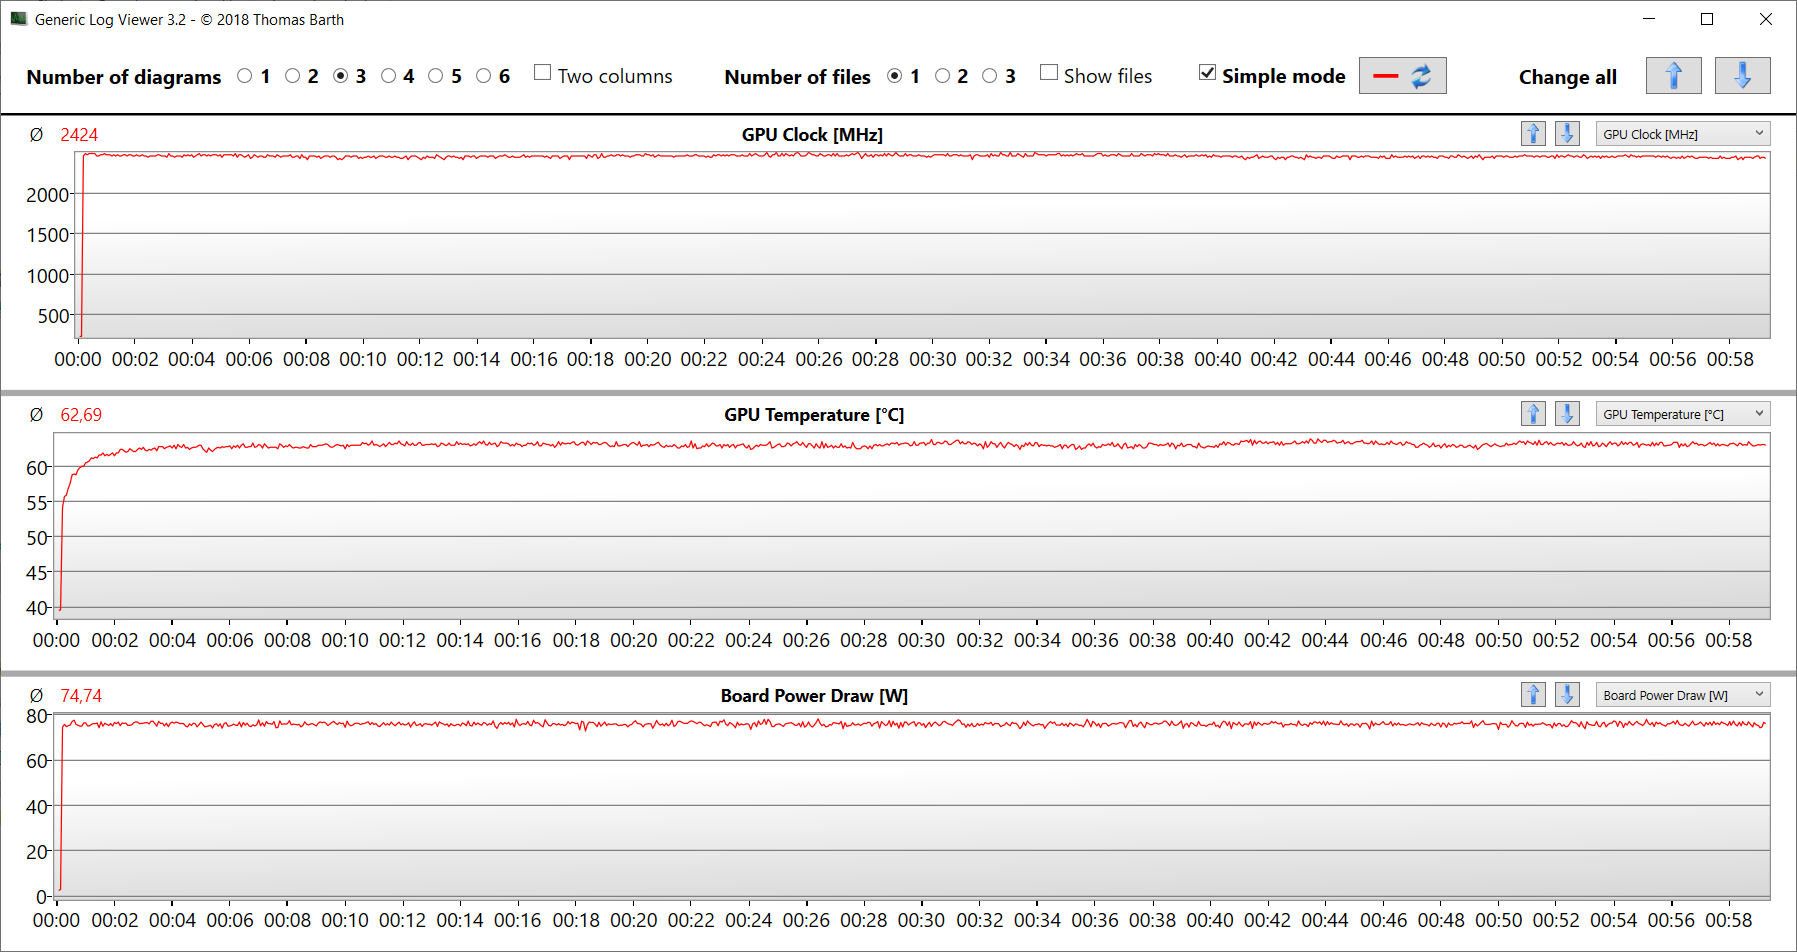
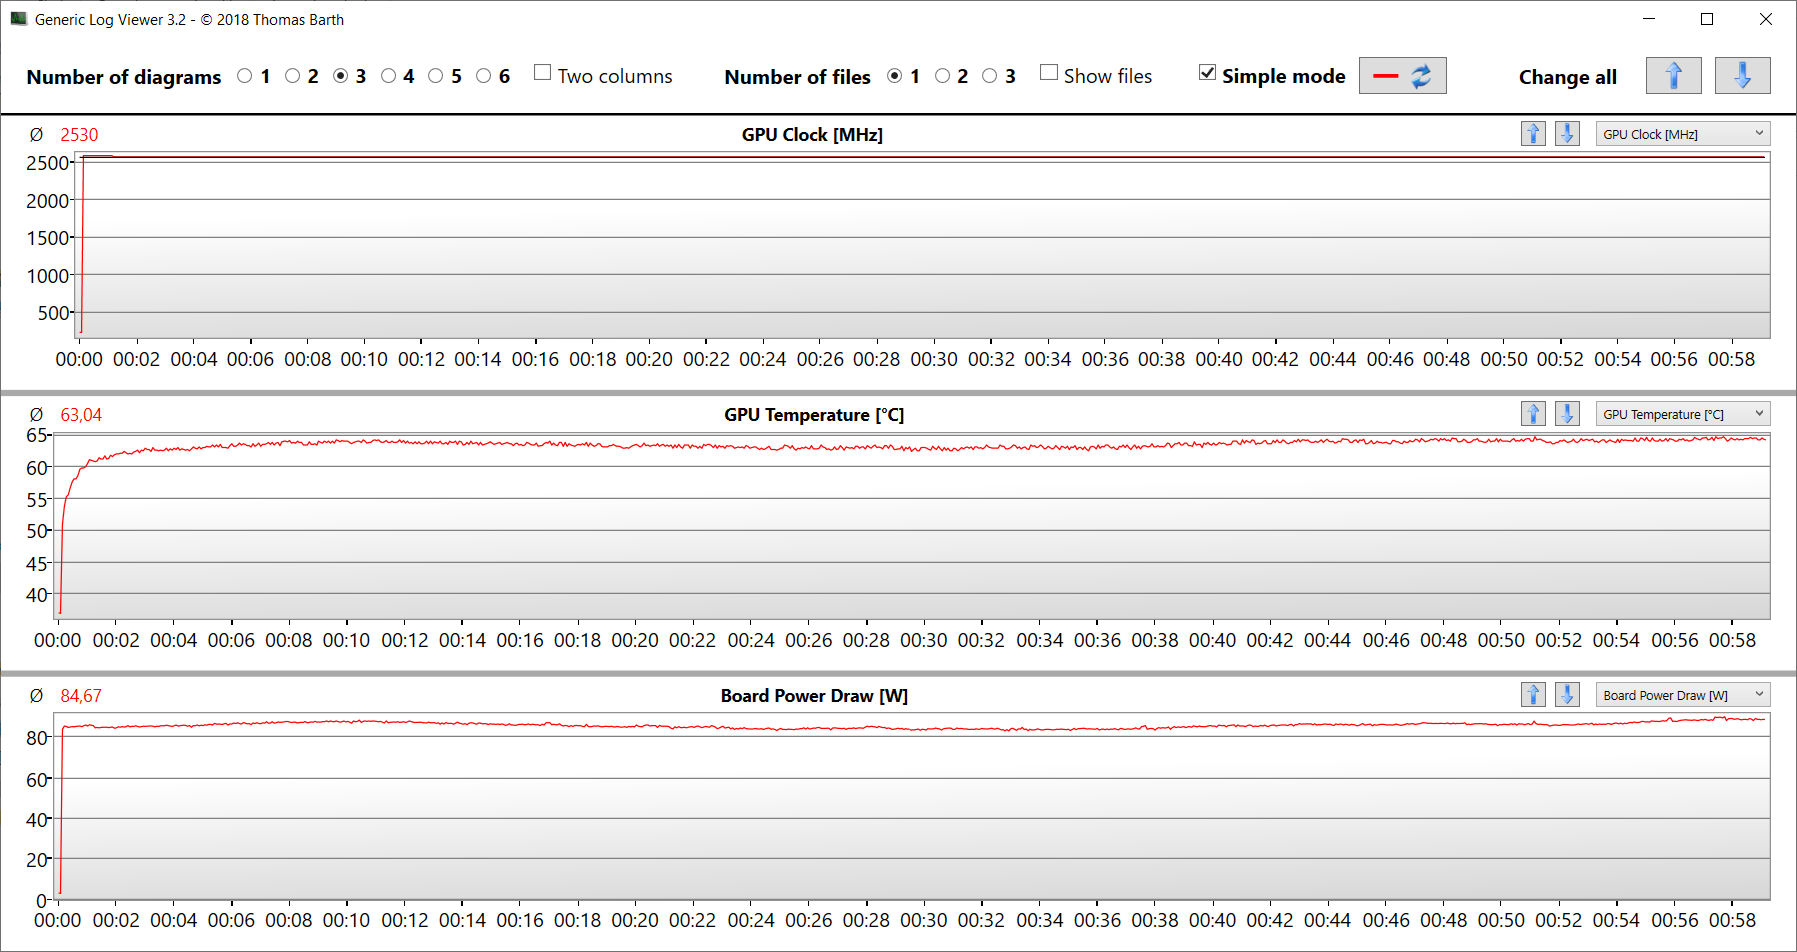
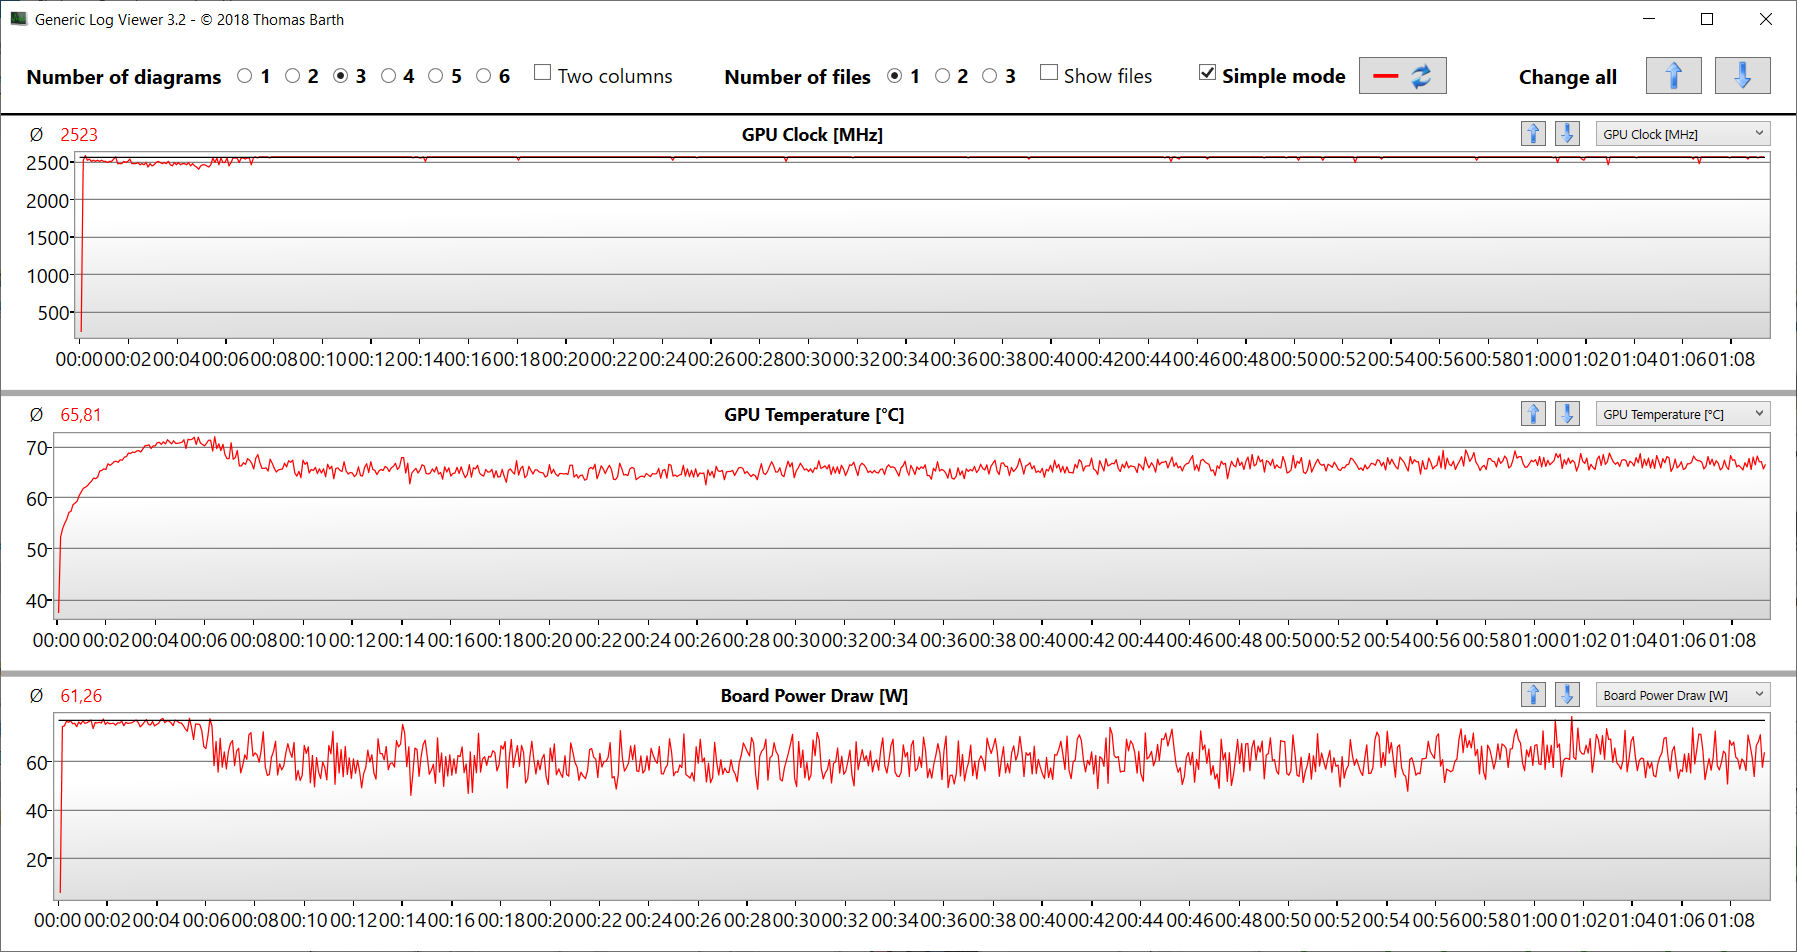
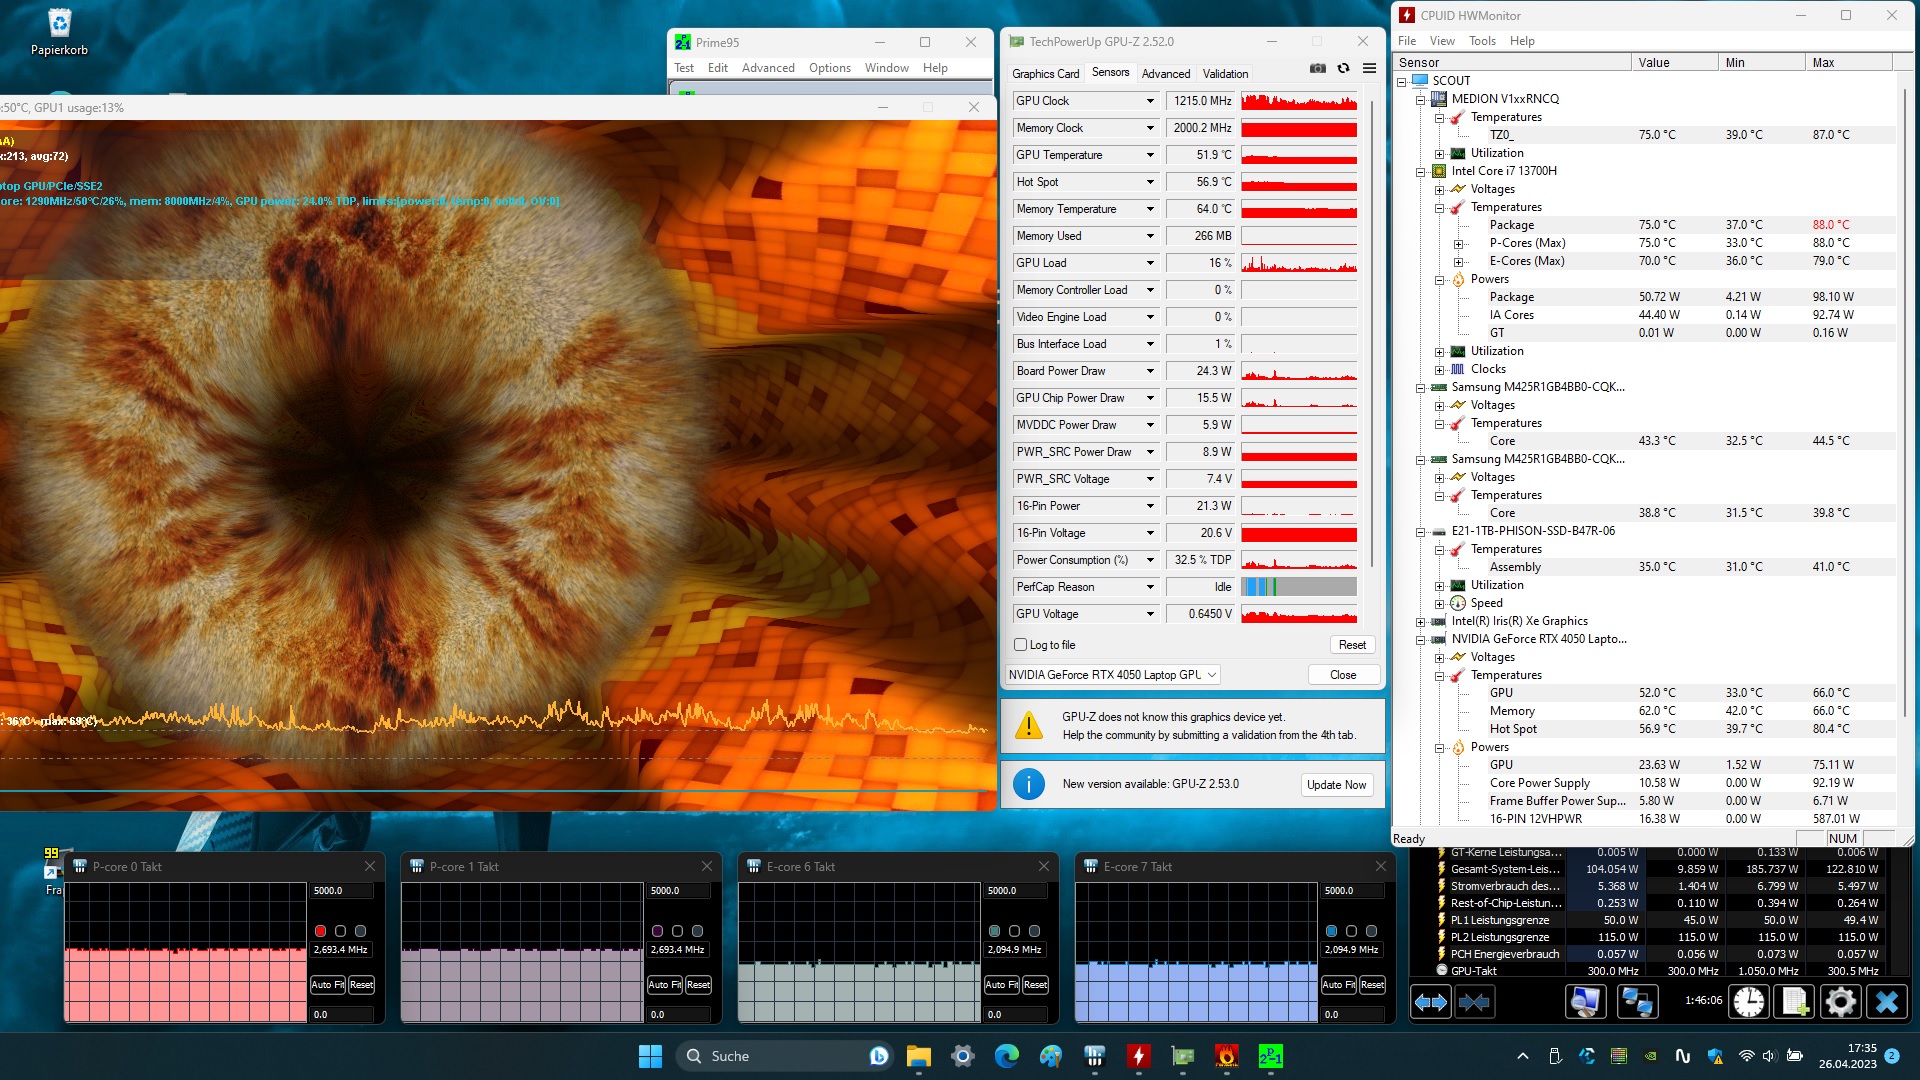
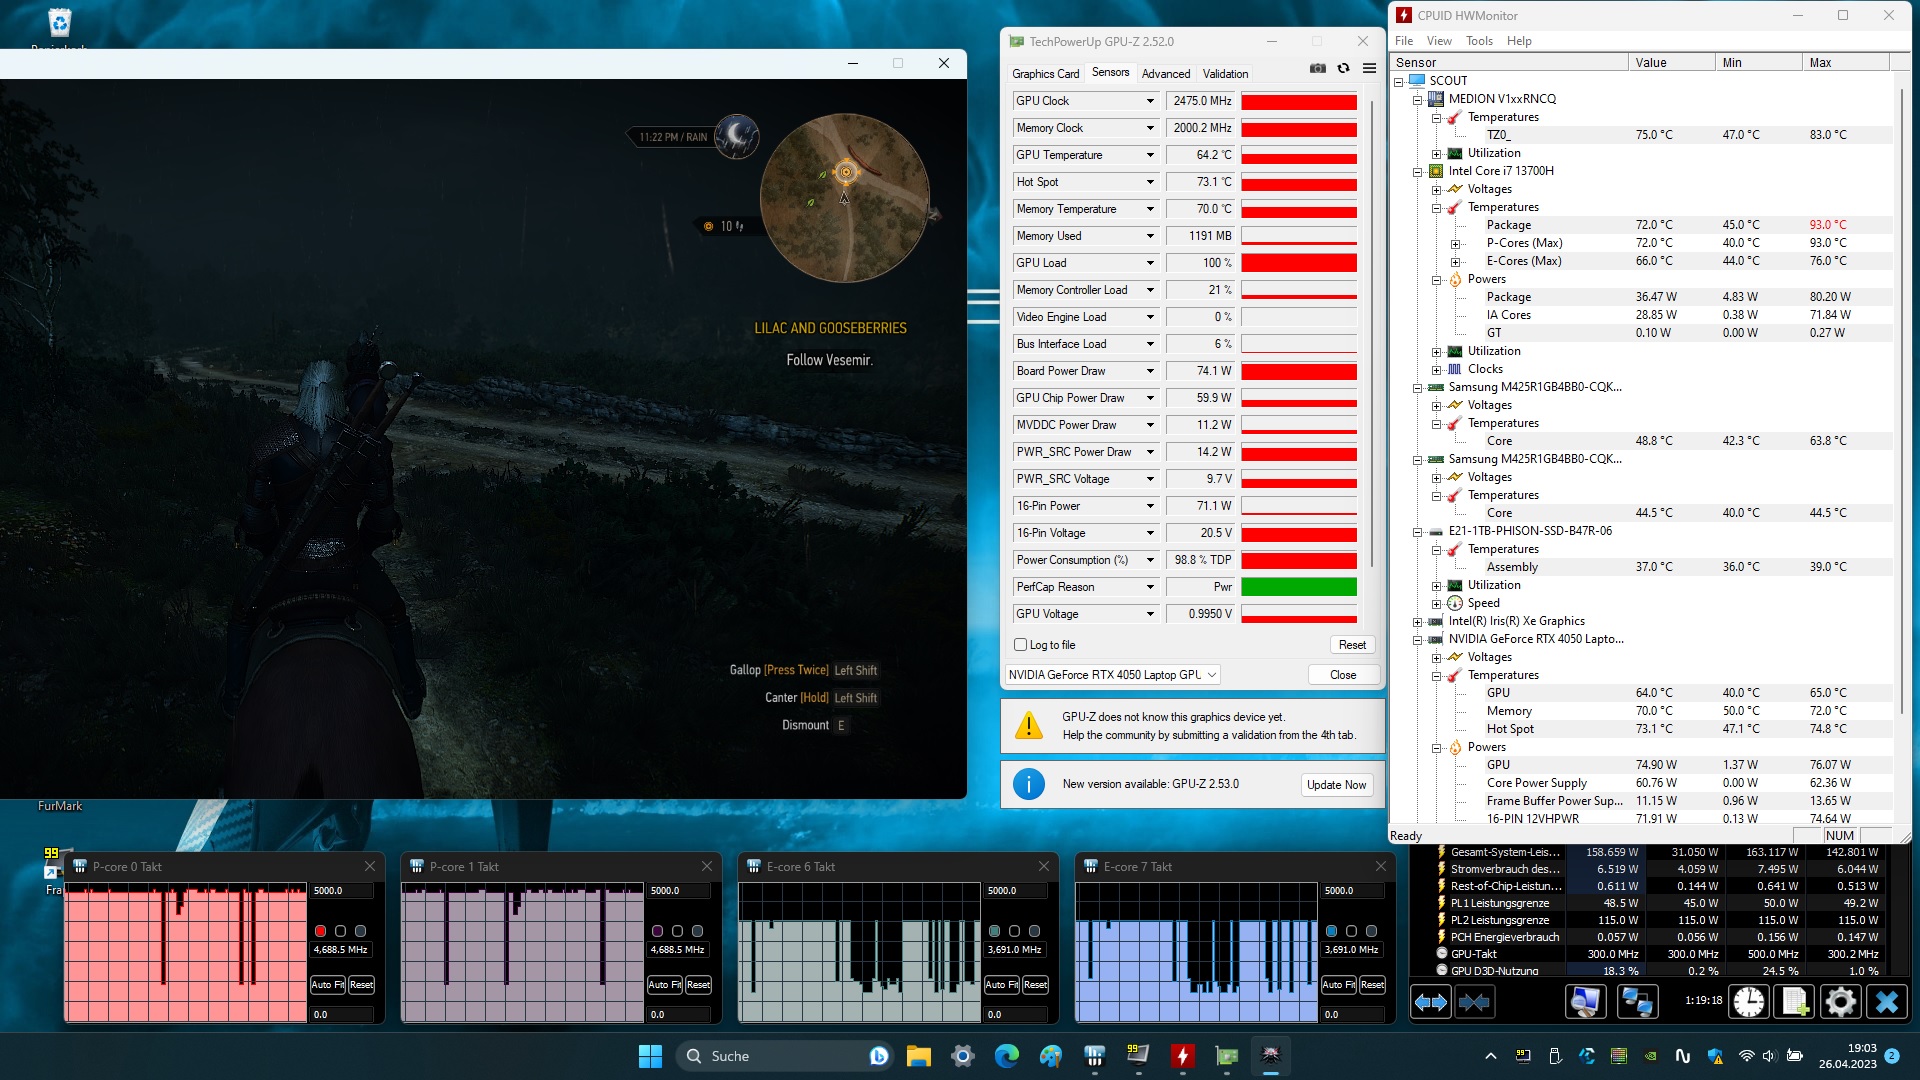
Stress Test
The stress test (with Prime95 and Furmark running constantly) represents an extreme scenario that we use to evaluate the system stability under full load. The CPU begins the test with medium-high clock speeds (P: 3.4 to 3.7 GHz, E: 2.8 to 2.9 GHz), and the GPU runs at 2.3 GHz. Continuing the test, the clock speeds of the CPU and GPU decrease.
Speakers
The stereo speakers produce a meager sound that also offers hardly any bass. For a better listening experience, we recommend using headphones or external speakers.
Medion Erazer Scout E20 audio analysis
(+) | speakers can play relatively loud (84 dB)
Bass 100 - 315 Hz
(-) | nearly no bass - on average 33.1% lower than median
(±) | linearity of bass is average (9.9% delta to prev. frequency)
Mids 400 - 2000 Hz
(±) | higher mids - on average 6.6% higher than median
(±) | linearity of mids is average (8.2% delta to prev. frequency)
Highs 2 - 16 kHz
(+) | balanced highs - only 2.1% away from median
(±) | linearity of highs is average (7.5% delta to prev. frequency)
Overall 100 - 16.000 Hz
(±) | linearity of overall sound is average (22.2% difference to median)
Compared to same class
» 77% of all tested devices in this class were better, 7% similar, 17% worse
» The best had a delta of 6%, average was 18%, worst was 132%
Compared to all devices tested
» 59% of all tested devices were better, 7% similar, 34% worse
» The best had a delta of 4%, average was 25%, worst was 134%
MSI Katana 17 B13VFK audio analysis
(±) | speaker loudness is average but good (78.5 dB)
Bass 100 - 315 Hz
(-) | nearly no bass - on average 17.7% lower than median
(±) | linearity of bass is average (11.7% delta to prev. frequency)
Mids 400 - 2000 Hz
(±) | higher mids - on average 6.8% higher than median
(+) | mids are linear (6.7% delta to prev. frequency)
Highs 2 - 16 kHz
(+) | balanced highs - only 3.2% away from median
(±) | linearity of highs is average (7.2% delta to prev. frequency)
Overall 100 - 16.000 Hz
(±) | linearity of overall sound is average (19.4% difference to median)
Compared to same class
» 64% of all tested devices in this class were better, 8% similar, 29% worse
» The best had a delta of 6%, average was 18%, worst was 132%
Compared to all devices tested
» 42% of all tested devices were better, 8% similar, 50% worse
» The best had a delta of 4%, average was 25%, worst was 134%
Power Management - The Medion laptop offers only a meager battery life
Power Consumption
The power consumption of the Medion laptop doesn't show any conspicuous behavior, and the values range at normal levels for the hardware used. The laptop runs through our The Witcher 3 test and stress test with a constant power consumption. The 230-Watt power supply provides a sufficient amount of power at all times.
| Off / Standby | |
| Idle | |
| Load |
|
| Medion Erazer Scout E20 i7-13700H, NVIDIA GeForce RTX 4050 Laptop GPU | Gigabyte G7 KE i5-12500H, GeForce RTX 3060 Laptop GPU | MSI Katana 17 B13VFK i7-13620H, NVIDIA GeForce RTX 4060 Laptop GPU | Asus TUF Gaming A16 FA617 R7 7735HS, Radeon RX 7600S | Lenovo Legion 5 15IAH7H 82RB i7-12700H, GeForce RTX 3060 Laptop GPU | Acer Nitro 5 AN515-46-R1A1 R7 6800H, GeForce RTX 3070 Ti Laptop GPU | Average NVIDIA GeForce RTX 4050 Laptop GPU | Average of class Gaming | |
|---|---|---|---|---|---|---|---|---|
| Power Consumption | -51% | -25% | -5% | -104% | -25% | -20% | -63% | |
| Idle Minimum * | 5 | 15 -200% | 12.2 -144% | 8 -60% | 19.8 -296% | 7 -40% | 9.98 ? -100% | 13.9 ? -178% |
| Idle Average * | 11 | 17 -55% | 14.9 -35% | 11 -0% | 26.2 -138% | 8.9 19% | 15 ? -36% | 19.1 ? -74% |
| Idle Maximum * | 22 | 24 -9% | 15.8 28% | 16 27% | 48.2 -119% | 14.4 35% | 18.9 ? 14% | 26.9 ? -22% |
| Load Average * | 96 | 111 -16% | 85.22 11% | 97 -1% | 102.9 -7% | 202 -110% | 87.5 ? 9% | 111.5 ? -16% |
| Witcher 3 ultra * | 145.2 | 174.1 -20% | 151.1 -4% | 161.5 -11% | 186.7 -29% | 203 -40% | ||
| Load Maximum * | 201 | 208 -3% | 212.8 -6% | 168 16% | 268 -33% | 230 -14% | 179.8 ? 11% | 251 ? -25% |
* ... smaller is better
Power Consumption The Witcher 3 / Stress Test
Power Consumption With External Monitor
Battery Life
In our WLAN test calling up web sites via script and video test playing the short film Big Buck Bunny (H.264 coding, FHD) in a loop, the 17.3-inch laptop achieves runtimes of 4:44 h and 4:37 h respectively. During both tests, the power saving functions of the laptop are deactivated, and the display brightness is adjusted to about 150 cd/m². In addition, the communication modules are also turned off while running the video test.
| Medion Erazer Scout E20 i7-13700H, NVIDIA GeForce RTX 4050 Laptop GPU, 53.35 Wh | Gigabyte G7 KE i5-12500H, GeForce RTX 3060 Laptop GPU, 54 Wh | MSI Katana 17 B13VFK i7-13620H, NVIDIA GeForce RTX 4060 Laptop GPU, 53.5 Wh | Asus TUF Gaming A16 FA617 R7 7735HS, Radeon RX 7600S, 90 Wh | Lenovo Legion 5 15IAH7H 82RB i7-12700H, GeForce RTX 3060 Laptop GPU, 80 Wh | Acer Nitro 5 AN515-46-R1A1 R7 6800H, GeForce RTX 3070 Ti Laptop GPU, 57.5 Wh | Average of class Gaming | |
|---|---|---|---|---|---|---|---|
| Battery Runtime | -12% | -37% | 120% | -0% | 22% | 26% | |
| Reader / Idle | 399 | 425 7% | 1212 204% | 483 21% | 632 58% | 541 ? 36% | |
| H.264 | 277 | 132 -52% | 343 24% | 397 ? 43% | |||
| WiFi v1.3 | 284 | 317 12% | 176 -38% | 724 155% | 302 6% | 349 23% | 366 ? 29% |
| Load | 89 | 76 -15% | 58 -35% | 90 1% | 64 -28% | 75 -16% | 83.9 ? -6% |
Pros
Cons
Verdict - A well-rounded gaming laptop from the entry-level segment
While the Erazer Scout E20 is focused on FHD gaming, the laptop also strikes a good figure in other areas such as rendering and video processing. The Core i7-13700H and GeForce RTX 4050 are able to run at high clock speeds, and a 1-TB SSD ensures short load times and provides the necessary storage space.
With the Erazer Scout E20, Medion delivers a consistent gaming laptop from the entry-level segment. The fan control could still use some adjustment.
Although the laptop heats up only moderately under load, it can then produce a lot of noise. Fortunately, there is a "Silent mode" that enables gaming at a low noise level - but not silence.
A realistic battery life of barely 4.5 to 5 hours doesn't inspire any enthusiasm, and the relatively low battery capacity of 53.35 Wh becomes noticeable here. Since the battery cannot be charged with a USB-C charger, you'd always have to bring the power supply. The matte 17.3-inch display (FHD, IPS, 144 Hz, sRGB) left a good impression overall.
An alternative to the E20 could be the Asus TUF Gaming A16 Advantage Edition. While the performance ranges at a similar level, it can score with a significantly longer battery life and a display in the 16:10 format. A budget alternative would be the Gigabyte G7 KE, which has a comparable graphics performance but a purchase price that is about 450 Euros (~$498) lower. However, a Windows operating system is not included.
Price and Availability
In Germany, the Medion Erazer Scout E20 is available from the Medion online shop for almost 1,500 Euros (~$1,658). It is based on the Clevo V170RNCQ, which is available from Clevo for 1399 Euros (~$1,547). Clevo also offers different configuration options.
Medion Erazer Scout E20
-
05/16/2023 v7
Sascha Mölck
More articles related to this device
Medion Erazer Scout E20 (Erazer Scout E Series)Related Articles


Transparency
The present review sample was made available to the author as a loan by the manufacturer or a shop for the purposes of review. The lender had no influence on this review, nor did the manufacturer receive a copy of this review before publication. There was no obligation to publish this review.
Pricecompare

