

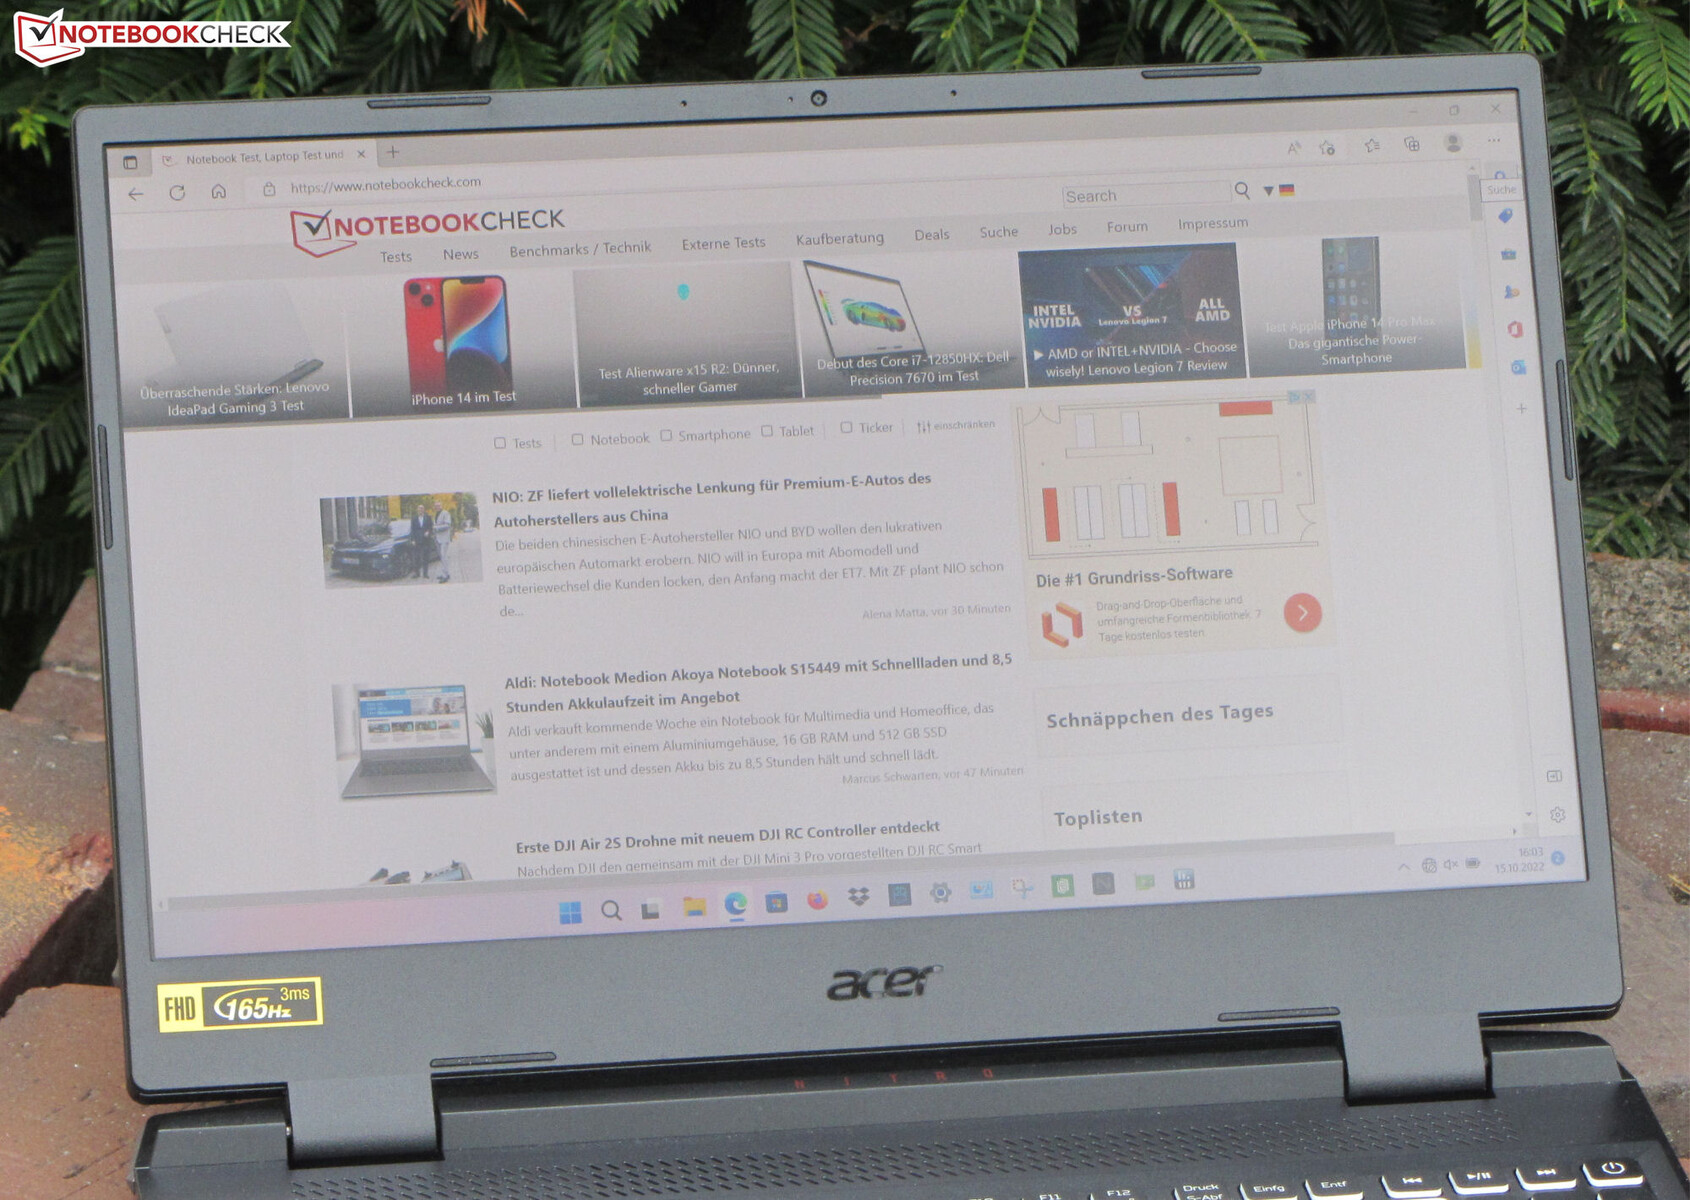
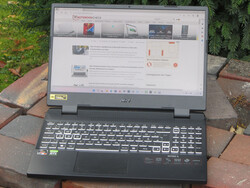
Acer Nitro 5 AN515-46 review: powerful FHD gaming with USB 4
Acer's Nitro 5 series consists of entry-level and mid-range gaming devices. The laptops are positioned below the Predator series, with prices reaching up to 2,500 euros. Today's test unit is available starting from 1,750 euros. Acer has combined an energy-efficient Ryzen 7-6800H APU with a GeForce RTX 3070-Ti GPU (TGP of 150 watts) for this model. In theory, this could make for a powerful notebook that has low emissions and a long battery life. The device's competitors include the Schenker XMG Fusion 15 (Mid 22), the MSI Katana GF66 12UGS, and the Asus TUF Dash F15 FX517ZR.
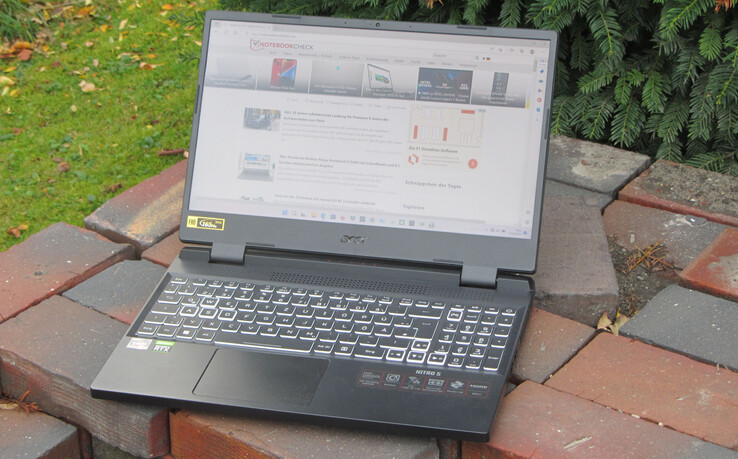
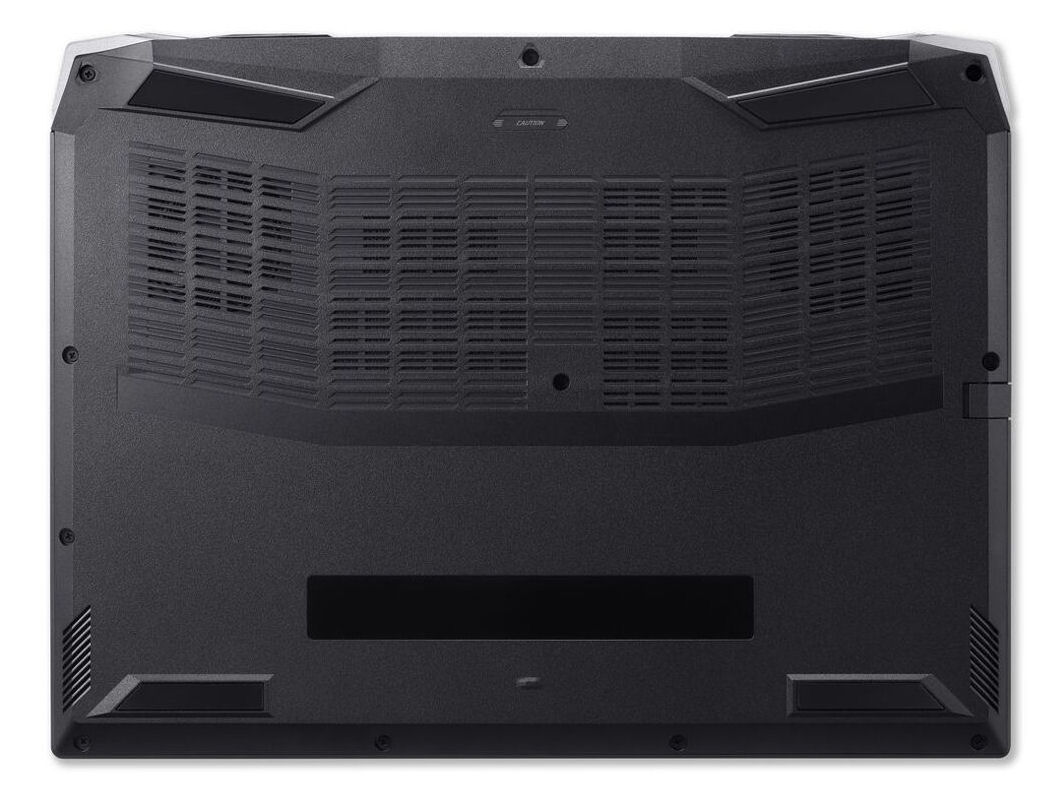
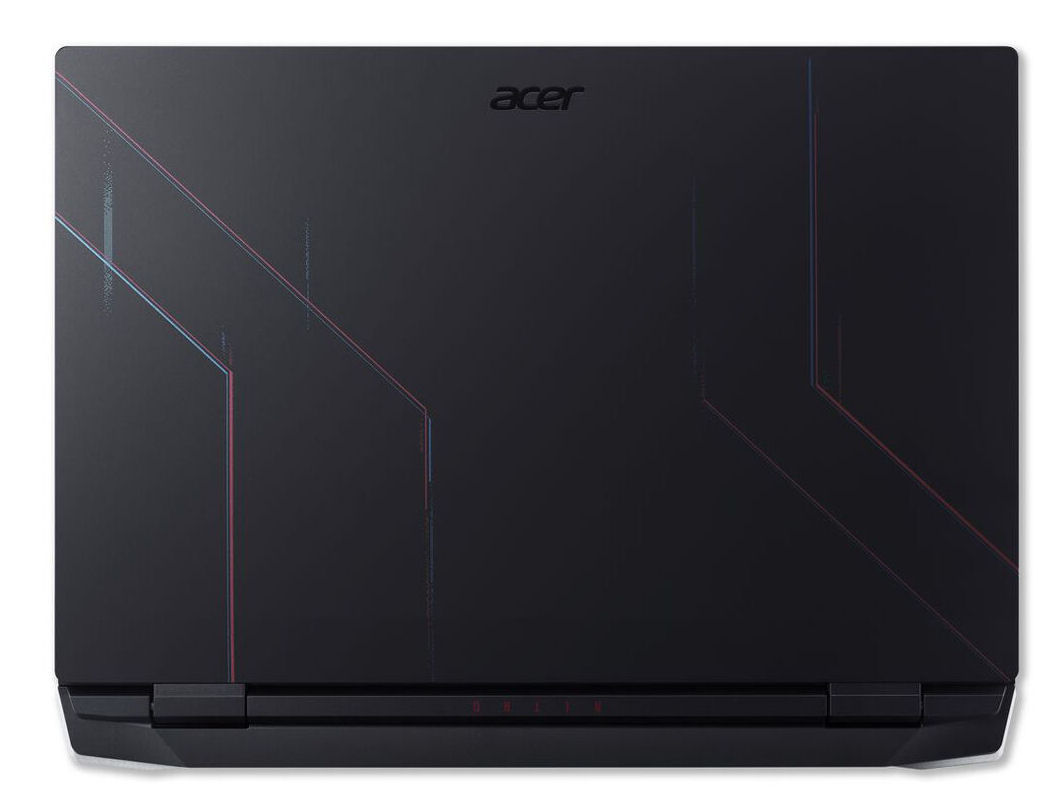
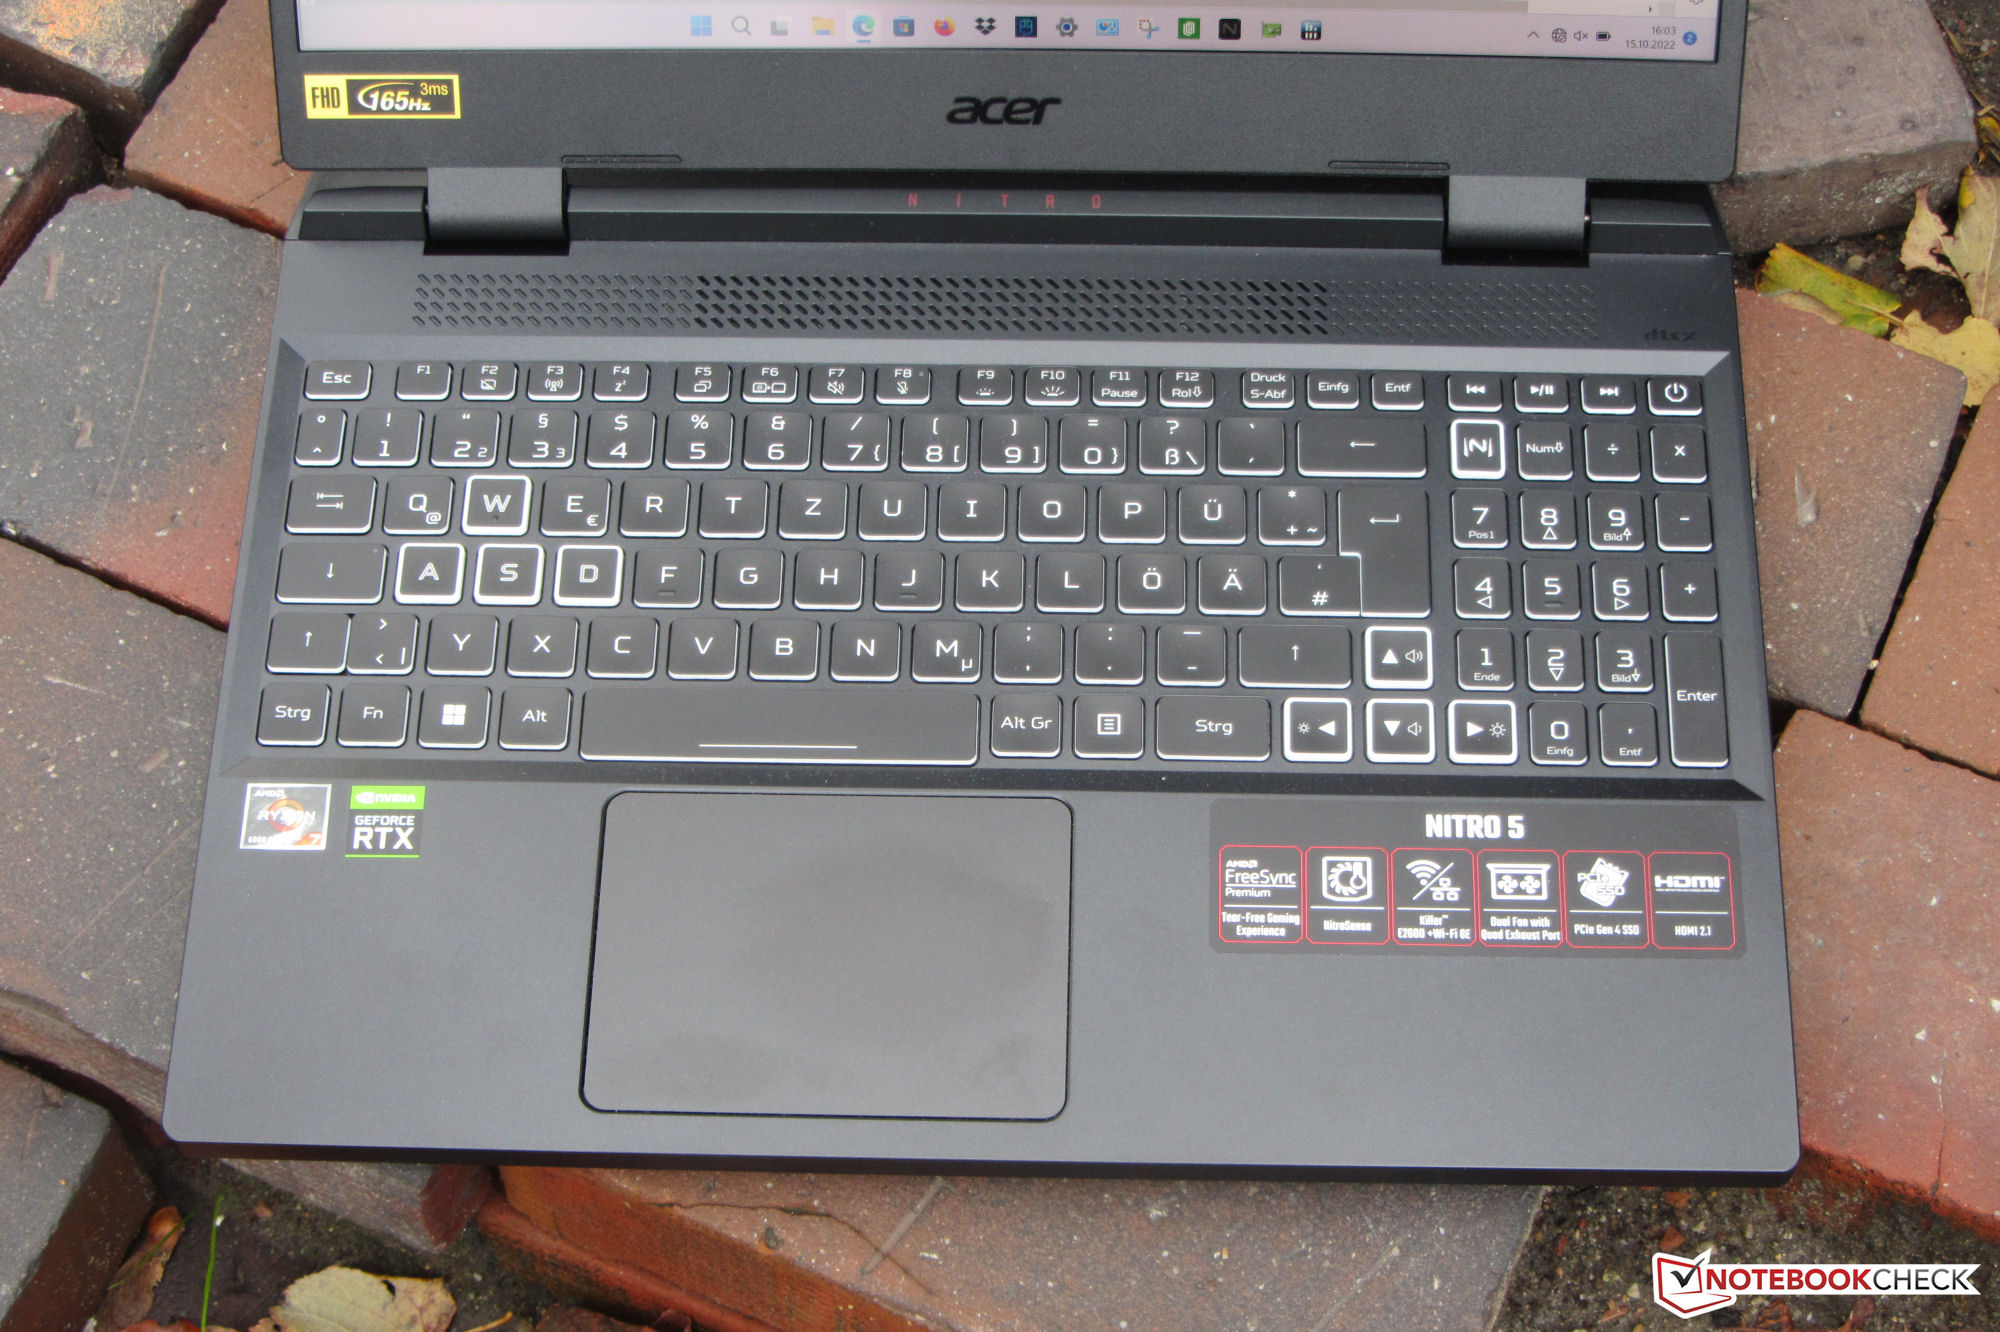
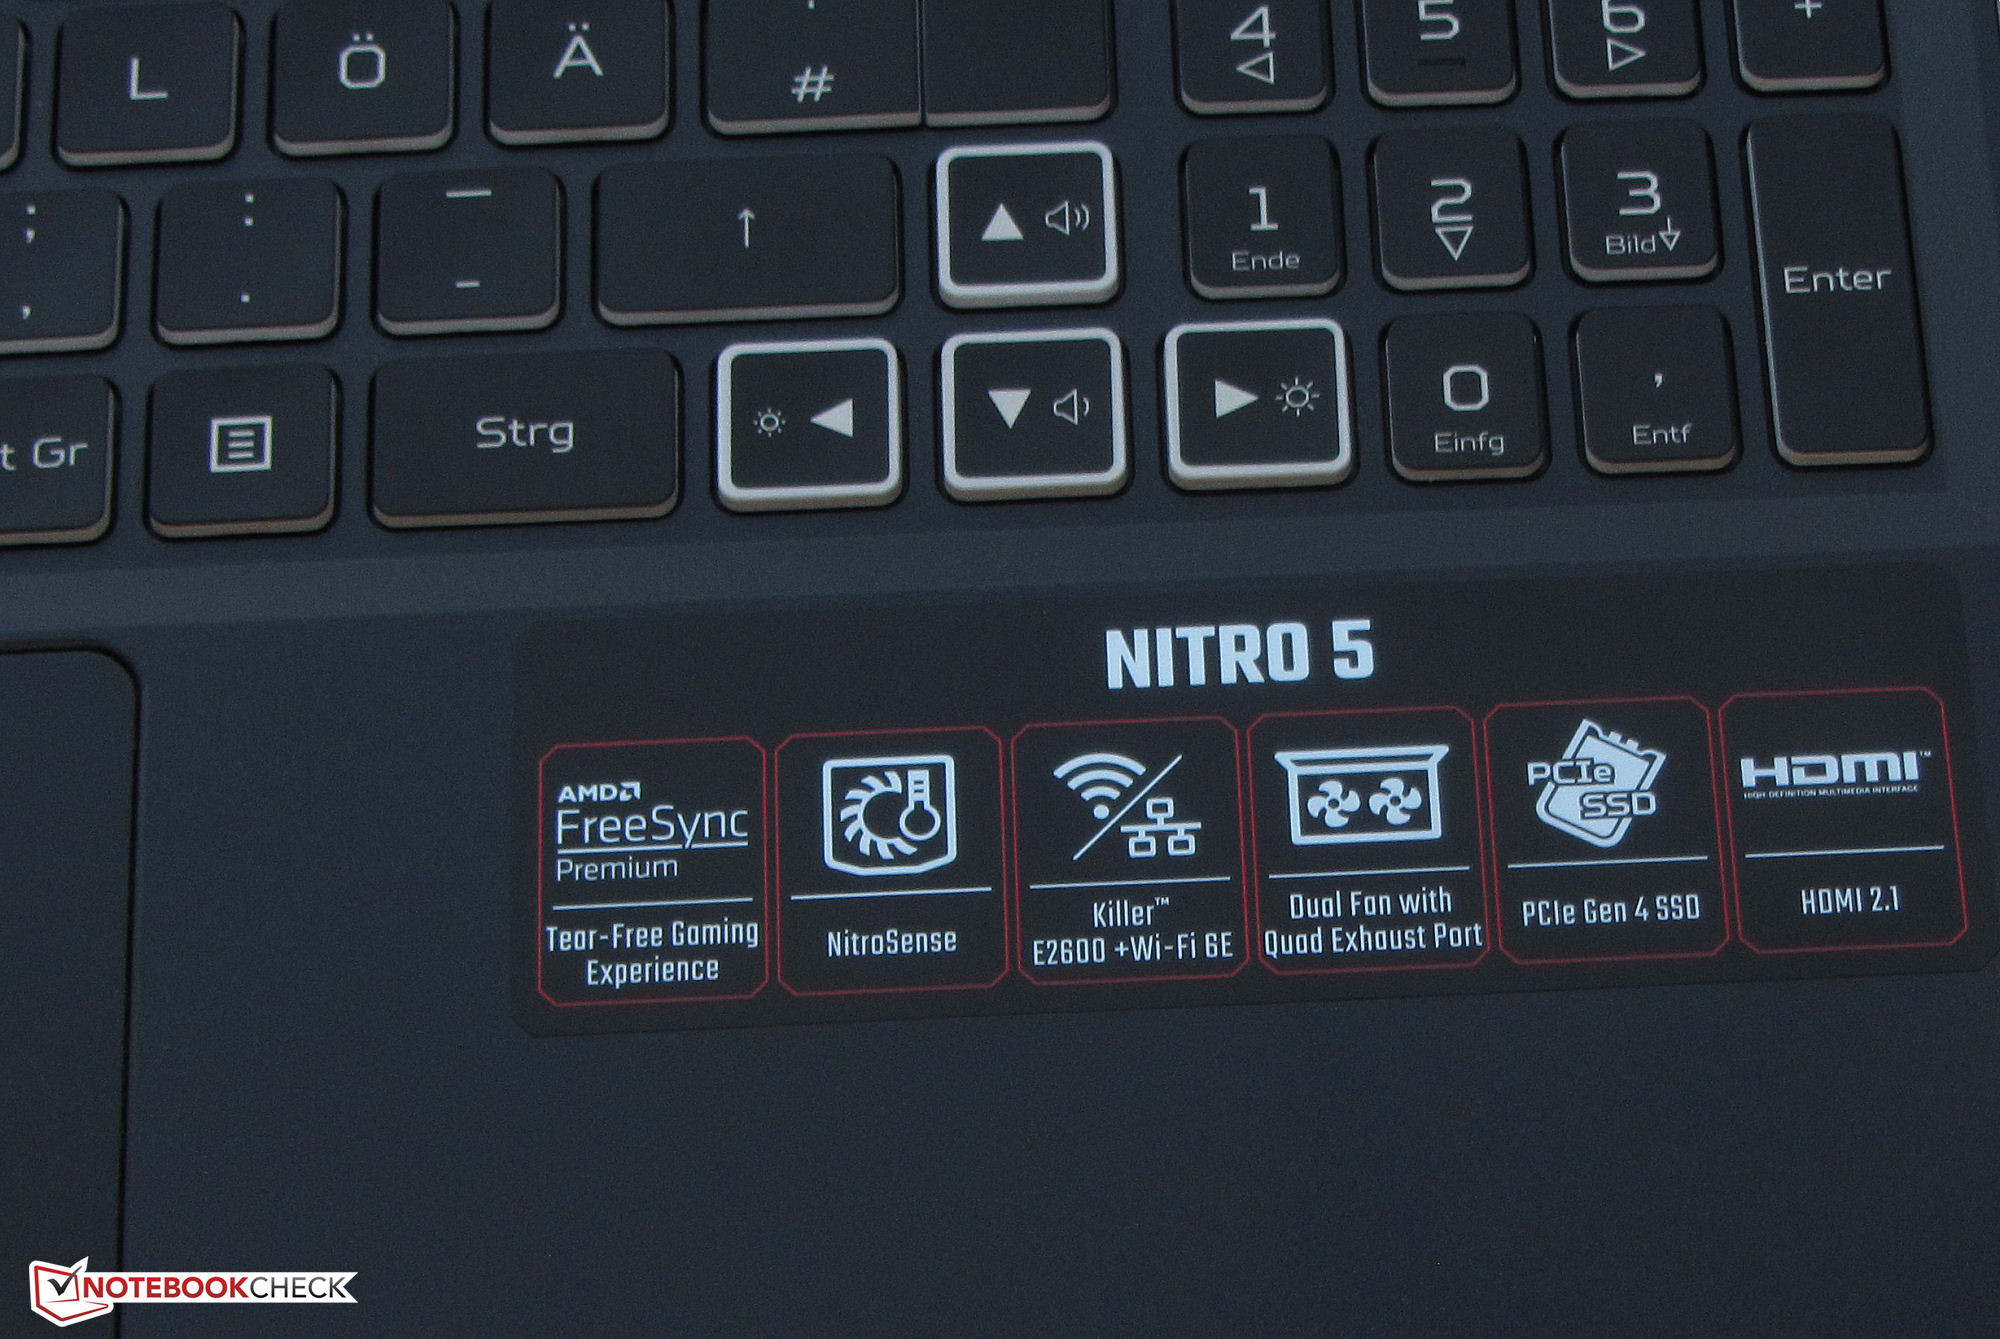
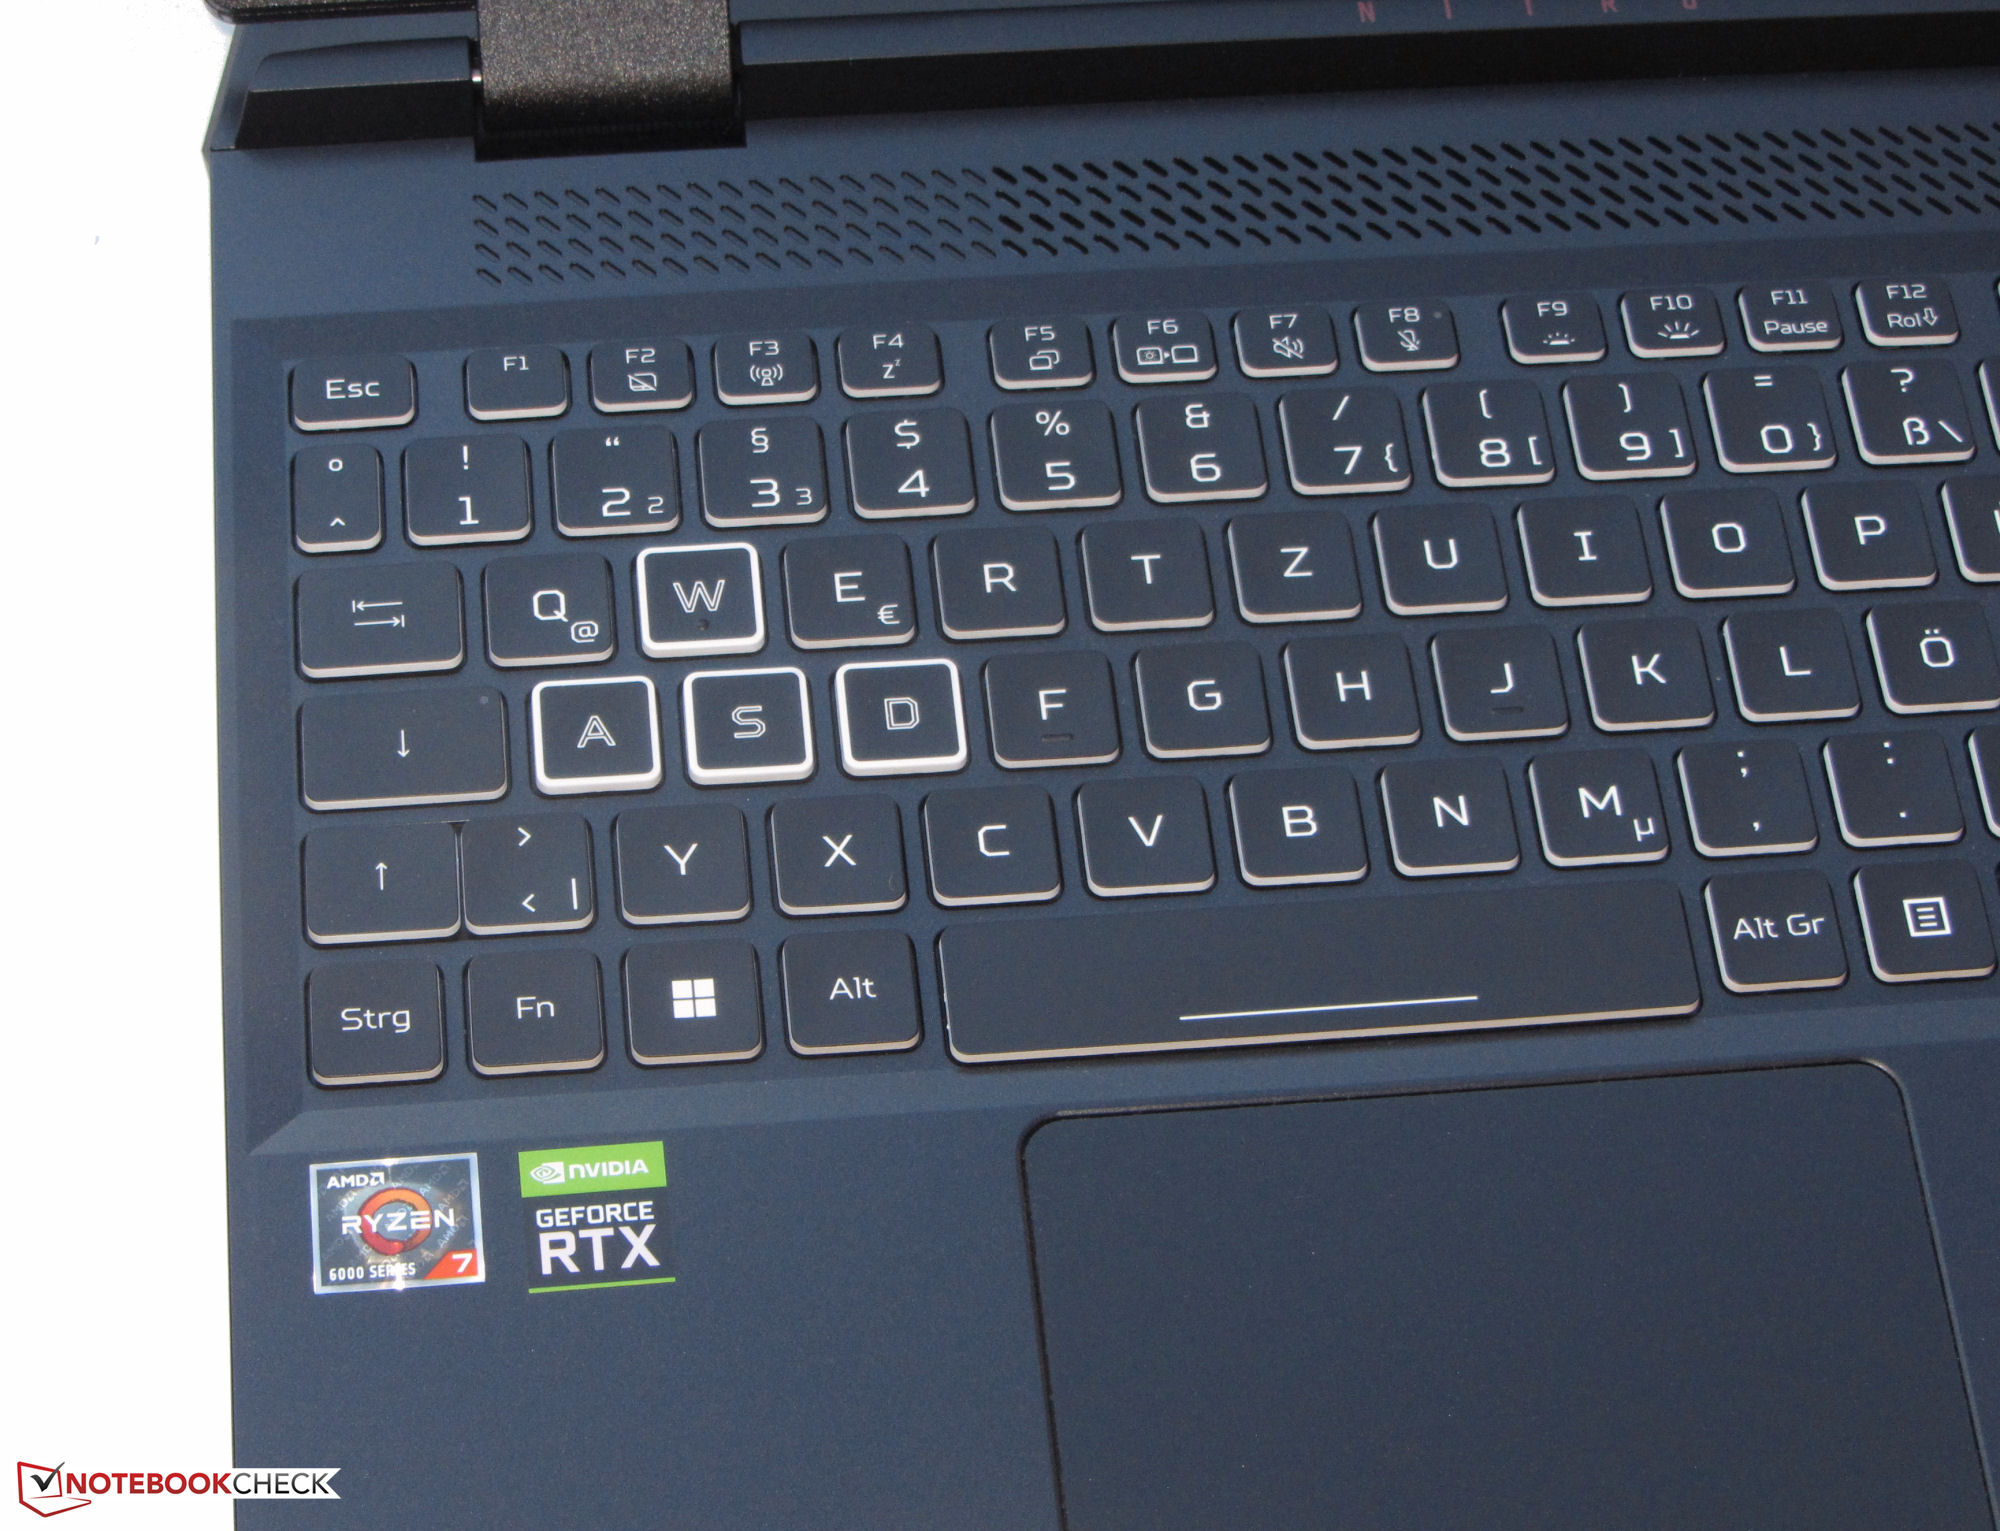
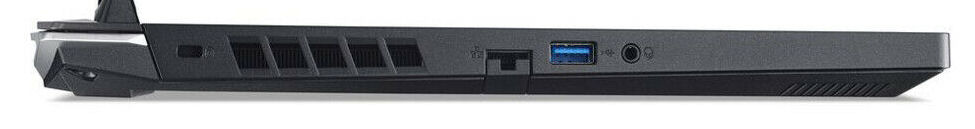
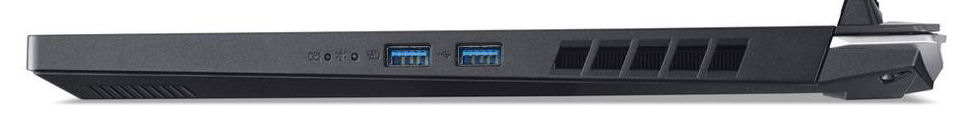
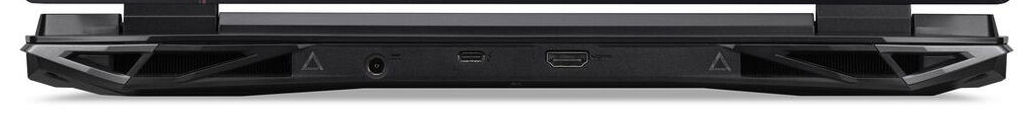
The AN515-58 has been fitted into the same case as its Intel-based sibling, which we already tested. To find out more about the case, connectivity and input devices, please see our review of the Nitro 5 AN515-58 (Core i7, QHD).
Potential competitors
Rating | Date | Model | Weight | Height | Size | Resolution | Price |
|---|---|---|---|---|---|---|---|
| 83.9 % v7 (old) | 11 / 2022 | Acer Nitro 5 AN515-46-R1A1 R7 6800H, GeForce RTX 3070 Ti Laptop GPU | 2.5 kg | 26.8 mm | 15.60" | 1920x1080 | |
| 80.3 % v7 (old) | 06 / 2022 | MSI Katana GF66 12UGS i7-12700H, GeForce RTX 3070 Ti Laptop GPU | 2.3 kg | 27.5 mm | 15.60" | 1920x1080 | |
| 87.4 % v7 (old) | 08 / 2022 | Schenker XMG Fusion 15 (Mid 22) i7-11800H, GeForce RTX 3070 Laptop GPU | 1.9 kg | 21.65 mm | 15.60" | 2560x1440 | |
| 85.8 % v7 (old) | 07 / 2022 | Asus TUF Dash F15 FX517ZR i7-12650H, GeForce RTX 3070 Laptop GPU | 2 kg | 20.7 mm | 15.60" | 2560x1440 |
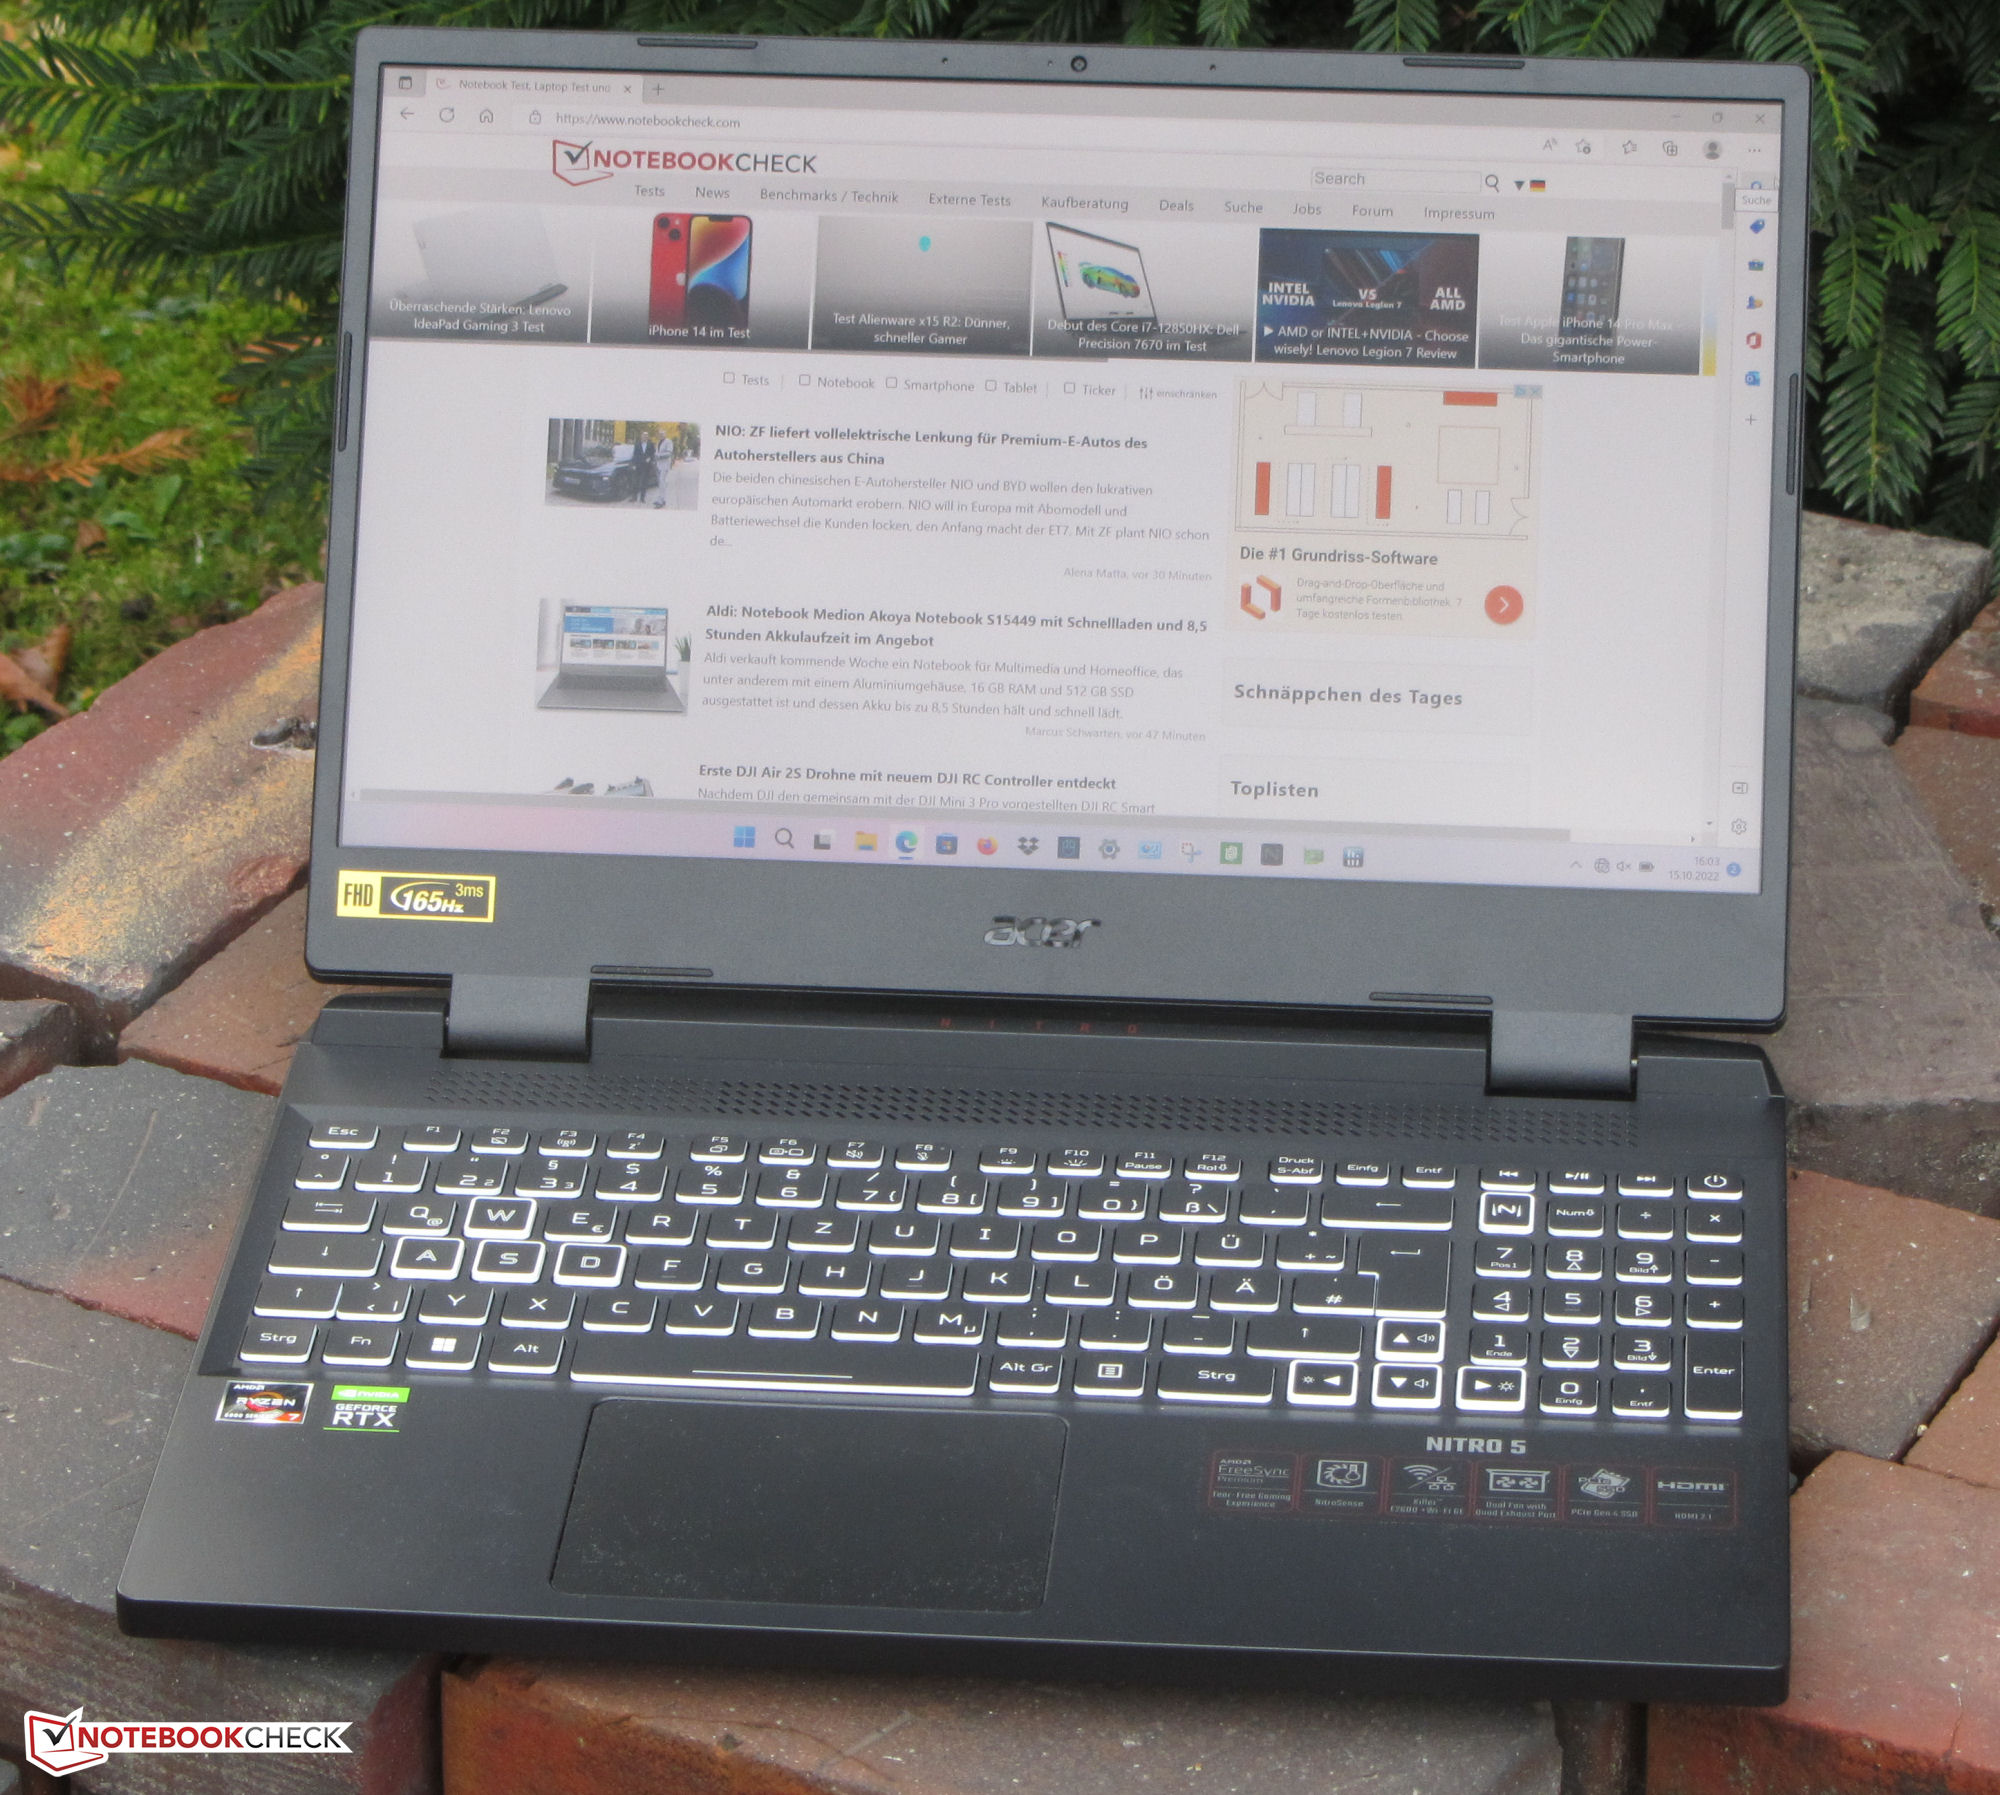


Display - Acer notebook with a 165-Hz panel

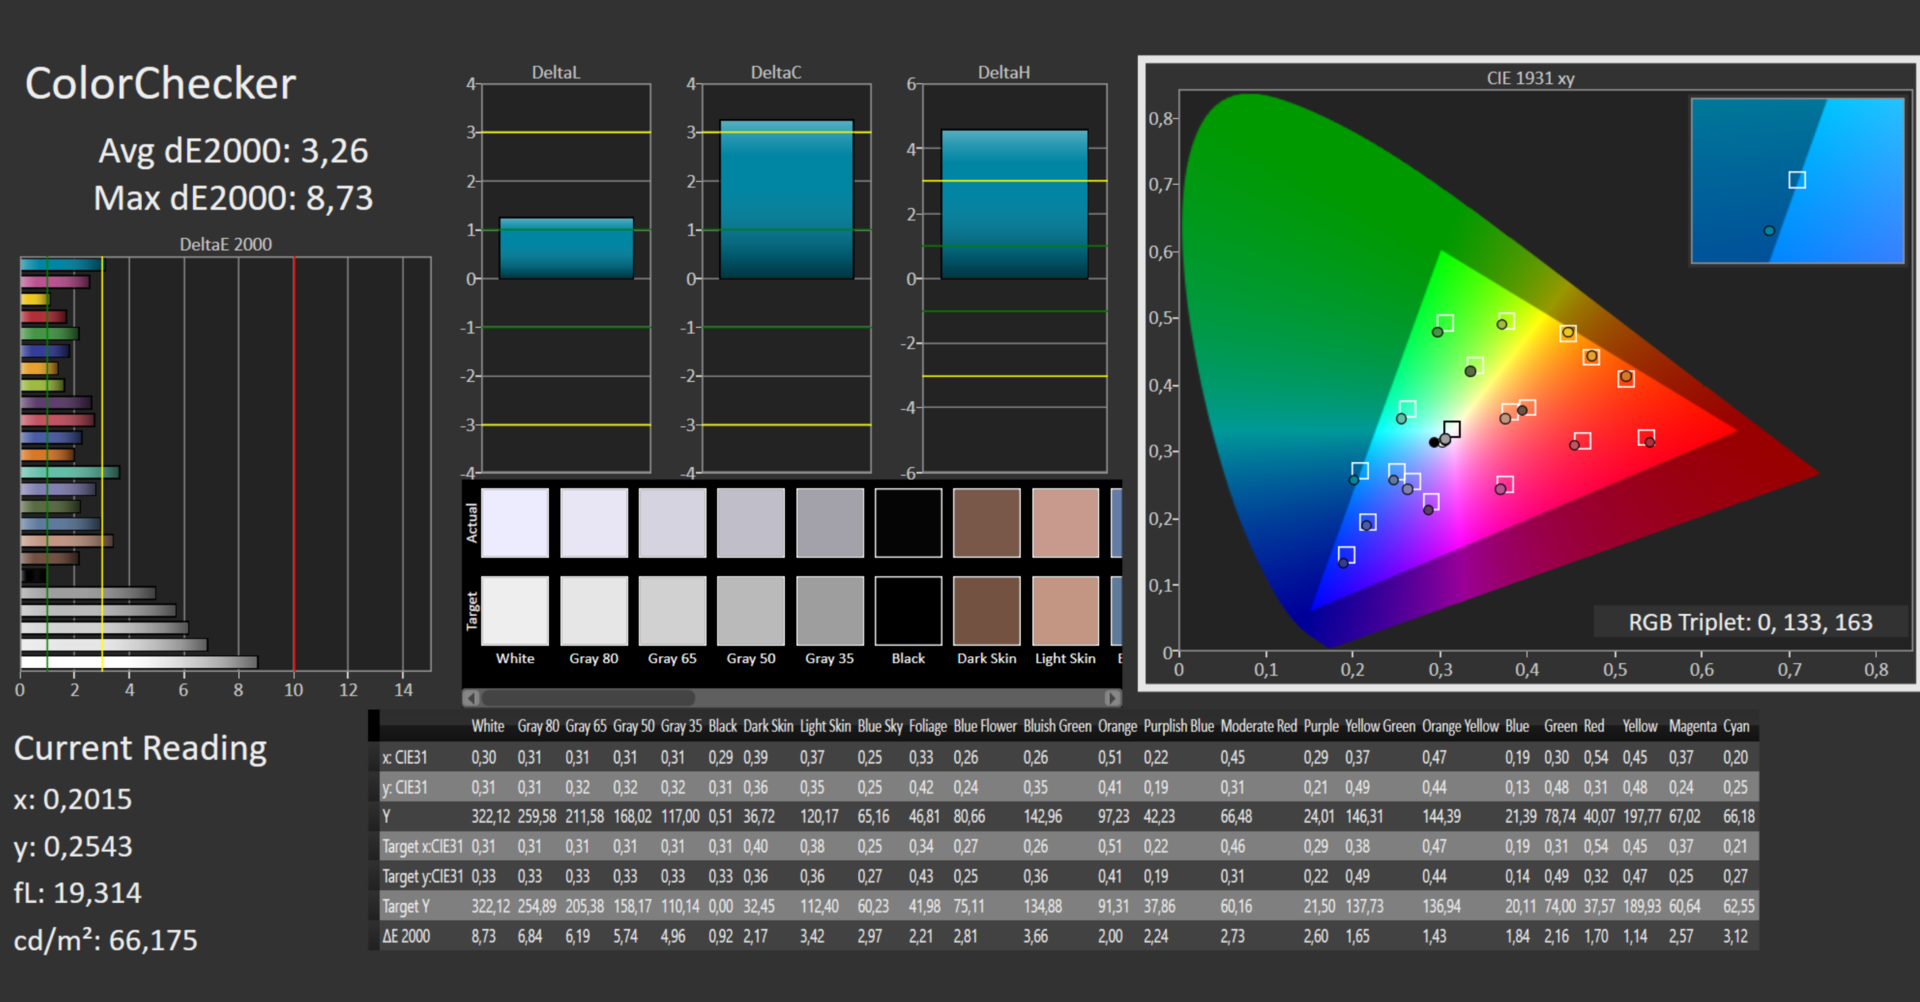
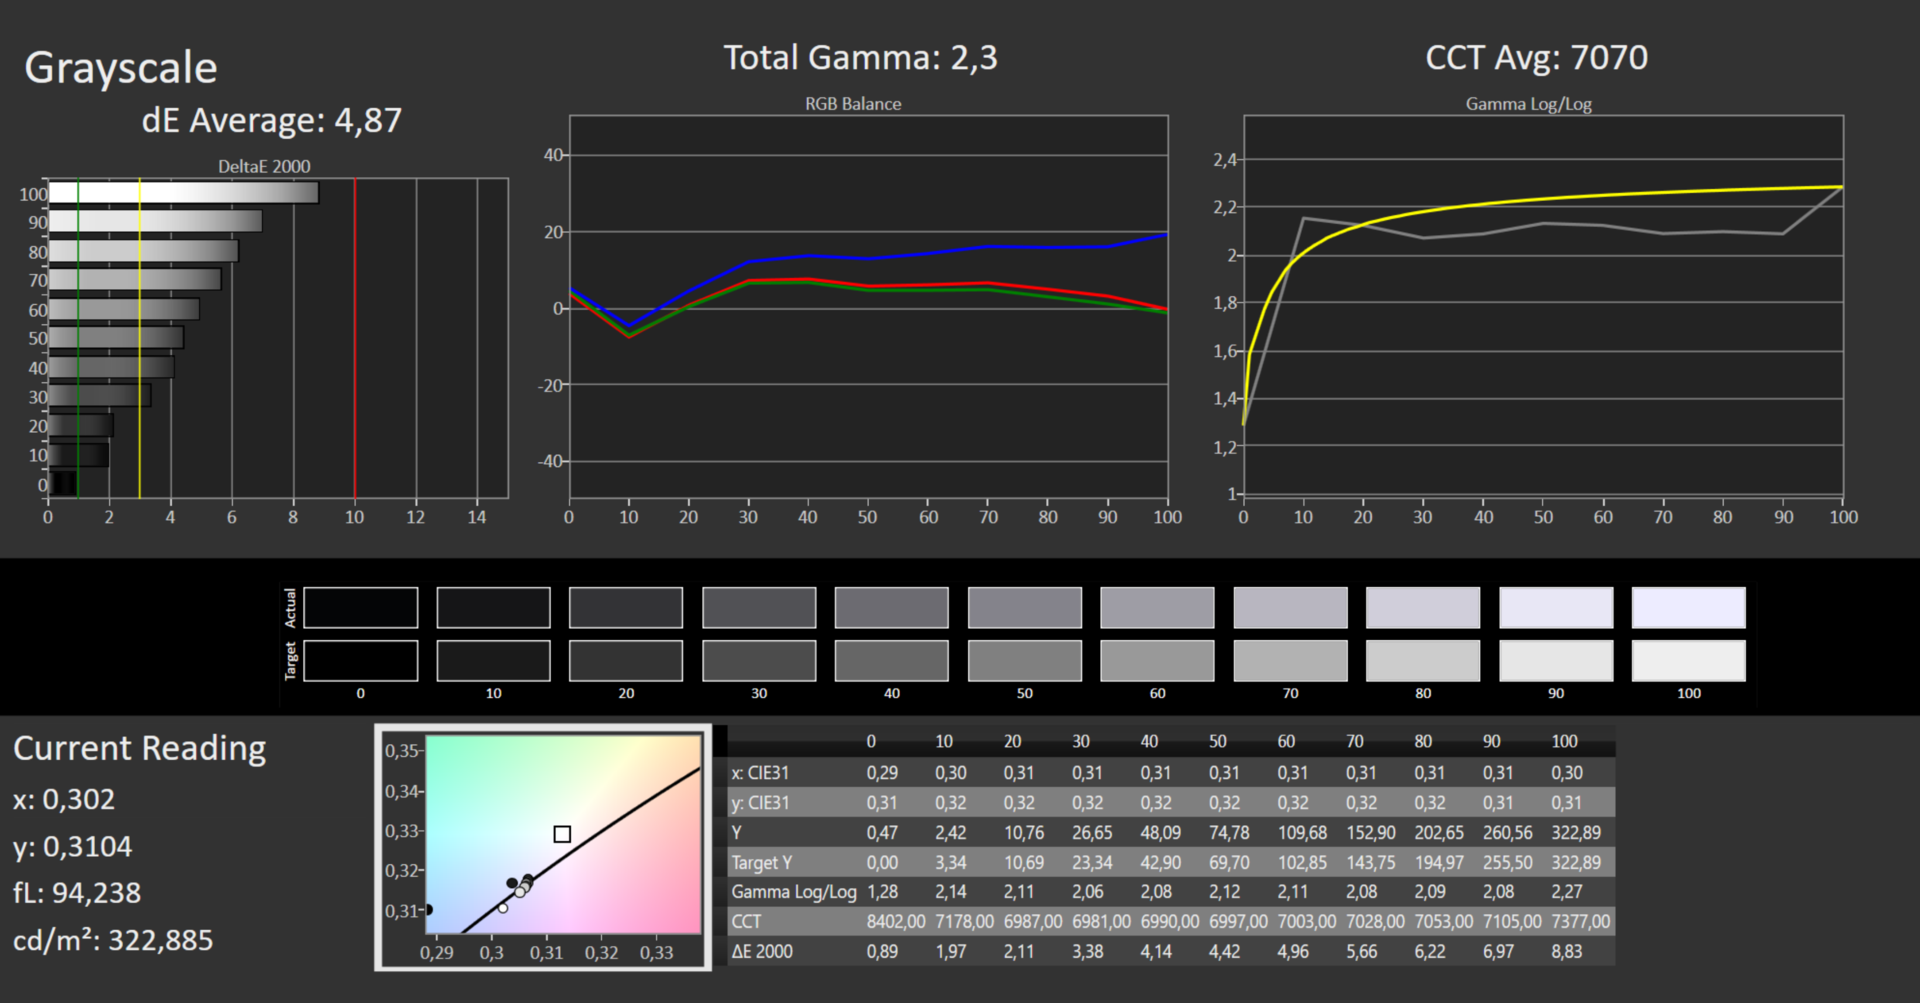
The matte 15.6-inch (1,920 x 1,080 pixel) display's brightness of 320.2 cd/m² fulfills our minimum requirements (> 300 cd/m²). Its contrast ratio of 1,363:1 is more than adequate and easily beats its competition. The 165-Hz panel has short response times and does not use PWM at any level of brightness.
The display supports AMD's FreeSync technology. This dynamically matches the display's refresh rates with the GPU. The aim is to create the smoothest image possible - especially in computer games.
| |||||||||||||||||||||||||
Brightness Distribution: 93 %
Center on Battery: 334 cd/m²
Contrast: 1363:1 (Black: 0.24 cd/m²)
ΔE ColorChecker Calman: 3.26 | ∀{0.5-29.43 Ø4.78}
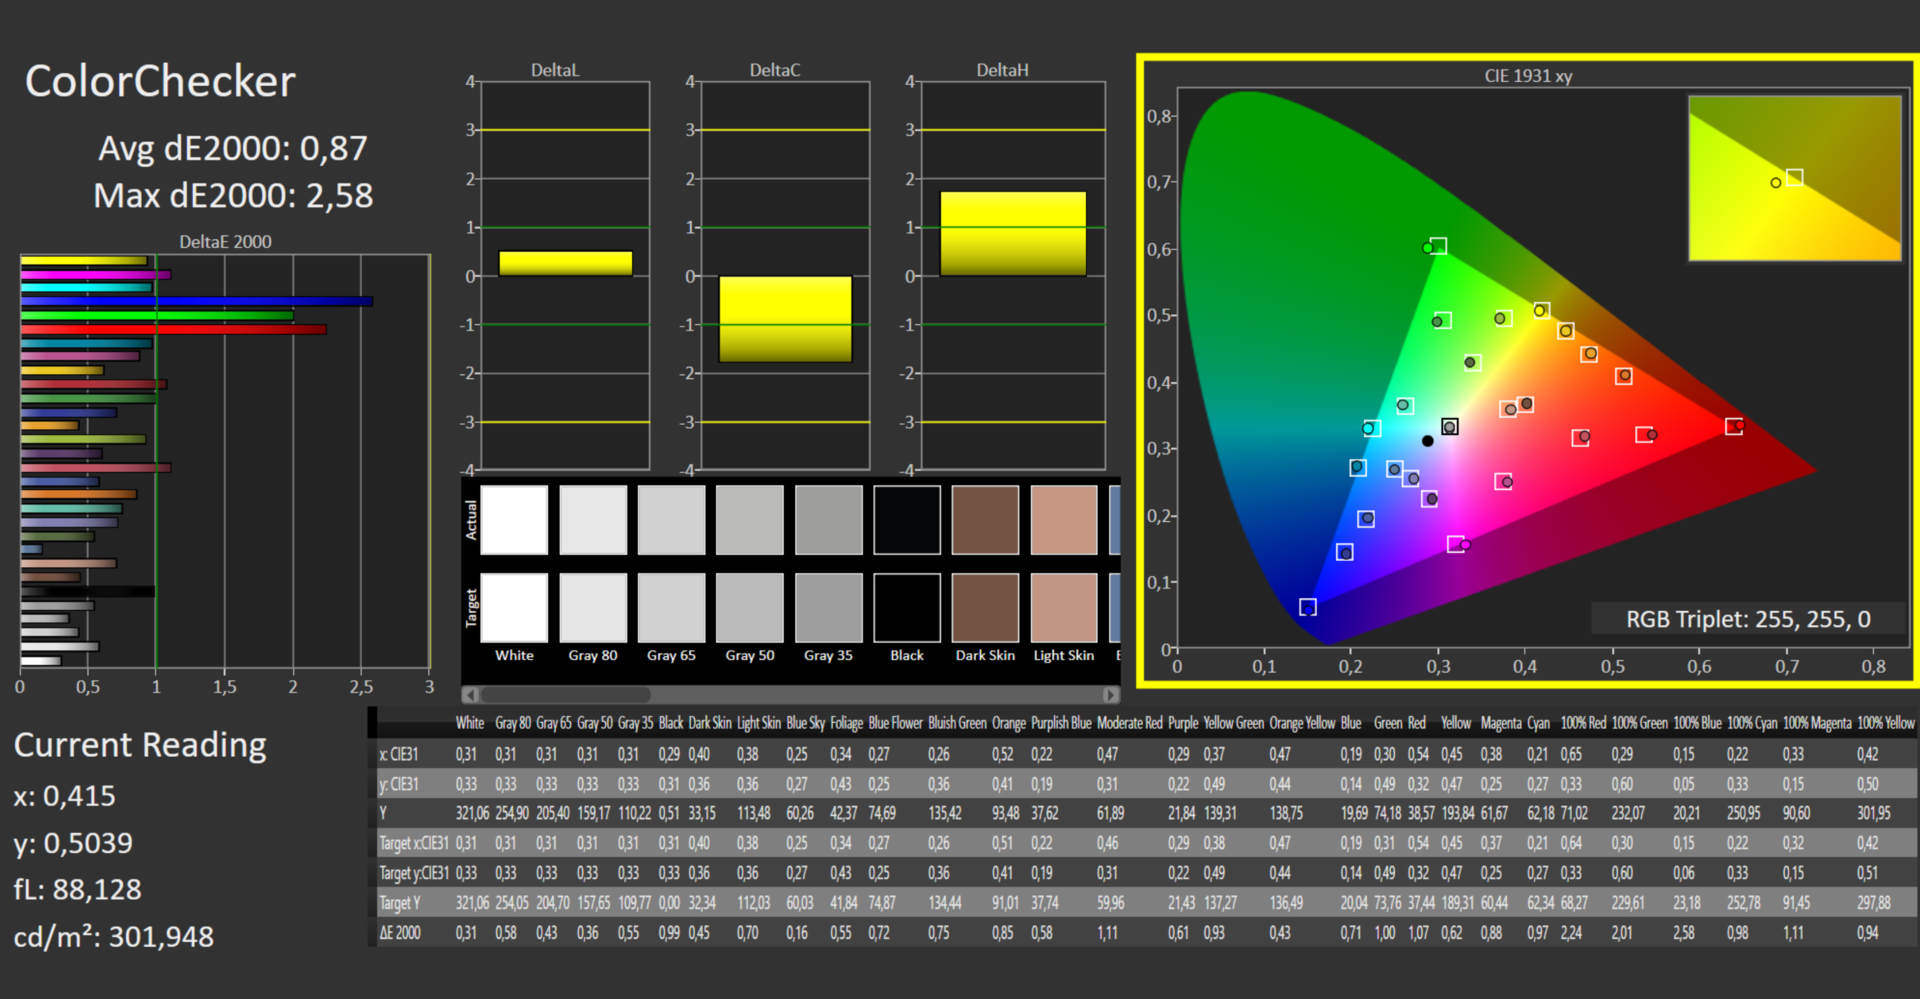
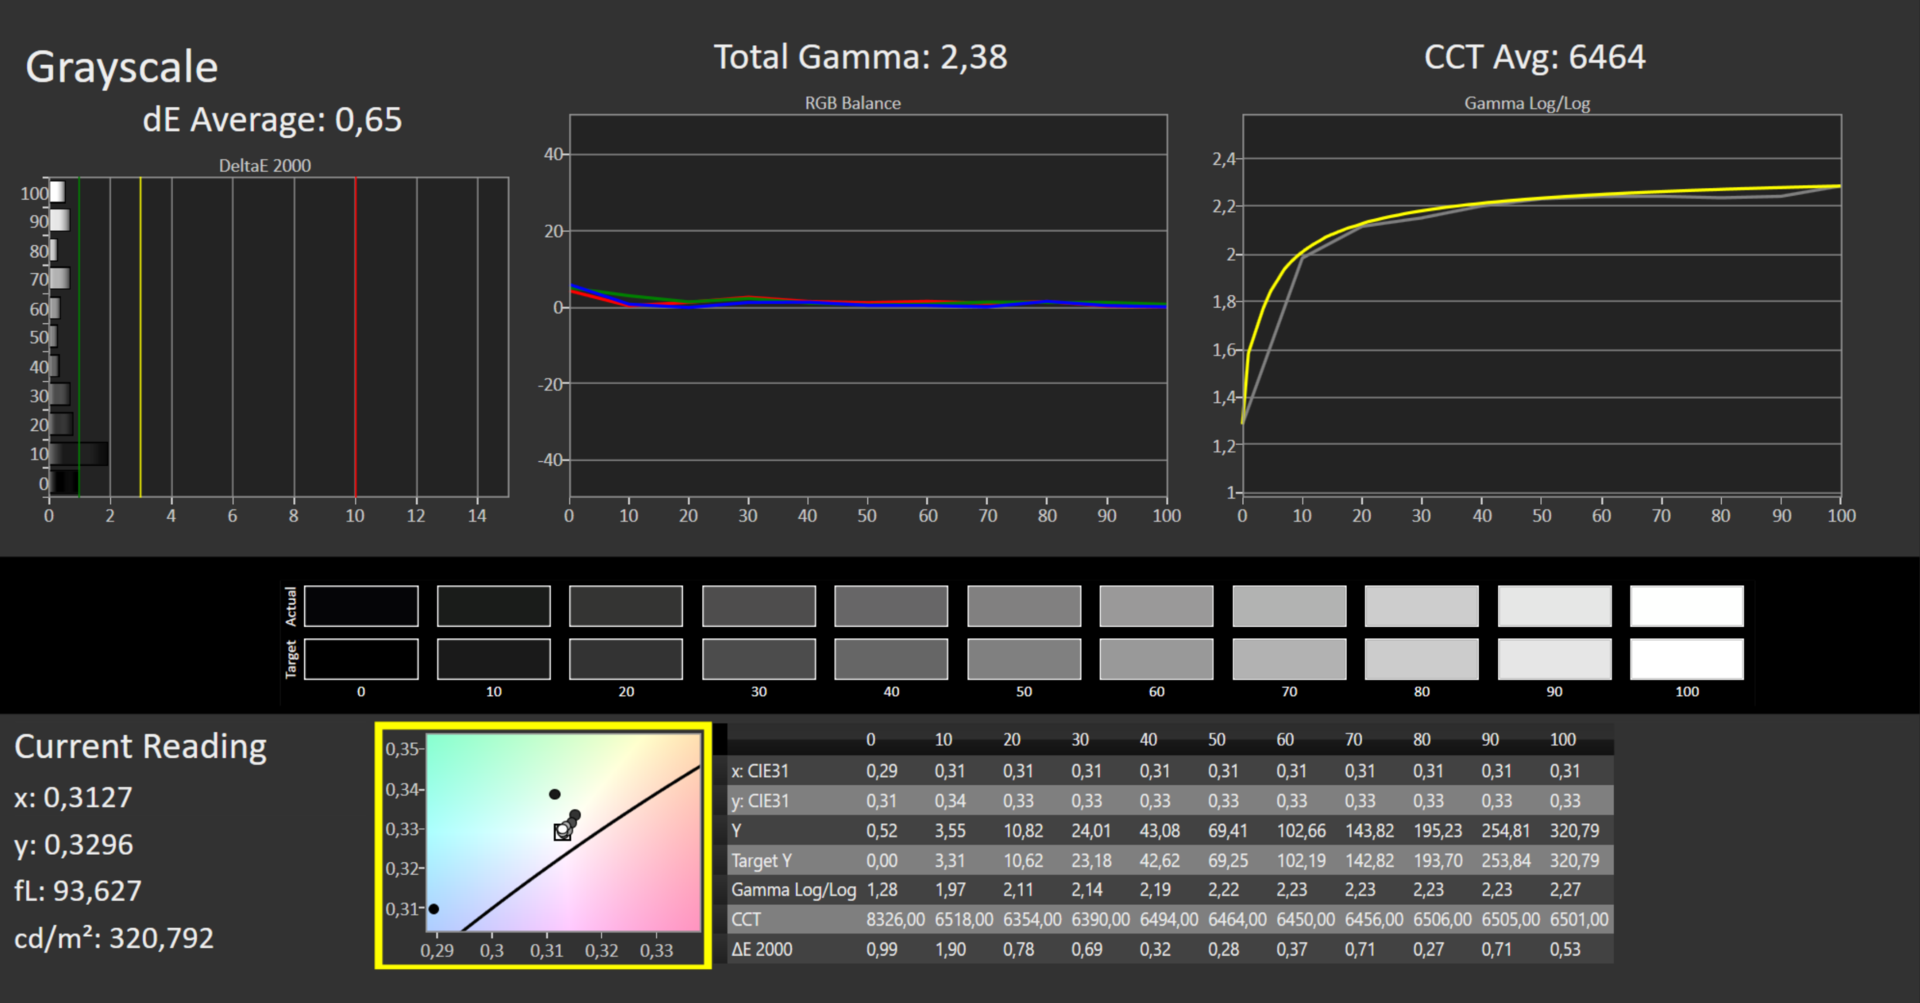
calibrated: 0.87
ΔE Greyscale Calman: 4.87 | ∀{0.09-98 Ø5}
69.7% AdobeRGB 1998 (Argyll 3D)
98.1% sRGB (Argyll 3D)
68.8% Display P3 (Argyll 3D)
Gamma: 2.3
CCT: 7070 K
| Acer Nitro 5 AN515-46-R1A1 AU Optronics B156HAN12.H, IPS, 1920x1080, 15.6" | MSI Katana GF66 12UGS AU Optronics AUOAF90, IPS, 1920x1080, 15.6" | Schenker XMG Fusion 15 (Mid 22) BOE CQ NE156QHM-NY2, IPS, 2560x1440, 15.6" | Asus TUF Dash F15 FX517ZR BOE CQ NE156QHM-NY1, IPS, 2560x1440, 15.6" | Acer Nitro 5 AN515-58-72QR Chi Mei N156KME-GNA, IPS, 2560x1440, 15.6" | |
|---|---|---|---|---|---|
| Display | -42% | -2% | 23% | 21% | |
| Display P3 Coverage (%) | 68.8 | 39.1 -43% | 67.3 -2% | 98.4 43% | 95.6 39% |
| sRGB Coverage (%) | 98.1 | 58.3 -41% | 96.7 -1% | 99.9 2% | 99.8 2% |
| AdobeRGB 1998 Coverage (%) | 69.7 | 40.4 -42% | 68.2 -2% | 85.9 23% | 85.2 22% |
| Response Times | -232% | 12% | 20% | -25% | |
| Response Time Grey 50% / Grey 80% * (ms) | 13 ? | 40 ? -208% | 11.6 ? 11% | 5.6 ? 57% | 15.7 ? -21% |
| Response Time Black / White * (ms) | 8 ? | 28.4 ? -255% | 7 ? 12% | 9.4 ? -18% | 10.2 ? -28% |
| PWM Frequency (Hz) | |||||
| Screen | -55% | -15% | 9% | -2% | |
| Brightness middle (cd/m²) | 327 | 227 -31% | 326 0% | 286 -13% | 332 2% |
| Brightness (cd/m²) | 320 | 225 -30% | 303 -5% | 266 -17% | 303 -5% |
| Brightness Distribution (%) | 93 | 90 -3% | 89 -4% | 87 -6% | 86 -8% |
| Black Level * (cd/m²) | 0.24 | 0.21 12% | 0.33 -38% | 0.25 -4% | 0.29 -21% |
| Contrast (:1) | 1363 | 1081 -21% | 988 -28% | 1144 -16% | 1145 -16% |
| Colorchecker dE 2000 * | 3.26 | 4.19 -29% | 2.73 16% | 2.14 34% | 3.61 -11% |
| Colorchecker dE 2000 max. * | 8.73 | 17.45 -100% | 9.54 -9% | 5.22 40% | 7.71 12% |
| Colorchecker dE 2000 calibrated * | 0.87 | 3.81 -338% | 1.36 -56% | 0.67 23% | 0.59 32% |
| Greyscale dE 2000 * | 4.87 | 2.7 45% | 5.2 -7% | 2.8 43% | 5.2 -7% |
| Gamma | 2.3 96% | 2.208 100% | 2.074 106% | 2.23 99% | 2.155 102% |
| CCT | 7070 92% | 6176 105% | 6911 94% | 7092 92% | 6724 97% |
| Total Average (Program / Settings) | -110% /
-77% | -2% /
-8% | 17% /
14% | -2% /
-1% |
* ... smaller is better
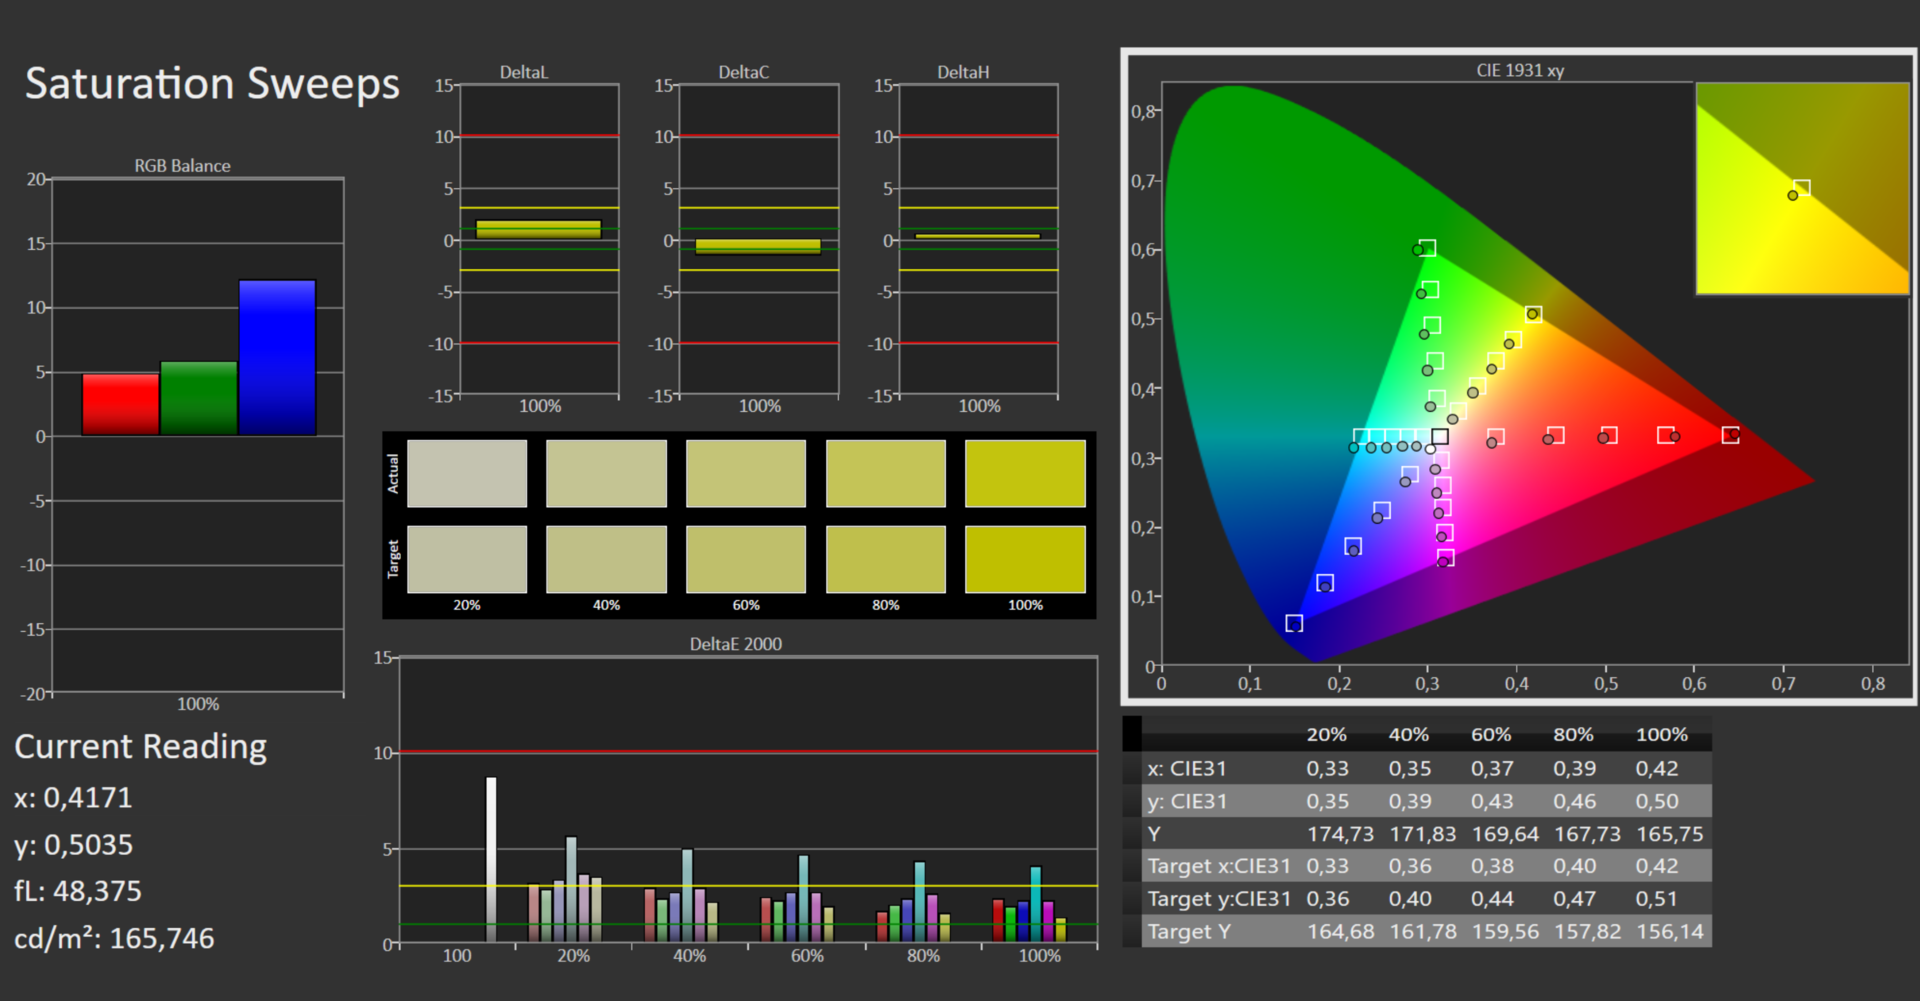
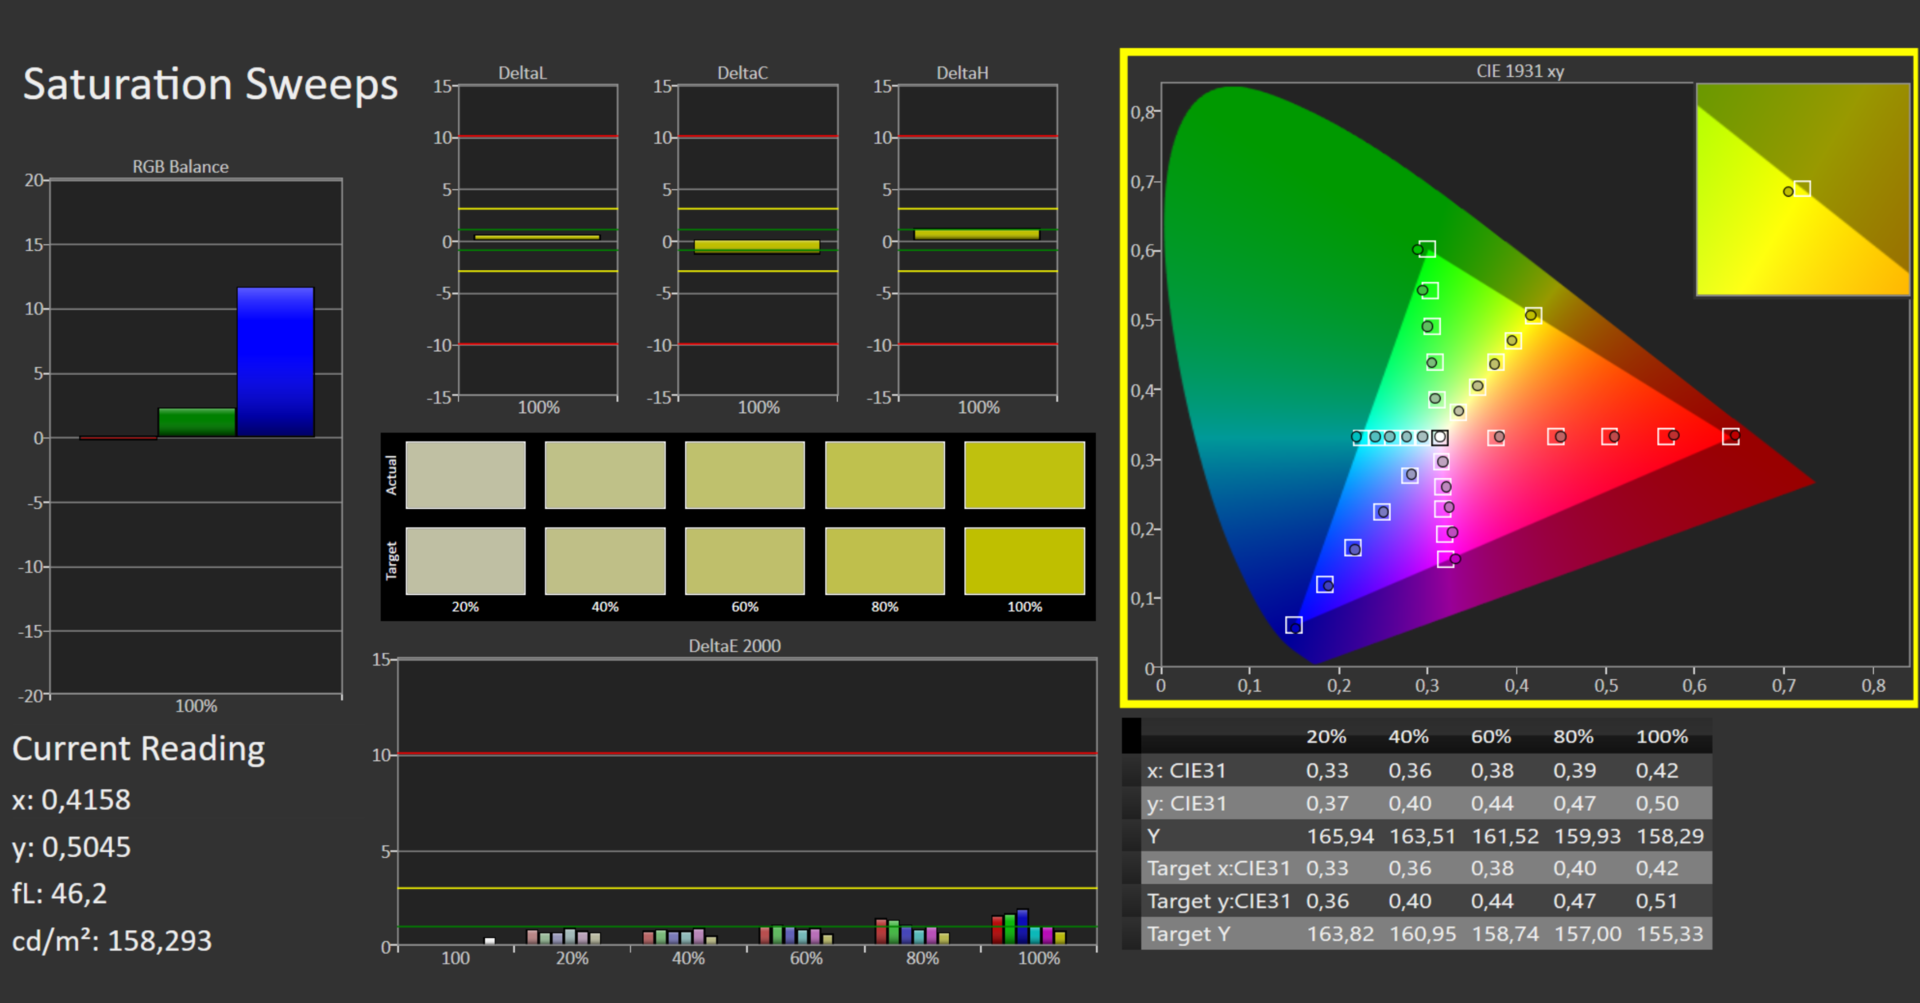
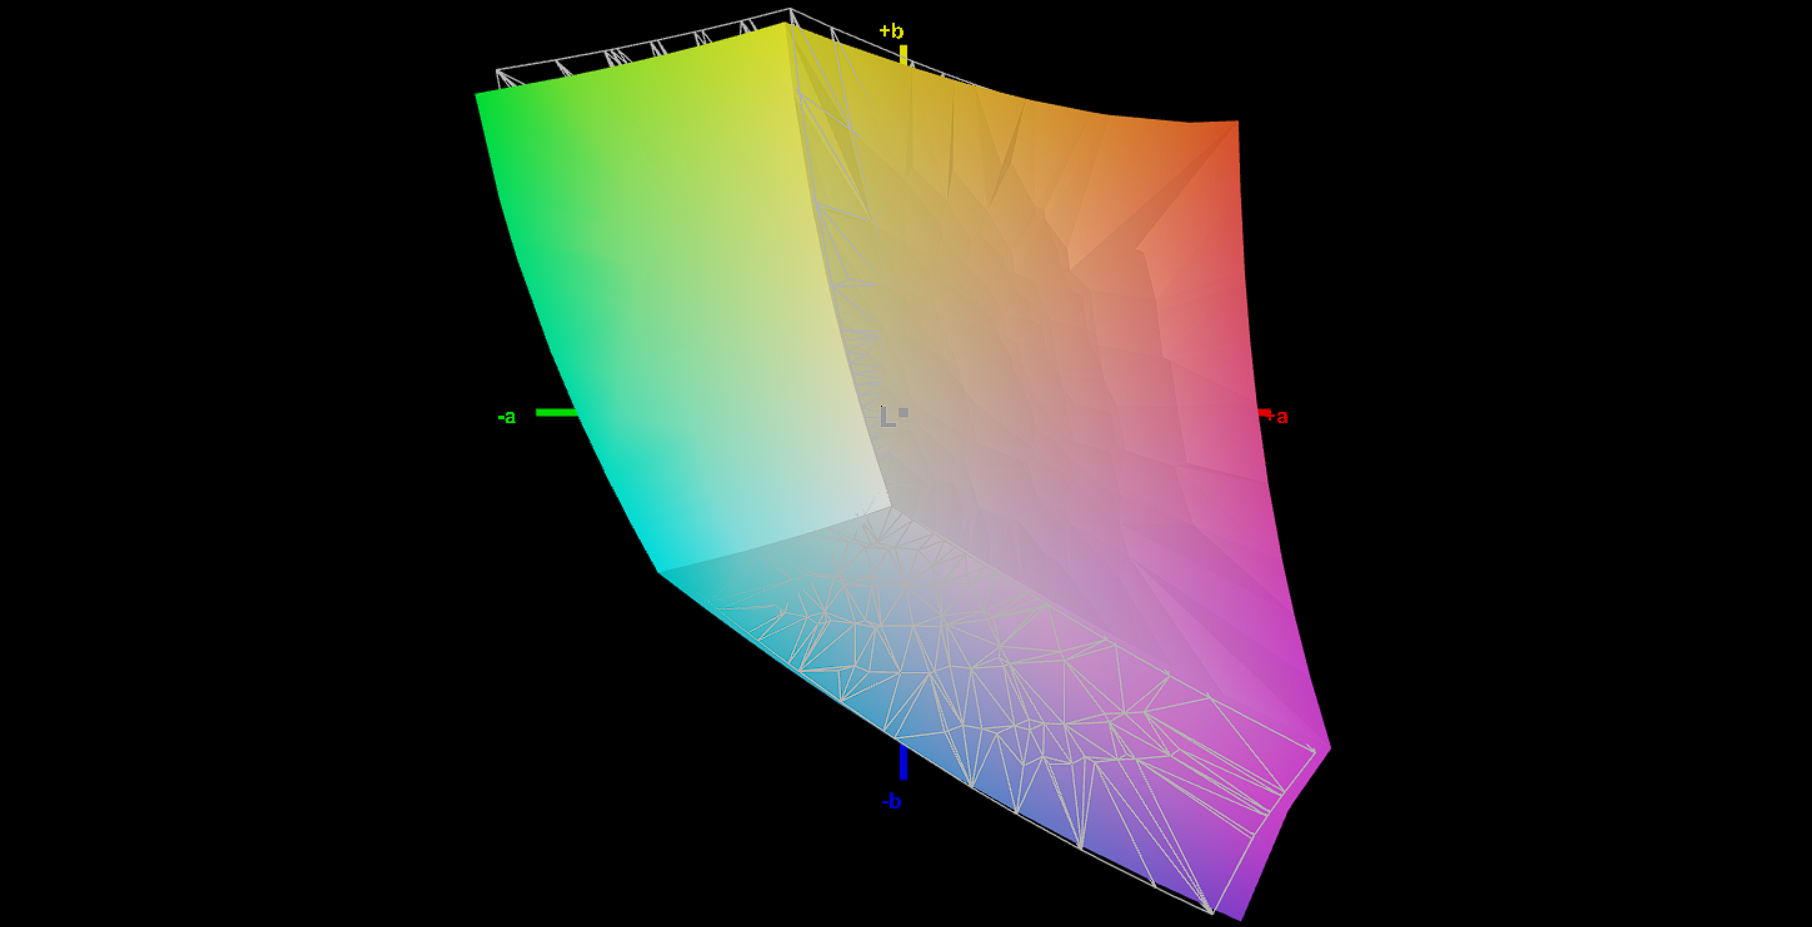
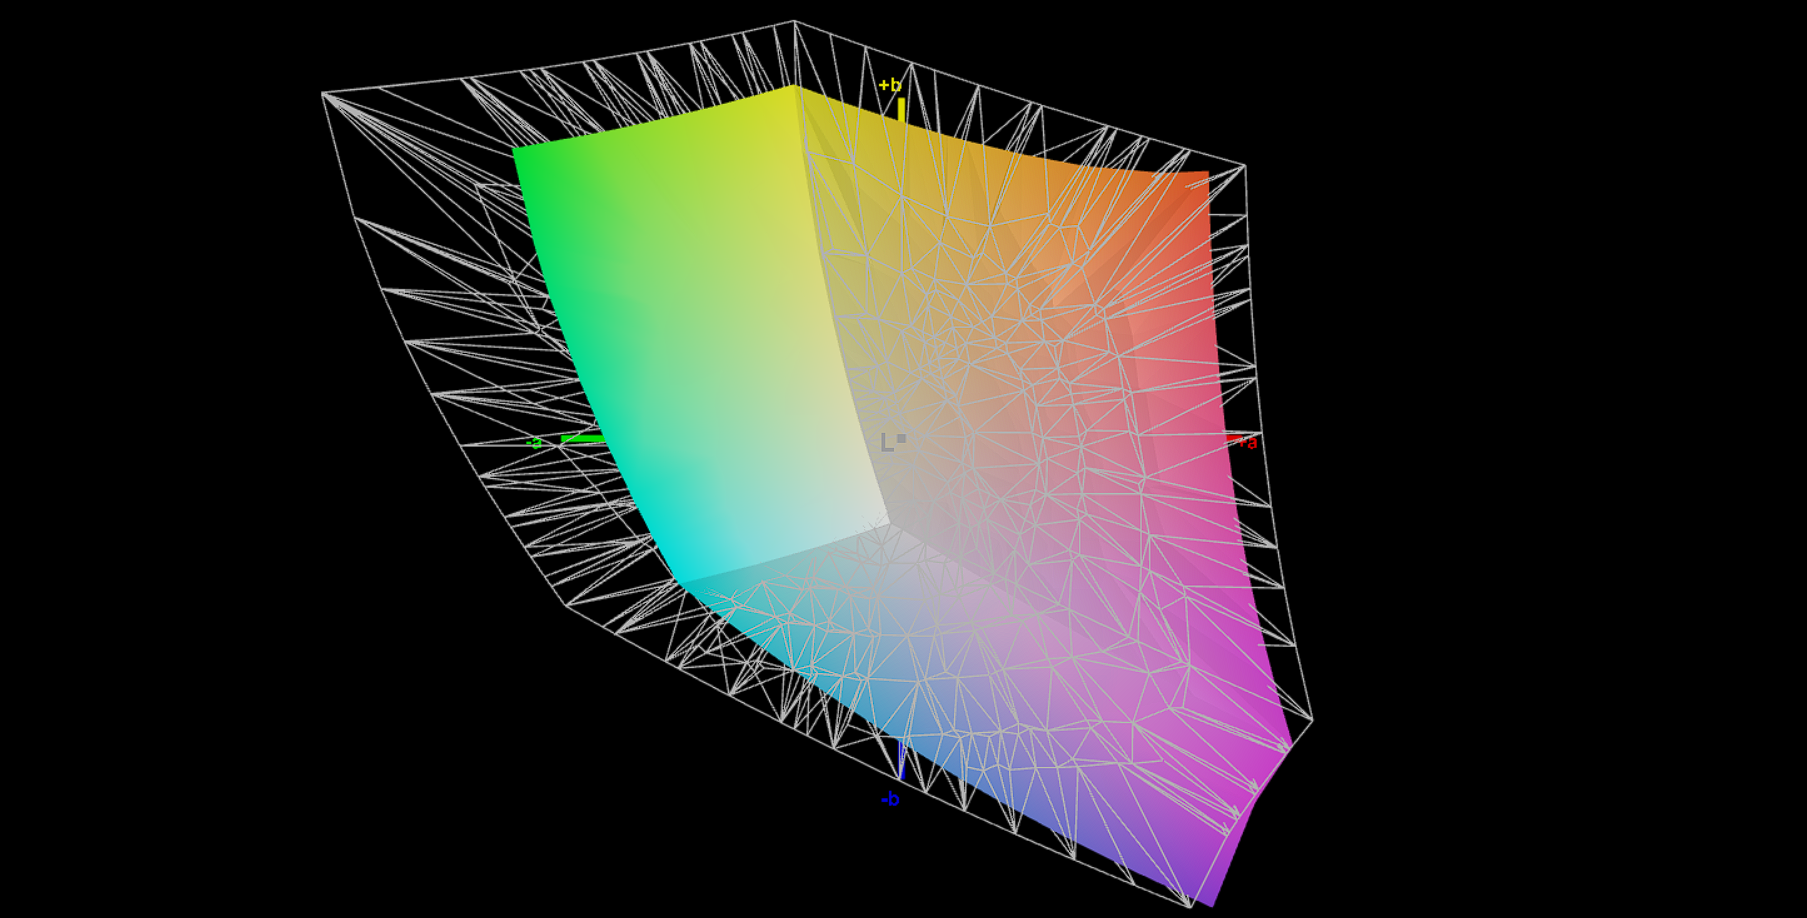
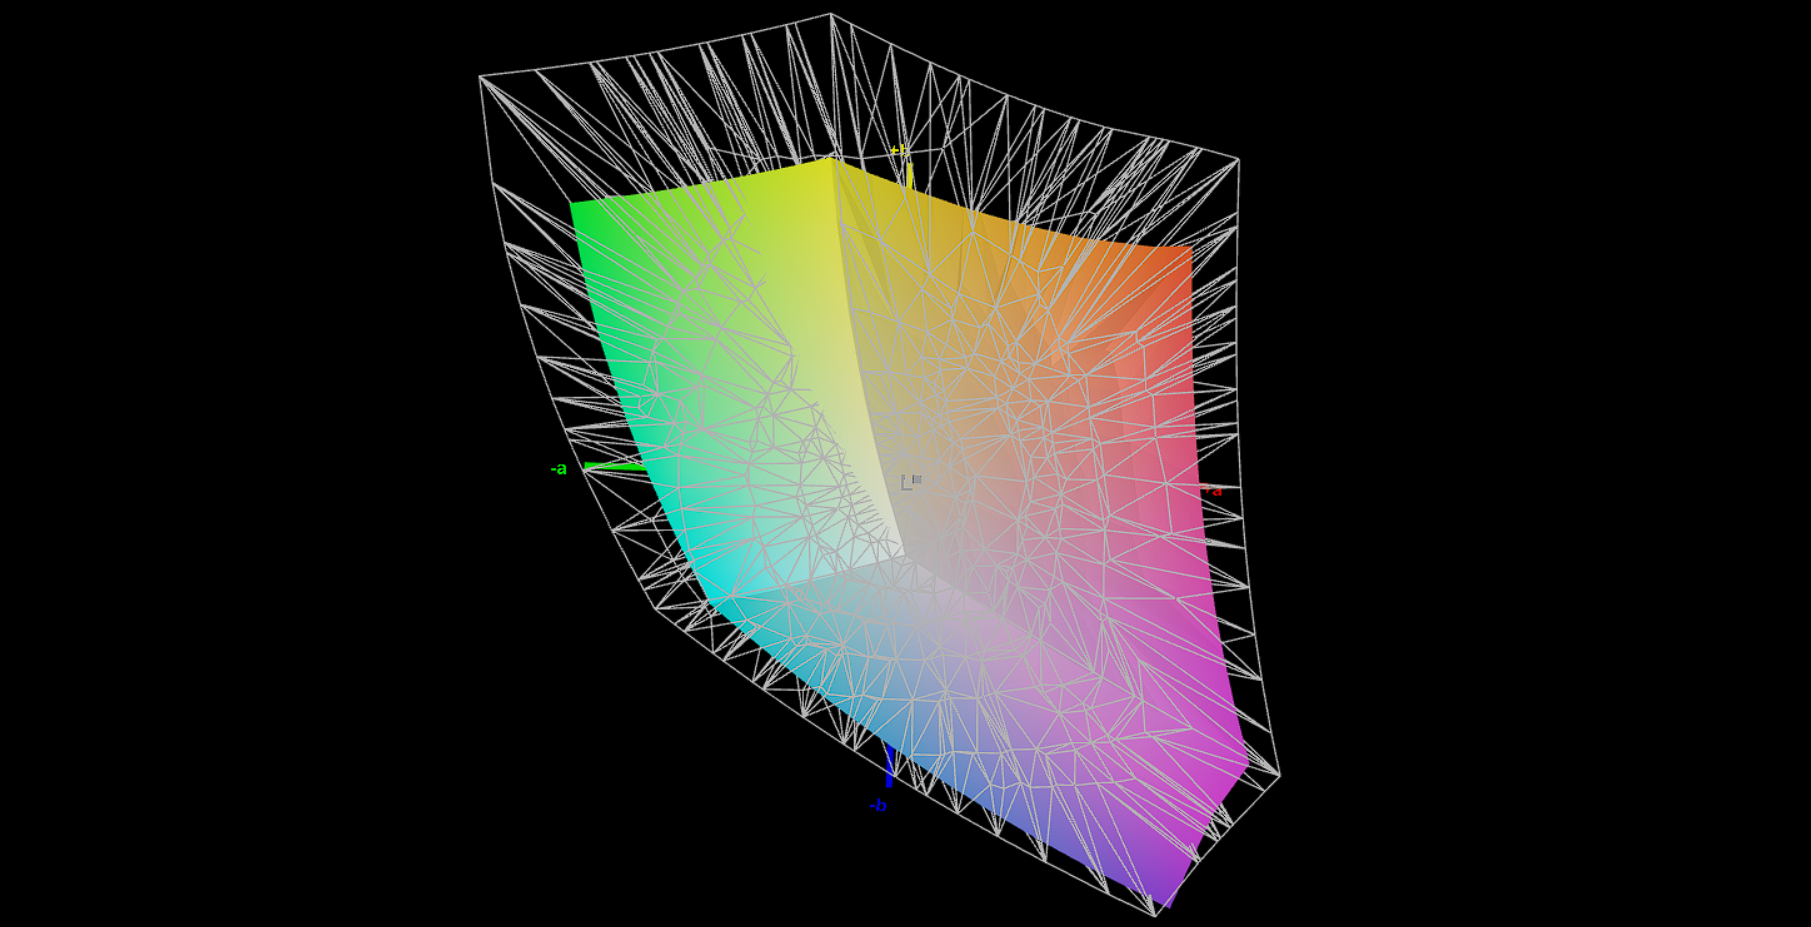
The screen displays colors quite well ex-works. We measured a color deviation of 3.26, which is only just above the ideal value (DeltaE < 3). Calibrating the display reduces deviation to 0.87 and makes grayscales appear more even. The panel can display almost the entire sRGB color space (98.1%) and covers 70% of AdobeRGB and 69% of DCI-P3. The sister model's QHD panel achieves better overall color space coverage.
You can download and use the color profile we created for free. The link is in the info box above.
Display Response Times
| ↔ Response Time Black to White | ||
|---|---|---|
| 8 ms ... rise ↗ and fall ↘ combined | ↗ 4 ms rise |  |
| ↘ 4 ms fall | ||
| The screen shows fast response rates in our tests and should be suited for gaming. In comparison, all tested devices range from 0.1 (minimum) to 240 (maximum) ms. » 21 % of all devices are better. This means that the measured response time is better than the average of all tested devices (20.2 ms). | ||
| ↔ Response Time 50% Grey to 80% Grey | ||
| 13 ms ... rise ↗ and fall ↘ combined | ↗ 6 ms rise |  |
| ↘ 7 ms fall | ||
| The screen shows good response rates in our tests, but may be too slow for competitive gamers. In comparison, all tested devices range from 0.165 (minimum) to 636 (maximum) ms. » 25 % of all devices are better. This means that the measured response time is better than the average of all tested devices (31.6 ms). | ||
Screen Flickering / PWM (Pulse-Width Modulation)
| Screen flickering / PWM not detected |  | ||
In comparison: 53 % of all tested devices do not use PWM to dim the display. If PWM was detected, an average of 8111 (minimum: 5 - maximum: 343500) Hz was measured. | |||


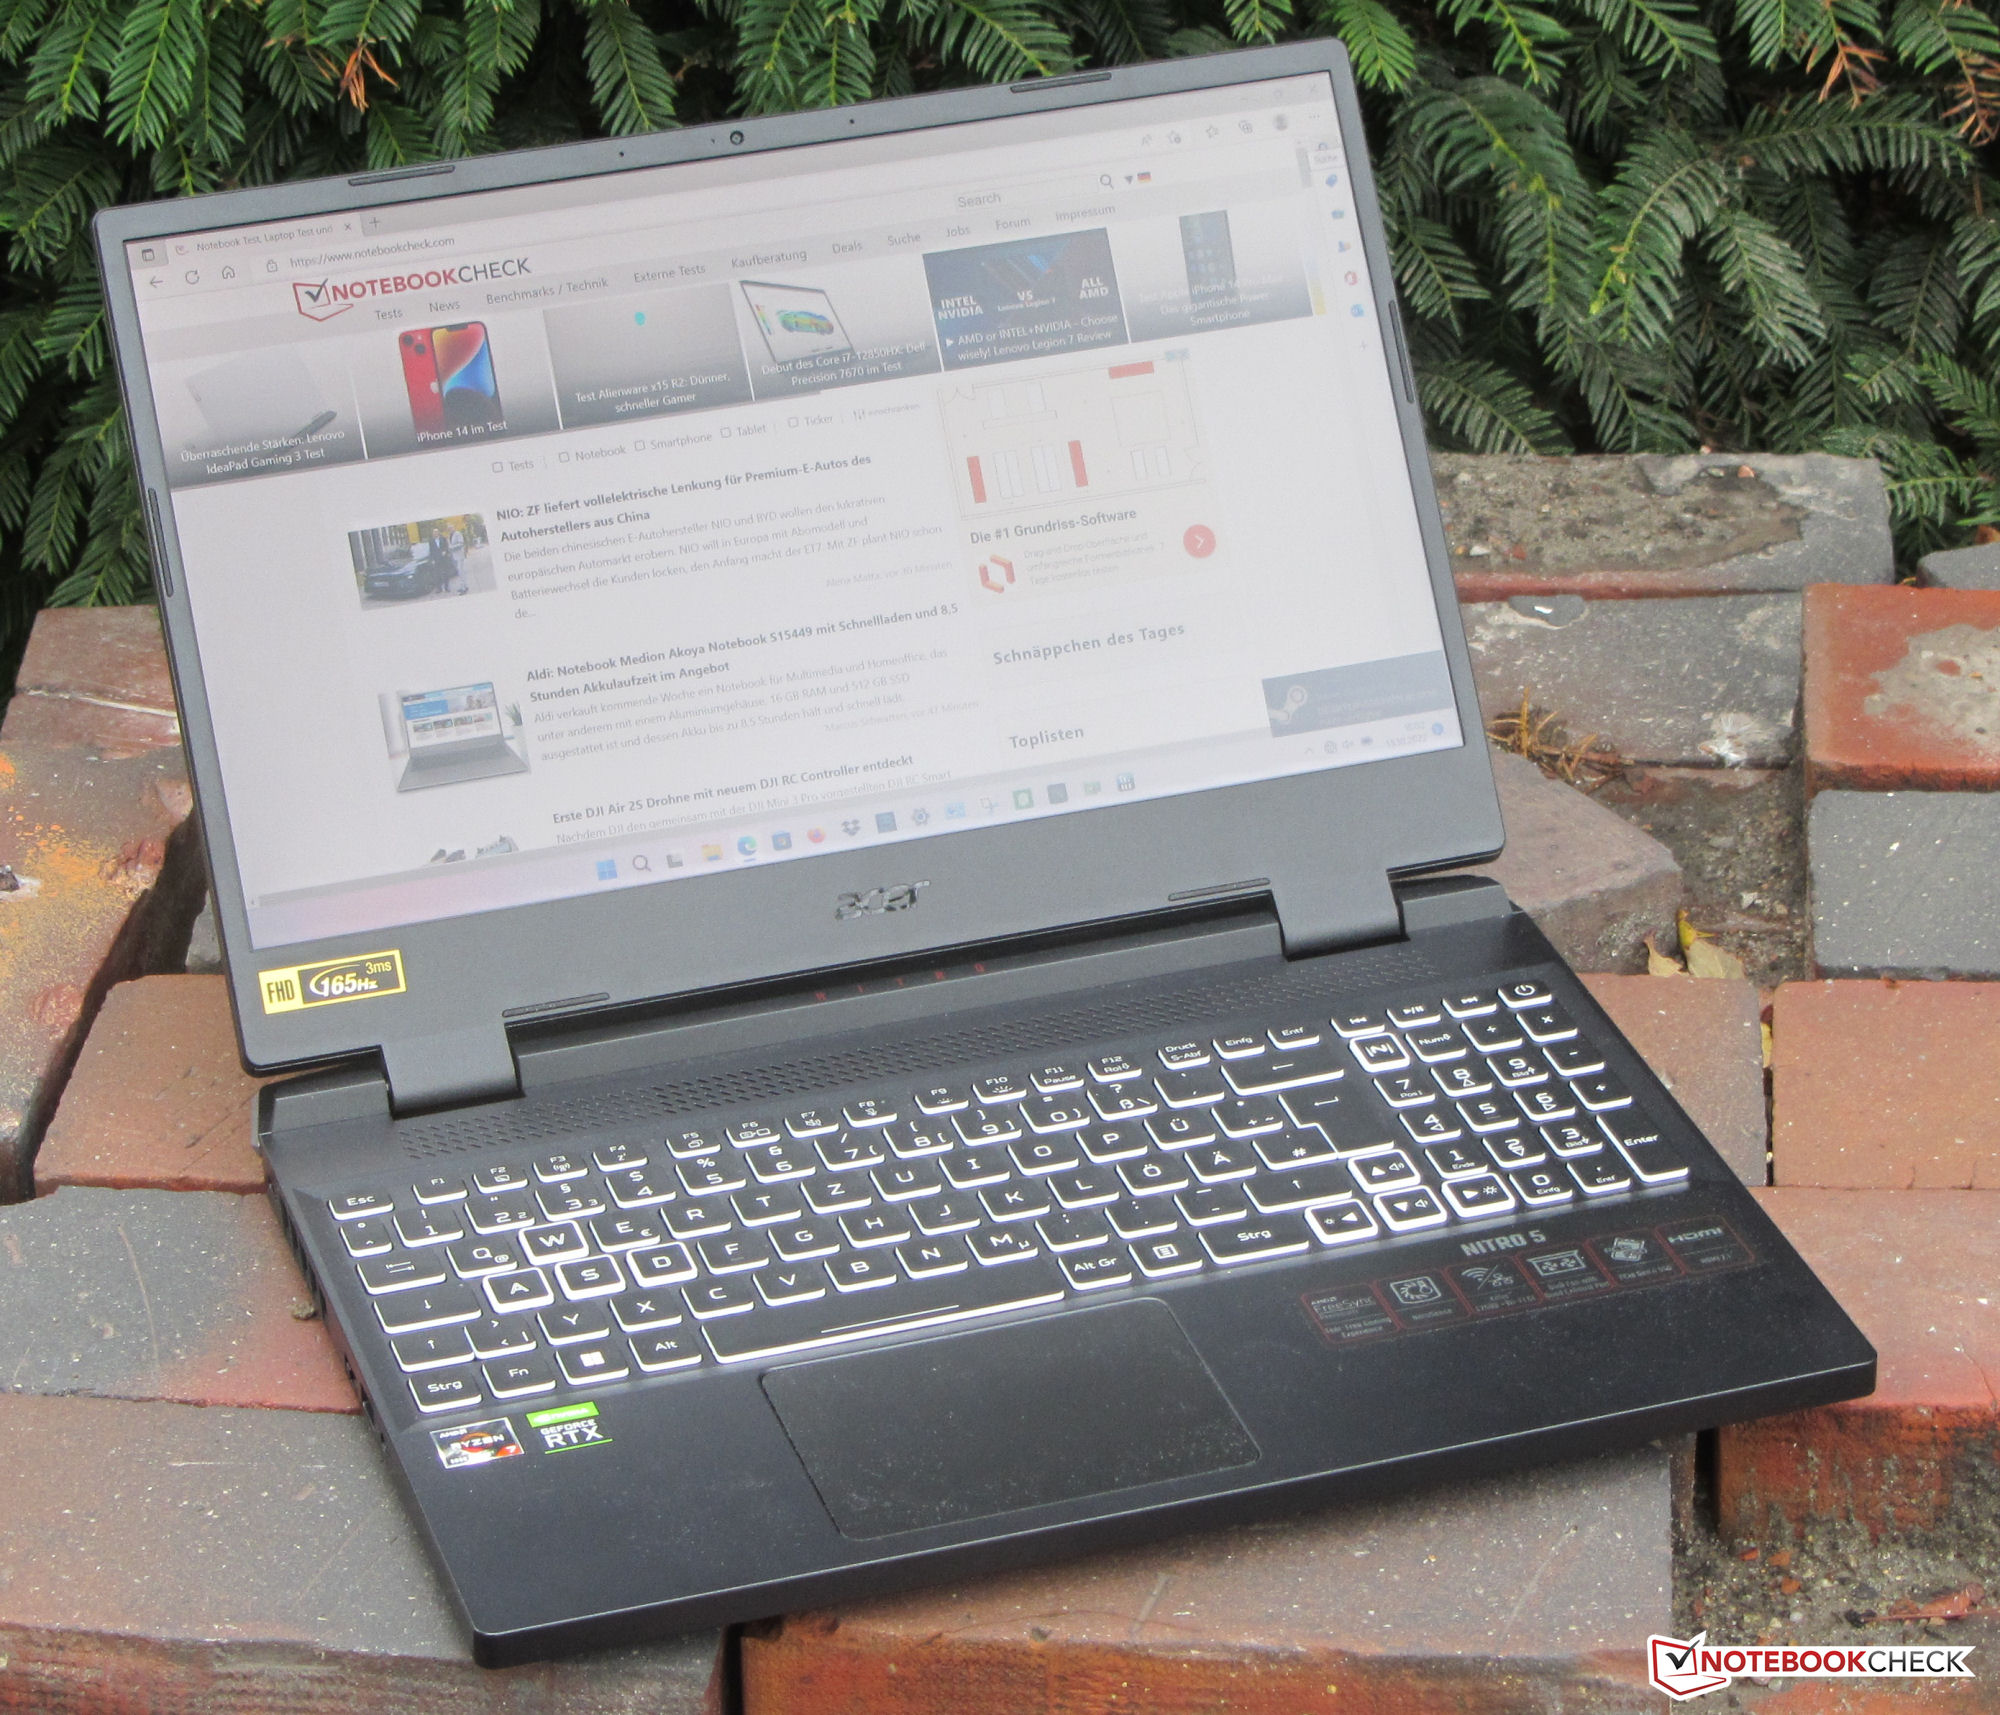
The IPS panel has stable viewing angles and can be read from any position. It can also be used outdoors, provided the sun isn't too bright.

Performance - Nitro notebook with Ampere and Rembrandt
The Acer Nitro 5 AN515 - a 15.6-inch gaming notebook - is available in a whole range of configurations and can be equipped with either an Intel or an AMD processor. The entry-level configuration is currently available for approximately 800 euros (Core i5-11400H, RTX 3050, 8 GB of RAM, 512-GB SSD, no Windows). The most expensive model (Ryzen 9 6900HX, RTX 3070 Ti, 32 GB of RAM, 1-TB SSD) has a price tag of 2,400 euros.
Testing Conditions
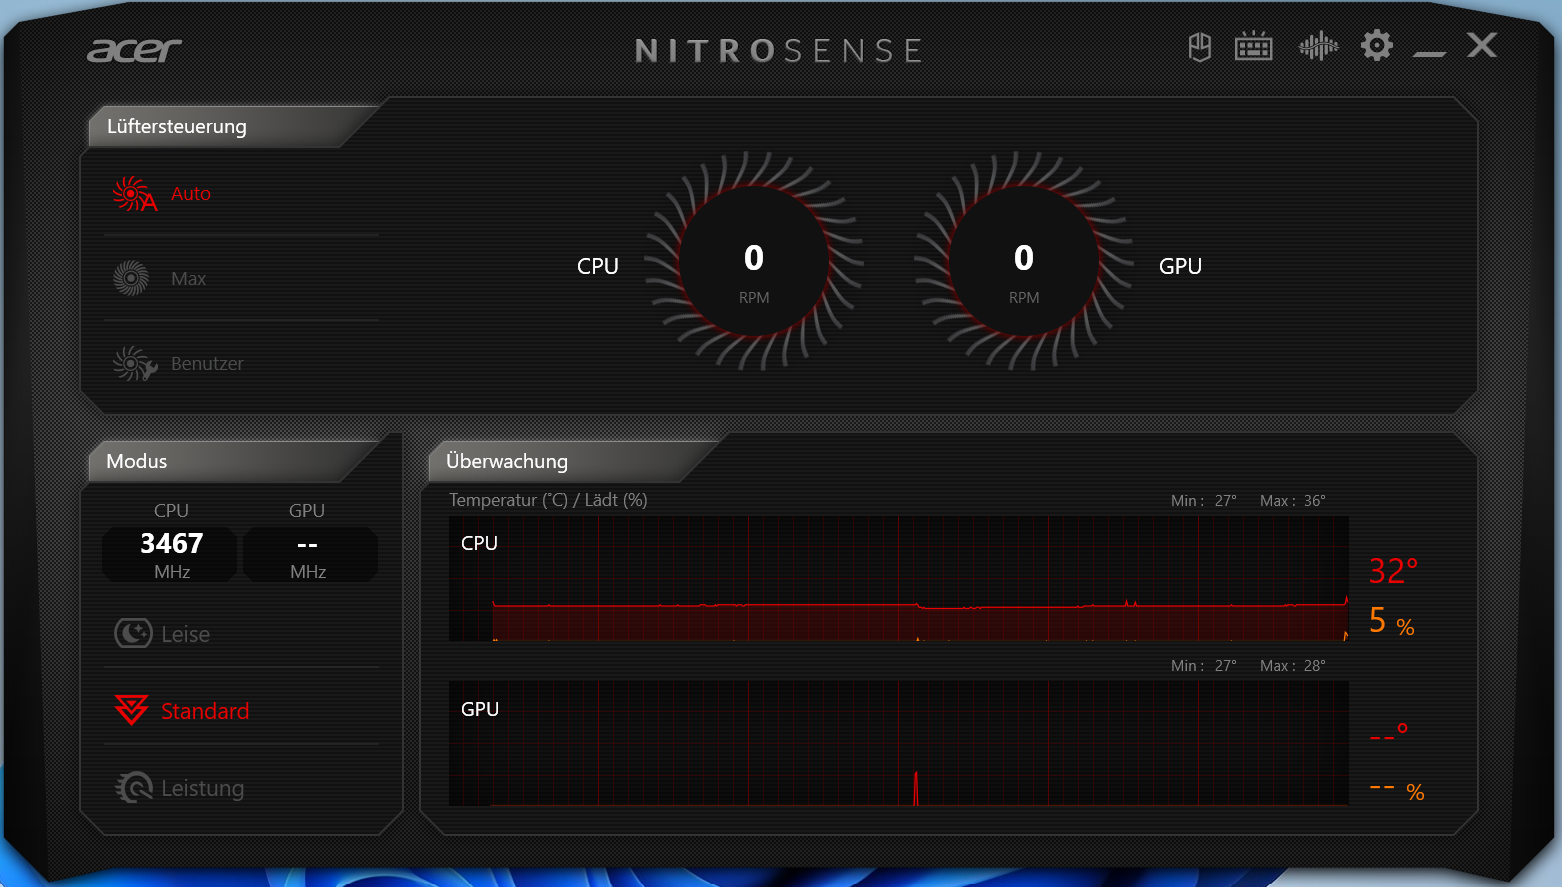
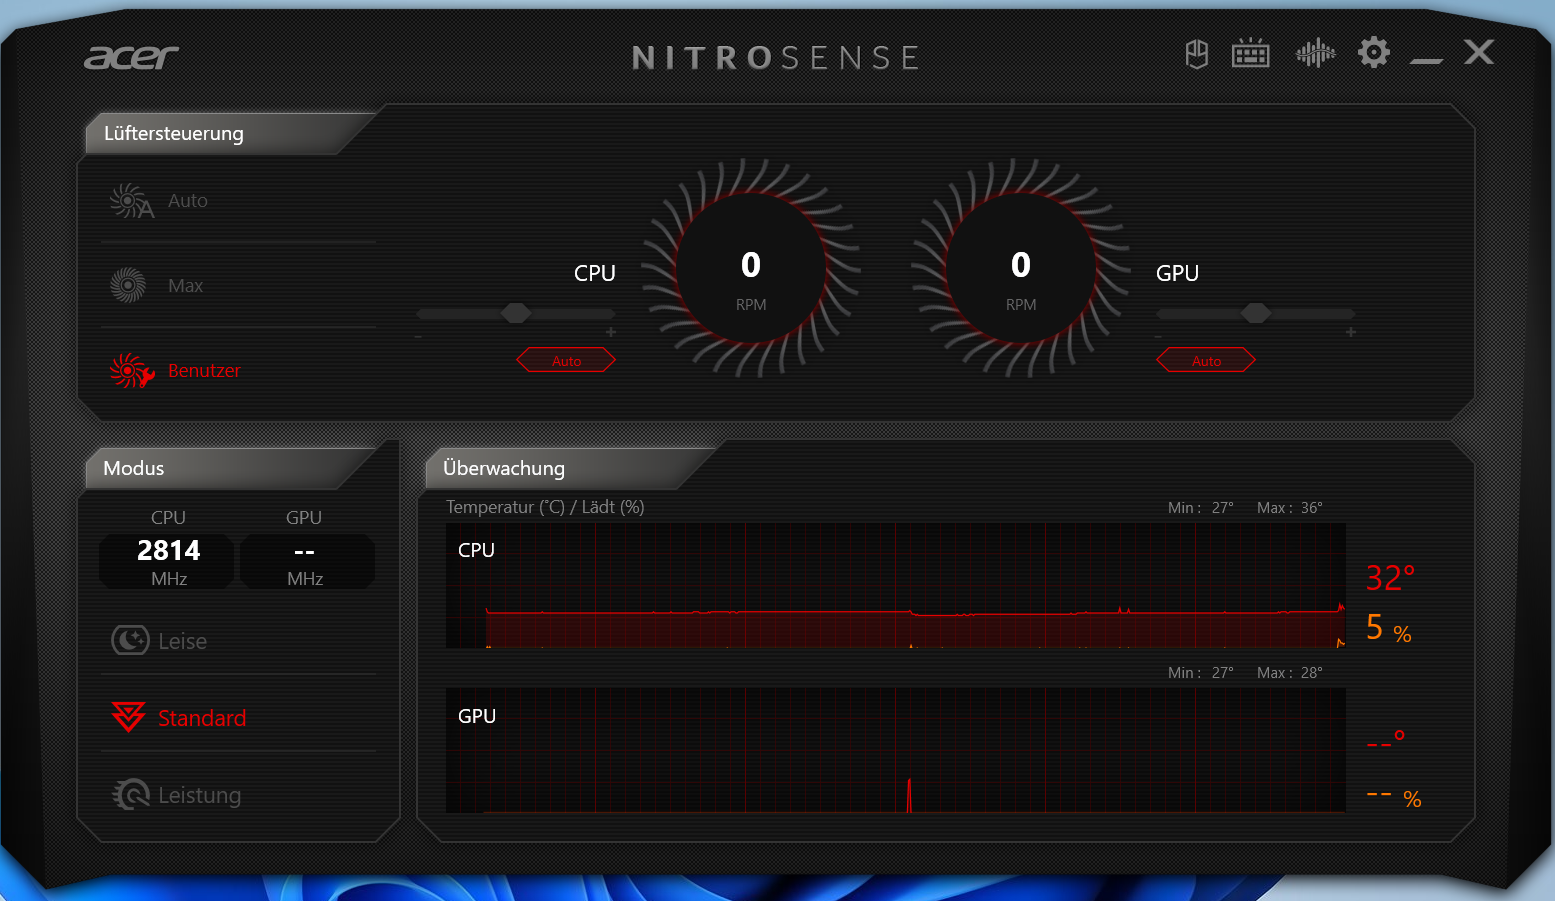
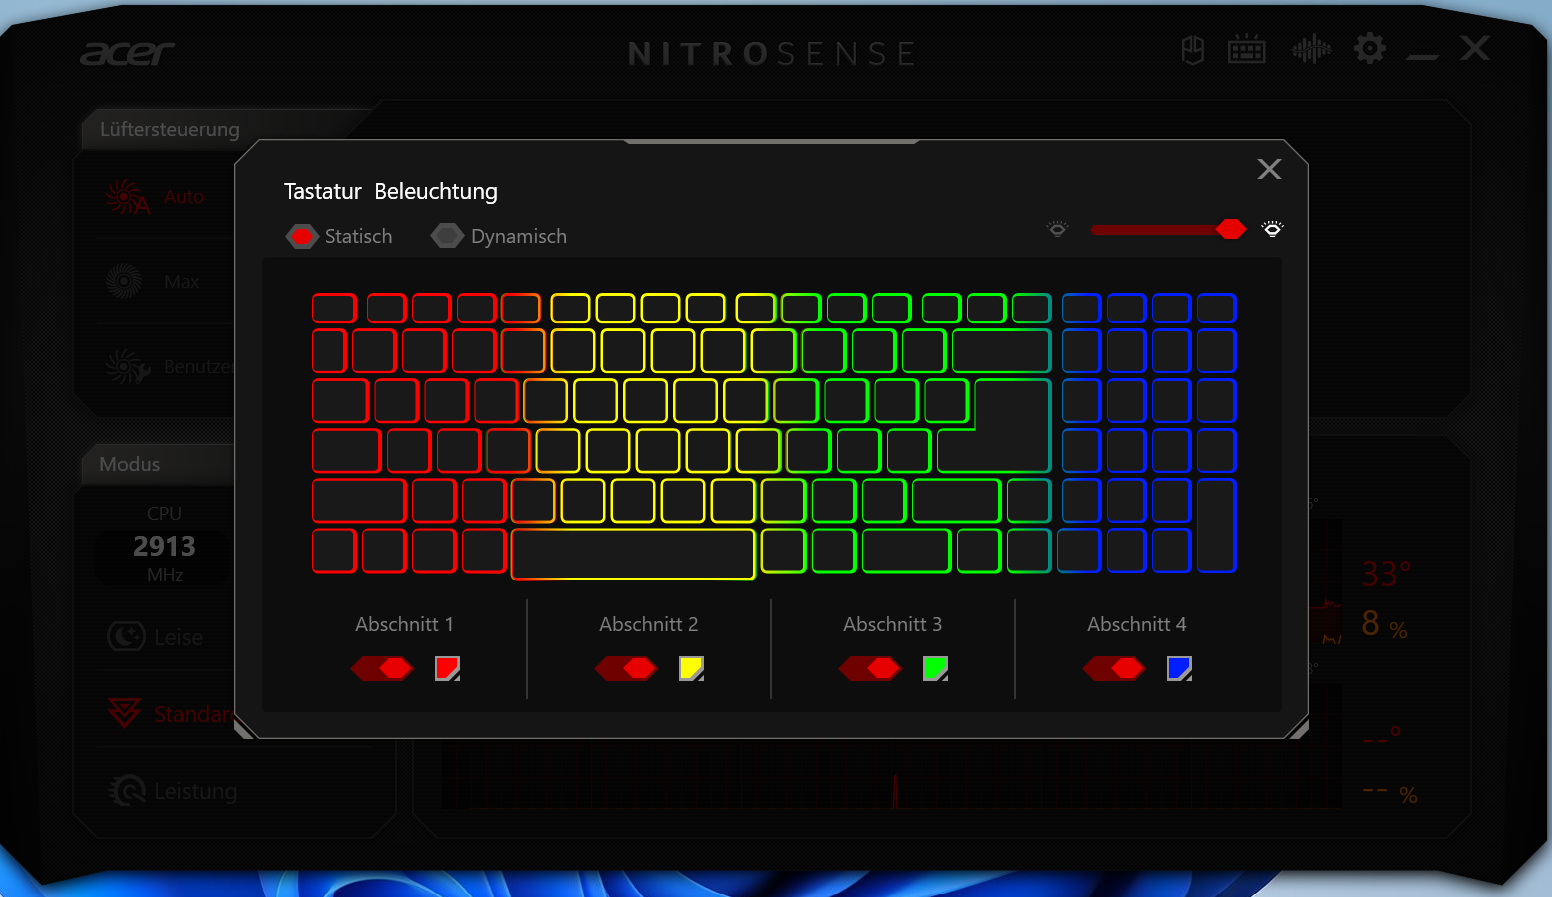
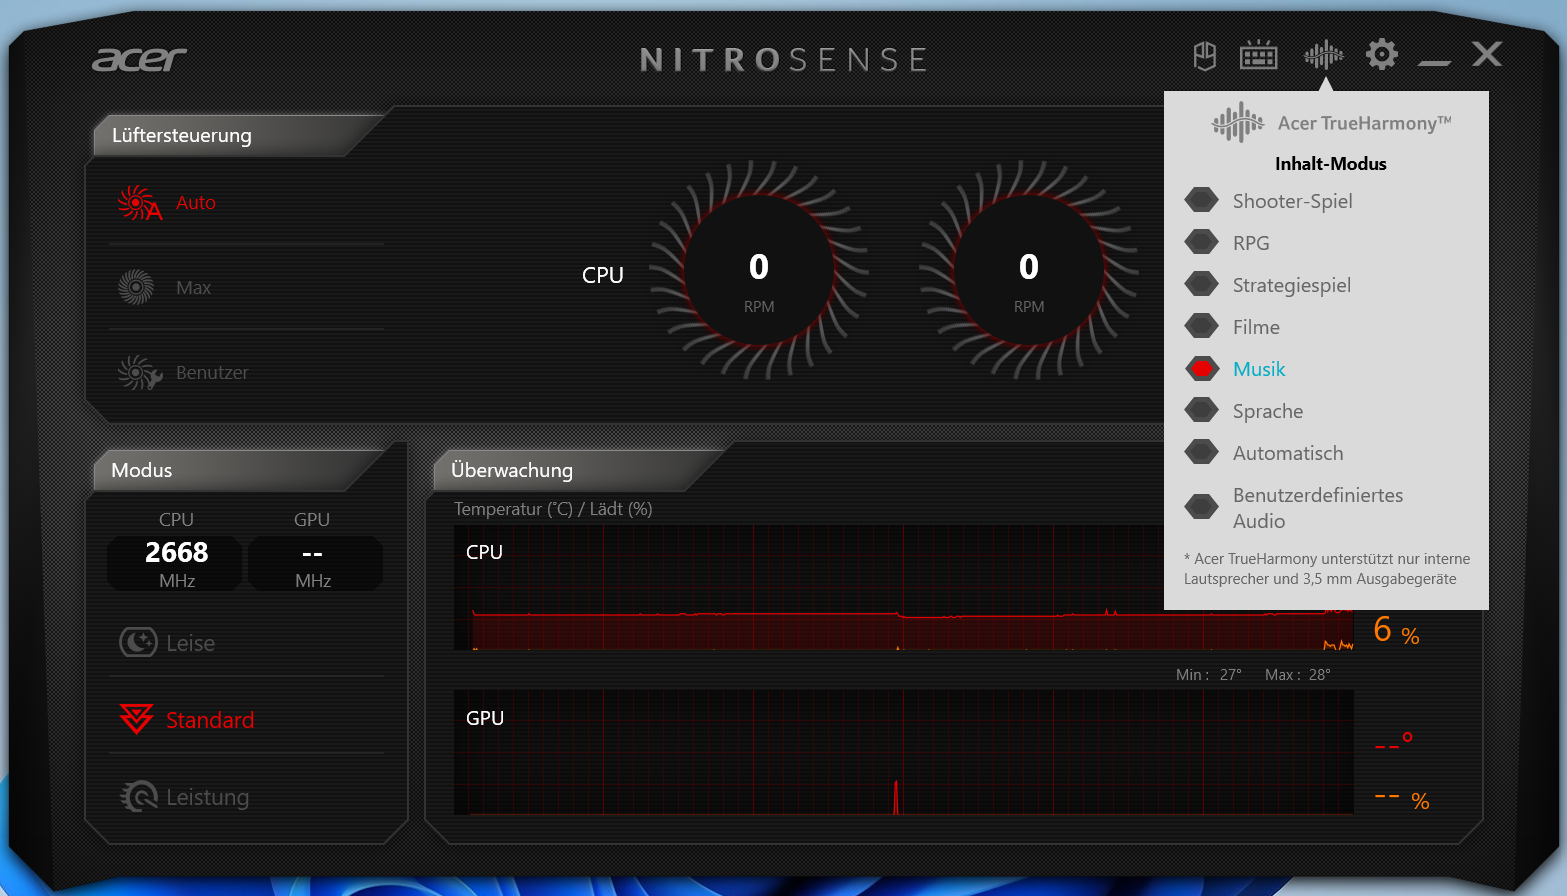
The pre-installed NitroSense software (the laptop's control center, see images) can be used to switch between the performance profiles set by the manufacturer ("performance", "standard", and "quiet"). We performed all our tests with the "standard" profile and with fan control set to automatic. The CPU performance is the same in all performance profiles; GPU performance varies slightly.
Processor
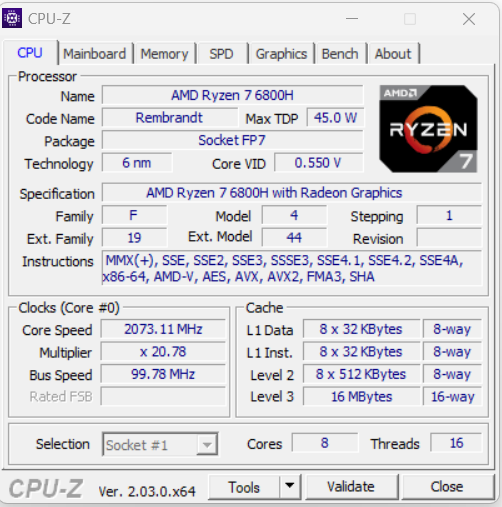
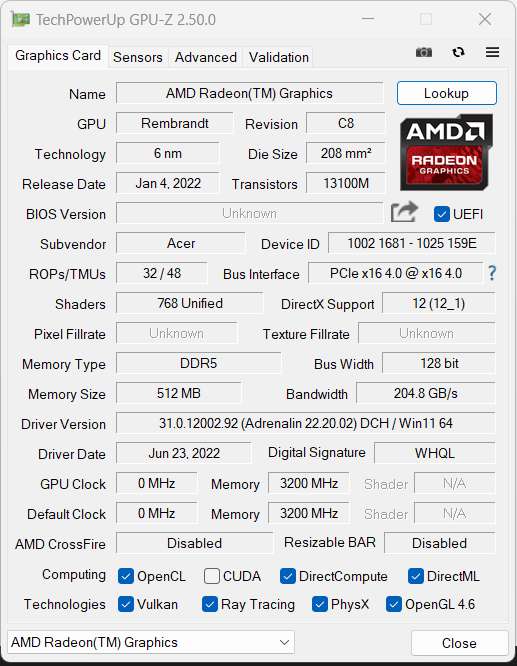
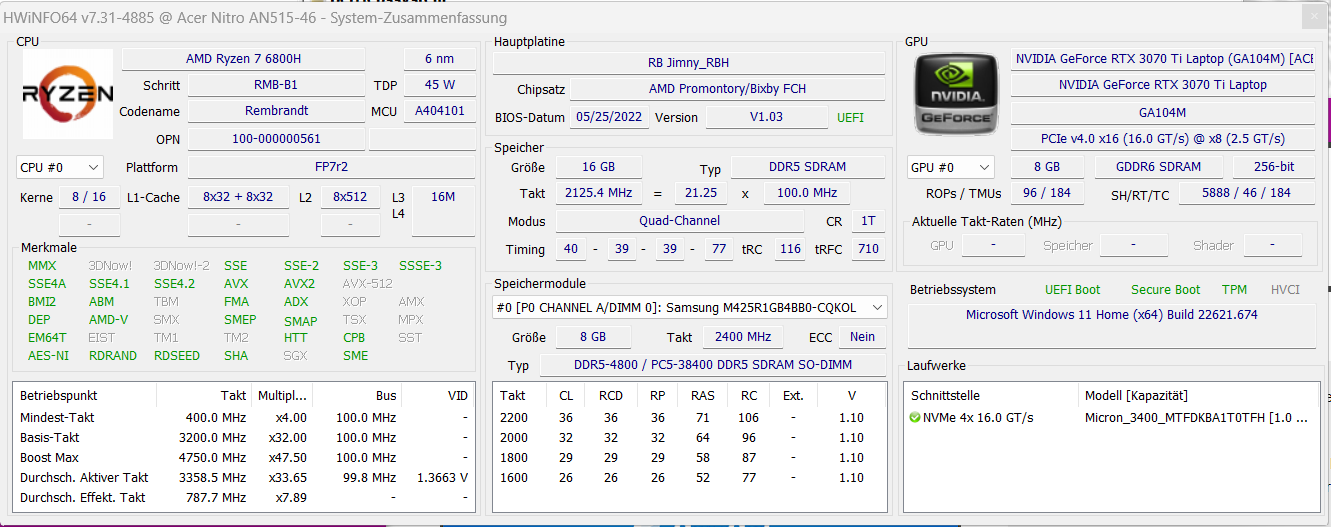
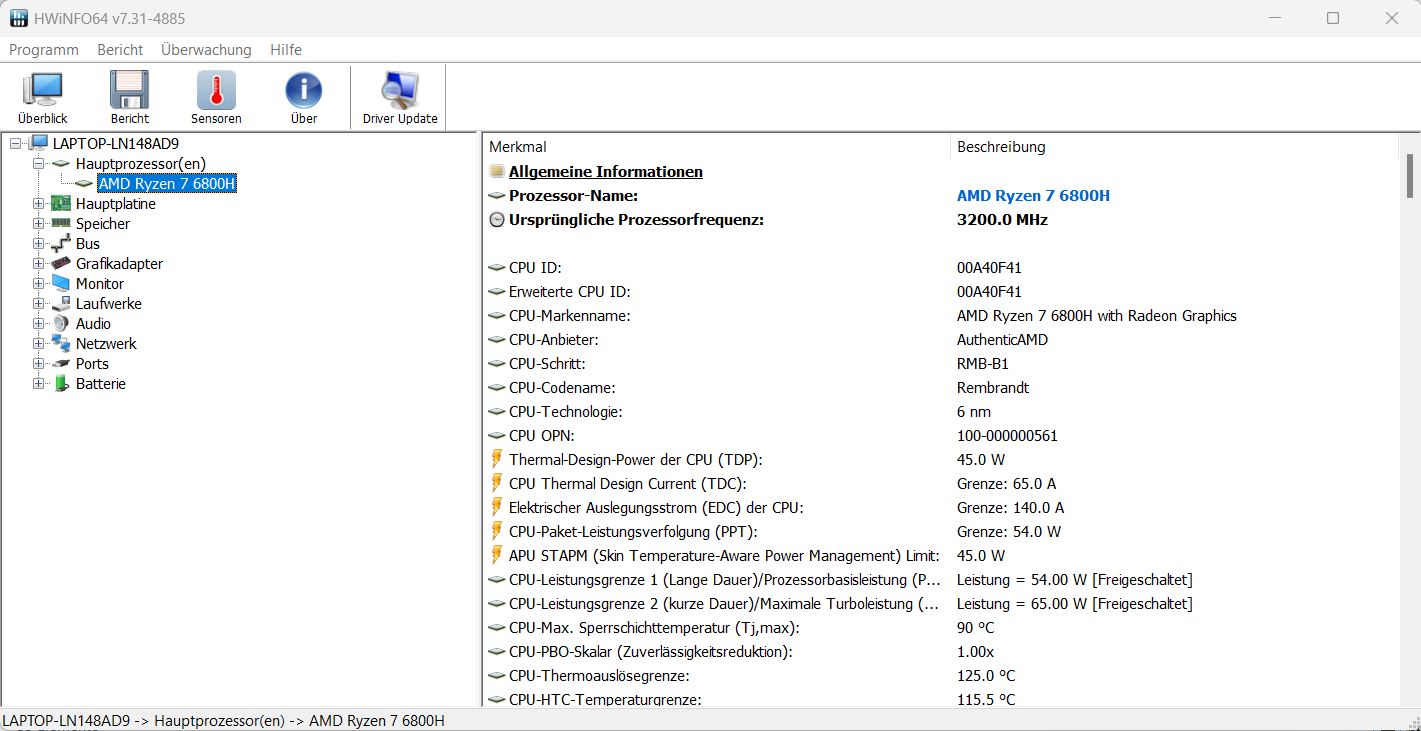
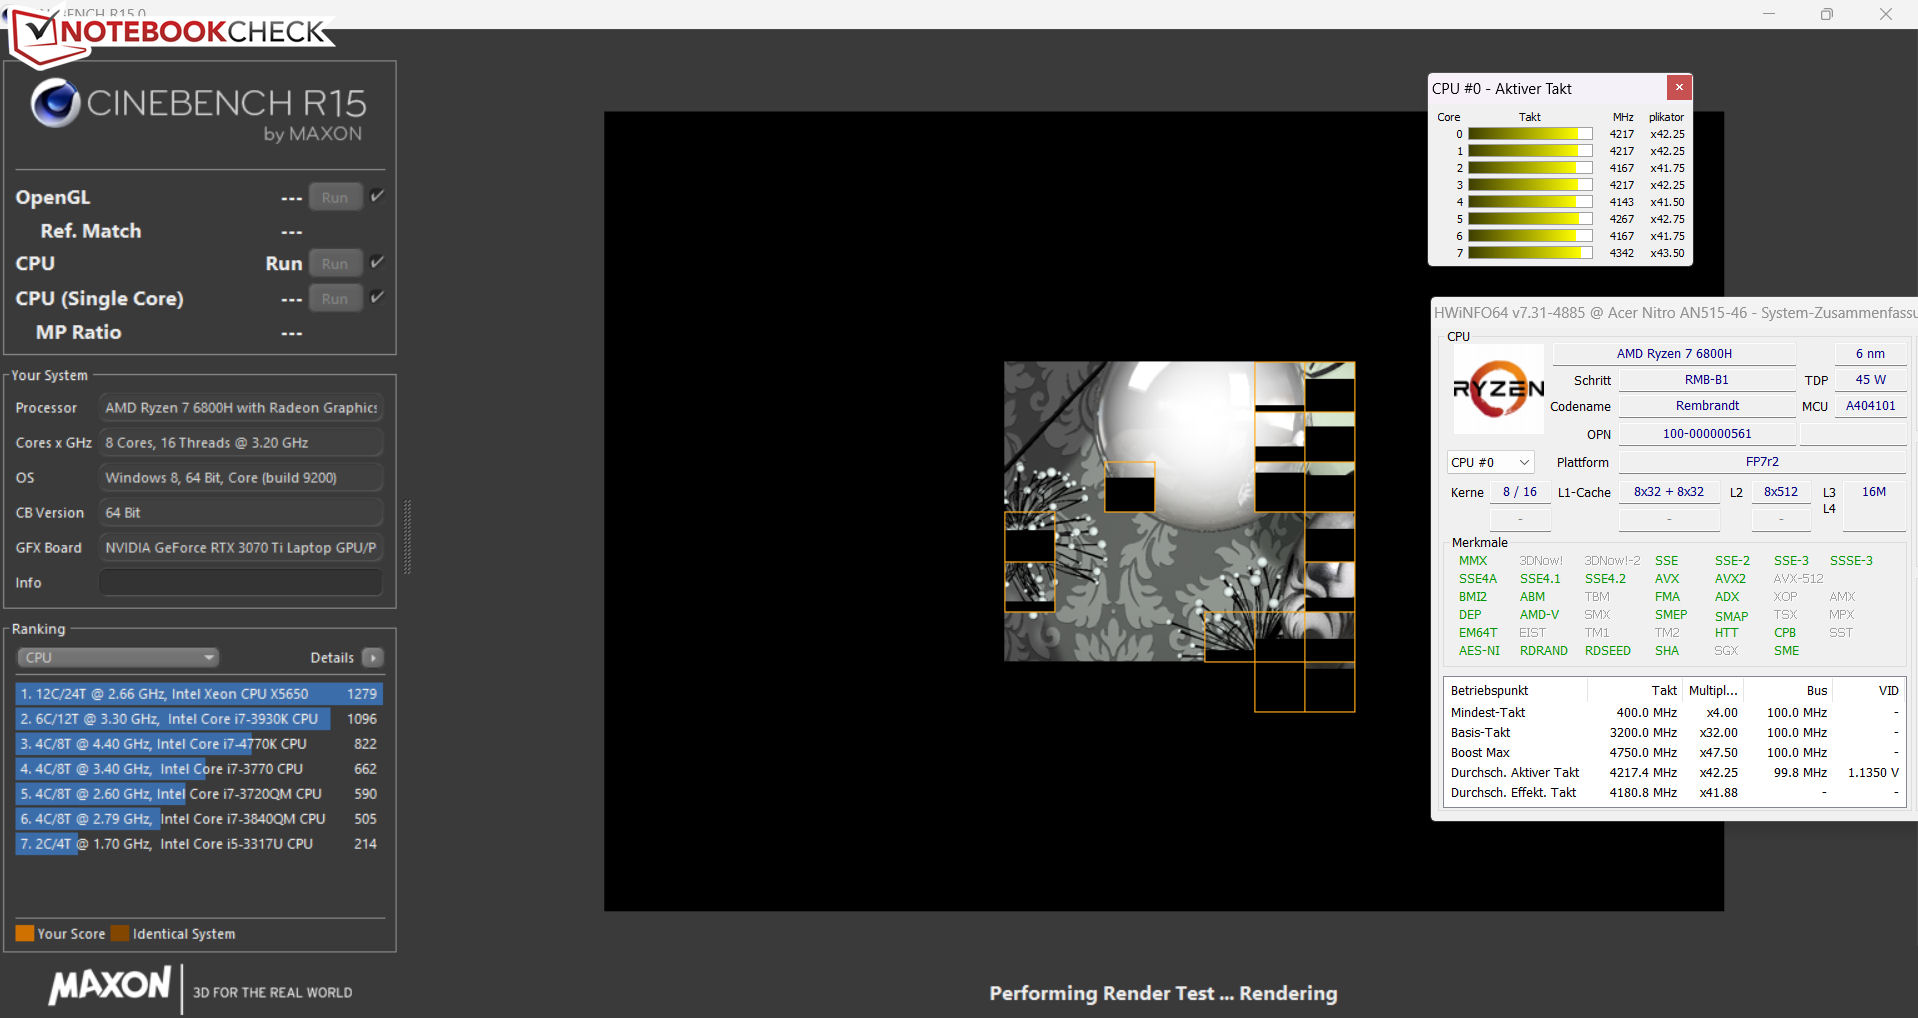
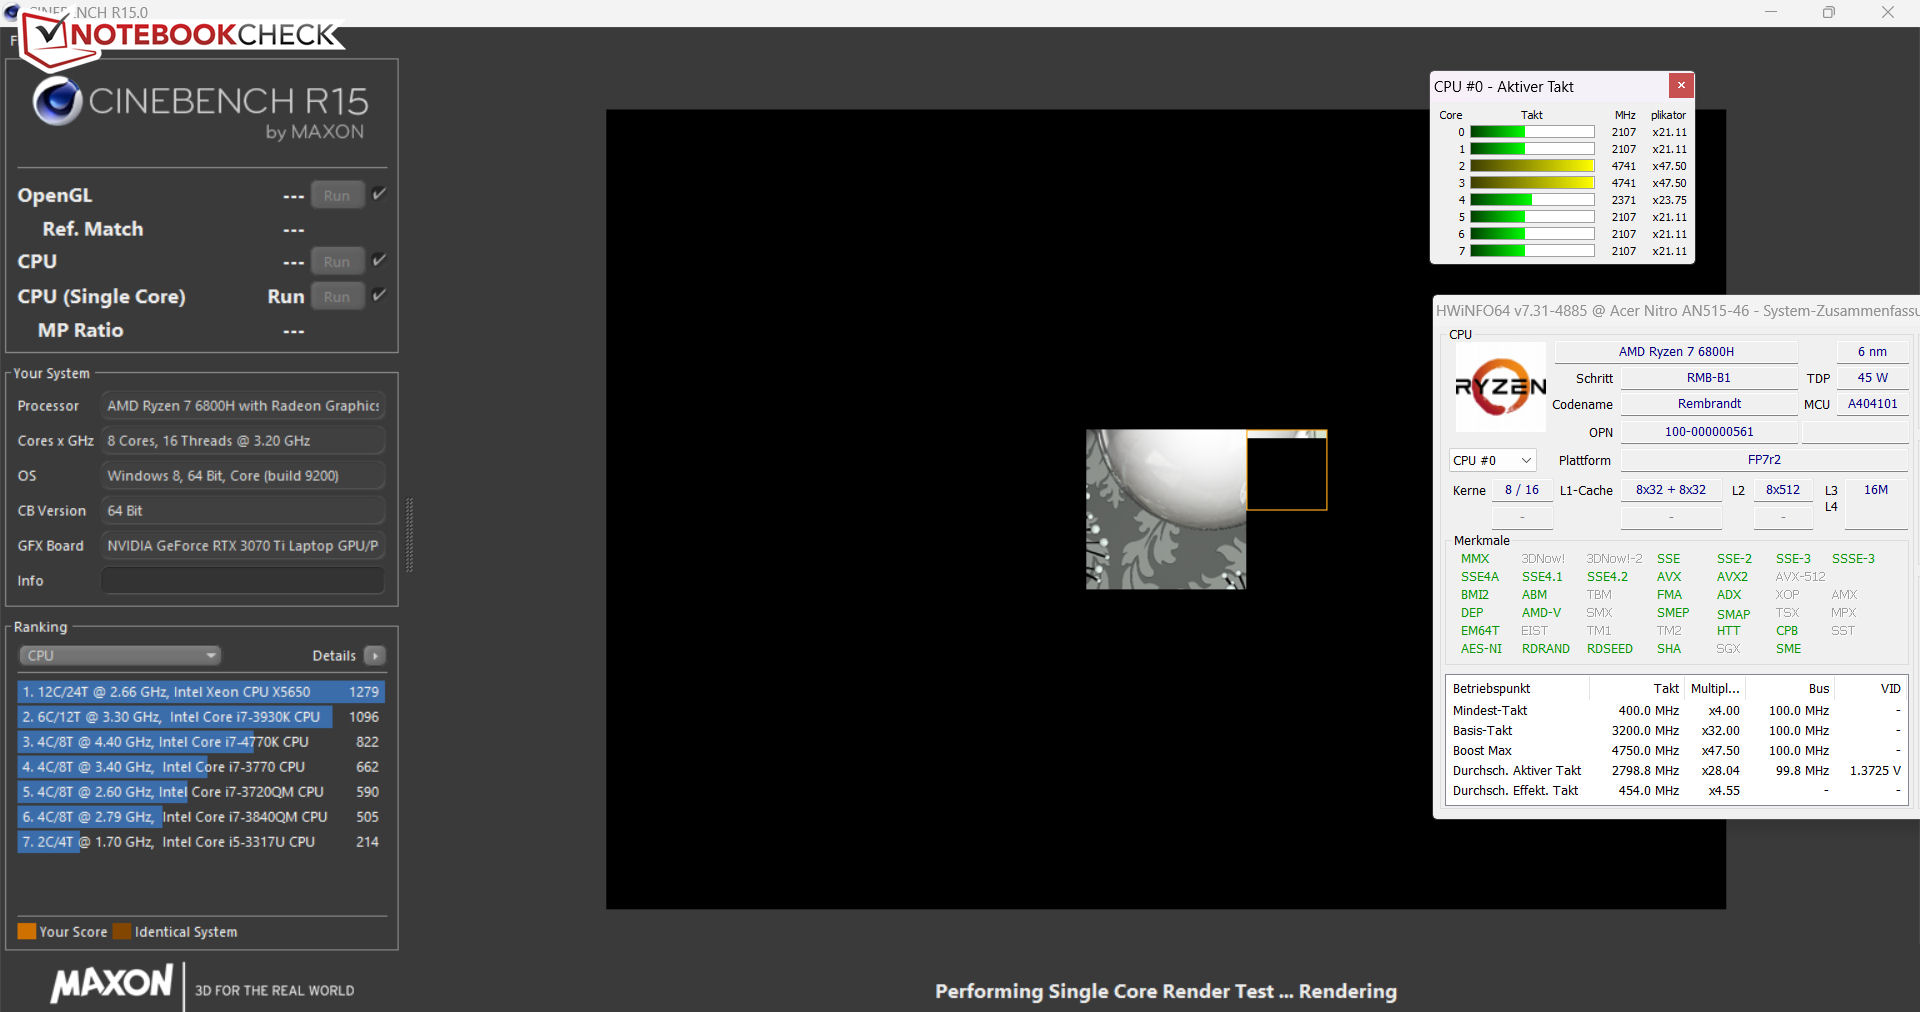
The CPU part of the Ryzen 7 6800H APU (Rembrandt) is made up of an octa-core processor with a basic clock rate of 3.2 GHz. The clock rate can increase up to 4.75 GHz thanks to the turbo. The chip supports simultaneous multi-threading (working two threads per core). The CPU benchmark results are the same across all three performance profiles.
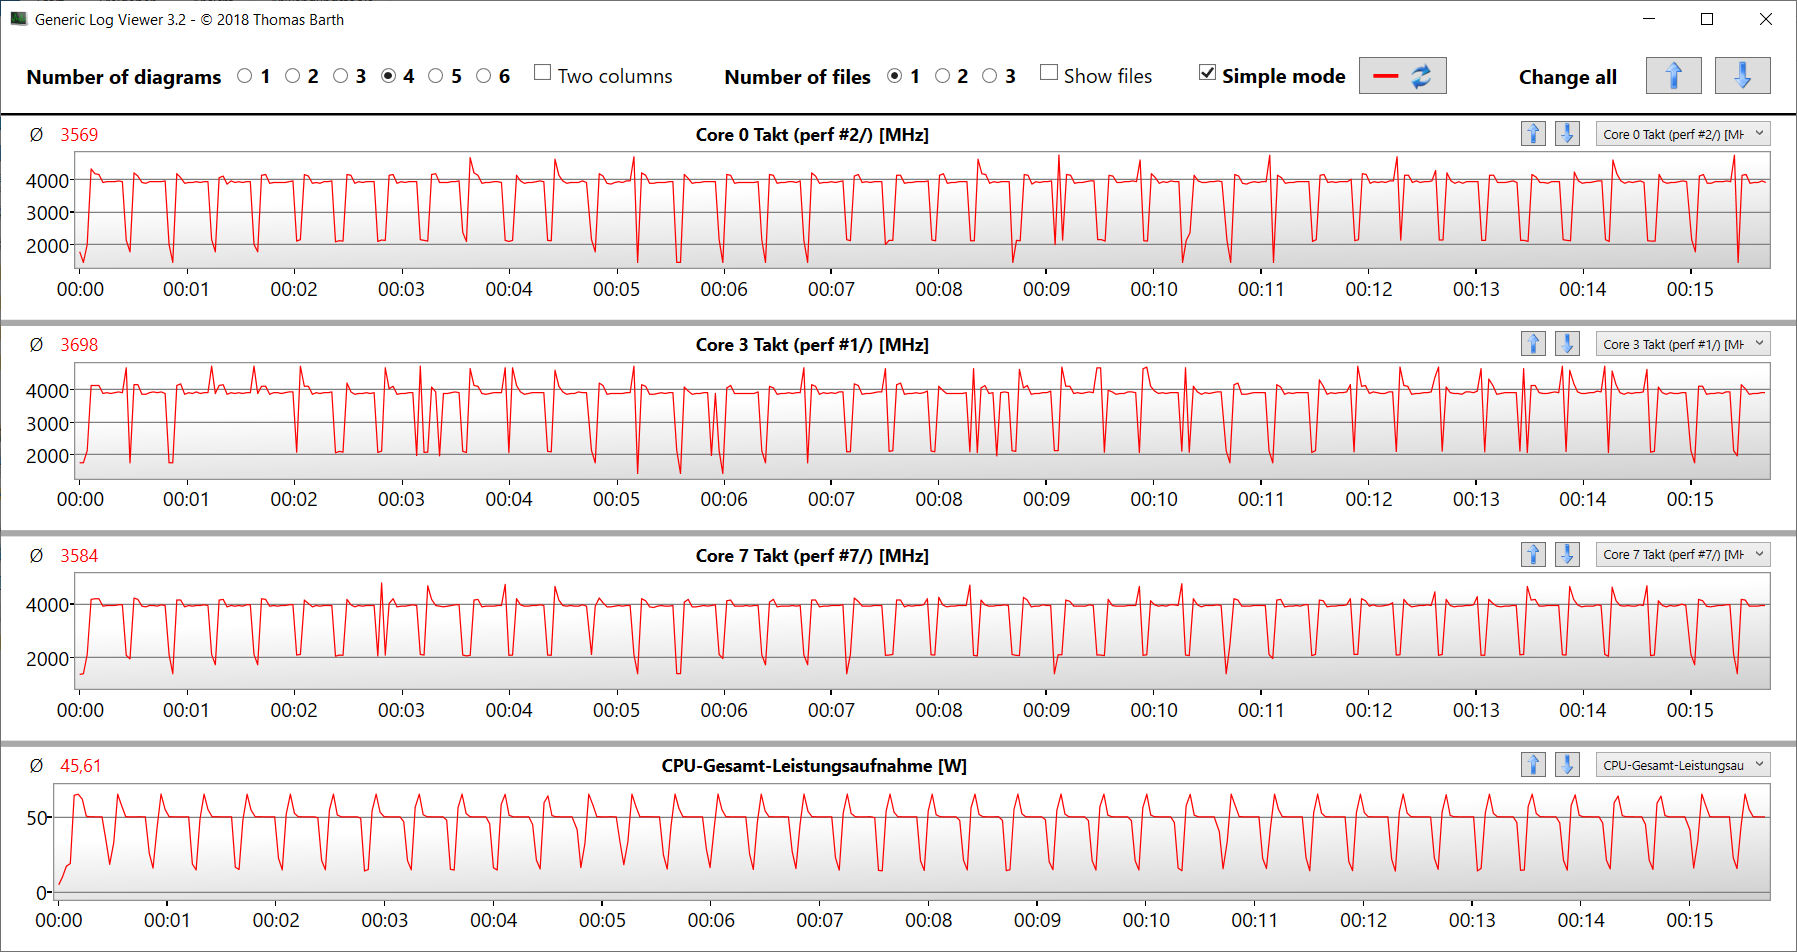
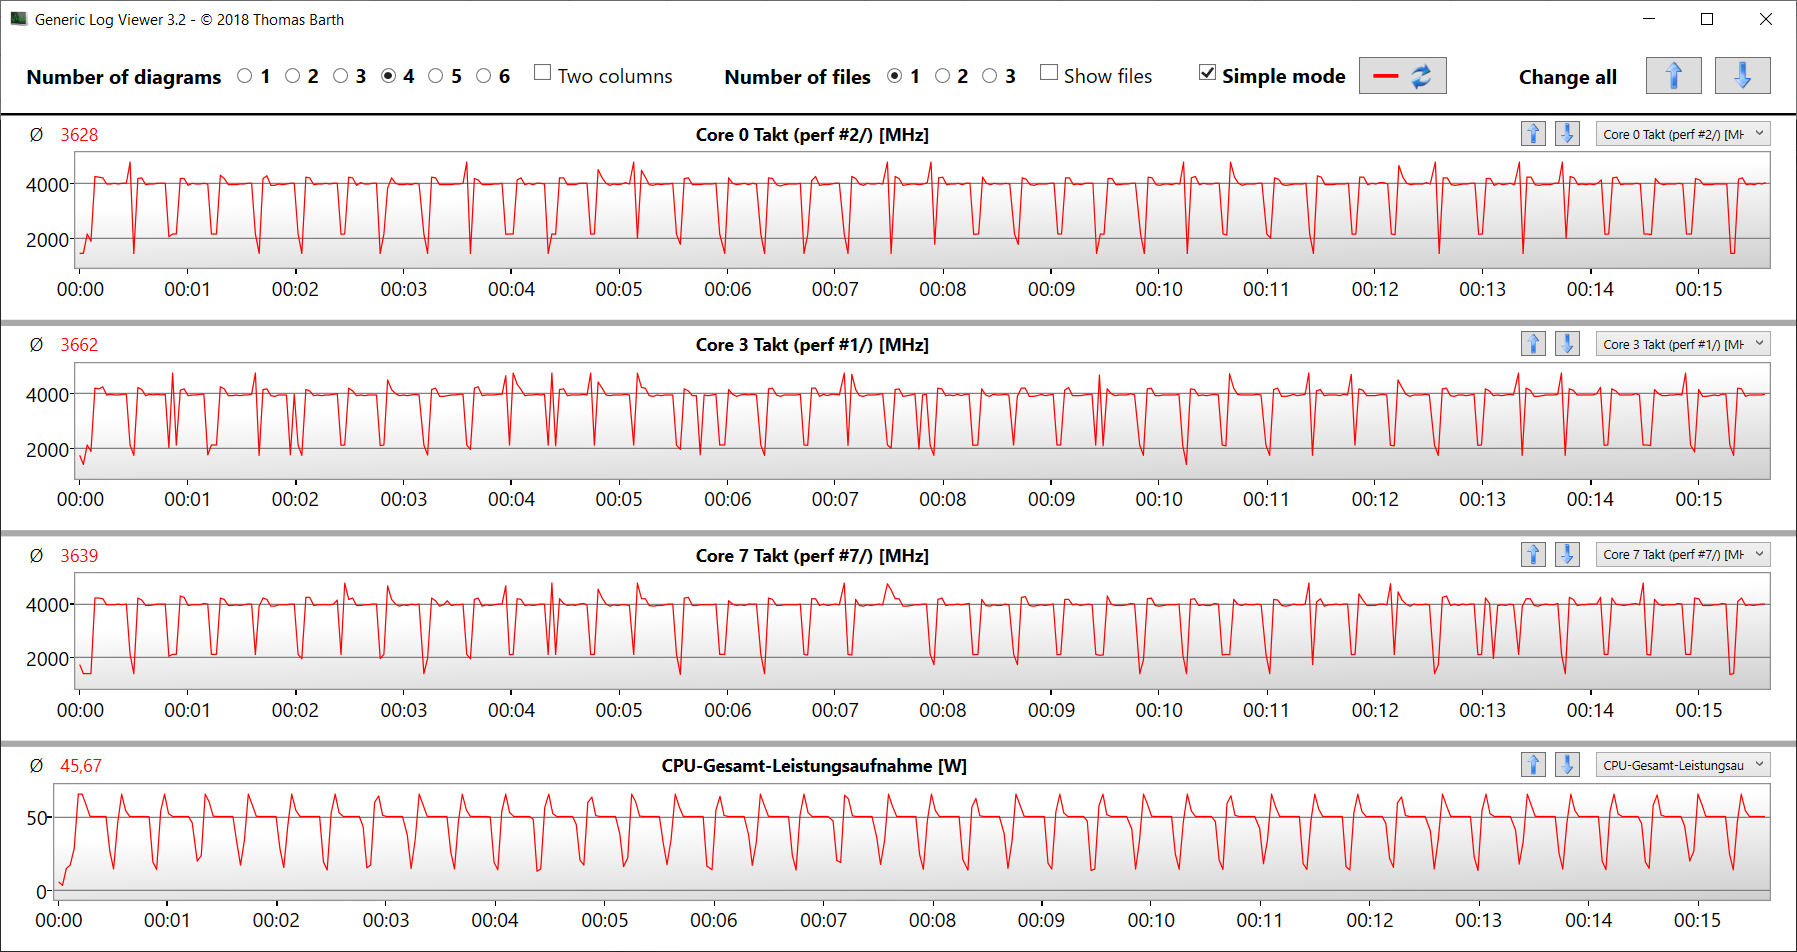
The Cinebench R15 multi-thread test resulted in clock rates between 4 and 4.2 GHz. The single-thread test was completed with 2 to 4.75 GHz. On battery, the CPU clocked at 2.5 GHz (multi-thread) and 1.2 to 2.5 GHz (single-thread). The CB15 loop benchmark confirmed that the CPU turbo can be used continuously.
The processor offers a good performance overall. It does fall behind Intel Alder Lake CPUs occasionally, especially when they can take advantage of their additional CPU cores.
Cinebench R15 Multi Loop
* ... smaller is better
AIDA64: FP32 Ray-Trace | FPU Julia | CPU SHA3 | CPU Queen | FPU SinJulia | FPU Mandel | CPU AES | CPU ZLib | FP64 Ray-Trace | CPU PhotoWorxx
| Performance rating | |
| Average of class Gaming | |
| Acer Nitro 5 AN515-46-R1A1 | |
| Average AMD Ryzen 7 6800H | |
| Schenker XMG Fusion 15 (Mid 22) | |
| Asus TUF Dash F15 FX517ZR | |
| MSI Katana GF66 12UGS | |
| Acer Nitro 5 AN515-58-72QR | |
| AIDA64 / FP32 Ray-Trace | |
| Average of class Gaming (7192 - 85542, n=141, last 2 years) | |
| Acer Nitro 5 AN515-46-R1A1 | |
| Average AMD Ryzen 7 6800H (12876 - 17031, n=8) | |
| Asus TUF Dash F15 FX517ZR | |
| Schenker XMG Fusion 15 (Mid 22) | |
| MSI Katana GF66 12UGS | |
| Acer Nitro 5 AN515-58-72QR | |
| AIDA64 / FPU Julia | |
| Average of class Gaming (35040 - 238426, n=141, last 2 years) | |
| Acer Nitro 5 AN515-46-R1A1 | |
| Average AMD Ryzen 7 6800H (82673 - 105987, n=8) | |
| Asus TUF Dash F15 FX517ZR | |
| Schenker XMG Fusion 15 (Mid 22) | |
| Acer Nitro 5 AN515-58-72QR | |
| MSI Katana GF66 12UGS | |
| AIDA64 / CPU SHA3 | |
| Average of class Gaming (1728 - 9817, n=141, last 2 years) | |
| Schenker XMG Fusion 15 (Mid 22) | |
| Acer Nitro 5 AN515-46-R1A1 | |
| Average AMD Ryzen 7 6800H (2886 - 3634, n=8) | |
| MSI Katana GF66 12UGS | |
| Acer Nitro 5 AN515-58-72QR | |
| Asus TUF Dash F15 FX517ZR | |
| AIDA64 / CPU Queen | |
| Average of class Gaming (50699 - 173351, n=141, last 2 years) | |
| Acer Nitro 5 AN515-46-R1A1 | |
| MSI Katana GF66 12UGS | |
| Acer Nitro 5 AN515-58-72QR | |
| Average AMD Ryzen 7 6800H (75117 - 106322, n=8) | |
| Asus TUF Dash F15 FX517ZR | |
| Schenker XMG Fusion 15 (Mid 22) | |
| AIDA64 / FPU SinJulia | |
| Average of class Gaming (5020 - 33636, n=141, last 2 years) | |
| Acer Nitro 5 AN515-46-R1A1 | |
| Average AMD Ryzen 7 6800H (11771 - 13120, n=8) | |
| Acer Nitro 5 AN515-58-72QR | |
| MSI Katana GF66 12UGS | |
| Schenker XMG Fusion 15 (Mid 22) | |
| Asus TUF Dash F15 FX517ZR | |
| AIDA64 / FPU Mandel | |
| Average of class Gaming (17585 - 128721, n=141, last 2 years) | |
| Acer Nitro 5 AN515-46-R1A1 | |
| Average AMD Ryzen 7 6800H (45287 - 58327, n=8) | |
| Schenker XMG Fusion 15 (Mid 22) | |
| Asus TUF Dash F15 FX517ZR | |
| Acer Nitro 5 AN515-58-72QR | |
| MSI Katana GF66 12UGS | |
| AIDA64 / CPU AES | |
| Schenker XMG Fusion 15 (Mid 22) | |
| Acer Nitro 5 AN515-46-R1A1 | |
| Average AMD Ryzen 7 6800H (67816 - 137383, n=8) | |
| Average of class Gaming (19065 - 247074, n=141, last 2 years) | |
| MSI Katana GF66 12UGS | |
| Asus TUF Dash F15 FX517ZR | |
| Acer Nitro 5 AN515-58-72QR | |
| AIDA64 / CPU ZLib | |
| Average of class Gaming (373 - 2531, n=141, last 2 years) | |
| Acer Nitro 5 AN515-58-72QR | |
| MSI Katana GF66 12UGS | |
| Asus TUF Dash F15 FX517ZR | |
| Acer Nitro 5 AN515-46-R1A1 | |
| Average AMD Ryzen 7 6800H (732 - 901, n=8) | |
| Schenker XMG Fusion 15 (Mid 22) | |
| AIDA64 / FP64 Ray-Trace | |
| Average of class Gaming (3856 - 45446, n=141, last 2 years) | |
| Acer Nitro 5 AN515-46-R1A1 | |
| Average AMD Ryzen 7 6800H (6917 - 8980, n=8) | |
| Asus TUF Dash F15 FX517ZR | |
| Schenker XMG Fusion 15 (Mid 22) | |
| Acer Nitro 5 AN515-58-72QR | |
| MSI Katana GF66 12UGS | |
| AIDA64 / CPU PhotoWorxx | |
| Average of class Gaming (10805 - 62916, n=141, last 2 years) | |
| Asus TUF Dash F15 FX517ZR | |
| Average AMD Ryzen 7 6800H (26496 - 30360, n=8) | |
| Acer Nitro 5 AN515-46-R1A1 | |
| MSI Katana GF66 12UGS | |
| Schenker XMG Fusion 15 (Mid 22) | |
| Acer Nitro 5 AN515-58-72QR | |
System Performance
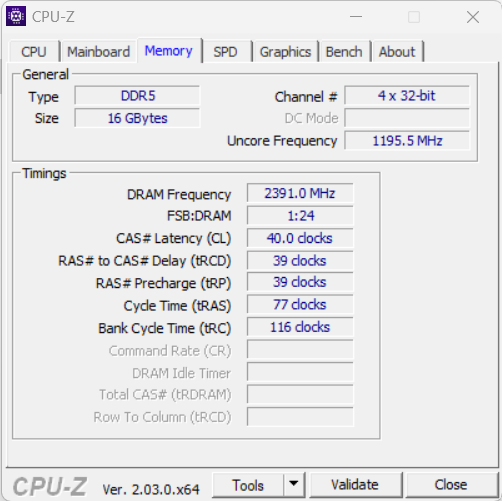
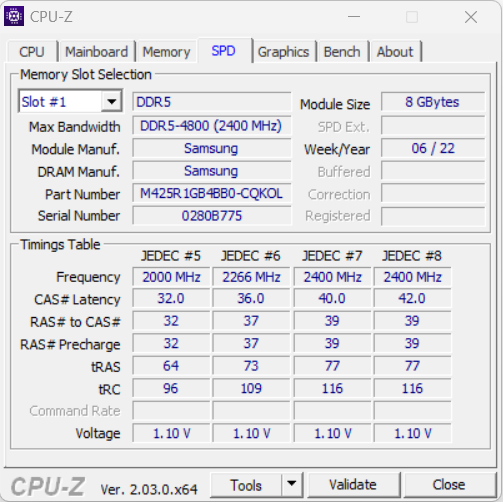
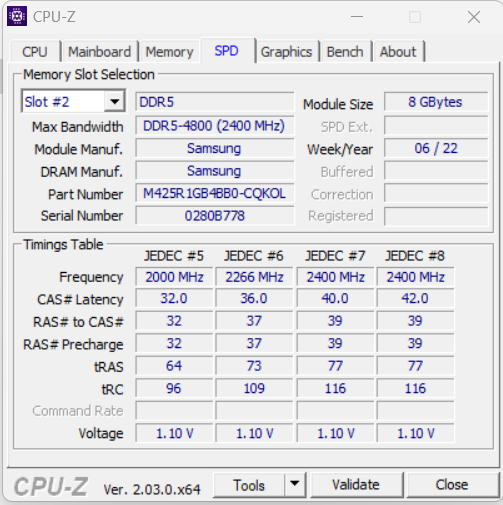
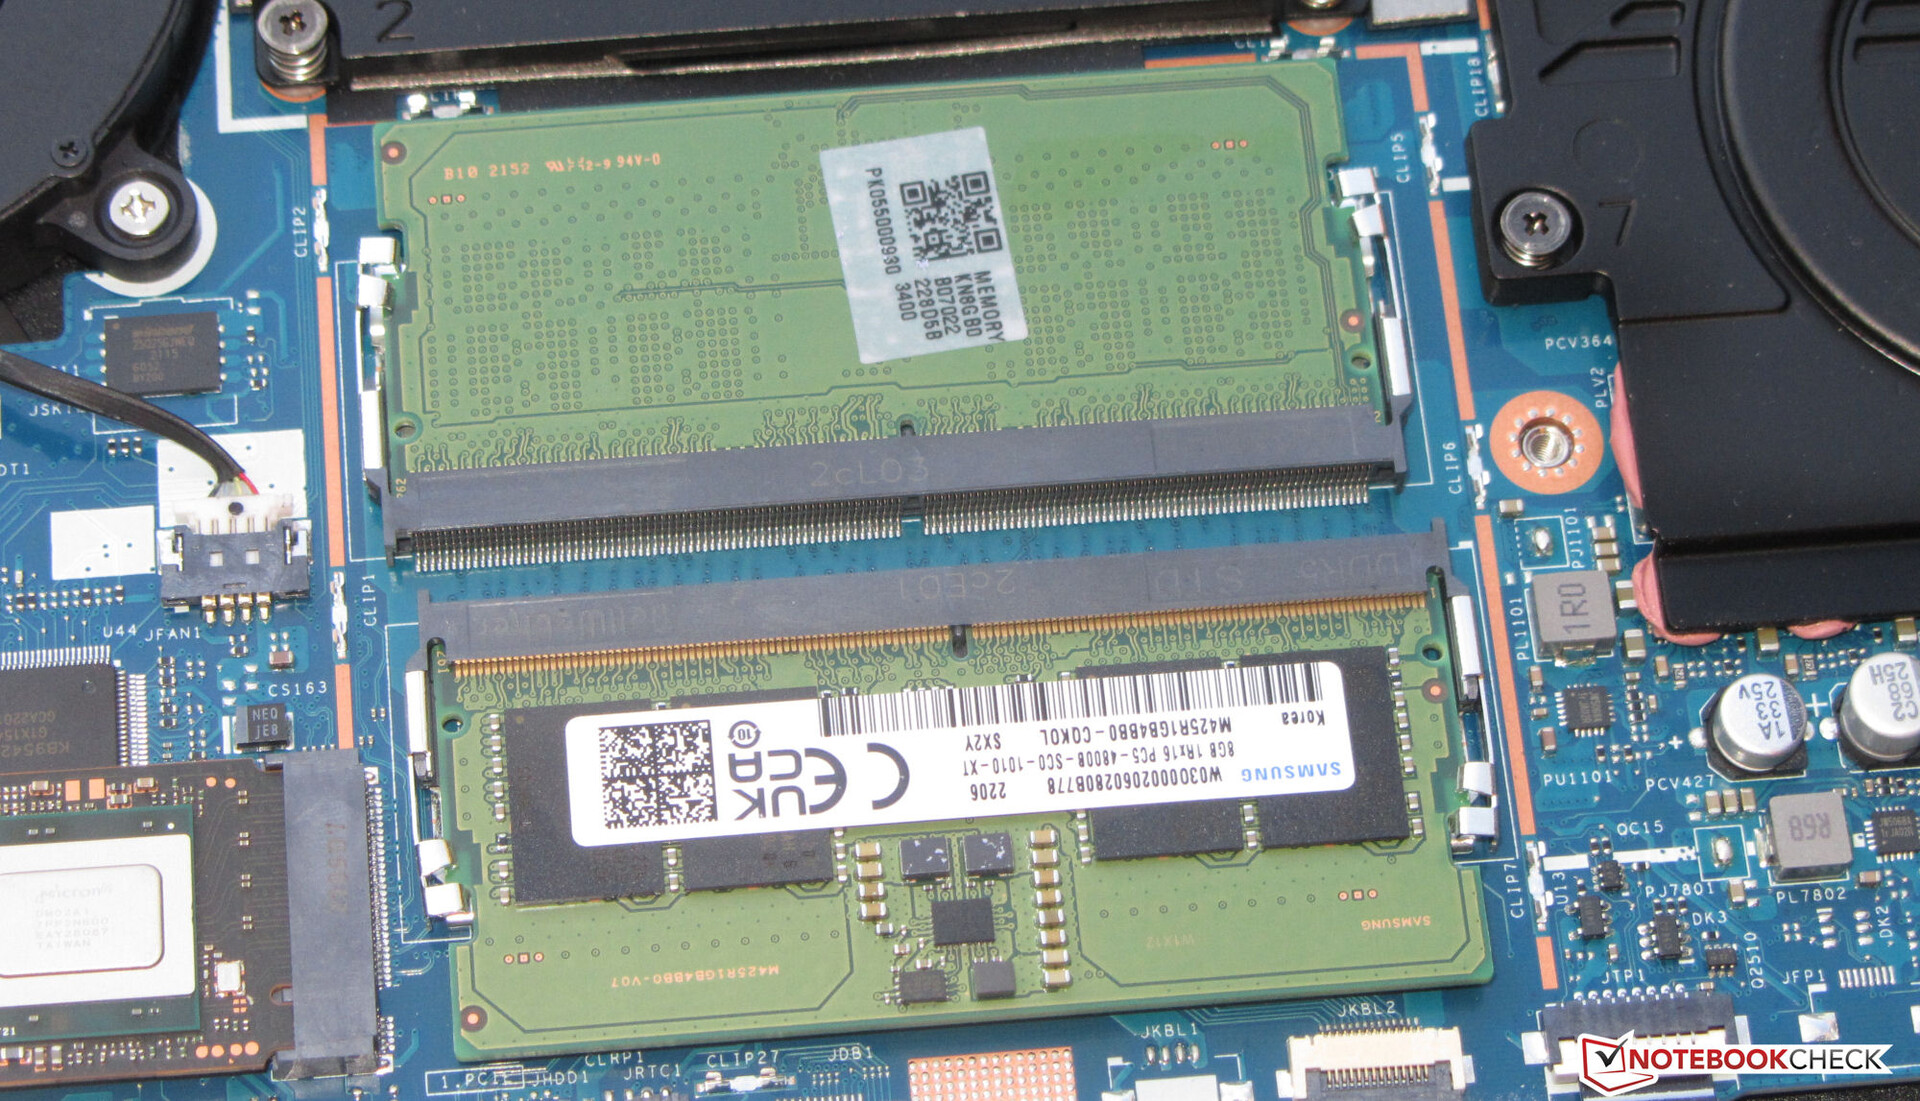
The well-rounded and smooth-running system offers sufficient computing power for demanding applications such as rendering, video processing and gaming. The PCMark results are good. The RAM's transfer rates (DDR5-4800) are slightly lower than those of comparable notebooks such as the Asus TUF Dash F15.
CrossMark: Overall | Productivity | Creativity | Responsiveness
| PCMark 10 / Score | |
| Average of class Gaming (5776 - 9647, n=119, last 2 years) | |
| MSI Katana GF66 12UGS | |
| Average AMD Ryzen 7 6800H, NVIDIA GeForce RTX 3070 Ti Laptop GPU (6783 - 7549, n=2) | |
| Acer Nitro 5 AN515-58-72QR | |
| Asus TUF Dash F15 FX517ZR | |
| Acer Nitro 5 AN515-46-R1A1 | |
| Schenker XMG Fusion 15 (Mid 22) | |
| PCMark 10 / Essentials | |
| Average of class Gaming (8840 - 12600, n=123, last 2 years) | |
| Average AMD Ryzen 7 6800H, NVIDIA GeForce RTX 3070 Ti Laptop GPU (10343 - 10472, n=2) | |
| MSI Katana GF66 12UGS | |
| Acer Nitro 5 AN515-46-R1A1 | |
| Asus TUF Dash F15 FX517ZR | |
| Acer Nitro 5 AN515-58-72QR | |
| Schenker XMG Fusion 15 (Mid 22) | |
| PCMark 10 / Productivity | |
| MSI Katana GF66 12UGS | |
| Average of class Gaming (6662 - 14612, n=119, last 2 years) | |
| Asus TUF Dash F15 FX517ZR | |
| Average AMD Ryzen 7 6800H, NVIDIA GeForce RTX 3070 Ti Laptop GPU (8991 - 9479, n=2) | |
| Acer Nitro 5 AN515-58-72QR | |
| Acer Nitro 5 AN515-46-R1A1 | |
| Schenker XMG Fusion 15 (Mid 22) | |
| PCMark 10 / Digital Content Creation | |
| Average of class Gaming (7440 - 19351, n=119, last 2 years) | |
| MSI Katana GF66 12UGS | |
| Average AMD Ryzen 7 6800H, NVIDIA GeForce RTX 3070 Ti Laptop GPU (9108 - 11759, n=2) | |
| Acer Nitro 5 AN515-58-72QR | |
| Asus TUF Dash F15 FX517ZR | |
| Acer Nitro 5 AN515-46-R1A1 | |
| Schenker XMG Fusion 15 (Mid 22) | |
| CrossMark / Overall | |
| Average of class Gaming (1247 - 2344, n=114, last 2 years) | |
| MSI Katana GF66 12UGS | |
| Asus TUF Dash F15 FX517ZR | |
| Acer Nitro 5 AN515-58-72QR | |
| Schenker XMG Fusion 15 (Mid 22) | |
| Average AMD Ryzen 7 6800H, NVIDIA GeForce RTX 3070 Ti Laptop GPU (1522 - 1643, n=2) | |
| Acer Nitro 5 AN515-46-R1A1 | |
| CrossMark / Productivity | |
| MSI Katana GF66 12UGS | |
| Average of class Gaming (1299 - 2211, n=114, last 2 years) | |
| Acer Nitro 5 AN515-58-72QR | |
| Asus TUF Dash F15 FX517ZR | |
| Schenker XMG Fusion 15 (Mid 22) | |
| Average AMD Ryzen 7 6800H, NVIDIA GeForce RTX 3070 Ti Laptop GPU (1530 - 1600, n=2) | |
| Acer Nitro 5 AN515-46-R1A1 | |
| CrossMark / Creativity | |
| Average of class Gaming (1275 - 2729, n=114, last 2 years) | |
| Asus TUF Dash F15 FX517ZR | |
| MSI Katana GF66 12UGS | |
| Acer Nitro 5 AN515-58-72QR | |
| Schenker XMG Fusion 15 (Mid 22) | |
| Average AMD Ryzen 7 6800H, NVIDIA GeForce RTX 3070 Ti Laptop GPU (1589 - 1746, n=2) | |
| Acer Nitro 5 AN515-46-R1A1 | |
| CrossMark / Responsiveness | |
| MSI Katana GF66 12UGS | |
| Average of class Gaming (1030 - 2330, n=114, last 2 years) | |
| Acer Nitro 5 AN515-58-72QR | |
| Schenker XMG Fusion 15 (Mid 22) | |
| Asus TUF Dash F15 FX517ZR | |
| Average AMD Ryzen 7 6800H, NVIDIA GeForce RTX 3070 Ti Laptop GPU (1316 - 1481, n=2) | |
| Acer Nitro 5 AN515-46-R1A1 | |
| PCMark 8 Home Score Accelerated v2 | 5074 points | |
| PCMark 8 Work Score Accelerated v2 | 5934 points | |
| PCMark 10 Score | 6783 points | |
Help | ||
| AIDA64 / Memory Copy | |
| Average of class Gaming (21750 - 104987, n=141, last 2 years) | |
| Asus TUF Dash F15 FX517ZR | |
| Average AMD Ryzen 7 6800H (48209 - 51186, n=8) | |
| Acer Nitro 5 AN515-46-R1A1 | |
| Schenker XMG Fusion 15 (Mid 22) | |
| MSI Katana GF66 12UGS | |
| Acer Nitro 5 AN515-58-72QR | |
| AIDA64 / Memory Read | |
| Average of class Gaming (22956 - 104349, n=141, last 2 years) | |
| Asus TUF Dash F15 FX517ZR | |
| Acer Nitro 5 AN515-46-R1A1 | |
| Average AMD Ryzen 7 6800H (43828 - 51778, n=8) | |
| Schenker XMG Fusion 15 (Mid 22) | |
| MSI Katana GF66 12UGS | |
| Acer Nitro 5 AN515-58-72QR | |
| AIDA64 / Memory Write | |
| Average of class Gaming (22297 - 133486, n=141, last 2 years) | |
| Asus TUF Dash F15 FX517ZR | |
| Acer Nitro 5 AN515-46-R1A1 | |
| Average AMD Ryzen 7 6800H (51116 - 55307, n=8) | |
| MSI Katana GF66 12UGS | |
| Schenker XMG Fusion 15 (Mid 22) | |
| Acer Nitro 5 AN515-58-72QR | |
| AIDA64 / Memory Latency | |
| Average of class Gaming (59.5 - 259, n=141, last 2 years) | |
| MSI Katana GF66 12UGS | |
| Asus TUF Dash F15 FX517ZR | |
| Schenker XMG Fusion 15 (Mid 22) | |
| Acer Nitro 5 AN515-46-R1A1 | |
| Average AMD Ryzen 7 6800H (83.1 - 104.1, n=8) | |
| Acer Nitro 5 AN515-58-72QR | |
| Acer Nitro 5 AN515-58-72QR | |
* ... smaller is better
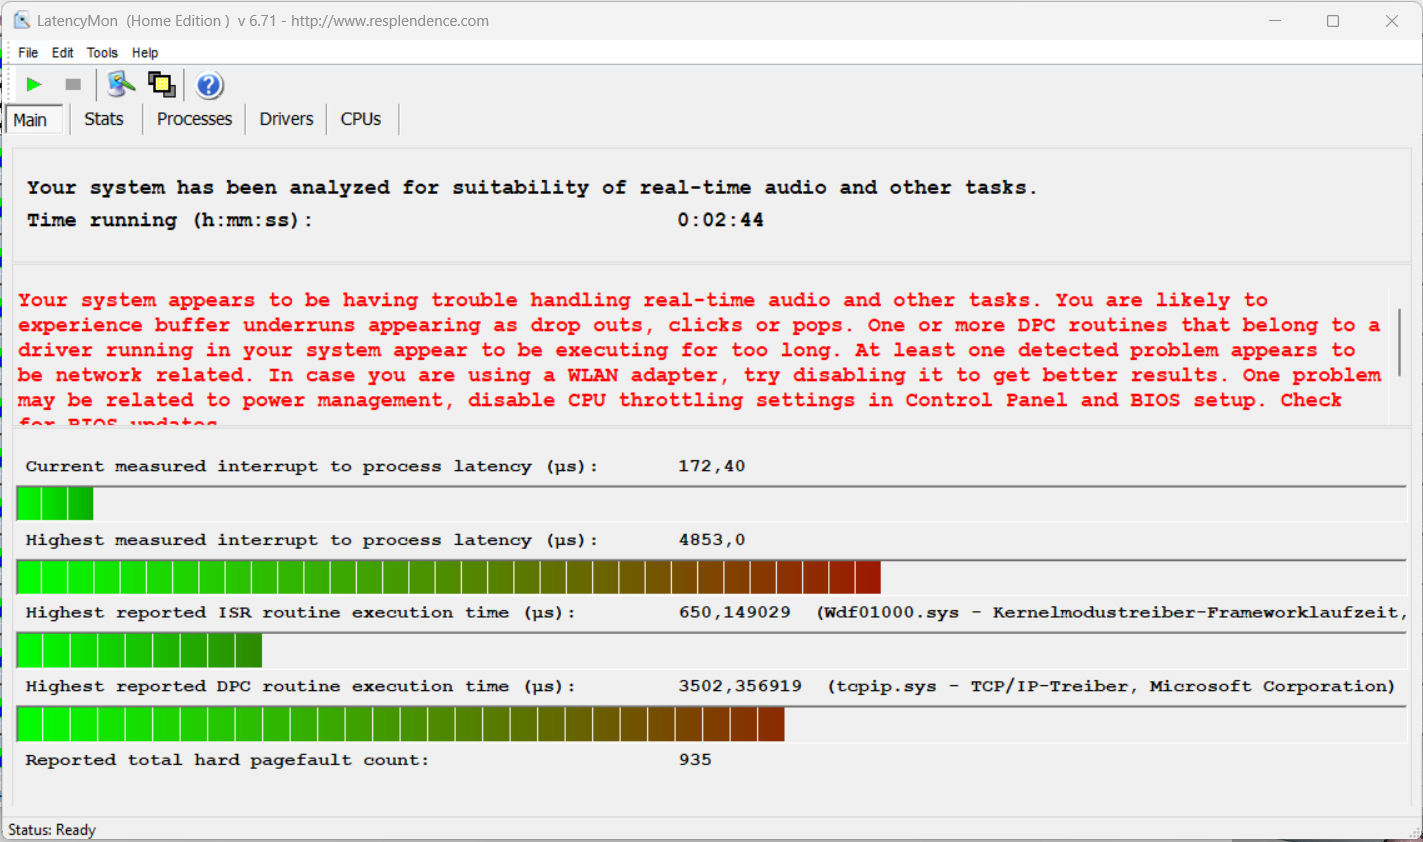
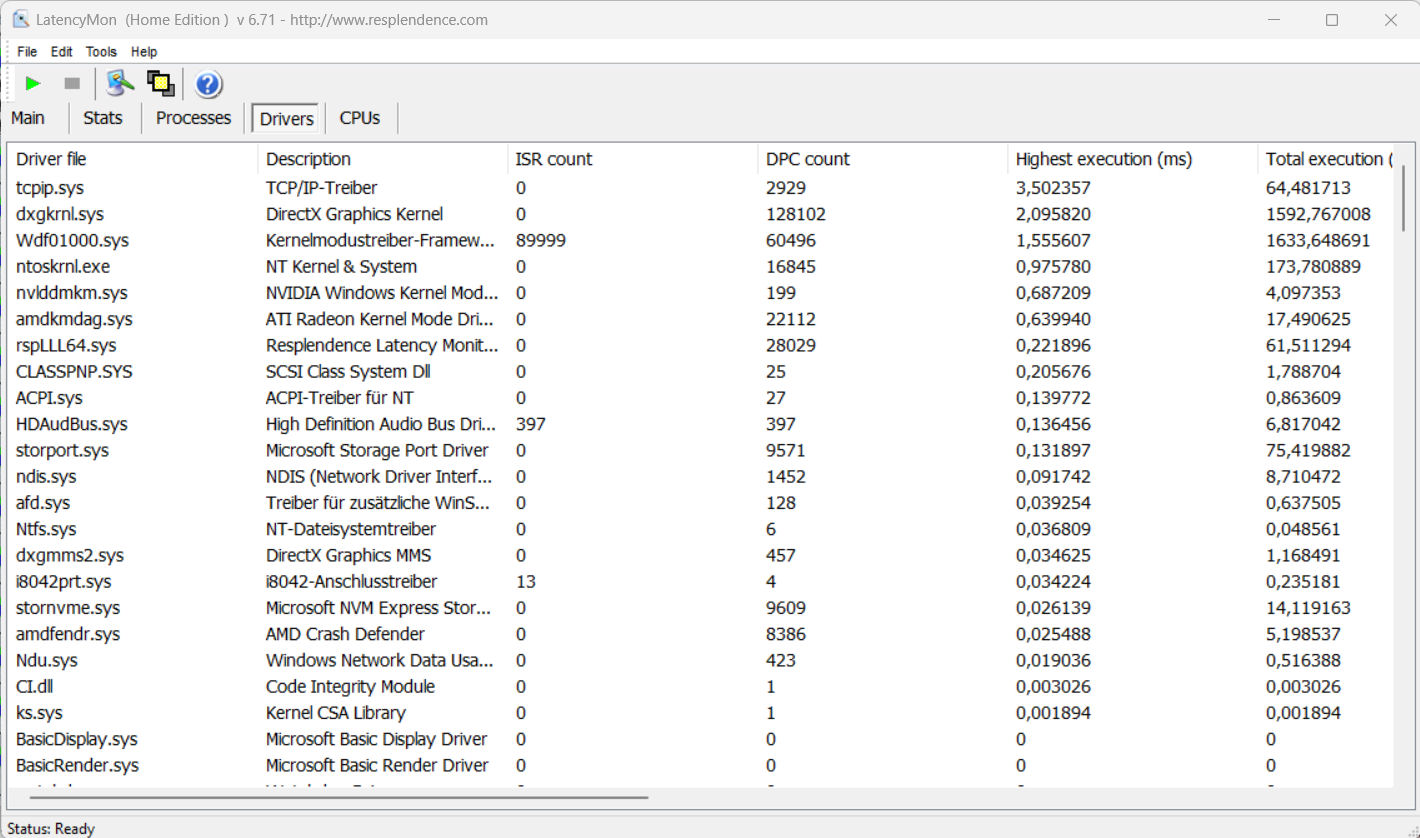
DPC Latencies
The standardized Latency Monitor test (browsing, playing 4K videos, running Prime95 High Load) showed some weaknesses in terms of DPC latencies. The system does not seem to be suitable for real-time video and audio processing. Future software updates could improve or even worsen this situation.
| DPC Latencies / LatencyMon - interrupt to process latency (max), Web, Youtube, Prime95 | |
| Acer Nitro 5 AN515-46-R1A1 | |
| Schenker XMG Fusion 15 (Mid 22) | |
| Acer Nitro 5 AN515-58-72QR | |
| MSI Katana GF66 12UGS | |
| Asus TUF Dash F15 FX517ZR | |
* ... smaller is better
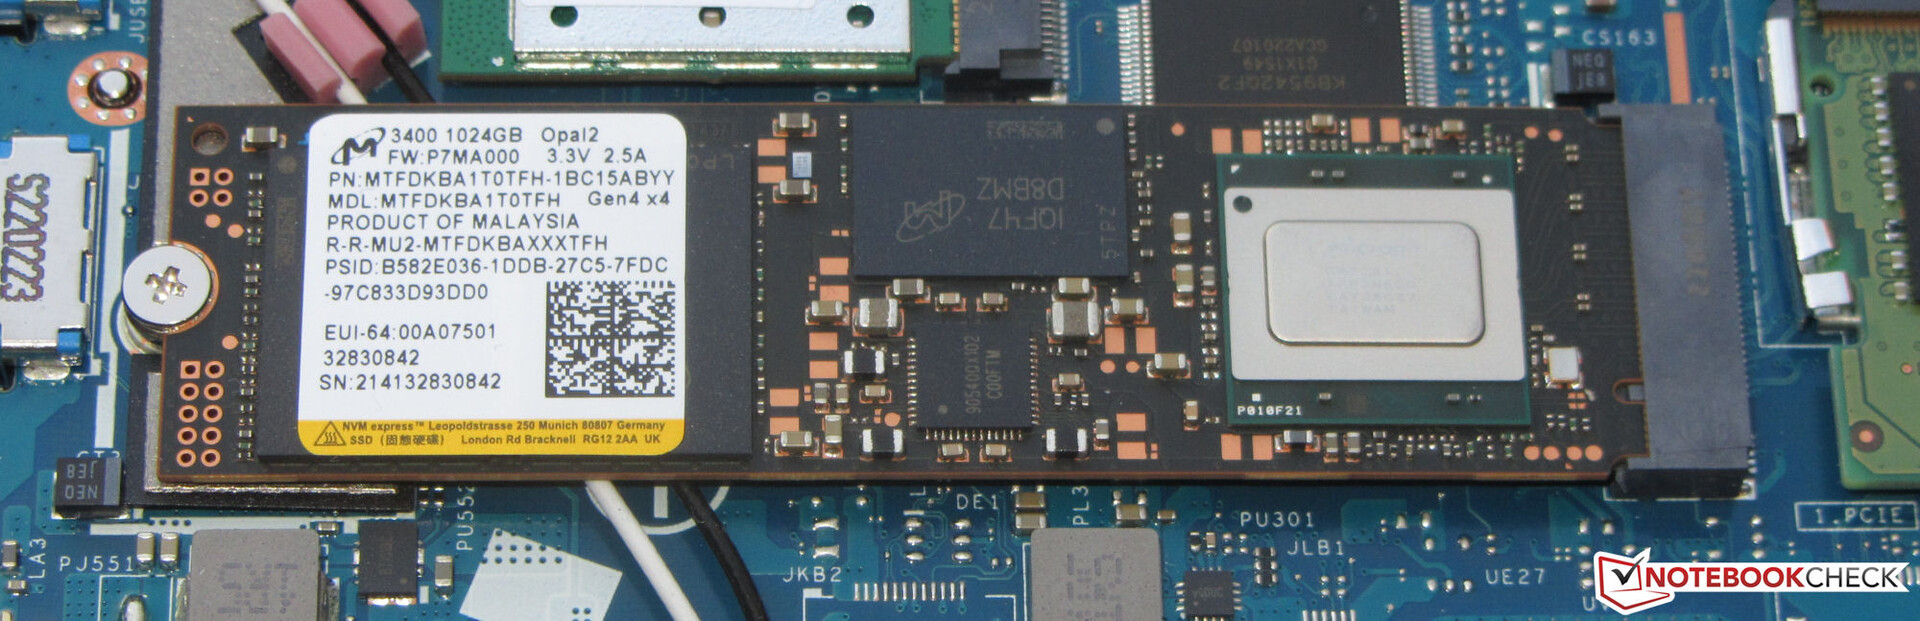
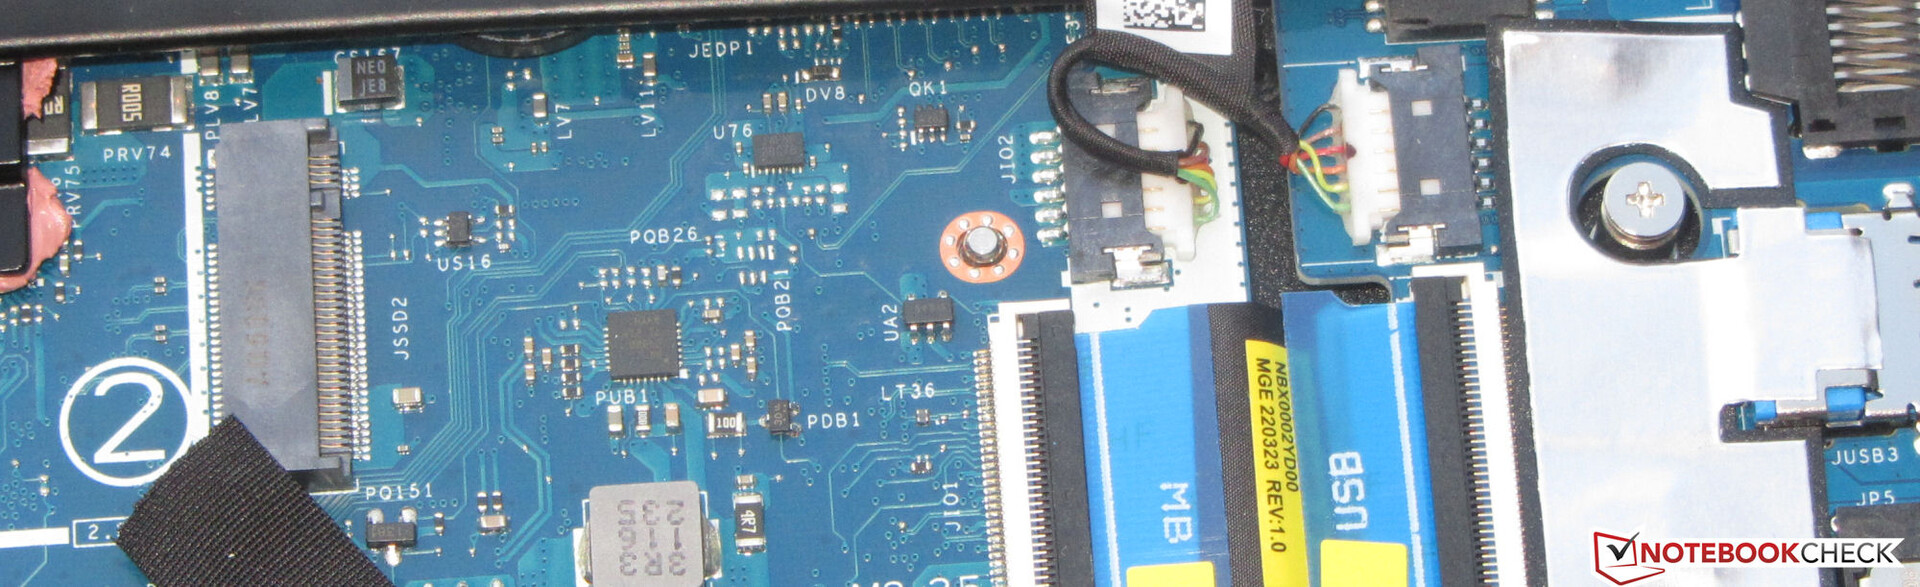
Storage Device
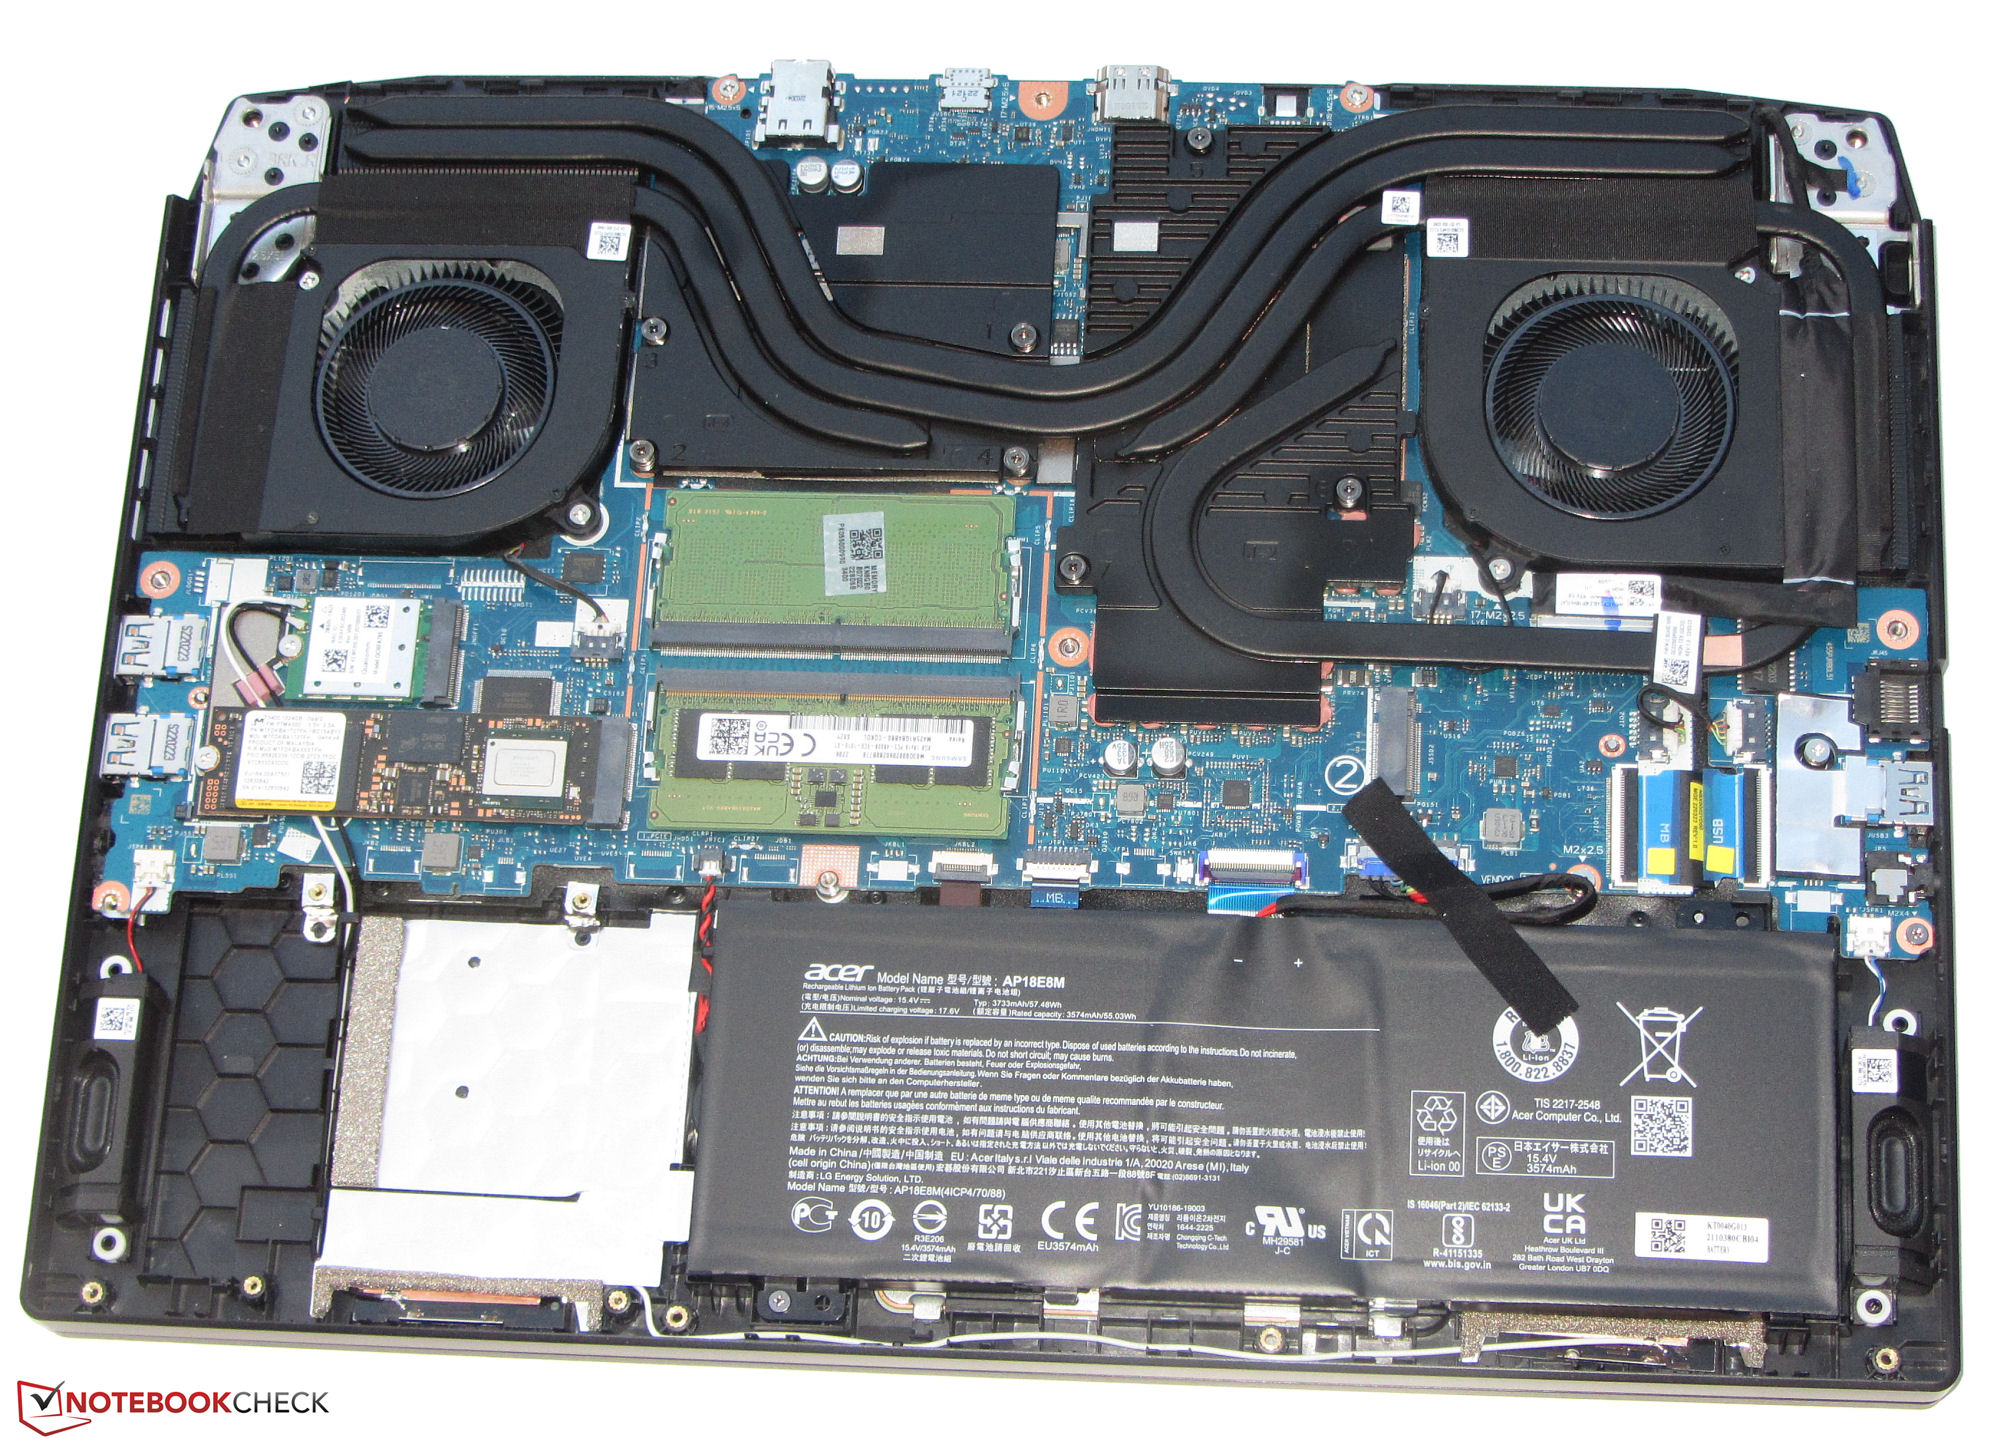
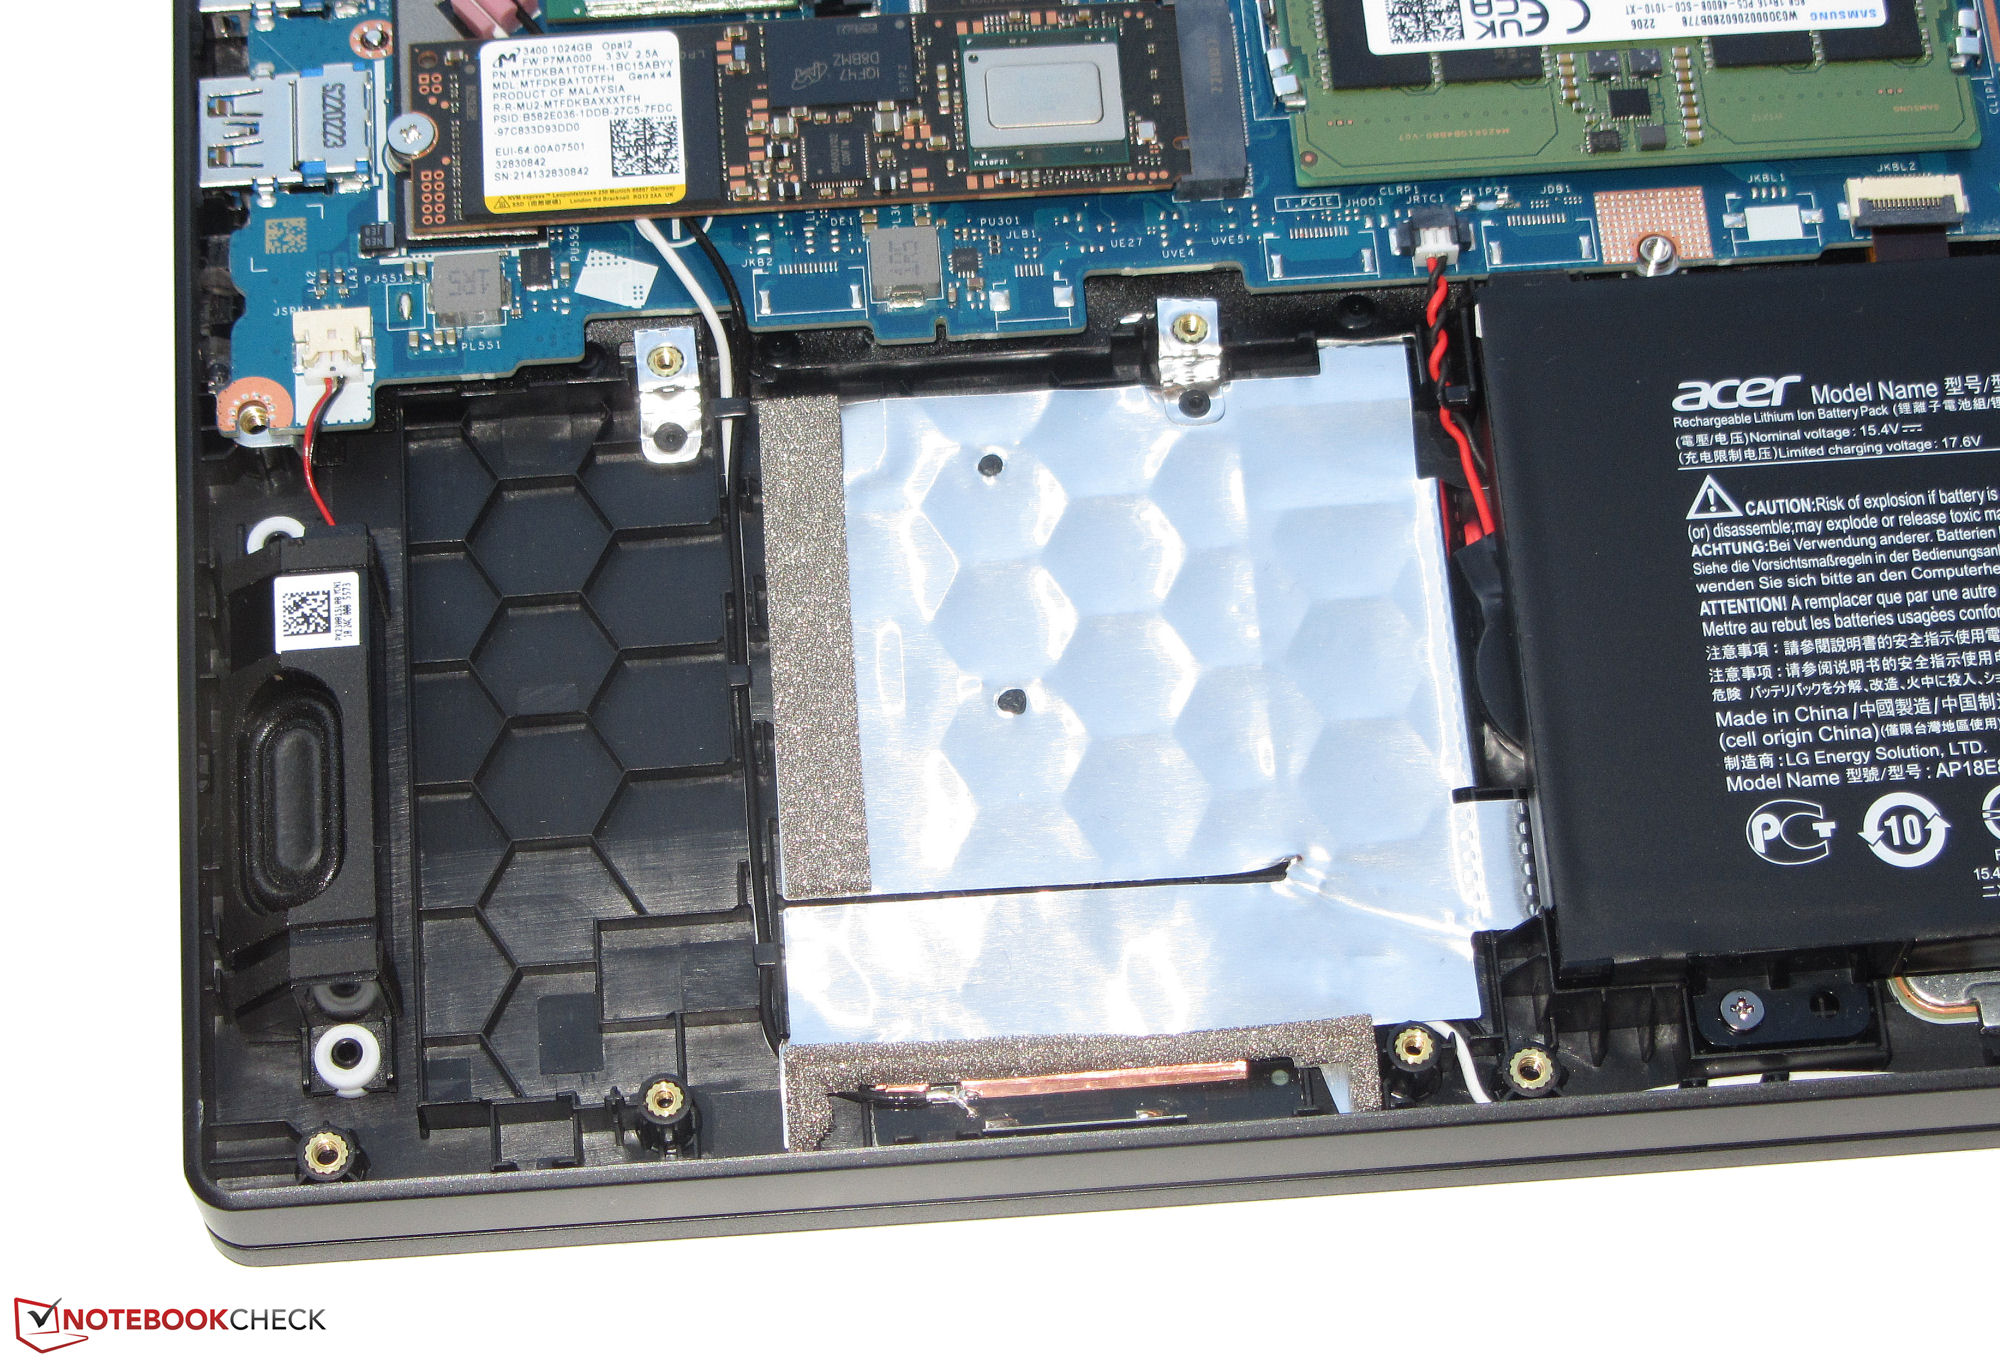
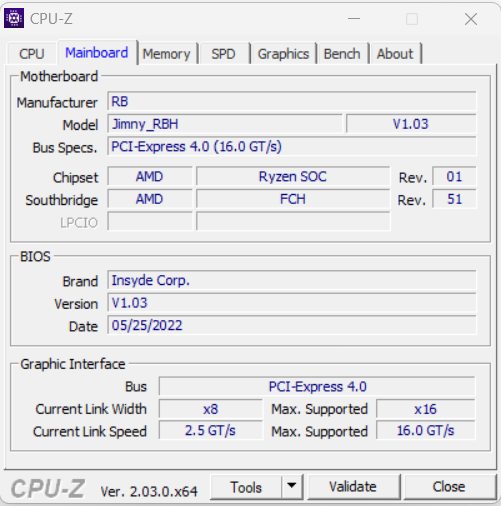
The 1-TB SSD (PCIe 4, M.2-2280) from Micron has very good transfer rates but suffers from drops in performance due to thermal throttling. The AN515 has another slot for a second PCIe 4 SSD. In theory, the notebook could also be equipped with a 2.5-inch storage device, but the device does not come with the necessary SATA slot nor a suitable drive caddy.

* ... smaller is better
Disk Throttling: DiskSpd Read Loop, Queue Depth 8
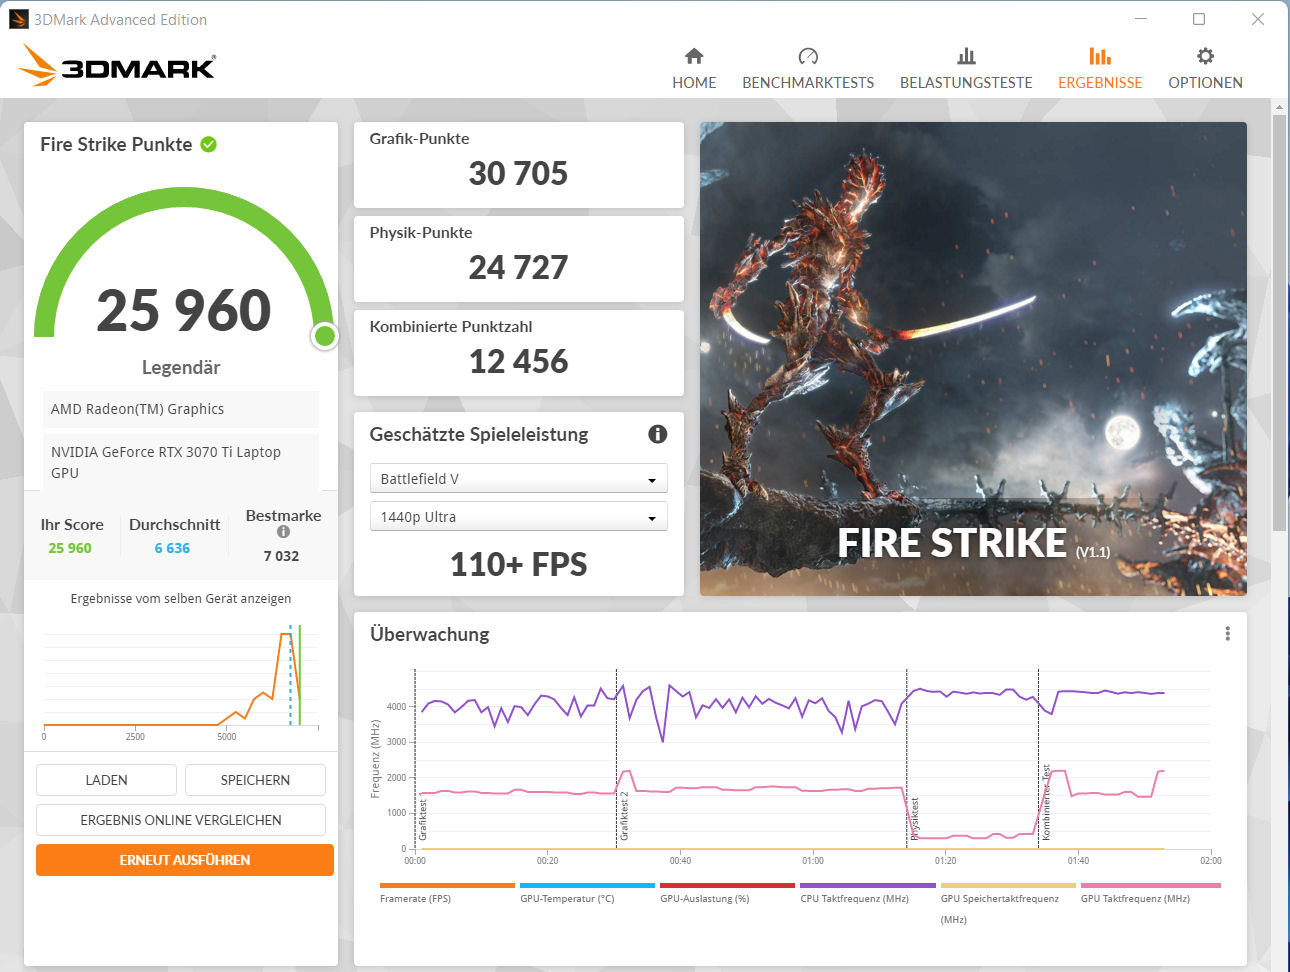
Graphics
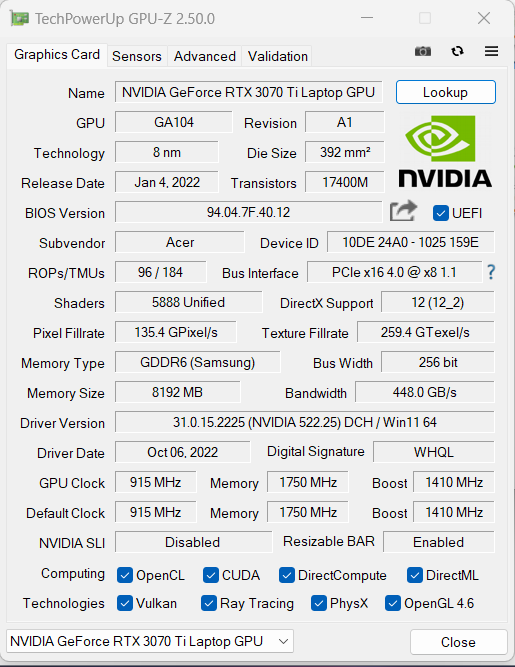
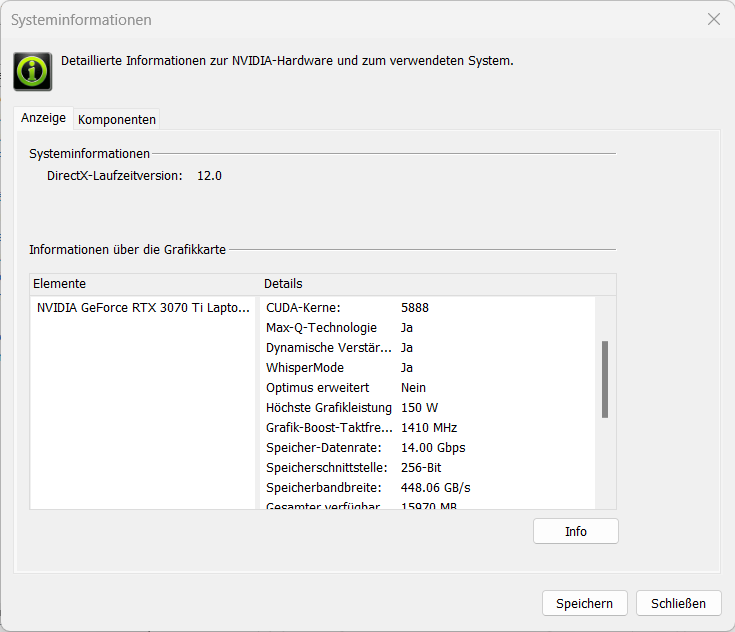
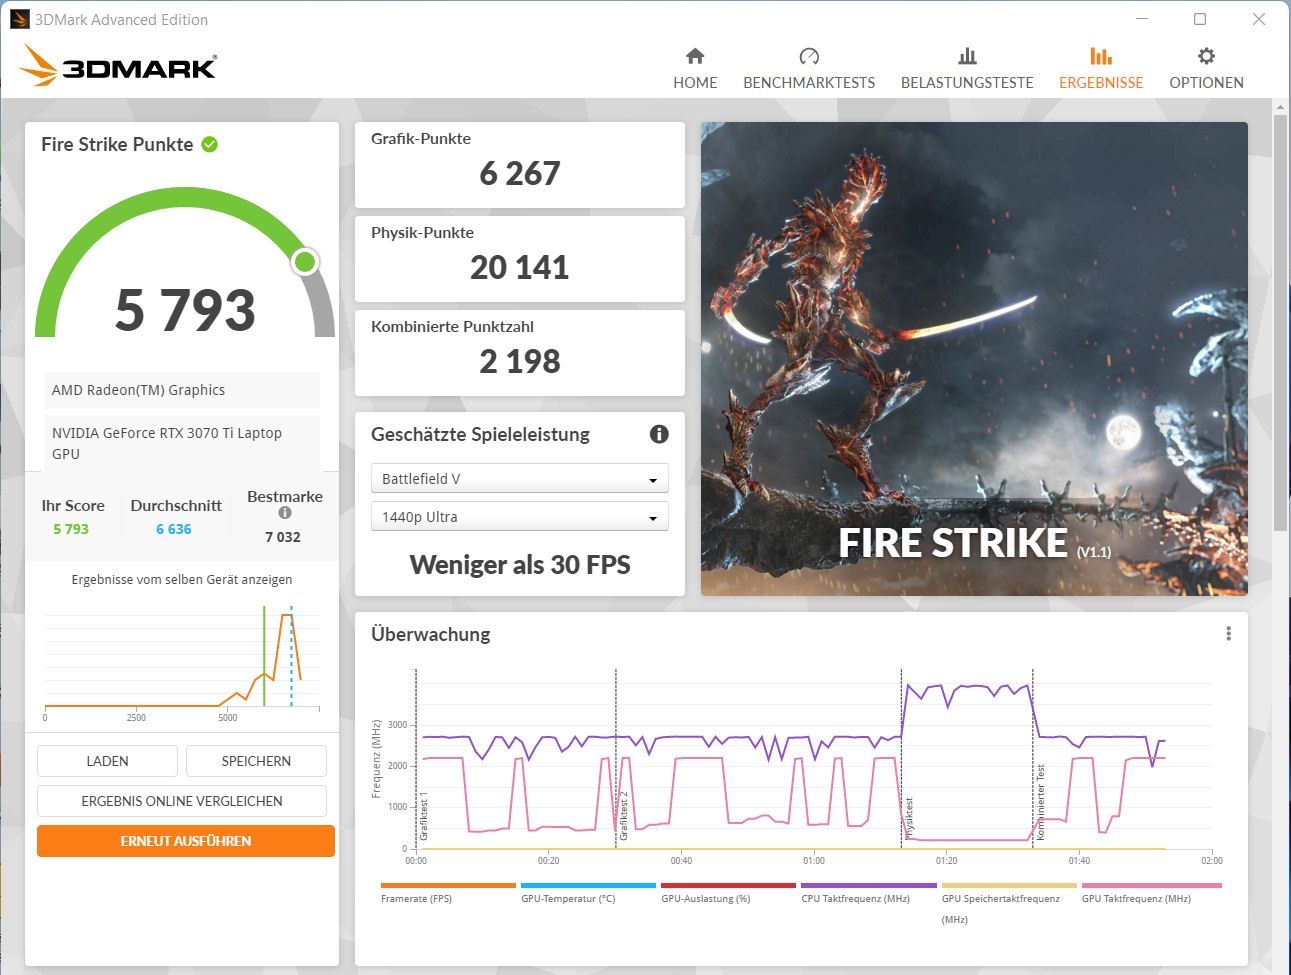
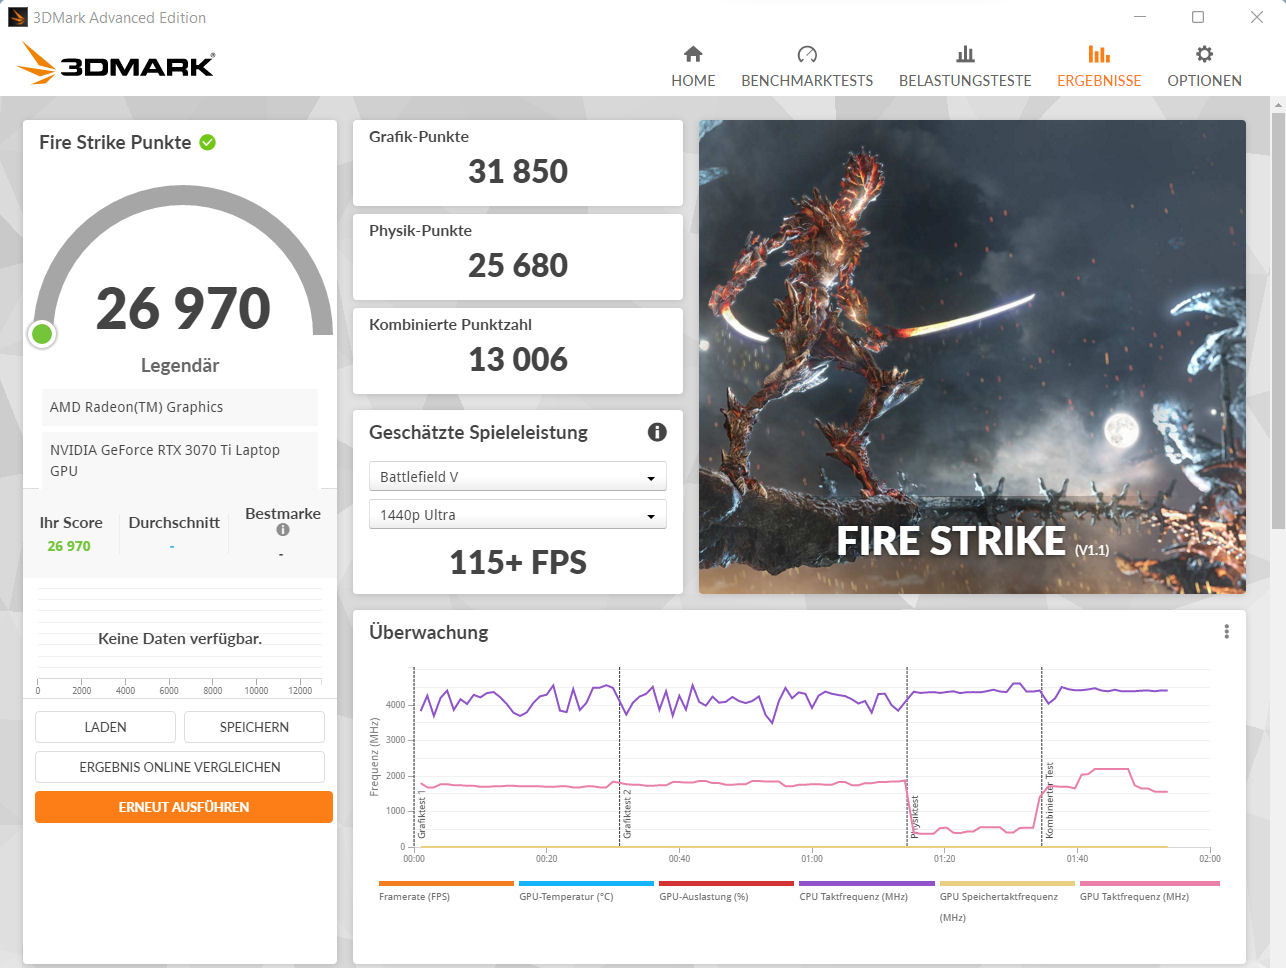
Acer has given the GeForce RTX 3070 Ti (VRAM:8,192 MB GDDR6) a maximum TGP of 150 watts (125 watts + 25 watts of Dynamic Boost). The 3DMark results are above the average measured so far for RTX 3070 Ti GPUs. The differences between the performance profiles are minimal (See Fire Strike screenshots). The device makes use of the Dynamic Boost, as can be seen in our Witcher 3 test.
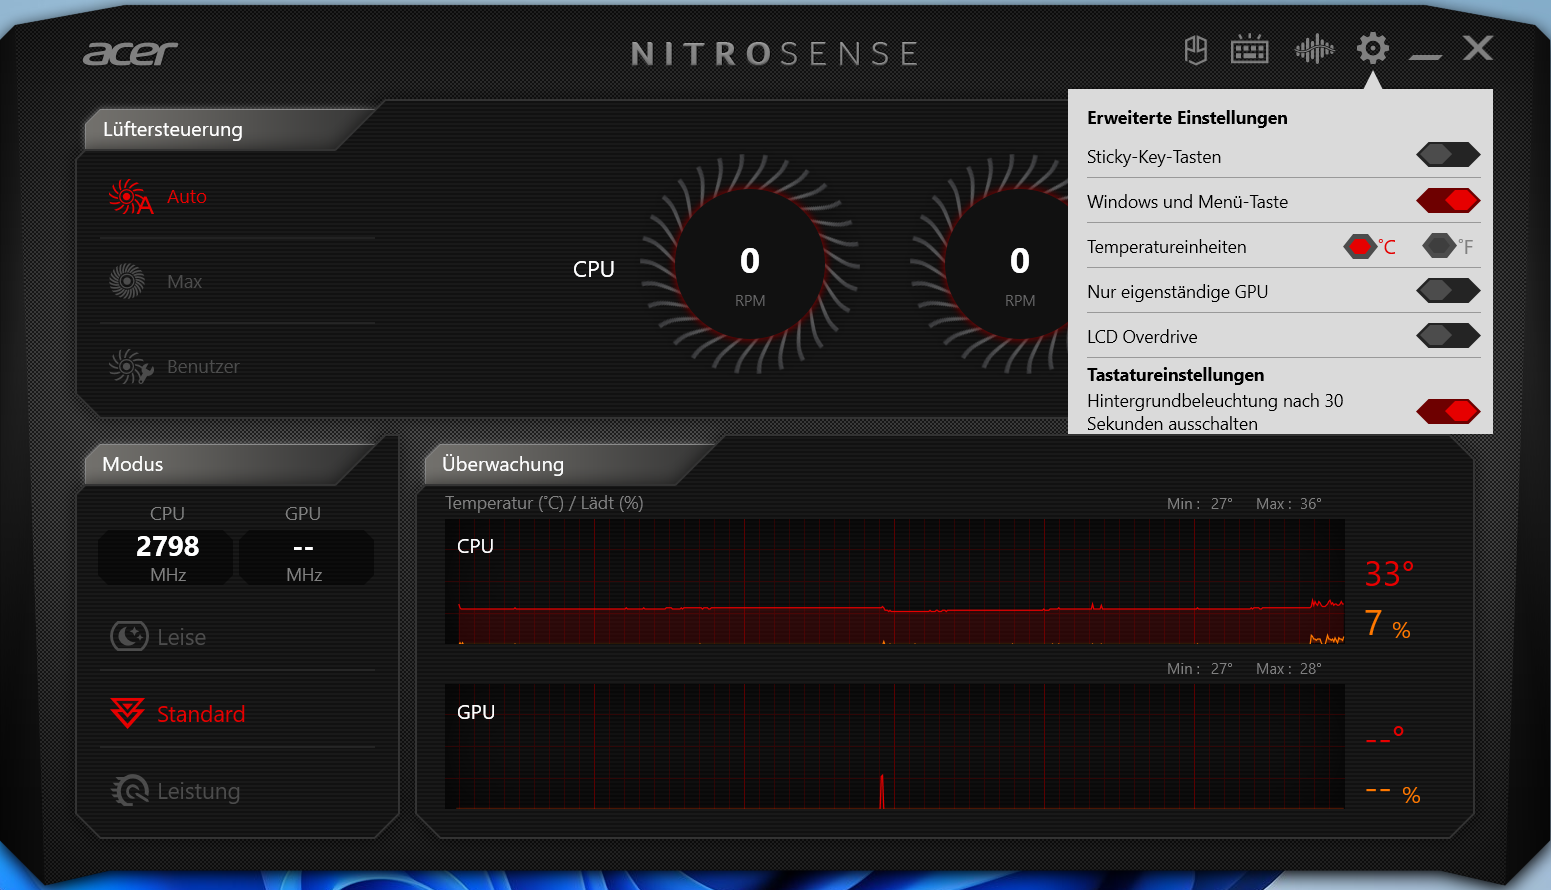
Graphics performance can be improved slightly by setting up direct image output from the GeForce GPU. This switch can be made in the BIOS or through the NitroSense software (click the settings symbol). Acer uses MUX Switch and the device does not support Advanced Optimus.

| 3DMark Performance rating - Percent | |
| Average of class Gaming | |
| Acer Nitro 5 AN515-46-R1A1 | |
| Acer Nitro 5 AN515-46-R1A1 | |
| Average NVIDIA GeForce RTX 3070 Ti Laptop GPU | |
| Acer Nitro 5 AN515-58-72QR | |
| MSI Katana GF66 12UGS | |
| Schenker XMG Fusion 15 (Mid 22) | |
| Asus TUF Dash F15 FX517ZR | |
| 3DMark 11 - 1280x720 Performance GPU | |
| Average of class Gaming (13523 - 80022, n=136, last 2 years) | |
| Acer Nitro 5 AN515-46-R1A1 (dGPU) | |
| Acer Nitro 5 AN515-46-R1A1 | |
| Acer Nitro 5 AN515-58-72QR | |
| Average NVIDIA GeForce RTX 3070 Ti Laptop GPU (13799 - 42569, n=36) | |
| MSI Katana GF66 12UGS | |
| Schenker XMG Fusion 15 (Mid 22) | |
| Asus TUF Dash F15 FX517ZR | |
| 3DMark | |
| 1920x1080 Fire Strike Graphics | |
| Average of class Gaming (6487 - 62849, n=150, last 2 years) | |
| Acer Nitro 5 AN515-46-R1A1 (dGPU) | |
| Acer Nitro 5 AN515-46-R1A1 | |
| Average NVIDIA GeForce RTX 3070 Ti Laptop GPU (22612 - 32550, n=37) | |
| Acer Nitro 5 AN515-58-72QR | |
| MSI Katana GF66 12UGS | |
| Schenker XMG Fusion 15 (Mid 22) | |
| Asus TUF Dash F15 FX517ZR | |
| 2560x1440 Time Spy Graphics | |
| Average of class Gaming (2295 - 25984, n=147, last 2 years) | |
| Acer Nitro 5 AN515-46-R1A1 (dGPU) | |
| Acer Nitro 5 AN515-46-R1A1 | |
| Average NVIDIA GeForce RTX 3070 Ti Laptop GPU (8142 - 12324, n=37) | |
| Acer Nitro 5 AN515-58-72QR | |
| MSI Katana GF66 12UGS | |
| Schenker XMG Fusion 15 (Mid 22) | |
| Asus TUF Dash F15 FX517ZR | |
| 2560x1440 Port Royal Graphics | |
| Average of class Gaming (984 - 16978, n=81, last 2 years) | |
| Acer Nitro 5 AN515-46-R1A1 (dGPU) | |
| Acer Nitro 5 AN515-46-R1A1 | |
| Average NVIDIA GeForce RTX 3070 Ti Laptop GPU (5091 - 7510, n=23) | |
| Acer Nitro 5 AN515-58-72QR | |
| MSI Katana GF66 12UGS | |
| Schenker XMG Fusion 15 (Mid 22) | |
| Asus TUF Dash F15 FX517ZR | |
| 3DMark 06 Standard Score | 43453 points | |
| 3DMark 11 Performance | 28137 points | |
| 3DMark Cloud Gate Standard Score | 56030 points | |
| 3DMark Fire Strike Score | 25960 points | |
| 3DMark Time Spy Score | 11042 points | |
Help | ||
| Blender | |
| v3.3 Classroom OPTIX/RTX | |
| Asus TUF Dash F15 FX517ZR | |
| Acer Nitro 5 AN515-46-R1A1 (3.3.0) | |
| Acer Nitro 5 AN515-46-R1A1 (3.3.0, dGPU) | |
| Average of class Gaming (9 - 95, n=138, last 2 years) | |
| v3.3 Classroom CUDA | |
| Asus TUF Dash F15 FX517ZR | |
| Acer Nitro 5 AN515-46-R1A1 (3.3.0) | |
| Acer Nitro 5 AN515-46-R1A1 (3.3.0, dGPU) | |
| Average of class Gaming (15 - 228, n=142, last 2 years) | |
| v3.3 Classroom CPU | |
| Schenker XMG Fusion 15 (Mid 22) | |
| Asus TUF Dash F15 FX517ZR | |
| Acer Nitro 5 AN515-46-R1A1 (3.3.0) | |
| Acer Nitro 5 AN515-46-R1A1 (3.3.0, dGPU) | |
| Average of class Gaming (122 - 962, n=139, last 2 years) | |
* ... smaller is better
Gaming Performance
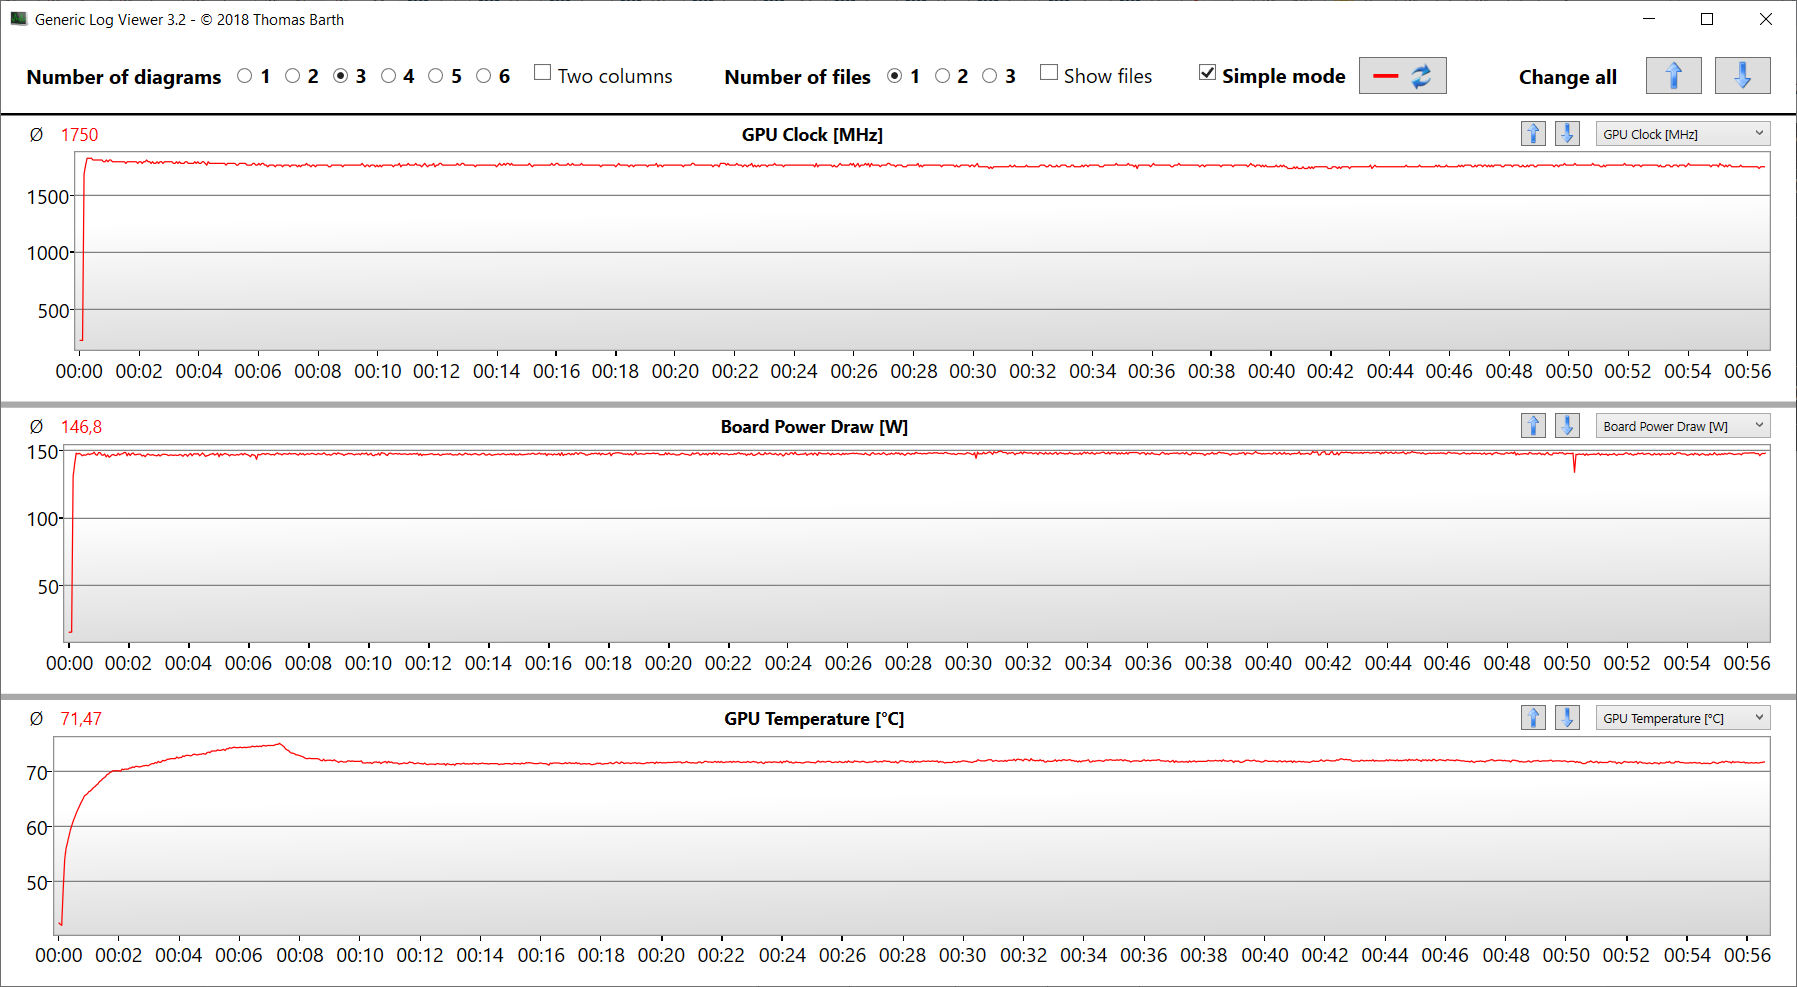
The hardware supports FHD gaming at maximum settings. The refresh rates of the tested titles are often above the average for the RTX 3070 Ti. The image output via the GeForce GPU increases the frame rates. The Witcher 3 test confirms that refresh rates remain stable over a long period.
| The Witcher 3 - 1920x1080 Ultra Graphics & Postprocessing (HBAO+) | |
| Average of class Gaming (18.4 - 240, n=55, last 2 years) | |
| Acer Nitro 5 AN515-46-R1A1 (dGPU) | |
| Acer Nitro 5 AN515-46-R1A1 | |
| Average NVIDIA GeForce RTX 3070 Ti Laptop GPU (76.8 - 124.1, n=39) | |
| Acer Nitro 5 AN515-58-72QR | |
| MSI Katana GF66 12UGS | |
| Schenker XMG Fusion 15 (Mid 22) | |
| Asus TUF Dash F15 FX517ZR | |
| Dota 2 Reborn - 1920x1080 ultra (3/3) best looking | |
| Average of class Gaming (65.1 - 248, n=143, last 2 years) | |
| MSI Katana GF66 12UGS | |
| Average NVIDIA GeForce RTX 3070 Ti Laptop GPU (68.7 - 160.5, n=38) | |
| Acer Nitro 5 AN515-58-72QR | |
| Schenker XMG Fusion 15 (Mid 22) | |
| Acer Nitro 5 AN515-46-R1A1 (dGPU) | |
| Asus TUF Dash F15 FX517ZR | |
| Acer Nitro 5 AN515-46-R1A1 | |
| X-Plane 11.11 - 1920x1080 high (fps_test=3) | |
| Average of class Gaming (33.4 - 150.2, n=146, last 2 years) | |
| MSI Katana GF66 12UGS | |
| Asus TUF Dash F15 FX517ZR | |
| Average NVIDIA GeForce RTX 3070 Ti Laptop GPU (51.6 - 116.9, n=37) | |
| Acer Nitro 5 AN515-58-72QR | |
| Schenker XMG Fusion 15 (Mid 22) | |
| Acer Nitro 5 AN515-46-R1A1 (dGPU) | |
| Acer Nitro 5 AN515-46-R1A1 | |
| Final Fantasy XV Benchmark - 1920x1080 High Quality | |
| Average of class Gaming (19.2 - 215, n=140, last 2 years) | |
| Acer Nitro 5 AN515-46-R1A1 (1.3, dGPU) | |
| Acer Nitro 5 AN515-46-R1A1 (1.3) | |
| Average NVIDIA GeForce RTX 3070 Ti Laptop GPU (49.5 - 122.4, n=35) | |
| Schenker XMG Fusion 15 (Mid 22) (1.3) | |
| MSI Katana GF66 12UGS (1.3) | |
| Acer Nitro 5 AN515-58-72QR (1.3) | |
| Asus TUF Dash F15 FX517ZR (1.3) | |
| GTA V - 1920x1080 Highest AA:4xMSAA + FX AF:16x | |
| Average of class Gaming (12.1 - 186.9, n=128, last 2 years) | |
| Average NVIDIA GeForce RTX 3070 Ti Laptop GPU (44 - 123.9, n=36) | |
| Asus TUF Dash F15 FX517ZR | |
| MSI Katana GF66 12UGS | |
| Schenker XMG Fusion 15 (Mid 22) | |
| Acer Nitro 5 AN515-58-72QR | |
| Acer Nitro 5 AN515-46-R1A1 | |
| Acer Nitro 5 AN515-46-R1A1 (dGPU) | |
| Strange Brigade - 1920x1080 ultra AA:ultra AF:16 | |
| Average of class Gaming (38.9 - 456, n=128, last 2 years) | |
| Acer Nitro 5 AN515-46-R1A1 (1.47.22.14 D3D12, dGPU) | |
| Average NVIDIA GeForce RTX 3070 Ti Laptop GPU (109 - 221, n=37) | |
| Acer Nitro 5 AN515-58-72QR (1.47.22.14 D3D12) | |
| Acer Nitro 5 AN515-46-R1A1 (1.47.22.14 D3D12) | |
| MSI Katana GF66 12UGS (1.47.22.14 D3D12) | |
| Schenker XMG Fusion 15 (Mid 22) (1.47.22.14 D3D12) | |
| Asus TUF Dash F15 FX517ZR (1.47.22.14 D3D12) | |
| F1 22 - 1920x1080 Ultra High Preset AA:T AF:16x | |
| Average of class Gaming (40.1 - 135.1, n=21, last 2 years) | |
| Acer Nitro 5 AN515-46-R1A1 (923650, dGPU) | |
| Acer Nitro 5 AN515-46-R1A1 (923662) | |
| Average NVIDIA GeForce RTX 3070 Ti Laptop GPU (58.1 - 80, n=8) | |
| Far Cry 5 - 1920x1080 Ultra Preset AA:T | |
| Average of class Gaming (70 - 174, n=44, last 2 years) | |
| Average NVIDIA GeForce RTX 3070 Ti Laptop GPU (91 - 138, n=25) | |
| MSI Katana GF66 12UGS | |
| Acer Nitro 5 AN515-46-R1A1 (dGPU) | |
| Schenker XMG Fusion 15 (Mid 22) | |
| Acer Nitro 5 AN515-46-R1A1 | |
| Asus TUF Dash F15 FX517ZR | |
| Acer Nitro 5 AN515-58-72QR | |
| Hitman 3 - 1920x1080 Maximum Settings AF:16x | |
| Acer Nitro 5 AN515-46-R1A1 | |
| Average NVIDIA GeForce RTX 3070 Ti Laptop GPU (138 - 157.7, n=3) | |
| God of War - 1920x1080 Ultra Preset | |
| Average of class Gaming (n=1last 2 years) | |
| Acer Nitro 5 AN515-46-R1A1 | |
| Average NVIDIA GeForce RTX 3070 Ti Laptop GPU (55.1 - 64.3, n=5) | |
| Tiny Tina's Wonderlands - 1920x1080 Badass Preset (DX12) | |
| Average of class Gaming (55 - 187.5, n=15, last 2 years) | |
| Acer Nitro 5 AN515-46-R1A1 | |
| Average NVIDIA GeForce RTX 3070 Ti Laptop GPU (89.8 - 93.7, n=4) | |
| Asus TUF Dash F15 FX517ZR | |
| Vampire Bloodhunt - 1920x1080 Ultra Preset | |
| Average NVIDIA GeForce RTX 3070 Ti Laptop GPU (168.6 - 189.9, n=2) | |
| Acer Nitro 5 AN515-46-R1A1 | |
| The Quarry - 1920x1080 Ultra Preset | |
| Acer Nitro 5 AN515-46-R1A1 | |
| Average NVIDIA GeForce RTX 3070 Ti Laptop GPU (80 - 81.5, n=2) | |
| Average of class Gaming (n=1last 2 years) | |
Witcher 3 FPS diagram
| low | med. | high | ultra | |
|---|---|---|---|---|
| GTA V (2015) | 174.2 | 167.3 | 149.5 | 92.5 |
| The Witcher 3 (2015) | 284 | 237 | 179.4 | 108.5 |
| Dota 2 Reborn (2015) | 130.9 | 120 | 112.1 | 108.5 |
| Final Fantasy XV Benchmark (2018) | 171.8 | 139.9 | 108.6 | |
| X-Plane 11.11 (2018) | 100.3 | 89.3 | 72.3 | |
| Far Cry 5 (2018) | 134 | 116 | 112 | 106 |
| Strange Brigade (2018) | 289 | 212 | 190.3 | 177 |
| Hitman 3 (2021) | 207.9 | 169.1 | 162.1 | 157.7 |
| God of War (2022) | 117.3 | 104.8 | 88.7 | 64.3 |
| Tiny Tina's Wonderlands (2022) | 183.3 | 159.8 | 118.3 | 93.7 |
| Vampire Bloodhunt (2022) | 197.6 | 185.1 | 172.7 | 168.6 |
| F1 22 (2022) | 207 | 205 | 192.3 | 73.2 |
| The Quarry (2022) | 149.6 | 120.7 | 101.5 | 81.5 |
Emissions - the AN515 only heats up moderately
Noise Emissions
During everyday use (office, internet) and while idling, the two fans remain quiet enough and can even stop running occasionally. Still, they are somewhat unpredictable and the noise level can increase up to 44.3 dB(A). Under load, we measured a maximum of 53.6 dB(A), which is rather loud.
The fan speed can be slowed down with the help of the device's NitroSense software, but the fan curve cannot be adjusted. Noise development is very similar in the "quiet" and the "standard" profiles.
Noise level
| Idle |
| 25 / 28.6 / 44.3 dB(A) |
| Load |
| 47.6 / 53.6 dB(A) |
 | ||
30 dB silent 40 dB(A) audible 50 dB(A) loud |
||
min: | ||
| Acer Nitro 5 AN515-46-R1A1 GeForce RTX 3070 Ti Laptop GPU, R7 6800H, Micron 3400 1TB MTFDKBA1T0TFH | MSI Katana GF66 12UGS GeForce RTX 3070 Ti Laptop GPU, i7-12700H, Micron 2450 1TB MTFDKBA1T0TFK | Schenker XMG Fusion 15 (Mid 22) GeForce RTX 3070 Laptop GPU, i7-11800H, Samsung SSD 980 Pro 1TB MZ-V8P1T0BW | Asus TUF Dash F15 FX517ZR GeForce RTX 3070 Laptop GPU, i7-12650H, Samsung PM991a MZVLQ1T0HBLB | Acer Nitro 5 AN515-58-72QR GeForce RTX 3070 Ti Laptop GPU, i7-12700H, Samsung PM9A1 MZVL21T0HCLR | |
|---|---|---|---|---|---|
| Noise | 7% | 7% | 2% | 3% | |
| off / environment * (dB) | 25 | 26 -4% | 26 -4% | 26 -4% | 26 -4% |
| Idle Minimum * (dB) | 25 | 27 -8% | 26 -4% | 26 -4% | 26 -4% |
| Idle Average * (dB) | 28.6 | 28 2% | 28 2% | 32 -12% | 29 -1% |
| Idle Maximum * (dB) | 44.3 | 31 30% | 31 30% | 33 26% | 33 26% |
| Load Average * (dB) | 47.6 | 44 8% | 45 5% | 48 -1% | 47 1% |
| Load Maximum * (dB) | 53.6 | 45 16% | 48 10% | 49 9% | 53 1% |
| Witcher 3 ultra * (dB) | 44 | 46 | 47 | 53 |
* ... smaller is better
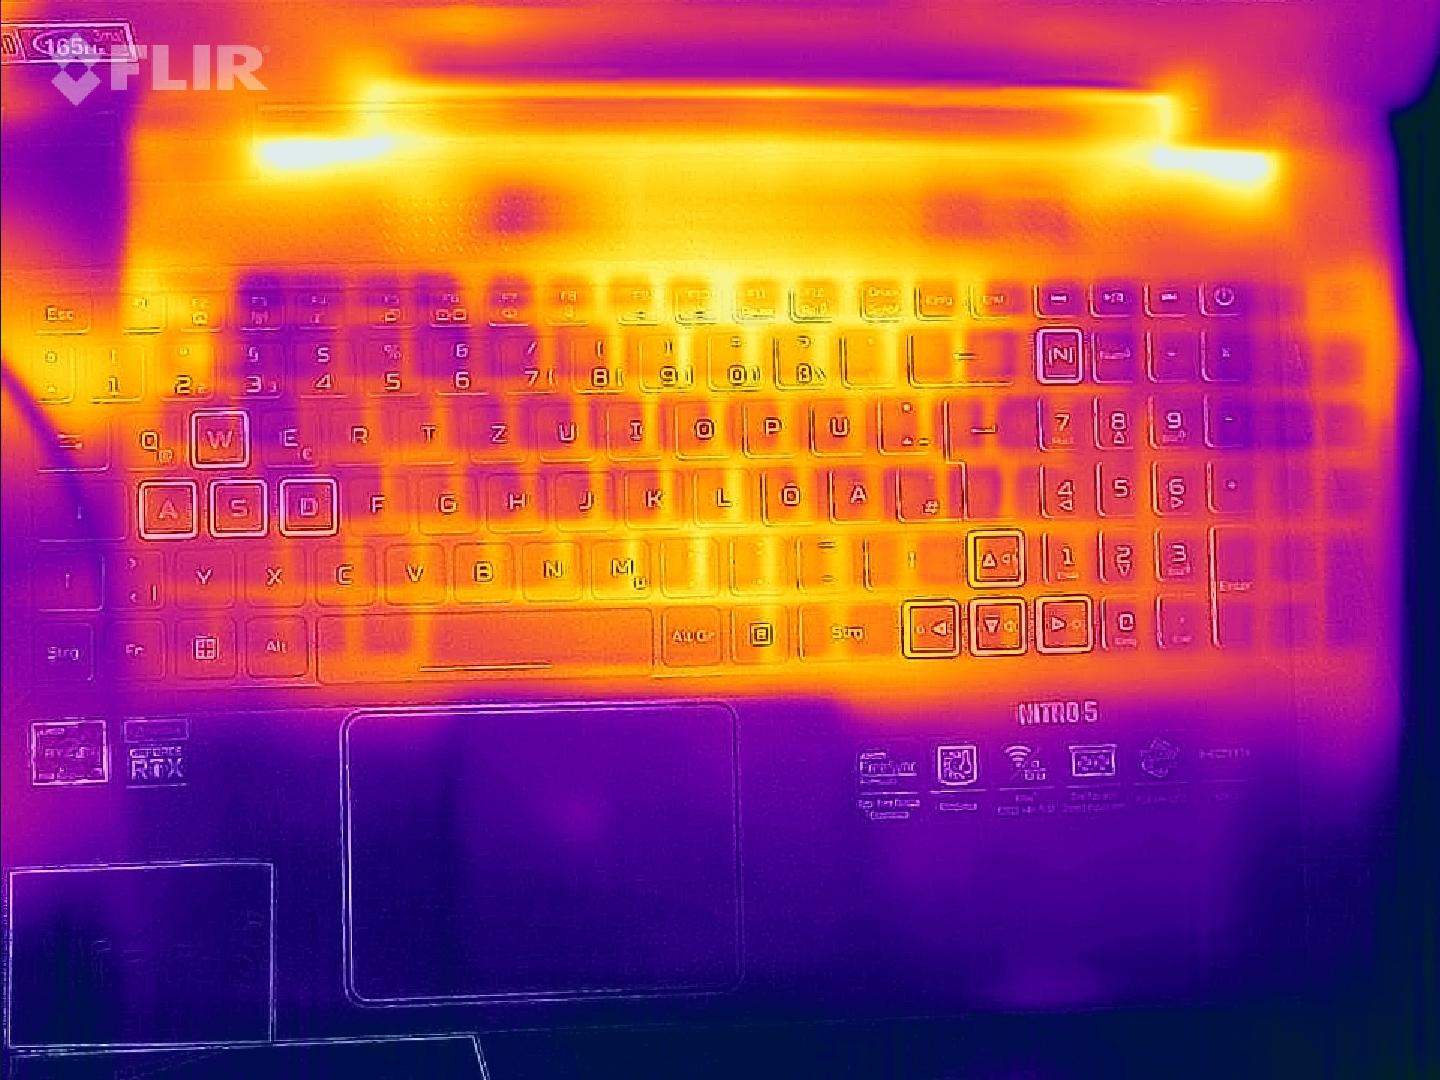
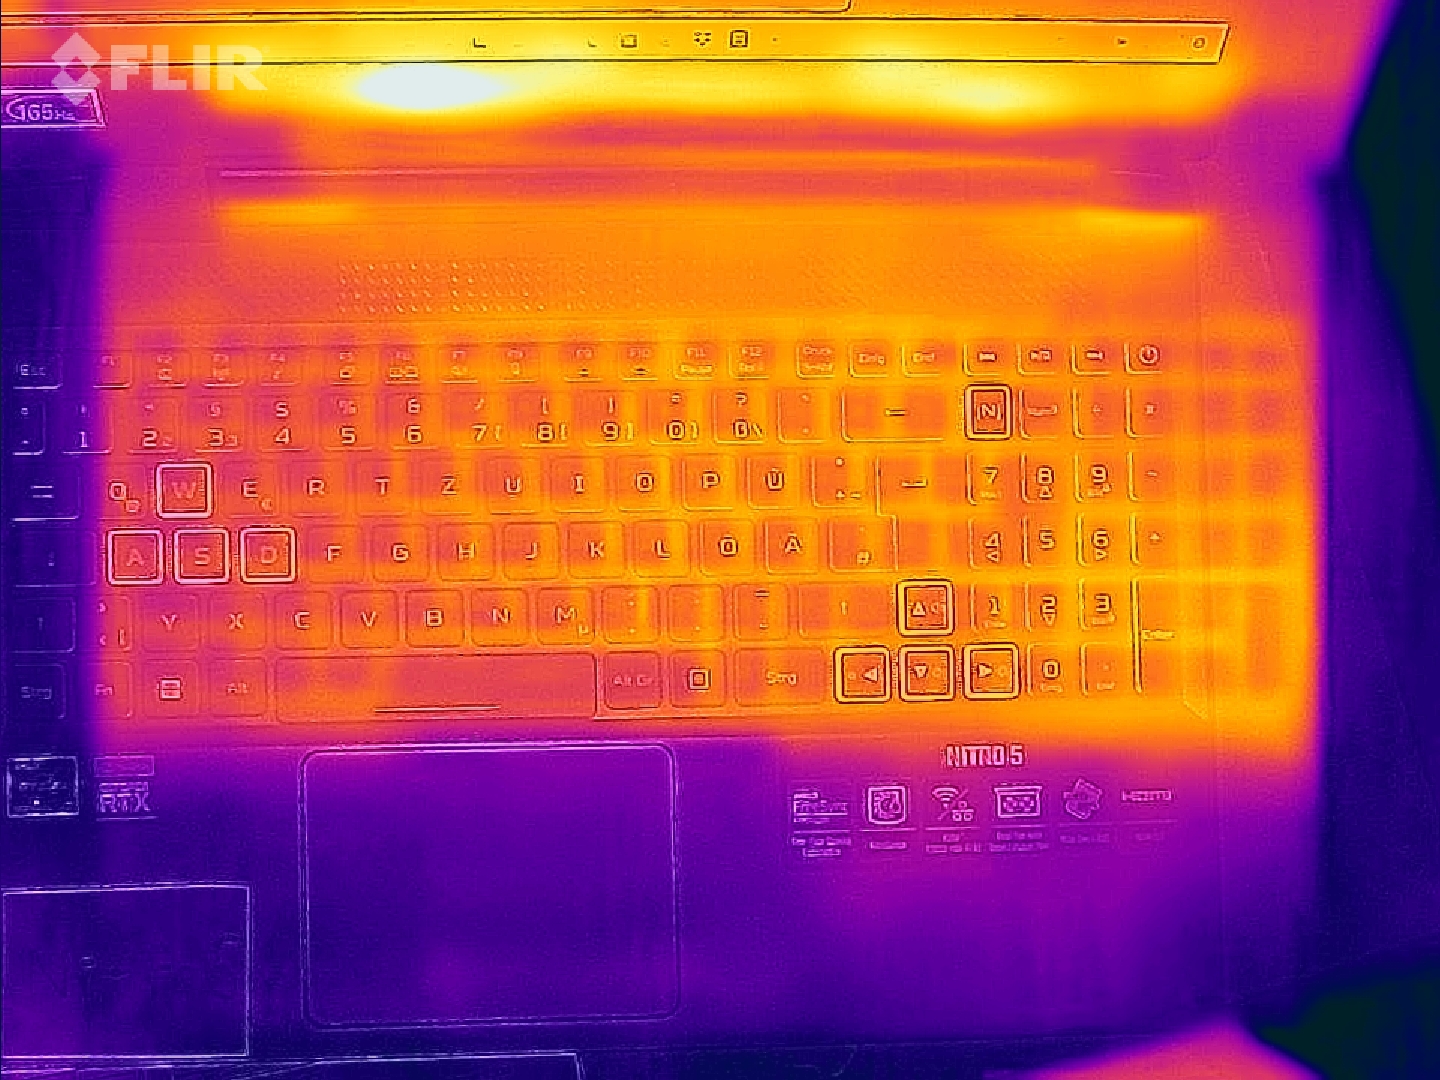
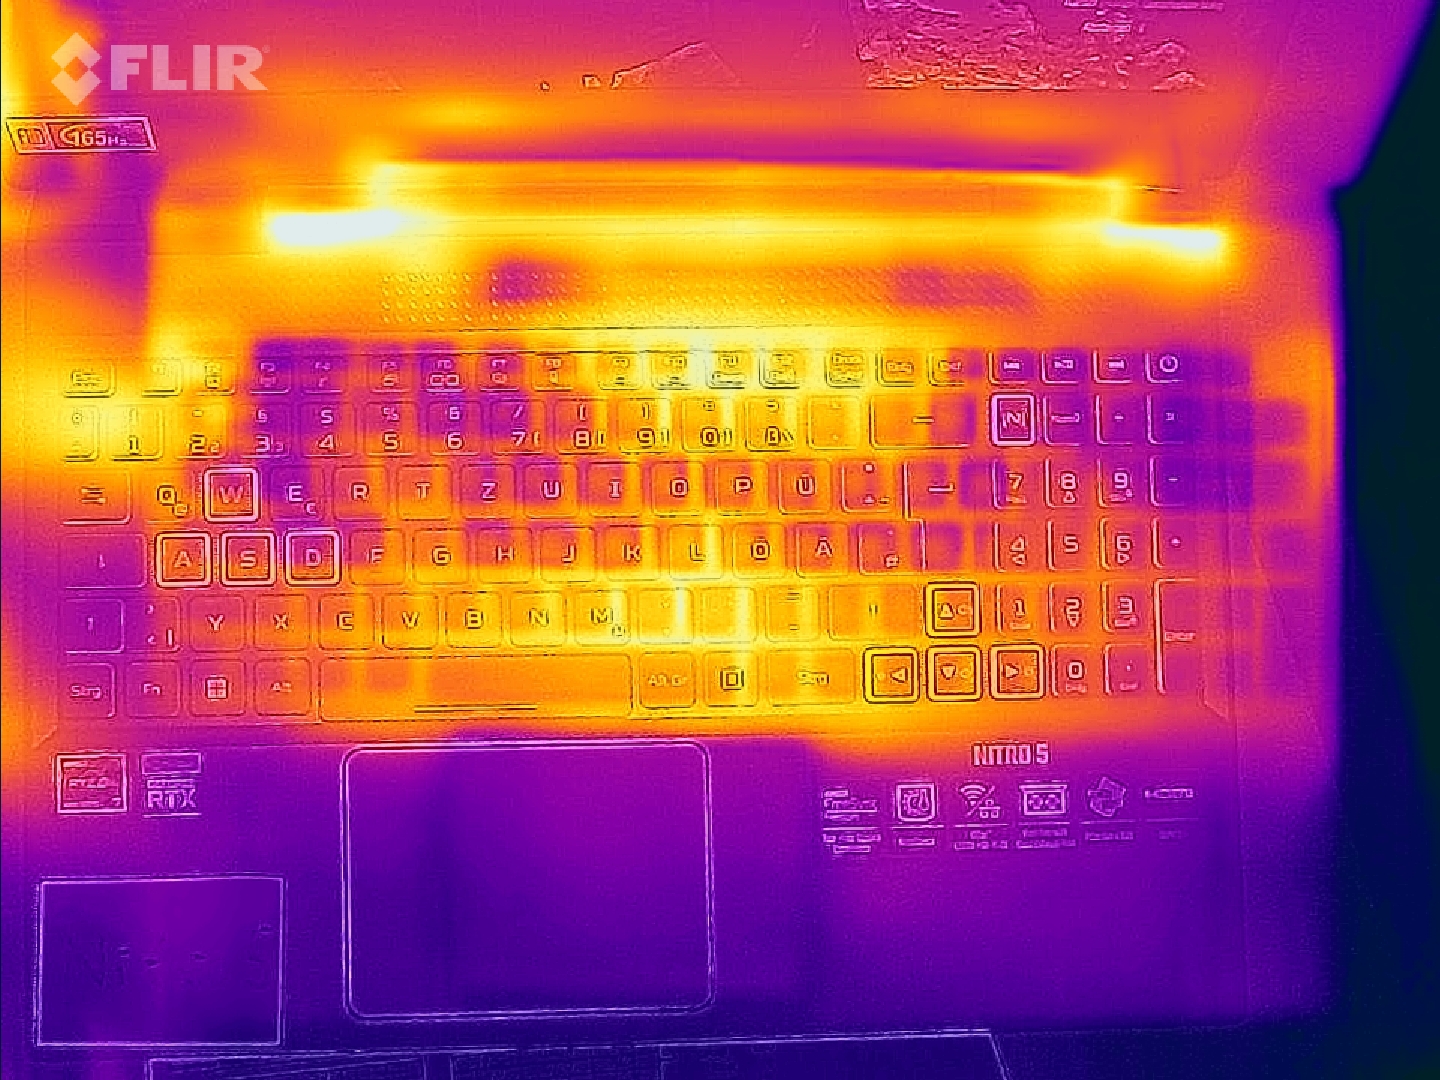
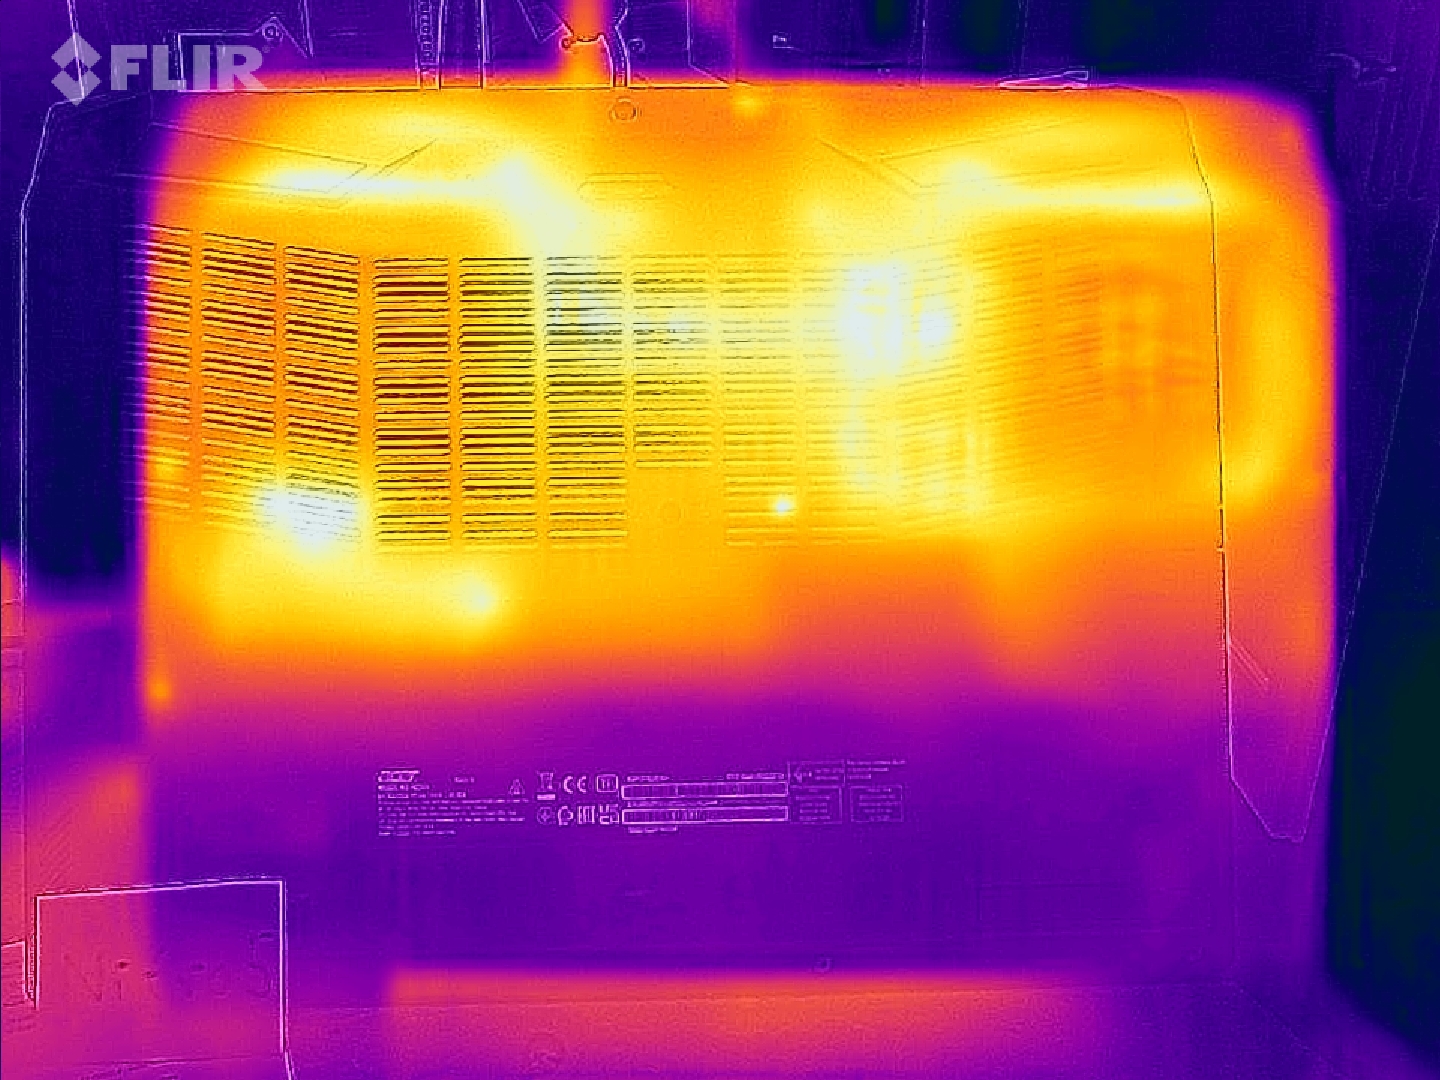
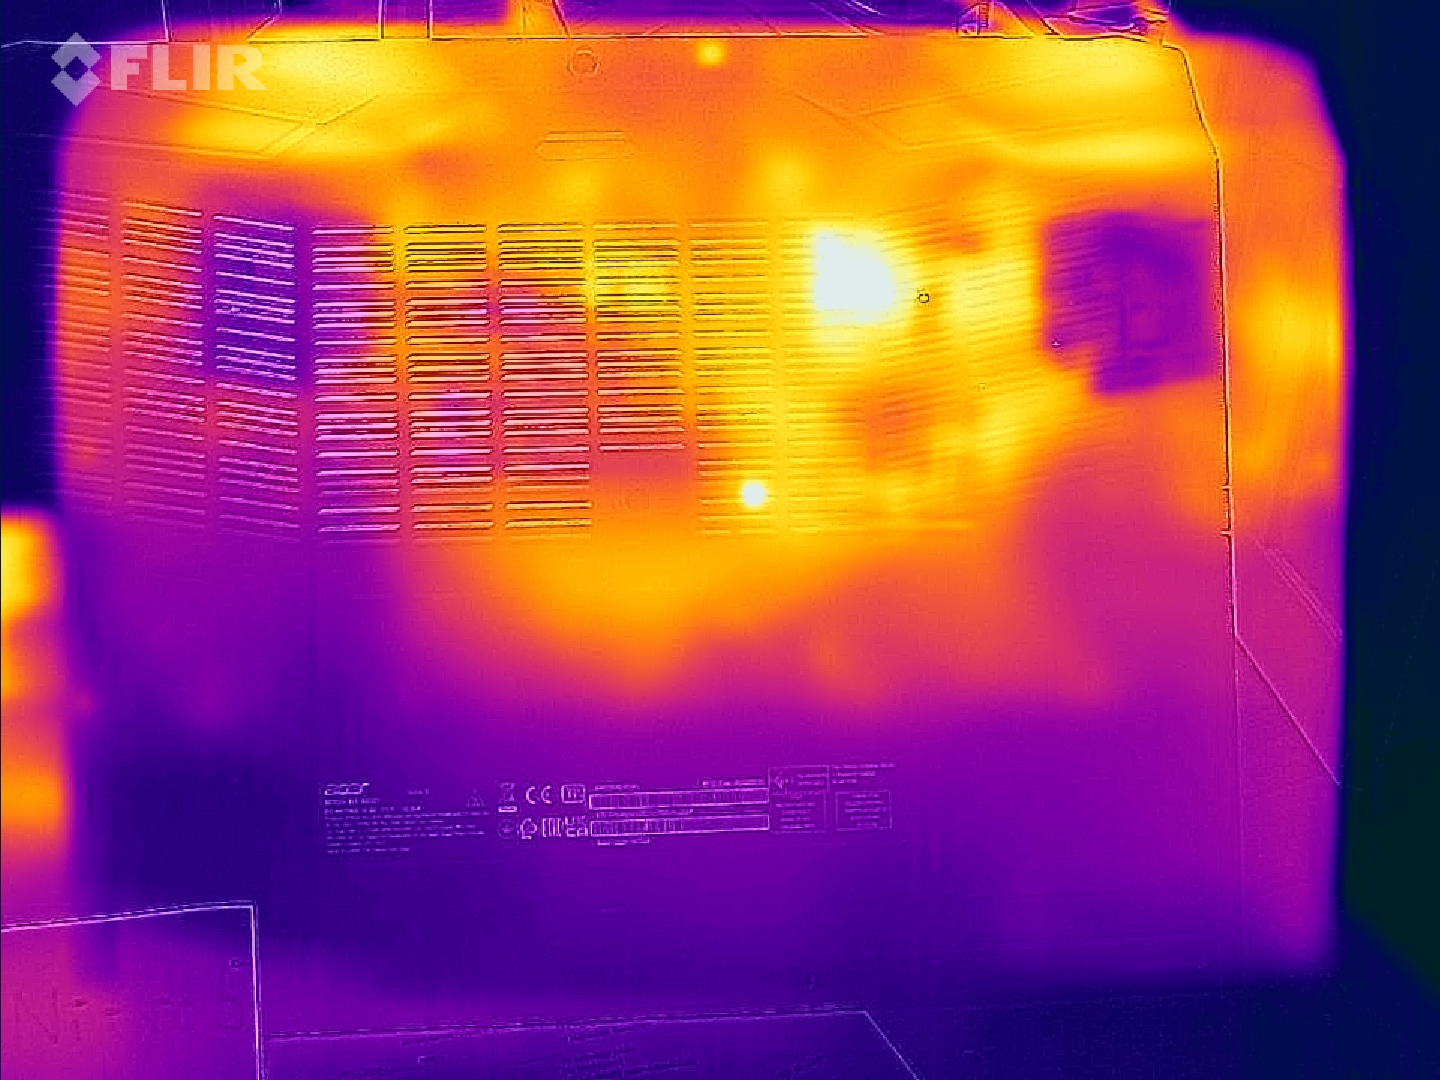
Temperature
The surface temperatures remain acceptable during everyday use (office, internet) and only increase moderately under load (stress test, Witcher 3). This is very different from the sister model.
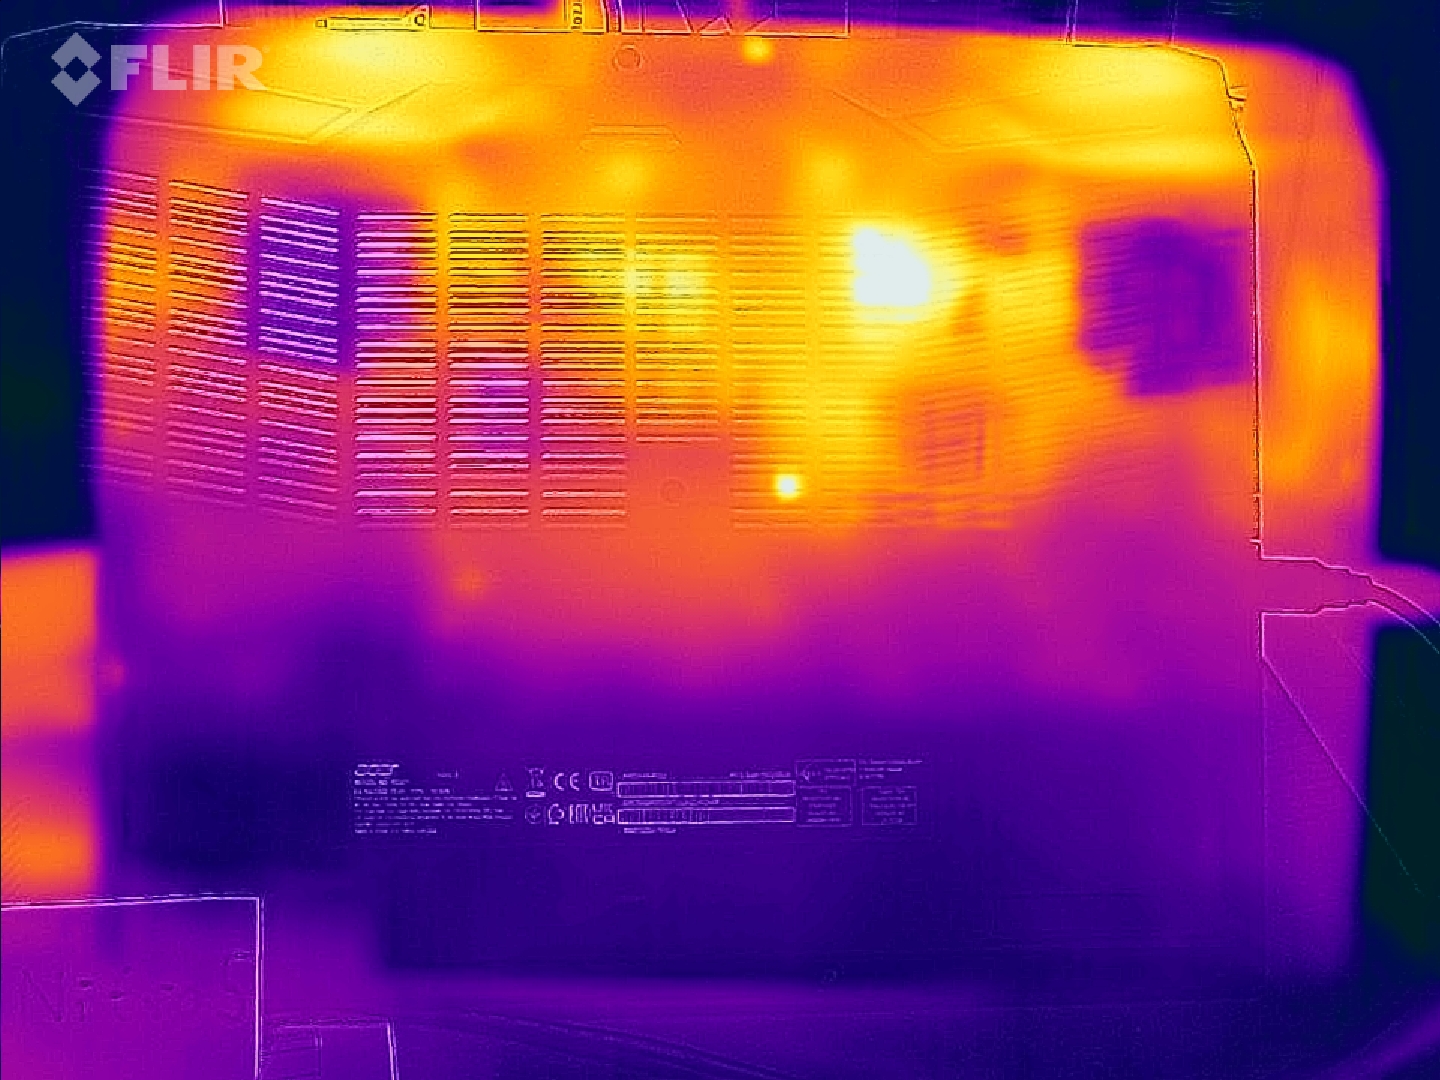
(-) The maximum temperature on the upper side is 48.1 °C / 119 F, compared to the average of 40.4 °C / 105 F, ranging from 21.2 to 68.8 °C for the class Gaming.
(-) The bottom heats up to a maximum of 49.7 °C / 121 F, compared to the average of 43.2 °C / 110 F
(+) In idle usage, the average temperature for the upper side is 26.4 °C / 80 F, compared to the device average of 33.9 °C / 93 F.
(+) Playing The Witcher 3, the average temperature for the upper side is 31.8 °C / 89 F, compared to the device average of 33.9 °C / 93 F.
(+) The palmrests and touchpad are cooler than skin temperature with a maximum of 25.2 °C / 77.4 F and are therefore cool to the touch.
(+) The average temperature of the palmrest area of similar devices was 28.9 °C / 84 F (+3.7 °C / 6.6 F).
| Acer Nitro 5 AN515-46-R1A1 AMD Ryzen 7 6800H, NVIDIA GeForce RTX 3070 Ti Laptop GPU | MSI Katana GF66 12UGS Intel Core i7-12700H, NVIDIA GeForce RTX 3070 Ti Laptop GPU | Schenker XMG Fusion 15 (Mid 22) Intel Core i7-11800H, NVIDIA GeForce RTX 3070 Laptop GPU | Asus TUF Dash F15 FX517ZR Intel Core i7-12650H, NVIDIA GeForce RTX 3070 Laptop GPU | Acer Nitro 5 AN515-58-72QR Intel Core i7-12700H, NVIDIA GeForce RTX 3070 Ti Laptop GPU | |
|---|---|---|---|---|---|
| Heat | -25% | -20% | -9% | -5% | |
| Maximum Upper Side * (°C) | 48.1 | 61 -27% | 52 -8% | 52 -8% | 48 -0% |
| Maximum Bottom * (°C) | 49.7 | 55 -11% | 63 -27% | 52 -5% | 51 -3% |
| Idle Upper Side * (°C) | 30 | 43 -43% | 37 -23% | 33 -10% | 34 -13% |
| Idle Bottom * (°C) | 31.7 | 38 -20% | 38 -20% | 36 -14% | 33 -4% |
* ... smaller is better
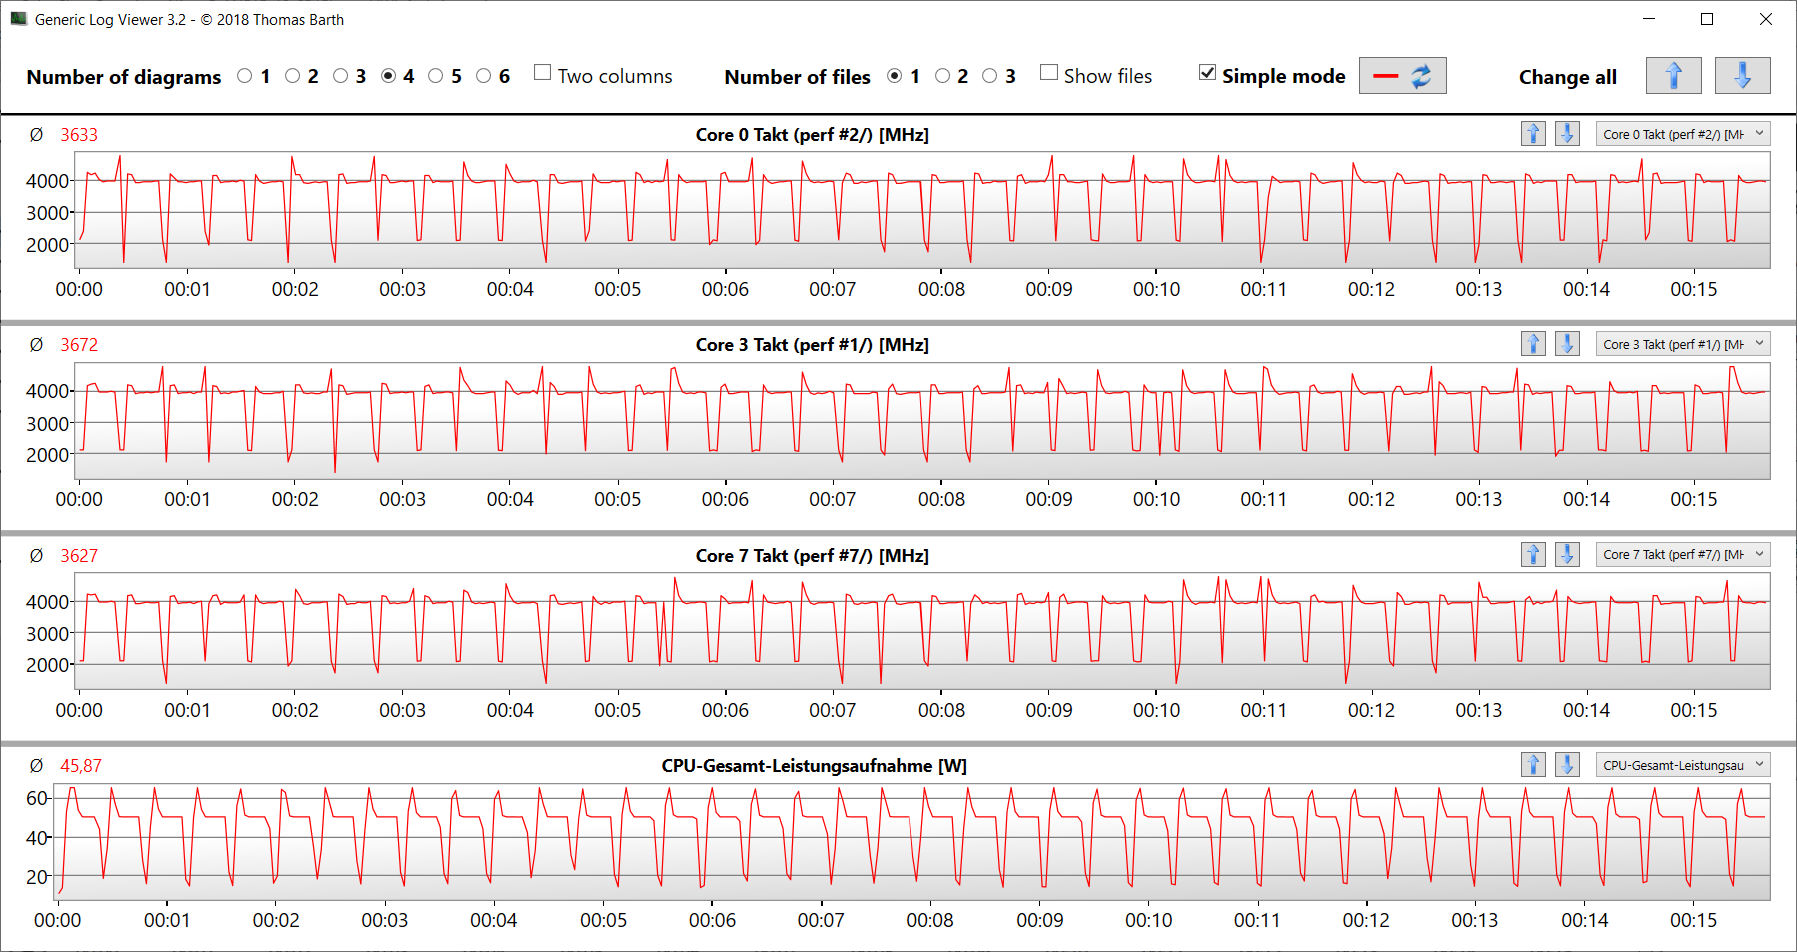
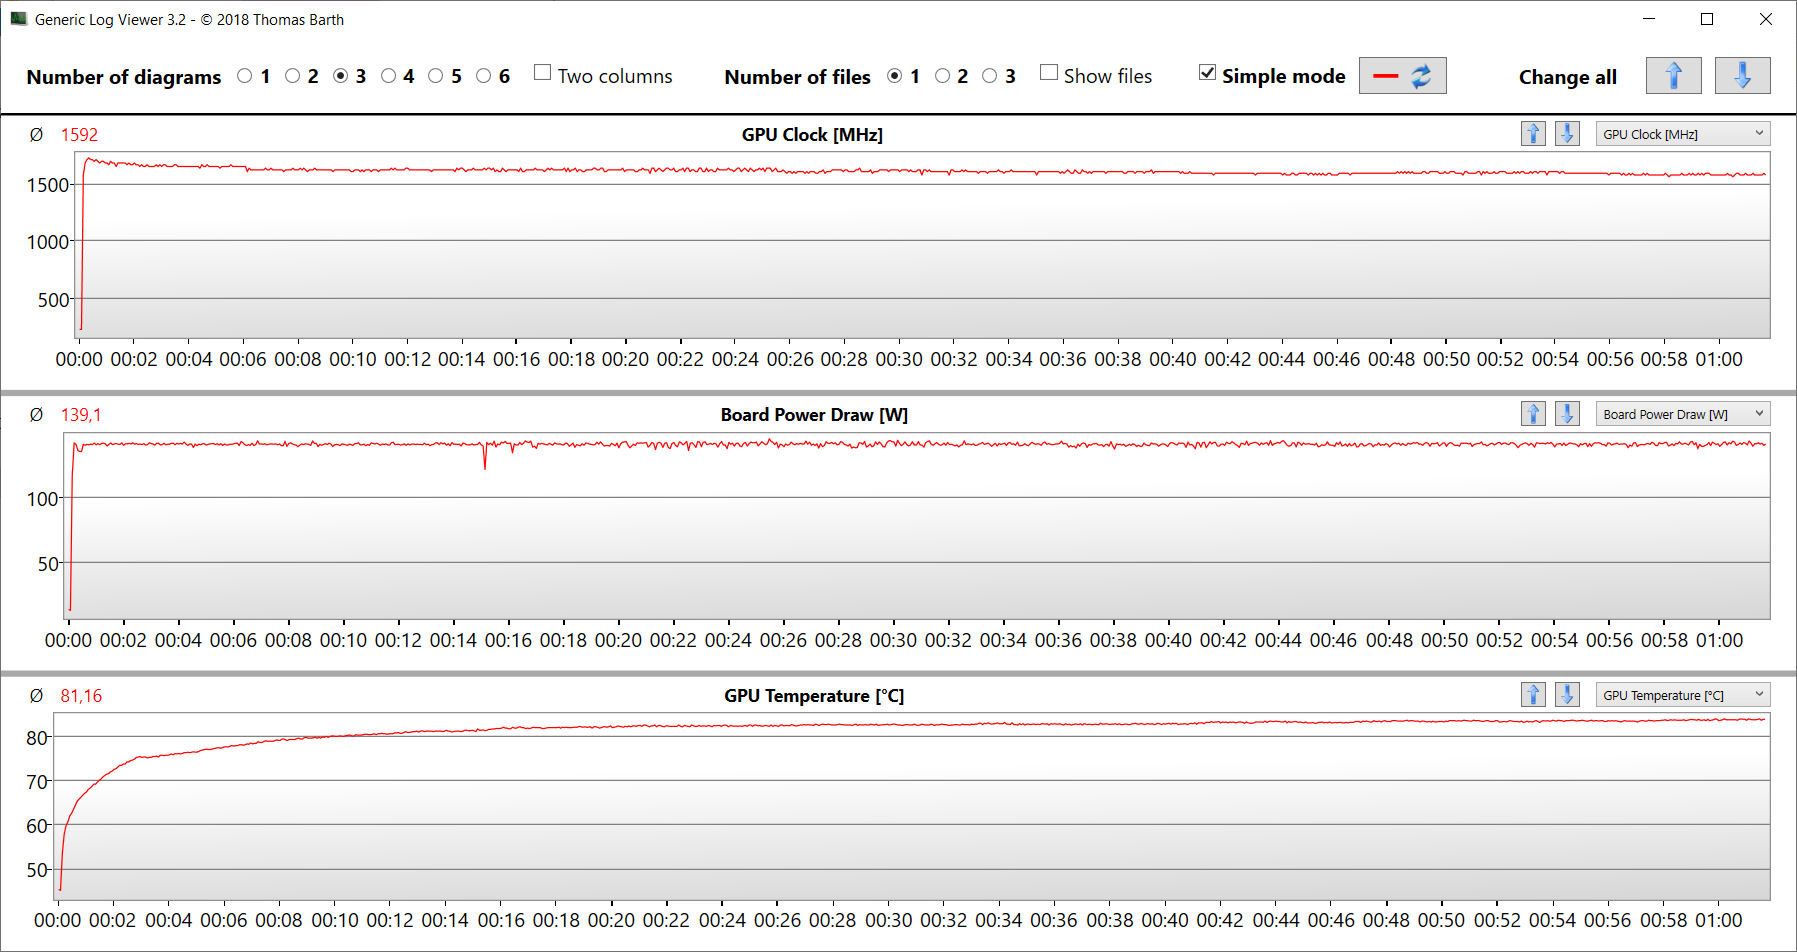
Stress test
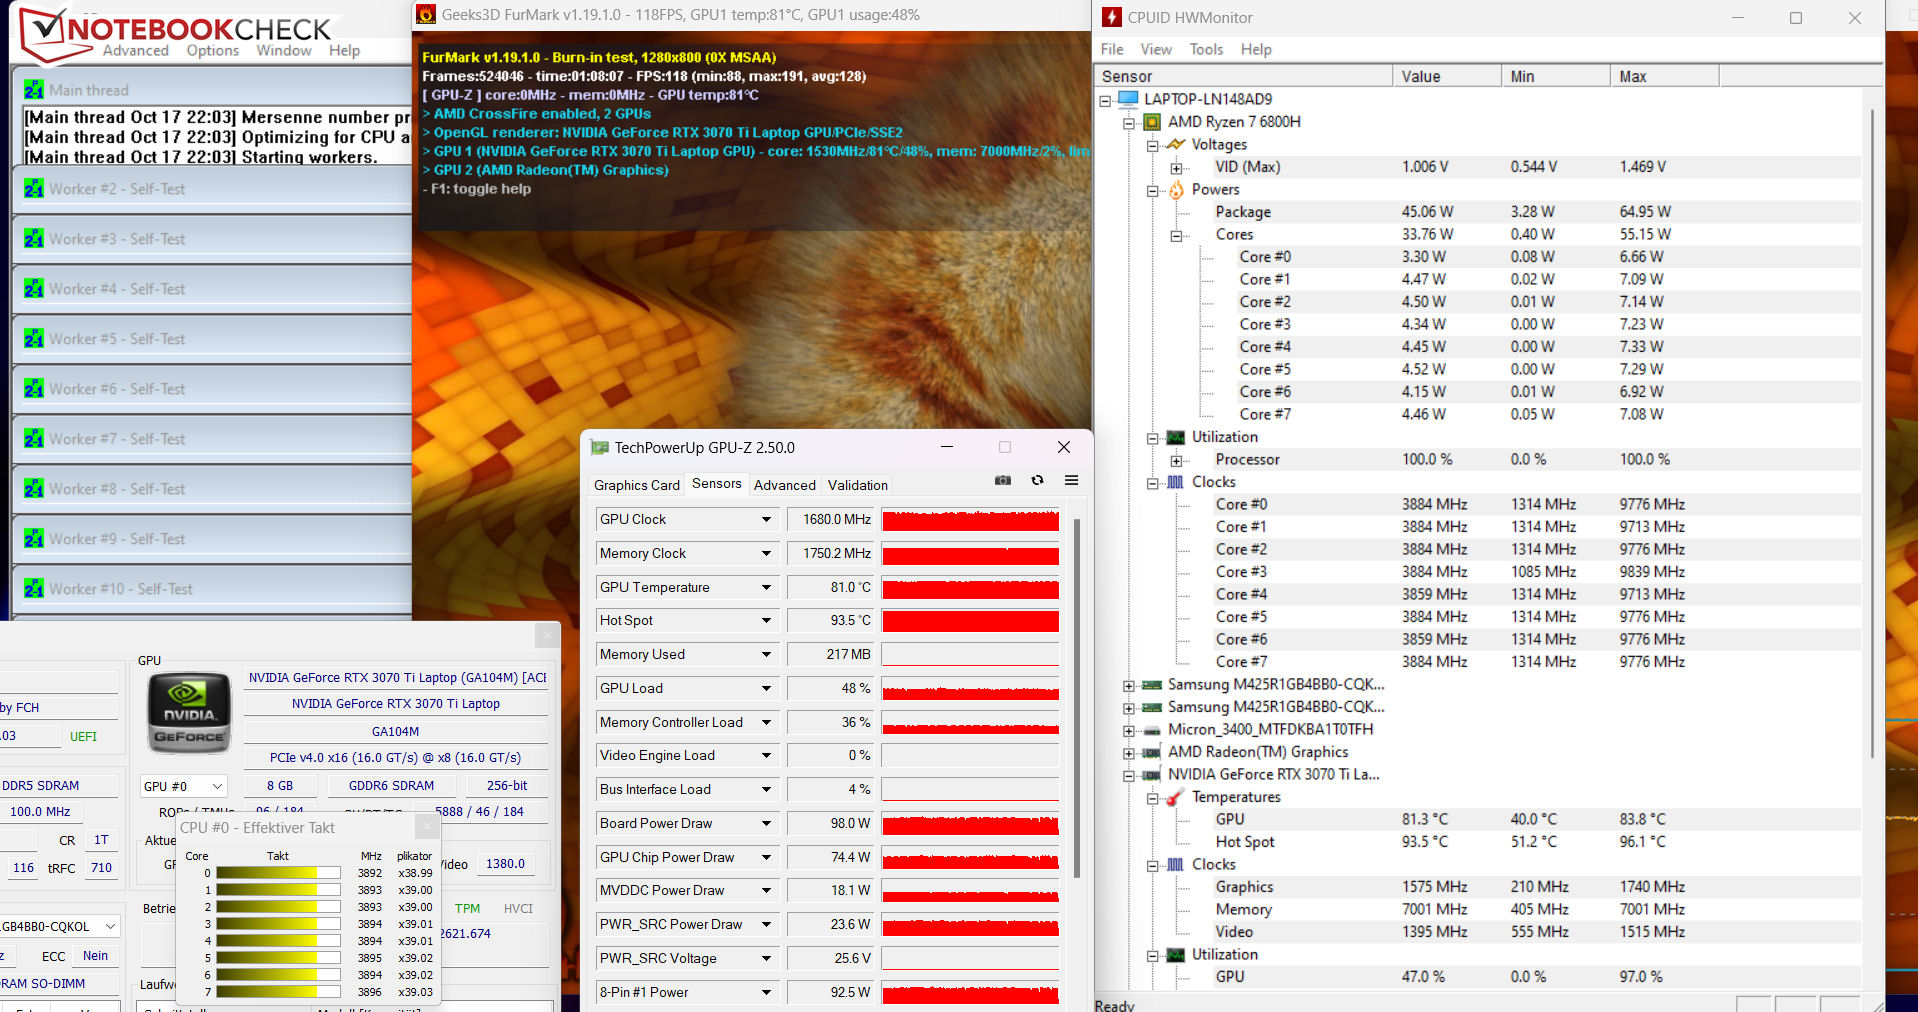
The stress test (Prime95 and FurMark are activated continuously) is an extreme scenario that enables us to examine the system's stability under maximum load. The CPU (4.2 to 4.3 GHz) and GPU (1,000 to 1,600 MHz) begin the test with high clock rates. While the CPU clock rate drops slightly in the course of the test, the GPU clock rate stabilizes at a high level.
Speakers
The sound produced by the stereo speakers is adequate but could benefit from more bass.
Acer Nitro 5 AN515-46-R1A1 audio analysis
(±) | speaker loudness is average but good (76.3 dB)
Bass 100 - 315 Hz
(-) | nearly no bass - on average 23% lower than median
(±) | linearity of bass is average (14.2% delta to prev. frequency)
Mids 400 - 2000 Hz
(+) | balanced mids - only 3.1% away from median
(+) | mids are linear (6.9% delta to prev. frequency)
Highs 2 - 16 kHz
(+) | balanced highs - only 3.4% away from median
(+) | highs are linear (6.3% delta to prev. frequency)
Overall 100 - 16.000 Hz
(±) | linearity of overall sound is average (19.7% difference to median)
Compared to same class
» 69% of all tested devices in this class were better, 6% similar, 25% worse
» The best had a delta of 6%, average was 18%, worst was 132%
Compared to all devices tested
» 49% of all tested devices were better, 7% similar, 44% worse
» The best had a delta of 4%, average was 24%, worst was 134%
Schenker XMG Fusion 15 (Mid 22) audio analysis
(+) | speakers can play relatively loud (82 dB)
Bass 100 - 315 Hz
(-) | nearly no bass - on average 17.6% lower than median
(±) | linearity of bass is average (12.1% delta to prev. frequency)
Mids 400 - 2000 Hz
(+) | balanced mids - only 3% away from median
(+) | mids are linear (3.9% delta to prev. frequency)
Highs 2 - 16 kHz
(+) | balanced highs - only 2.8% away from median
(+) | highs are linear (5.5% delta to prev. frequency)
Overall 100 - 16.000 Hz
(+) | overall sound is linear (13.3% difference to median)
Compared to same class
» 19% of all tested devices in this class were better, 5% similar, 76% worse
» The best had a delta of 6%, average was 18%, worst was 132%
Compared to all devices tested
» 13% of all tested devices were better, 3% similar, 84% worse
» The best had a delta of 4%, average was 24%, worst was 134%
Energy Management - Acer computer with decent battery life
Energy Consumption
We did not notice any inconsistencies when it comes to the AN515's energy consumption. Consumption increased up to 230 watts and an average of 203 watts during the stress test/Witcher 3 test, but it remained steady throughout both tests. The AC adapter (rated output: 280 watts) is large enough to cover this device's needs.
| Off / Standby | |
| Idle | |
| Load |
|
Key:
min: | |
| Acer Nitro 5 AN515-46-R1A1 R7 6800H, GeForce RTX 3070 Ti Laptop GPU, Micron 3400 1TB MTFDKBA1T0TFH, IPS, 1920x1080, 15.6" | MSI Katana GF66 12UGS i7-12700H, GeForce RTX 3070 Ti Laptop GPU, Micron 2450 1TB MTFDKBA1T0TFK, IPS, 1920x1080, 15.6" | Schenker XMG Fusion 15 (Mid 22) i7-11800H, GeForce RTX 3070 Laptop GPU, Samsung SSD 980 Pro 1TB MZ-V8P1T0BW, IPS, 2560x1440, 15.6" | Asus TUF Dash F15 FX517ZR i7-12650H, GeForce RTX 3070 Laptop GPU, Samsung PM991a MZVLQ1T0HBLB, IPS, 2560x1440, 15.6" | Acer Nitro 5 AN515-58-72QR i7-12700H, GeForce RTX 3070 Ti Laptop GPU, Samsung PM9A1 MZVL21T0HCLR, IPS, 2560x1440, 15.6" | Average NVIDIA GeForce RTX 3070 Ti Laptop GPU | Average of class Gaming | |
|---|---|---|---|---|---|---|---|
| Power Consumption | -5% | -25% | -8% | -15% | -56% | -54% | |
| Idle Minimum * (Watt) | 7 | 9 -29% | 12 -71% | 10 -43% | 7 -0% | 14.2 ? -103% | 13.7 ? -96% |
| Idle Average * (Watt) | 8.9 | 13 -46% | 17 -91% | 14 -57% | 15 -69% | 19.9 ? -124% | 19.6 ? -120% |
| Idle Maximum * (Watt) | 14.4 | 20 -39% | 24 -67% | 20 -39% | 24 -67% | 26.2 ? -82% | 26.3 ? -83% |
| Load Average * (Watt) | 202 | 100 50% | 106 48% | 122 40% | 124 39% | 125.8 ? 38% | 111.2 ? 45% |
| Witcher 3 ultra * (Watt) | 203 | 149 27% | 159.9 21% | 138.6 32% | 195.1 4% | ||
| Load Maximum * (Watt) | 230 | 212 8% | 208 10% | 189 18% | 220 4% | 248 ? -8% | 263 ? -14% |
* ... smaller is better
Power consumption Witcher 3 / stress test
Power consumption with an external screen
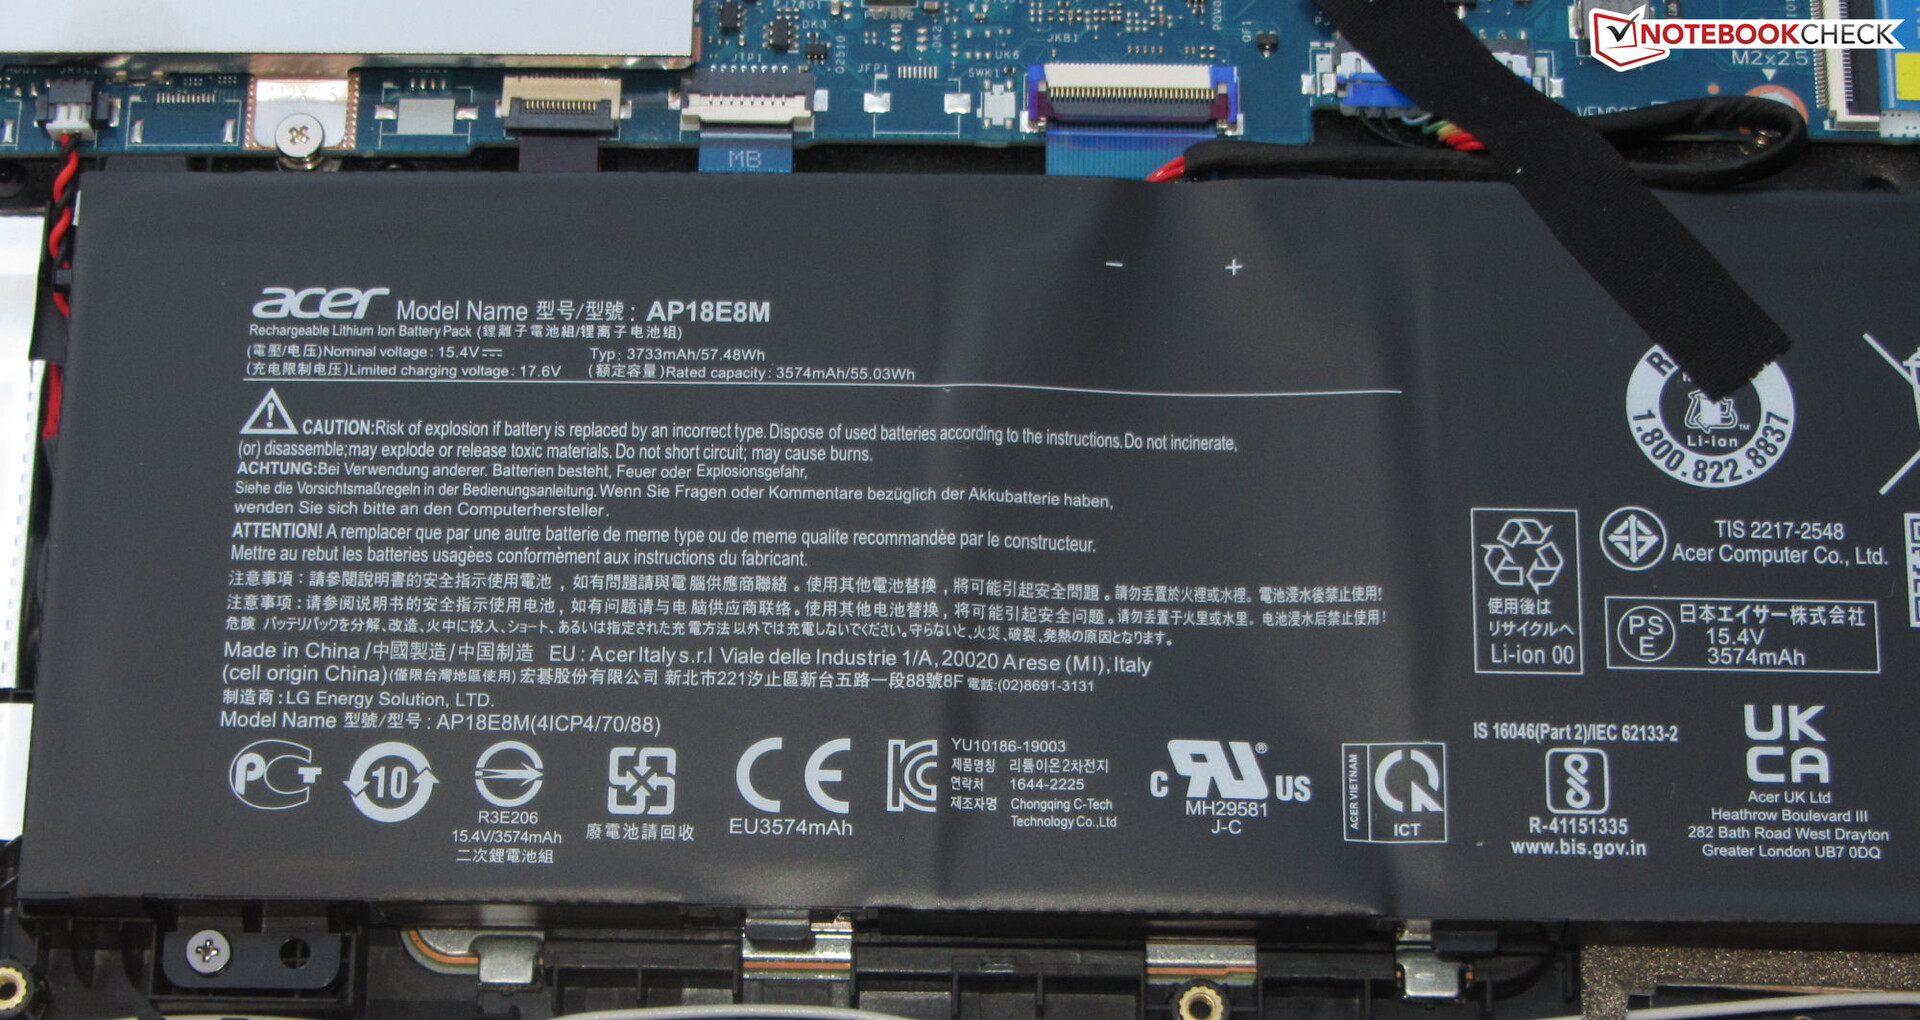
Battery Life
After the MSI Katana (52 Wh), the Nitro has the lowest battery capacity within our comparison field (57.5 Wh). It nonetheless achieves a decent battery life and can even keep up with some of its more generously-equipped competitors. It clearly outlasts its Intel-based sister model, thanks to the more frugal AMD processor and the lower screen resolution.
| Acer Nitro 5 AN515-46-R1A1 R7 6800H, GeForce RTX 3070 Ti Laptop GPU, 57.5 Wh | MSI Katana GF66 12UGS i7-12700H, GeForce RTX 3070 Ti Laptop GPU, 52 Wh | Schenker XMG Fusion 15 (Mid 22) i7-11800H, GeForce RTX 3070 Laptop GPU, 93.48 Wh | Asus TUF Dash F15 FX517ZR i7-12650H, GeForce RTX 3070 Laptop GPU, 76 Wh | Acer Nitro 5 AN515-58-72QR i7-12700H, GeForce RTX 3070 Ti Laptop GPU, 57.5 Wh | Average of class Gaming | |
|---|---|---|---|---|---|---|
| Battery runtime | -26% | 37% | 26% | -26% | 16% | |
| Reader / Idle (h) | 10.5 | 15.5 48% | 10.8 3% | 5.7 -46% | 9.99 ? -5% | |
| H.264 (h) | 5.7 | 7.5 32% | 5.8 2% | 4.7 -18% | 8.1 ? 42% | |
| WiFi v1.3 (h) | 5.8 | 2.4 -59% | 7.4 28% | 7 21% | 3.9 -33% | 6.71 ? 16% |
| Load (h) | 1.3 | 1.4 8% | 1.8 38% | 2.3 77% | 1.2 -8% | 1.435 ? 10% |
Pros
Cons
Verdict - A well-rounded gaming notebook
The Nitro 5 is made for FHD gaming at maximum settings - thanks to a Ryzen 7-6800H APU and a GeForce RTX 3070-Ti Laptop GPU (TGP: 150 W). The fast PCIe-4 SSD (1 TB) provides the necessary storage space and ensures short load times.
Acer's Nitro 5 AN515-46 is a fast FHD gaming notebook that does not display any serious weaknesses.
The CPU and GPU can provide consistently high clock rates. The device only heats up moderately under load. Unfortunately, its noise emissions aren't any better than usual: the Nitro 5 can be quite loud. The matte 15.6-inch panel (FHD, IPS, 165 Hz) gave us a good impression.
The notebook's battery life is decent but nothing out of the ordinary. The battery can be recharged with a universal USB-C AC adapter (min. 65 watts, 20 V) as the USB 4 port supports Power Delivery (and DisplayPort). This means that users won't necessarily have to carry the weighty 280-W power supply around with them.
Which Nitro 5 model is the better choice? That depends on your needs. The AMD version has DDR5 memory, low energy consumption values and a better battery life. It also heats up less. The Intel model offers higher single-thread CPU performance, Thunderbolt 4 and a better display. But remember: both Nitro versions are available with either an FHD or a QHD panel.
Some alternatives to the Nitro include the Schenker XMG Fusion 15 (Mid 22) and the Asus TUF Dash F15. Both devices offer a lower GPU performance and heat up noticeably under load. On the other hand, they are more compact, weigh less and have a longer battery life. The Fusion offers by far the longest runtimes.
Price and Availability
The Acer Nitro 5 AN515-46 is available from the manufacturer's website for $2200.
Acer Nitro 5 AN515-46-R1A1
- 10/28/2022 v7 (old)
Sascha Mölck
Price comparison

