 Deutsch
 English
 Español
 Français
 Italiano
 Nederlands
 Polski
 Português
 Русский
 Türkçe
 Svenska
 Chinese
 Magyar
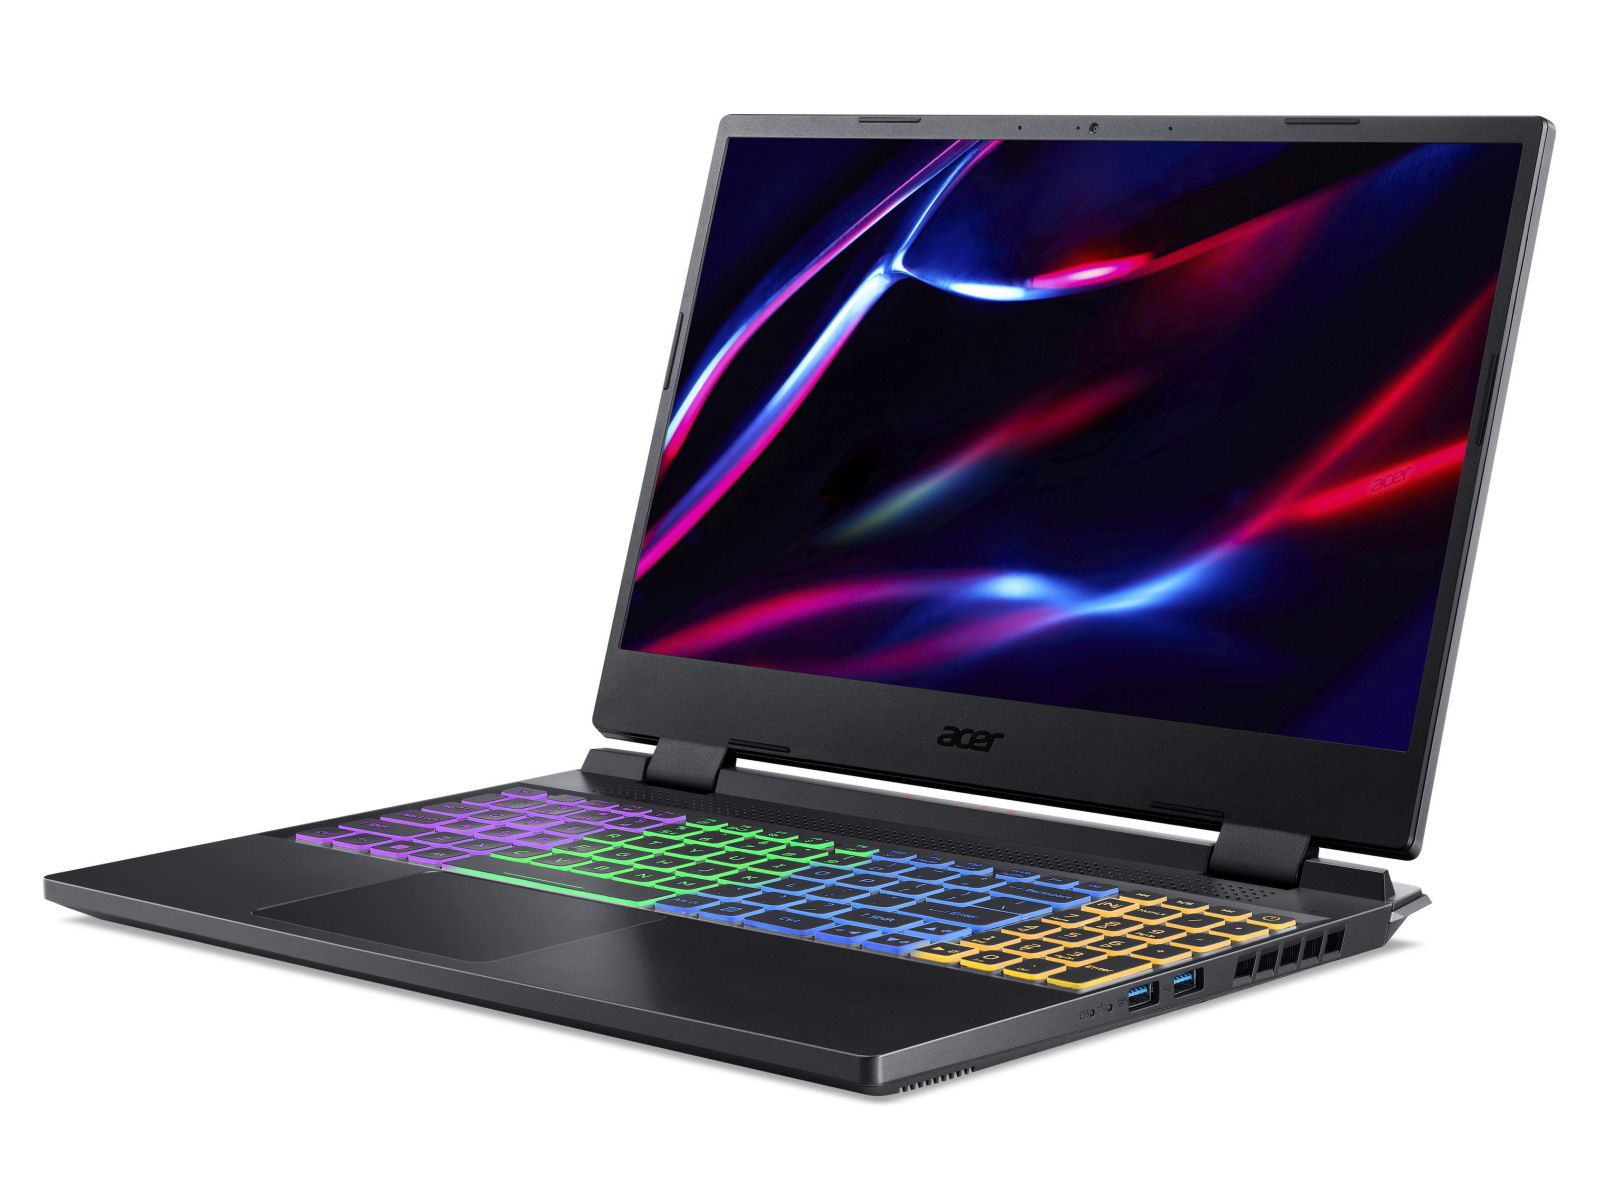
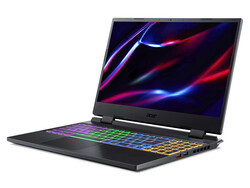
Acer Nitro 5 AN515-58 review: Fast QHD gaming notebook

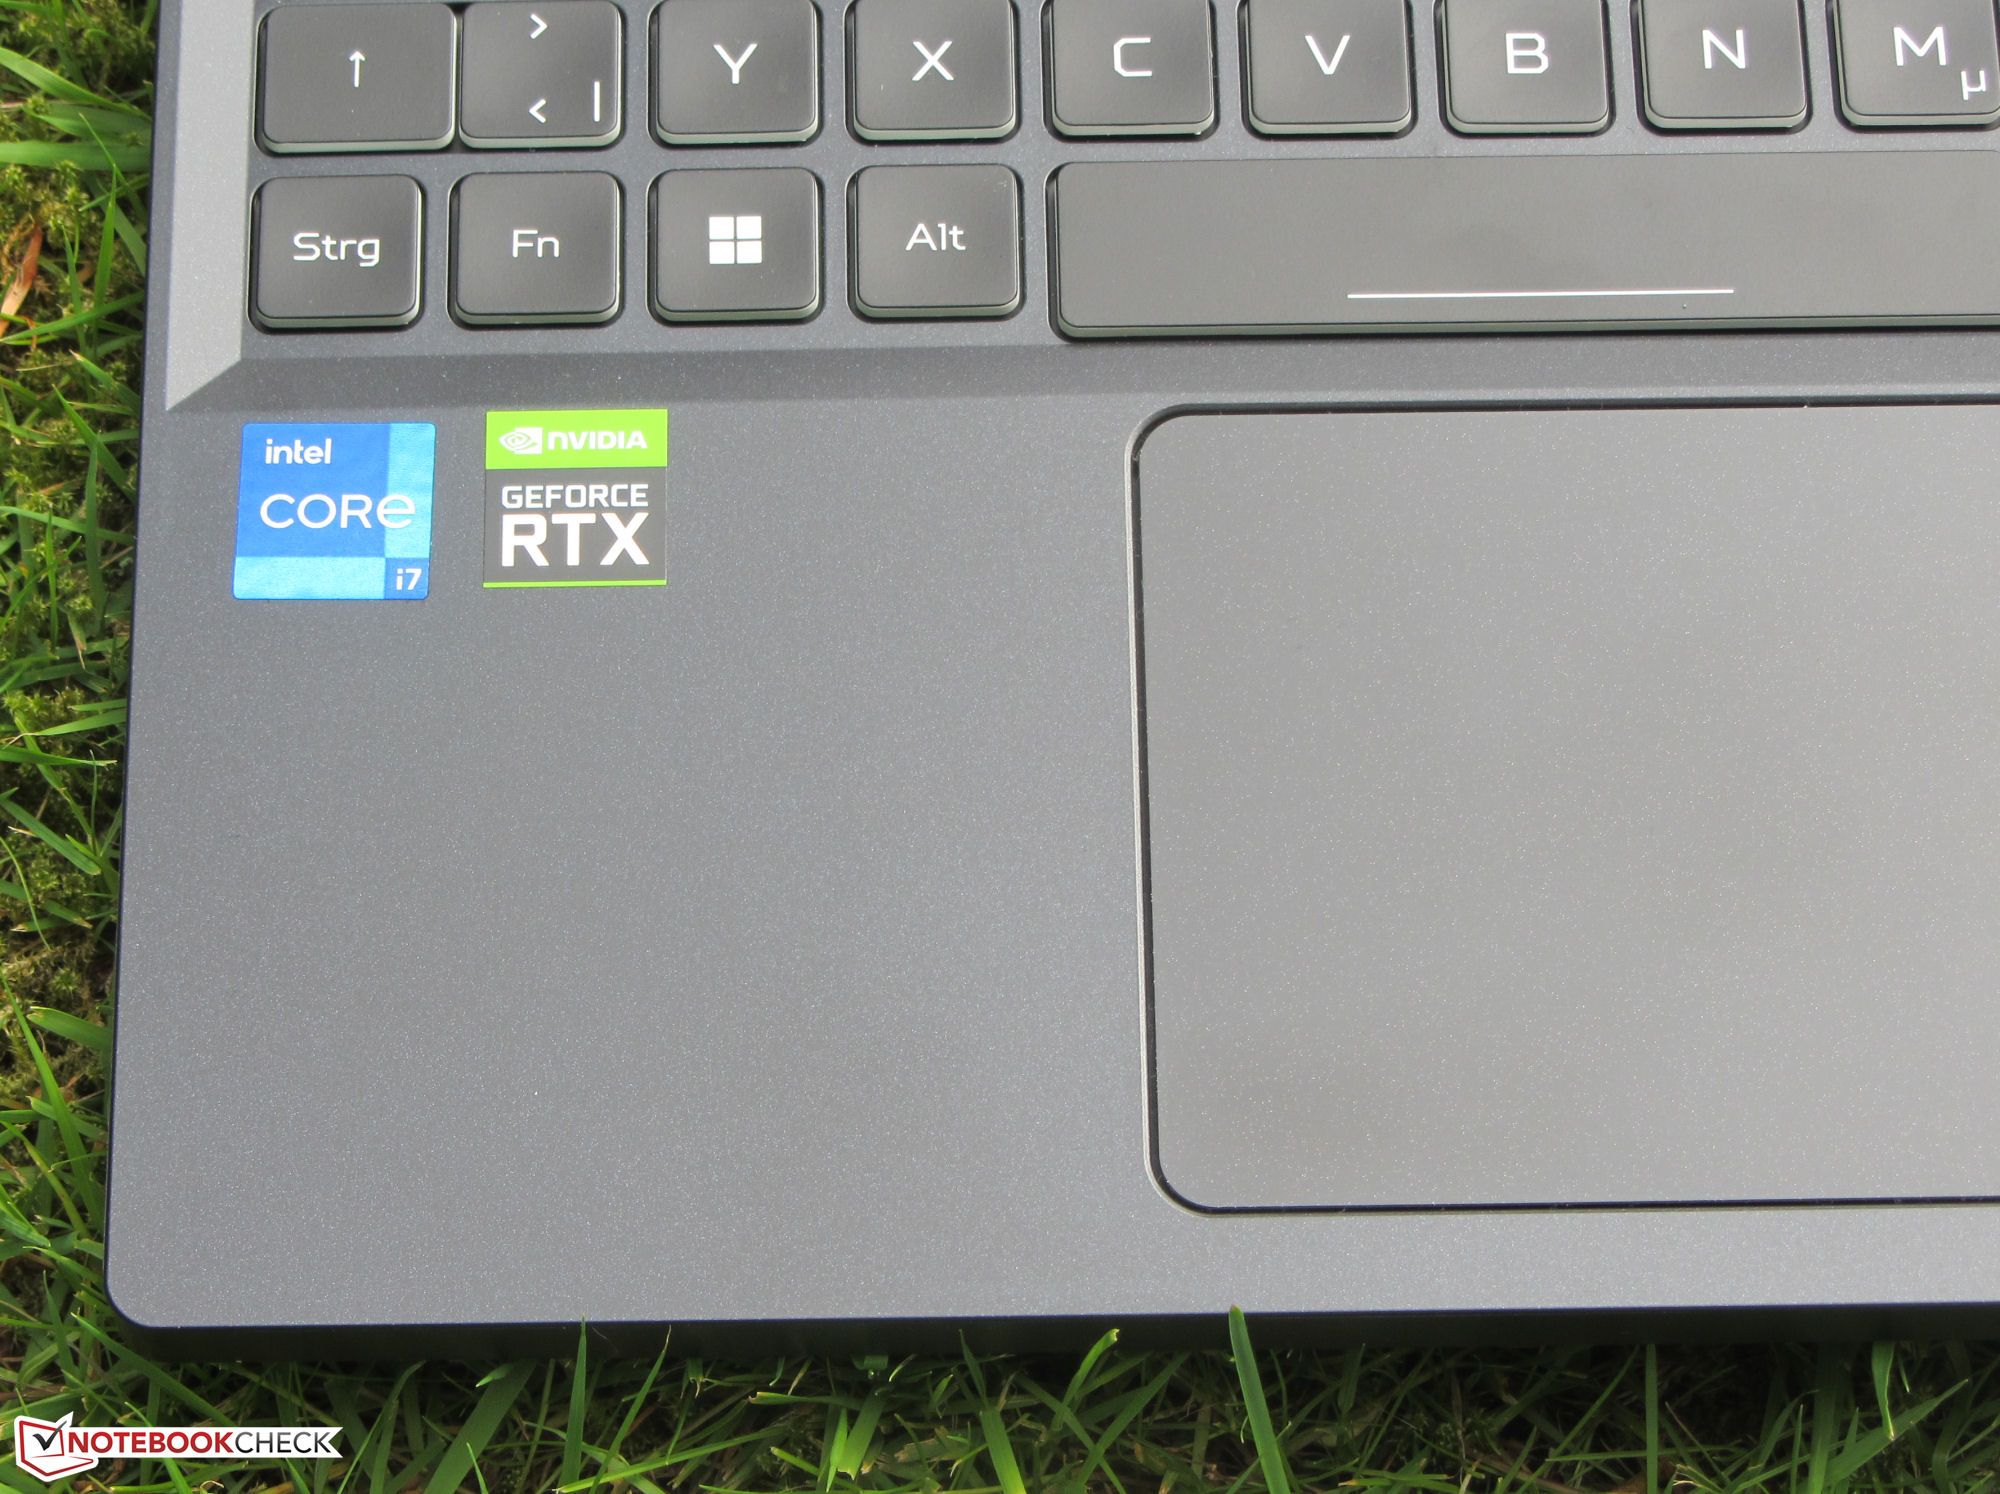
Acer has introduced a high-end gaming notebook to its lineup in the form of the Nitro 5 AN515-58, which is powered by a Core i7-12700H CPU and a GeForce RTX 3070 Ti laptop GPU. Competitors include devices like the HP Omen 16, the MSI Vector GP66 12UGS and the Lenovo Legion 5 Pro 16 G7.
Possible Competitors in Comparison
Rating | Date | Model | Weight | Height | Size | Resolution | Best Price |
|---|---|---|---|---|---|---|---|
| 84 % | 06/2022 | Acer Nitro 5 AN515-58-72QR i7-12700H, GeForce RTX 3070 Ti Laptop GPU | 2.5 kg | 26.8 mm | 15.60" | 2560x1440 | |
| 86.9 % | 03/2022 | MSI Vector GP66 12UGS i9-12900H, GeForce RTX 3070 Ti Laptop GPU | 2.3 kg | 23.4 mm | 15.60" | 1920x1080 | |
| 85.5 % | 05/2022 | HP Omen 16-b1090ng i7-12700H, GeForce RTX 3070 Ti Laptop GPU | 2.3 kg | 23 mm | 16.10" | 2560x1440 | |
| 88 % | 03/2022 | Lenovo Legion 5 Pro 16 G7 i7 RTX 3070Ti i7-12700H, GeForce RTX 3070 Ti Laptop GPU | 2.6 kg | 26.6 mm | 16.00" | 2560x1600 |
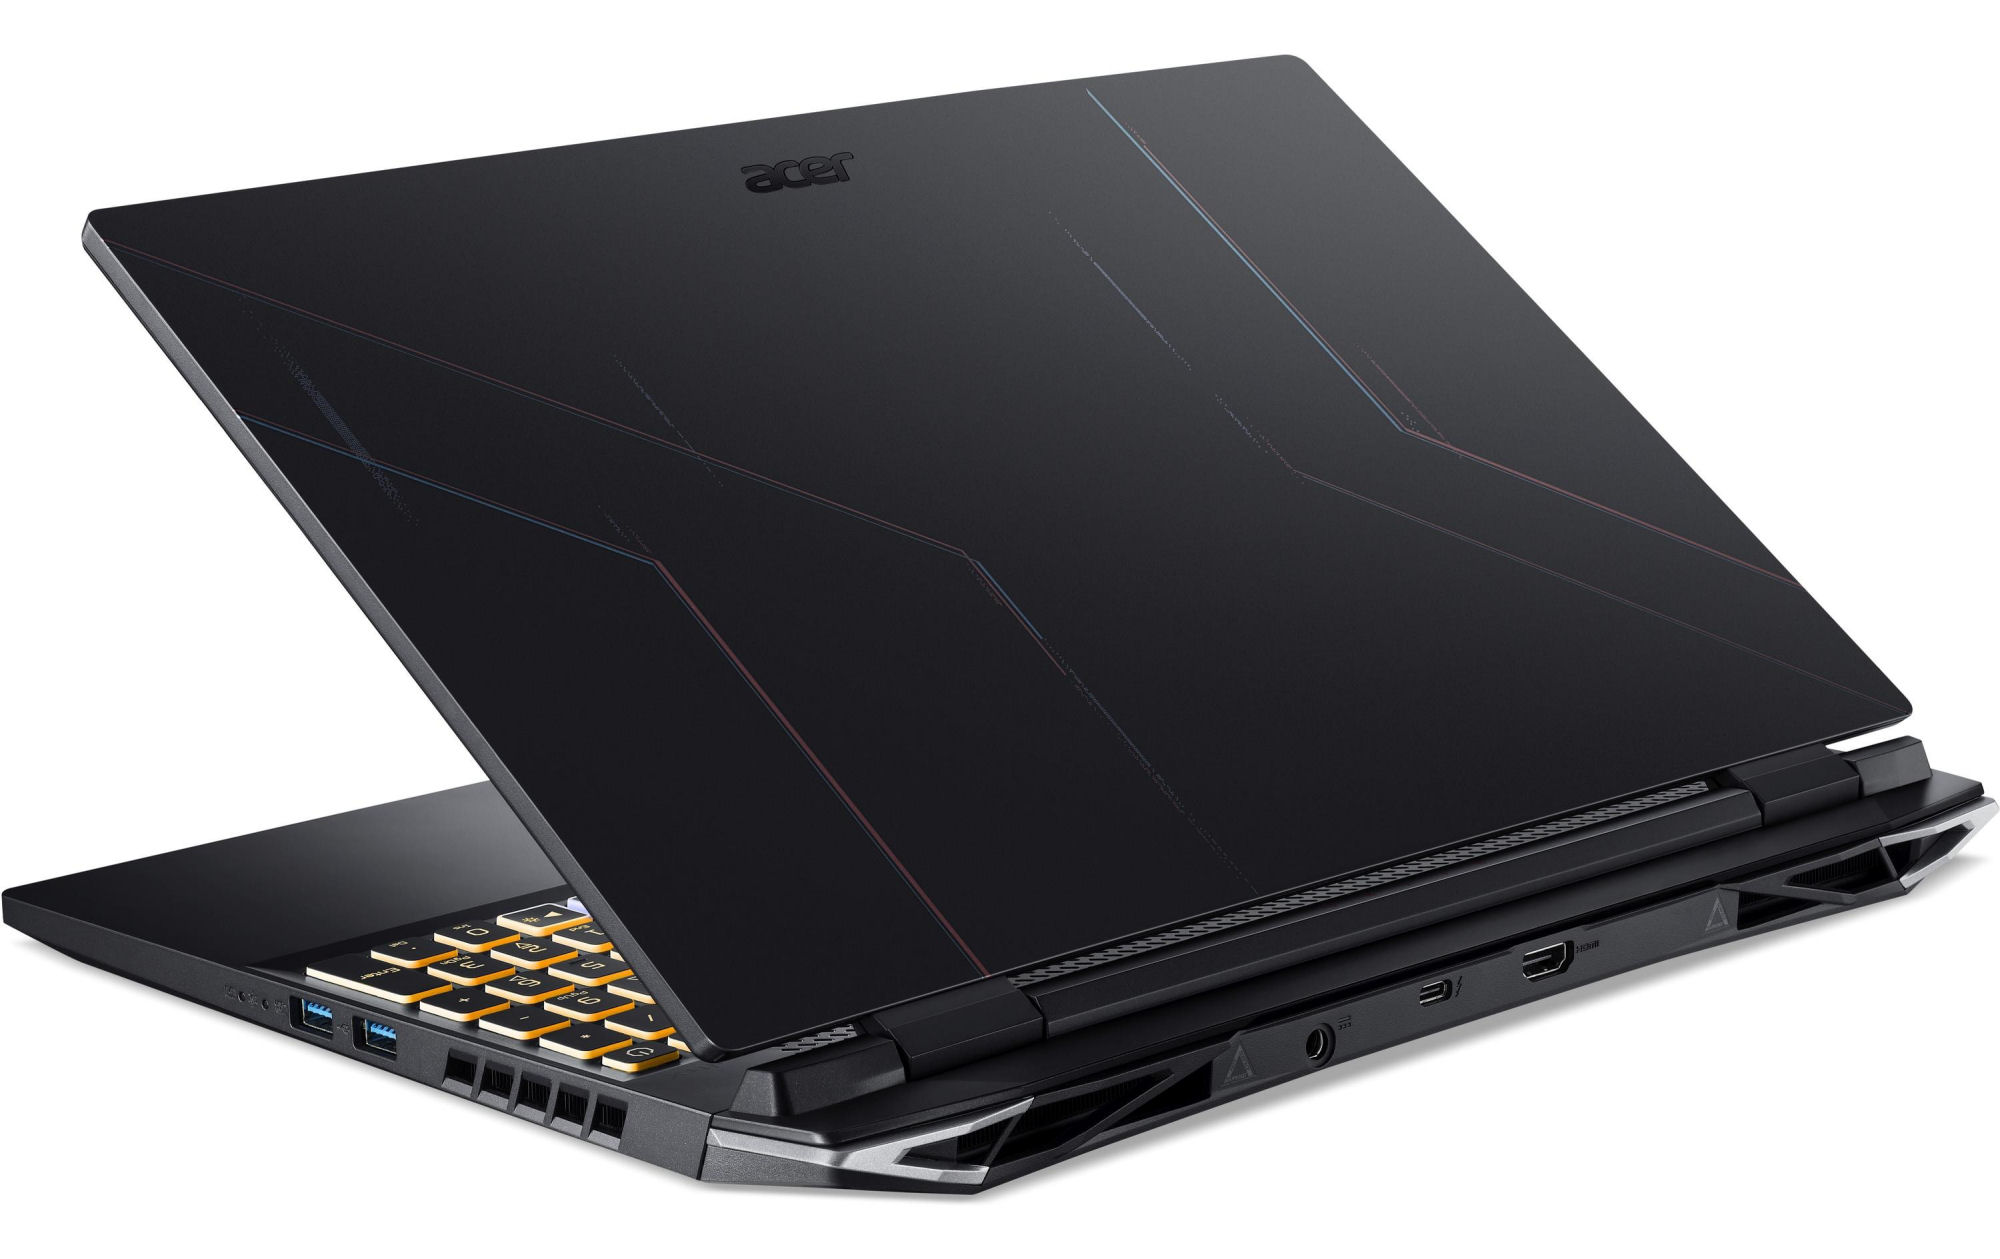
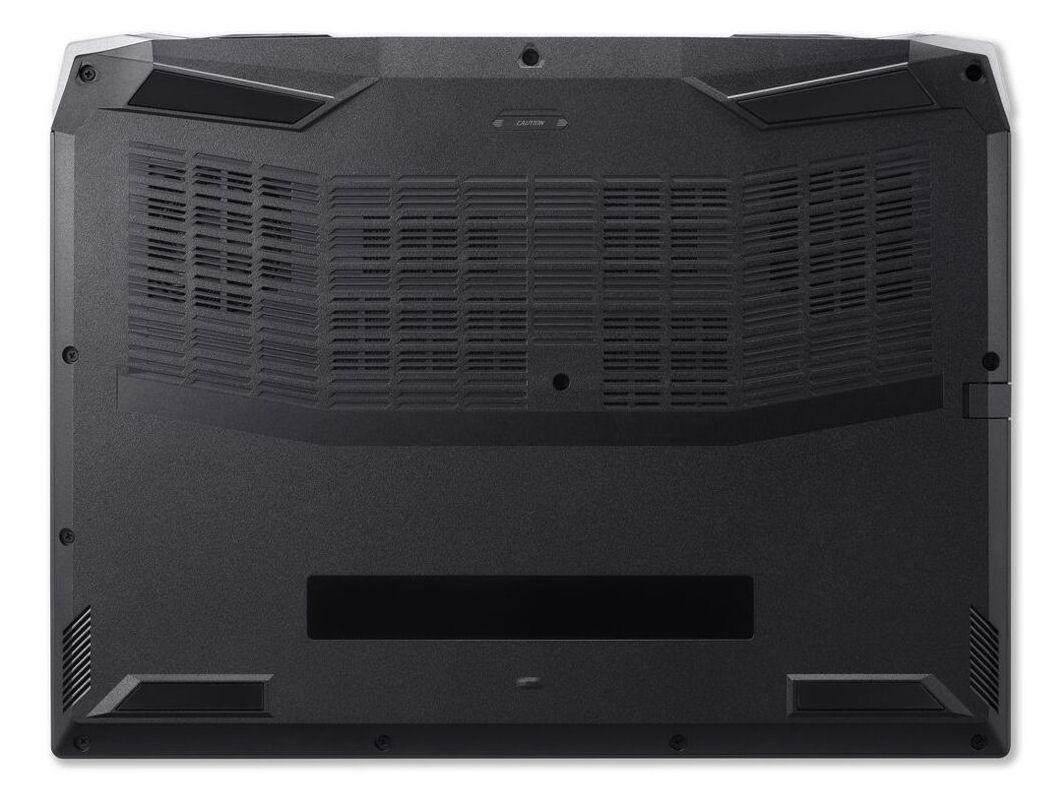
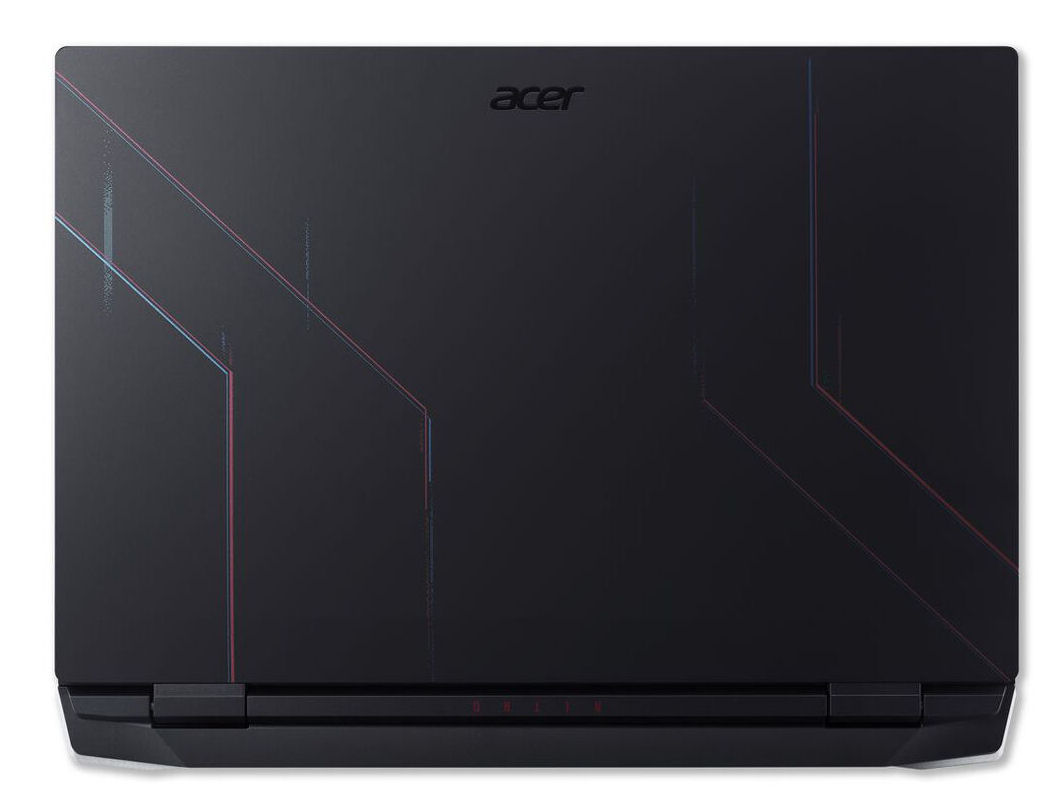
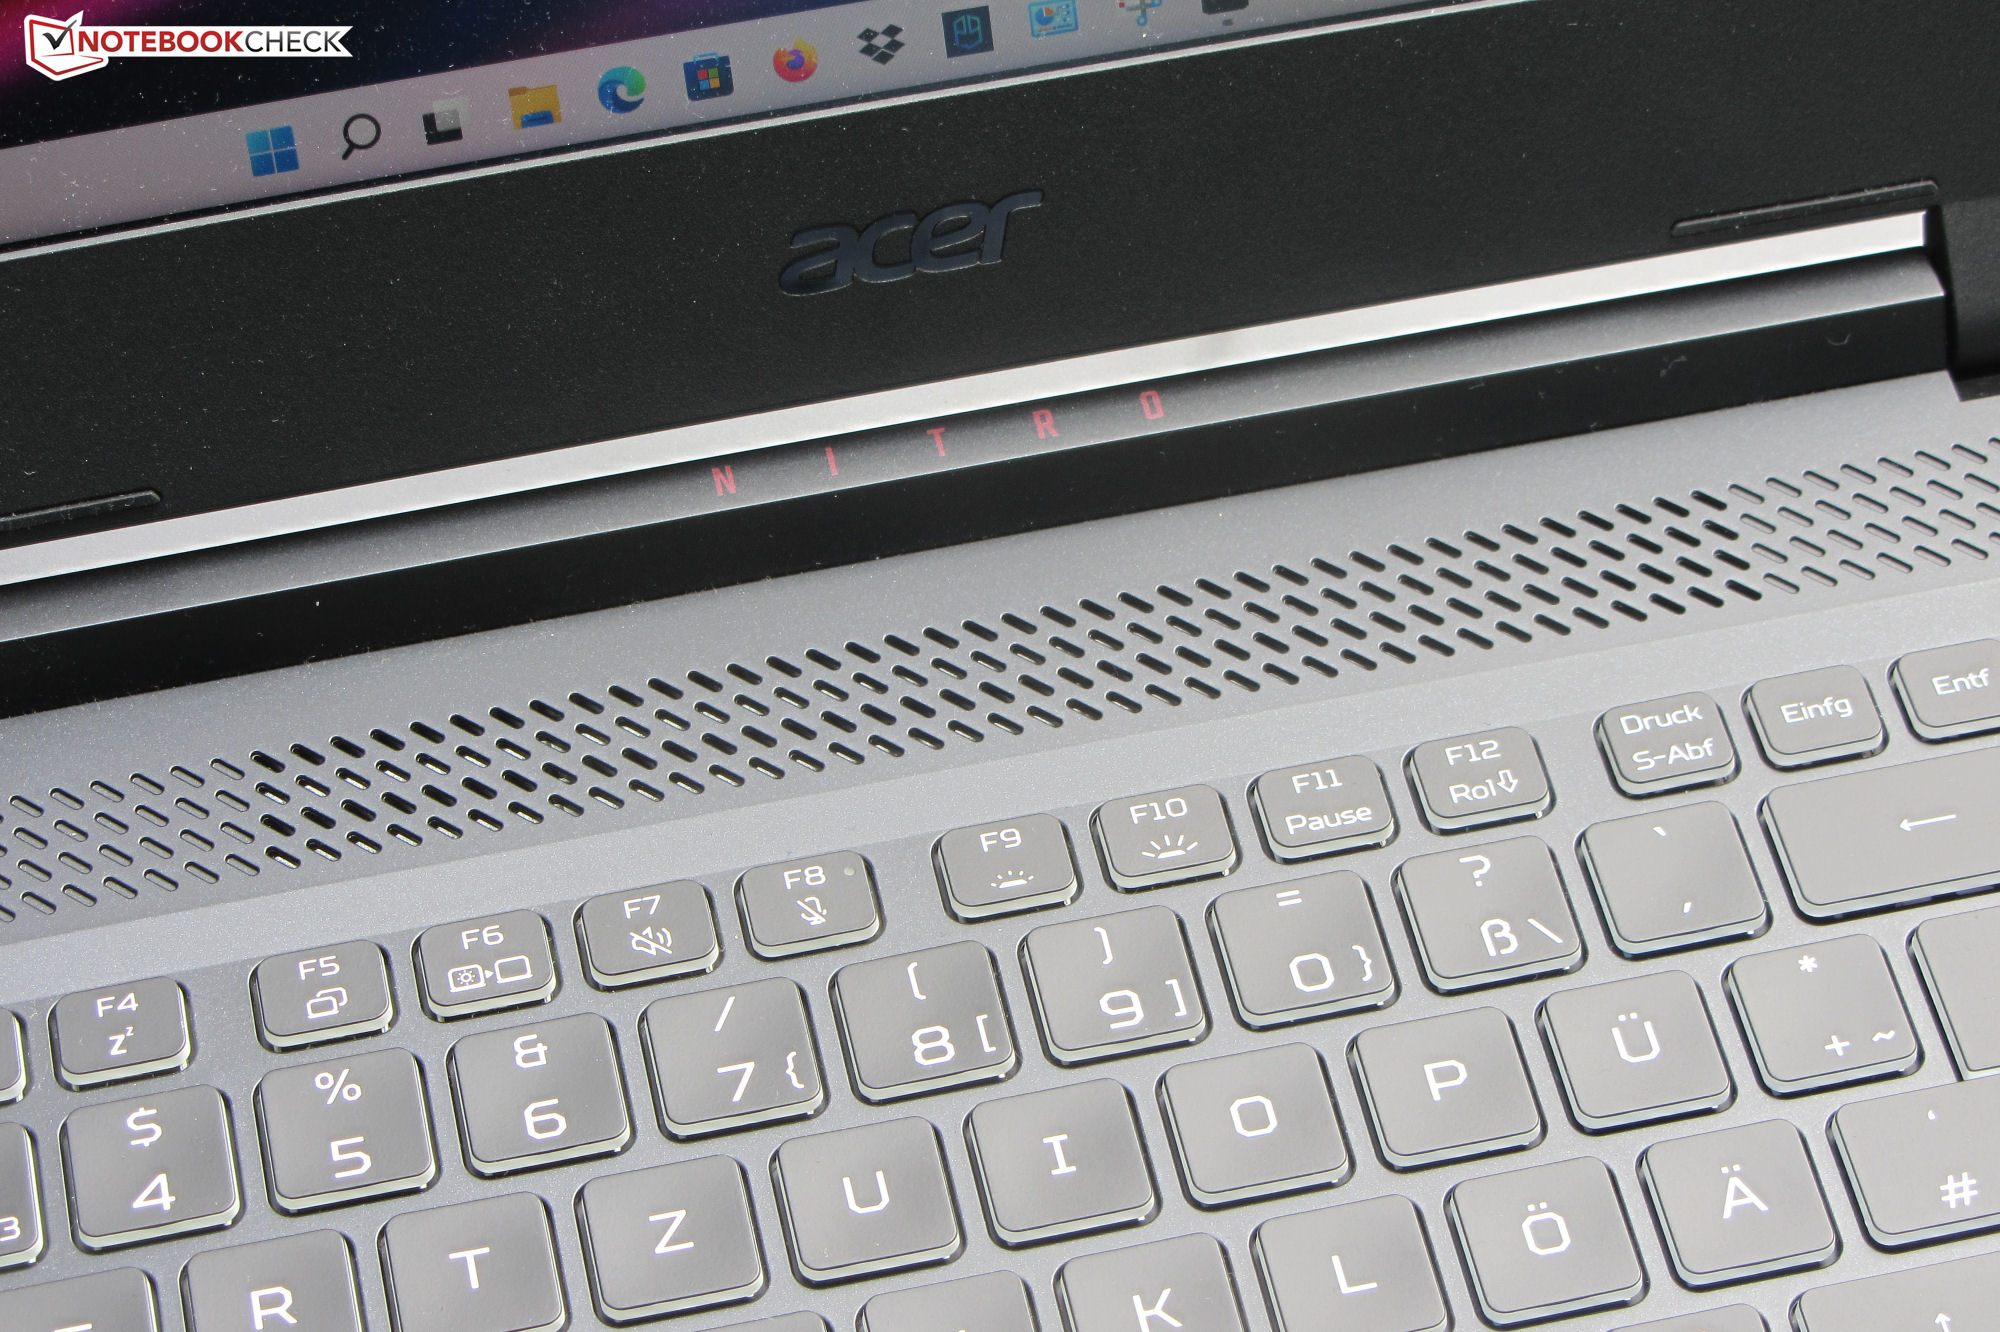
Case: Acer set on plastic
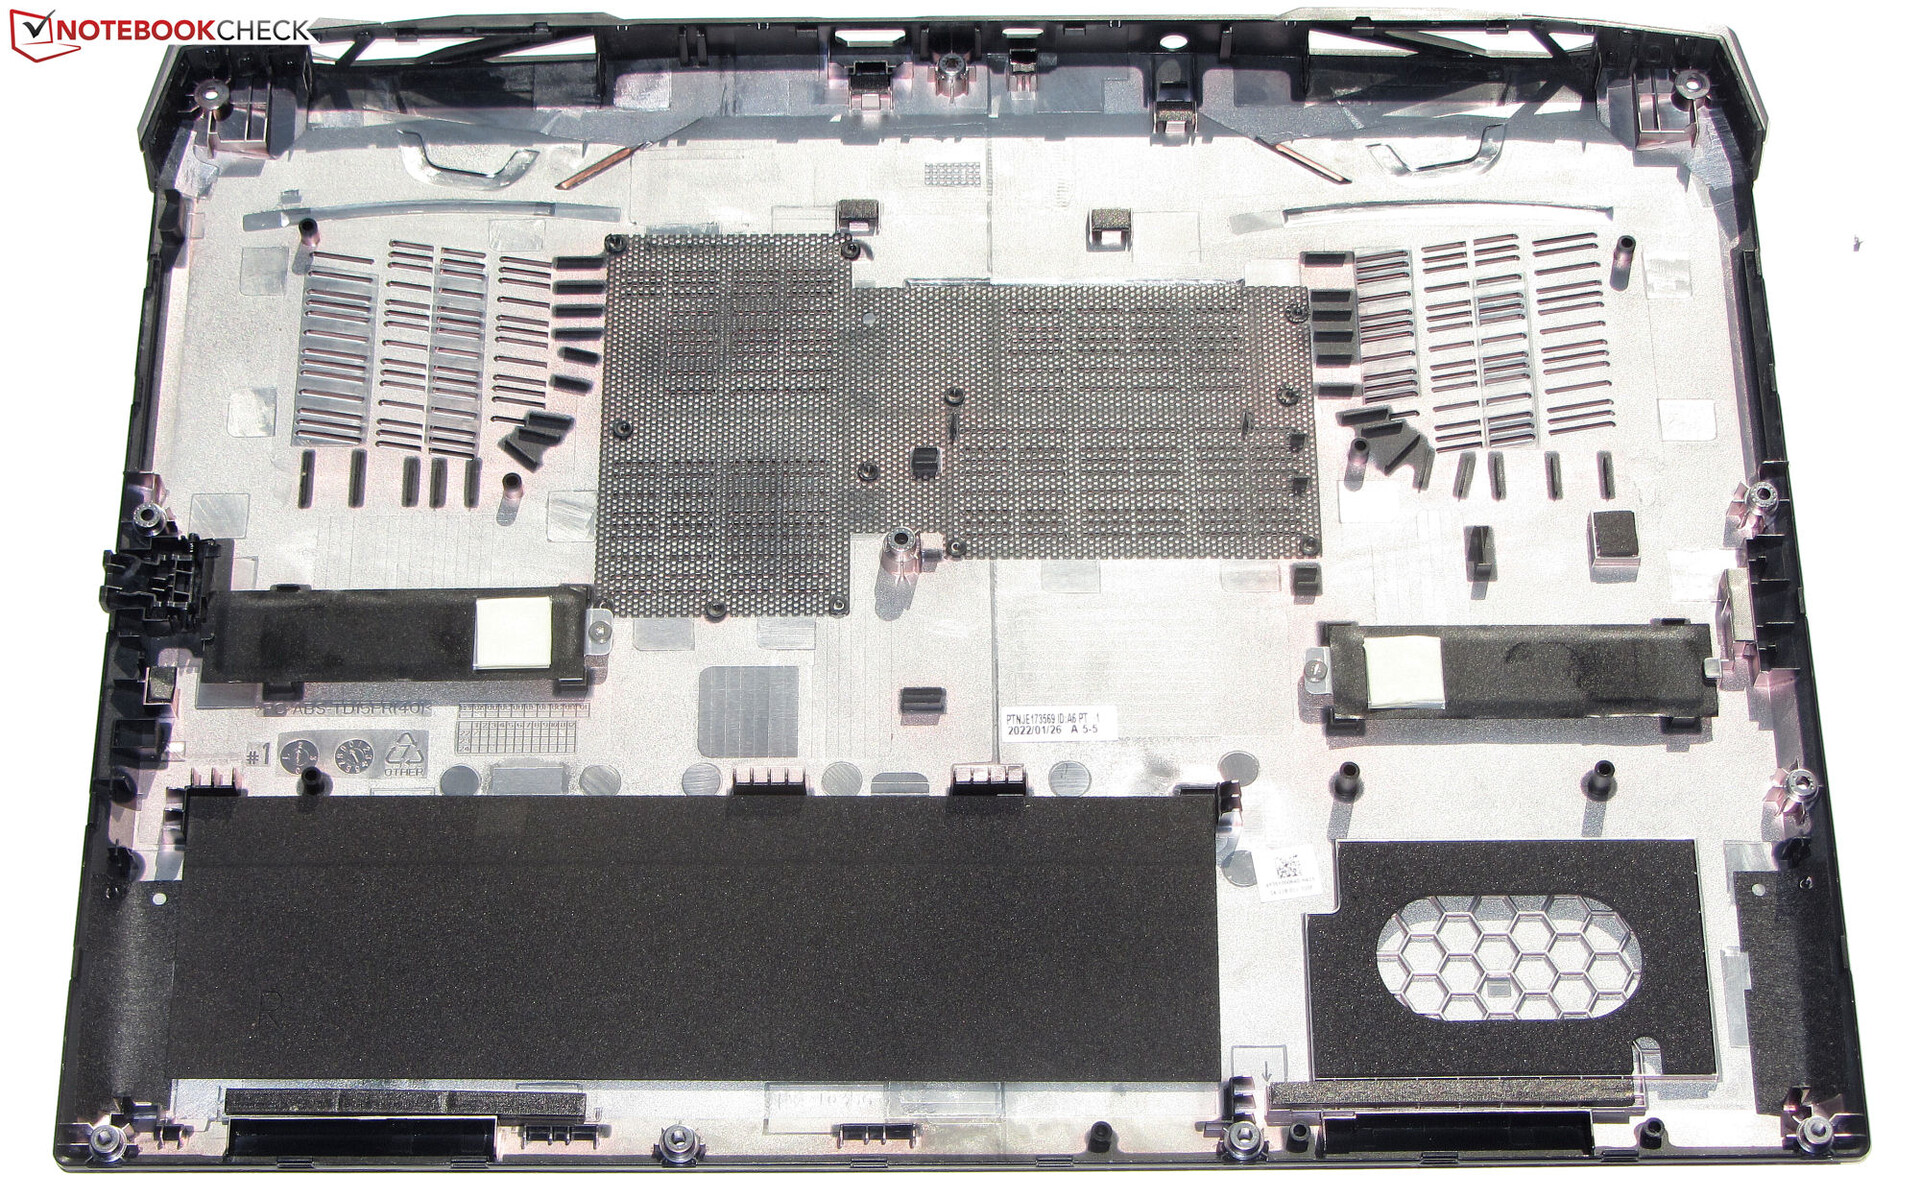
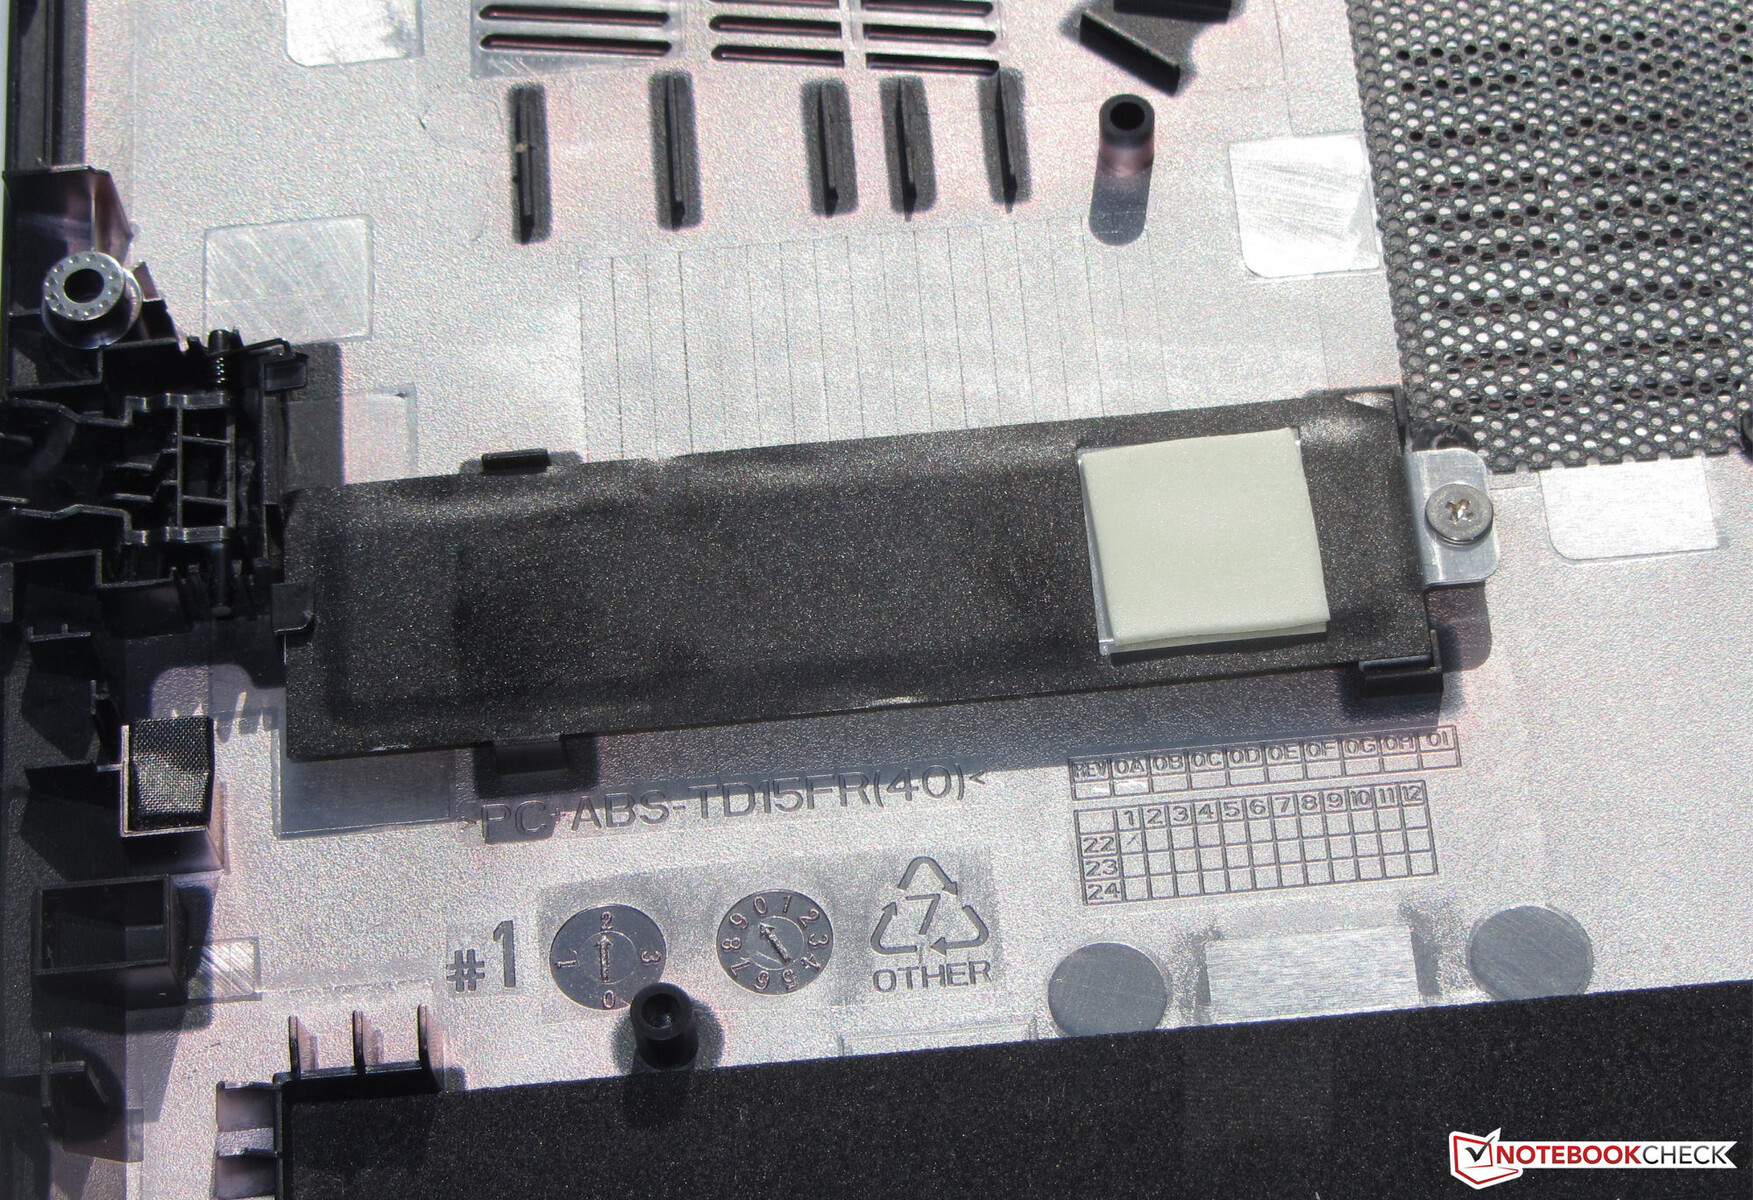
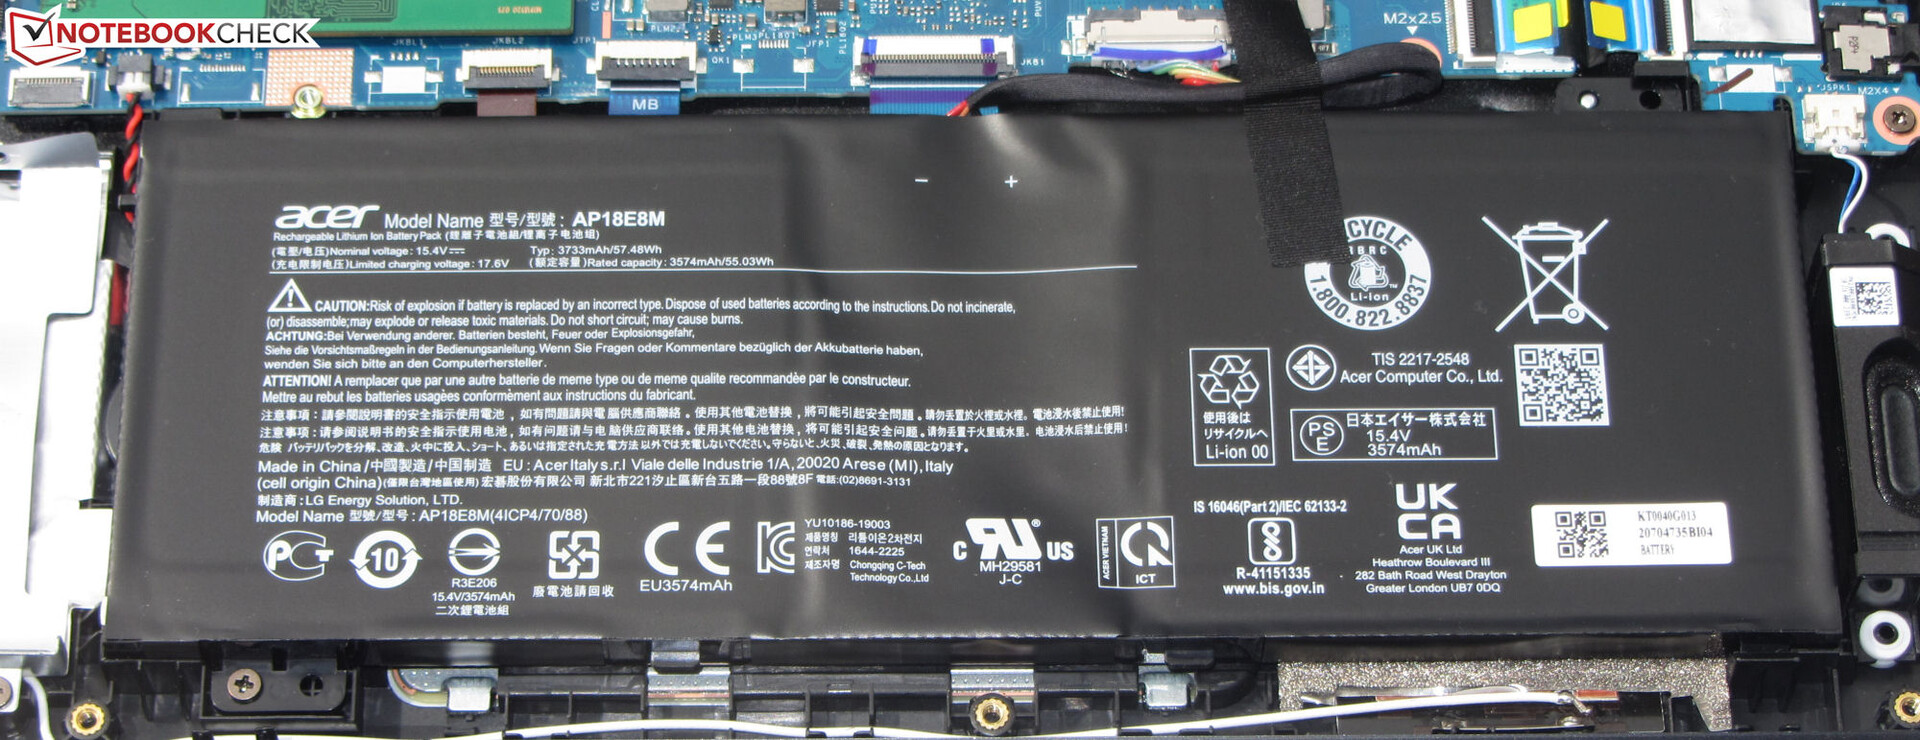
The case of the Nitro 5 does not appear to offer any high quality material - the entire chassis is made of matte black plastic. The keyboard's RGB backlight and a few thin, colorful stripes on the lid's back add some color. The smooth surfaces of the chassis prove rather susceptible to fingerprints. The battery is installed in the device (screwed, not glued) and the interior is accessible after removing the bottom shell.
No workmanship flaws were detected upon closer examination. All gaps are even and no material protrusions were found. The base unit twists slightly under torsion, but remains within acceptable limits. The lid, on the other hand, could be tighter. The hinges keep the lid firmly in position and the maximum opening angle is about 155 degrees. One-handed opening of the lid is possible.
In terms of weight and size, the Nitro is roughly on par with the Lenovo Legion 5 Pro. In the comparison field, the Omen 16 represents the lightest and most compact device.
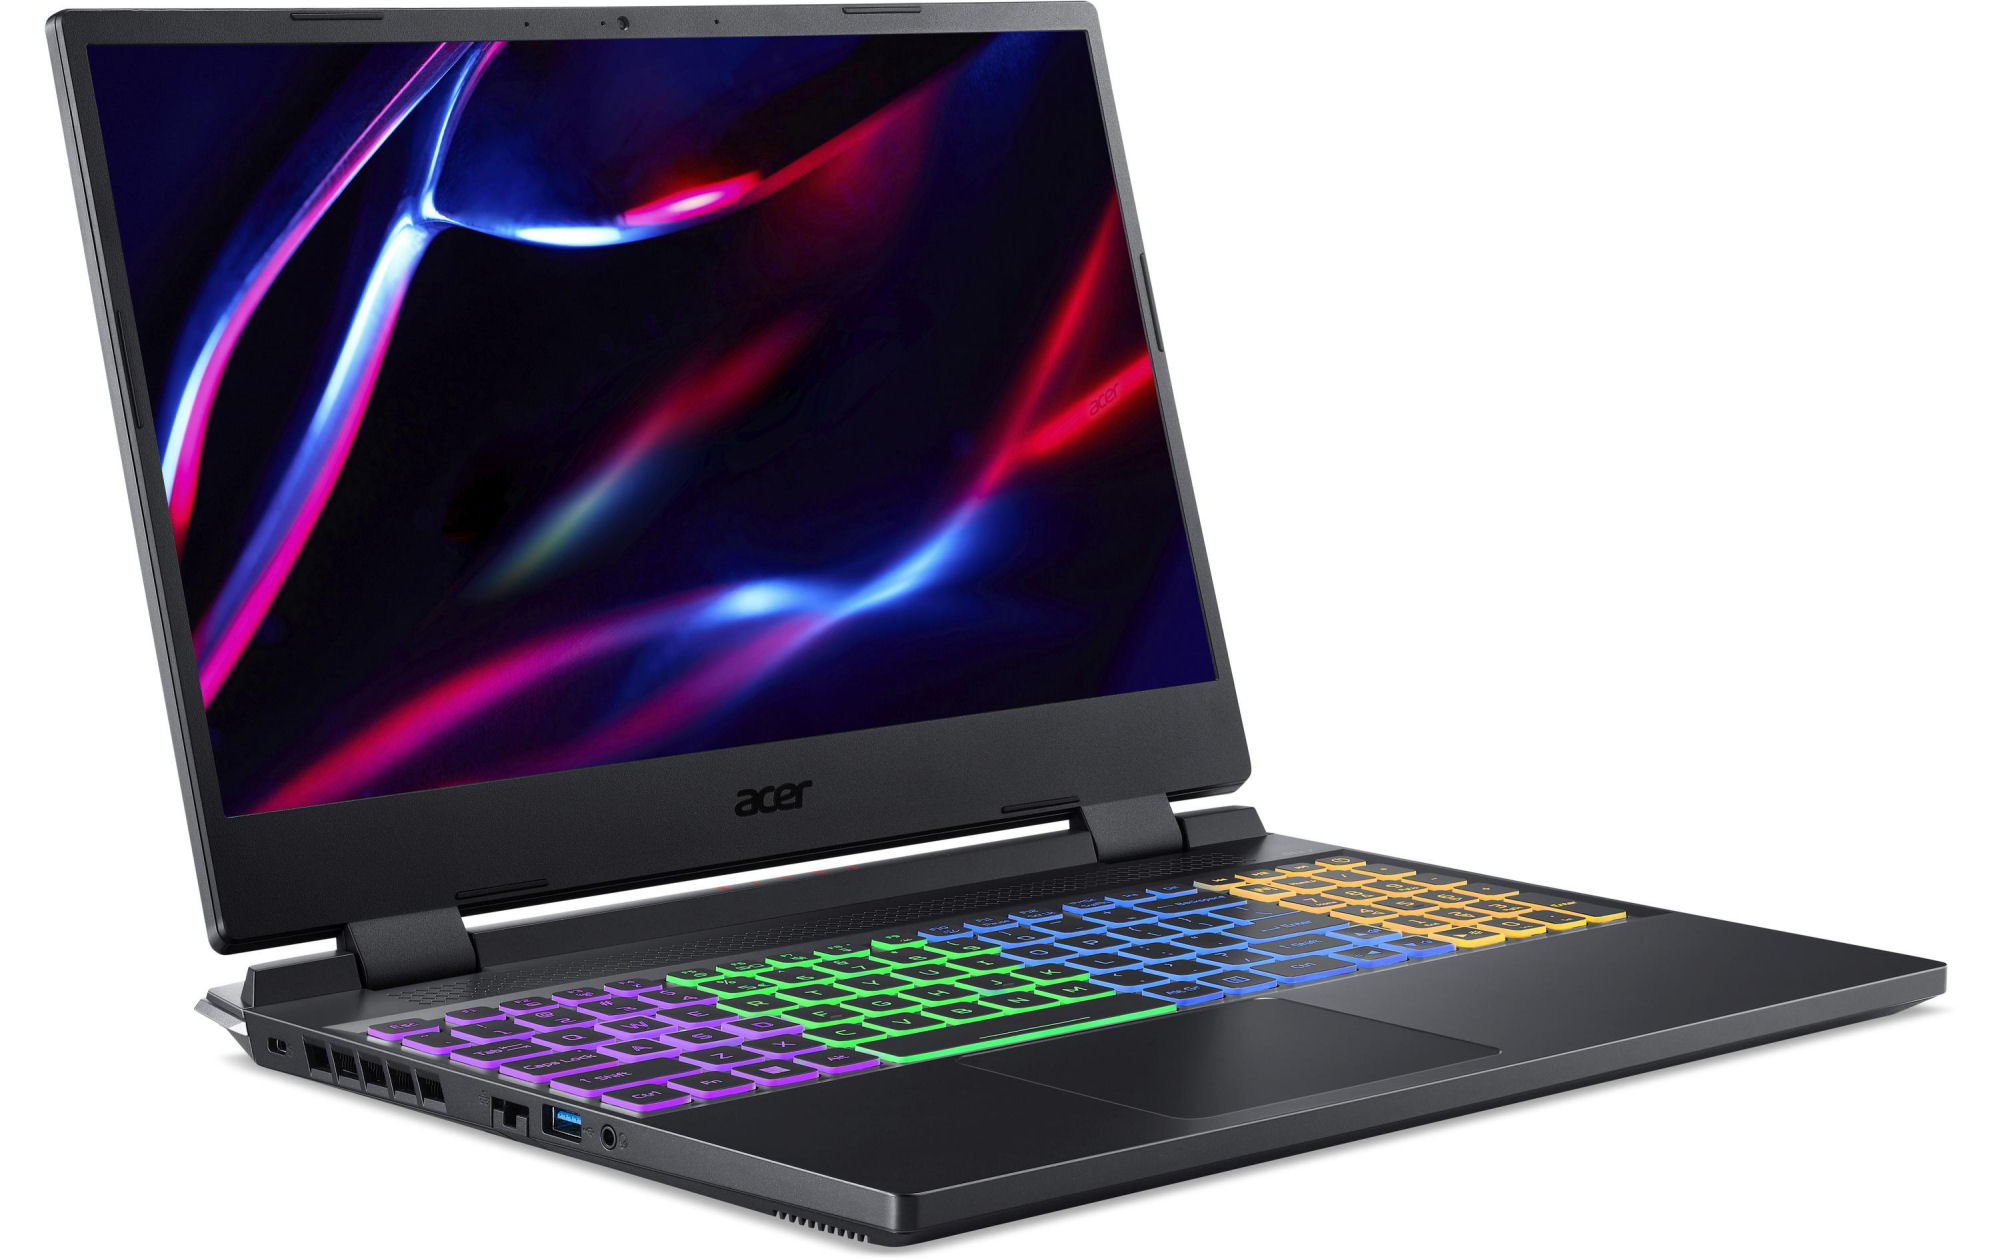
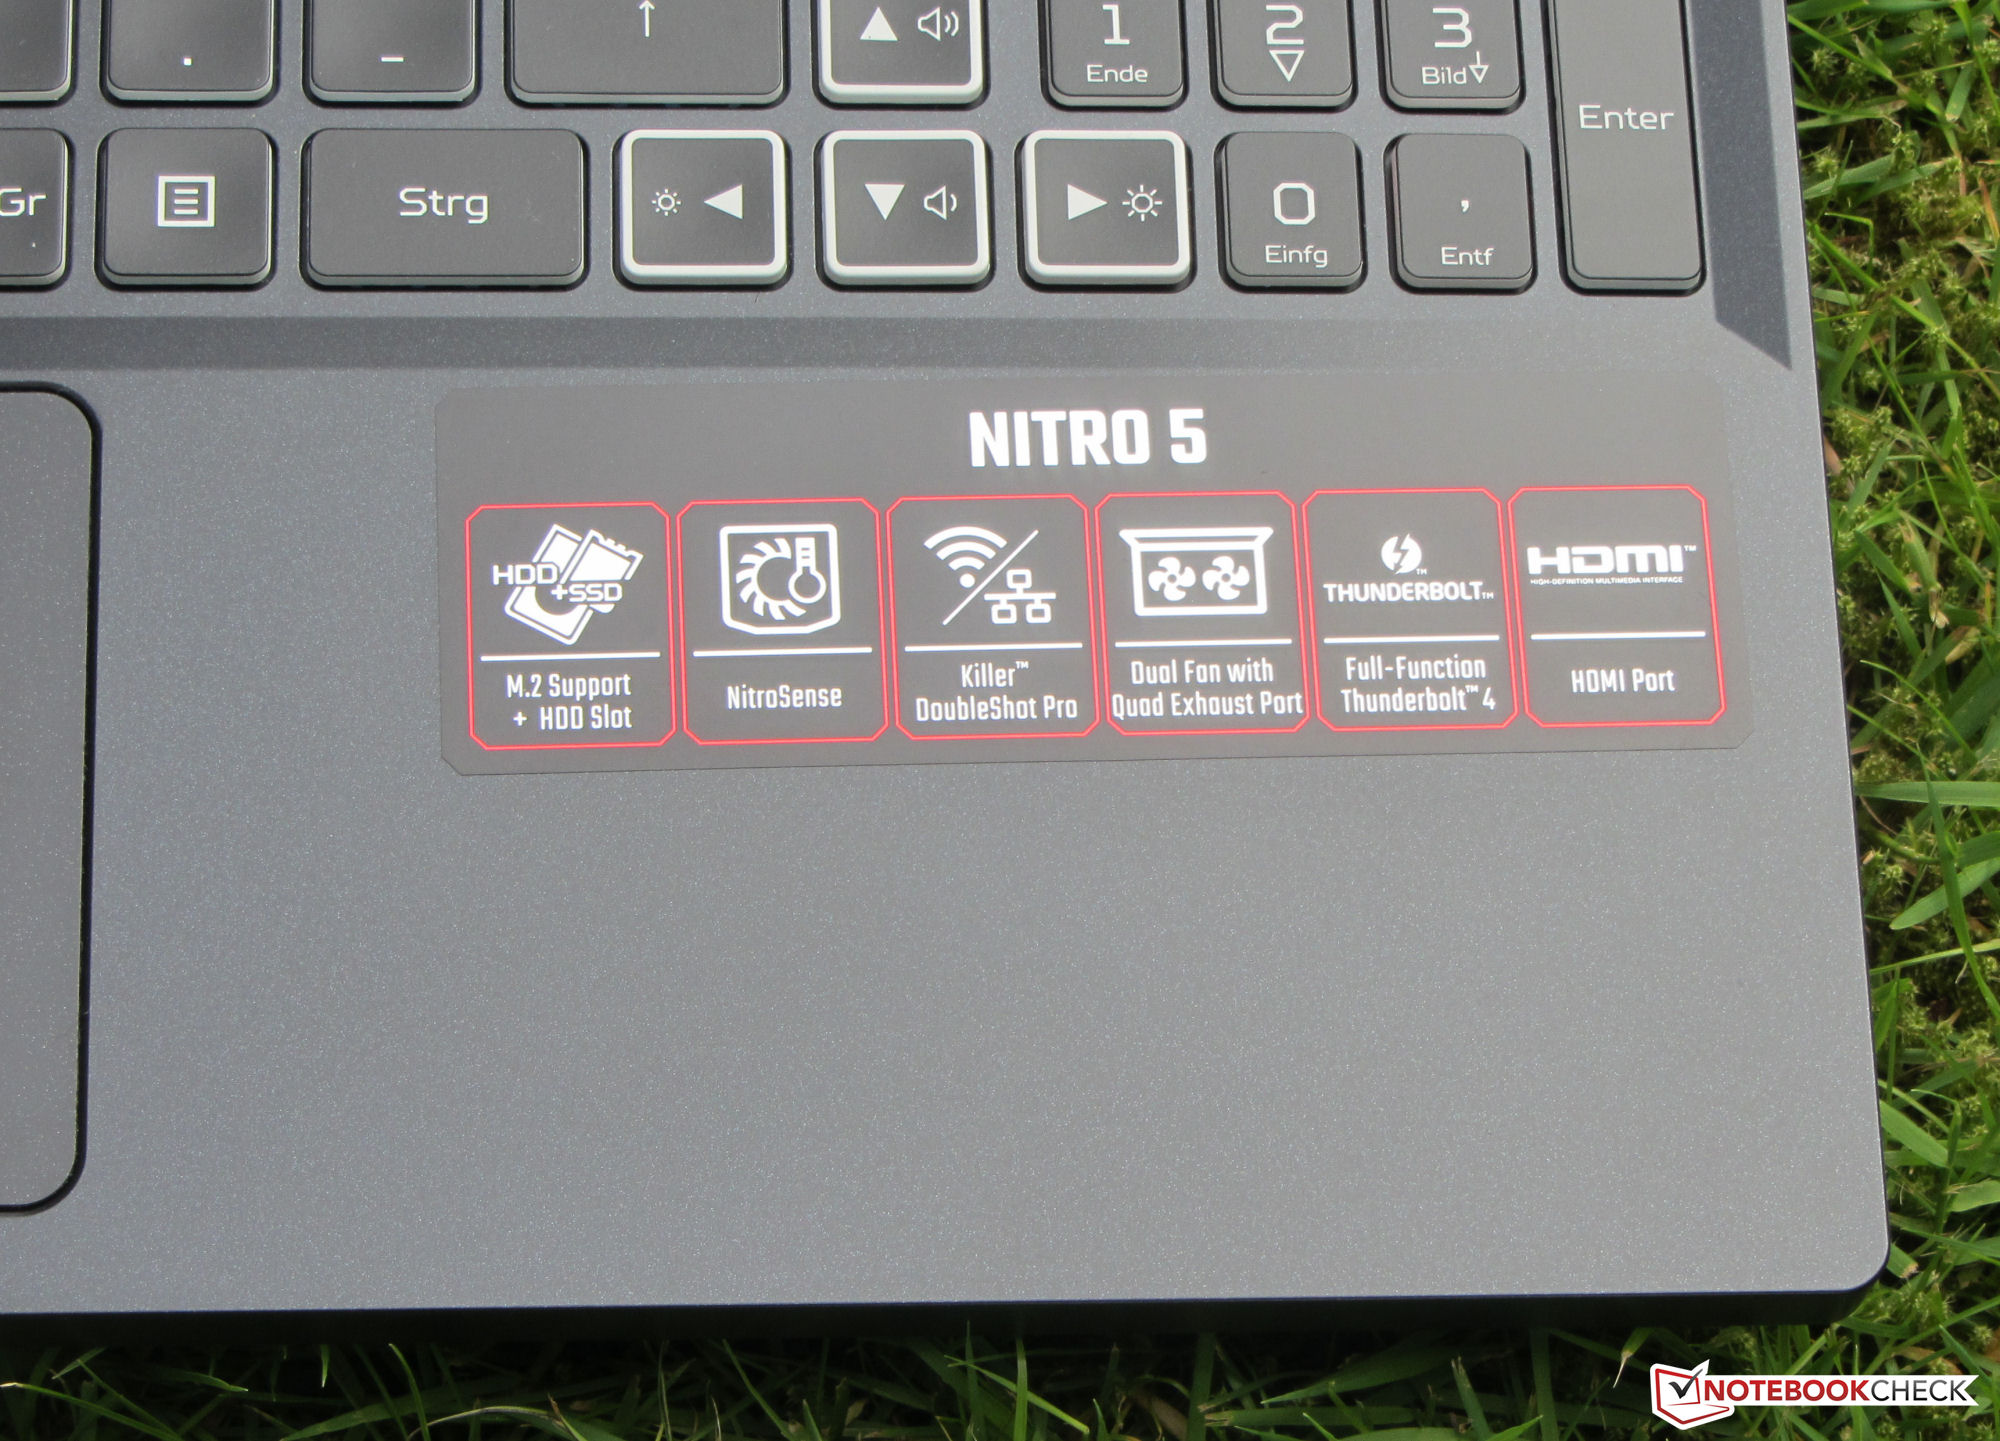
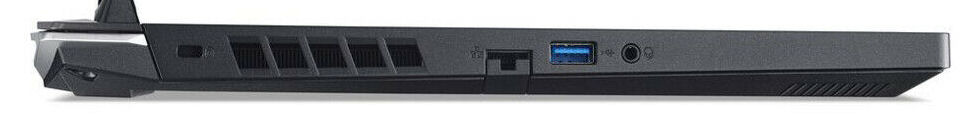
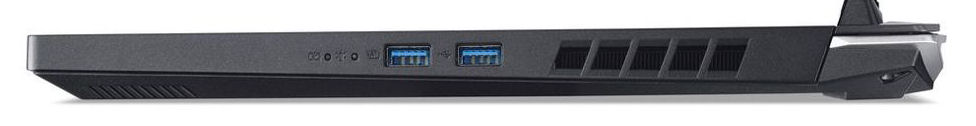
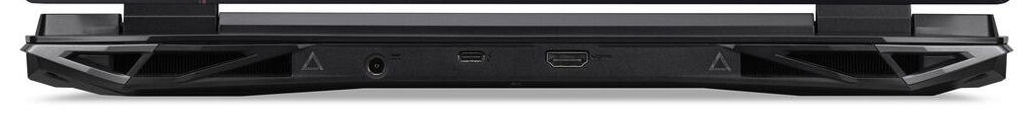
Connectivity: Acer Nitro offers Thunderbolt 4
The Nitro features three USB-A ports (2x USB 3.2 Gen 2, 1x USB 3.2 Gen 1) and one USB-C port (Thunderbolt 4), of which the latter supports Power Delivery and Displayport. Together with the HDMI slot, the laptop thus offers two video outputs. There is also a combined audio jack, a Gigabit Ethernet port and an opening for a cable lock. Only a memory card reader is missing.
Communication
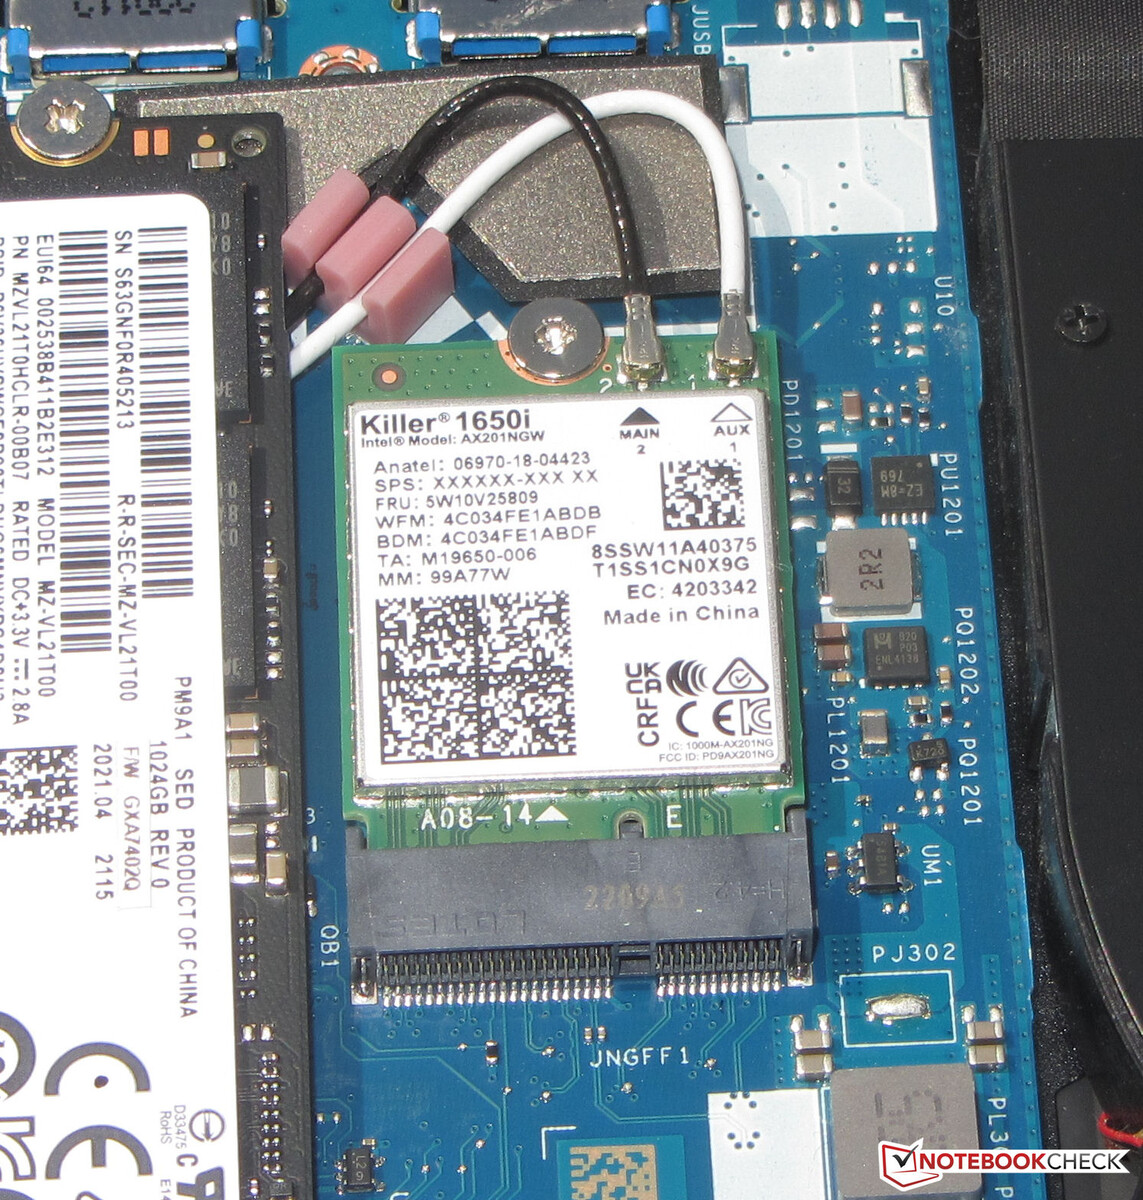
The WLAN transfer rates determined under optimal conditions (no other WLAN devices in the immediate vicinity, short distance between notebook and server PC) are excellent and correspond to the capabilities of the WiFi chip (Killer AX1650i = Intel AX201; 802.11 ax). Wired network connections function via a Gigabit Ethernet chip (Killer E2600).
| Networking | |
| iperf3 transmit AXE11000 | |
| Acer Nitro 5 AN515-58-72QR | |
| Average of class Gaming (469 - 1793, n=153, last 2 years) | |
| HP Omen 16-b1090ng | |
| iperf3 receive AXE11000 | |
| Acer Nitro 5 AN515-58-72QR | |
| Average of class Gaming (685 - 1890, n=159, last 2 years) | |
| HP Omen 16-b1090ng | |
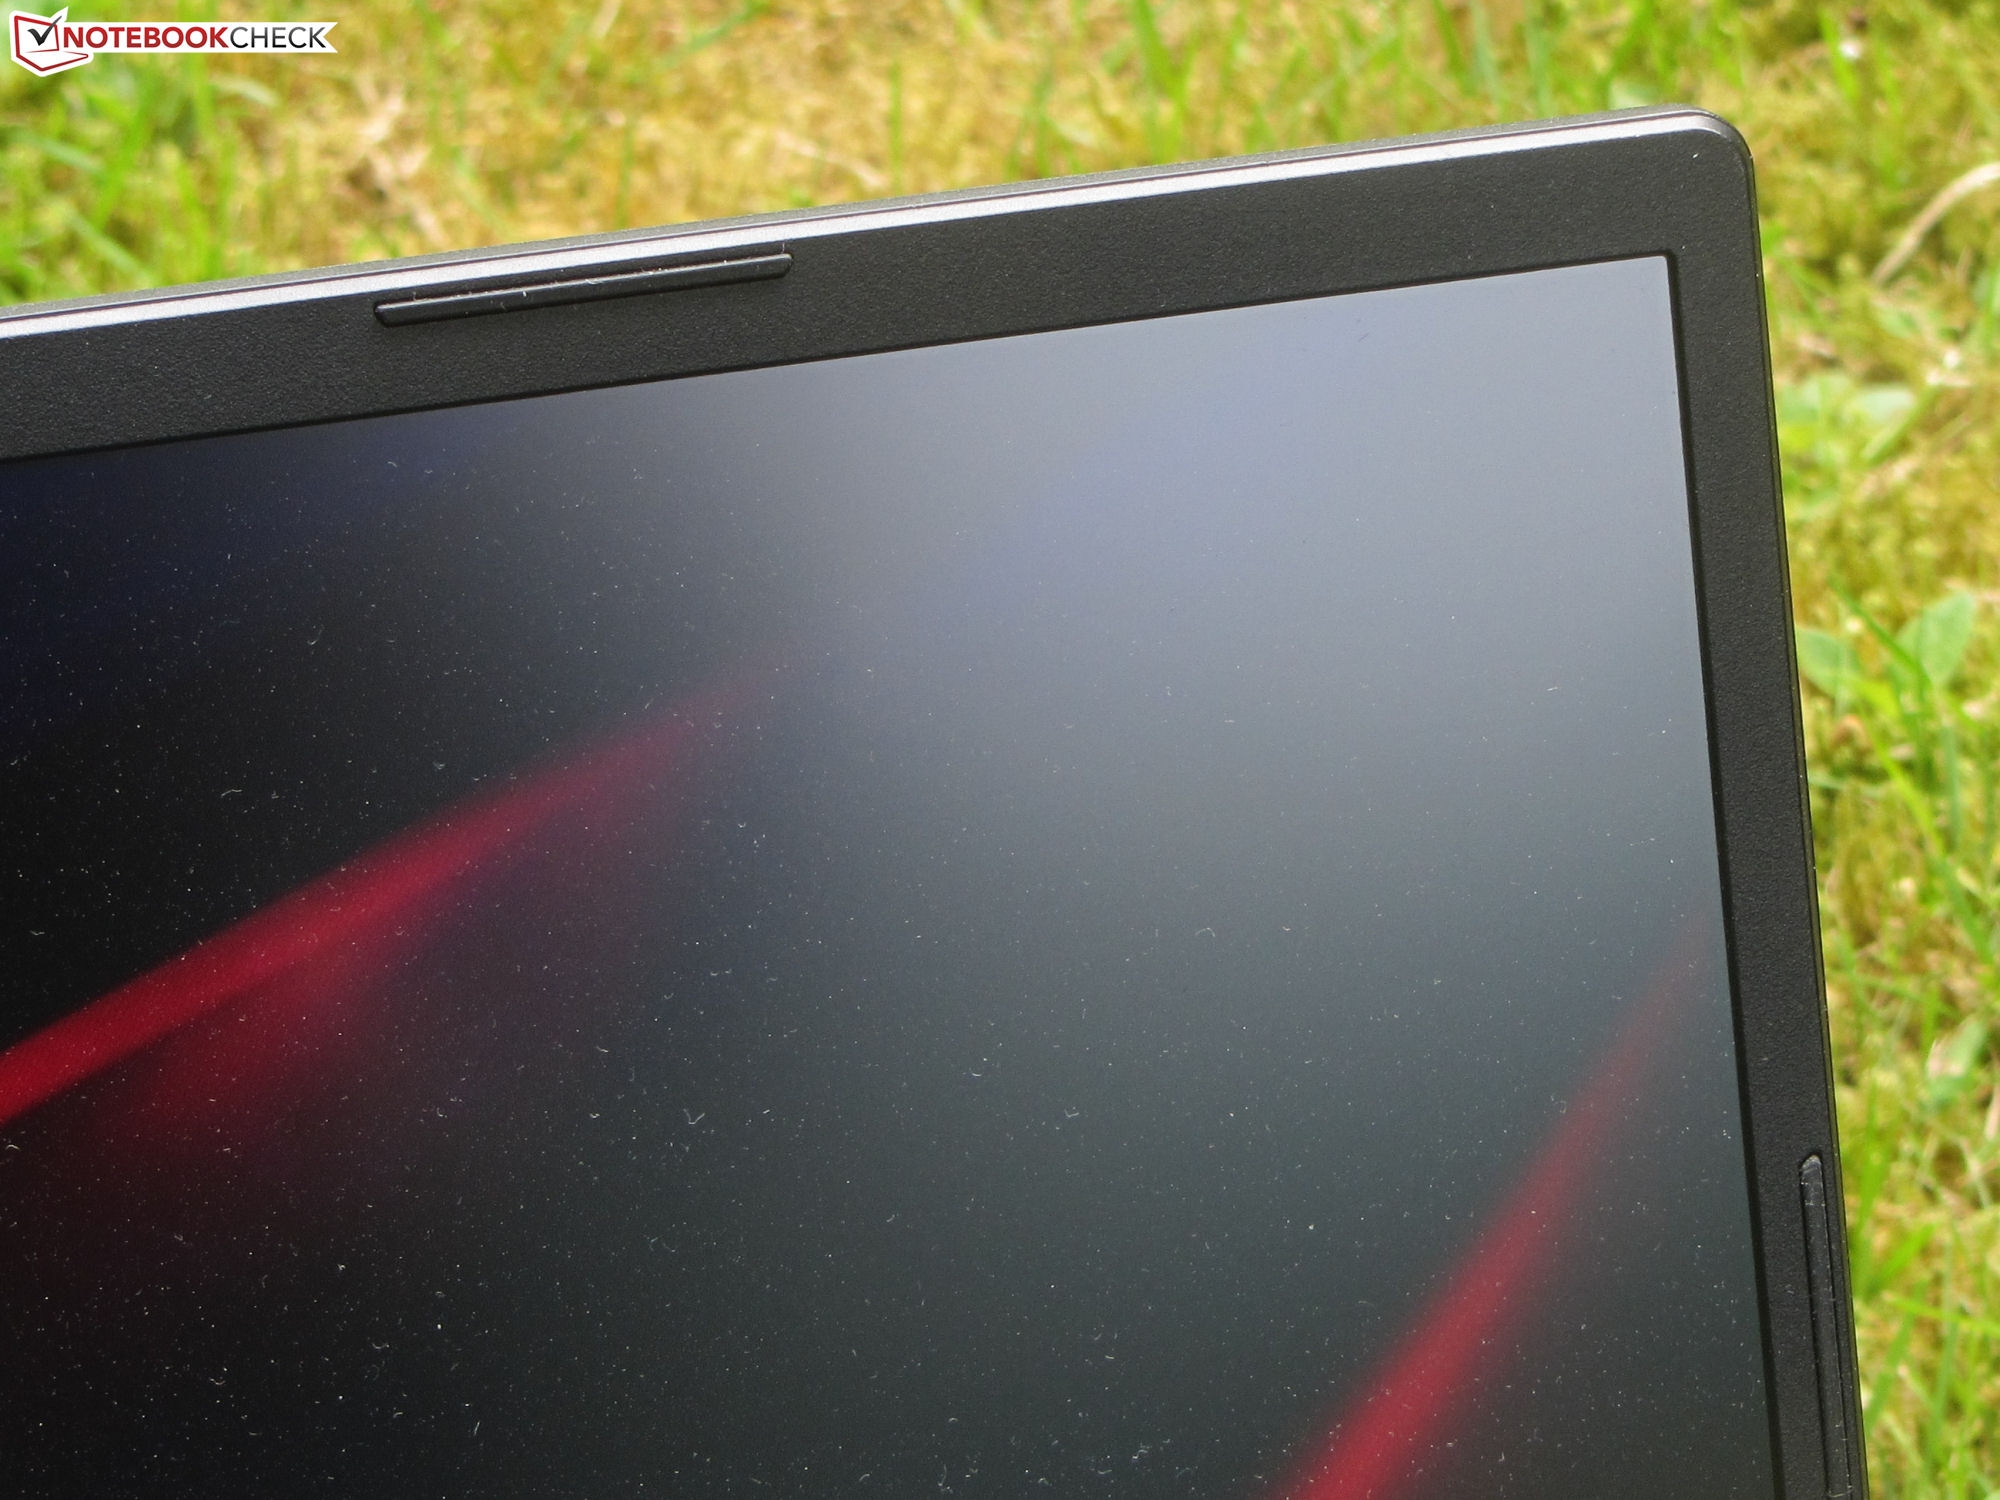
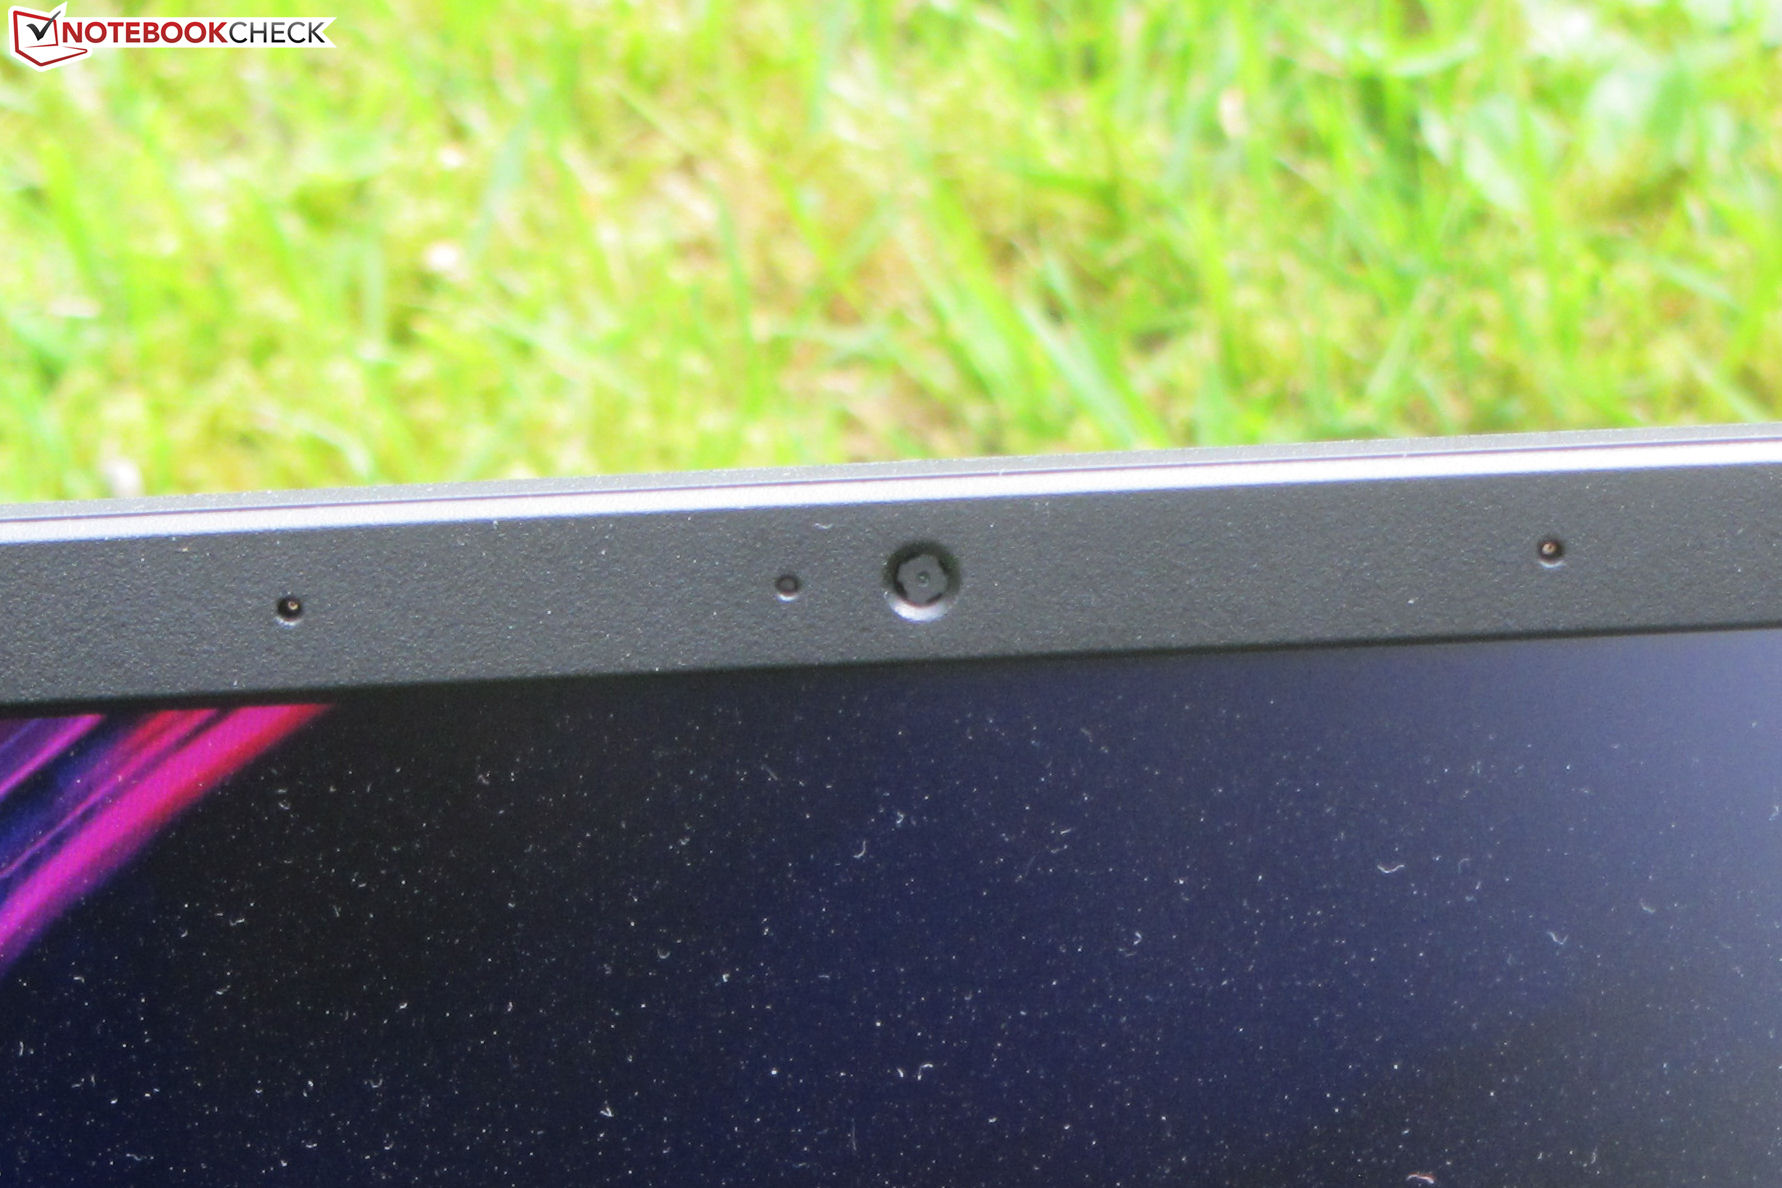
Webcam
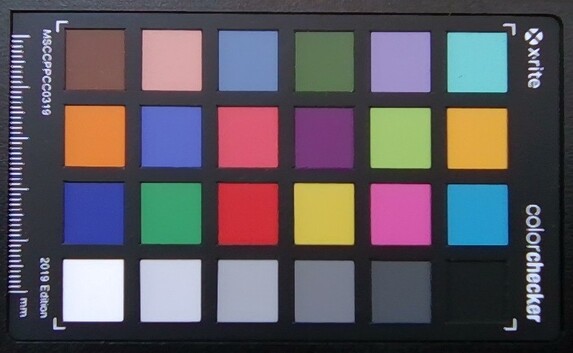
The webcam (0.9 MP) produces pictures at a maximum resolution of 1280x720. Color accuracy is a problem: the colors deviate significantly from target. No mechanical shutter is provided for the camera.


Accessories
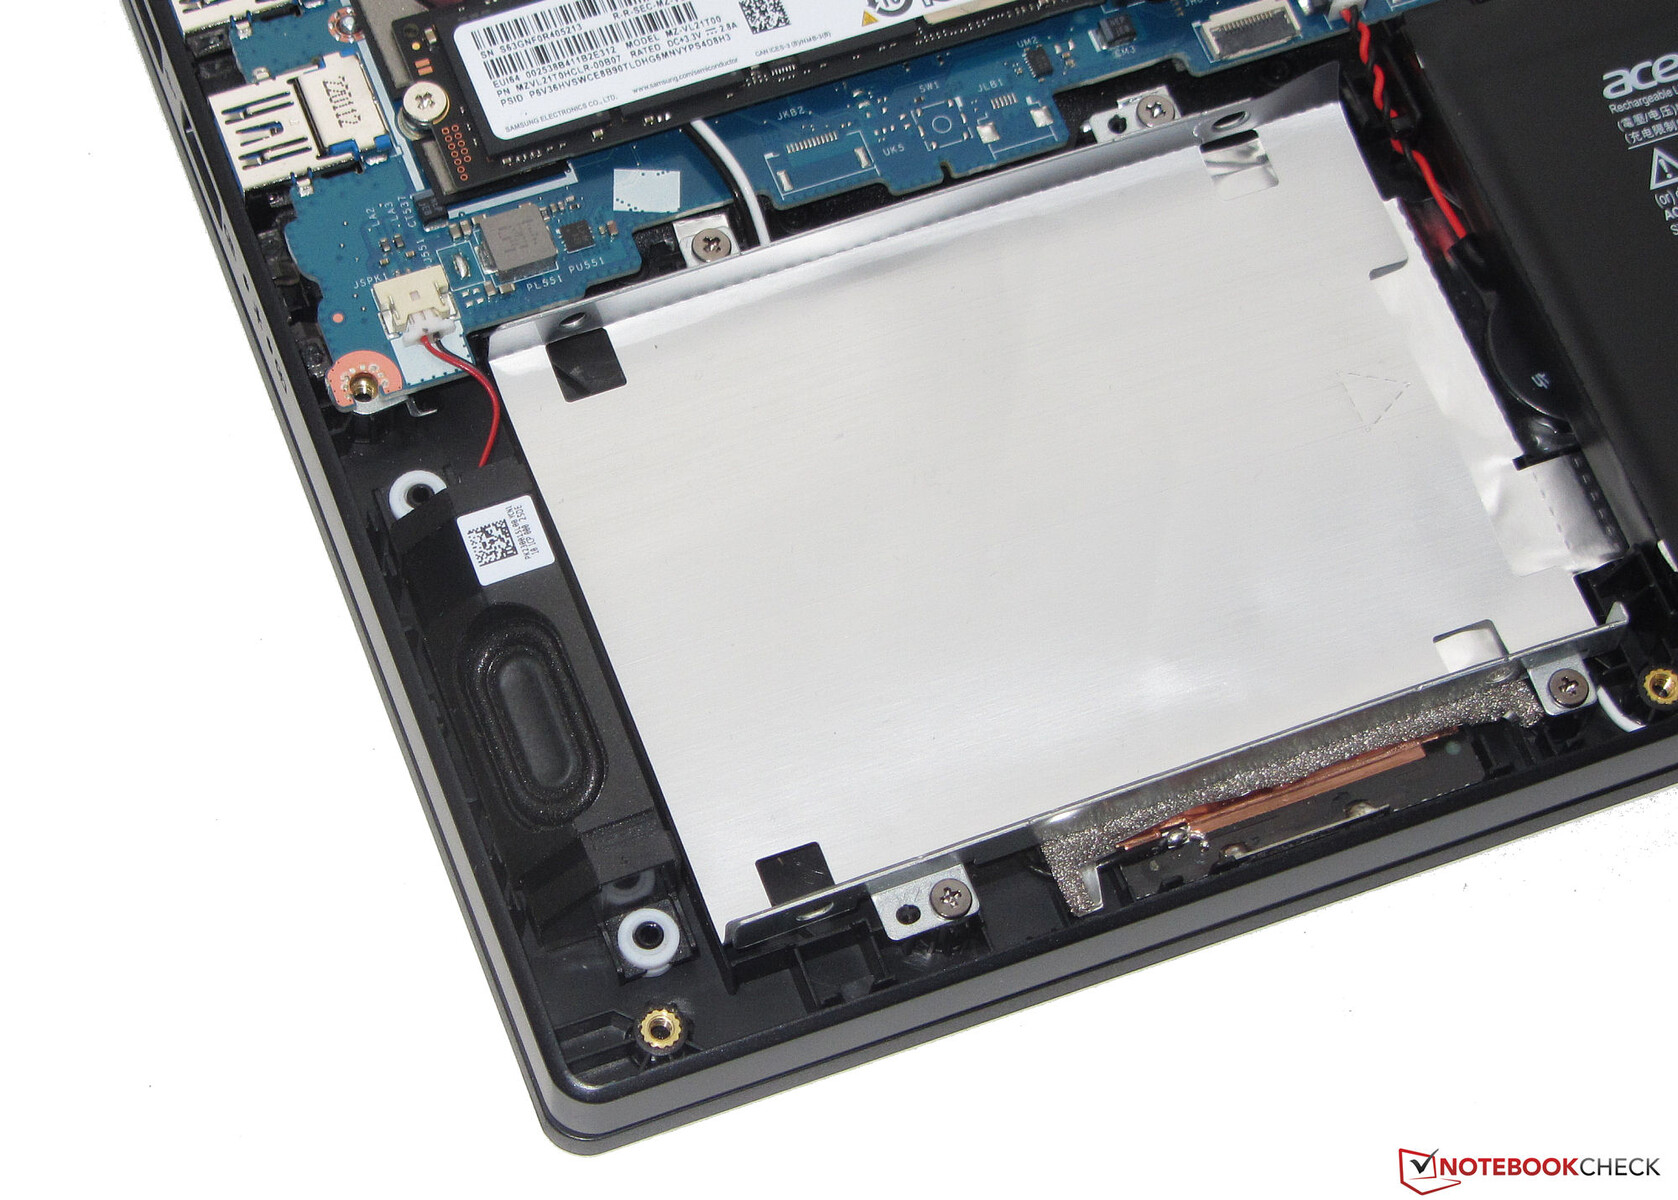
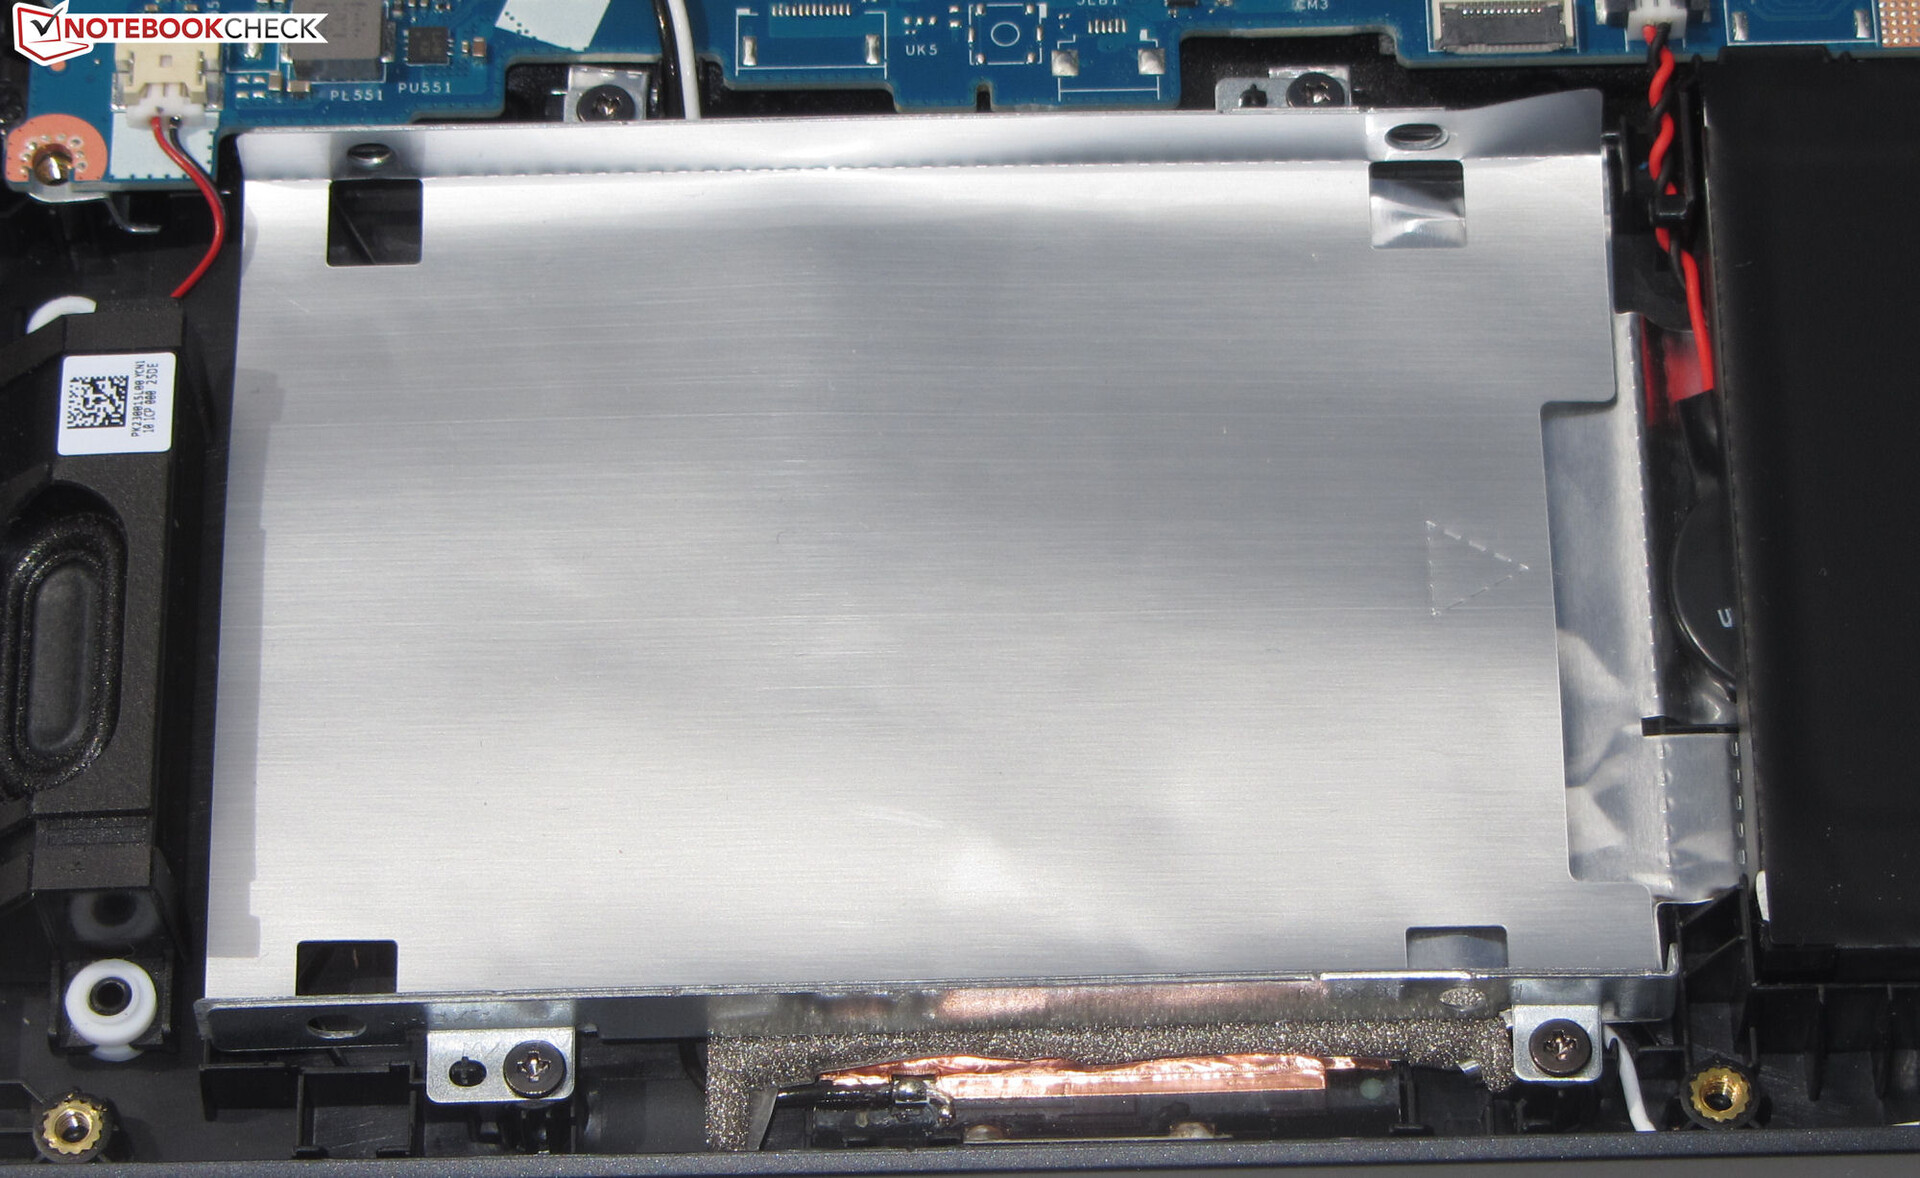
The notebook comes with the usual documents: A quick start guide and warranty information. In addition, a short flat cable together with a SATA connector is included, which is needed for the installation of a 2.5-inch storage device. The corresponding mounting frame already comes preinstalled inside the notebook.
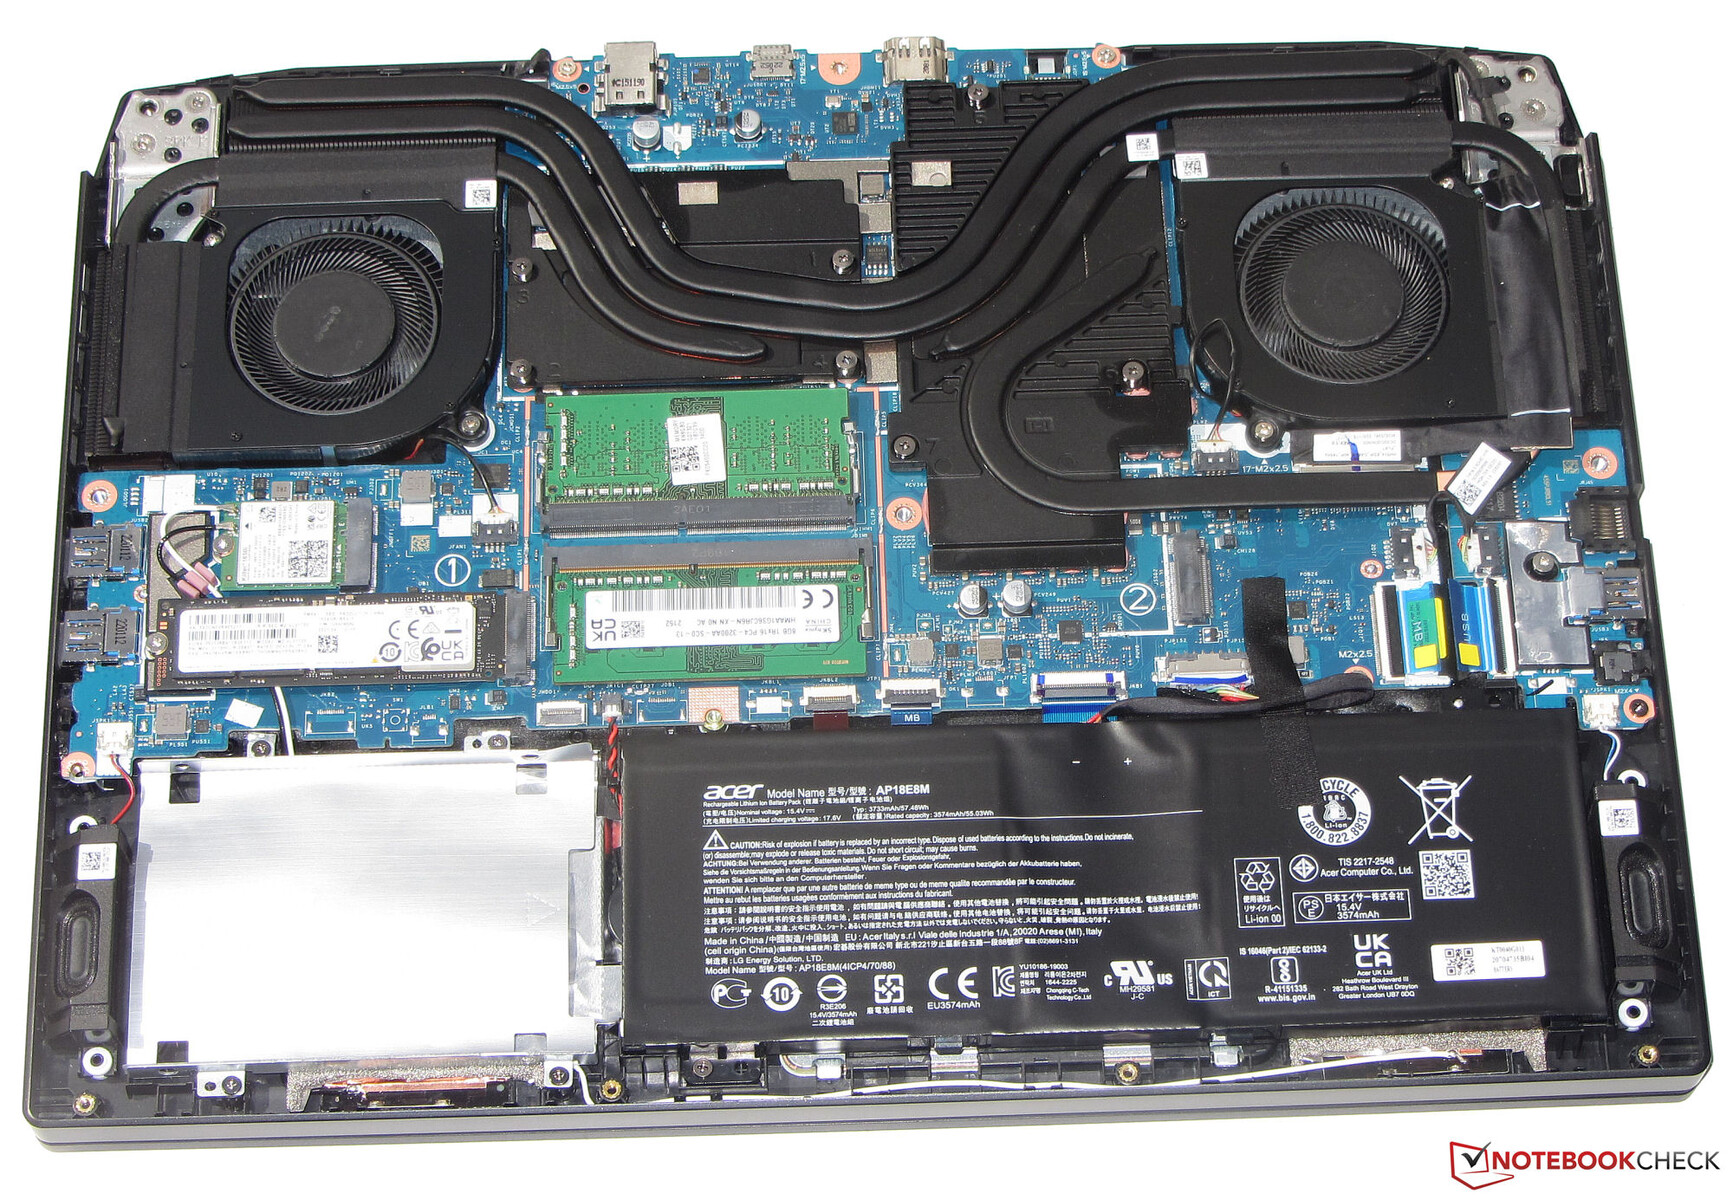
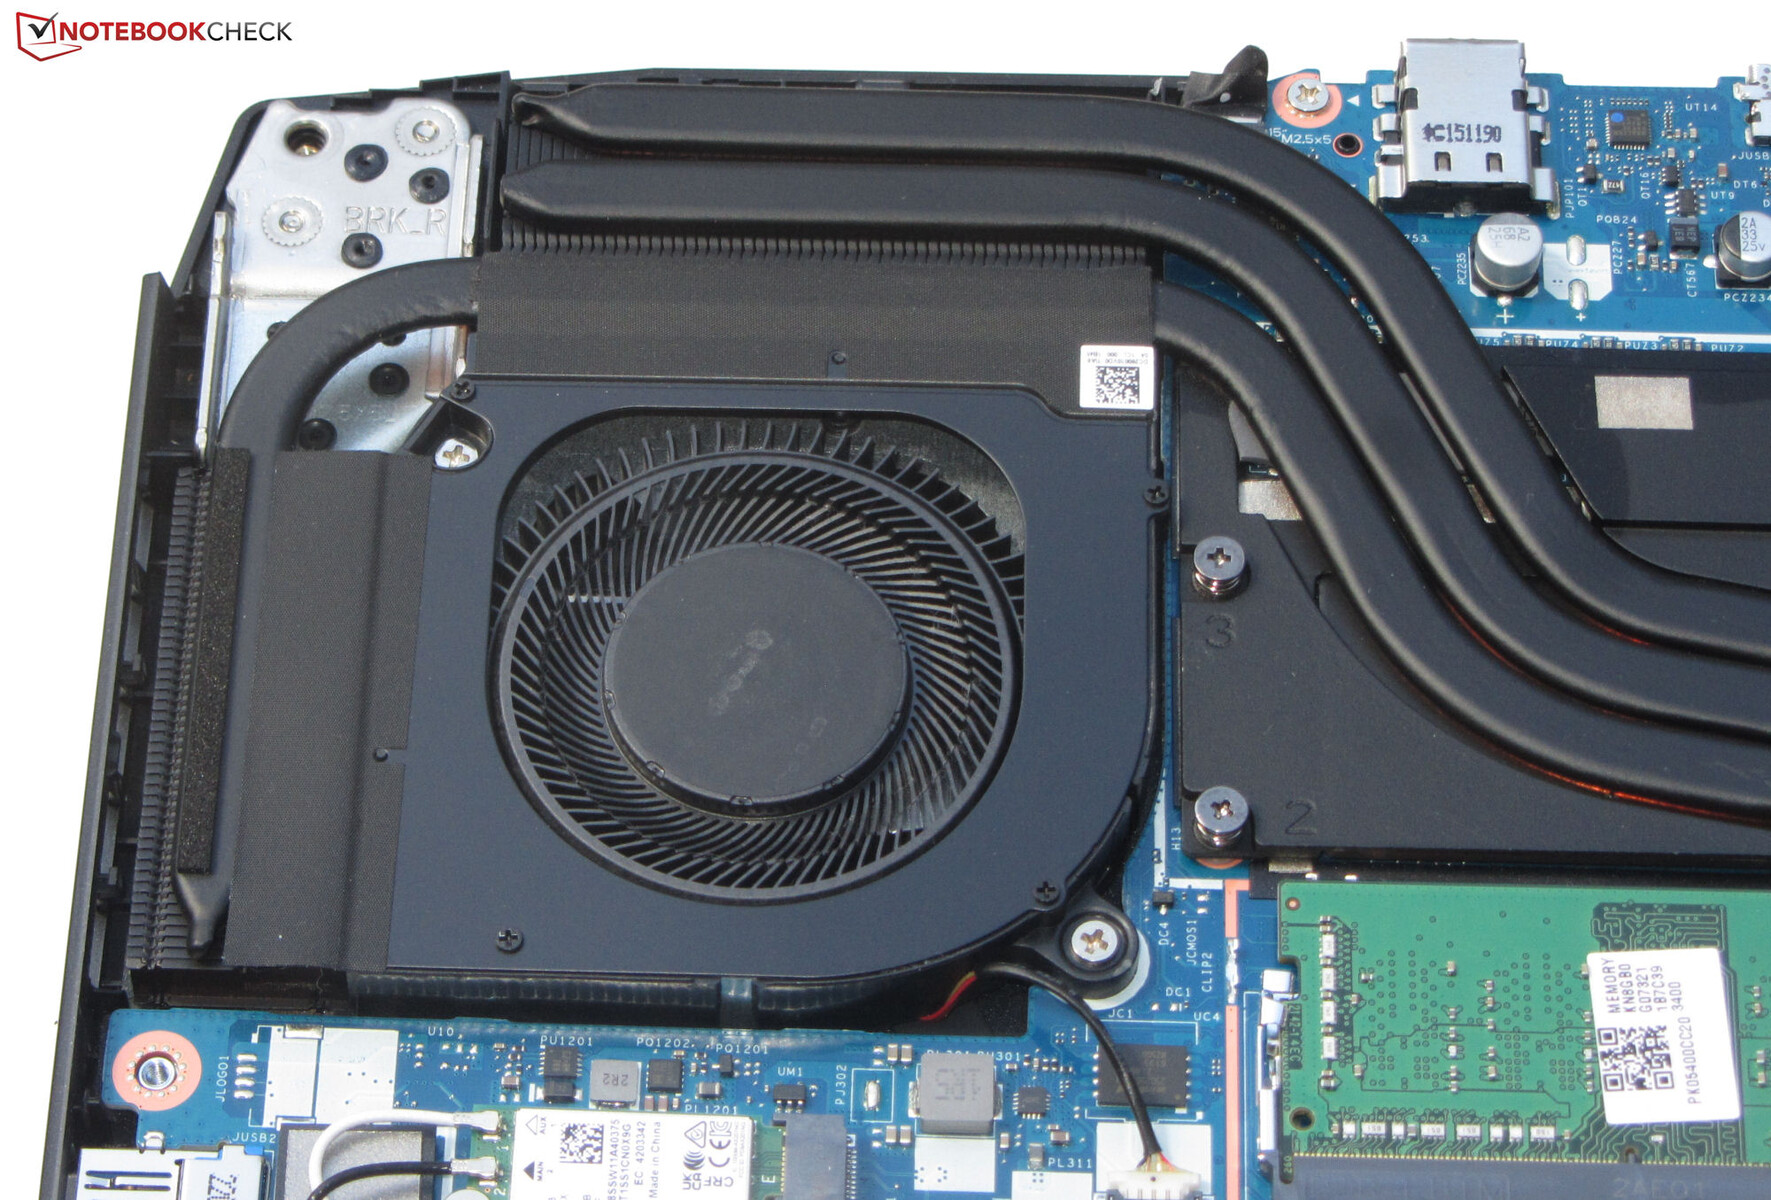
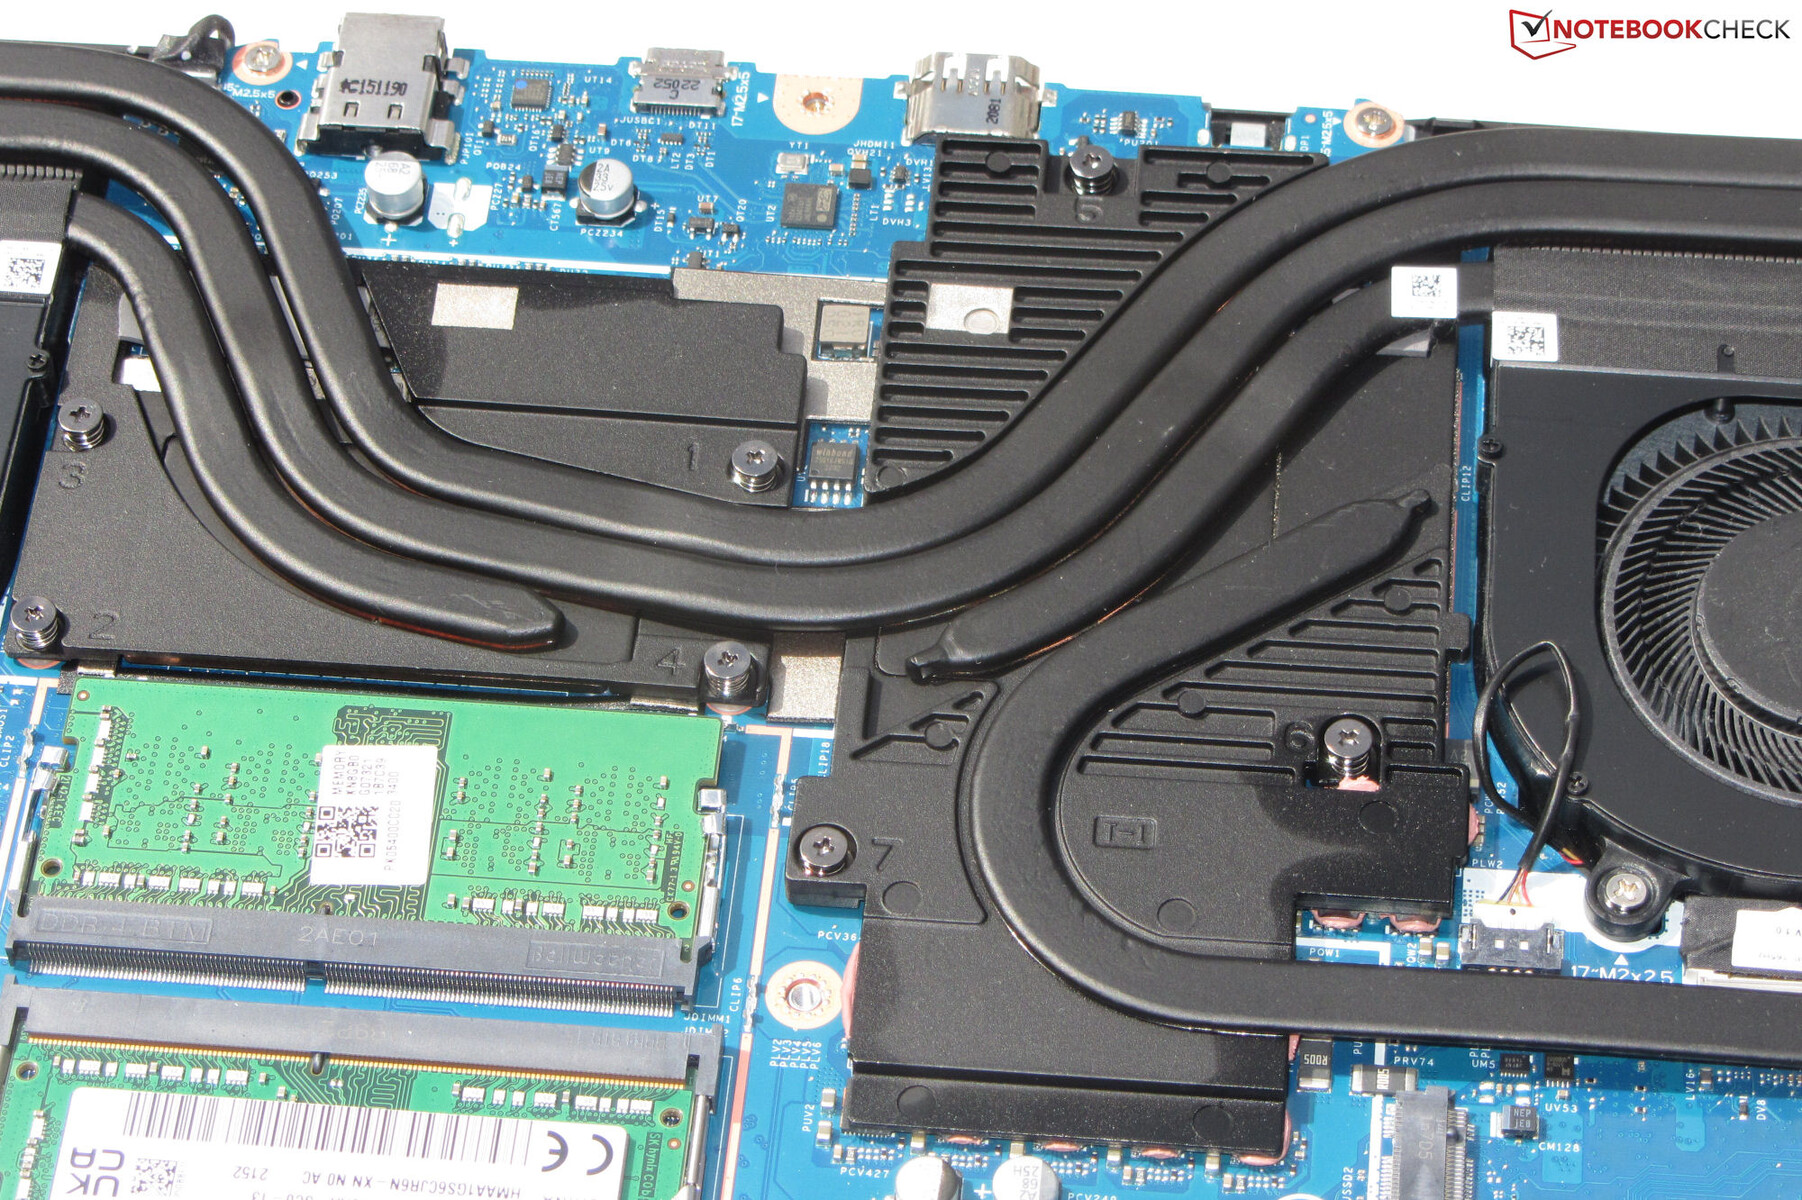
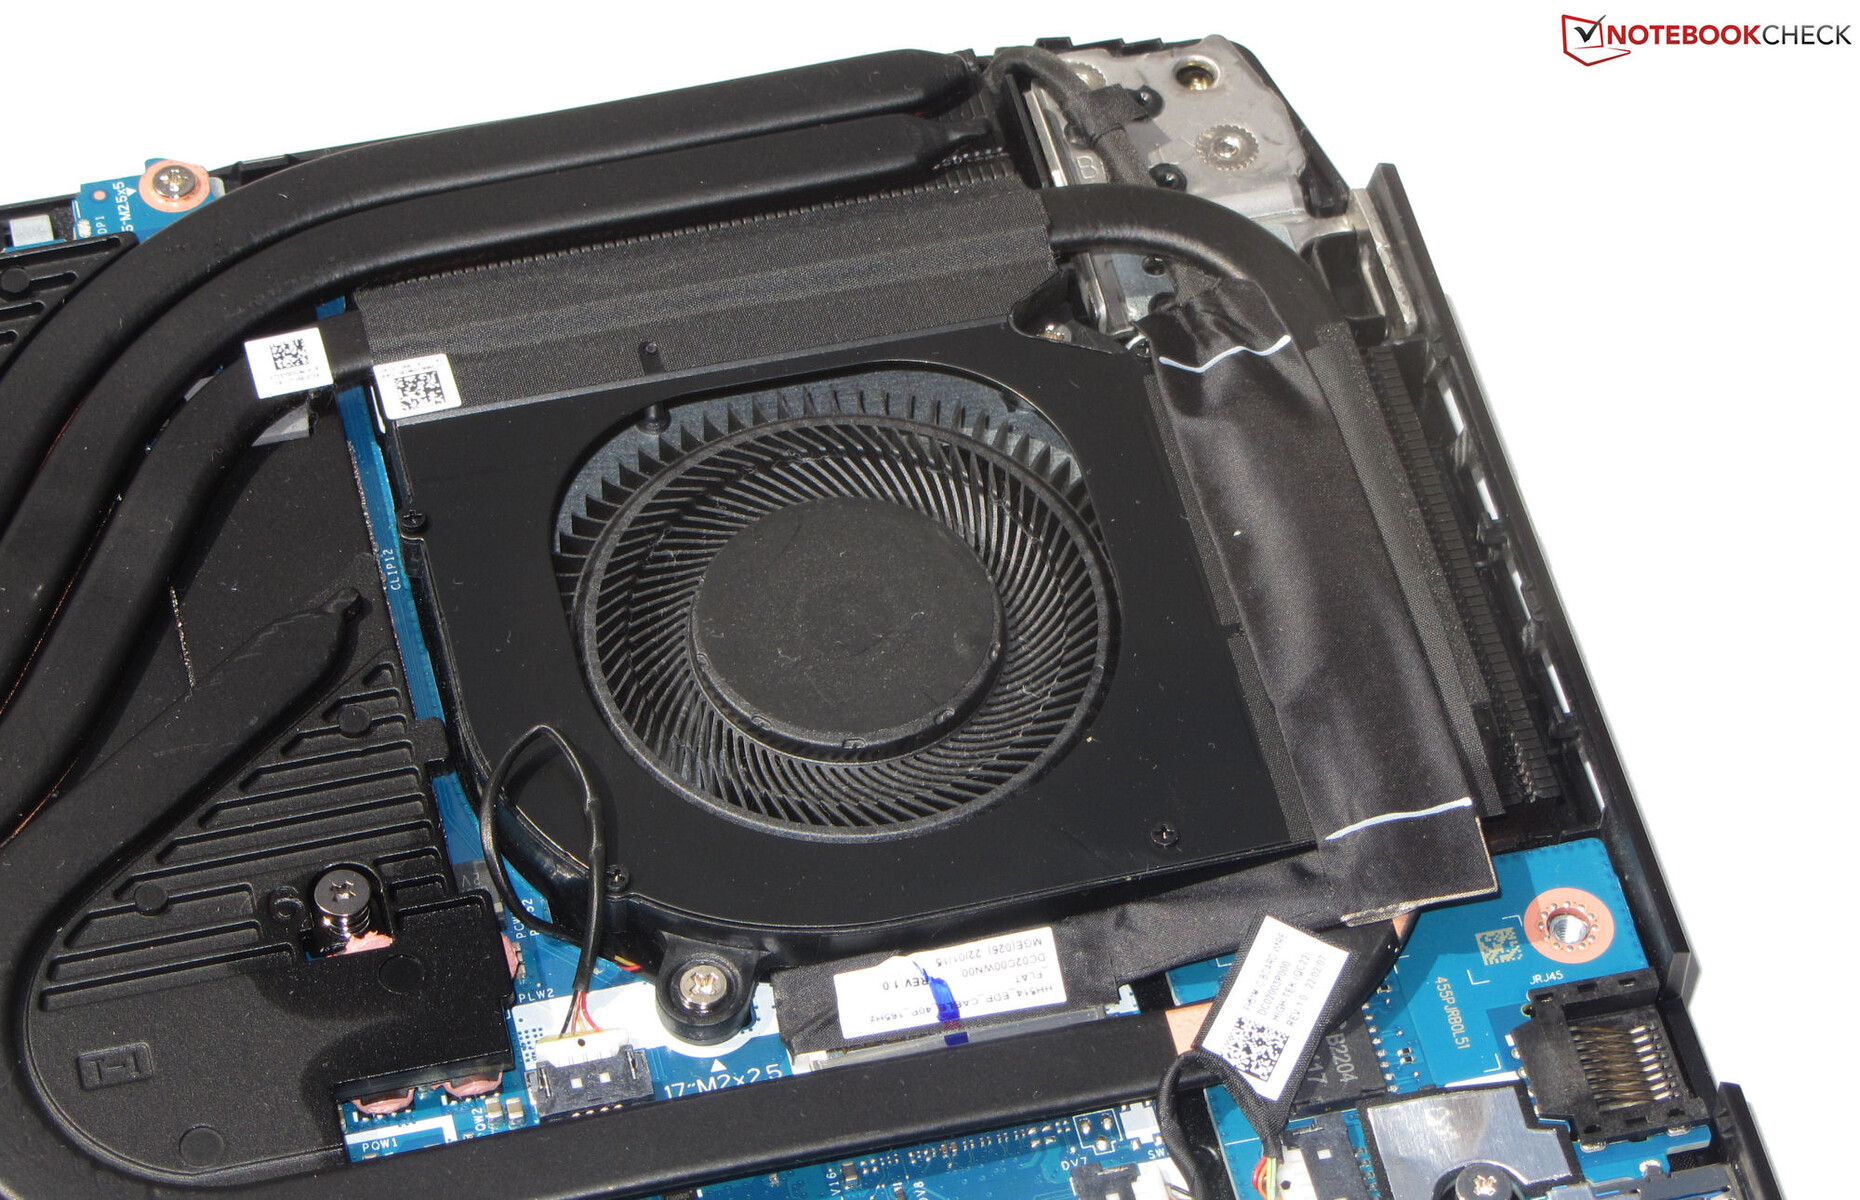
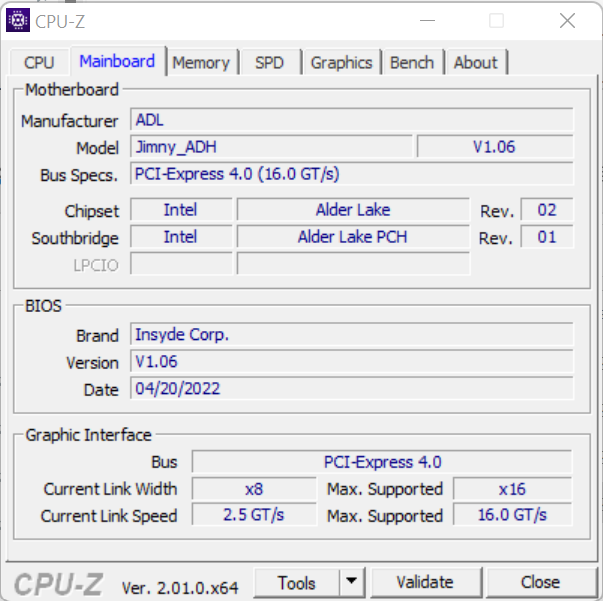
Maintenance
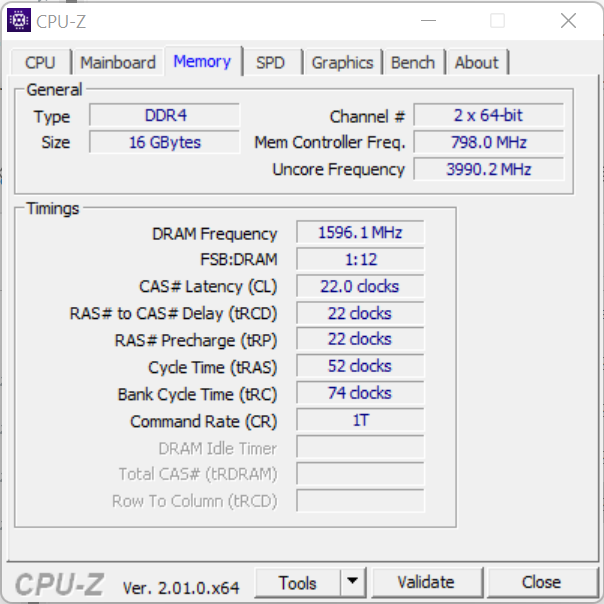
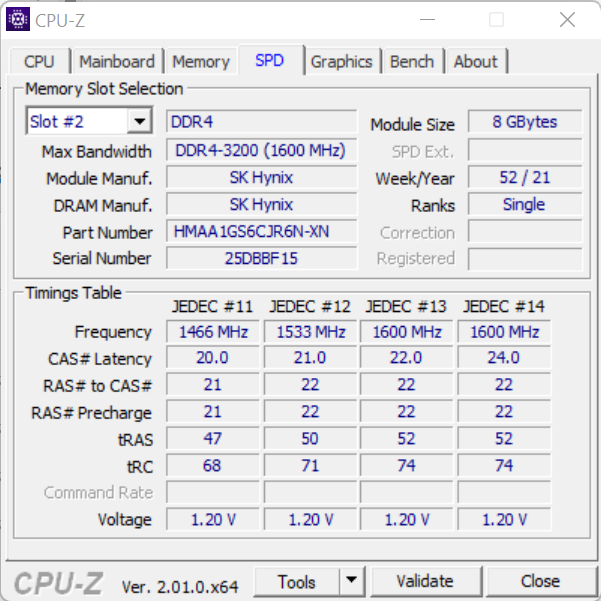
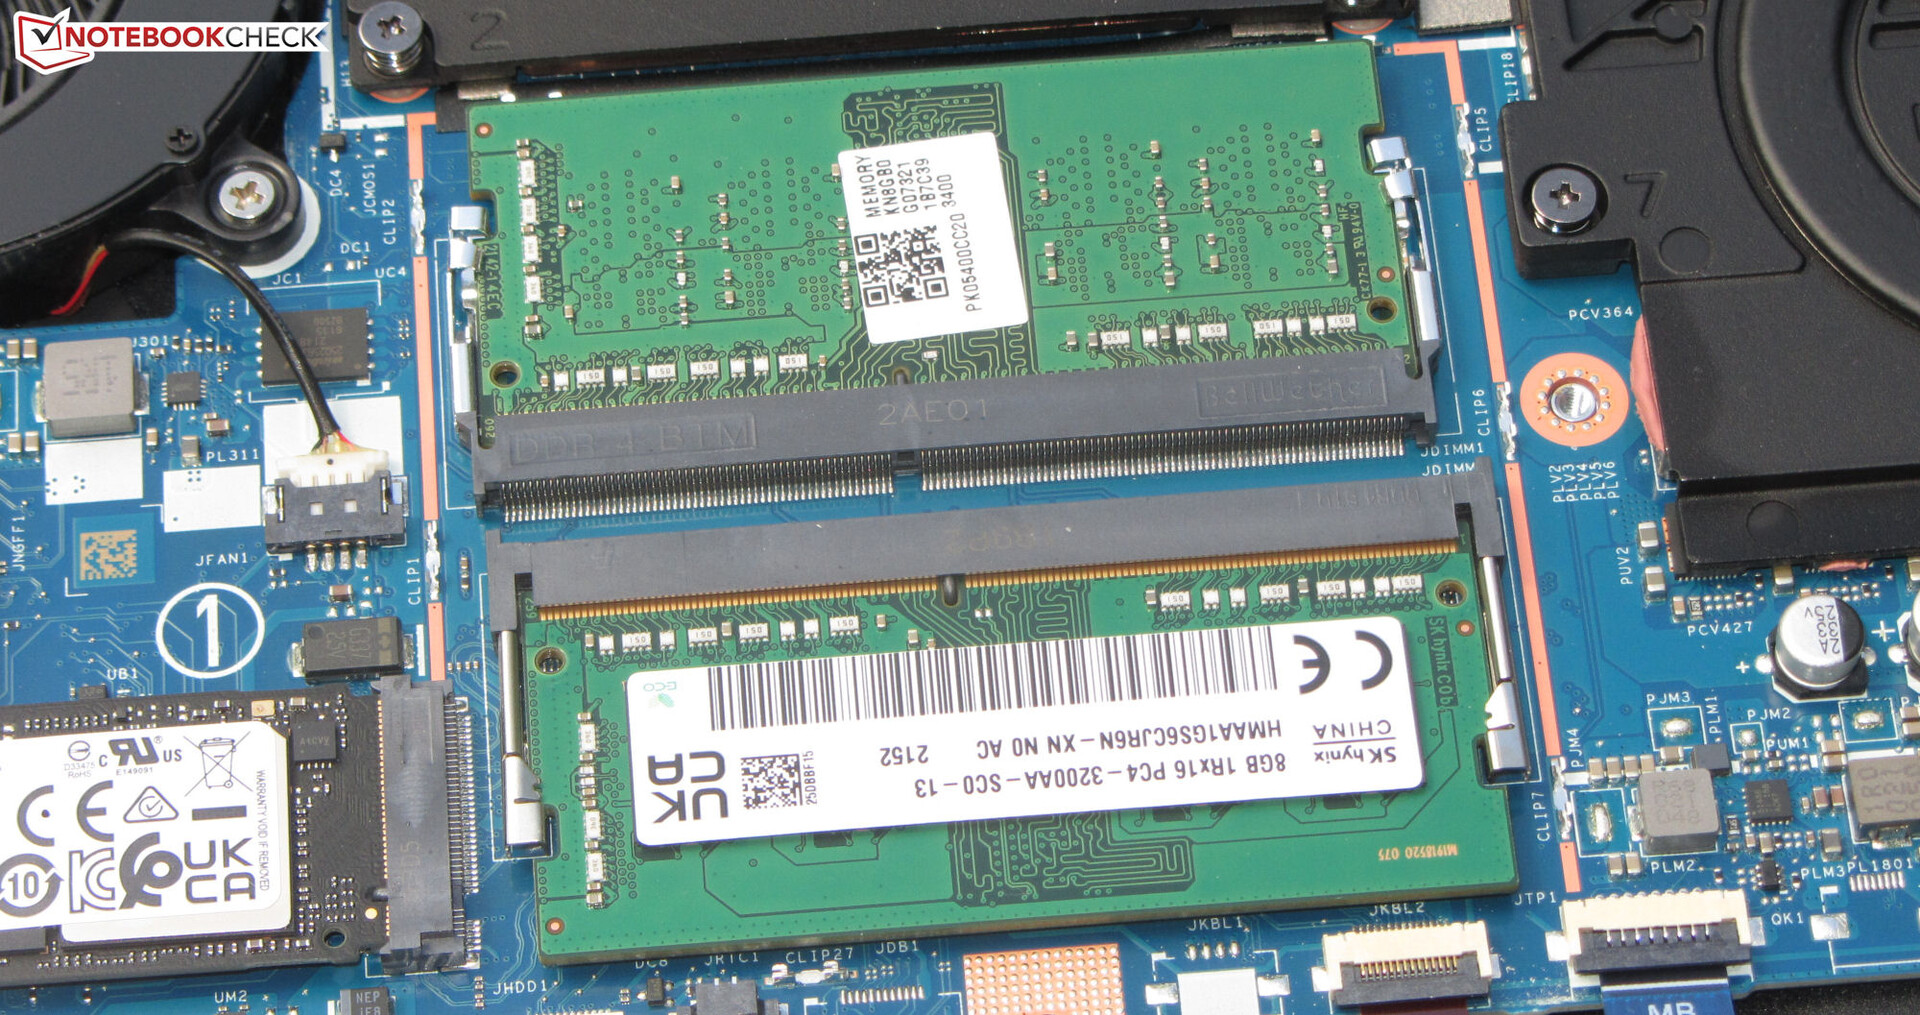
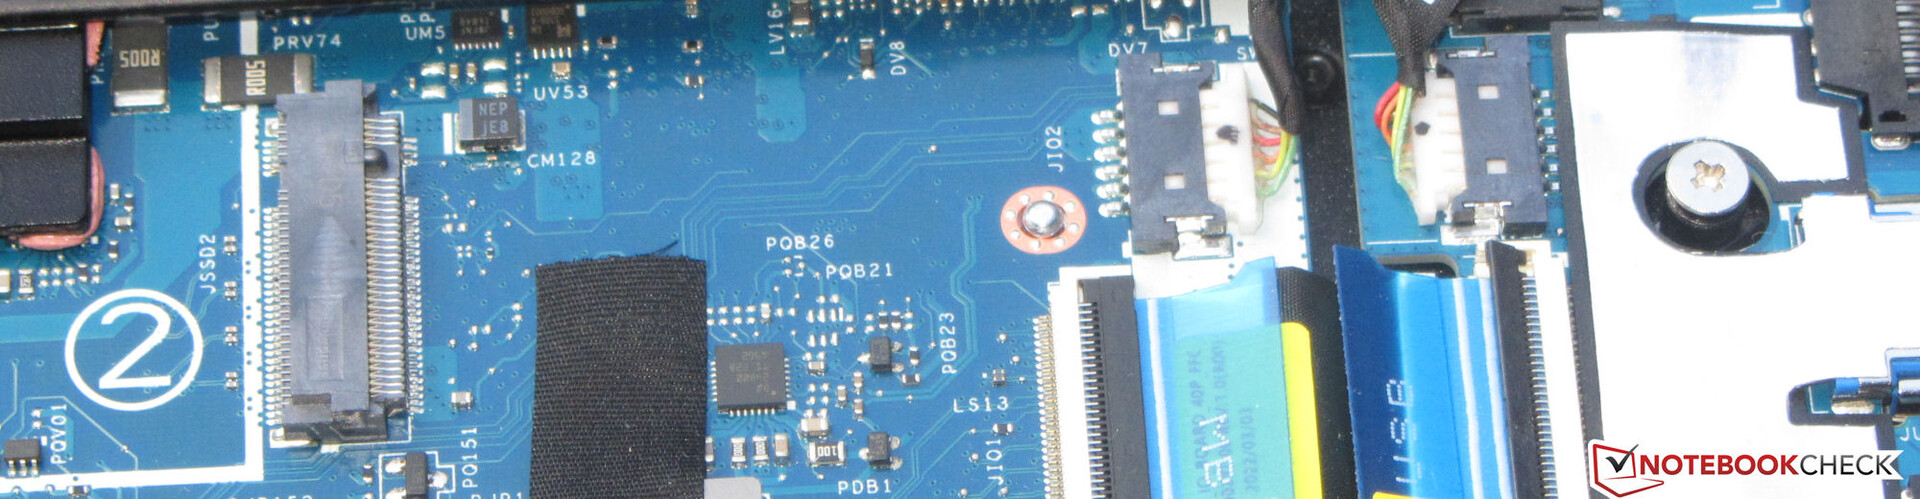
After removing all screws on the bottom of the device, the bottom shell can be detached using a flat spatula. Care must be taken here: The bottom shell is fastened quite tightly. Afterwards, you have access to the RAM banks (both occupied), the SSD (PCIe 4), the second M.2-2280 slot (PCIe 4), the 2.5-inch mounting frame, the WLAN module, the fans, the speakers and the battery.
Warranty
A two-year warranty is provided in Germany. An upgrade to a three year on-site warranty costs just under 120 Euros. This may not apply to other countries and regions of purchase, so make sure to double check the warranty with your supplier.
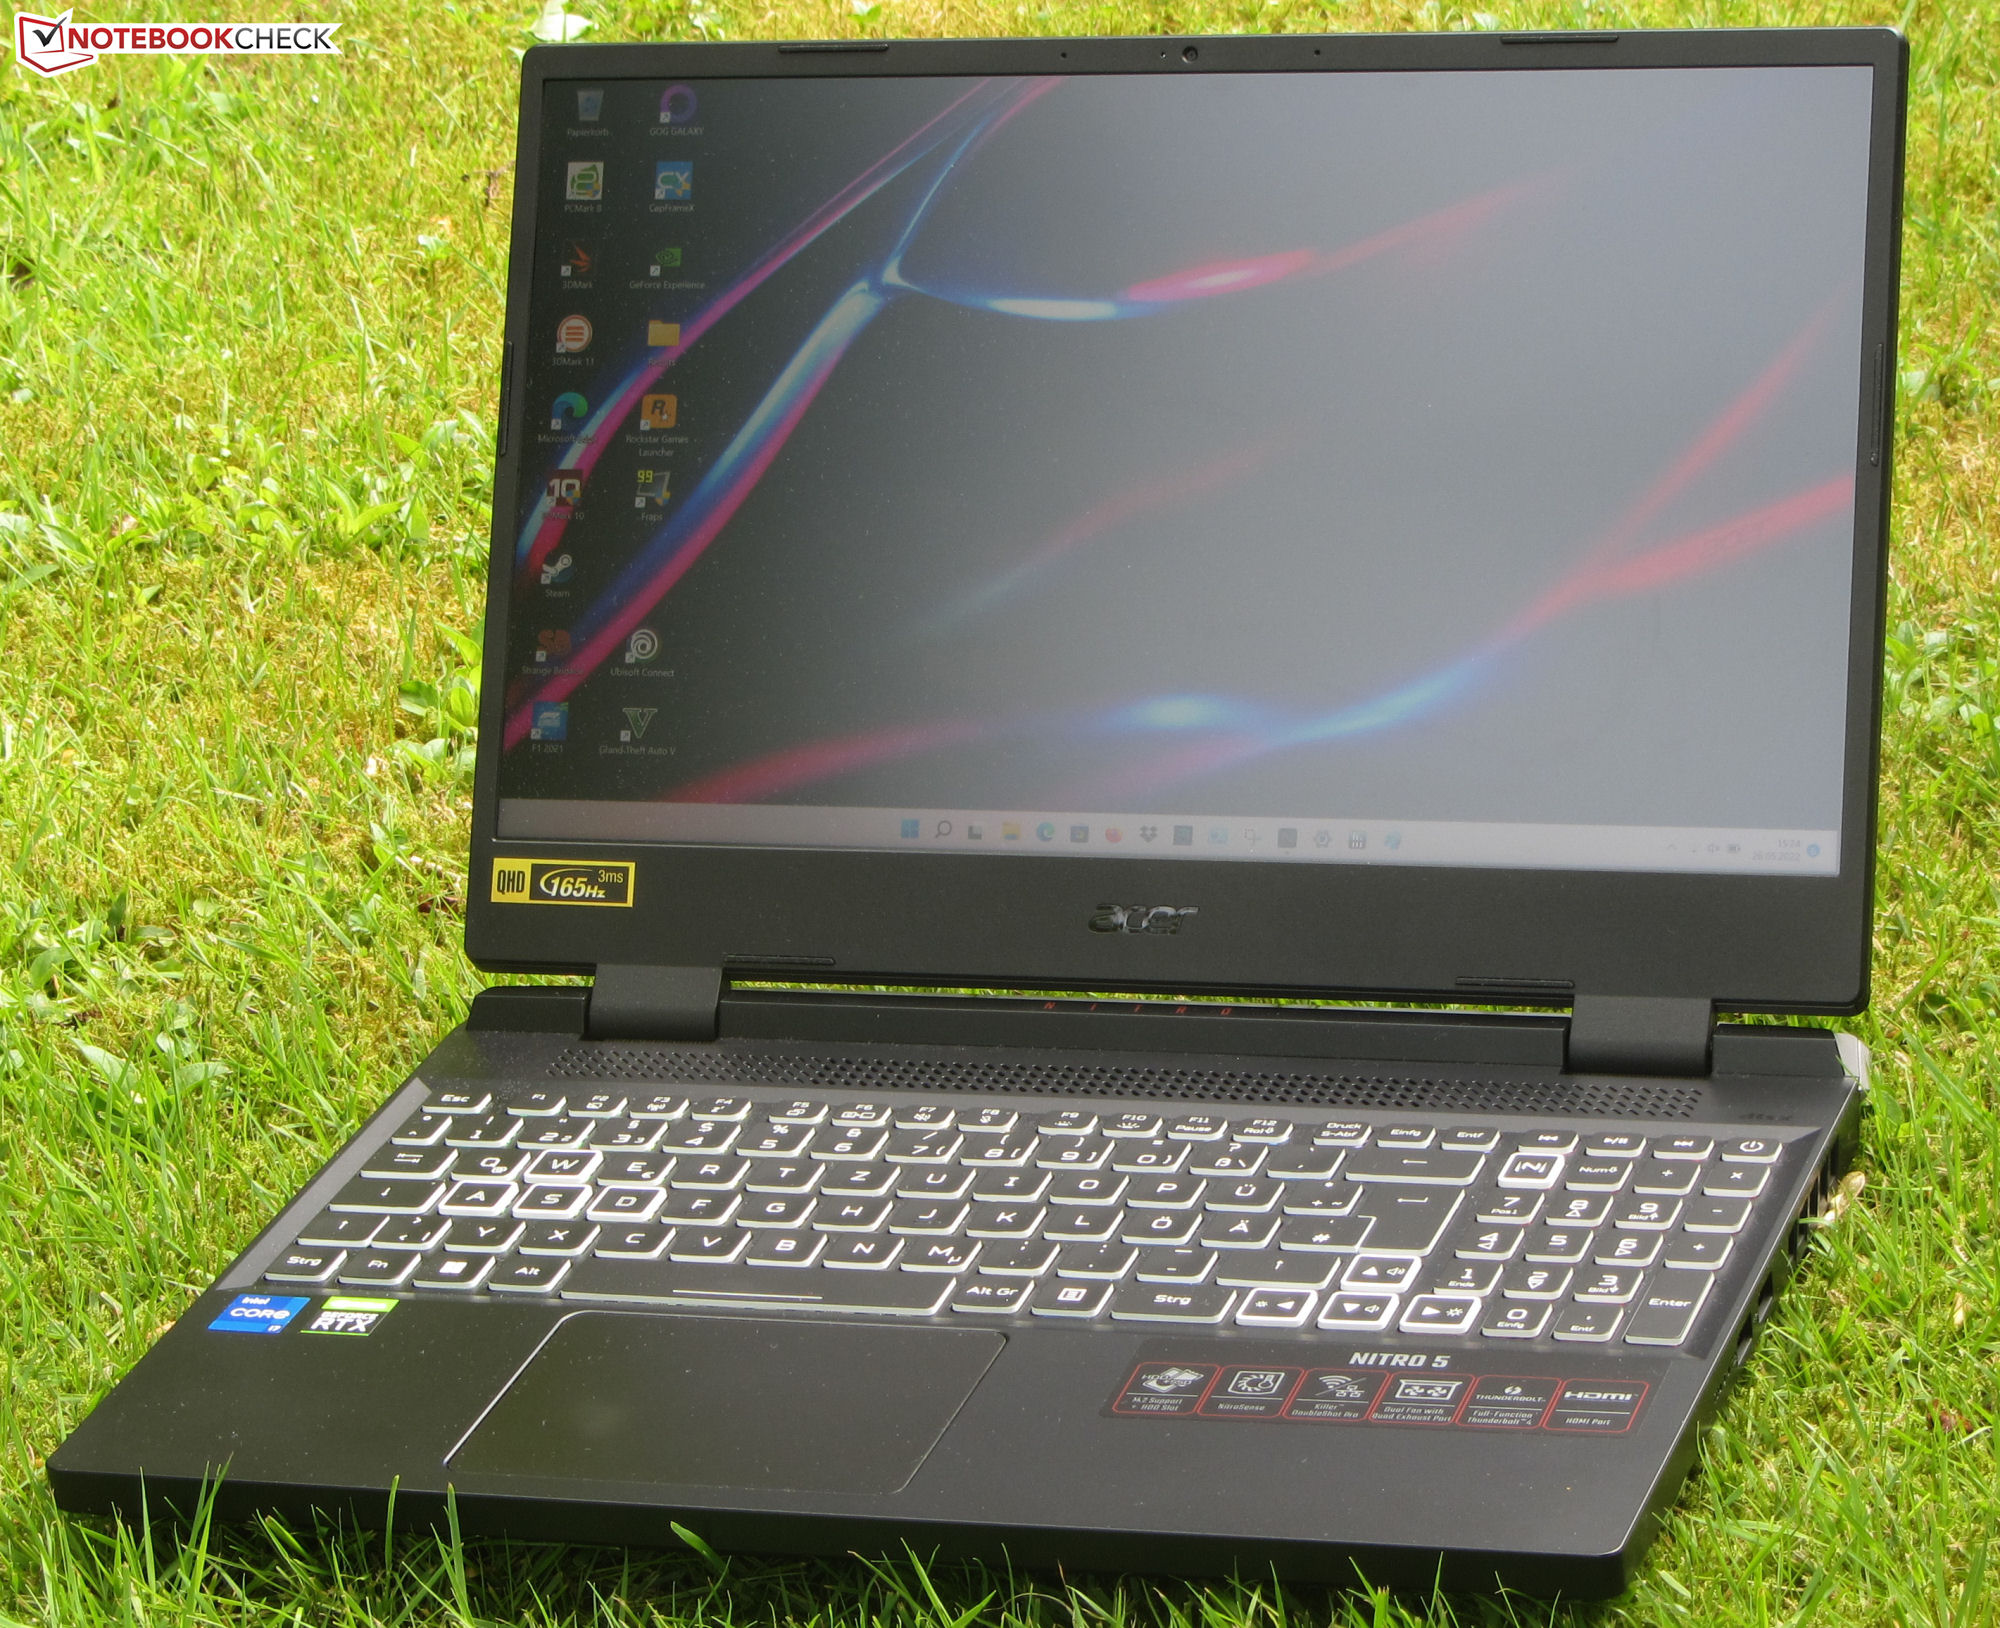
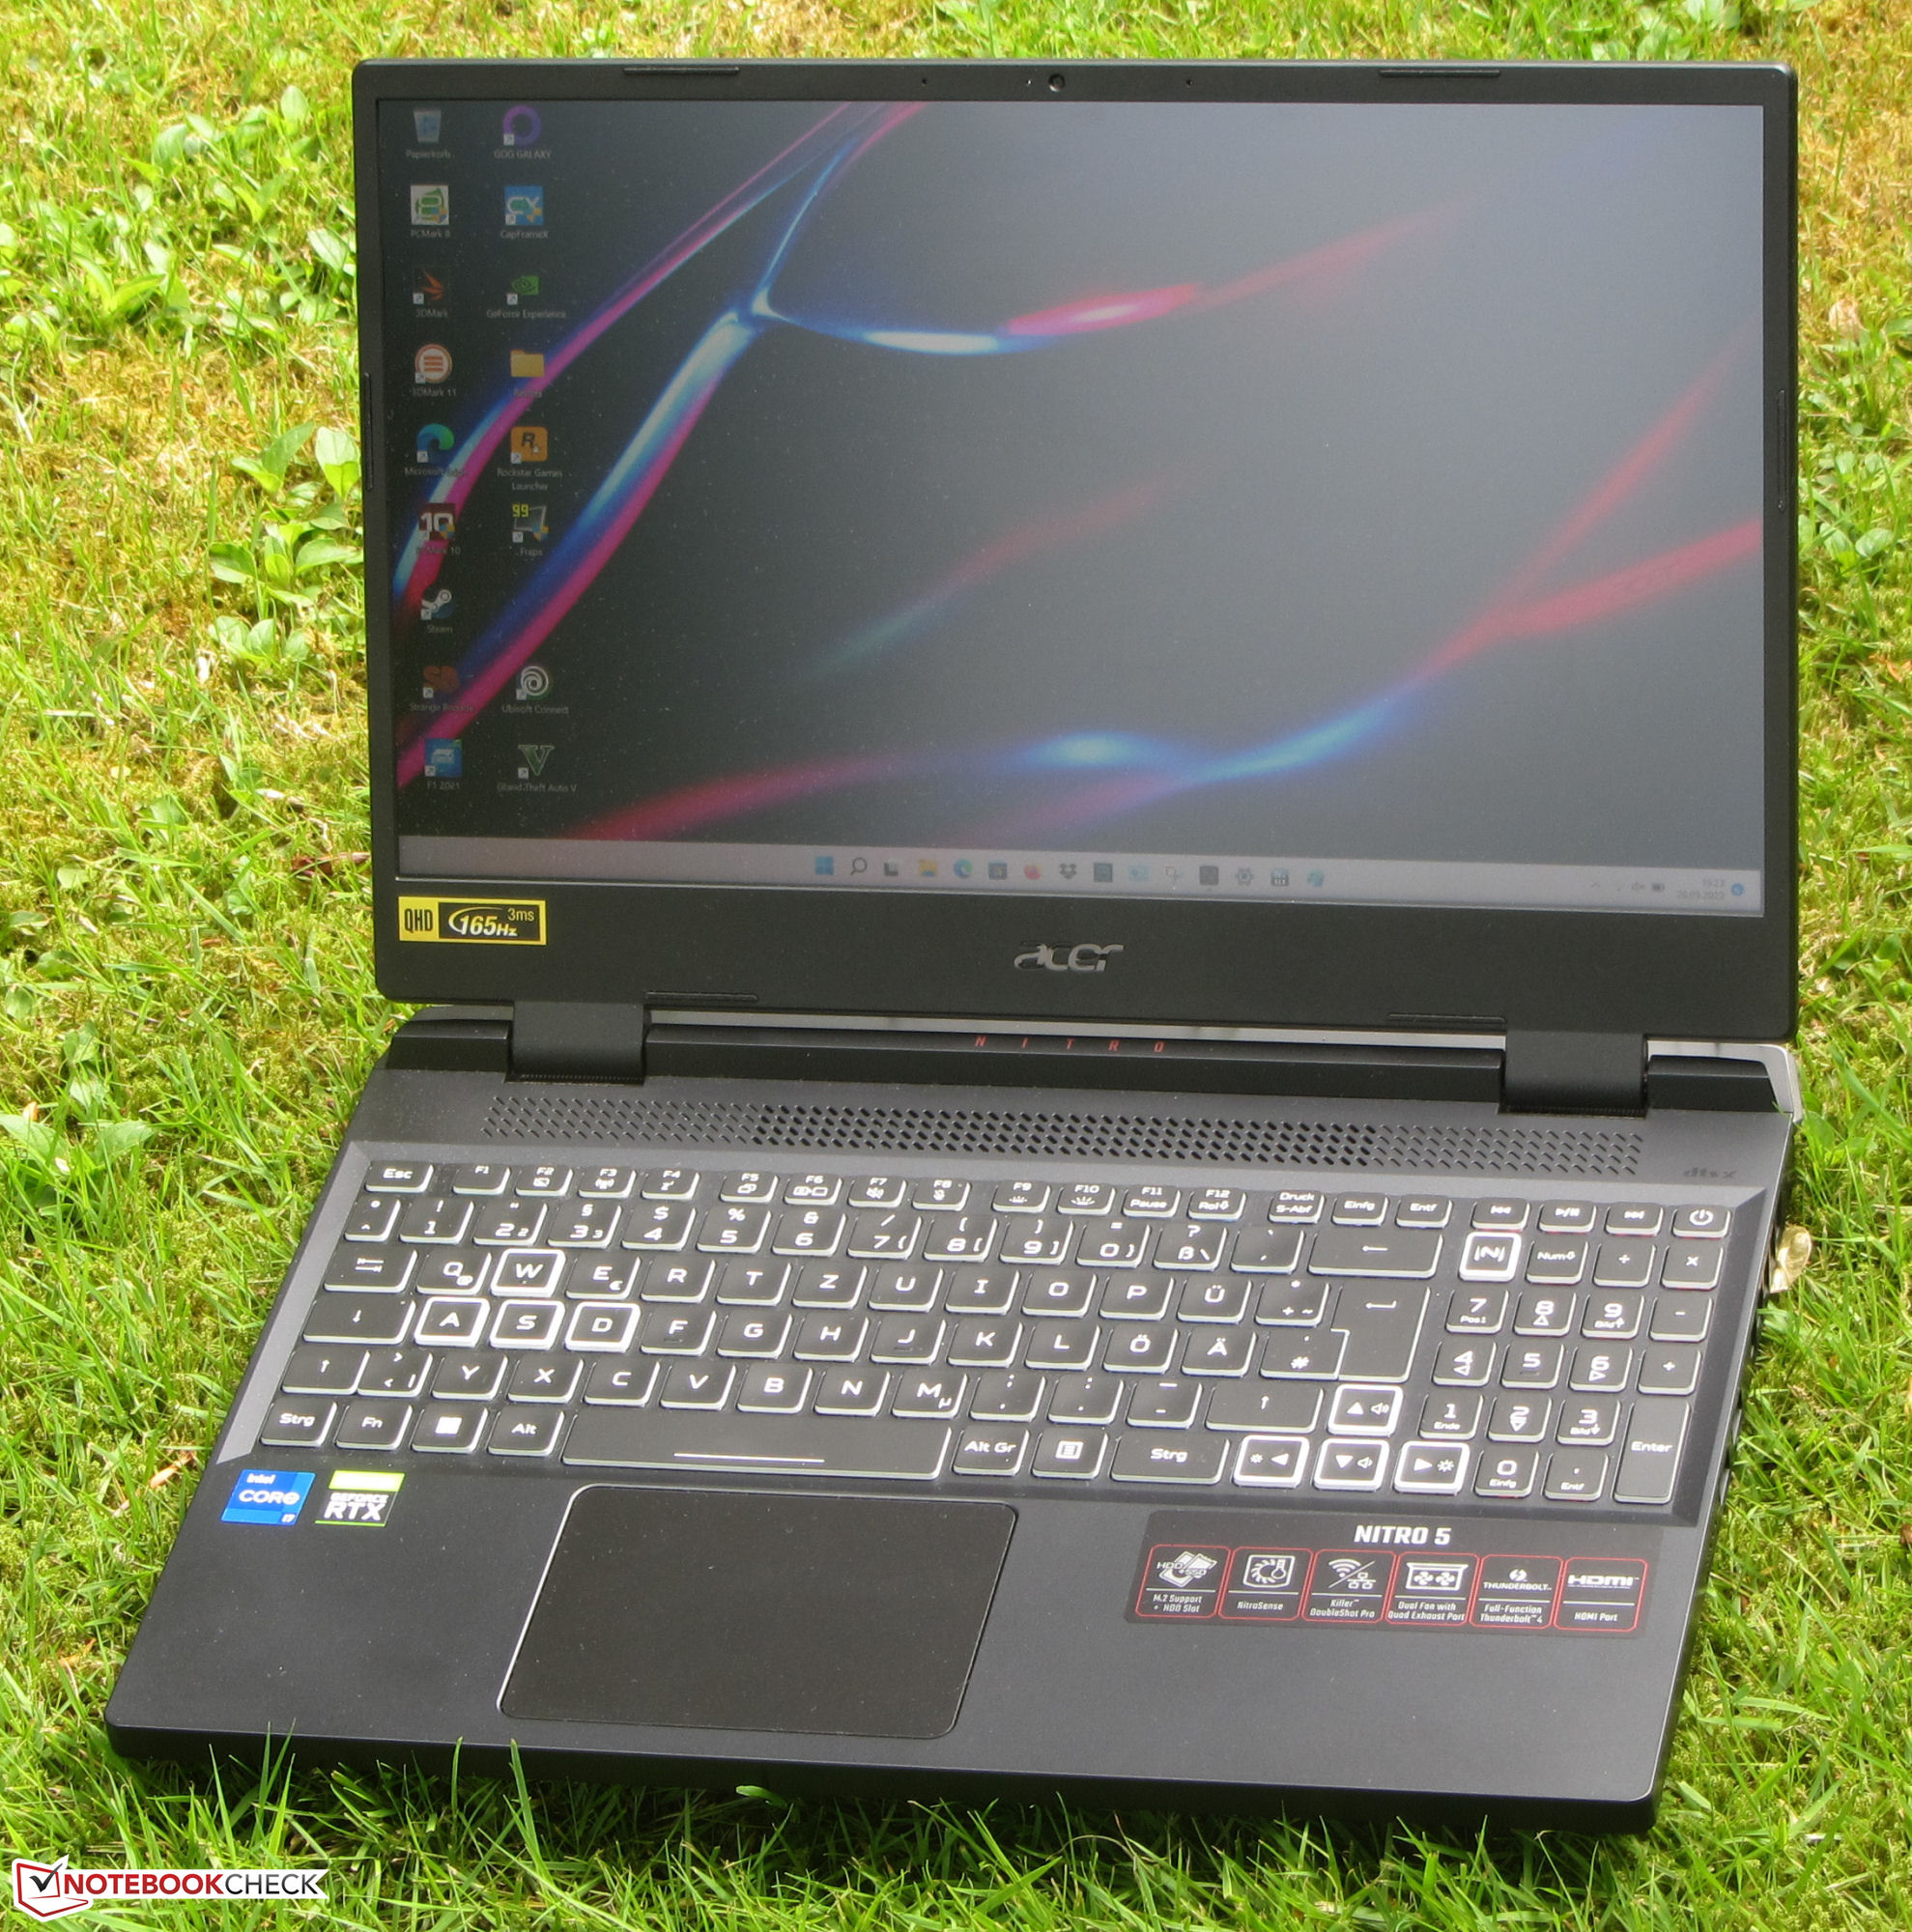
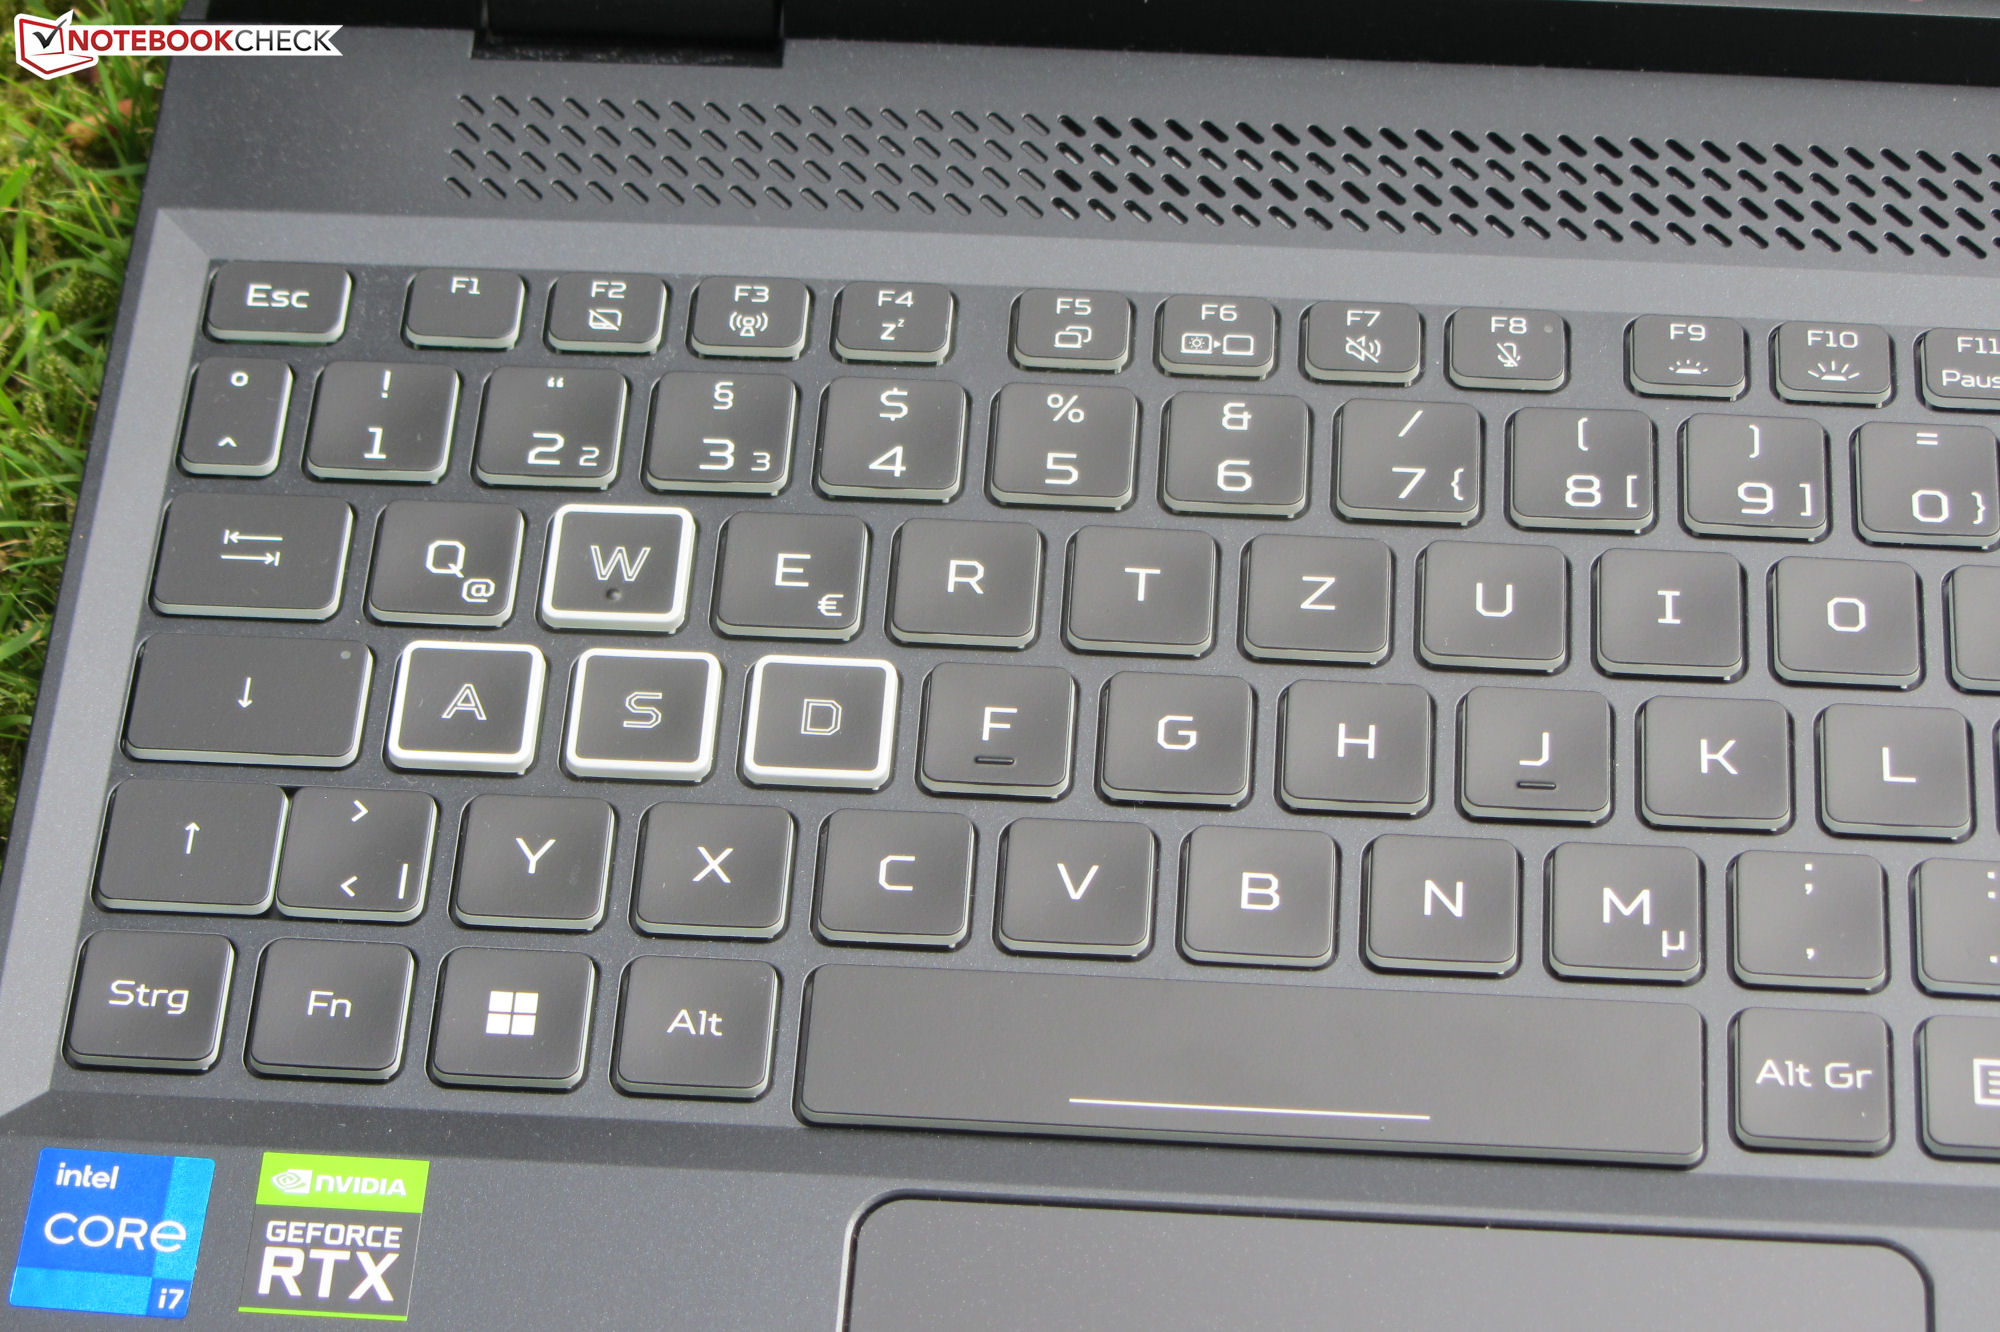
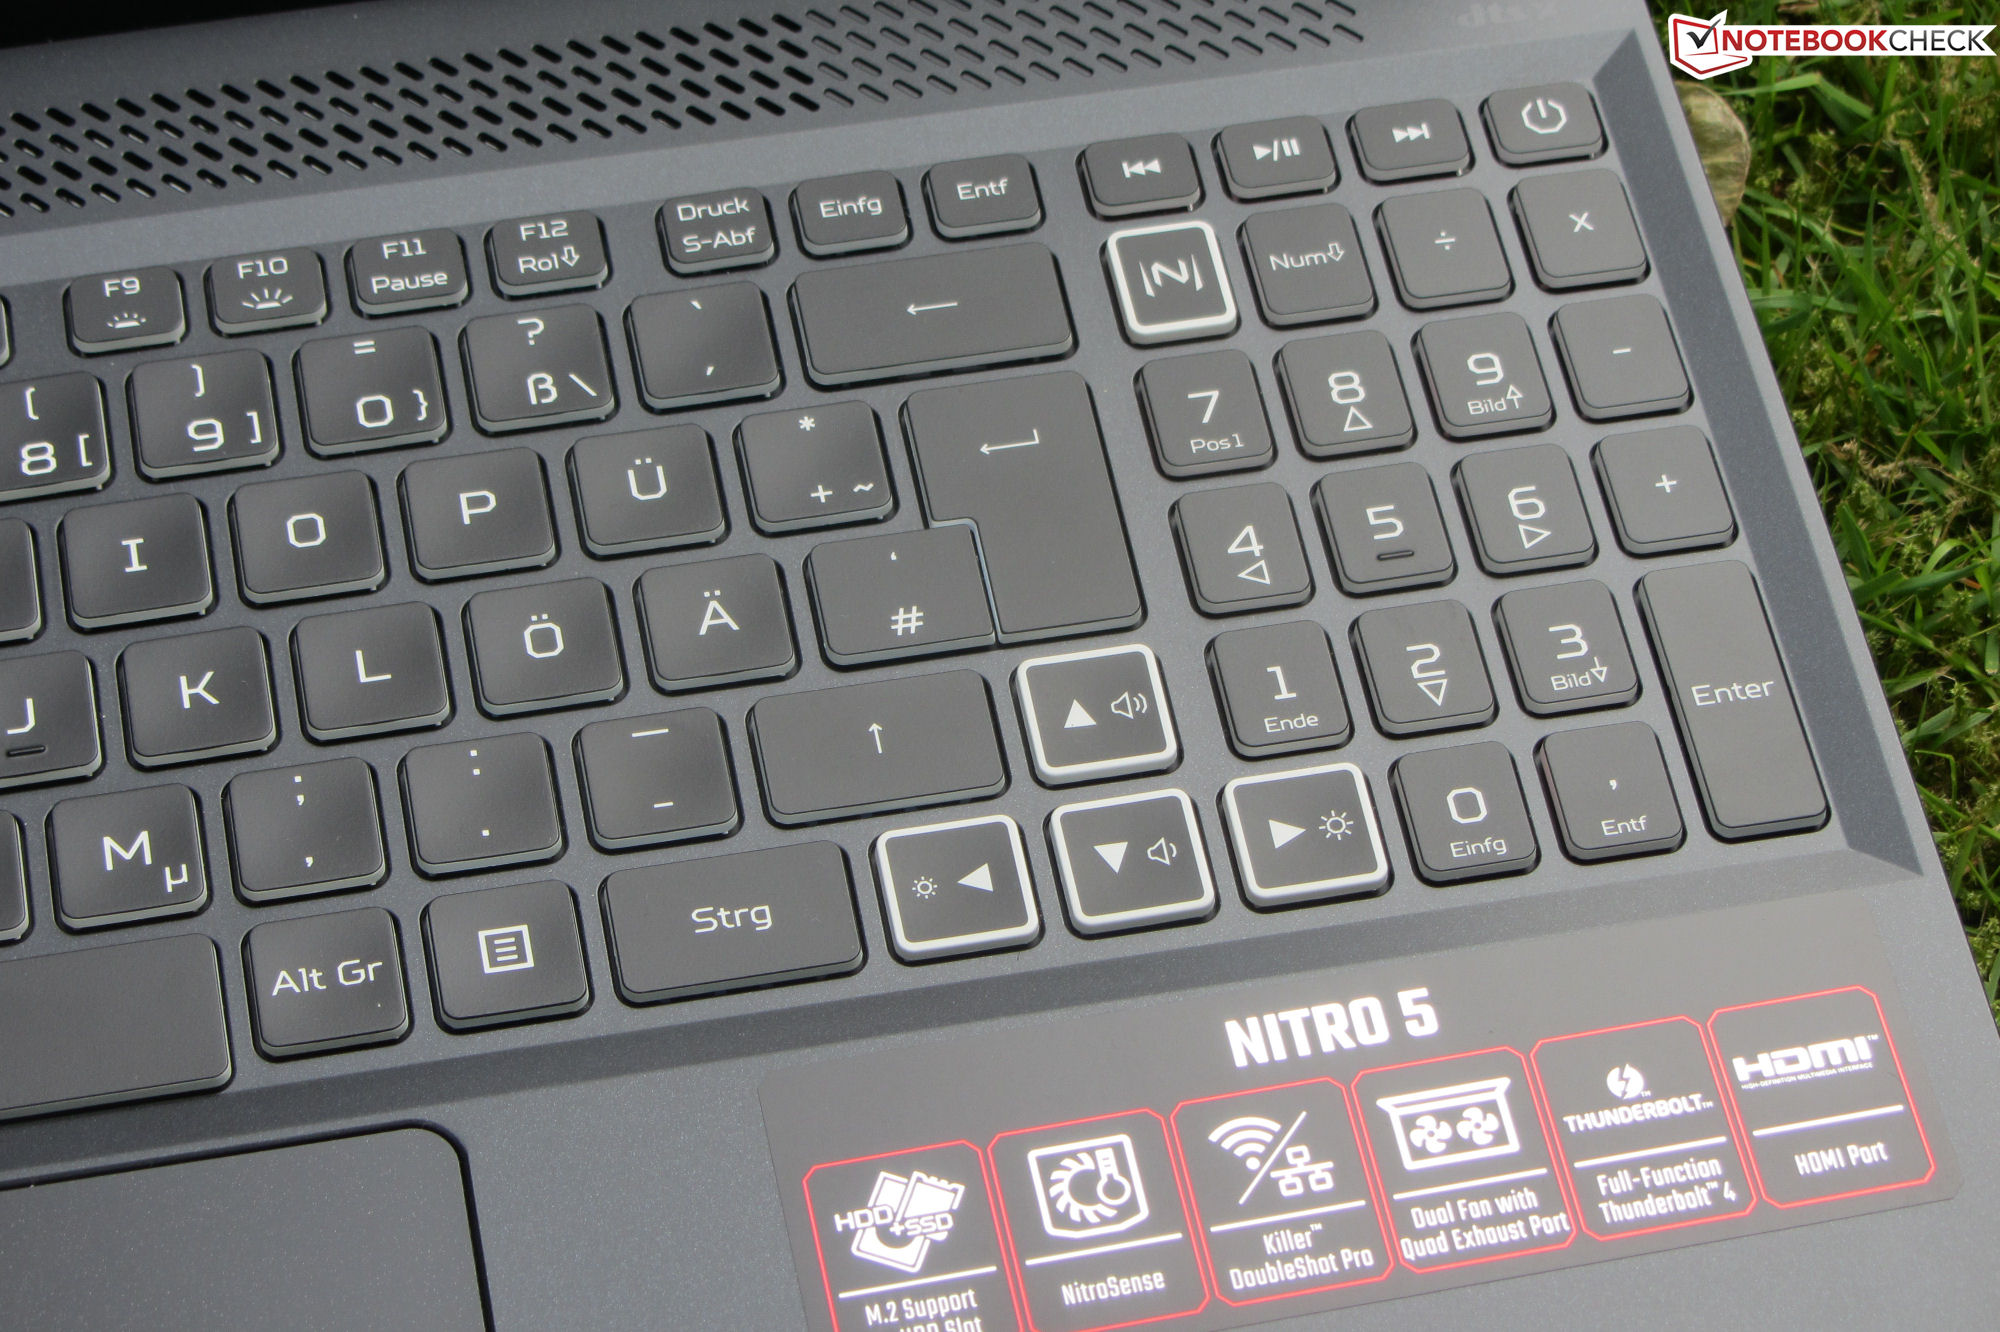
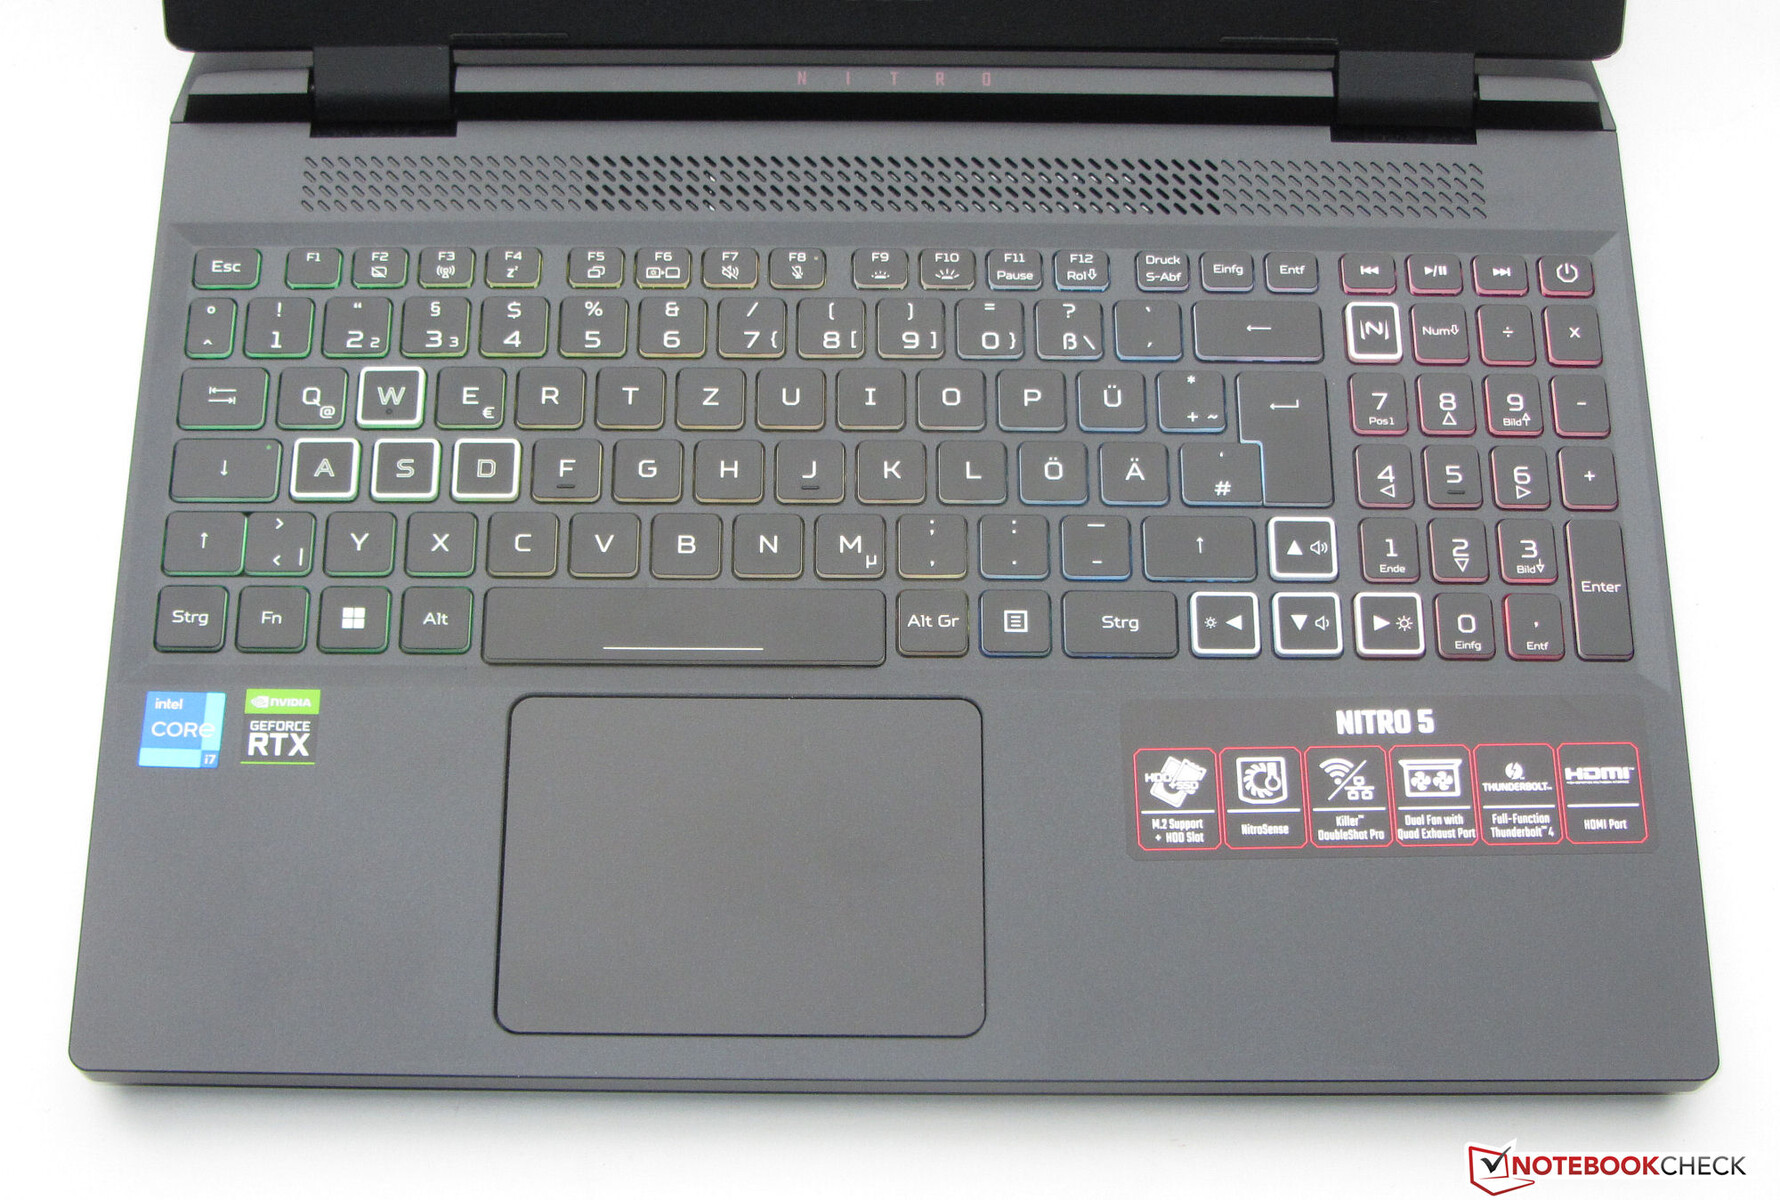
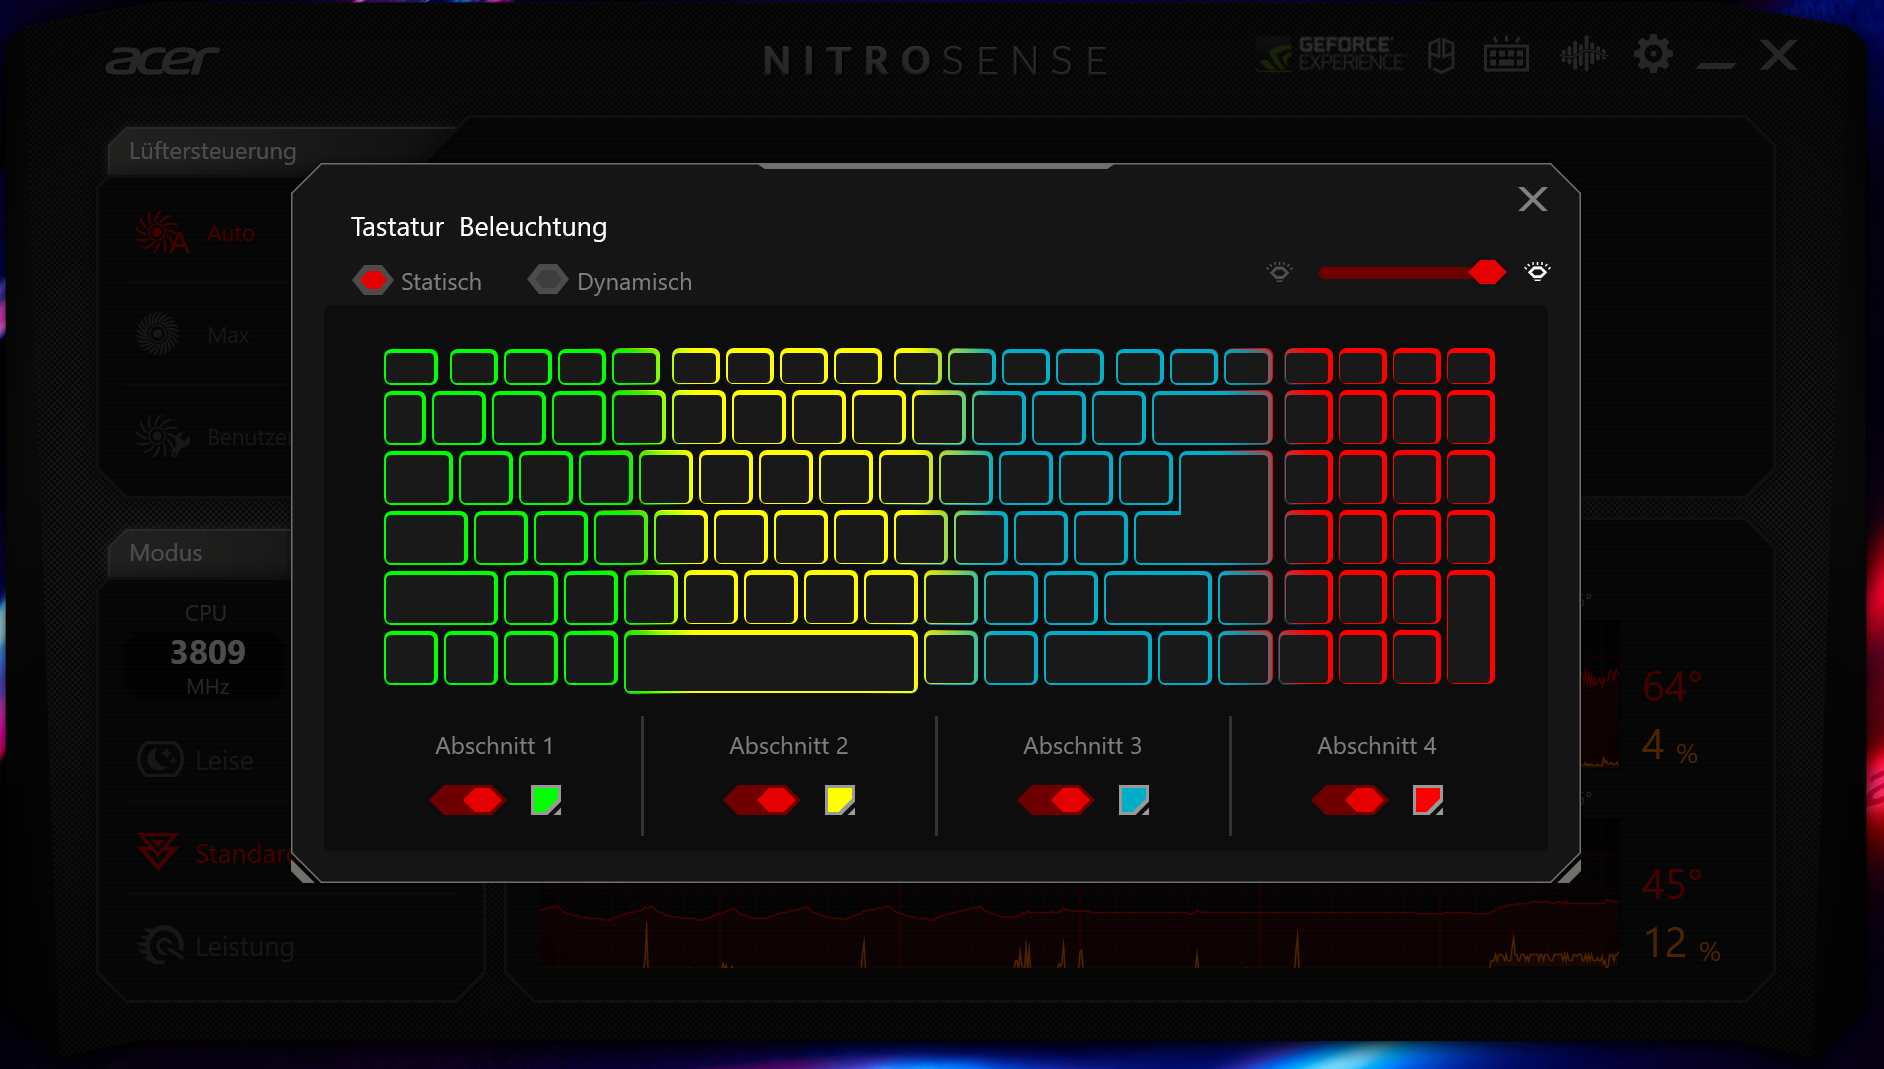
Input devices: The AN515 has a keyboard with RGB lighting
Keyboard
The illuminated chiclet keyboard consists of concave (letters, number row) and flat keys (function keys, number pad), which all offer a medium drop and a clear pressure point. However, key resistance could be crisper for our taste. The keyboard yields a little during typing, but this did not prove to be troublesome. The four-stage RGB lighting is controlled via two function keys. Overall, Acer delivers a keyboard that is suitable for everyday use.
Touchpad
A multi-touch capable clickpad (about 10.6 x 7.8cm) serves as a mouse replacement. Its smooth surface allows for easy finger gliding and good input response in the corners. The travel is short and the pressure point clear.
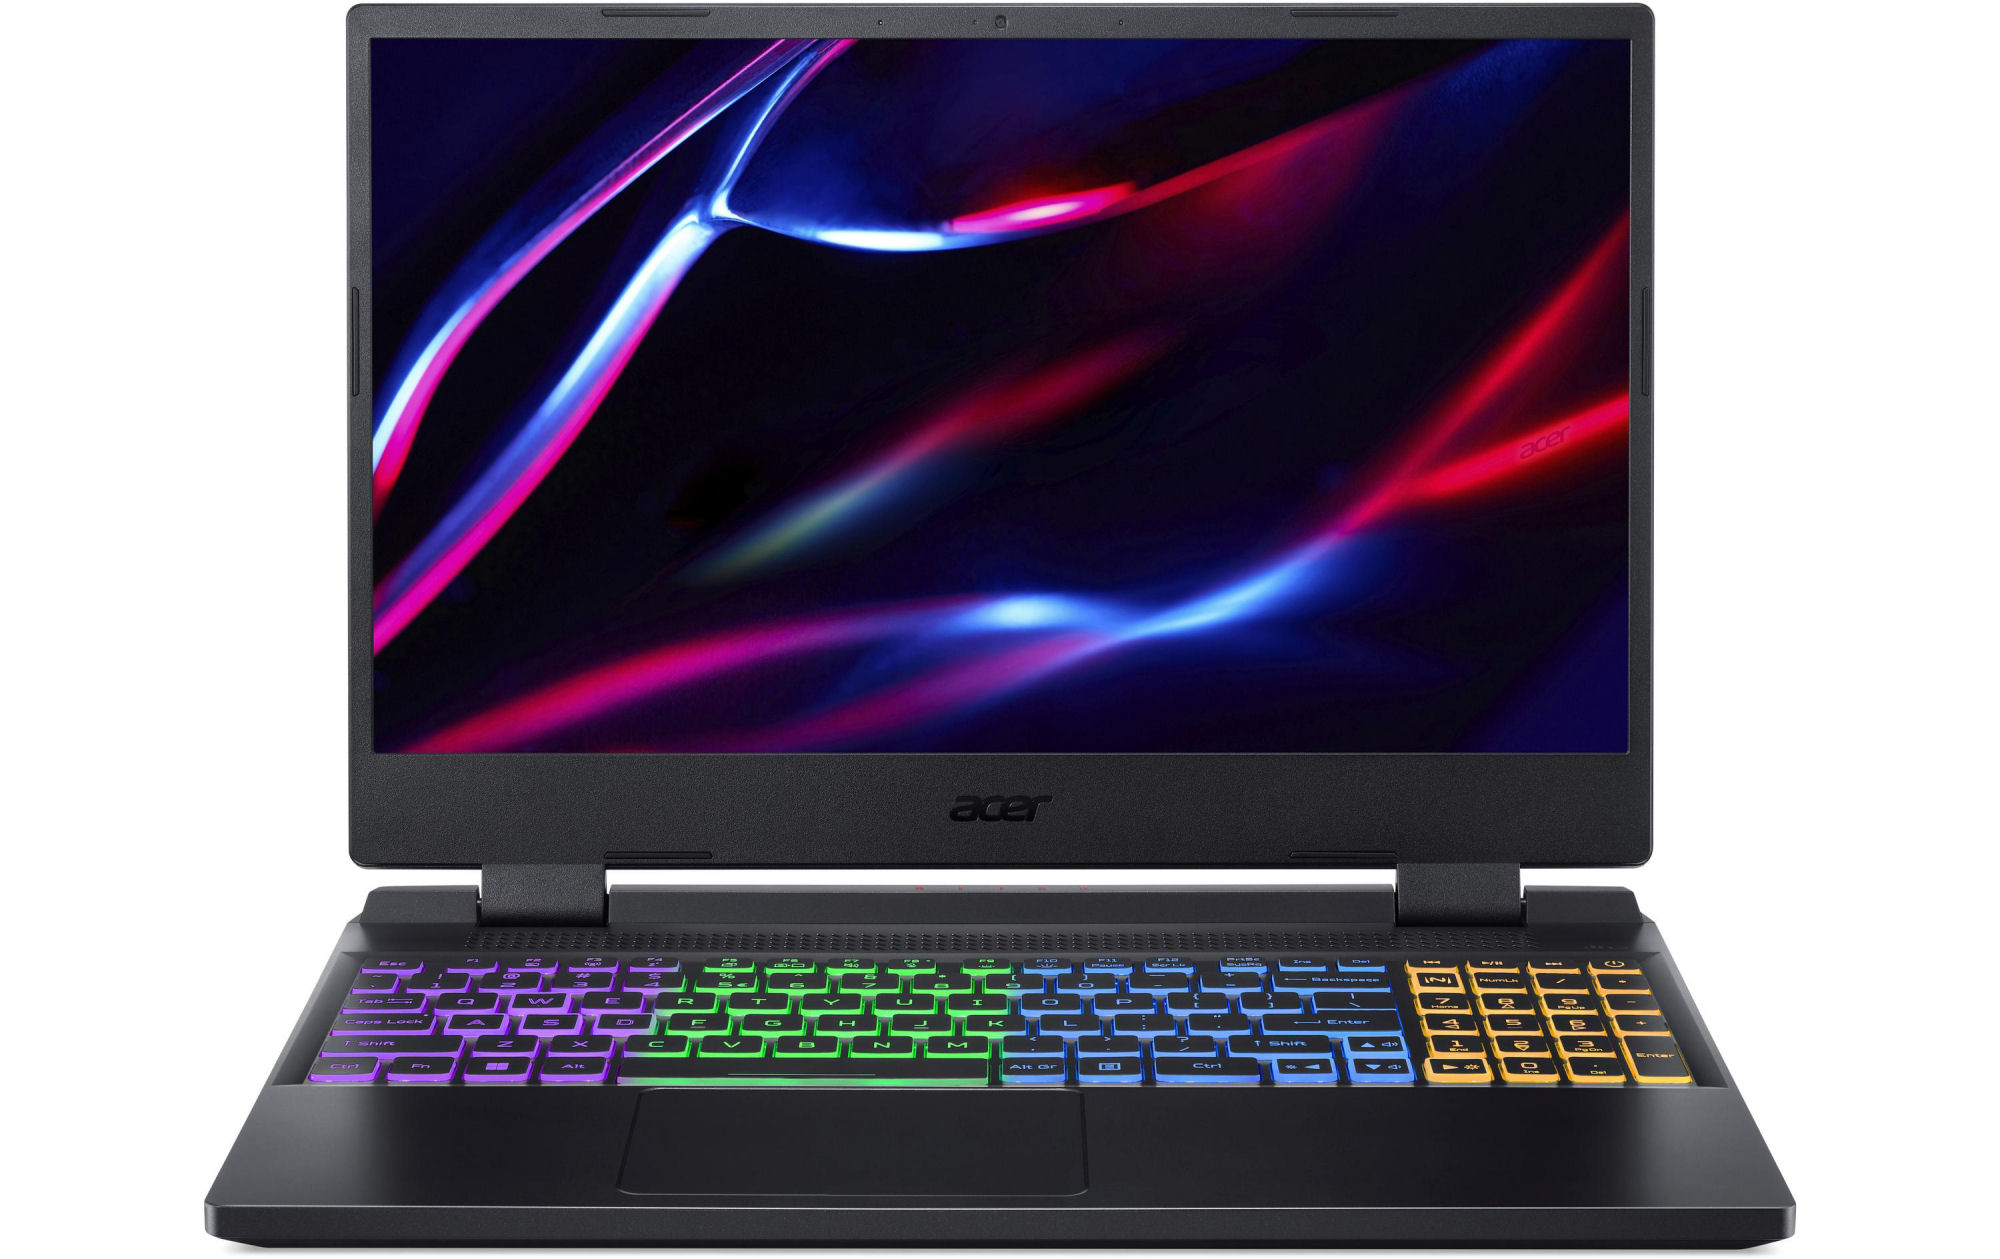
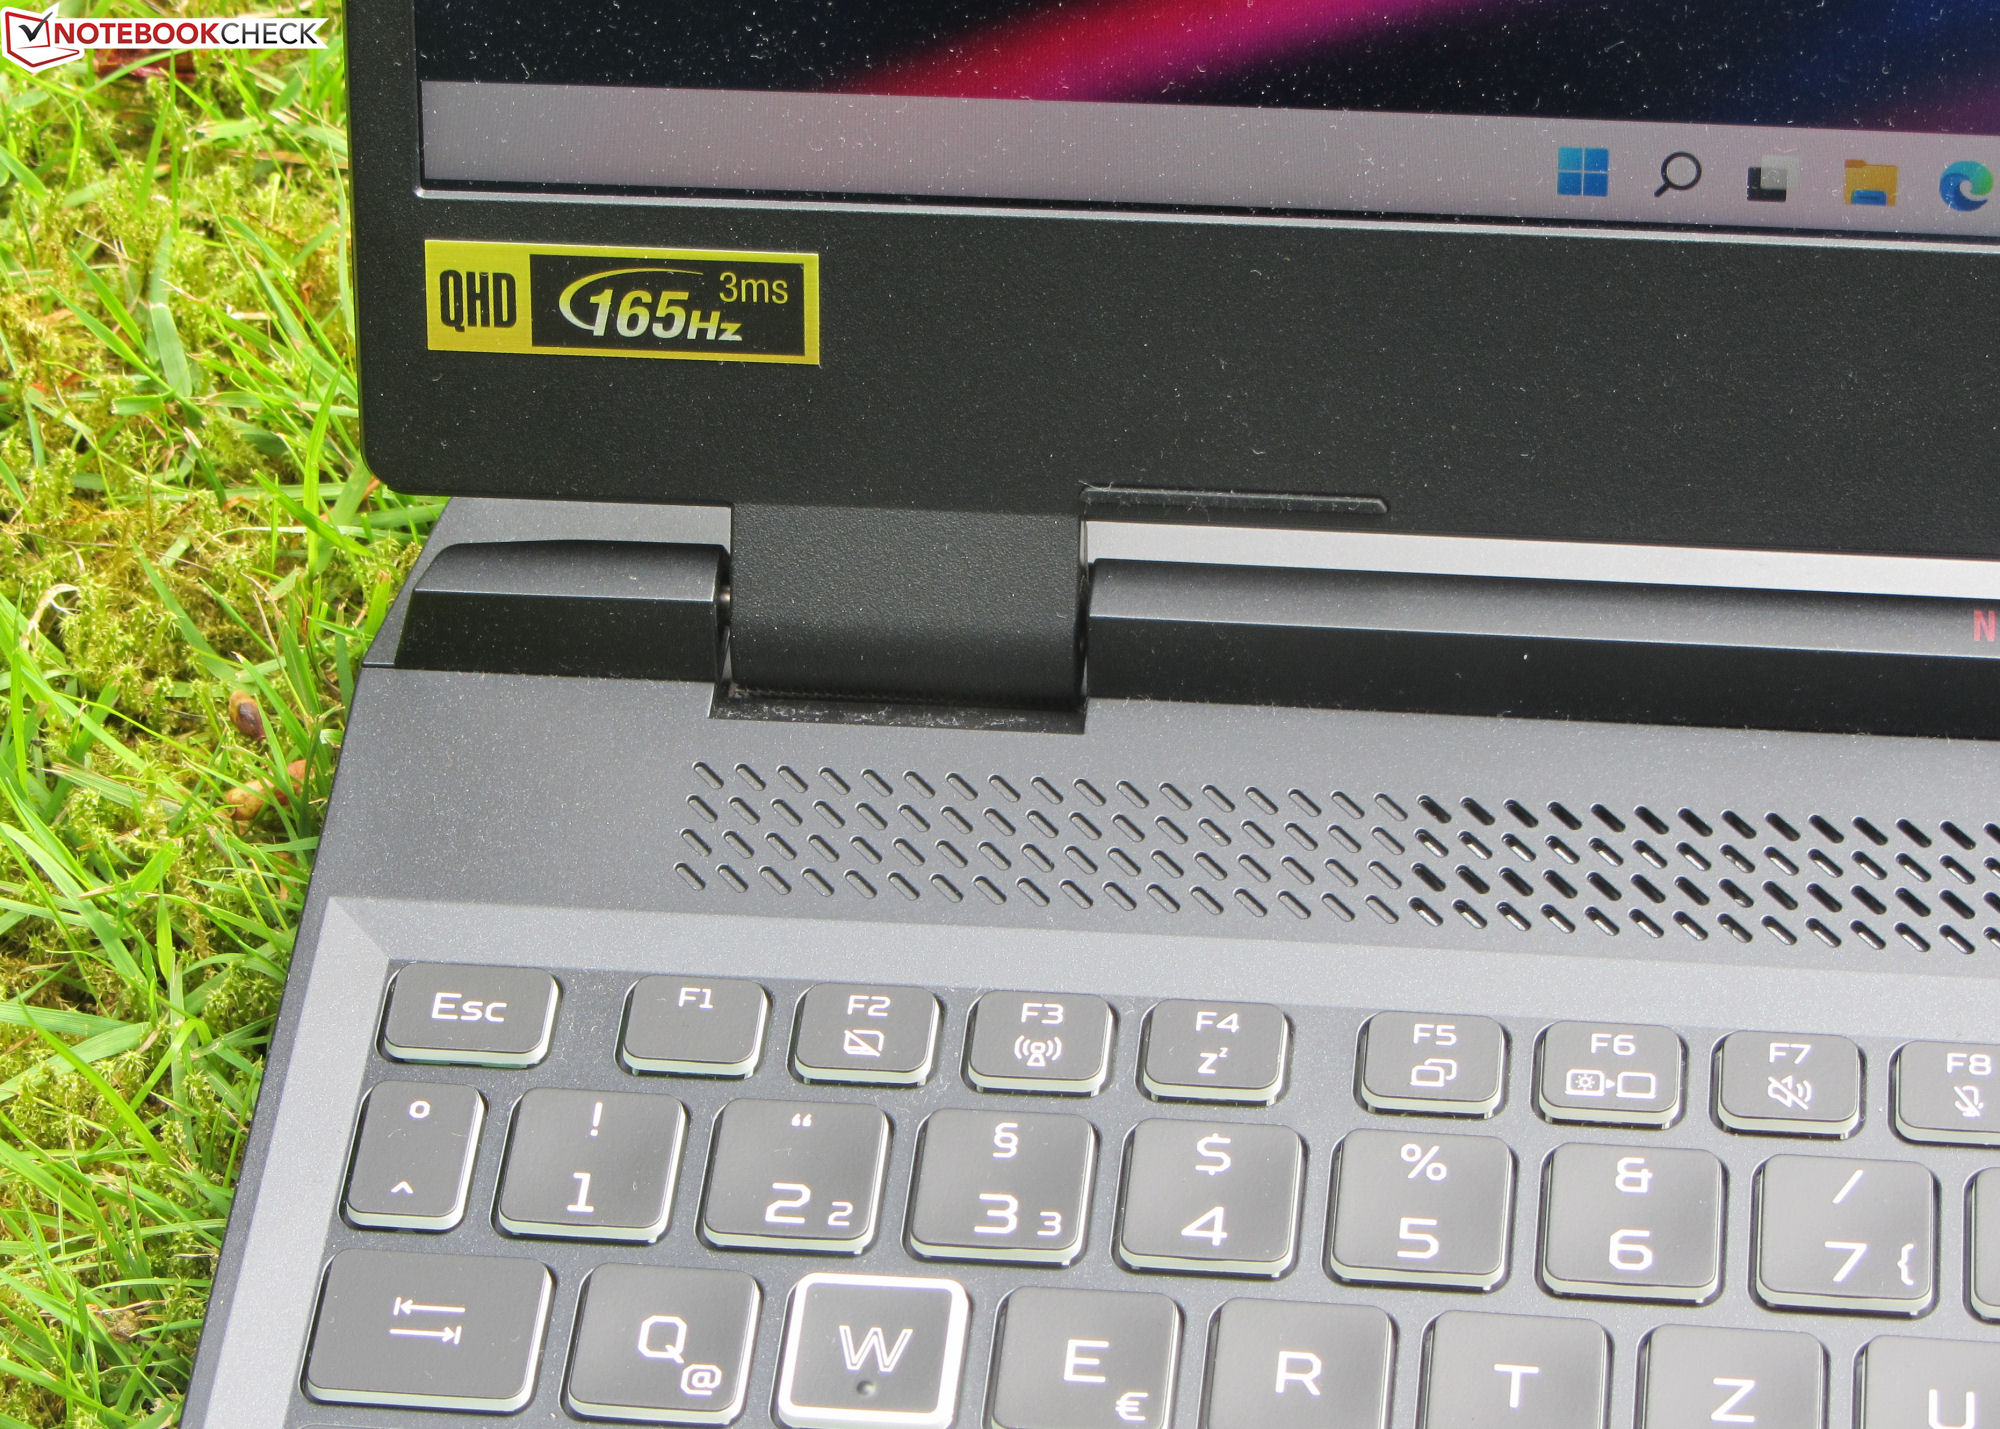
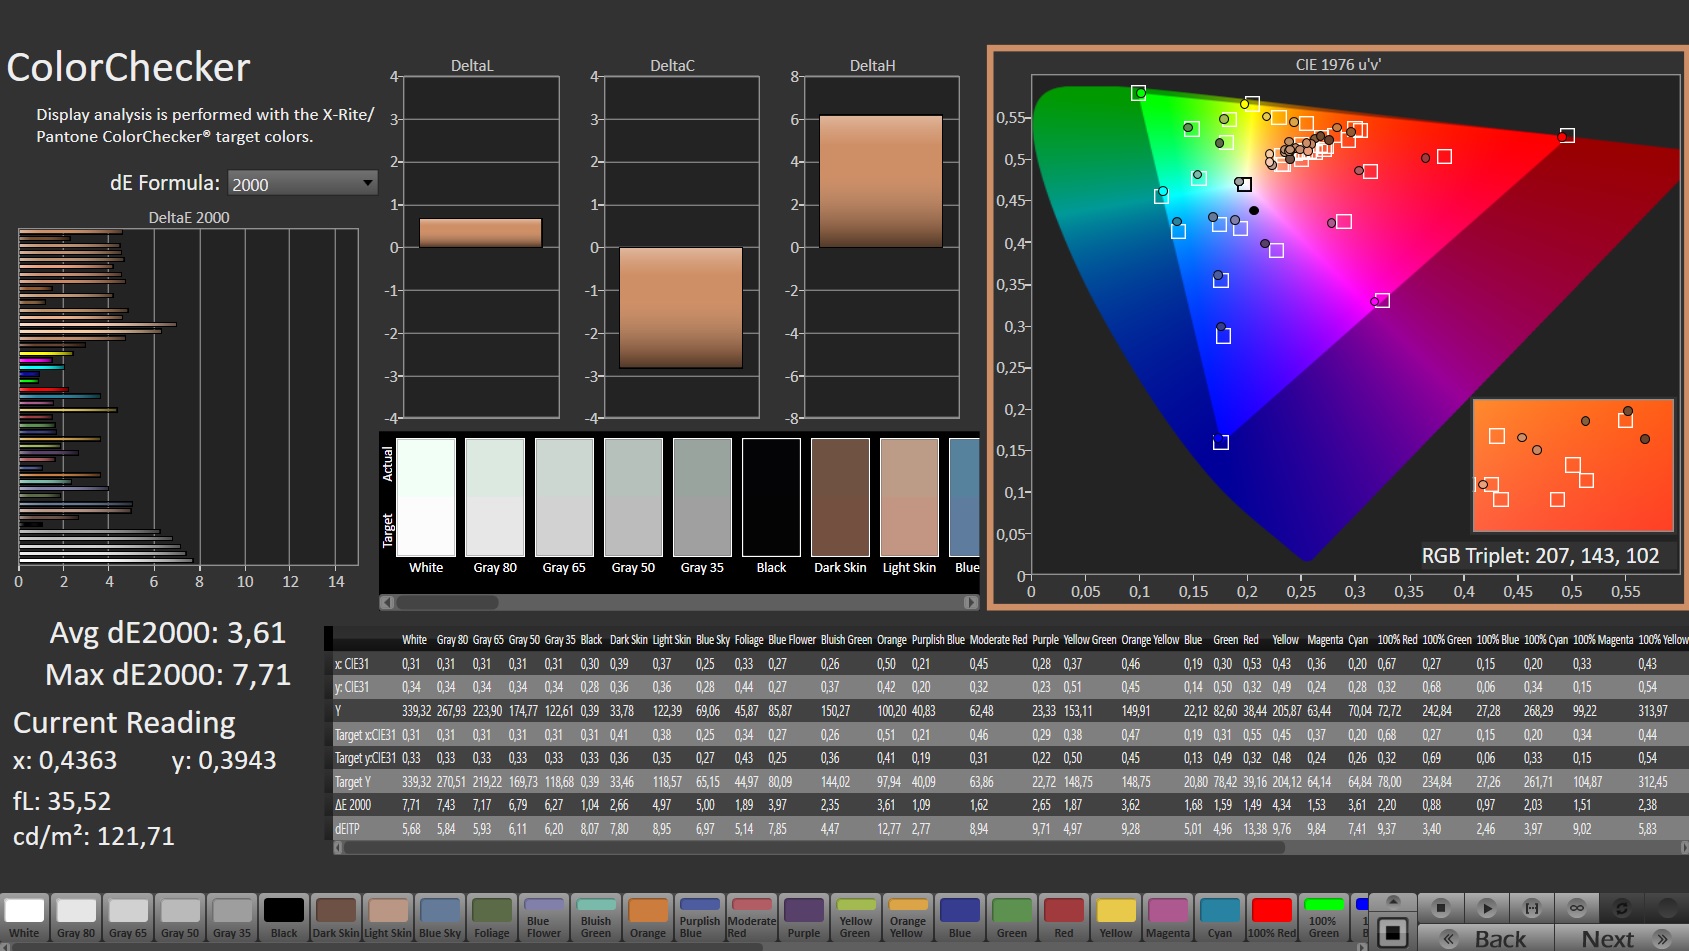
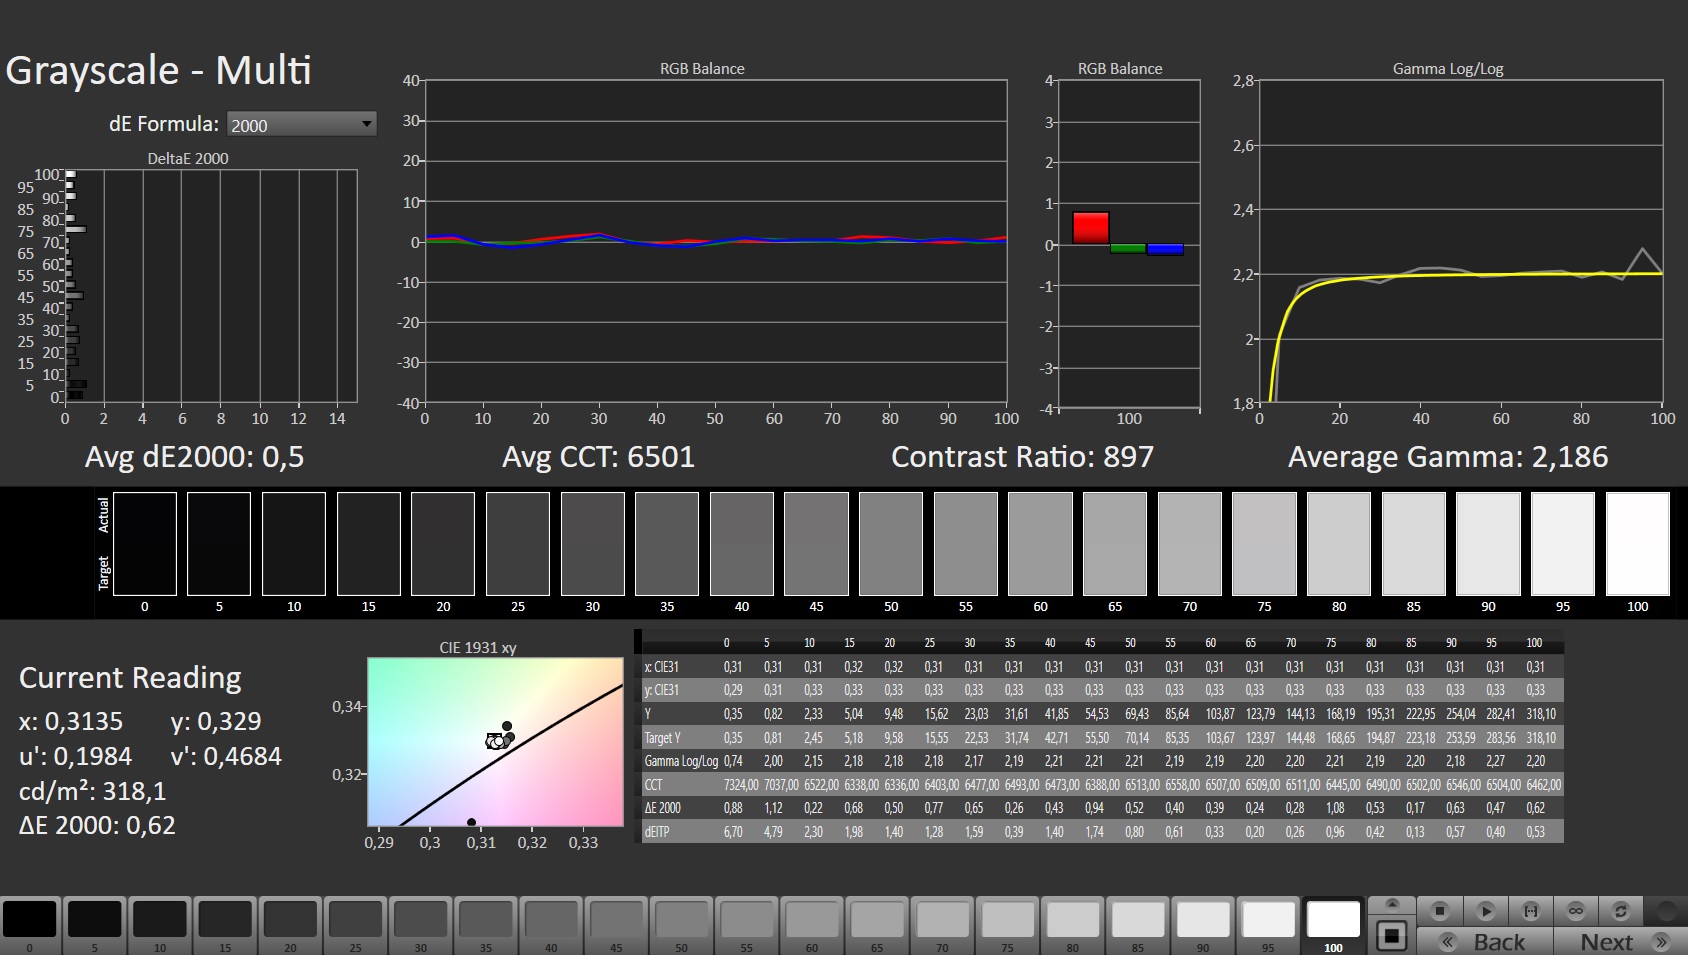
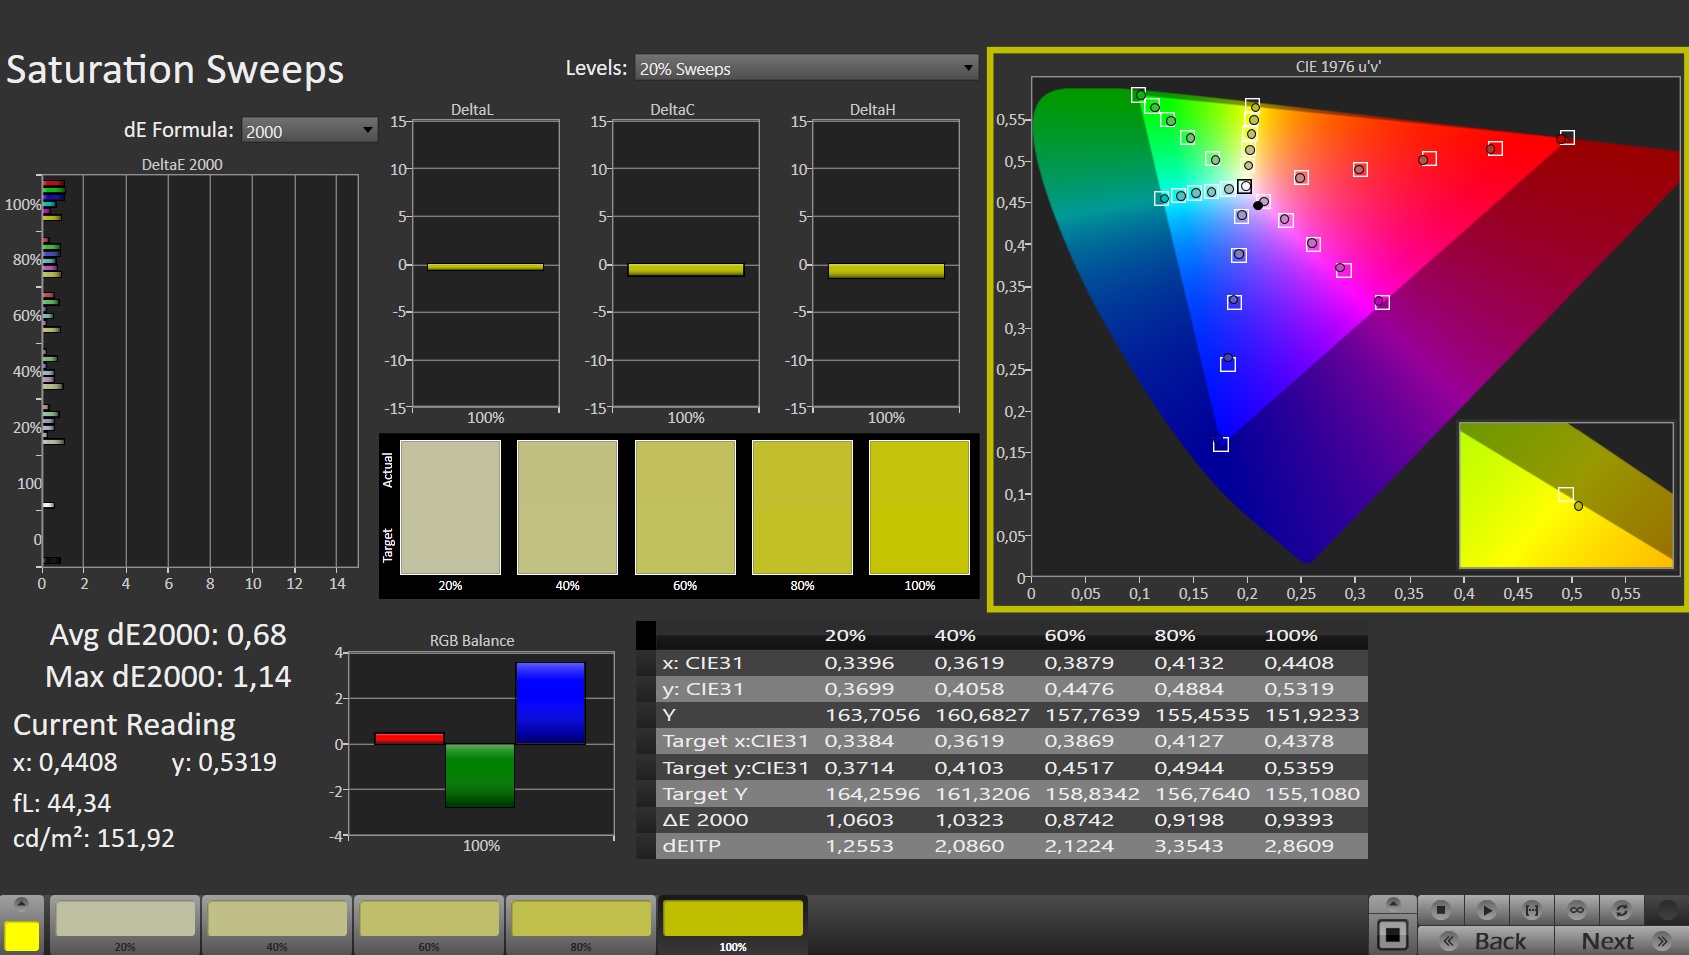
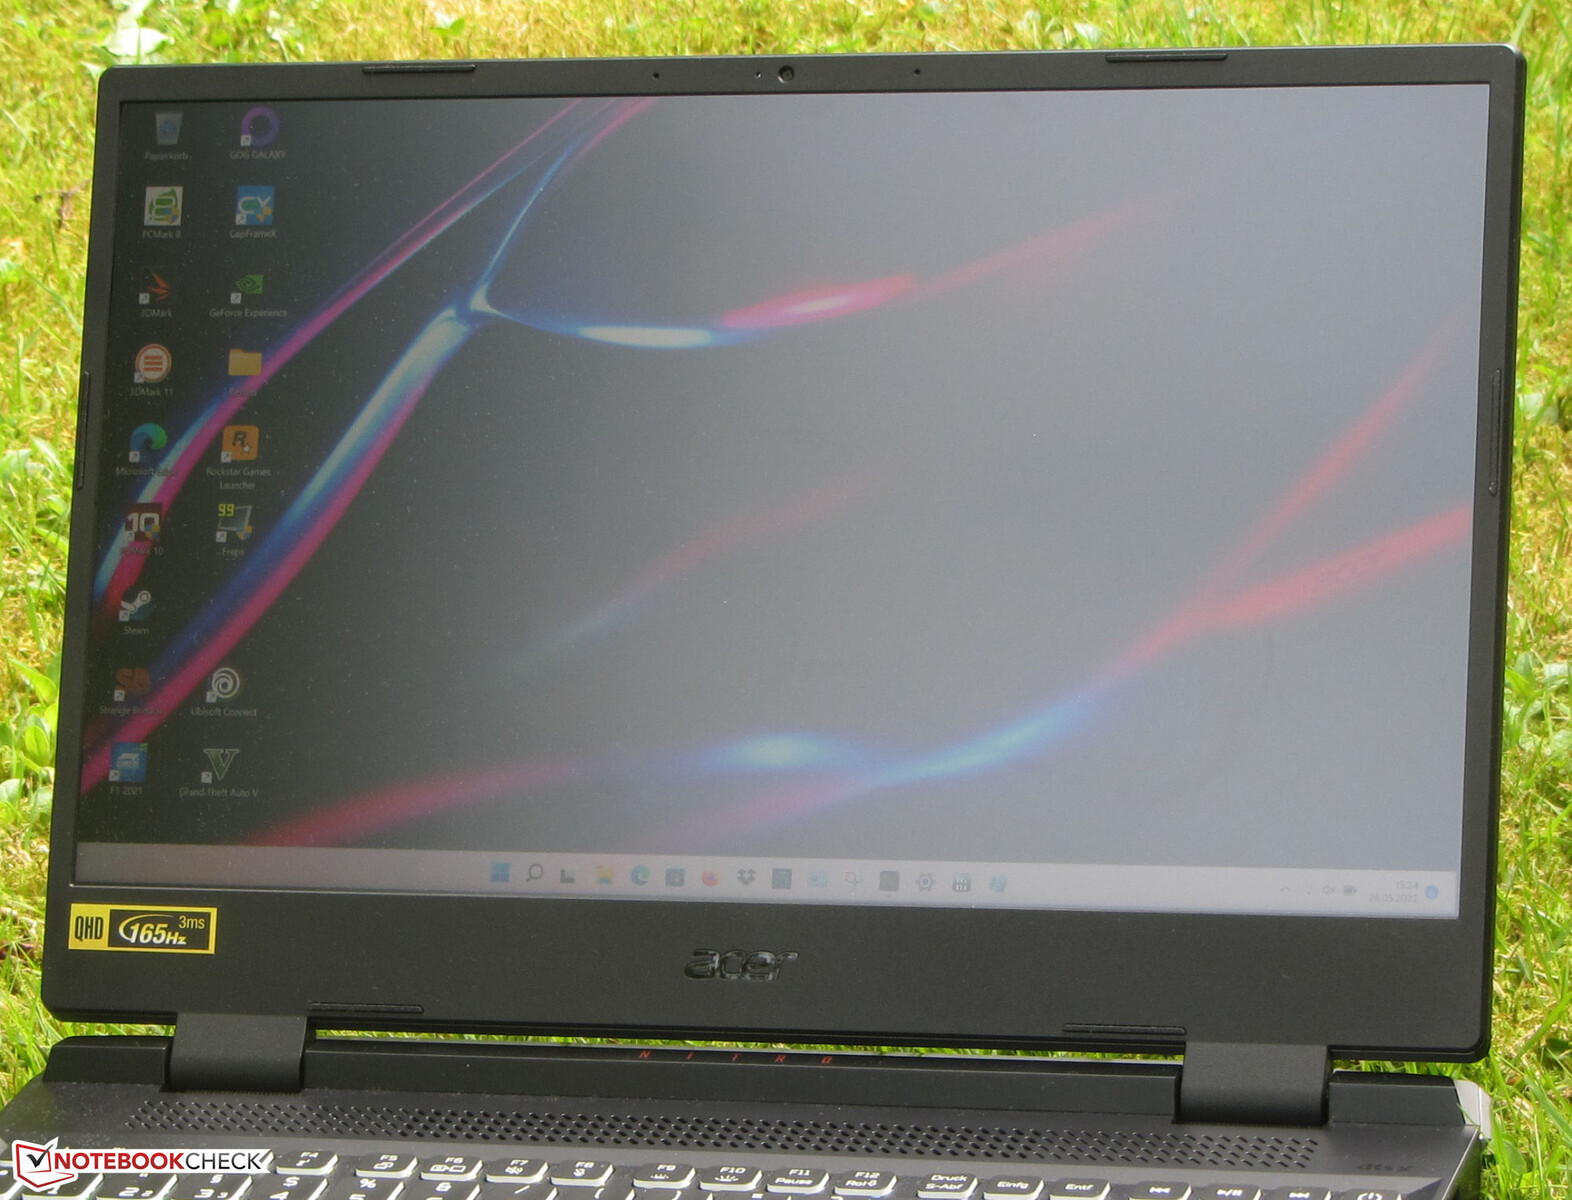
Display: Gaming notebook with QHD-Panel
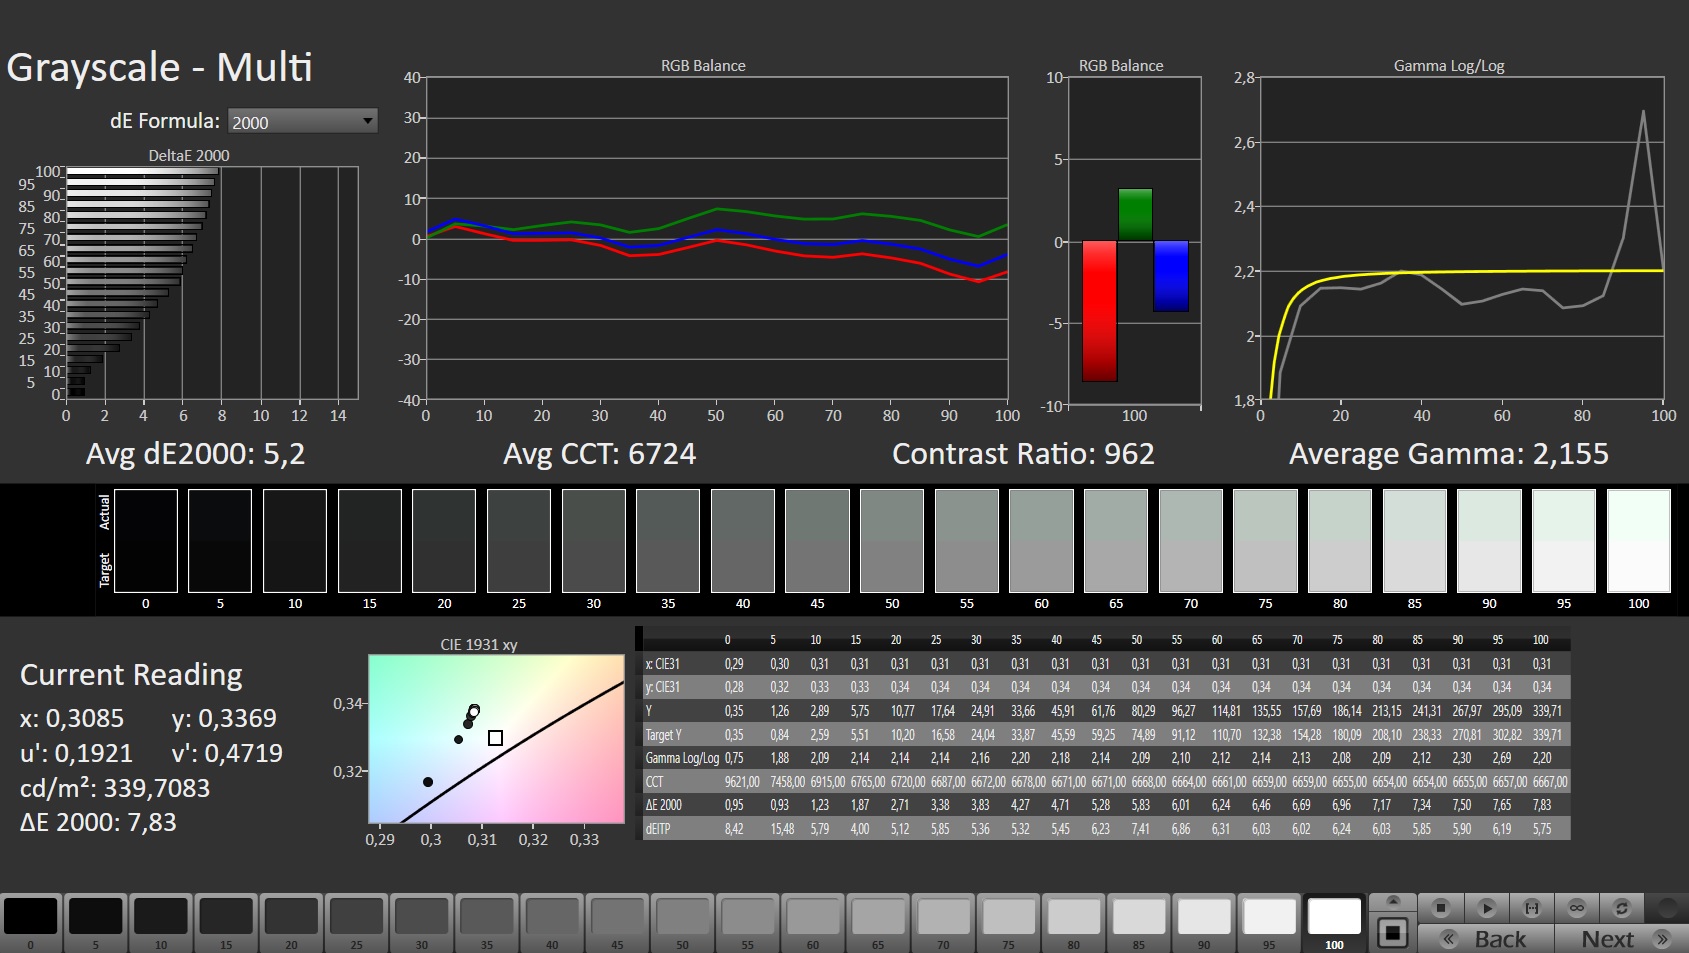
The brightness (303 cd/m²) and contrast ratio (1145:1) of the matte 15.6-inch screen (2560x1440) both meet the respective targets. A positive aspect: The inbuilt 165 Hz panel offers short response times and shows no PWM flickering.
| |||||||||||||||||||||||||
Brightness Distribution: 86 %
Center on Battery: 332 cd/m²
Contrast: 1145:1 (Black: 0.29 cd/m²)
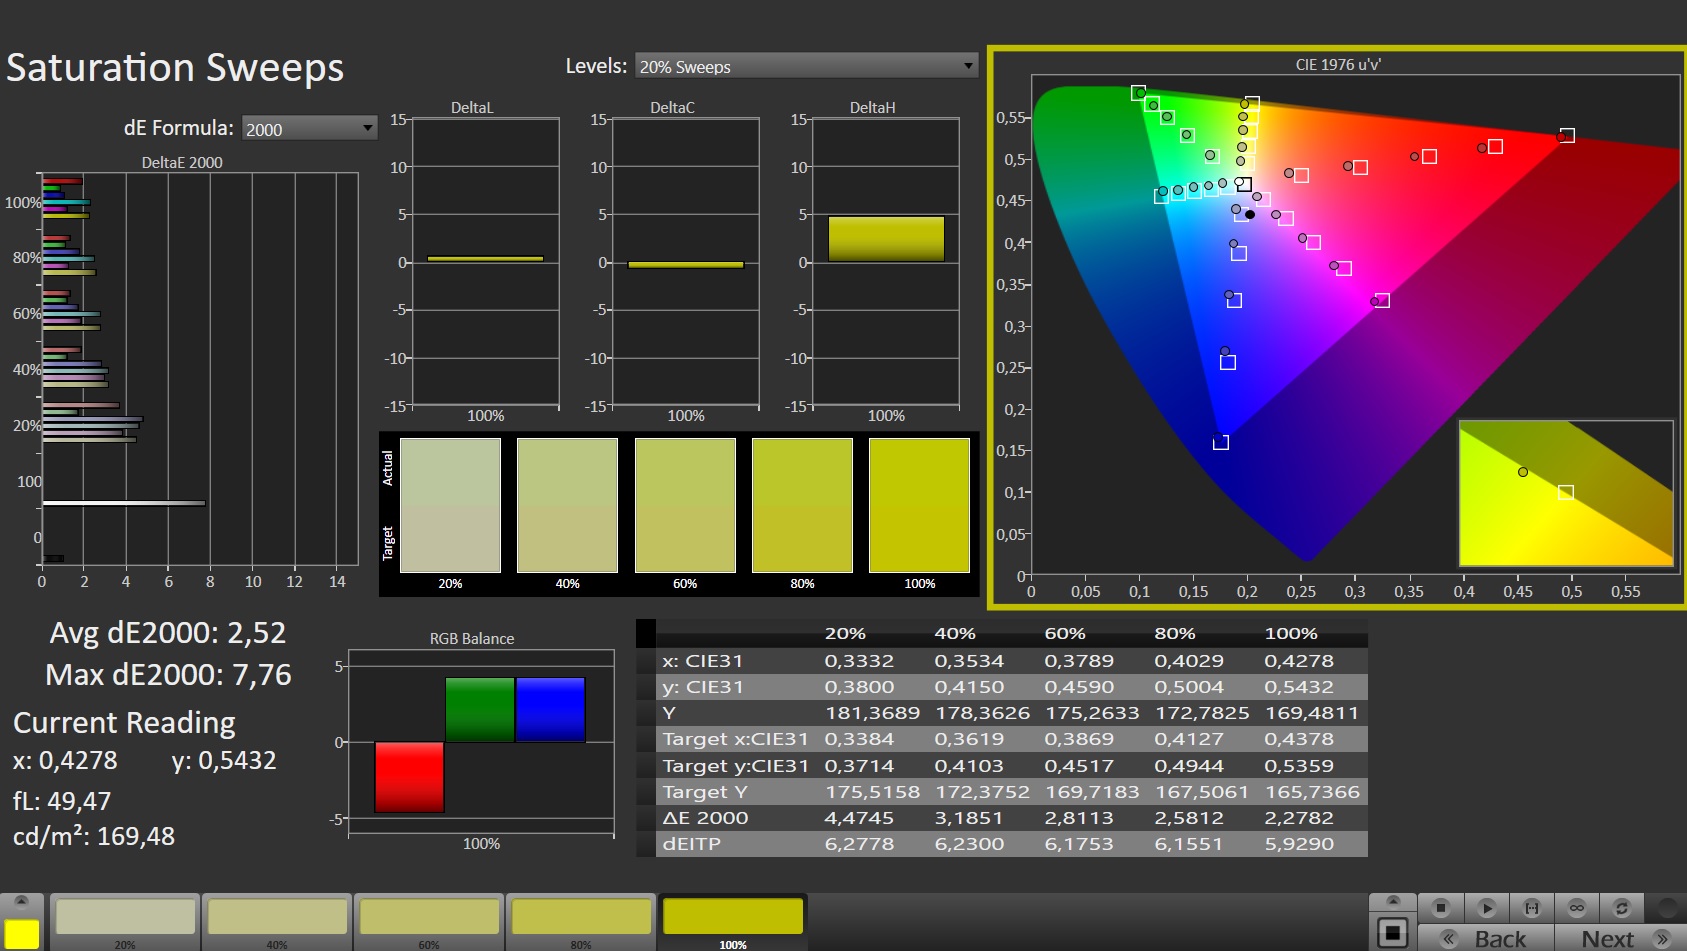
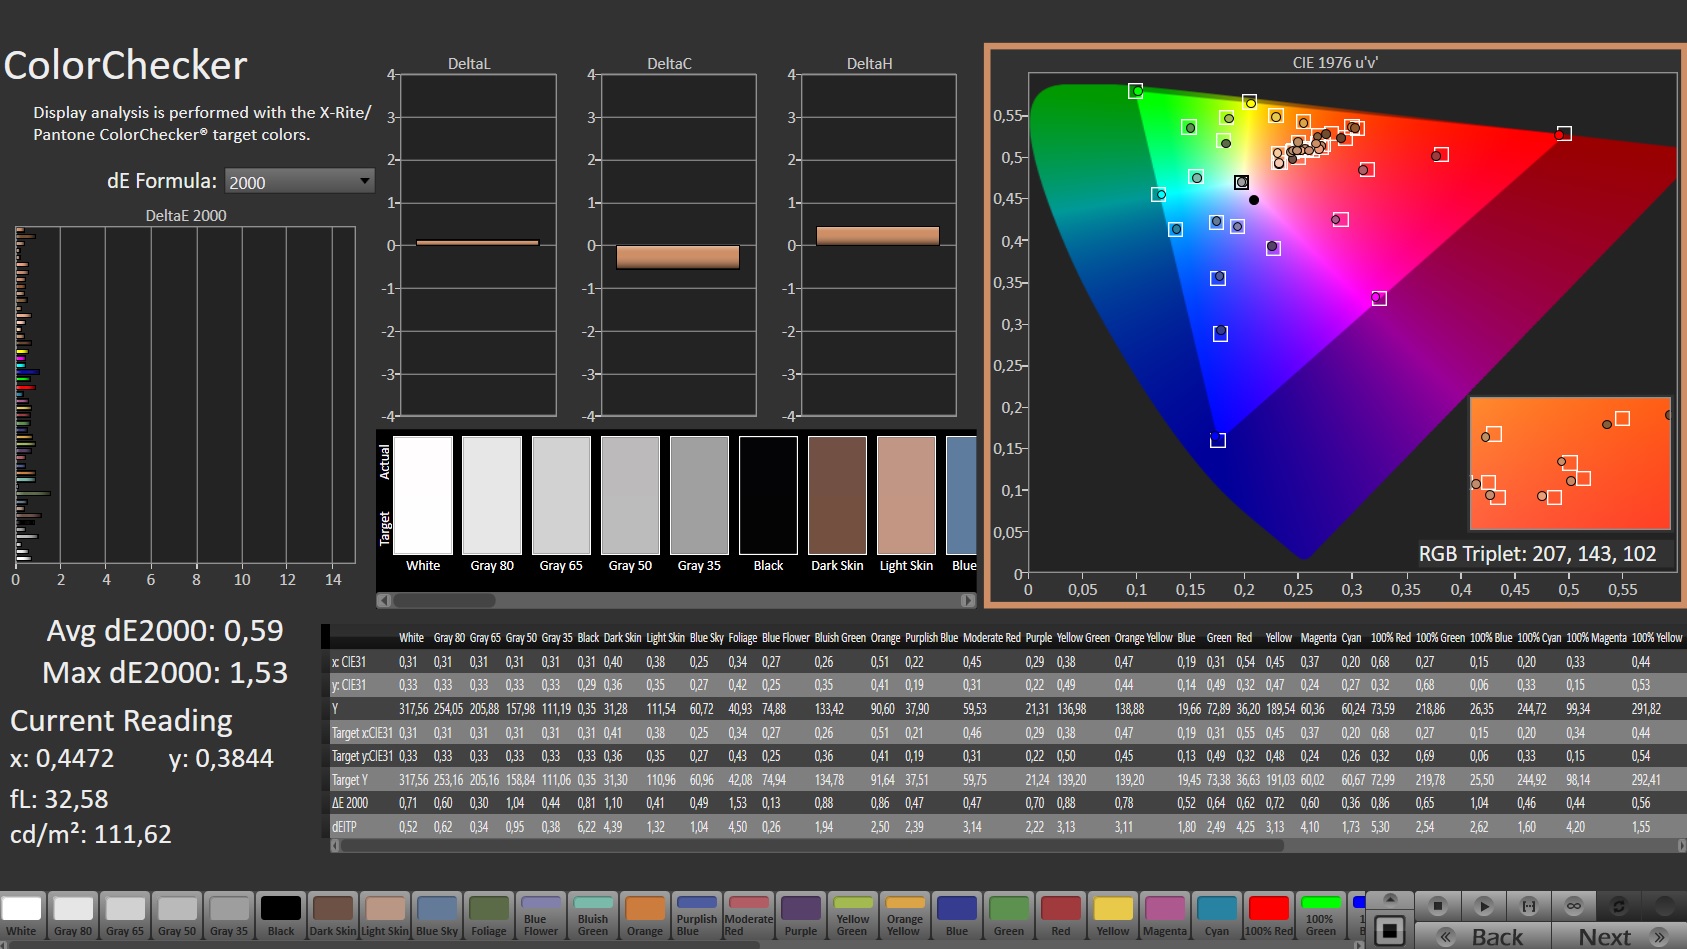
ΔE Color 3.61 | 0.5-29.43 Ø5, calibrated: 0.59
ΔE Greyscale 5.2 | 0.57-98 Ø5.3
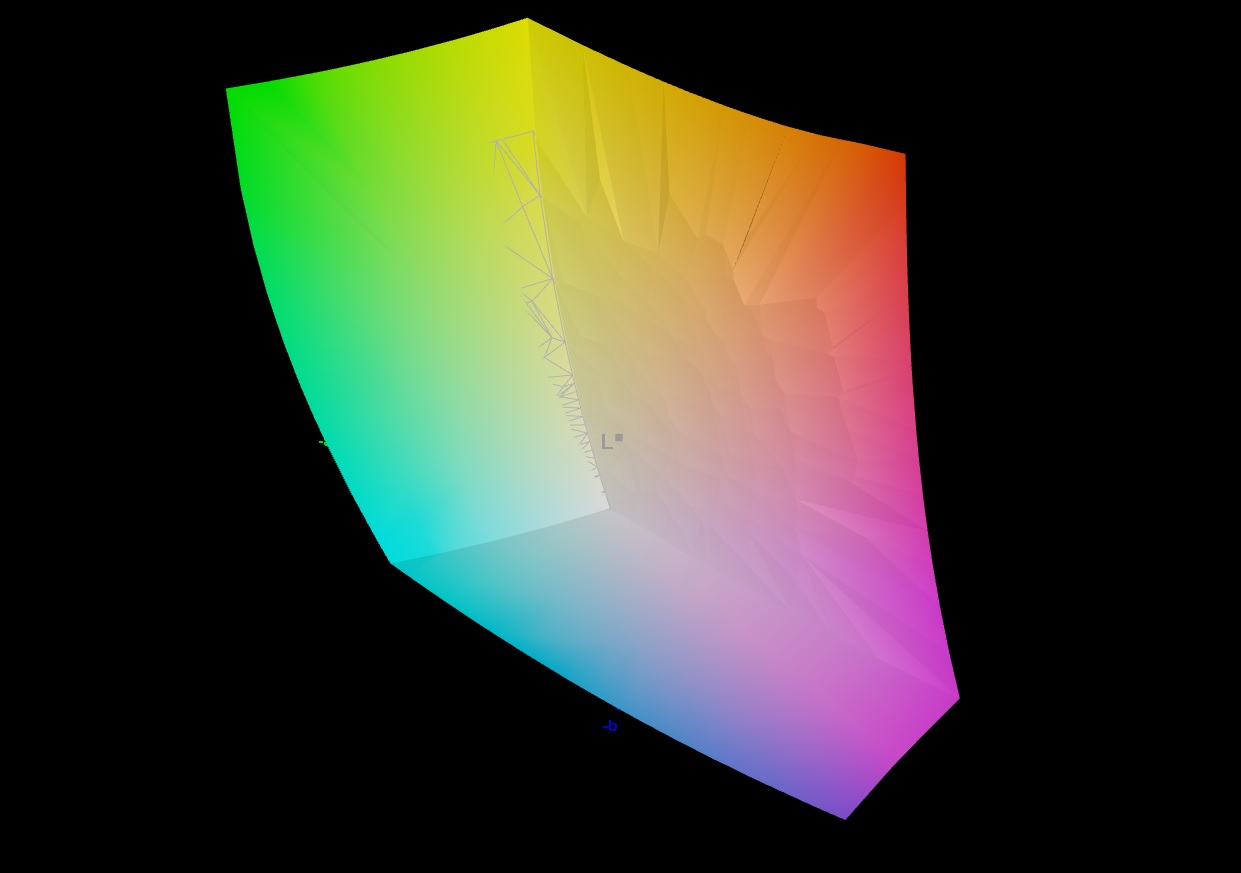
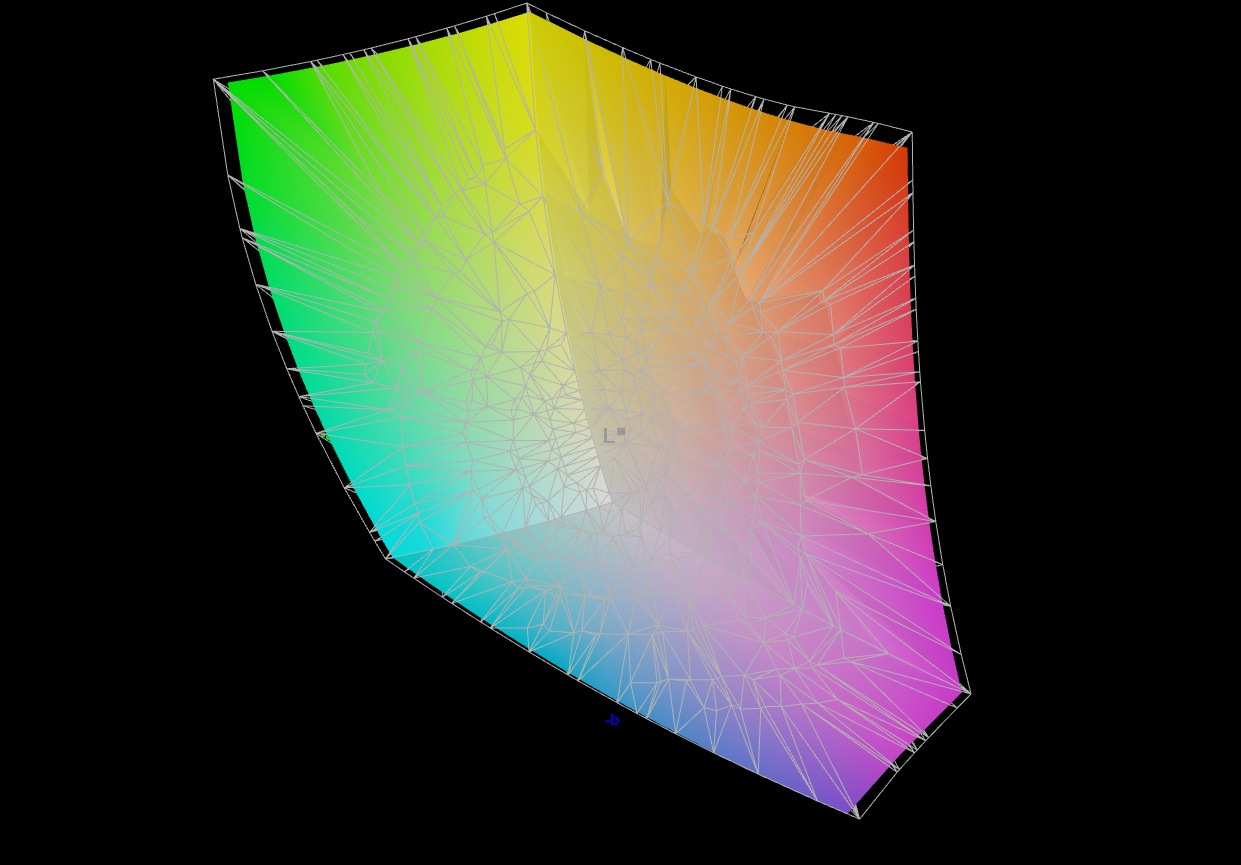
85.2% AdobeRGB 1998 (Argyll 2.2.0 3D)
99.8% sRGB (Argyll 2.2.0 3D)
95.6% Display P3 (Argyll 2.2.0 3D)
Gamma: 2.155
| Acer Nitro 5 AN515-58-72QR Chi Mei N156KME-GNA, IPS, 2560x1440, 15.60 | MSI Vector GP66 12UGS BOE NE156FHM-NZ3, IPS, 1920x1080, 15.60 | HP Omen 16-b1090ng BOE09E5, IPS, 2560x1440, 16.10 | Lenovo Legion 5 Pro 16 G7 i7 RTX 3070Ti NE160QDM-NY1, IPS, 2560x1600, 16.00 | |
|---|---|---|---|---|
| Display | -14% | -14% | -16% | |
| Display P3 Coverage | 95.6 | 70.1 -27% | 71 -26% | 68.7 -28% |
| sRGB Coverage | 99.8 | 99.5 0% | 97.9 -2% | 97.6 -2% |
| AdobeRGB 1998 Coverage | 85.2 | 72.1 -15% | 73.3 -14% | 70.9 -17% |
| Response Times | 35% | 8% | 7% | |
| Response Time Grey 50% / Grey 80% * | 15.7 ? | 5.8 ? 63% | 14.5 ? 8% | 17.6 ? -12% |
| Response Time Black / White * | 10.2 ? | 9.6 ? 6% | 9.4 ? 8% | 7.6 ? 25% |
| PWM Frequency | ||||
| Screen | -2% | -21% | 10% | |
| Brightness middle | 332 | 353.1 6% | 335 1% | 502 51% |
| Brightness | 303 | 325 7% | 319 5% | 491 62% |
| Brightness Distribution | 86 | 85 -1% | 90 5% | 91 6% |
| Black Level * | 0.29 | 0.38 -31% | 0.28 3% | 0.37 -28% |
| Contrast | 1145 | 929 -19% | 1196 4% | 1357 19% |
| Colorchecker dE 2000 * | 3.61 | 2.24 38% | 4.38 -21% | 2.7 25% |
| Colorchecker dE 2000 max. * | 7.71 | 5 35% | 9.48 -23% | 4.5 42% |
| Colorchecker dE 2000 calibrated * | 0.59 | 1.02 -73% | 1.33 -125% | 1.4 -137% |
| Greyscale dE 2000 * | 5.2 | 4 23% | 7 -35% | 2.7 48% |
| Gamma | 2.155 102% | 2.24 98% | 2.103 105% | 2.44 90% |
| CCT | 6724 97% | 6864 95% | 6244 104% | 6326 103% |
| Total Average (Program / Settings) | 6% /
1% | -9% /
-15% | 0% /
4% |
* ... smaller is better
The screen displays the colors quite decently out of the box and the slight color deviation is not perceptible. A calibration brings about significant improvements: The display can almost completely reproduce the sRGB (99.8%) and DCI-P3 (96%) color spaces, and 85% of the AdobeRGB color space is reproduced.

Display Response Times
| ↔ Response Time Black to White | ||
|---|---|---|
| 10.2 ms ... rise ↗ and fall ↘ combined | ↗ 6.1 ms rise | 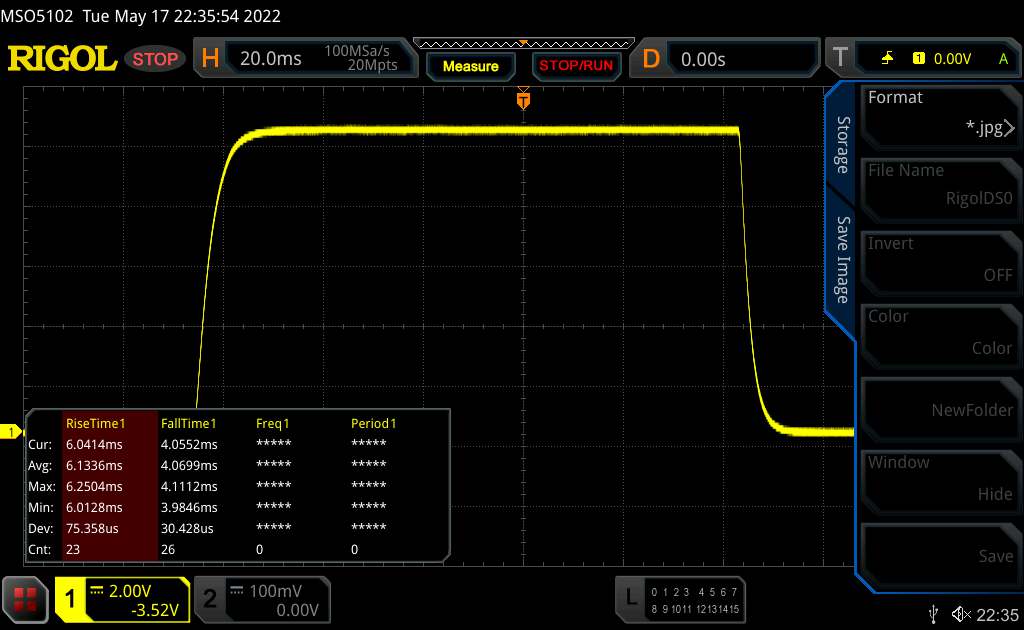 |
| ↘ 4.1 ms fall | ||
| The screen shows good response rates in our tests, but may be too slow for competitive gamers. In comparison, all tested devices range from 0.1 (minimum) to 240 (maximum) ms. » 23 % of all devices are better. This means that the measured response time is better than the average of all tested devices (21.5 ms). | ||
| ↔ Response Time 50% Grey to 80% Grey | ||
| 15.7 ms ... rise ↗ and fall ↘ combined | ↗ 7.5 ms rise | 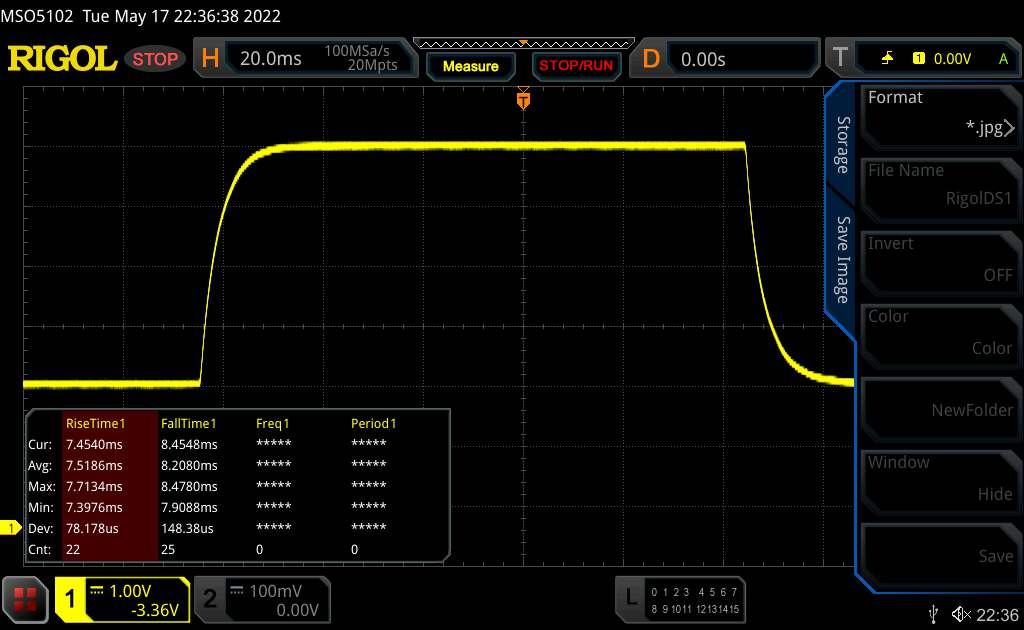 |
| ↘ 8.2 ms fall | ||
| The screen shows good response rates in our tests, but may be too slow for competitive gamers. In comparison, all tested devices range from 0.2 (minimum) to 636 (maximum) ms. » 25 % of all devices are better. This means that the measured response time is better than the average of all tested devices (33.7 ms). | ||
Screen Flickering / PWM (Pulse-Width Modulation)
| Screen flickering / PWM not detected | 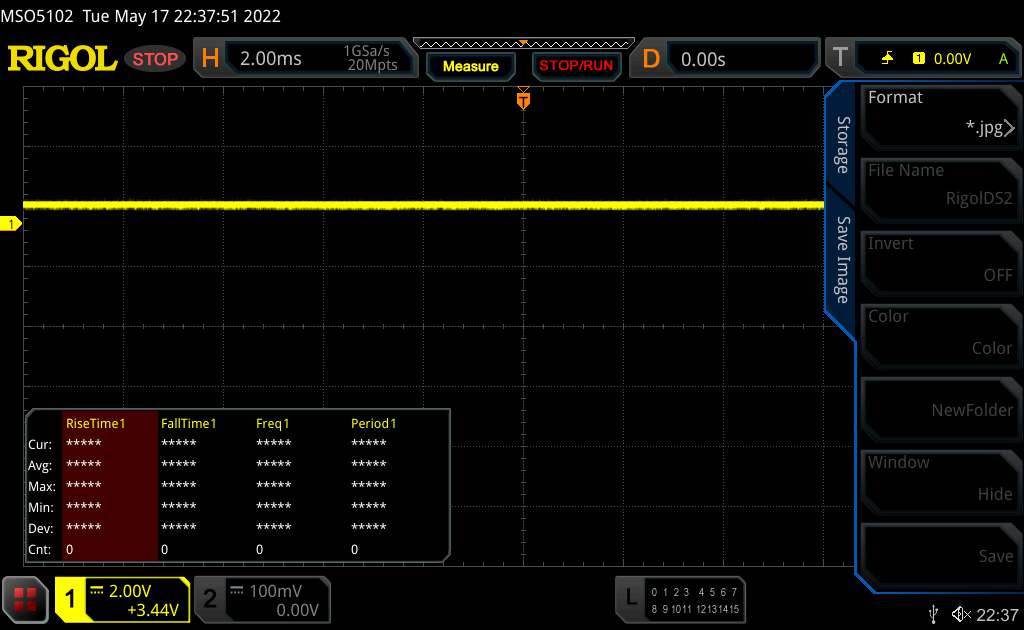 | ||
In comparison: 53 % of all tested devices do not use PWM to dim the display. If PWM was detected, an average of 17900 (minimum: 5 - maximum: 3846000) Hz was measured. | |||
The viewing-angle stable IPS panel can be read from any position. Outdoor reading of the display is possible when the sun does not shine too brightly.

Performance: Nitro laptop with Ampere and Alder Lake
With the Nitro 5, Acer has a 15.6-inch gaming notebook in its lineup that runs every current game smoothly.

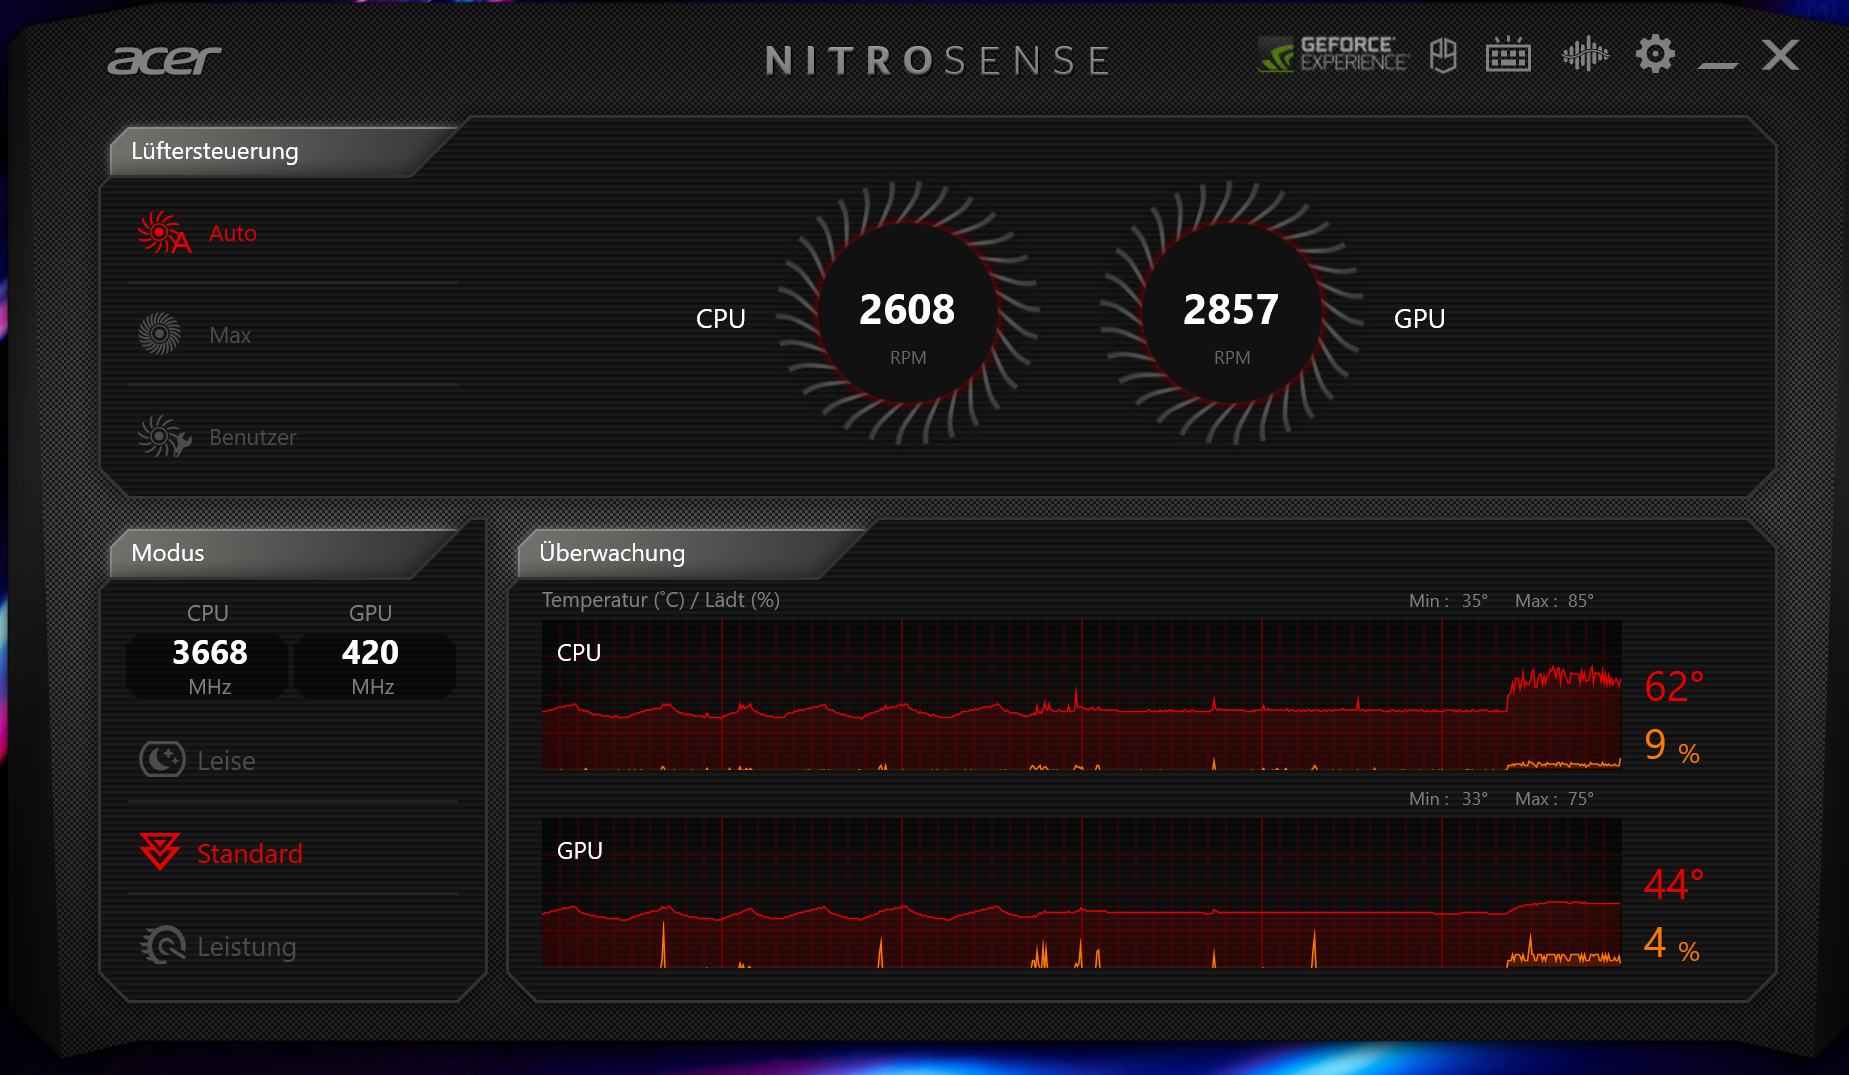
Testing Conditions
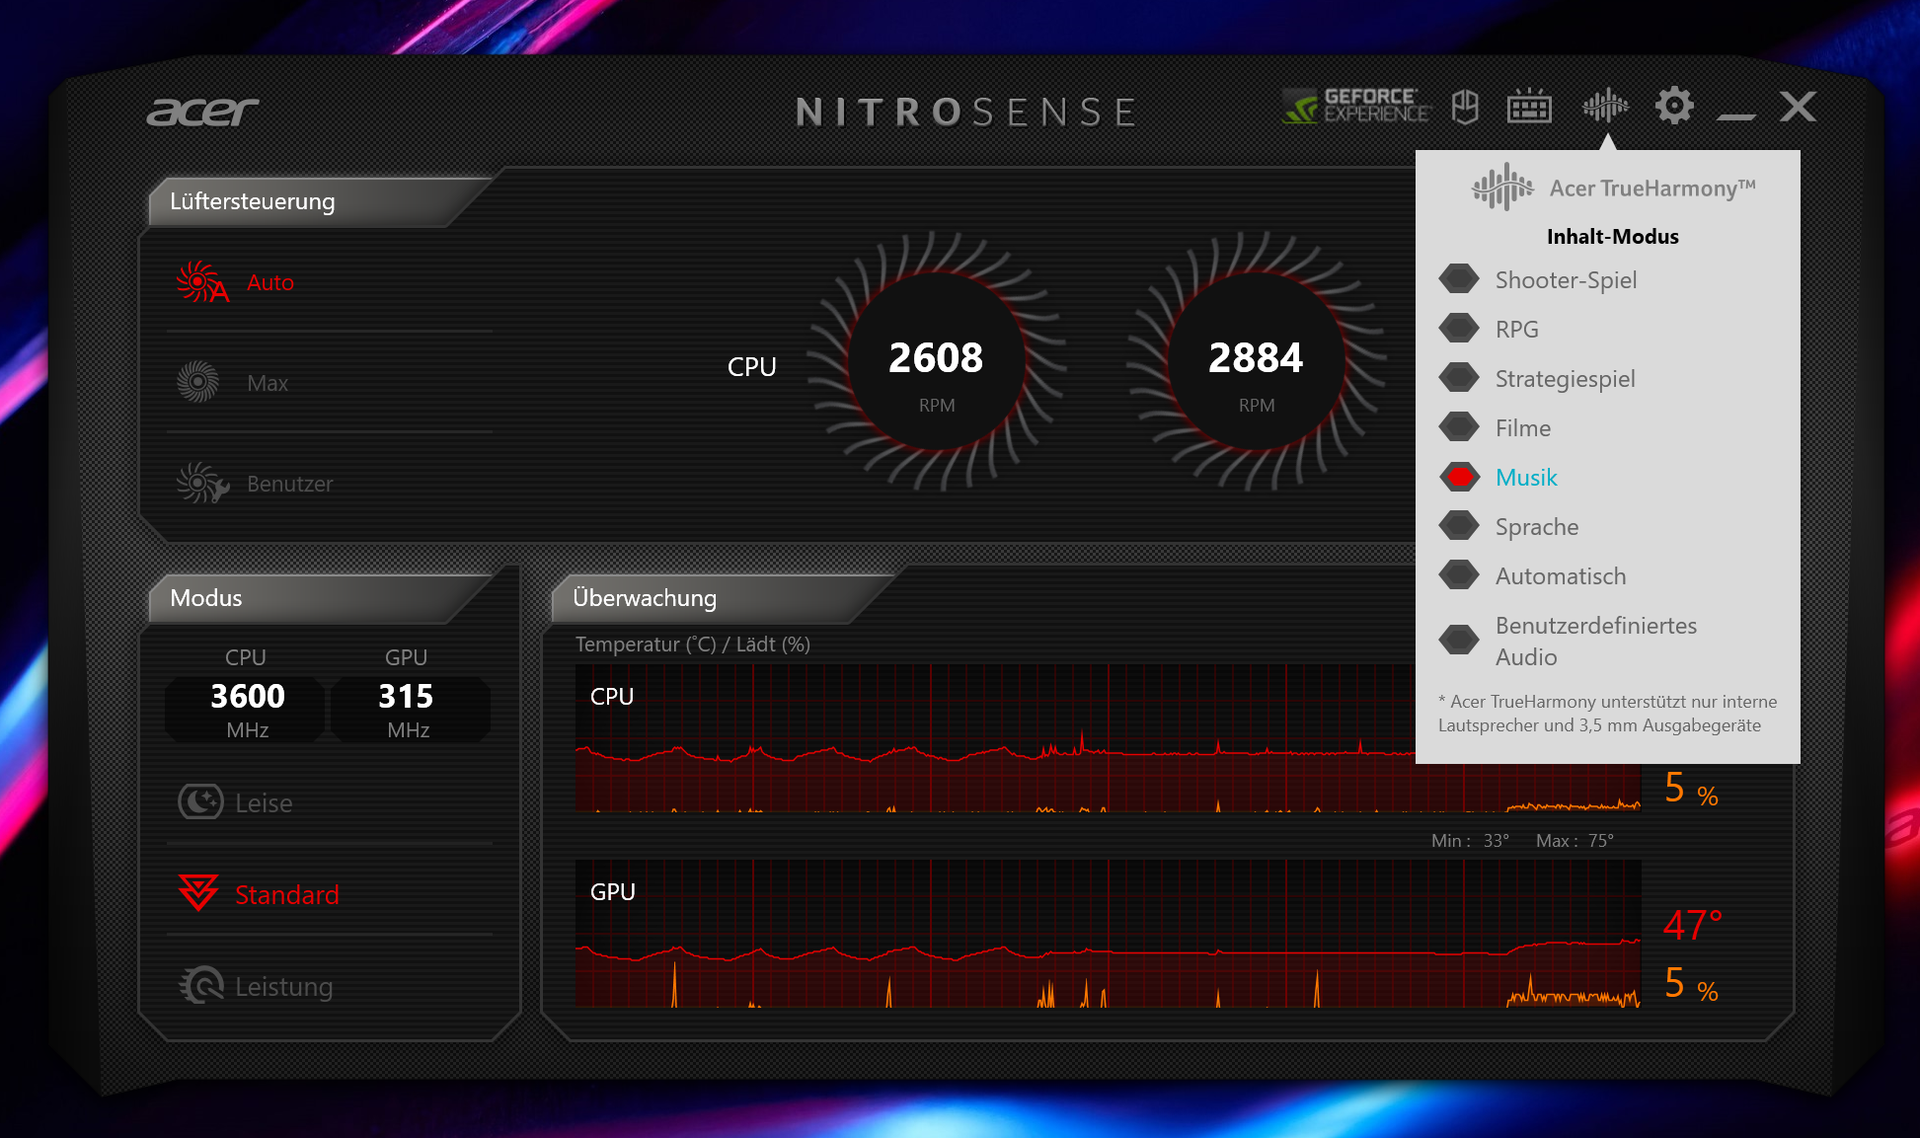
The Acer laptop has three manufacturer-specific performance profiles ("Performance", "Standard", "Quiet") from which the user can choose via the preinstalled NitroSense software. The "Performance" profile can only be used in mains operation. The battery tests were carried out under the "Quiet" profile and the benchmarks under the "Standard" profile. Automatic fan control was also used.
| Standard | Performance | Quiet | |
|---|---|---|---|
| Power Limit 1 | 80 Watt | 95 Watt | 80 Watt |
| Power Limit 2 | 115 Watt | 115 Watt | 115 Watt |
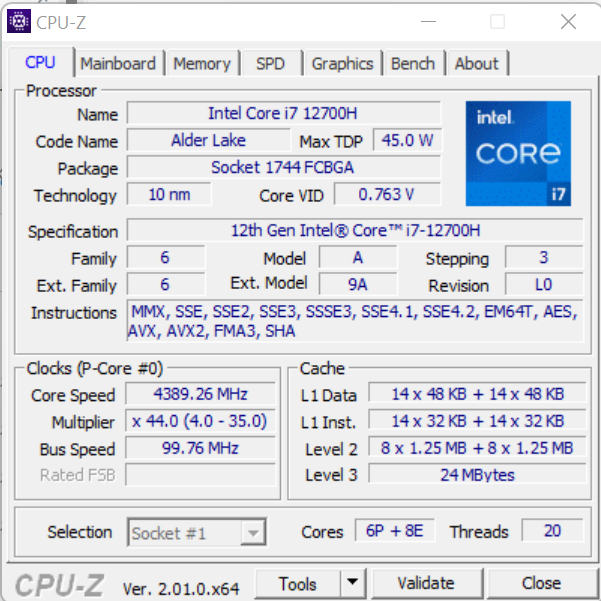
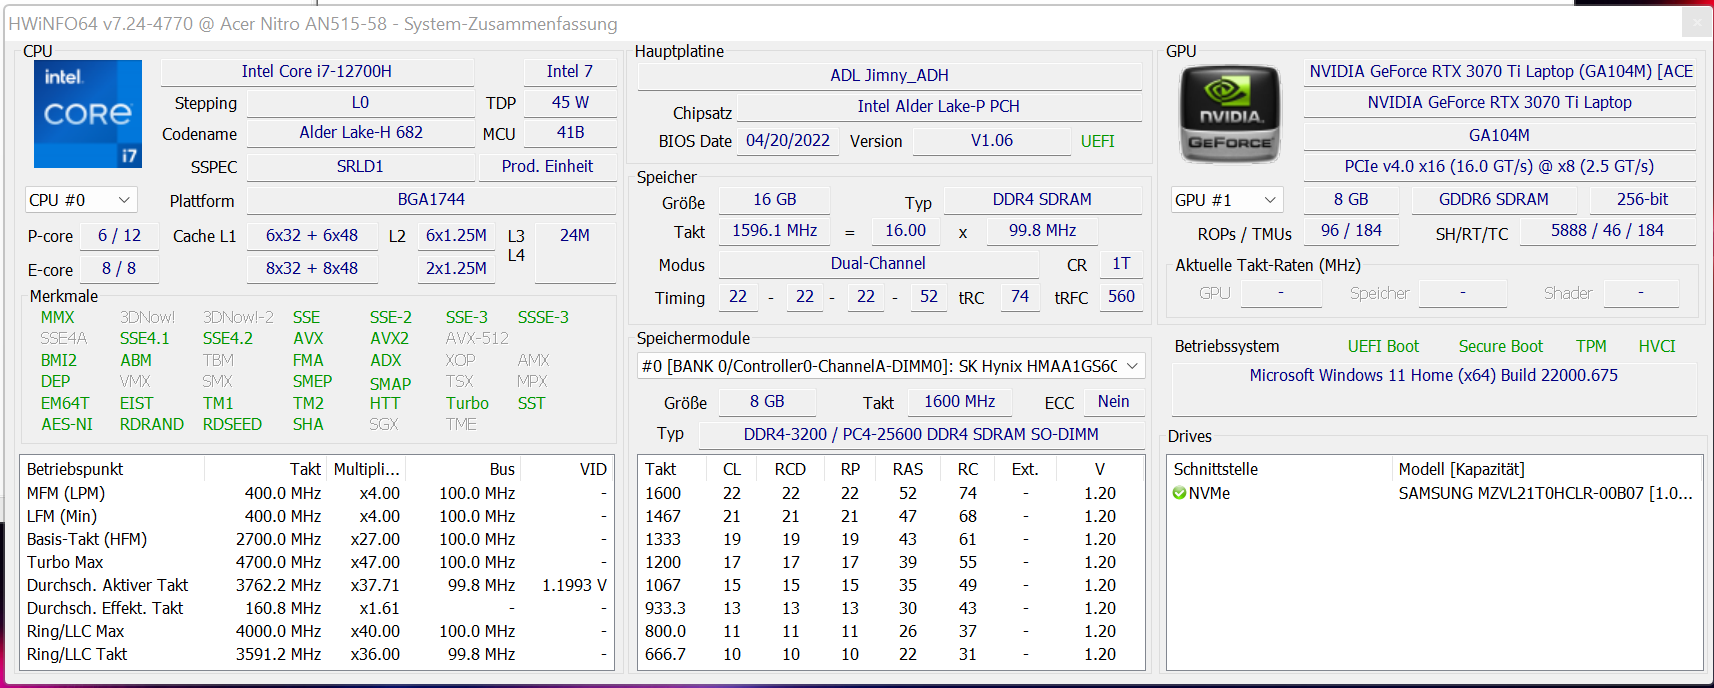
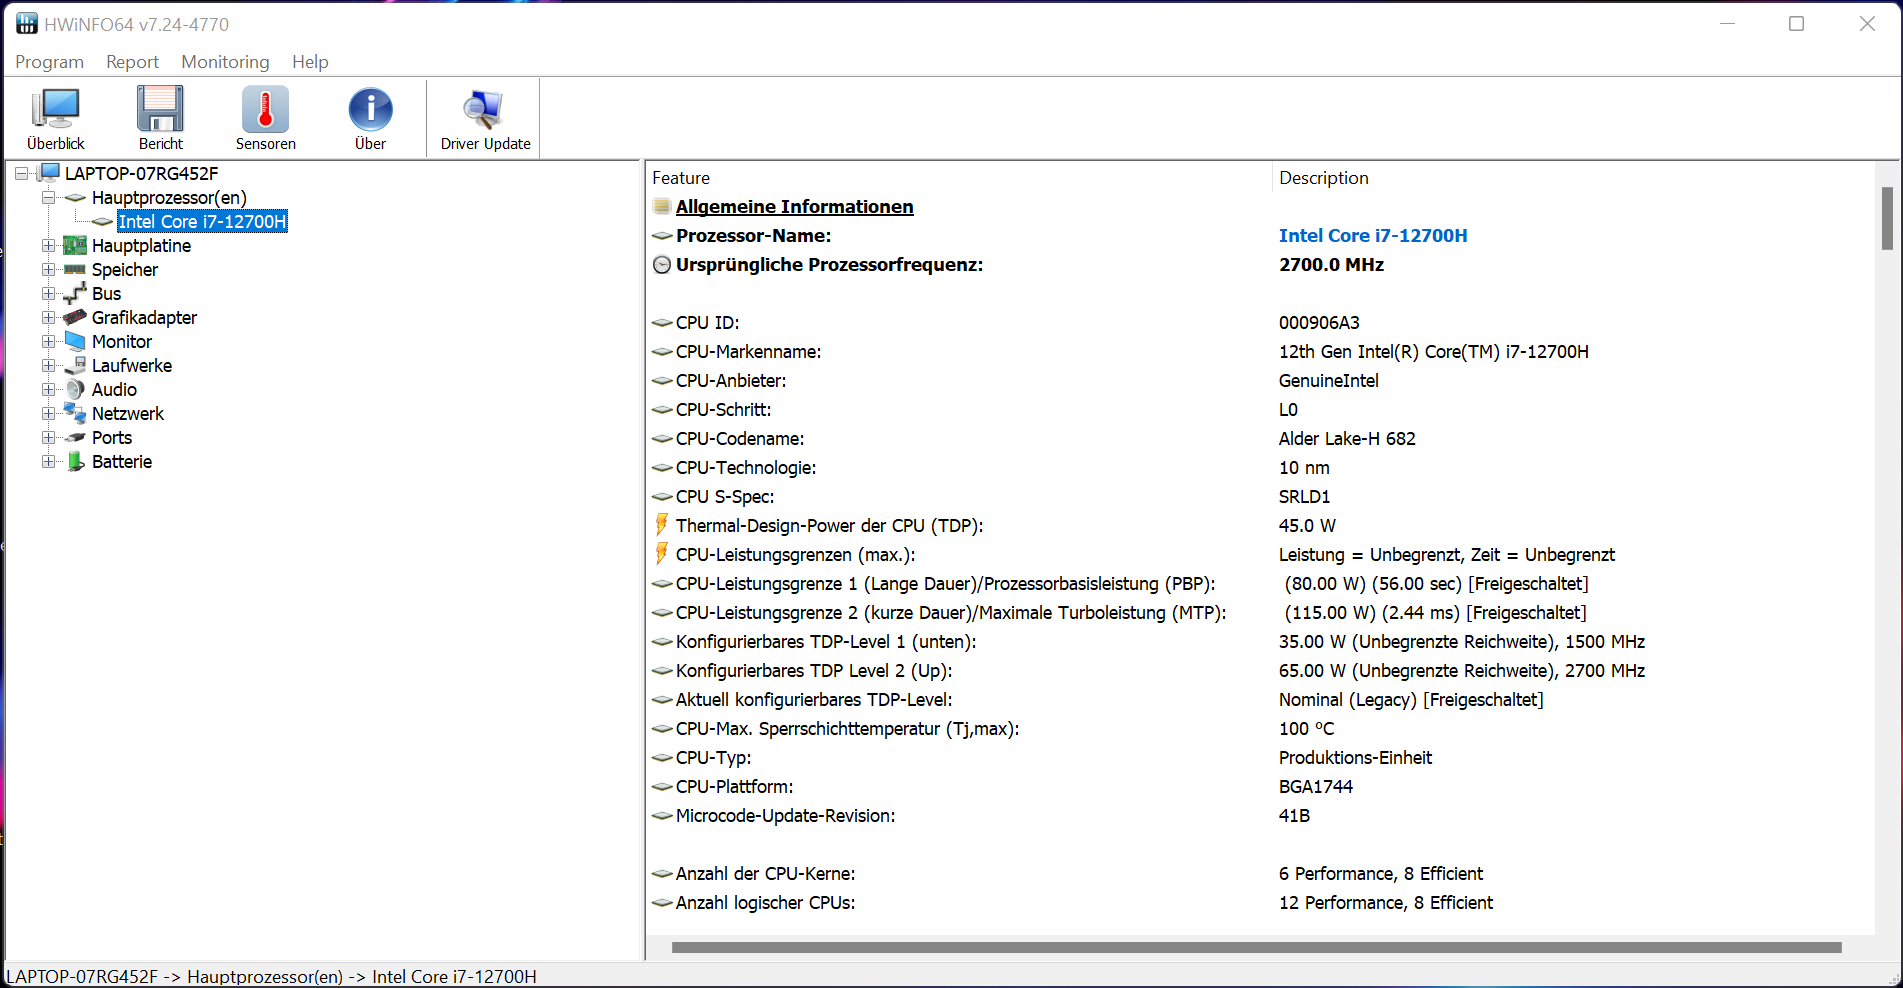
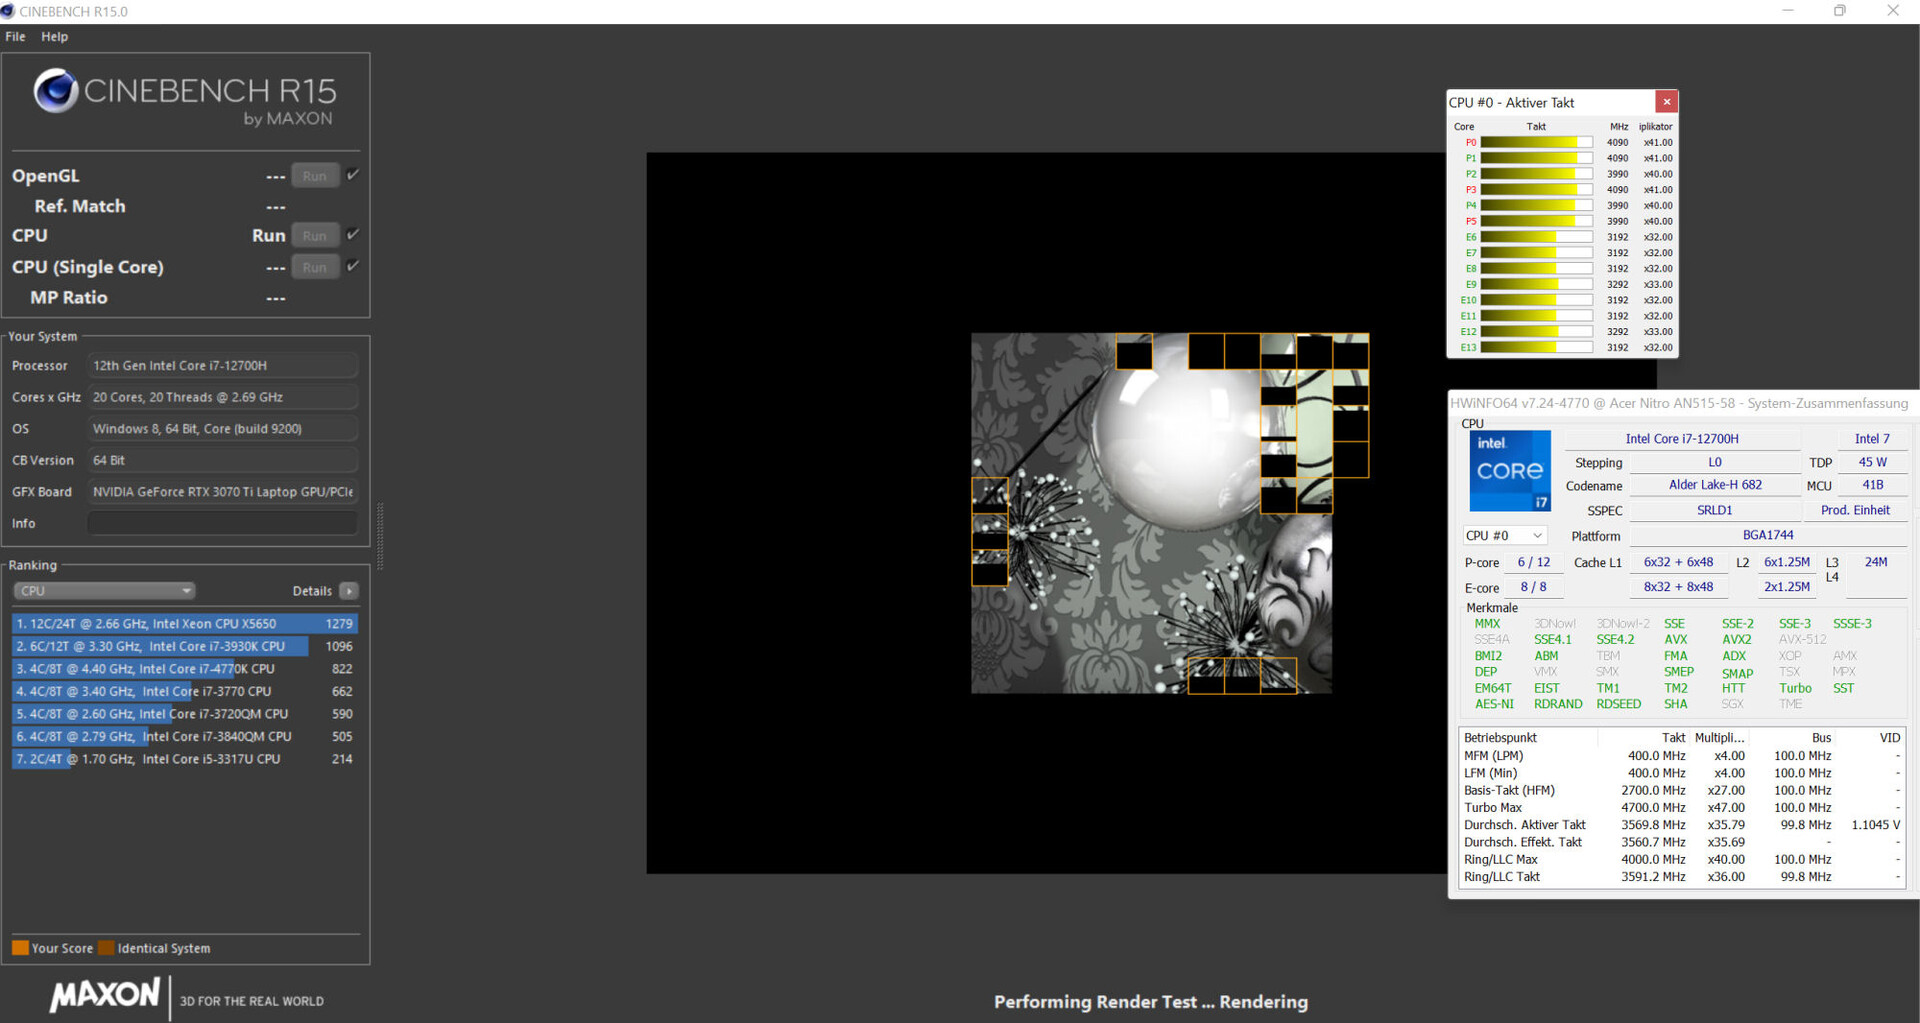
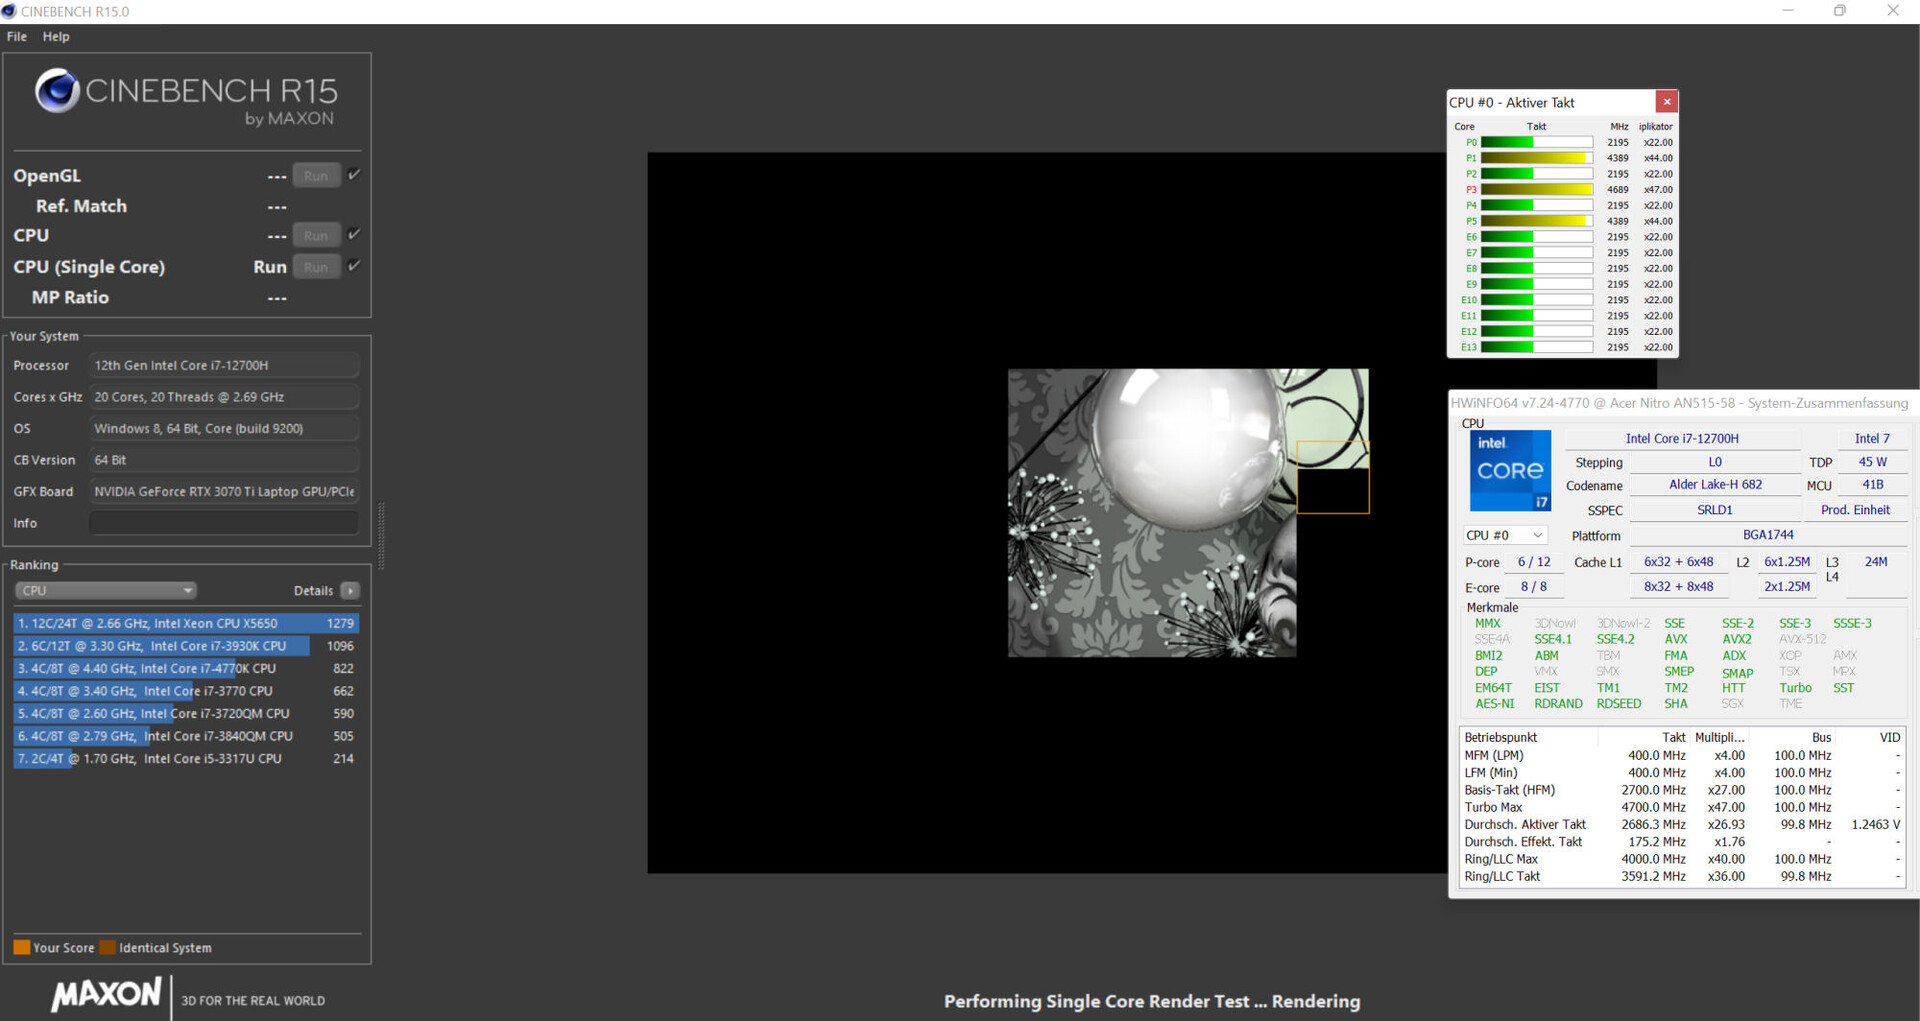
Processor
The Core i7-12700H processor (Alder Lake) consists of six performance cores (hyperthreading, 2.4 to 4.7 GHz) and eight efficiency cores (no hyperthreading, 1.8 to 3.5 GHz). In total, this results in 20 logical CPU cores.
The multi-thread test of the Cinebench R15 benchmark was run briefly at high clock speeds (P cores: 4 to 4.1 GHz, E cores: 3.2 GHz) before dropping slightly (P cores: 3.5 to 3.9 GHz, E cores: 2.9 to 3.1 GHz). The single-thread test was carried out at speeds of 2.2 to 4.7 GHz (P cores) and 1.2 to 3.5 GHz (E cores). Clock speeds were significantly lower in battery mode.
Overall, the benchmark results are mixed. In terms of multi-thread performance, the Nitro lags behind the Lenovo Legion 5 Pro 16 G7, which is also equipped with a 12700H processor.
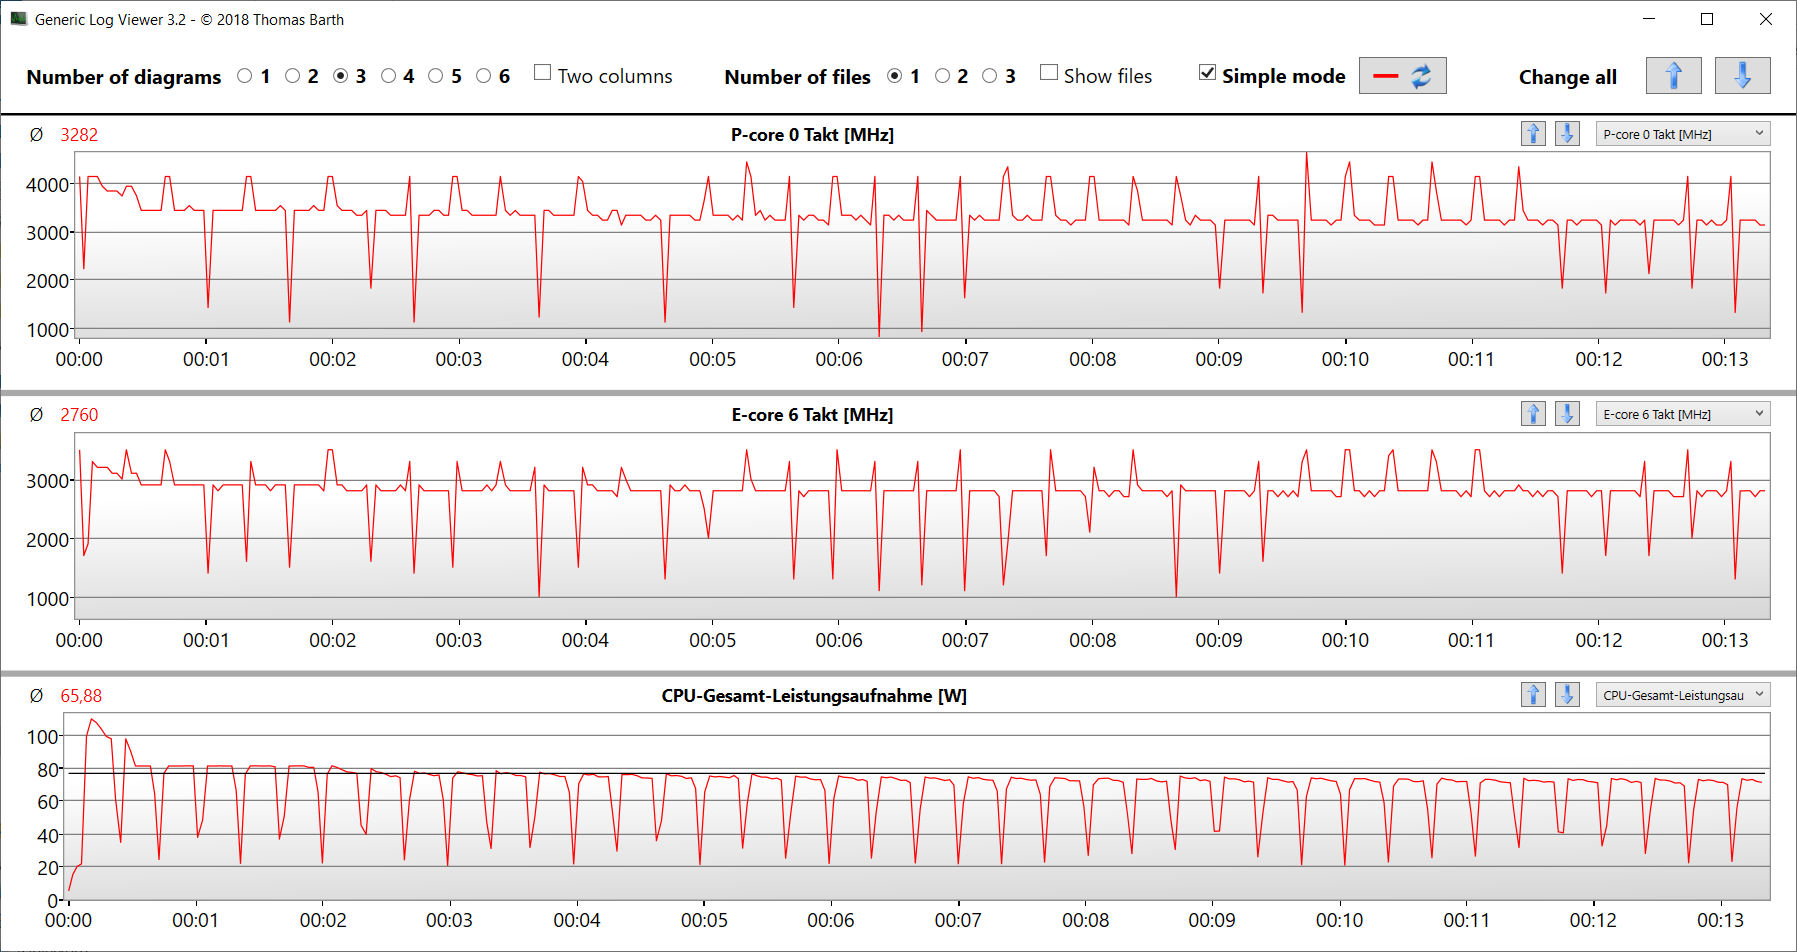
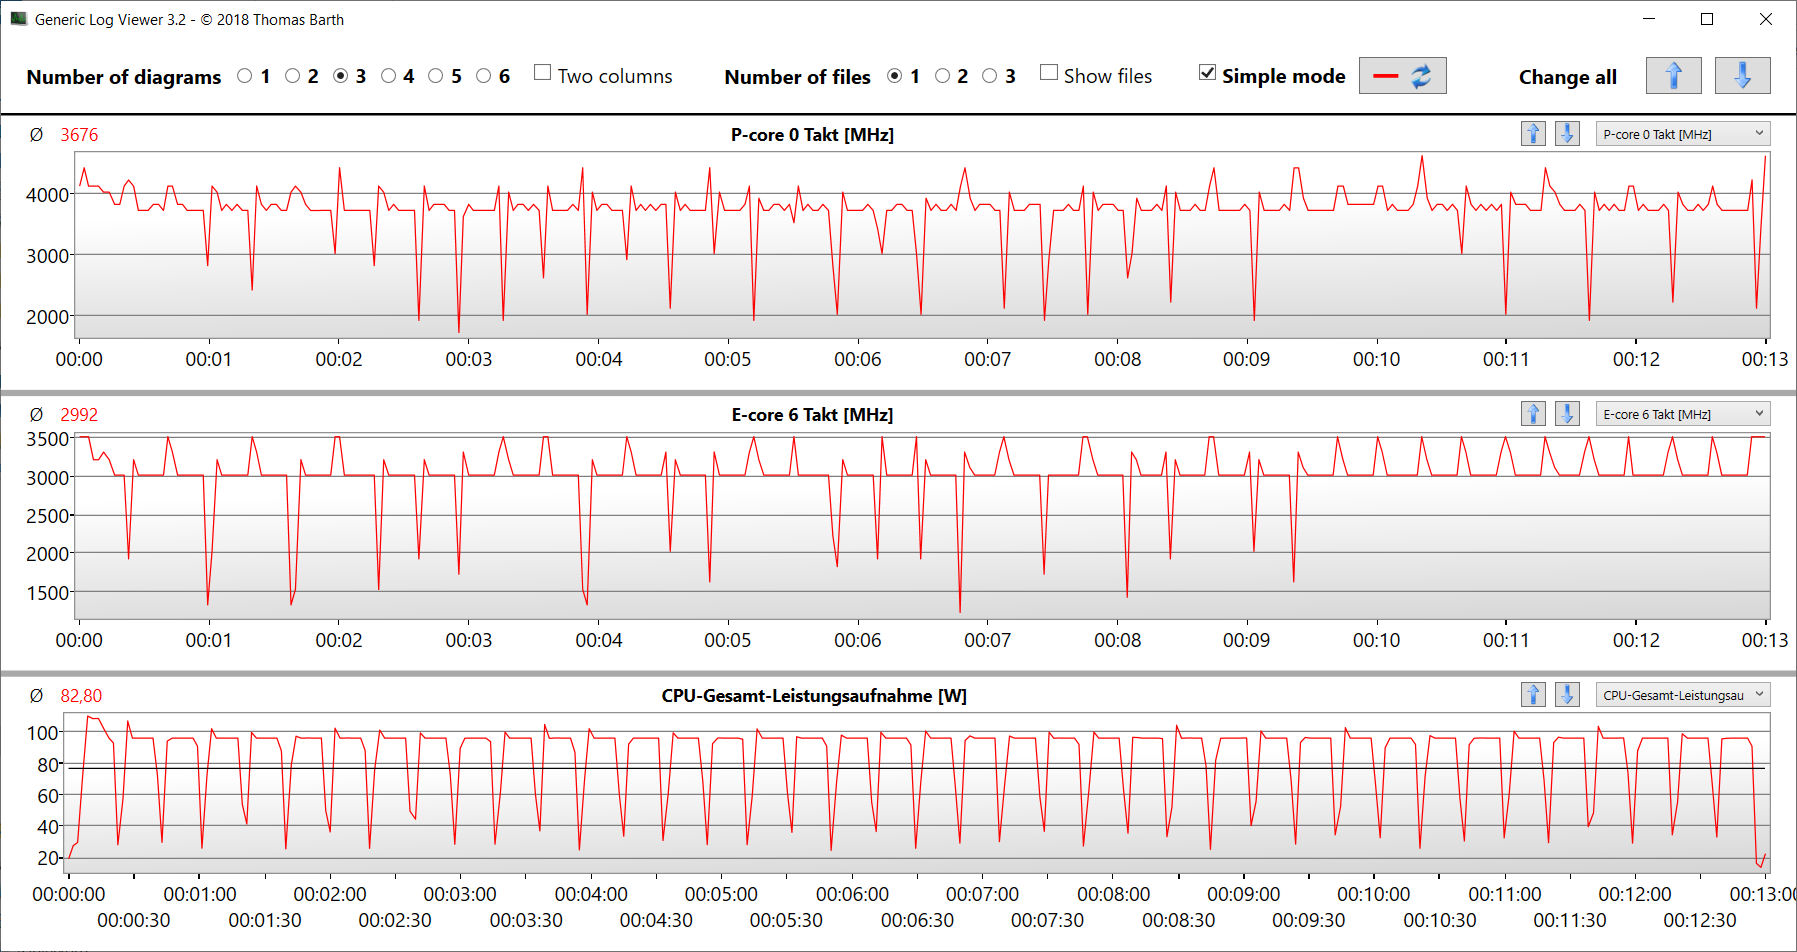
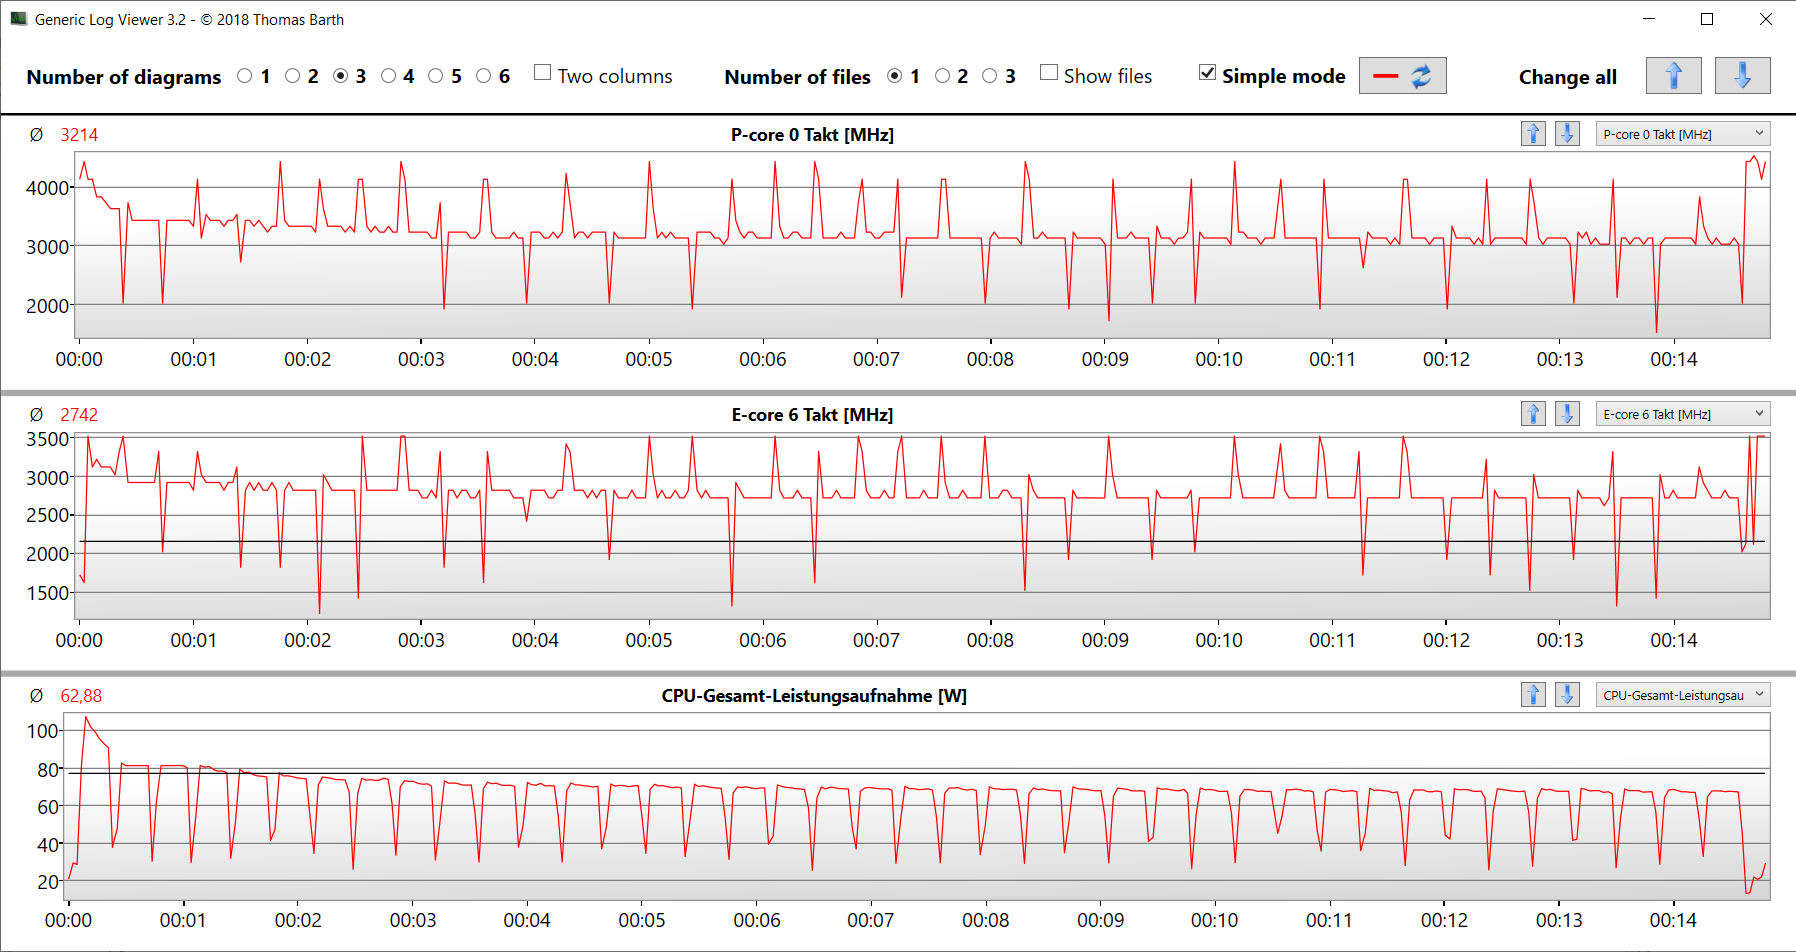
Whether the CPU Turbo is used constantly in mains operation is tested by running the multithread test of the Cinebench R15 benchmark in a loop. In this case, high clock rates can only be maintained for a short time. Afterwards, both the P and E cores operate at speeds in the mid Turbo range. The "Performance" profile causes a slight increase in computing power.
Cinebench R15 Multi Loop
| CPU Performance Rating - Percent | |
| Average of class Gaming | |
| Lenovo Legion 5 Pro 16 G7 i7 RTX 3070Ti | |
| MSI Vector GP66 12UGS | |
| HP Omen 16-b1090ng | |
| Acer Nitro 5 AN515-58-72QR | |
| Acer Nitro 5 AN515-58-72QR | |
| Average Intel Core i7-12700H | |
| Acer Nitro 5 AN515-58-72QR | |
| HP Omen 16-c0077ng -1! | |
| Cinebench R23 | |
| Multi Core | |
| Average of class Gaming (2435 - 34613, n=232, last 2 years) | |
| Lenovo Legion 5 Pro 16 G7 i7 RTX 3070Ti | |
| Acer Nitro 5 AN515-58-72QR (Leistung) | |
| MSI Vector GP66 12UGS | |
| Acer Nitro 5 AN515-58-72QR | |
| Acer Nitro 5 AN515-58-72QR (Leise) | |
| HP Omen 16-b1090ng | |
| Average Intel Core i7-12700H (4032 - 19330, n=63) | |
| HP Omen 16-c0077ng | |
| Single Core | |
| MSI Vector GP66 12UGS | |
| Lenovo Legion 5 Pro 16 G7 i7 RTX 3070Ti | |
| Acer Nitro 5 AN515-58-72QR | |
| Average of class Gaming (527 - 2235, n=230, last 2 years) | |
| Acer Nitro 5 AN515-58-72QR (Leise) | |
| HP Omen 16-b1090ng | |
| Acer Nitro 5 AN515-58-72QR (Leistung) | |
| Average Intel Core i7-12700H (778 - 1826, n=62) | |
| HP Omen 16-c0077ng | |
| Cinebench R20 | |
| CPU (Multi Core) | |
| Average of class Gaming (930 - 13769, n=230, last 2 years) | |
| Lenovo Legion 5 Pro 16 G7 i7 RTX 3070Ti | |
| MSI Vector GP66 12UGS | |
| Acer Nitro 5 AN515-58-72QR (Leistung) | |
| Acer Nitro 5 AN515-58-72QR | |
| Acer Nitro 5 AN515-58-72QR (Leise) | |
| Average Intel Core i7-12700H (1576 - 7407, n=63) | |
| HP Omen 16-b1090ng | |
| HP Omen 16-c0077ng | |
| CPU (Single Core) | |
| MSI Vector GP66 12UGS | |
| Average of class Gaming (169 - 855, n=230, last 2 years) | |
| Lenovo Legion 5 Pro 16 G7 i7 RTX 3070Ti | |
| HP Omen 16-b1090ng | |
| Acer Nitro 5 AN515-58-72QR | |
| Acer Nitro 5 AN515-58-72QR (Leistung) | |
| Average Intel Core i7-12700H (300 - 704, n=63) | |
| Acer Nitro 5 AN515-58-72QR (Leise) | |
| HP Omen 16-c0077ng | |
| Cinebench R15 | |
| CPU Multi 64Bit | |
| Average of class Gaming (400 - 5663, n=235, last 2 years) | |
| Lenovo Legion 5 Pro 16 G7 i7 RTX 3070Ti | |
| HP Omen 16-b1090ng | |
| Acer Nitro 5 AN515-58-72QR | |
| Average Intel Core i7-12700H (1379 - 2916, n=69) | |
| Acer Nitro 5 AN515-58-72QR (Leise) | |
| Acer Nitro 5 AN515-58-72QR (Leistung) | |
| MSI Vector GP66 12UGS | |
| HP Omen 16-c0077ng | |
| CPU Single 64Bit | |
| MSI Vector GP66 12UGS | |
| Average of class Gaming (79.2 - 318, n=234, last 2 years) | |
| Lenovo Legion 5 Pro 16 G7 i7 RTX 3070Ti | |
| Acer Nitro 5 AN515-58-72QR | |
| HP Omen 16-b1090ng | |
| Acer Nitro 5 AN515-58-72QR (Leise) | |
| Acer Nitro 5 AN515-58-72QR (Leistung) | |
| Average Intel Core i7-12700H (113 - 263, n=64) | |
| HP Omen 16-c0077ng | |
| Blender - v2.79 BMW27 CPU | |
| HP Omen 16-c0077ng | |
| Average Intel Core i7-12700H (168 - 732, n=62) | |
| Acer Nitro 5 AN515-58-72QR (Leise) | |
| Acer Nitro 5 AN515-58-72QR | |
| Average of class Gaming (87 - 1259, n=228, last 2 years) | |
| MSI Vector GP66 12UGS | |
| Acer Nitro 5 AN515-58-72QR (Leistung) | |
| HP Omen 16-b1090ng | |
| Lenovo Legion 5 Pro 16 G7 i7 RTX 3070Ti | |
| 7-Zip 18.03 | |
| 7z b 4 | |
| Average of class Gaming (11386 - 140932, n=229, last 2 years) | |
| HP Omen 16-b1090ng | |
| Lenovo Legion 5 Pro 16 G7 i7 RTX 3070Ti | |
| MSI Vector GP66 12UGS | |
| Average Intel Core i7-12700H (22844 - 73067, n=62) | |
| Acer Nitro 5 AN515-58-72QR | |
| Acer Nitro 5 AN515-58-72QR (Leise) | |
| Acer Nitro 5 AN515-58-72QR (Leistung) | |
| 7z b 4 -mmt1 | |
| Average of class Gaming (2685 - 7581, n=229, last 2 years) | |
| MSI Vector GP66 12UGS | |
| HP Omen 16-b1090ng | |
| Lenovo Legion 5 Pro 16 G7 i7 RTX 3070Ti | |
| Acer Nitro 5 AN515-58-72QR | |
| Acer Nitro 5 AN515-58-72QR (Leise) | |
| Average Intel Core i7-12700H (2743 - 5972, n=62) | |
| HP Omen 16-c0077ng | |
| Acer Nitro 5 AN515-58-72QR (Leistung) | |
| Geekbench 5.5 | |
| Multi-Core | |
| Average of class Gaming (1946 - 22200, n=234, last 2 years) | |
| HP Omen 16-b1090ng | |
| Lenovo Legion 5 Pro 16 G7 i7 RTX 3070Ti | |
| MSI Vector GP66 12UGS | |
| Average Intel Core i7-12700H (5144 - 13745, n=63) | |
| Acer Nitro 5 AN515-58-72QR | |
| Acer Nitro 5 AN515-58-72QR (Leistung) | |
| Acer Nitro 5 AN515-58-72QR (Leise) | |
| HP Omen 16-c0077ng | |
| Single-Core | |
| MSI Vector GP66 12UGS | |
| Average of class Gaming (158 - 2210, n=234, last 2 years) | |
| HP Omen 16-b1090ng | |
| Acer Nitro 5 AN515-58-72QR | |
| Lenovo Legion 5 Pro 16 G7 i7 RTX 3070Ti | |
| Average Intel Core i7-12700H (803 - 1851, n=63) | |
| Acer Nitro 5 AN515-58-72QR (Leistung) | |
| Acer Nitro 5 AN515-58-72QR (Leise) | |
| HP Omen 16-c0077ng | |
| HWBOT x265 Benchmark v2.2 - 4k Preset | |
| Lenovo Legion 5 Pro 16 G7 i7 RTX 3070Ti | |
| Average of class Gaming (3 - 37.6, n=232, last 2 years) | |
| HP Omen 16-b1090ng | |
| MSI Vector GP66 12UGS | |
| Acer Nitro 5 AN515-58-72QR (Leistung) | |
| Acer Nitro 5 AN515-58-72QR | |
| Average Intel Core i7-12700H (4.67 - 21.8, n=63) | |
| Acer Nitro 5 AN515-58-72QR (Leise) | |
| Acer Nitro 5 AN515-58-72QR (Leise) | |
| HP Omen 16-c0077ng | |
| LibreOffice - 20 Documents To PDF | |
| HP Omen 16-c0077ng | |
| Average of class Gaming (32.8 - 332, n=226, last 2 years) | |
| Average Intel Core i7-12700H (34.2 - 95.3, n=62) | |
| Acer Nitro 5 AN515-58-72QR (Leistung) | |
| Acer Nitro 5 AN515-58-72QR (Leise) | |
| Lenovo Legion 5 Pro 16 G7 i7 RTX 3070Ti | |
| Acer Nitro 5 AN515-58-72QR | |
| HP Omen 16-b1090ng | |
| MSI Vector GP66 12UGS | |
| R Benchmark 2.5 - Overall mean | |
| HP Omen 16-c0077ng | |
| Acer Nitro 5 AN515-58-72QR (Leistung) | |
| Average Intel Core i7-12700H (0.4441 - 1.052, n=62) | |
| Average of class Gaming (0.3609 - 4.47, n=229, last 2 years) | |
| Acer Nitro 5 AN515-58-72QR (Leise) | |
| Acer Nitro 5 AN515-58-72QR | |
| Lenovo Legion 5 Pro 16 G7 i7 RTX 3070Ti | |
| HP Omen 16-b1090ng | |
| MSI Vector GP66 12UGS | |
* ... smaller is better
AIDA64: FP32 Ray-Trace | FPU Julia | CPU SHA3 | CPU Queen | FPU SinJulia | FPU Mandel | CPU AES | CPU ZLib | FP64 Ray-Trace | CPU PhotoWorxx
| Performance Rating | |
| Average of class Gaming | |
| HP Omen 16-c0077ng | |
| Lenovo Legion 5 Pro 16 G7 i7 RTX 3070Ti | |
| Average Intel Core i7-12700H | |
| MSI Vector GP66 12UGS | |
| HP Omen 16-b1090ng | |
| Acer Nitro 5 AN515-58-72QR | |
| Acer Nitro 5 AN515-58-72QR | |
| AIDA64 / FP32 Ray-Trace | |
| Average of class Gaming (3069 - 60169, n=225, last 2 years) | |
| HP Omen 16-c0077ng (v6.50.5800) | |
| Average Intel Core i7-12700H (2585 - 17957, n=62) | |
| Lenovo Legion 5 Pro 16 G7 i7 RTX 3070Ti (v6.50.5800) | |
| Acer Nitro 5 AN515-58-72QR (v6.50.5800, Leistung) | |
| Acer Nitro 5 AN515-58-72QR (v6.50.5800) | |
| MSI Vector GP66 12UGS (v6.50.5800) | |
| HP Omen 16-b1090ng (v6.50.5800) | |
| AIDA64 / FPU Julia | |
| Average of class Gaming (18567 - 252486, n=225, last 2 years) | |
| HP Omen 16-c0077ng (v6.50.5800) | |
| Average Intel Core i7-12700H (12439 - 90760, n=62) | |
| Lenovo Legion 5 Pro 16 G7 i7 RTX 3070Ti (v6.50.5800) | |
| Acer Nitro 5 AN515-58-72QR (v6.50.5800, Leistung) | |
| Acer Nitro 5 AN515-58-72QR (v6.50.5800) | |
| MSI Vector GP66 12UGS (v6.50.5800) | |
| HP Omen 16-b1090ng (v6.50.5800) | |
| AIDA64 / CPU SHA3 | |
| Average of class Gaming (629 - 10389, n=225, last 2 years) | |
| Lenovo Legion 5 Pro 16 G7 i7 RTX 3070Ti (v6.50.5800) | |
| Acer Nitro 5 AN515-58-72QR (v6.50.5800, Leistung) | |
| HP Omen 16-c0077ng (v6.50.5800) | |
| Average Intel Core i7-12700H (833 - 4242, n=62) | |
| MSI Vector GP66 12UGS (v6.50.5800) | |
| Acer Nitro 5 AN515-58-72QR (v6.50.5800) | |
| HP Omen 16-b1090ng (v6.50.5800) | |
| AIDA64 / CPU Queen | |
| Average of class Gaming (15371 - 200651, n=225, last 2 years) | |
| MSI Vector GP66 12UGS (v6.50.5800) | |
| HP Omen 16-b1090ng (v6.50.5800) | |
| Lenovo Legion 5 Pro 16 G7 i7 RTX 3070Ti (v6.50.5800) | |
| HP Omen 16-c0077ng (v6.50.5800) | |
| Acer Nitro 5 AN515-58-72QR (v6.50.5800) | |
| Acer Nitro 5 AN515-58-72QR (v6.50.5800, Leistung) | |
| Average Intel Core i7-12700H (57923 - 103202, n=62) | |
| AIDA64 / FPU SinJulia | |
| Average of class Gaming (2137 - 32988, n=225, last 2 years) | |
| HP Omen 16-c0077ng (v6.50.5800) | |
| Lenovo Legion 5 Pro 16 G7 i7 RTX 3070Ti (v6.50.5800) | |
| Acer Nitro 5 AN515-58-72QR (v6.50.5800, Leistung) | |
| Acer Nitro 5 AN515-58-72QR (v6.50.5800) | |
| MSI Vector GP66 12UGS (v6.50.5800) | |
| HP Omen 16-b1090ng (v6.50.5800) | |
| Average Intel Core i7-12700H (3249 - 9939, n=62) | |
| AIDA64 / FPU Mandel | |
| HP Omen 16-c0077ng (v6.50.5800) | |
| Average of class Gaming (10291 - 134044, n=225, last 2 years) | |
| Average Intel Core i7-12700H (7135 - 44760, n=62) | |
| Lenovo Legion 5 Pro 16 G7 i7 RTX 3070Ti (v6.50.5800) | |
| Acer Nitro 5 AN515-58-72QR (v6.50.5800, Leistung) | |
| Acer Nitro 5 AN515-58-72QR | |
| MSI Vector GP66 12UGS (v6.50.5800) | |
| HP Omen 16-b1090ng (v6.50.5800) | |
| AIDA64 / CPU AES | |
| HP Omen 16-c0077ng (v6.50.5800) | |
| Average of class Gaming (19065 - 328679, n=225, last 2 years) | |
| Lenovo Legion 5 Pro 16 G7 i7 RTX 3070Ti (v6.50.5800) | |
| MSI Vector GP66 12UGS (v6.50.5800) | |
| HP Omen 16-b1090ng (v6.50.5800) | |
| Average Intel Core i7-12700H (31839 - 144360, n=62) | |
| Acer Nitro 5 AN515-58-72QR (v6.50.5800, Leistung) | |
| Acer Nitro 5 AN515-58-72QR (v6.50.5800) | |
| AIDA64 / CPU ZLib | |
| Average of class Gaming (150.9 - 2409, n=225, last 2 years) | |
| Lenovo Legion 5 Pro 16 G7 i7 RTX 3070Ti (v6.50.5800) | |
| Acer Nitro 5 AN515-58-72QR (v6.50.5800, Leistung) | |
| MSI Vector GP66 12UGS (v6.50.5800) | |
| Acer Nitro 5 AN515-58-72QR (v6.50.5800) | |
| Average Intel Core i7-12700H (305 - 1171, n=62) | |
| HP Omen 16-b1090ng (v6.50.5800) | |
| HP Omen 16-c0077ng (v6.50.5800) | |
| AIDA64 / FP64 Ray-Trace | |
| Average of class Gaming (1518 - 31796, n=225, last 2 years) | |
| HP Omen 16-c0077ng (v6.50.5800) | |
| Average Intel Core i7-12700H (1437 - 9692, n=62) | |
| Lenovo Legion 5 Pro 16 G7 i7 RTX 3070Ti (v6.50.5800) | |
| Acer Nitro 5 AN515-58-72QR (v6.50.5800, Leistung) | |
| Acer Nitro 5 AN515-58-72QR (v6.50.5800) | |
| MSI Vector GP66 12UGS (v6.50.5800) | |
| HP Omen 16-b1090ng (v6.50.5800) | |
| AIDA64 / CPU PhotoWorxx | |
| HP Omen 16-b1090ng (v6.50.5800) | |
| Average of class Gaming (10805 - 60161, n=226, last 2 years) | |
| Lenovo Legion 5 Pro 16 G7 i7 RTX 3070Ti (v6.50.5800) | |
| Average Intel Core i7-12700H (12863 - 52207, n=62) | |
| MSI Vector GP66 12UGS (v6.50.5800) | |
| Acer Nitro 5 AN515-58-72QR (v6.50.5800) | |
| HP Omen 16-c0077ng (v6.50.5800) | |
| Acer Nitro 5 AN515-58-72QR (v6.50.5800, Leistung) | |
System Performance
The system works smoothly and fluidly, and the installed hardware provides more than enough computing power for performance demanding applications such as gaming, video editing and image processing. The transfer rates of the RAM are on a normal level for DDR4-3200 memory. The PCMark results are also solid.
| PCMark 8 Home Score Accelerated v2 | 5150 points | |
| PCMark 8 Creative Score Accelerated v2 | 6975 points | |
| PCMark 8 Work Score Accelerated v2 | 6035 points | |
| PCMark 10 Score | 6941 points | |
Help | ||
CrossMark: Overall | Productivity | Creativity | Responsiveness
| PCMark 10 / Score | |
| MSI Vector GP66 12UGS | |
| Average of class Gaming (5235 - 9852, n=200, last 2 years) | |
| Lenovo Legion 5 Pro 16 G7 i7 RTX 3070Ti | |
| Average Intel Core i7-12700H, NVIDIA GeForce RTX 3070 Ti Laptop GPU (6941 - 7947, n=11) | |
| HP Omen 16-b1090ng | |
| HP Omen 16-c0077ng | |
| Acer Nitro 5 AN515-58-72QR | |
| PCMark 10 / Essentials | |
| MSI Vector GP66 12UGS | |
| Average of class Gaming (8300 - 12334, n=199, last 2 years) | |
| Average Intel Core i7-12700H, NVIDIA GeForce RTX 3070 Ti Laptop GPU (9892 - 10935, n=11) | |
| HP Omen 16-c0077ng | |
| HP Omen 16-b1090ng | |
| Lenovo Legion 5 Pro 16 G7 i7 RTX 3070Ti | |
| Acer Nitro 5 AN515-58-72QR | |
| PCMark 10 / Productivity | |
| MSI Vector GP66 12UGS | |
| Lenovo Legion 5 Pro 16 G7 i7 RTX 3070Ti | |
| Average Intel Core i7-12700H, NVIDIA GeForce RTX 3070 Ti Laptop GPU (9024 - 10638, n=11) | |
| Average of class Gaming (6662 - 11833, n=199, last 2 years) | |
| HP Omen 16-b1090ng | |
| HP Omen 16-c0077ng | |
| Acer Nitro 5 AN515-58-72QR | |
| PCMark 10 / Digital Content Creation | |
| MSI Vector GP66 12UGS | |
| Lenovo Legion 5 Pro 16 G7 i7 RTX 3070Ti | |
| Average of class Gaming (6462 - 18475, n=199, last 2 years) | |
| Average Intel Core i7-12700H, NVIDIA GeForce RTX 3070 Ti Laptop GPU (10165 - 12546, n=11) | |
| HP Omen 16-b1090ng | |
| HP Omen 16-c0077ng | |
| Acer Nitro 5 AN515-58-72QR | |
| CrossMark / Overall | |
| Lenovo Legion 5 Pro 16 G7 i7 RTX 3070Ti | |
| Average of class Gaming (1247 - 2334, n=170, last 2 years) | |
| Average Intel Core i7-12700H, NVIDIA GeForce RTX 3070 Ti Laptop GPU (974 - 2000, n=12) | |
| Acer Nitro 5 AN515-58-72QR | |
| CrossMark / Productivity | |
| Lenovo Legion 5 Pro 16 G7 i7 RTX 3070Ti | |
| Average of class Gaming (1299 - 2204, n=170, last 2 years) | |
| Average Intel Core i7-12700H, NVIDIA GeForce RTX 3070 Ti Laptop GPU (907 - 1962, n=12) | |
| Acer Nitro 5 AN515-58-72QR | |
| CrossMark / Creativity | |
| Lenovo Legion 5 Pro 16 G7 i7 RTX 3070Ti | |
| Average of class Gaming (1275 - 2514, n=170, last 2 years) | |
| Average Intel Core i7-12700H, NVIDIA GeForce RTX 3070 Ti Laptop GPU (1027 - 2057, n=12) | |
| Acer Nitro 5 AN515-58-72QR | |
| CrossMark / Responsiveness | |
| Lenovo Legion 5 Pro 16 G7 i7 RTX 3070Ti | |
| Average Intel Core i7-12700H, NVIDIA GeForce RTX 3070 Ti Laptop GPU (1029 - 2142, n=12) | |
| Average of class Gaming (1030 - 2330, n=170, last 2 years) | |
| Acer Nitro 5 AN515-58-72QR | |
| AIDA64 / Memory Copy | |
| HP Omen 16-b1090ng | |
| Average of class Gaming (21842 - 92565, n=225, last 2 years) | |
| Average Intel Core i7-12700H (25615 - 80511, n=62) | |
| Lenovo Legion 5 Pro 16 G7 i7 RTX 3070Ti | |
| MSI Vector GP66 12UGS | |
| Acer Nitro 5 AN515-58-72QR | |
| HP Omen 16-c0077ng | |
| AIDA64 / Memory Read | |
| HP Omen 16-b1090ng | |
| Average of class Gaming (24879 - 90647, n=225, last 2 years) | |
| Lenovo Legion 5 Pro 16 G7 i7 RTX 3070Ti | |
| Average Intel Core i7-12700H (25586 - 79442, n=62) | |
| MSI Vector GP66 12UGS | |
| HP Omen 16-c0077ng | |
| Acer Nitro 5 AN515-58-72QR | |
| AIDA64 / Memory Write | |
| HP Omen 16-b1090ng | |
| Average of class Gaming (21619 - 103259, n=225, last 2 years) | |
| Lenovo Legion 5 Pro 16 G7 i7 RTX 3070Ti | |
| Average Intel Core i7-12700H (23679 - 88660, n=62) | |
| MSI Vector GP66 12UGS | |
| Acer Nitro 5 AN515-58-72QR | |
| HP Omen 16-c0077ng | |
| AIDA64 / Memory Latency | |
| Lenovo Legion 5 Pro 16 G7 i7 RTX 3070Ti | |
| MSI Vector GP66 12UGS | |
| HP Omen 16-b1090ng | |
| Average of class Gaming (59.5 - 152.5, n=222, last 2 years) | |
| HP Omen 16-c0077ng | |
| Average Intel Core i7-12700H (76.2 - 133.9, n=60) | |
| Acer Nitro 5 AN515-58-72QR | |
| Acer Nitro 5 AN515-58-72QR | |
* ... smaller is better
DPC Latencies
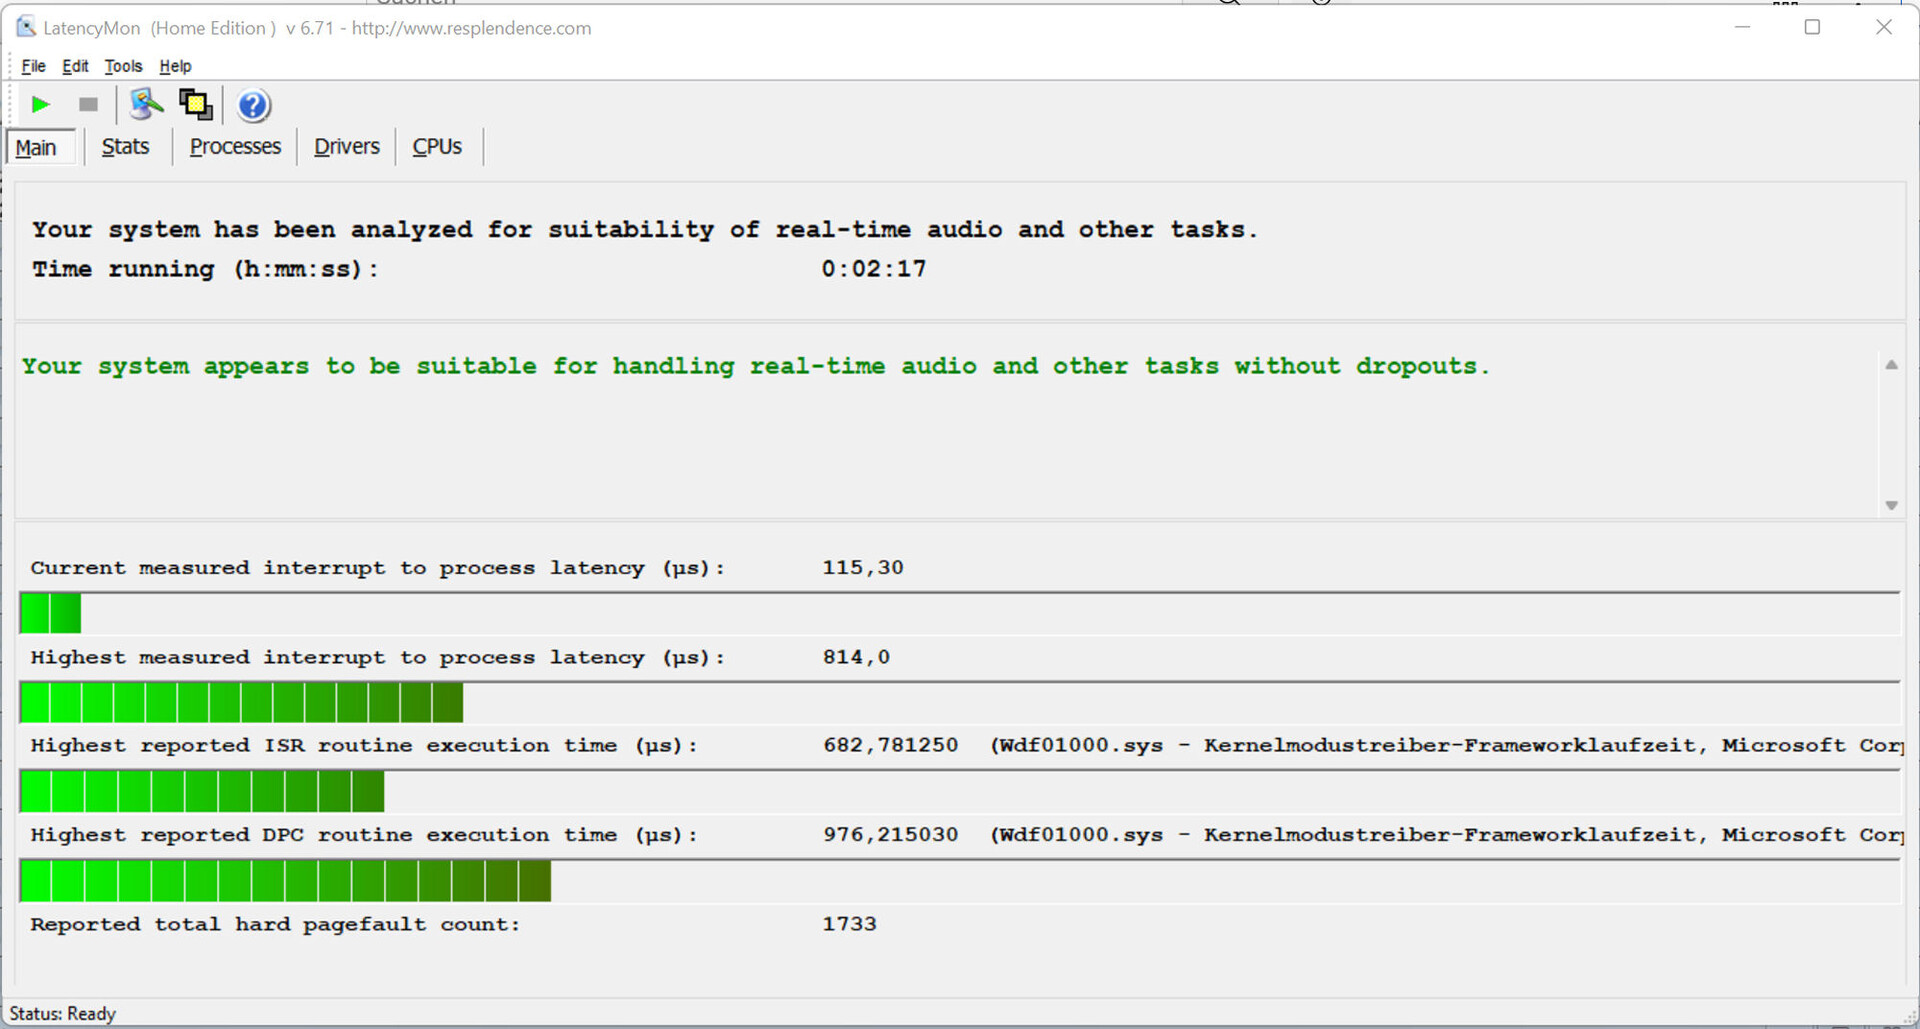
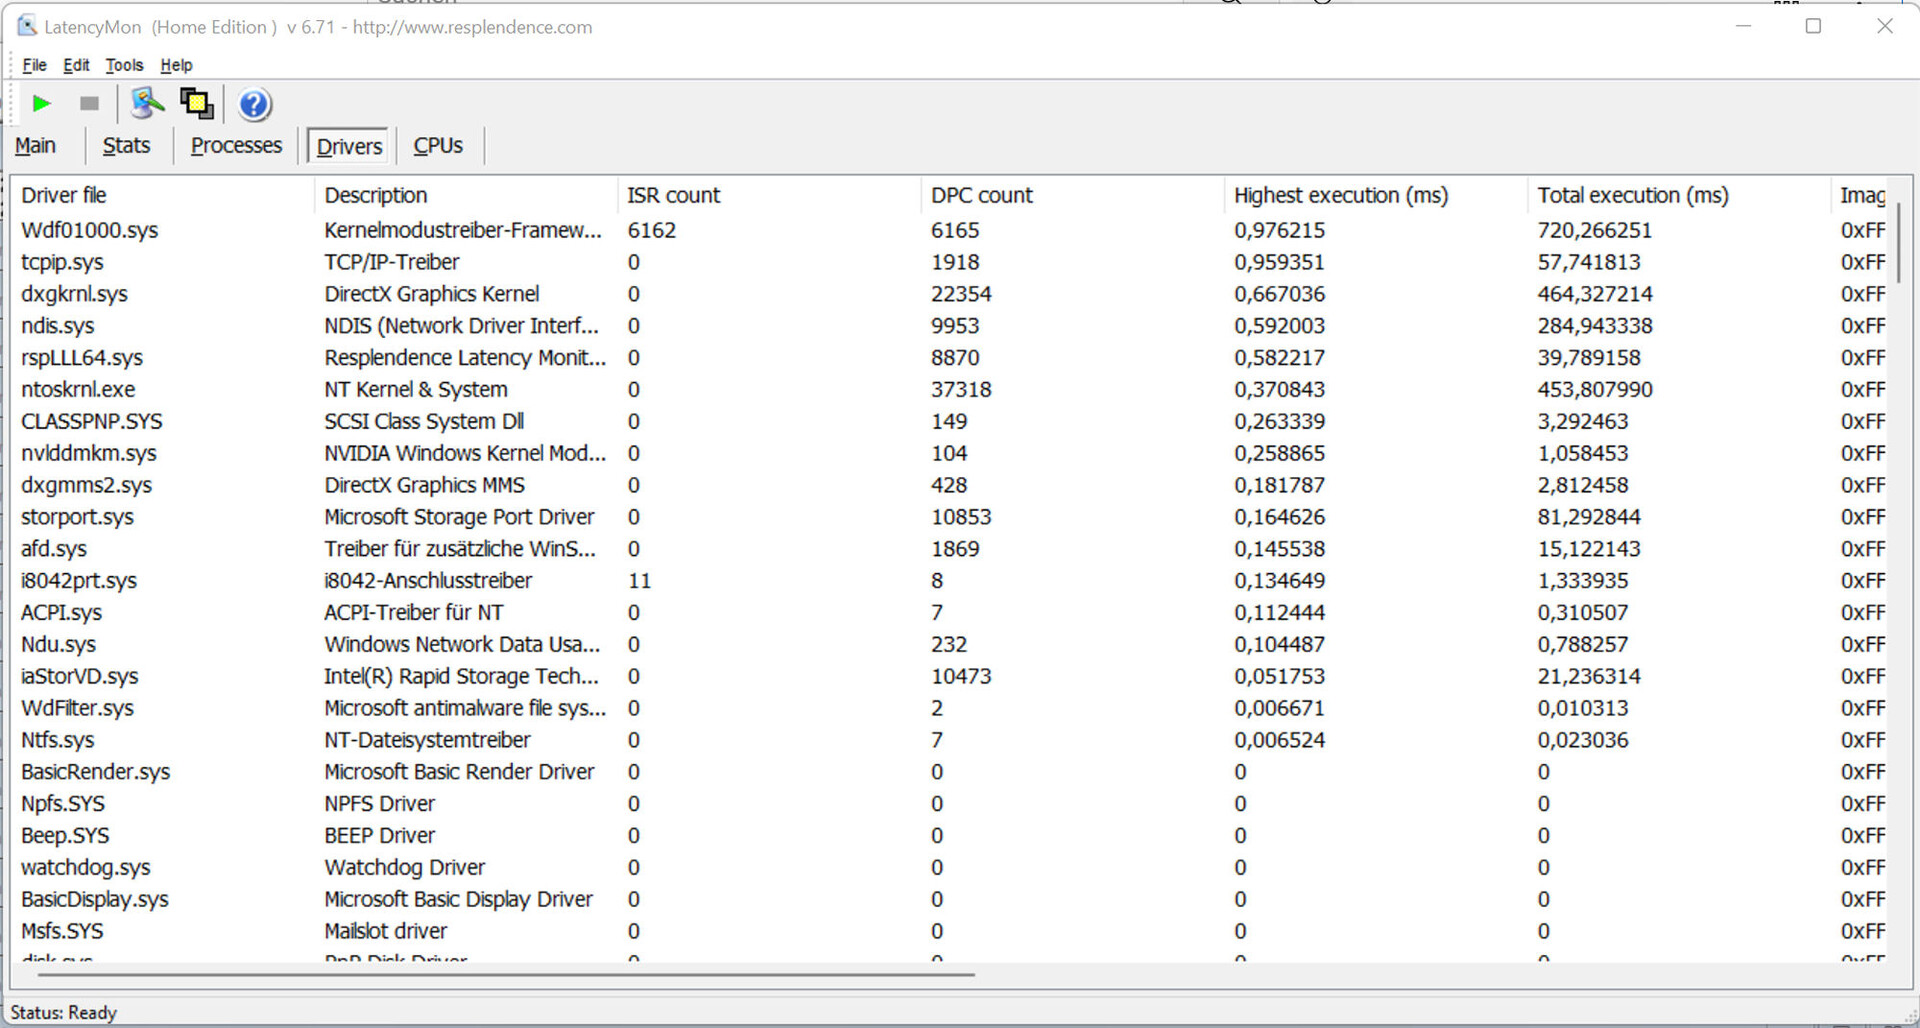
The standardized latency monitor test (web surfing, 4k video playback, Prime95 high-load) did not reveal any abnormalities in the DPC latencies. The system seems to be suitable for real-time video and audio editing. Future software updates may lead to improvements or even deterioration.
| DPC Latencies / LatencyMon - interrupt to process latency (max), Web, Youtube, Prime95 | |
| MSI Vector GP66 12UGS | |
| HP Omen 16-c0077ng | |
| Acer Nitro 5 AN515-58-72QR | |
| Lenovo Legion 5 Pro 16 G7 i7 RTX 3070Ti | |
| HP Omen 16-b1090ng | |
* ... smaller is better
Storage Devices
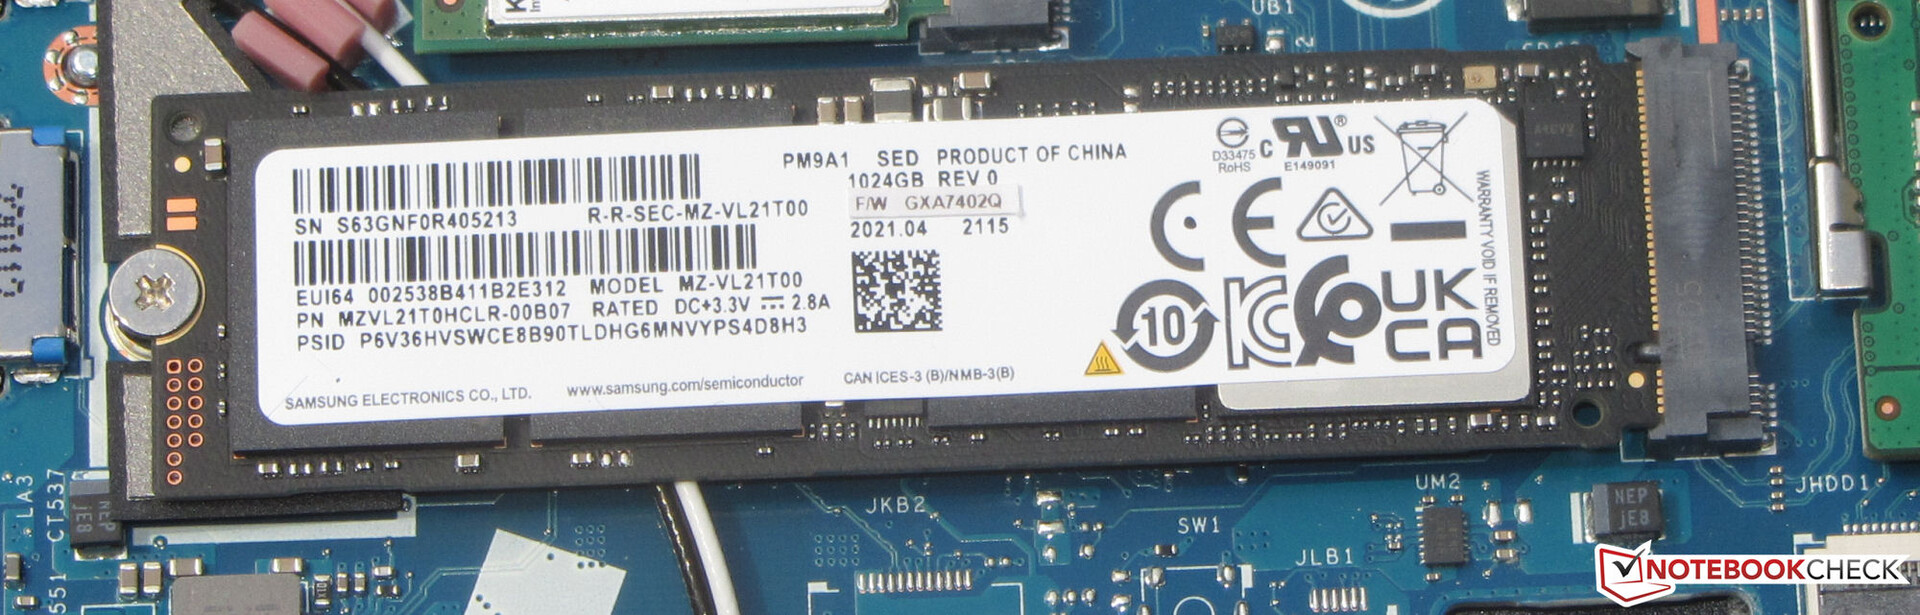
Acer equips the AN515 with a 1TB SSD (PCIe 4, M.2-2280) from Samsung, which delivers very good transfer rates. The notebook also offers space for a second PCIe 4 SSD as well as a 2.5-inch storage medium (SATA slot and screws are in the box, while the mounting frame is already inside the notebook).

* ... smaller is better
Sustained Read Performance: DiskSpd Read Loop, Queue Depth 8
Graphics Card
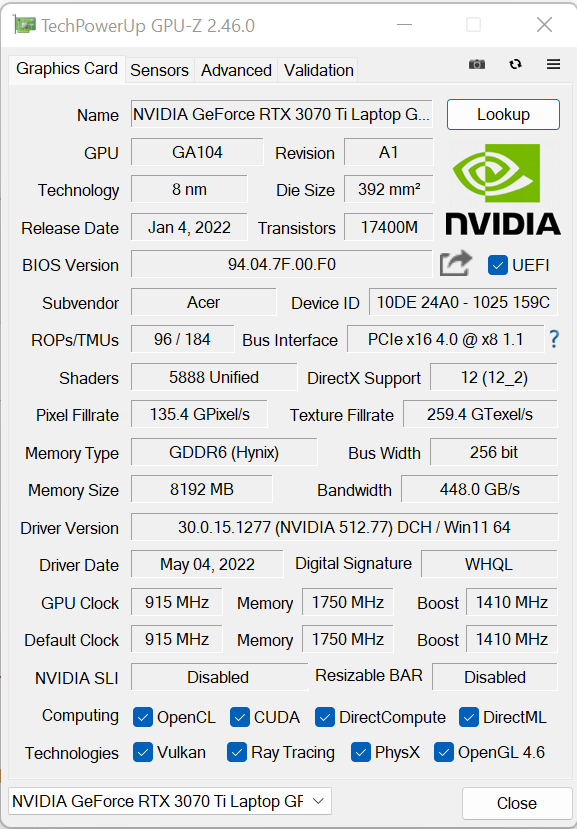
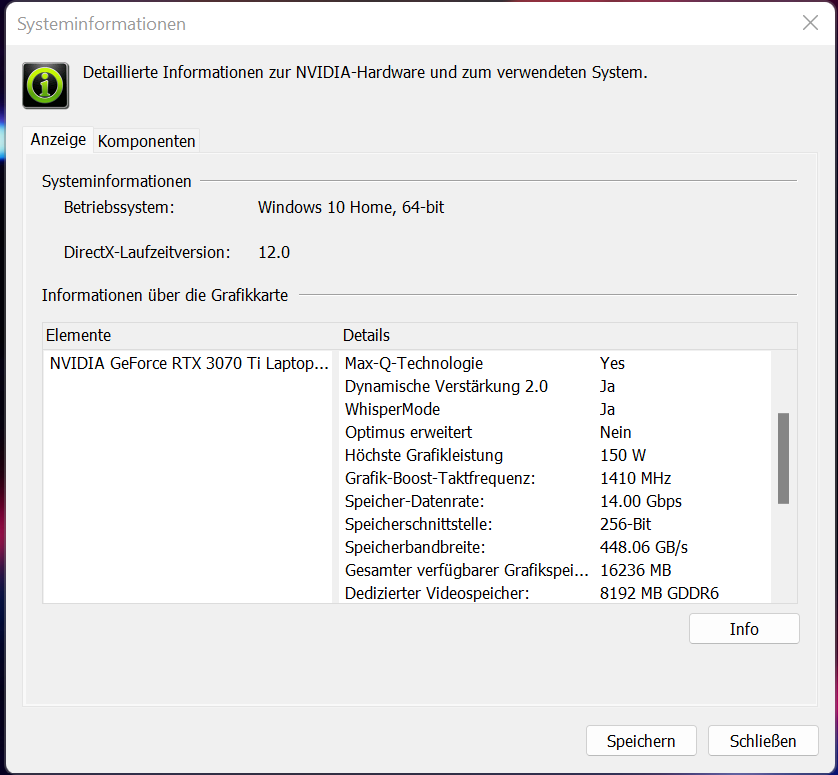
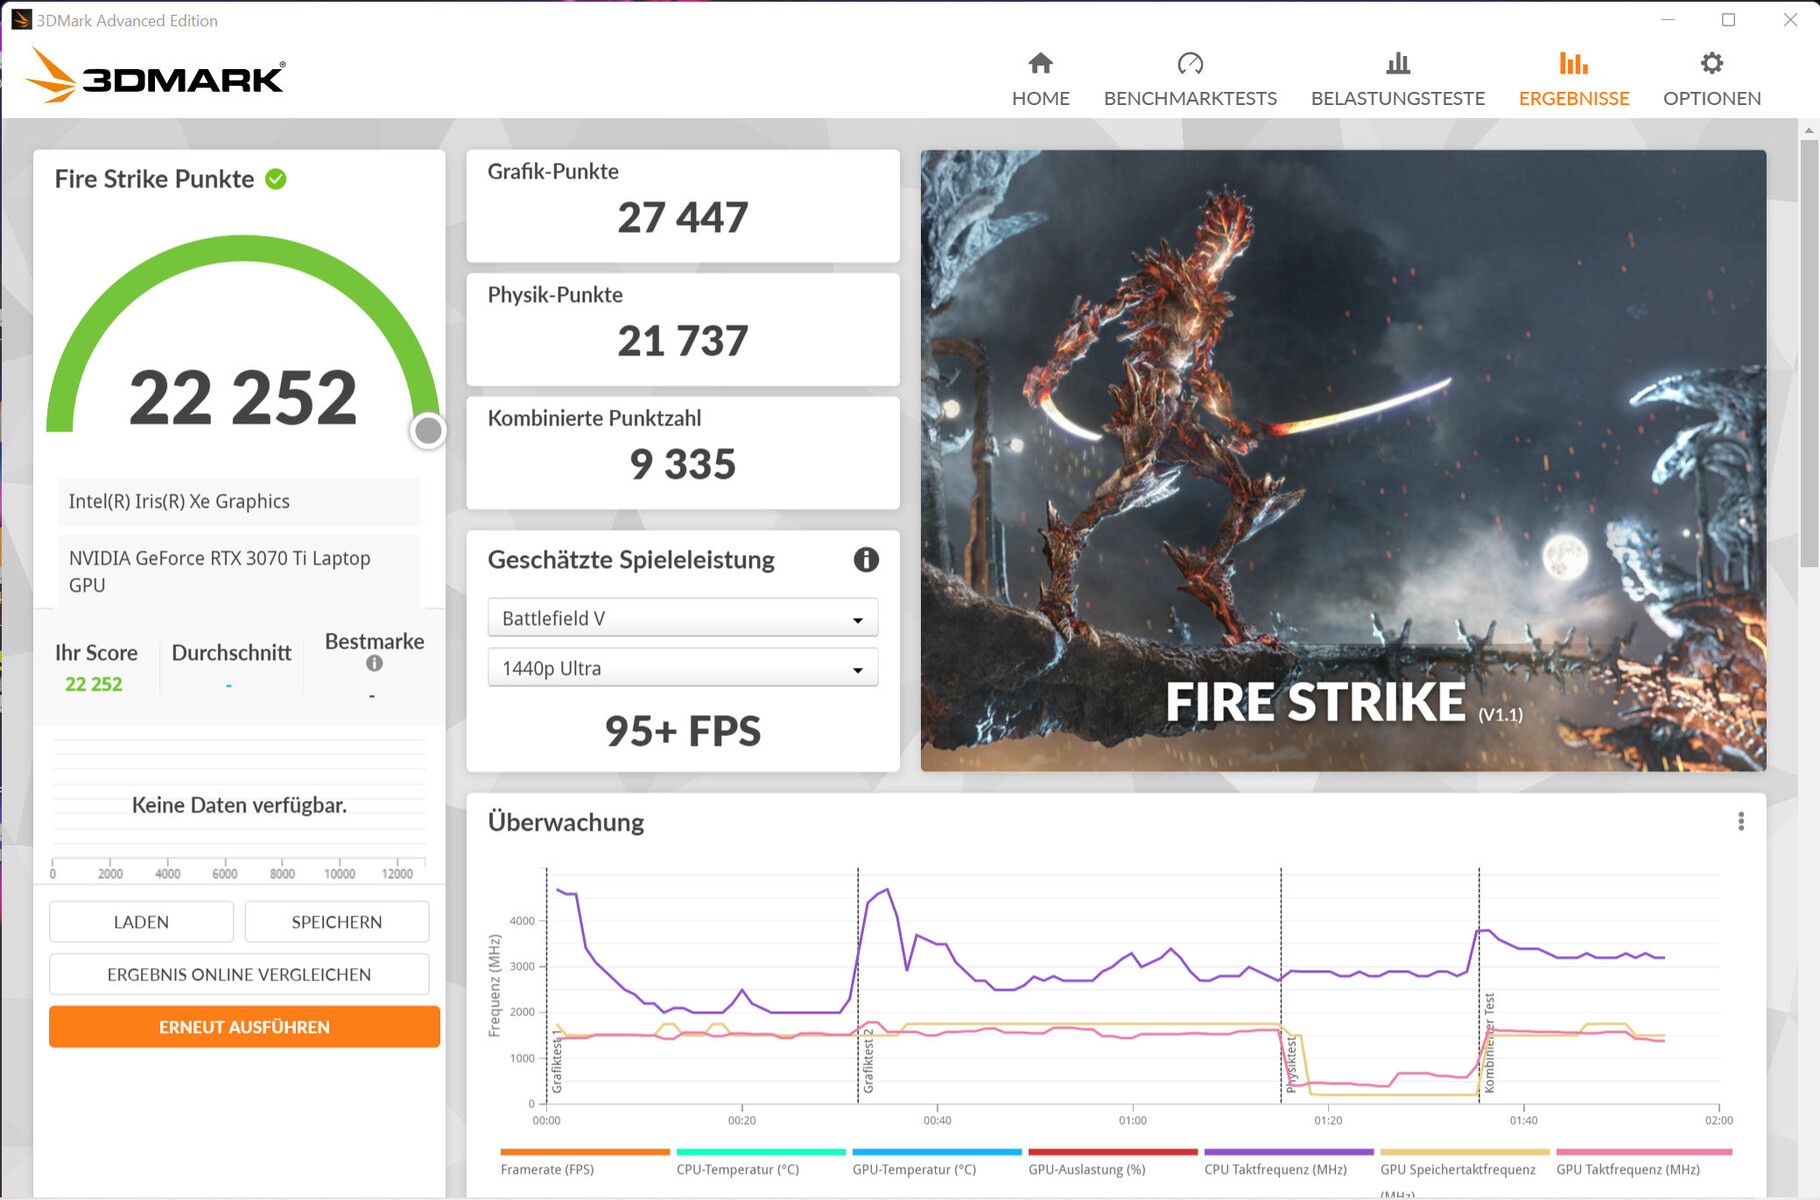
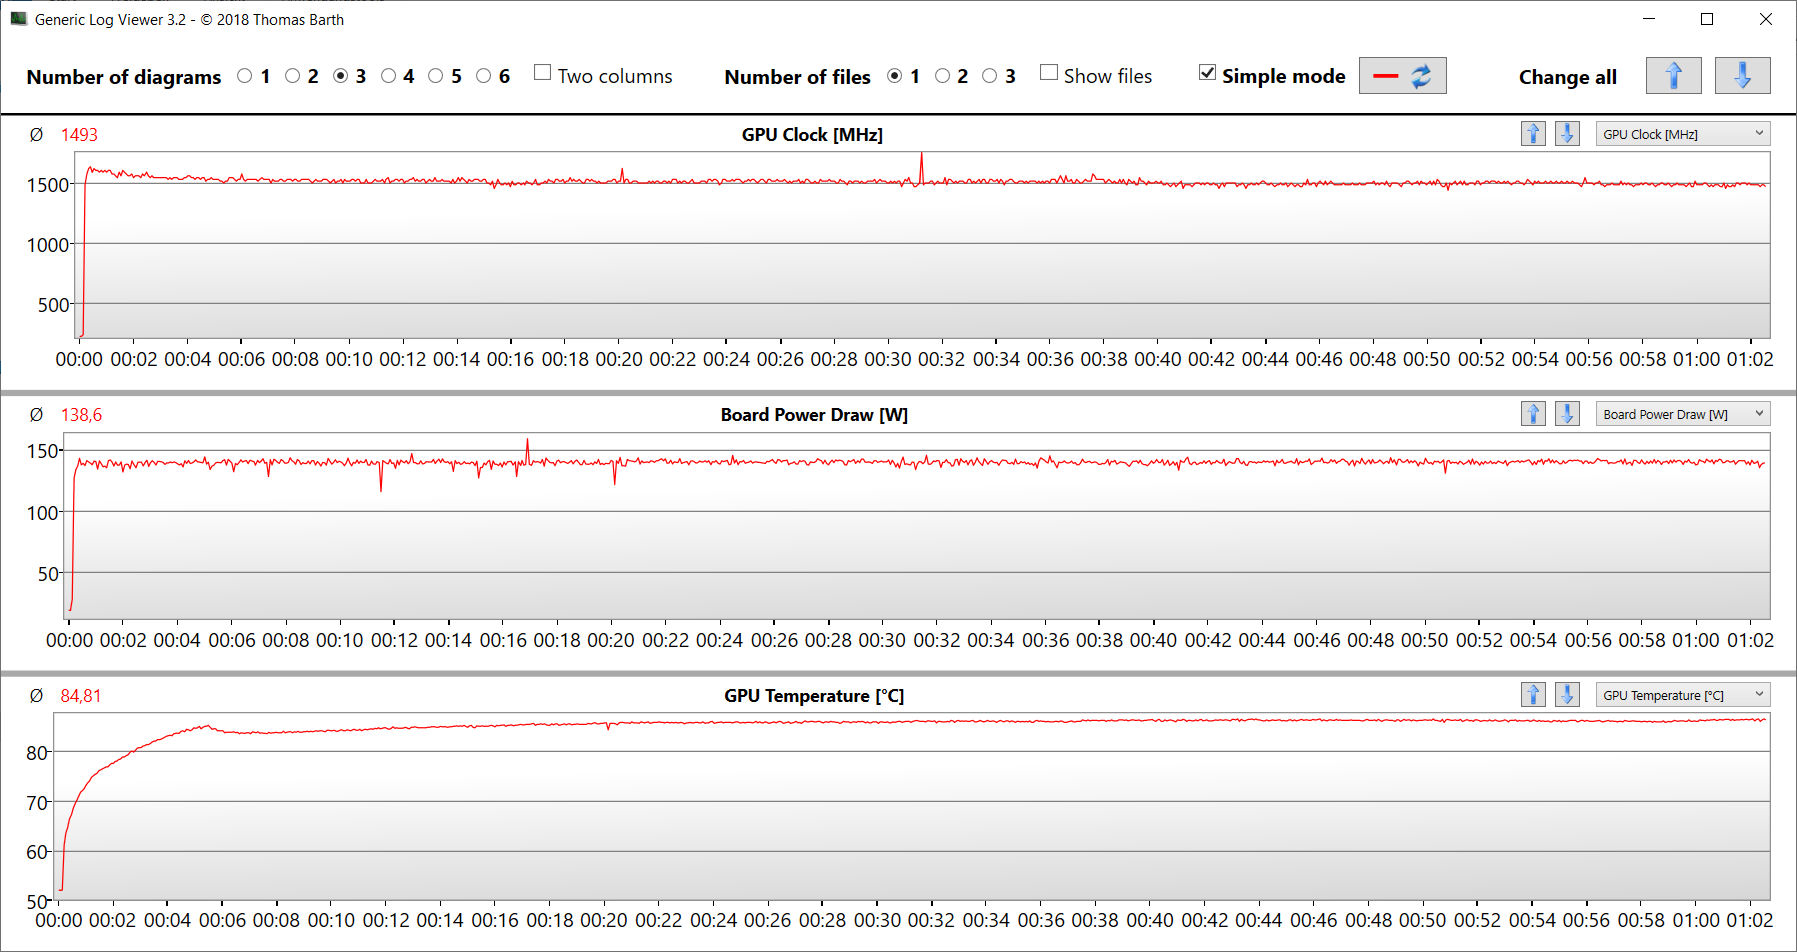
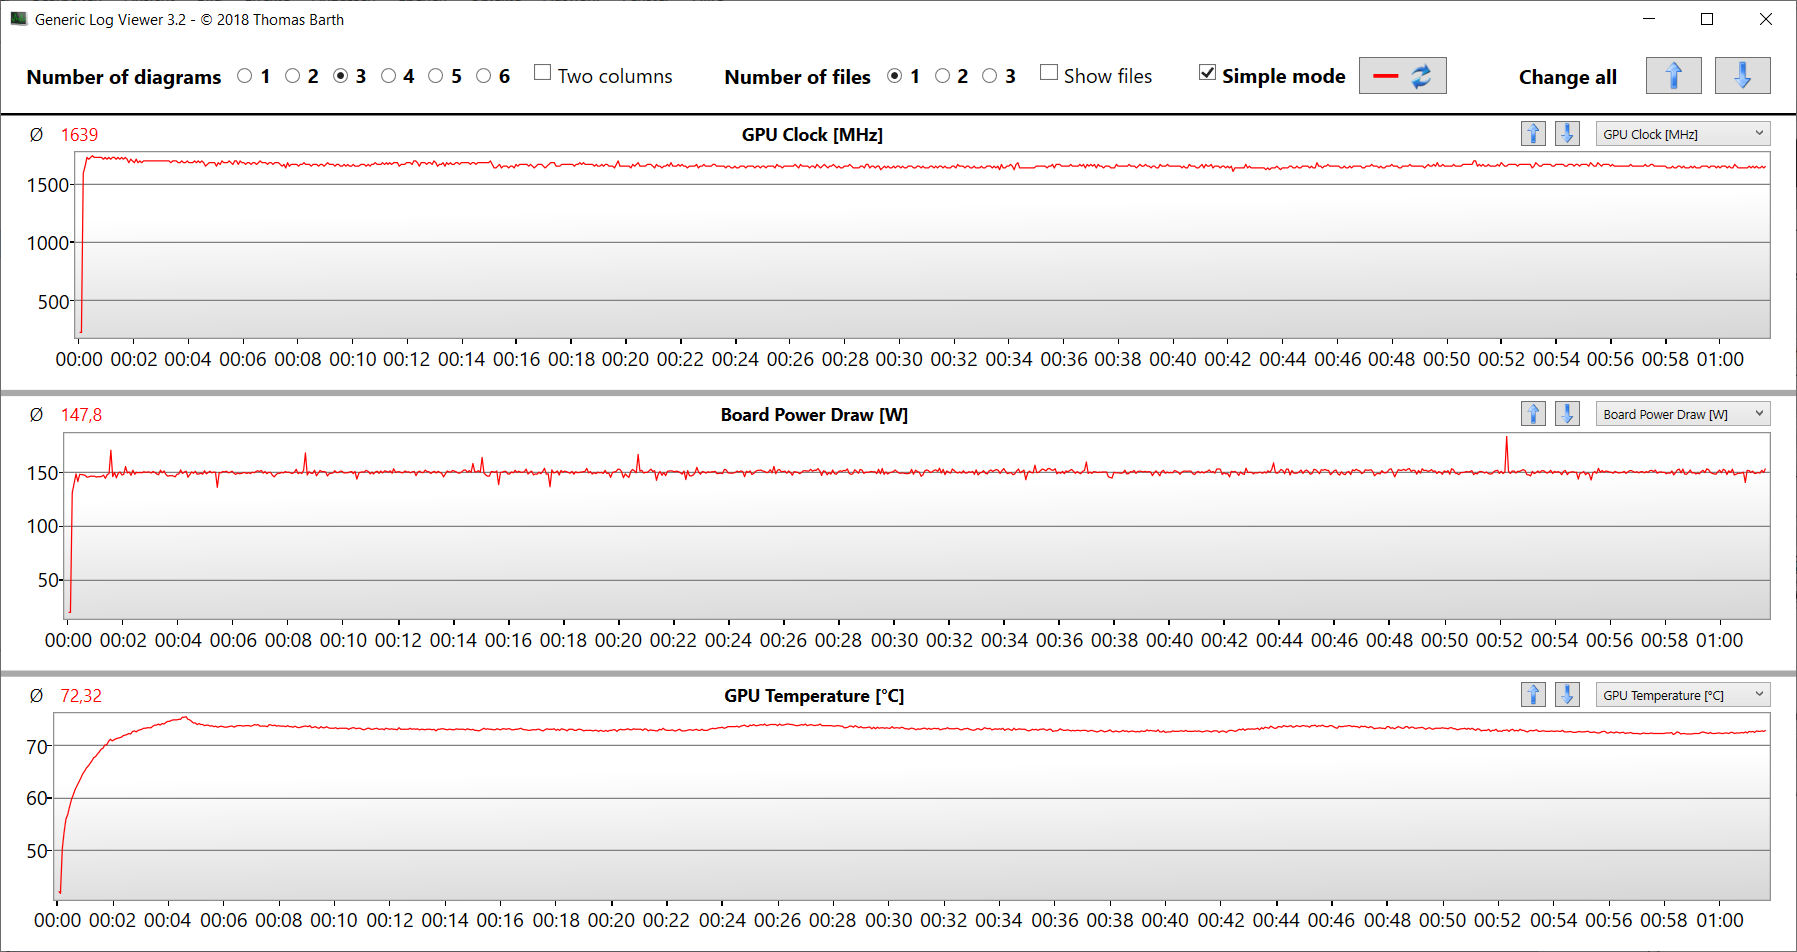
The actual performance of an RTX-3000 GPU depends on a few factors: Cooling, memory configuration and the maximum TGP that a notebook manufacturer chooses within the limits set by Nvidia. Acer gives the installed GeForce RTX 3070 Ti laptop a maximum TGP of 150 watts (125 watts + 25 watts Dynamic Boost). The GPU has fast GDDR6 graphics memory (8,192 MB) at its disposal.
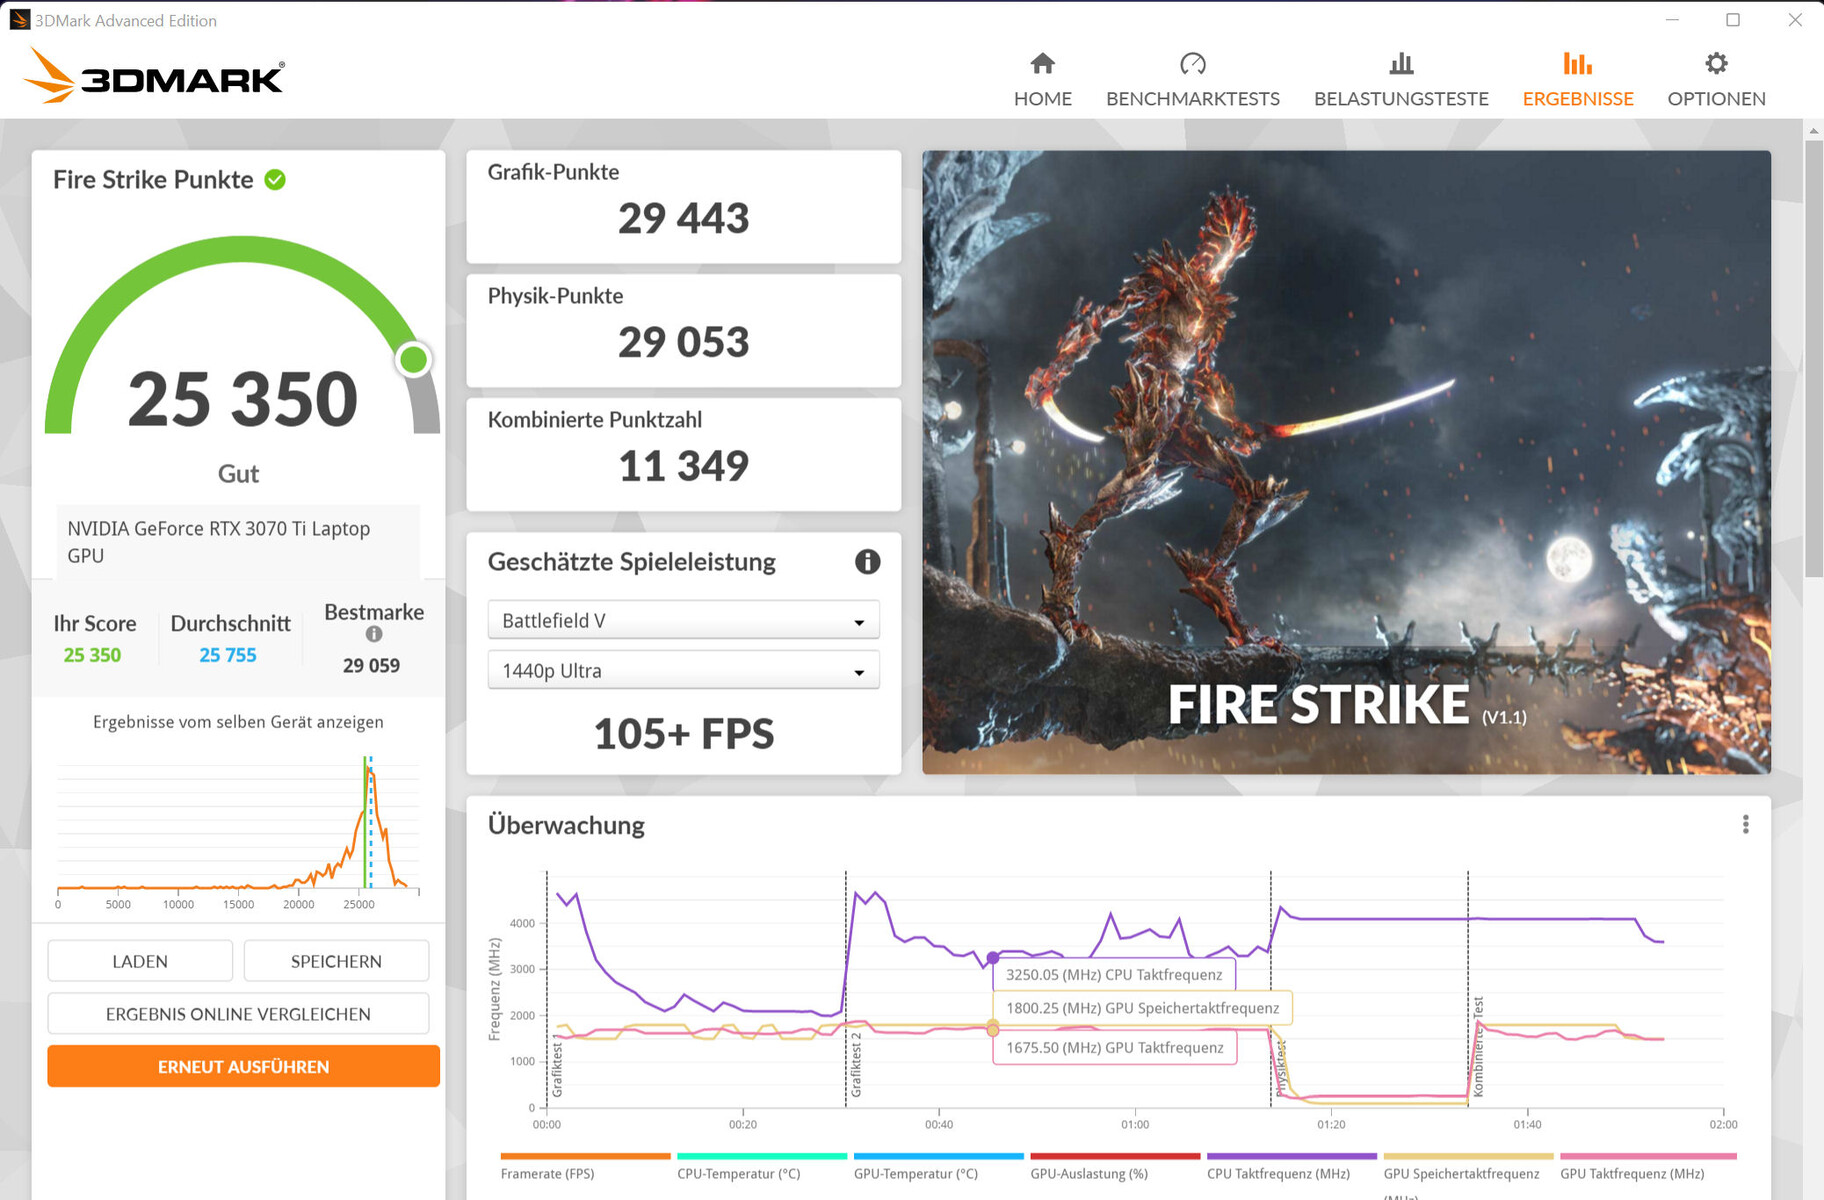
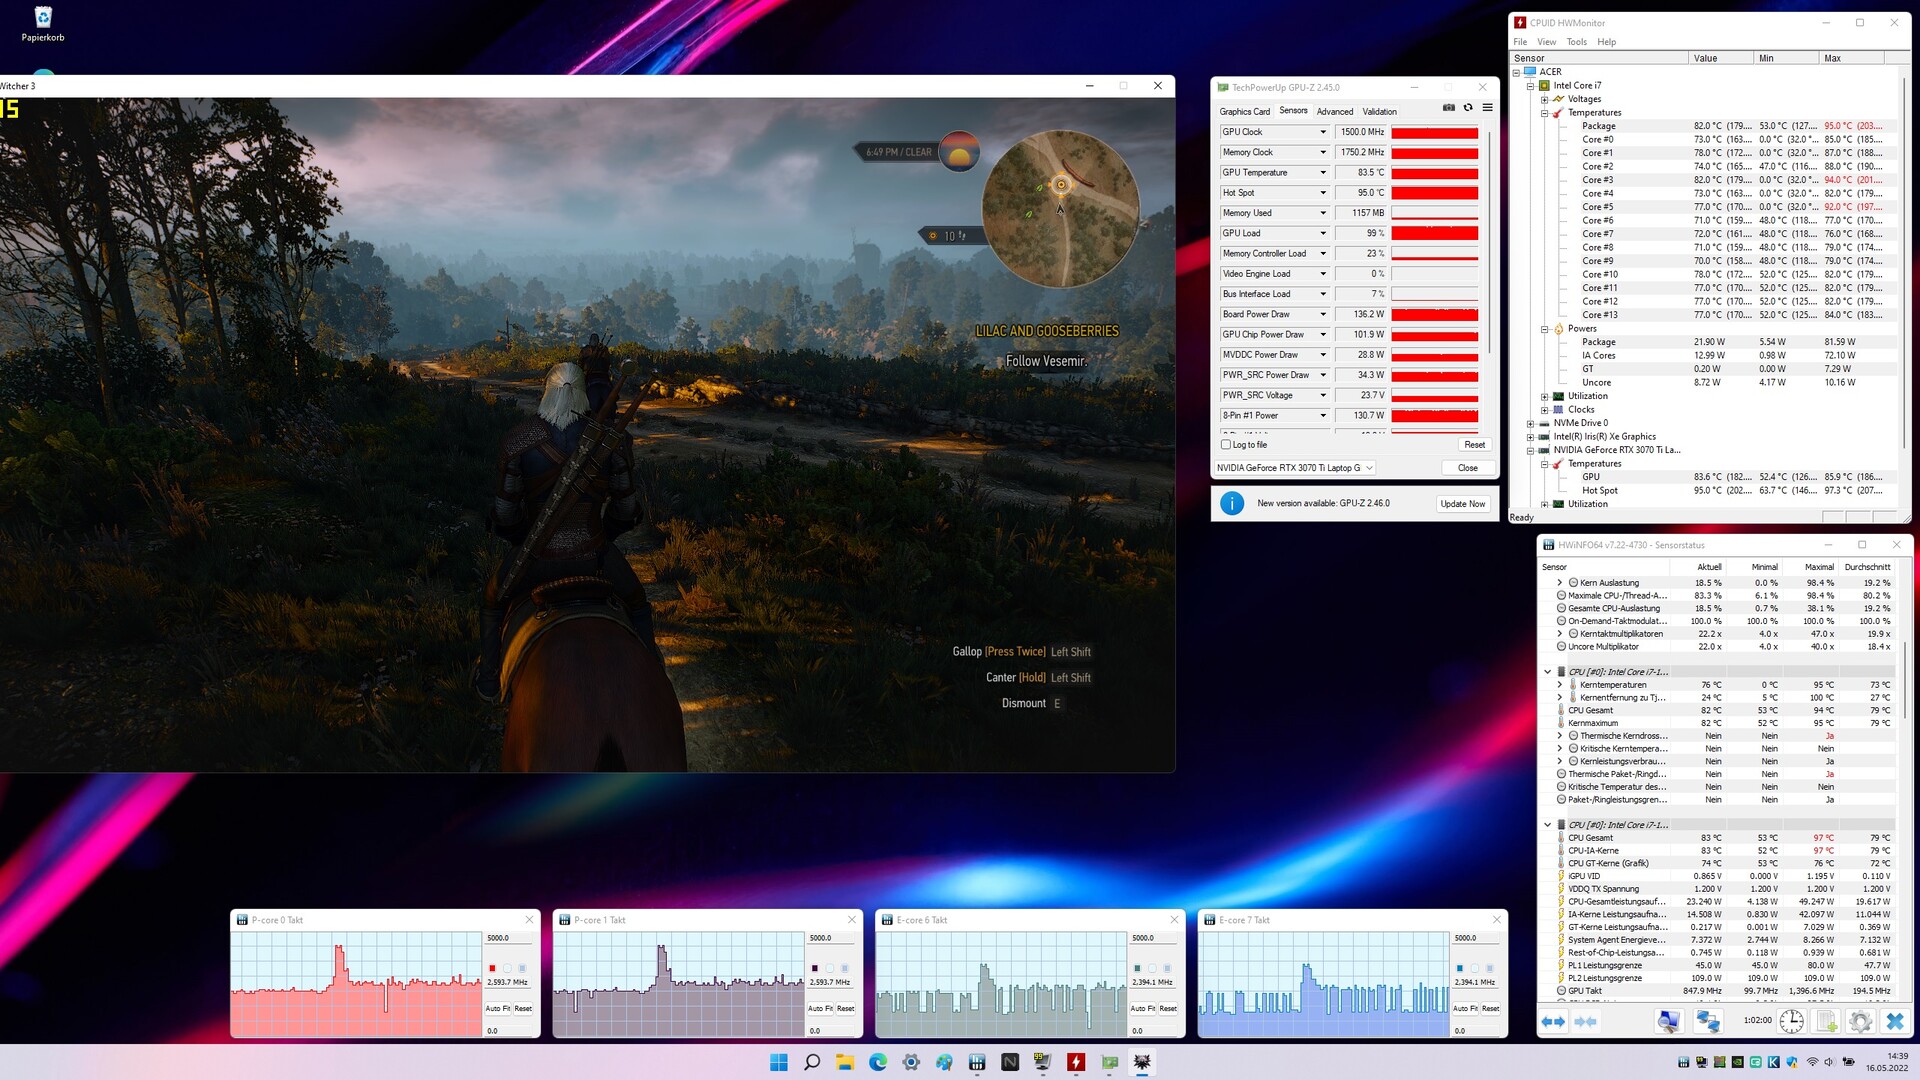
The benchmark results are, depending on the selected profile, above or below the previously determined RTX 3070 Ti average. Dynamic Boost is not fully utilized under the "Standard" profile, while the "Performance" profile brings about more intensive usage of Dynamic Boost, as shown by the Witcher 3 test.
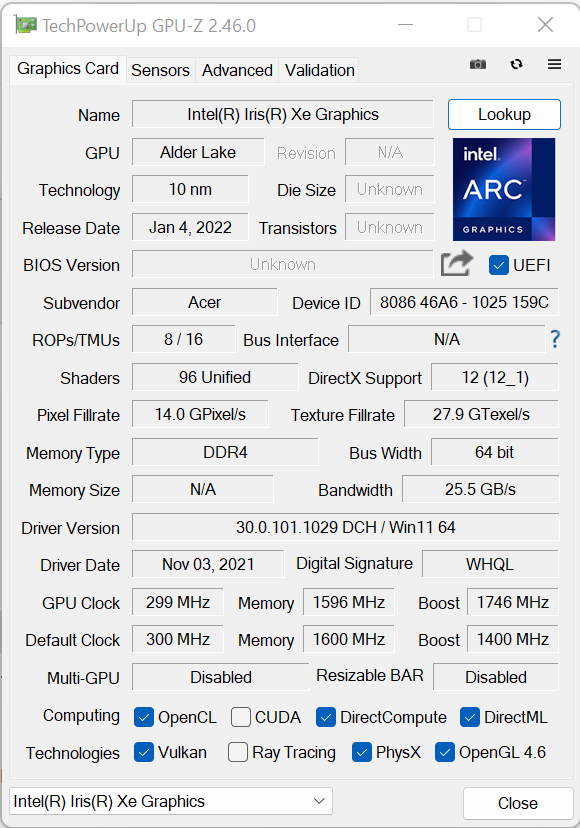
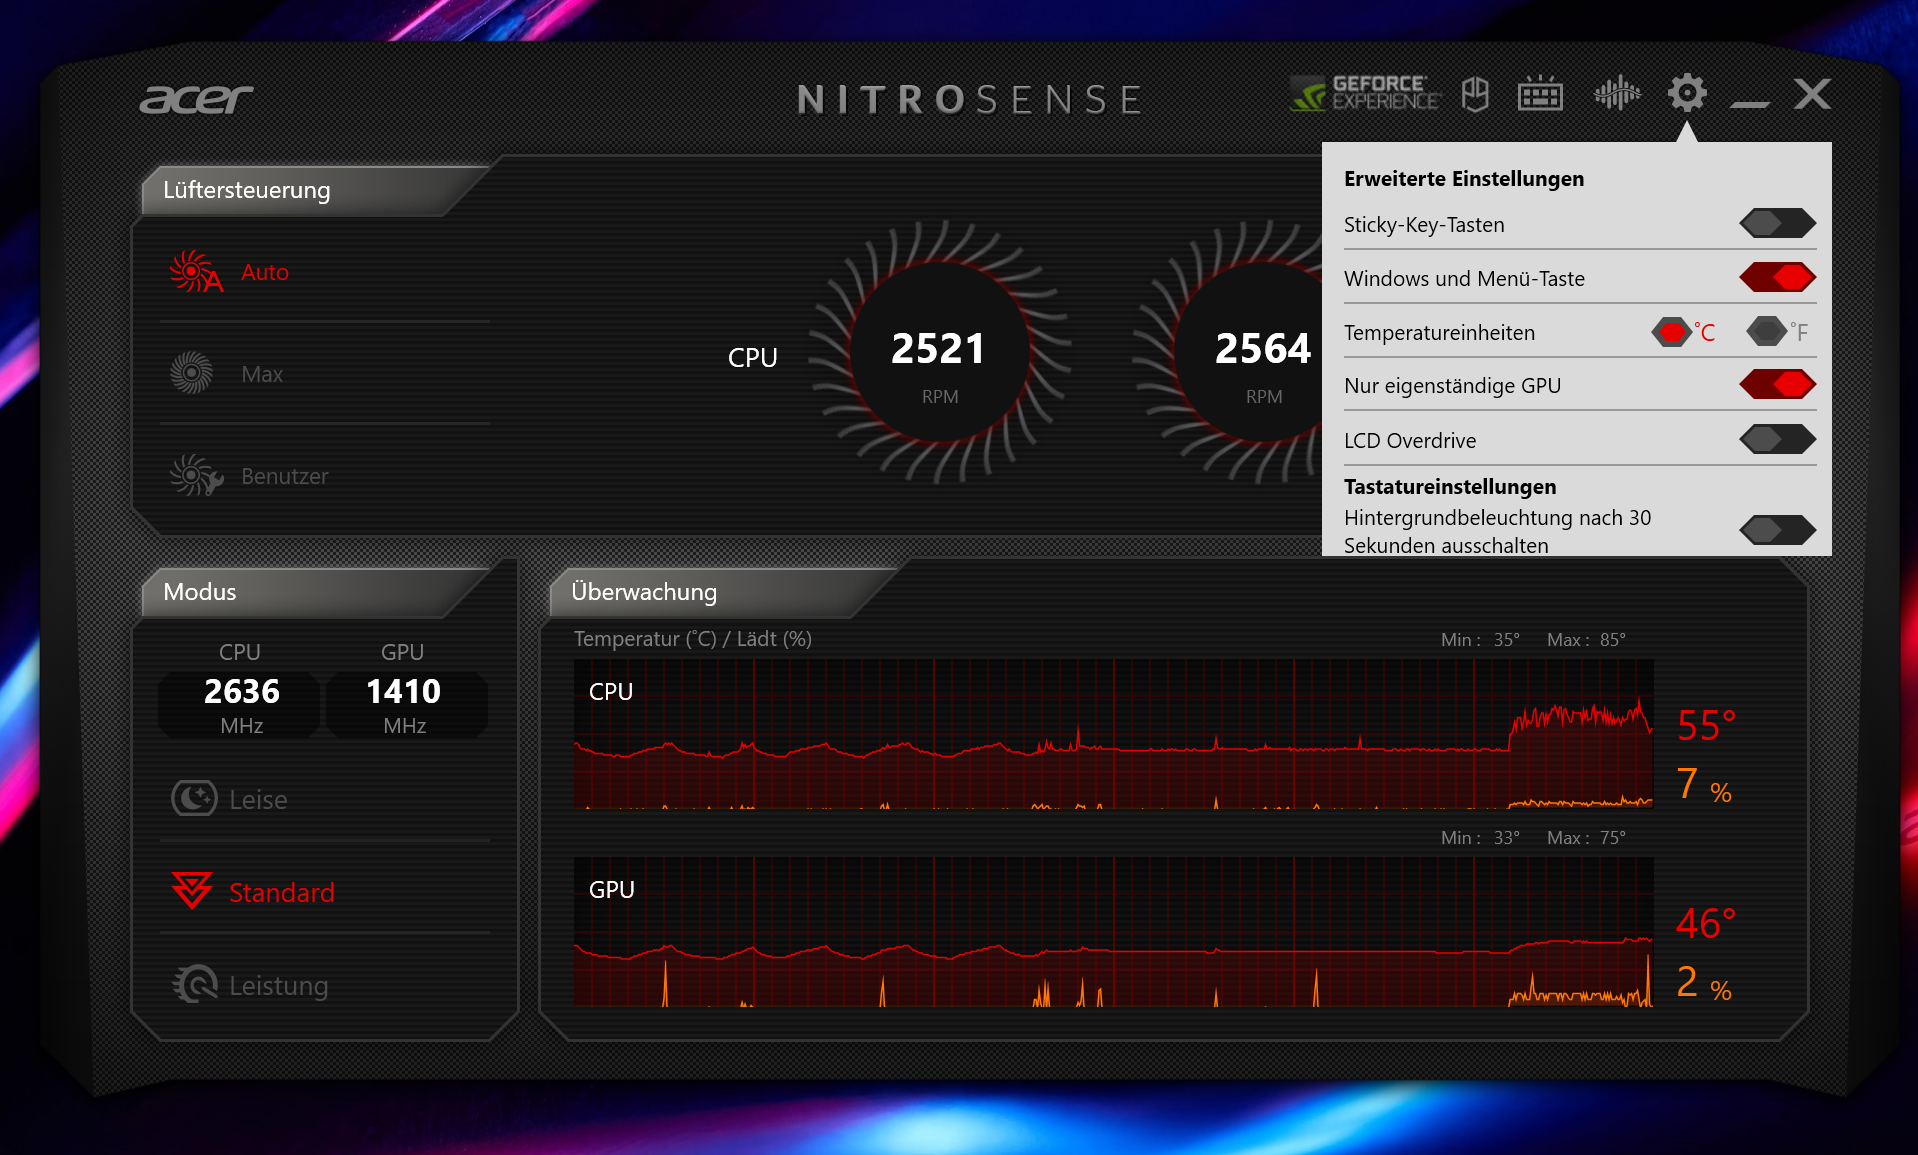
But there is still room for improvement: The notebook offers the option of direct image output via the GeForce GPU. To enable this, the iGPU has to be deactivated - directly in the BIOS or via the NitroSense software. In combination with the "Performance" profile, the graphics performance increases noticeably.


| 3DMark 11 Performance | 27608 points | |
| 3DMark Cloud Gate Standard Score | 42815 points | |
| 3DMark Fire Strike Score | 22252 points | |
| 3DMark Time Spy Score | 10066 points | |
Help | ||
| 3DMark Performance Rating - Percent | |
| Average of class Gaming | |
| MSI Vector GP66 12UGS | |
| Lenovo Legion 5 Pro 16 G7 i7 RTX 3070Ti -1! | |
| Acer Nitro 5 AN515-58-72QR | |
| Acer Nitro 5 AN515-58-72QR | |
| Average NVIDIA GeForce RTX 3070 Ti Laptop GPU | |
| Acer Nitro 5 AN515-58-72QR | |
| HP Omen 16-b1090ng | |
| Acer Nitro 5 AN515-58-72QR | |
| HP Omen 16-c0077ng -1! | |
| 3DMark 11 - 1280x720 Performance GPU | |
| MSI Vector GP66 12UGS | |
| Average of class Gaming (1029 - 72070, n=232, last 2 years) | |
| Acer Nitro 5 AN515-58-72QR (Leistung) | |
| Acer Nitro 5 AN515-58-72QR (dGPU, Leistung) | |
| Acer Nitro 5 AN515-58-72QR | |
| Average NVIDIA GeForce RTX 3070 Ti Laptop GPU (13799 - 42569, n=36) | |
| HP Omen 16-b1090ng | |
| Acer Nitro 5 AN515-58-72QR (Leise) | |
| HP Omen 16-c0077ng | |
Gaming Performance
All current games run very smoothly in QHD resolution at high to maximum settings. The frame rate is below the RTX 3070 Ti average in standard mode. The direct image output via the GeForce GPU in combination with the "Performance" profile increases the frame rate significantly in some cases.
| The Witcher 3 - 1920x1080 Ultra Graphics & Postprocessing (HBAO+) | |
| Average of class Gaming (8.61 - 216, n=226, last 2 years) | |
| MSI Vector GP66 12UGS | |
| Acer Nitro 5 AN515-58-72QR (Leistung) | |
| Acer Nitro 5 AN515-58-72QR (dGPU, Leistung) | |
| Lenovo Legion 5 Pro 16 G7 i7 RTX 3070Ti | |
| Average NVIDIA GeForce RTX 3070 Ti Laptop GPU (76.8 - 124.1, n=39) | |
| Acer Nitro 5 AN515-58-72QR | |
| HP Omen 16-b1090ng | |
| Acer Nitro 5 AN515-58-72QR (Leise) | |
| HP Omen 16-c0077ng | |
| Dota 2 Reborn - 1920x1080 ultra (3/3) best looking | |
| MSI Vector GP66 12UGS | |
| HP Omen 16-b1090ng | |
| Lenovo Legion 5 Pro 16 G7 i7 RTX 3070Ti | |
| Average of class Gaming (26.9 - 220, n=238, last 2 years) | |
| Acer Nitro 5 AN515-58-72QR (dGPU, Leistung) | |
| Average NVIDIA GeForce RTX 3070 Ti Laptop GPU (68.7 - 160.5, n=38) | |
| Acer Nitro 5 AN515-58-72QR | |
| Acer Nitro 5 AN515-58-72QR (Leise) | |
| Acer Nitro 5 AN515-58-72QR (Leistung) | |
| HP Omen 16-c0077ng | |
| X-Plane 11.11 - 1920x1080 high (fps_test=3) | |
| HP Omen 16-b1090ng | |
| MSI Vector GP66 12UGS | |
| Average of class Gaming (12.4 - 166.2, n=243, last 2 years) | |
| Acer Nitro 5 AN515-58-72QR (dGPU, Leistung) | |
| Lenovo Legion 5 Pro 16 G7 i7 RTX 3070Ti | |
| Average NVIDIA GeForce RTX 3070 Ti Laptop GPU (51.6 - 116.9, n=37) | |
| Acer Nitro 5 AN515-58-72QR | |
| Acer Nitro 5 AN515-58-72QR (Leistung) | |
| Acer Nitro 5 AN515-58-72QR (Leise) | |
| HP Omen 16-c0077ng | |
| Final Fantasy XV Benchmark | |
| 1920x1080 High Quality | |
| MSI Vector GP66 12UGS (1.3) | |
| Average of class Gaming (9.13 - 194.9, n=228, last 2 years) | |
| Lenovo Legion 5 Pro 16 G7 i7 RTX 3070Ti (1.3) | |
| Acer Nitro 5 AN515-58-72QR (1.3, dGPU, Leistung) | |
| HP Omen 16-b1090ng | |
| Average NVIDIA GeForce RTX 3070 Ti Laptop GPU (49.5 - 122.4, n=35) | |
| Acer Nitro 5 AN515-58-72QR (1.3, Leistung) | |
| Acer Nitro 5 AN515-58-72QR (1.3) | |
| HP Omen 16-c0077ng (1.3) | |
| Acer Nitro 5 AN515-58-72QR (1.3, Leise) | |
| 2560x1440 High Quality | |
| Average of class Gaming (19.8 - 162.9, n=163, last 2 years) | |
| Lenovo Legion 5 Pro 16 G7 i7 RTX 3070Ti (1.3) | |
| Acer Nitro 5 AN515-58-72QR (1.3, dGPU, Leistung) | |
| Average NVIDIA GeForce RTX 3070 Ti Laptop GPU (57.9 - 93, n=24) | |
| Acer Nitro 5 AN515-58-72QR (1.3, Leistung) | |
| Acer Nitro 5 AN515-58-72QR (1.3) | |
| Acer Nitro 5 AN515-58-72QR (1.3, Leise) | |
| HP Omen 16-c0077ng (1.3) | |
| GTA V | |
| 2560x1440 Highest Settings possible AA:4xMSAA + FX AF:16x | |
| Average of class Gaming (5.61 - 160.6, n=139, last 2 years) | |
| Lenovo Legion 5 Pro 16 G7 i7 RTX 3070Ti | |
| Acer Nitro 5 AN515-58-72QR (dGPU, Leistung) | |
| Average NVIDIA GeForce RTX 3070 Ti Laptop GPU (72.7 - 108.7, n=22) | |
| Acer Nitro 5 AN515-58-72QR (Leistung) | |
| Acer Nitro 5 AN515-58-72QR | |
| Acer Nitro 5 AN515-58-72QR (Leise) | |
| HP Omen 16-c0077ng | |
| 1920x1080 Highest Settings possible AA:4xMSAA + FX AF:16x | |
| MSI Vector GP66 12UGS | |
| Lenovo Legion 5 Pro 16 G7 i7 RTX 3070Ti | |
| Acer Nitro 5 AN515-58-72QR (dGPU, Leistung) | |
| HP Omen 16-b1090ng | |
| Average of class Gaming (6.38 - 167.7, n=218, last 2 years) | |
| Average NVIDIA GeForce RTX 3070 Ti Laptop GPU (44 - 123.9, n=36) | |
| Acer Nitro 5 AN515-58-72QR | |
| Acer Nitro 5 AN515-58-72QR (Leise) | |
| HP Omen 16-c0077ng | |
| Strange Brigade | |
| 2560x1440 ultra AA:ultra AF:16 | |
| Average of class Gaming (79.8 - 322, n=139, last 2 years) | |
| Acer Nitro 5 AN515-58-72QR (1.47.22.14 D3D12, dGPU, Leistung) | |
| Lenovo Legion 5 Pro 16 G7 i7 RTX 3070Ti | |
| Acer Nitro 5 AN515-58-72QR (1.47.22.14 D3D12, Leistung) | |
| Average NVIDIA GeForce RTX 3070 Ti Laptop GPU (110.7 - 160.5, n=21) | |
| Acer Nitro 5 AN515-58-72QR (1.47.22.14 D3D12) | |
| Acer Nitro 5 AN515-58-72QR (1.47.22.14 D3D12, Leise) | |
| HP Omen 16-c0077ng | |
| 1920x1080 ultra AA:ultra AF:16 | |
| MSI Vector GP66 12UGS (1.47.22.14 D3D12) | |
| Average of class Gaming (14.6 - 421, n=226, last 2 years) | |
| Acer Nitro 5 AN515-58-72QR (1.47.22.14 D3D12, dGPU, Leistung) | |
| Lenovo Legion 5 Pro 16 G7 i7 RTX 3070Ti | |
| Acer Nitro 5 AN515-58-72QR (1.47.22.14 D3D12, Leistung) | |
| Average NVIDIA GeForce RTX 3070 Ti Laptop GPU (109 - 221, n=37) | |
| Acer Nitro 5 AN515-58-72QR (1.47.22.14 D3D12) | |
| HP Omen 16-c0077ng | |
| Acer Nitro 5 AN515-58-72QR (1.47.22.14 D3D12, Leise) | |
| HP Omen 16-b1090ng (1.47.22.14 D3D12) | |
| F1 2021 | |
| 2560x1440 Ultra High Preset + Raytracing AA:T AF:16x | |
| Average of class Gaming (47.5 - 204, n=39, last 2 years) | |
| Lenovo Legion 5 Pro 16 G7 i7 RTX 3070Ti (852849) | |
| Acer Nitro 5 AN515-58-72QR (874931, dGPU, Leistung) | |
| Acer Nitro 5 AN515-58-72QR (874931, Leistung) | |
| Average NVIDIA GeForce RTX 3070 Ti Laptop GPU (47.5 - 99.2, n=11) | |
| Acer Nitro 5 AN515-58-72QR (874931) | |
| Acer Nitro 5 AN515-58-72QR (874931, Leise) | |
| 1920x1080 Ultra High Preset + Raytracing AA:T AF:16x | |
| Lenovo Legion 5 Pro 16 G7 i7 RTX 3070Ti (852849) | |
| Acer Nitro 5 AN515-58-72QR (874931, dGPU, Leistung) | |
| Average of class Gaming (13.5 - 271, n=63, last 2 years) | |
| Acer Nitro 5 AN515-58-72QR (874931, Leistung) | |
| Average NVIDIA GeForce RTX 3070 Ti Laptop GPU (67.3 - 134.2, n=13) | |
| Acer Nitro 5 AN515-58-72QR (874931) | |
| Acer Nitro 5 AN515-58-72QR (874931, Leise) | |
| Far Cry 5 | |
| 2560x1440 Ultra Preset AA:T | |
| Average of class Gaming (14 - 194, n=93, last 2 years) | |
| Lenovo Legion 5 Pro 16 G7 i7 RTX 3070Ti | |
| Average NVIDIA GeForce RTX 3070 Ti Laptop GPU (77 - 111, n=15) | |
| Acer Nitro 5 AN515-58-72QR (dGPU, Leistung) | |
| HP Omen 16-c0077ng | |
| Acer Nitro 5 AN515-58-72QR | |
| 1920x1080 Ultra Preset AA:T | |
| MSI Vector GP66 12UGS | |
| Average of class Gaming (14 - 218, n=125, last 2 years) | |
| Lenovo Legion 5 Pro 16 G7 i7 RTX 3070Ti | |
| Average NVIDIA GeForce RTX 3070 Ti Laptop GPU (91 - 138, n=25) | |
| Acer Nitro 5 AN515-58-72QR (dGPU, Leistung) | |
| HP Omen 16-c0077ng | |
| Acer Nitro 5 AN515-58-72QR | |
To determine whether the frame rates remain largely constant over longer periods of time, we ran the game The Witcher 3 for about 60 minutes in Full HD resolution and at maximum quality settings. The game character was not moved. No noticeable drop in frame rates were detected.
Witcher 3 FPS Chart
| low | med. | high | ultra | QHD | |
| GTA V (2015) | 180.3 | 176.9 | 152.5 | 95 | 81.8 |
| The Witcher 3 (2015) | 329 | 244 | 162.7 | 99.4 | |
| Dota 2 Reborn (2015) | 161.9 | 145 | 133.3 | 126.8 | |
| Final Fantasy XV Benchmark (2018) | 144.4 | 113.9 | 88.3 | 70.1 | |
| X-Plane 11.11 (2018) | 127.2 | 109.8 | 89.7 | ||
| Far Cry 5 (2018) | 144 | 105 | 99 | 91 | 77 |
| Strange Brigade (2018) | 358 | 231 | 198.2 | 178.3 | 136.7 |
| F1 2021 (2021) | 266 | 208 | 178.3 | 106.2 | 82.6 |
Emissions: Lots of noise under load
Noise
The two fans do not produce excessive amounts of noise in everyday use (office, internet). Sometimes they even stand still. Under load is a different story: the laptop gets loud with maximum sound pressure levels of up to 53 dB(A) (stress test, Witcher 3 test). Under the "Performance" profile, the fans run at full power constantly.
The difference between the "Quiet" and "Standard" profiles is not particularly large under load - other gaming notebooks offer better quiet modes. If necessary, the fan speeds can be reduced via the NitroSense software. Manual adjusting of the fan settings is not possible.
Noise Level
| Idle |
| 26 / 29 / 33 dB(A) |
| Load |
| 47 / 53 dB(A) |
 | ||
30 dB silent 40 dB(A) audible 50 dB(A) loud |
||
min: | ||
| Acer Nitro 5 AN515-58-72QR GeForce RTX 3070 Ti Laptop GPU, i7-12700H, Samsung PM9A1 MZVL21T0HCLR | MSI Vector GP66 12UGS GeForce RTX 3070 Ti Laptop GPU, i9-12900H | HP Omen 16-b1090ng GeForce RTX 3070 Ti Laptop GPU, i7-12700H, WDC PC SN810 1TB | Lenovo Legion 5 Pro 16 G7 i7 RTX 3070Ti GeForce RTX 3070 Ti Laptop GPU, i7-12700H, Samsung PM9A1 MZVL21T0HCLR | |
|---|---|---|---|---|
| Noise | 9% | -5% | 2% | |
| off / environment * | 26 | 22.9 12% | 26 -0% | 24.6 5% |
| Idle Minimum * | 26 | 23.4 10% | 30 -15% | 28.4 -9% |
| Idle Average * | 29 | 23.4 19% | 31 -7% | 28.4 2% |
| Idle Maximum * | 33 | 27.4 17% | 33 -0% | 28.4 14% |
| Load Average * | 47 | 36 23% | 49 -4% | 49.4 -5% |
| Witcher 3 ultra * | 53 | 58.2 -10% | 53 -0% | 49.4 7% |
| Load Maximum * | 53 | 58 -9% | 57 -8% | 54.7 -3% |
* ... smaller is better
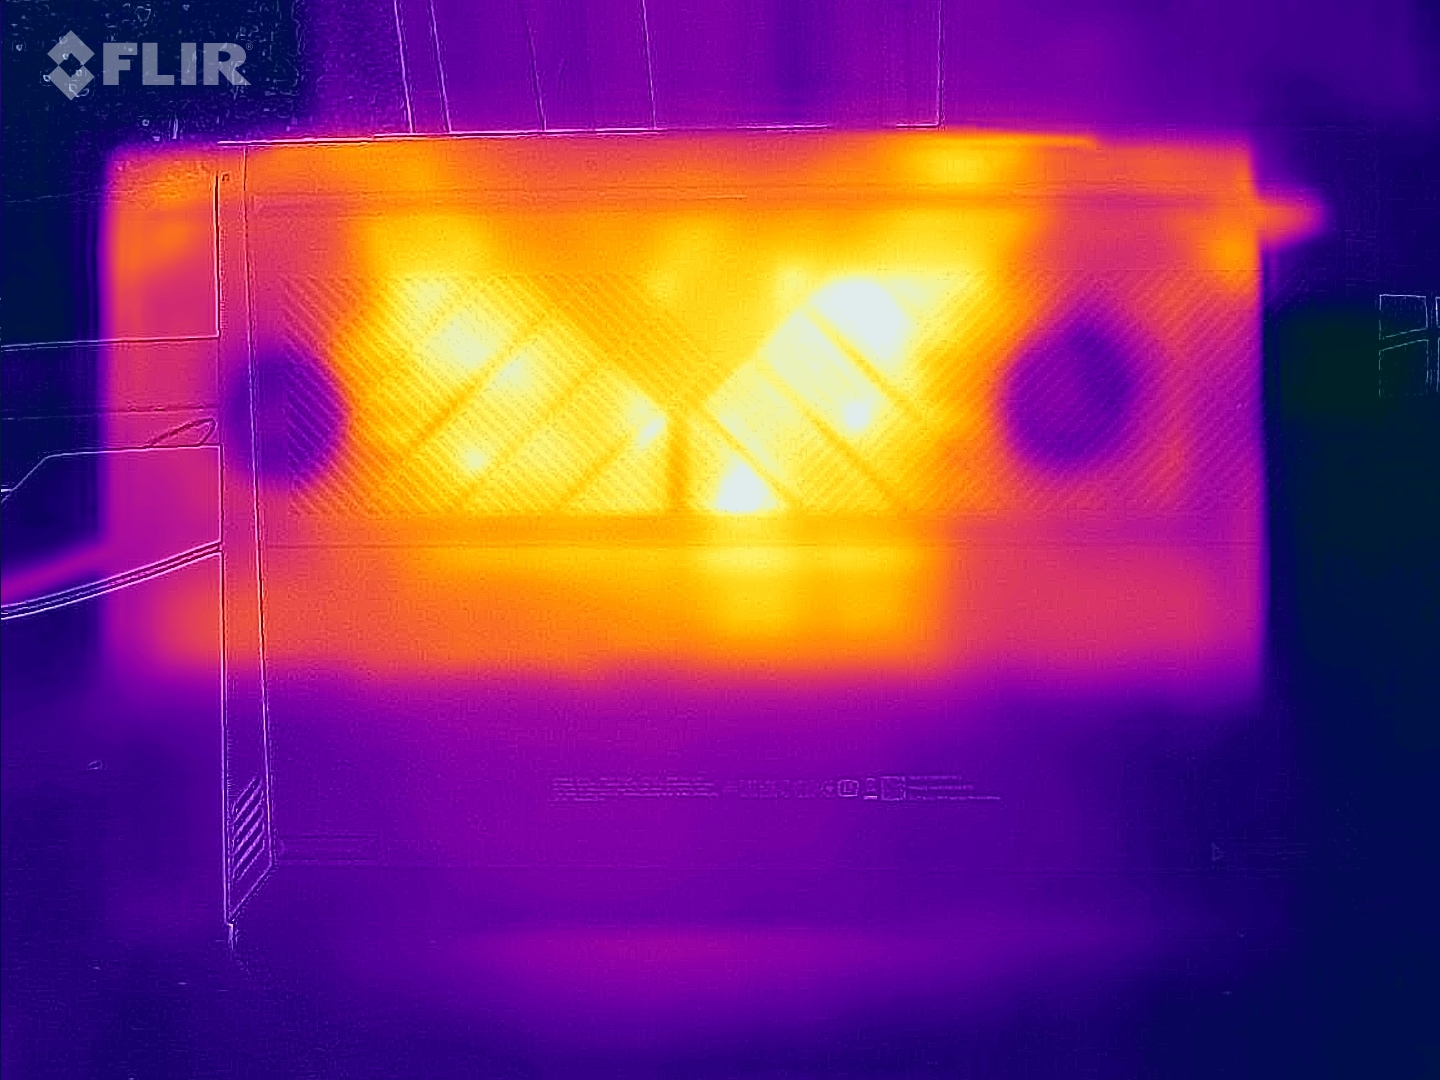
Temperature
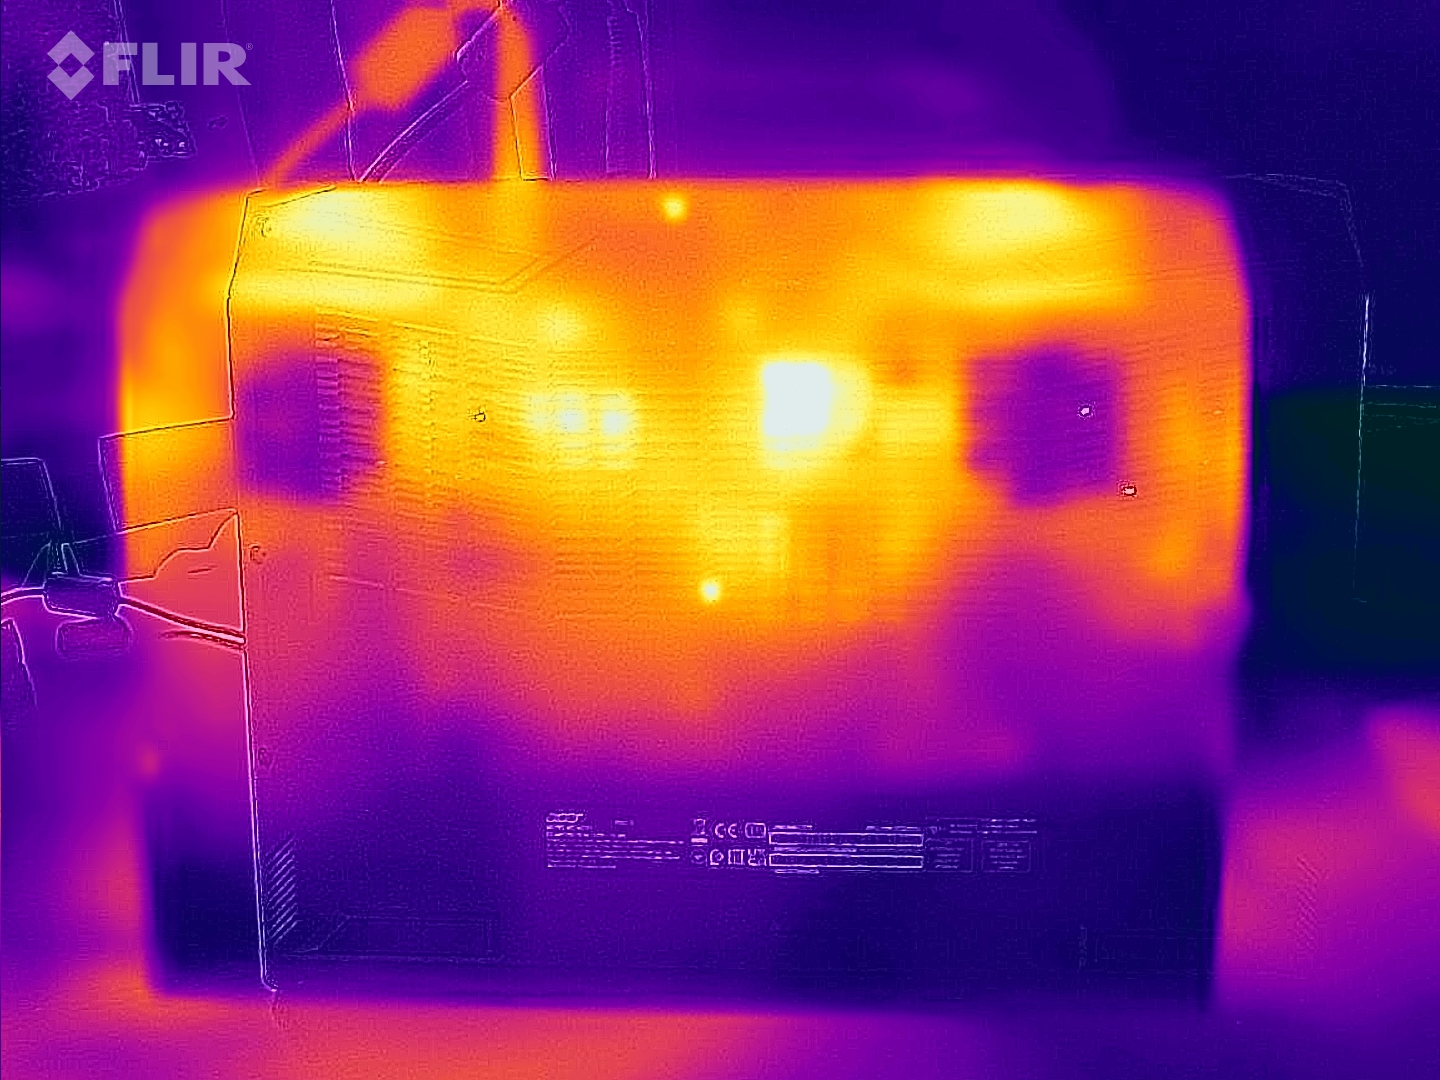
Case temperatures remain within the green range in everyday use (office, Internet). The notebook heats up noticeably under load (stress test, Witcher 3 test), but remains within acceptable limits. The CPU temperatures sometimes reach the red zone. Accordingly, the CPU clock significantly drops in the course of the test.
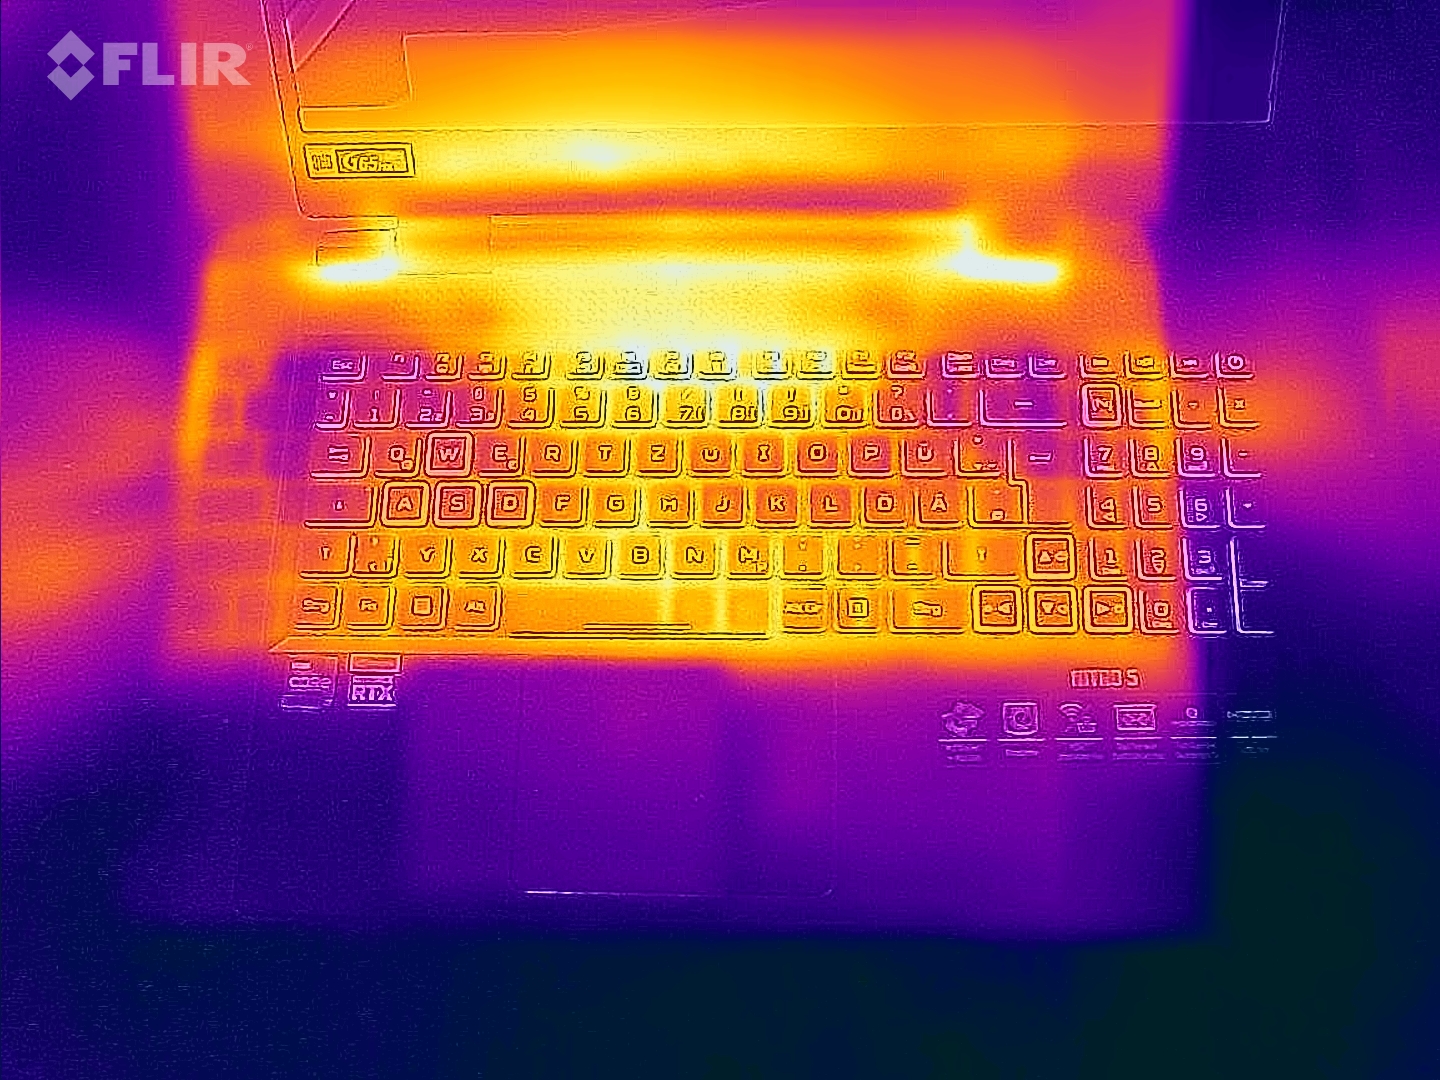
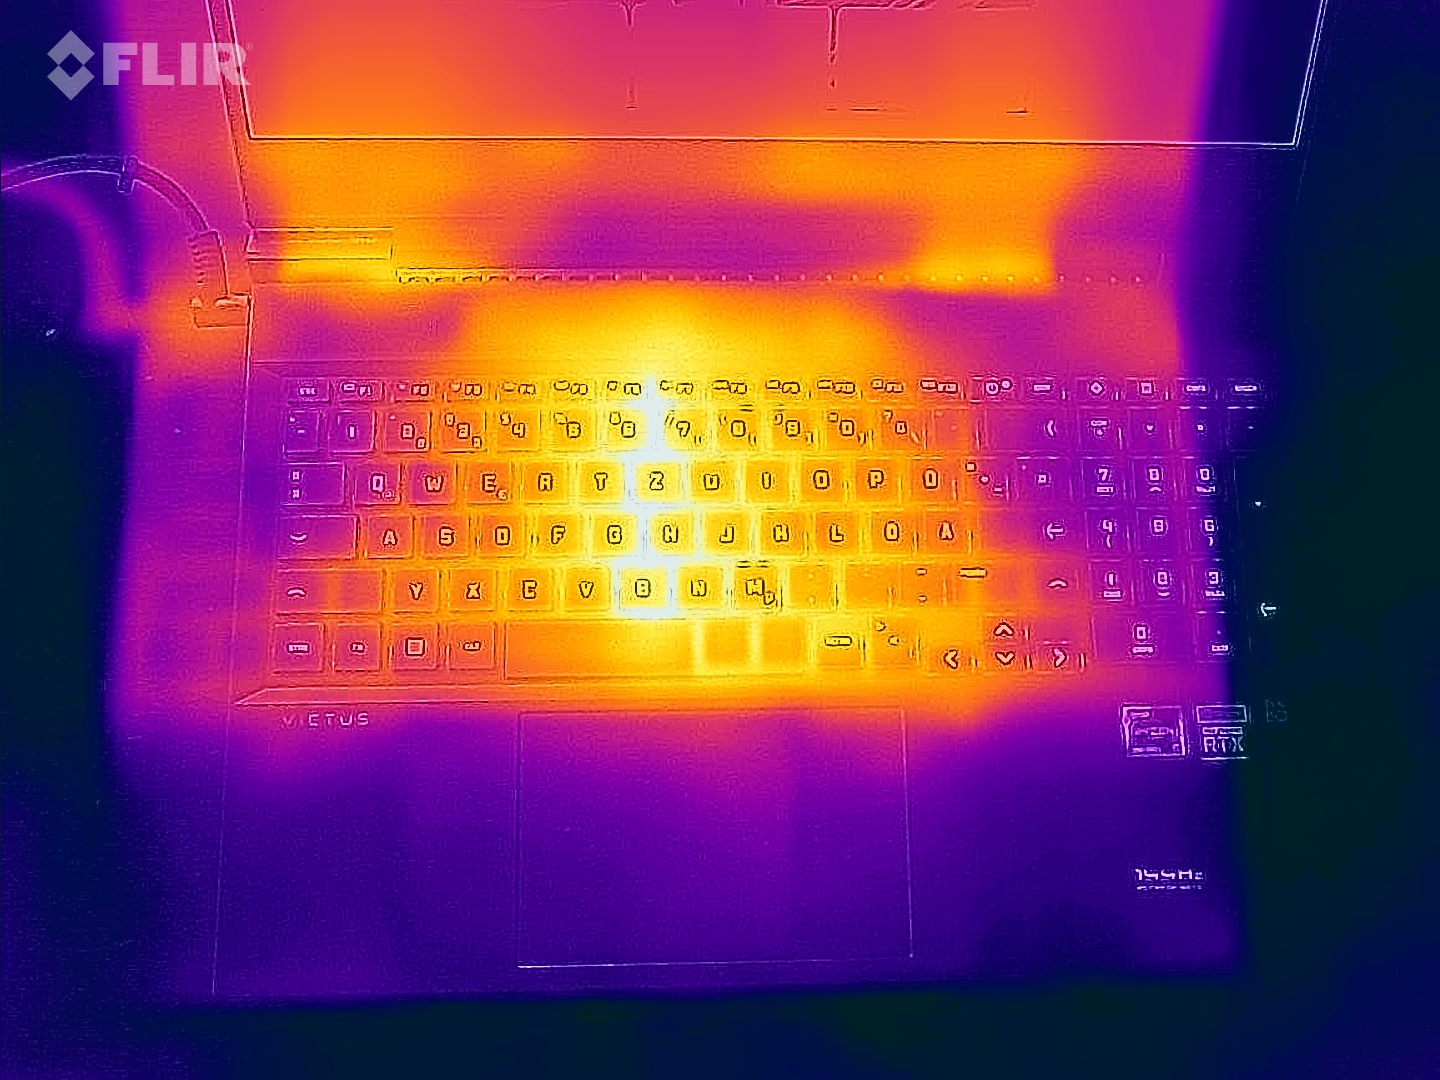
(-) The maximum temperature on the upper side is 48 °C / 118 F, compared to the average of 40.4 °C / 105 F, ranging from 21.2 to 68.8 °C for the class Gaming.
(-) The bottom heats up to a maximum of 51 °C / 124 F, compared to the average of 43.2 °C / 110 F
(+) In idle usage, the average temperature for the upper side is 31.3 °C / 88 F, compared to the device average of 33.8 °C / 93 F.
(-) Playing The Witcher 3, the average temperature for the upper side is 42.4 °C / 108 F, compared to the device average of 33.8 °C / 93 F.
(±) The palmrests and touchpad can get very hot to the touch with a maximum of 38 °C / 100.4 F.
(-) The average temperature of the palmrest area of similar devices was 28.9 °C / 84 F (-9.1 °C / -16.4 F).
| Acer Nitro 5 AN515-58-72QR Intel Core i7-12700H, NVIDIA GeForce RTX 3070 Ti Laptop GPU | MSI Vector GP66 12UGS Intel Core i9-12900H, NVIDIA GeForce RTX 3070 Ti Laptop GPU | HP Omen 16-b1090ng Intel Core i7-12700H, NVIDIA GeForce RTX 3070 Ti Laptop GPU | Lenovo Legion 5 Pro 16 G7 i7 RTX 3070Ti Intel Core i7-12700H, NVIDIA GeForce RTX 3070 Ti Laptop GPU | |
|---|---|---|---|---|
| Heat | 4% | 10% | 2% | |
| Maximum Upper Side * | 48 | 40.2 16% | 41 15% | 45.3 6% |
| Maximum Bottom * | 51 | 43.8 14% | 62 -22% | 61.2 -20% |
| Idle Upper Side * | 34 | 34.8 -2% | 25 26% | 28.6 16% |
| Idle Bottom * | 33 | 37 -12% | 26 21% | 31.4 5% |
* ... smaller is better
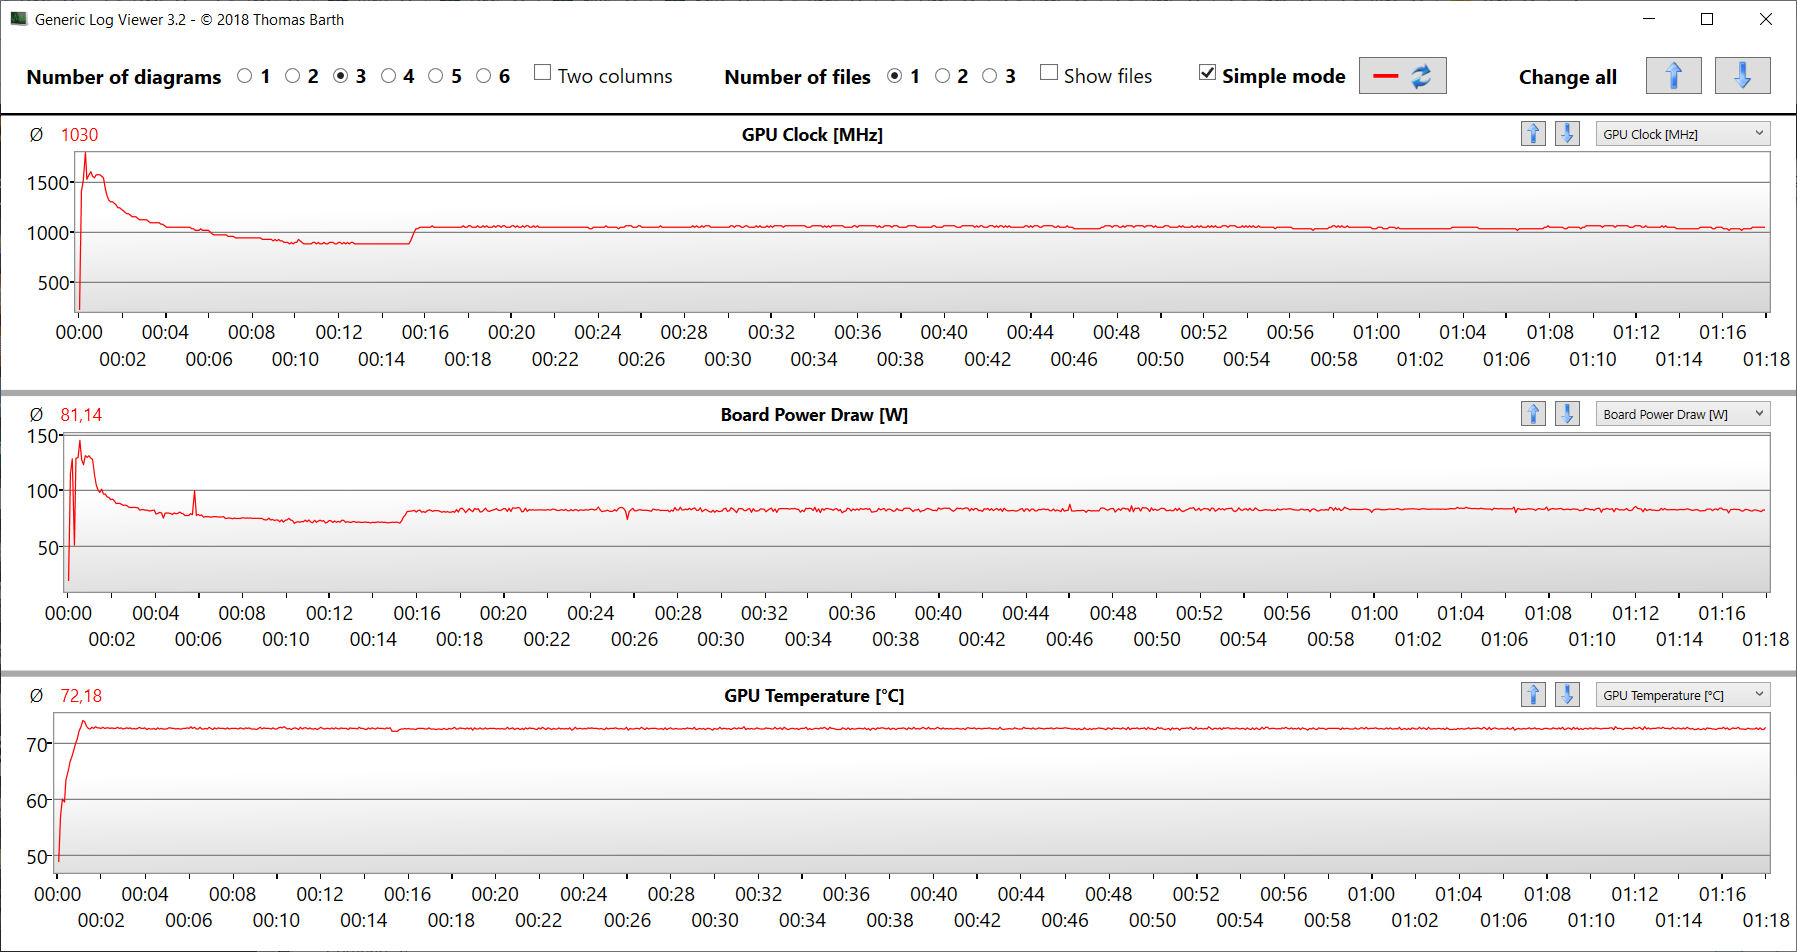
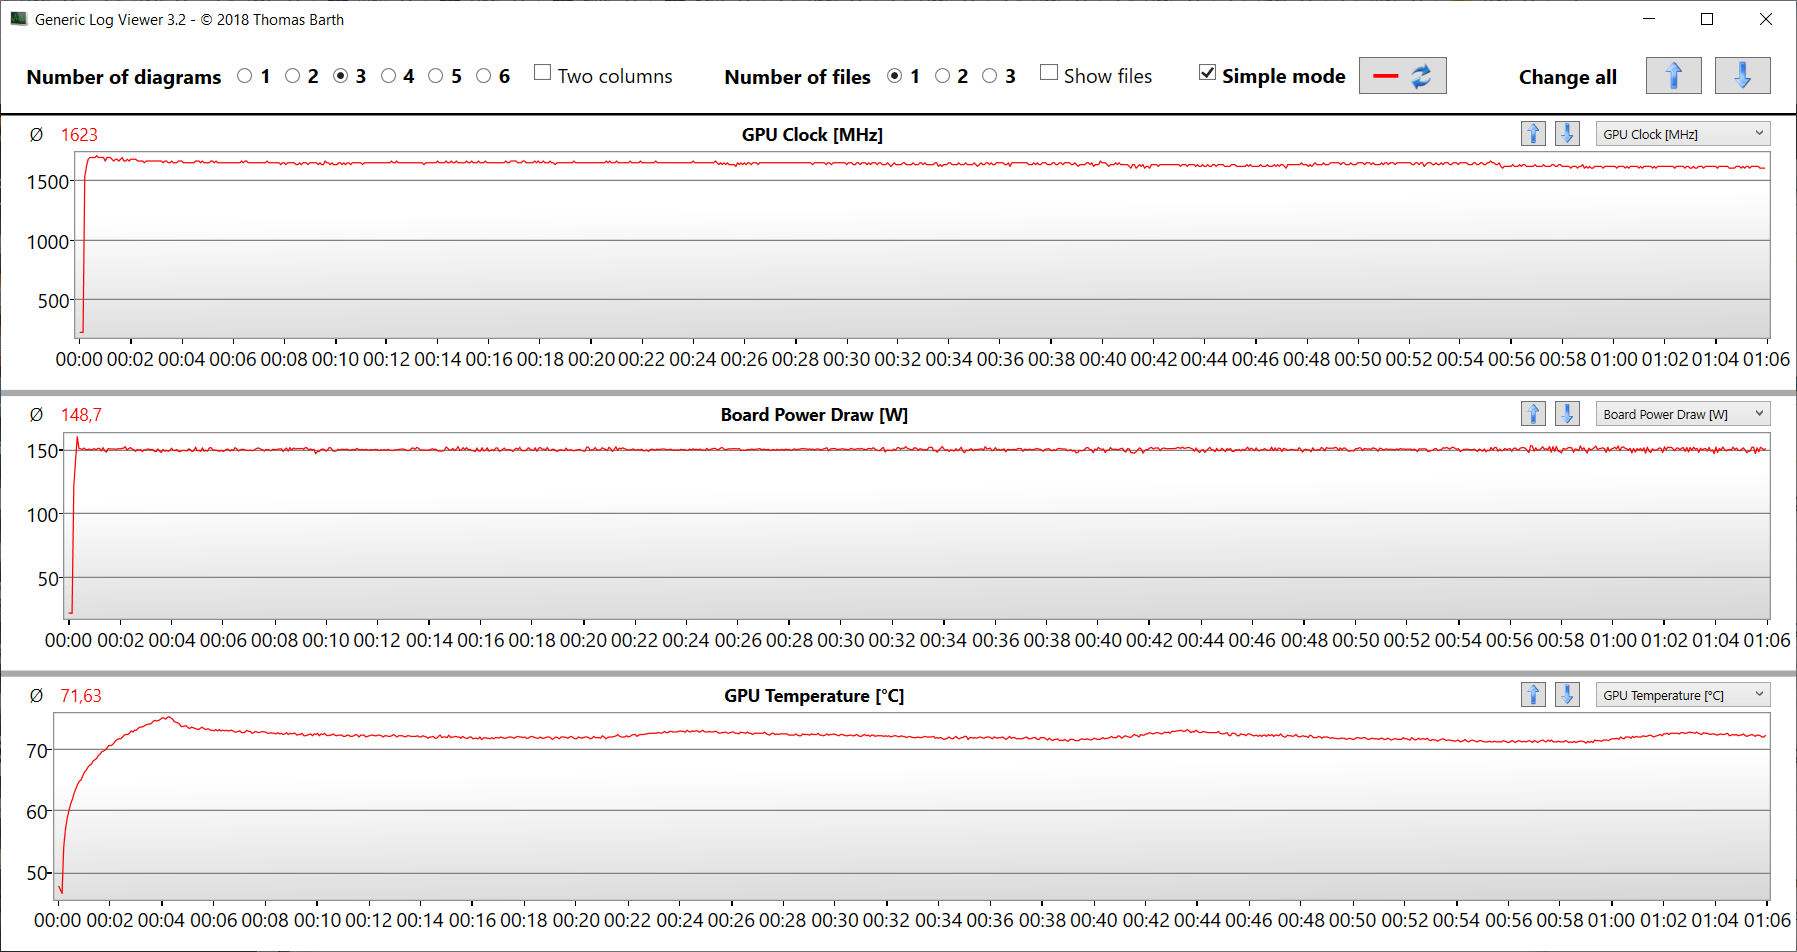
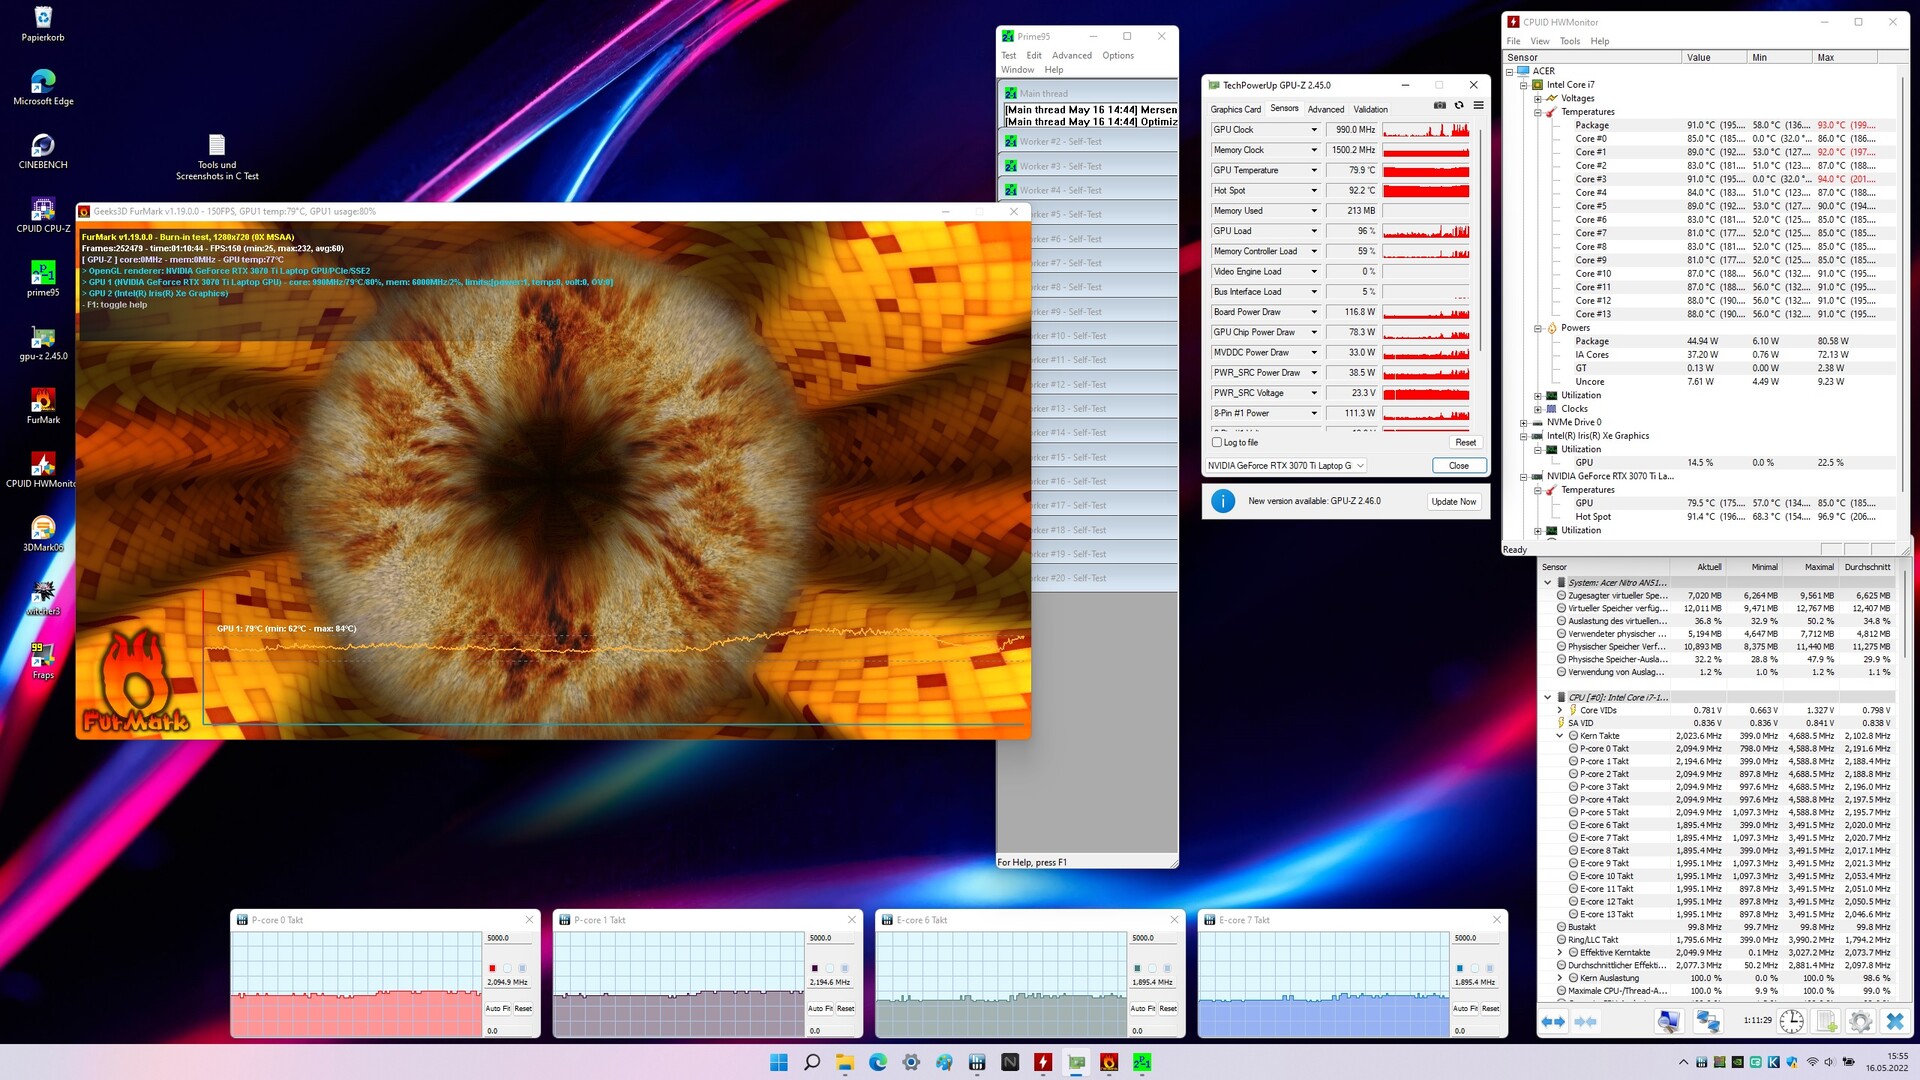
Stress Test
The CPU ran at high clock speeds at the beginning of the stress test (Prime95 and Furmark run for at least one hour) before later dropping to to 2.1 GHz (P cores) and 1.9 GHz (E cores). The GPU operated at speeds between 600 and 1,000 MHz. The stress test represents an extreme scenario. We use this test to check whether the system runs stably under full load.
Speakers
The stereo speakers produce an acceptable sound quality that could use more bass. We recommend using headphones or external speakers for a better sound experience.
Acer Nitro 5 AN515-58-72QR audio analysis
(±) | speaker loudness is average but good (77 dB)
Bass 100 - 315 Hz
(±) | reduced bass - on average 14.4% lower than median
(±) | linearity of bass is average (12.8% delta to prev. frequency)
Mids 400 - 2000 Hz
(+) | balanced mids - only 1.2% away from median
(+) | mids are linear (3.2% delta to prev. frequency)
Highs 2 - 16 kHz
(±) | higher highs - on average 5.4% higher than median
(±) | linearity of highs is average (10.4% delta to prev. frequency)
Overall 100 - 16.000 Hz
(±) | linearity of overall sound is average (15.8% difference to median)
Compared to same class
» 34% of all tested devices in this class were better, 7% similar, 59% worse
» The best had a delta of 6%, average was 18%, worst was 132%
Compared to all devices tested
» 20% of all tested devices were better, 5% similar, 75% worse
» The best had a delta of 4%, average was 25%, worst was 134%
HP Omen 16-b1090ng audio analysis
(+) | speakers can play relatively loud (83 dB)
Bass 100 - 315 Hz
(-) | nearly no bass - on average 24.4% lower than median
(±) | linearity of bass is average (13.8% delta to prev. frequency)
Mids 400 - 2000 Hz
(+) | balanced mids - only 1.9% away from median
(+) | mids are linear (2.8% delta to prev. frequency)
Highs 2 - 16 kHz
(+) | balanced highs - only 2.2% away from median
(+) | highs are linear (3.8% delta to prev. frequency)
Overall 100 - 16.000 Hz
(±) | linearity of overall sound is average (15.1% difference to median)
Compared to same class
» 29% of all tested devices in this class were better, 6% similar, 64% worse
» The best had a delta of 6%, average was 18%, worst was 132%
Compared to all devices tested
» 17% of all tested devices were better, 4% similar, 79% worse
» The best had a delta of 4%, average was 25%, worst was 134%
Power Management: The battery runtimes are no reason for joy
Power Consumption
The AN515 does not reveal any abnormalities during power consumption. The stress test and the Witcher 3 test saw power consumption rise up to 220 watts and an average of 195 watts. While the Witcher 3 test ran under constant power consumption, the demand dropped slightly over the course of the stress test. The included power supply is sufficiently sized with a nominal output of 280 watts.
| Off / Standby | |
| Idle | |
| Load |
|
| Acer Nitro 5 AN515-58-72QR i7-12700H, GeForce RTX 3070 Ti Laptop GPU | MSI Vector GP66 12UGS i9-12900H, GeForce RTX 3070 Ti Laptop GPU | HP Omen 16-b1090ng i7-12700H, GeForce RTX 3070 Ti Laptop GPU | Lenovo Legion 5 Pro 16 G7 i7 RTX 3070Ti i7-12700H, GeForce RTX 3070 Ti Laptop GPU | Average NVIDIA GeForce RTX 3070 Ti Laptop GPU | Average of class Gaming | |
|---|---|---|---|---|---|---|
| Power Consumption | -52% | 19% | -9% | -32% | -28% | |
| Idle Minimum * | 7 | 17.5 -150% | 4 43% | 8.6 -23% | 14.2 ? -103% | 13.8 ? -97% |
| Idle Average * | 15 | 20.1 -34% | 10 33% | 17.6 -17% | 19.9 ? -33% | 19.2 ? -28% |
| Idle Maximum * | 24 | 47.3 -97% | 19 21% | 18.5 23% | 26.2 ? -9% | 27 ? -13% |
| Load Average * | 124 | 107.3 13% | 114 8% | 110 11% | 125.8 ? -1% | 111.3 ? 10% |
| Witcher 3 ultra * | 195.1 | 225 -15% | 183.2 6% | 227 -16% | ||
| Load Maximum * | 220 | 277.7 -26% | 221 -0% | 294.6 -34% | 248 ? -13% | 251 ? -14% |
* ... smaller is better
Power Consumption Witcher 3 / Stress Test
Power Consumption with External Monitor
Battery Life
The 15.6 incher achieved runtimes of 3:54 h in the WLAN test (loading websites via a script) and and 4:43 h in the video test (short film Big Buck Bunny, H.264 encoding, FHD, in a loop). During both tests, the notebook's energy-saving features were disabled and the display brightness was set to around 150 cd/m². The wireless modules were also disabled for the video test.
The meager runtimes are due to the relatively low battery capacity (57.5 Wh). Calculated down to the watt-hour, the Nitro delivers endurance values similar to the Omen 16 (83 Wh) and the Legion 5 Pro (80 Wh) in the real-world WLAN test.
| Acer Nitro 5 AN515-58-72QR i7-12700H, GeForce RTX 3070 Ti Laptop GPU, 57.5 Wh | MSI Vector GP66 12UGS i9-12900H, GeForce RTX 3070 Ti Laptop GPU, 65 Wh | HP Omen 16-b1090ng i7-12700H, GeForce RTX 3070 Ti Laptop GPU, 83 Wh | Lenovo Legion 5 Pro 16 G7 i7 RTX 3070Ti i7-12700H, GeForce RTX 3070 Ti Laptop GPU, 80 Wh | Average of class Gaming | |
|---|---|---|---|---|---|
| Battery Runtime | 23% | 60% | 8% | 44% | |
| Reader / Idle | 340 | 473 39% | 603 77% | 544 ? 60% | |
| H.264 | 283 | 377 33% | 399 ? 41% | ||
| WiFi v1.3 | 234 | 342 46% | 336 44% | 326 39% | 368 ? 57% |
| Load | 72 | 61 -15% | 114 58% | 37 -49% | 84.2 ? 17% |
Pros
Cons
Verdict: Successful gaming notebook

The Nitro 5 is a well-balanced gaming laptop for just under US$ 2400. A Core i7-12700H CPU and a GeForce RTX 3070 Ti Laptop GPU enable QHD gaming at high to maximum settings, accompanied by fast PCIe-4-SSD (1 TB) and 16 GB of RAM.
Acer delivers a solid QHD gaming notebook with the Nitro 5 AN515-58. However, the laptop is not completely free of shortcomings.
The CPU and GPU can work at consistently high clock rates. The laptop heats up noticeably under load, but not excessively. Noise development is on the usual class level. Once again, however, Acer needs to improve the fan control.
The 15.6-inch screen (QHD, IPS, 165 Hz) gives a good impression overall, but the same cannot be said for the battery runtimes. At least the battery can be charged via a universal USB-C power adapter (min. 65 watts, 20 V) as the Thunderbolt 4 slot supports Power Delivery, thus removing the need to carry the bulky 280-watt power adapter around.
An alternative to the Nitro 5 is the Lenovo Legion 5 Pro 16 G7, which delivers slightly better performance benchmarks with the same CPU-GPU combination, offers faster DDR5 working memory and has a 16:10 screen on board. The battery runtimes are also better.
Price and Availability
In the US, a sister model (Acer Nitro 5 AN515-58-7853) is currently available for a price of US$ 2399.99 via Amazon. In contrast to the reviewed 72QR model above, this variant comes with 2TB and 32GB of DDR4 RAM.
Acer Nitro 5 AN515-58-72QR
-
06/02/2022 v7
Sascha Mölck
Pricecompare

