 Deutsch
 English
 Español
 Français
 Italiano
 Nederlands
 Polski
 Português
 Русский
 Türkçe
 Svenska
 Chinese
 Magyar
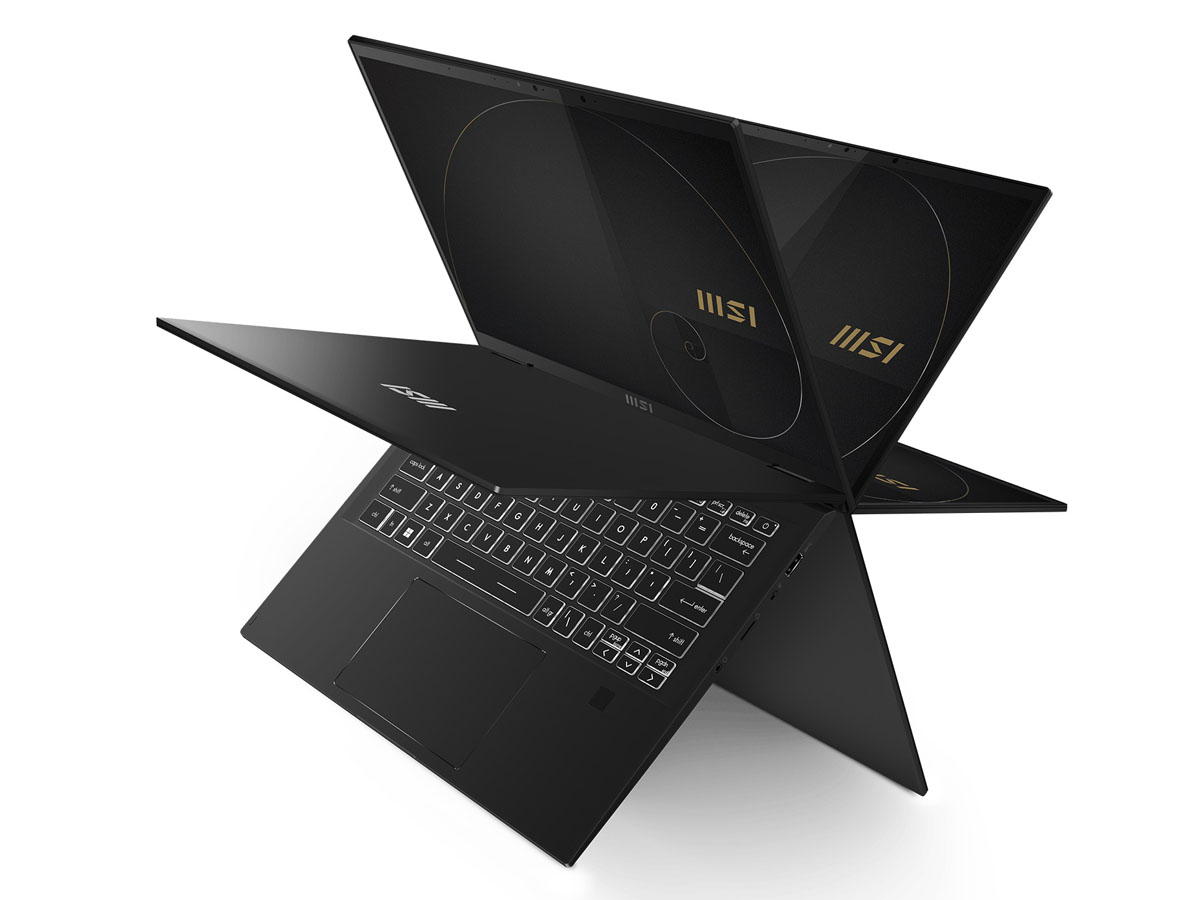
MSI Summit E14 Flip Evo A12M convertible review: A legit alternative to HP, Dell or Lenovo
Not to be confused with the Summit E14 clamshell, the Summit E14 Flip is the convertible version with 360-degree hinges and an overall different chassis design. The model made its debut in March alongside the smaller and refreshed 13-inch Summit E13 Flip.
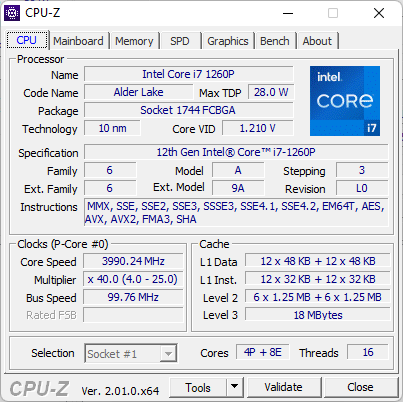
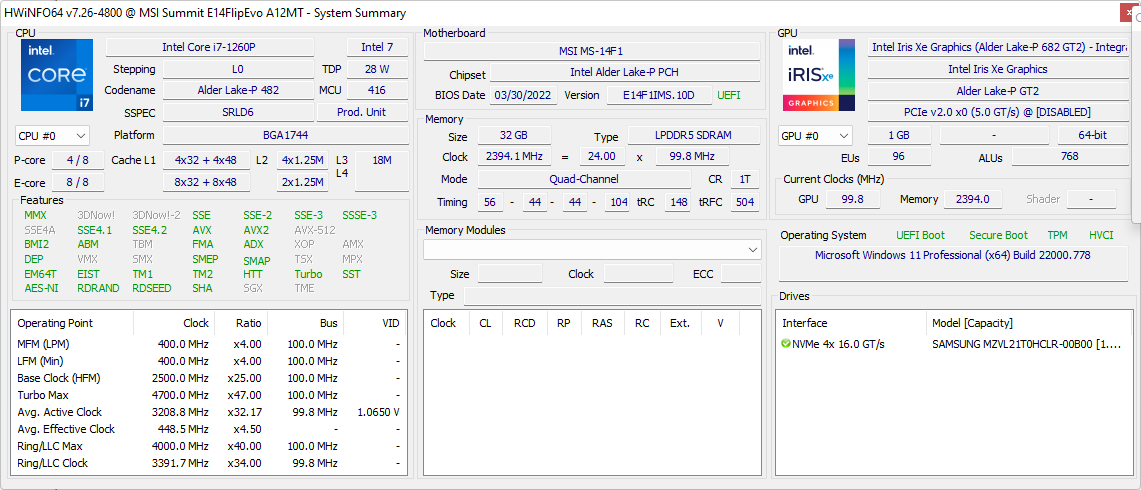
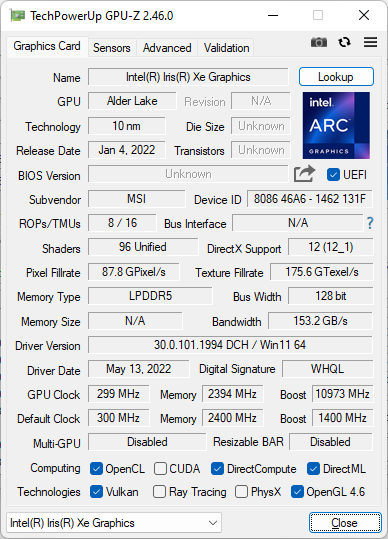
Our review unit comes configured with the Intel Alder Lake-P Core i7-1260P CPU, 32 GB of LPDDR5 RAM, 16:10 QHD+ IPS touchscreen, and a 1 TB NVMe SSD for approximately $1600 to $1700 USD retail. Additional SKUs with discrete GeForce MX options are planned for the near future.
The Summit E14 Flip competes with other high-end prosumer or business-centric convertibles like the Lenovo Yoga 9i 14, Dell Latitude 9420 2-in-1, LG Gram 14T90P, or Asus ExpertBook B7 Flip.
More MSI reviews:
Potential Competitors in Comparison
Rating | Date | Model | Weight | Height | Size | Resolution | Best Price |
|---|---|---|---|---|---|---|---|
| 86.1 % | 07/2022 | MSI Summit E14 Flip Evo A12MT i7-1260P, Iris Xe G7 96EUs | 1.6 kg | 17.9 mm | 14.00" | 2880x1800 | |
| 82.3 % | 07/2021 | MSI Summit E14 A11SCS i7-1185G7, GeForce GTX 1650 Ti Max-Q | 1.3 kg | 16 mm | 14.00" | 3840x2160 | |
| 84.1 % | 06/2022 | Asus VivoBook S 14X S5402Z i7-12700H, Iris Xe G7 96EUs | 1.6 kg | 17.9 mm | 14.50" | 2880x1800 | |
| 87.5 % | 05/2022 | LG Gram 14T90P i5-1135G7, Iris Xe G7 80EUs | 1.2 kg | 17 mm | 14.00" | 1900x1200 | |
| 87.6 % | 06/2022 | Lenovo Yoga Slim 7i Pro 14IAP G7 i5-1240P, Iris Xe G7 80EUs | 1.3 kg | 14.6 mm | 14.00" | 2880x1800 | |
| 89 % | 07/2021 | Dell Latitude 9420 2-in-1 i7-1185G7, Iris Xe G7 96EUs | 1.5 kg | 13.94 mm | 14.00" | 2560x1600 |
Case — Tougher Than Before
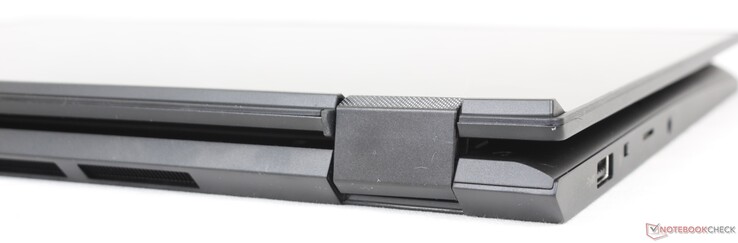
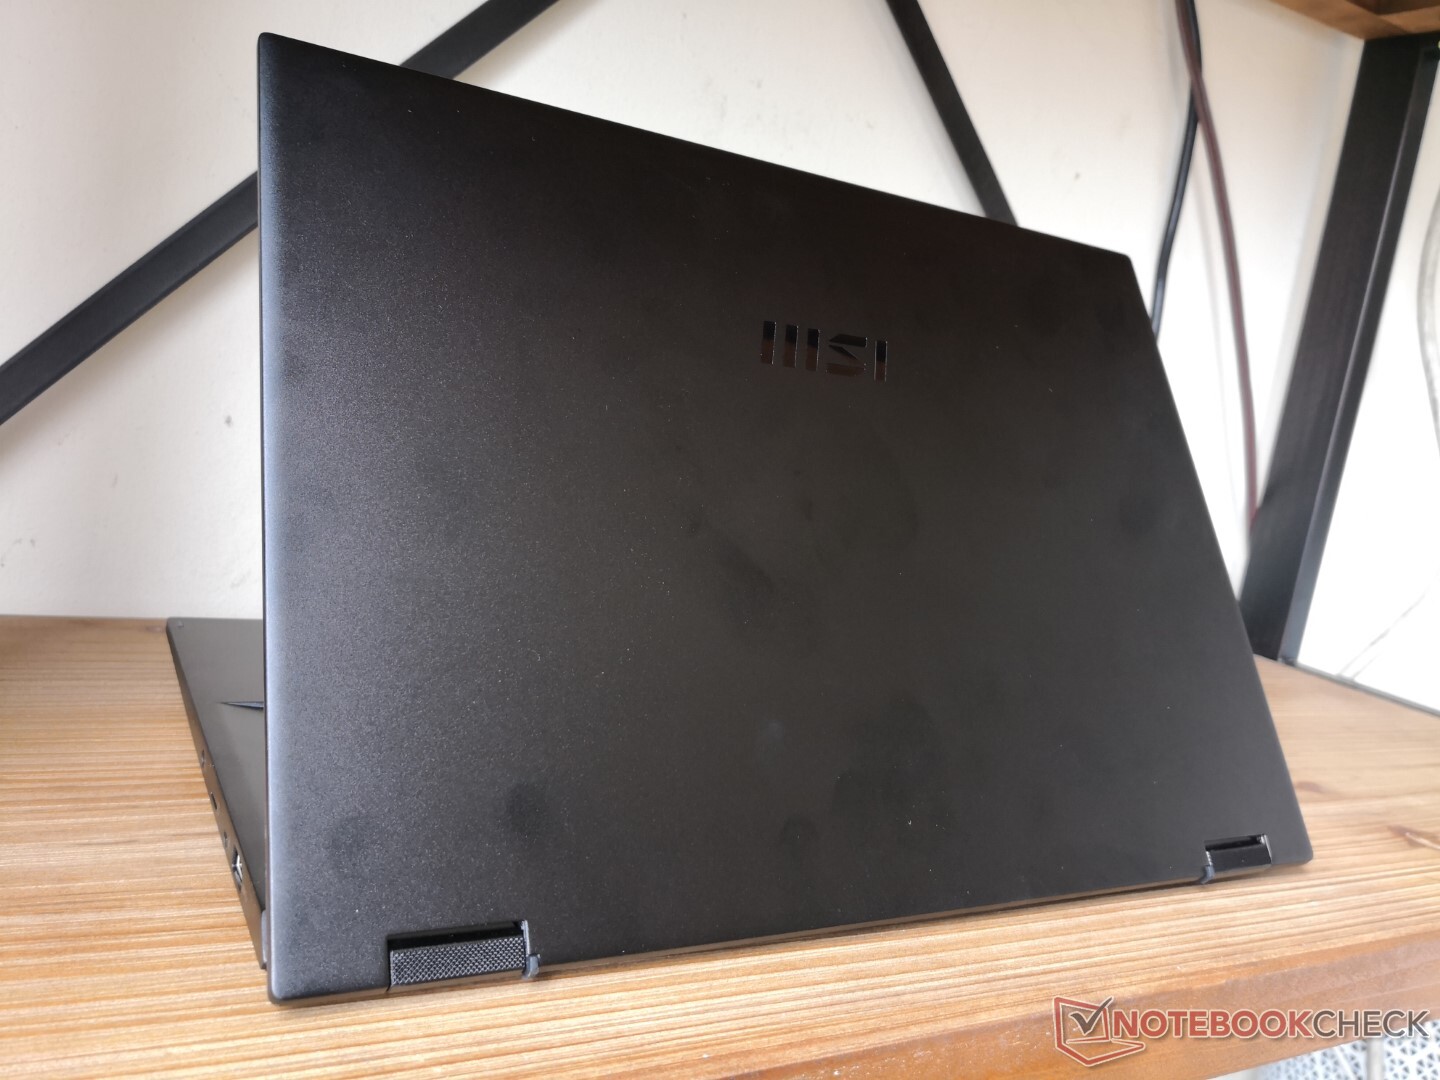
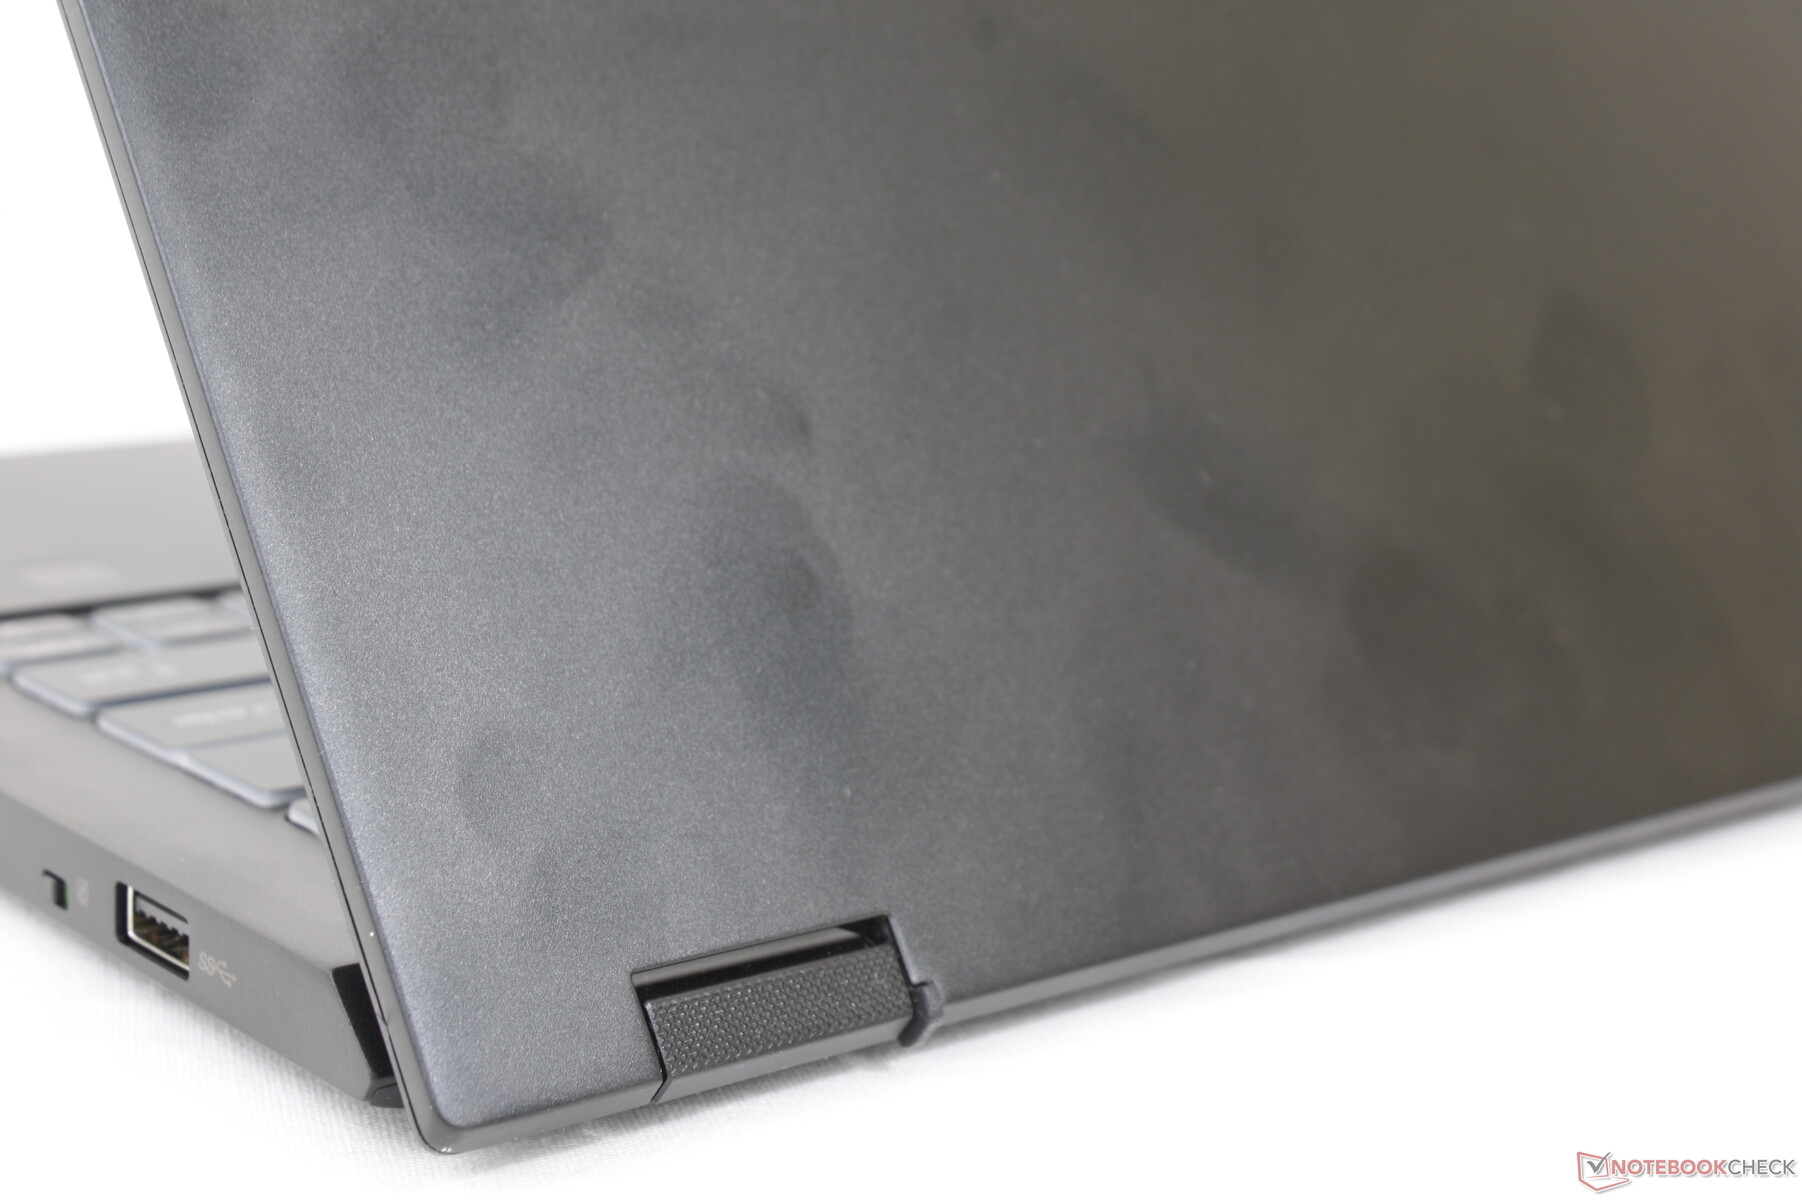
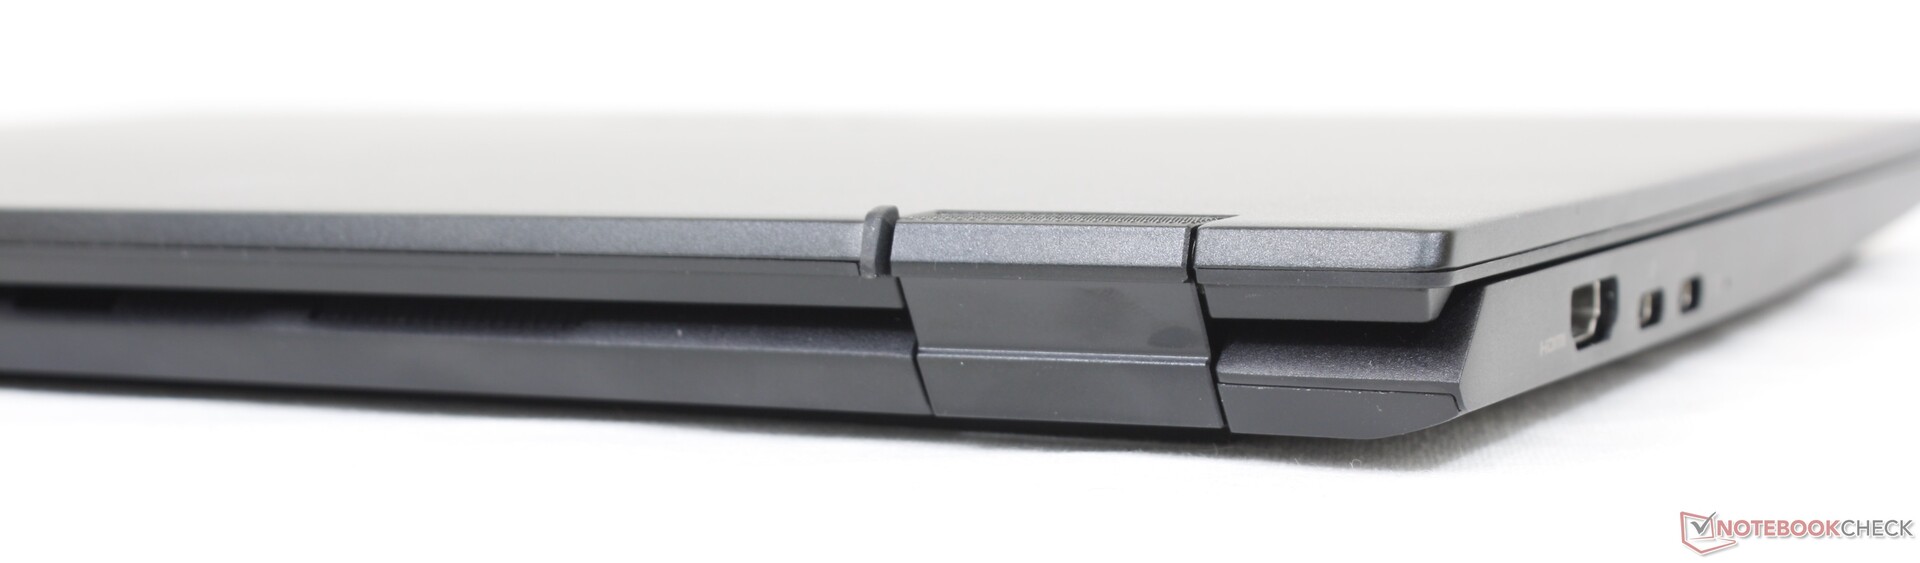
Though the Summit E14 Flip convertible may look like the Summit E14 clamshell at first glance because of their matte black coating, they are actually quite different both inside and out. Gone are the golden logo and trims around the clickpad for a more subtle look. Edge-to-edge glass now comes standard to both strengthen the rigidity of the lid and allow for touchscreen/pen inputs. The hinges, which are limited to 180-degrees on the clamshell model, have been completely redesigned to be larger and stronger for the new 360-degree form factor. We still think the hinges could be stiffer at some angles, however, particularly around the 150 to 180-degree range for a better sense of longevity.
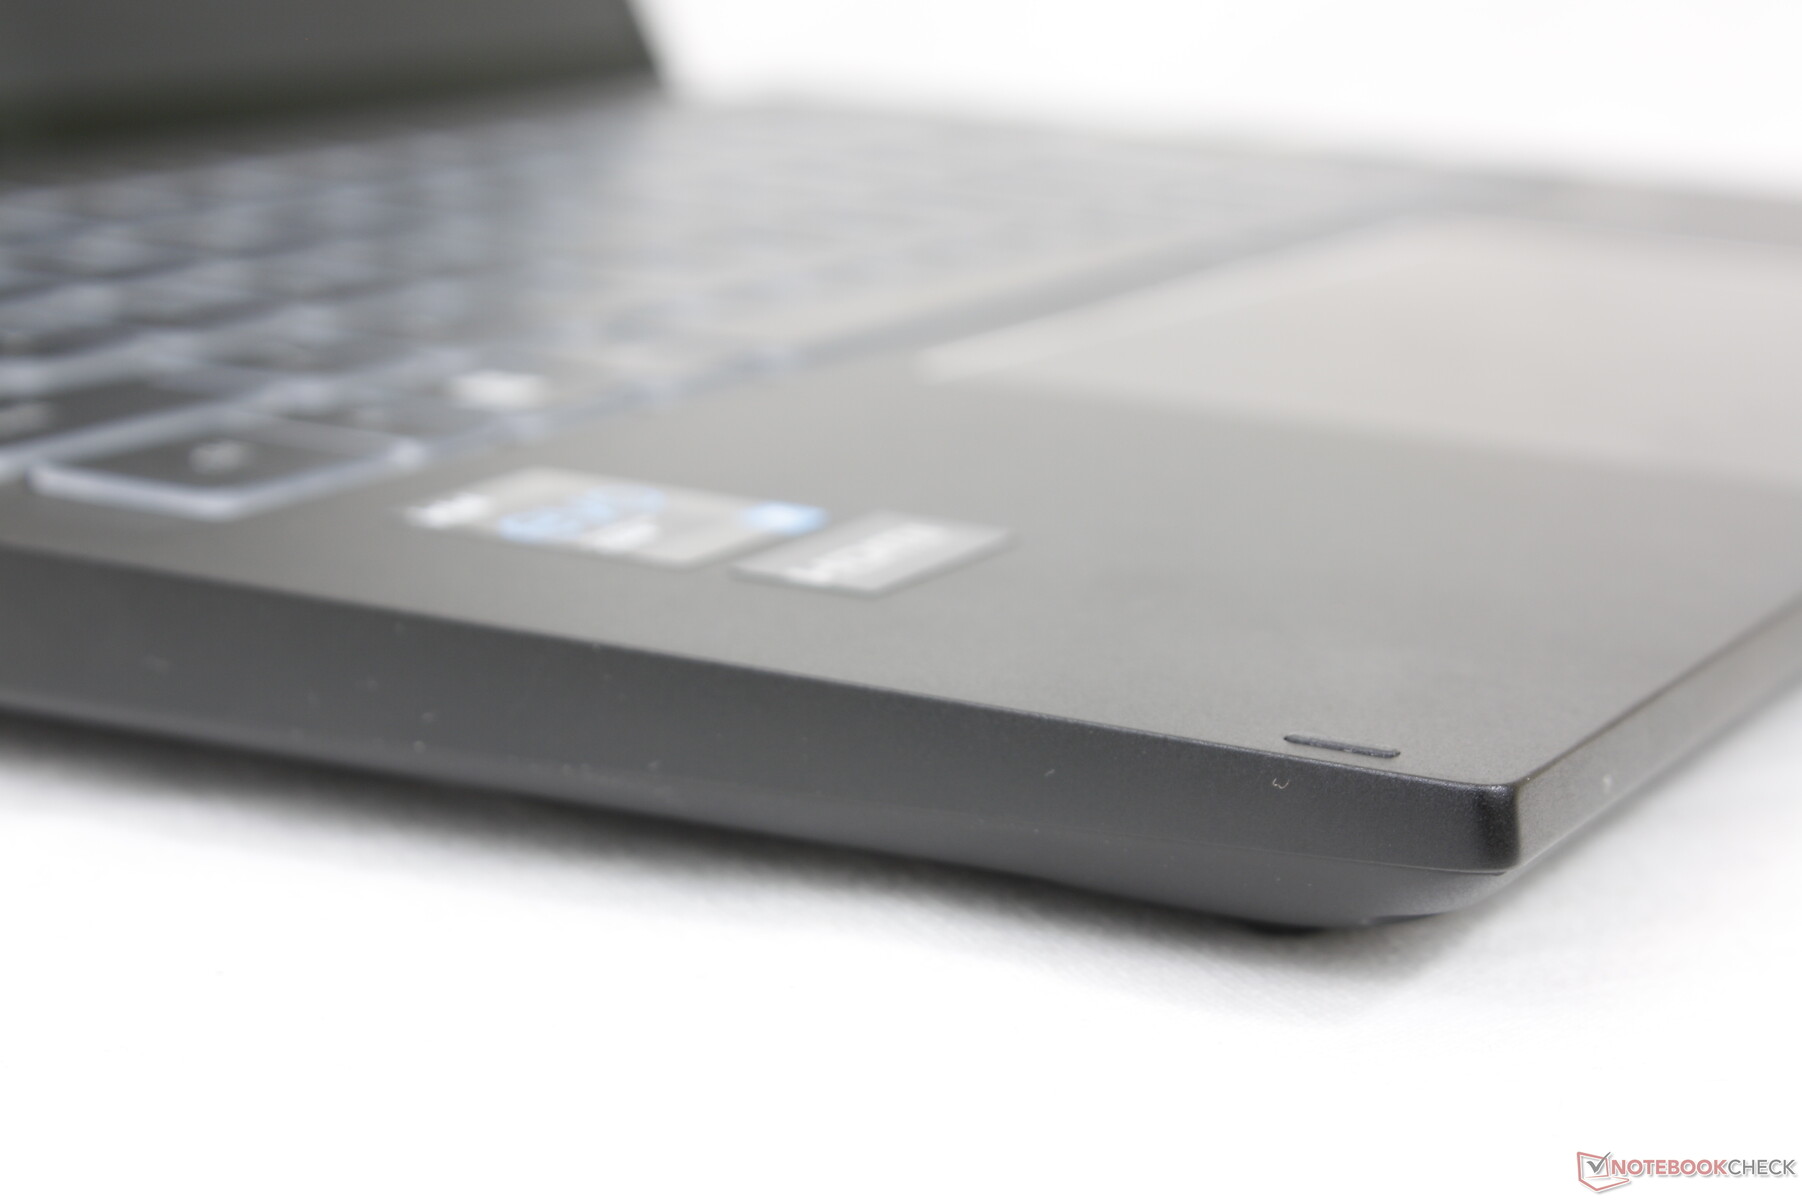
The model retains the MIL-STD-810G certification that it shares with the original clamshell. The base is rigid and resistant to twists and depressions to be on a similar level as many other prosumer convertibles like the Asus Zenbook Flip, XPS 13 2-in-1, or Lenovo Yoga 9i 14. It's a major improvement over the cheaper MSI Modern laptops which we've always found to be flimsier relative to the competition.

In terms of size and weight, the MSI model is both larger and heavier than many other 14-inch convertibles. The LG Gram 14T90P and Latitude 9420 2-in-1, for example, are each lighter, smaller, and even thinner than our Summit E14 Flip. The Lenovo Yoga 9i 14 convertible is slightly larger in footprint, but it is still thinner and lighter by about 3 mm and 200 grams, respectively.
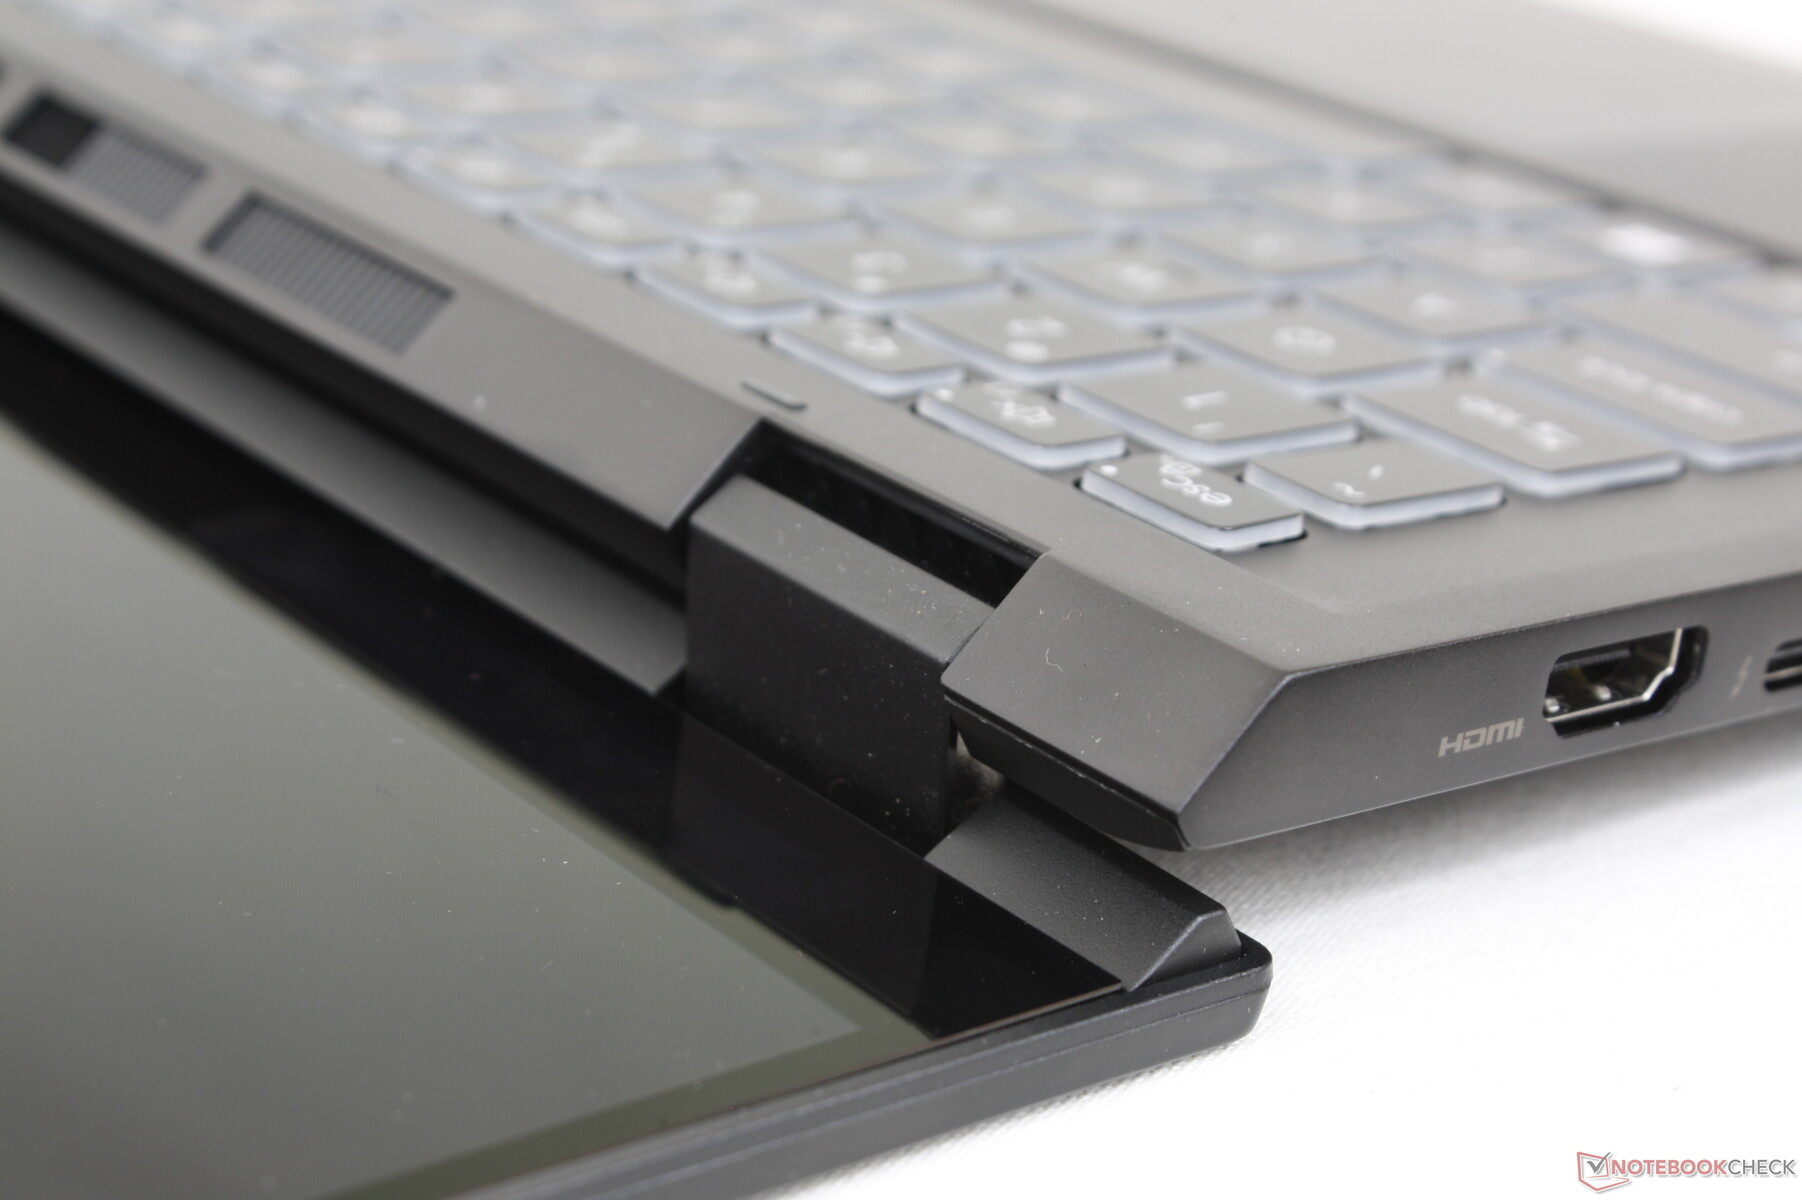
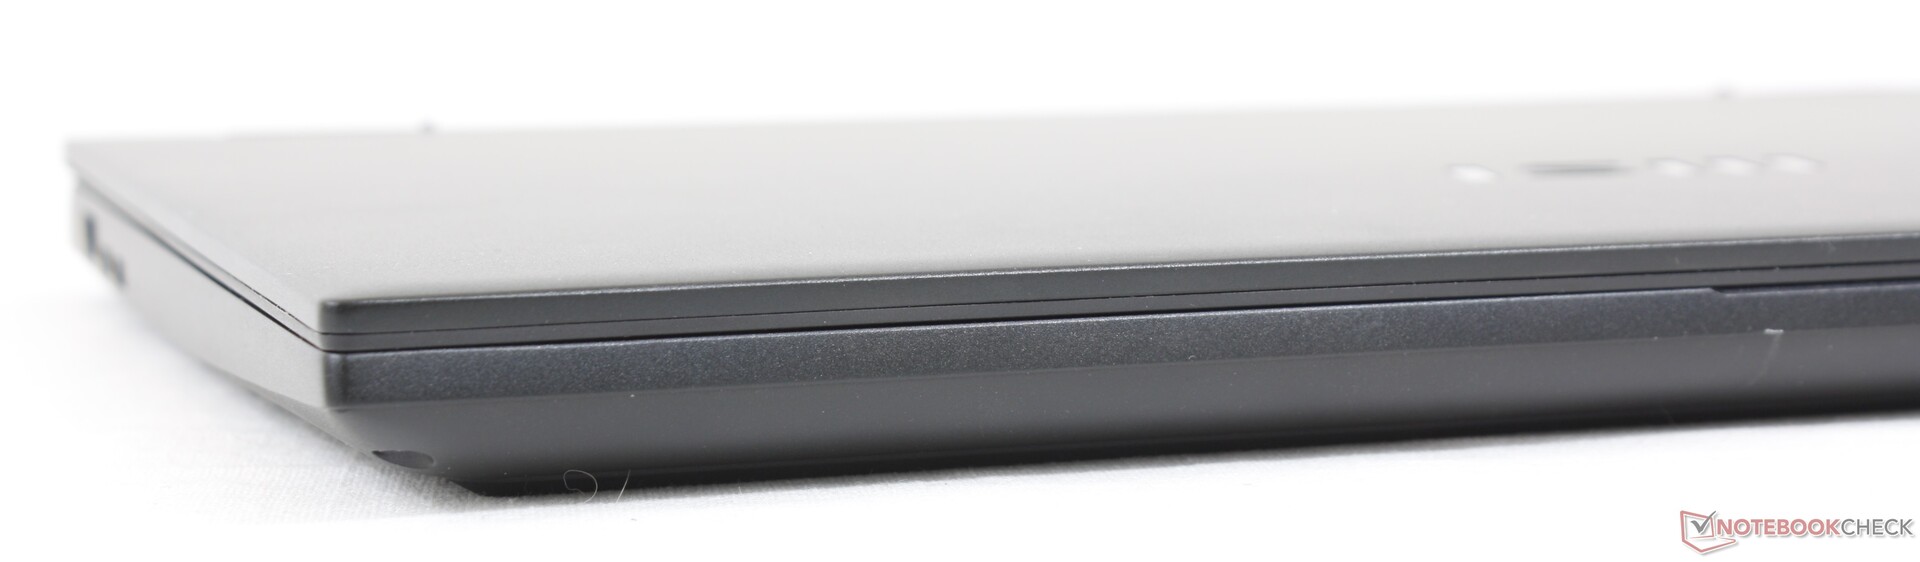
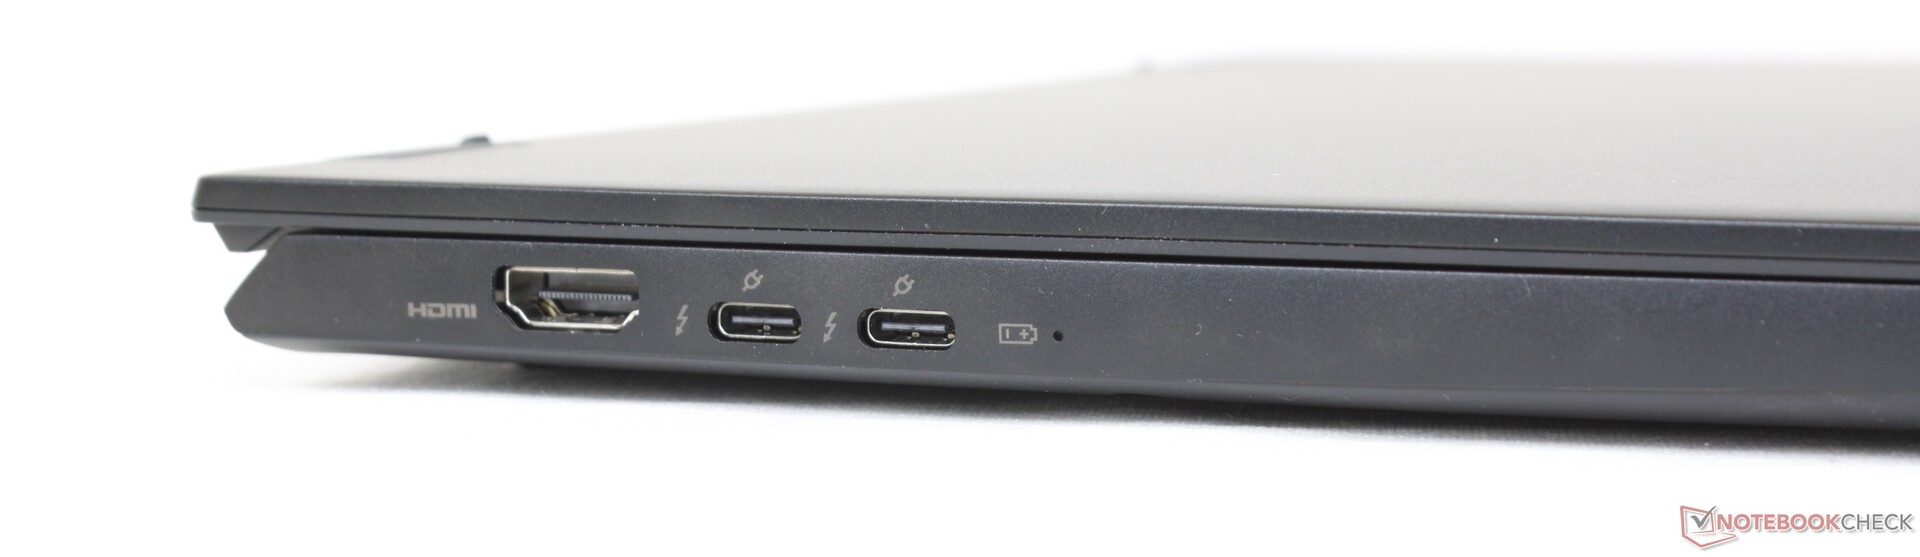
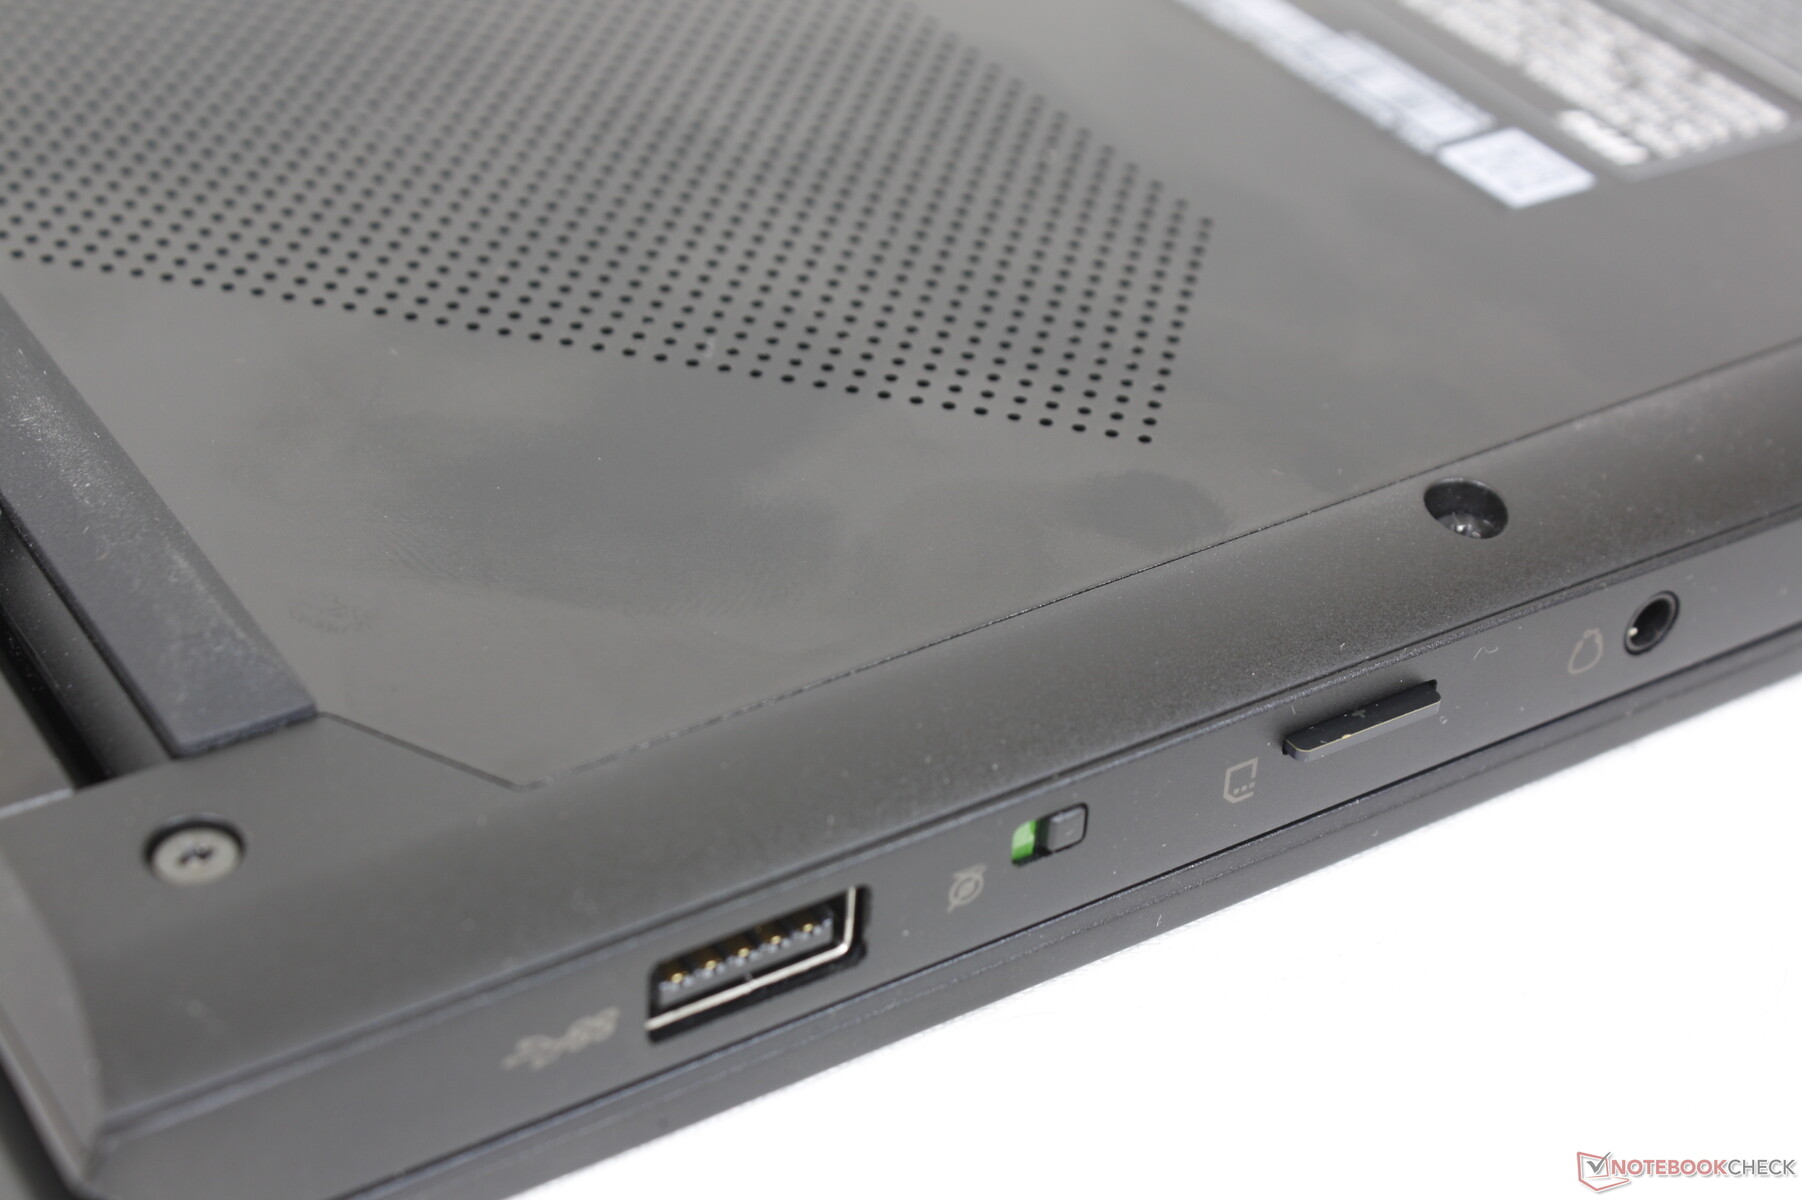
Connectivity — Thunderbolt 4 Support
This convertible model includes all the ports from the original clamshell version plus full-size HDMI and a webcam switch. It would have been great to see a Kensington lock, however, since the Summit series is more professional oriented. Port positioning could have been better along the left edge where the three ports are packed a bit too tightly together.
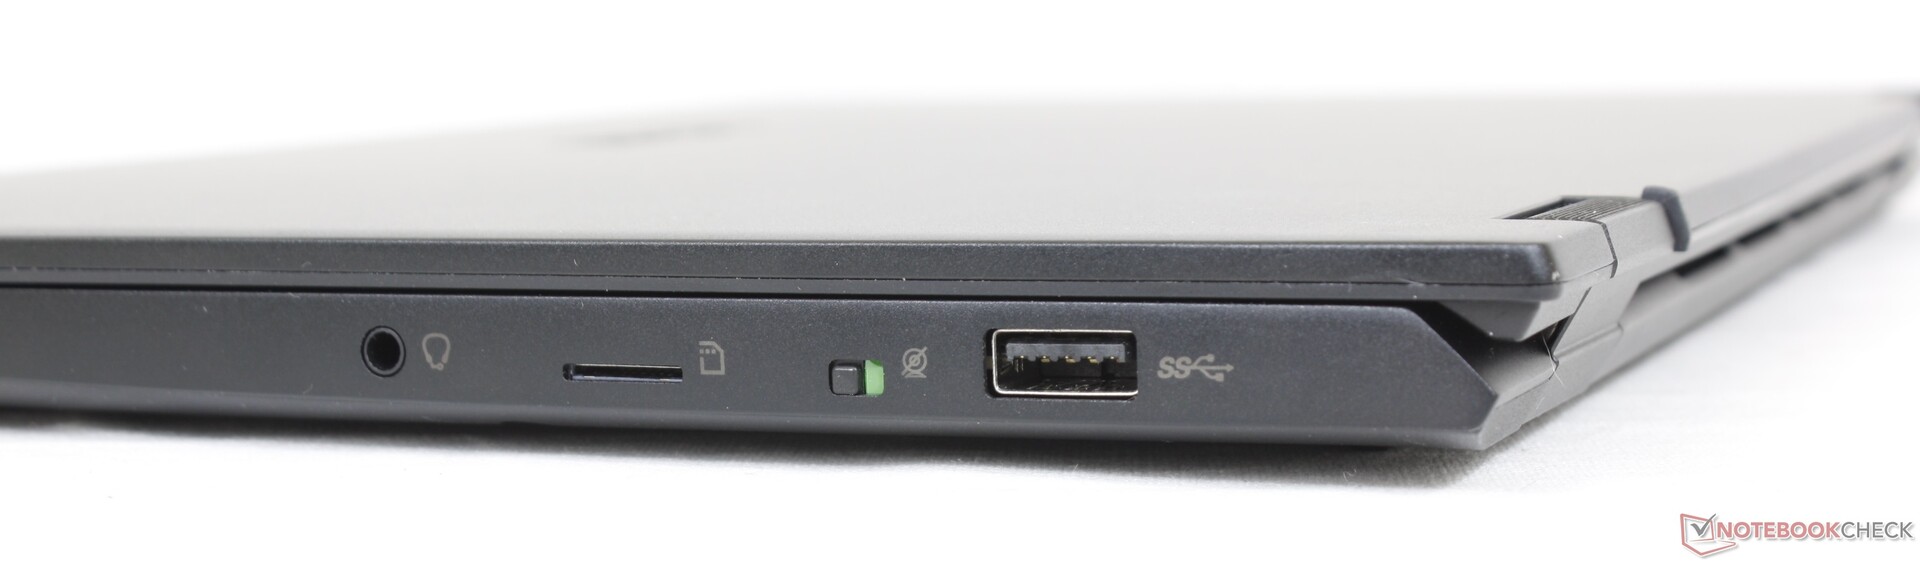
SD Card Reader
Unfortunately, the integrated spring-loaded MicroSD reader is slower than the one on the Summit E14 clamshell. Moving 1 GB of images from our UHS-II test card top desktop takes about 21 seconds compared to just 6 to 7 seconds on the Summit E14.
| SD Card Reader | |
| average JPG Copy Test (av. of 3 runs) | |
| MSI Summit E14 A11SCS (AV Pro V60) | |
| Dell Latitude 9420 2-in-1 (AV PRO microSD 128 GB V60) | |
| LG Gram 14T90P (AV Pro V60) | |
| MSI Summit E14 Flip Evo A12MT (AV Pro V60) | |
| maximum AS SSD Seq Read Test (1GB) | |
| MSI Summit E14 A11SCS (AV Pro V60) | |
| Dell Latitude 9420 2-in-1 (AV PRO microSD 128 GB V60) | |
| LG Gram 14T90P (AV Pro V60) | |
| MSI Summit E14 Flip Evo A12MT (AV Pro V60) | |
Communication
An Intel AX1675s comes standard for Wi-Fi 6E and Bluetooth 5.2 connectivity. We experienced no issues when paired to our 6 GHz network.
| Networking | |
| iperf3 transmit AX12 | |
| MSI Summit E14 A11SCS | |
| Dell Latitude 9420 2-in-1 | |
| iperf3 receive AX12 | |
| MSI Summit E14 A11SCS | |
| Dell Latitude 9420 2-in-1 | |
| iperf3 receive AXE11000 6GHz | |
| Asus VivoBook S 14X S5402Z | |
| MSI Summit E14 Flip Evo A12MT | |
| iperf3 transmit AXE11000 6GHz | |
| MSI Summit E14 Flip Evo A12MT | |
| Asus VivoBook S 14X S5402Z | |
Webcam
The webcam is 2 MP unlike on most other laptops where 1 MP sensors are still common. Windows Hello is supported.
For privacy, the model relies on an electronic switch to disable to the webcam instead of a physical shutter.


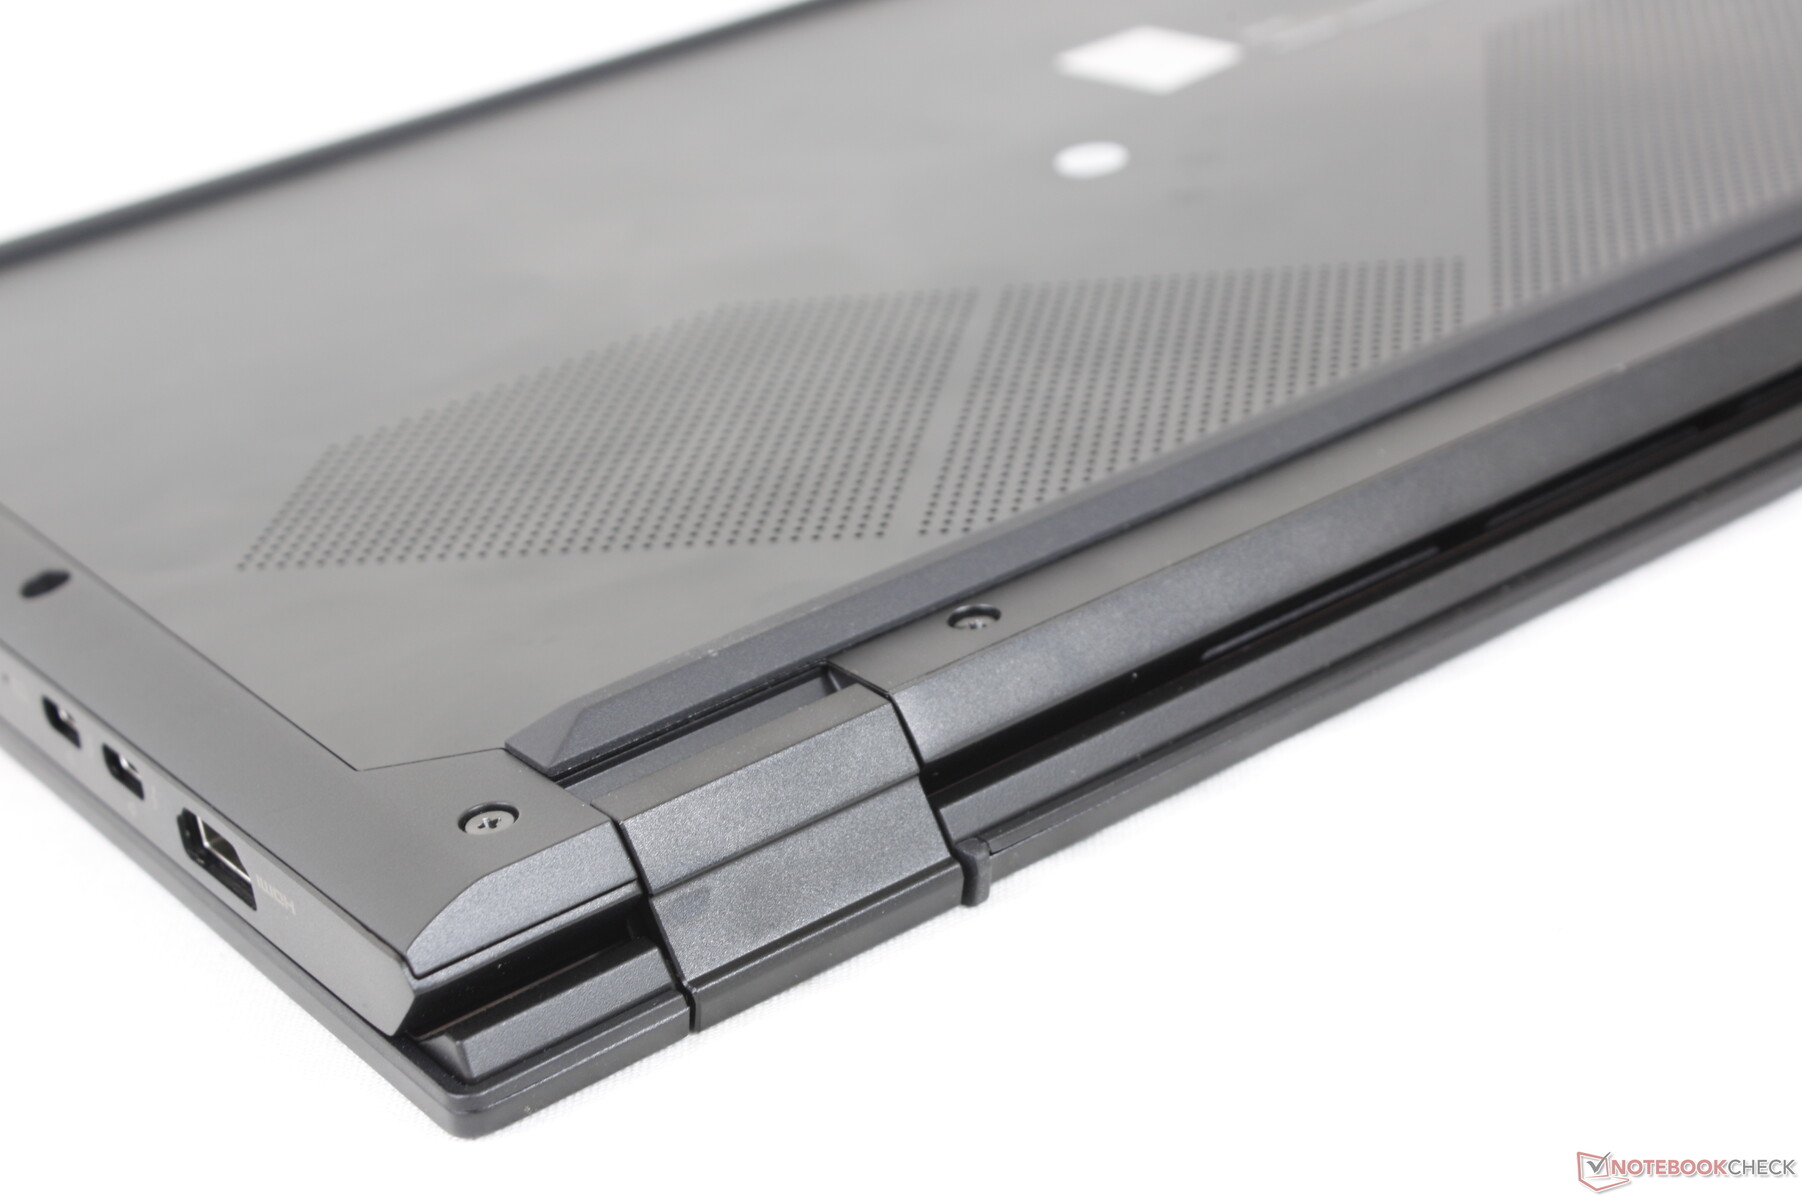
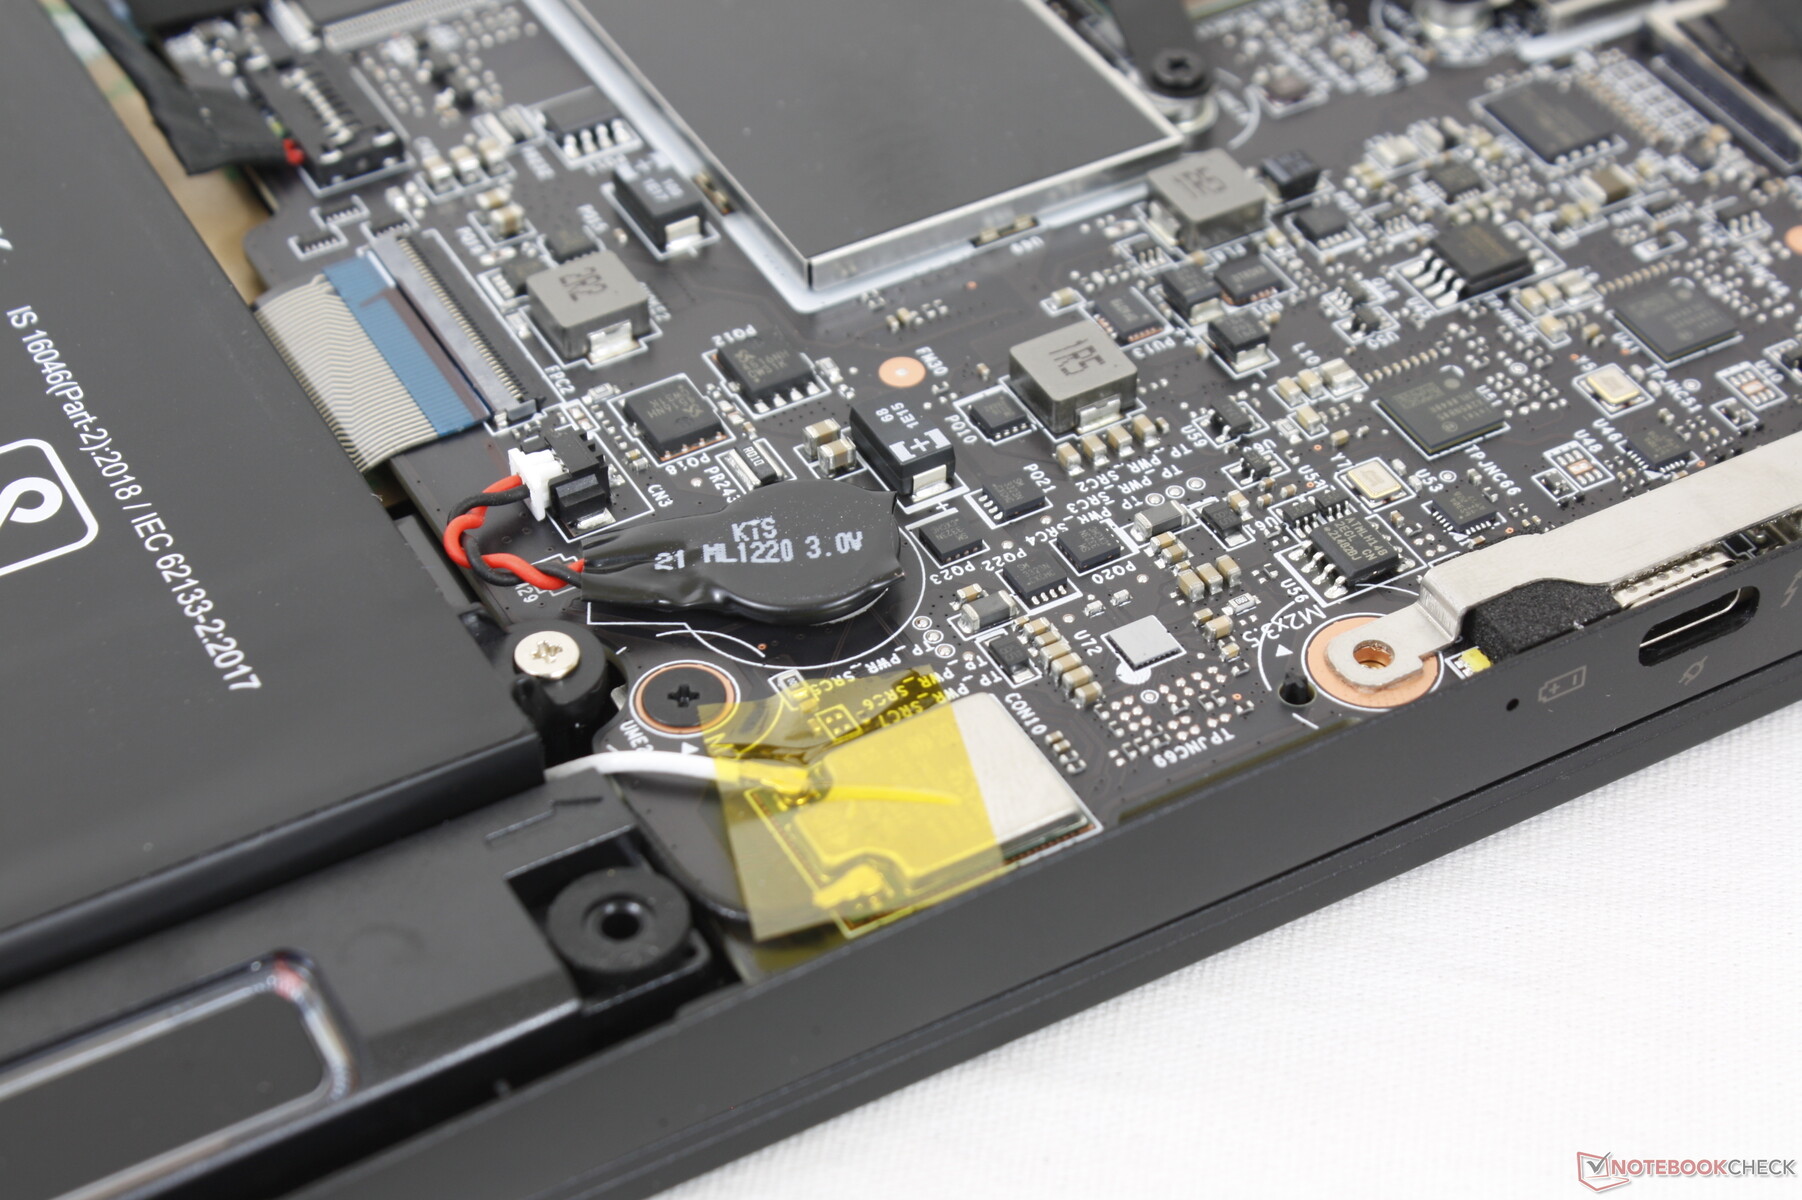
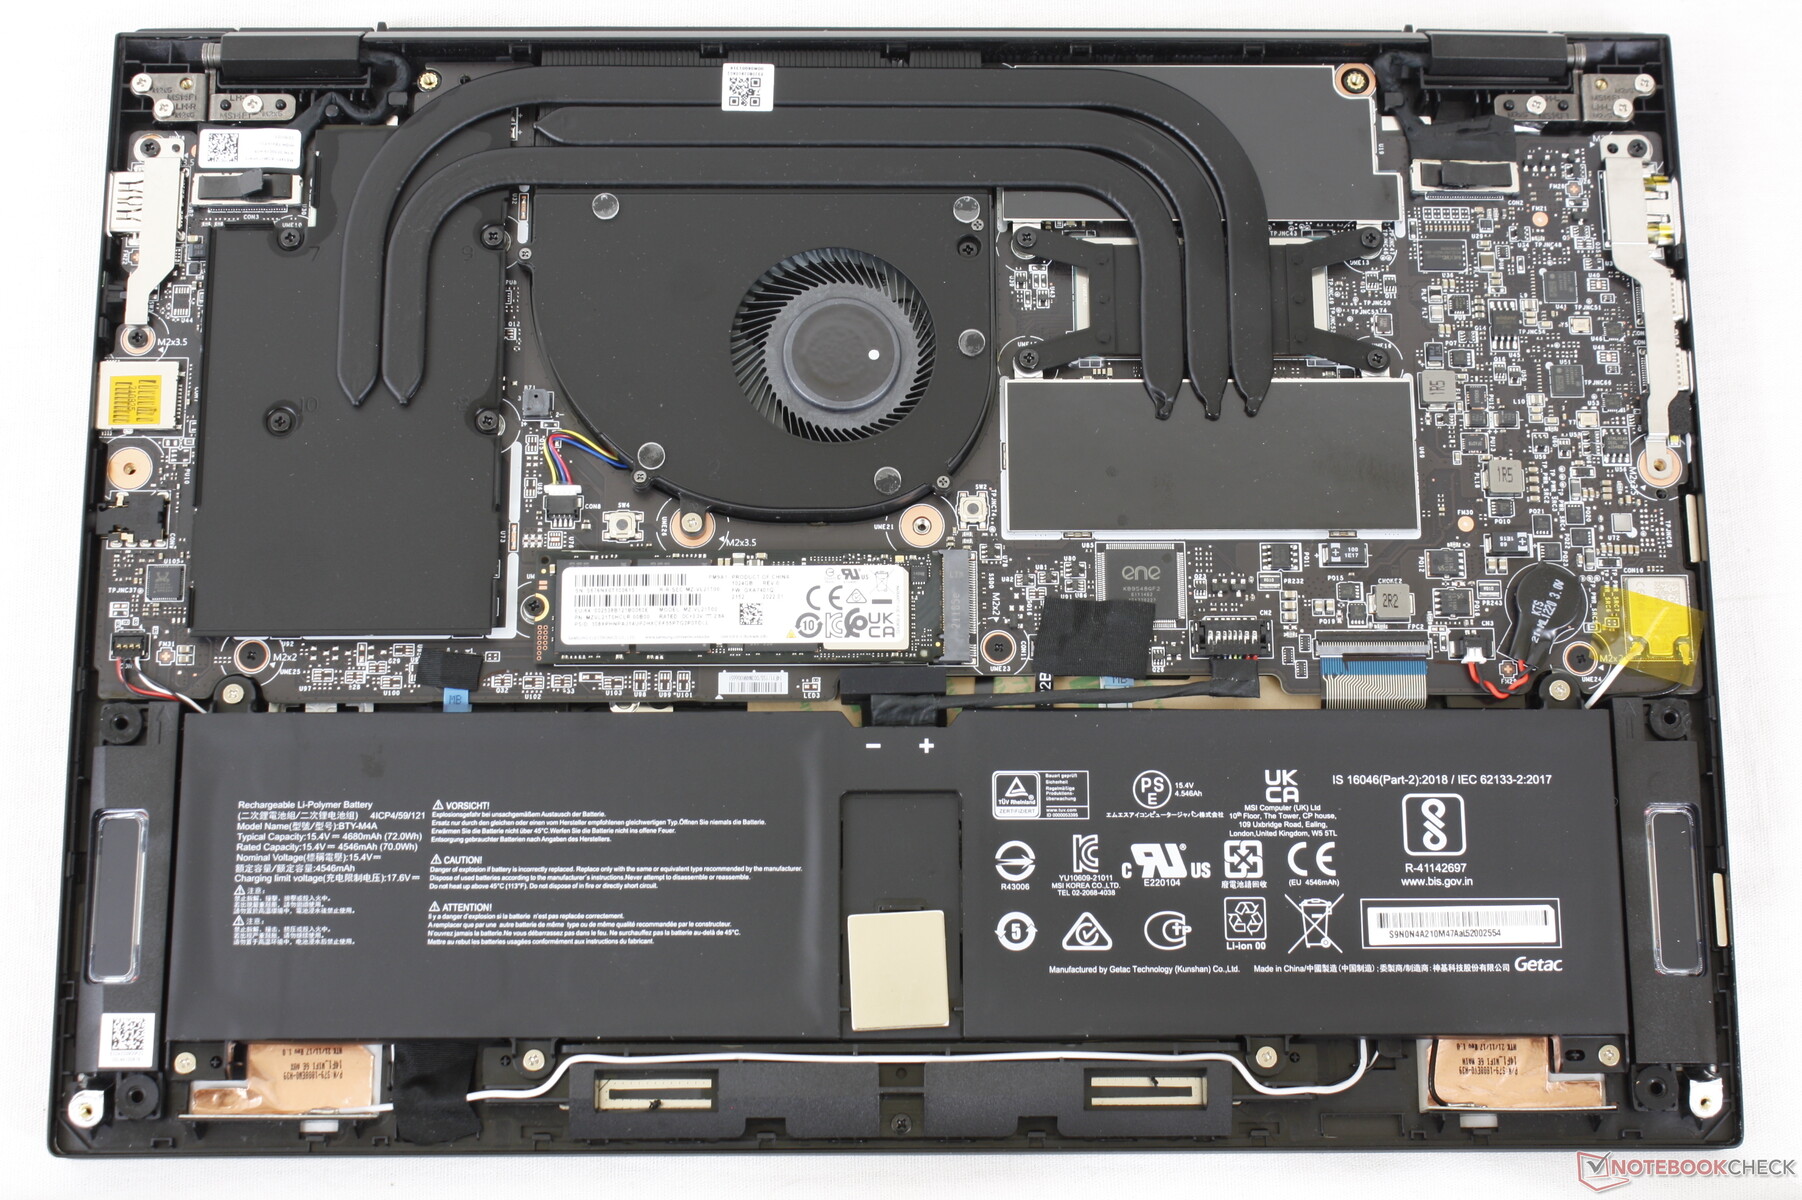
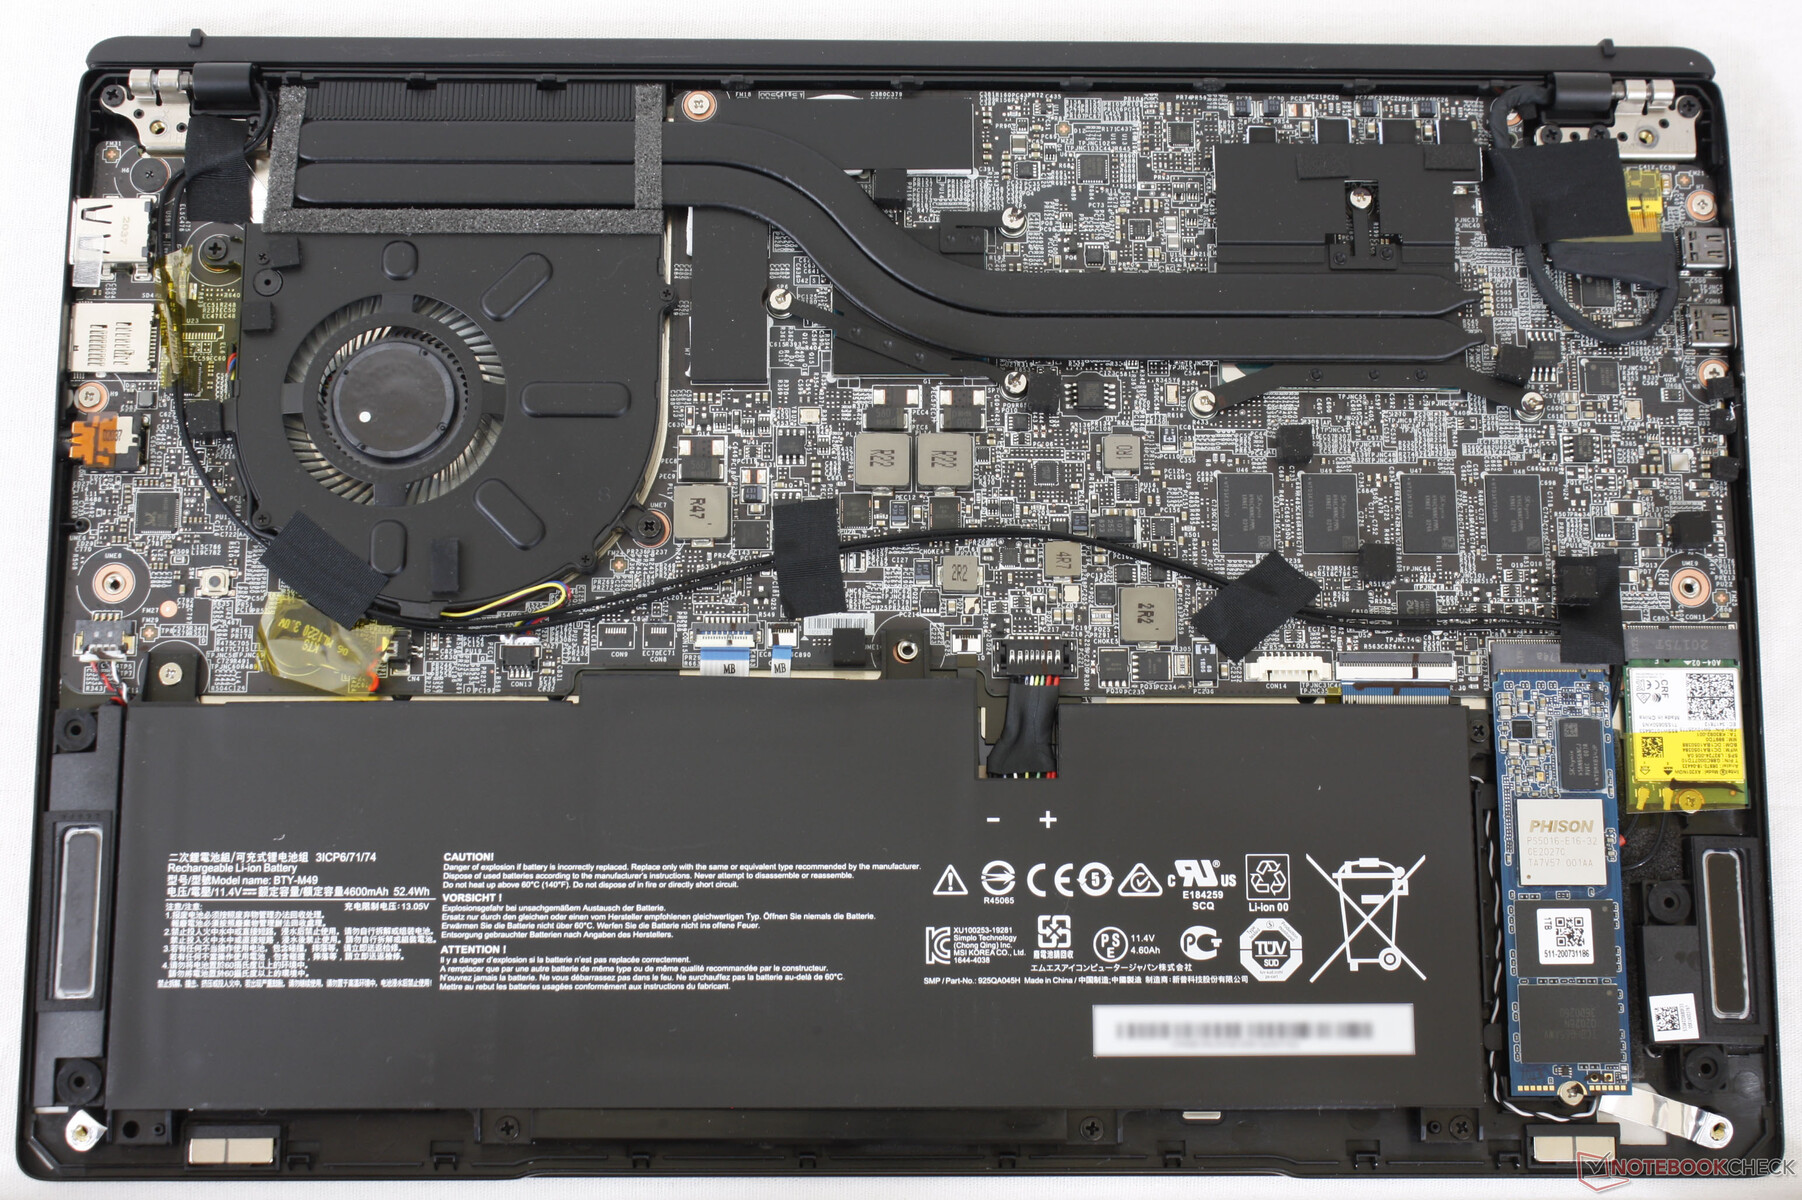
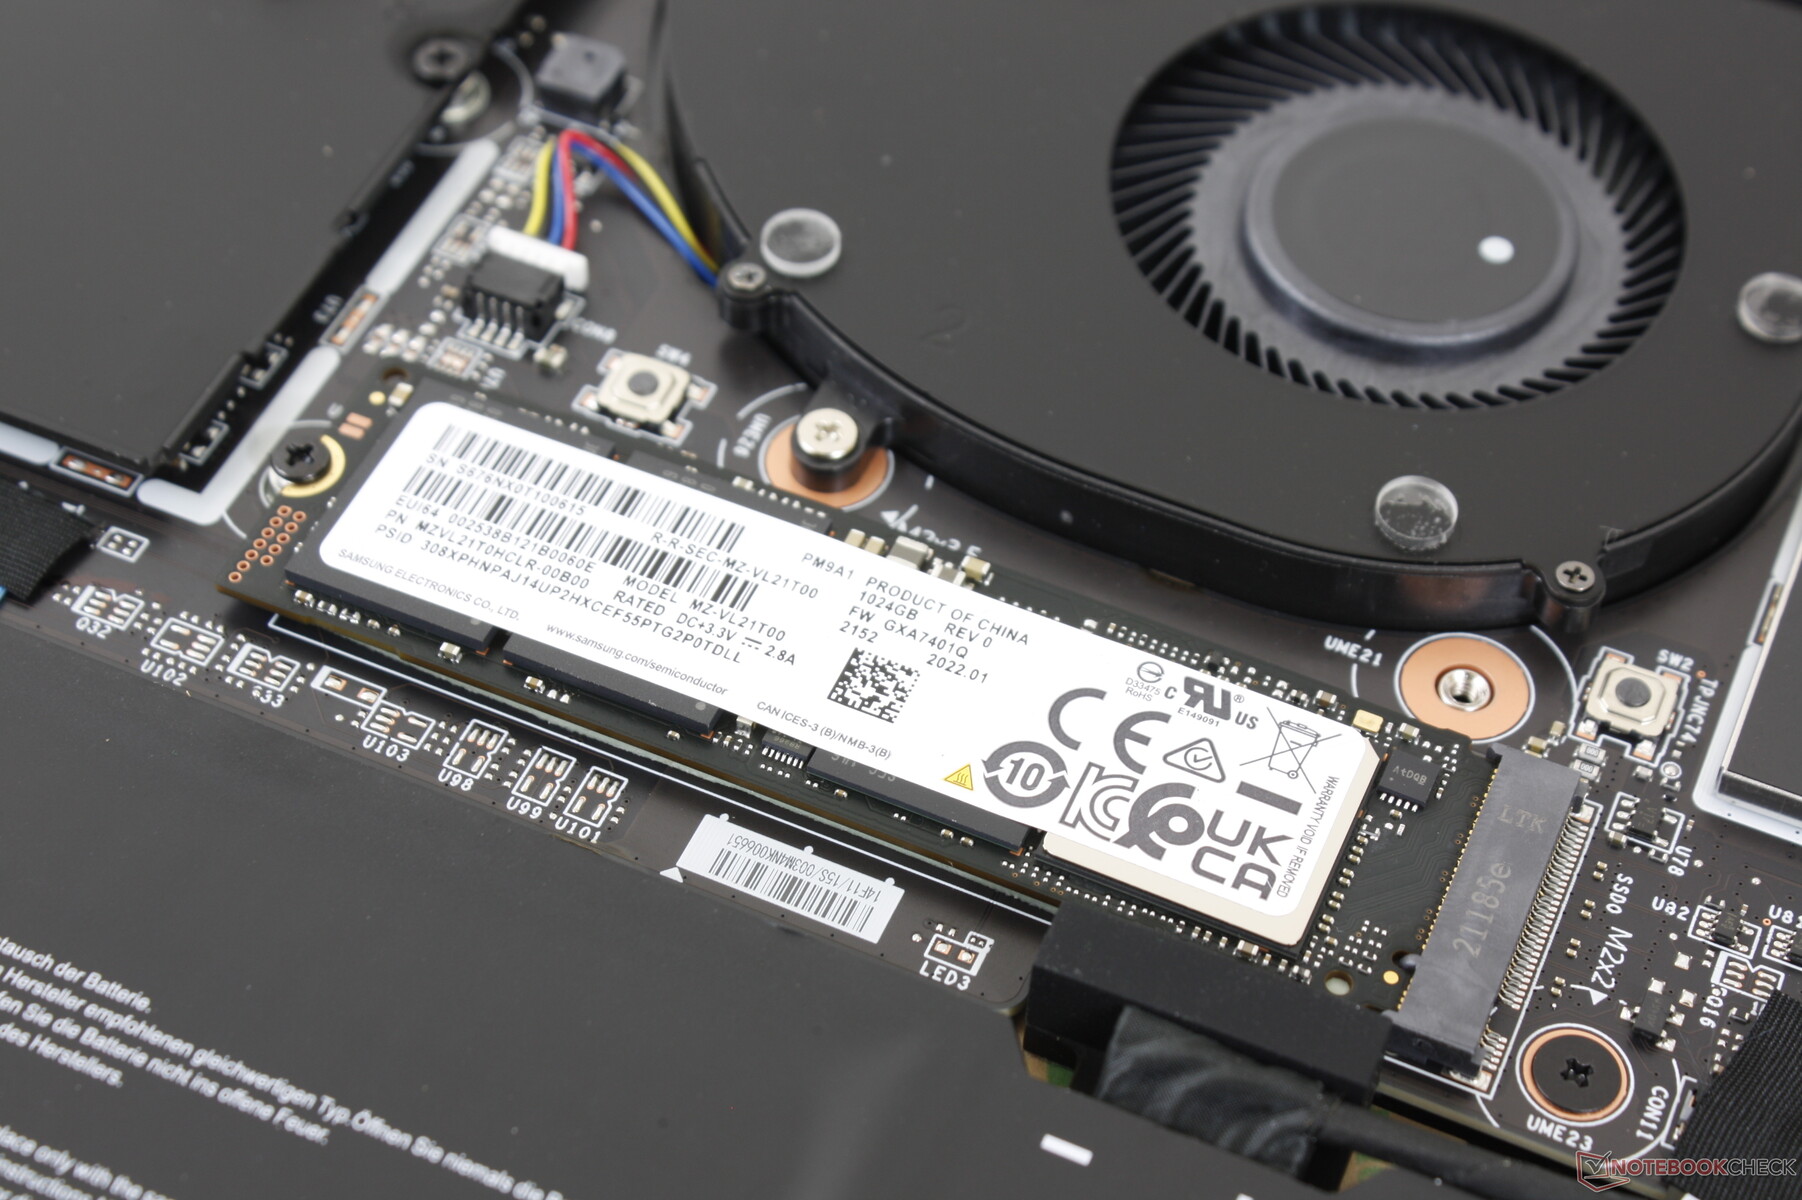
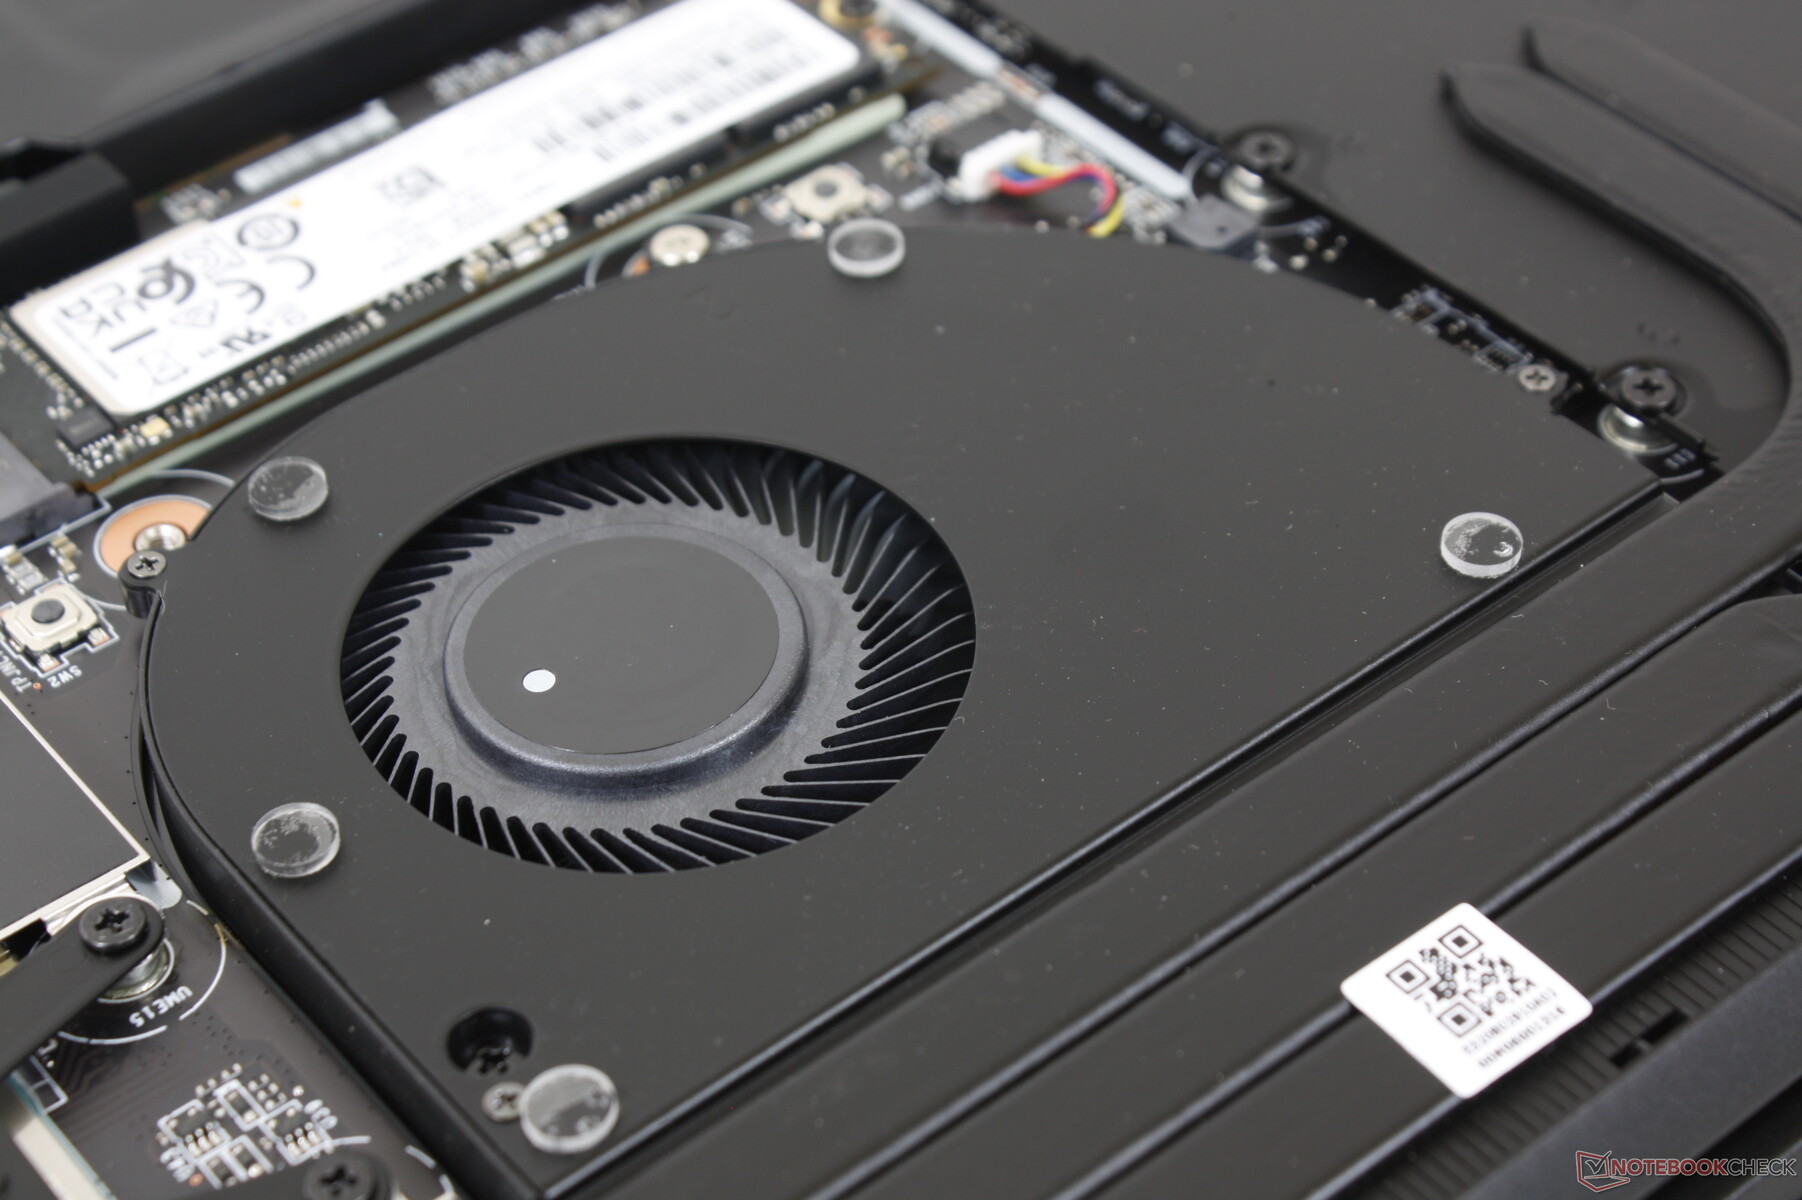
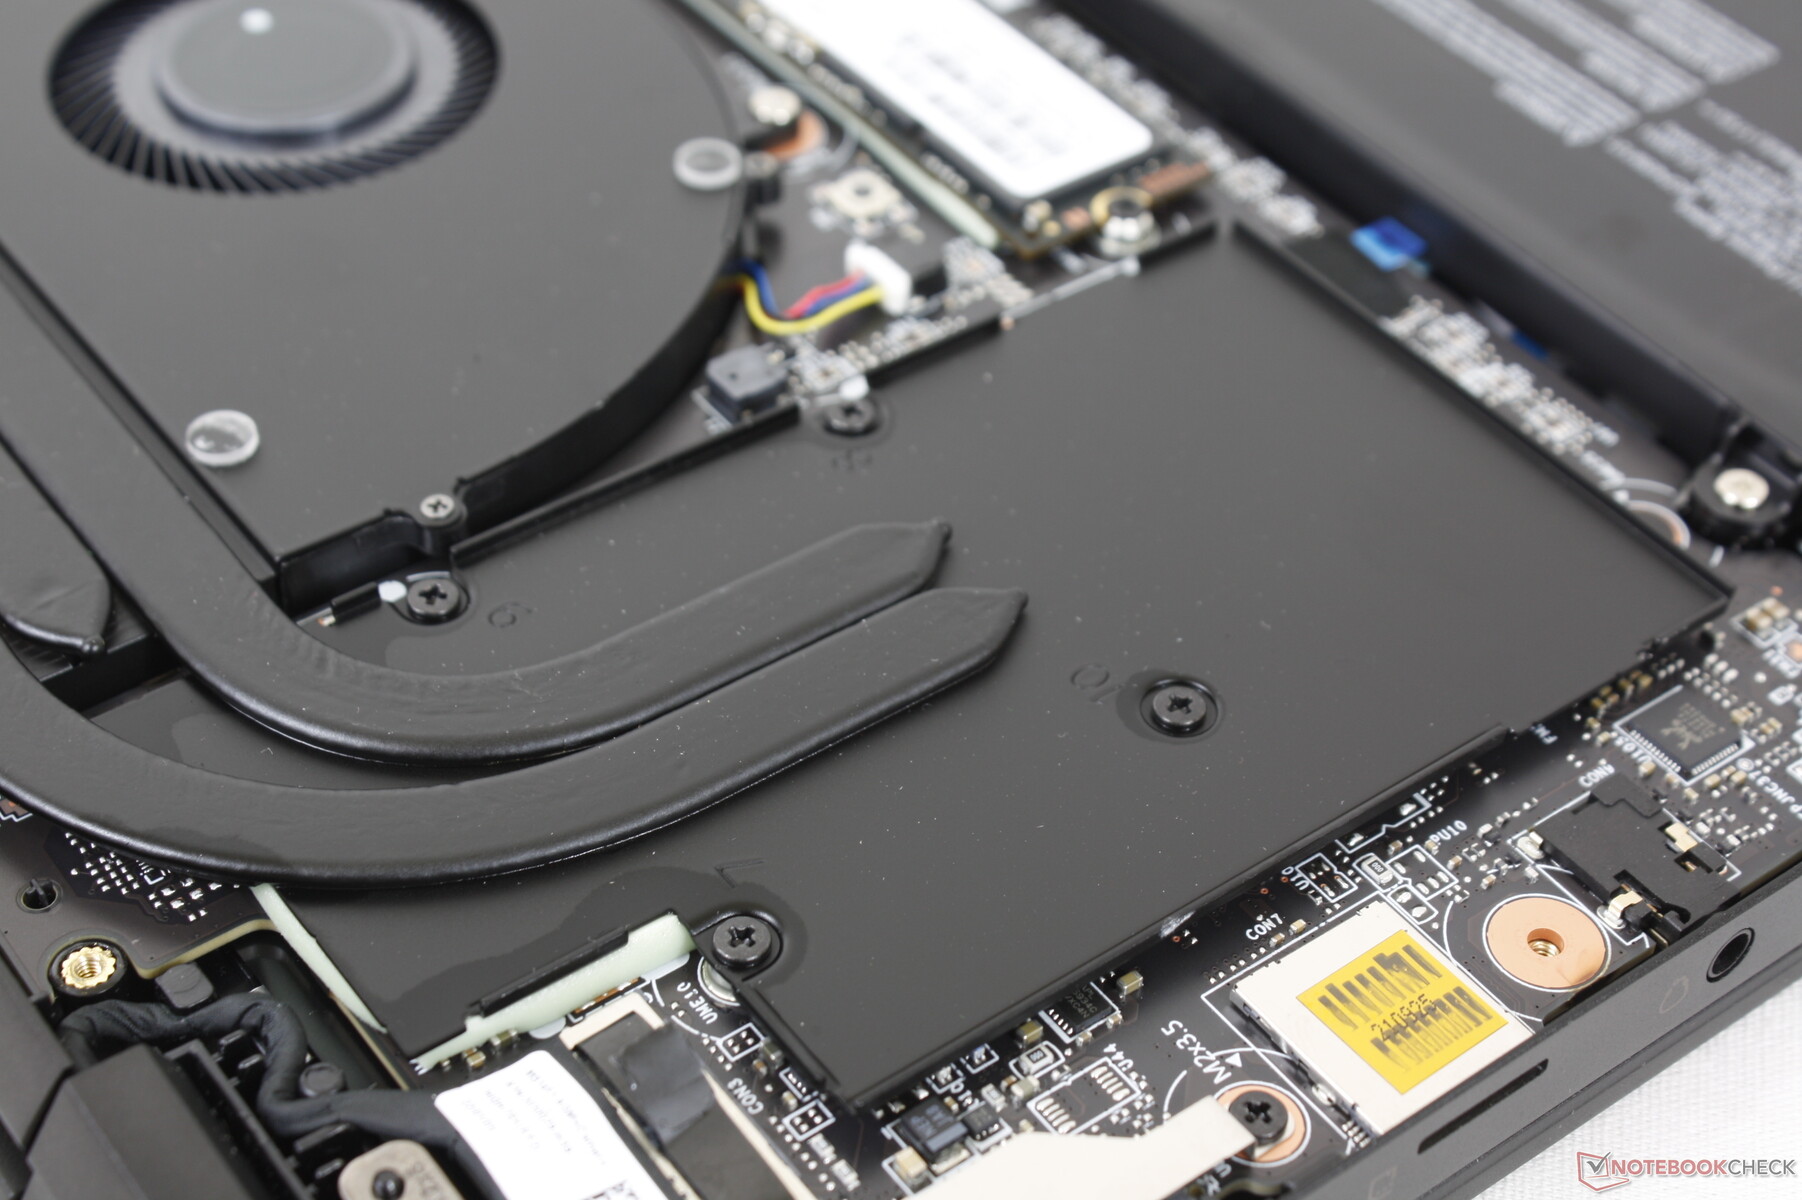
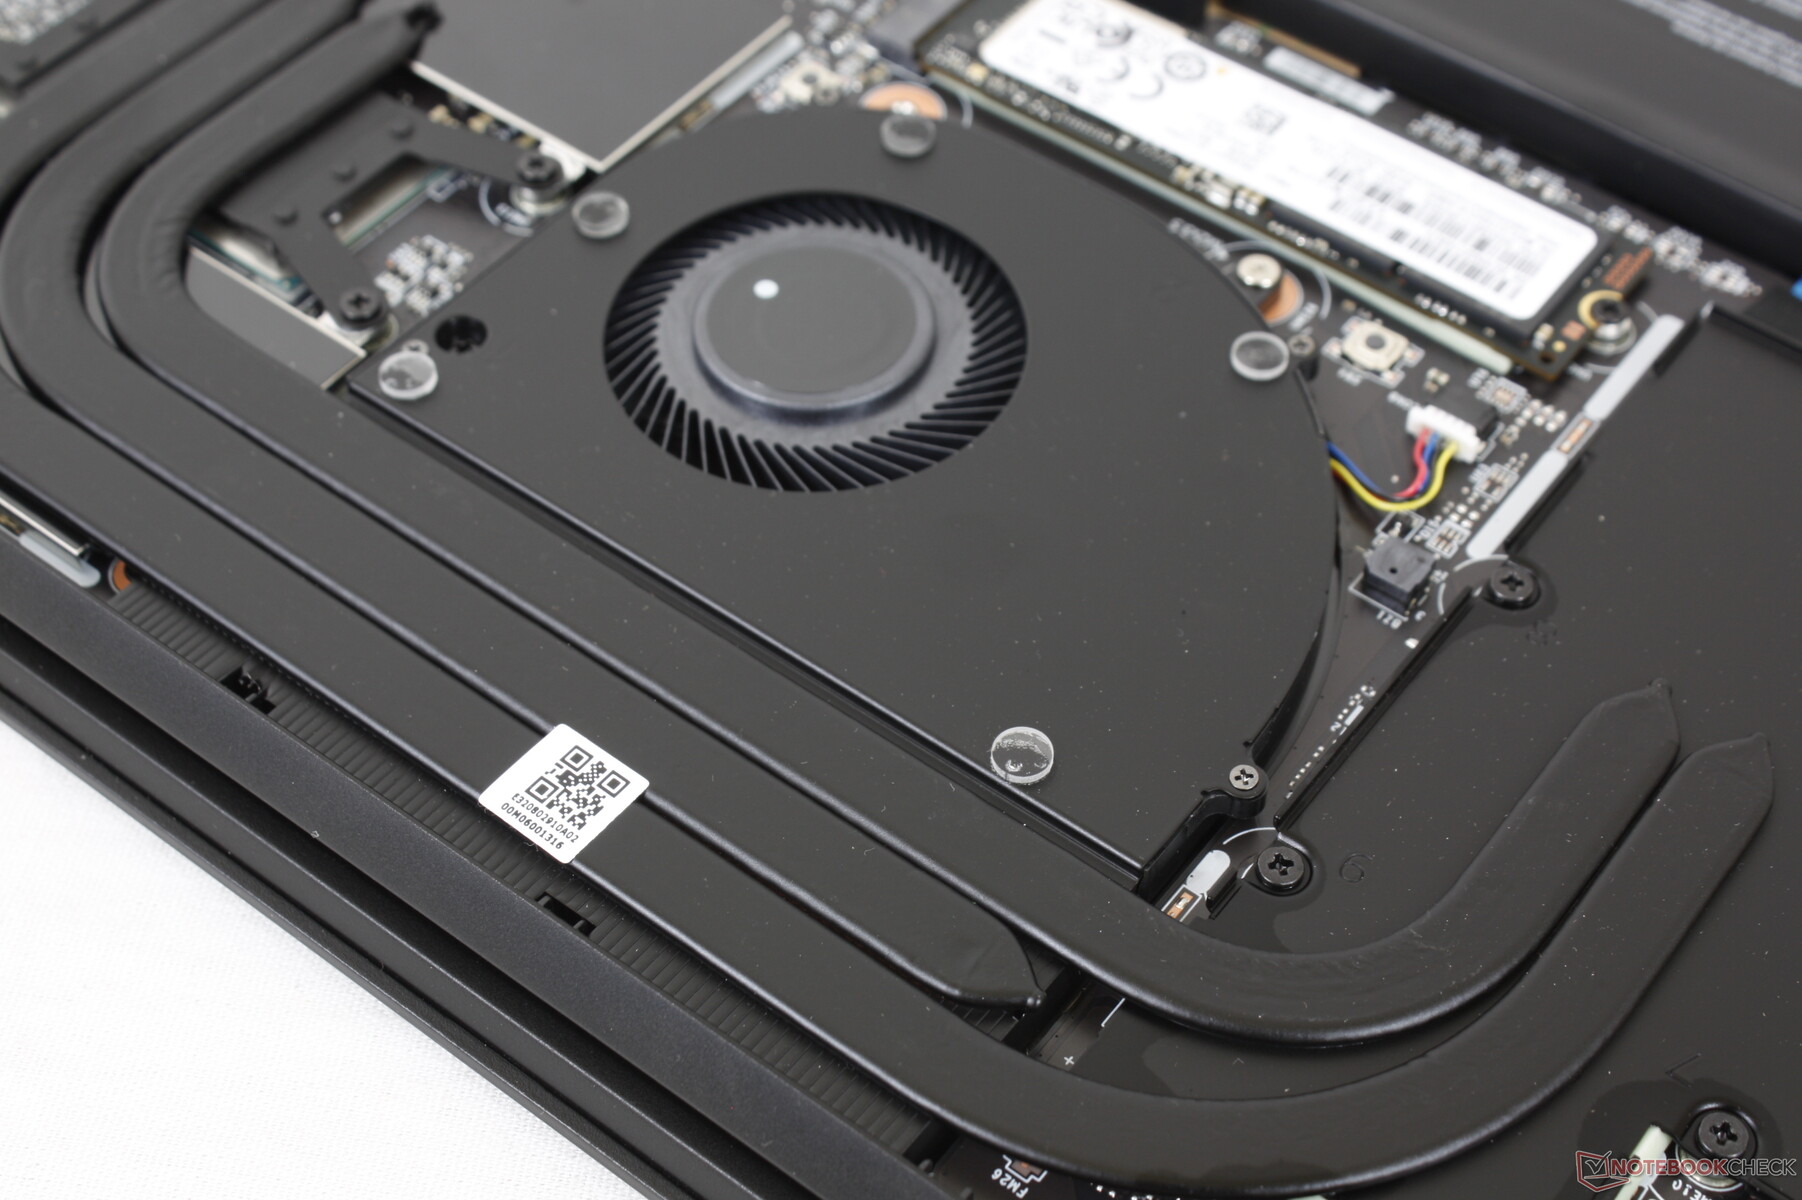
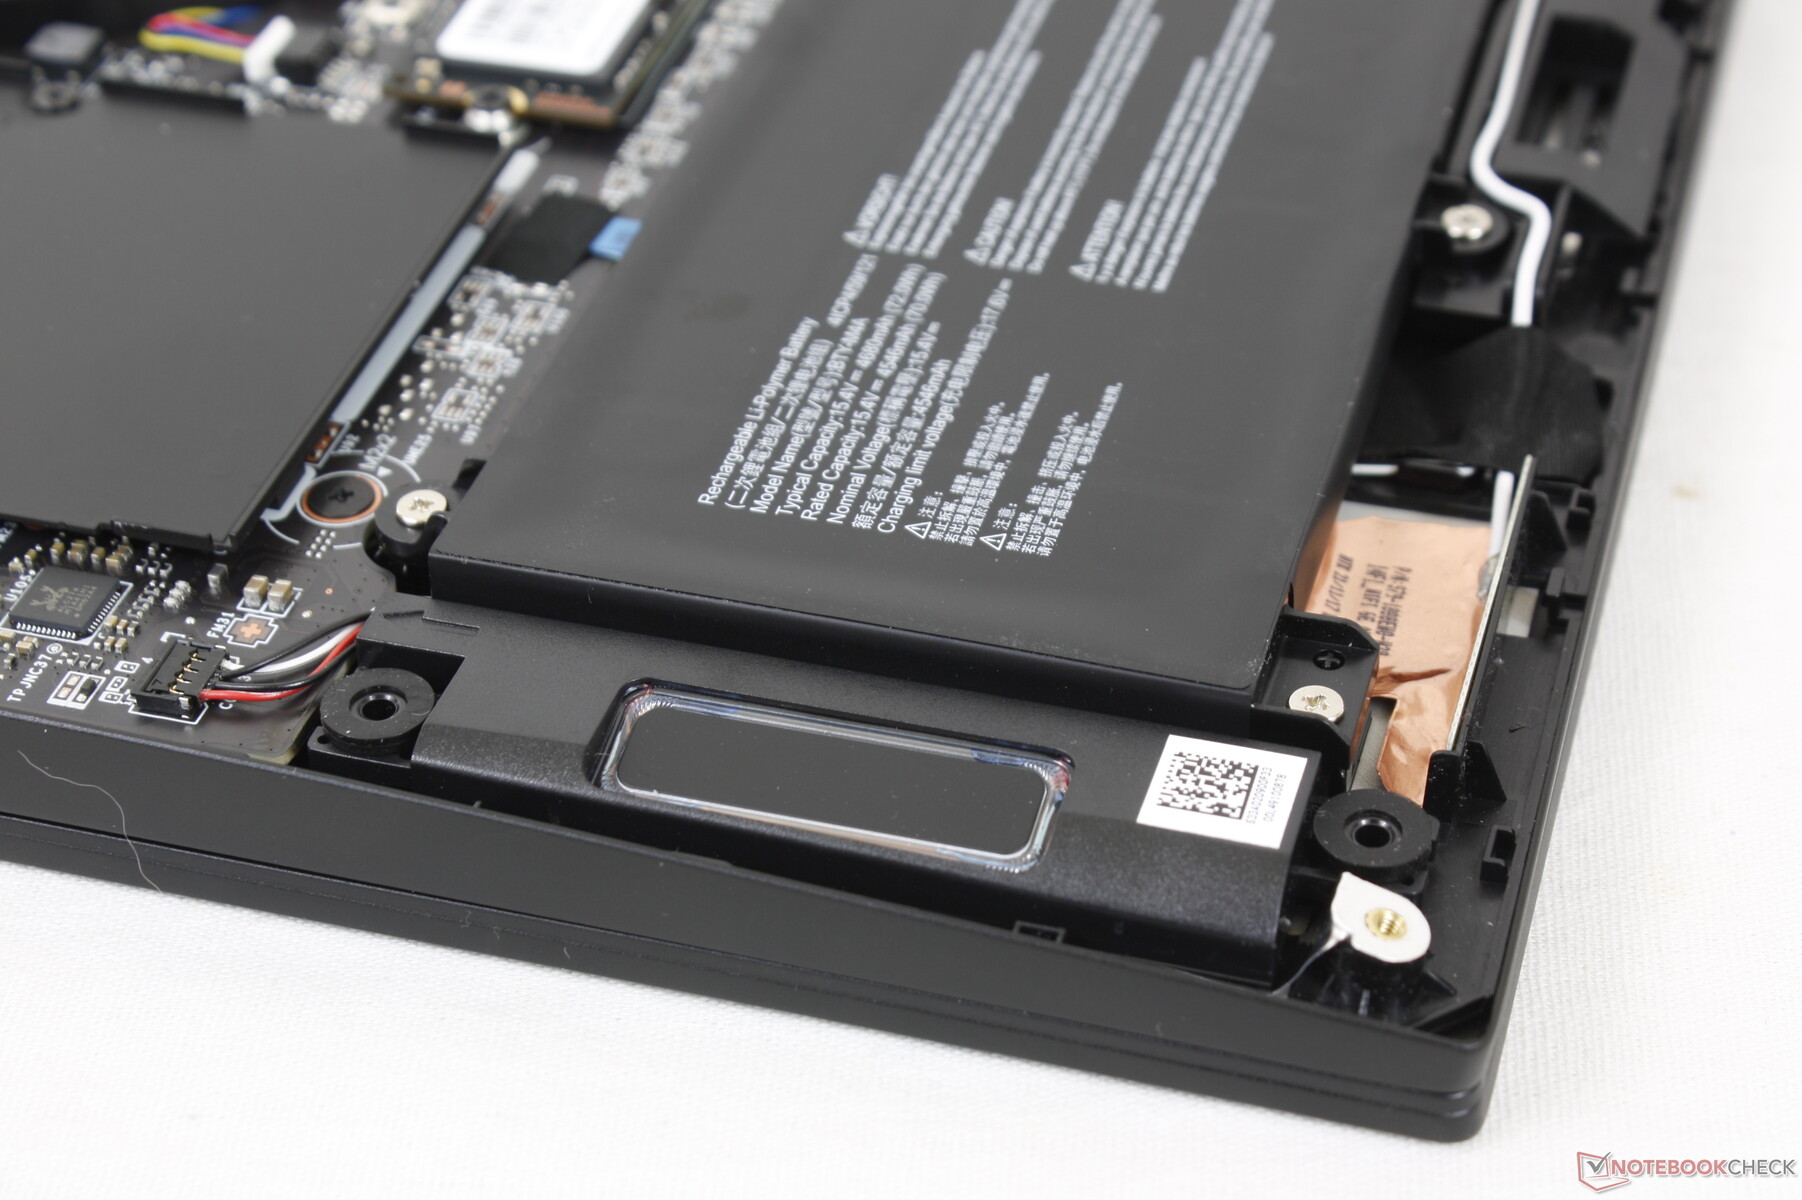
Maintenance
The bottom panel is secured by just 9 Philips screws for easy removal. However, keep in mind that you must break a factory seal sticker in order to access one of the screws. There isn't much to upgrade as there is only one storage slot and both the RAM and WLAN modules are soldered onto the board.
The layout and design of the motherboard are completely different from the Summit E14 clamshell as shown by the comparison images below.
Accessories and Warranty
The retail box includes the active MSI Pen which currently retails for over $100 USD. The standard one-year limited manufacturer warranty applies.
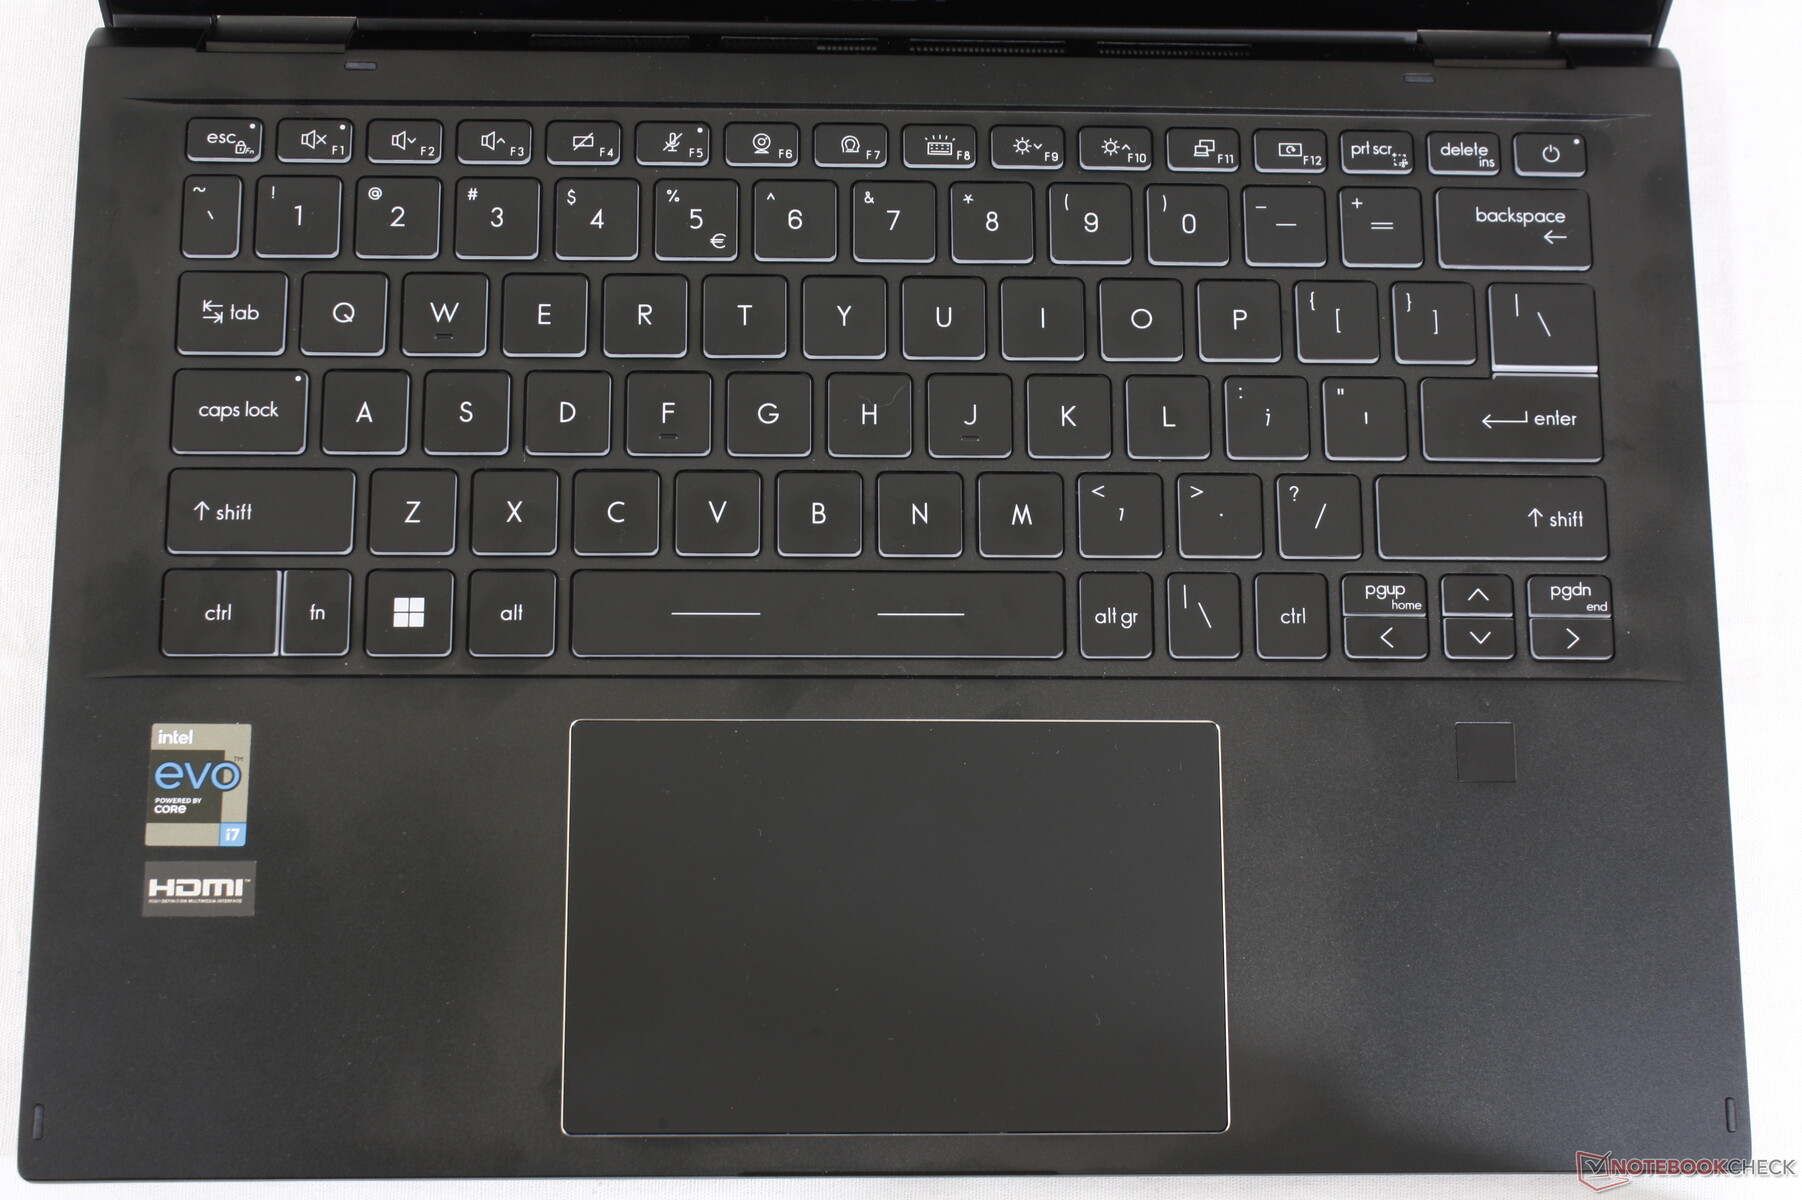
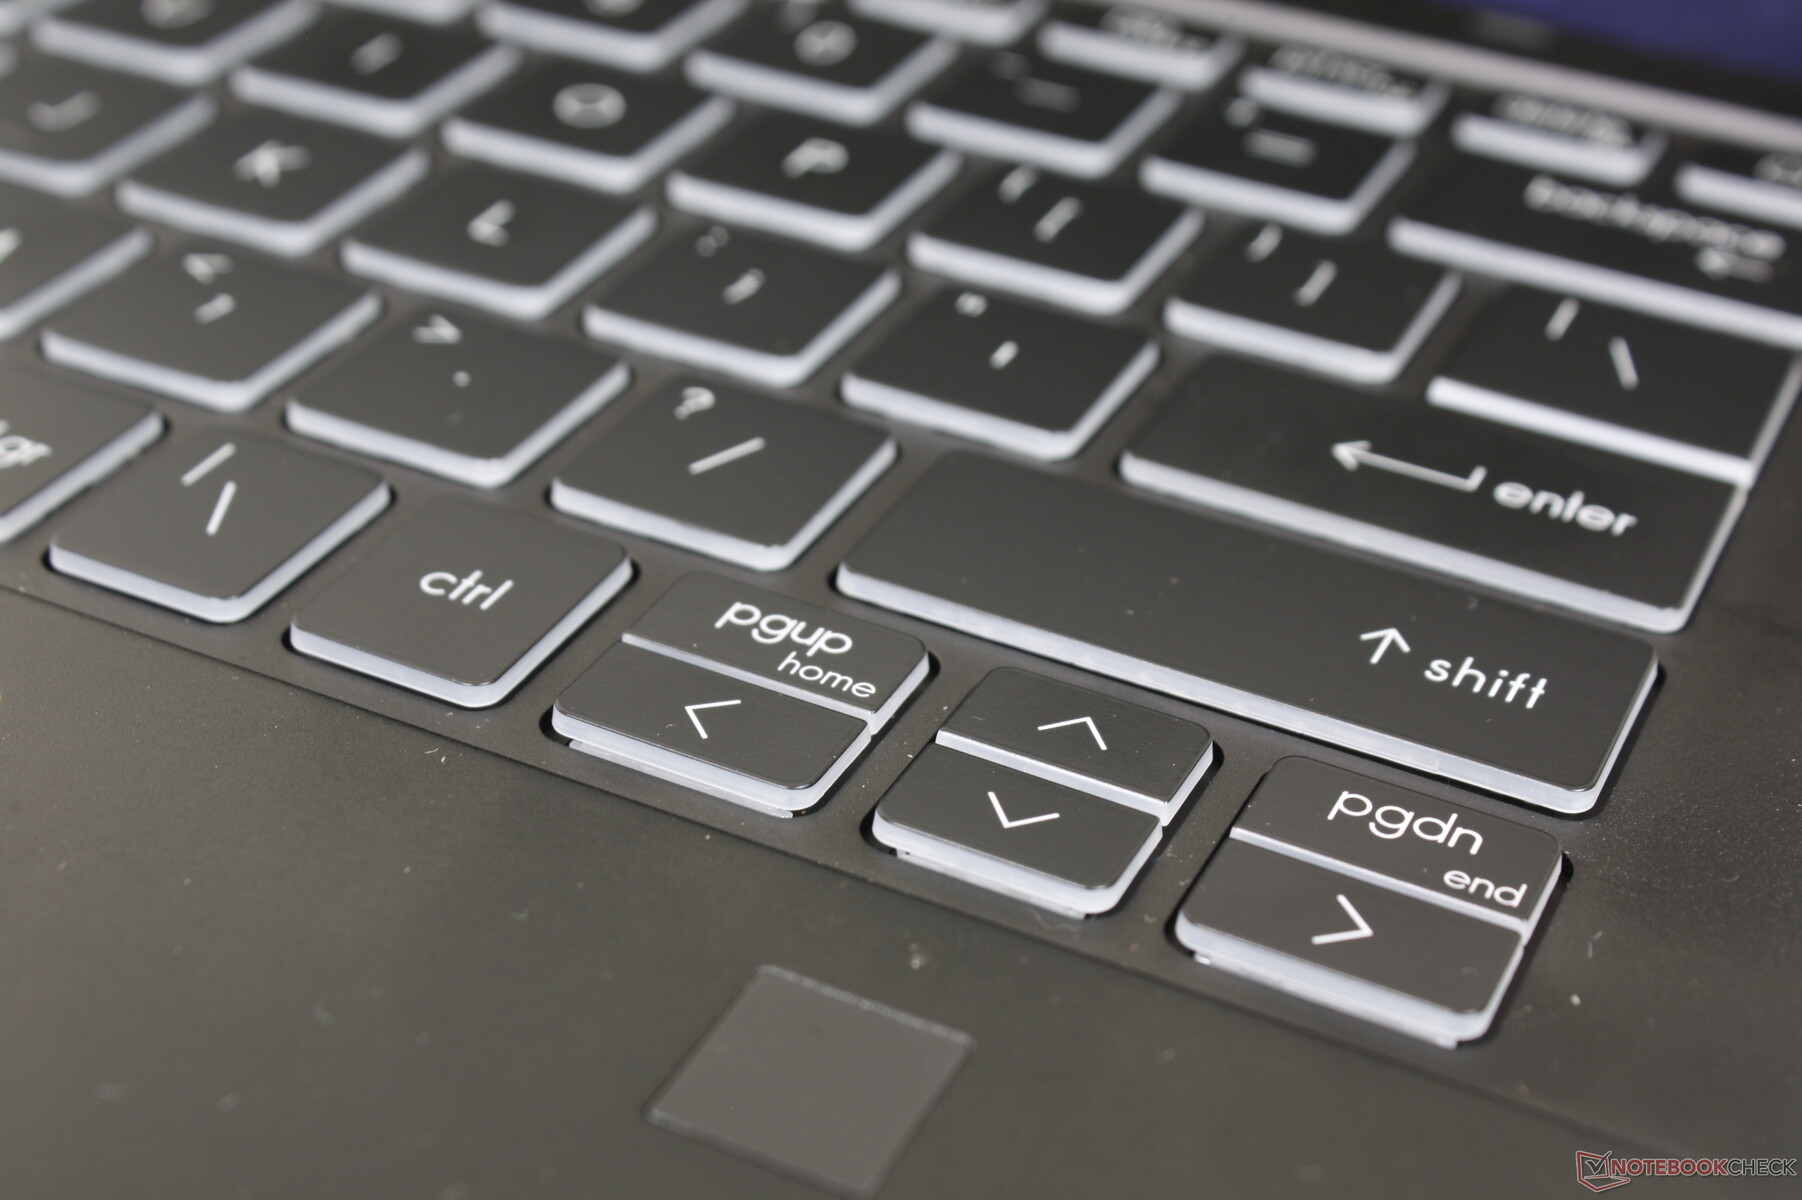
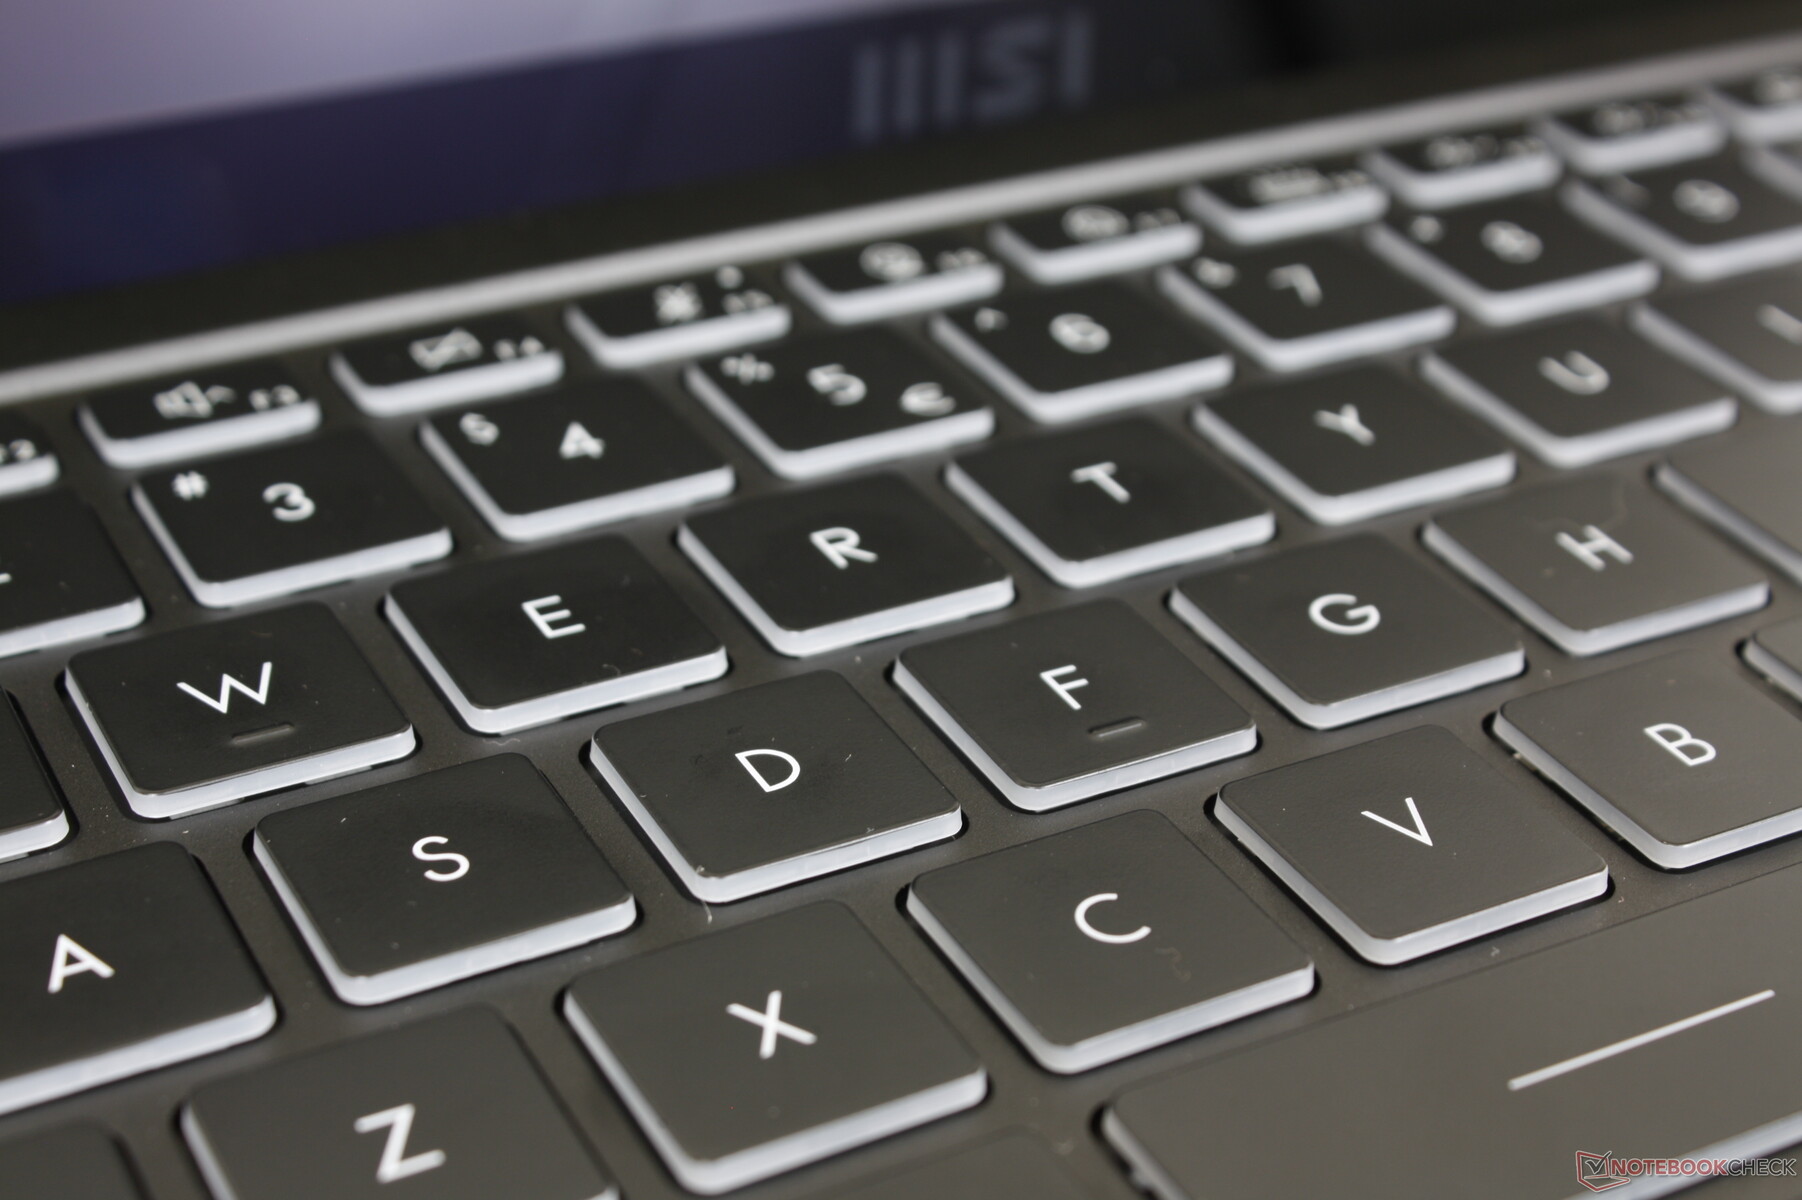
Input Devices — No Major Summit Changes
Keyboard
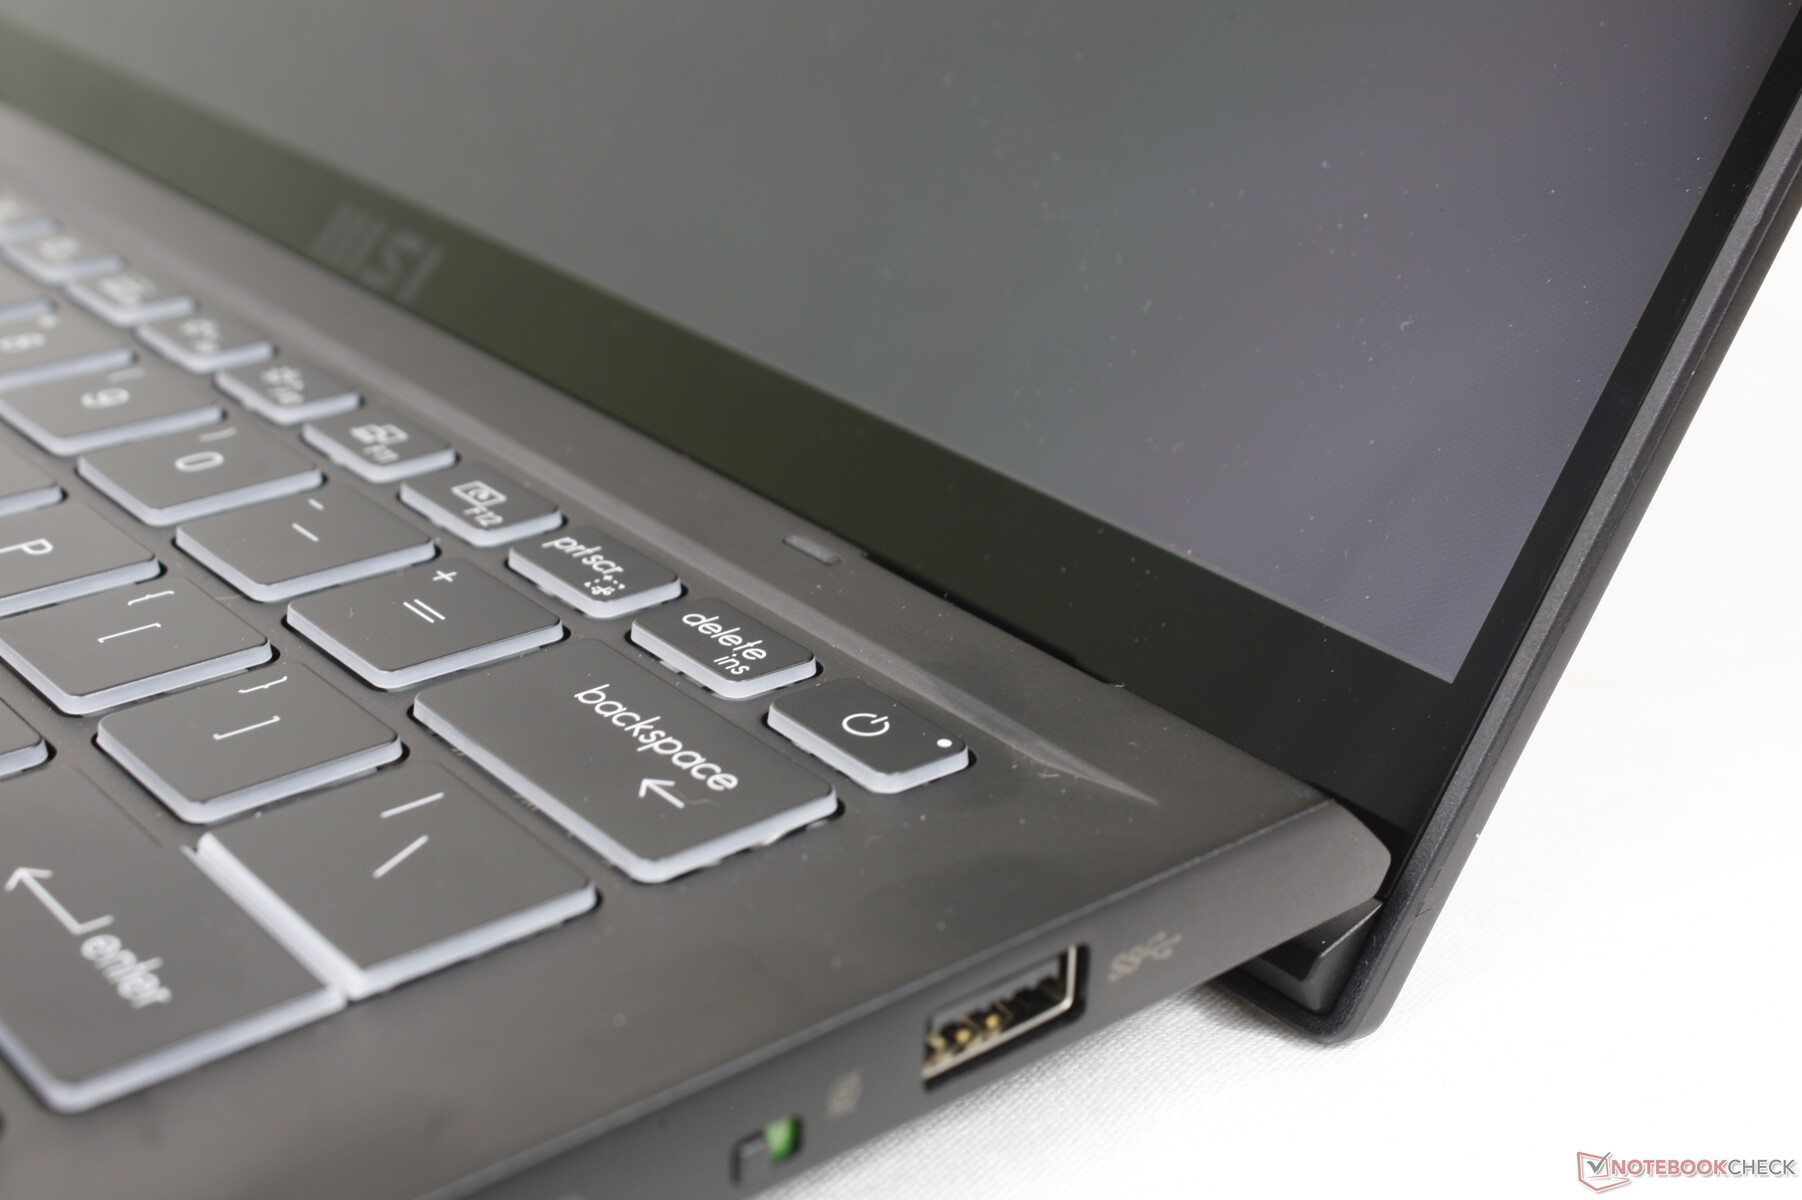
Keyboard layout differs from the Summit E14 clamshell. The right column of Del, Insert, PgDn, and PgUp keys, for example, is now gone for a shorter keyboard width overall. The typing experience remains satisfactory with louder-than-average key clatter and slightly softer feedback than the keys on an HP Spectre x360 14.
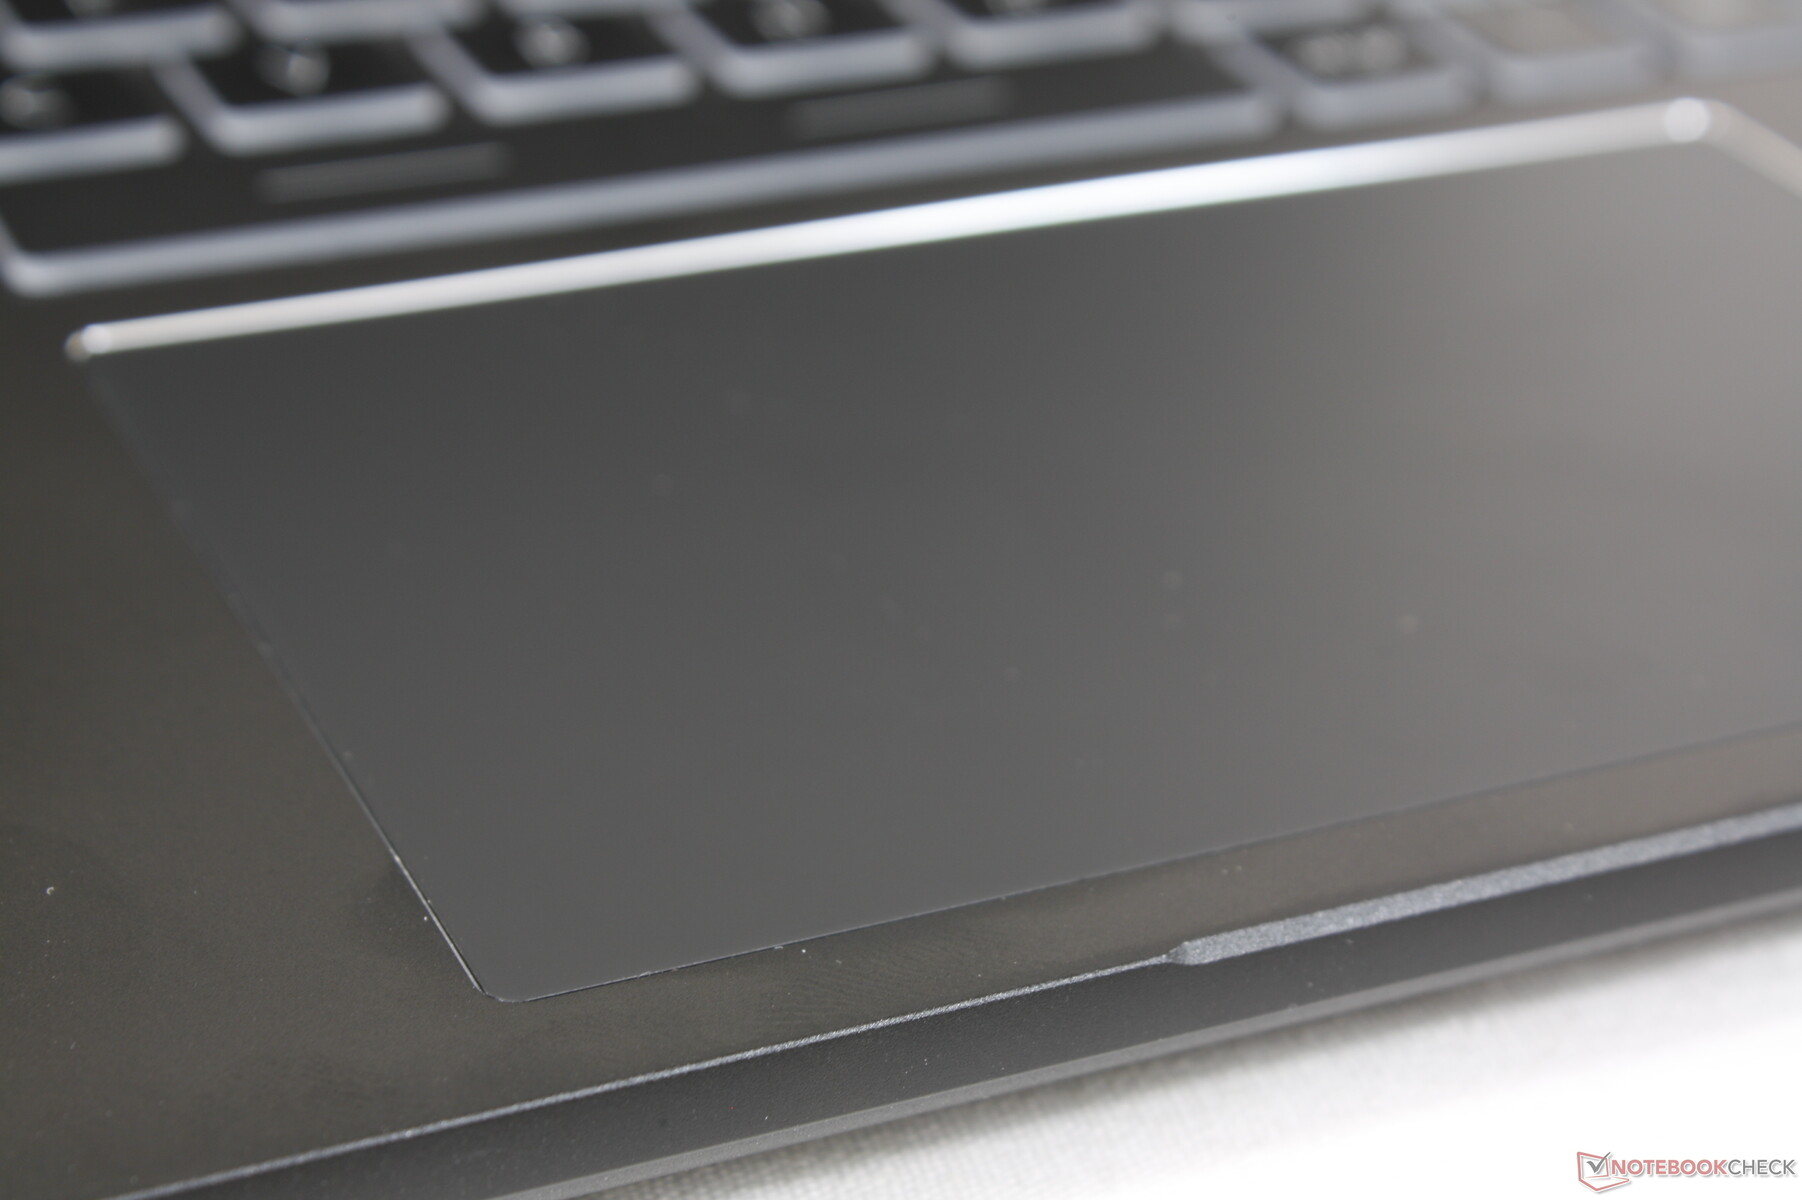
Touchpad
MSI has increased the size of the clickpad from 10.5 x 6.5 cm on the Summit E14 clamshell to 12 x 7.5 cm on the convertible version for more comfortable multi-touch inputs. Its gliding properties are extremely smooth even when moving at slow speeds which can make finer cursor clicks somewhat difficult. Meanwhile, feedback from clicking on the clickpad is adequate and easy to press in rapid succession without tiring the finger.
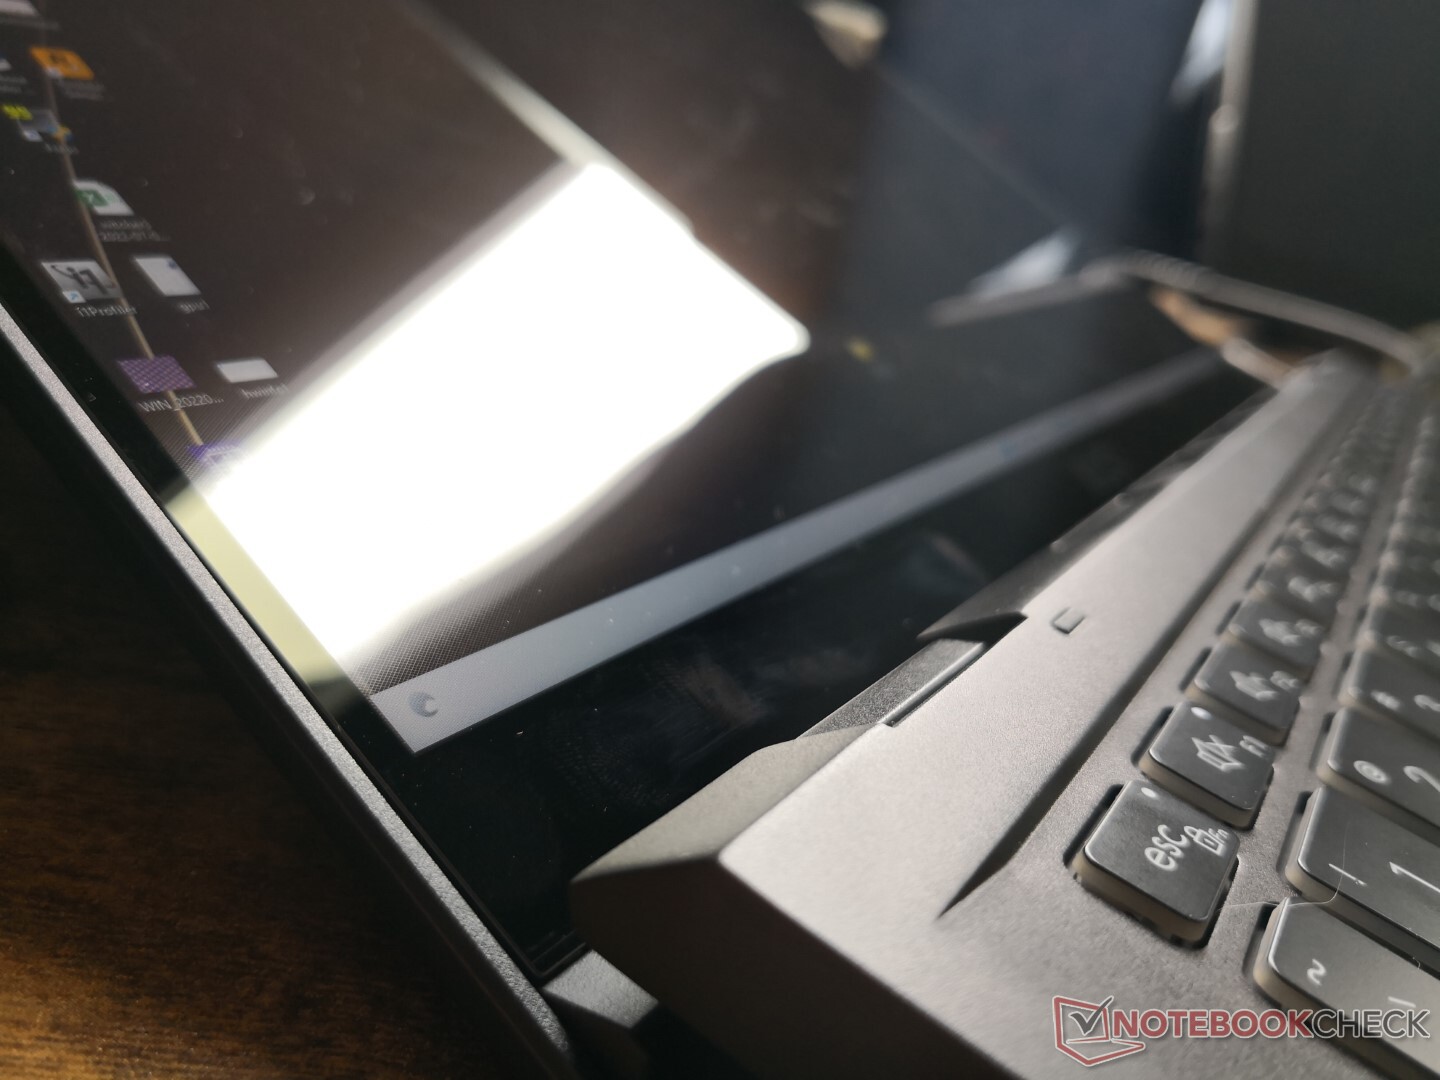
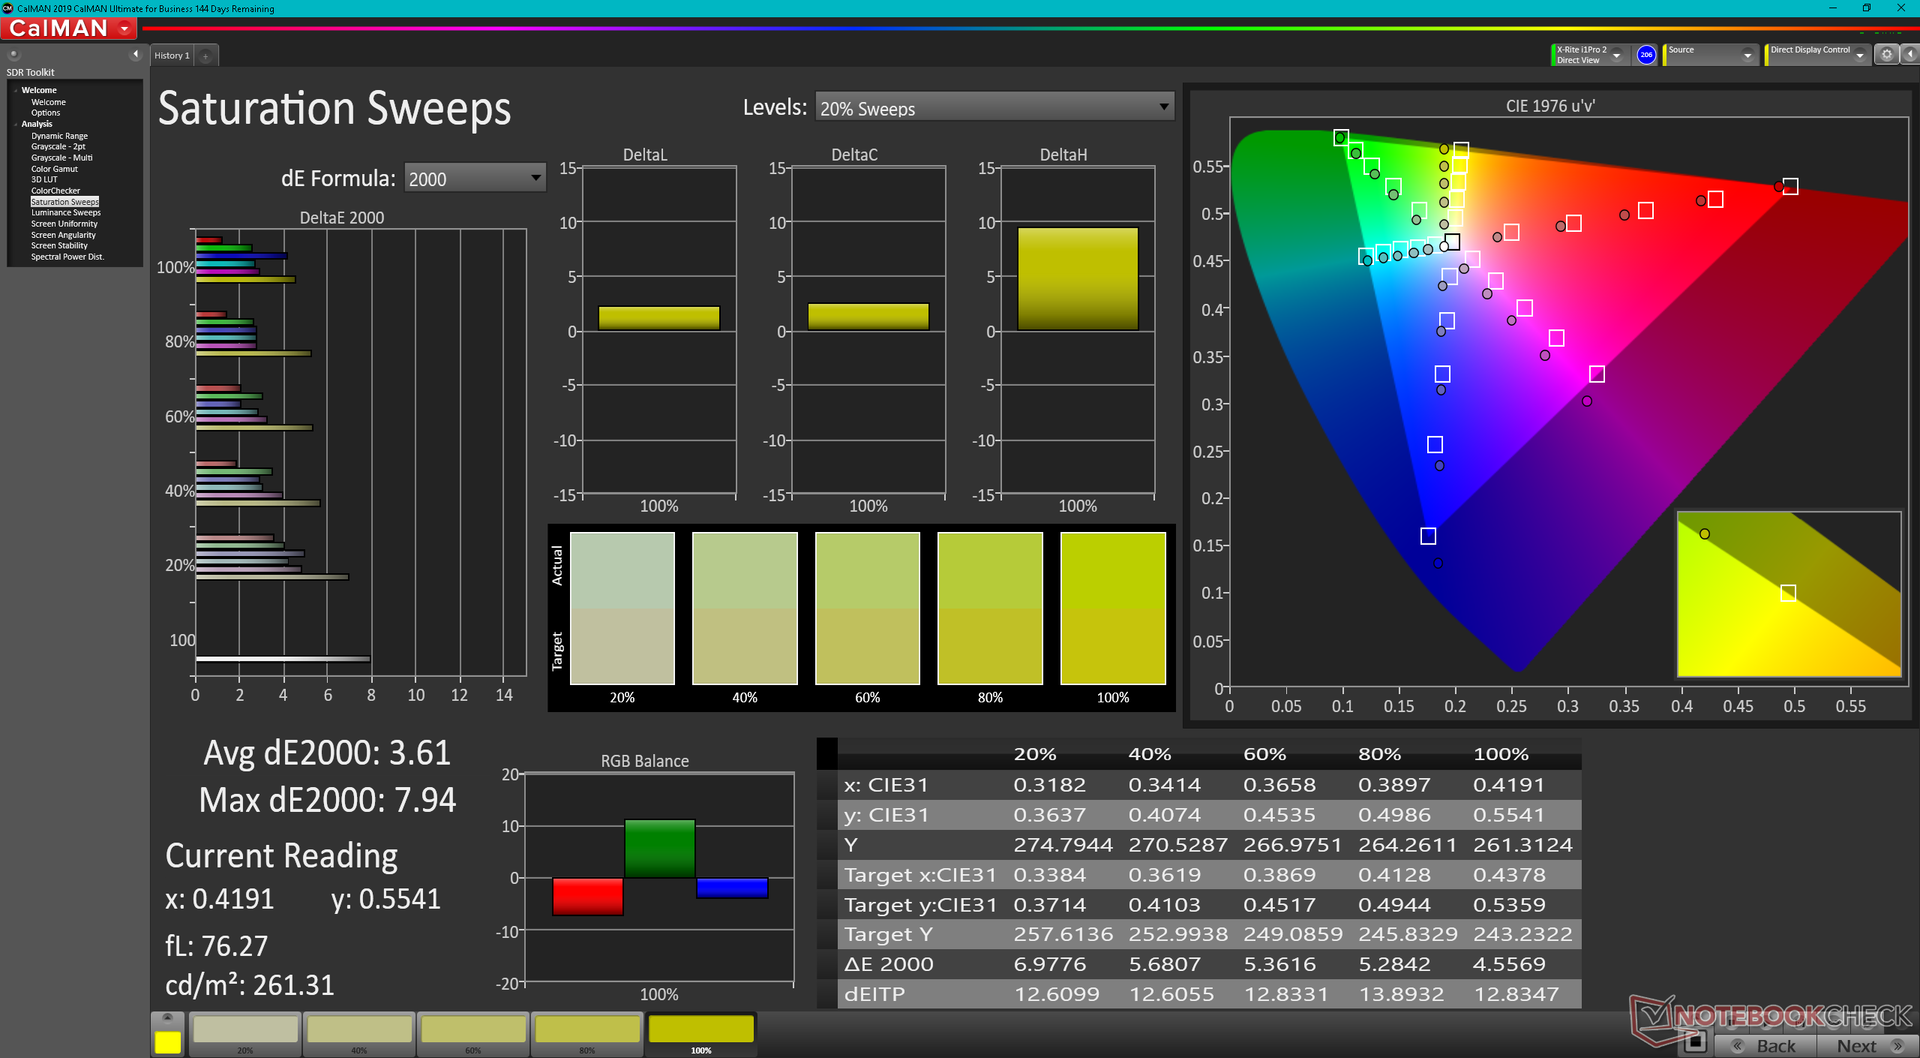
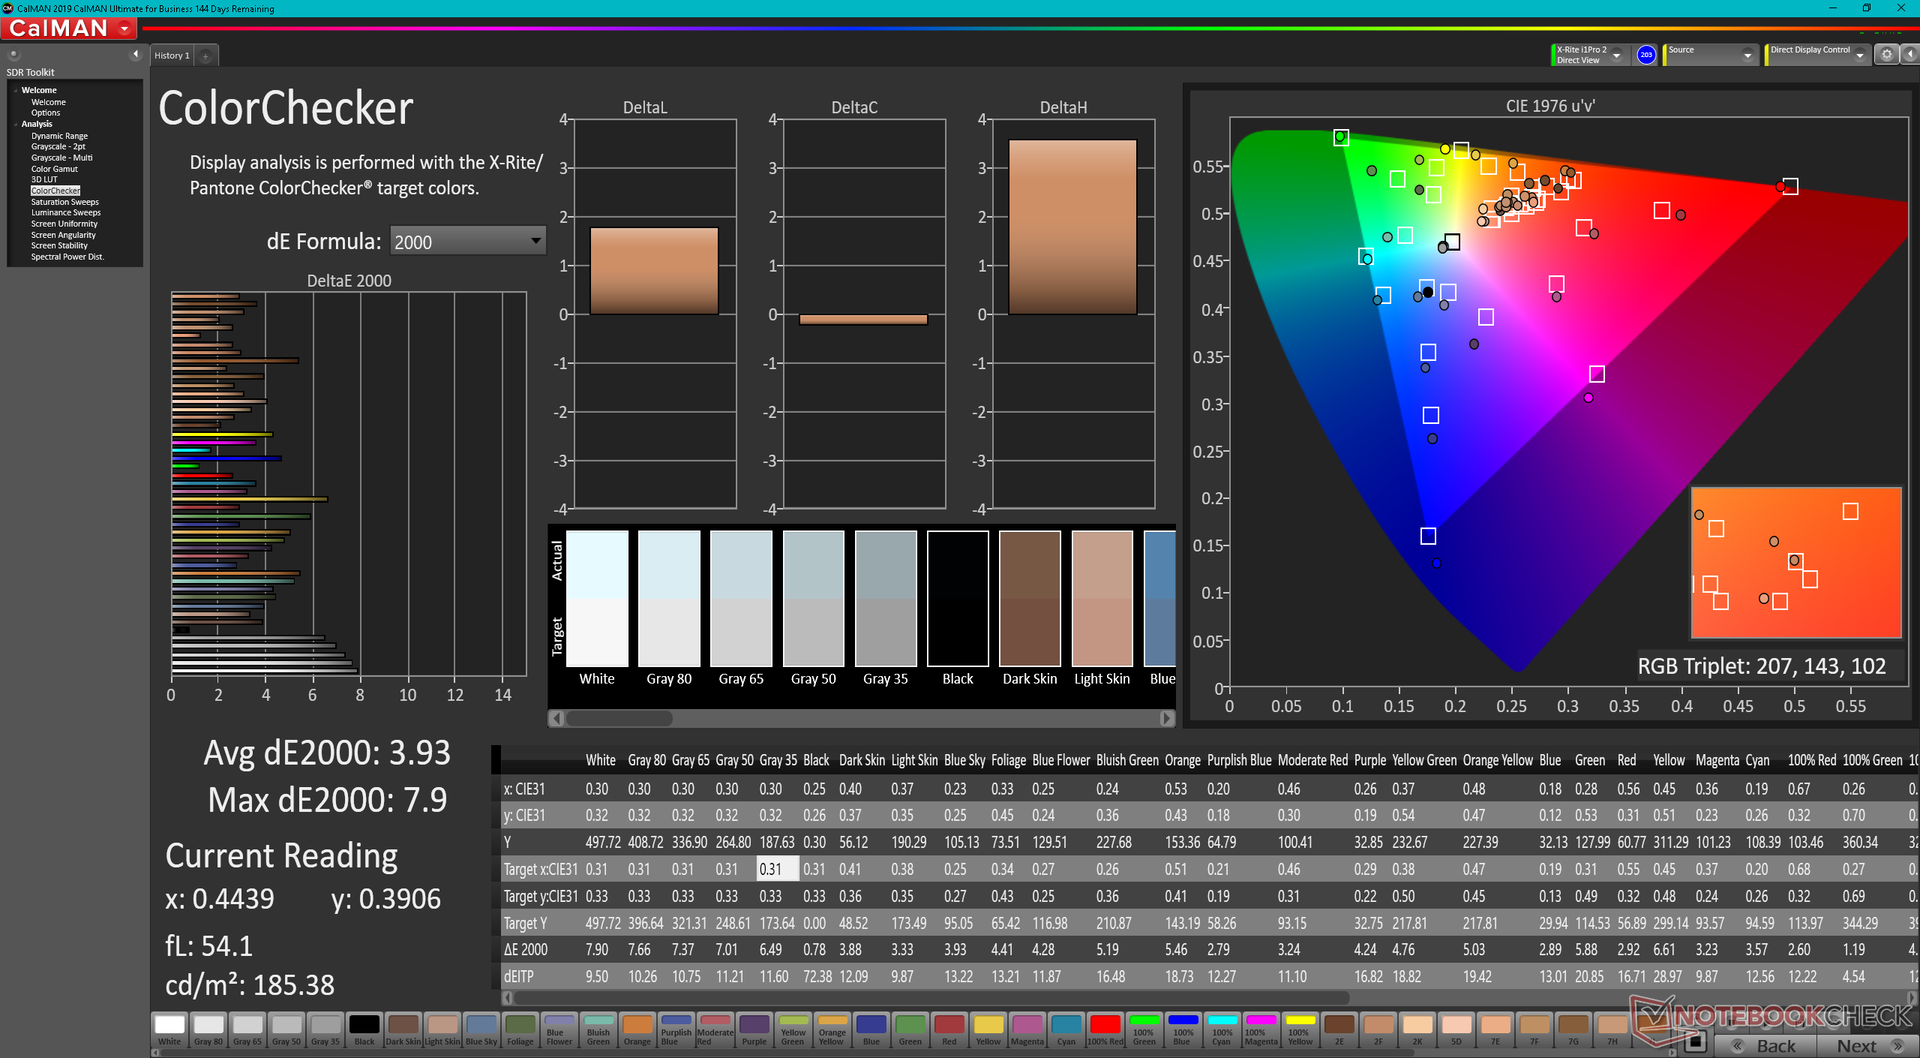
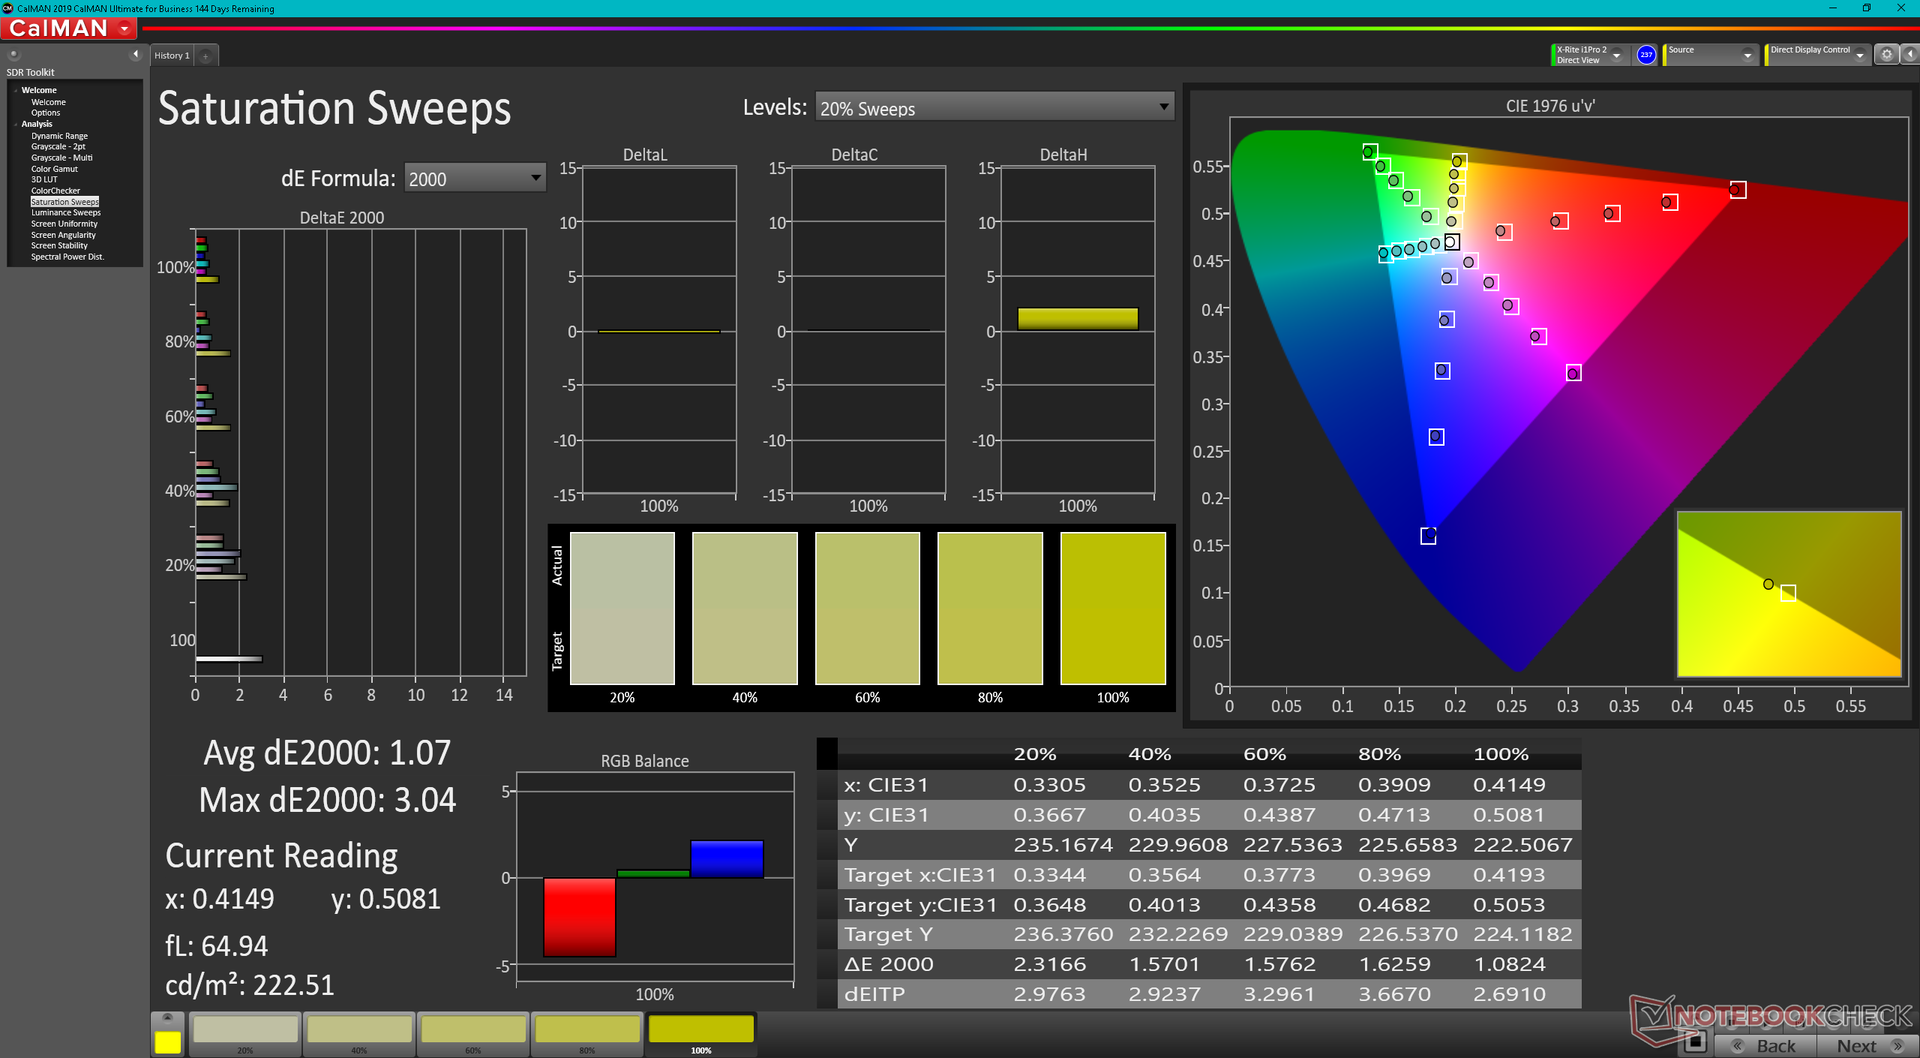
Display — Great Colors, But Stuck At 60 Hz
The model offers the same native resolution as on the Lenovo Yoga Slim 7i Pro but with wider colors to support the DCI-P3 standard. Black-white and gray-gray response times, though not as fast as OLED, are still faster than on the LG Gram 14T90P or Latitude 9420 2-in-1 for noticeably less ghosting. The display works very well for both gaming and office tasks as a result of its deep colors, bright 500-nit backlight, and reasonable response times.
A key limitation to the display is its native 60 Hz refresh rate as other subnotebooks are beginning to offer 90 Hz refresh rates or higher. Alternatives like the Lenovo IdeaPad Slim 7i Pro or Asus VivoBook S 14X can offer noticeably smoother UI experiences with their higher refresh rates. Pen inputs in particular would have benefited from a higher display refresh rate than the typical 60 Hz.
| |||||||||||||||||||||||||
Brightness Distribution: 87 %
Center on Battery: 496.7 cd/m²
Contrast: 1656:1 (Black: 0.3 cd/m²)
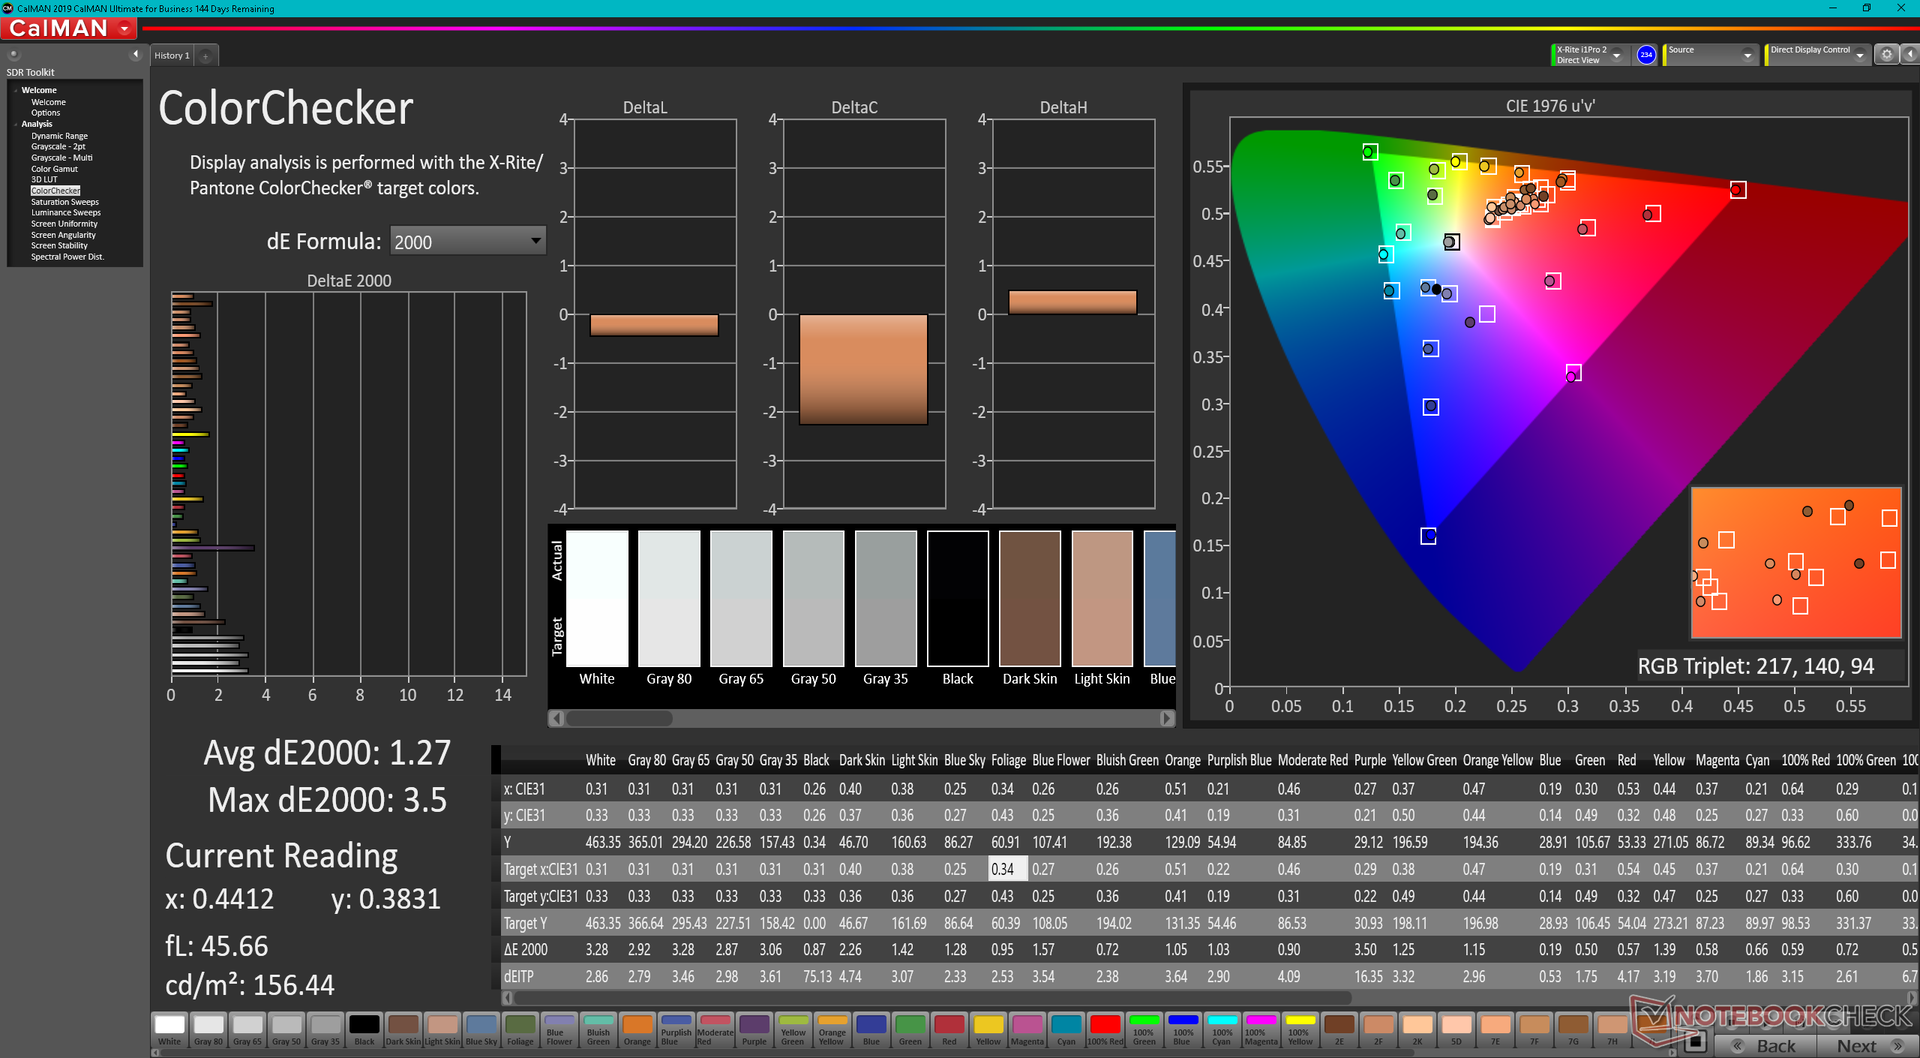
ΔE Color 3.93 | 0.5-29.43 Ø5, calibrated: 1.27
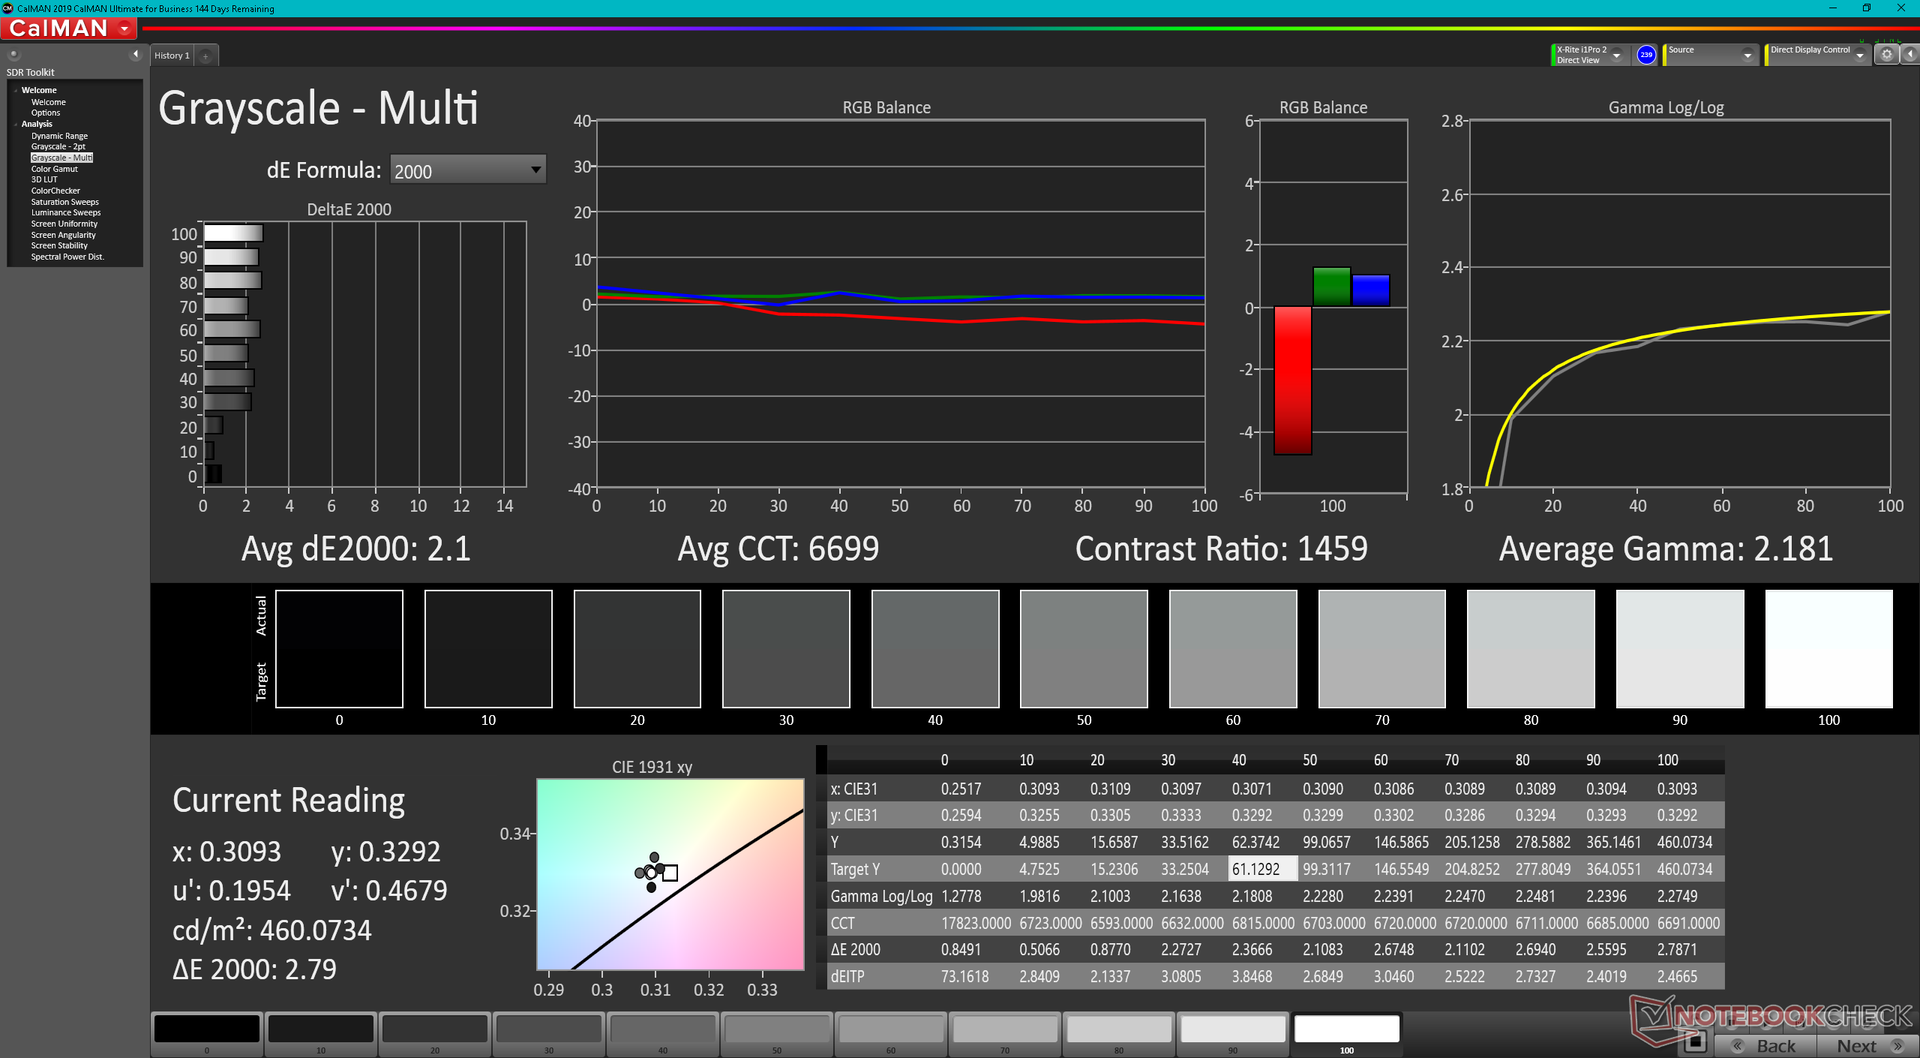
ΔE Greyscale 5.9 | 0.57-98 Ø5.3
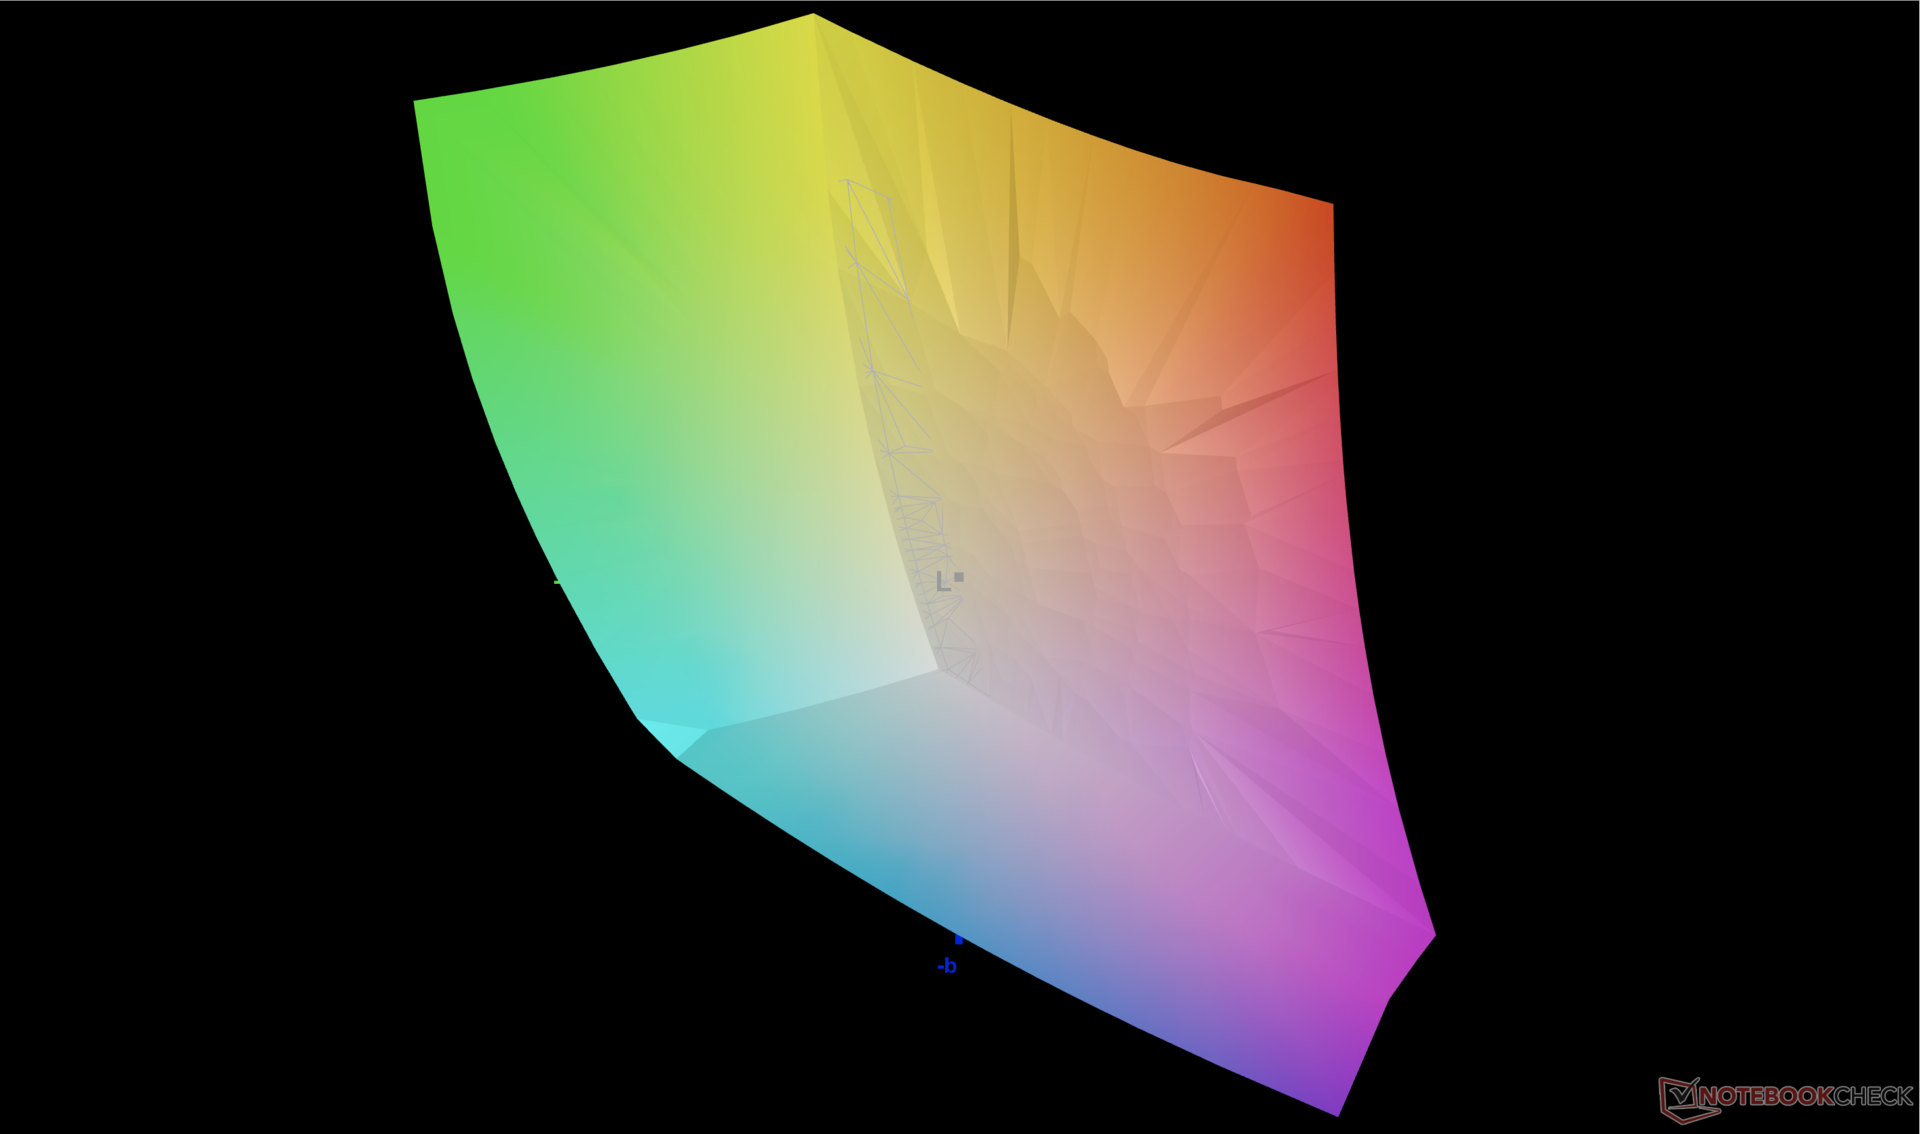
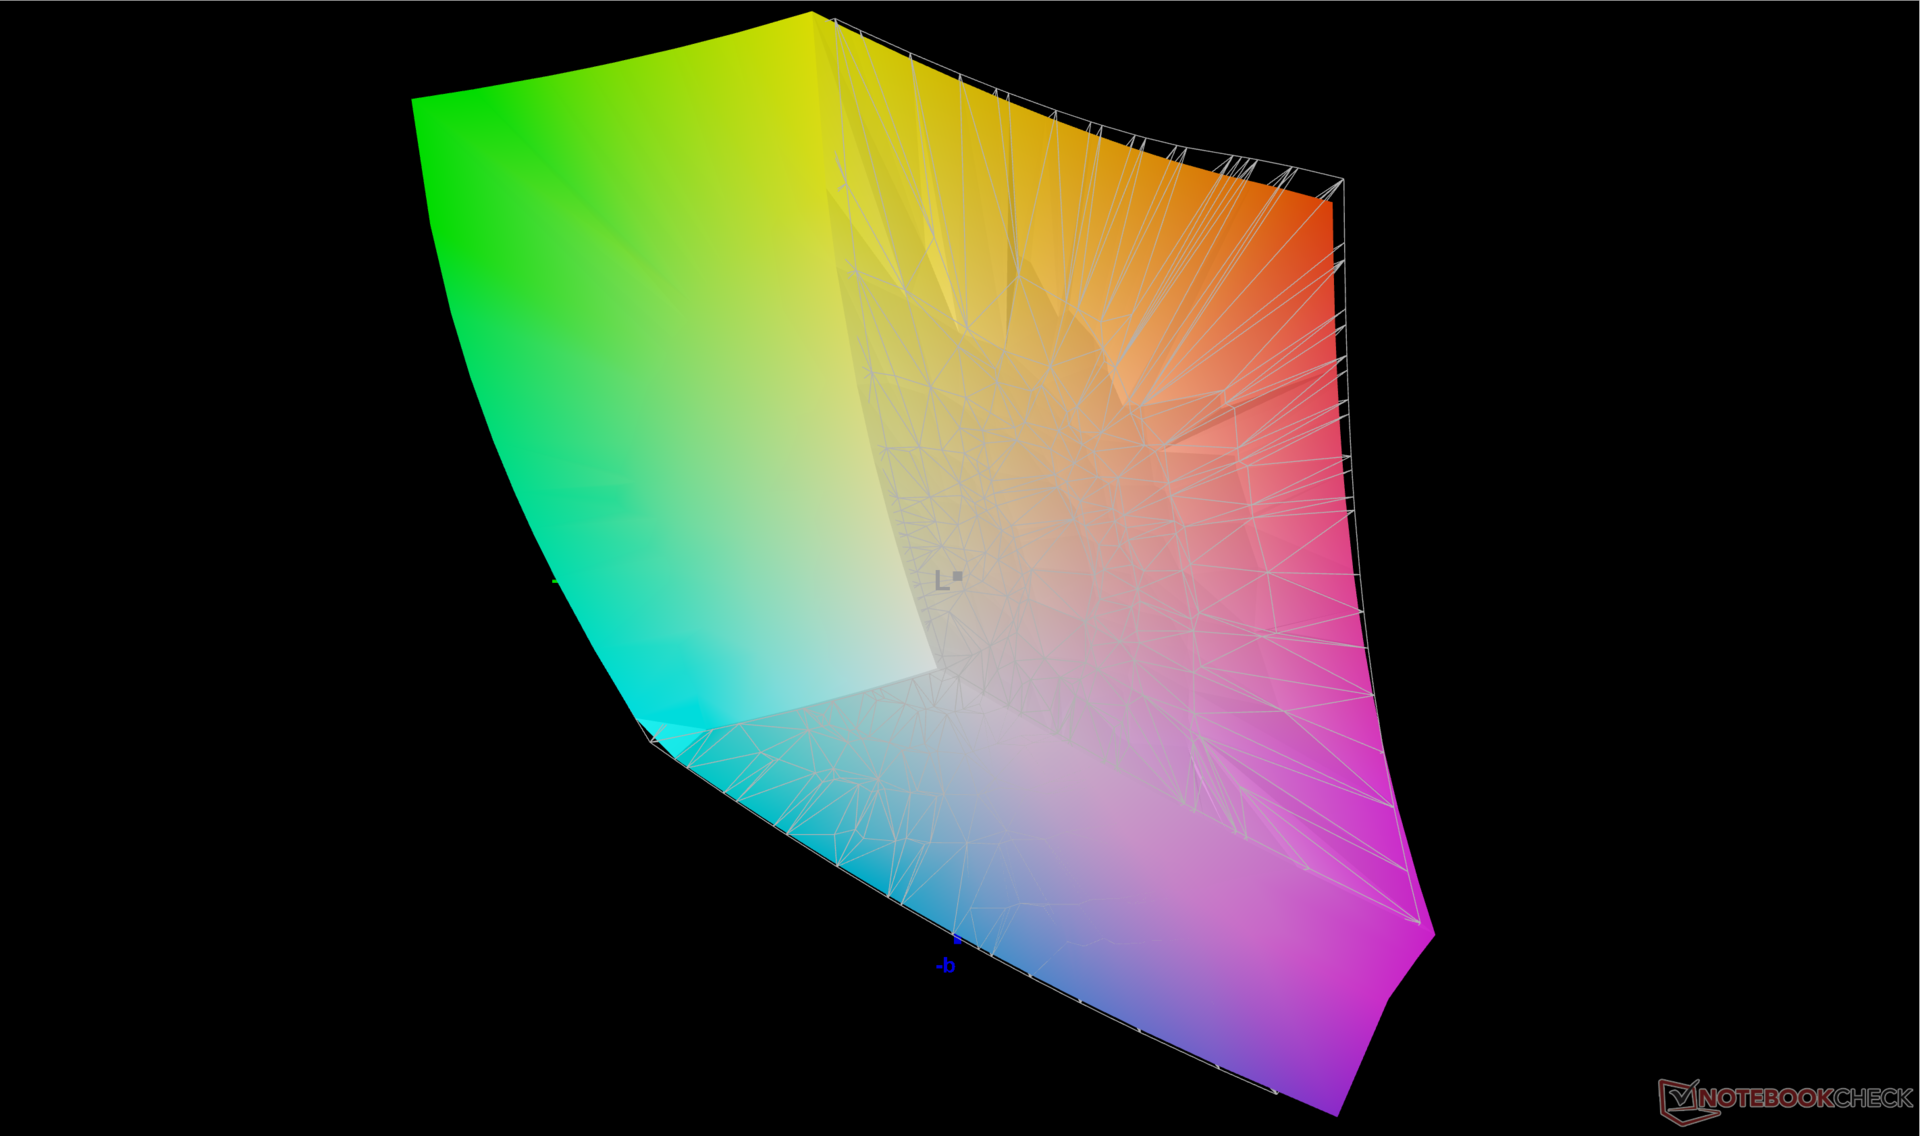
85.9% AdobeRGB 1998 (Argyll 2.2.0 3D)
99.9% sRGB (Argyll 2.2.0 3D)
97.8% Display P3 (Argyll 2.2.0 3D)
Gamma: 2.04
| MSI Summit E14 Flip Evo A12MT AU Optronics B140QAN04.R, IPS, 2880x1800, 14.00 | MSI Summit E14 A11SCS AU Optronics AUO123B, IPS, 3840x2160, 14.00 | Asus VivoBook S 14X S5402Z Samsung ATNA45AF01-0, OLED, 2880x1800, 14.50 | LG Gram 14T90P LG Philips LP140WU1-SPA1, IPS, 1900x1200, 14.00 | Lenovo Yoga Slim 7i Pro 14IAP G7 LEN140WQ+, IPS, 2880x1800, 14.00 | Dell Latitude 9420 2-in-1 AU Optronics B140QAN, IPS, 2560x1600, 14.00 | |
|---|---|---|---|---|---|---|
| Display | 2% | 4% | 1% | -10% | -8% | |
| Display P3 Coverage | 97.8 | 87.5 -11% | 99.9 2% | 98.8 1% | 77.7 -21% | 80.7 -17% |
| sRGB Coverage | 99.9 | 100 0% | 100 0% | 100 0% | 100 0% | 100 0% |
| AdobeRGB 1998 Coverage | 85.9 | 99.4 16% | 95.5 11% | 78.4 -9% | 79.7 -7% | |
| Response Times | -154% | 95% | -128% | -61% | -167% | |
| Response Time Grey 50% / Grey 80% * | 16.9 ? | 52 ? -208% | 0.73 ? 96% | 44 ? -160% | 35.2 ? -108% | 54 ? -220% |
| Response Time Black / White * | 15.4 ? | 30.8 ? -100% | 1 ? 94% | 30 ? -95% | 17.6 ? -14% | 32.8 ? -113% |
| PWM Frequency | 240.4 ? | |||||
| Screen | -29% | 18% | 1% | 7% | -0% | |
| Brightness middle | 496.7 | 593.3 19% | 373 -25% | 305.5 -38% | 469 -6% | 483.6 -3% |
| Brightness | 468 | 571 22% | 375 -20% | 289 -38% | 445 -5% | 465 -1% |
| Brightness Distribution | 87 | 87 0% | 99 14% | 87 0% | 90 3% | 92 6% |
| Black Level * | 0.3 | 0.53 -77% | 0.27 10% | 0.32 -7% | ||
| Contrast | 1656 | 1119 -32% | 1131 -32% | 1511 -9% | ||
| Colorchecker dE 2000 * | 3.93 | 4.42 -12% | 2.26 42% | 3.31 16% | 3.5 11% | 3.69 6% |
| Colorchecker dE 2000 max. * | 7.9 | 7.16 9% | 6.22 21% | 6.12 23% | 5.3 33% | 5.97 24% |
| Colorchecker dE 2000 calibrated * | 1.27 | 4.3 -239% | 1.7 -34% | 2.05 -61% | ||
| Greyscale dE 2000 * | 5.9 | 3.2 46% | 1.4 76% | 1.9 68% | 3.3 44% | 3.5 41% |
| Gamma | 2.04 108% | 2.04 108% | 2.22 99% | 2.04 108% | 1.97 112% | 2.04 108% |
| CCT | 7618 85% | 6737 96% | 6417 101% | 6706 97% | 6512 100% | 6158 106% |
| Total Average (Program / Settings) | -60% /
-41% | 39% /
28% | -42% /
-20% | -21% /
-9% | -58% /
-26% |
* ... smaller is better
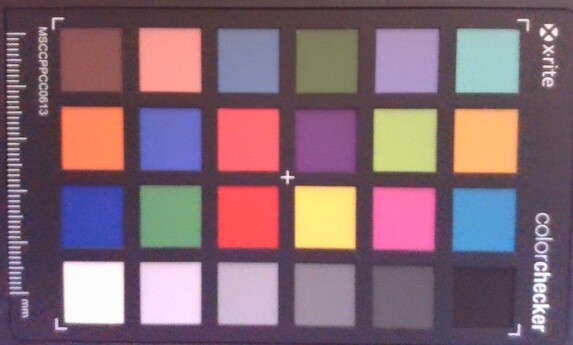
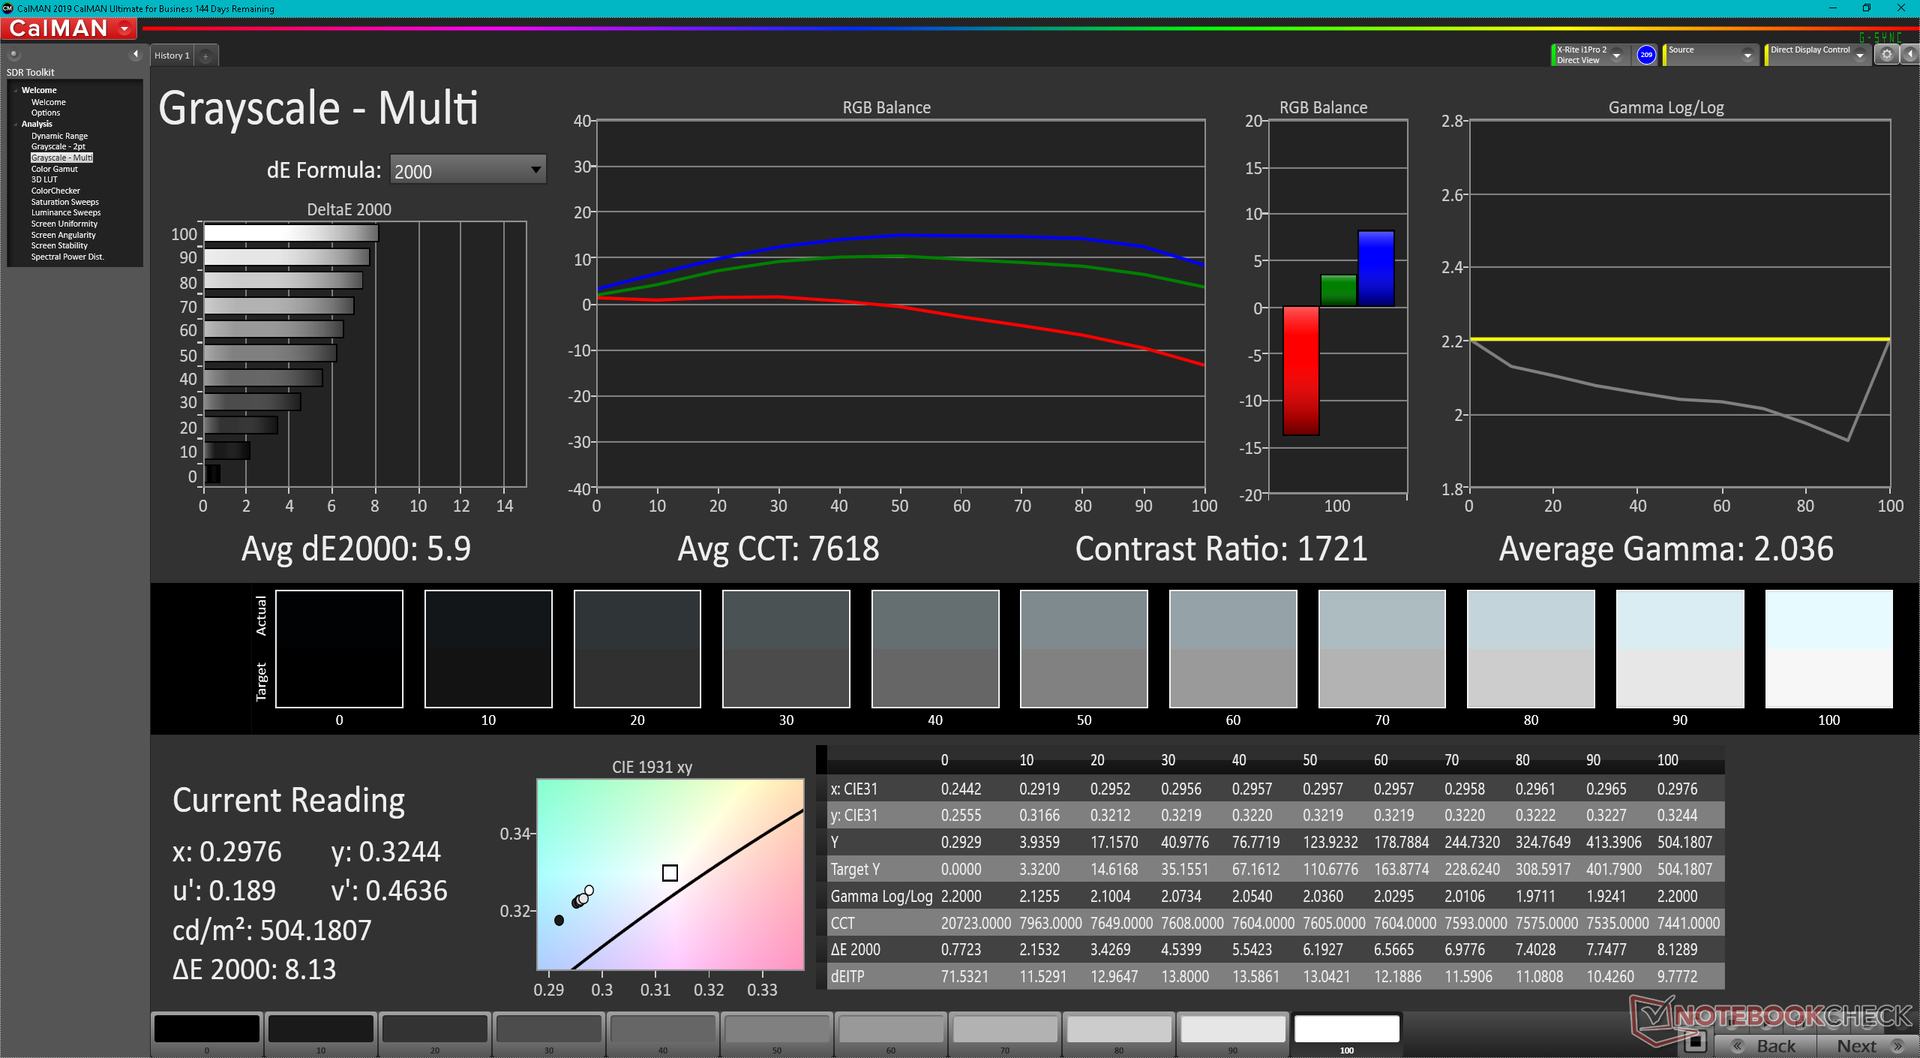
The display on our Summit is not factory calibrated unlike on many MSI Creator models despite the fact that the panel offers full DCI-P3 coverage. Thus, average grayscale and color DeltaE values are mediocre at 5.9 and 3.93, respectively, against the P3 standard. Color temperature in particular is cooler than we would like at 7618. Users will need to calibrate their displays to better exploit its color range.
Display Response Times
| ↔ Response Time Black to White | ||
|---|---|---|
| 15.4 ms ... rise ↗ and fall ↘ combined | ↗ 7.3 ms rise | 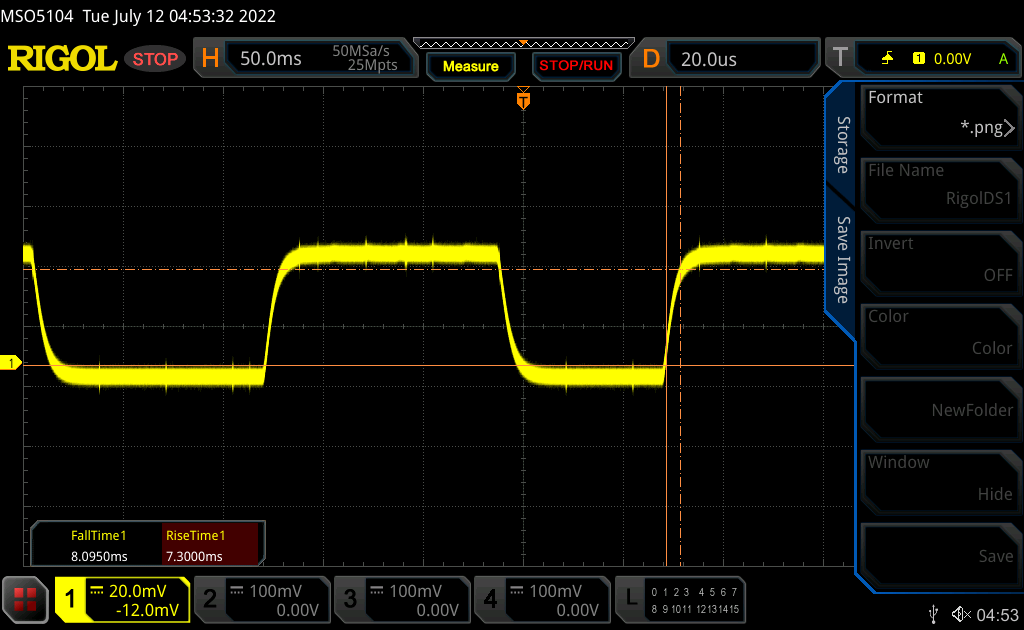 |
| ↘ 8.1 ms fall | ||
| The screen shows good response rates in our tests, but may be too slow for competitive gamers. In comparison, all tested devices range from 0.1 (minimum) to 240 (maximum) ms. » 31 % of all devices are better. This means that the measured response time is better than the average of all tested devices (21.5 ms). | ||
| ↔ Response Time 50% Grey to 80% Grey | ||
| 16.9 ms ... rise ↗ and fall ↘ combined | ↗ 7.3 ms rise | 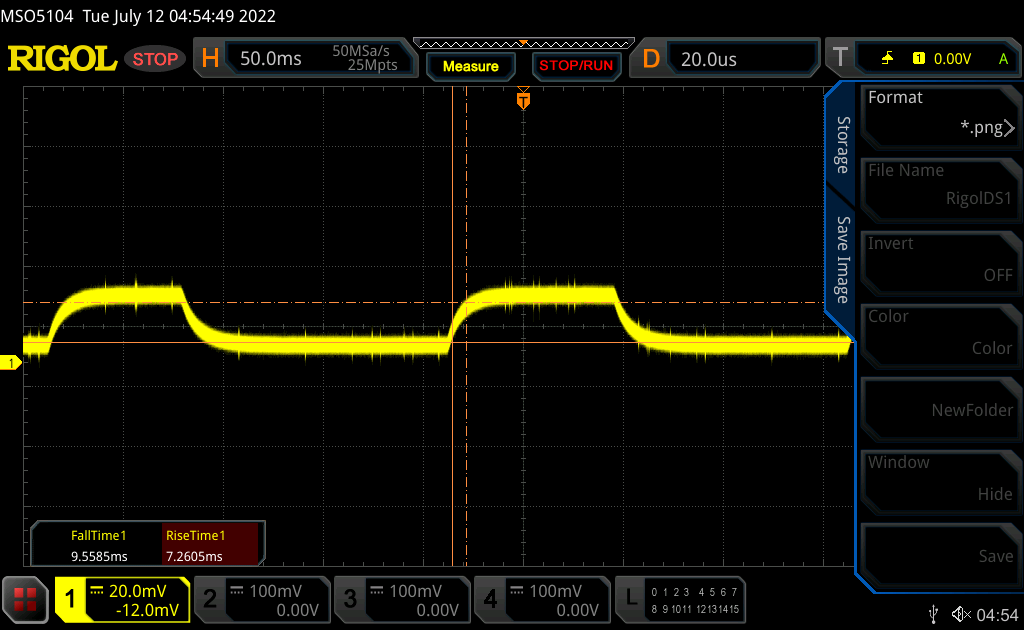 |
| ↘ 9.6 ms fall | ||
| The screen shows good response rates in our tests, but may be too slow for competitive gamers. In comparison, all tested devices range from 0.2 (minimum) to 636 (maximum) ms. » 26 % of all devices are better. This means that the measured response time is better than the average of all tested devices (33.7 ms). | ||
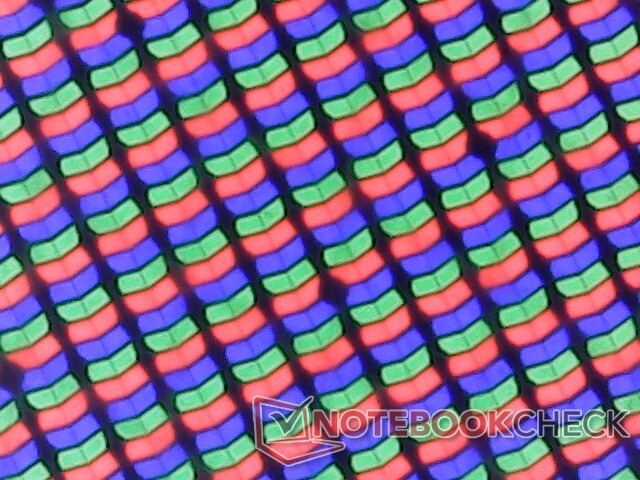
Screen Flickering / PWM (Pulse-Width Modulation)
| Screen flickering / PWM not detected | 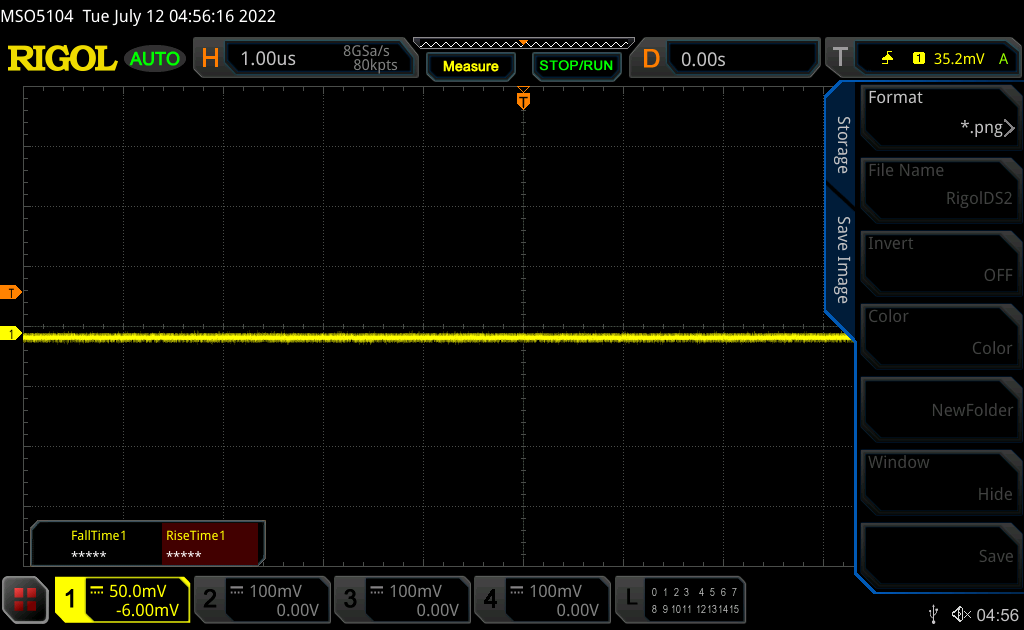 | ||
In comparison: 53 % of all tested devices do not use PWM to dim the display. If PWM was detected, an average of 17900 (minimum: 5 - maximum: 3846000) Hz was measured. | |||
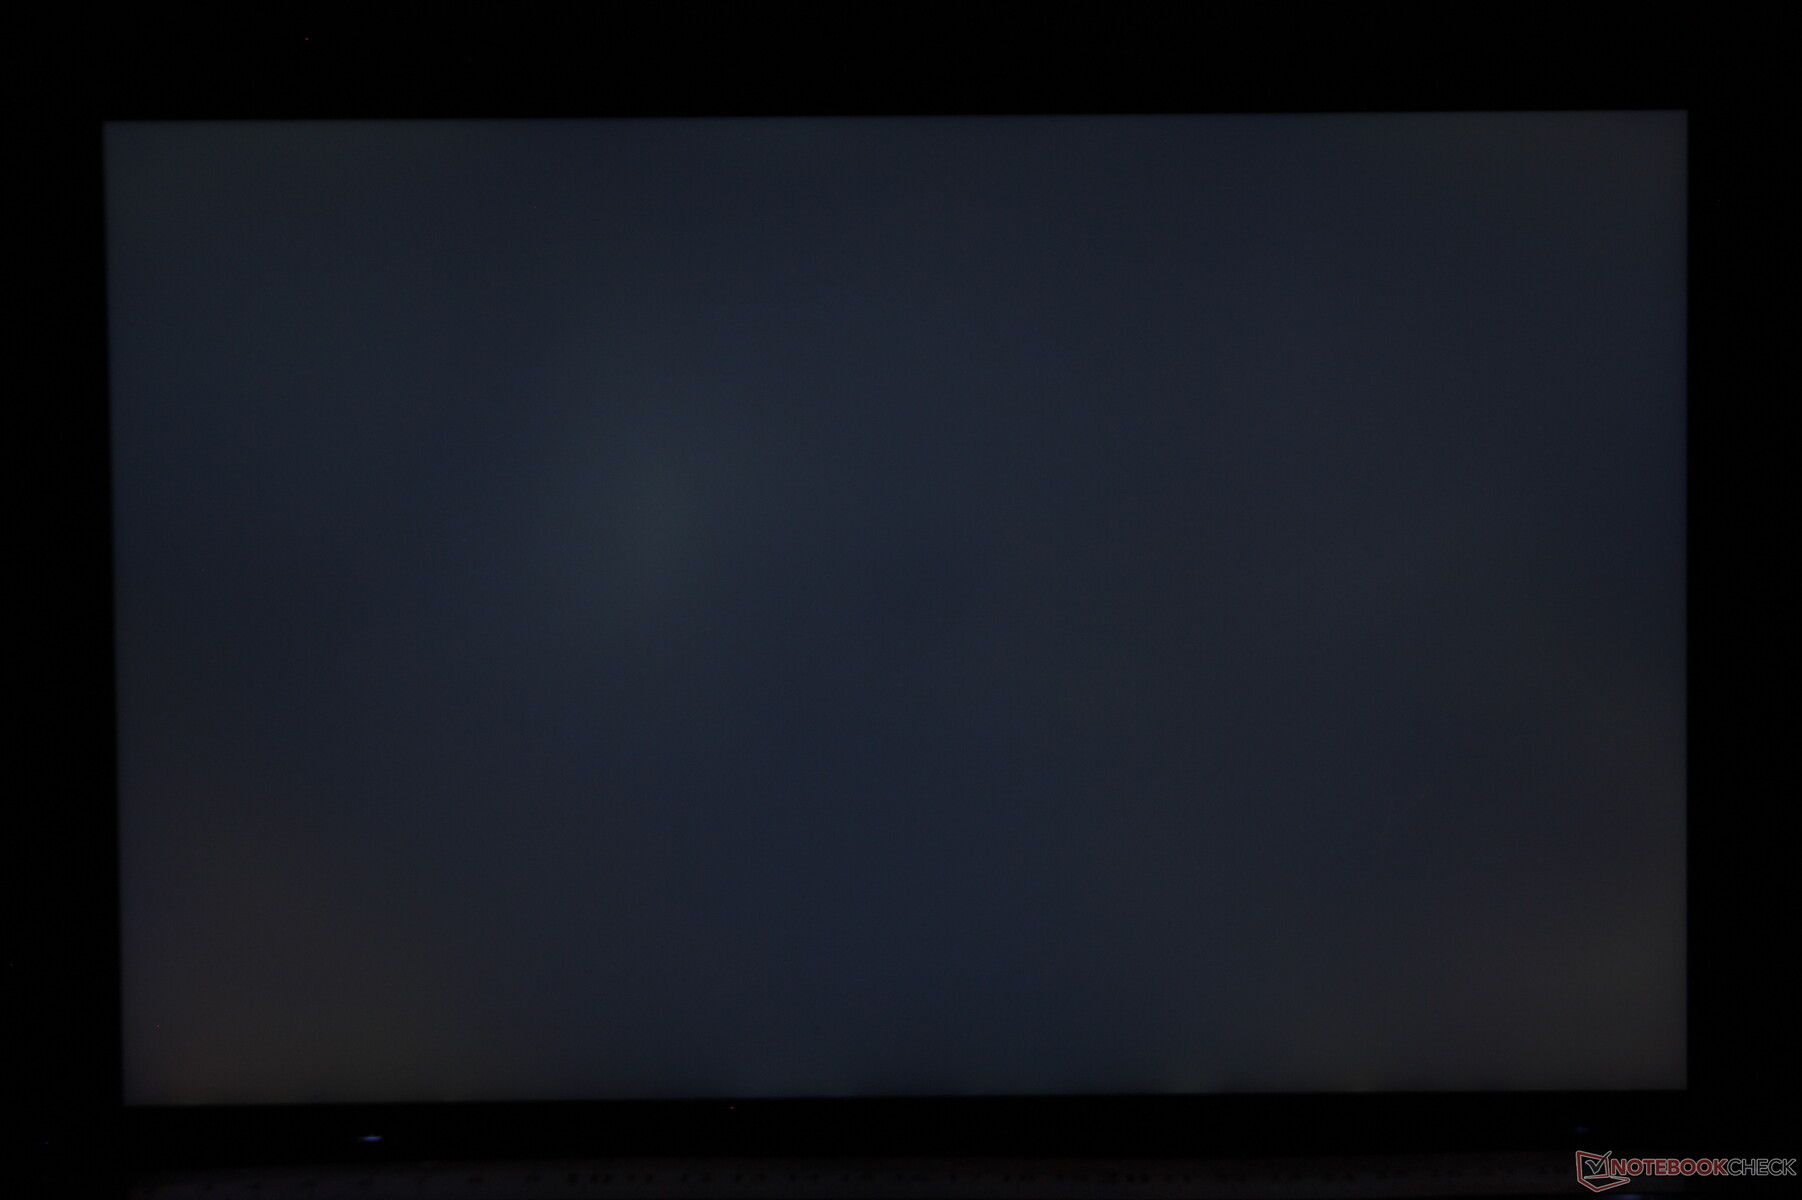
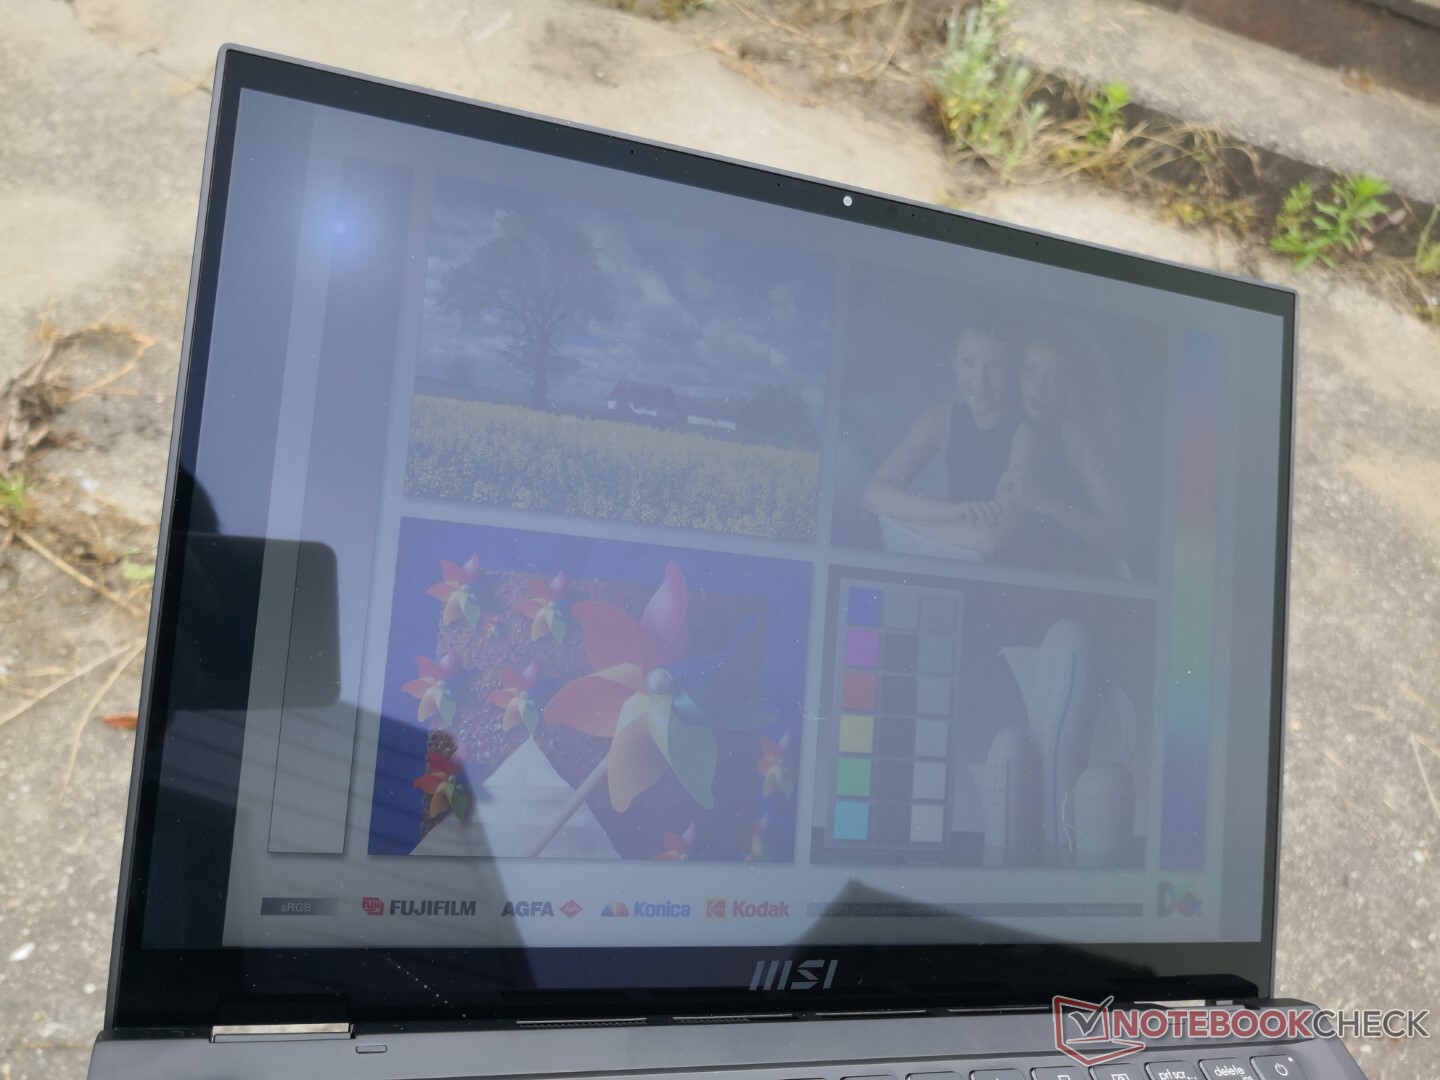
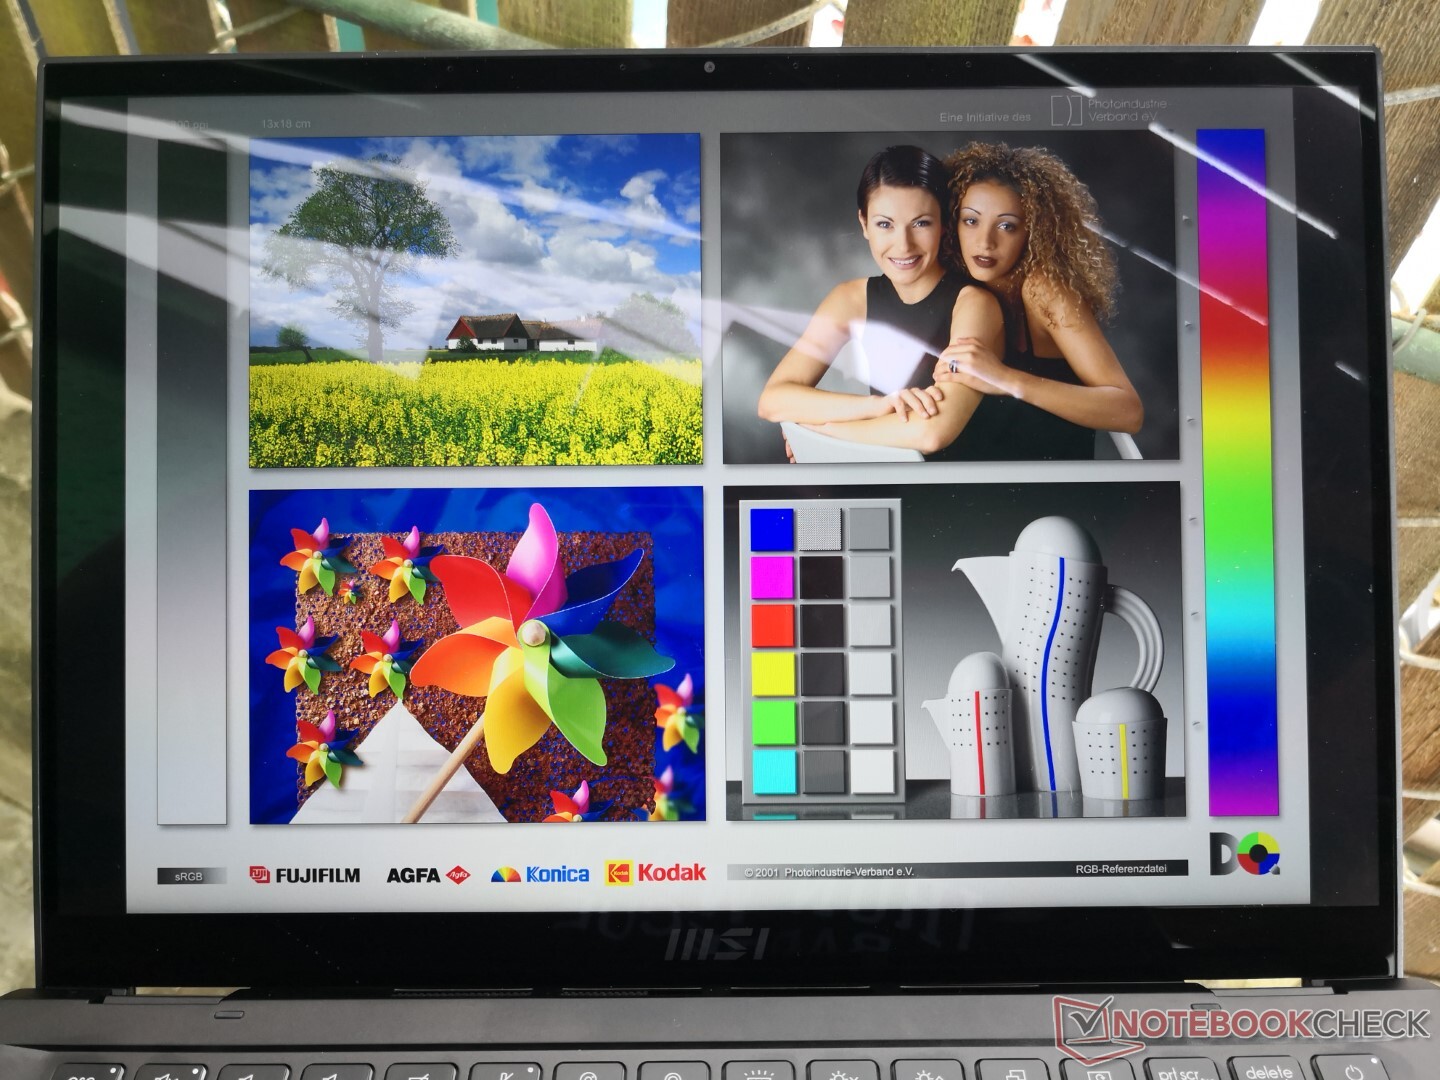
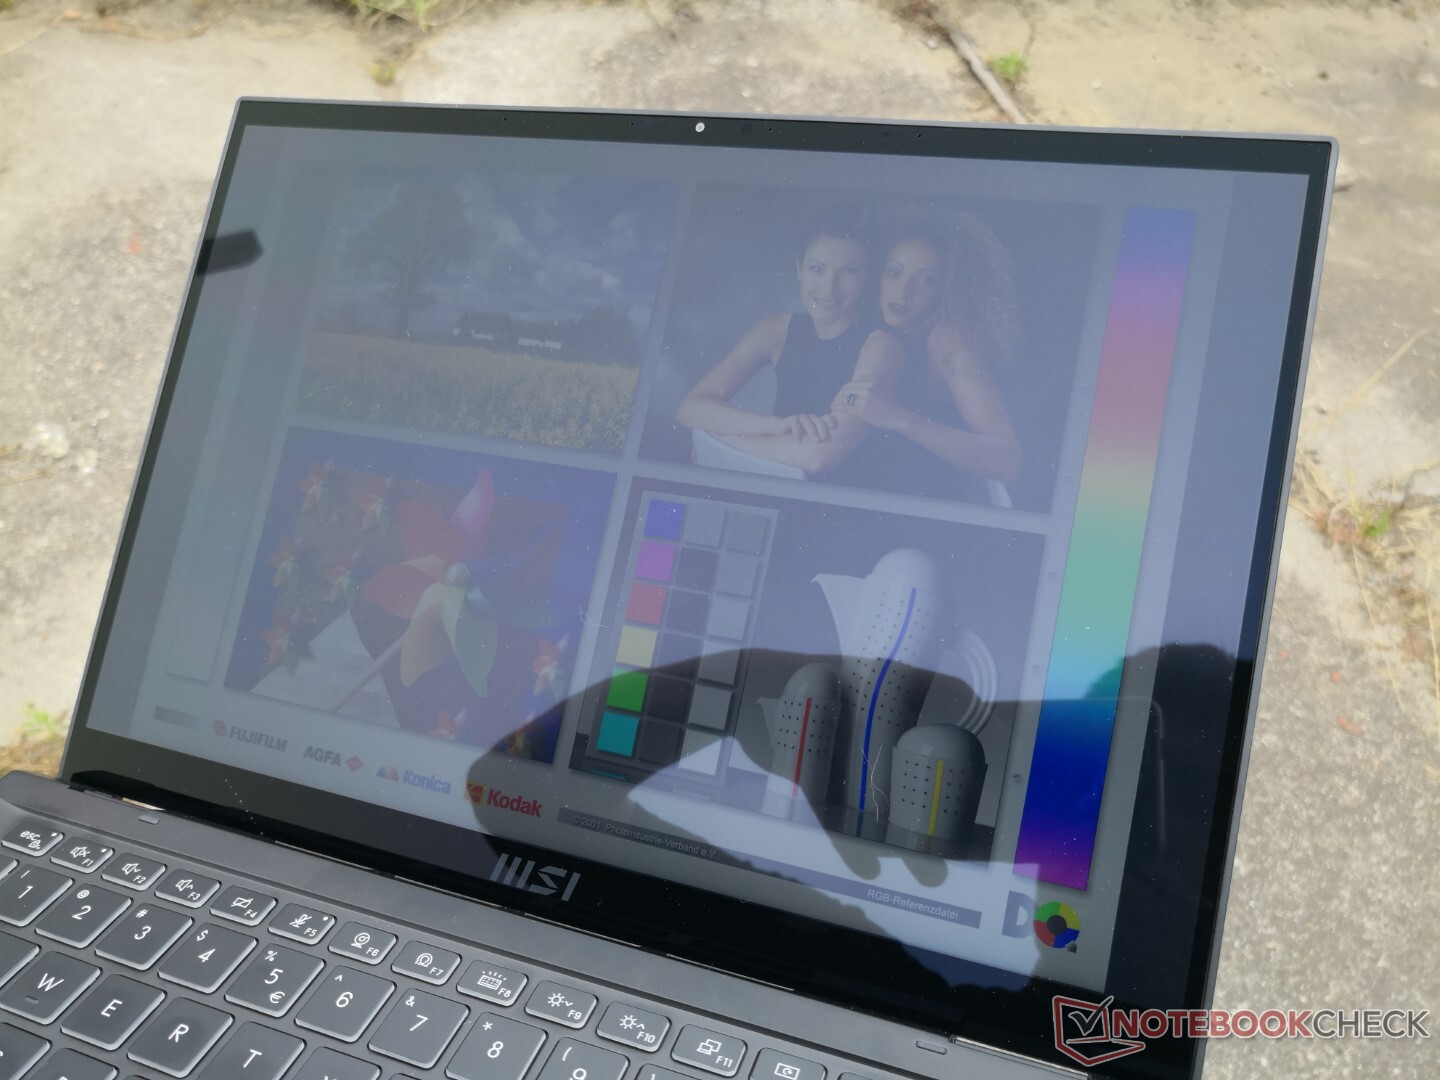
Glare is unavoidable on the glossy screen, but the brighter-than-average 500-nit backlight helps to minimize the glare to more tolerable levels. It's still recommended to avoid working under direct sunlight.
Performance — Intel Core-P Series Impresses
Testing Conditions
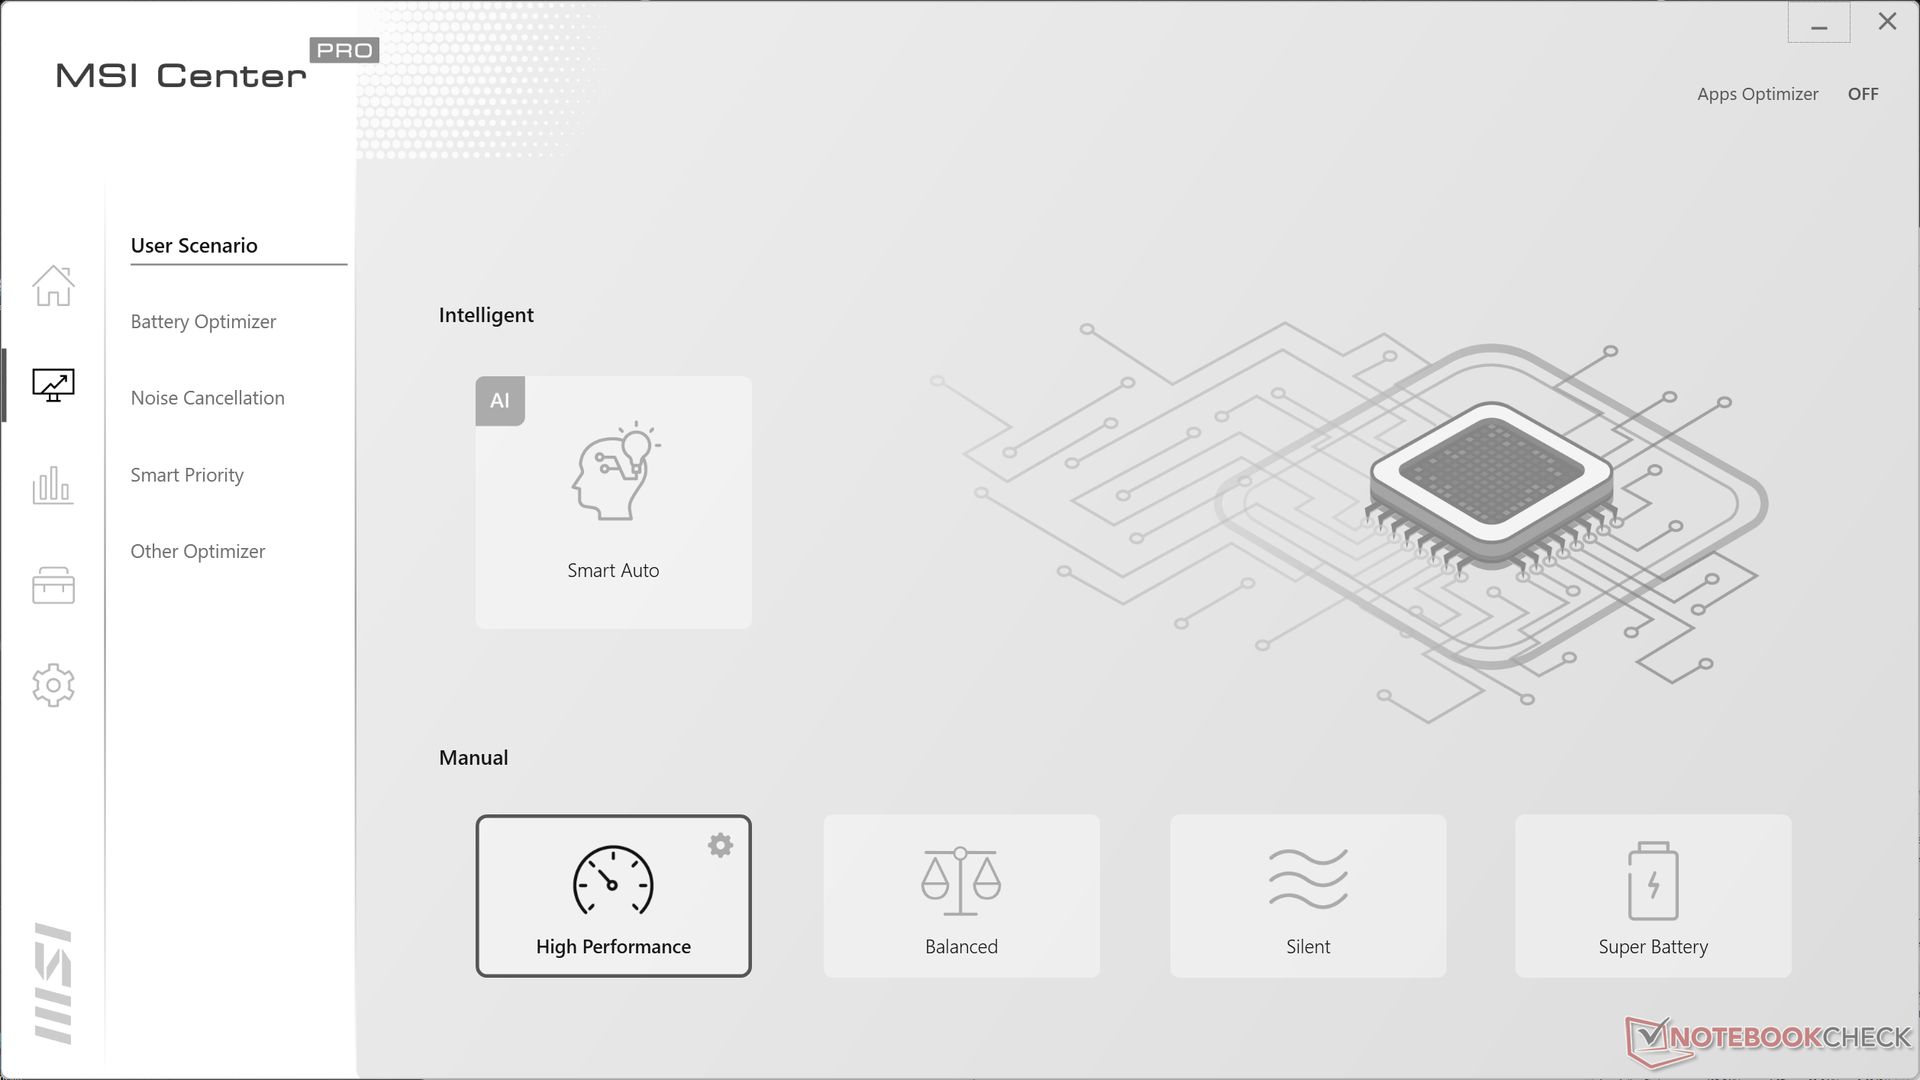
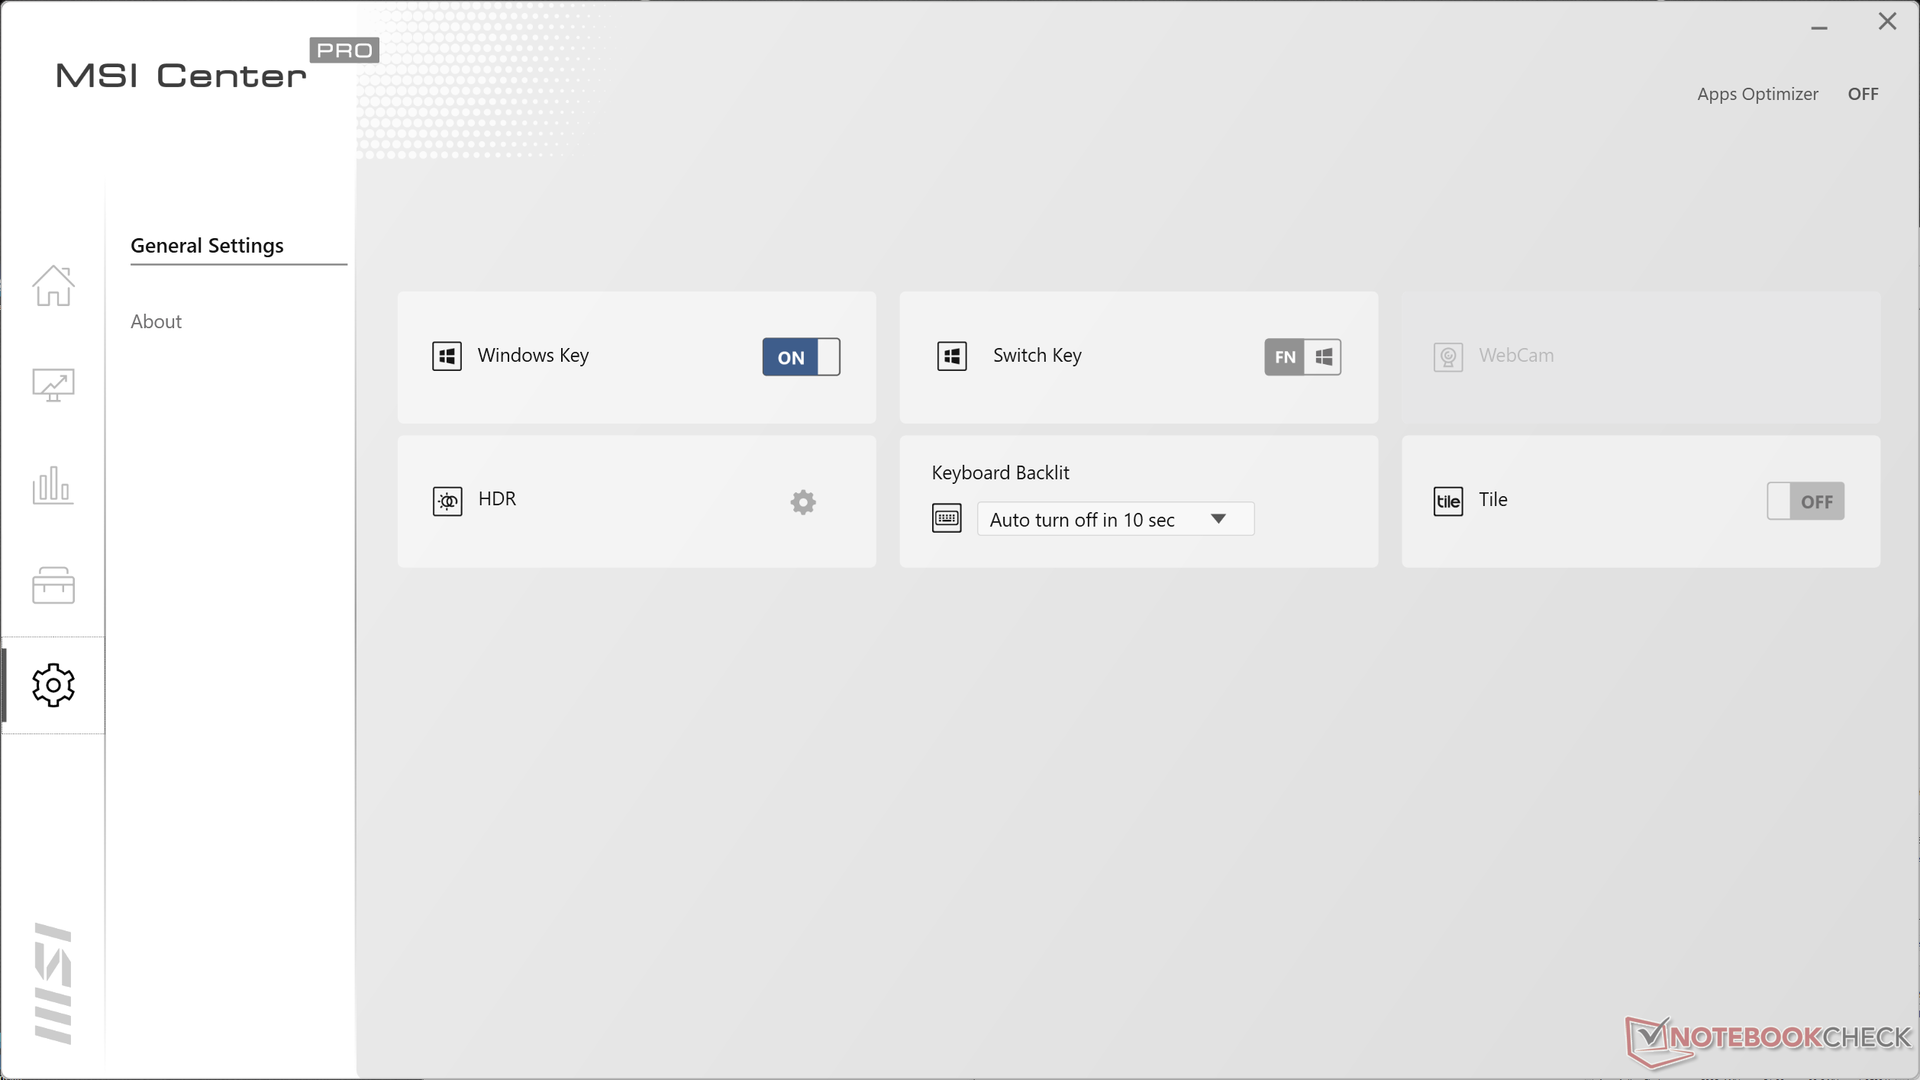
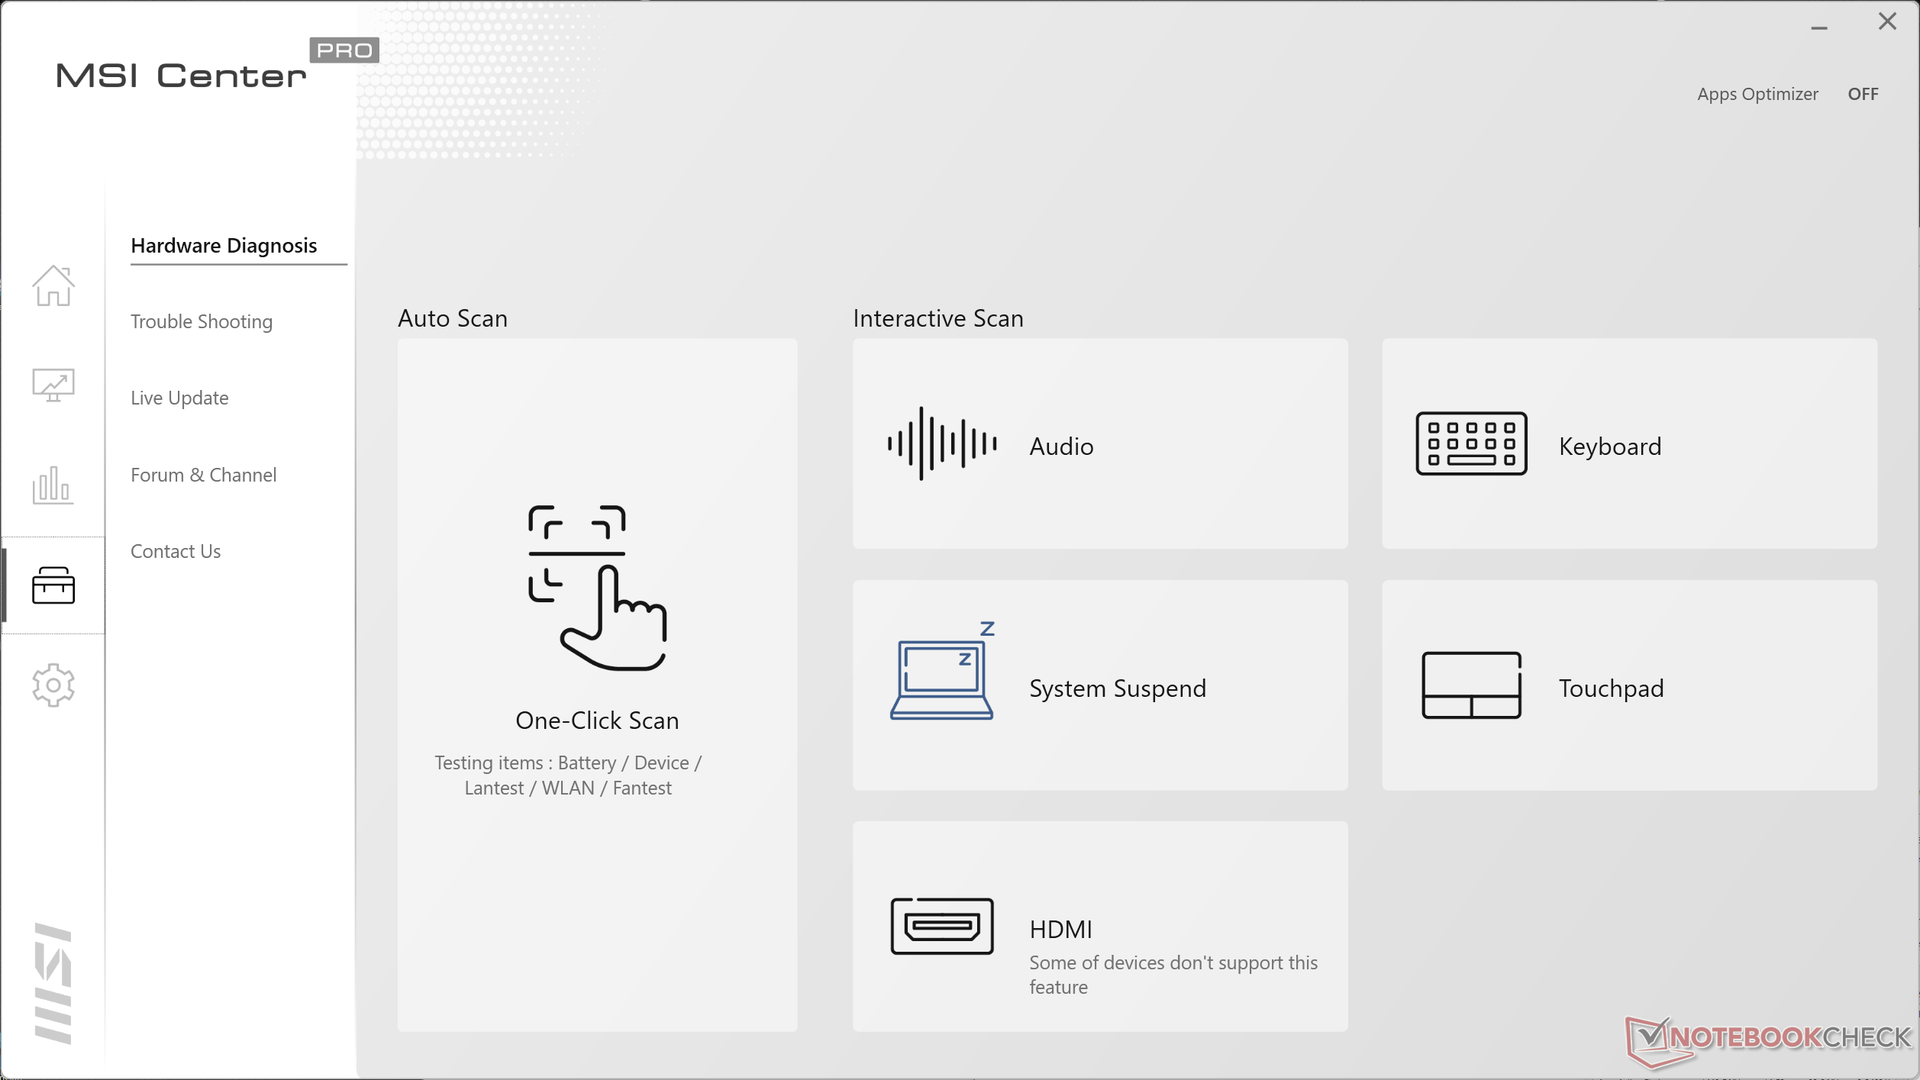
We set our unit to High Performance mode via the pre-installed MSI Center software prior to running any performance benchmarks below. It's recommended that owners become familiar with this software as it is essentially the command center for adjusting most system settings, updates, and performance profiles.
Processor
CPU performance is excellent with results that are 5 to 10 percent higher than the average laptop in our database equipped with the same Core i7-1260P CPU. Our unit even manages to consistently outperform the Core i7-1270P as found on the Lenovo ThinkPad X1 Yoga G7 in both single- and multi-threaded workloads. Users upgrading from the last generation Core i7-1165G7 can expect a significant boost of up to 80 percent in multi-threaded applications.
The competing Ryzen 7 6800U is able to outperform our Core i7-1260P by up to 15 to 20 percent in multi-threaded workloads while the opposite is true in single-threaded workloads.
Cinebench R15 Multi Loop
Cinebench R23: Multi Core | Single Core
Cinebench R15: CPU Multi 64Bit | CPU Single 64Bit
Blender: v2.79 BMW27 CPU
7-Zip 18.03: 7z b 4 | 7z b 4 -mmt1
Geekbench 5.5: Multi-Core | Single-Core
HWBOT x265 Benchmark v2.2: 4k Preset
LibreOffice : 20 Documents To PDF
R Benchmark 2.5: Overall mean
Cinebench R23: Multi Core | Single Core
Cinebench R15: CPU Multi 64Bit | CPU Single 64Bit
Blender: v2.79 BMW27 CPU
7-Zip 18.03: 7z b 4 | 7z b 4 -mmt1
Geekbench 5.5: Multi-Core | Single-Core
HWBOT x265 Benchmark v2.2: 4k Preset
LibreOffice : 20 Documents To PDF
R Benchmark 2.5: Overall mean
* ... smaller is better
AIDA64: FP32 Ray-Trace | FPU Julia | CPU SHA3 | CPU Queen | FPU SinJulia | FPU Mandel | CPU AES | CPU ZLib | FP64 Ray-Trace | CPU PhotoWorxx
| Performance Rating | |
| Asus VivoBook S 14X S5402Z | |
| Lenovo Yoga Slim 7i Pro 14IAP G7 | |
| Dell Latitude 9420 2-in-1 | |
| Average Intel Core i7-1260P | |
| MSI Summit E14 A11SCS | |
| LG Gram 14T90P | |
| MSI Summit E14 Flip Evo A12MT | |
| AIDA64 / FP32 Ray-Trace | |
| Dell Latitude 9420 2-in-1 | |
| MSI Summit E14 A11SCS | |
| LG Gram 14T90P | |
| Asus VivoBook S 14X S5402Z | |
| Average Intel Core i7-1260P (2176 - 10898, n=26) | |
| Lenovo Yoga Slim 7i Pro 14IAP G7 | |
| MSI Summit E14 Flip Evo A12MT | |
| AIDA64 / FPU Julia | |
| Asus VivoBook S 14X S5402Z | |
| Average Intel Core i7-1260P (11015 - 56906, n=26) | |
| Dell Latitude 9420 2-in-1 | |
| MSI Summit E14 A11SCS | |
| Lenovo Yoga Slim 7i Pro 14IAP G7 | |
| LG Gram 14T90P | |
| MSI Summit E14 Flip Evo A12MT | |
| AIDA64 / CPU SHA3 | |
| Asus VivoBook S 14X S5402Z | |
| Lenovo Yoga Slim 7i Pro 14IAP G7 | |
| Dell Latitude 9420 2-in-1 | |
| MSI Summit E14 A11SCS | |
| LG Gram 14T90P | |
| Average Intel Core i7-1260P (669 - 2709, n=26) | |
| MSI Summit E14 Flip Evo A12MT | |
| AIDA64 / CPU Queen | |
| Asus VivoBook S 14X S5402Z | |
| MSI Summit E14 Flip Evo A12MT | |
| Lenovo Yoga Slim 7i Pro 14IAP G7 | |
| Average Intel Core i7-1260P (42571 - 82493, n=26) | |
| Dell Latitude 9420 2-in-1 | |
| MSI Summit E14 A11SCS | |
| LG Gram 14T90P | |
| AIDA64 / FPU SinJulia | |
| Asus VivoBook S 14X S5402Z | |
| Lenovo Yoga Slim 7i Pro 14IAP G7 | |
| MSI Summit E14 Flip Evo A12MT | |
| Average Intel Core i7-1260P (2901 - 6975, n=26) | |
| Dell Latitude 9420 2-in-1 | |
| MSI Summit E14 A11SCS | |
| LG Gram 14T90P | |
| AIDA64 / FPU Mandel | |
| Asus VivoBook S 14X S5402Z | |
| MSI Summit E14 A11SCS | |
| Dell Latitude 9420 2-in-1 | |
| LG Gram 14T90P | |
| Average Intel Core i7-1260P (5950 - 26376, n=26) | |
| Lenovo Yoga Slim 7i Pro 14IAP G7 | |
| MSI Summit E14 Flip Evo A12MT | |
| AIDA64 / CPU AES | |
| Dell Latitude 9420 2-in-1 | |
| LG Gram 14T90P | |
| Asus VivoBook S 14X S5402Z | |
| Average Intel Core i7-1260P (16041 - 92356, n=26) | |
| Lenovo Yoga Slim 7i Pro 14IAP G7 | |
| MSI Summit E14 A11SCS | |
| MSI Summit E14 Flip Evo A12MT | |
| AIDA64 / CPU ZLib | |
| Asus VivoBook S 14X S5402Z | |
| Lenovo Yoga Slim 7i Pro 14IAP G7 | |
| MSI Summit E14 Flip Evo A12MT | |
| Average Intel Core i7-1260P (259 - 771, n=26) | |
| Dell Latitude 9420 2-in-1 | |
| MSI Summit E14 A11SCS | |
| LG Gram 14T90P | |
| AIDA64 / FP64 Ray-Trace | |
| Asus VivoBook S 14X S5402Z | |
| Dell Latitude 9420 2-in-1 | |
| MSI Summit E14 A11SCS | |
| LG Gram 14T90P | |
| Average Intel Core i7-1260P (1237 - 5858, n=26) | |
| Lenovo Yoga Slim 7i Pro 14IAP G7 | |
| MSI Summit E14 Flip Evo A12MT | |
| AIDA64 / CPU PhotoWorxx | |
| MSI Summit E14 A11SCS | |
| Dell Latitude 9420 2-in-1 | |
| LG Gram 14T90P | |
| MSI Summit E14 Flip Evo A12MT | |
| Lenovo Yoga Slim 7i Pro 14IAP G7 | |
| Average Intel Core i7-1260P (13261 - 43652, n=26) | |
| Asus VivoBook S 14X S5402Z | |
System Performance
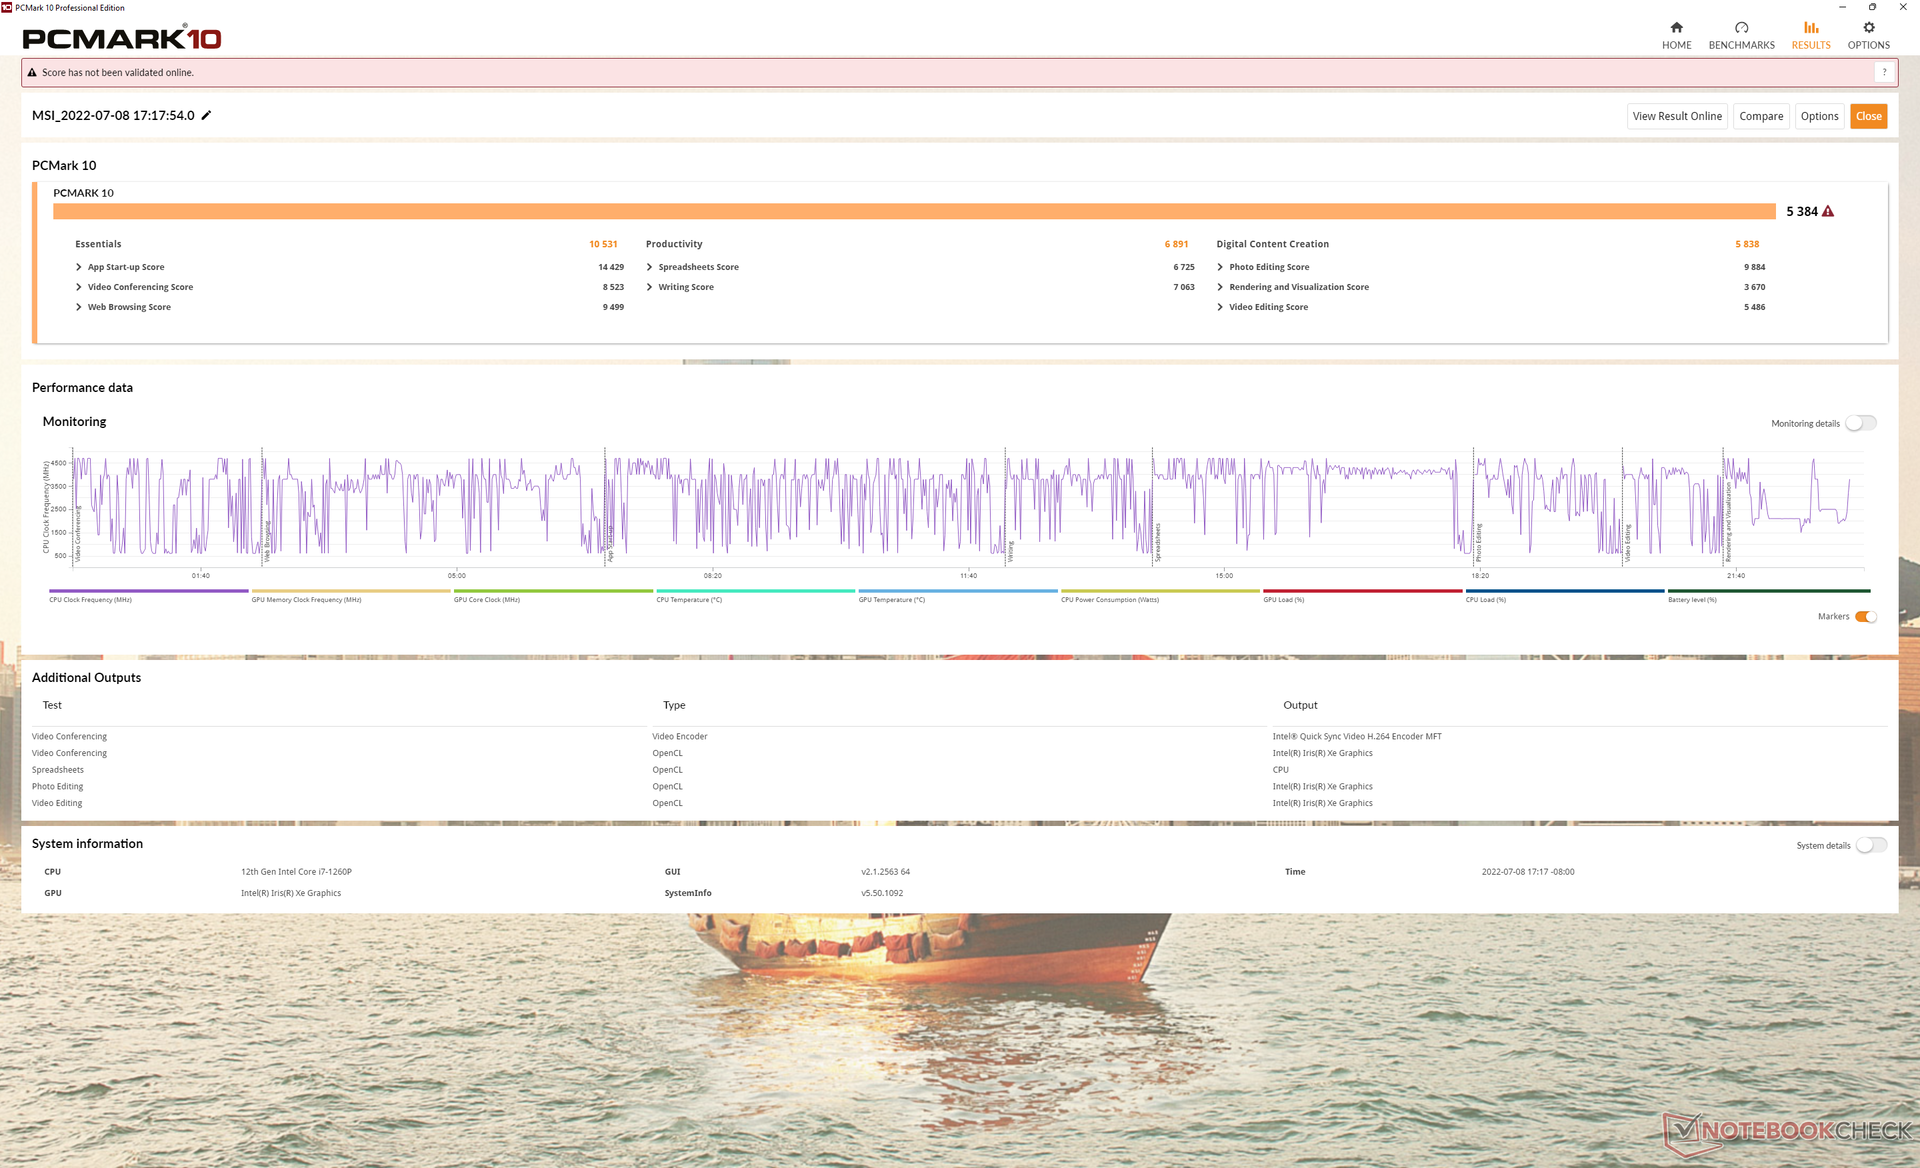
PCMark 10 scores are comparable to other laptops running on the same Core i7-1260P CPU. Meanwhile, CrossMark scores are consistently higher than on many other 14-inch alternatives including even the Core H-series-powered Asus VivoBook S 14.
CrossMark: Overall | Productivity | Creativity | Responsiveness
| PCMark 10 / Score | |
| Asus VivoBook S 14X S5402Z | |
| Average Intel Core i7-1260P, Intel Iris Xe Graphics G7 96EUs (4796 - 6068, n=17) | |
| MSI Summit E14 Flip Evo A12MT | |
| MSI Summit E14 A11SCS | |
| Dell Latitude 9420 2-in-1 | |
| Lenovo Yoga Slim 7i Pro 14IAP G7 | |
| LG Gram 14T90P | |
| PCMark 10 / Essentials | |
| Asus VivoBook S 14X S5402Z | |
| MSI Summit E14 Flip Evo A12MT | |
| Dell Latitude 9420 2-in-1 | |
| Average Intel Core i7-1260P, Intel Iris Xe Graphics G7 96EUs (9260 - 11251, n=17) | |
| Lenovo Yoga Slim 7i Pro 14IAP G7 | |
| LG Gram 14T90P | |
| MSI Summit E14 A11SCS | |
| PCMark 10 / Productivity | |
| MSI Summit E14 A11SCS | |
| Asus VivoBook S 14X S5402Z | |
| Average Intel Core i7-1260P, Intel Iris Xe Graphics G7 96EUs (6167 - 8629, n=17) | |
| Dell Latitude 9420 2-in-1 | |
| MSI Summit E14 Flip Evo A12MT | |
| LG Gram 14T90P | |
| Lenovo Yoga Slim 7i Pro 14IAP G7 | |
| PCMark 10 / Digital Content Creation | |
| Asus VivoBook S 14X S5402Z | |
| Average Intel Core i7-1260P, Intel Iris Xe Graphics G7 96EUs (5231 - 6908, n=17) | |
| Lenovo Yoga Slim 7i Pro 14IAP G7 | |
| MSI Summit E14 Flip Evo A12MT | |
| MSI Summit E14 A11SCS | |
| Dell Latitude 9420 2-in-1 | |
| LG Gram 14T90P | |
| CrossMark / Overall | |
| MSI Summit E14 Flip Evo A12MT | |
| Average Intel Core i7-1260P, Intel Iris Xe Graphics G7 96EUs (1484 - 1811, n=16) | |
| Lenovo Yoga Slim 7i Pro 14IAP G7 | |
| Asus VivoBook S 14X S5402Z | |
| LG Gram 14T90P | |
| CrossMark / Productivity | |
| MSI Summit E14 Flip Evo A12MT | |
| Average Intel Core i7-1260P, Intel Iris Xe Graphics G7 96EUs (1486 - 1755, n=16) | |
| Asus VivoBook S 14X S5402Z | |
| Lenovo Yoga Slim 7i Pro 14IAP G7 | |
| LG Gram 14T90P | |
| CrossMark / Creativity | |
| MSI Summit E14 Flip Evo A12MT | |
| Average Intel Core i7-1260P, Intel Iris Xe Graphics G7 96EUs (1451 - 1872, n=16) | |
| Lenovo Yoga Slim 7i Pro 14IAP G7 | |
| Asus VivoBook S 14X S5402Z | |
| LG Gram 14T90P | |
| CrossMark / Responsiveness | |
| MSI Summit E14 Flip Evo A12MT | |
| Average Intel Core i7-1260P, Intel Iris Xe Graphics G7 96EUs (1253 - 1807, n=16) | |
| Asus VivoBook S 14X S5402Z | |
| Lenovo Yoga Slim 7i Pro 14IAP G7 | |
| LG Gram 14T90P | |
| PCMark 10 Score | 5384 points | |
Help | ||
| AIDA64 / Memory Copy | |
| MSI Summit E14 Flip Evo A12MT | |
| Dell Latitude 9420 2-in-1 | |
| LG Gram 14T90P | |
| MSI Summit E14 A11SCS | |
| Lenovo Yoga Slim 7i Pro 14IAP G7 | |
| Average Intel Core i7-1260P (25125 - 71544, n=25) | |
| Asus VivoBook S 14X S5402Z | |
| AIDA64 / Memory Read | |
| MSI Summit E14 Flip Evo A12MT | |
| Dell Latitude 9420 2-in-1 | |
| Lenovo Yoga Slim 7i Pro 14IAP G7 | |
| LG Gram 14T90P | |
| MSI Summit E14 A11SCS | |
| Average Intel Core i7-1260P (24983 - 72065, n=25) | |
| Asus VivoBook S 14X S5402Z | |
| AIDA64 / Memory Write | |
| LG Gram 14T90P | |
| Dell Latitude 9420 2-in-1 | |
| MSI Summit E14 A11SCS | |
| MSI Summit E14 Flip Evo A12MT | |
| Lenovo Yoga Slim 7i Pro 14IAP G7 | |
| Average Intel Core i7-1260P (23512 - 66799, n=25) | |
| Asus VivoBook S 14X S5402Z | |
| AIDA64 / Memory Latency | |
| MSI Summit E14 A11SCS | |
| Dell Latitude 9420 2-in-1 | |
| LG Gram 14T90P | |
| Average Intel Core i7-1260P (77.9 - 118.4, n=21) | |
| Asus VivoBook S 14X S5402Z | |
| MSI Summit E14 Flip Evo A12MT | |
* ... smaller is better
DPC Latency
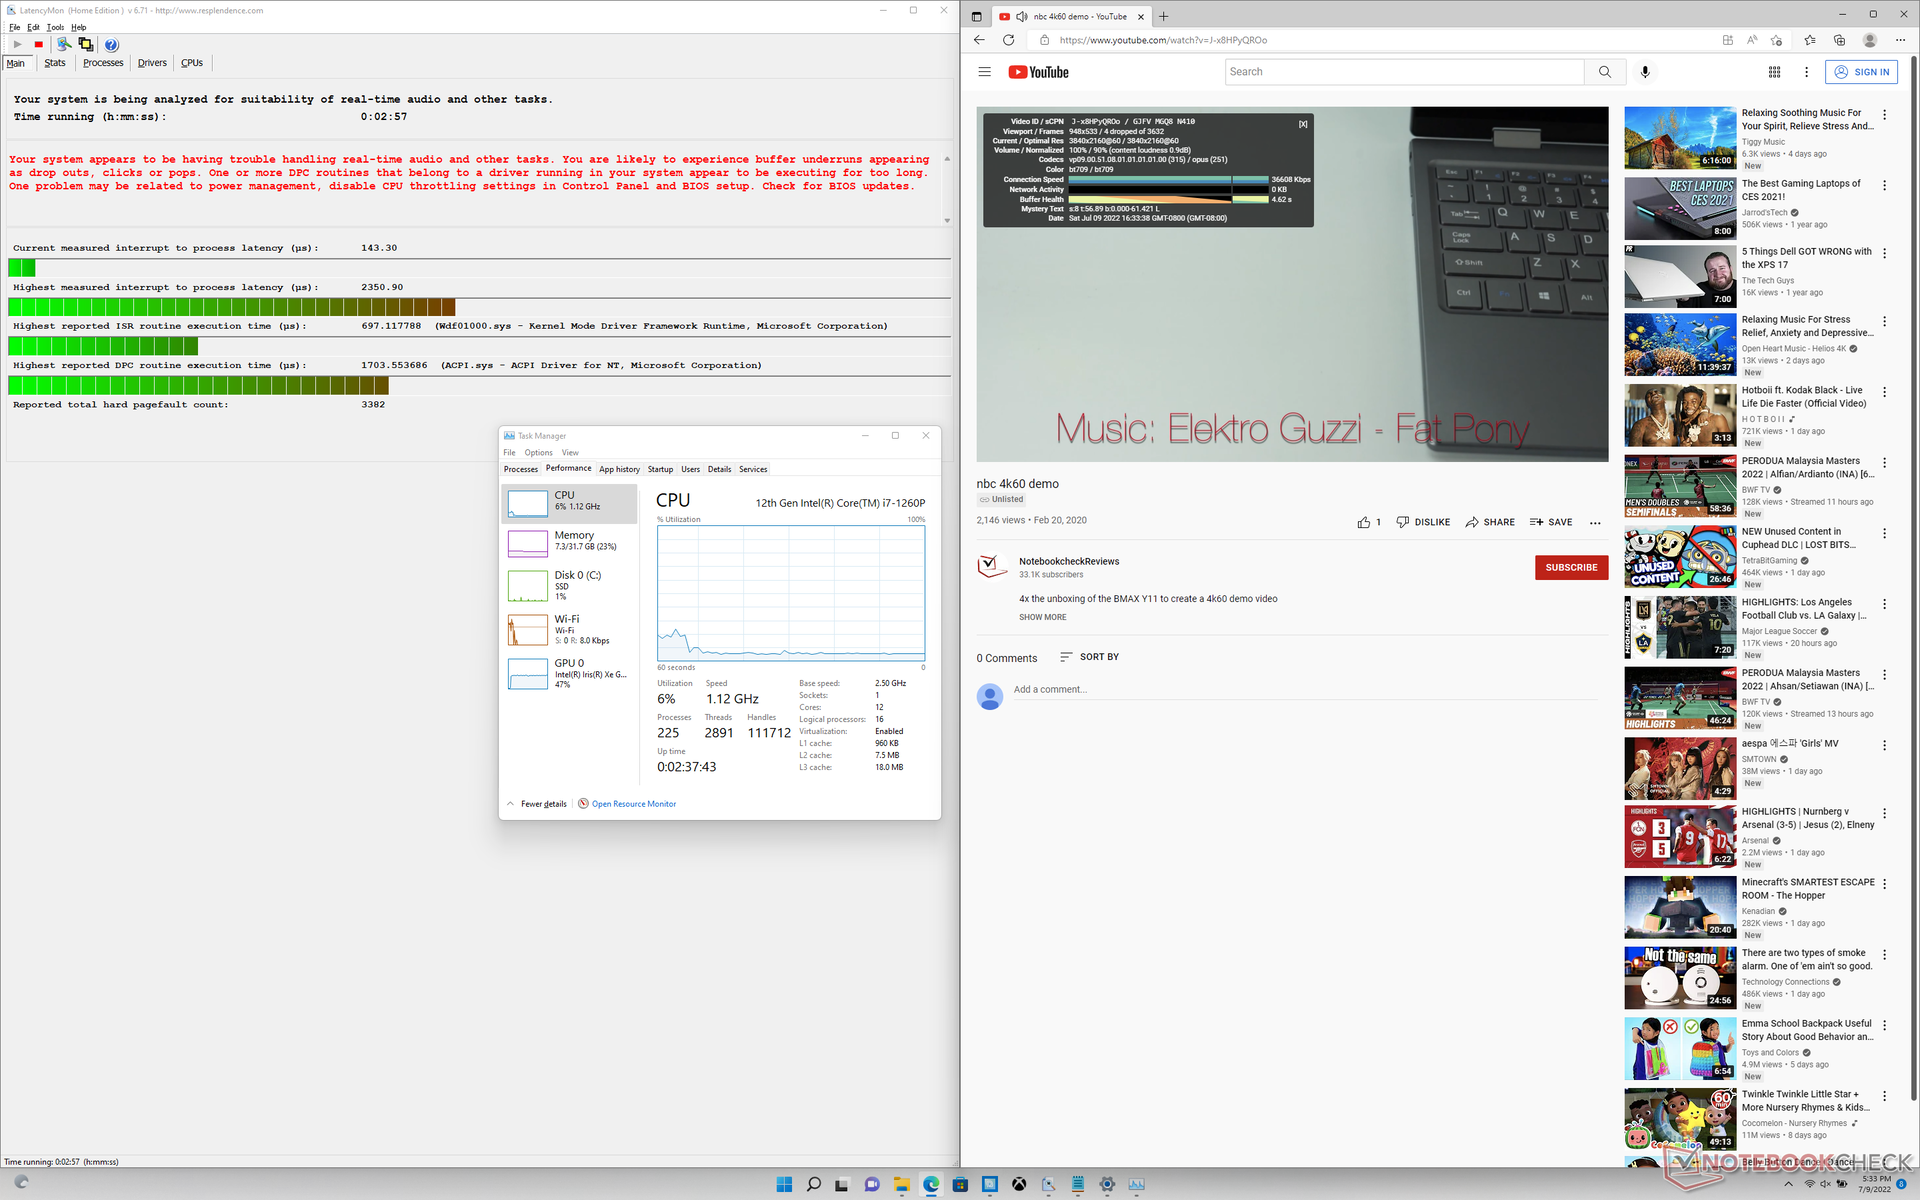
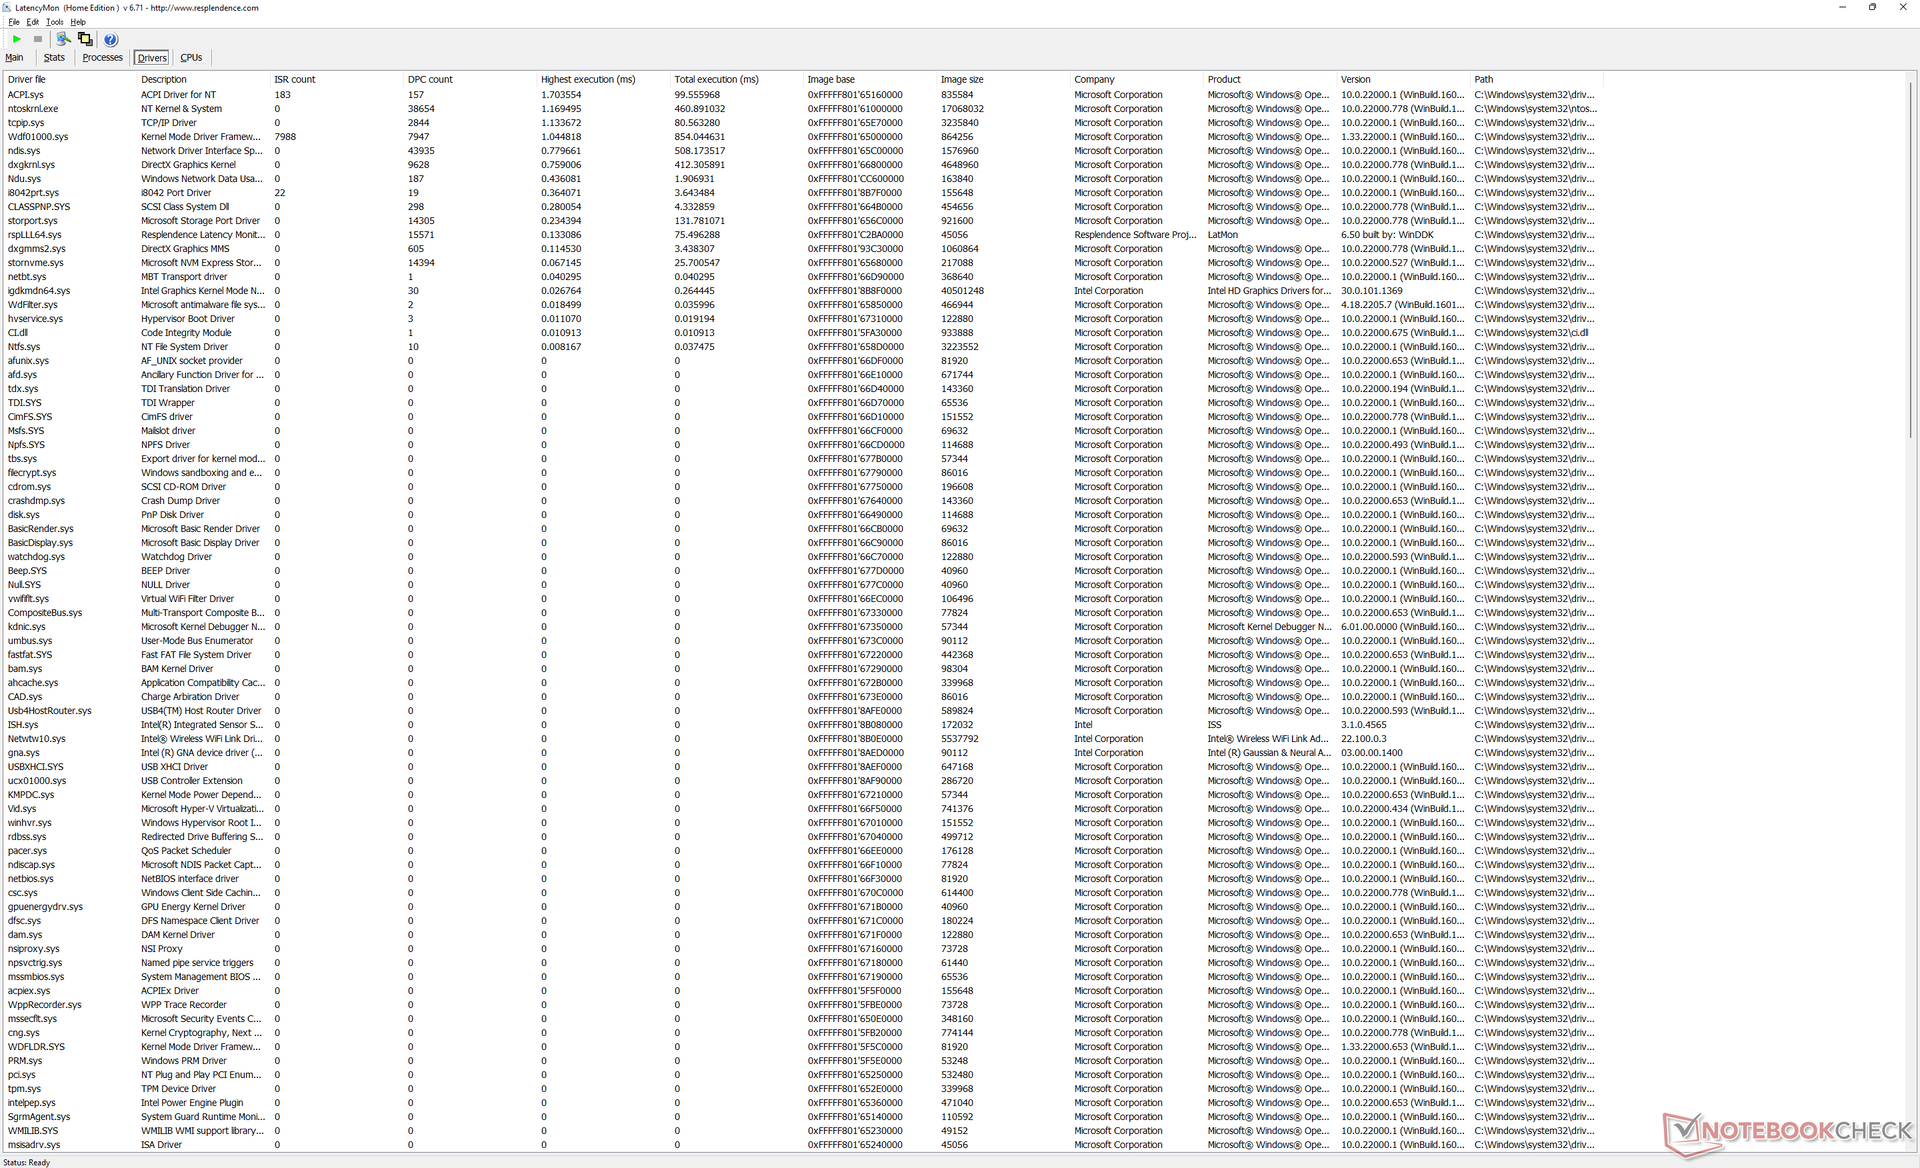
LatencyMon reveals DPC issues when opening multiple browser tabs of our homepage. 4K video playback at 60 FPS is not perfect either with 4 dropped frames during our minute-long video test.
| DPC Latencies / LatencyMon - interrupt to process latency (max), Web, Youtube, Prime95 | |
| MSI Summit E14 Flip Evo A12MT | |
| Asus VivoBook S 14X S5402Z | |
| LG Gram 14T90P | |
| MSI Summit E14 A11SCS | |
| Lenovo Yoga Slim 7i Pro 14IAP G7 | |
| Dell Latitude 9420 2-in-1 | |
* ... smaller is better
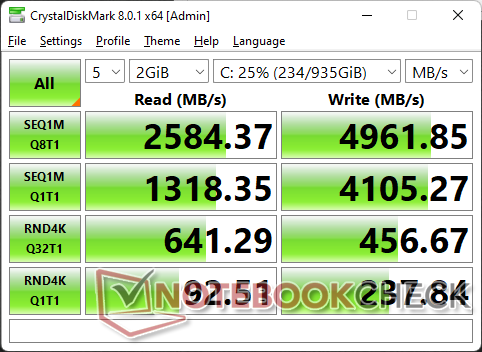
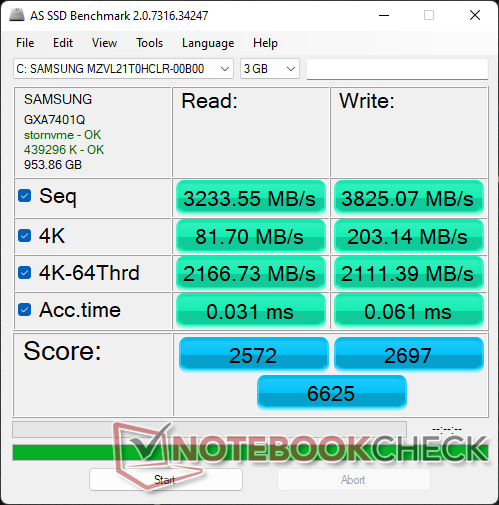
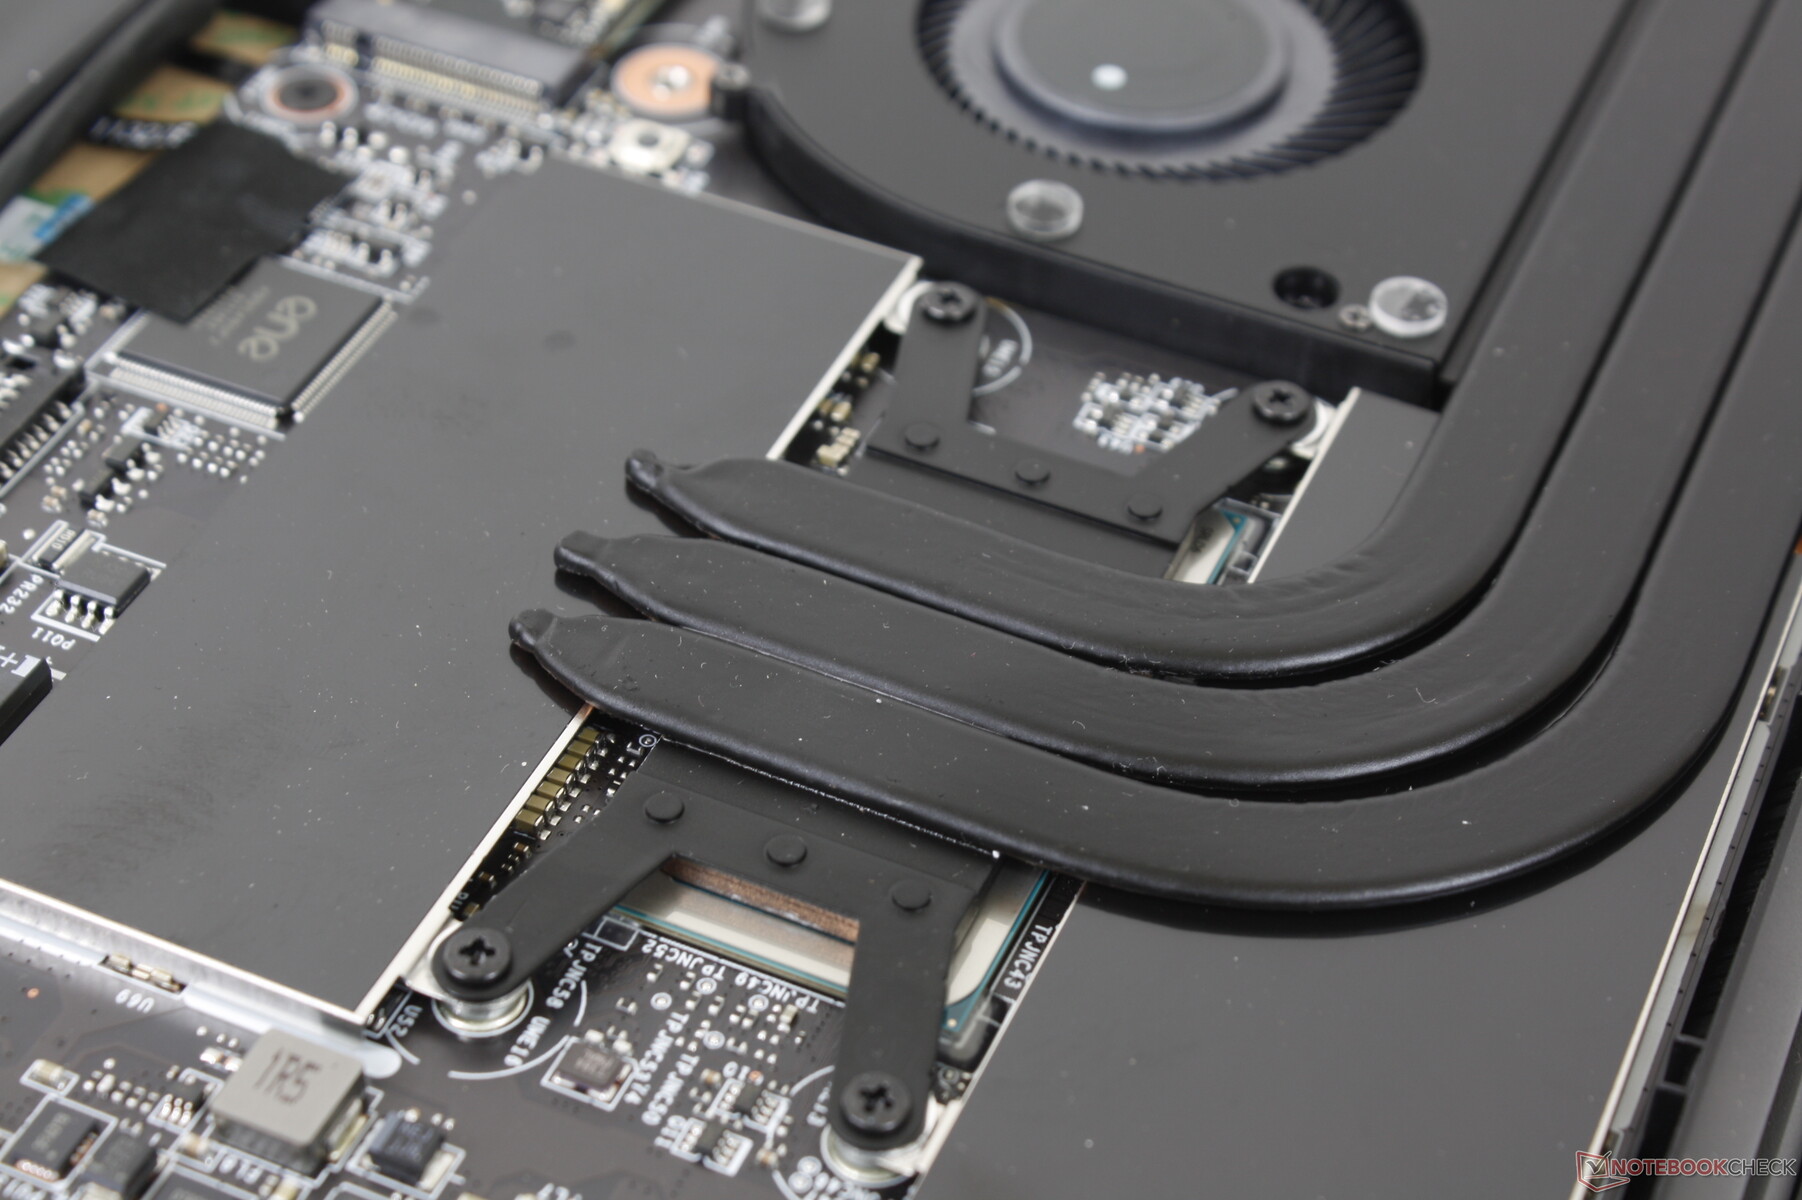
Storage Devices — PCIe4 x4 Performance Throttling
Our test unit comes with a 1 TB Samsung PM9A1 PCIe4 x4 NVMe SSD for sequential read and write rates of up to 7000 MB/s and 5200 MB/s, respectively. Unfortunately, don't expect anywhere near those transfer rates in most real-world scenarios due to the lack of any cooling for the SSD in the Summit E14 Flip. When running DiskSpd in a loop, transfer rates would almost instantly crater to just 1700 MB/s which is already slower than most PCIe3 NVMe SSDs. Running this same test on the Lenovo Yoga Slim 7i Pro equipped with a similar Samsung PM9A1 SSD would show performance throttling behavior as well, but average transfer rates are still faster than on the MSI.

| Drive Performance Rating - Percent | |
| MSI Summit E14 Flip Evo A12MT | |
| MSI Summit E14 A11SCS | |
| Lenovo Yoga Slim 7i Pro 14IAP G7 | |
| LG Gram 14T90P | |
| Asus VivoBook S 14X S5402Z | |
| Dell Latitude 9420 2-in-1 | |
* ... smaller is better
Disk Throttling: DiskSpd Read Loop, Queue Depth 8
GPU Performance — Iris Xe Is Still Very Good
Graphics performance is 15 to 20 percent faster than the average Iris Xe 96 EUs in our database to be one of the fastest 14-inch convertibles with integrated graphics. The slight boost can be partly attributed to the LPDDR5 RAM whereas most other Ultrabooks are still using DDR4 or LPDDR4. The AMD Radeon 680M is still faster is most cases, however, but such an option is not available on the Summit series. The system is nonetheless fast enough to play demanding games at low 720p or 900p resolutions or less demanding games like DOTA 2 at 1080p.
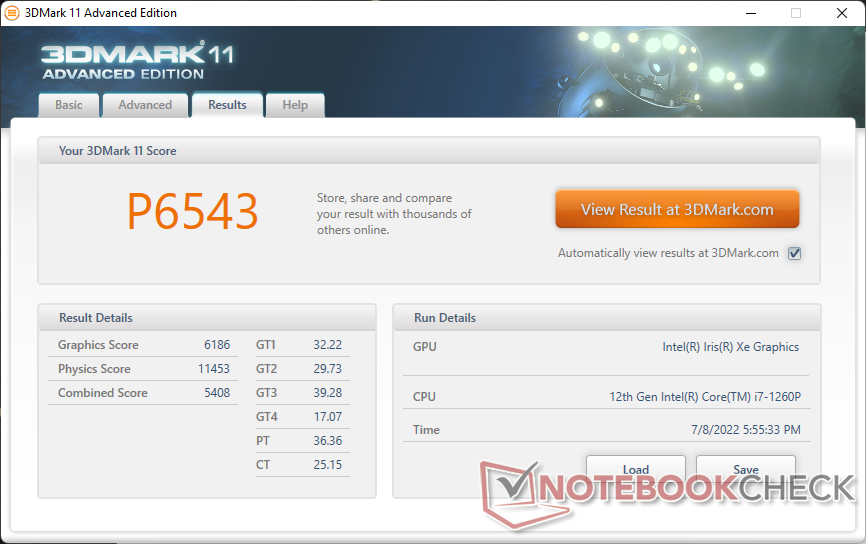
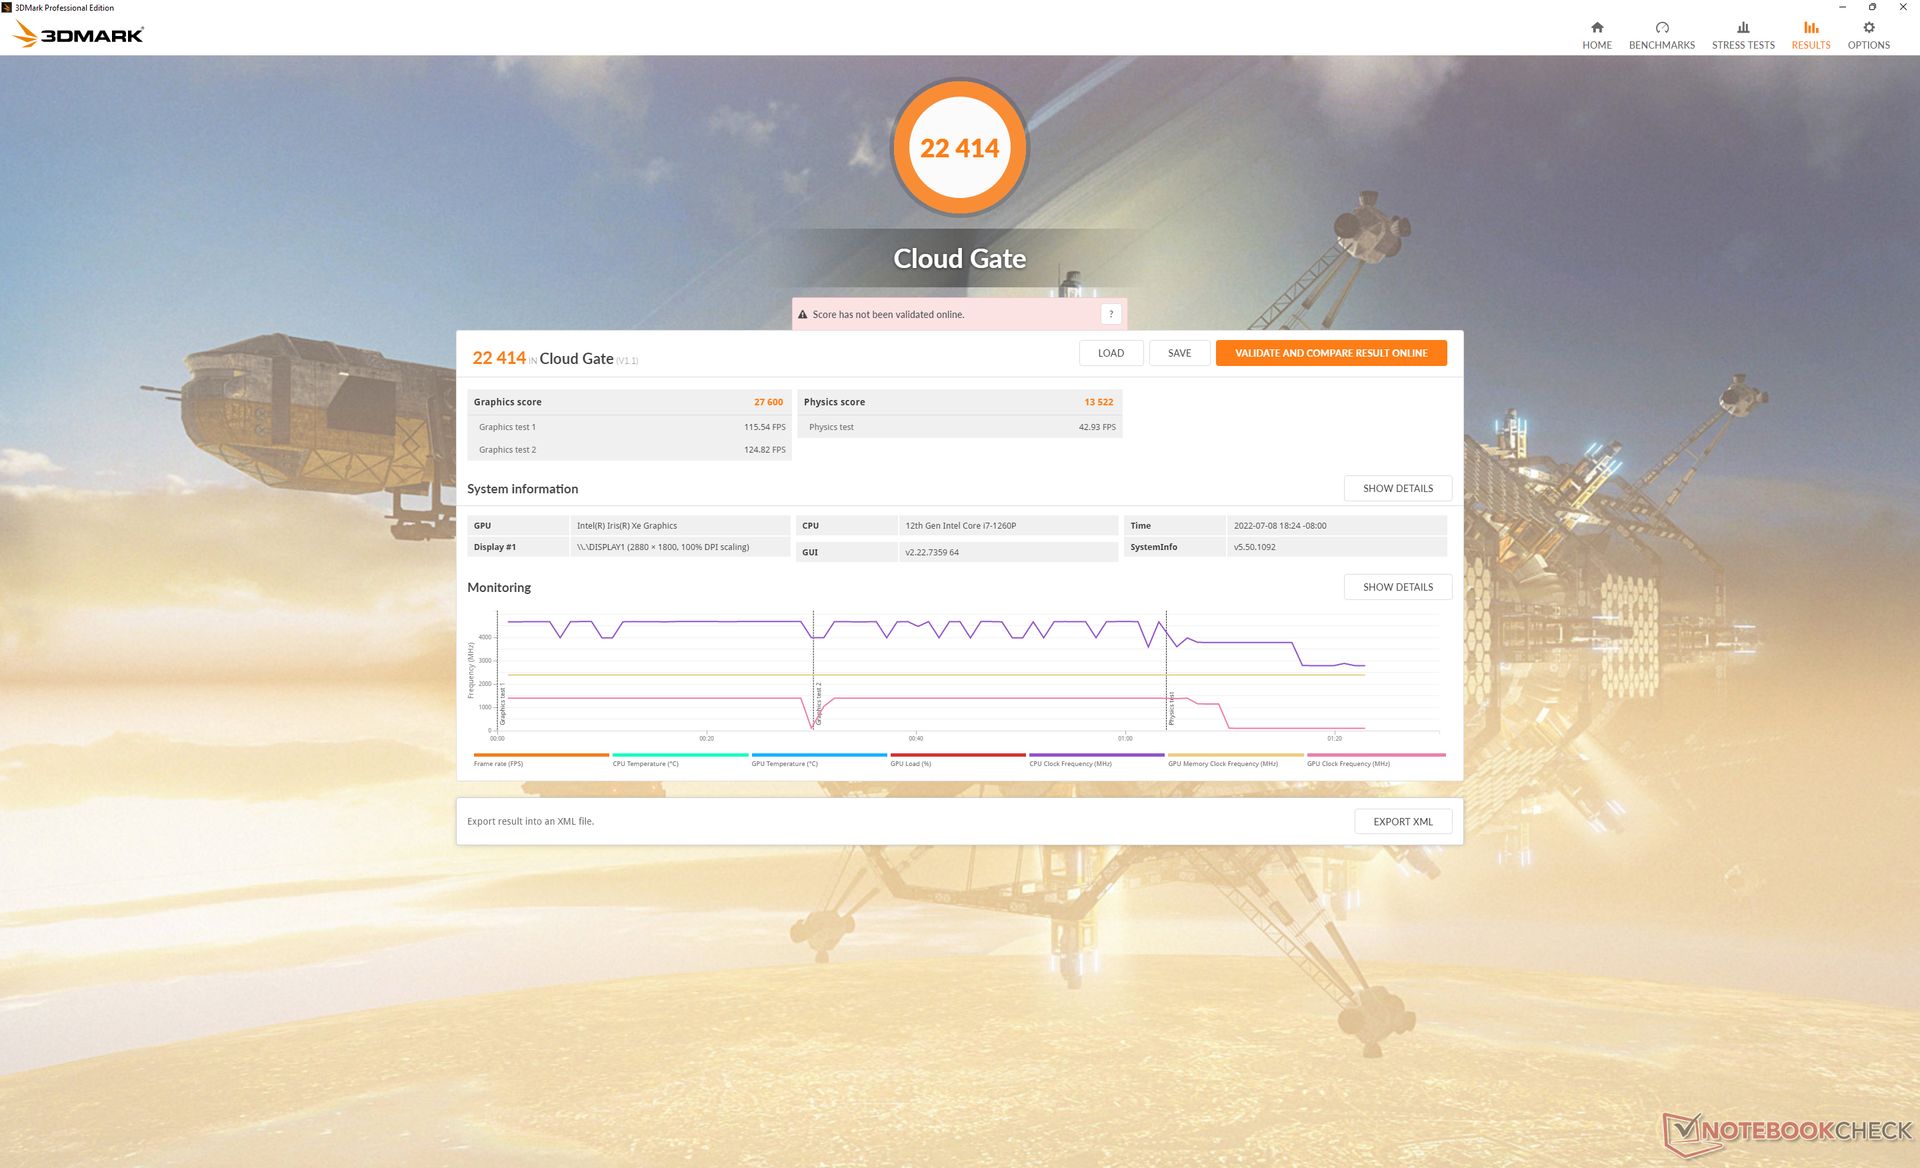
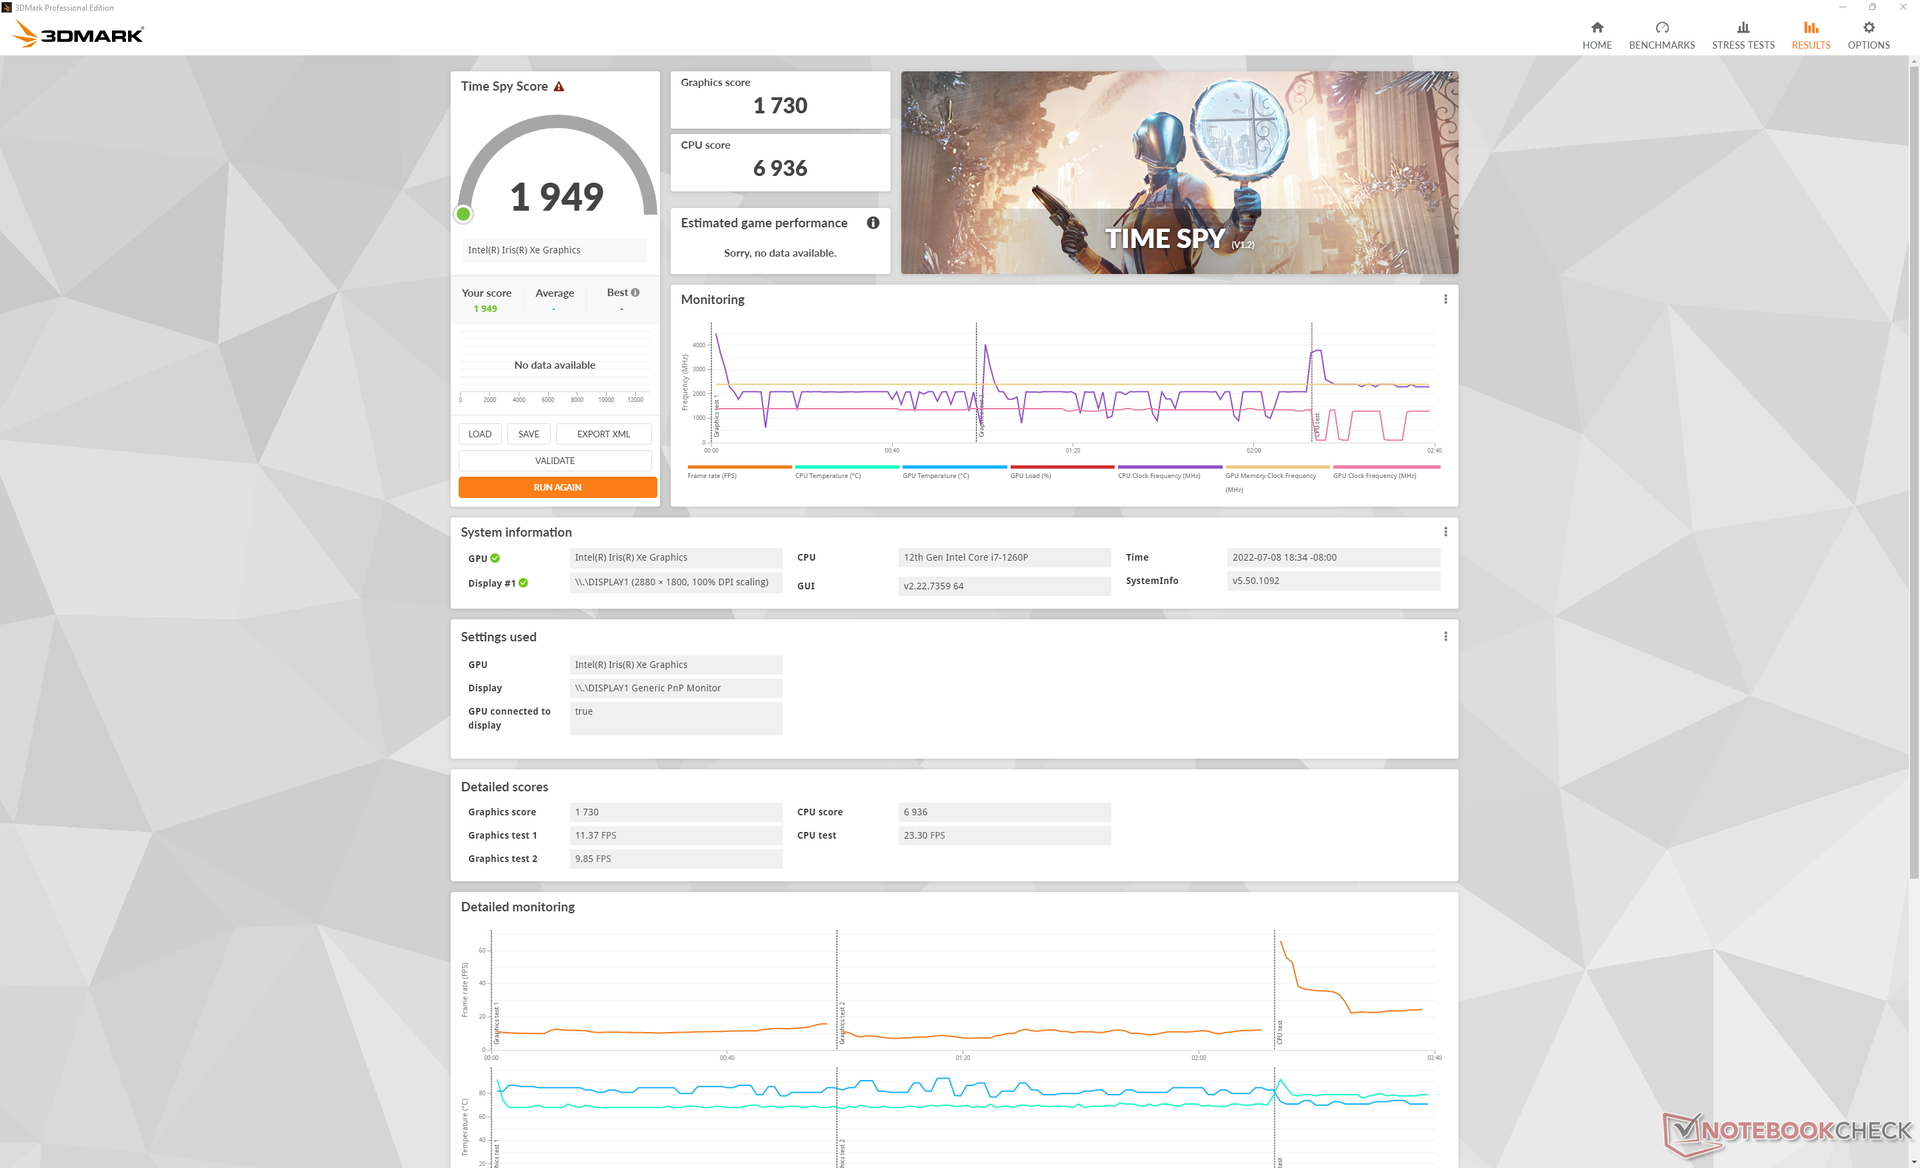
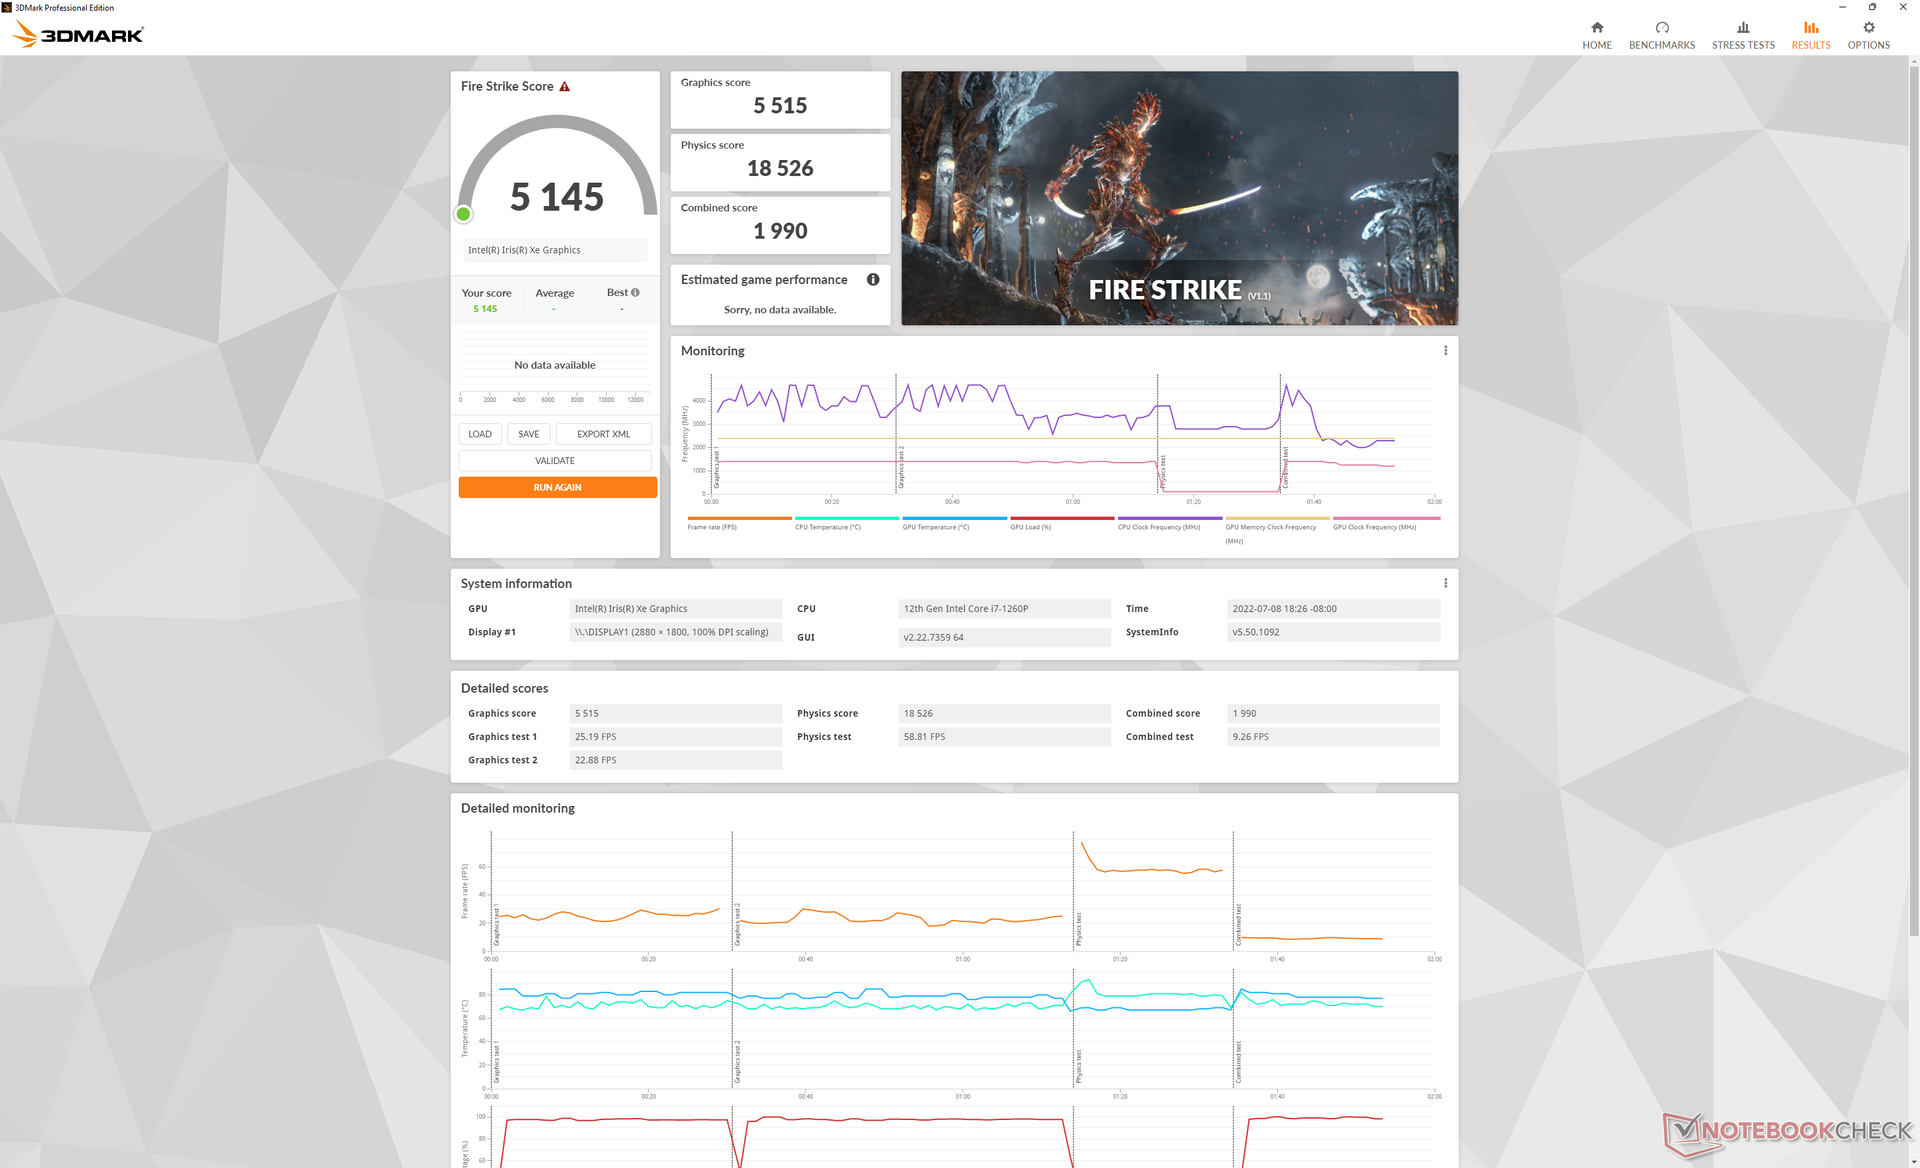
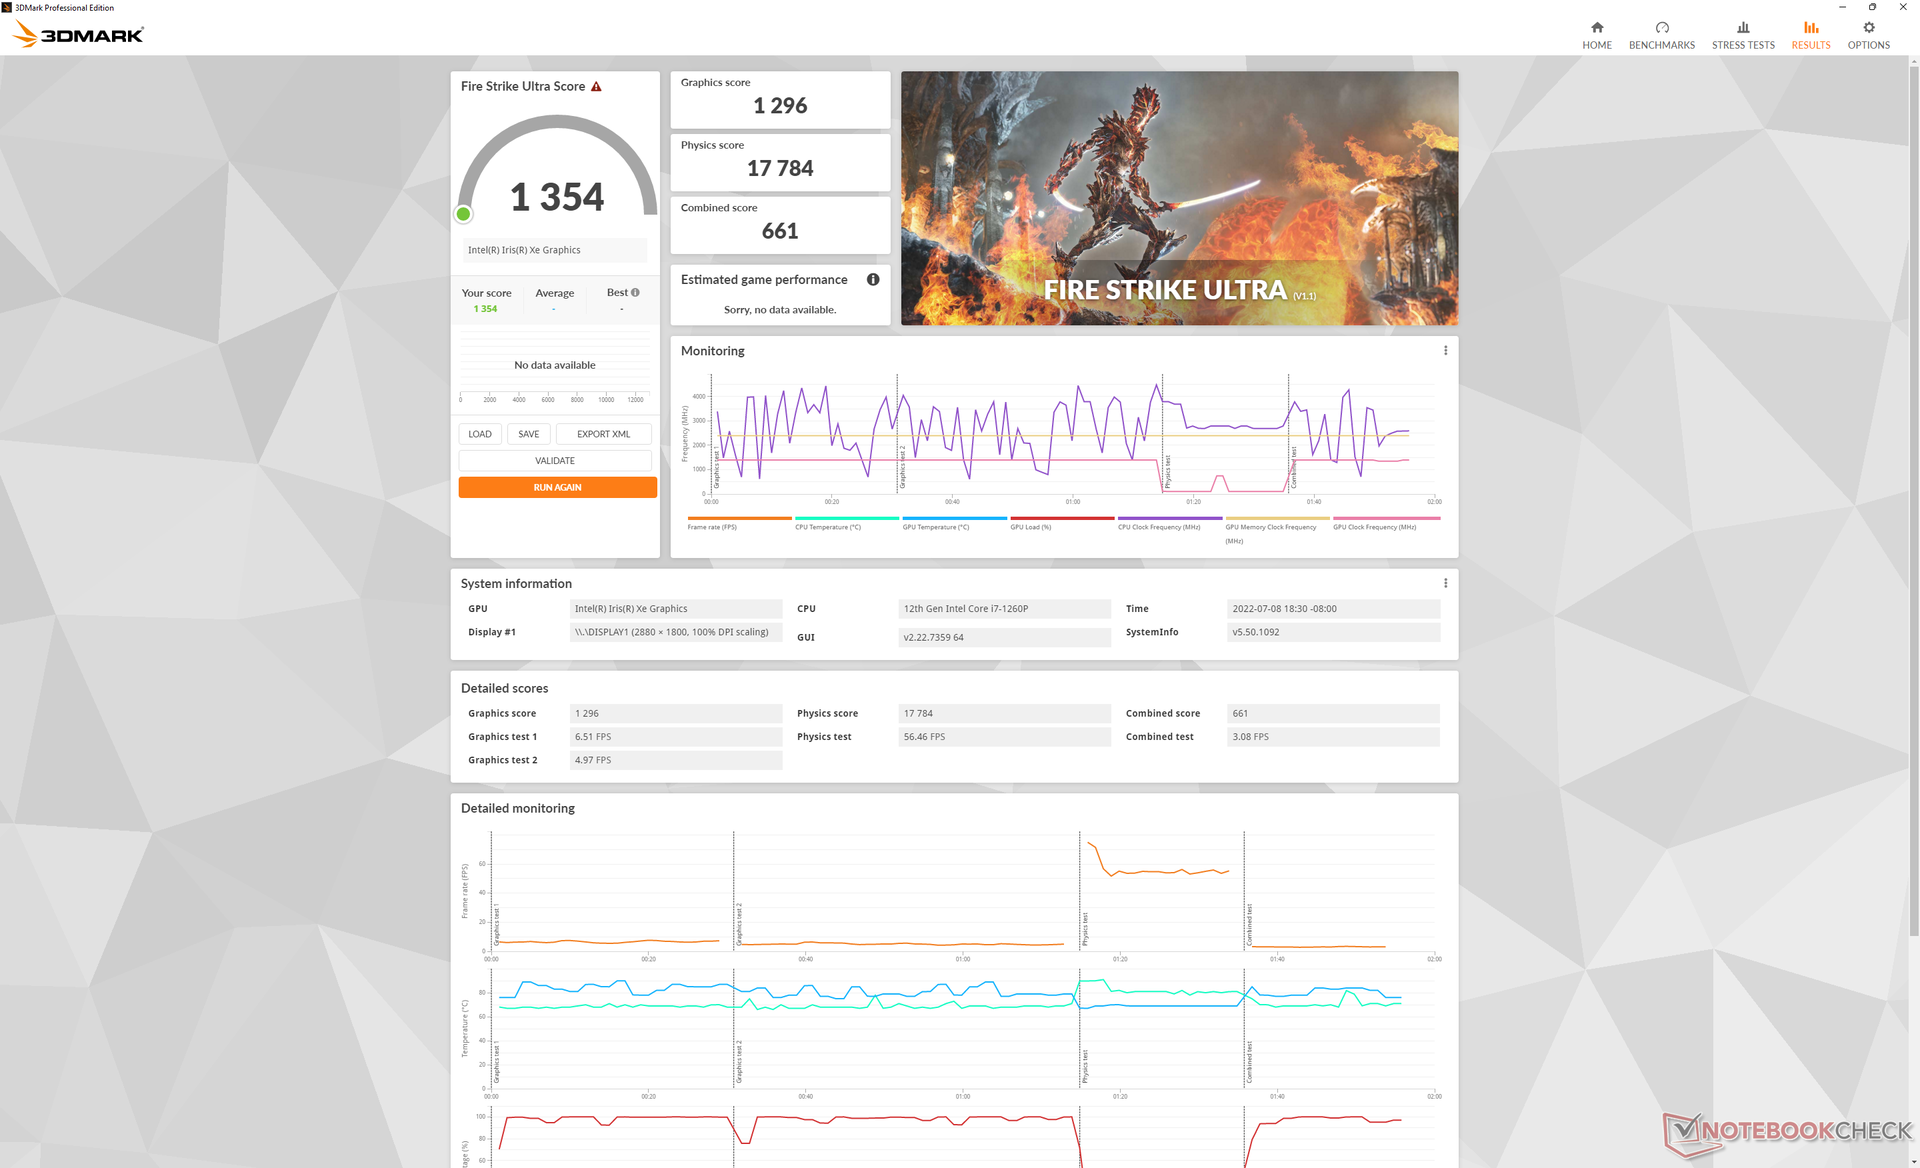
| 3DMark 11 Performance | 6543 points | |
| 3DMark Cloud Gate Standard Score | 22414 points | |
| 3DMark Fire Strike Score | 5145 points | |
| 3DMark Time Spy Score | 1949 points | |
Help | ||
Witcher 3 FPS Chart
| low | med. | high | ultra | |
| GTA V (2015) | 121.6 | 101.4 | 20.5 | 9.75 |
| The Witcher 3 (2015) | 96.9 | 62.9 | 34.7 | 15.8 |
| Dota 2 Reborn (2015) | 122.1 | 93.5 | 66.2 | 59.8 |
| Final Fantasy XV Benchmark (2018) | 44.4 | 24.8 | 24.8 | |
| X-Plane 11.11 (2018) | 47.8 | 34.9 | 32.1 | |
| Strange Brigade (2018) | 95.2 | 44.5 | 35.8 | 29 |
| Cyberpunk 2077 1.6 (2022) | 22.6 | 19.1 | 14.5 | 11.6 |
Emissions
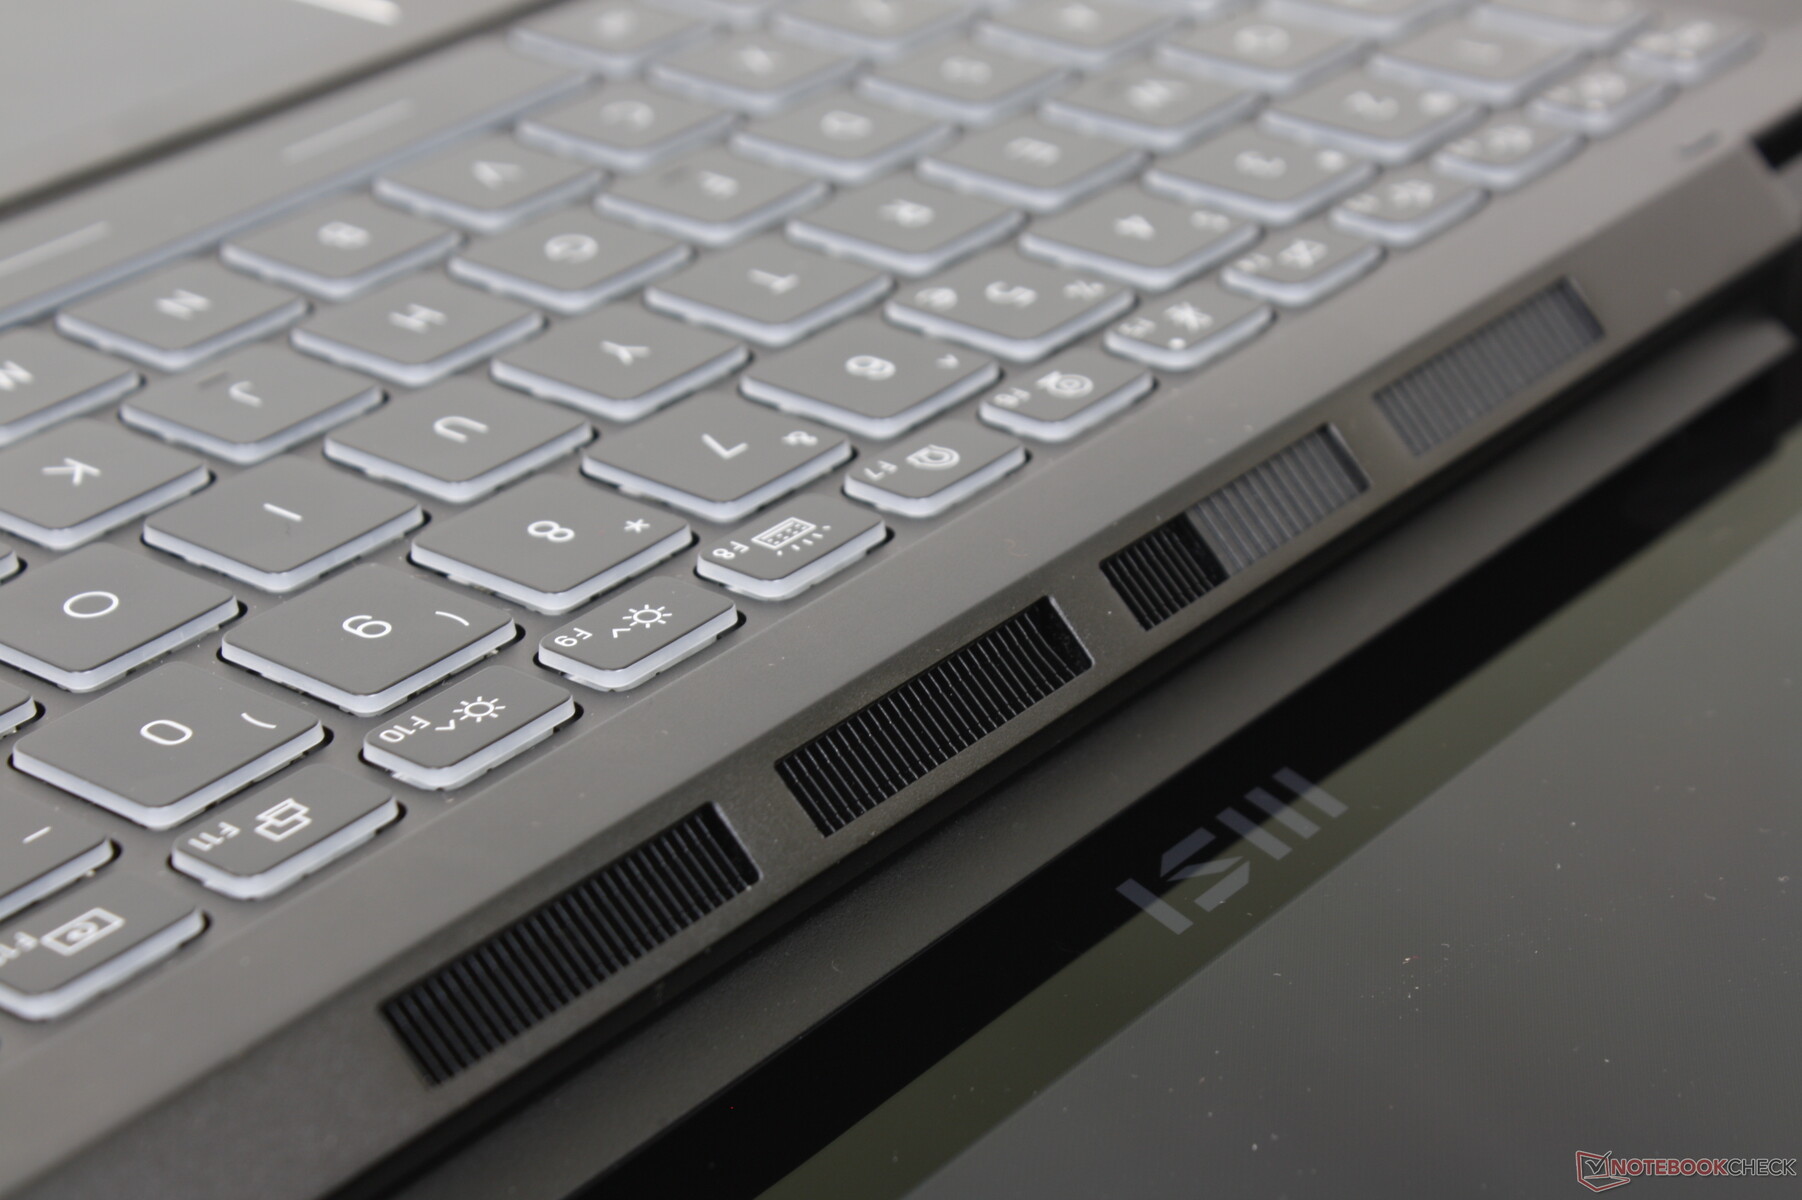
System Noise — Quiet Under Most Low-Medium Scenarios
The chassis was built to support more demanding Core-H and discrete GeForce MX options. Thus, it's no surprise that our lone Core-P CPU configuration is relatively quiet. When running the first benchmark scene of 3DMark 06 on Balanced mode, for example, fan noise would be barely audible at just 24 dB(A) against a silent background of 23.3 dB(A). Users can expect fan noise to remain below 24.7 dB(A) when under typical browsing scenarios.
When running Witcher 3 to represent high loads, fan noise would typically be between 35 to 43 dB(A). Enabling Cooler Boost mode (i.e. maximum fan mode) would induce a fan noise of almost 56 dB(A) to be louder than most subnotebooks. Such a mode is thankfully not necessary in most cases for our particular configuration.
Noise Level
| Idle |
| 23.3 / 23.3 / 23.3 dB(A) |
| Load |
| 24 / 55.8 dB(A) |
 | ||
30 dB silent 40 dB(A) audible 50 dB(A) loud |
||
min: | ||
| MSI Summit E14 Flip Evo A12MT Iris Xe G7 96EUs, i7-1260P, Samsung PM9A1 MZVL21T0HCLR | MSI Summit E14 A11SCS GeForce GTX 1650 Ti Max-Q, i7-1185G7, Phison 1TB SM2801T24GKBB4S-E162 | Asus VivoBook S 14X S5402Z Iris Xe G7 96EUs, i7-12700H, Micron 2450 512GB MTFDKBA512TFK | LG Gram 14T90P Iris Xe G7 80EUs, i5-1135G7, Samsung SSD PM981a MZVLB512HBJQ | Lenovo Yoga Slim 7i Pro 14IAP G7 Iris Xe G7 80EUs, i5-1240P, Samsung PM9A1 MZVL2512HCJQ | Dell Latitude 9420 2-in-1 Iris Xe G7 96EUs, i7-1185G7, WDC PC SN530 SDBPNPZ-512G | |
|---|---|---|---|---|---|---|
| Noise | -21% | -20% | -2% | -8% | -5% | |
| off / environment * | 23.3 | 23.9 -3% | 22.7 3% | 25.4 -9% | 23.7 -2% | 25.4 -9% |
| Idle Minimum * | 23.3 | 24.2 -4% | 23.2 -0% | 25.5 -9% | 23.7 -2% | 25.4 -9% |
| Idle Average * | 23.3 | 24.2 -4% | 23.2 -0% | 25.5 -9% | 25.1 -8% | 25.4 -9% |
| Idle Maximum * | 23.3 | 24.2 -4% | 27.2 -17% | 25.5 -9% | 25.1 -8% | 25.4 -9% |
| Load Average * | 24 | 50.2 -109% | 43.2 -80% | 28.3 -18% | 38.4 -60% | 25.4 -6% |
| Witcher 3 ultra * | 35.6 | 47 -32% | 52.8 -48% | 35 2% | 38.4 -8% | 41.3 -16% |
| Load Maximum * | 55.8 | 51.7 7% | 52.8 5% | 35 37% | 39.4 29% | 41.3 26% |
* ... smaller is better
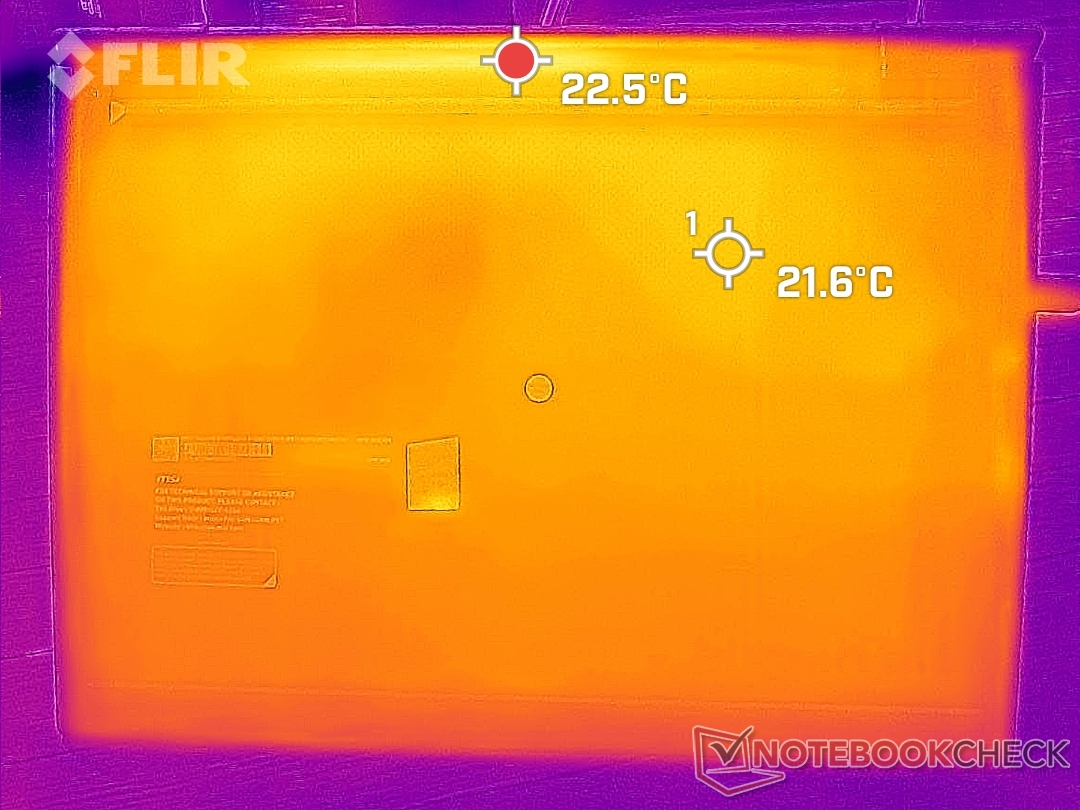
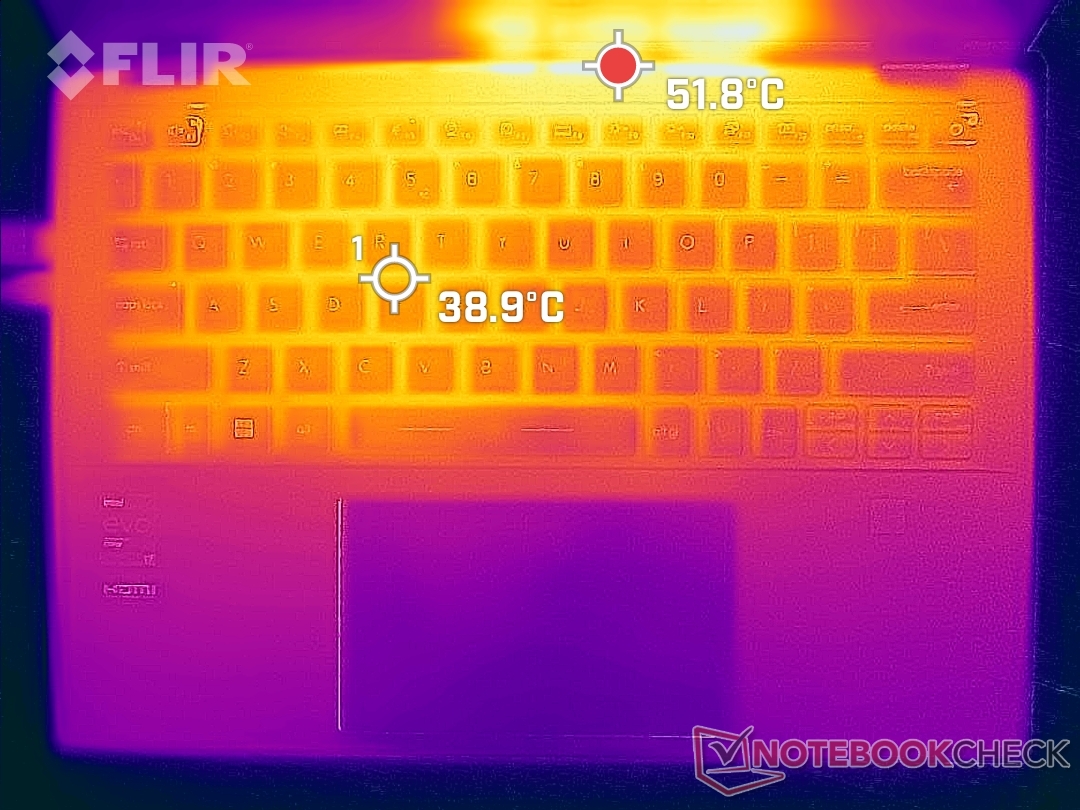
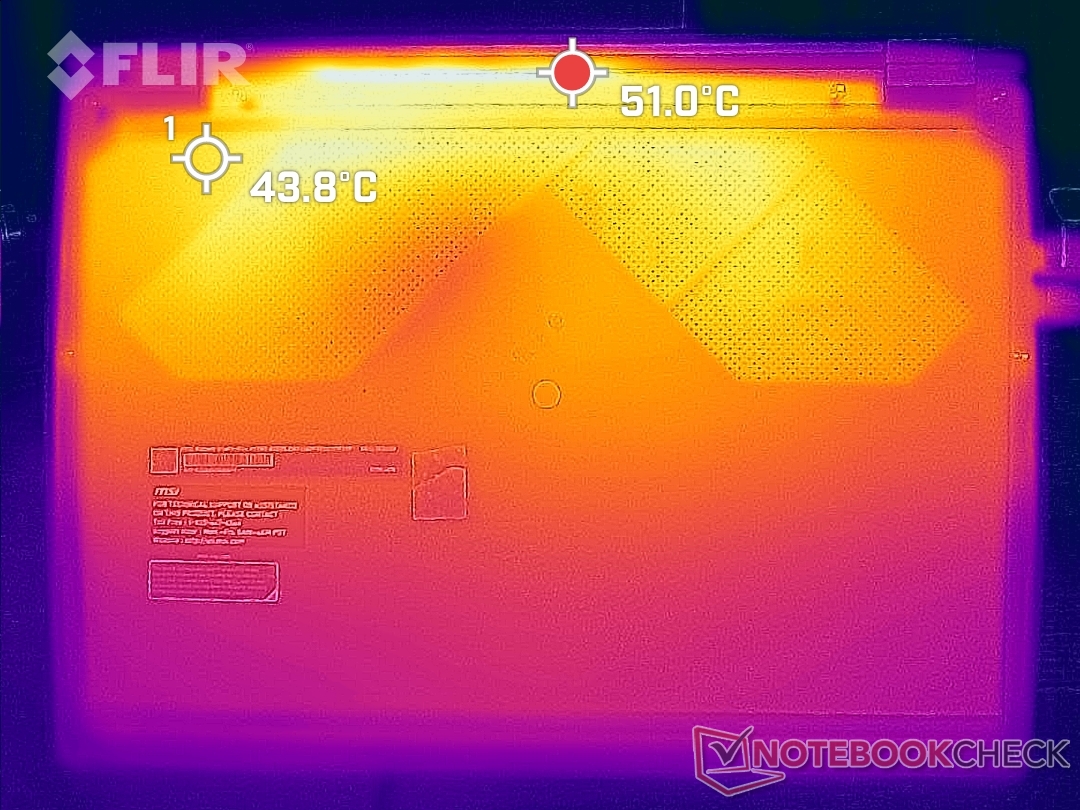
Temperature
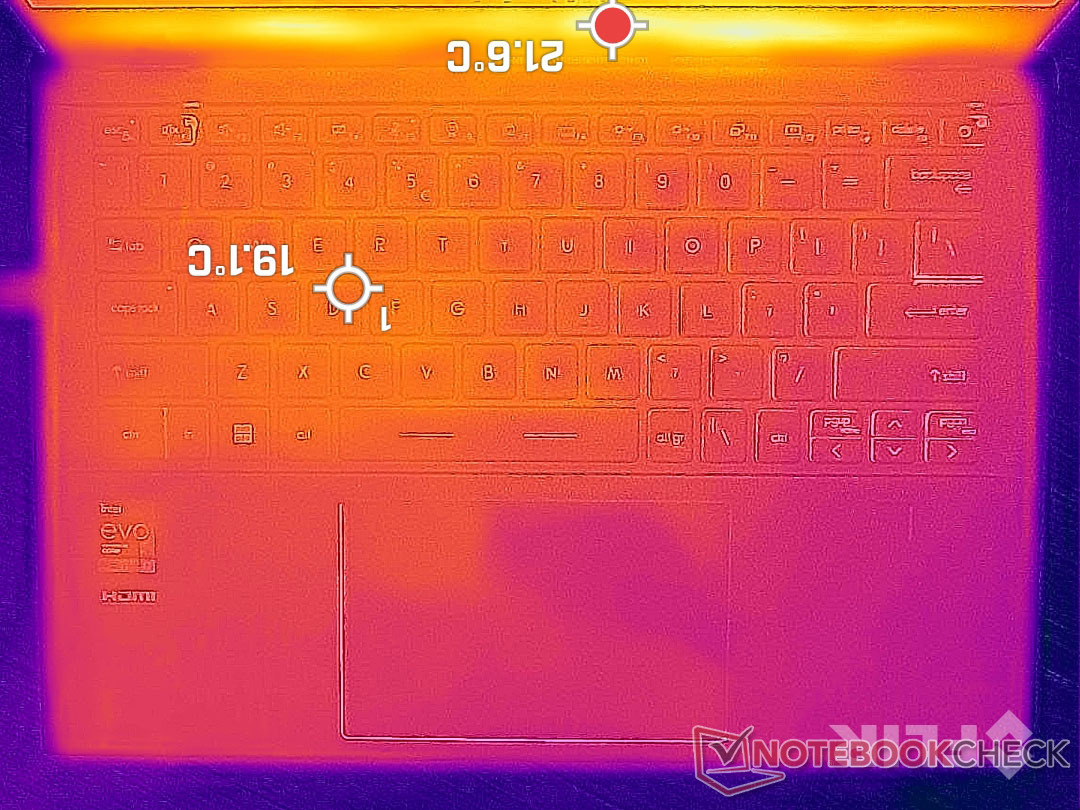
Surface temperatures when idling or web browsing remain comfortable and sometimes even cool to the touch since most of the chassis is metal. When running more demanding loads like games, however, hot spots on the top and bottom can become as warm as 52 C near the ventilation grilles. The palm rests will also become warmer at 27 C to be noticeable on the palms. Similar results can be observed on the metal-clad Dell Latitude 9420 2-in-1 and so the very warm surface temperatures of the MSI are not uncommon.
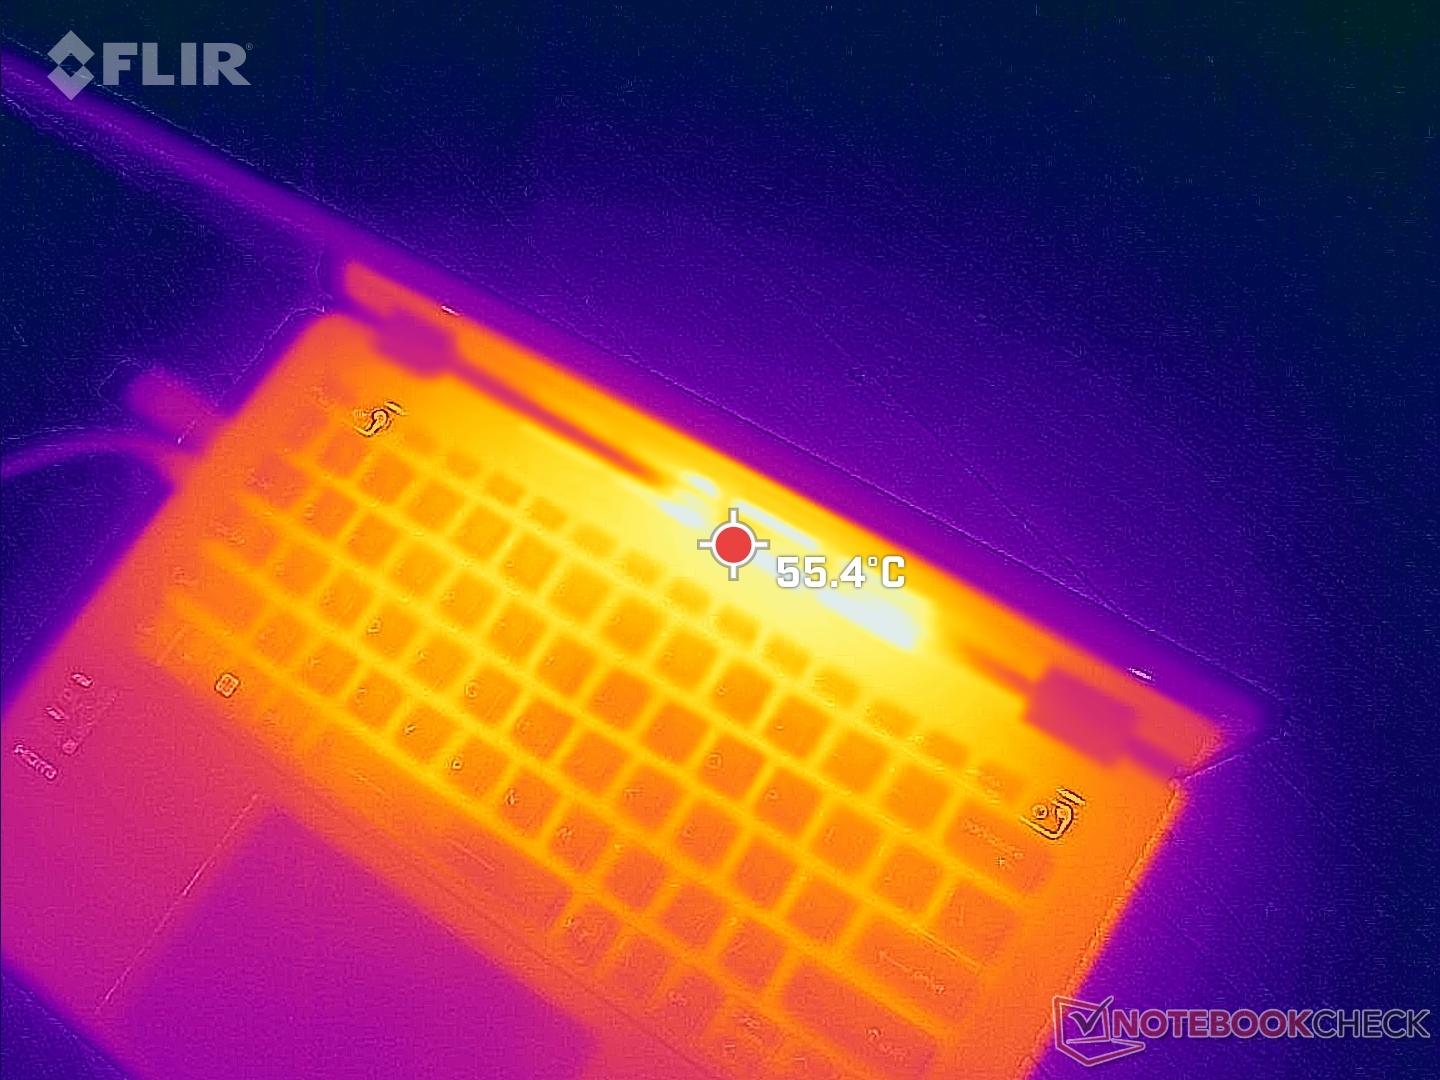
(±) The maximum temperature on the upper side is 44.2 °C / 112 F, compared to the average of 35.3 °C / 96 F, ranging from 19.6 to 55.7 °C for the class Convertible.
(-) The bottom heats up to a maximum of 45.8 °C / 114 F, compared to the average of 36.8 °C / 98 F
(+) In idle usage, the average temperature for the upper side is 19.2 °C / 67 F, compared to the device average of 30.2 °C / 86 F.
(+) The palmrests and touchpad are cooler than skin temperature with a maximum of 27.2 °C / 81 F and are therefore cool to the touch.
(±) The average temperature of the palmrest area of similar devices was 28.1 °C / 82.6 F (+0.9 °C / 1.6 F).
| MSI Summit E14 Flip Evo A12MT Intel Core i7-1260P, Intel Iris Xe Graphics G7 96EUs | MSI Summit E14 A11SCS Intel Core i7-1185G7, NVIDIA GeForce GTX 1650 Ti Max-Q | Asus VivoBook S 14X S5402Z Intel Core i7-12700H, Intel Iris Xe Graphics G7 96EUs | LG Gram 14T90P Intel Core i5-1135G7, Intel Iris Xe Graphics G7 80EUs | Lenovo Yoga Slim 7i Pro 14IAP G7 Intel Core i5-1240P, Intel Iris Xe Graphics G7 80EUs | Dell Latitude 9420 2-in-1 Intel Core i7-1185G7, Intel Iris Xe Graphics G7 96EUs | |
|---|---|---|---|---|---|---|
| Heat | -43% | -17% | -4% | -20% | -21% | |
| Maximum Upper Side * | 44.2 | 49.4 -12% | 37.2 16% | 41.6 6% | 42.3 4% | 43.4 2% |
| Maximum Bottom * | 45.8 | 60.6 -32% | 39.2 14% | 46.2 -1% | 52.8 -15% | 48 -5% |
| Idle Upper Side * | 19.6 | 30.6 -56% | 30.4 -55% | 22.6 -15% | 27.1 -38% | 29.8 -52% |
| Idle Bottom * | 22 | 37.4 -70% | 31.6 -44% | 23.2 -5% | 29.1 -32% | 28 -27% |
* ... smaller is better
Stress Test — High Core Temperatures
When running Prime95, CPU clock rates would boost to 3.3 GHz for under a minute before hitting a core temperature of 95 C. Thereafter, clock rates would drop to 2.6 GHz before finally dropping and stabilizing at 1.9 GHz and at a temperature of 82 C. CPU power draw would be as high as 72 W during the start of the test before settling at 28 W. Running this same test on the Yoga 9 14 with the same CPU would result in similar stable clock rates of 2.0 GHz and CPU power draw of 28 W, but core temperature would be cooler at 66 C.
Running Witcher 3 would result in an average core temperature of 85 C which is on the high side for a 14-inch convertible. Running this same test on the Dell Latitude 9420 2-in-1 or aforementioned Lenovo, for example, would again result in cooler core temperature of ~73 C and 65 C, respectively. Enabling Cooler Boost mode would help reduce temperatures to the lower 70 C range if the high temperatures are a concern.
Running on battery power does not limit performance. A 3DMark 11 test on batteries would return similar scores to mains.
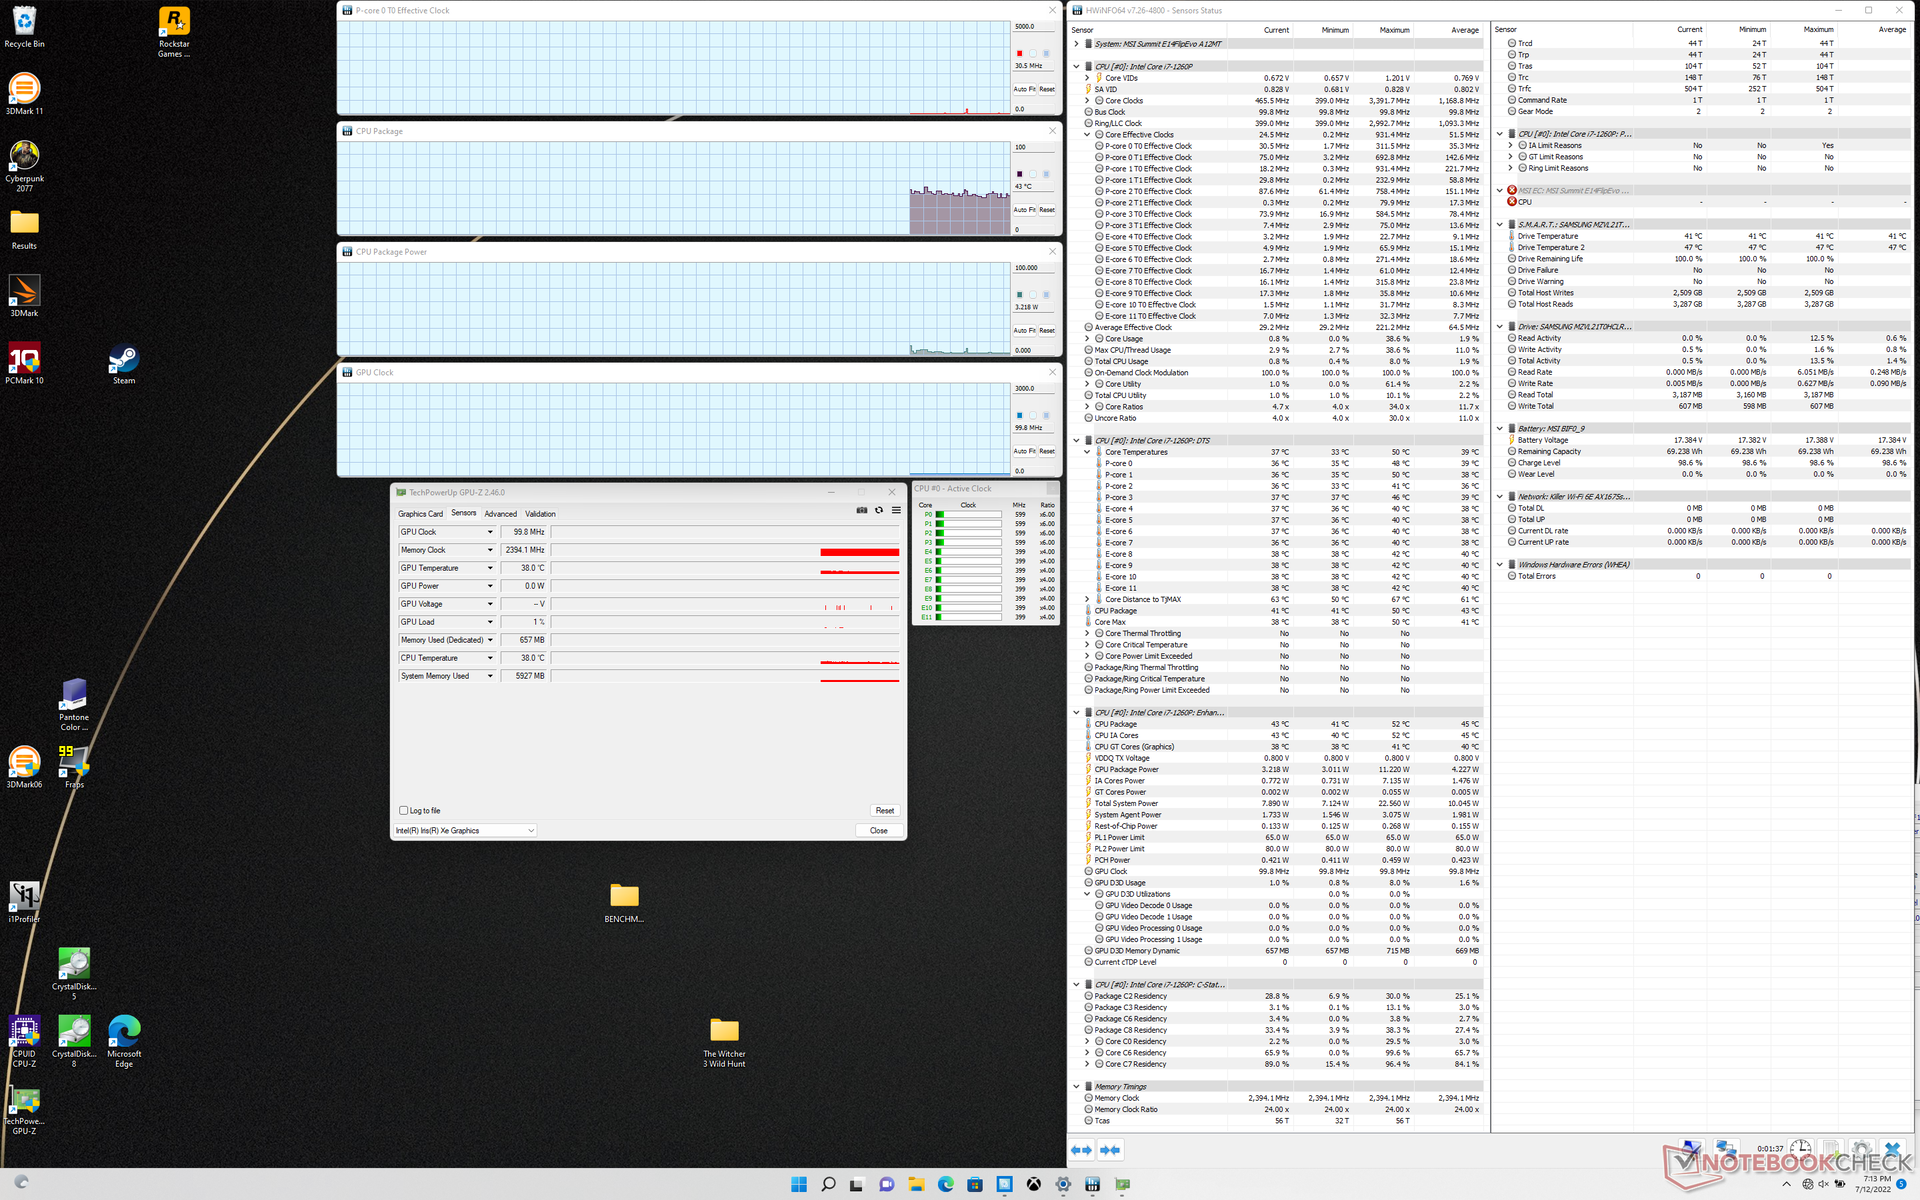
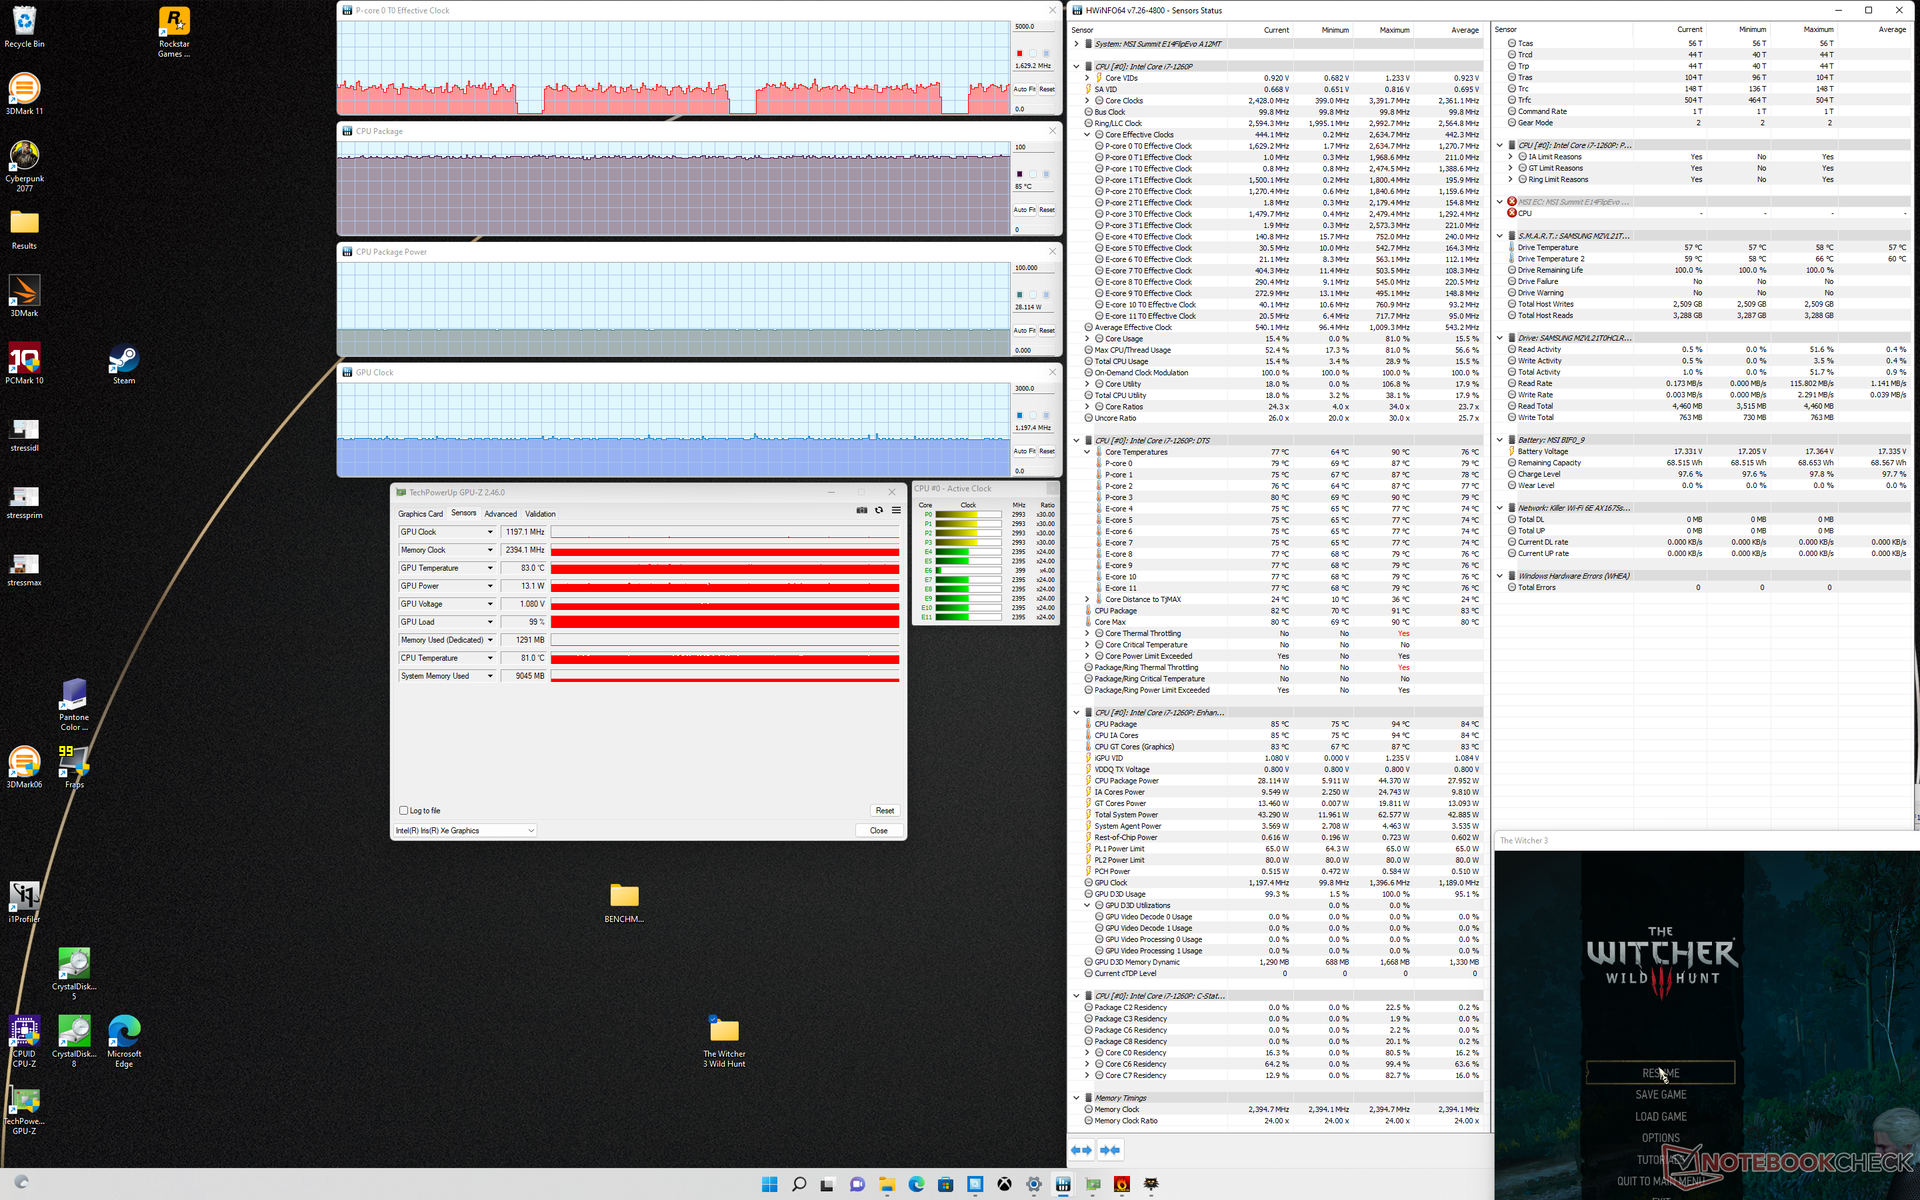
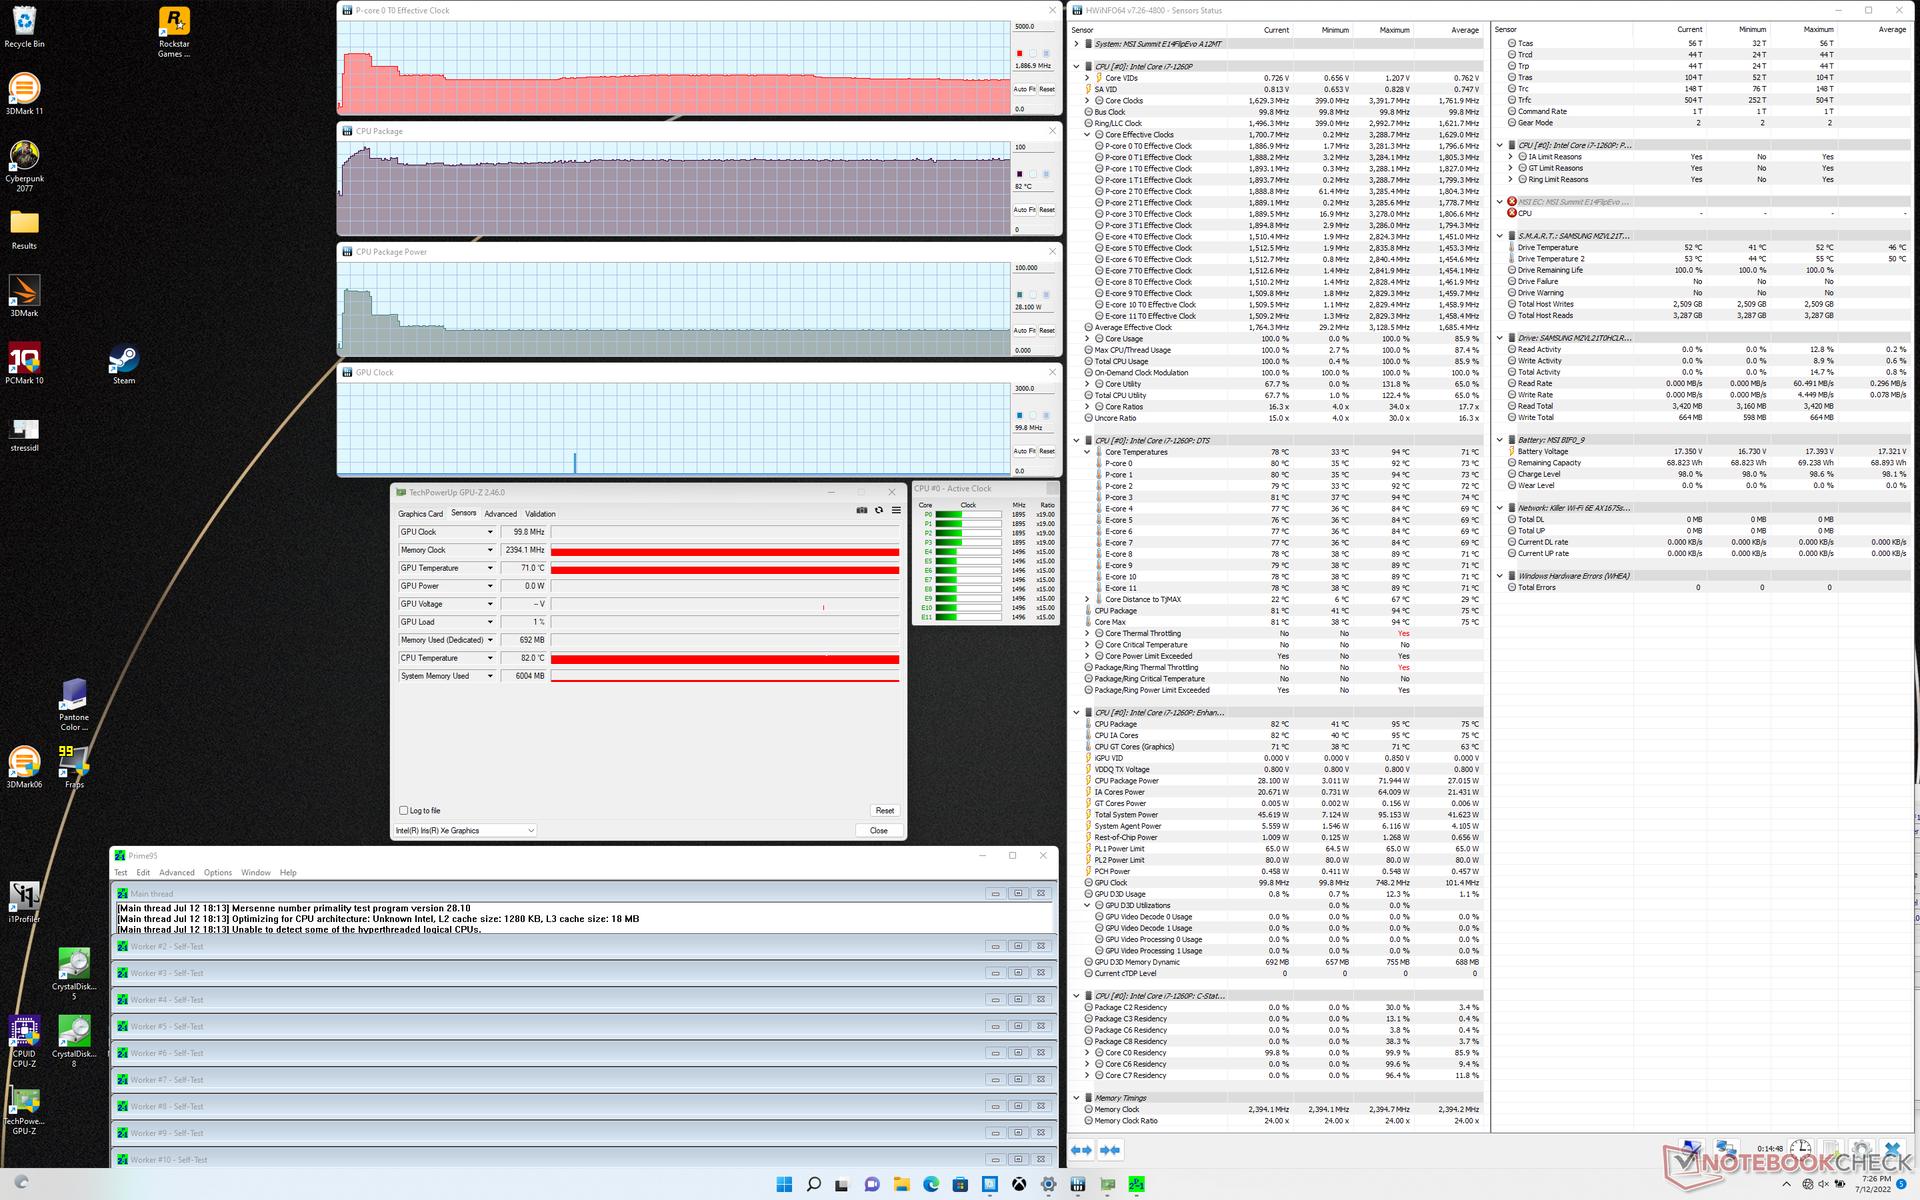
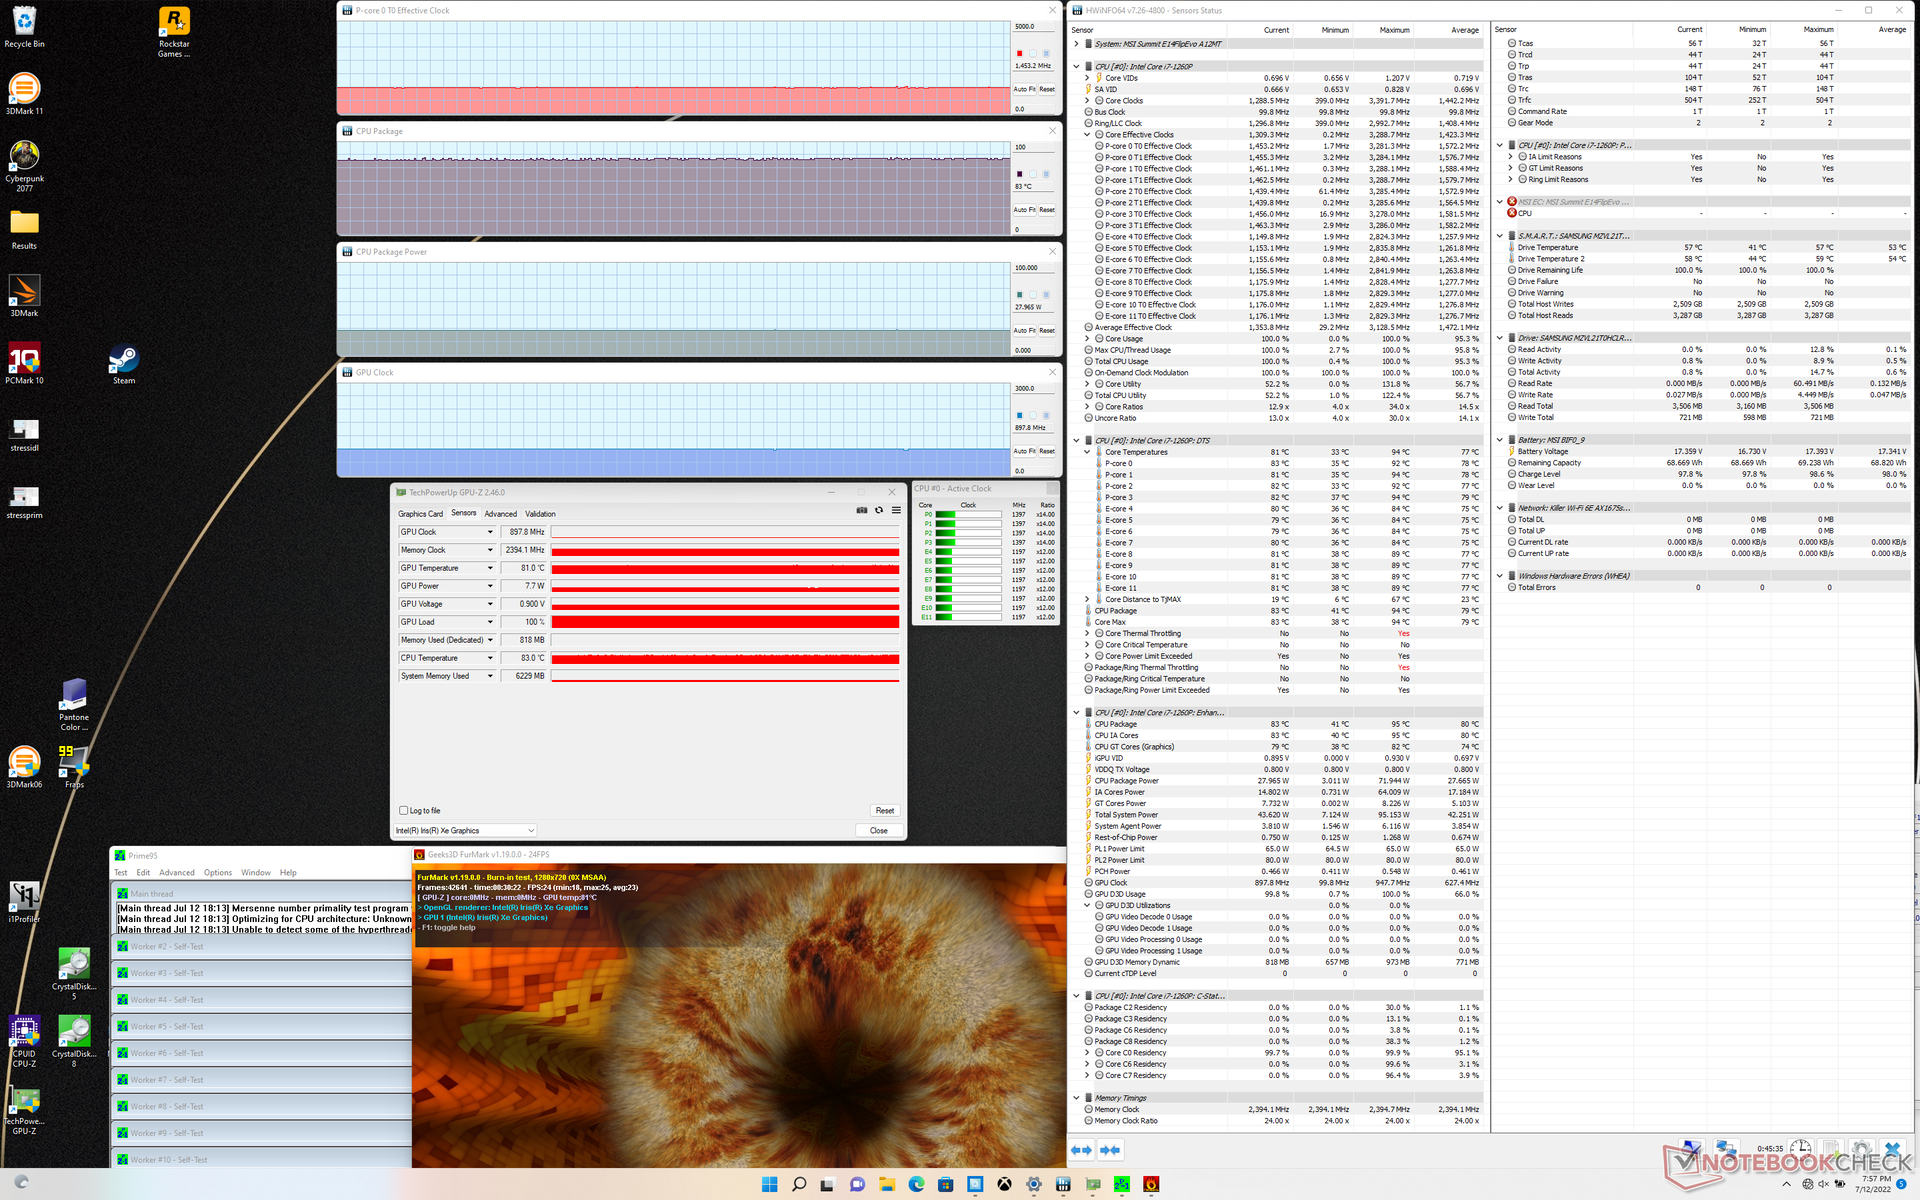
| CPU Clock (GHz) | GPU Clock (MHz) | Average CPU Temperature (°C) | |
| System Idle | -- | -- | 43 |
| Prime95 Stress | 1.9 - 2.0 | -- | 82 |
| Prime95 + FurMark Stress | 1.5 | 898 | 83 |
| Witcher 3 Stress | ~1.6 | 1197 | 85 |
Speakers
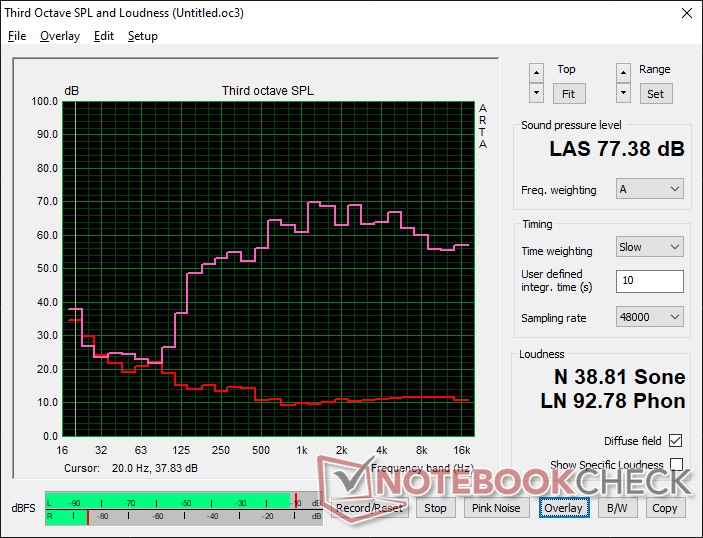
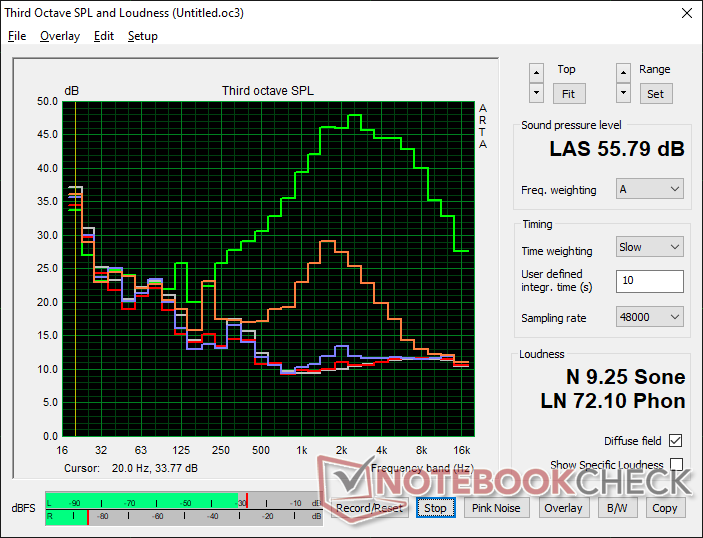
MSI Summit E14 Flip Evo A12MT audio analysis
(±) | speaker loudness is average but good (77.4 dB)
Bass 100 - 315 Hz
(±) | reduced bass - on average 14.7% lower than median
(±) | linearity of bass is average (11.4% delta to prev. frequency)
Mids 400 - 2000 Hz
(±) | higher mids - on average 5.2% higher than median
(±) | linearity of mids is average (8.7% delta to prev. frequency)
Highs 2 - 16 kHz
(+) | balanced highs - only 4.3% away from median
(±) | linearity of highs is average (7.7% delta to prev. frequency)
Overall 100 - 16.000 Hz
(±) | linearity of overall sound is average (17% difference to median)
Compared to same class
» 25% of all tested devices in this class were better, 8% similar, 67% worse
» The best had a delta of 6%, average was 21%, worst was 57%
Compared to all devices tested
» 25% of all tested devices were better, 8% similar, 67% worse
» The best had a delta of 4%, average was 25%, worst was 134%
Apple MacBook Pro 16 2021 M1 Pro audio analysis
(+) | speakers can play relatively loud (84.7 dB)
Bass 100 - 315 Hz
(+) | good bass - only 3.8% away from median
(+) | bass is linear (5.2% delta to prev. frequency)
Mids 400 - 2000 Hz
(+) | balanced mids - only 1.3% away from median
(+) | mids are linear (2.1% delta to prev. frequency)
Highs 2 - 16 kHz
(+) | balanced highs - only 1.9% away from median
(+) | highs are linear (2.7% delta to prev. frequency)
Overall 100 - 16.000 Hz
(+) | overall sound is linear (4.6% difference to median)
Compared to same class
» 0% of all tested devices in this class were better, 0% similar, 100% worse
» The best had a delta of 5%, average was 18%, worst was 45%
Compared to all devices tested
» 0% of all tested devices were better, 0% similar, 100% worse
» The best had a delta of 4%, average was 25%, worst was 134%
Energy Management
Power Consumption — Core-P Is Very Demanding
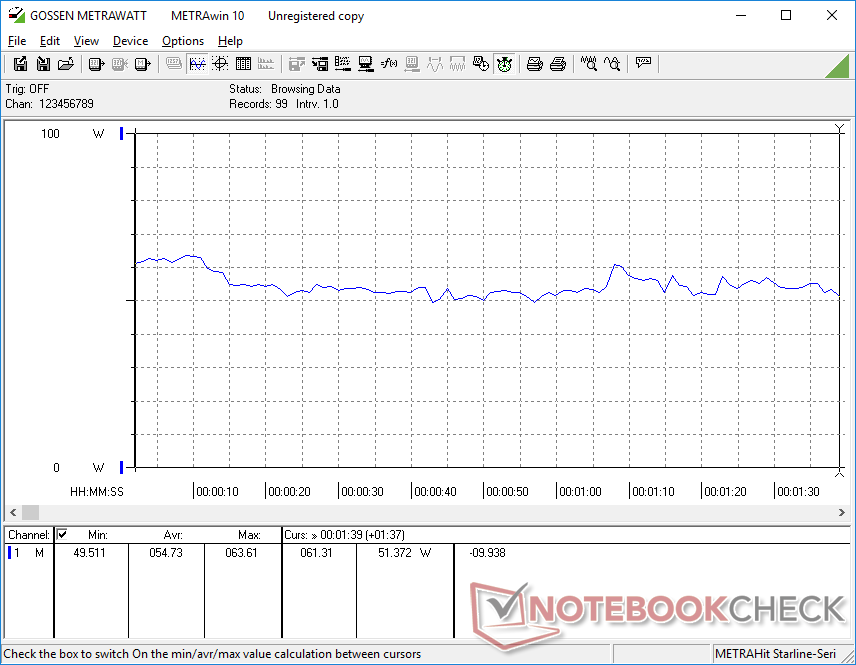
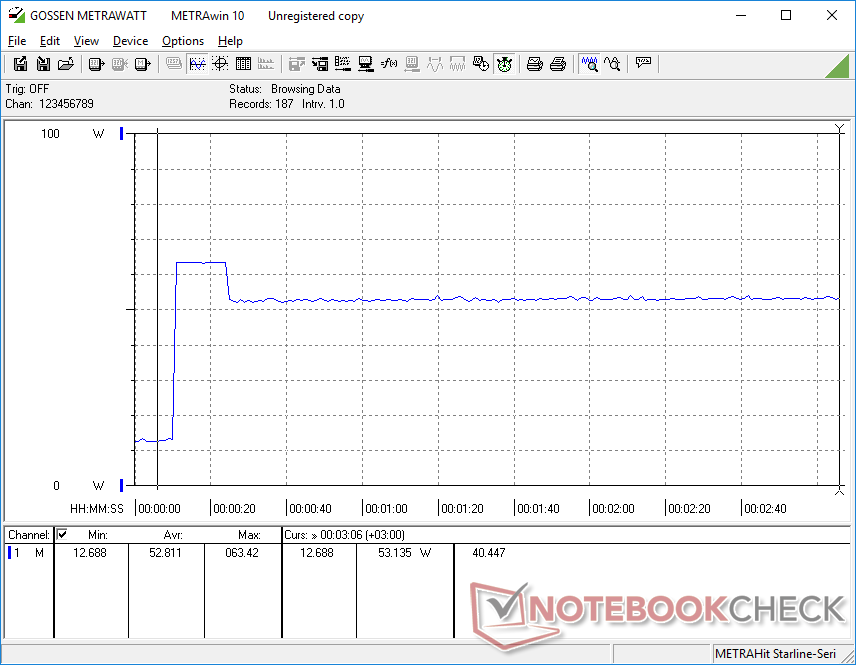
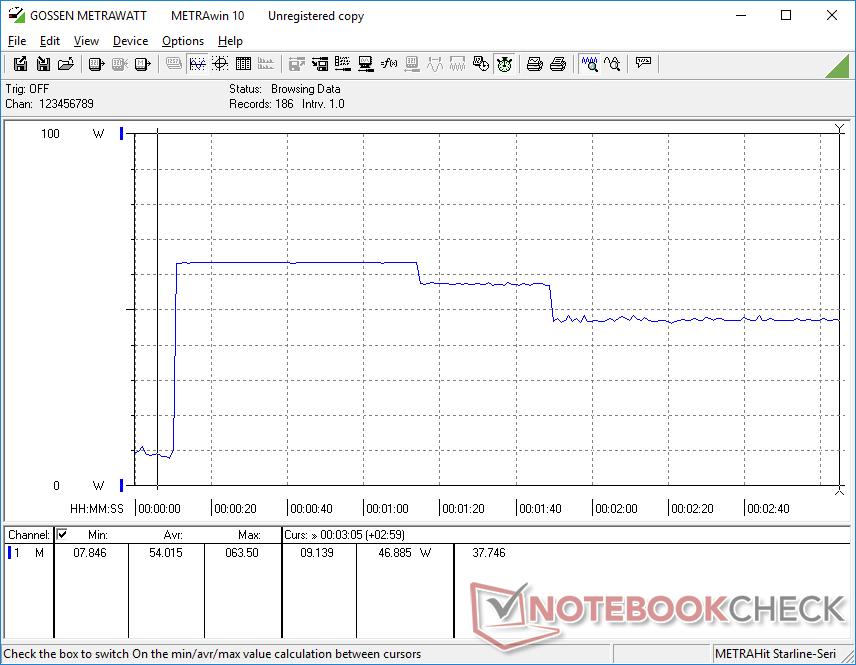
Power consumption is higher across the board relative to systems running on 11th gen Intel Core U-series CPUs such as the LG Gram 14T90P or Dell Latitude 9420 2-in-1. Running Witcher 3 or Prime95 on our MSI, for example, would consume 37 percent and 47 percent more power, respectively, when compared to the aforementioned Dell. In other words, the CPU and GPU gains mentioned above over previous generation Intel CPUs come at the cost of noticeably higher power demands.
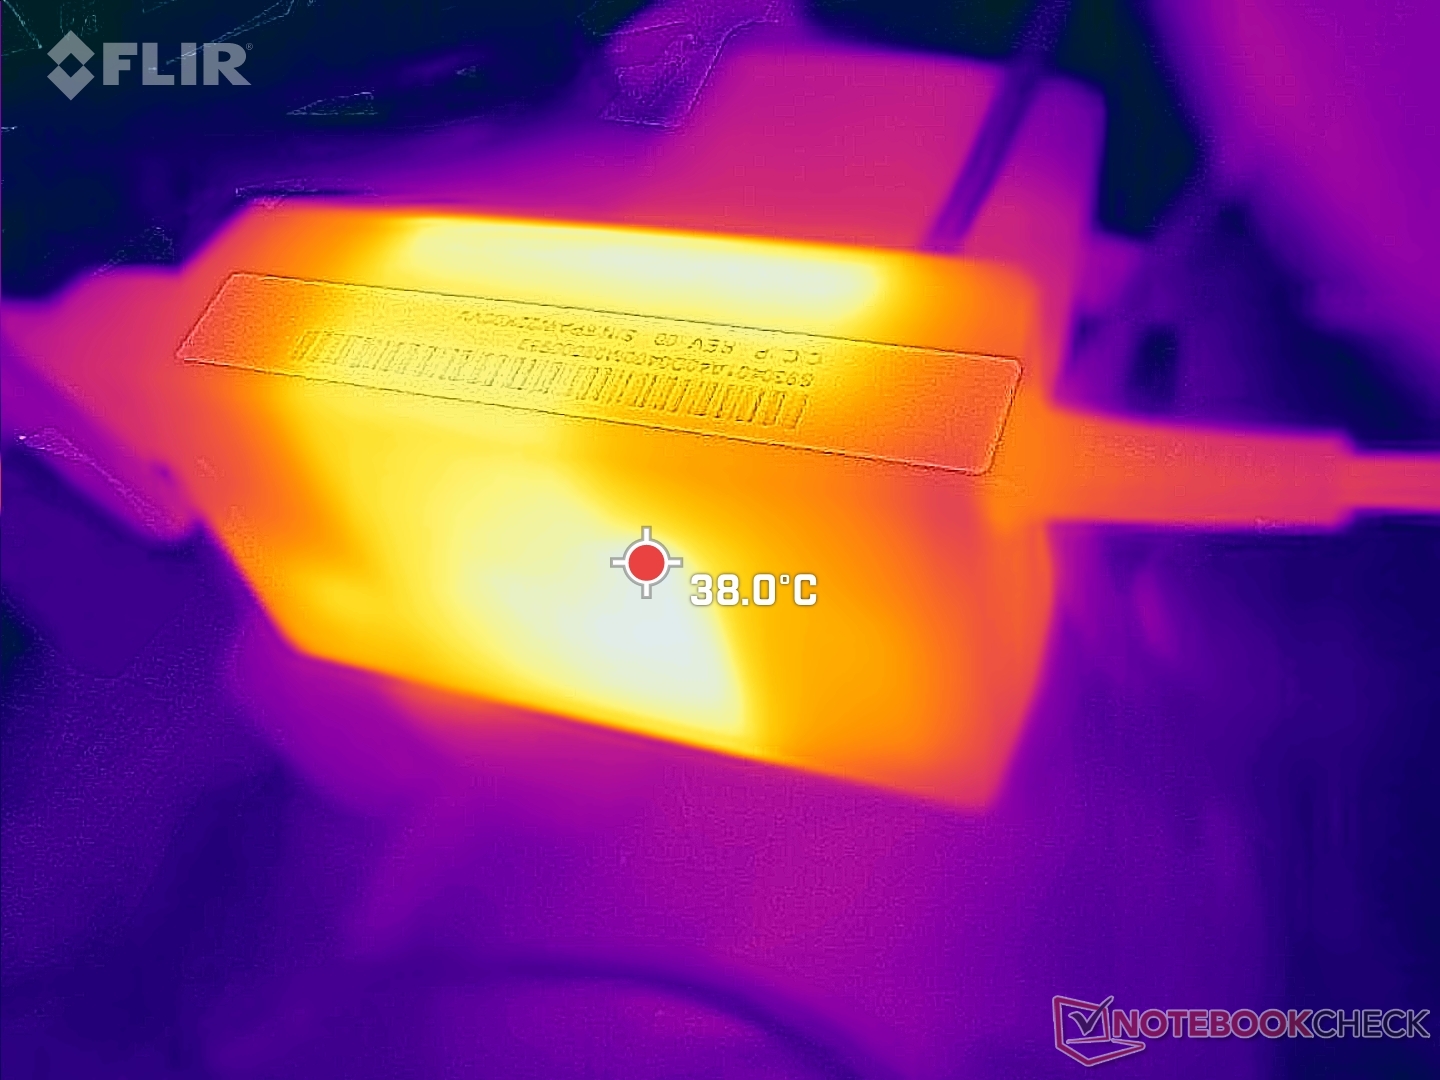
We're able to record a maximum draw of 63.4 W from the small (~8.8 x 4.9 x 3 cm) 65 W AC adapter. Total power draw tends to stabilize at 53 W when the CPU is fully stressed leaving a headroom of just 12 W.

| Off / Standby | |
| Idle | |
| Load |
|
| MSI Summit E14 Flip Evo A12MT i7-1260P, Iris Xe G7 96EUs, Samsung PM9A1 MZVL21T0HCLR, IPS, 2880x1800, 14.00 | MSI Summit E14 A11SCS i7-1185G7, GeForce GTX 1650 Ti Max-Q, Phison 1TB SM2801T24GKBB4S-E162, IPS, 3840x2160, 14.00 | Asus VivoBook S 14X S5402Z i7-12700H, Iris Xe G7 96EUs, Micron 2450 512GB MTFDKBA512TFK, OLED, 2880x1800, 14.50 | LG Gram 14T90P i5-1135G7, Iris Xe G7 80EUs, Samsung SSD PM981a MZVLB512HBJQ, IPS, 1900x1200, 14.00 | Lenovo Yoga Slim 7i Pro 14IAP G7 i5-1240P, Iris Xe G7 80EUs, Samsung PM9A1 MZVL2512HCJQ, IPS, 2880x1800, 14.00 | Dell Latitude 9420 2-in-1 i7-1185G7, Iris Xe G7 96EUs, WDC PC SN530 SDBPNPZ-512G, IPS, 2560x1600, 14.00 | |
|---|---|---|---|---|---|---|
| Power Consumption | -64% | -5% | 31% | 9% | 11% | |
| Idle Minimum * | 5.4 | 9.9 -83% | 5.1 6% | 2.8 48% | 5.6 -4% | 4.6 15% |
| Idle Average * | 9.5 | 17.4 -83% | 7.7 19% | 5.5 42% | 9.3 2% | 7.8 18% |
| Idle Maximum * | 12.4 | 22.5 -81% | 11 11% | 6.4 48% | 9.6 23% | 8.2 34% |
| Load Average * | 54.7 | 85.6 -56% | 73.9 -35% | 45.4 17% | 49 10% | 47.9 12% |
| Witcher 3 ultra * | 52 | 70.9 -36% | 42.7 18% | 34 35% | 38.2 27% | 38.8 25% |
| Load Maximum * | 63.4 | 91.1 -44% | 93 -47% | 65.9 -4% | 65.2 -3% | 87.1 -37% |
* ... smaller is better
Power Consumption Witcher 3 / Stresstest
Power Consumption external Monitor
Battery Life
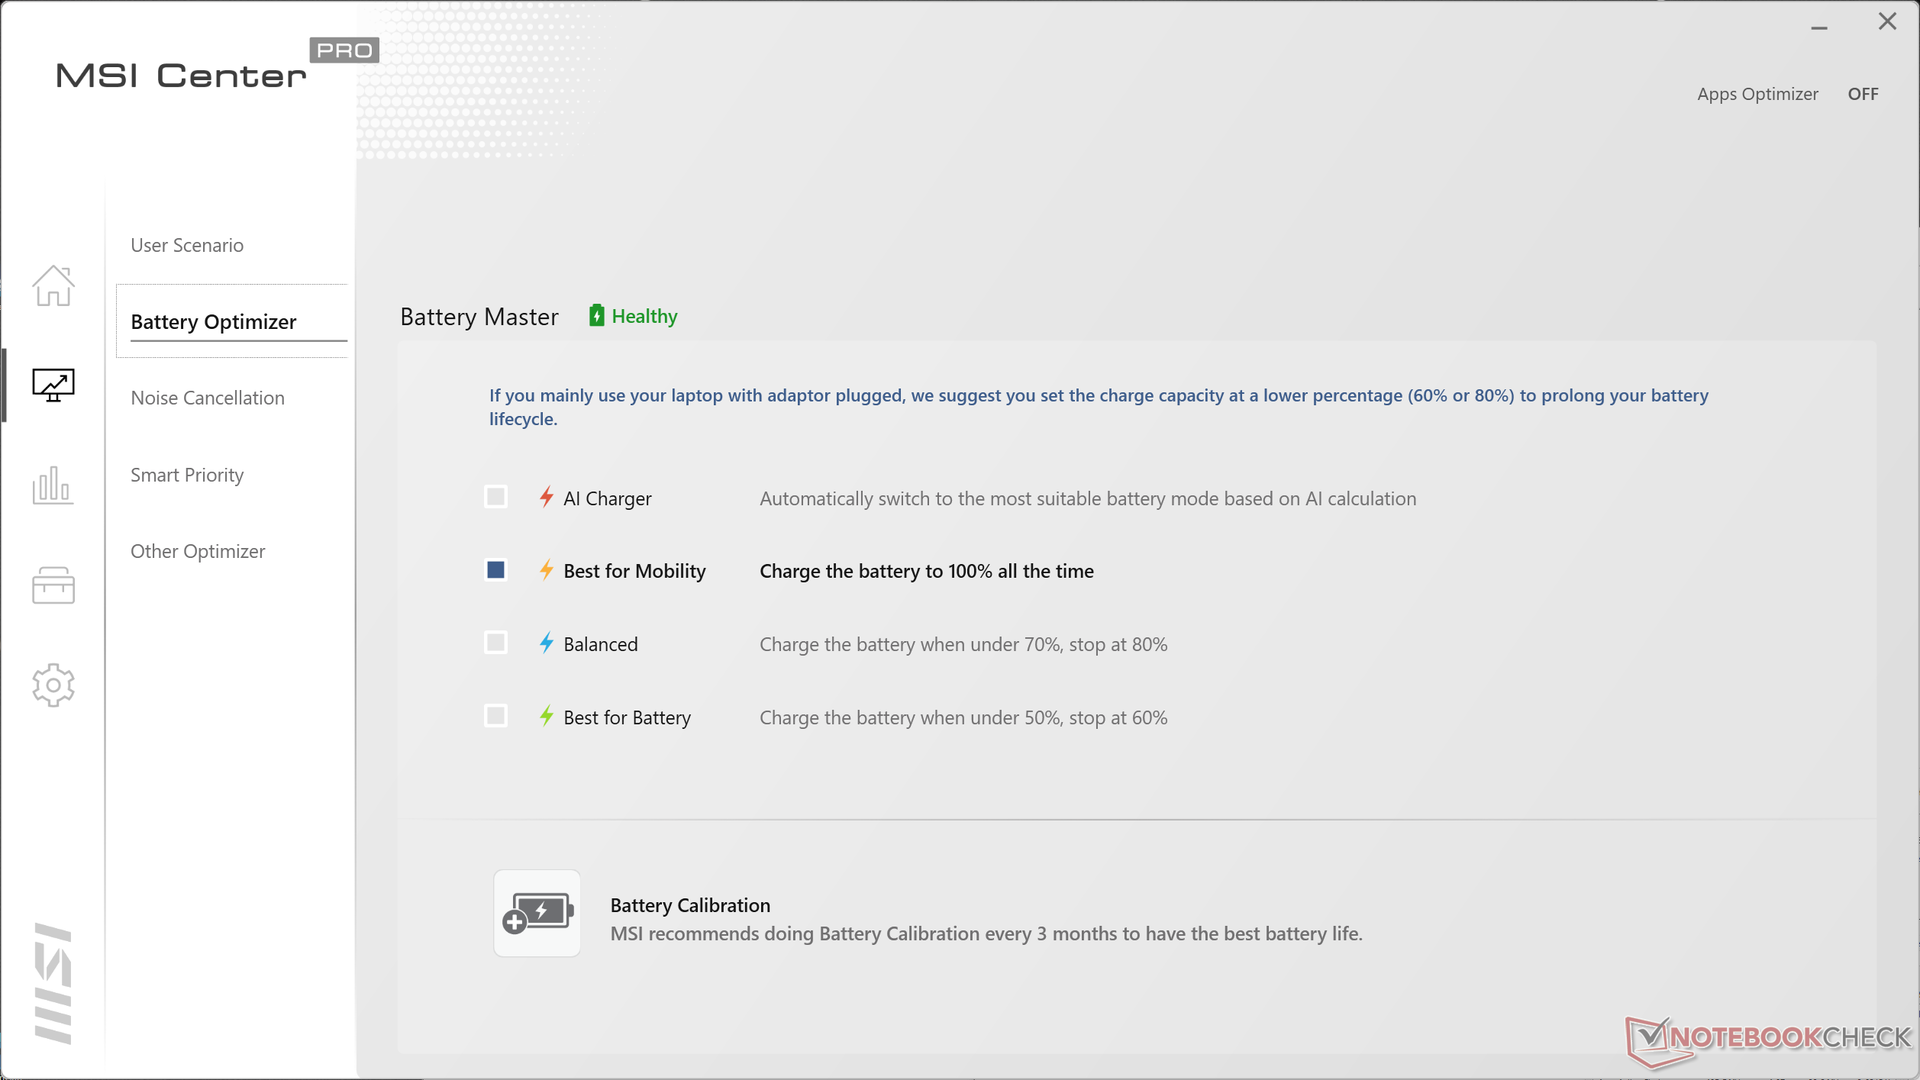
Battery capacity is similar to what is available on the competing Asus VivoBook S 14X or LG Gram 14T90P at 70 Wh. Users can expect just over 8 hours of real-world WLAN surfing before needing to recharge.
Charging from empty to full capacity with the included adapter takes just under 90 minutes which is comparable to most Ultrabooks. Third-party USB-C AC adapters can also be used to recharge the system.
| MSI Summit E14 Flip Evo A12MT i7-1260P, Iris Xe G7 96EUs, 72 Wh | MSI Summit E14 A11SCS i7-1185G7, GeForce GTX 1650 Ti Max-Q, 52 Wh | Asus VivoBook S 14X S5402Z i7-12700H, Iris Xe G7 96EUs, 70 Wh | LG Gram 14T90P i5-1135G7, Iris Xe G7 80EUs, 72 Wh | Lenovo Yoga Slim 7i Pro 14IAP G7 i5-1240P, Iris Xe G7 80EUs, 61 Wh | Dell Latitude 9420 2-in-1 i7-1185G7, Iris Xe G7 96EUs, 60 Wh | |
|---|---|---|---|---|---|---|
| Battery Runtime | -55% | -28% | 34% | -21% | 33% | |
| Reader / Idle | 1324 | 396 -70% | 787 -41% | 1721 30% | ||
| WiFi v1.3 | 494 | 271 -45% | 425 -14% | 728 47% | 517 5% | 699 41% |
| Load | 114 | 58 -49% | 138 21% | 61 -46% | 146 28% | |
| H.264 | 643 |
Pros
Cons
Verdict — The Best MSI Summit Yet
Instead of taking the 13-inch Summit E13 Flip and simply enlarging it for a 14-inch form factor, the Summit E14 Flip is the full chassis redesign we've been looking for. It loses some of the golden trims of its smaller sibling, but the gains in rigidity and build quality are arguably worth it especially from a professional standpoint where reliability takes priority. It doesn't quite feel as strong as the HP Spectre just yet, but it's certainly getting close.
The Summit E14 Flip is for prosumers and students who want the versatility of a convertible subnotebook form factor without needing to sacrifice performance along the way.
Performance is top notch with no major CPU or GPU throttling unlike on certain HP EliteBook Dragonfly models. Meanwhile, the display stands toe-to-toe with the displays on other prosumer subnotebooks from Dell, HP, or Asus on most fronts. We're hoping to see OLED or 90+ Hz options in the future which appear to be the current trend.
The lack of any WAN options means some users will still have a reason to opt for models from the Lenovo ThinkPad, Dell Latitude, or HP Spectre families. Furthermore, while performance is excellent and the chassis is strong, they also lead to very warm temperatures and a larger design, respectively. Choosing the Summit E14 Flip means sacrificing a bit of portability for that fast CPU.
Price and Availability
Amazon has multiple configurations in stock ranging from the Core i5-1240P for $1300 USD to the Core i7-1260P for $1700 USD.
MSI Summit E14 Flip Evo A12MT
-
07/15/2022 v7
Allen Ngo
More articles related to this device
MSI Summit E14 Flip Evo A12MT (Summit E14 Series)Related Articles


Pricecompare
