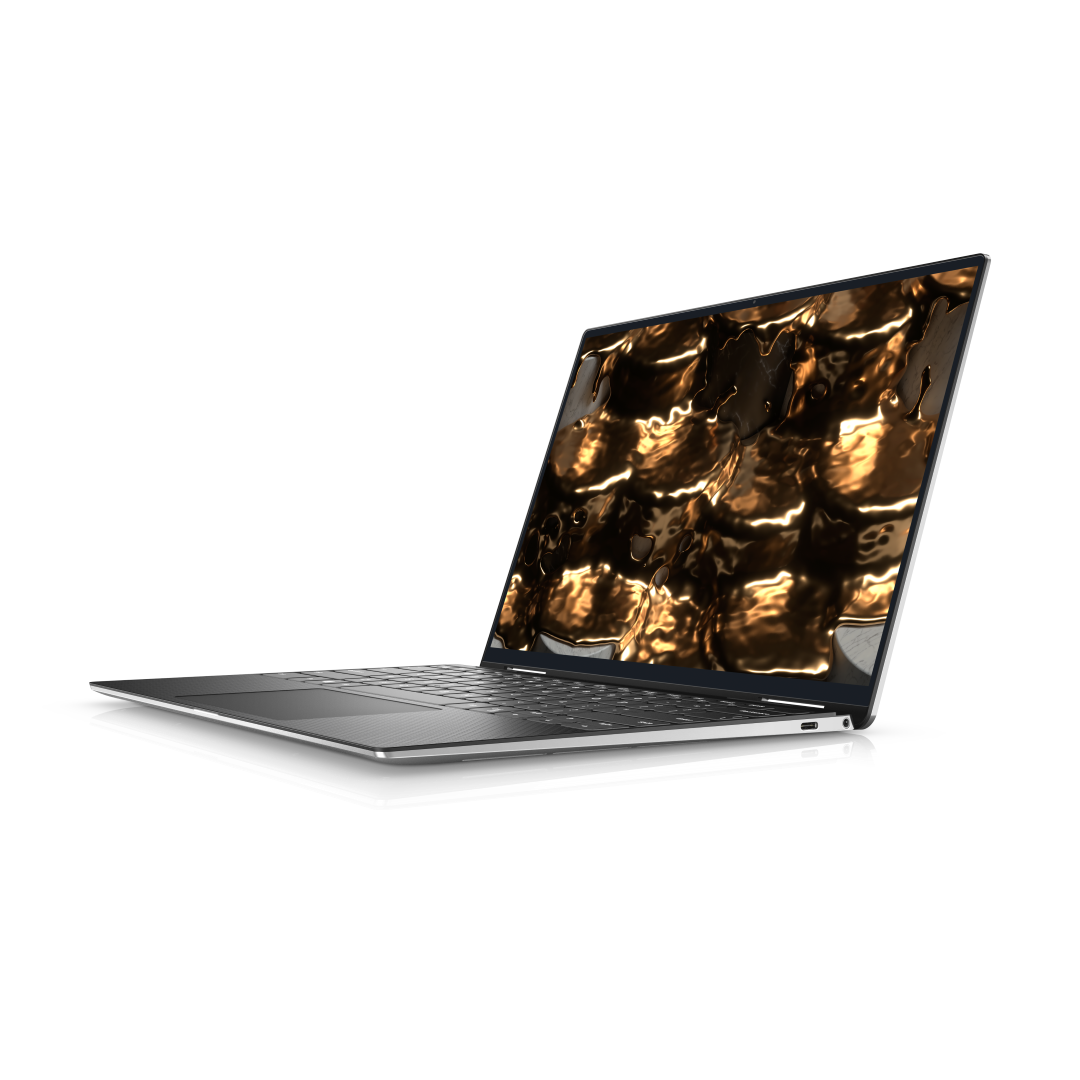
Dell XPS 13 9310 2-in-1 Review: Better than the XPS 13 7390 2-in-1 in one specific way
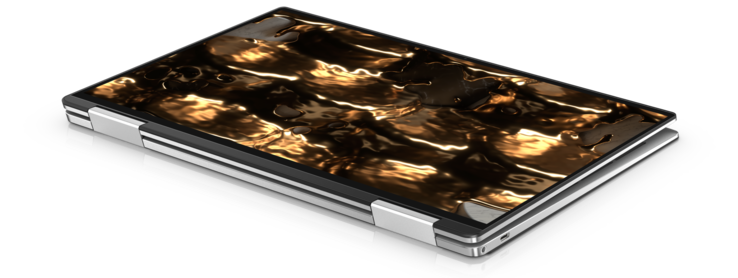
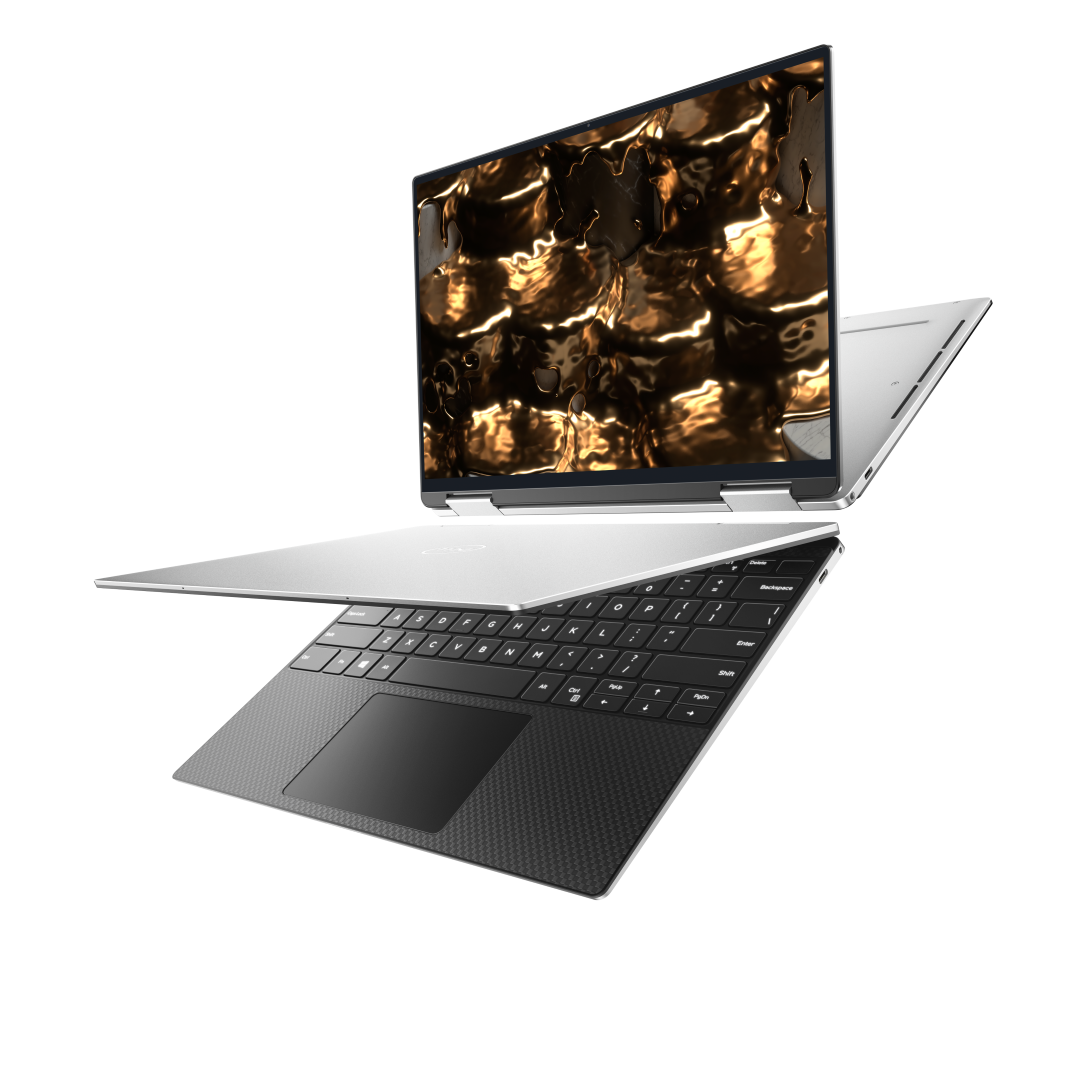
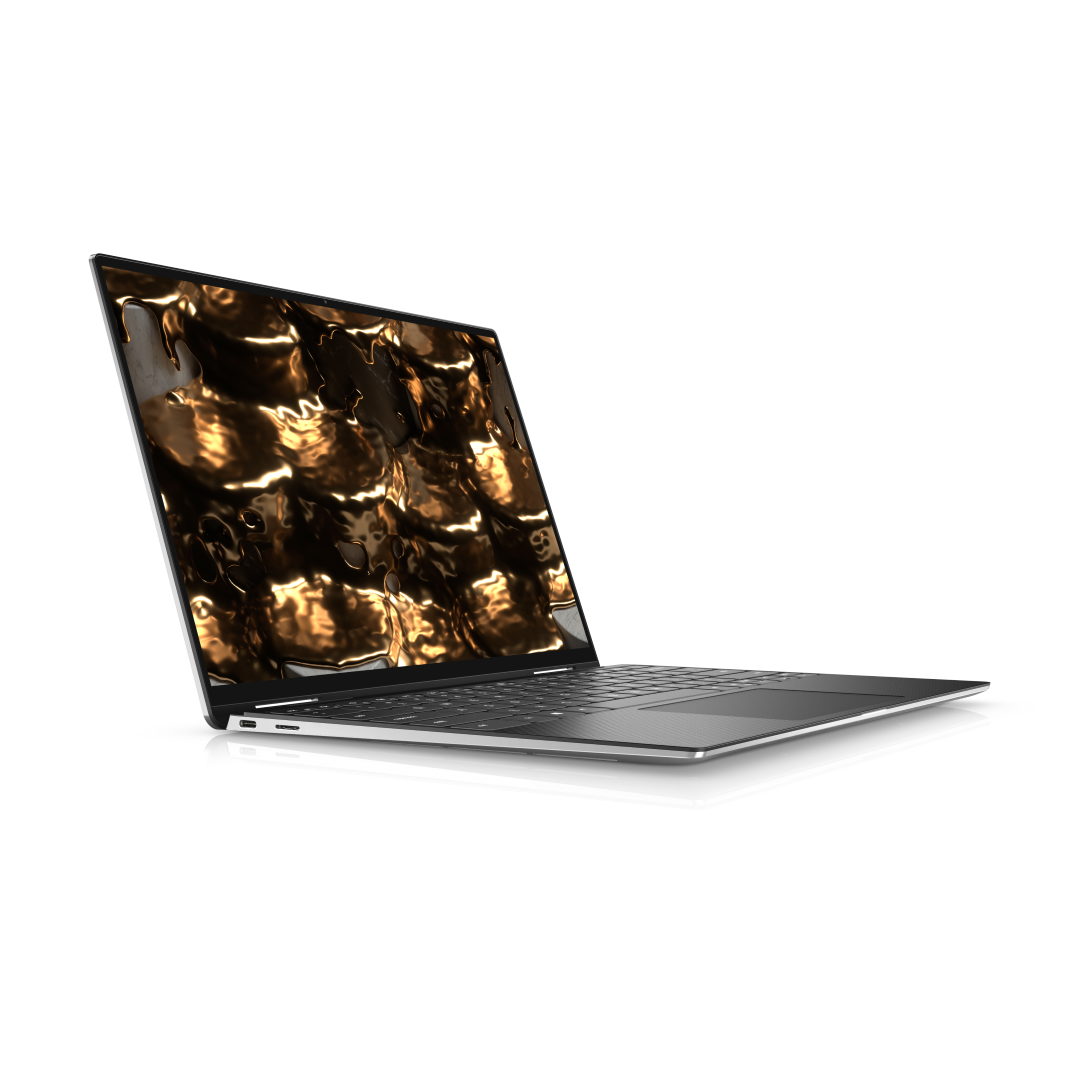
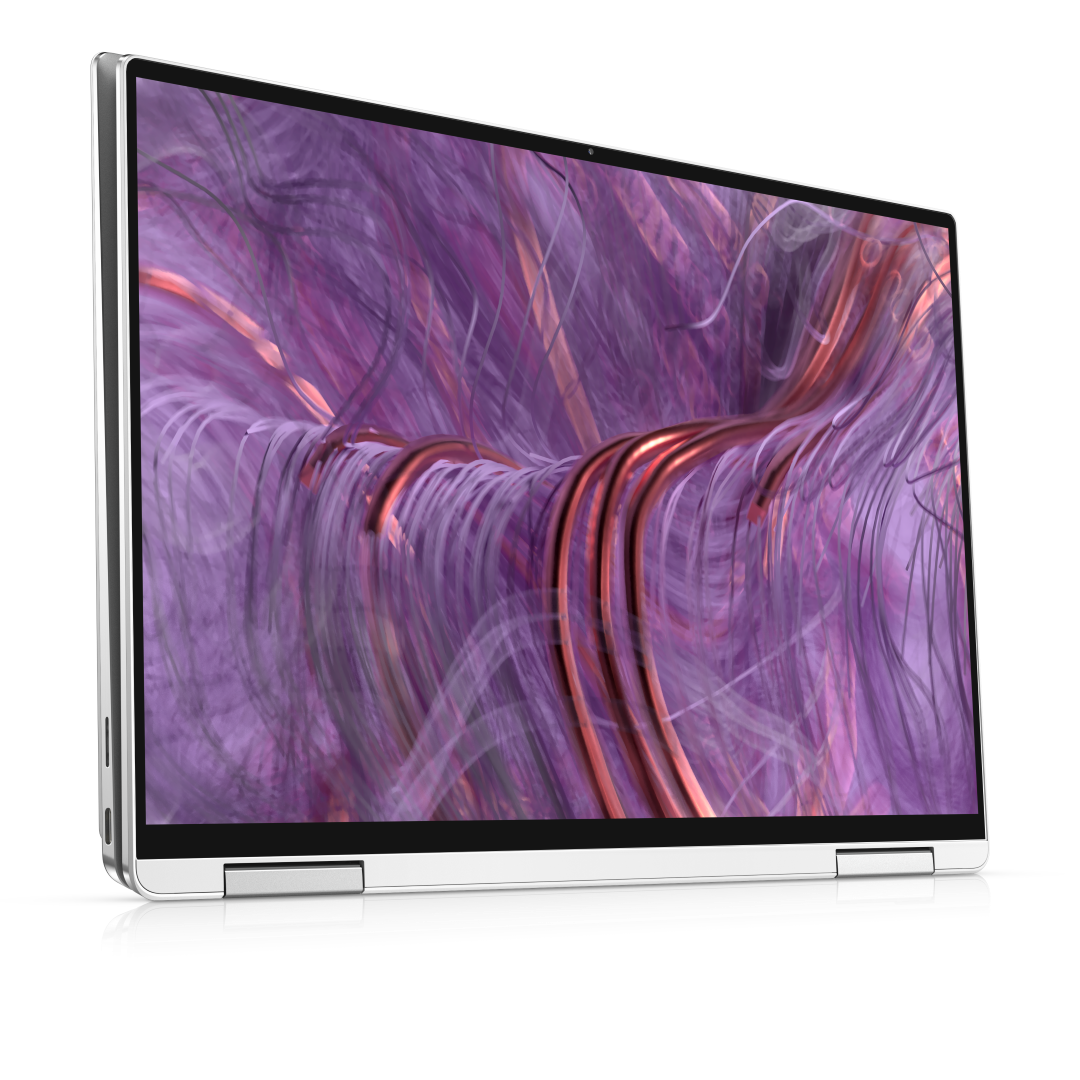
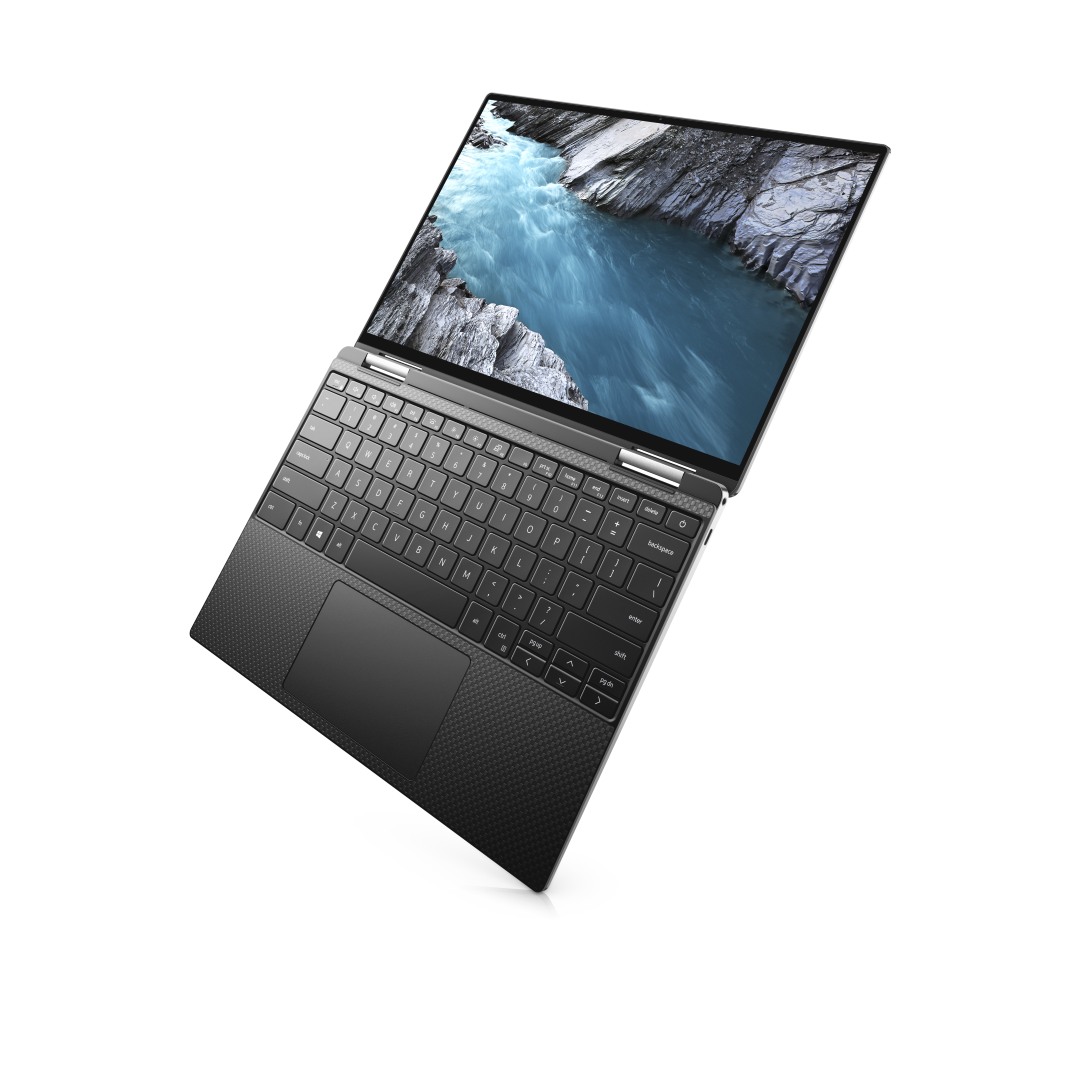
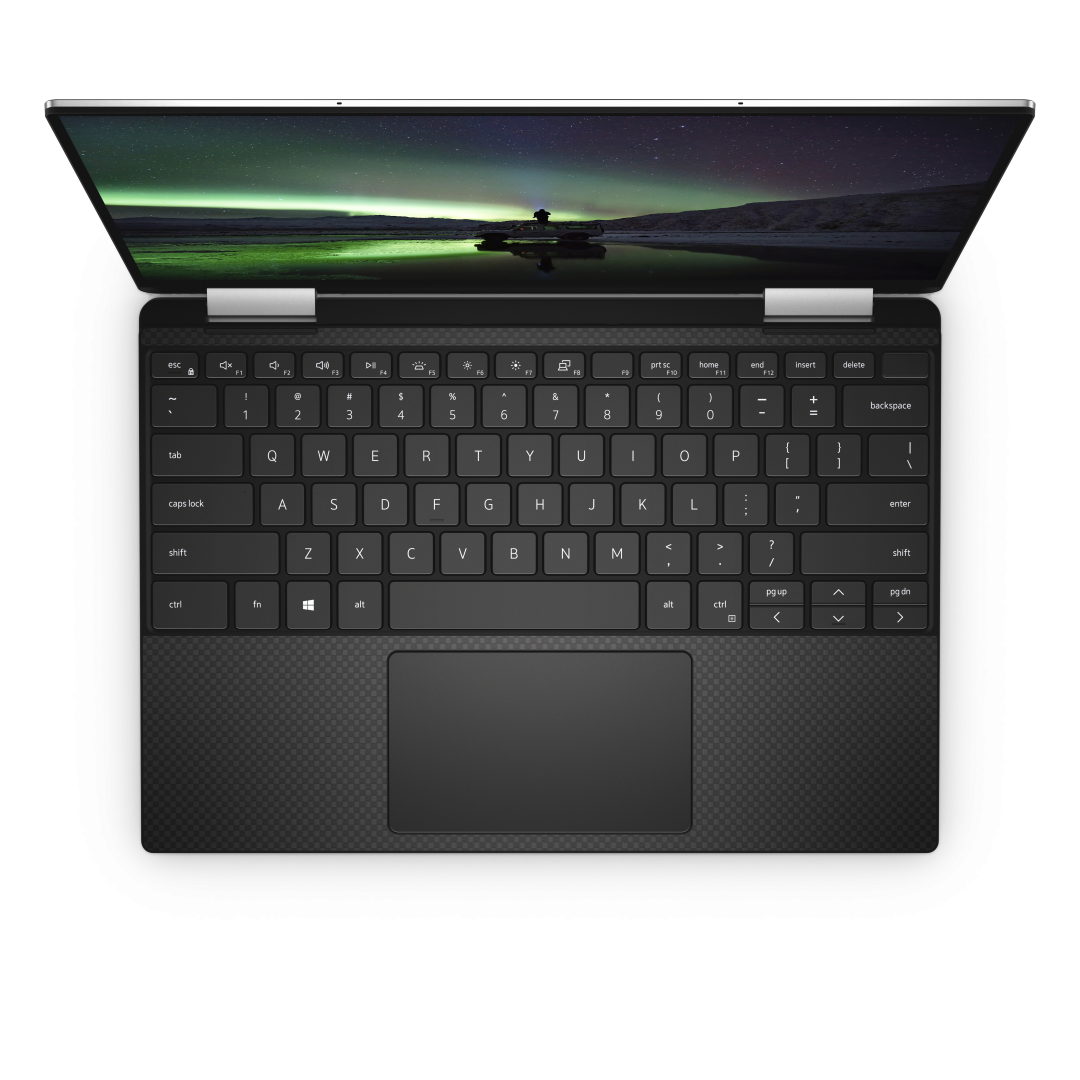
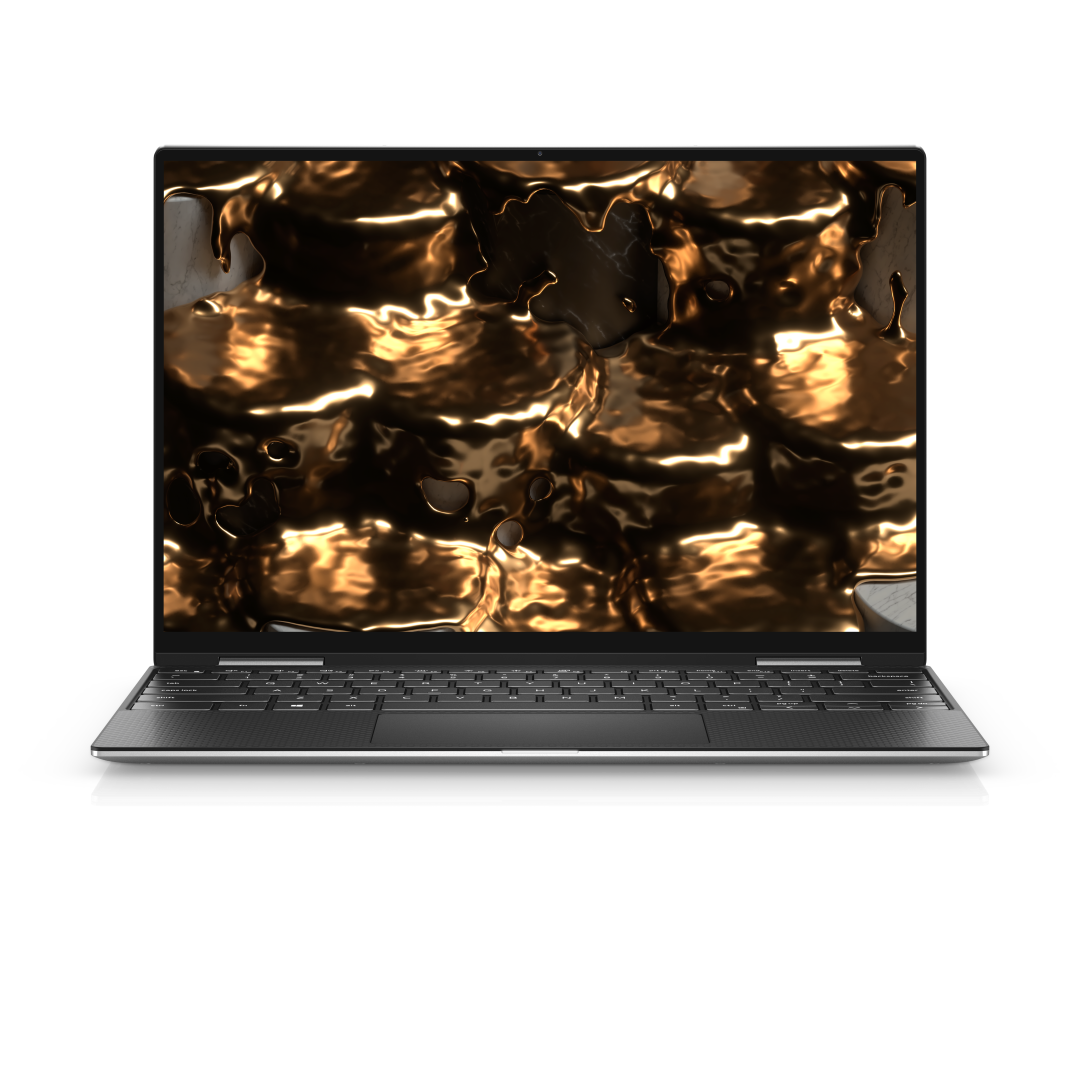
The Dell XPS 13 9310 2-in-1 shares the same chassis as the 2019 XPS 13 7390 2-in-1 but with newer Tiger Lake-U 11th gen Intel options to replace the older Ice Lake 10th gen options. Thus, key features on the 7390 2-in-1 all remain untouched on the 9310 2-in-1 including the MagLev keyboard keys, vapor chamber cooler, 13.4-inch 16:10 touchscreen, and properly positioned webcam.
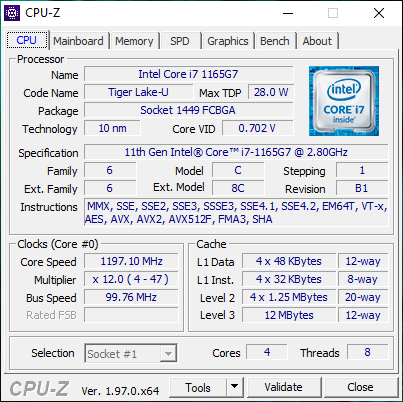
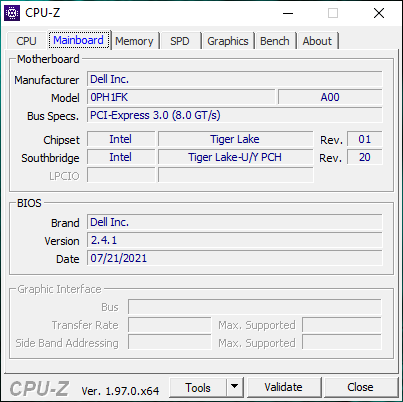
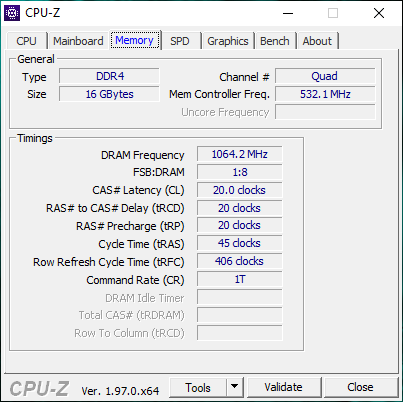
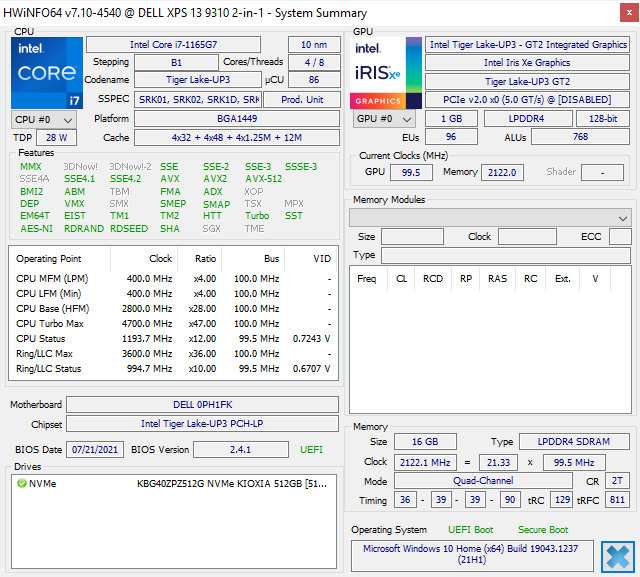
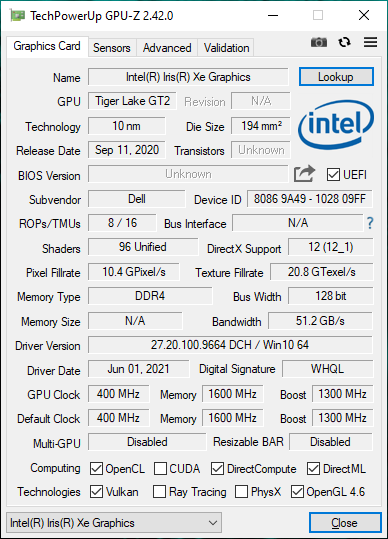
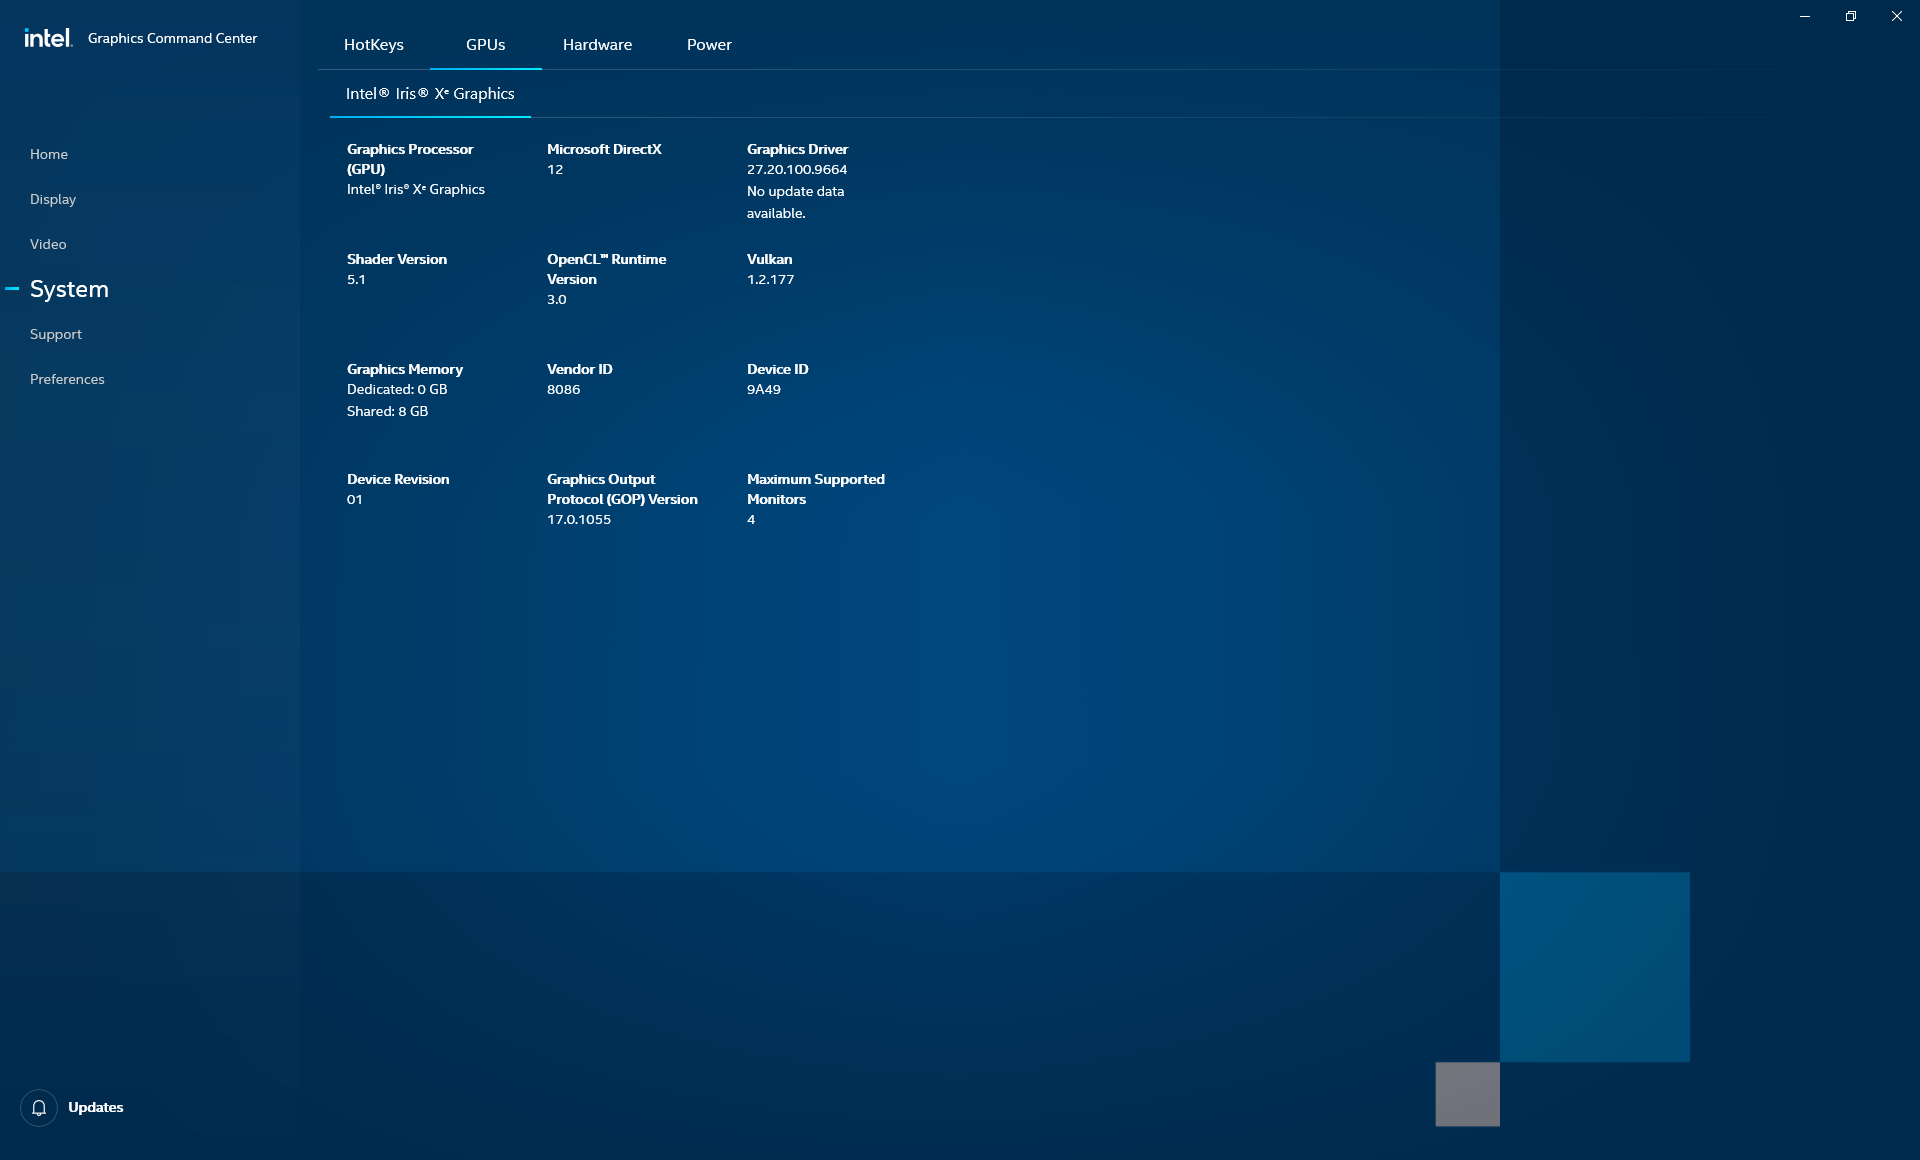
Our test unit has been configured with the Core i7-1165G7 CPU, 16 GB LPDDR4x 4267 MHz RAM, and 1920 x 1200 touchscreen for approximately $1600 USD. Other options include a Core i5-1135G7 CPU with half the RAM or higher-resolution 3840 x 2400 display. No OLED options are available unlike on the XPS 13 9310 clamshell.
We recommend checking out our existing review on the XPS 13 7390 2-in-1 to learn more about the physical features of the chassis as all our comments also apply for the 9310 2-in-1. This review will focus on the performance of the XPS 13 9310 2-in-1 and what users can expect to gain over the older but visually identical 7390 2-in-1.
Competitors in this space include other 13-inch subnotebook convertibles like the Lenovo Yoga 6 13, Asus ZenBook Flip 13, Samsung Galaxy Book Pro 360 13, or MSI Summit E13 Flip. A clamshell version of the XPS 13 9310 2-in-1 is also available simply called the XPS 13 9310.
More Dell reviews:
potential competitors in comparison
Rating | Date | Model | Weight | Height | Size | Resolution | Price |
|---|---|---|---|---|---|---|---|
| 86.7 % v7 (old) | 10 / 2021 | Dell XPS 13 9310 2-in-1 i7-1165G7, Iris Xe G7 96EUs | 1.3 kg | 14.35 mm | 13.40" | 1920x1200 | |
| 88.1 % v7 (old) | 10 / 2020 | Dell XPS 13 9310 Core i7 FHD i7-1165G7, Iris Xe G7 96EUs | 1.3 kg | 14.8 mm | 13.40" | 1920x1200 | |
| 86.3 % v7 (old) | 10 / 2019 | Dell XPS 13 7390 2-in-1 Core i7 i7-1065G7, Iris Plus Graphics G7 (Ice Lake 64 EU) | 1.3 kg | 13 mm | 13.40" | 1920x1200 | |
| 84.7 % v7 (old) | 07 / 2021 | Lenovo Yoga 6 13 82ND0009US R5 5500U, Vega 7 | 1.3 kg | 18.2 mm | 13.30" | 1920x1080 | |
| 86.3 % v7 (old) | 07 / 2021 | Asus ZenBook Flip 13 UX363EA-HP069T i7-1165G7, Iris Xe G7 96EUs | 1.2 kg | 13 mm | 13.30" | 1920x1080 | |
| 85.4 % v7 (old) | 06 / 2021 | Samsung Galaxy Book Pro 360 13 i5-1135G7, Iris Xe G7 80EUs | 1.1 kg | 13 mm | 13.20" | 1920x1080 |
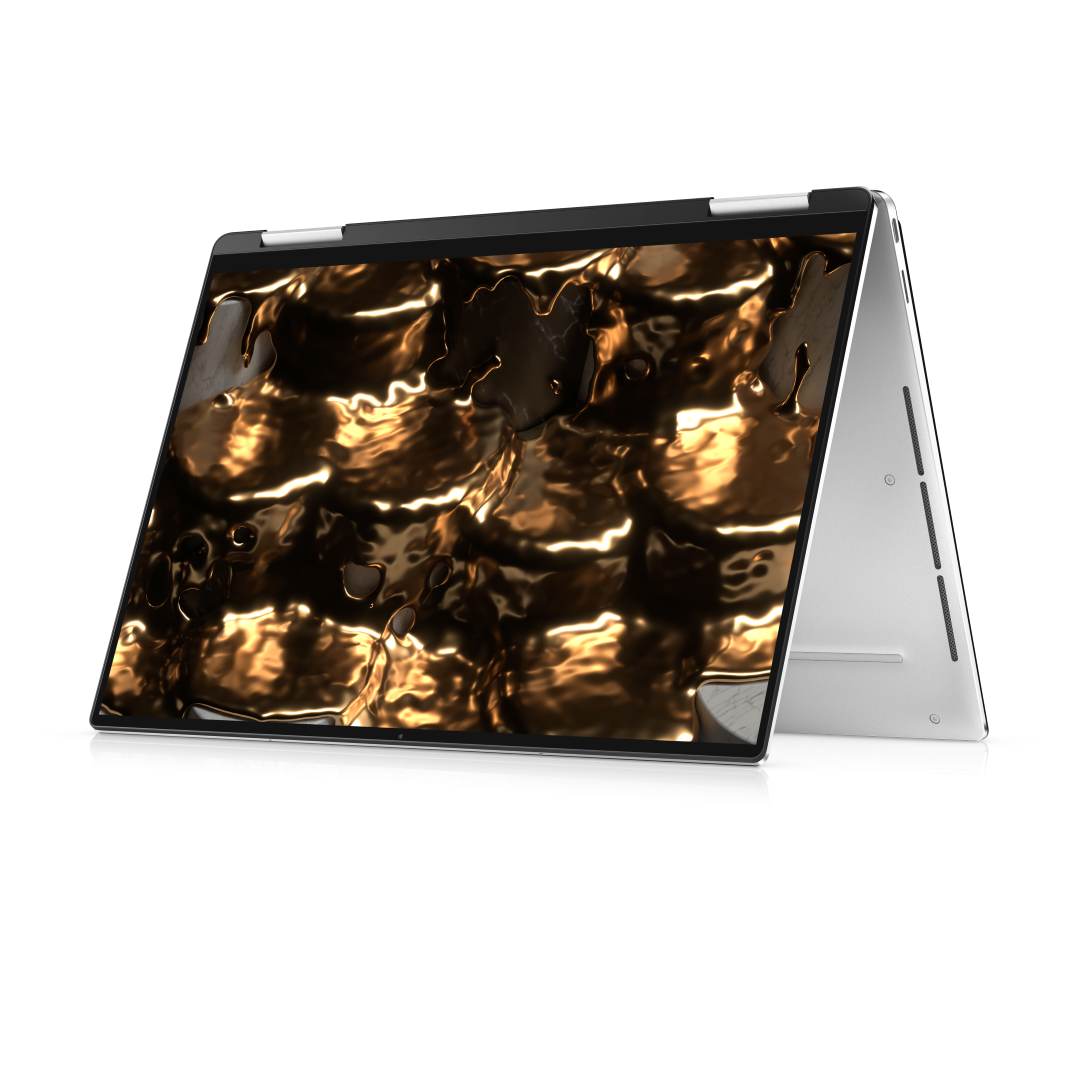
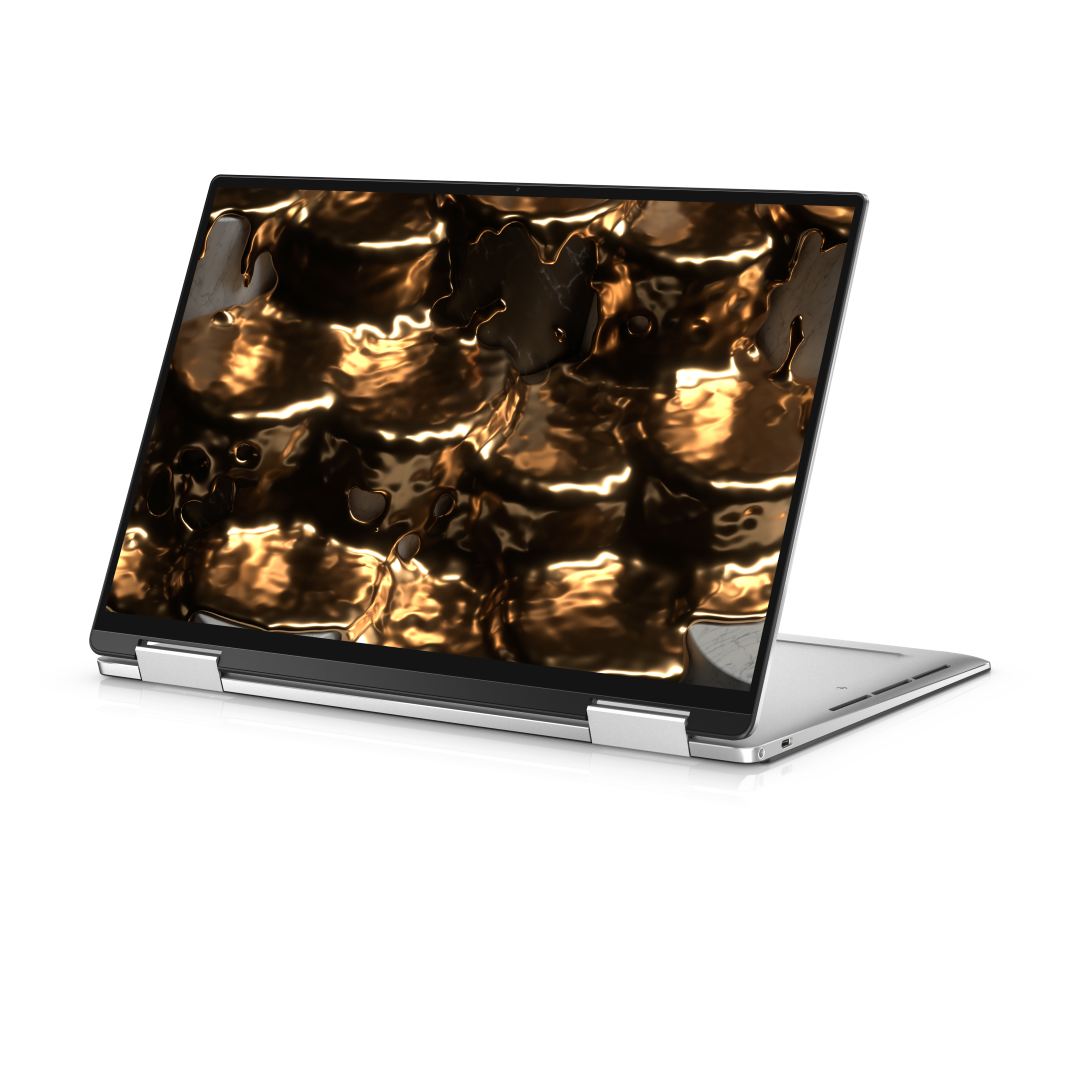
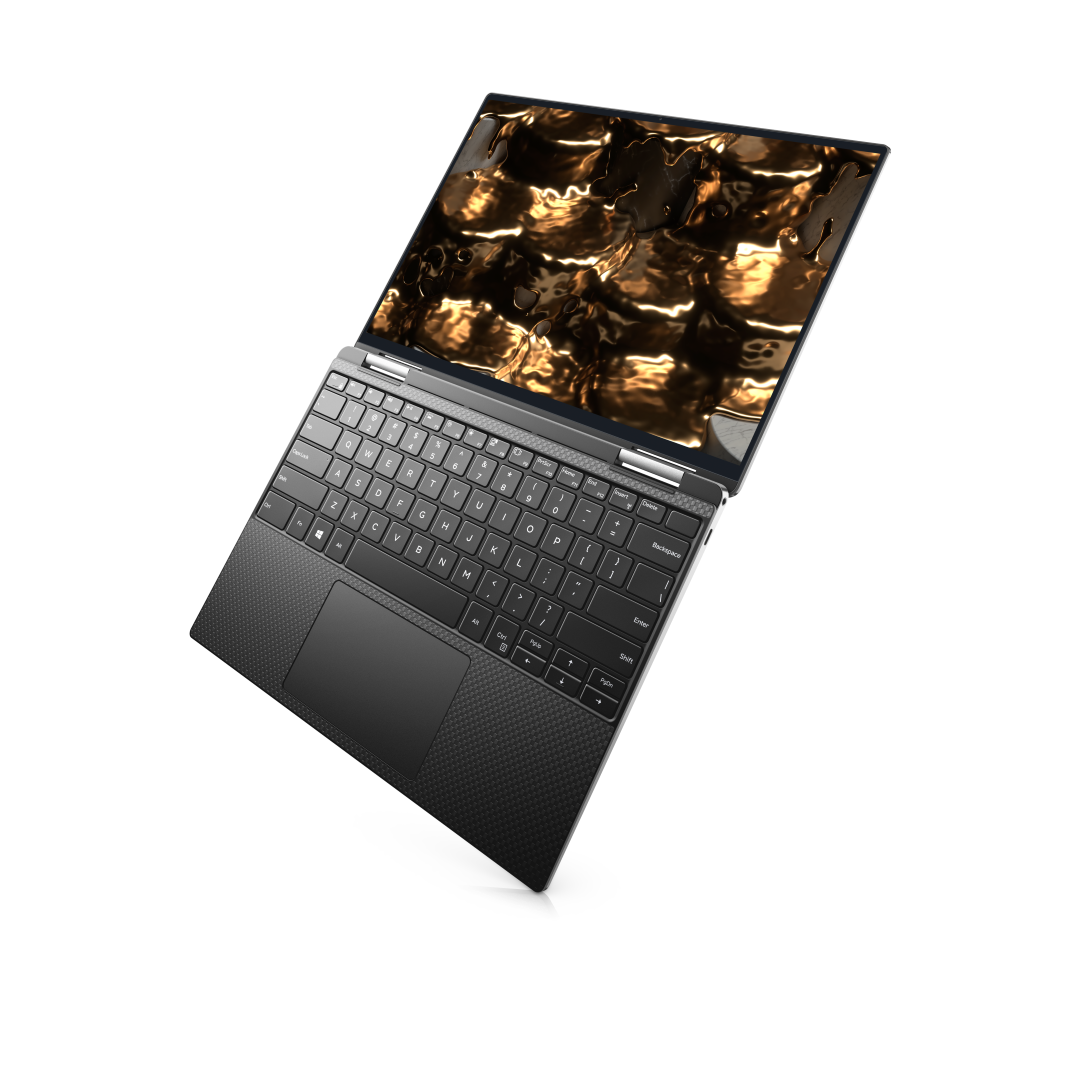
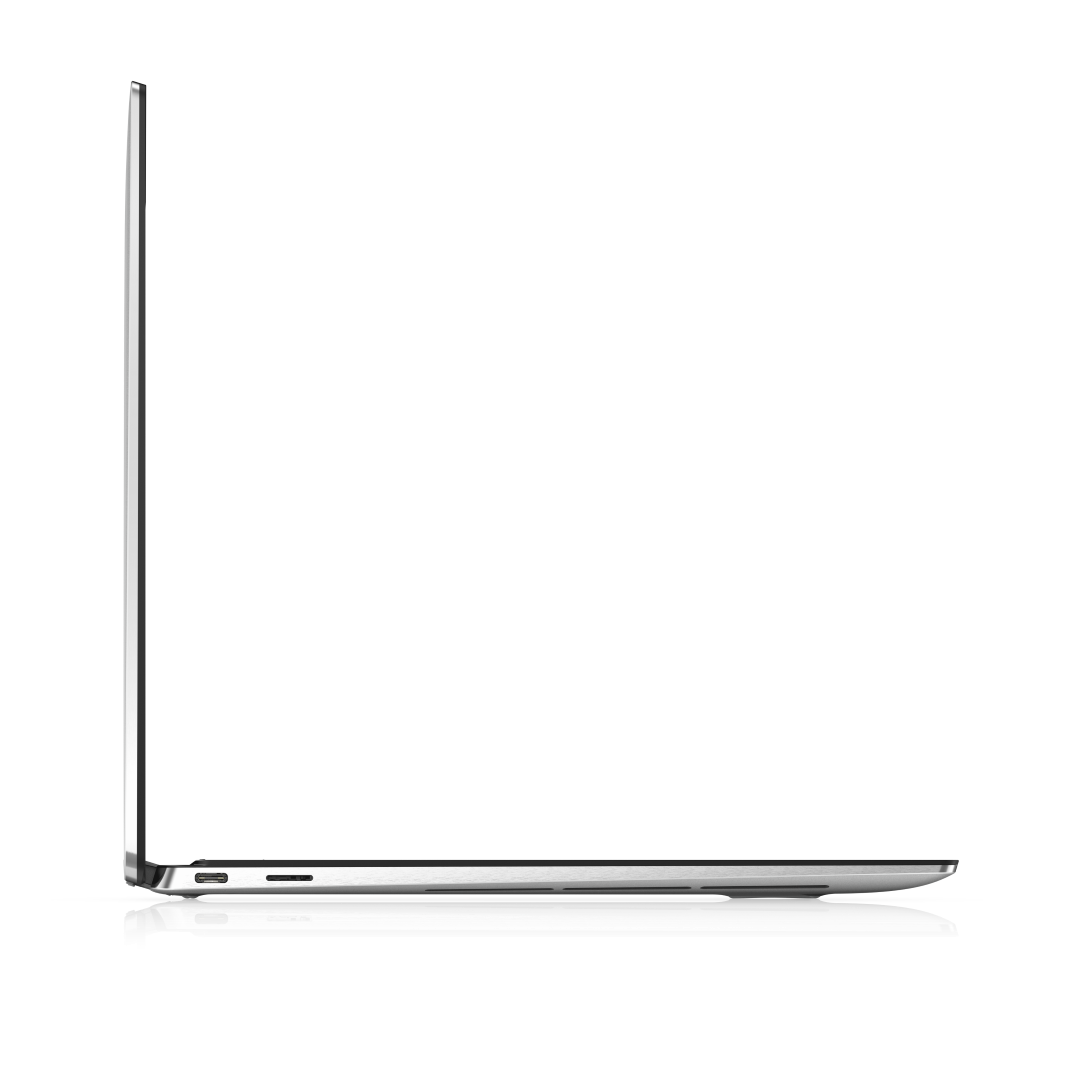
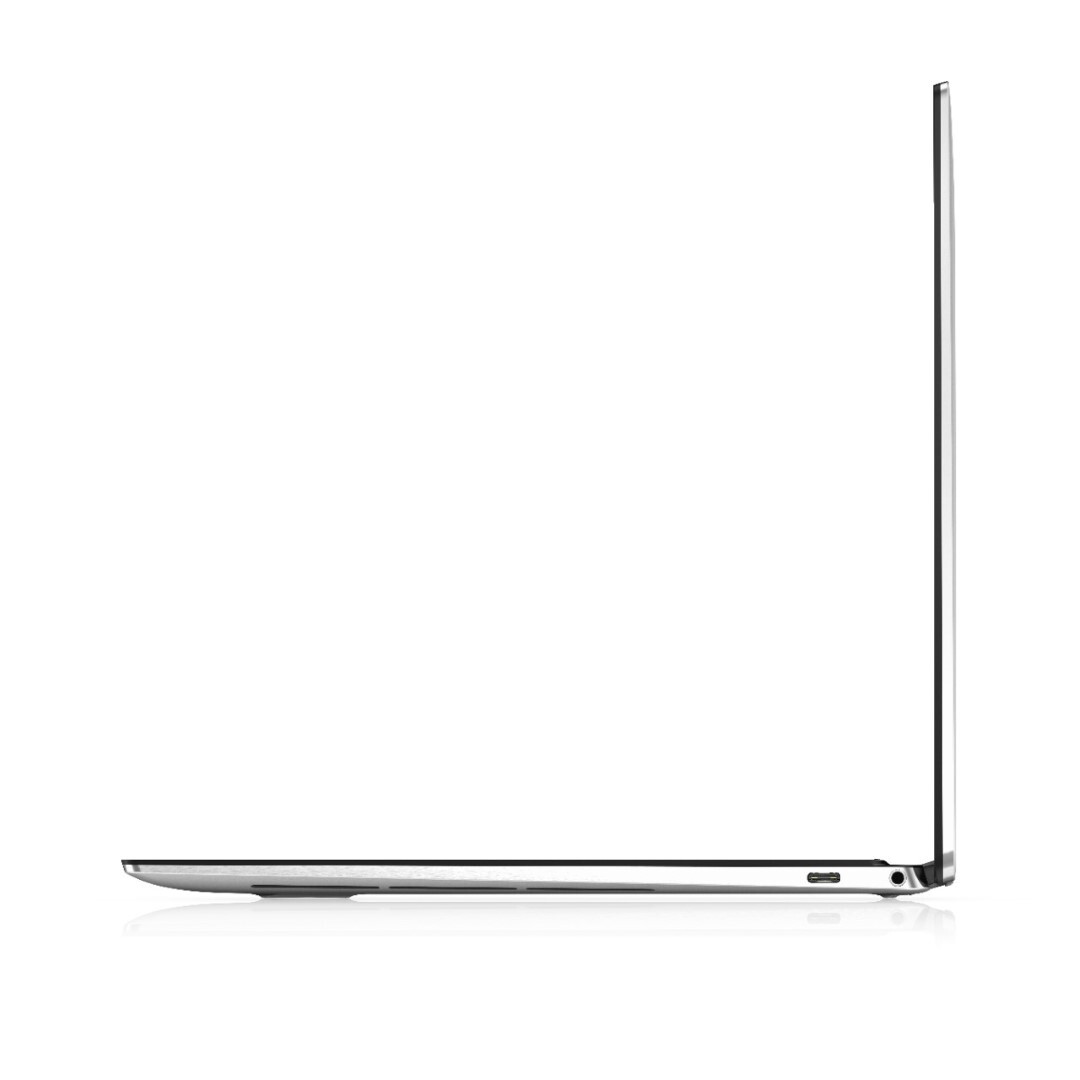
Case — Still the Sleekest Convertible Around
The chassis remains identical to the XPS 13 7390 2-in-1. However, the way Dell measures dimensions have changed since then and so the official measurements are now 14.35 x 297 x 207 mm instead of 13 x 296 x 207 mm on the older 7390 2-in-1.
Connectivity — Now with Thunderbolt 4
The two Thunderbolt 3 ports on the previous generation model have been updated to Thunderbolt 4. This won't make a difference for most users save for those who intend to connect external graphics.
SD Card Reader
| SD Card Reader | |
| average JPG Copy Test (av. of 3 runs) | |
| Dell XPS 13 9310 Core i7 FHD (Toshiba Exceria Pro M501 64 GB UHS-II) | |
| Dell XPS 13 9310 2-in-1 (AV Pro V60) | |
| Dell XPS 13 7390 2-in-1 Core i7 (Toshiba Exceria Pro M501 64 GB UHS-II) | |
| Samsung Galaxy Book Pro 360 13 | |
| maximum AS SSD Seq Read Test (1GB) | |
| Dell XPS 13 9310 Core i7 FHD (Toshiba Exceria Pro M501 64 GB UHS-II) | |
| Dell XPS 13 9310 2-in-1 (AV Pro V60) | |
| Dell XPS 13 7390 2-in-1 Core i7 (Toshiba Exceria Pro M501 64 GB UHS-II) | |
| Samsung Galaxy Book Pro 360 13 | |
Communication
Webcam
The low resolution 720p webcam remains unchanged which is a real bummer. The latest Razer Blade laptop upgraded its webcam from 720p to 1080p without any other changes to the chassis and so it would have been great to see something similar on this XPS 13 refresh.


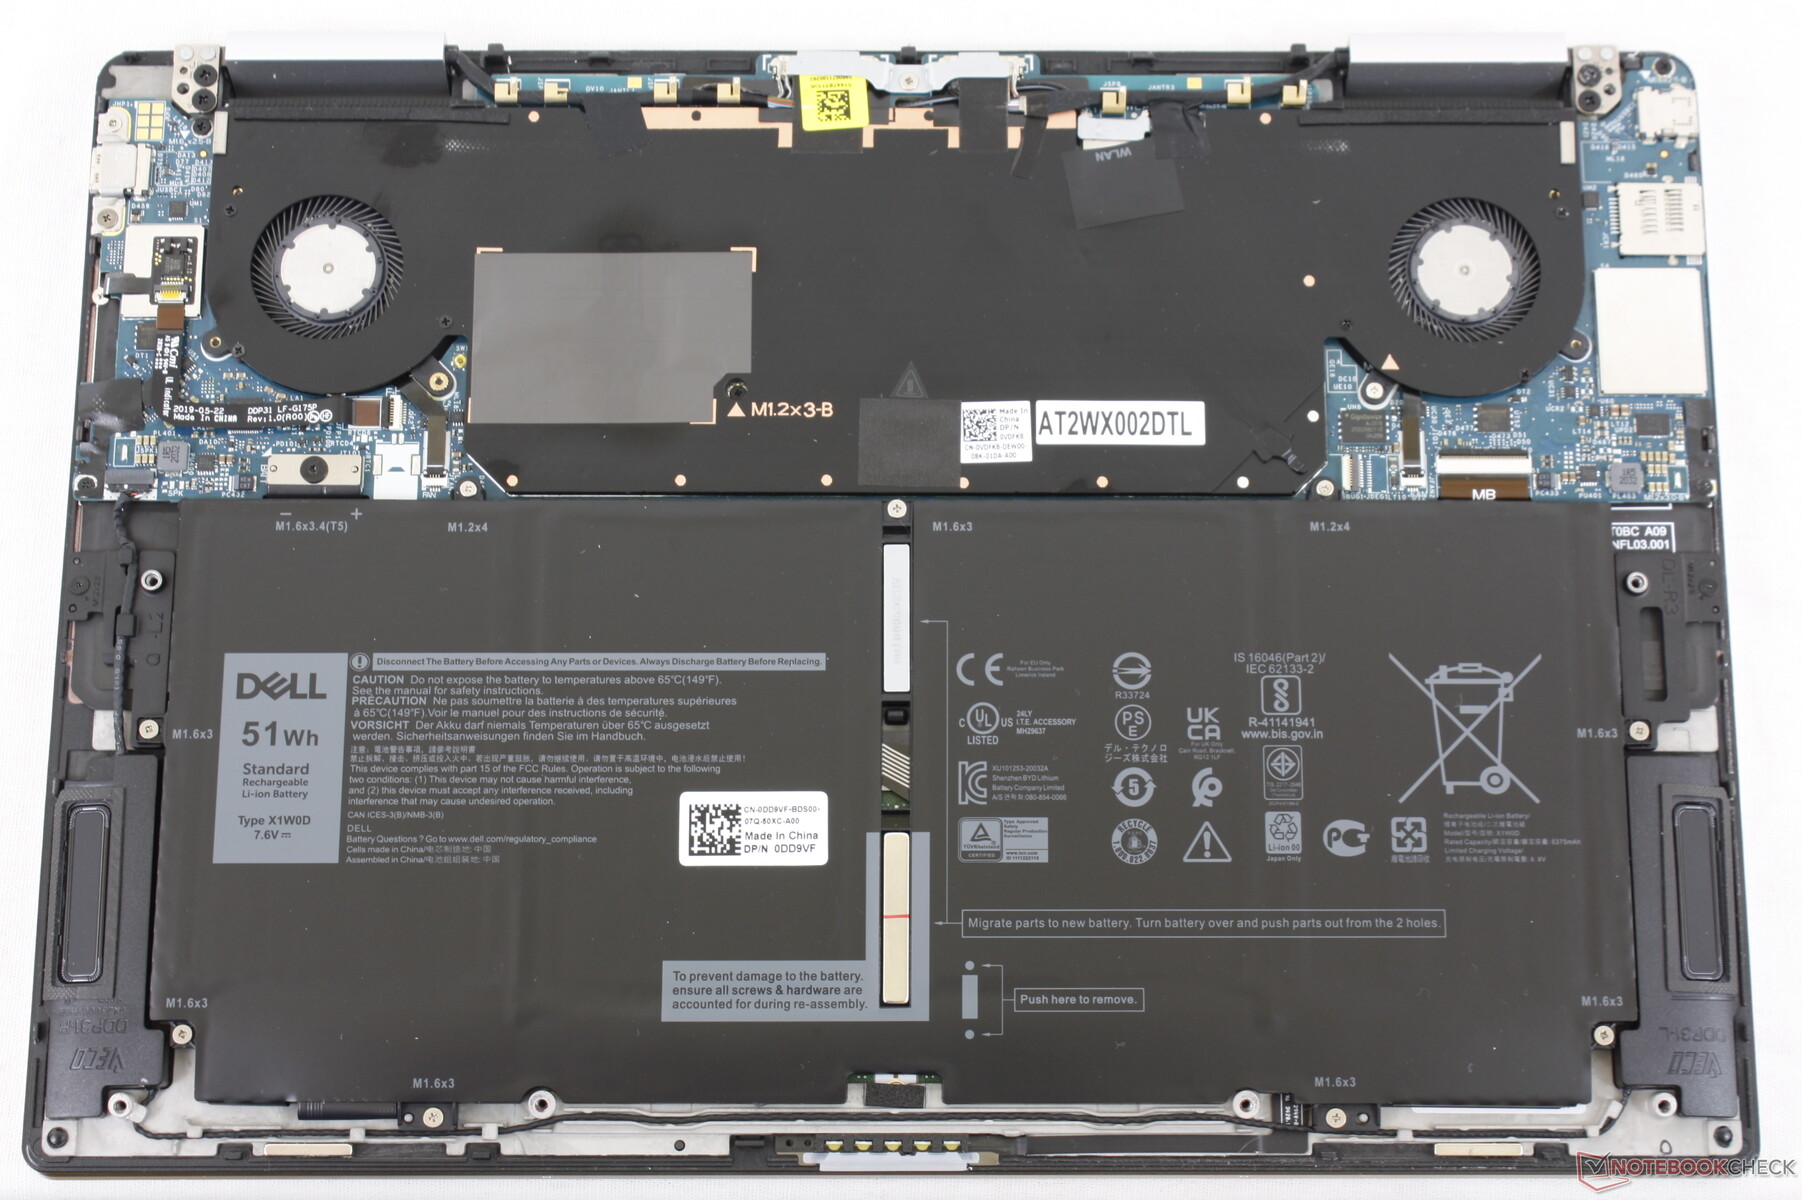
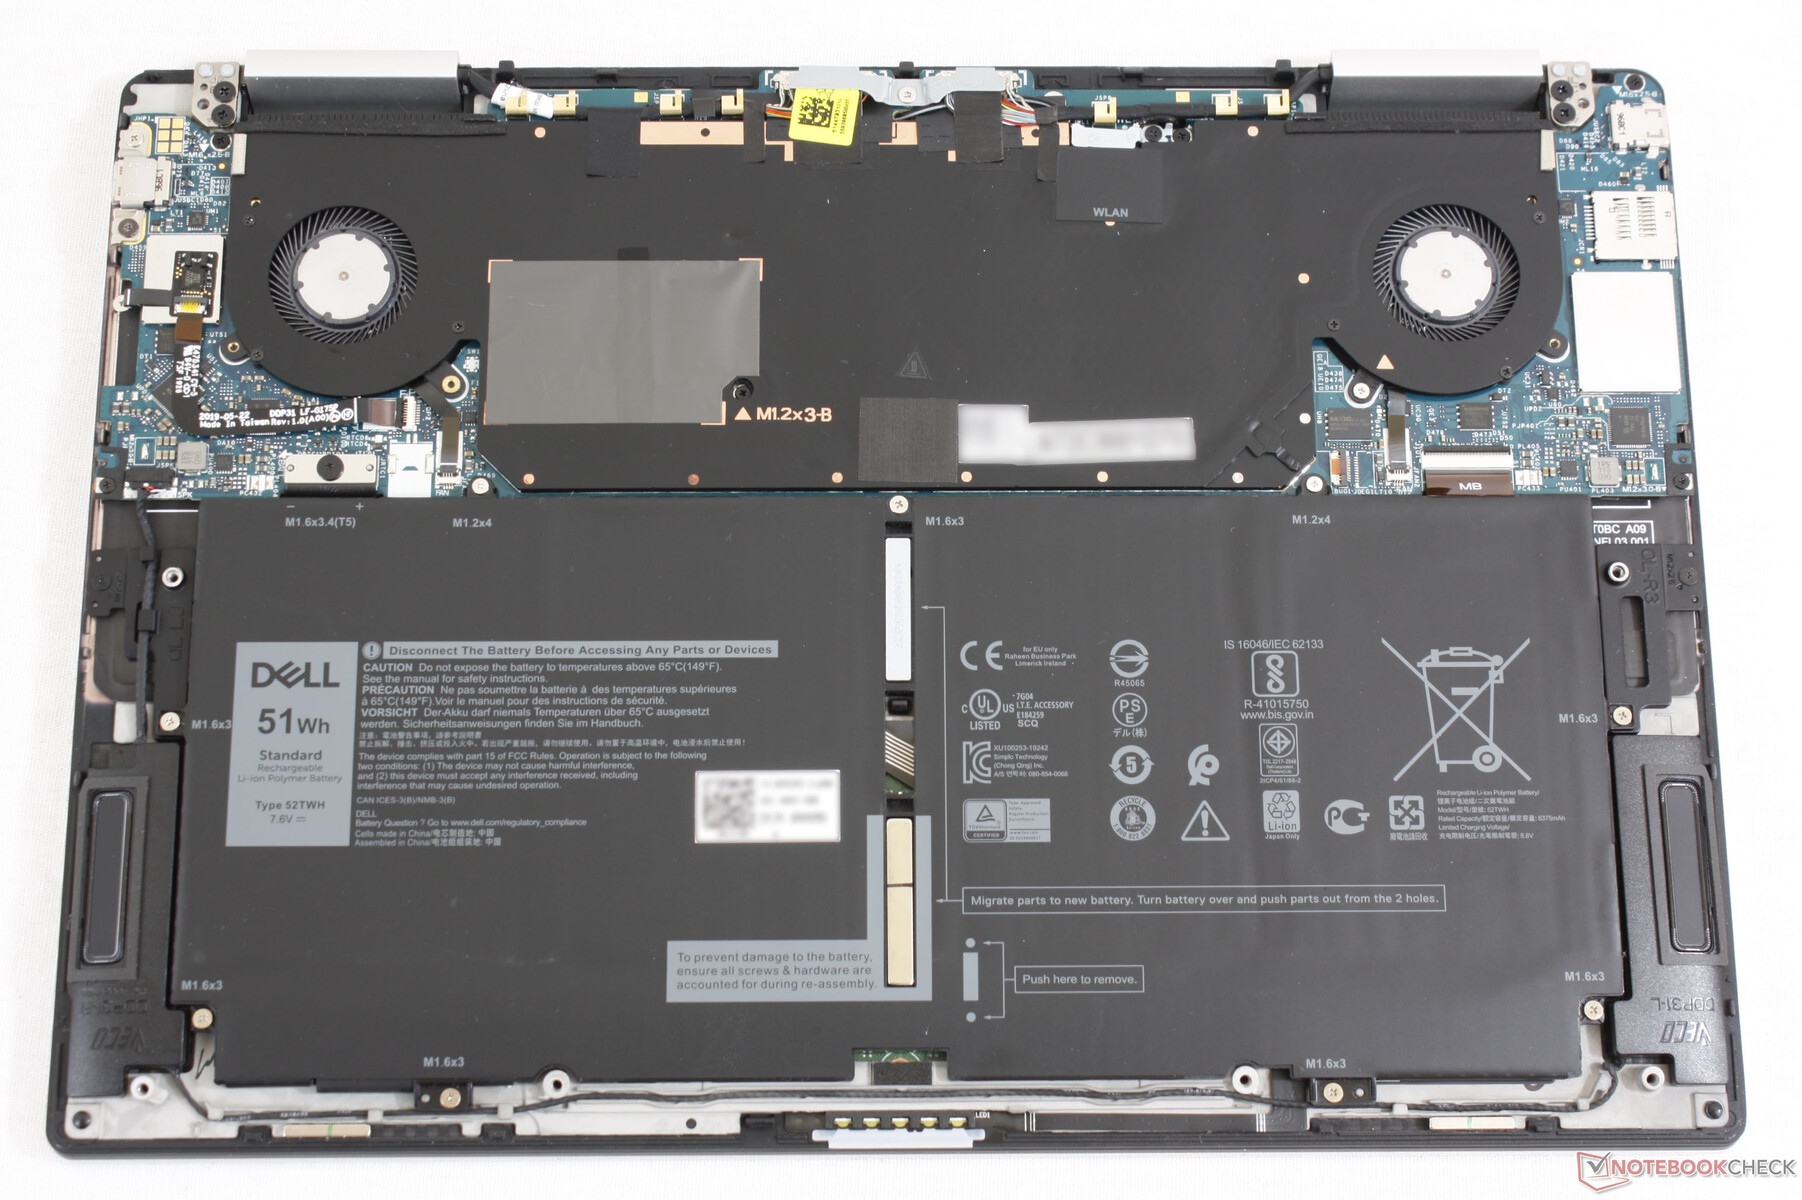
Maintenance
Accessories and Warranty
Extras include a USB-C to USB-A adapter since the system integrates no full-size USB-A ports. The packaging is also made completely from recycled materials and 25 percent ocean-bound plastics which are nice environmentally friendly touches.
The standard one-year limited warranty applies with many extension options if purchased directly from Dell.
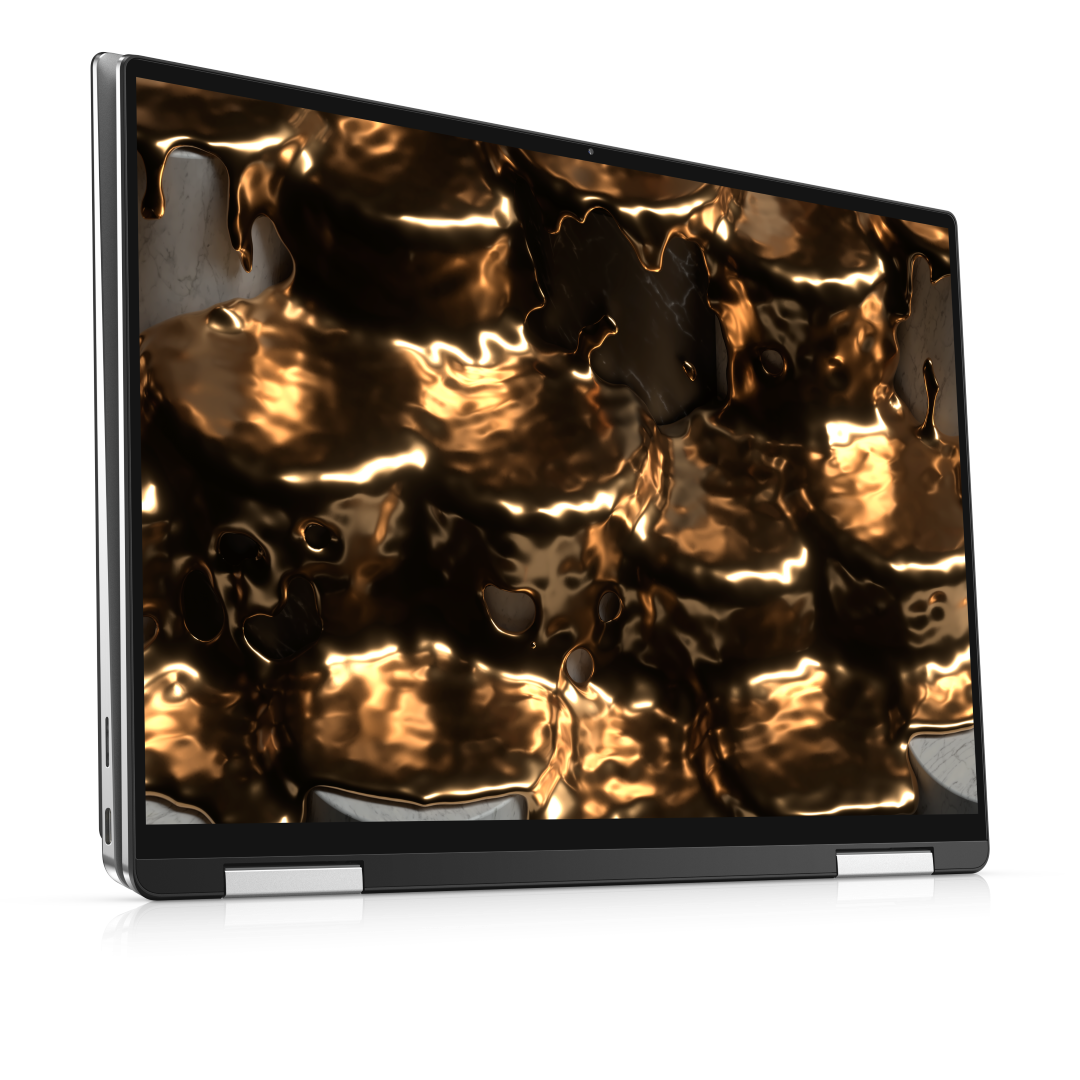
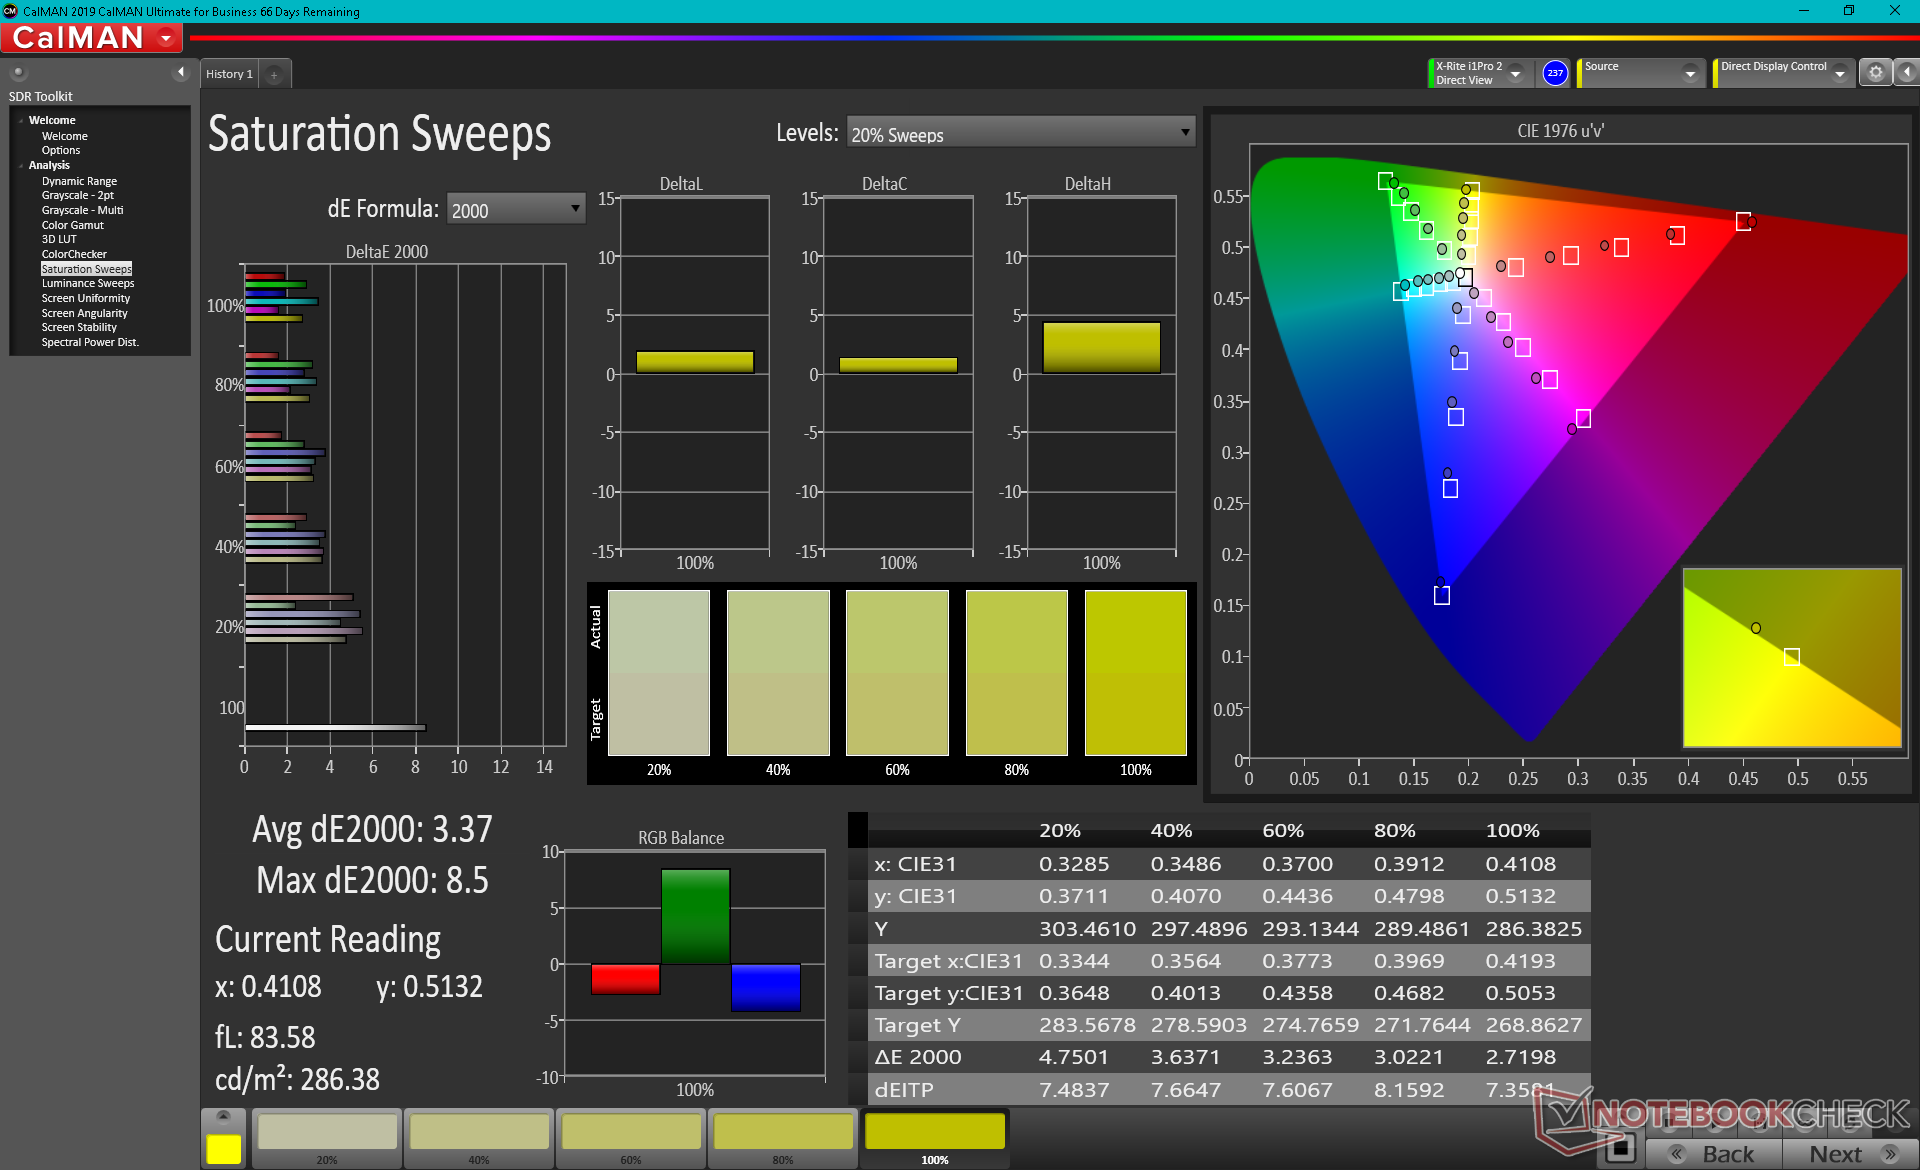
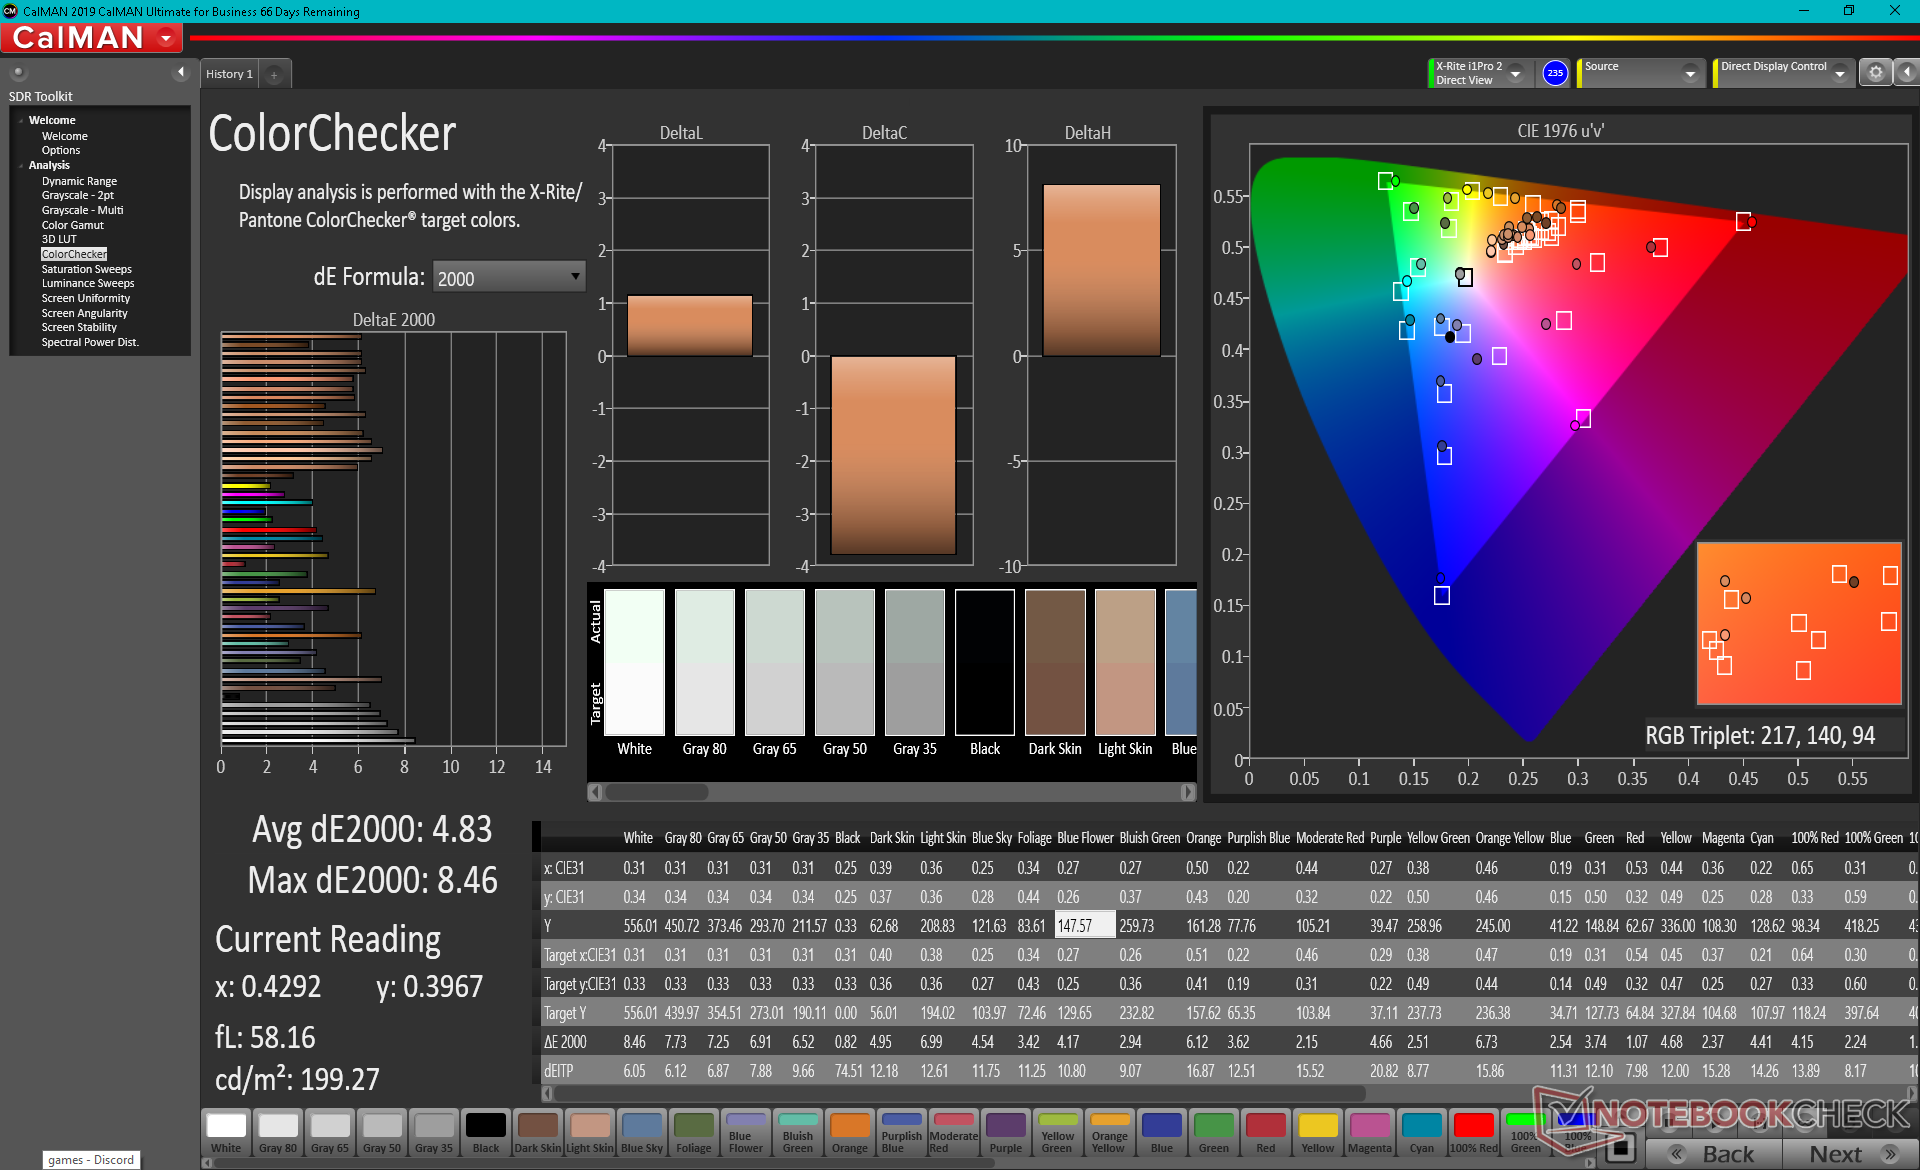
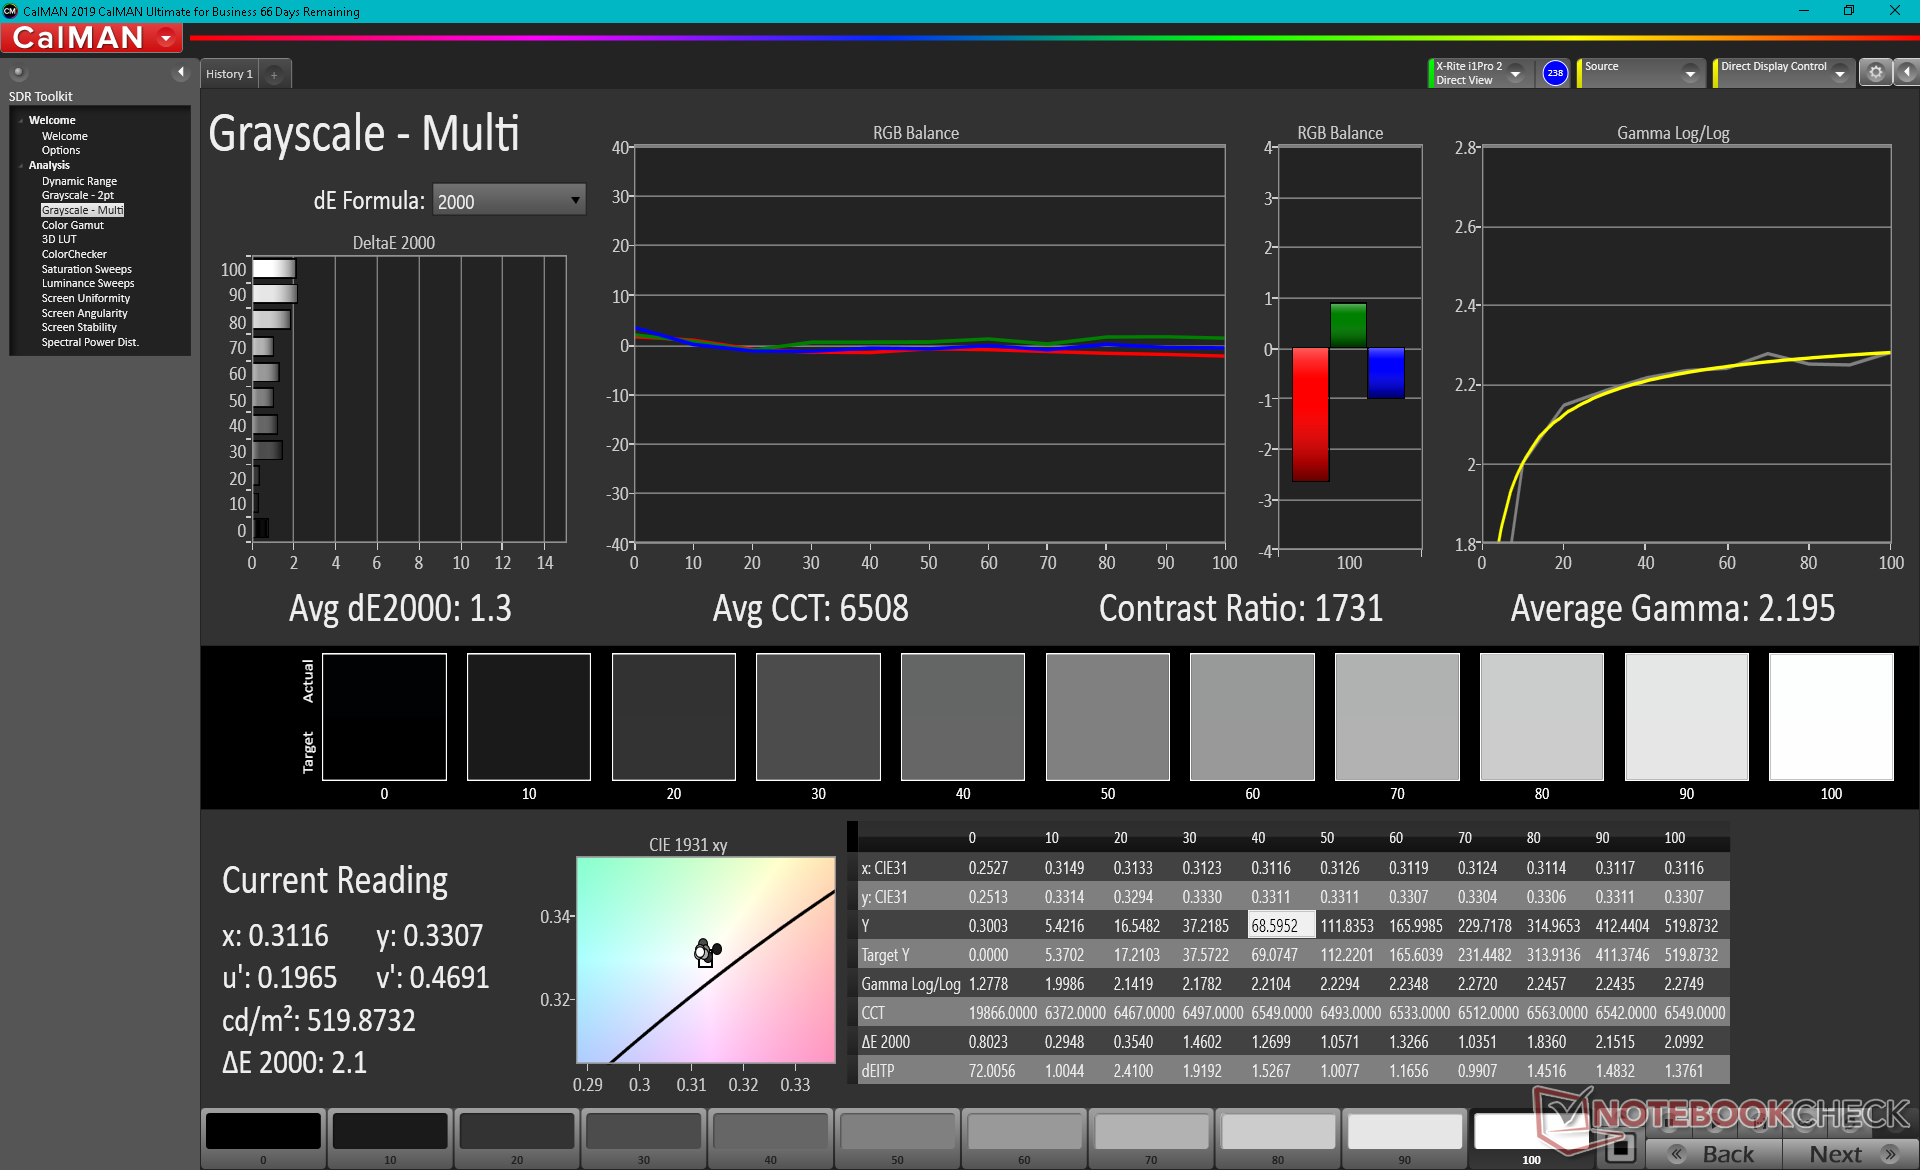
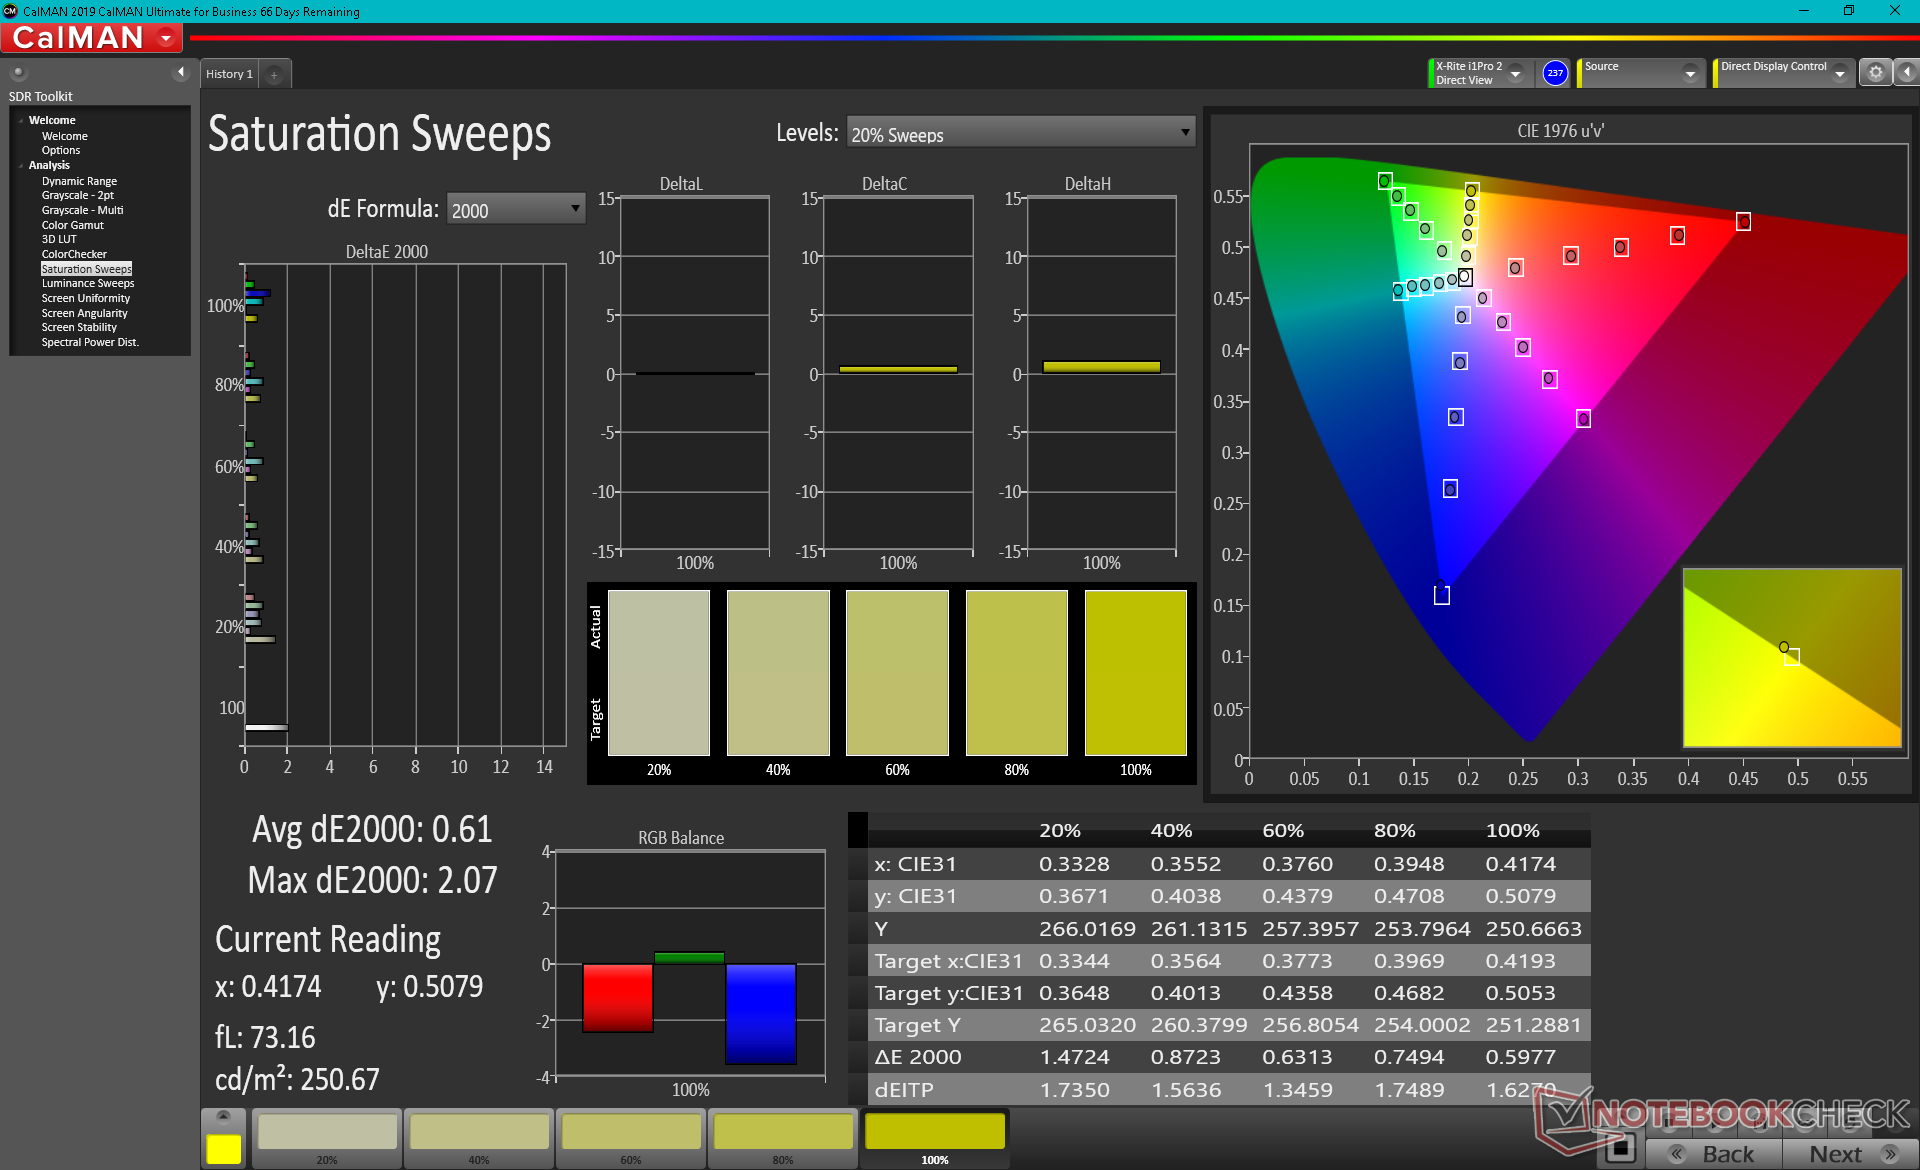
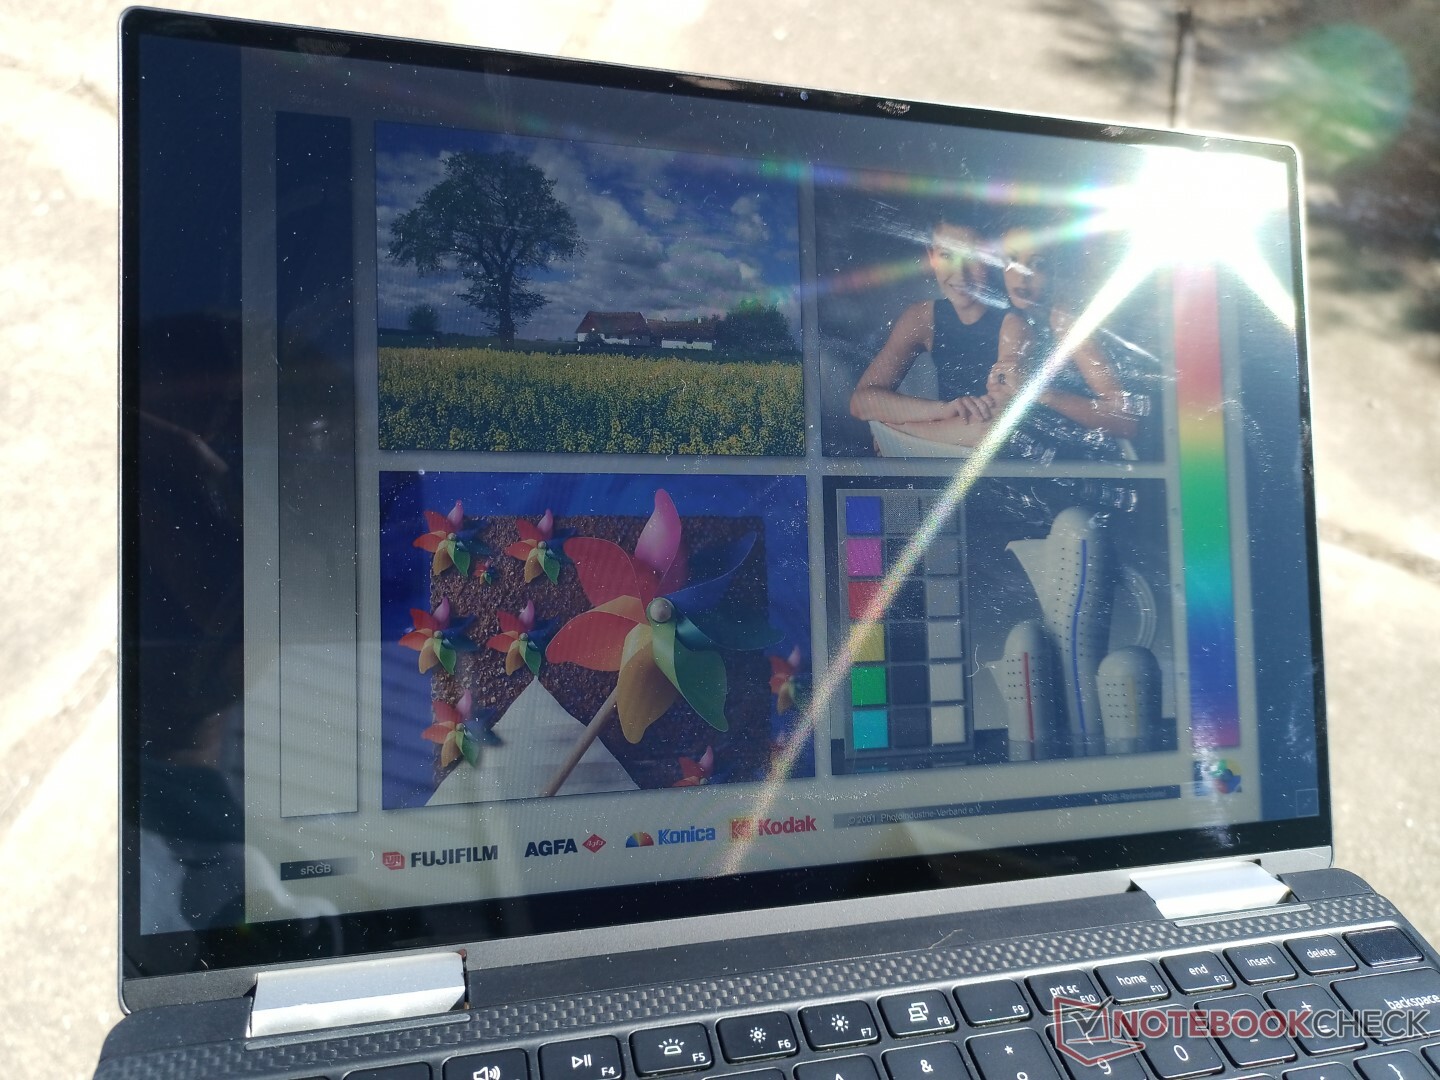
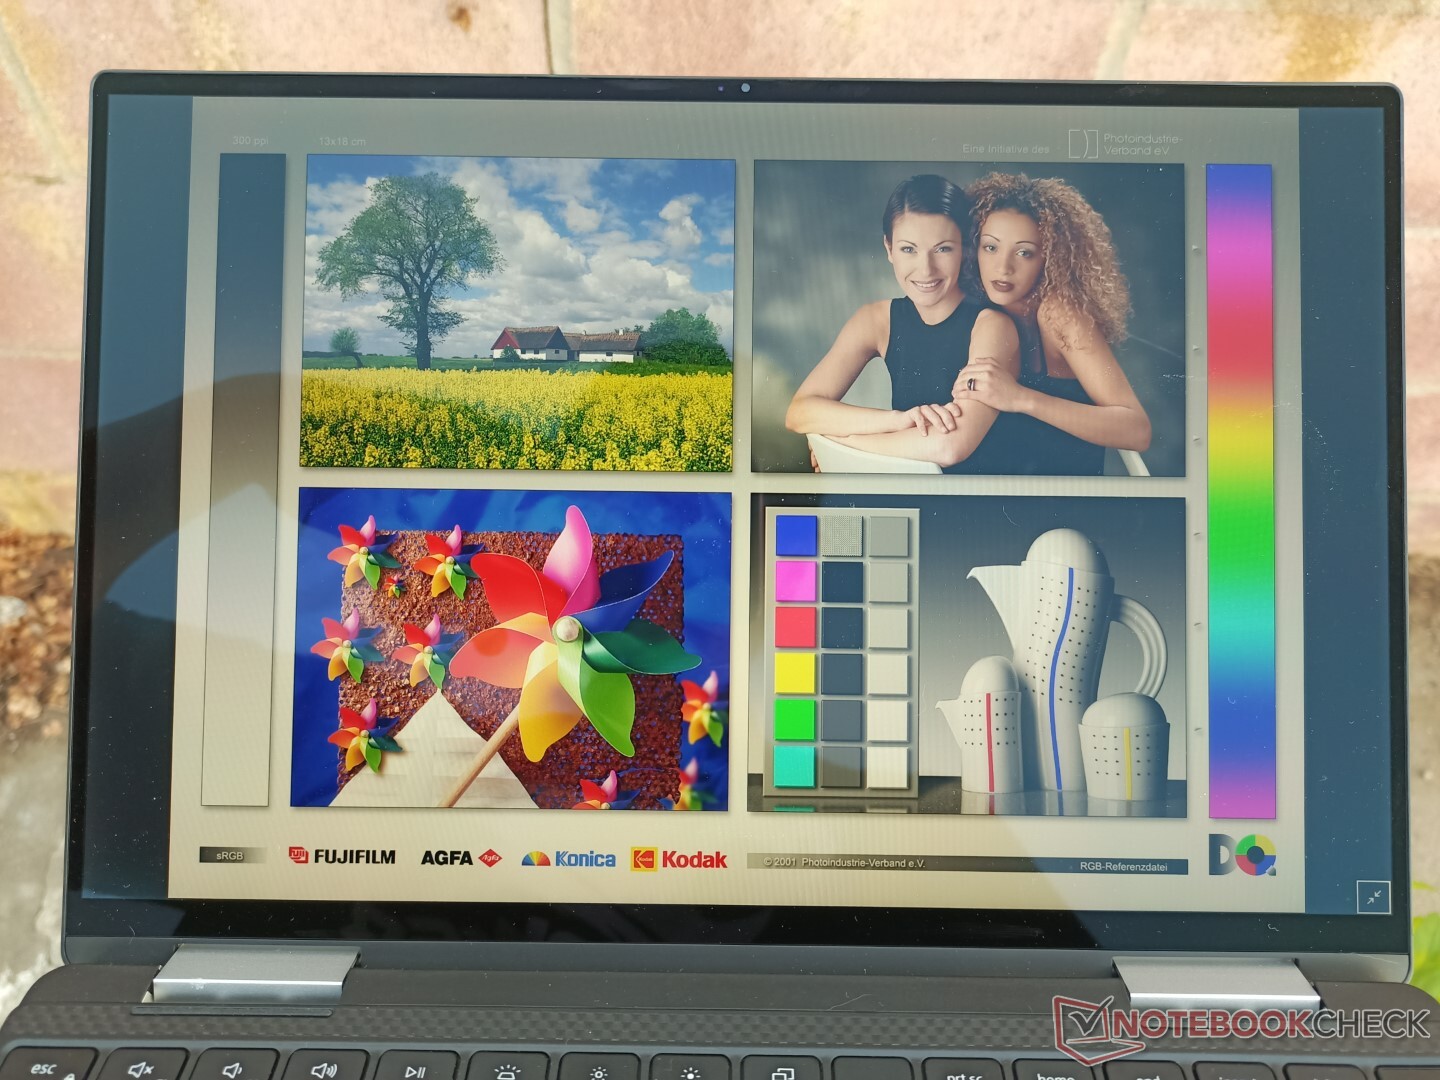
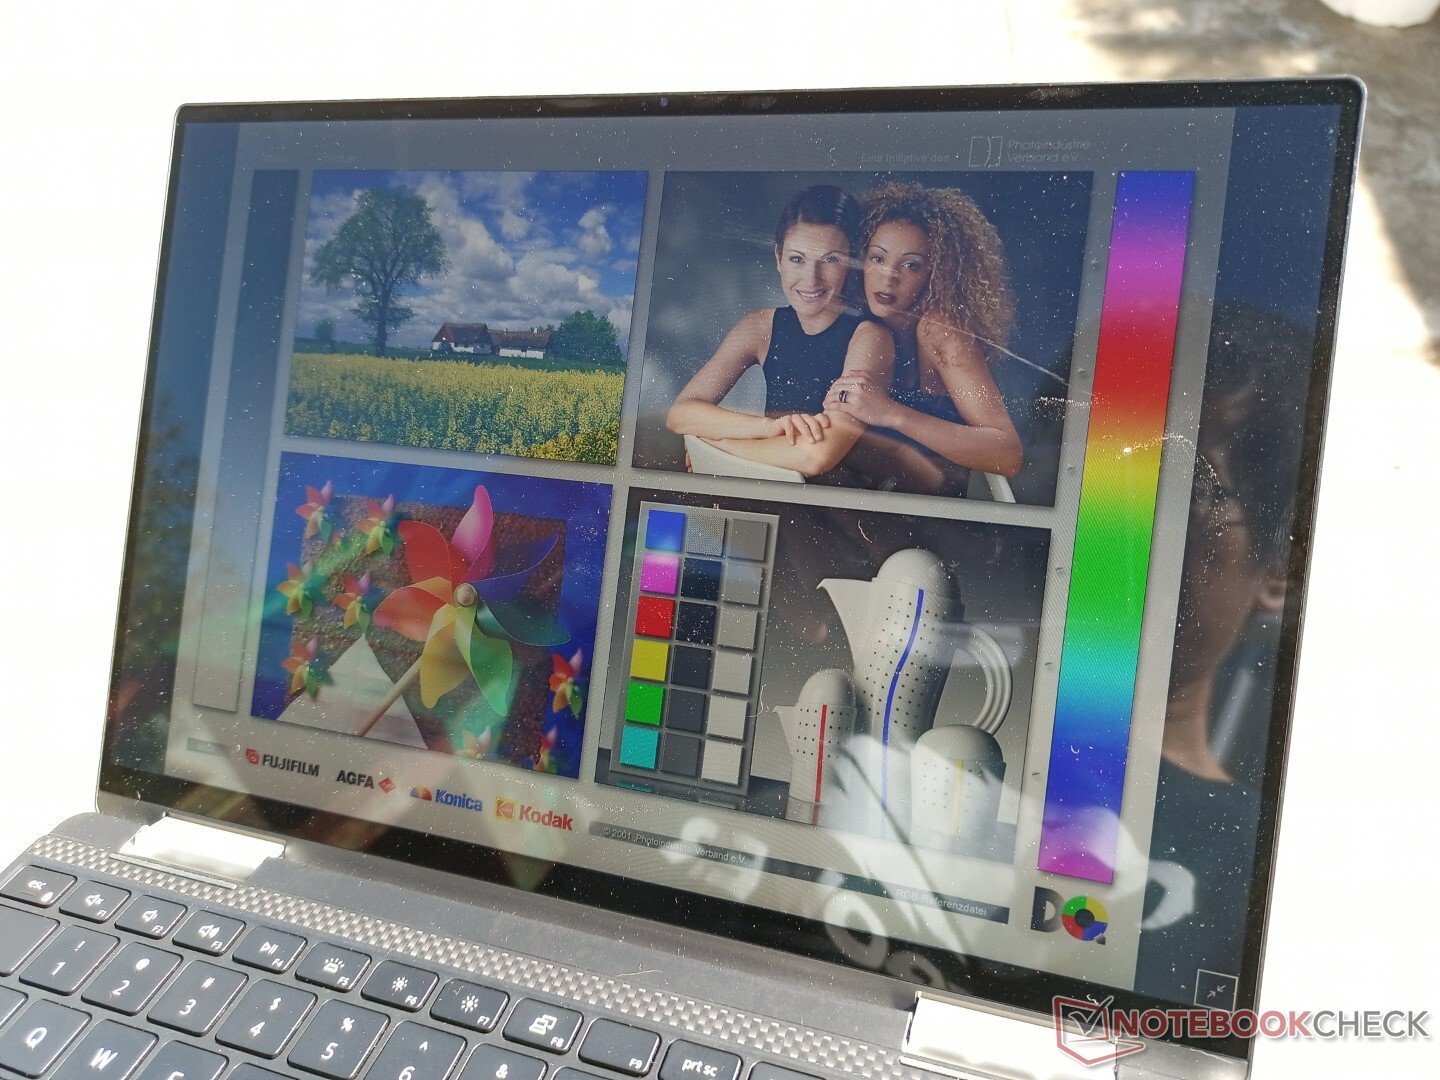
Display — We've Seen this Before
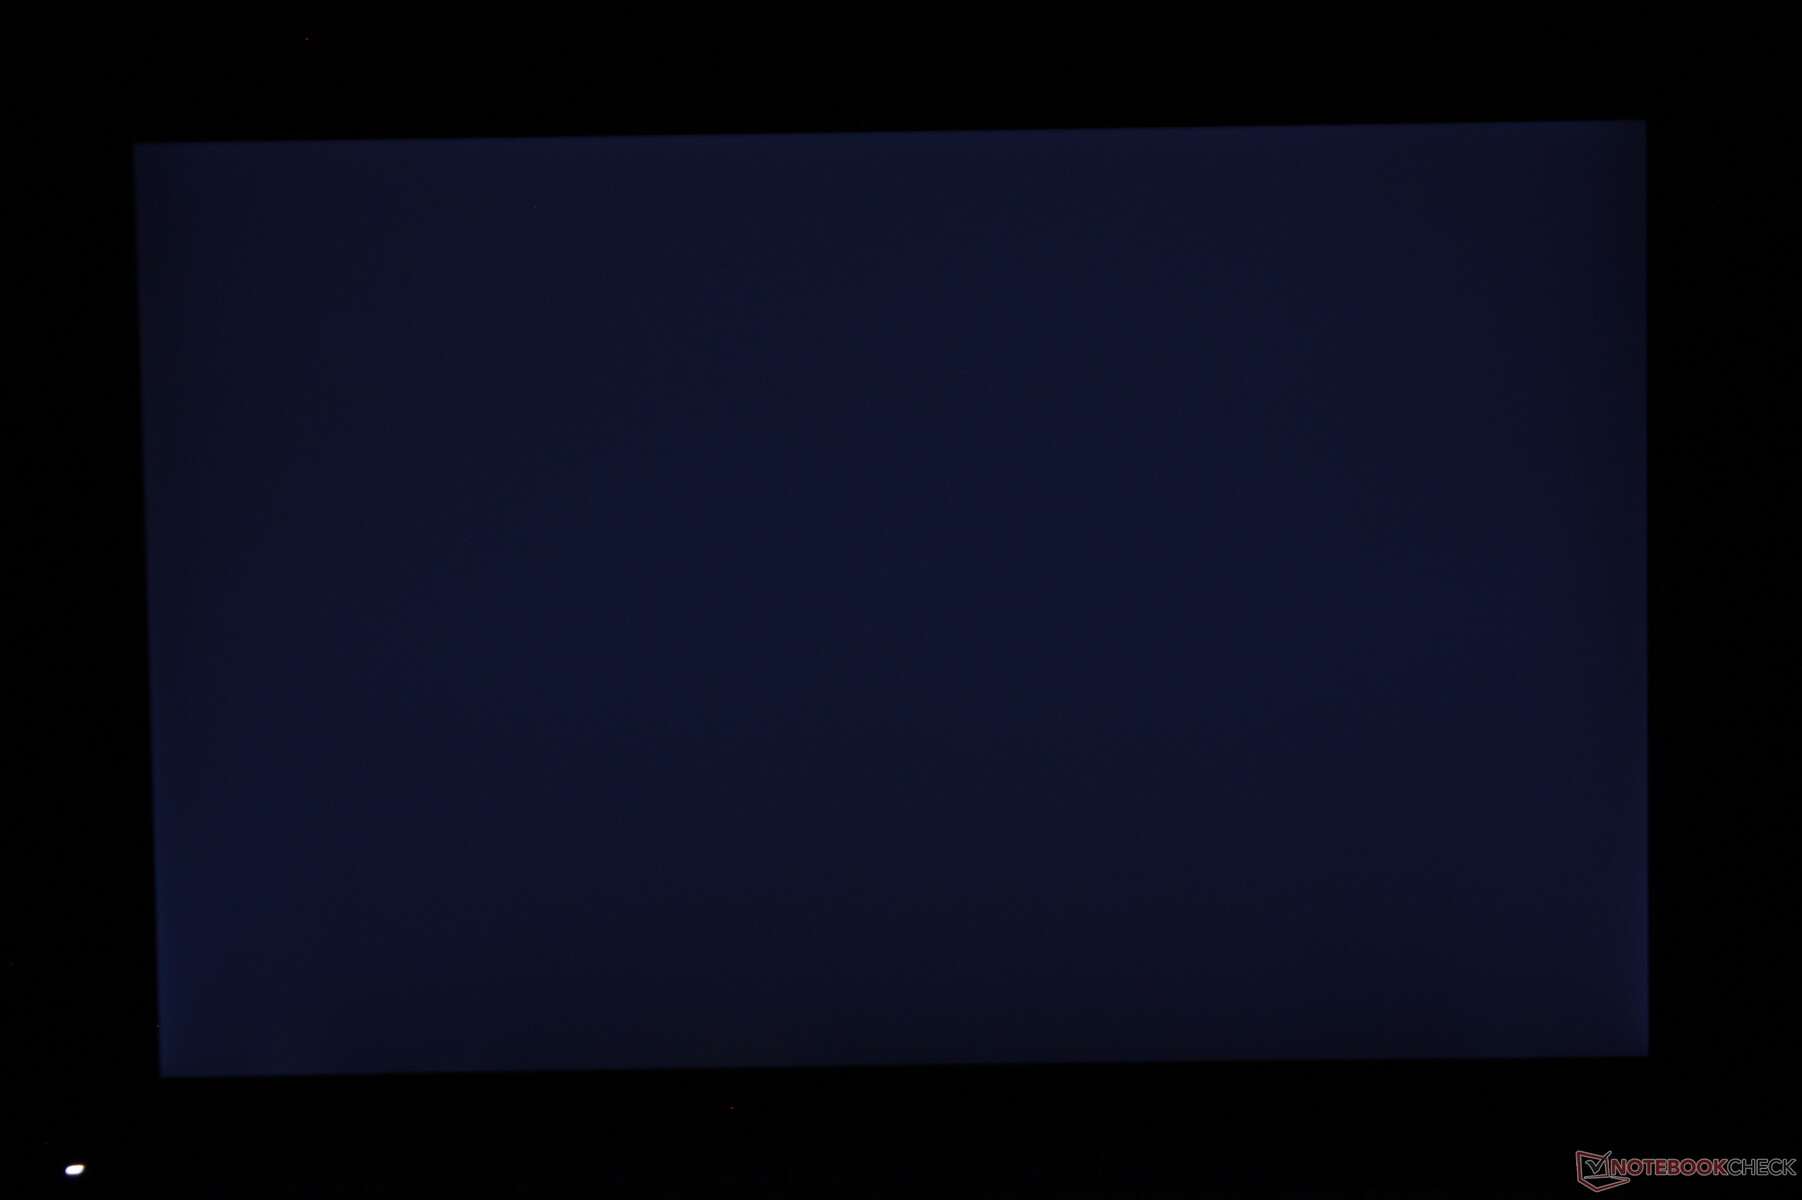
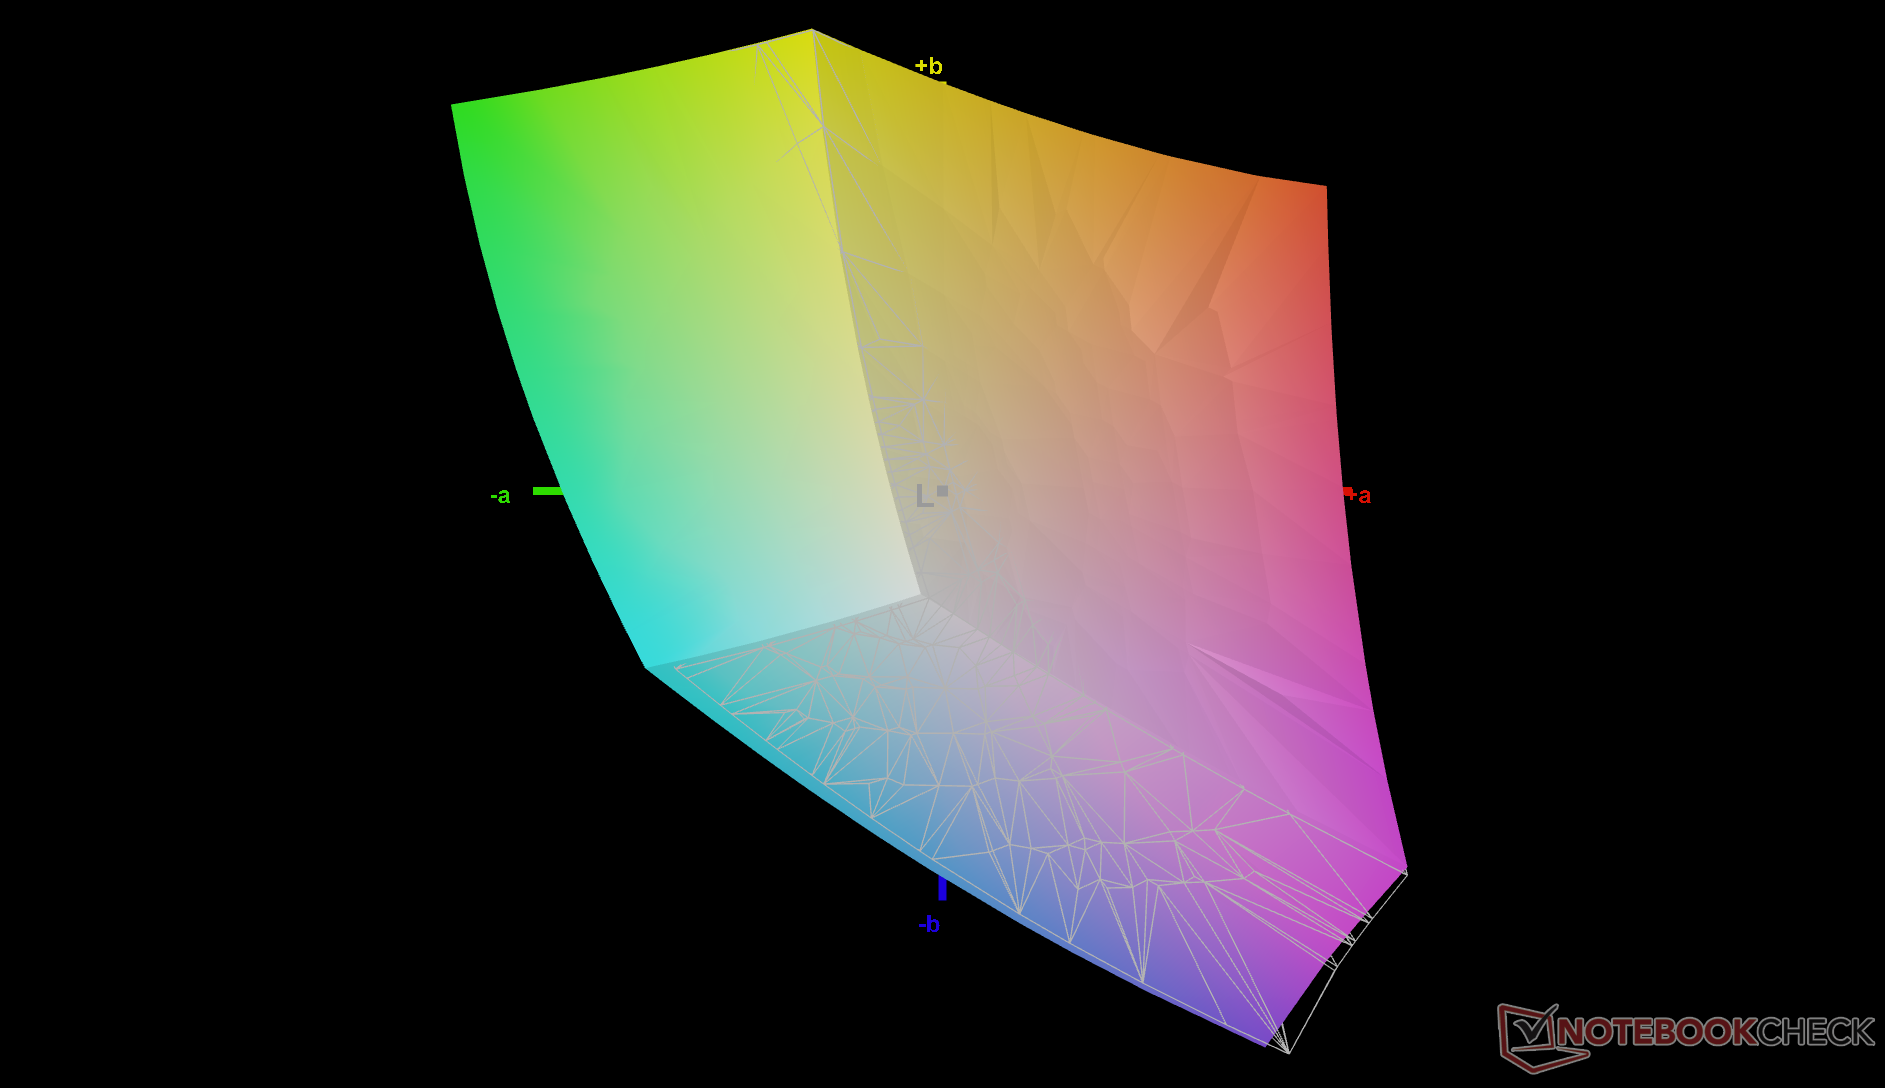
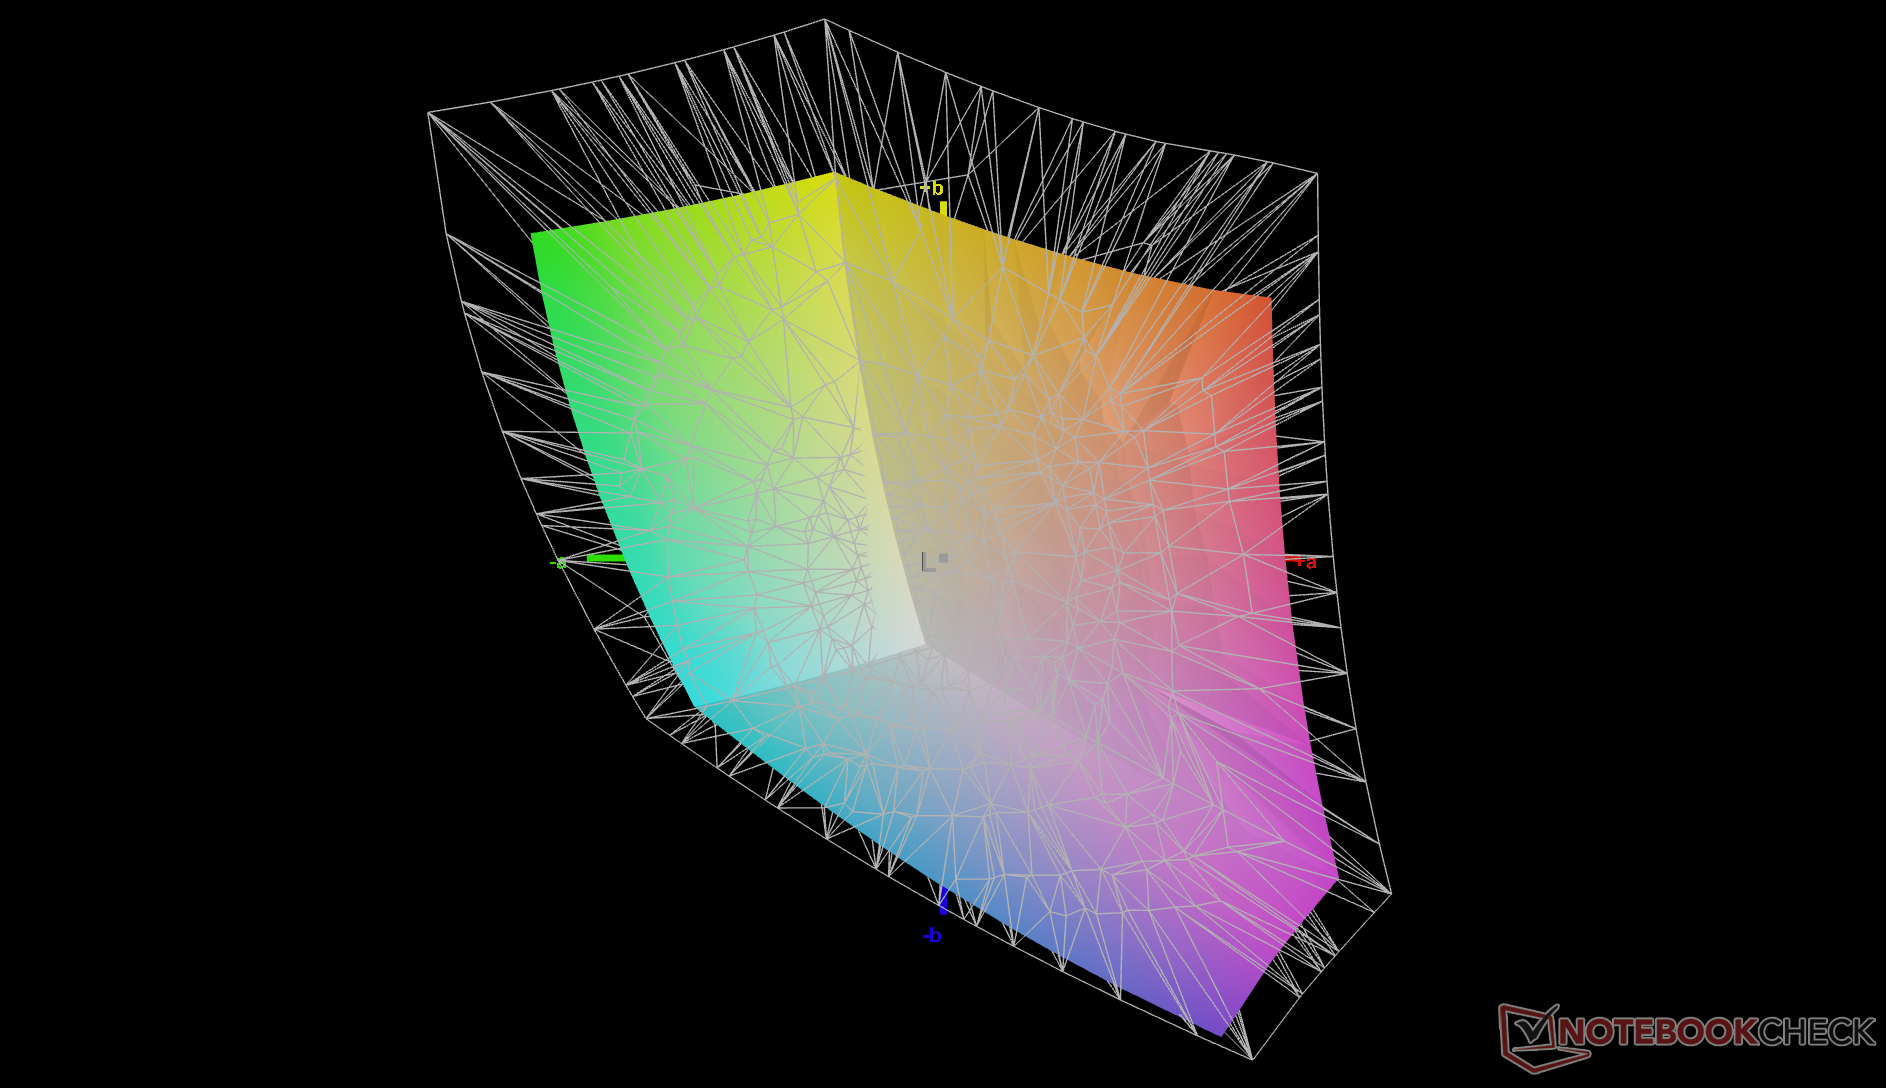
Dell is using the same 1200p Sharp LQ134N1 IPS panel across all of its 16:10 XPS 13 laptops including the XPS 13 7390 2-in-1, XPS 13 9300 clamshell, XPS 13 9310 clamshell, and our XPS 13 9310 2-in-1. This isn't necessarily a bad thing as it continues to be a bright, high quality 13.4-inch panel with excellent color coverage (>99 percent sRGB), high contrast, and sharp pixels with no graininess issues whatsoever. The slow black-white response times are still a weak point meaning ghosting is very noticeable especially if gaming.
A higher resolution UHD+ (3840 x 2400) option is available which we suspect to be the same Sharp LQ134R1 IPS panel as found on the XPS 13 9300.

| |||||||||||||||||||||||||
Brightness Distribution: 90 %
Center on Battery: 555.7 cd/m²
Contrast: 1588:1 (Black: 0.35 cd/m²)
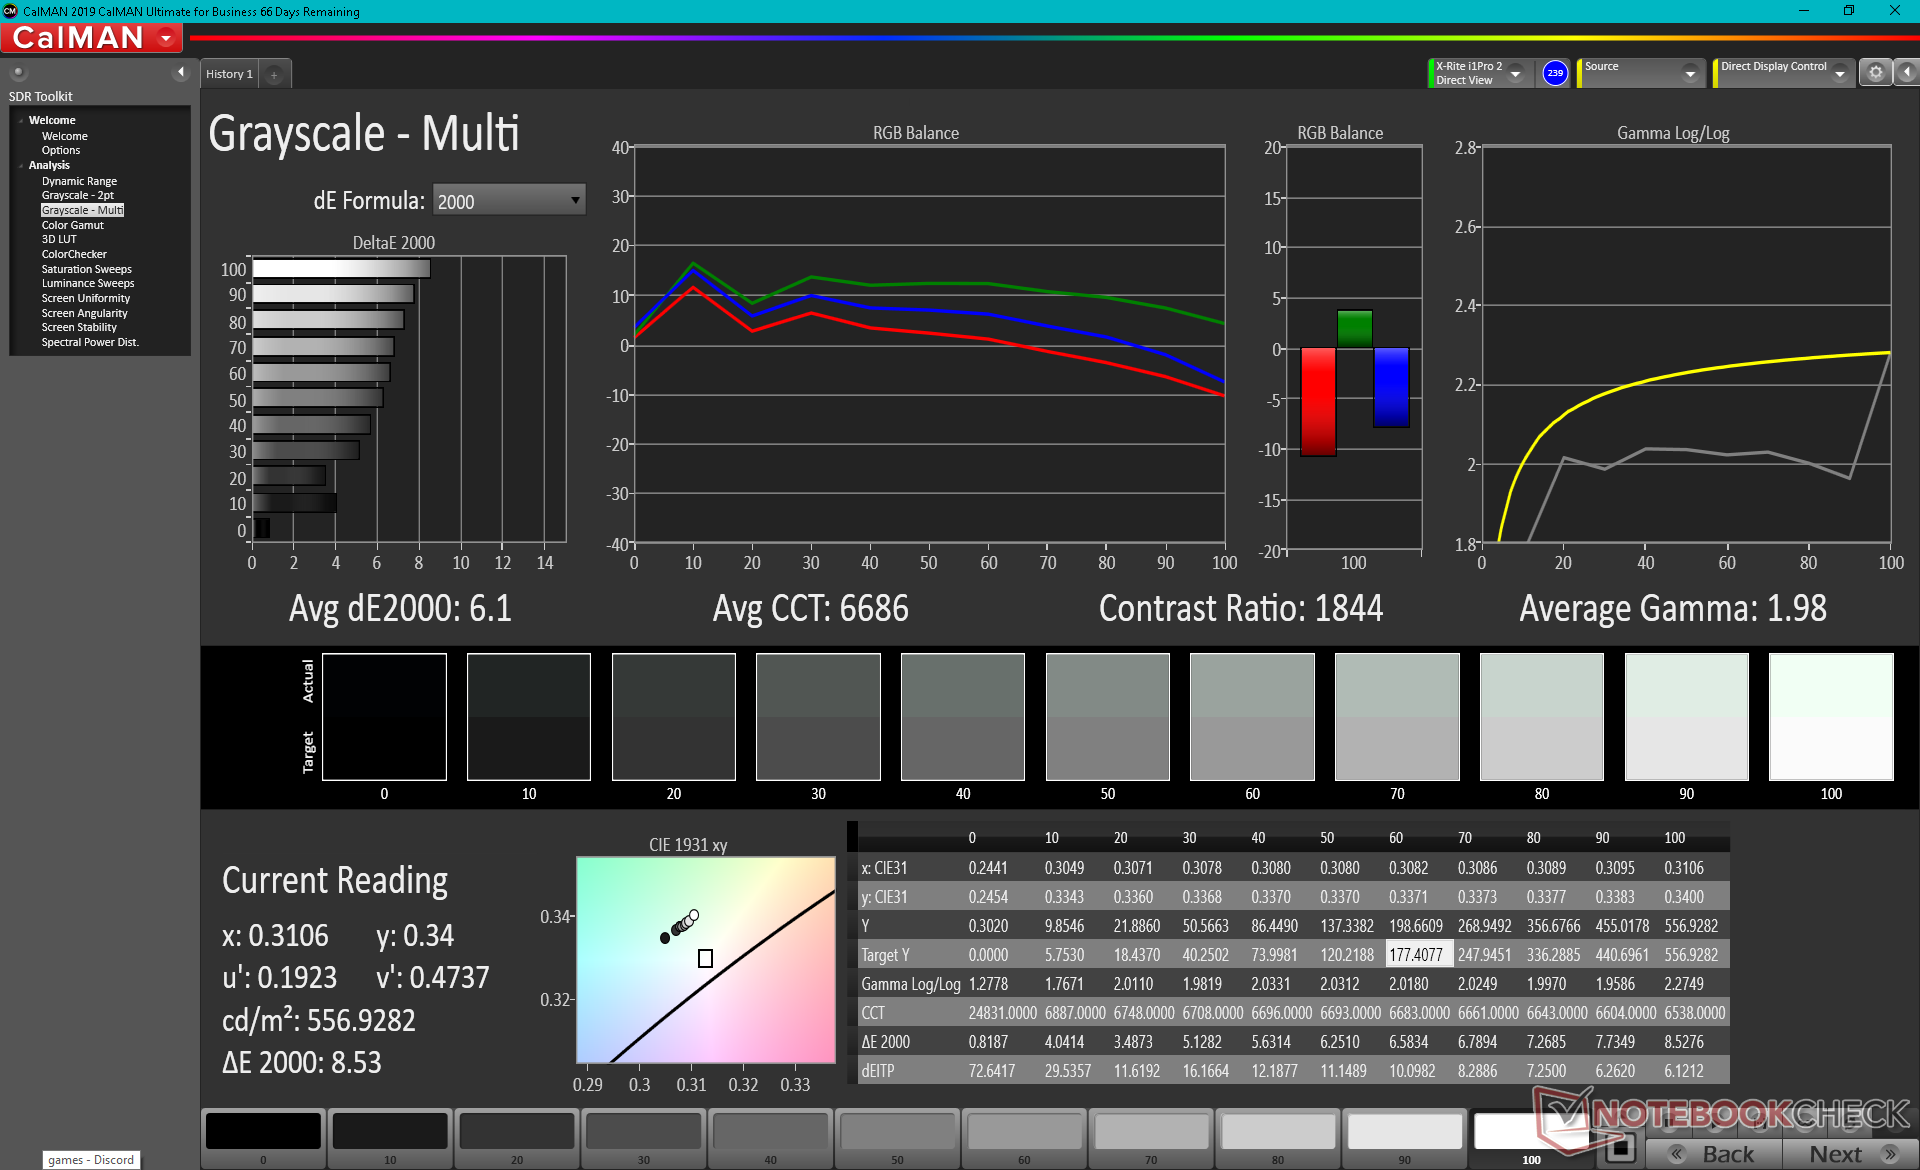
ΔE ColorChecker Calman: 4.83 | ∀{0.5-29.43 Ø4.73}
calibrated: 0.76
ΔE Greyscale Calman: 6.1 | ∀{0.09-98 Ø4.97}
71.7% AdobeRGB 1998 (Argyll 3D)
99% sRGB (Argyll 3D)
69.7% Display P3 (Argyll 3D)
Gamma: 1.98
CCT: 6686 K
| Dell XPS 13 9310 2-in-1 Sharp LQ134N1, IPS, 13.4", 1920x1200 | Dell XPS 13 9310 Core i7 FHD Sharp LQ134N1, IPS, 13.4", 1920x1200 | Dell XPS 13 7390 2-in-1 Core i7 Sharp LQ134N1, IPS, 13.4", 1920x1200 | Lenovo Yoga 6 13 82ND0009US AU Optronics B133HAN05.F, IPS, 13.3", 1920x1080 | Asus ZenBook Flip 13 UX363EA-HP069T Samsung, SDC414A, OLED, 13.3", 1920x1080 | Samsung Galaxy Book Pro 360 13 AMOLED, 13.2", 1920x1080 | |
|---|---|---|---|---|---|---|
| Display | 1% | 0% | 0% | 26% | ||
| Display P3 Coverage (%) | 69.7 | 70.9 2% | 69.9 0% | 69.7 0% | 99.4 43% | |
| sRGB Coverage (%) | 99 | 99.1 0% | 99.2 0% | 99.2 0% | 100 1% | |
| AdobeRGB 1998 Coverage (%) | 71.7 | 72.9 2% | 71.5 0% | 71.4 0% | 96 34% | |
| Response Times | 12% | 21% | 23% | 96% | 96% | |
| Response Time Grey 50% / Grey 80% * (ms) | 55.6 ? | 52 ? 6% | 47.6 ? 14% | 46.8 ? 16% | 2 ? 96% | 2 ? 96% |
| Response Time Black / White * (ms) | 40.4 ? | 33.2 ? 18% | 29.2 ? 28% | 28.8 ? 29% | 2 ? 95% | 2 ? 95% |
| PWM Frequency (Hz) | 2500 ? | 2475 ? | 2500 ? | 60 | 60 ? | |
| Screen | -2% | 7% | -8% | -38% | 235% | |
| Brightness middle (cd/m²) | 555.7 | 543.3 -2% | 549.8 -1% | 291.5 -48% | 353 -36% | 287 -48% |
| Brightness (cd/m²) | 528 | 524 -1% | 520 -2% | 294 -44% | 359 -32% | 289 -45% |
| Brightness Distribution (%) | 90 | 92 2% | 86 -4% | 93 3% | 95 6% | 96 7% |
| Black Level * (cd/m²) | 0.35 | 0.38 -9% | 0.39 -11% | 0.19 46% | 0.1 71% | 0.01 97% |
| Contrast (:1) | 1588 | 1430 -10% | 1410 -11% | 1534 -3% | 3530 122% | 28700 1707% |
| Colorchecker dE 2000 * | 4.83 | 3.02 37% | 2.12 56% | 3.83 21% | 3.98 18% | 2.24 54% |
| Colorchecker dE 2000 max. * | 8.46 | 7.61 10% | 3.66 57% | 8.43 -0% | 53.07 -527% | 3.69 56% |
| Colorchecker dE 2000 calibrated * | 0.76 | 1.23 -62% | 1.37 -80% | 1.07 -41% | ||
| Greyscale dE 2000 * | 6.1 | 5 18% | 2.6 57% | 6.2 -2% | 1.41 77% | 2.73 55% |
| Gamma | 1.98 111% | 2.02 109% | 2.3 96% | 2.2 100% | 2.39 92% | 2.46 89% |
| CCT | 6686 97% | 6550 99% | 6884 94% | 6469 100% | 6346 102% | 6523 100% |
| Color Space (Percent of AdobeRGB 1998) (%) | 66.8 | 65.4 | ||||
| Color Space (Percent of sRGB) (%) | 99.6 | 99.7 | ||||
| Total Average (Program / Settings) | 4% /
1% | 9% /
7% | 5% /
-2% | 29% /
-11% | 119% /
166% |
* ... smaller is better
Display Response Times
| ↔ Response Time Black to White | ||
|---|---|---|
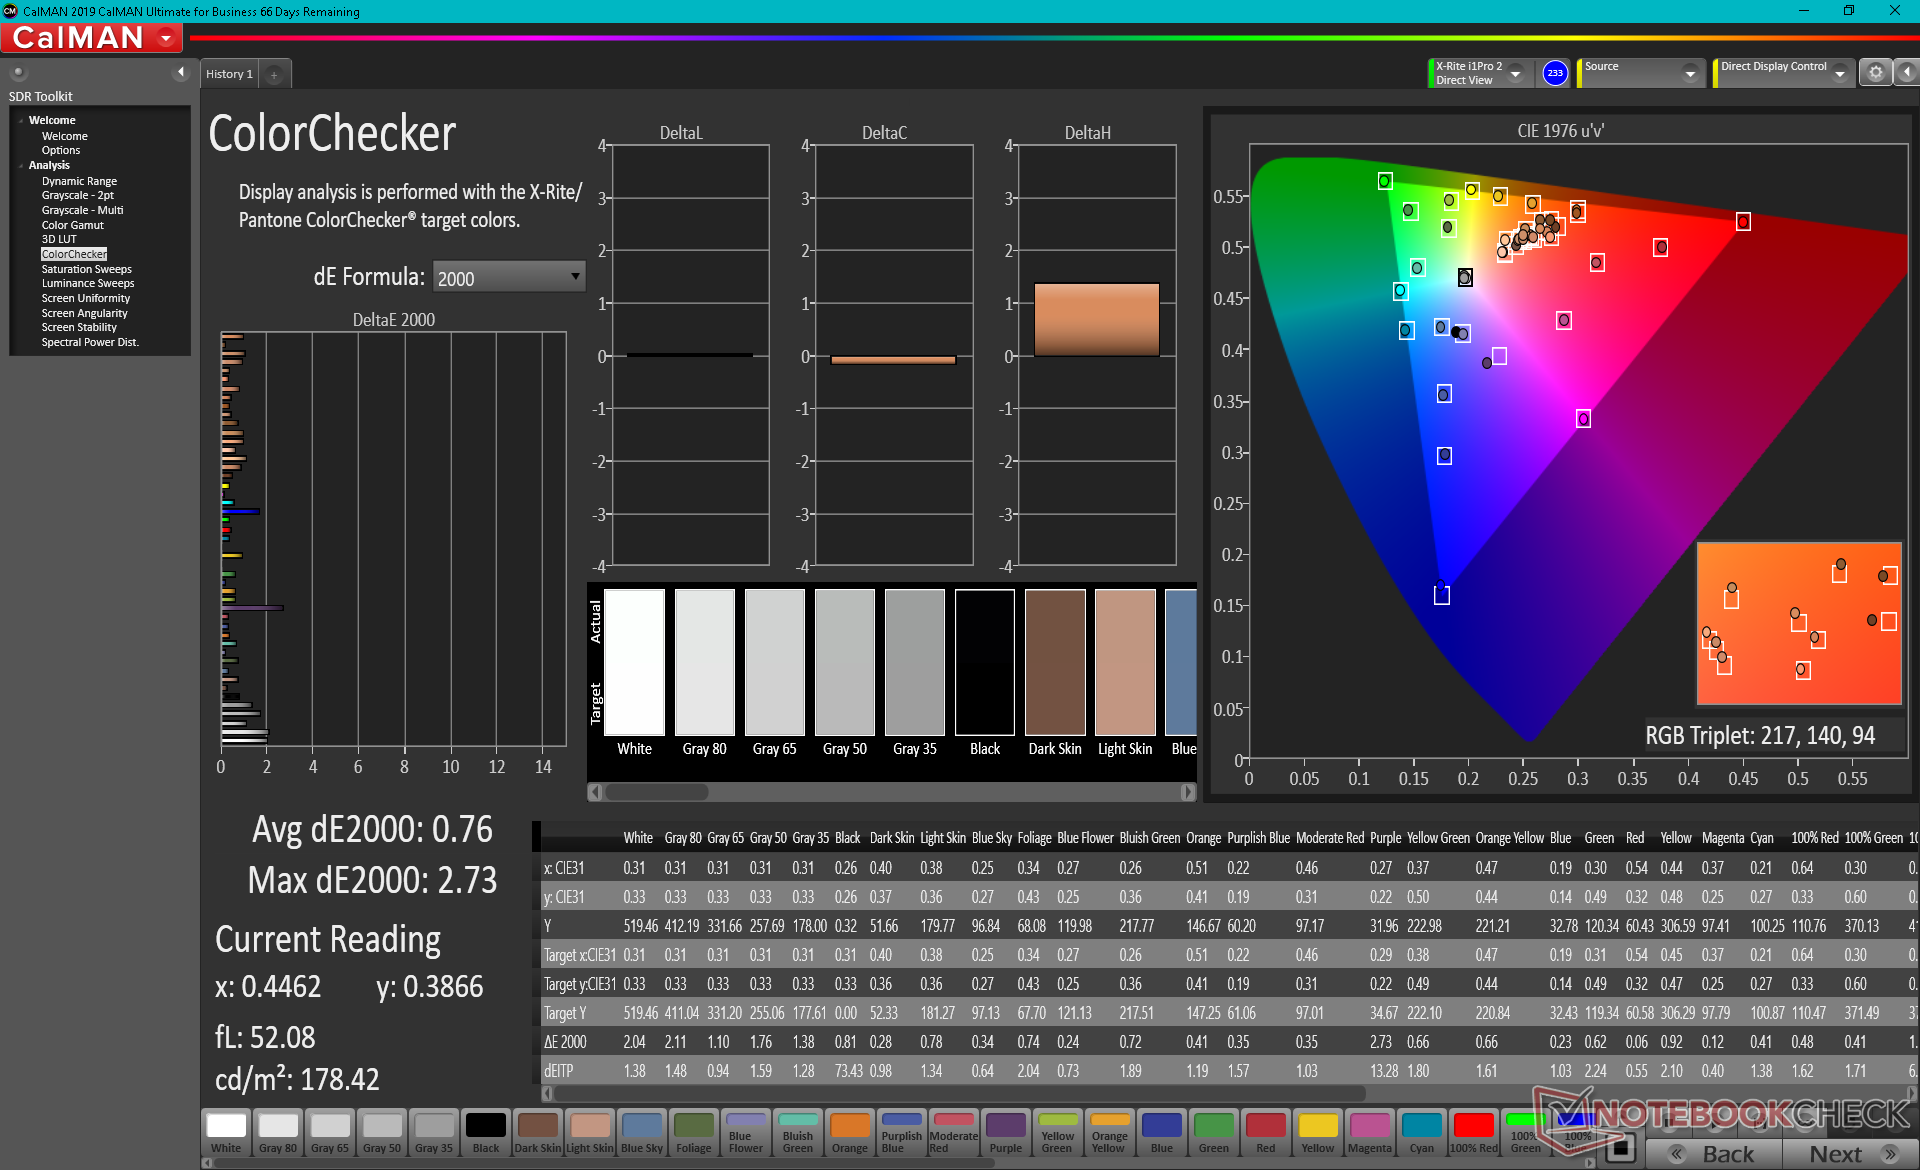
| 40.4 ms ... rise ↗ and fall ↘ combined | ↗ 22 ms rise | 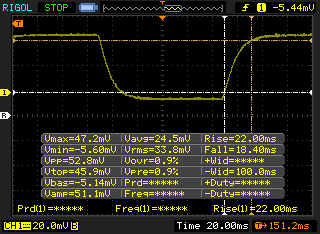 |
| ↘ 18.4 ms fall | ||
| The screen shows slow response rates in our tests and will be unsatisfactory for gamers. In comparison, all tested devices range from 0.1 (minimum) to 240 (maximum) ms. » 97 % of all devices are better. This means that the measured response time is worse than the average of all tested devices (19.9 ms). | ||
| ↔ Response Time 50% Grey to 80% Grey | ||
| 55.6 ms ... rise ↗ and fall ↘ combined | ↗ 27.6 ms rise | 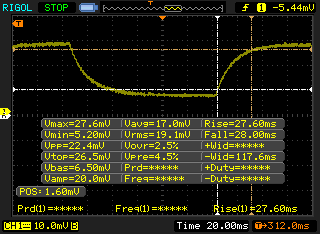 |
| ↘ 28 ms fall | ||
| The screen shows slow response rates in our tests and will be unsatisfactory for gamers. In comparison, all tested devices range from 0.165 (minimum) to 636 (maximum) ms. » 92 % of all devices are better. This means that the measured response time is worse than the average of all tested devices (31.1 ms). | ||
Screen Flickering / PWM (Pulse-Width Modulation)
| Screen flickering / PWM detected | 2500 Hz | ≤ 25 % brightness setting |  |
The display backlight flickers at 2500 Hz (worst case, e.g., utilizing PWM) Flickering detected at a brightness setting of 25 % and below. There should be no flickering or PWM above this brightness setting. The frequency of 2500 Hz is quite high, so most users sensitive to PWM should not notice any flickering. In comparison: 52 % of all tested devices do not use PWM to dim the display. If PWM was detected, an average of 7801 (minimum: 5 - maximum: 343500) Hz was measured. | |||

Performance — Intel Tiger Lake-U to the Rescue
Processor — Underperformer
CPU performance fluctuates heavily much like what we observed on the XPS 9310 clamshell equipped with the same Core i7-1165G7 processor. CineBench R15 xT scores can range from 480 to 750 points, respectively, compared to the more consistent clock rates of the XPS 13 7390 2-in-1 or ZenBook Flip 13. Processor performance can therefore be slower than the last generation Core i7-1065G7 at times.
Our unit was set to Ultra Performance mode via the Dell Power Manager software prior to running any benchmarks for the highest possible scores.
Cinebench R15 Multi Loop
Cinebench R23: Multi Core | Single Core
Cinebench R15: CPU Multi 64Bit | CPU Single 64Bit
Blender: v2.79 BMW27 CPU
7-Zip 18.03: 7z b 4 -mmt1 | 7z b 4
Geekbench 5.5: Single-Core | Multi-Core
HWBOT x265 Benchmark v2.2: 4k Preset
LibreOffice : 20 Documents To PDF
R Benchmark 2.5: Overall mean
| Cinebench R23 / Multi Core | |
| Lenovo Yoga Slim 7-14ARE | |
| Asus ZenBook 13 OLED UM325UA | |
| Lenovo Yoga 6 13 82ND0009US | |
| Average Intel Core i7-1165G7 (2525 - 6862, n=64) | |
| Dell XPS 13 9310 OLED | |
| Dell XPS 13 9310 2-in-1 | |
| HP Spectre x360 13-aw2003dx | |
| Asus VivoBook S13 S333JA-DS51 | |
| Cinebench R23 / Single Core | |
| Dell XPS 13 9310 OLED | |
| Average Intel Core i7-1165G7 (1110 - 1539, n=59) | |
| Dell XPS 13 9310 2-in-1 | |
| HP Spectre x360 13-aw2003dx | |
| Asus ZenBook 13 OLED UM325UA | |
| Lenovo Yoga Slim 7-14ARE | |
| Lenovo Yoga 6 13 82ND0009US | |
| Asus VivoBook S13 S333JA-DS51 | |
| Geekbench 5.5 / Single-Core | |
| Dell XPS 13 9310 OLED | |
| Average Intel Core i7-1165G7 (1302 - 1595, n=77) | |
| HP Spectre x360 13-aw2003dx | |
| Asus Zenbook S UX393JA | |
| HP Envy 13-ba0001ng | |
| Asus ZenBook 13 OLED UM325UA | |
| Lenovo Yoga Slim 7-14ARE | |
| Lenovo Yoga Slim 7-14ARE | |
| Asus VivoBook S13 S333JA-DS51 | |
| Geekbench 5.5 / Multi-Core | |
| Lenovo Yoga Slim 7-14ARE | |
| Lenovo Yoga Slim 7-14ARE | |
| Asus ZenBook 13 OLED UM325UA | |
| Dell XPS 13 9310 OLED | |
| HP Spectre x360 13-aw2003dx | |
| Average Intel Core i7-1165G7 (3078 - 5926, n=77) | |
| Asus Zenbook S UX393JA | |
| Asus VivoBook S13 S333JA-DS51 | |
| HP Envy 13-ba0001ng | |
| HWBOT x265 Benchmark v2.2 / 4k Preset | |
| Lenovo Yoga Slim 7-14ARE | |
| Asus ZenBook 13 OLED UM325UA | |
| Lenovo Yoga 6 13 82ND0009US | |
| Dell XPS 13 9310 OLED | |
| Dell XPS 13 9310 2-in-1 | |
| Average Intel Core i7-1165G7 (1.39 - 8.47, n=80) | |
| HP Spectre x360 13-aw2003dx | |
| Dell XPS 13 7390 Core i7-10710U | |
| Asus VivoBook S13 S333JA-DS51 | |
| Asus Zenbook S UX393JA | |
| HP Envy 13-ba0001ng | |
| LibreOffice / 20 Documents To PDF | |
| Lenovo Yoga 6 13 82ND0009US | |
| Asus VivoBook S13 S333JA-DS51 | |
| Asus ZenBook 13 OLED UM325UA | |
| Lenovo Yoga Slim 7-14ARE | |
| HP Envy 13-ba0001ng | |
| HP Spectre x360 13-aw2003dx | |
| Average Intel Core i7-1165G7 (21.5 - 88.1, n=78) | |
| Asus Zenbook S UX393JA | |
| Dell XPS 13 9310 OLED | |
| R Benchmark 2.5 / Overall mean | |
| Asus VivoBook S13 S333JA-DS51 | |
| Asus Zenbook S UX393JA | |
| HP Envy 13-ba0001ng | |
| HP Spectre x360 13-aw2003dx | |
| Lenovo Yoga 6 13 82ND0009US | |
| Lenovo Yoga Slim 7-14ARE | |
| Dell XPS 13 9310 2-in-1 | |
| Asus ZenBook 13 OLED UM325UA | |
| Dell XPS 13 9310 OLED | |
| Average Intel Core i7-1165G7 (0.552 - 1.002, n=80) | |
* ... smaller is better
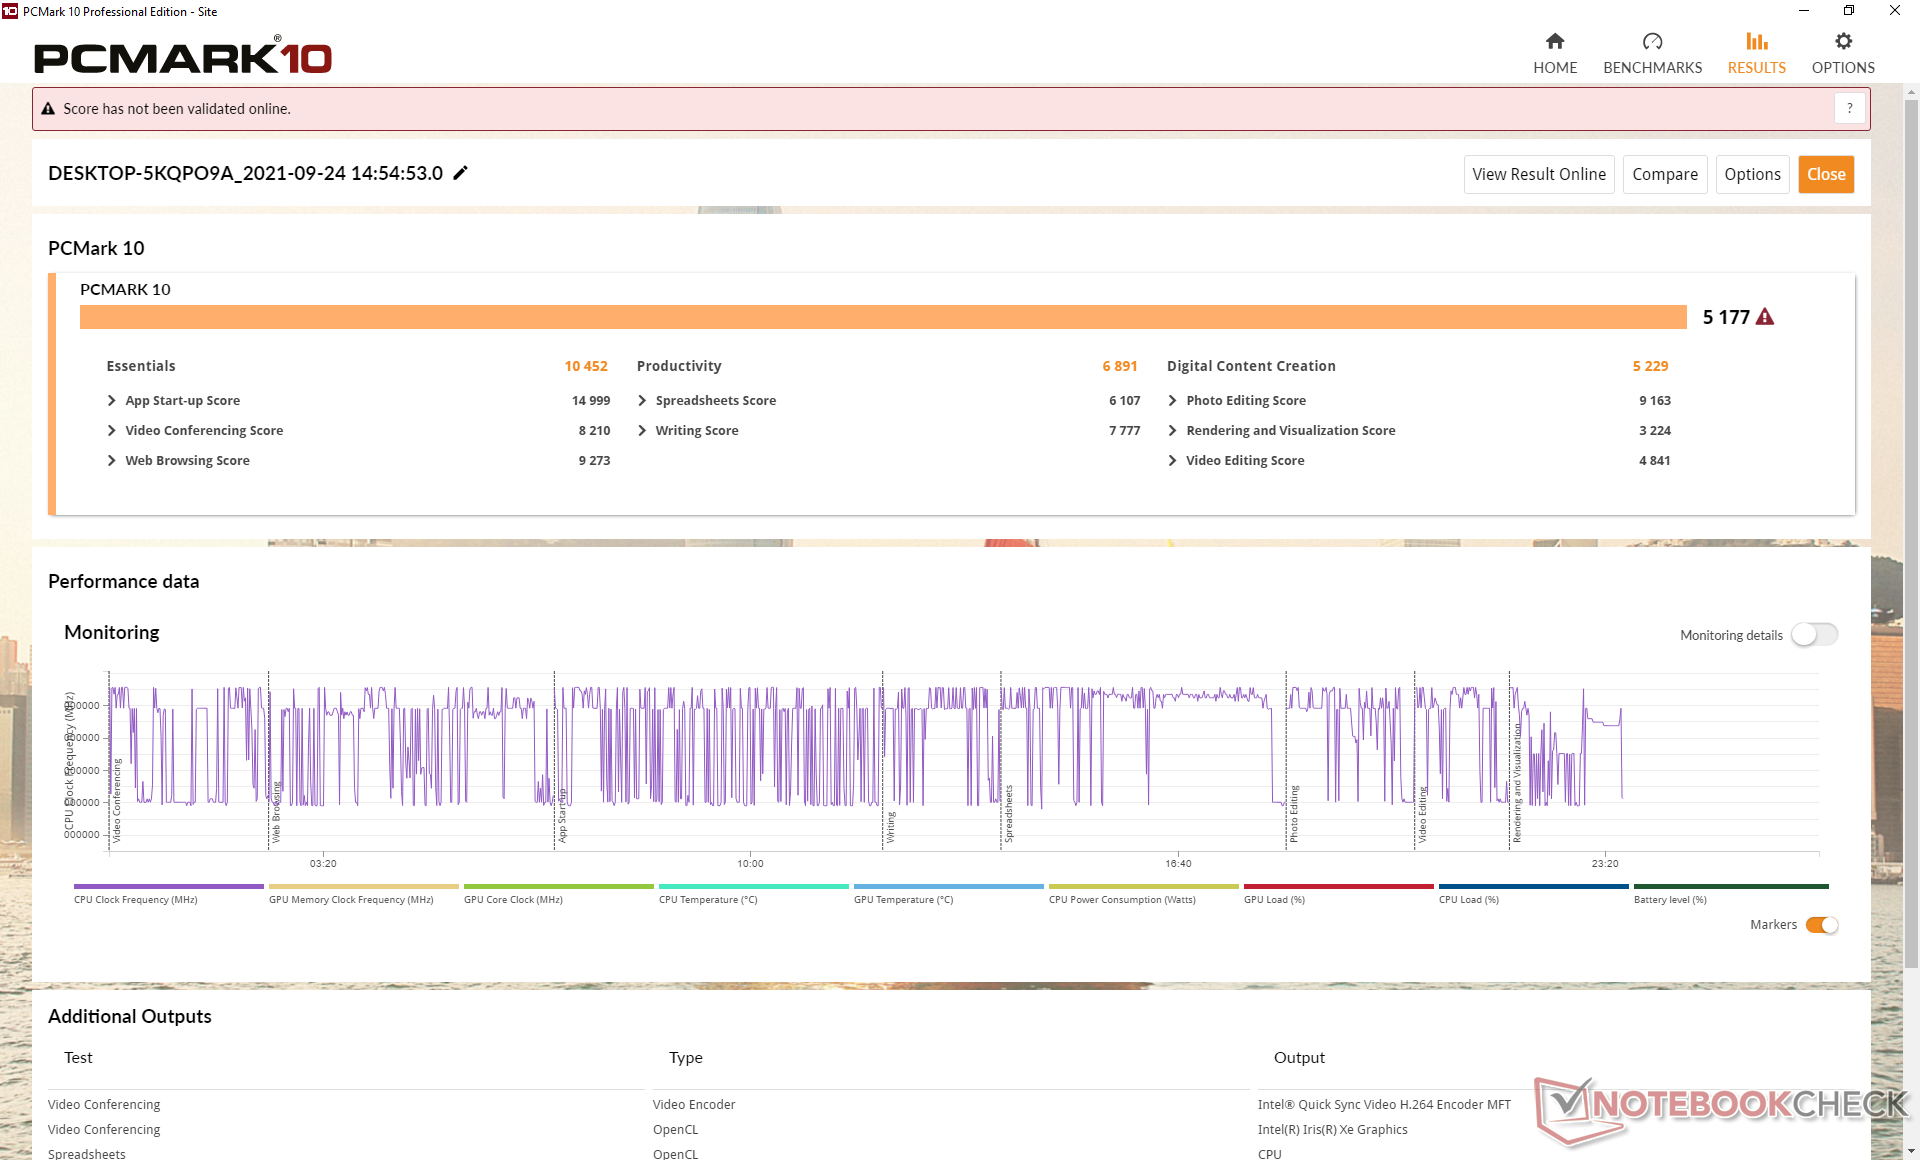
System Performance
PCMark 10 scores are where we expect them to be relative to other laptops equipped with the same Core i7 CPU. The biggest gain over the older XPS 13 7390 2-in-1 is in the GPU-heavy Digital Content Creation benchmark where our Iris Xe can handily outperform the Iris Plus G7.
| PCMark 10 / Score | |
| Lenovo Yoga 6 13 82ND0009US | |
| Dell XPS 13 9310 2-in-1 | |
| Average Intel Core i7-1165G7, Intel Iris Xe Graphics G7 96EUs (4531 - 5454, n=50) | |
| Dell XPS 13 9310 Core i7 FHD | |
| Asus ZenBook Flip 13 UX363EA-HP069T | |
| Dell XPS 13 7390 2-in-1 Core i7 | |
| Samsung Galaxy Book Pro 360 13 | |
| PCMark 10 / Essentials | |
| Dell XPS 13 9310 2-in-1 | |
| Asus ZenBook Flip 13 UX363EA-HP069T | |
| Average Intel Core i7-1165G7, Intel Iris Xe Graphics G7 96EUs (8997 - 11505, n=50) | |
| Lenovo Yoga 6 13 82ND0009US | |
| Dell XPS 13 9310 Core i7 FHD | |
| Dell XPS 13 7390 2-in-1 Core i7 | |
| Samsung Galaxy Book Pro 360 13 | |
| PCMark 10 / Productivity | |
| Lenovo Yoga 6 13 82ND0009US | |
| Dell XPS 13 7390 2-in-1 Core i7 | |
| Asus ZenBook Flip 13 UX363EA-HP069T | |
| Dell XPS 13 9310 2-in-1 | |
| Dell XPS 13 9310 Core i7 FHD | |
| Average Intel Core i7-1165G7, Intel Iris Xe Graphics G7 96EUs (5570 - 7136, n=50) | |
| Samsung Galaxy Book Pro 360 13 | |
| PCMark 10 / Digital Content Creation | |
| Lenovo Yoga 6 13 82ND0009US | |
| Dell XPS 13 9310 2-in-1 | |
| Average Intel Core i7-1165G7, Intel Iris Xe Graphics G7 96EUs (4083 - 5550, n=50) | |
| Dell XPS 13 9310 Core i7 FHD | |
| Samsung Galaxy Book Pro 360 13 | |
| Asus ZenBook Flip 13 UX363EA-HP069T | |
| Dell XPS 13 7390 2-in-1 Core i7 | |
| PCMark 10 Score | 5177 points | |
Help | ||
DPC Latency
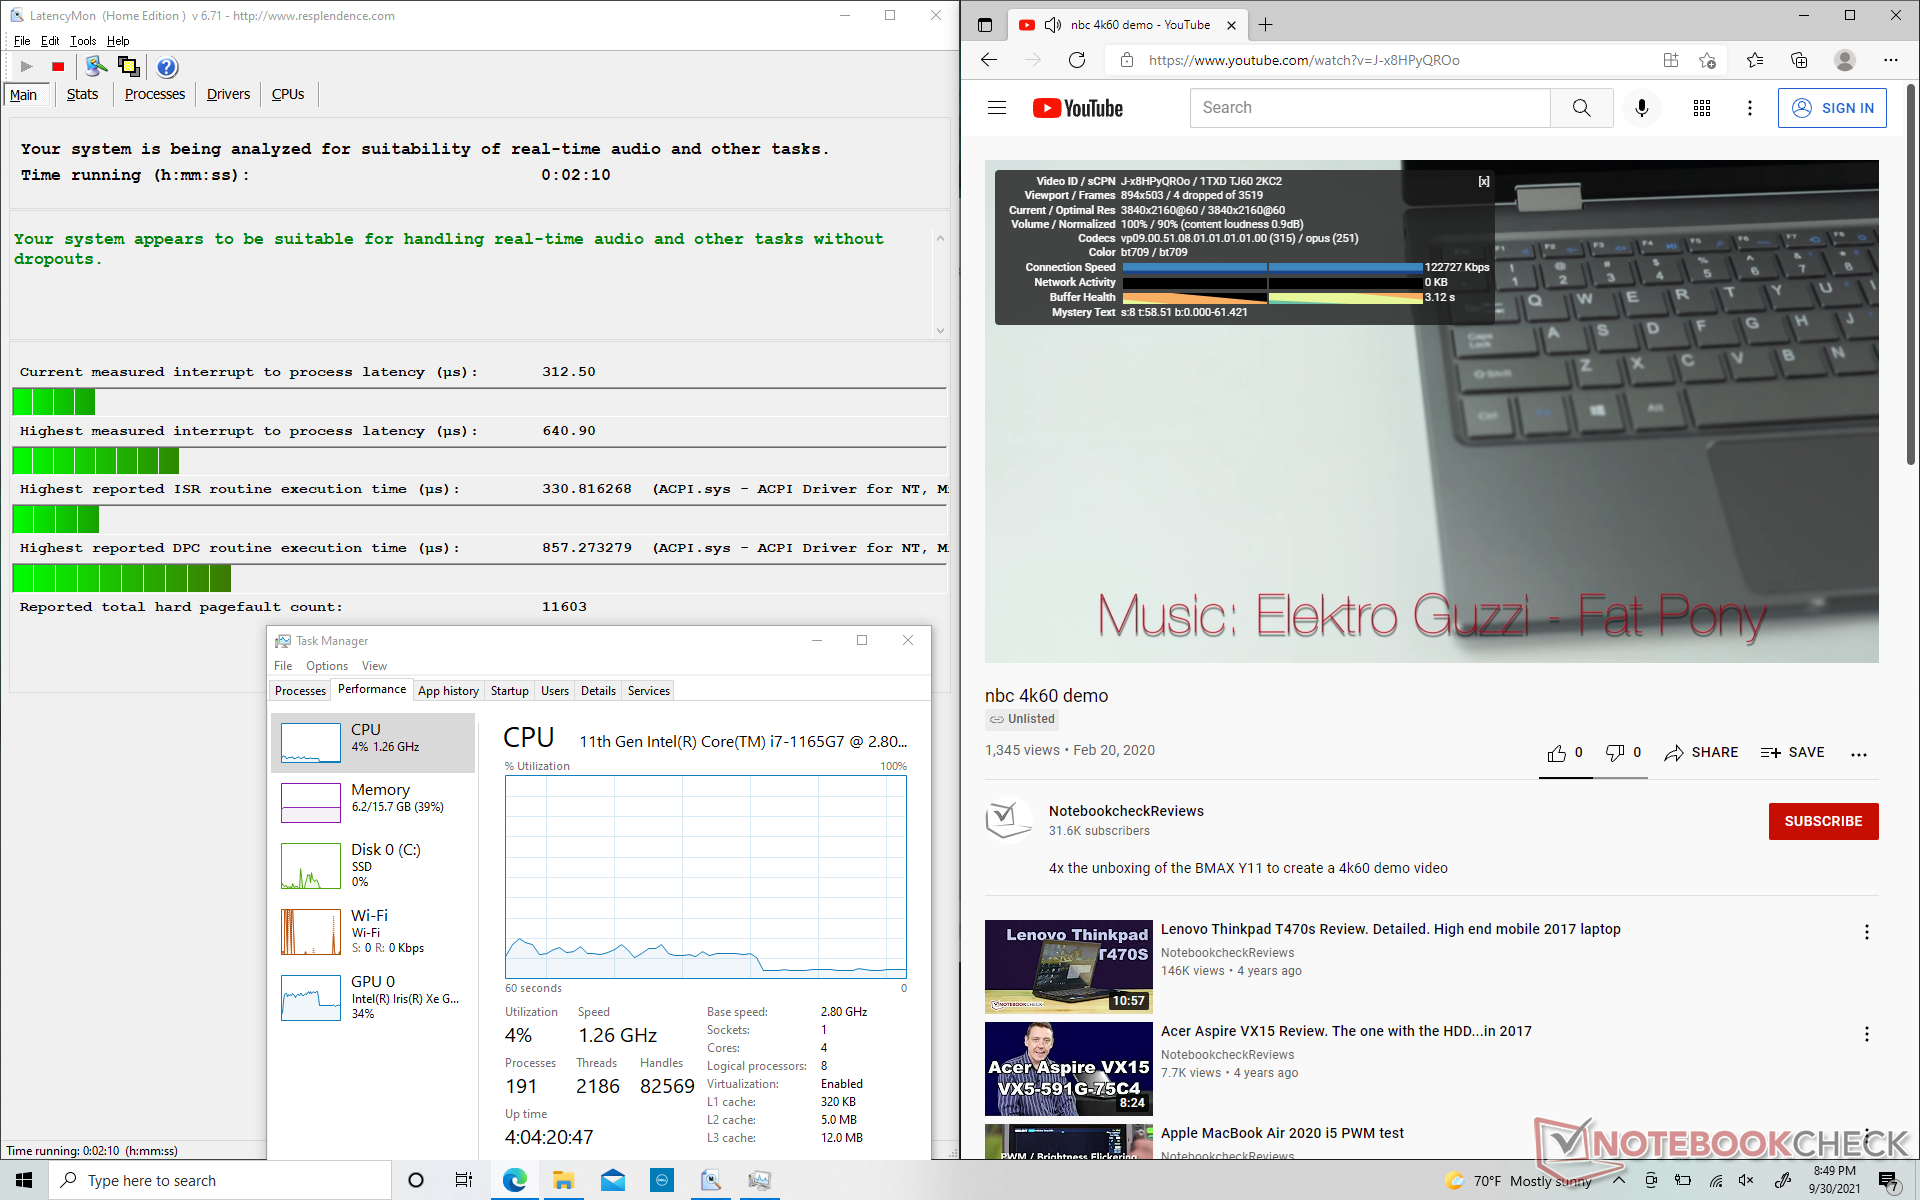
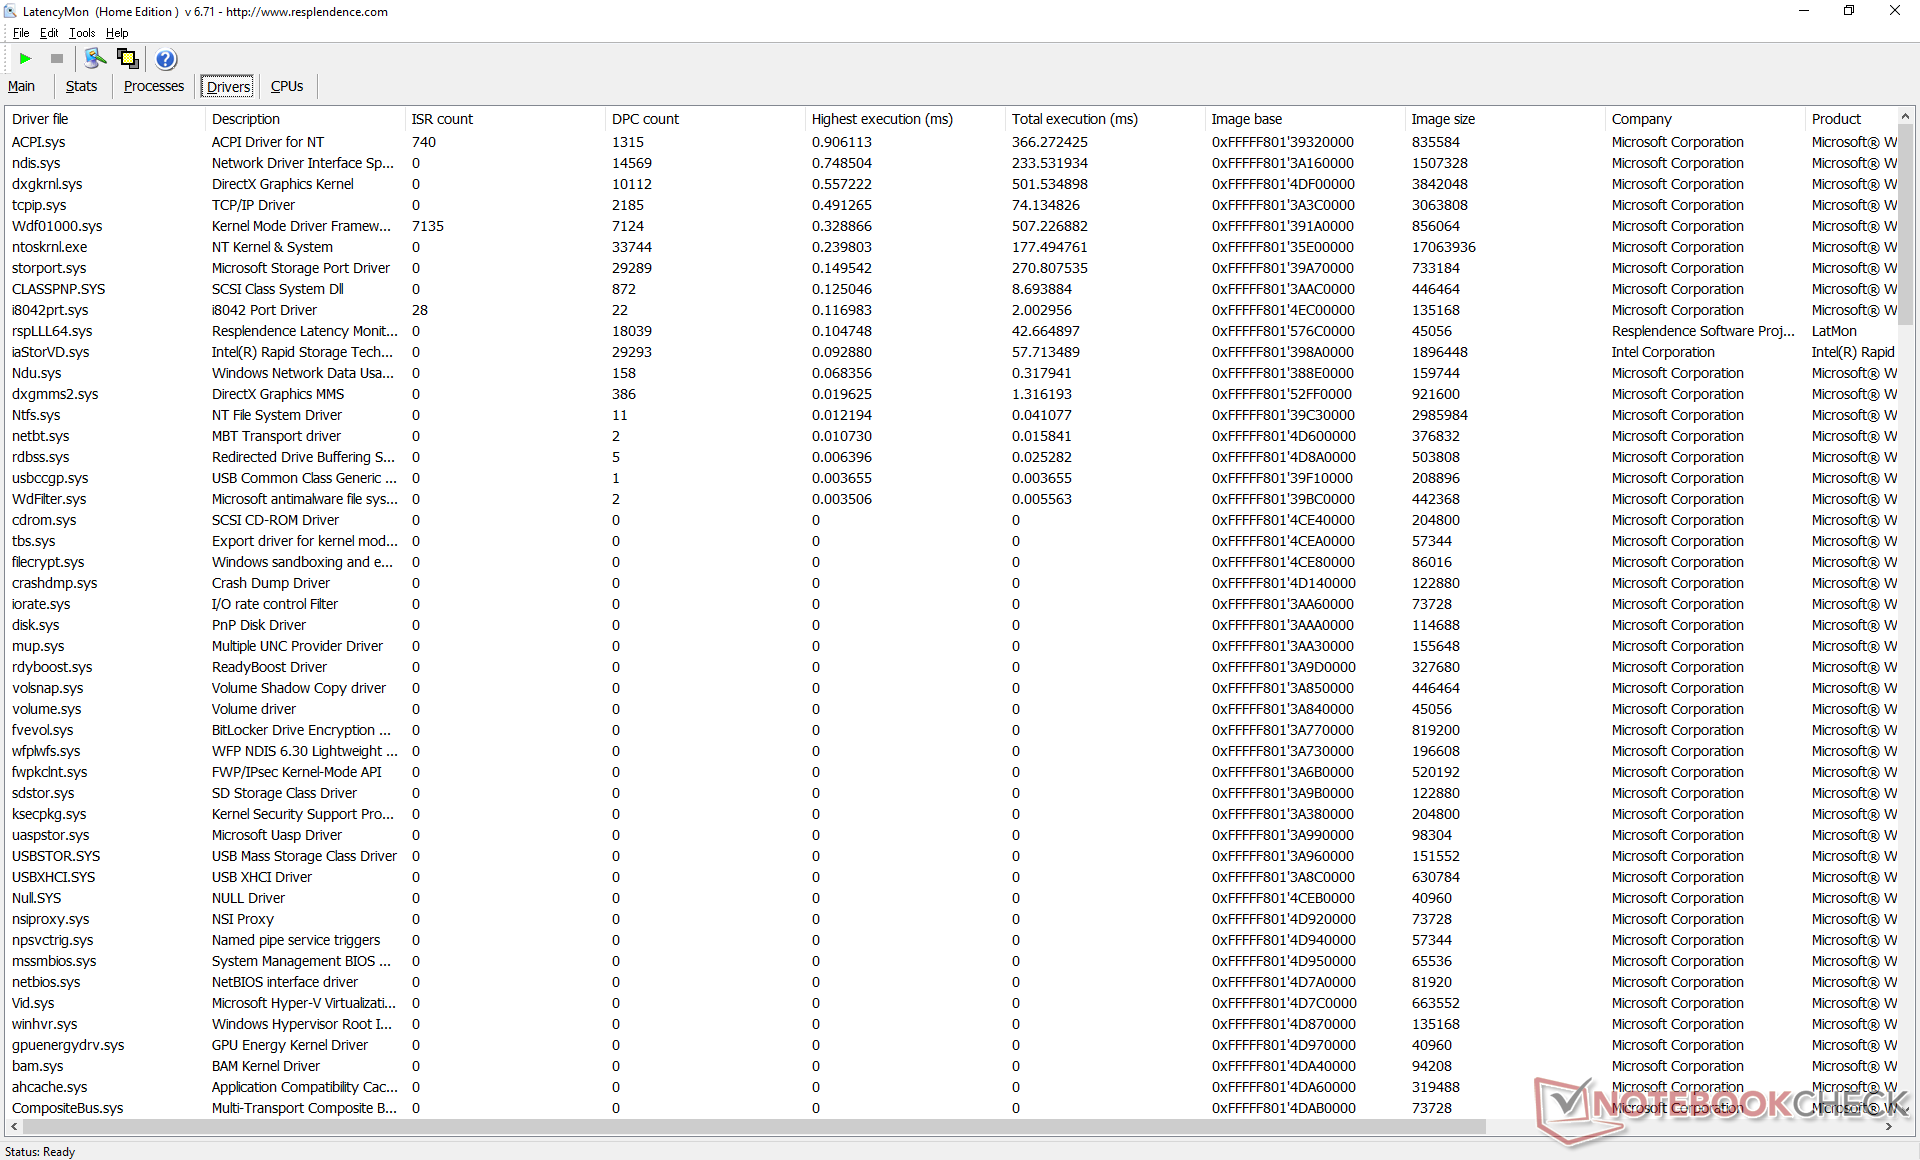
LatencyMon shows no latency issues when opening multiple tabs on our homepage or when running Prime95 stress. 4K UHD playback at 60 FPS is also smooth.
| DPC Latencies / LatencyMon - interrupt to process latency (max), Web, Youtube, Prime95 | |
| Samsung Galaxy Book Pro 360 13 | |
| Asus ZenBook Flip 13 UX363EA-HP069T | |
| Lenovo Yoga 6 13 82ND0009US | |
| Dell XPS 13 9310 Core i7 FHD | |
| Dell XPS 13 9310 2-in-1 | |
* ... smaller is better
Storage Devices
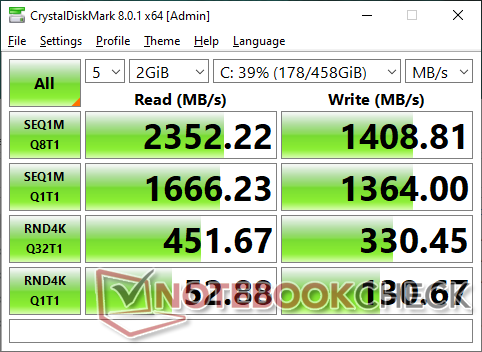
Our test unit ships with the same Toshiba BG4 PCIe3 NVMe SSD as found on the older XPS 13 7390 2-in-1. However, we wouldn't be surprised to see some units ship with Micron SSDs instead. There is no support for PCIe4 speeds unlike on the latest Vaio Z.
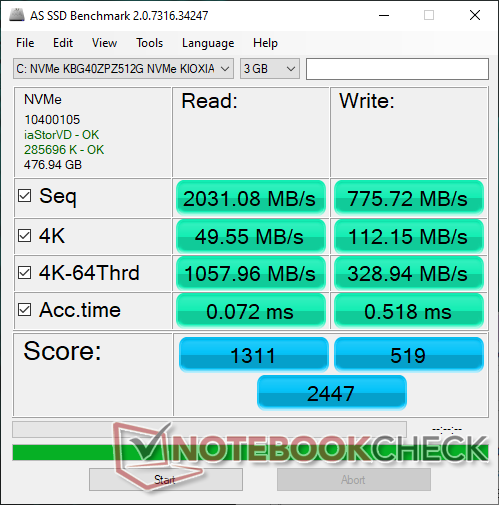
| Dell XPS 13 9310 2-in-1 Toshiba BG4 KBG40ZPZ512G | Dell XPS 13 9310 Core i7 FHD Micron 2300 512GB MTFDHBA512TDV | Dell XPS 13 7390 2-in-1 Core i7 Toshiba BG4 KBG40ZPZ512G | Lenovo Yoga 6 13 82ND0009US WDC PC SN530 SDBPMPZ-265G | Samsung Galaxy Book Pro 360 13 Samsung PM991 MZVLQ256HAJD | |
|---|---|---|---|---|---|
| AS SSD | 70% | 2% | -28% | 15% | |
| Seq Read (MB/s) | 2031 | 2091 3% | 1801 -11% | 1860 -8% | 1771 -13% |
| Seq Write (MB/s) | 776 | 1396 80% | 1125 45% | 500 -36% | 894 15% |
| 4K Read (MB/s) | 49.55 | 49.29 -1% | 39.7 -20% | 36.26 -27% | 53.5 8% |
| 4K Write (MB/s) | 112.2 | 104.2 -7% | 67 -40% | 118.6 6% | 157.8 41% |
| 4K-64 Read (MB/s) | 1058 | 827 -22% | 1253 18% | 419 -60% | 478.1 -55% |
| 4K-64 Write (MB/s) | 328.9 | 1636 397% | 209 -36% | 219 -33% | 741 125% |
| Access Time Read * (ms) | 0.072 | 0.066 8% | 0.069 4% | 0.102 -42% | 0.156 -117% |
| Access Time Write * (ms) | 0.518 | 0.365 30% | 0.625 -21% | 0.17 67% | 0.023 96% |
| Score Read (Points) | 1311 | 1086 -17% | 1472 12% | 641 -51% | 709 -46% |
| Score Write (Points) | 519 | 1880 262% | 388 -25% | 388 -25% | 988 90% |
| Score Total (Points) | 2447 | 3499 43% | 2583 6% | 1300 -47% | 2034 -17% |
| Copy ISO MB/s (MB/s) | 1103 | 1544 40% | 1293 17% | 880 -20% | 960 -13% |
| Copy Program MB/s (MB/s) | 331.7 | 613 85% | 560 69% | 185.3 -44% | 648 95% |
| Copy Game MB/s (MB/s) | 828 | 1451 75% | 927 12% | 212.7 -74% | 882 7% |
| CrystalDiskMark 5.2 / 6 | 24% | -3% | -20% | -12% | |
| Write 4K (MB/s) | 129.6 | 97.5 -25% | 106.7 -18% | 89.2 -31% | 170.6 32% |
| Read 4K (MB/s) | 52.2 | 50.9 -2% | 49.94 -4% | 33.09 -37% | 44.51 -15% |
| Write Seq (MB/s) | 1310 | 1811 38% | 1223 -7% | 988 -25% | 872 -33% |
| Read Seq (MB/s) | 1726 | 1836 6% | 1801 4% | 1322 -23% | 1188 -31% |
| Write 4K Q32T1 (MB/s) | 334.7 | 521 56% | 325.3 -3% | 332.6 -1% | 483.1 44% |
| Read 4K Q32T1 (MB/s) | 447.6 | 357.5 -20% | 551 23% | 389.3 -13% | 284.3 -36% |
| Write Seq Q32T1 (MB/s) | 1410 | 2879 104% | 1224 -13% | 984 -30% | 950 -33% |
| Read Seq Q32T1 (MB/s) | 2390 | 3204 34% | 2350 -2% | 2461 3% | 1872 -22% |
| Total Average (Program / Settings) | 47% /
53% | -1% /
0% | -24% /
-25% | 2% /
6% |
* ... smaller is better

Disk Throttling: DiskSpd Read Loop, Queue Depth 8
GPU Performance — Huge Gains Over Iris Plus G7
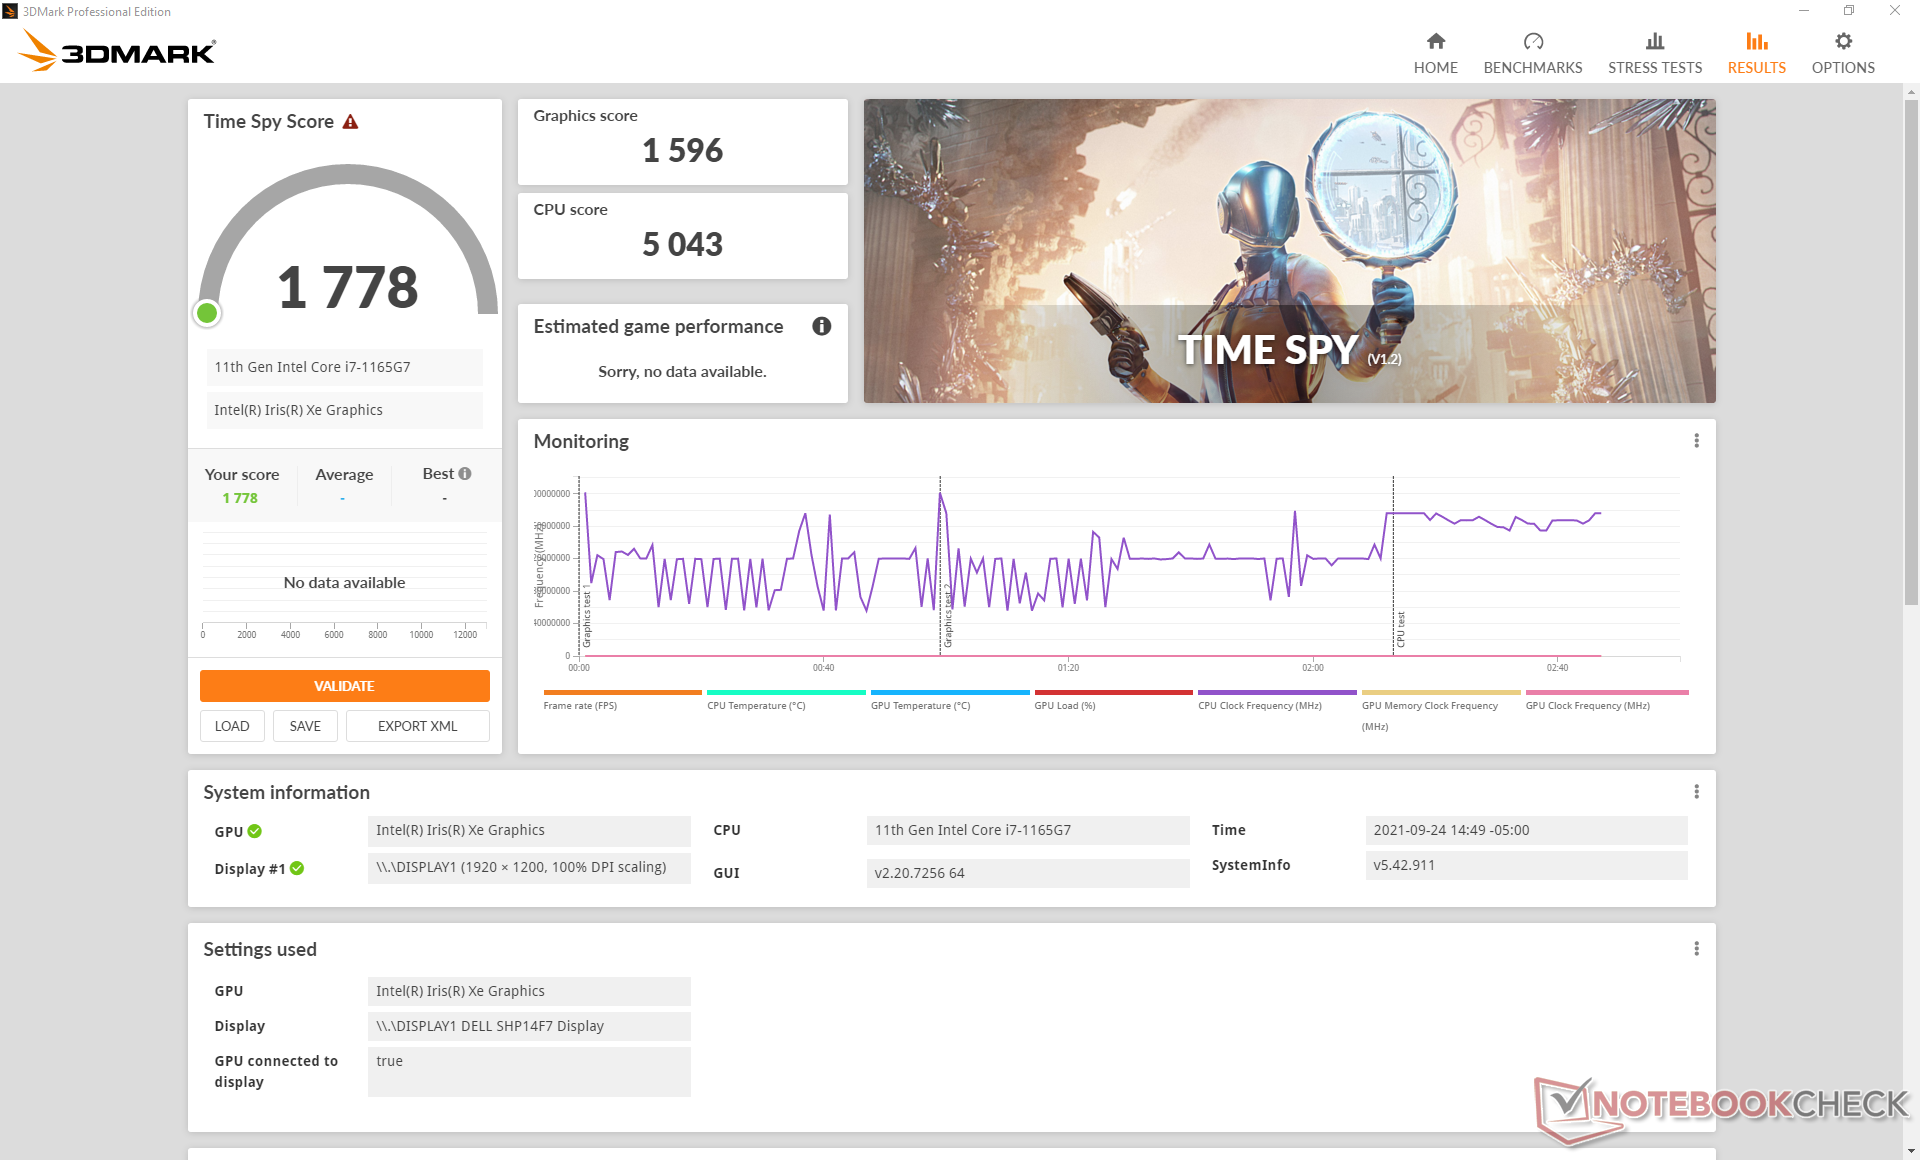
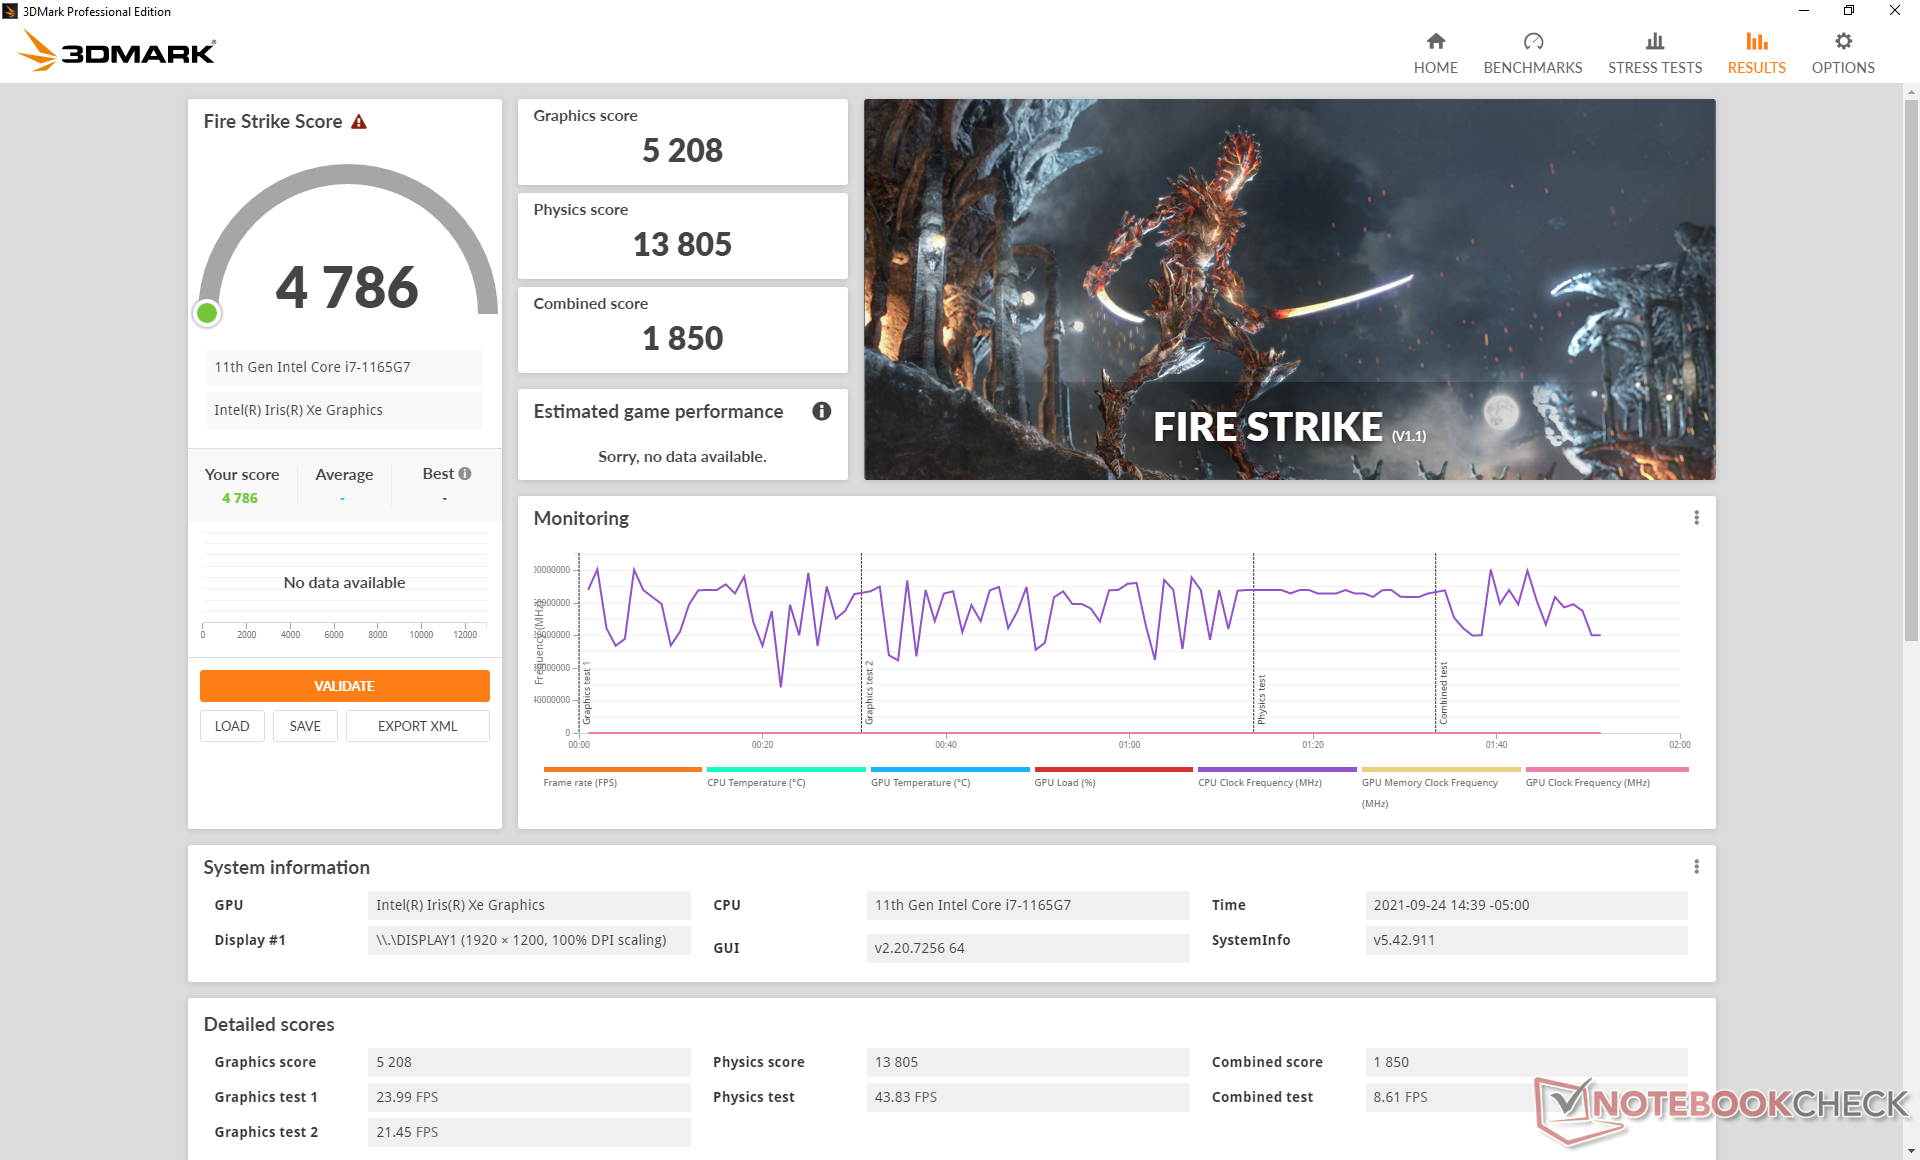
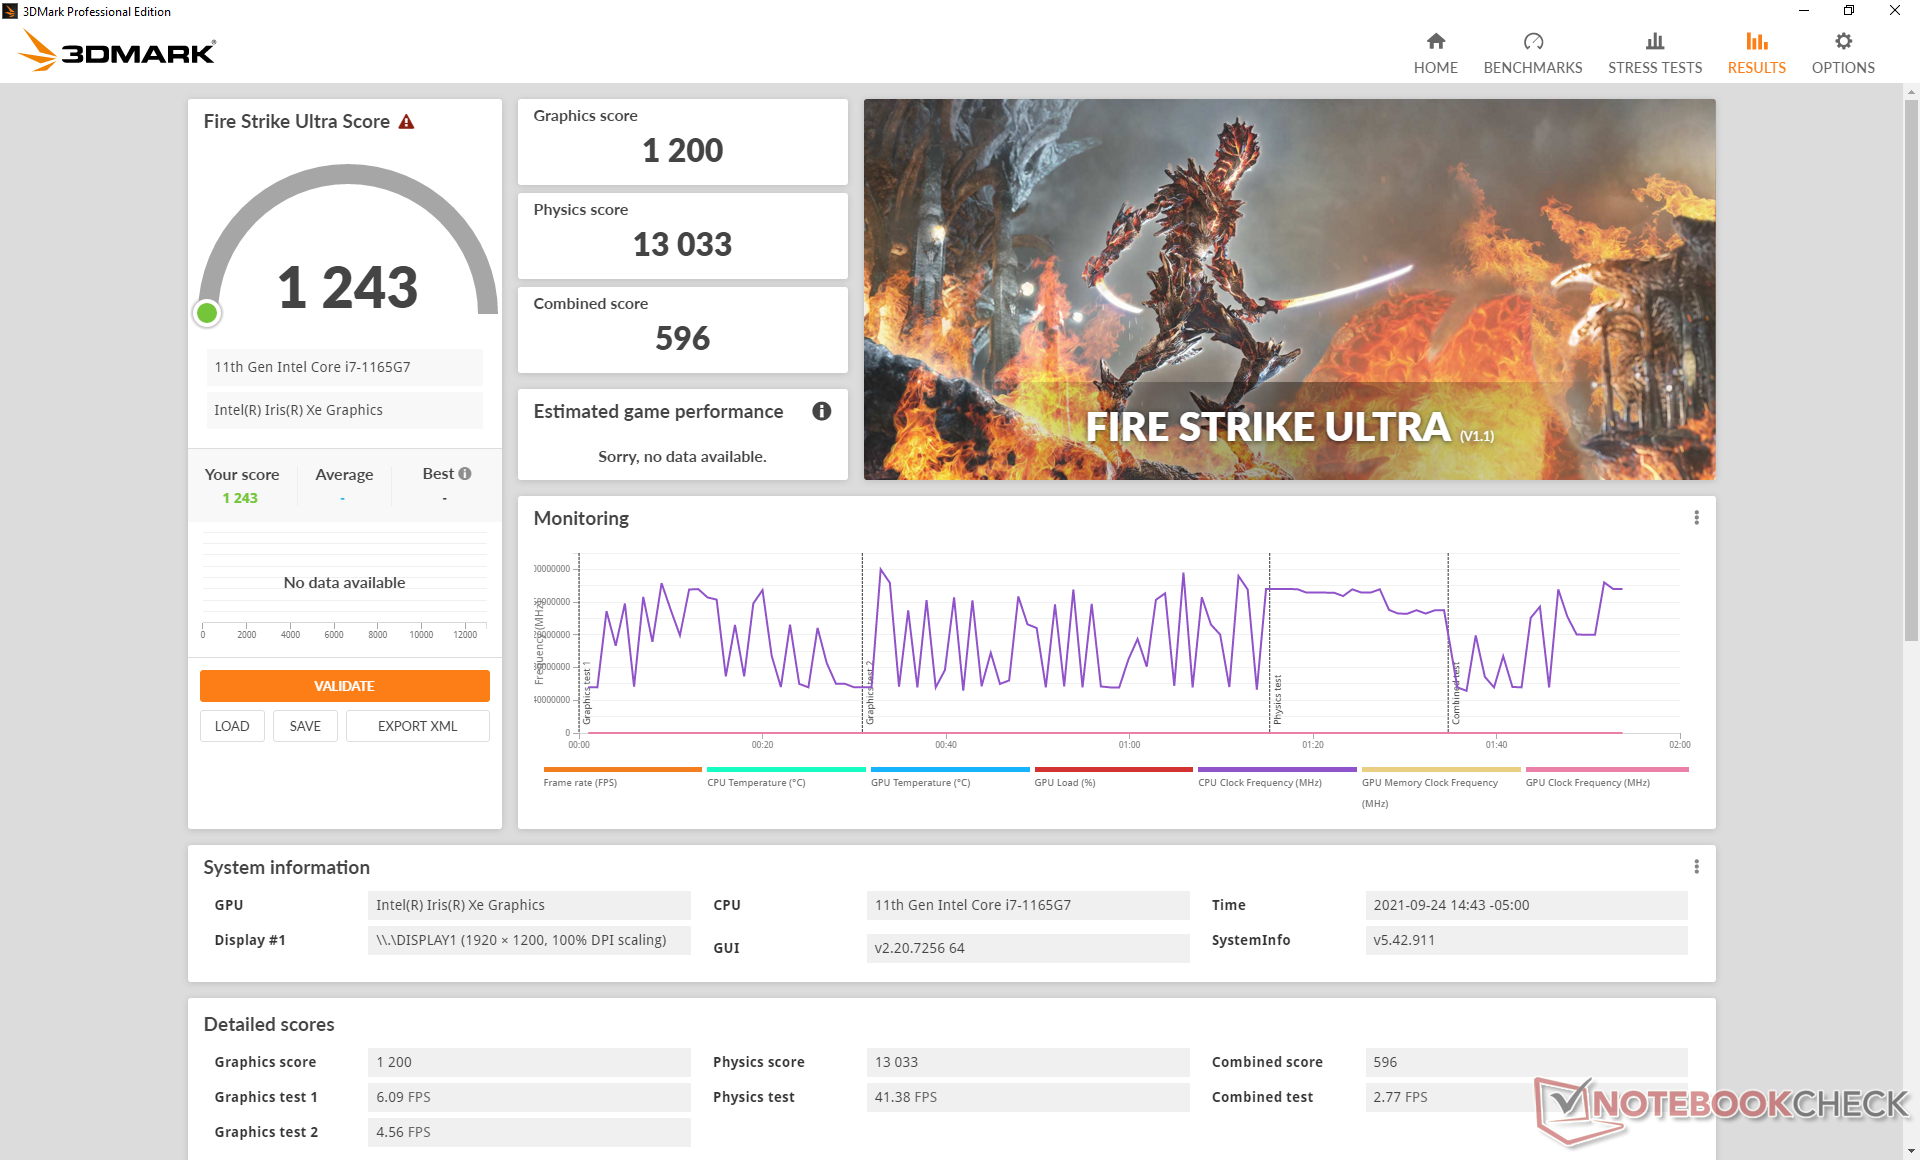
Iris Xe Graphics performance is a significant upgrade from the Iris Plus G7 on last year's XPS 13 7390 2-in-1 by as much as 60 to 90 percent according to 3DMark benchmarks. Users should see the biggest jumps for titles that support DX12 over DX11.
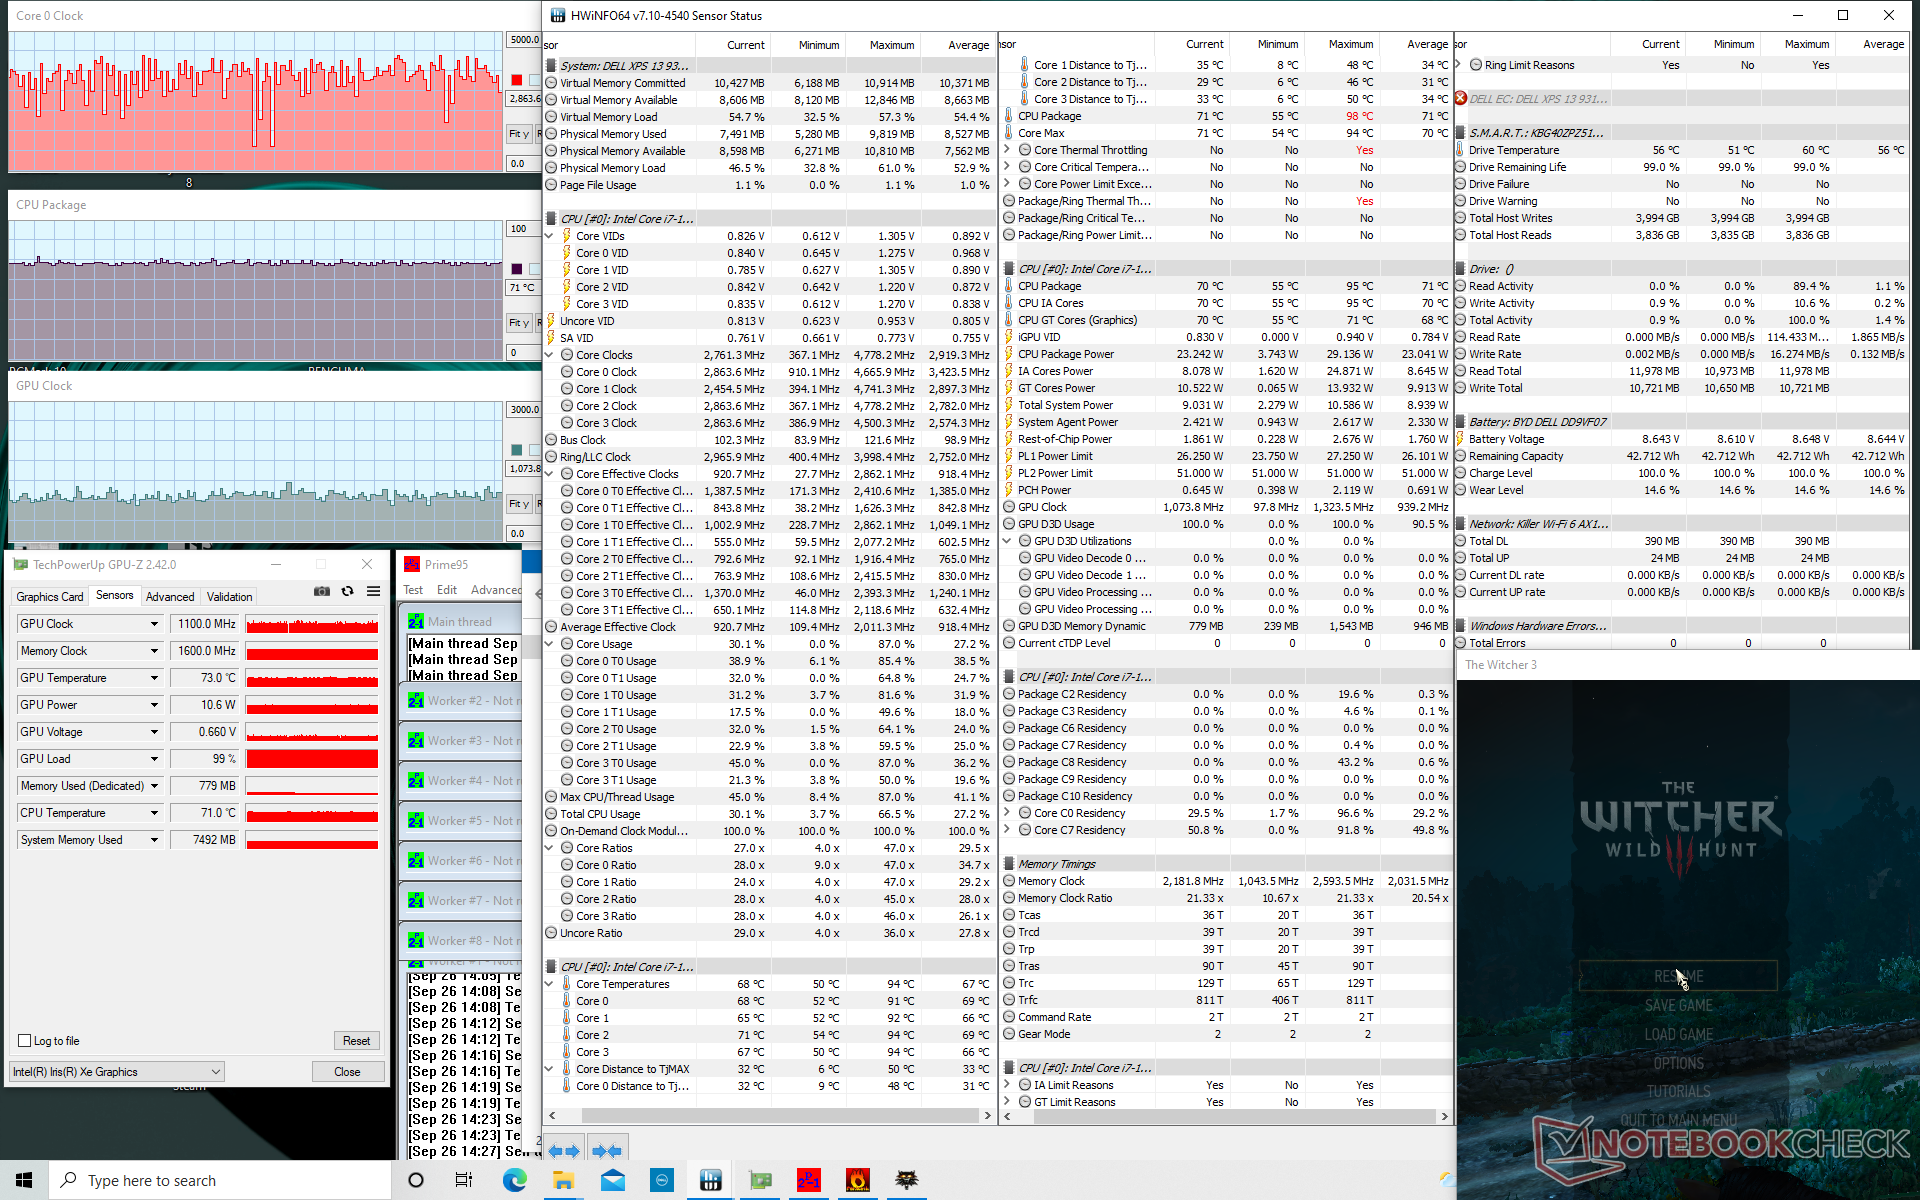
Performance is not always steady, however. For example, simply idling on Witcher 3 at low settings for an hour would result in fluctuating frame rates between 70 and 98 FPS. Thus, while performance is great on average, it may periodically dip slower by quite the margin. This behavior is something we've observed on previous generation XPS 13 models as well.
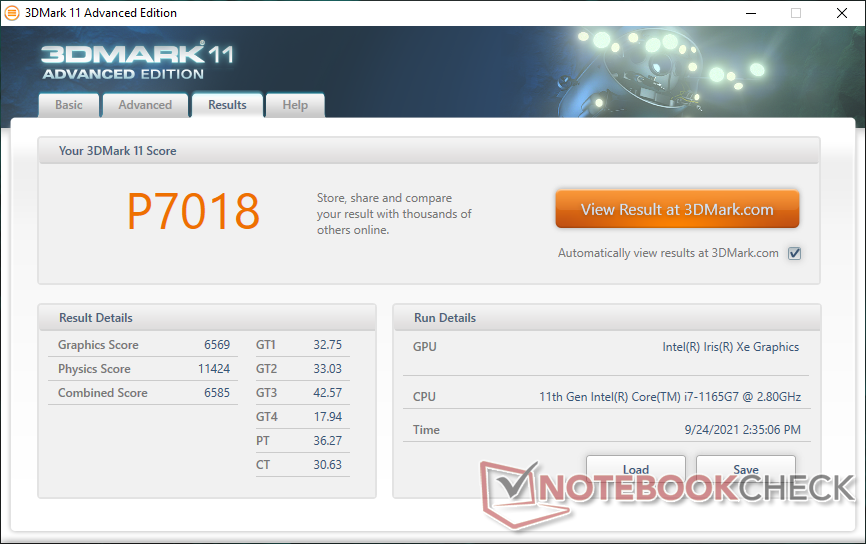
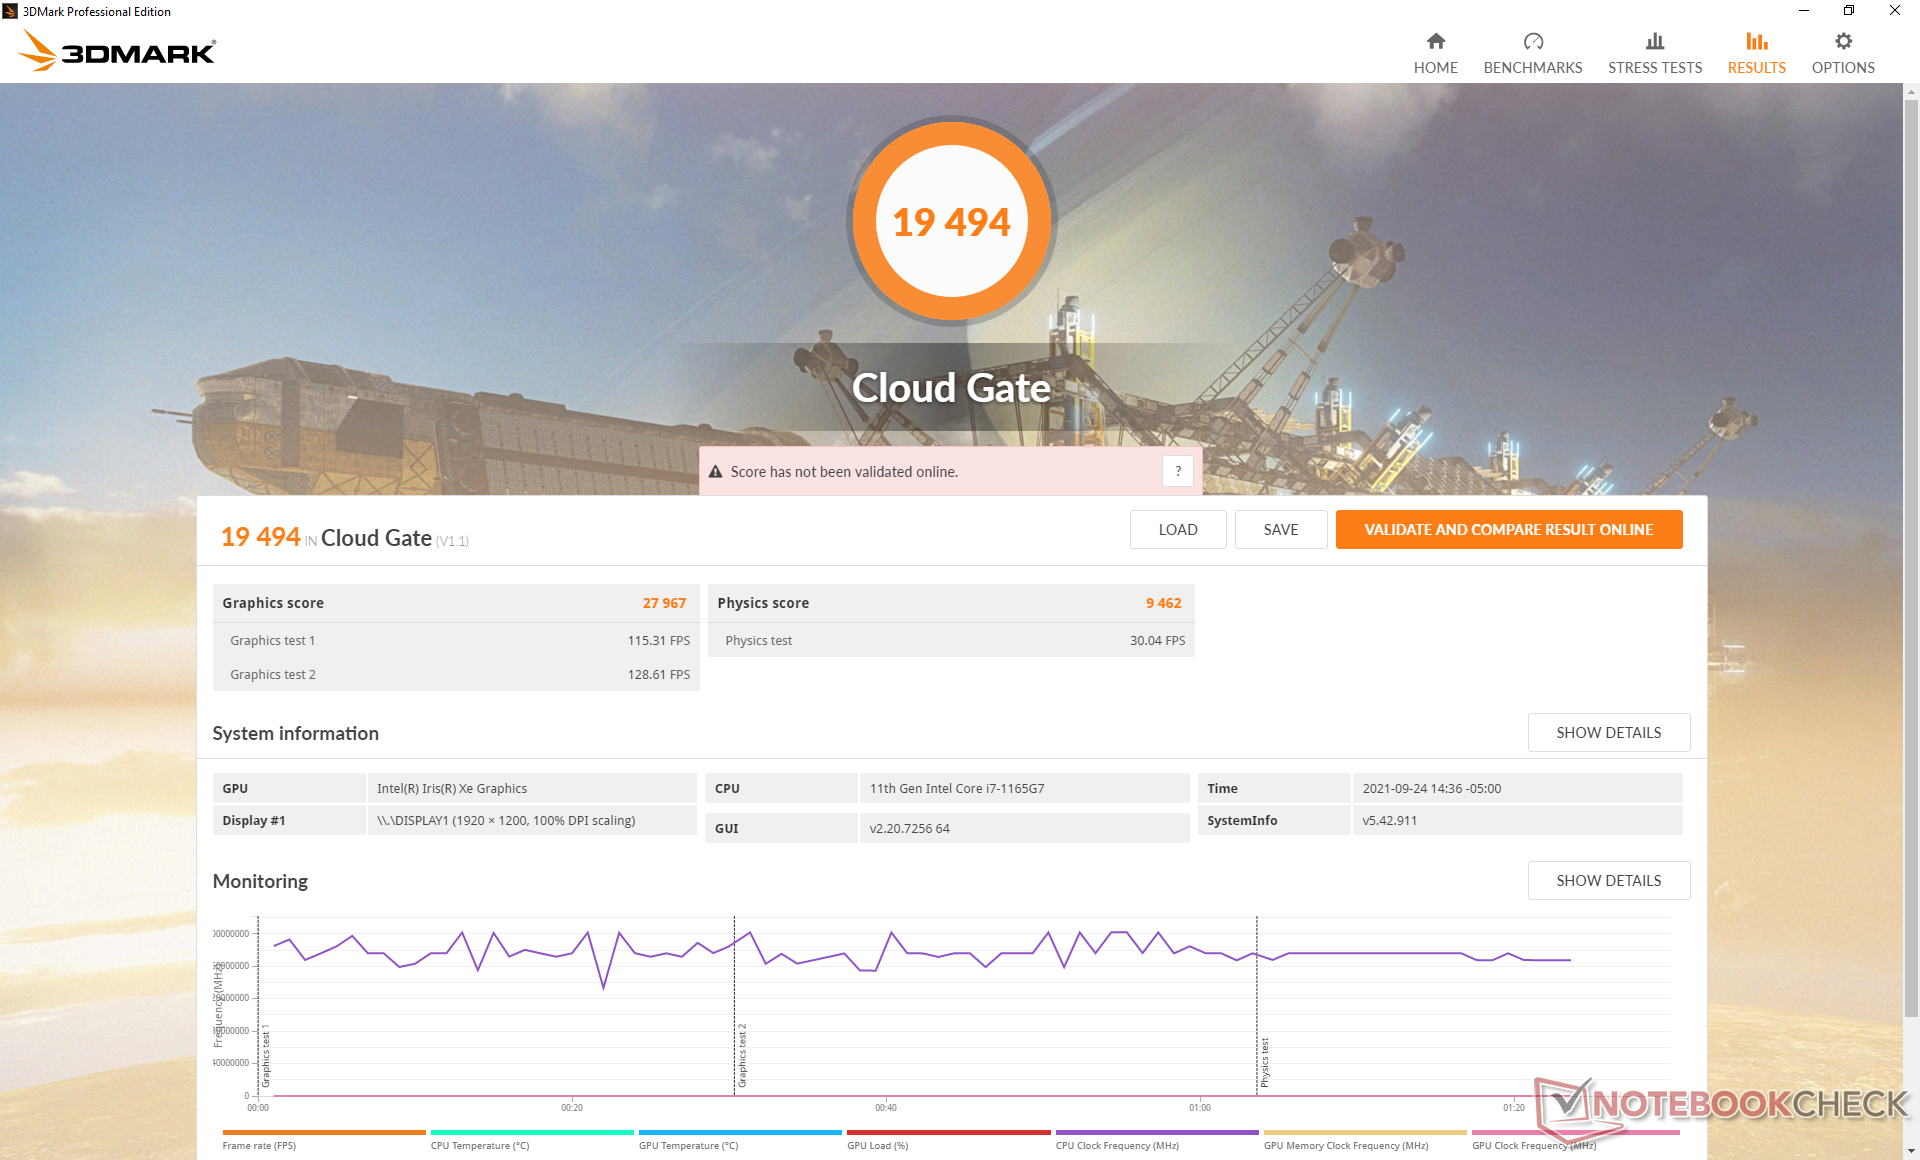
| 3DMark 11 Performance | 7018 points | |
| 3DMark Cloud Gate Standard Score | 19494 points | |
| 3DMark Fire Strike Score | 4786 points | |
| 3DMark Time Spy Score | 1778 points | |
Help | ||
| GTA V | |
| 1024x768 Lowest Settings possible | |
| Lenovo Yoga Slim 7-14ARE | |
| Average Intel Iris Xe Graphics G7 96EUs (52 - 166.4, n=168) | |
| Dell XPS 13 9310 2-in-1 | |
| Lenovo Yoga 6 13 82ND0009US | |
| 1920x1080 Lowest Settings possible | |
| Dell XPS 13 9310 2-in-1 | |
| Average Intel Iris Xe Graphics G7 96EUs (34.7 - 132.1, n=141) | |
| Lenovo Yoga Slim 7-14ARE | |
| Lenovo Yoga 6 13 82ND0009US | |
| 1366x768 Normal/Off AF:4x | |
| Average Intel Iris Xe Graphics G7 96EUs (24.1 - 152.7, n=169) | |
| Dell XPS 13 9310 2-in-1 | |
| 1920x1080 Normal/Off AF:4x | |
| Dell XPS 13 9310 2-in-1 | |
| Lenovo Yoga Slim 7-14ARE | |
| Average Intel Iris Xe Graphics G7 96EUs (20 - 119.3, n=142) | |
| Lenovo Yoga 6 13 82ND0009US | |
| 1920x1080 High/On (Advanced Graphics Off) AA:2xMSAA + FX AF:8x | |
| Lenovo Yoga Slim 7-14ARE | |
| Dell XPS 13 9310 2-in-1 | |
| Average Intel Iris Xe Graphics G7 96EUs (9.39 - 51.6, n=162) | |
| Lenovo Yoga 6 13 82ND0009US | |
| 1920x1080 Highest AA:4xMSAA + FX AF:16x | |
| Lenovo Yoga Slim 7-14ARE | |
| Dell XPS 13 9310 2-in-1 | |
| Average Intel Iris Xe Graphics G7 96EUs (4.13 - 22.9, n=156) | |
| Lenovo Yoga 6 13 82ND0009US | |
| Far Cry 5 | |
| 1280x720 Low Preset AA:T | |
| Dell XPS 13 9310 2-in-1 | |
| Average Intel Iris Xe Graphics G7 96EUs (23 - 75, n=93) | |
| 1920x1080 Low Preset AA:T | |
| Average Intel Iris Xe Graphics G7 96EUs (15 - 48, n=41) | |
| Dell XPS 13 9310 2-in-1 | |
| 1920x1080 Medium Preset AA:T | |
| Average Intel Iris Xe Graphics G7 96EUs (14 - 39, n=91) | |
| Dell XPS 13 9310 2-in-1 | |
| 1920x1080 High Preset AA:T | |
| Average Intel Iris Xe Graphics G7 96EUs (10 - 35, n=89) | |
| Dell XPS 13 9310 2-in-1 | |
| 1920x1080 Ultra Preset AA:T | |
| Average Intel Iris Xe Graphics G7 96EUs (11 - 33, n=75) | |
| Dell XPS 13 9310 2-in-1 | |
Witcher 3 FPS Chart
| low | med. | high | ultra | |
|---|---|---|---|---|
| GTA V (2015) | 96.7 | 80.5 | 25.4 | 10 |
| The Witcher 3 (2015) | 86.2 | 54.3 | 29.9 | 14.7 |
| Dota 2 Reborn (2015) | 109 | 61.4 | 52.8 | 52.8 |
| Final Fantasy XV Benchmark (2018) | 36.8 | 21.8 | 15.9 | |
| X-Plane 11.11 (2018) | 23.5 | 31.9 | 31.3 | |
| Far Cry 5 (2018) | 49 | 23 | 22 | 22 |
| Strange Brigade (2018) | 78.1 | 36.8 | 29.4 | 24 |
Emissions
System Noise — Quiet under Most Low-to-Medium Loads
Fan behavior is nearly identical to what we observed on the XPS 13 7390 2-in-1. The main difference is that fan noise may boost sooner when running high loads like 3DMark 06 possibly due to the higher Turbo Boost and PL2 limits of Tiger Lake-U when compared to Ice Lake. Otherwise, users can expect a fan noise between 38 to 43 dB(A) when running demanding loads or up to 27.2 dB(A) when video streaming or web browsing against a silent background of 24.3 dB(A). The new Galaxy Book Pro 360 13 would exhibit similar results.
| Dell XPS 13 9310 2-in-1 Iris Xe G7 96EUs, i7-1165G7, Toshiba BG4 KBG40ZPZ512G | Dell XPS 13 9310 Core i7 FHD Iris Xe G7 96EUs, i7-1165G7, Micron 2300 512GB MTFDHBA512TDV | Dell XPS 13 7390 2-in-1 Core i7 Iris Plus Graphics G7 (Ice Lake 64 EU), i7-1065G7, Toshiba BG4 KBG40ZPZ512G | Lenovo Yoga 6 13 82ND0009US Vega 7, R5 5500U, WDC PC SN530 SDBPMPZ-265G | Asus ZenBook Flip 13 UX363EA-HP069T Iris Xe G7 96EUs, i7-1165G7, WDC PC SN730 SDBPNTY-1T00 | Samsung Galaxy Book Pro 360 13 Iris Xe G7 80EUs, i5-1135G7, Samsung PM991 MZVLQ256HAJD | |
|---|---|---|---|---|---|---|
| Noise | 4% | -8% | -1% | -12% | -7% | |
| off / environment * (dB) | 24.3 | 25.7 -6% | 28.1 -16% | 25.1 -3% | 27 -11% | 27 -11% |
| Idle Minimum * (dB) | 24.8 | 25.7 -4% | 28.1 -13% | 25.1 -1% | 27 -9% | 27 -9% |
| Idle Average * (dB) | 24.8 | 25.7 -4% | 28.1 -13% | 25.1 -1% | 27 -9% | 27 -9% |
| Idle Maximum * (dB) | 24.8 | 25.9 -4% | 28.1 -13% | 25.1 -1% | 27 -9% | 27 -9% |
| Load Average * (dB) | 38 | 26.2 31% | 31.7 17% | 41 -8% | 46 -21% | 40.7 -7% |
| Witcher 3 ultra * (dB) | 38 | 36.5 4% | 43.4 -14% | 38.6 -2% | ||
| Load Maximum * (dB) | 41.5 | 36.6 12% | 43.4 -5% | 38.7 7% | 46.6 -12% | 40.7 2% |
* ... smaller is better
Noise level
| Idle |
| 24.8 / 24.8 / 24.8 dB(A) |
| Load |
| 38 / 41.5 dB(A) |
 | ||
30 dB silent 40 dB(A) audible 50 dB(A) loud |
||
min: | ||
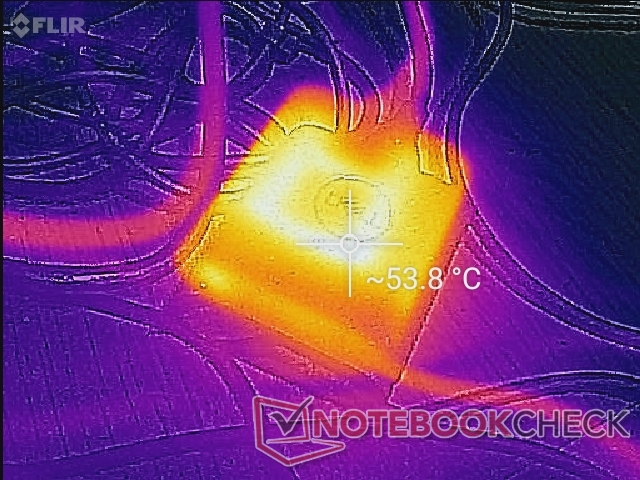
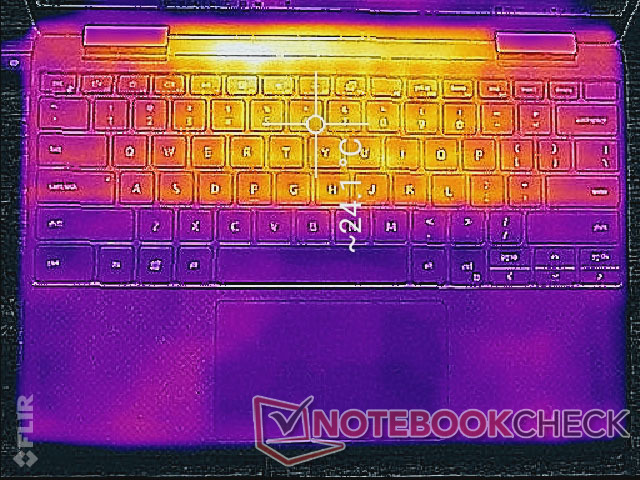
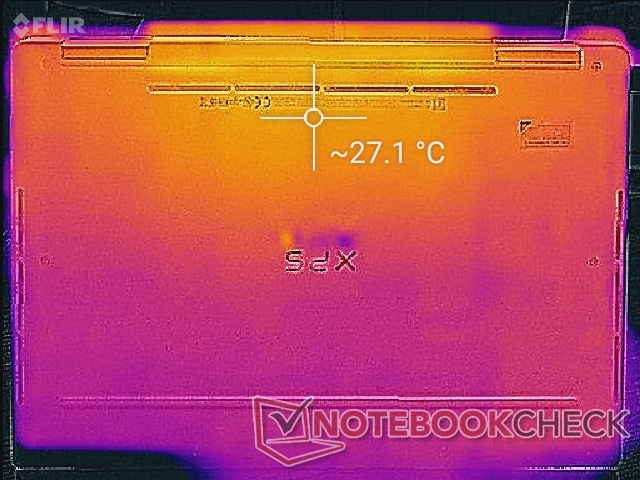
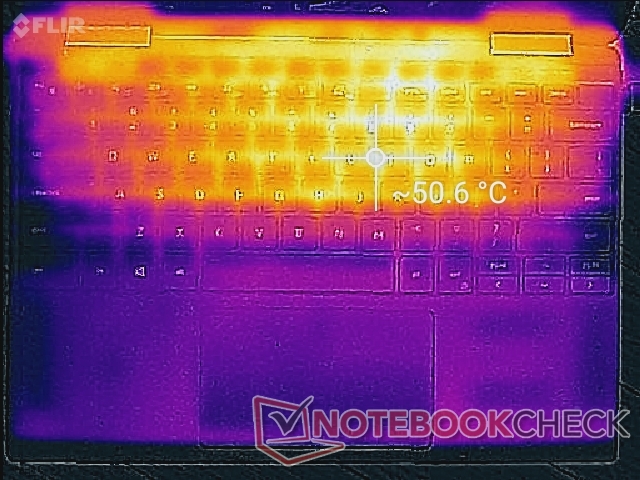
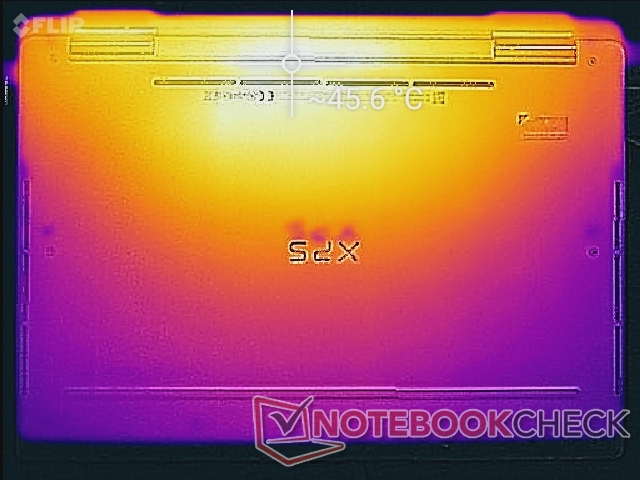
Temperature — Relatively Cool Palm Rests
Surface temperatures are nearly identical to what we observed on the Ice Lake-powered XPS 13 7390 2-in-1 at about 50 C and 57 C on the top and bottom hot spots, respectively. The keyboard deck continues to be noticeably warmer than on most other subnotebooks including the new Samsung Galaxy Book Pro 360.
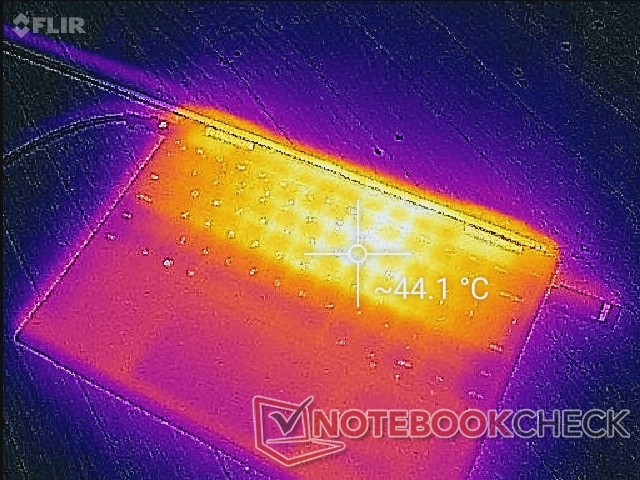
(-) The maximum temperature on the upper side is 51 °C / 124 F, compared to the average of 35.4 °C / 96 F, ranging from 19.6 to 60 °C for the class Convertible.
(-) The bottom heats up to a maximum of 45.4 °C / 114 F, compared to the average of 36.9 °C / 98 F
(+) In idle usage, the average temperature for the upper side is 22.9 °C / 73 F, compared to the device average of 30.3 °C / 87 F.
(+) The palmrests and touchpad are cooler than skin temperature with a maximum of 30.6 °C / 87.1 F and are therefore cool to the touch.
(-) The average temperature of the palmrest area of similar devices was 28 °C / 82.4 F (-2.6 °C / -4.7 F).
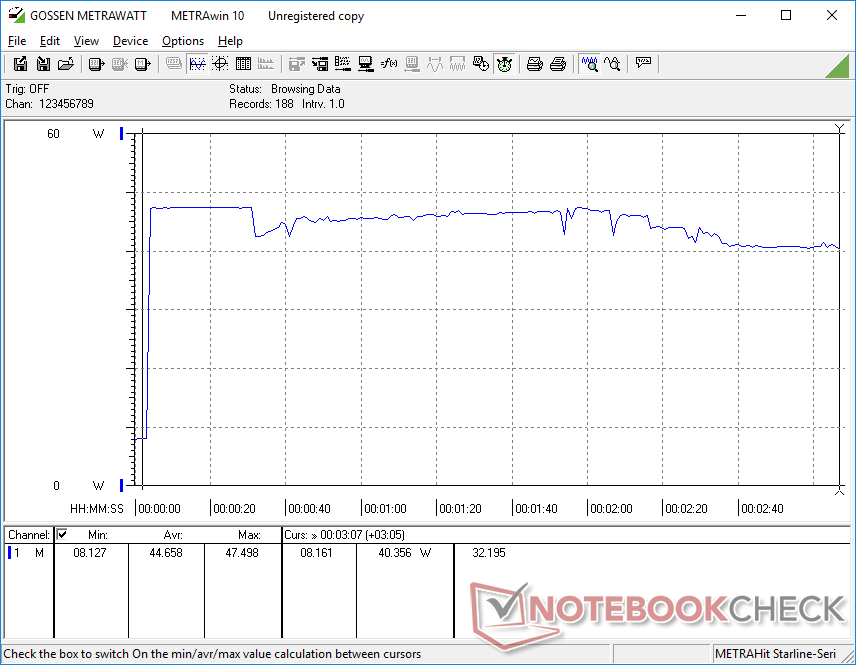
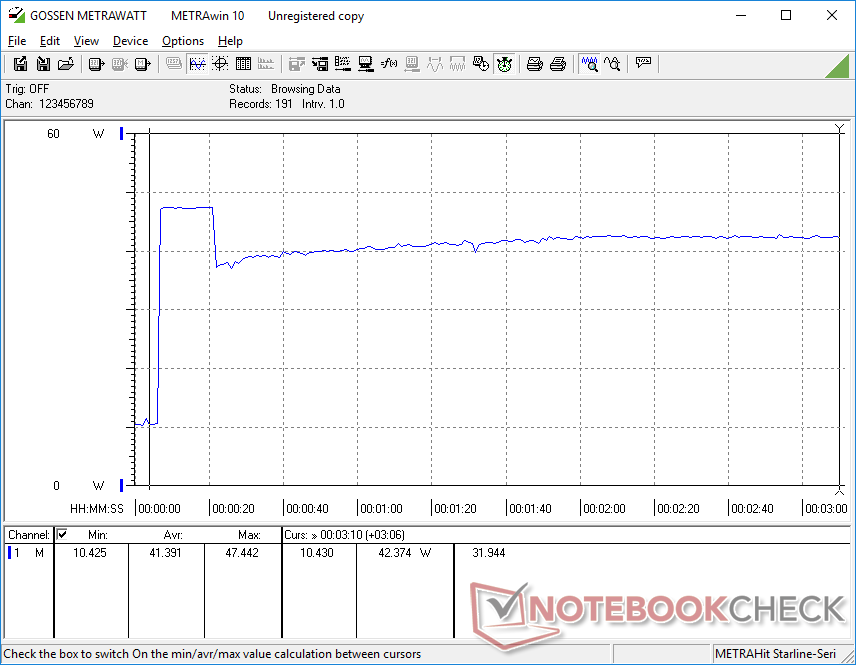
Stress Test — Cycling Clock Rates and Frame Rates
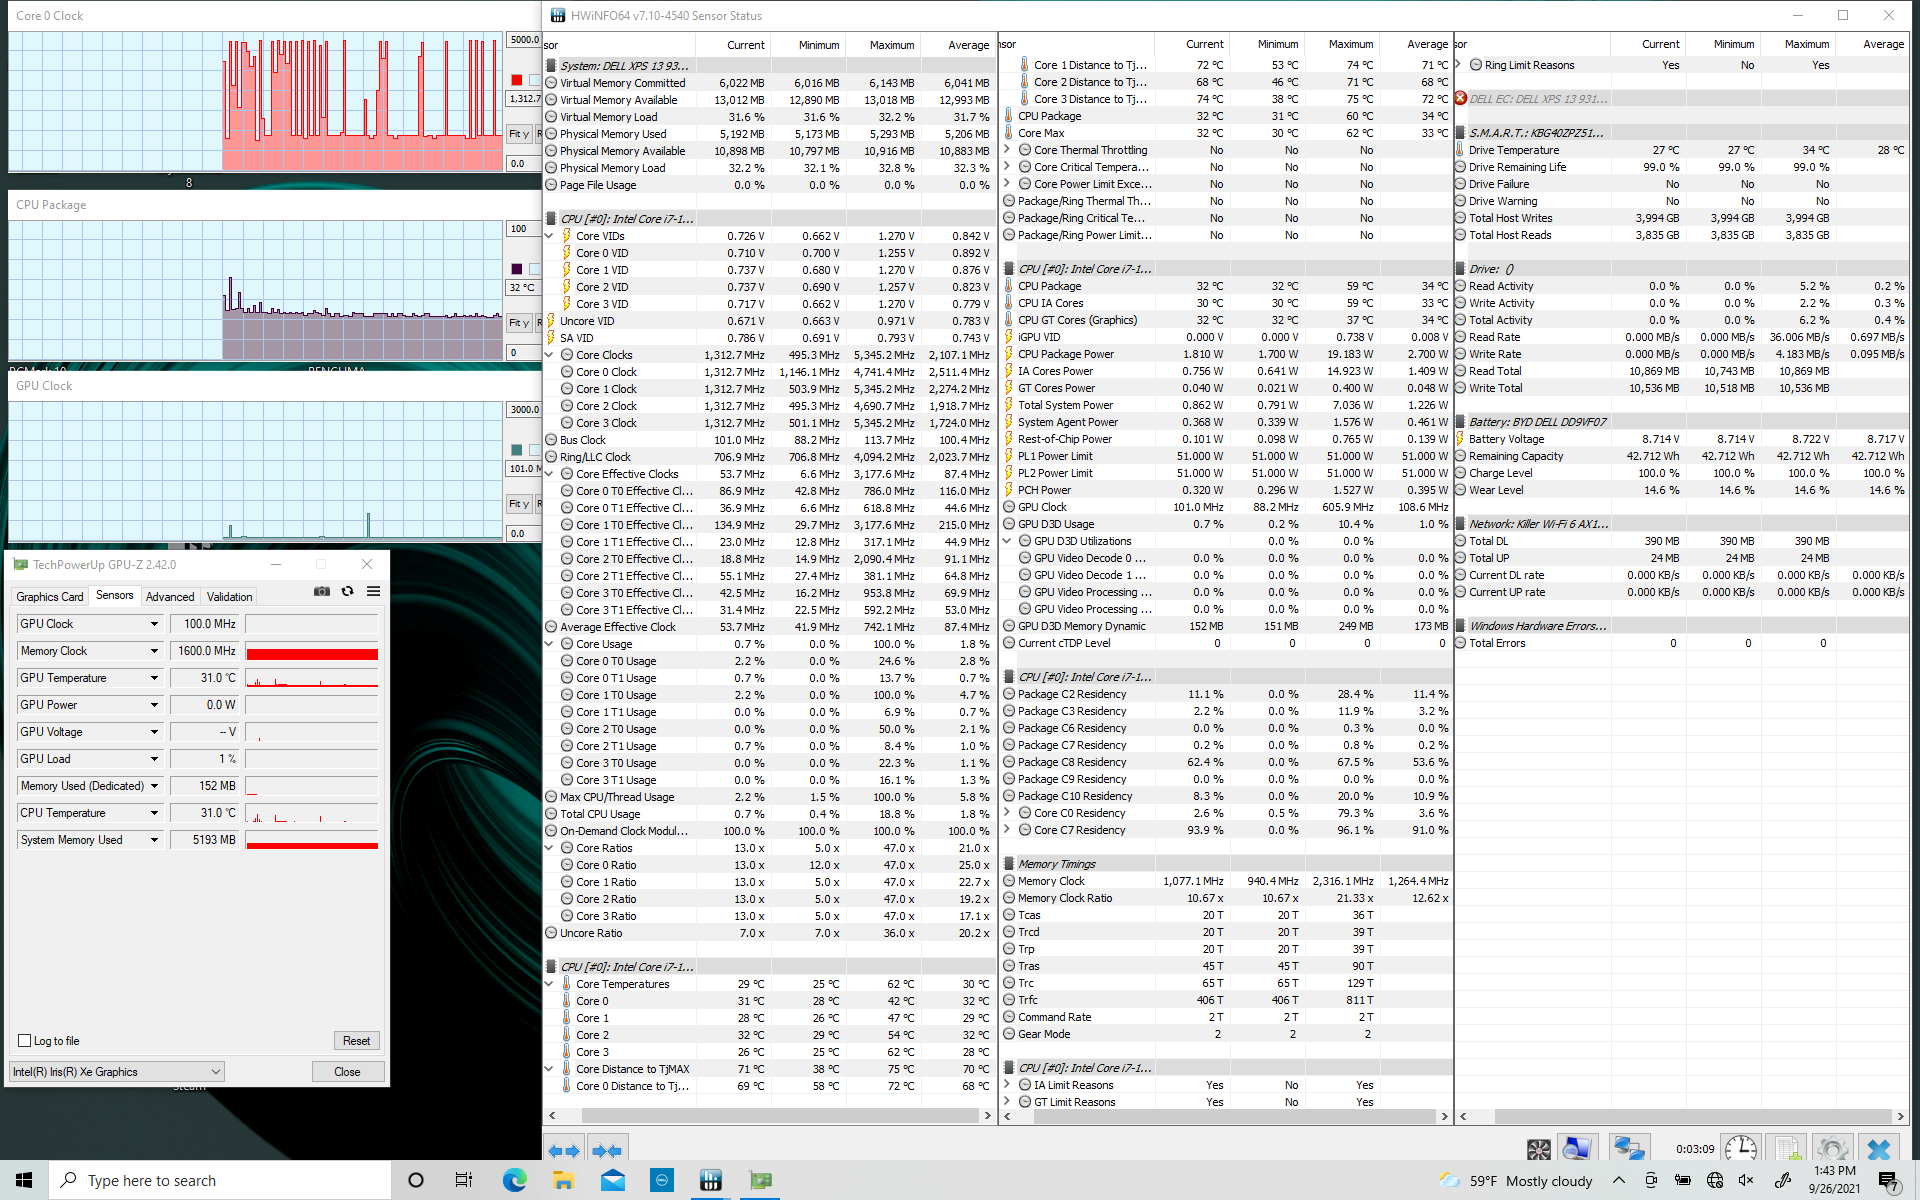
When stressed with Prime95, CPU clock rates and temperature would spike and remain stable up to 2.9 GHz and 100 C for the first couple of minutes. Thereafter, clock rates and temperature would drop and stabilize in the 1.8 to 2.2 GHz and 66 to 75 C range, respectively, even when set to Ultra Performance mode via the Dell Power Manager software. In comparison, the Ice Lake-powered XPS 13 7390 2-in-1 would stabilize at both higher core clock rates and temperatures. Thus, it appears that the newer XPS 13 9310 2-in-1 is aiming for lower core temperatures albeit at the cost of higher Turbo Boost performance. The cycling clock rates when under stress mirror our cycling CineBench R15 xT loop scores from above.
GPU clock rates would also cycle between 800 to 1280 MHz when running Witcher 3 which also mirror our cycling frame rates mentioned above. It's unfortunate that there is no "steady performance option" available on the XPS 13 for users who might prefer it over this cycling behavior.
Running on battery power will limit performance. A 3DMark 11 test on batteries would return Physics and Graphics scores of 9805 and 5106 points, respectively, compared to 11424 and 6569 points when on mains.
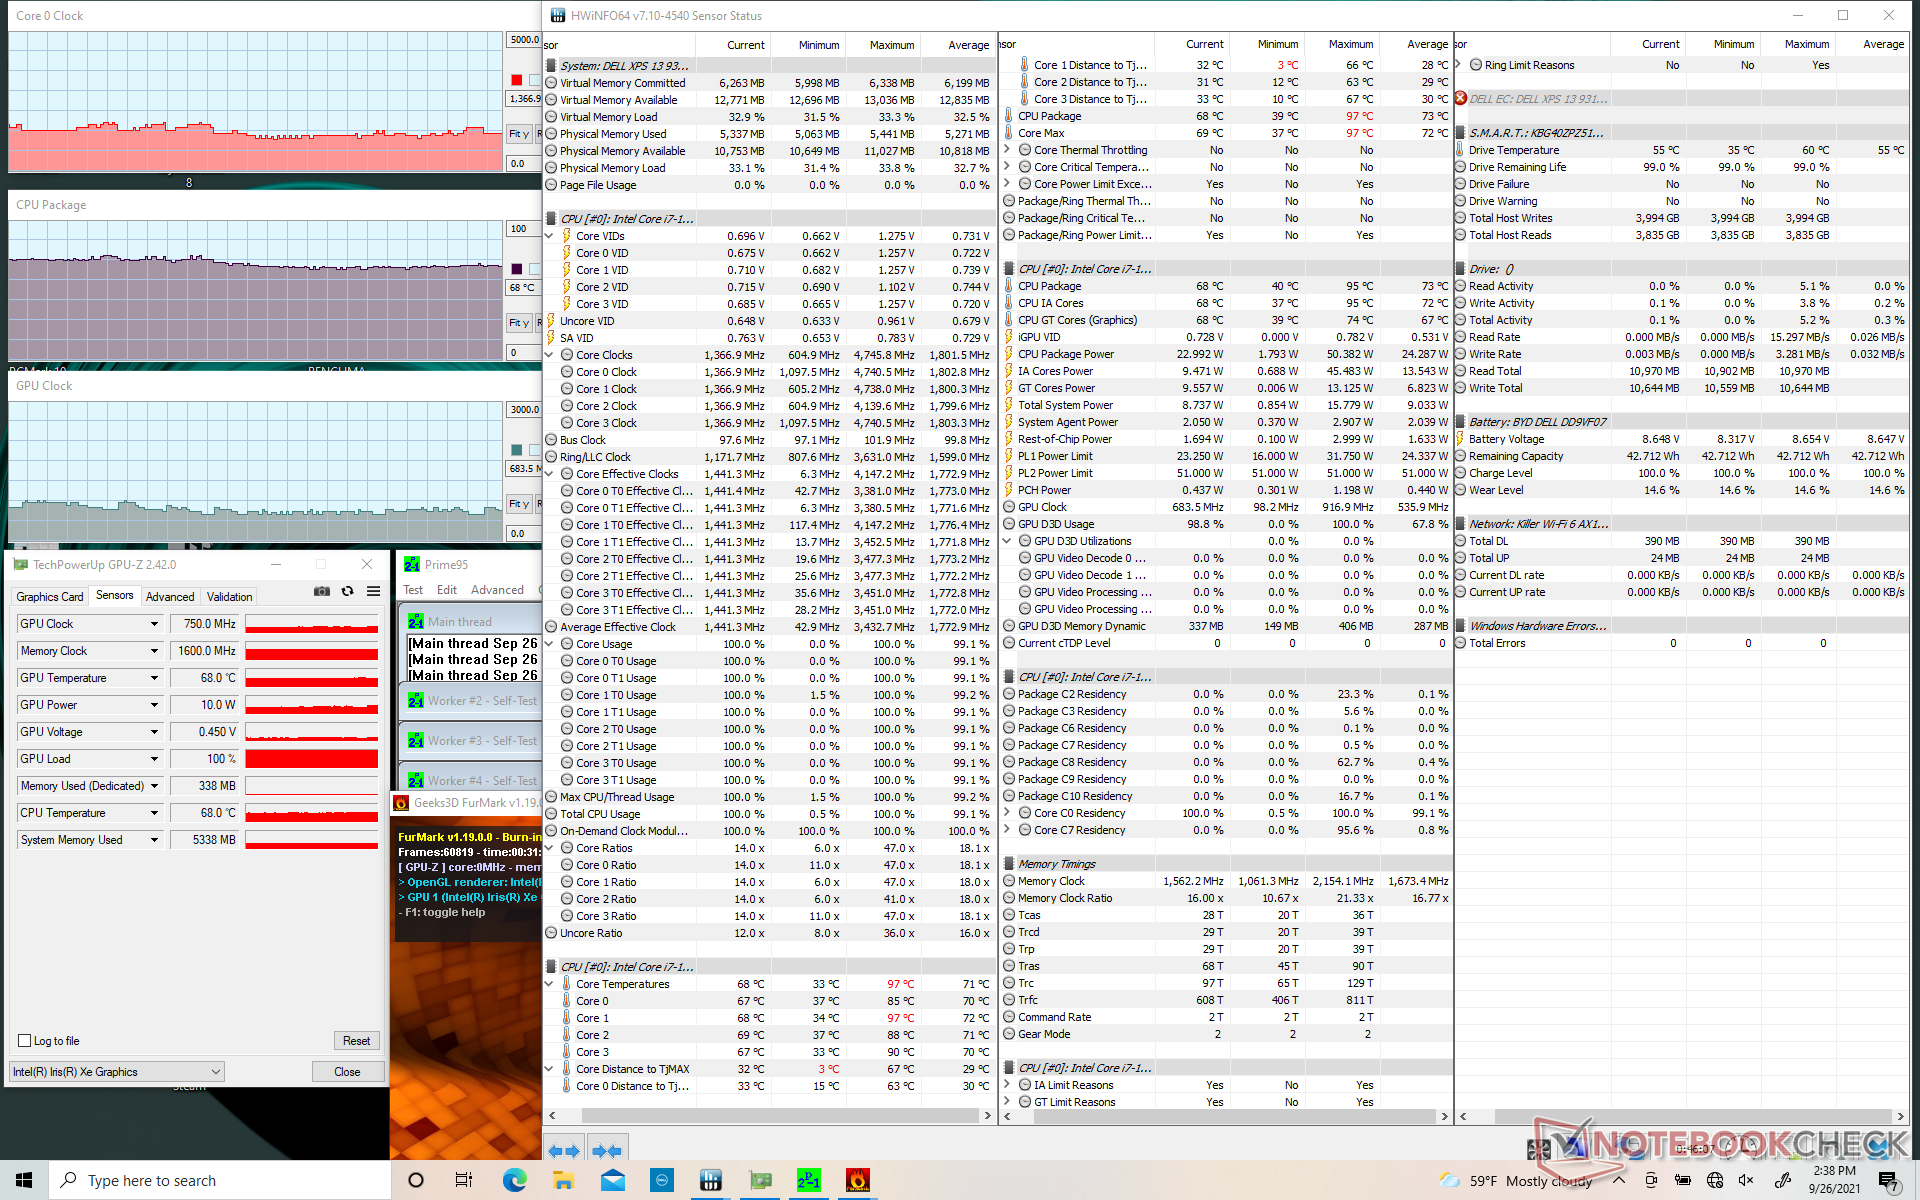
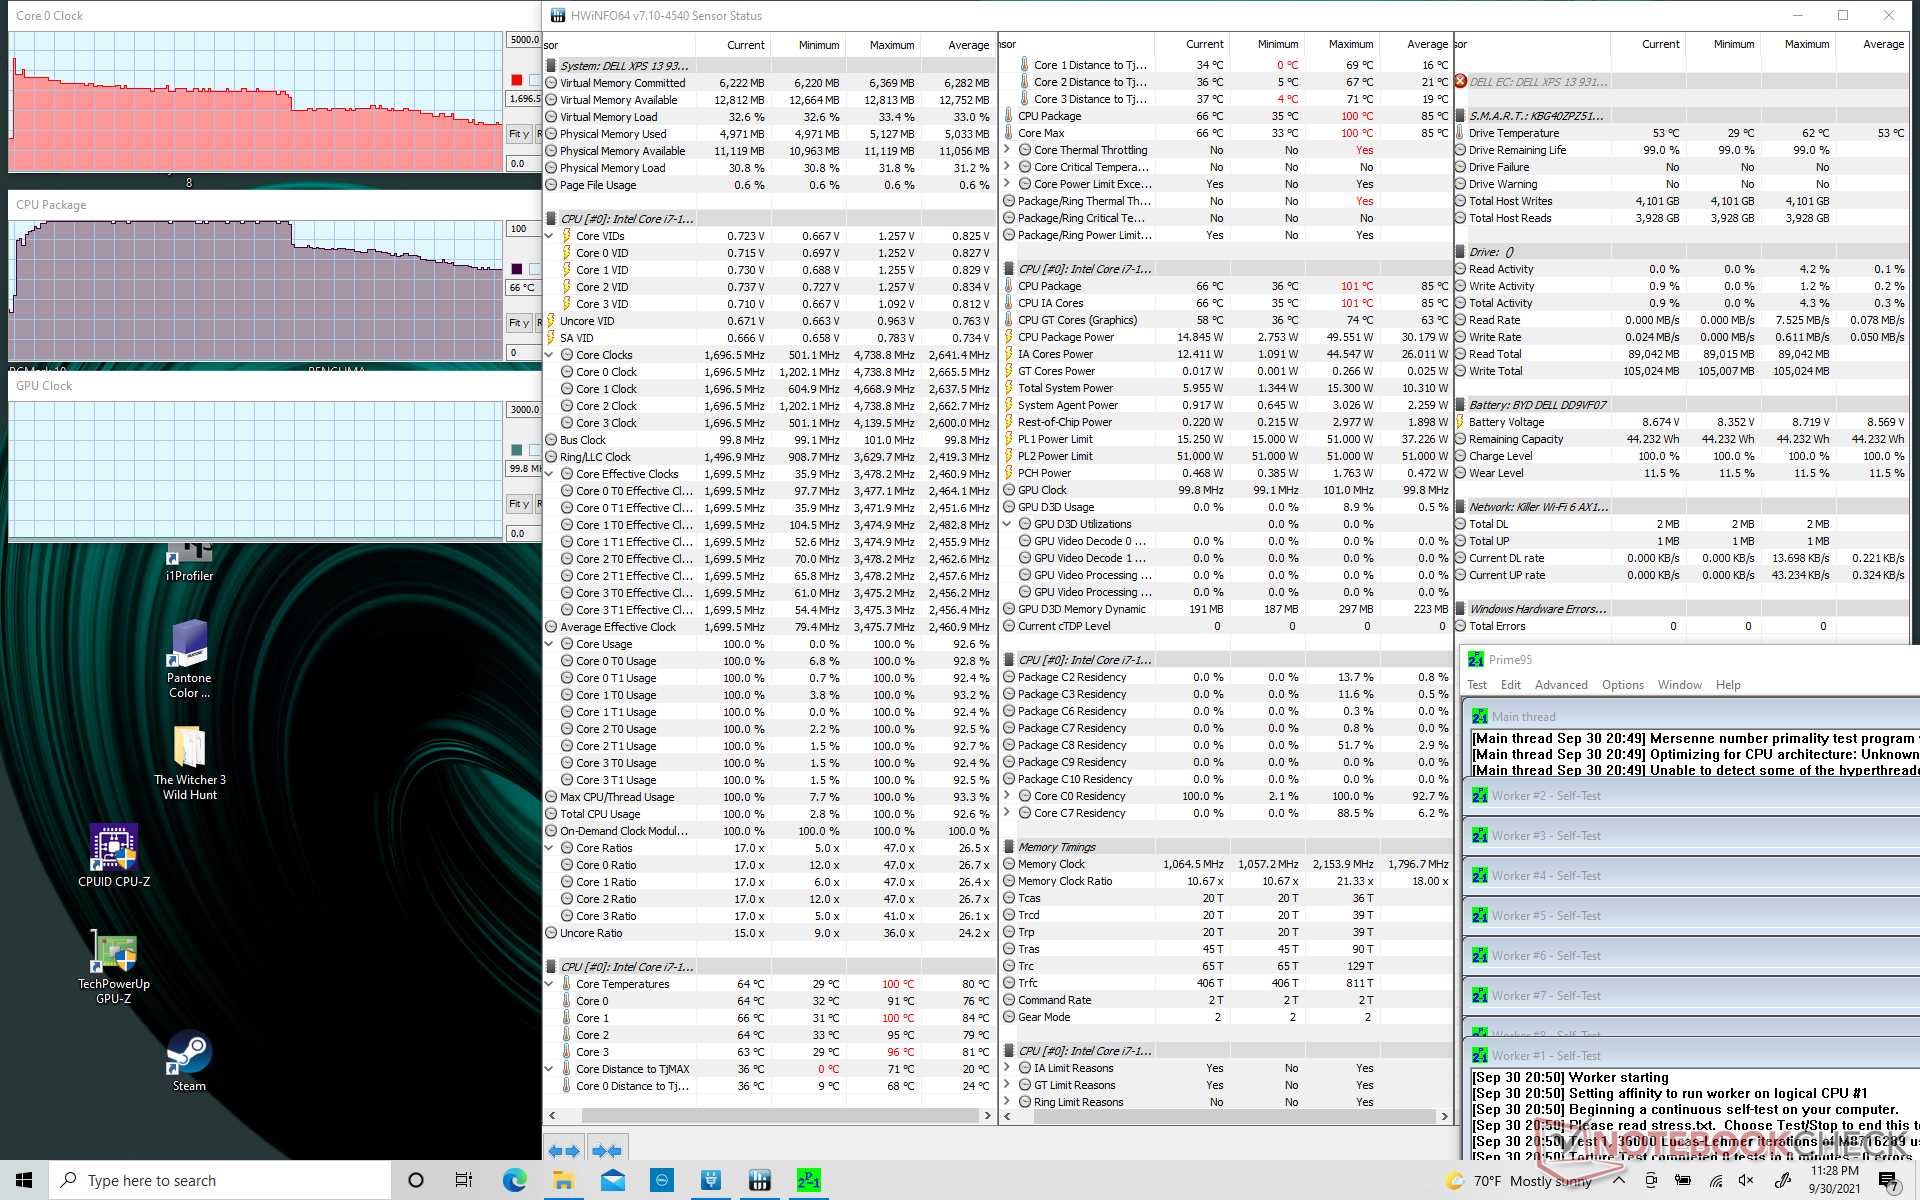

| CPU Clock (GHz) | GPU Clock (MHz) | Average CPU Temperature (°C) | |
| System Idle | -- | -- | 32 |
| Prime95 Stress | 1.8 - 2.2 | -- | 66 - 75 |
| Prime95 + FurMark Stress | 1.4 - 1.6 | ~650 - 750 | 68 |
| Witcher 3 Stress | ~0.6 - 1.4 | ~800 - 1280 | 71 |
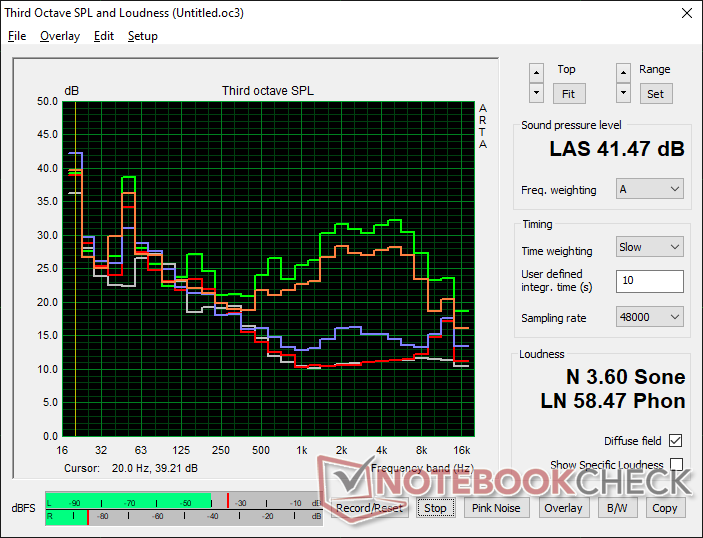
Speakers

Dell XPS 13 9310 2-in-1 audio analysis
(±) | speaker loudness is average but good (80.7 dB)
Bass 100 - 315 Hz
(±) | reduced bass - on average 11.7% lower than median
(±) | linearity of bass is average (10.6% delta to prev. frequency)
Mids 400 - 2000 Hz
(±) | higher mids - on average 6.1% higher than median
(+) | mids are linear (4.1% delta to prev. frequency)
Highs 2 - 16 kHz
(+) | balanced highs - only 1.4% away from median
(+) | highs are linear (3.6% delta to prev. frequency)
Overall 100 - 16.000 Hz
(+) | overall sound is linear (12.7% difference to median)
Compared to same class
» 15% of all tested devices in this class were better, 2% similar, 83% worse
» The best had a delta of 6%, average was 20%, worst was 57%
Compared to all devices tested
» 12% of all tested devices were better, 3% similar, 86% worse
» The best had a delta of 4%, average was 24%, worst was 134%
Apple MacBook 12 (Early 2016) 1.1 GHz audio analysis
(+) | speakers can play relatively loud (83.6 dB)
Bass 100 - 315 Hz
(±) | reduced bass - on average 11.3% lower than median
(±) | linearity of bass is average (14.2% delta to prev. frequency)
Mids 400 - 2000 Hz
(+) | balanced mids - only 2.4% away from median
(+) | mids are linear (5.5% delta to prev. frequency)
Highs 2 - 16 kHz
(+) | balanced highs - only 2% away from median
(+) | highs are linear (4.5% delta to prev. frequency)
Overall 100 - 16.000 Hz
(+) | overall sound is linear (10.2% difference to median)
Compared to same class
» 7% of all tested devices in this class were better, 2% similar, 91% worse
» The best had a delta of 5%, average was 18%, worst was 53%
Compared to all devices tested
» 5% of all tested devices were better, 1% similar, 94% worse
» The best had a delta of 4%, average was 24%, worst was 134%
Energy Management
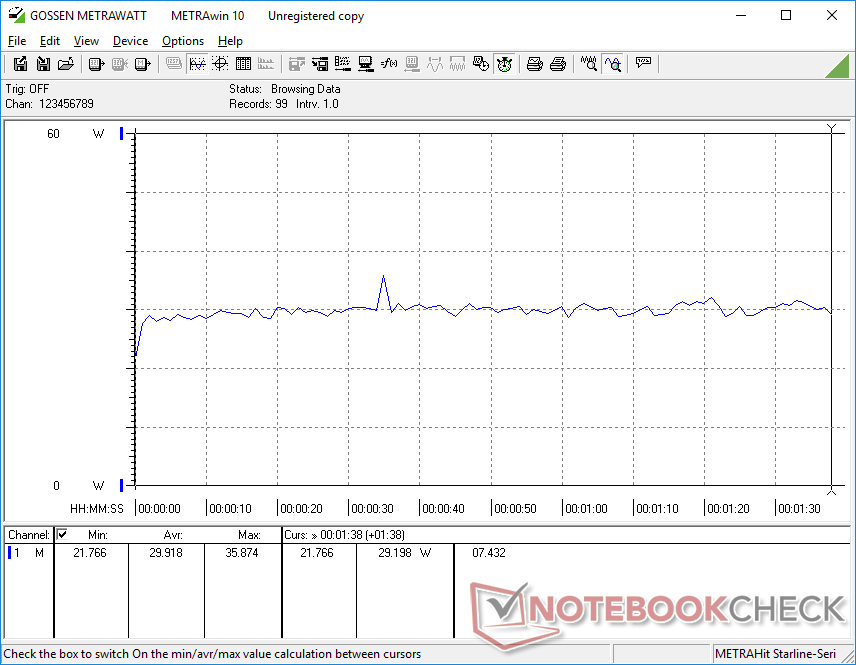
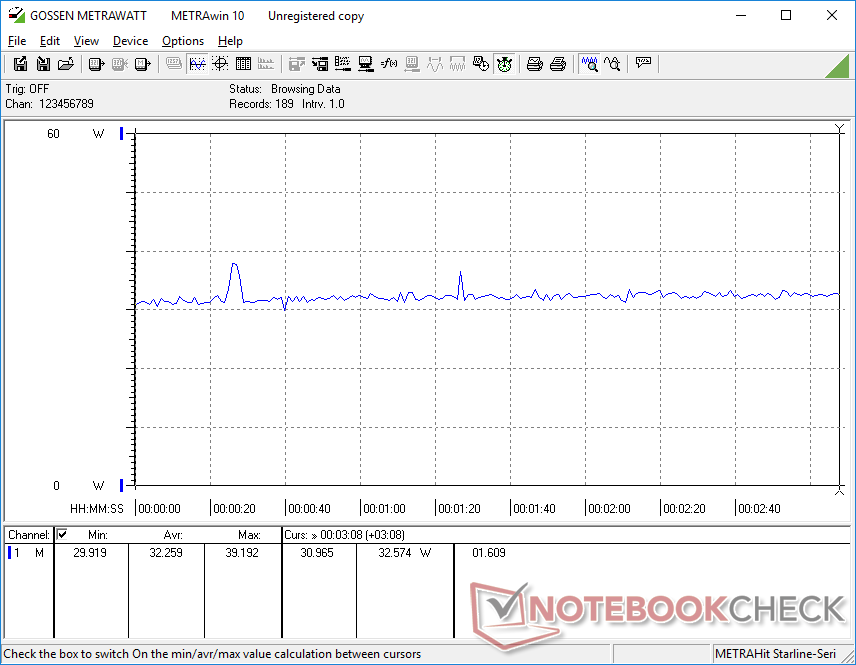
Power Consumption — Much More Power Efficient
The system consumes less power when gaming than on the older XPS 13 7390 2-in-1 despite the substantial increase in graphics performance. This shows how much of a leap Iris Xe can be over the Iris Plus G7 in terms of both power efficiency and performance.
| Off / Standby | |
| Idle | |
| Load |
|
Key:
min: | |
| Dell XPS 13 9310 2-in-1 i7-1165G7, Iris Xe G7 96EUs, Toshiba BG4 KBG40ZPZ512G, IPS, 1920x1200, 13.4" | Dell XPS 13 9310 Core i7 FHD i7-1165G7, Iris Xe G7 96EUs, Micron 2300 512GB MTFDHBA512TDV, IPS, 1920x1200, 13.4" | Dell XPS 13 7390 2-in-1 Core i7 i7-1065G7, Iris Plus Graphics G7 (Ice Lake 64 EU), Toshiba BG4 KBG40ZPZ512G, IPS, 1920x1200, 13.4" | Lenovo Yoga 6 13 82ND0009US R5 5500U, Vega 7, WDC PC SN530 SDBPMPZ-265G, IPS, 1920x1080, 13.3" | Asus ZenBook Flip 13 UX363EA-HP069T i7-1165G7, Iris Xe G7 96EUs, WDC PC SN730 SDBPNTY-1T00, OLED, 1920x1080, 13.3" | Samsung Galaxy Book Pro 360 13 i5-1135G7, Iris Xe G7 80EUs, Samsung PM991 MZVLQ256HAJD, AMOLED, 1920x1080, 13.2" | |
|---|---|---|---|---|---|---|
| Power Consumption | -11% | -9% | -20% | -11% | -22% | |
| Idle Minimum * (Watt) | 2.6 | 3.9 -50% | 2.6 -0% | 5 -92% | 4.4 -69% | 5 -92% |
| Idle Average * (Watt) | 6.4 | 5.9 8% | 5.3 17% | 6.3 2% | 7.4 -16% | 6 6% |
| Idle Maximum * (Watt) | 7.7 | 6.3 18% | 7 9% | 6.9 10% | 11.3 -47% | 11.7 -52% |
| Load Average * (Watt) | 29.9 | 39.7 -33% | 43.1 -44% | 41.5 -39% | 22 26% | 28 6% |
| Witcher 3 ultra * (Watt) | 32.2 | 34.8 -8% | 43.1 -34% | 33.2 -3% | 22.8 29% | 28.3 12% |
| Load Maximum * (Watt) | 47.5 | 47.5 -0% | 49 -3% | 46.5 2% | 42.5 11% | 53 -12% |
* ... smaller is better
Power Consumption Witcher 3 / Stresstest
Battery Life — Double-Digit Runtimes
Runtimes are very close to what we recorded on the XPS 13 9310 clamshell while being almost two hours longer than on the older XPS 13 7390 2-in-1. At 11 hours of real-world WLAN browsing, the battery should be sufficient for a day of productive use.
Charging from empty to full capacity still takes about 1.5 hours. The 45 W USB-C adapter can be used to charge other devices as well.
| Dell XPS 13 9310 2-in-1 i7-1165G7, Iris Xe G7 96EUs, 51 Wh | Dell XPS 13 9310 Core i7 FHD i7-1165G7, Iris Xe G7 96EUs, 52 Wh | Dell XPS 13 7390 2-in-1 Core i7 i7-1065G7, Iris Plus Graphics G7 (Ice Lake 64 EU), 51 Wh | Lenovo Yoga 6 13 82ND0009US R5 5500U, Vega 7, 60 Wh | Asus ZenBook Flip 13 UX363EA-HP069T i7-1165G7, Iris Xe G7 96EUs, 67 Wh | Samsung Galaxy Book Pro 360 13 i5-1135G7, Iris Xe G7 80EUs, 63 Wh | |
|---|---|---|---|---|---|---|
| Battery runtime | 5% | -16% | -16% | -6% | 12% | |
| Reader / Idle (h) | 25.4 | 30 18% | 17.5 -31% | 20.5 -19% | 31.3 23% | |
| WiFi v1.3 (h) | 10.7 | 11 3% | 9 -16% | 13.2 23% | 10.7 0% | 12.1 13% |
| Load (h) | 3.4 | 3.2 -6% | 2 -41% | 3.4 0% | 3.4 0% |
Pros
Cons
Verdict — Faster at No Additional Costs
The XPS 13 9310 2-in-1 offers significantly faster graphics performance than the XPS 13 7390 2-in-1. Better yet, the system accomplishes this under the same power envelope meaning users are getting better graphics without needing to sacrifice battery runtimes, surface temperatures, or fan noise along the way. If you do a lot of graphics editing work, then you will no doubt benefit greatly by moving up to Iris Xe from older UHD Graphics or last year's Iris Plus G7.
Intel Iris Xe has been a huge boon to the XPS 13 series, but the unsteady CPU and GPU clock rates when compared to most other Ultrabooks or subnotebooks may be vexing to some power users.
Unfortunately, processor performance has barely improved from the Core i7 XPS 13 7390 2-in-1. Clock rates tend to fluctuate much more readily on our Core i7 XPS 13 9310 2-in-1 while the lack of any new display options is one less incentive for owning the newer model. As a result, many home users will find little to gain at best from the XPS 13 9310 2-in-1 when compared to the XPS 13 7390 2-in-1 especially when the older model can be found cheaper.
Price and availability
Dell XPS 13 9310 2-in-1
- 10/02/2021 v7 (old)
Allen Ngo
Price comparison
