

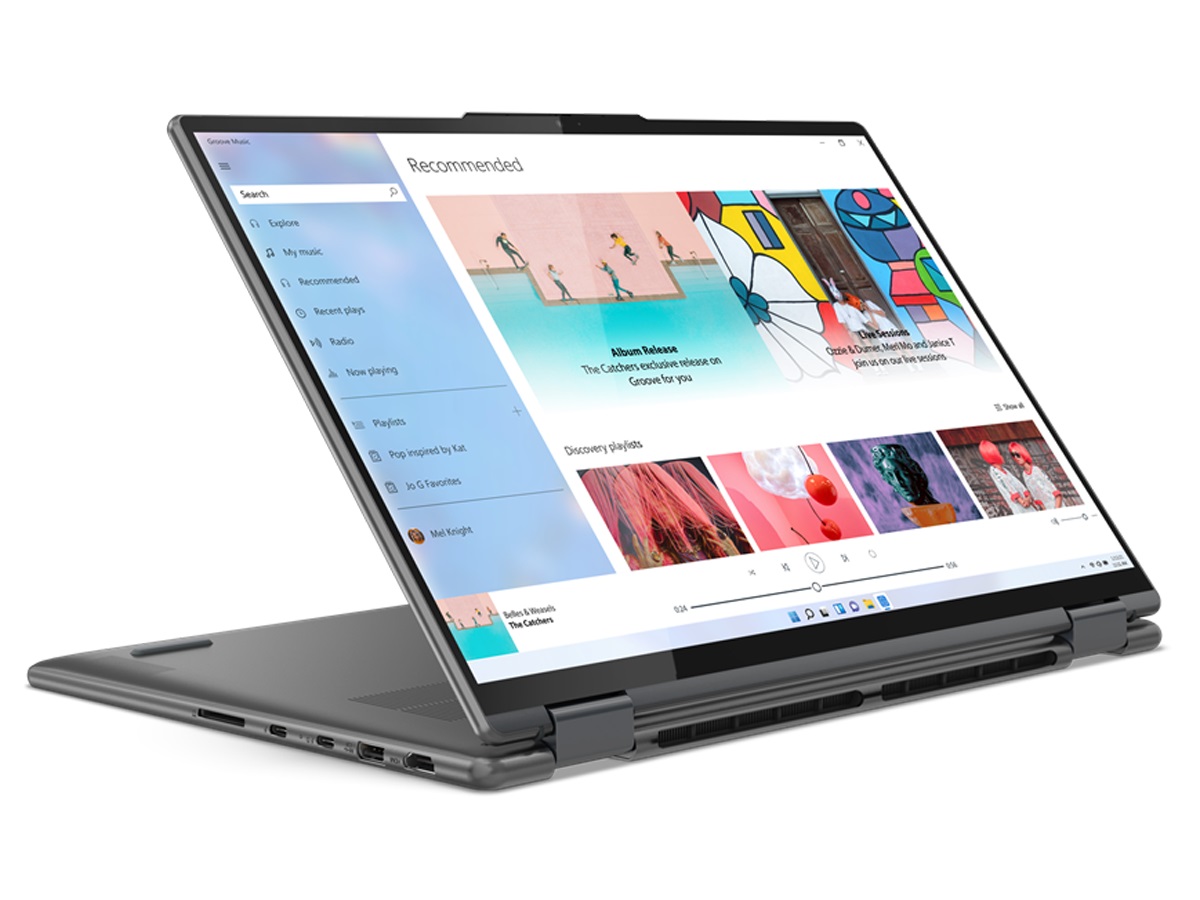
Lenovo Yoga 7 16 Gen 7 review: Massive 16-inch convertible laptop
The Lenovo Yoga 7 16IAP7 is an upper midrange to high-end convertible and the first 16-inch Yoga convertible from the manufacturer. It's also notable for being the first 16-inch convertible to have Core i7-1240P, Core i7-1260P, and Core i7-12700H configurations with the optional Intel Arc A370M discrete GPU. The touchscreen is otherwise fixed at 2560 x 1600 IPS with no other choices.
Our unit in review is one of the lesser configurations with the Core i7-1260P and no discrete Intel graphics for approximately $1400 USD. Alternatives include competing 16-inch models like the Dell Inspiron 16 7620 2-in-1, LG Gram 16 2-in-1, or Huawei MateBook D 16. There aren't many 16-inch convertibles in the market and so the Yoga 7 16IAP7 is one of the few available.
More Lenovo reviews:
Potential Competitors in Comparison
Rating | Date | Model | Weight | Height | Size | Resolution | Price |
|---|---|---|---|---|---|---|---|
| 88.7 % v7 (old) | 08 / 2022 | Lenovo Yoga 7 16IAP7 i7-1260P, Iris Xe G7 96EUs | 2 kg | 19.2 mm | 16.00" | 2560x1600 | |
| 83.6 % v7 (old) | 07 / 2022 | Huawei MateBook D 16 2022 i7-12700H, Iris Xe G7 96EUs | 1.7 kg | 18.4 mm | 16.00" | 1920x1200 | |
| 85.7 % v7 (old) | 06 / 2022 | Dell Inspiron 16 7620 2-in-1 i7-1260P, Iris Xe G7 96EUs | 2.1 kg | 18.41 mm | 16.00" | 1920x1200 | |
| 86.2 % v7 (old) | 07 / 2022 | Acer Swift X SFX16-51G-5388 i5-11320H, GeForce RTX 3050 4GB Laptop GPU | 1.8 kg | 18.9 mm | 16.10" | 1920x1080 | |
| 86.3 % v7 (old) | 06 / 2021 | LG Gram 16 (2021) i7-1165G7, Iris Xe G7 96EUs | 1.2 kg | 16.8 mm | 16.00" | 2560x1600 | |
| 86.1 % v7 (old) | 09 / 2021 | Lenovo IdeaPad 5 Pro 16ACH R7 5800H, GeForce GTX 1650 Mobile | 2 kg | 17.5 mm | 16.00" | 2560x1600 |
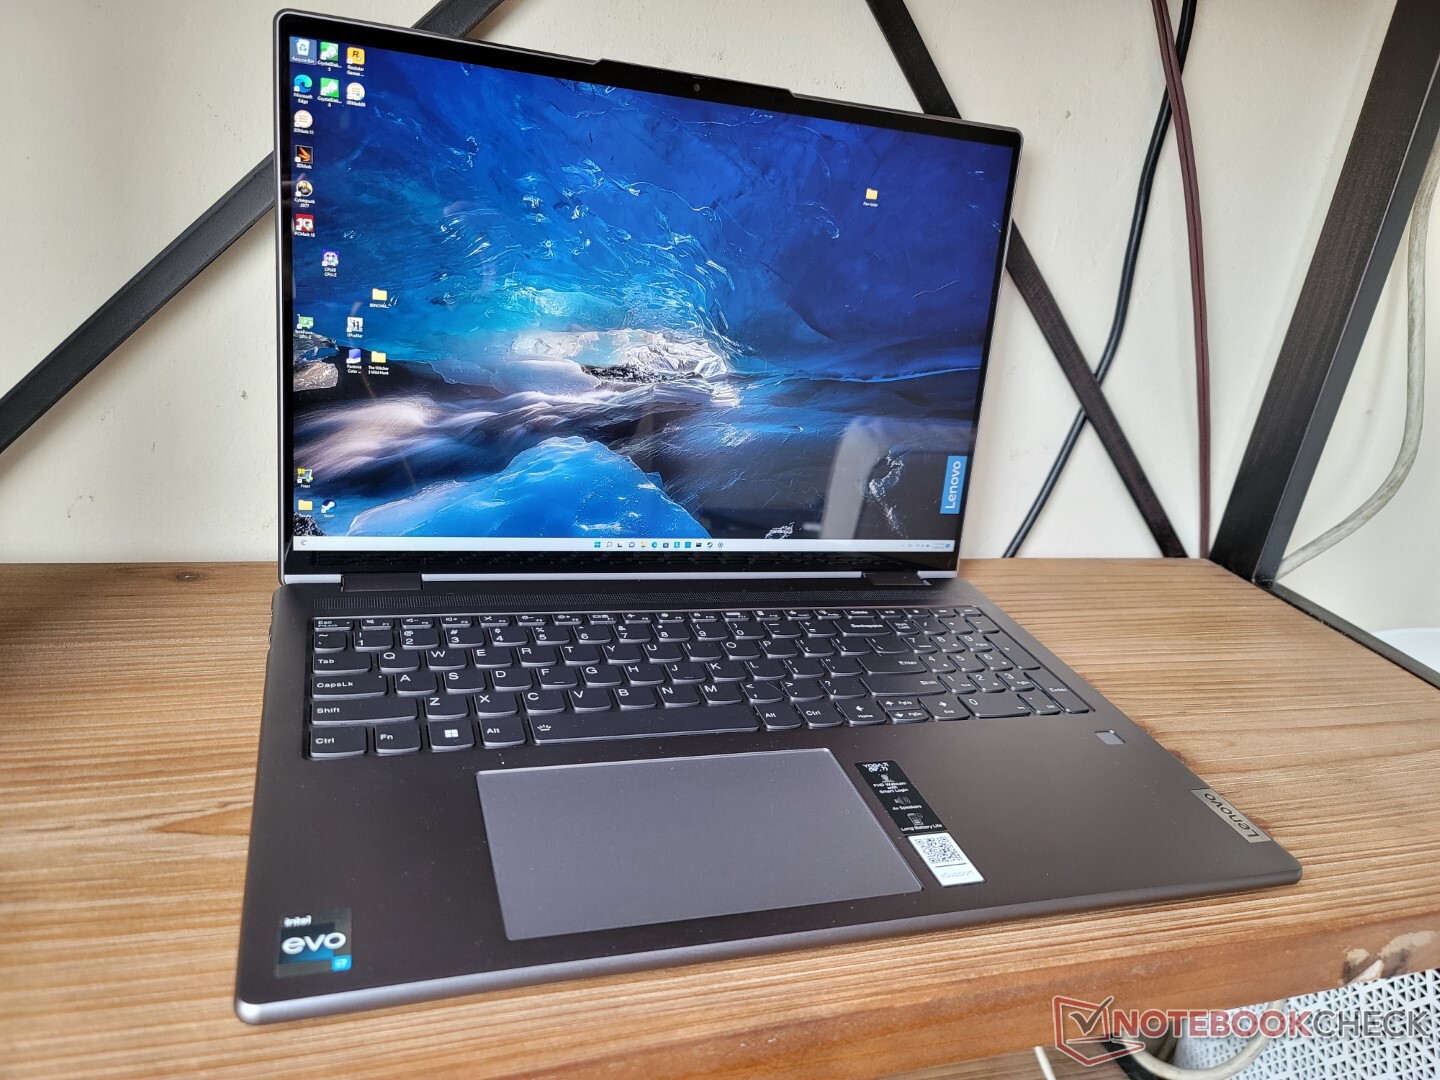
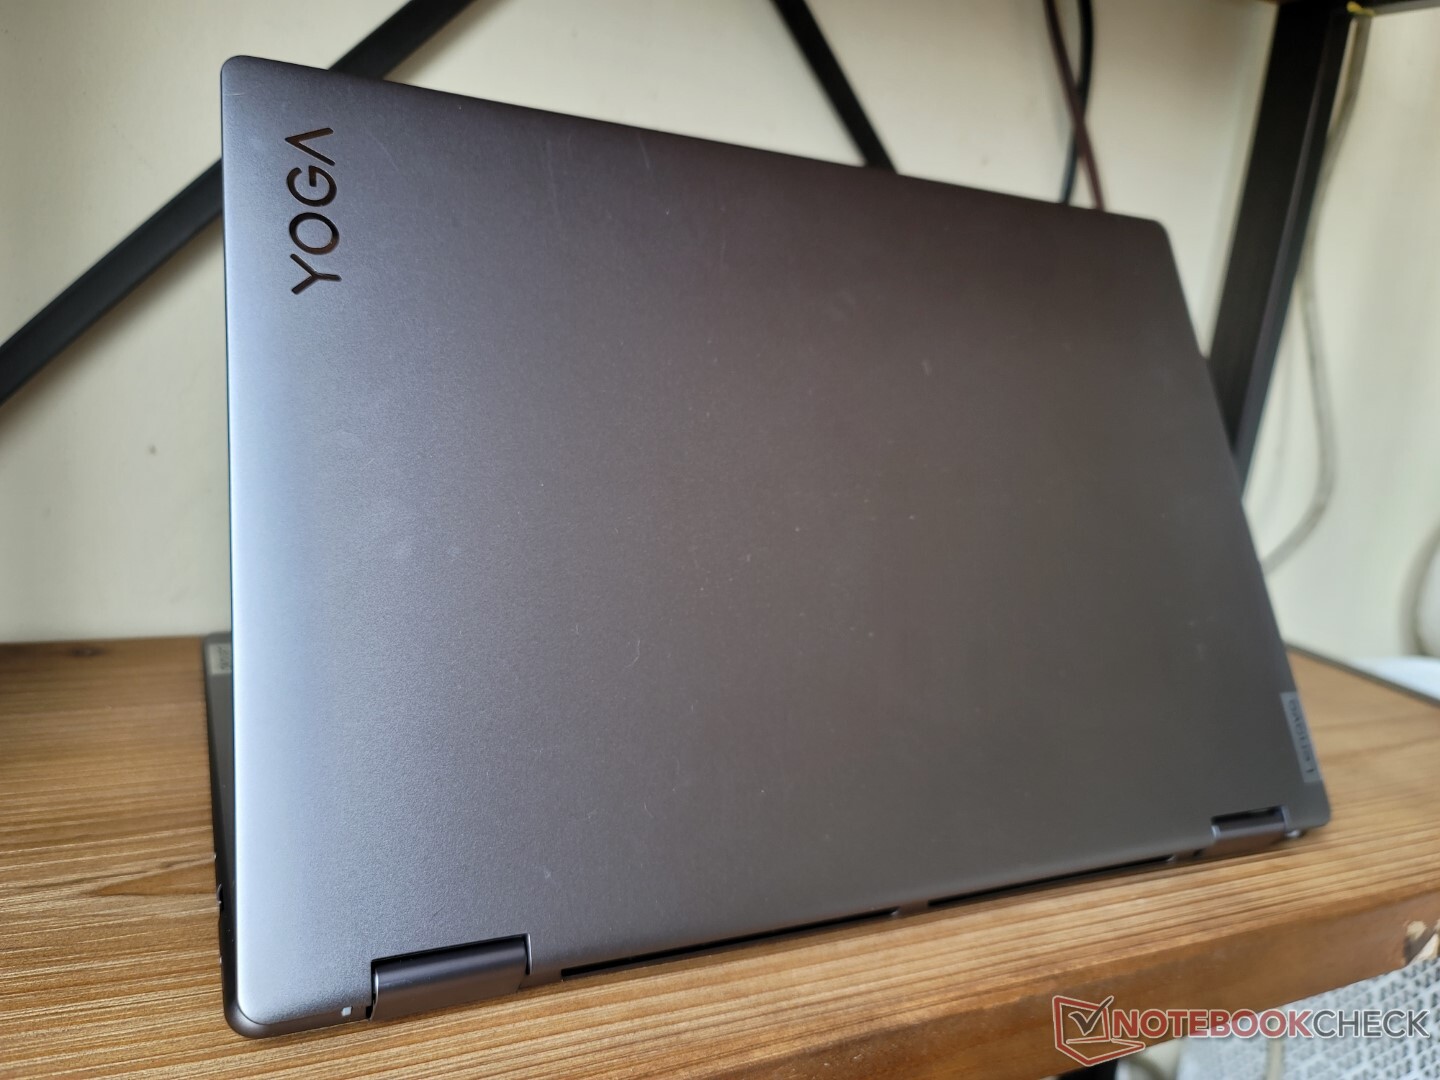
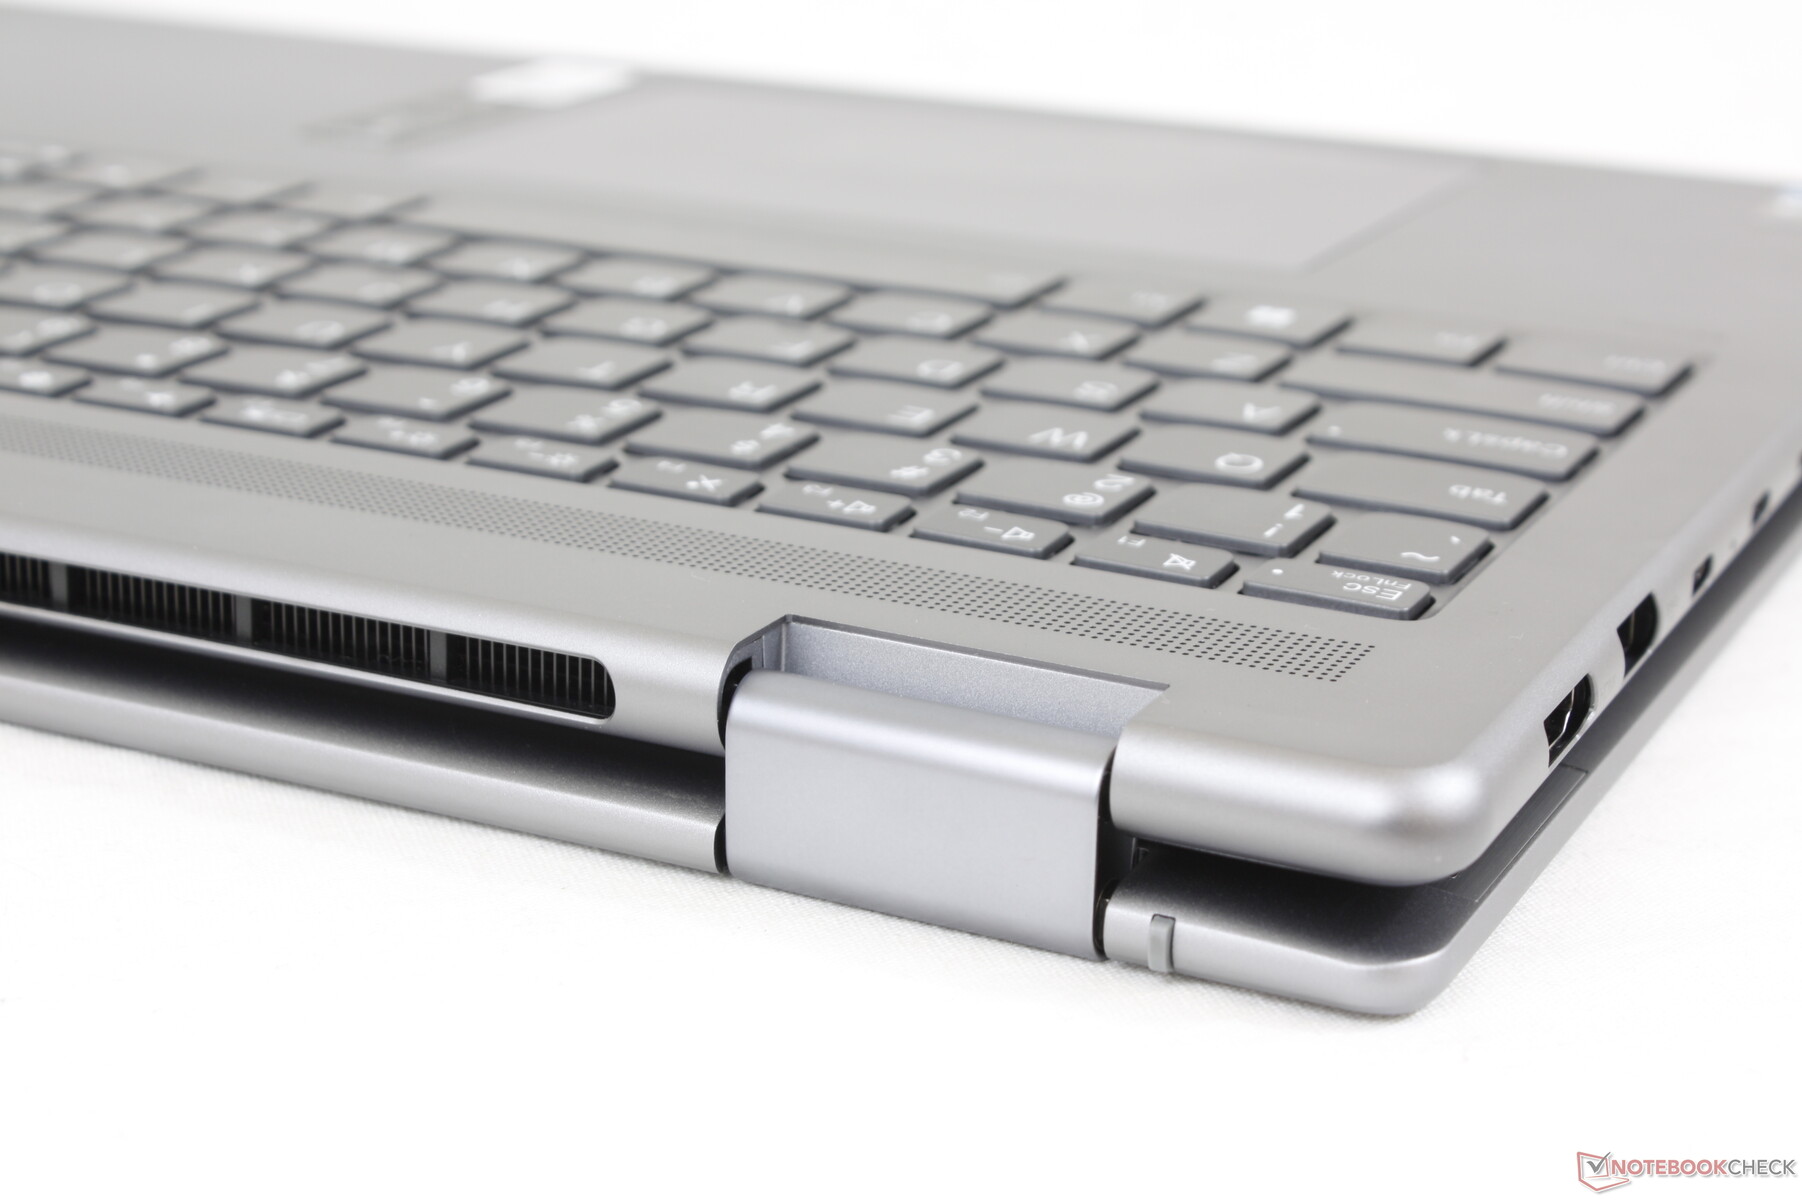
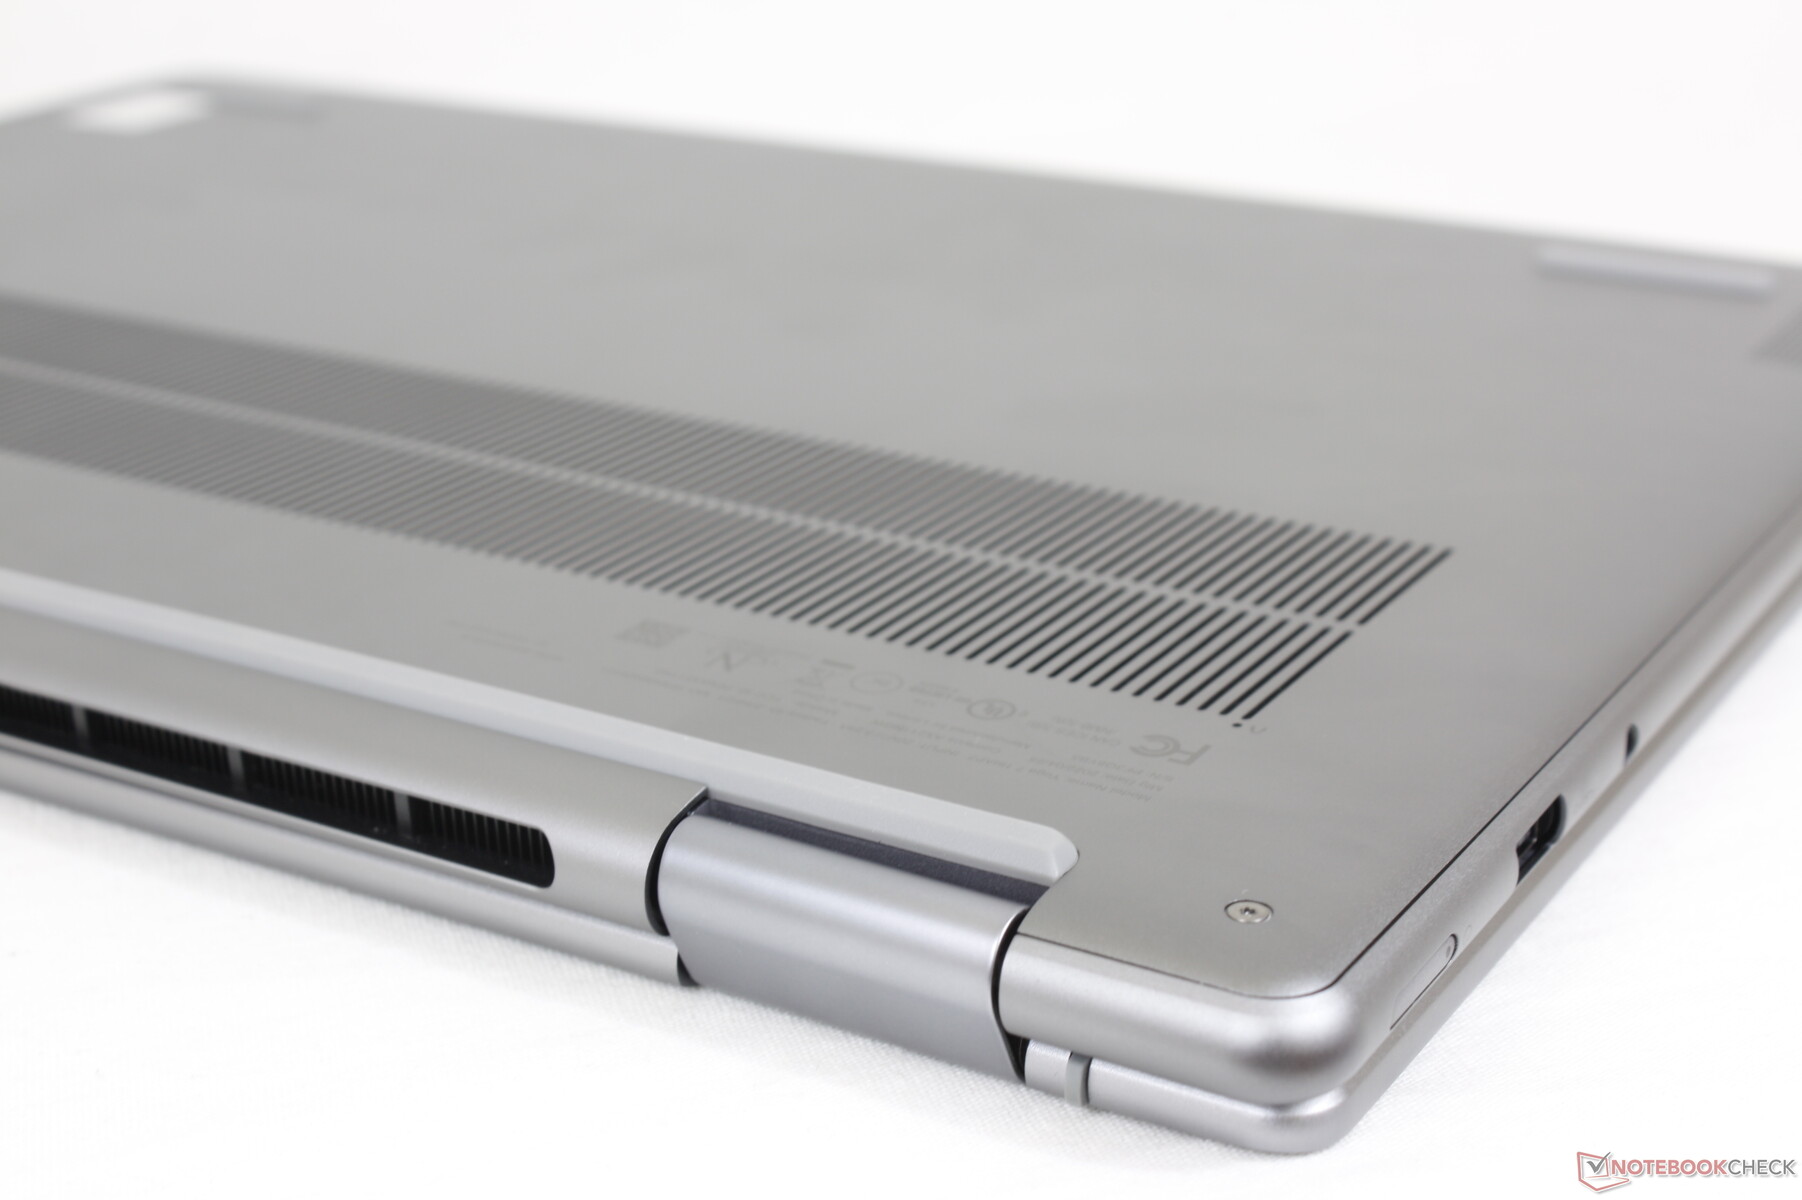
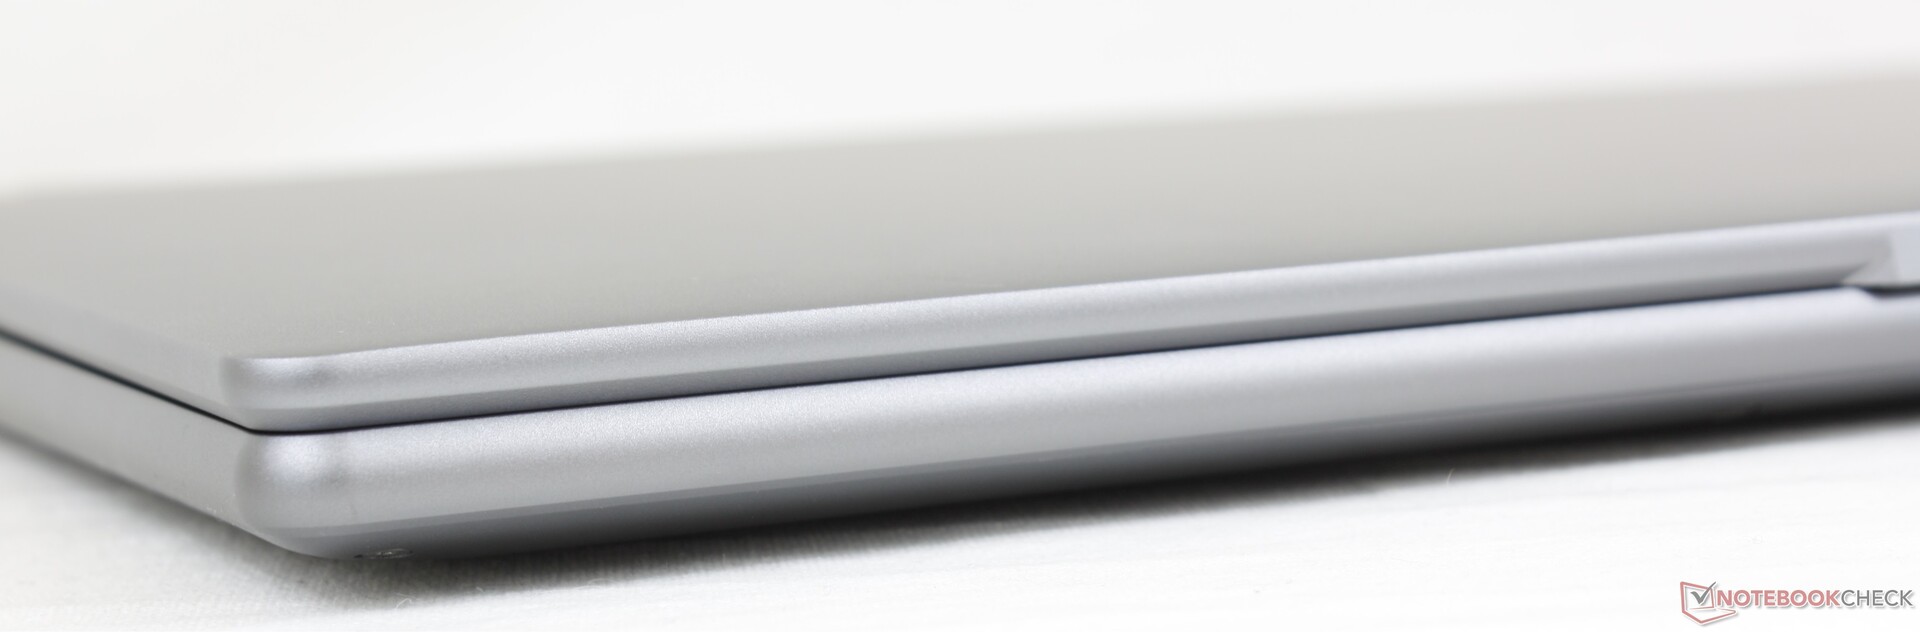
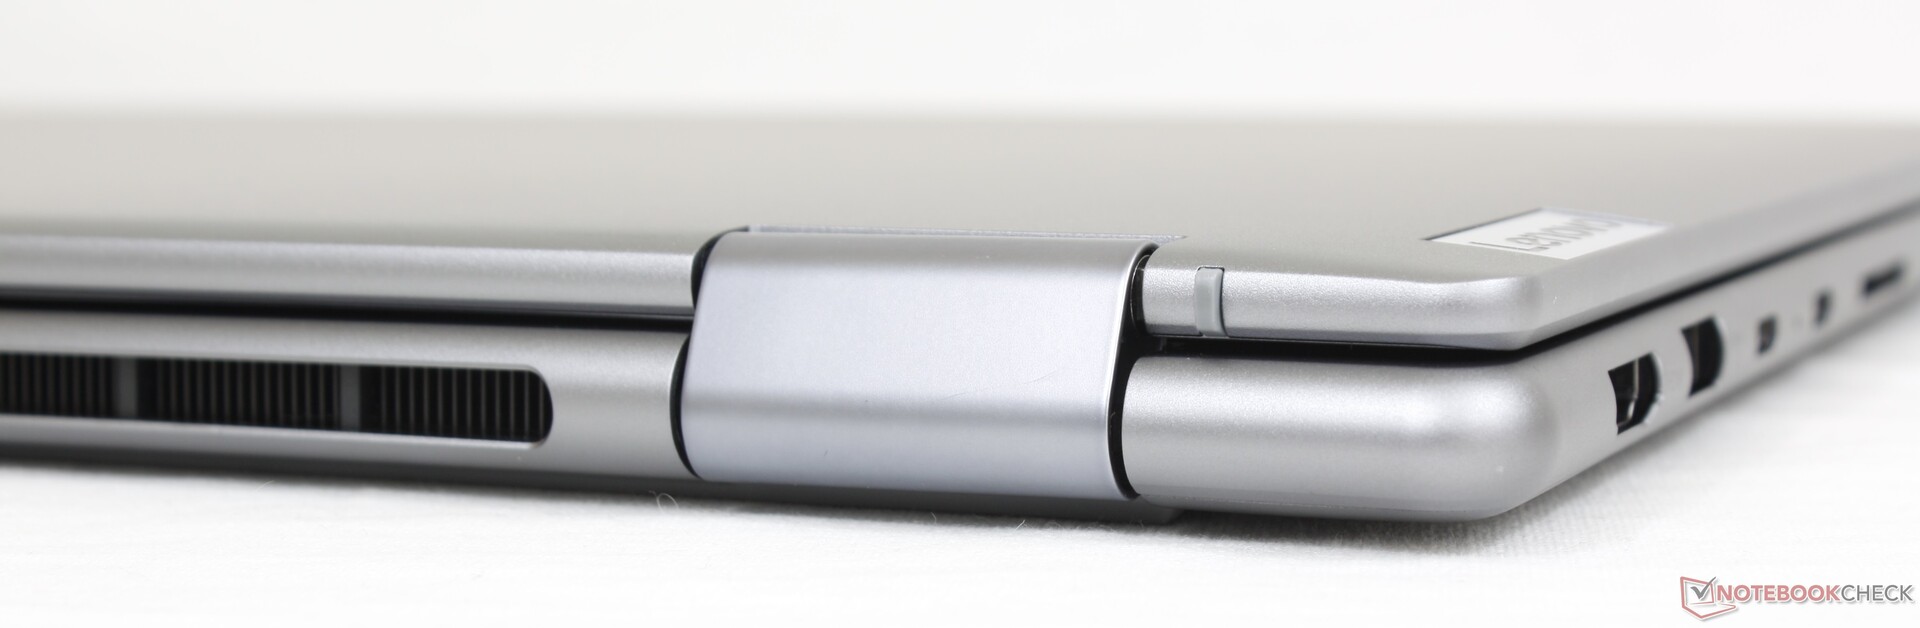
Case — Smooth And Round
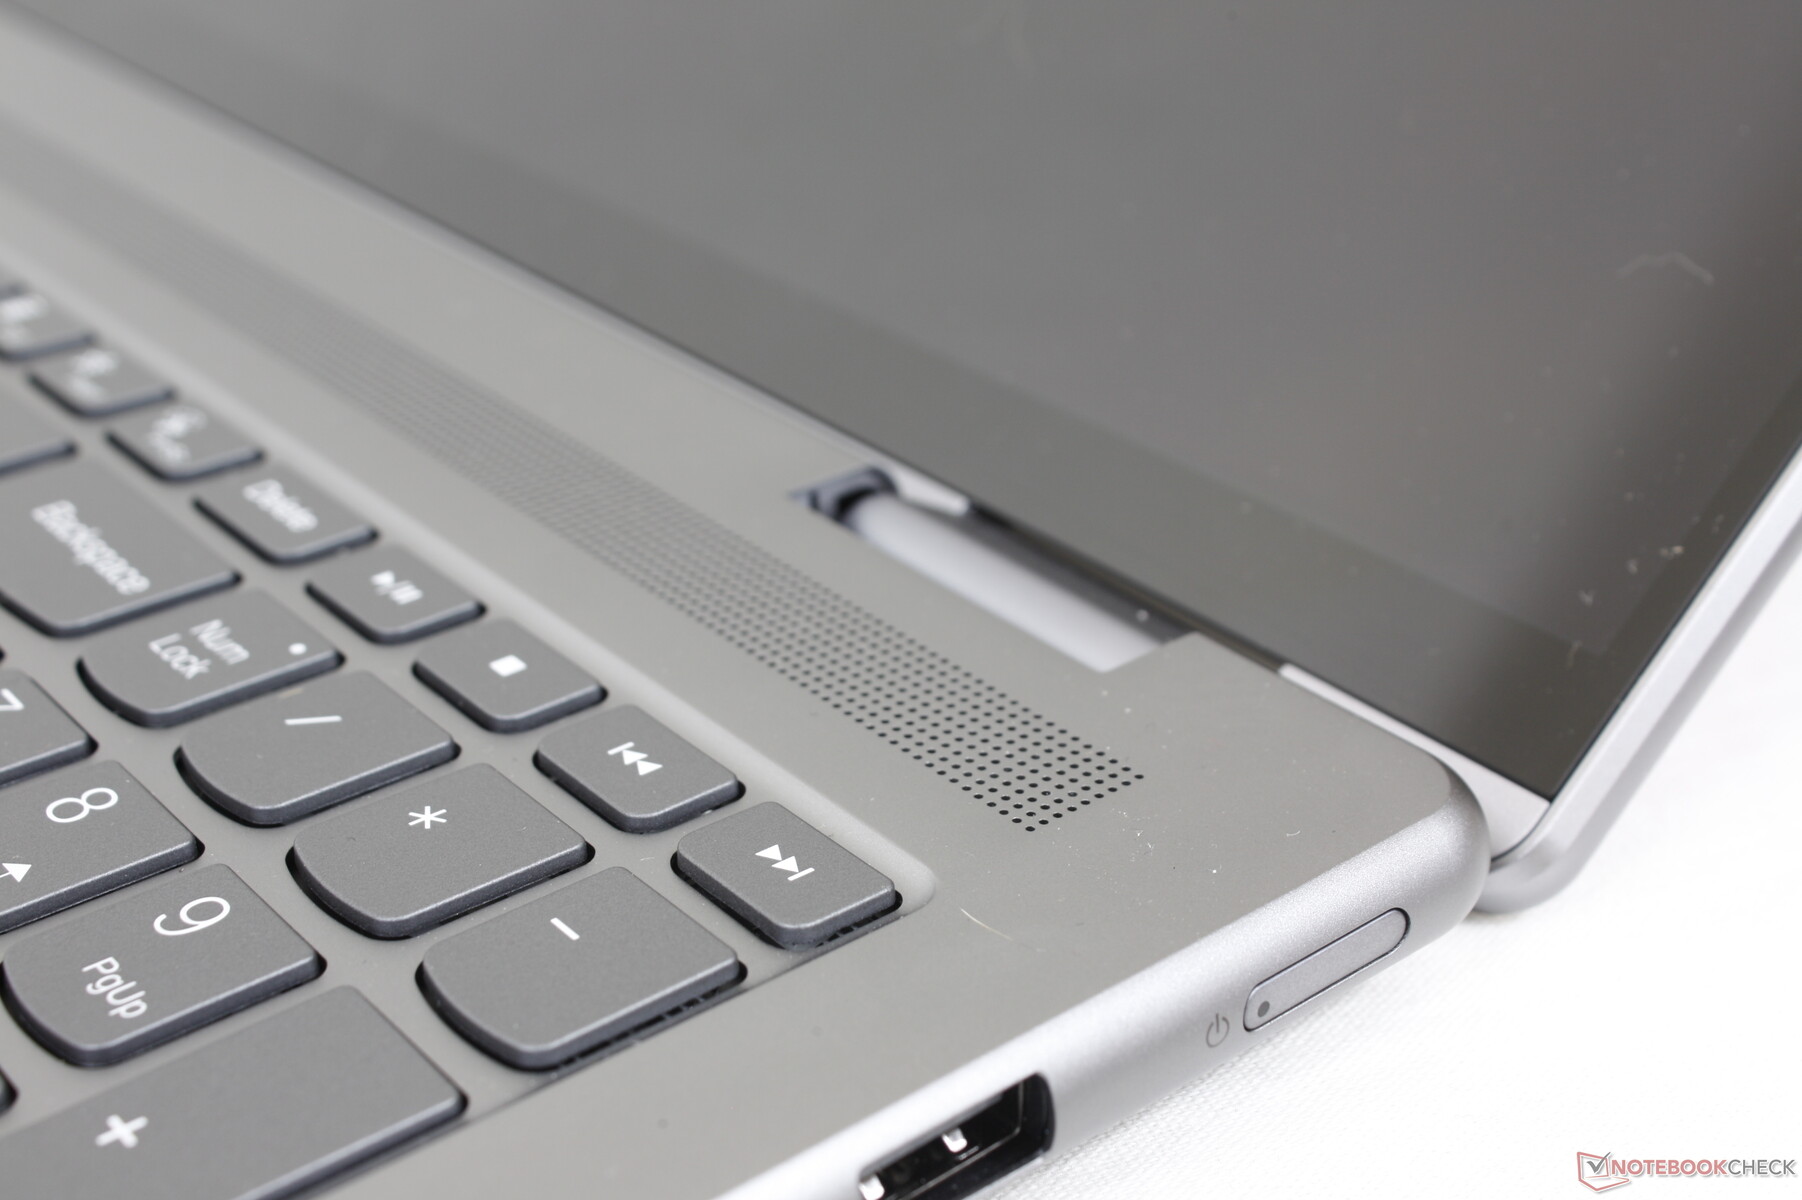
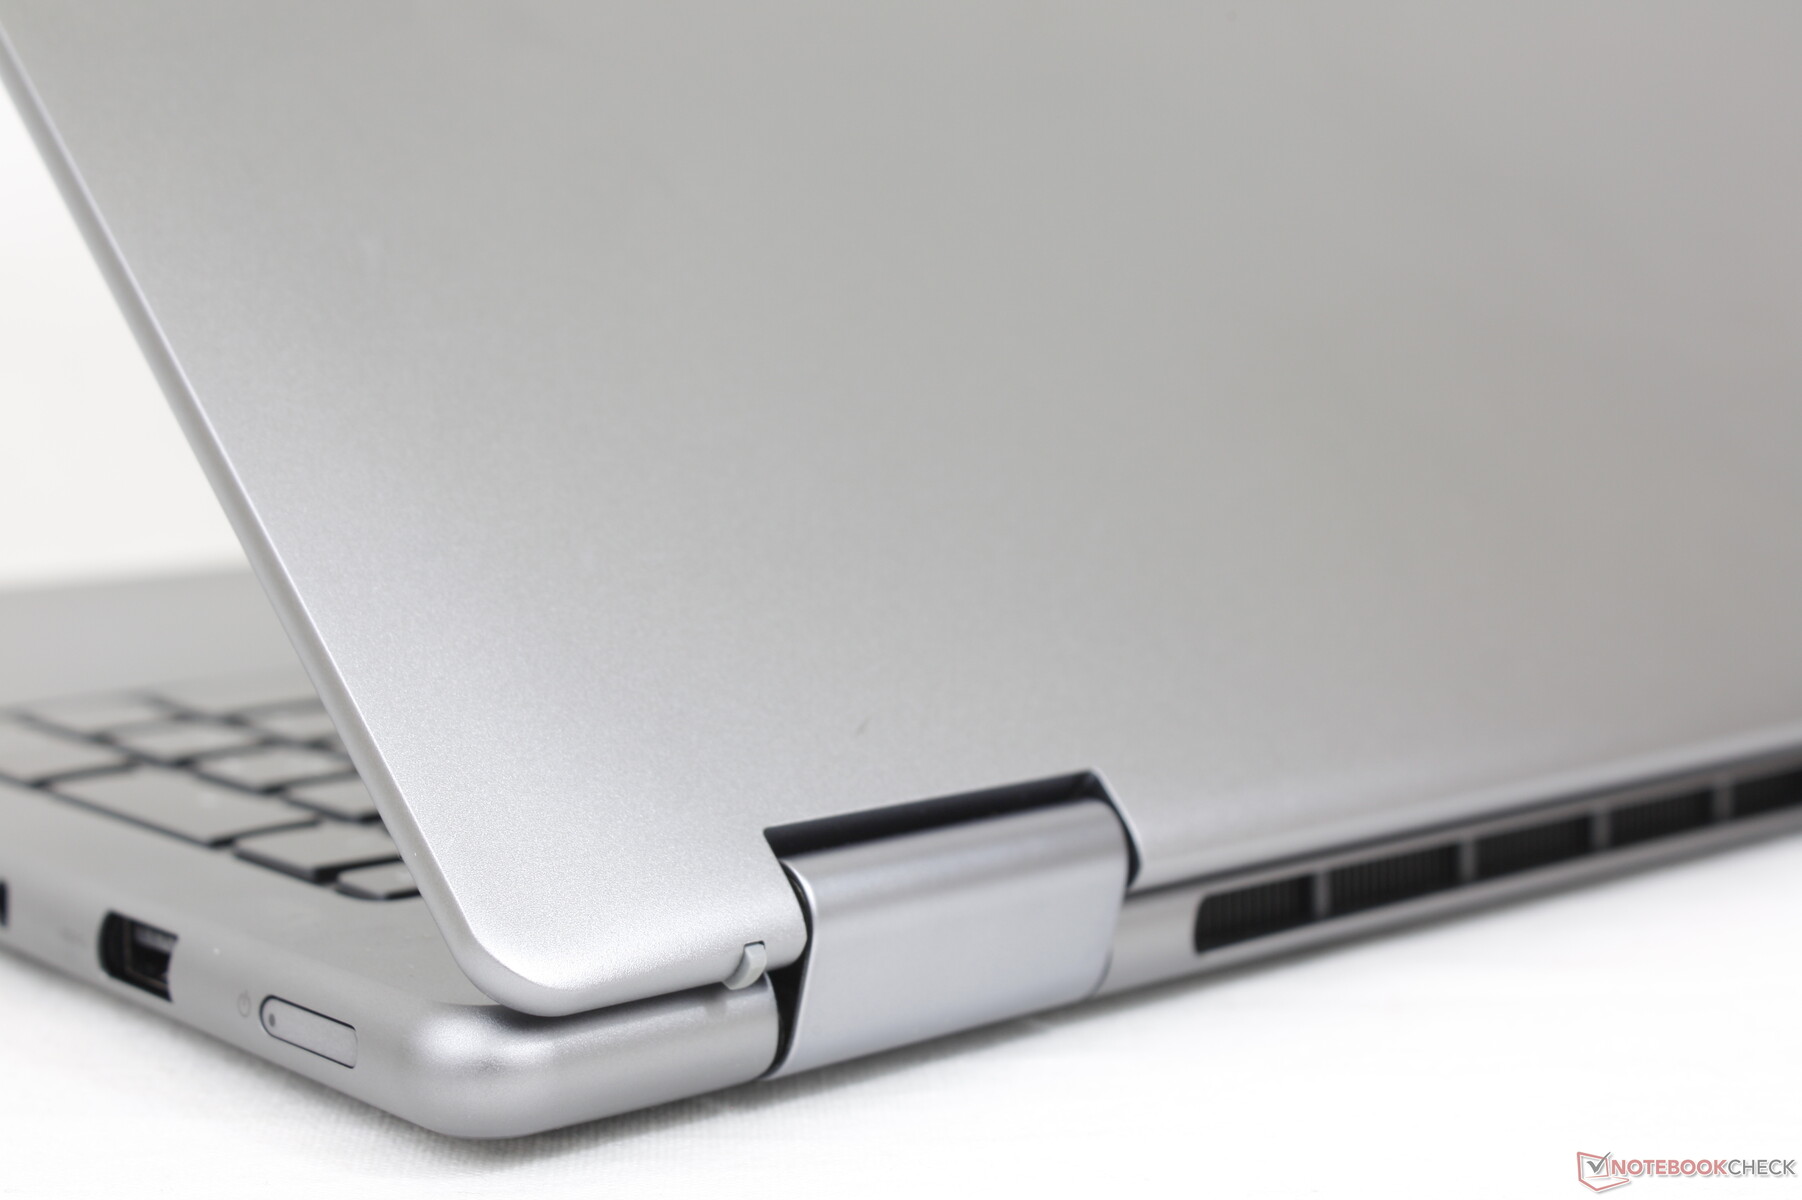
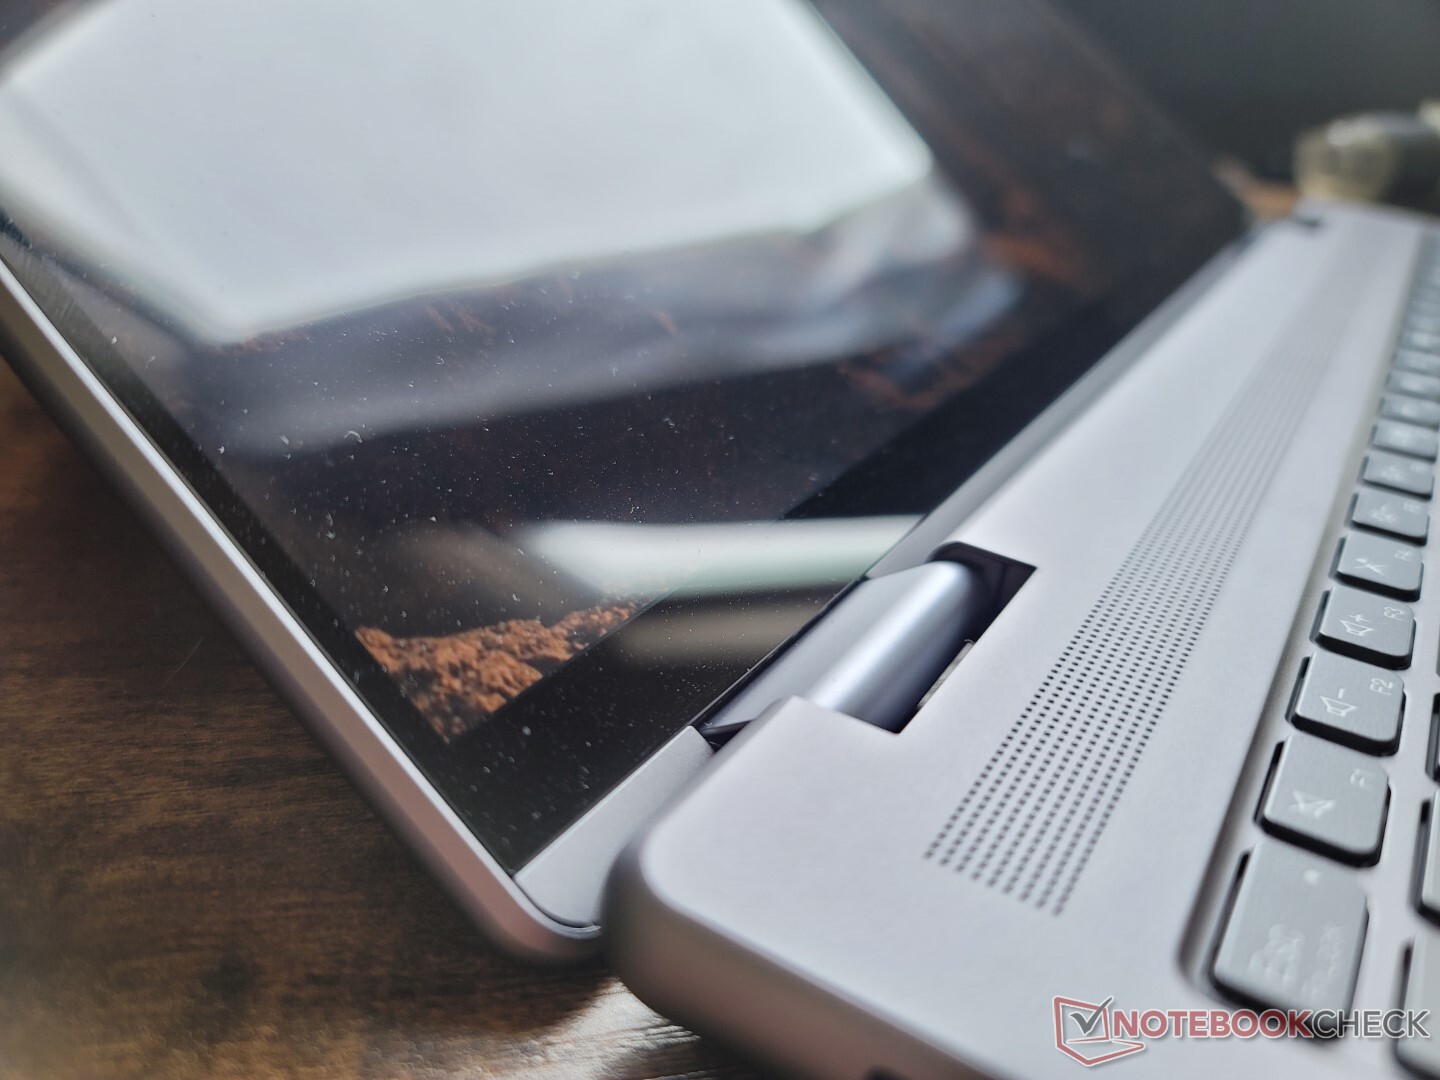
Visually, the chassis can be best described as the 16-inch version of the 14-inch Yoga 9 14IAP7. The design is distinguishable by its rounded edges for a convex appearance as opposed to the often flat edges on most other laptops. As a result, the entire unit feels especially smooth since the rounded edges and corners transition more seamlessly to the touch with the rest of the laptop.
As for rigidity, both the metal base and lid are firm with minimal creaking or twisting for solid impressions. However, applying pressure to the keyboard center would result in visibly more yielding than on the competing Dell Inspiron 16 7620 2-in-1 and so there is still some room for improvement.
The system is heavy even for a 16-inch form factor. The Acer Swift X SFX16, Huawei MateBook D 16, or LG Gram 16, for example, are each several hundred grams lighter while offering the same 16-inch screen size. In Lenovo's defense, the Yoga 7 16IAP7 is at least comparable to the Inspiron 16 7620 2-in-1 in both dimensions and weight.
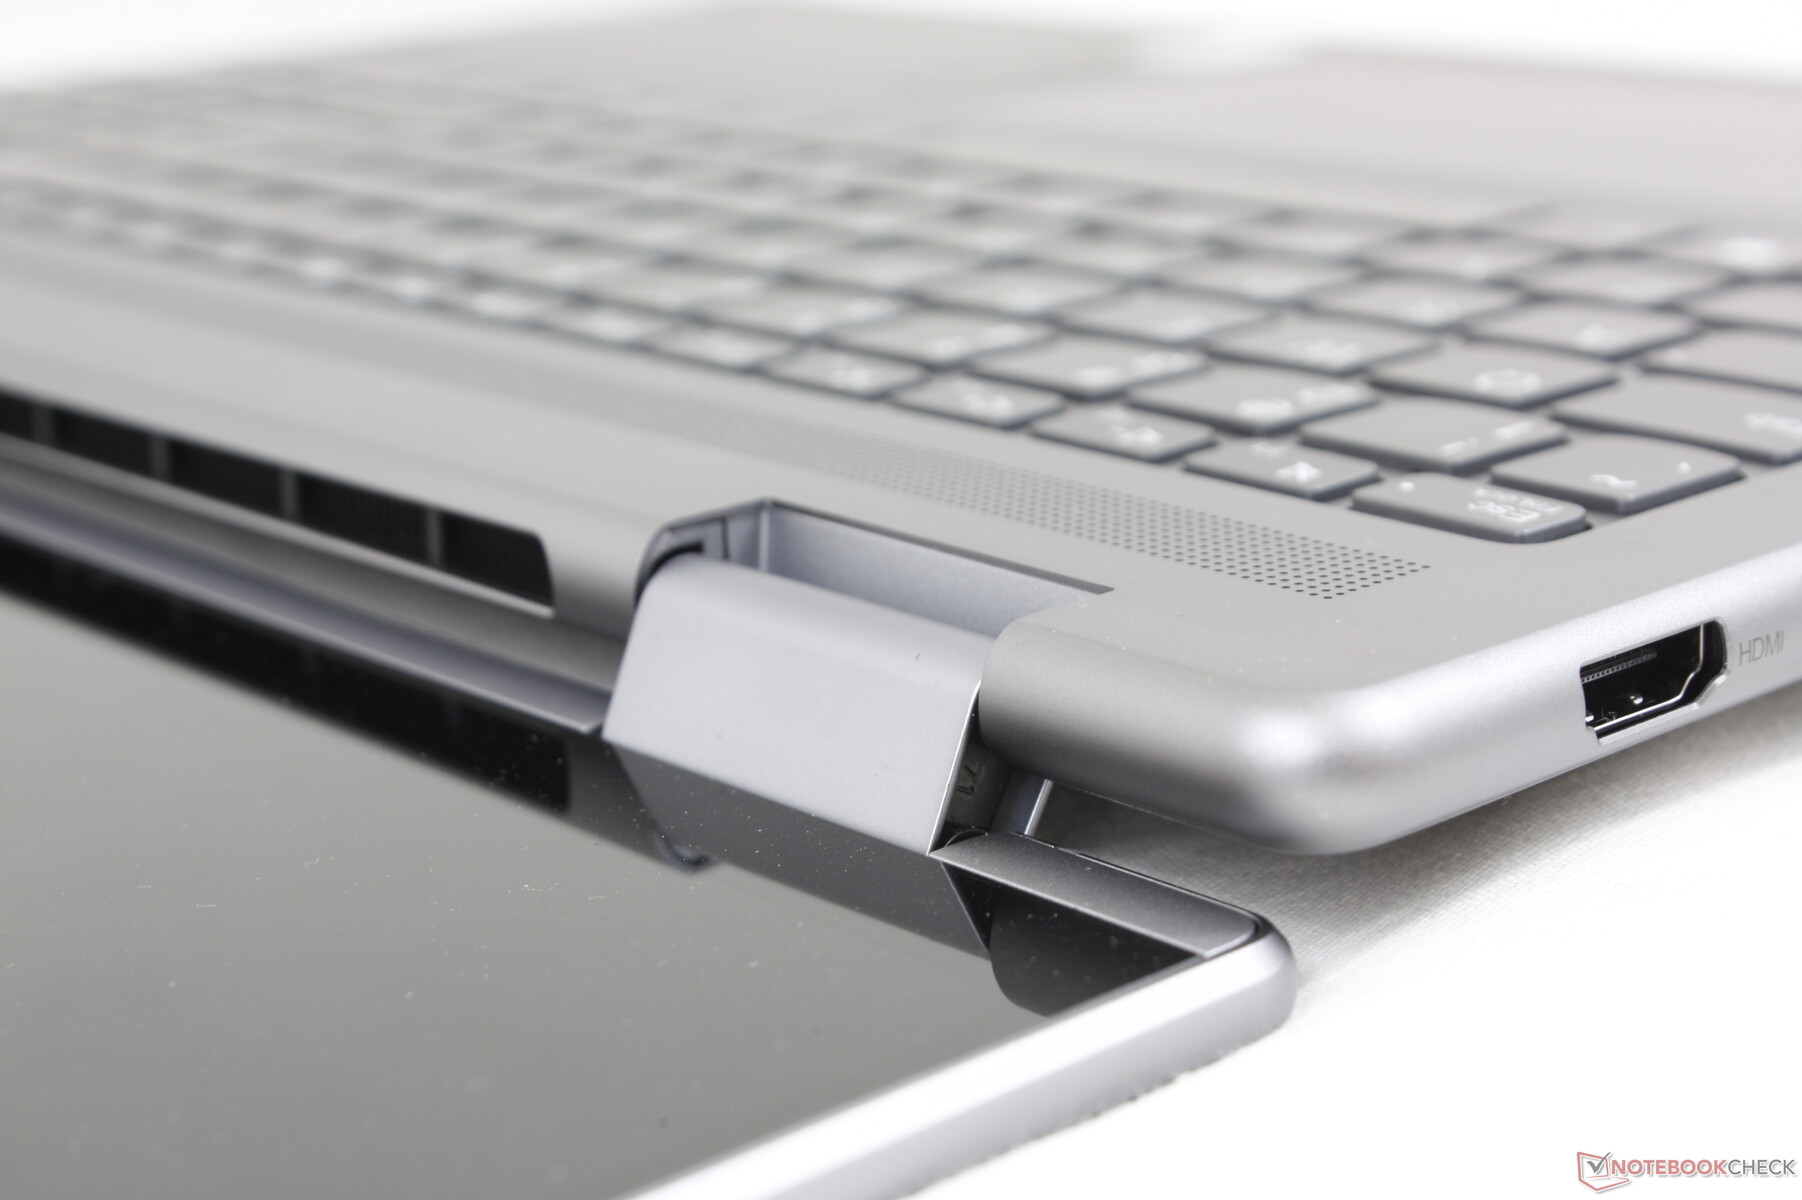
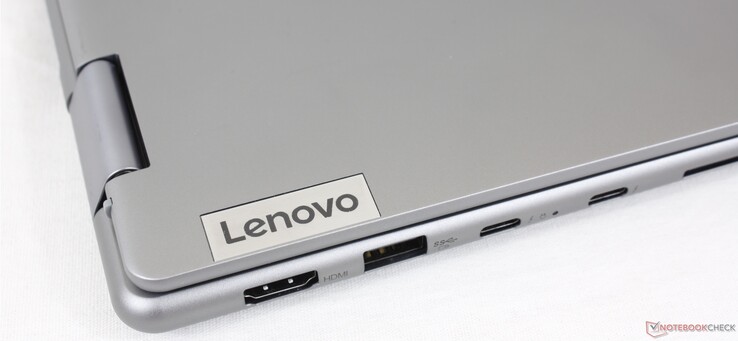
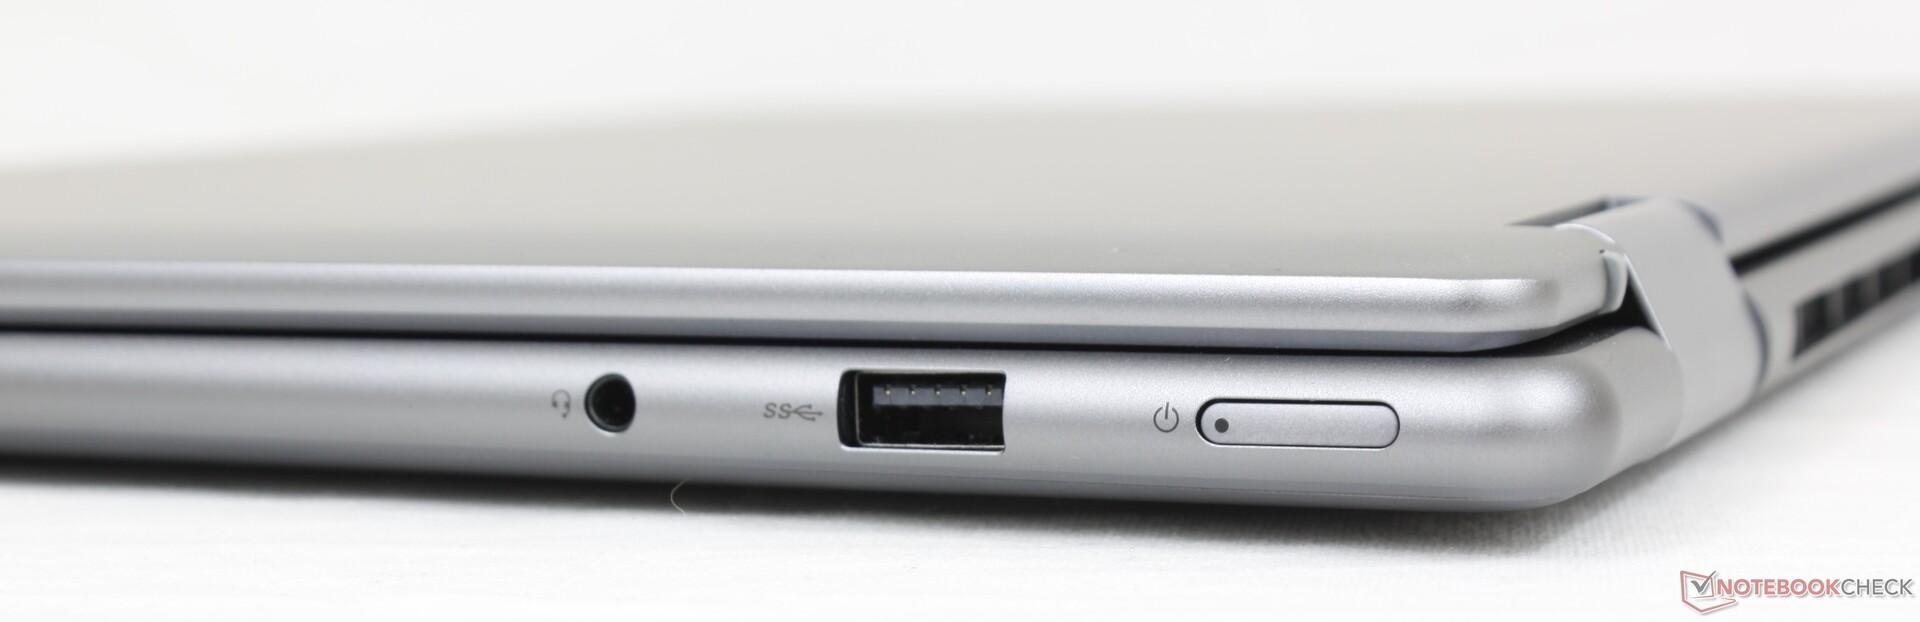
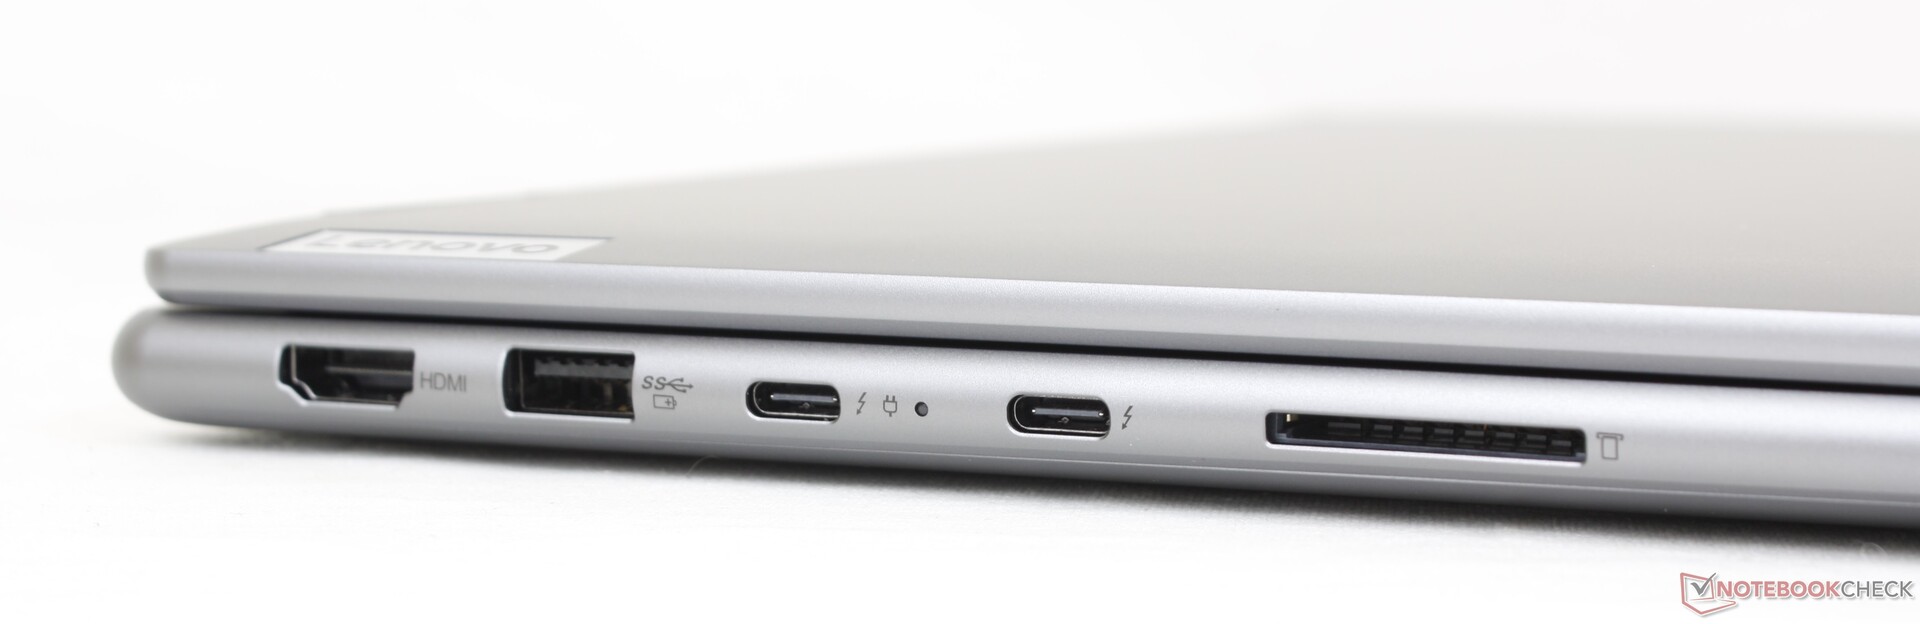
Connectivity — Thunderbolt 4 Support
Port options are exactly the same as on the Dell Inspiron 16 7620 2-in-1 or LG Gram 16. In fact, even the positioning of the ports is almost identical to the Dell model. The MateBook D 16 integrates the same ports as well albeit without Thunderbolt support.
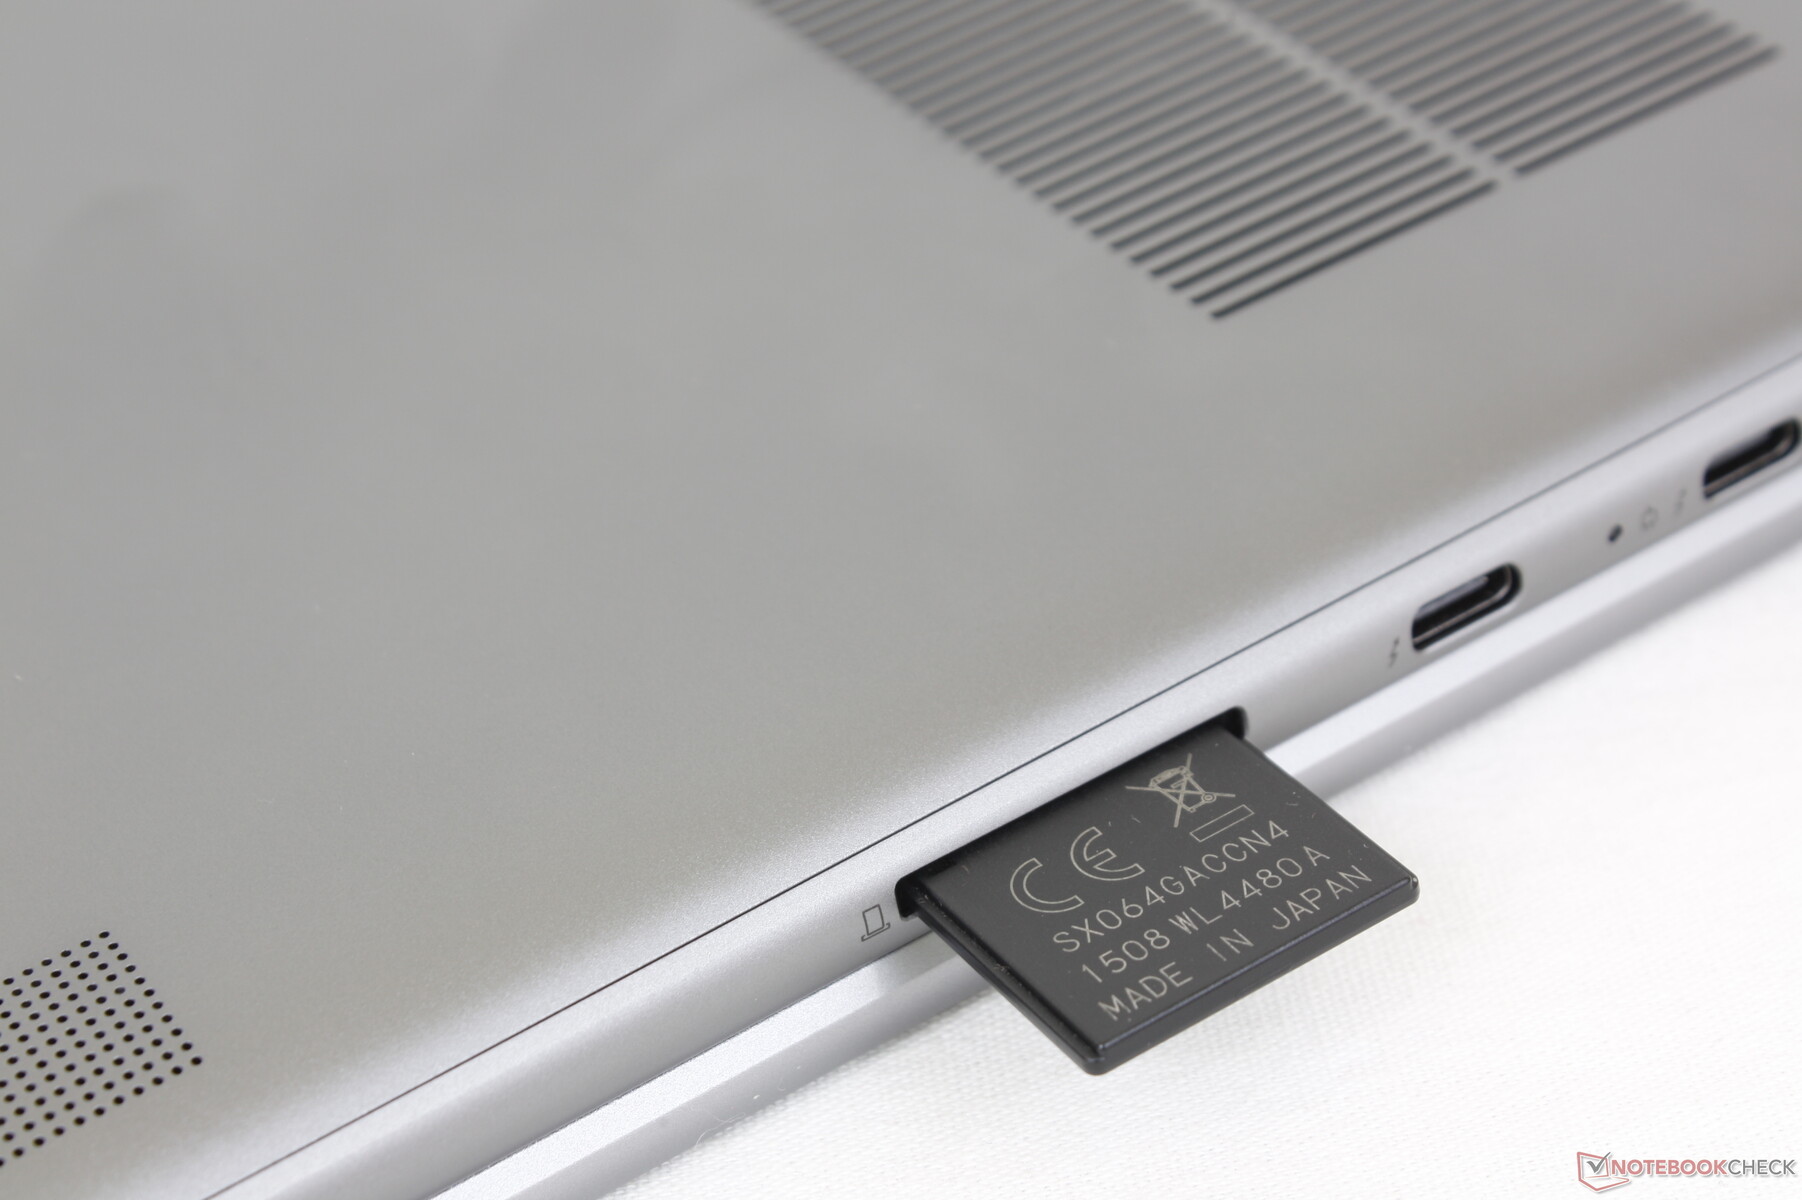
SD Card Reader
Transfer rates with the integrated SD card reader are average at around 80 MB/s. Moving 1 GB of pictures from our UHS-II test card to desktop takes about 12 seconds. It's worth noting that the integrated SD reader is not spring-loaded unlike on most other laptops.
| SD Card Reader | |
| average JPG Copy Test (av. of 3 runs) | |
| Lenovo Yoga 7 16IAP7 (Toshiba Exceria Pro SDXC 64 GB UHS-II) | |
| LG Gram 16 (2021) (Toshiba Exceria Pro M501 microSDXC 64GB) | |
| Lenovo IdeaPad 5 Pro 16ACH (AV PRO V60) | |
| Dell Inspiron 16 7620 2-in-1 (Toshiba Exceria Pro SDXC 64 GB UHS-II) | |
| maximum AS SSD Seq Read Test (1GB) | |
| LG Gram 16 (2021) (Toshiba Exceria Pro M501 microSDXC 64GB) | |
| Lenovo Yoga 7 16IAP7 (Toshiba Exceria Pro SDXC 64 GB UHS-II) | |
| Lenovo IdeaPad 5 Pro 16ACH (AV PRO V60) | |
| Dell Inspiron 16 7620 2-in-1 (Toshiba Exceria Pro SDXC 64 GB UHS-II) | |
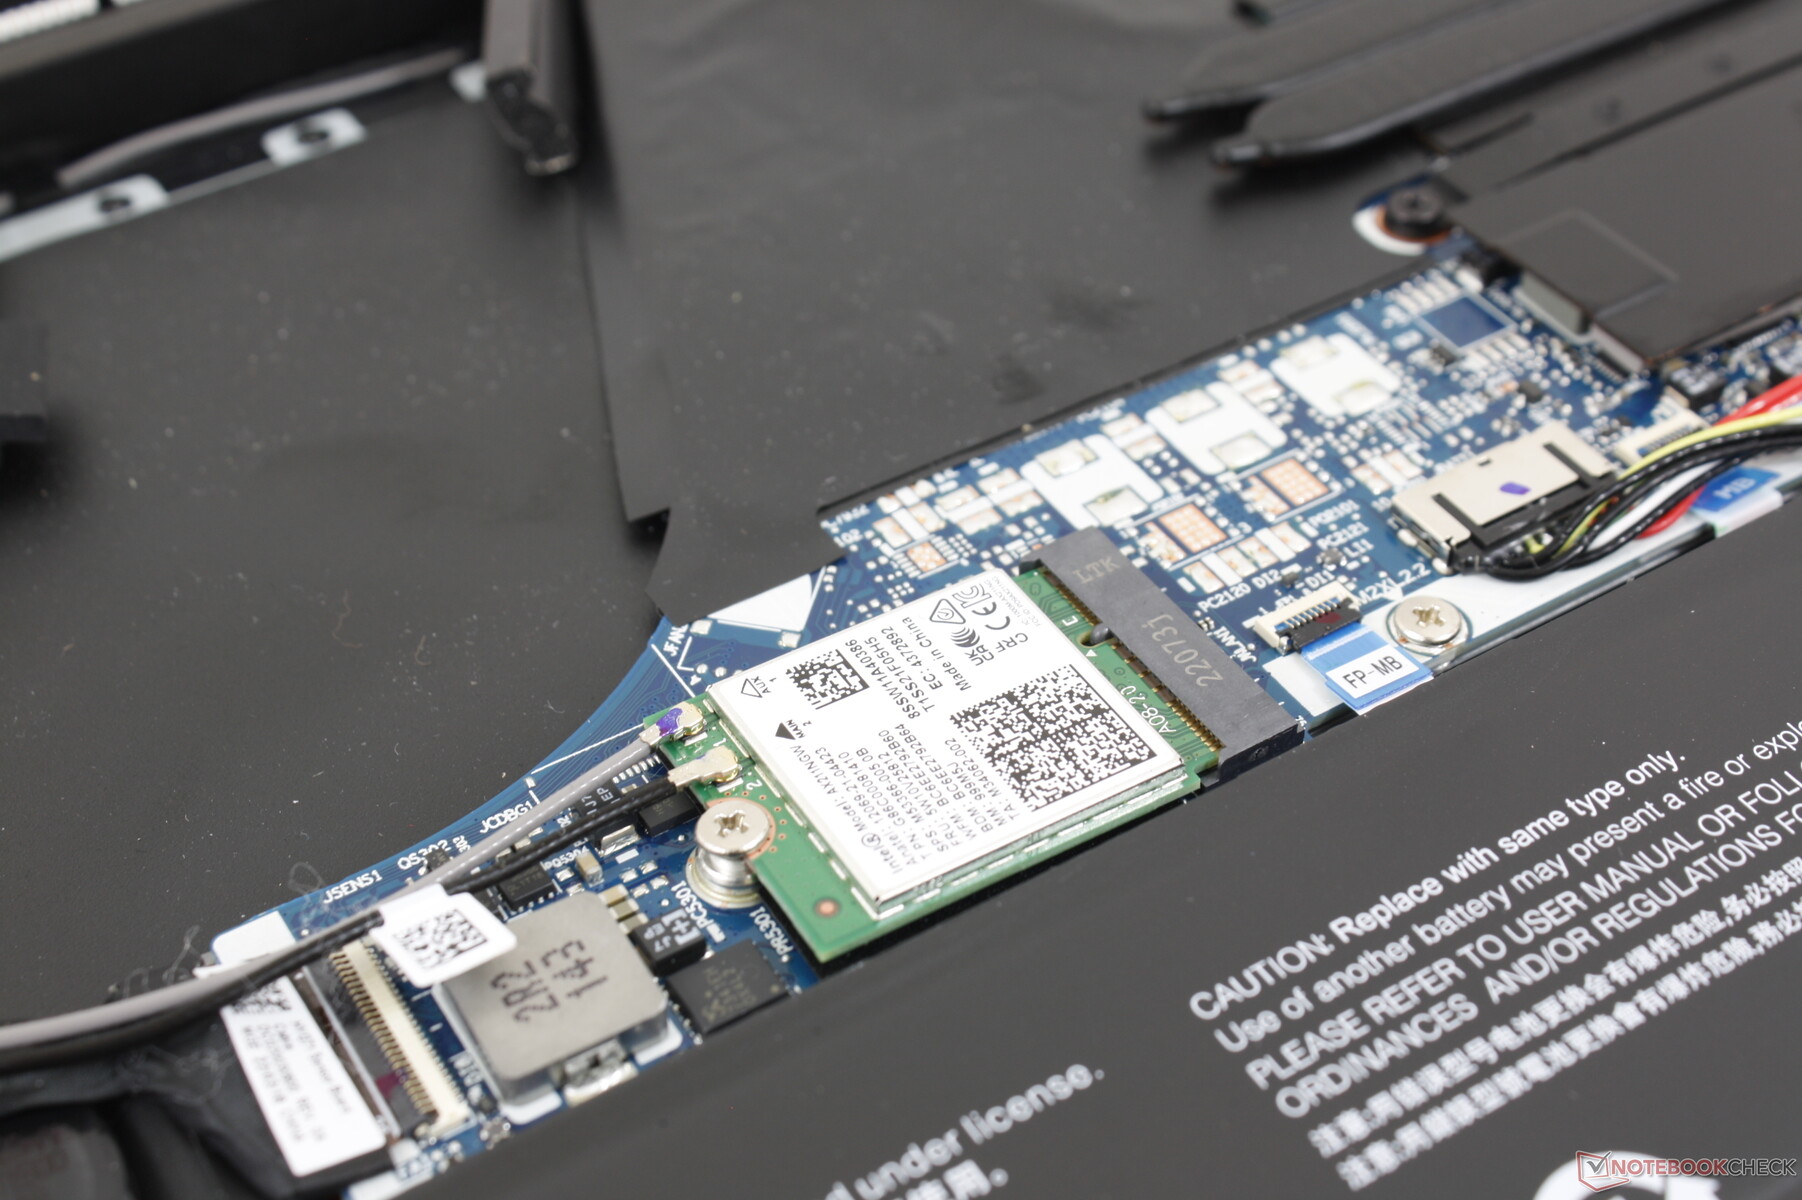
Communication — Wi-Fi 6E Support
An Intel AX211 comes standard for Wi-Fi 6E and Bluetooth 5.2 connectivity. We experienced stable transfer rates when paired to our 6 GHz network.
| Networking | |
| iperf3 transmit AX12 | |
| Acer Swift X SFX16-51G-5388 | |
| LG Gram 16 (2021) | |
| Lenovo IdeaPad 5 Pro 16ACH | |
| iperf3 receive AX12 | |
| Acer Swift X SFX16-51G-5388 | |
| LG Gram 16 (2021) | |
| Lenovo IdeaPad 5 Pro 16ACH | |
| iperf3 receive AXE11000 6GHz | |
| Lenovo Yoga 7 16IAP7 | |
| Dell Inspiron 16 7620 2-in-1 | |
| iperf3 transmit AXE11000 6GHz | |
| Dell Inspiron 16 7620 2-in-1 | |
| Lenovo Yoga 7 16IAP7 | |
Webcam
The 2 MP camera is sharper than on most other laptops where 1 MP is still the norm. A physical privacy shutter is included and there is an IR sensor for Windows Hello support.


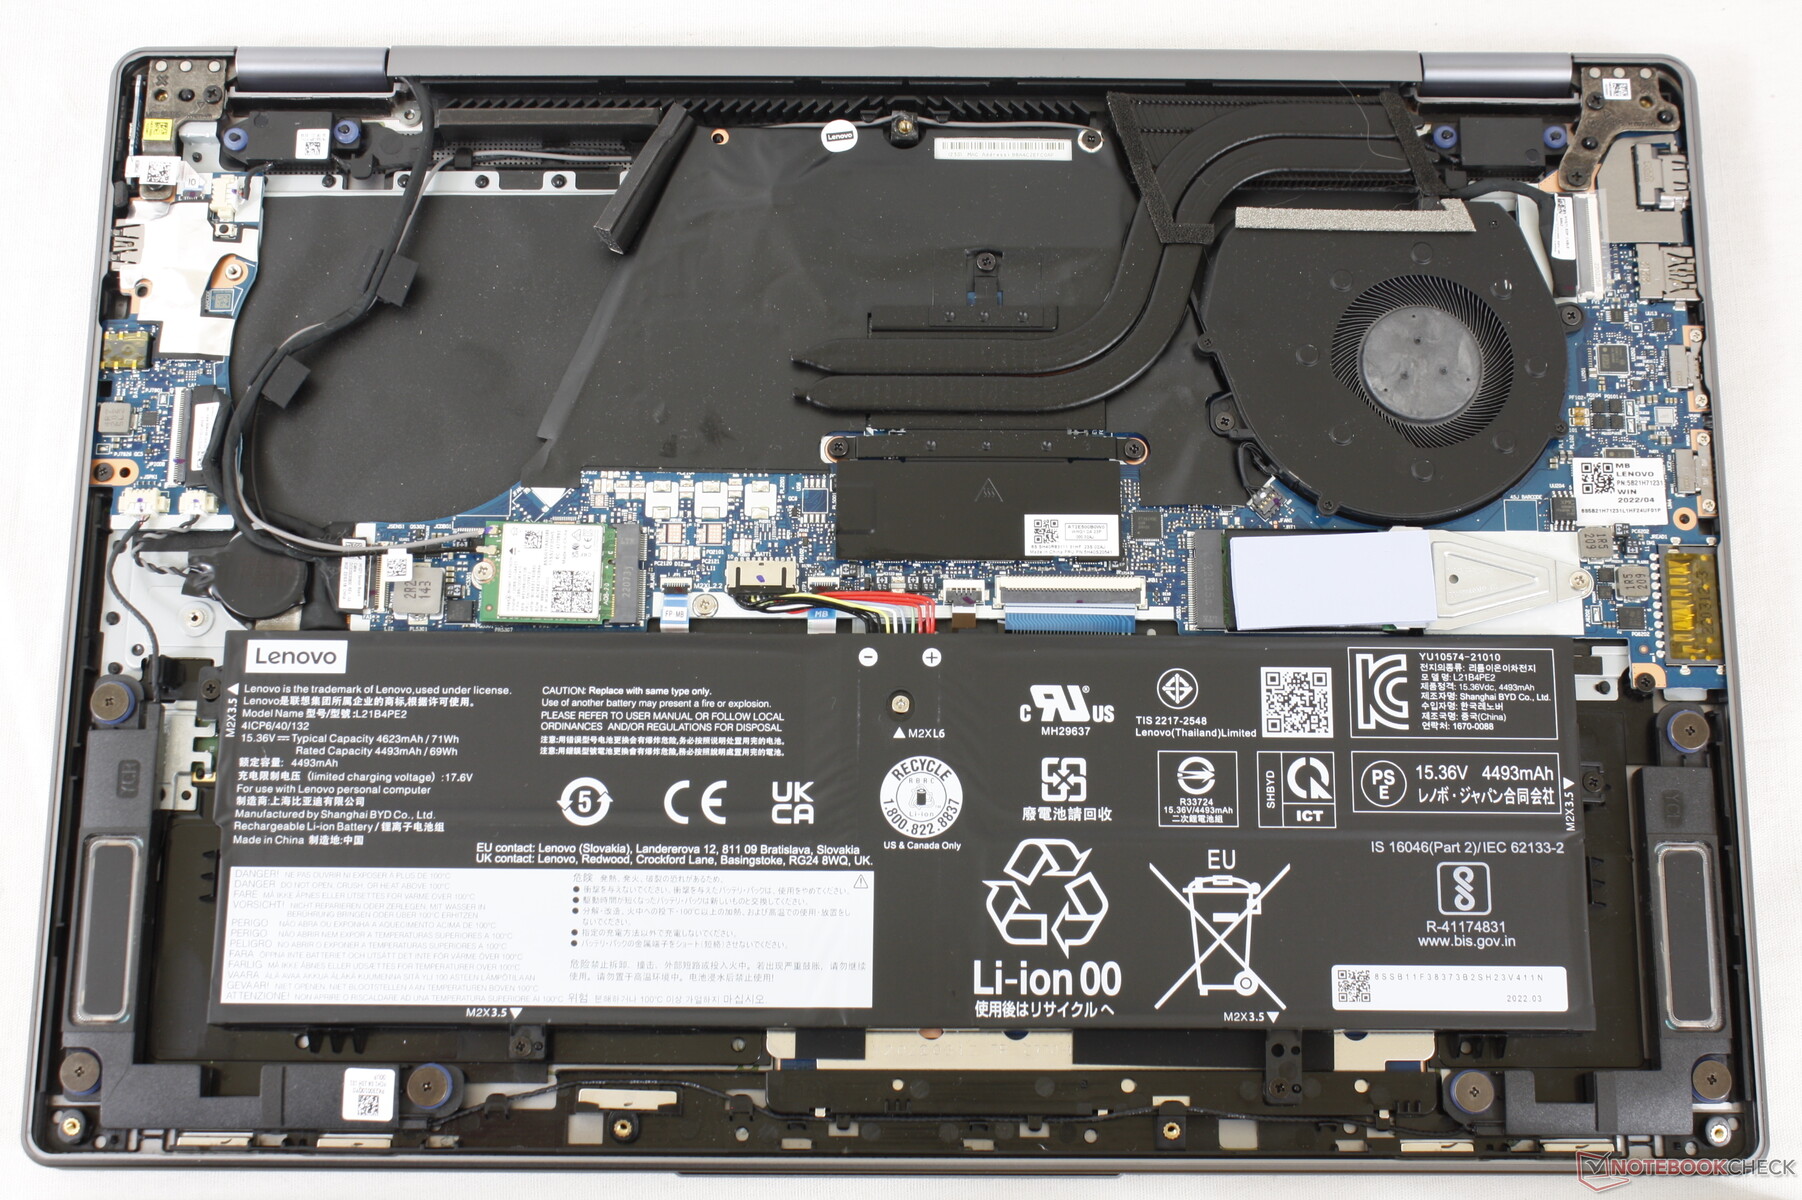
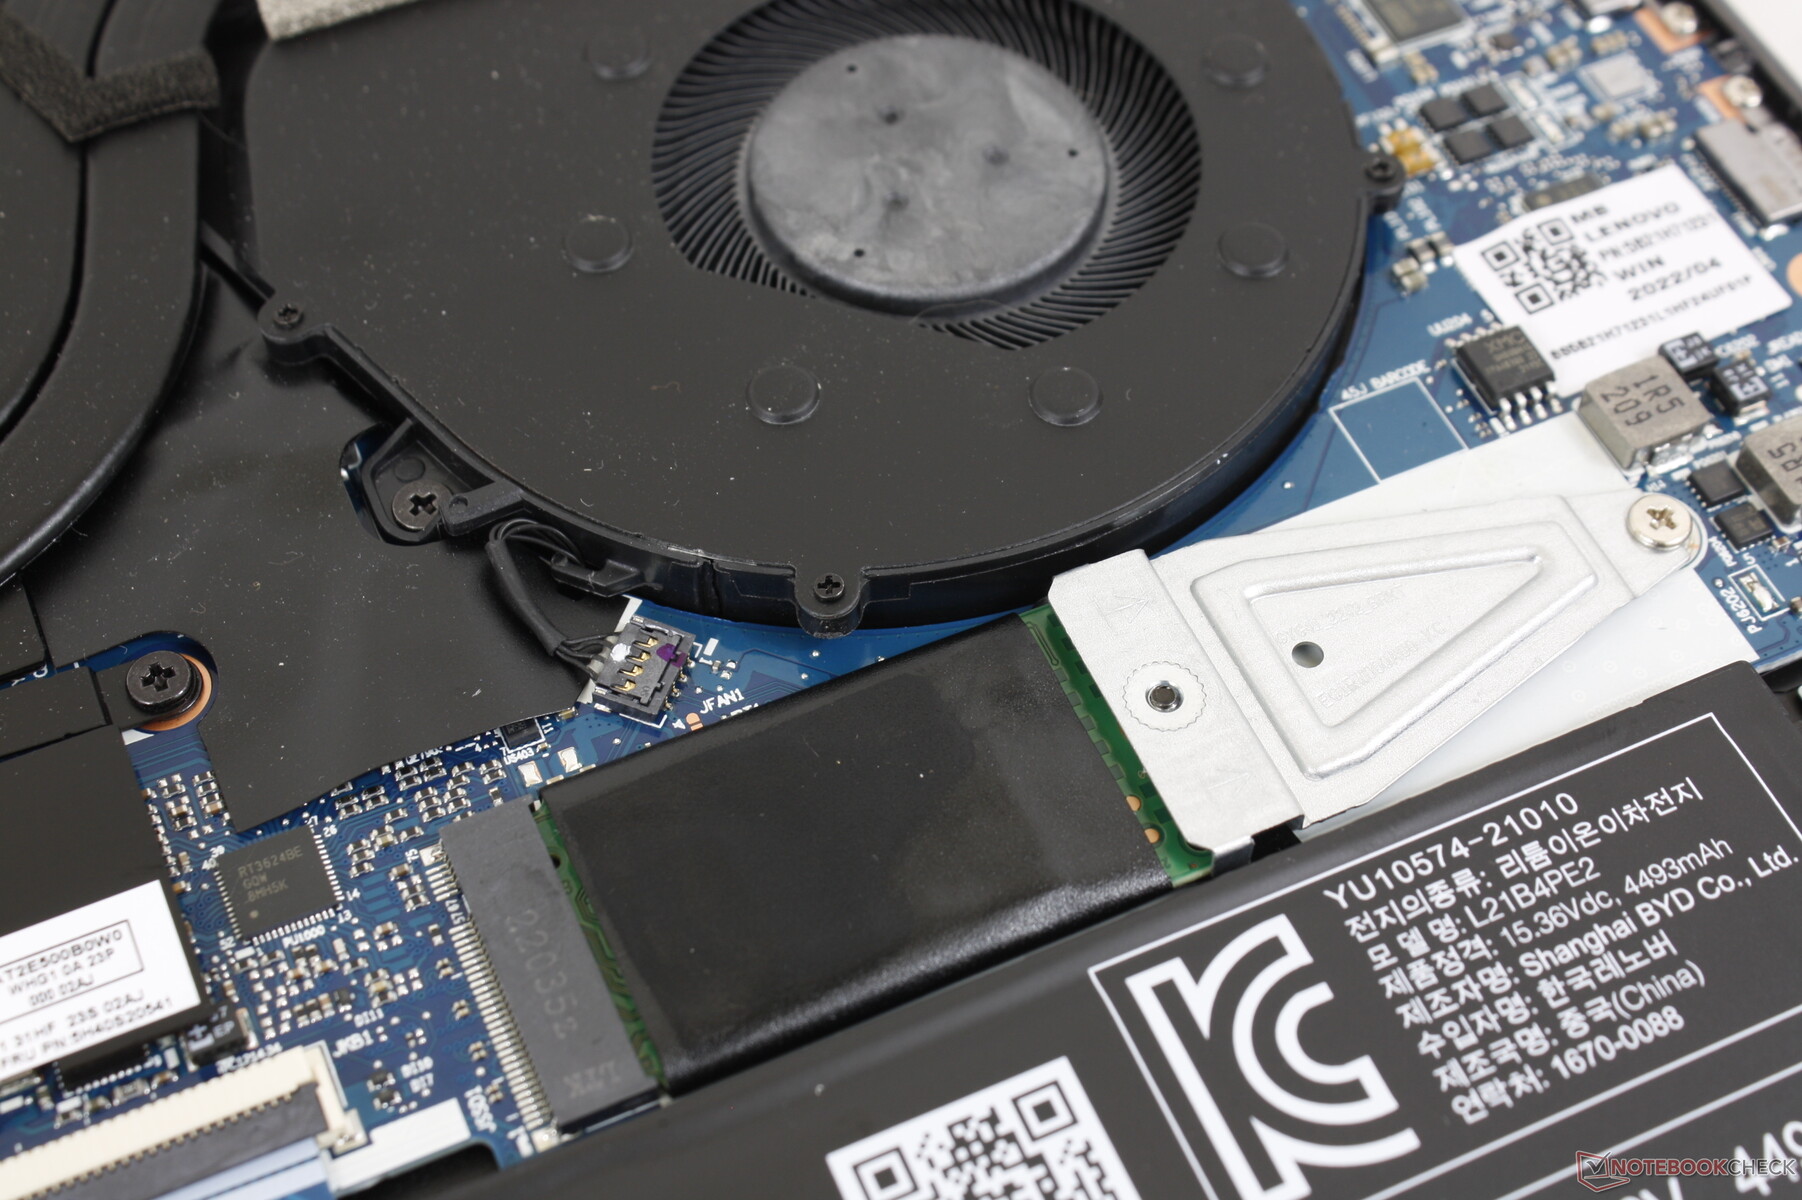
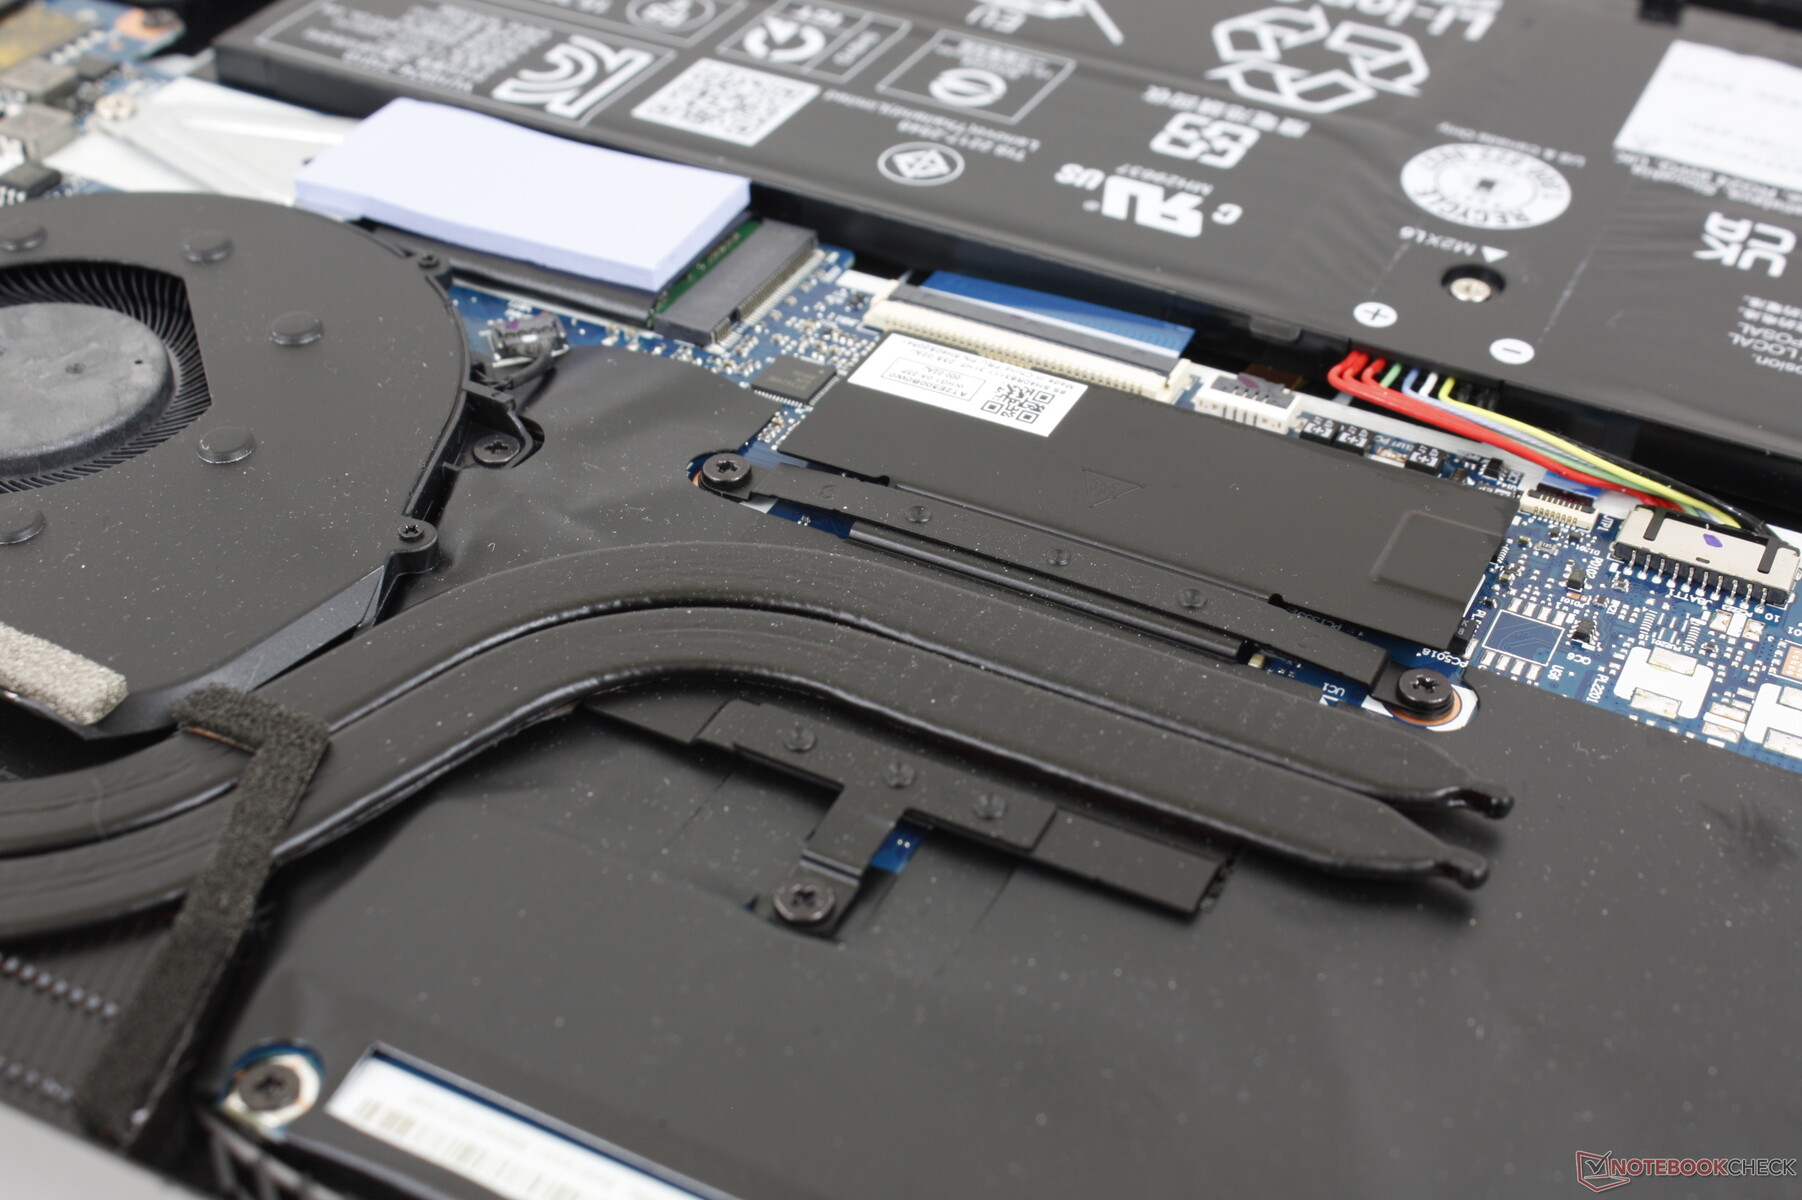
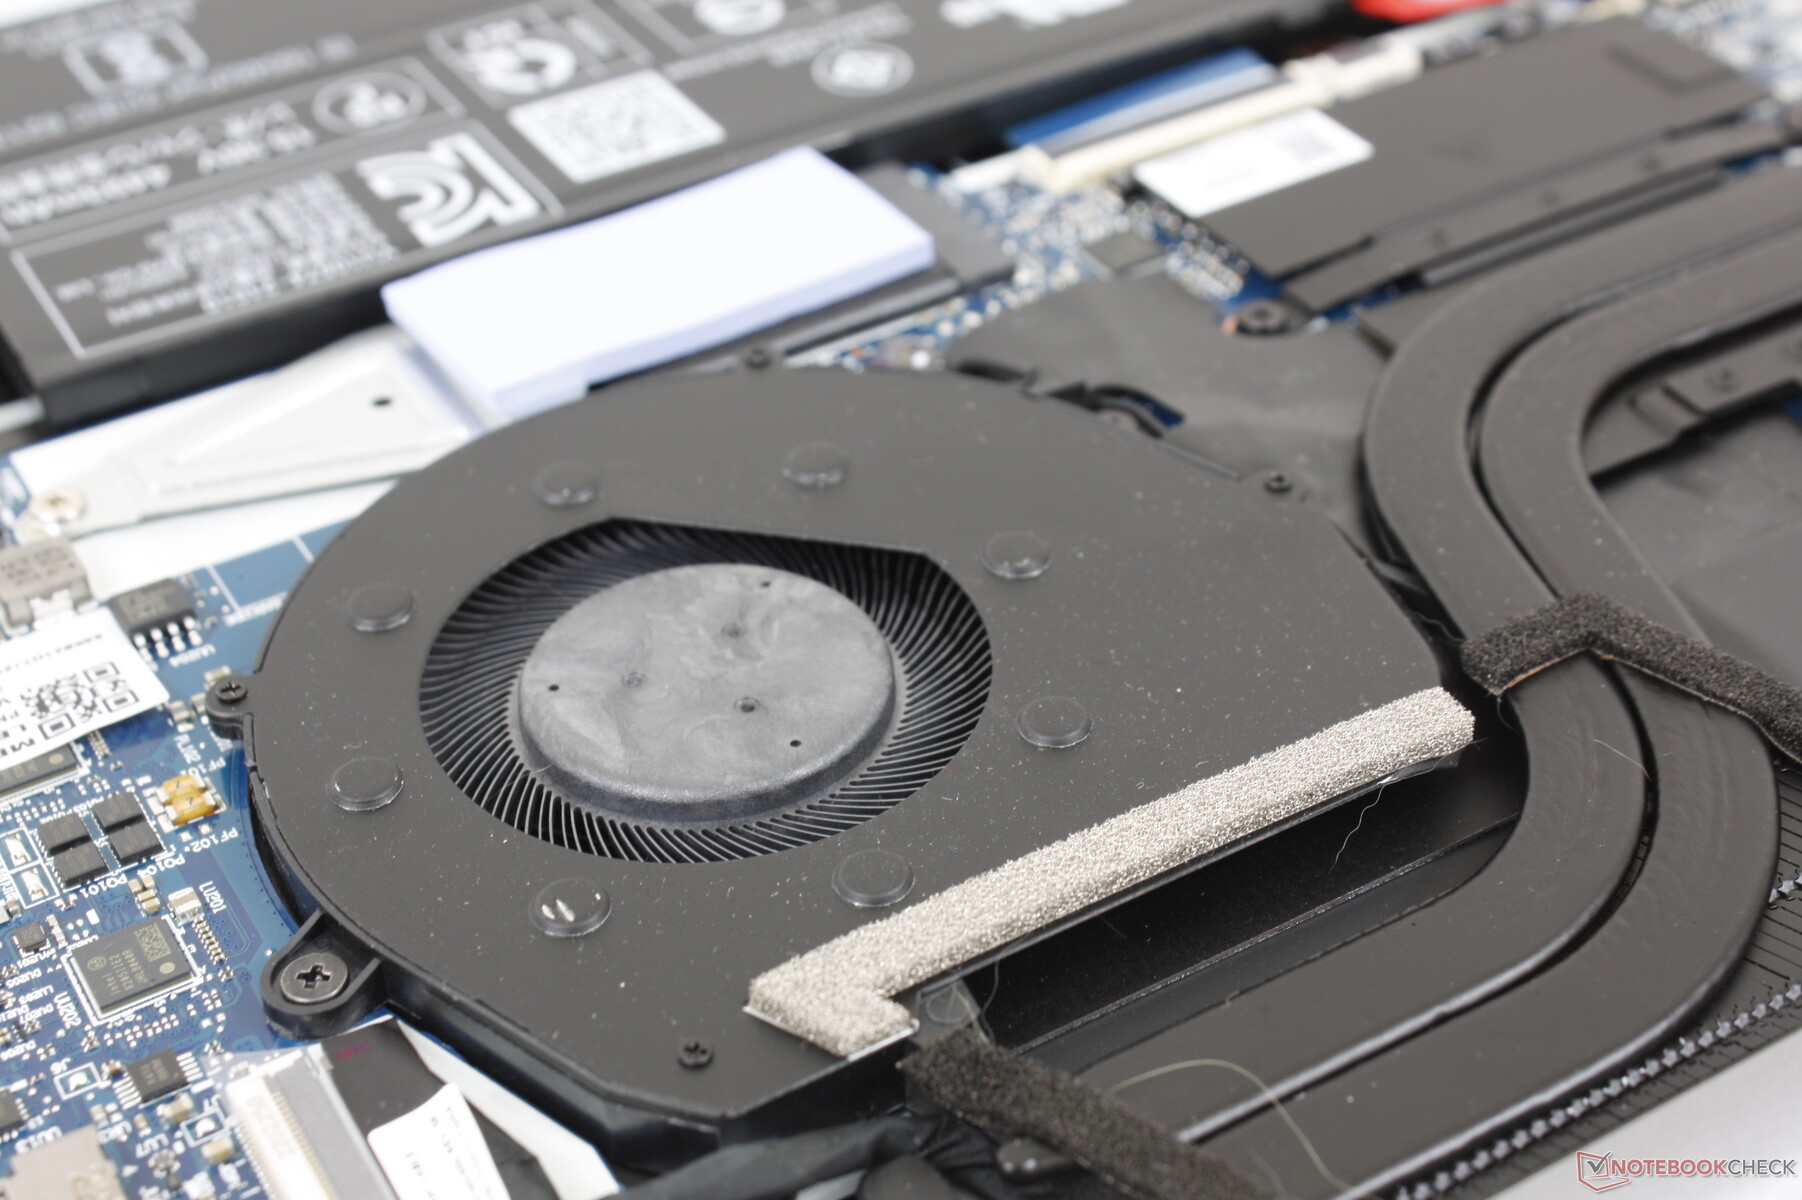
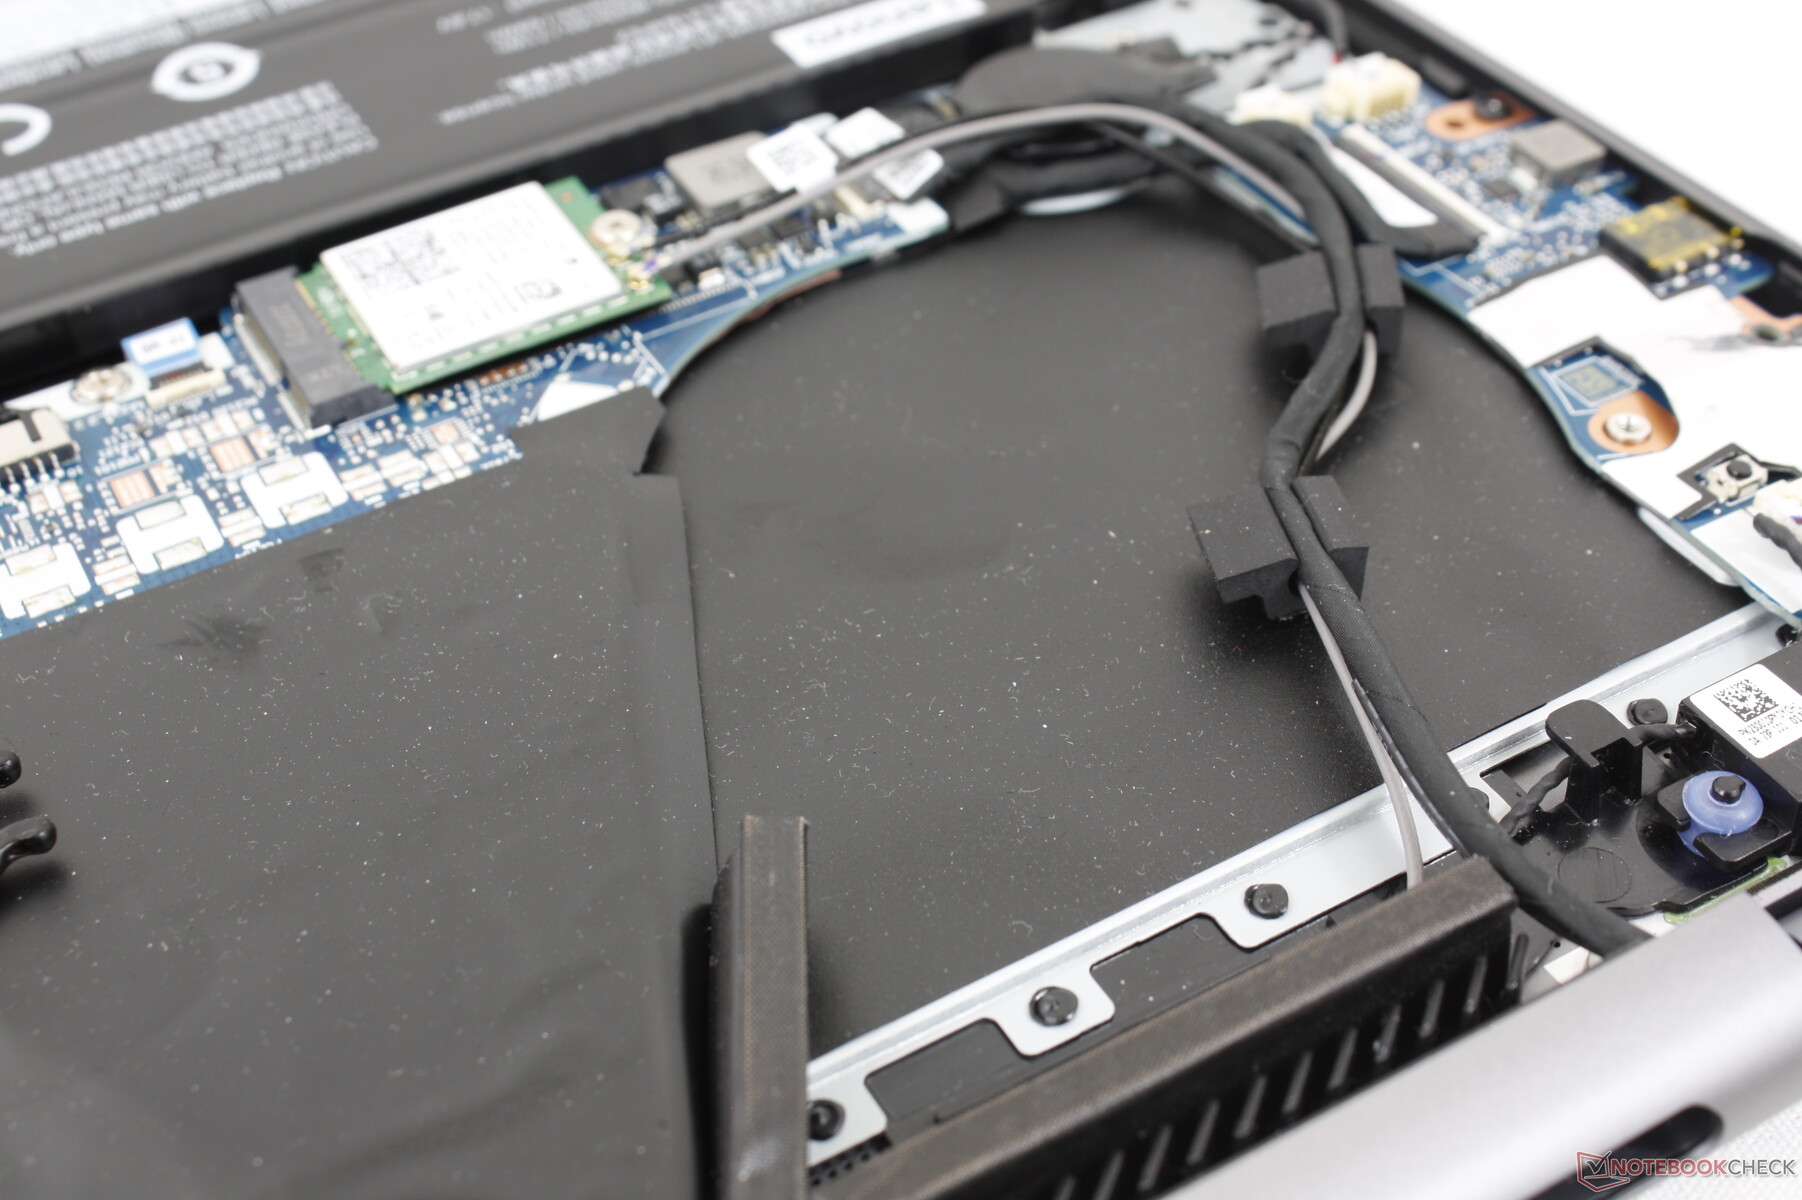
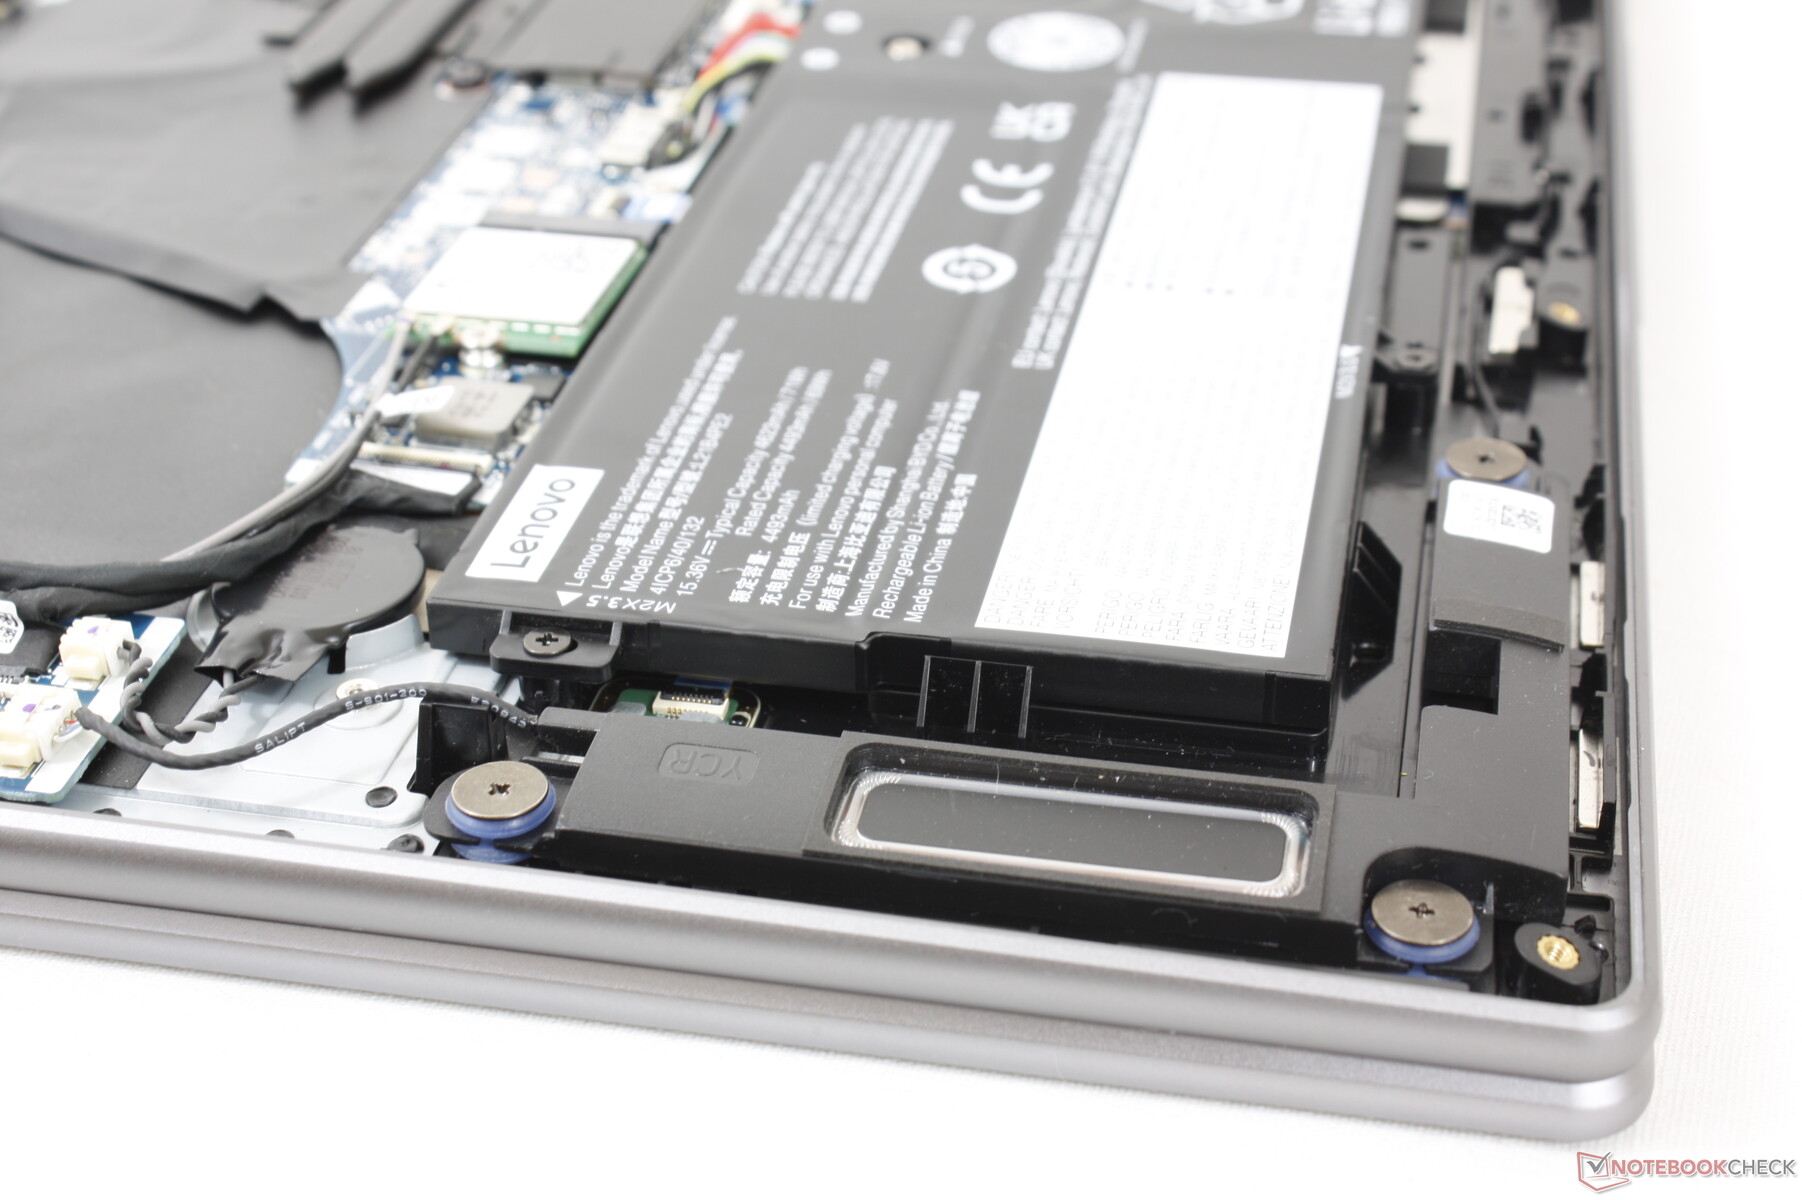
Maintenance
The bottom panel comes off easily after removing the seven T5 Torx screws. Note that the cooling solution is smaller on our configuration as it lacks the discrete Intel Arc GPU. Thus, users who configure with the Intel GPU can expect an even heavier and potentially louder system than what we've experienced on our particular unit.
Accessories and Warranty
The retail box includes no extras beyond the AC adapter and paperwork. We would've loved to see an active stylus pen included especially considering the high price of the Yoga 7 16.
A standard one-year limited manufacturer warranty applies if purchased in the US.
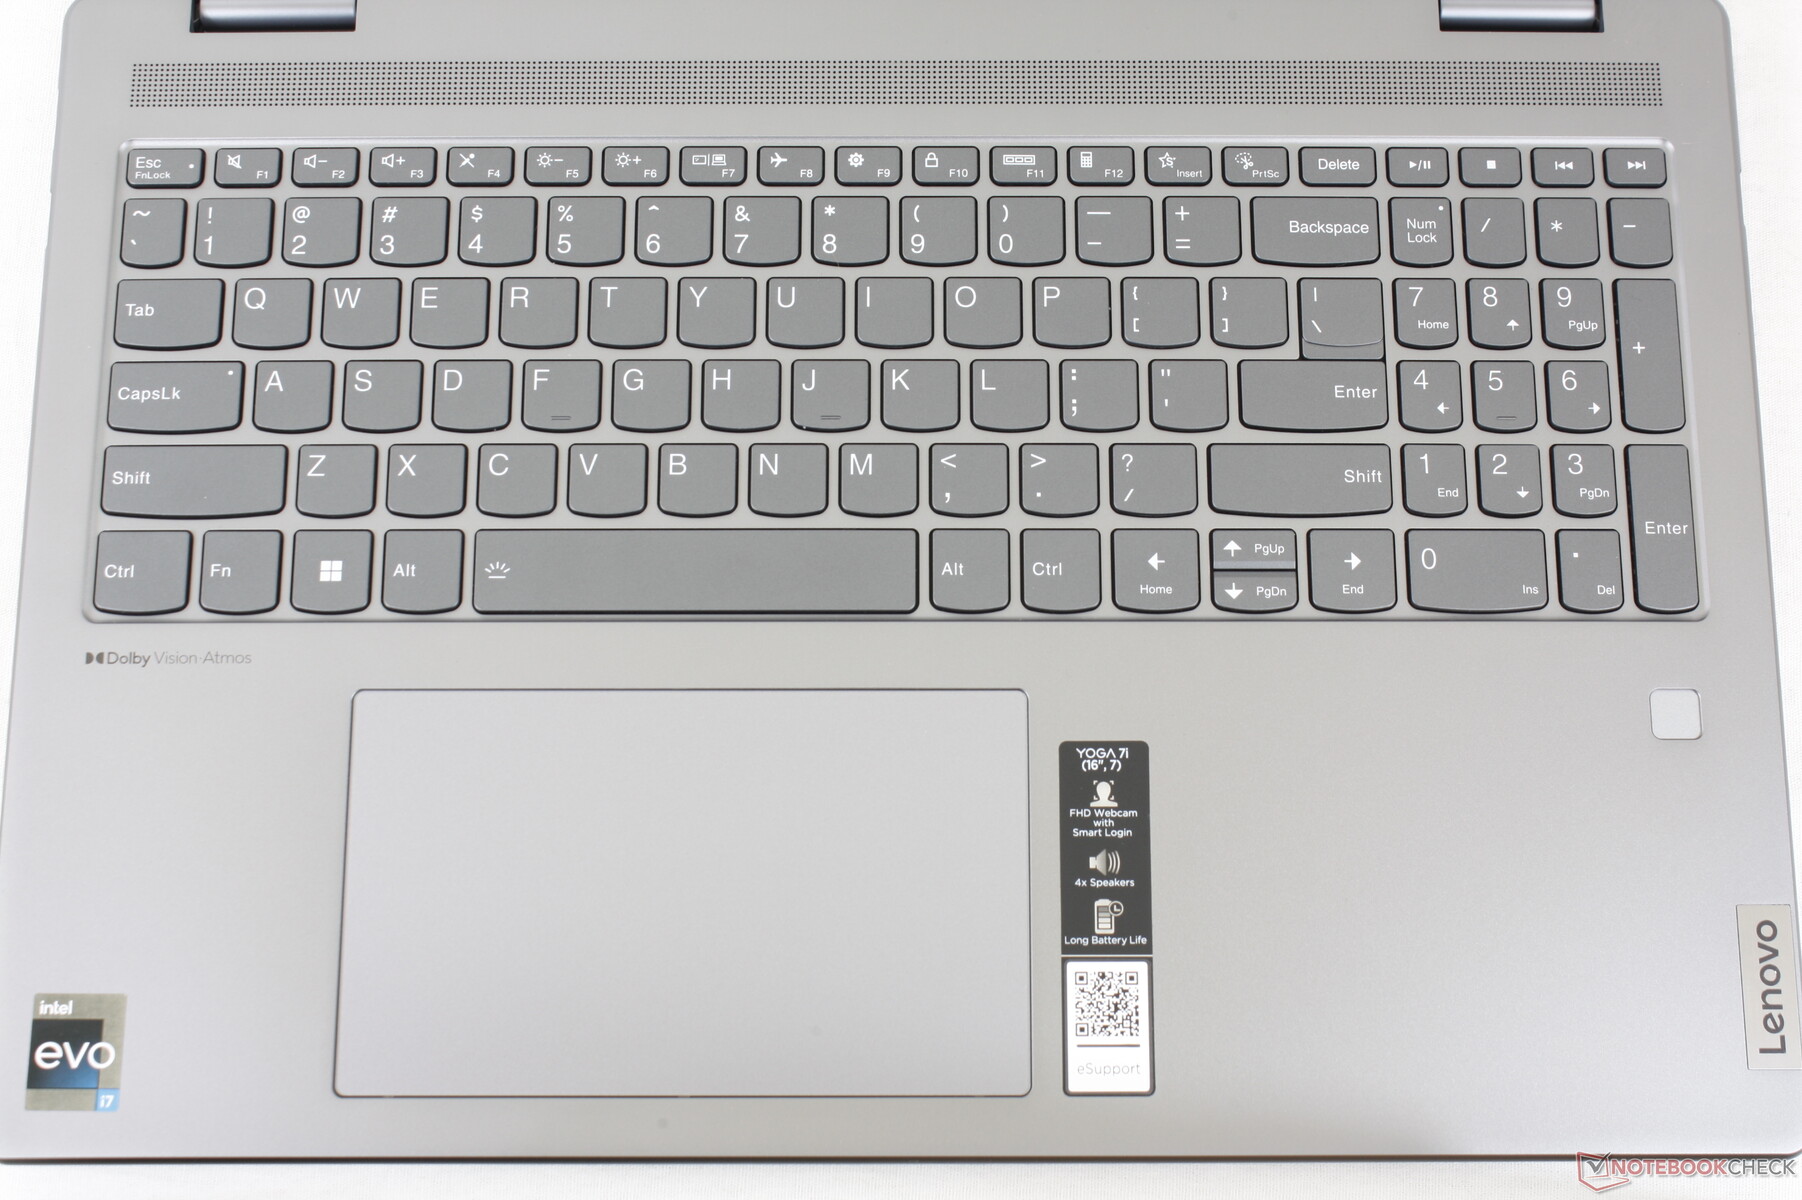
Input Devices — Like An IdeaPad
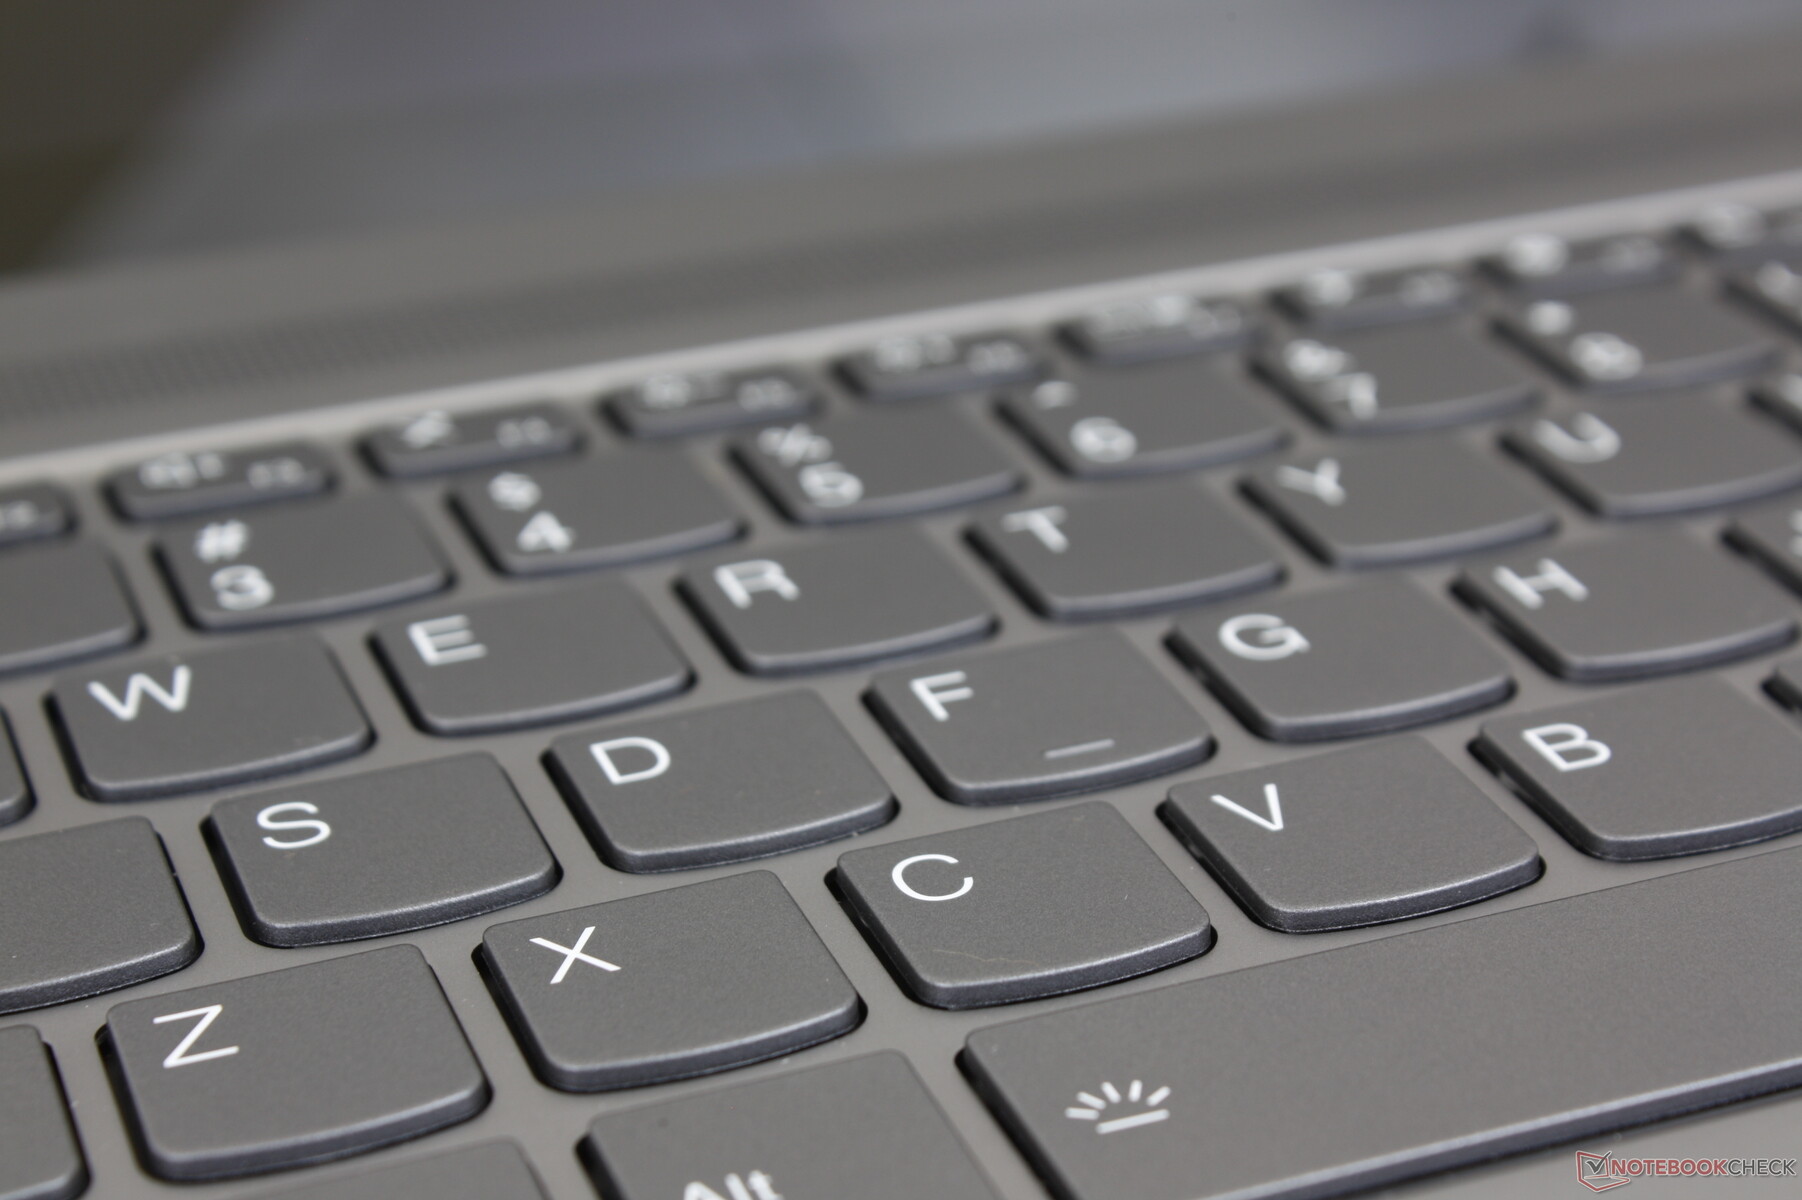
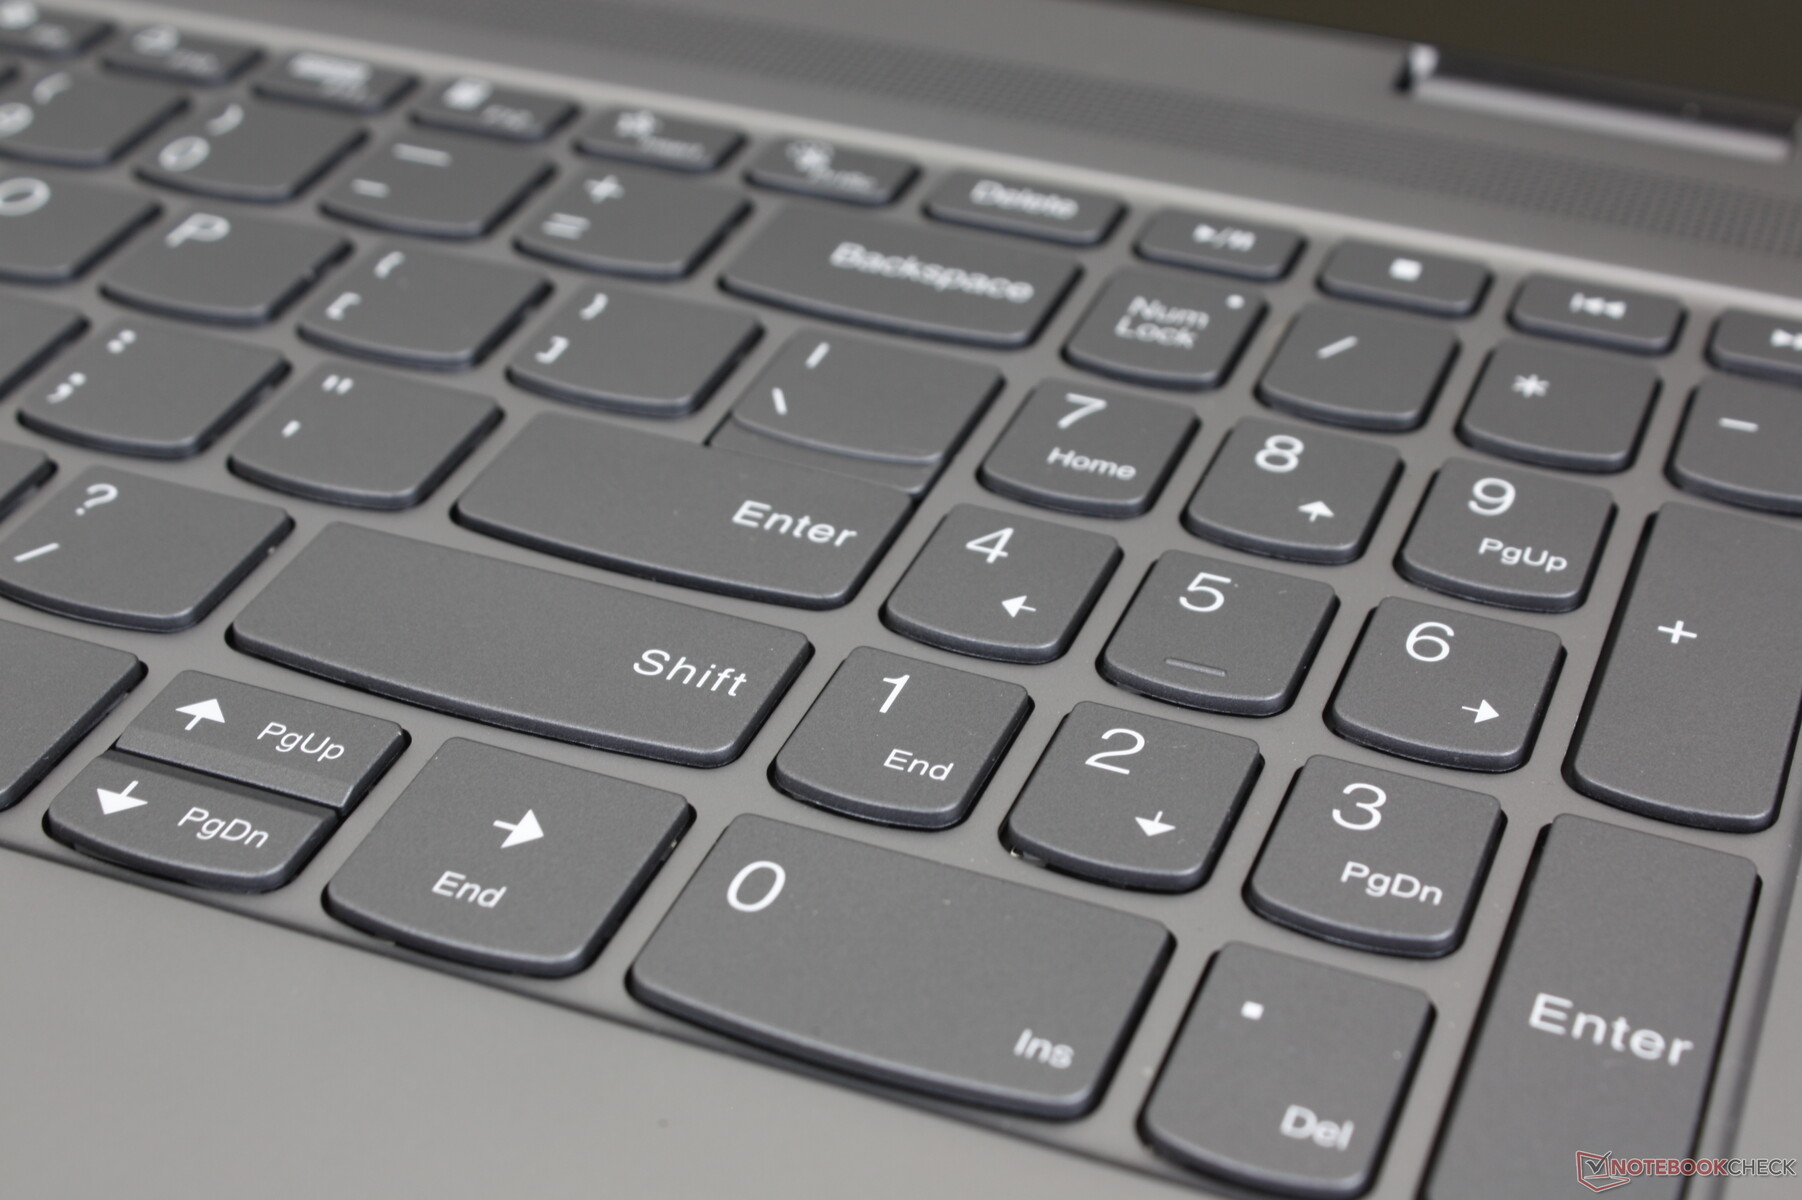
Keyboard
The keyboards on Yoga models are similar to what you'll find on IdeaPad models. Thus, the typing experience will feel familiar if you've had prior experience with IdeaPad or Yoga laptops. The keys here are light and relatively sharp in feedback, but travel is shallow and clatter is moderately loud as well. The keys on the HP Envy or LG Gram series are deeper in comparison.
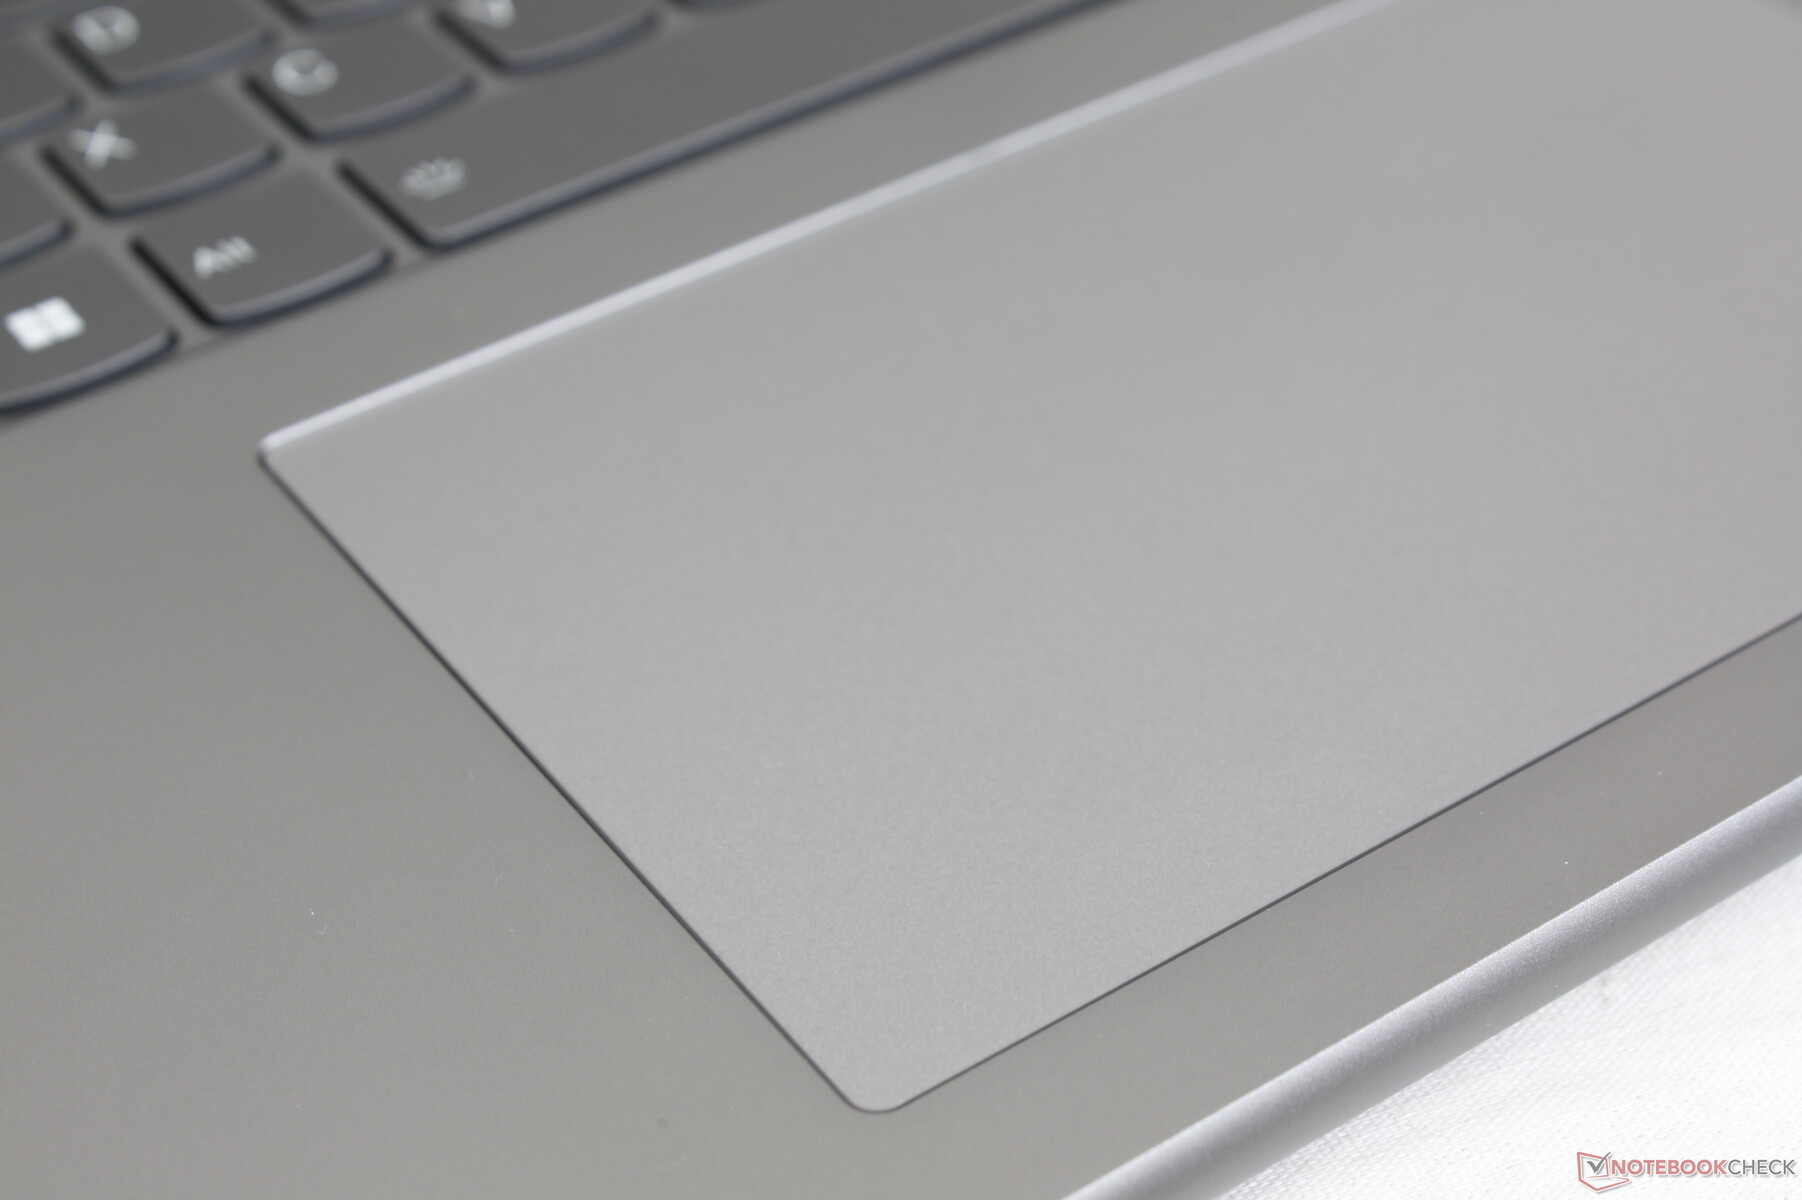
Touchpad
At 13.5 x 8 cm, the clickpad is ever-so-slightly smaller than the ones on the Dell Inspiron 16 7620 2-in-1 (~13.3 x 9 cm) or LG Gram 16 2-in-1 (13.2 x 8.3 cm). It's nonetheless spacious and with a very smooth glide for comfortable multi-touch inputs and cursor scrolling.
The integrated clickpad keys have decent feedback when pressed, but the click is loud which some users may not prefer.
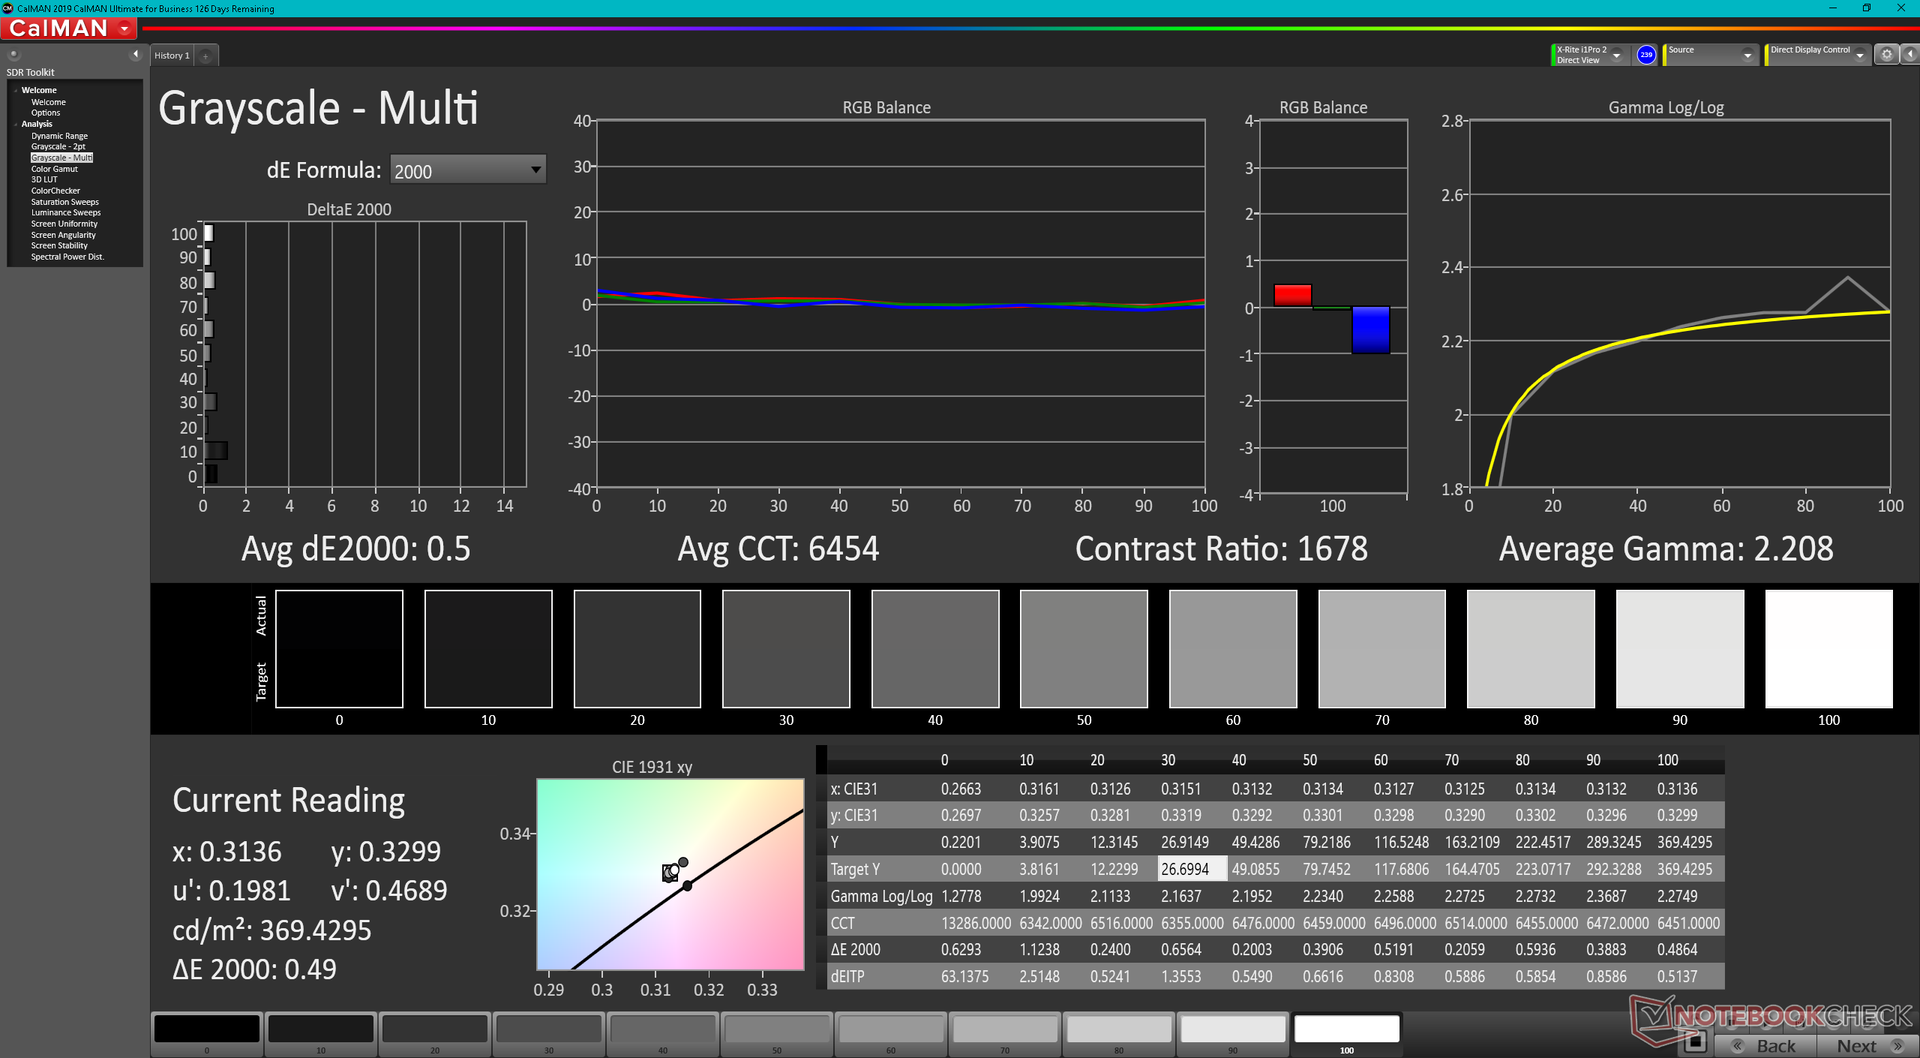
Display — No 90 Hz or 120 Hz options
HWiNFO reports a similar 16:10 LEN160WQXGA IPS panel as found on the IdeaPad 5 Pro 16IHU6. In reality, however, the displays are quite different between two. For one, our Yoga model is limited to a native 60 Hz refresh rate compared to 120 Hz on the IdeaPad. Secondly, response times are much slower on our Yoga. Colors and contrast are otherwise close between the two models. It's still disappointing to find that the display on an IdeaPad is superior to the display on our Yoga even thought the Yoga series is supposed to be a step up from the IdeaPad series.

| |||||||||||||||||||||||||
Brightness Distribution: 84 %
Center on Battery: 393.7 cd/m²
Contrast: 1036:1 (Black: 0.38 cd/m²)
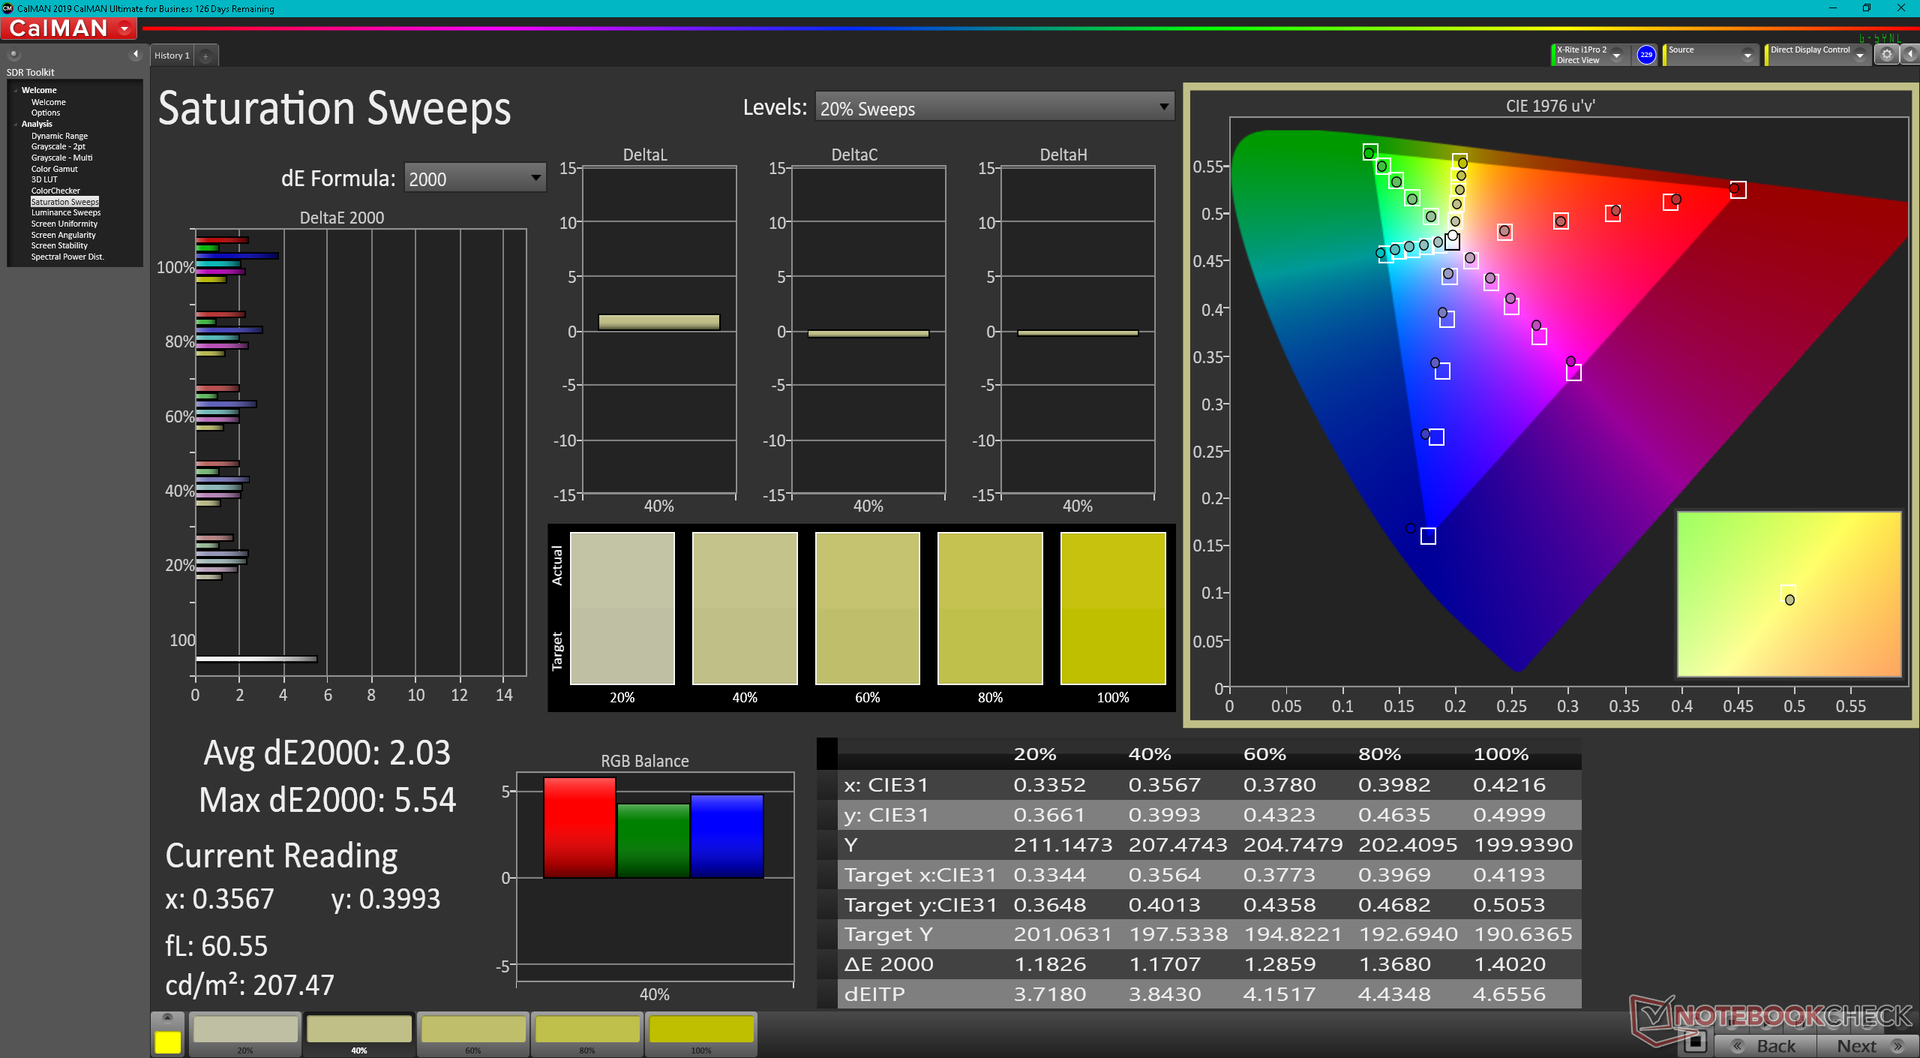
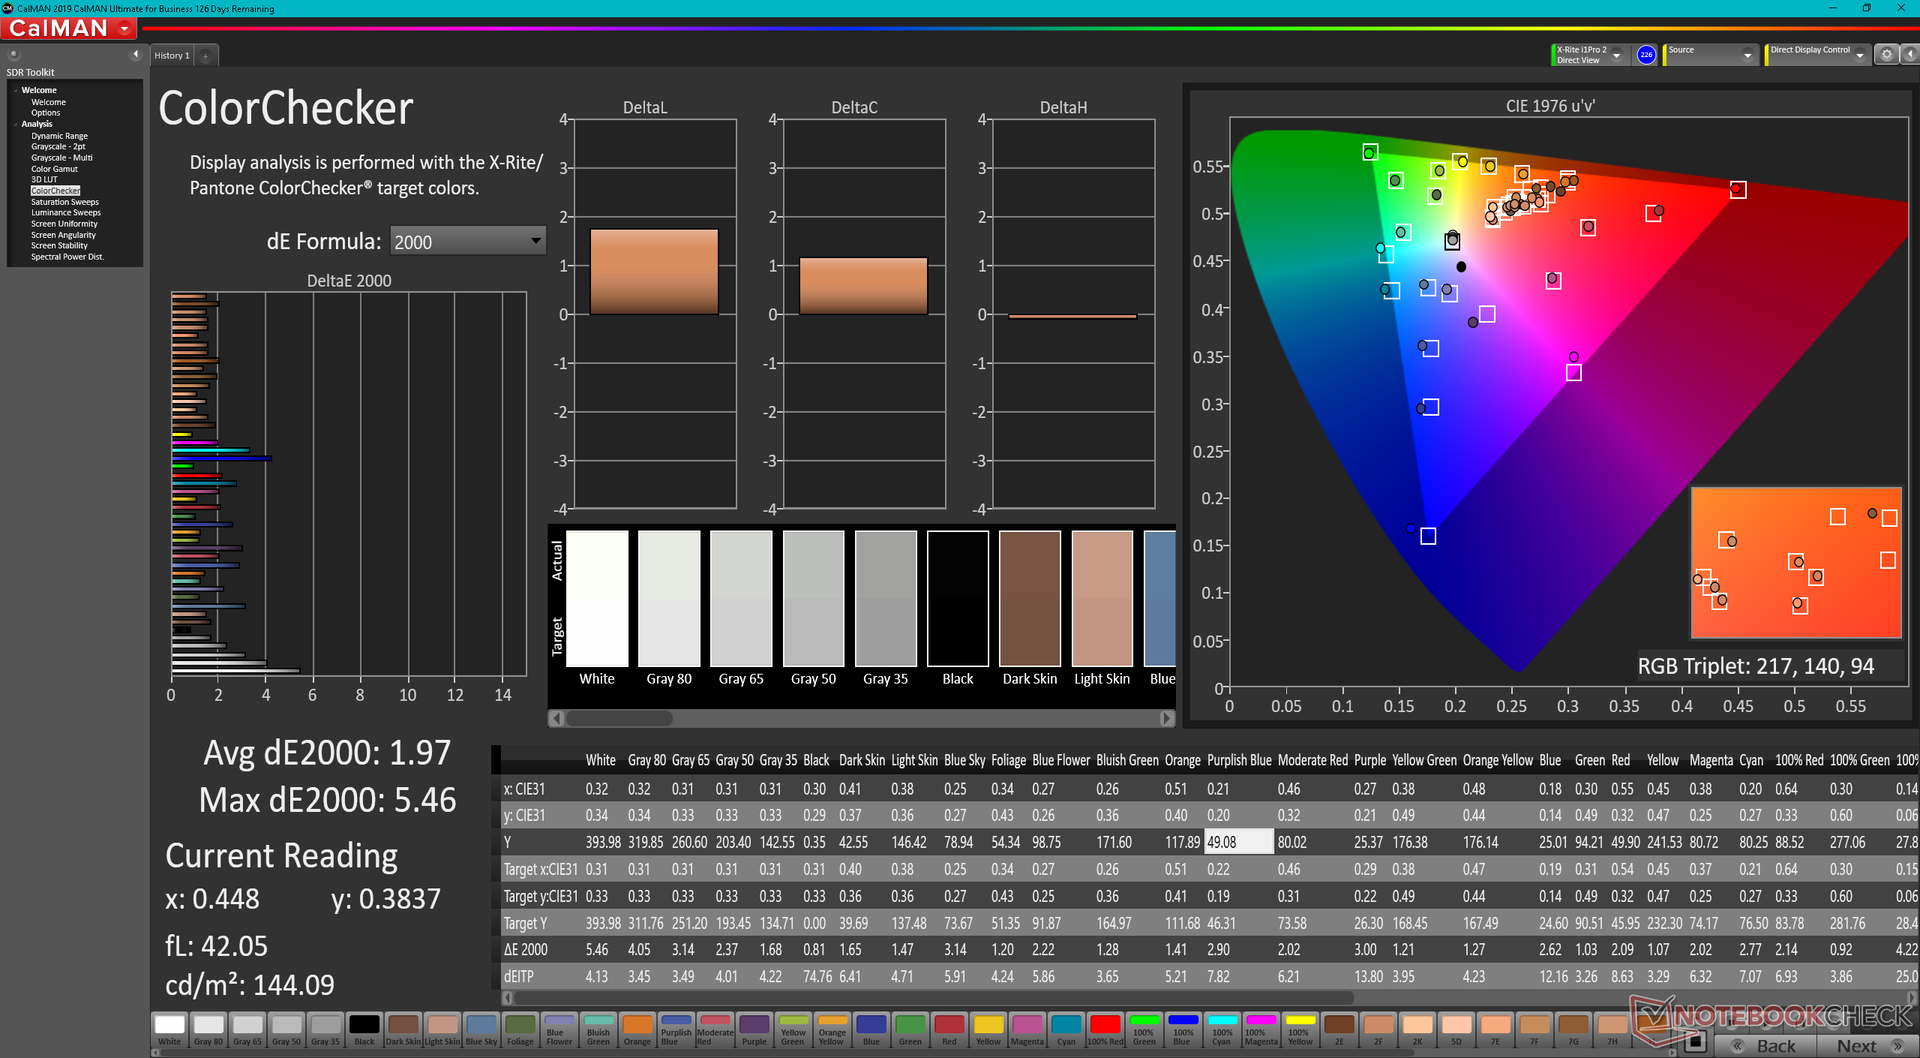
ΔE ColorChecker Calman: 1.97 | ∀{0.5-29.43 Ø4.79}
calibrated: 0.62
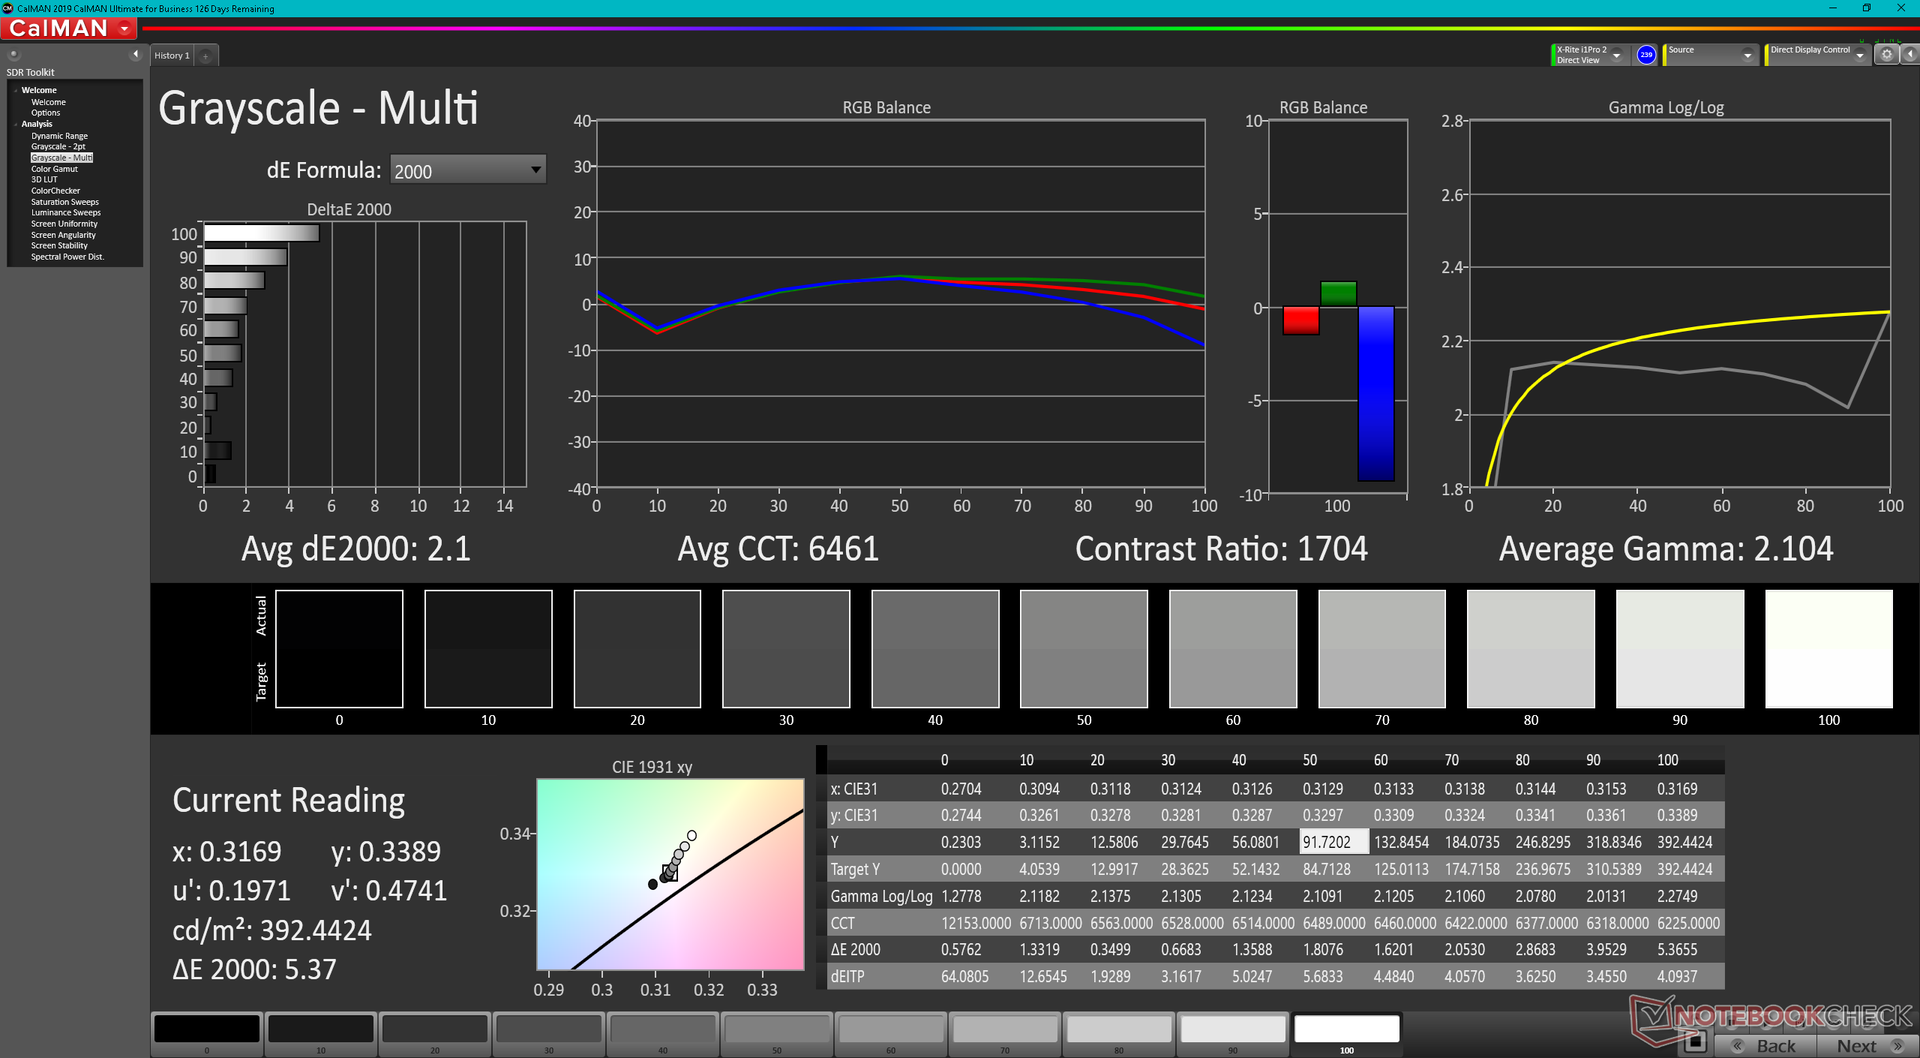
ΔE Greyscale Calman: 2.1 | ∀{0.09-98 Ø5}
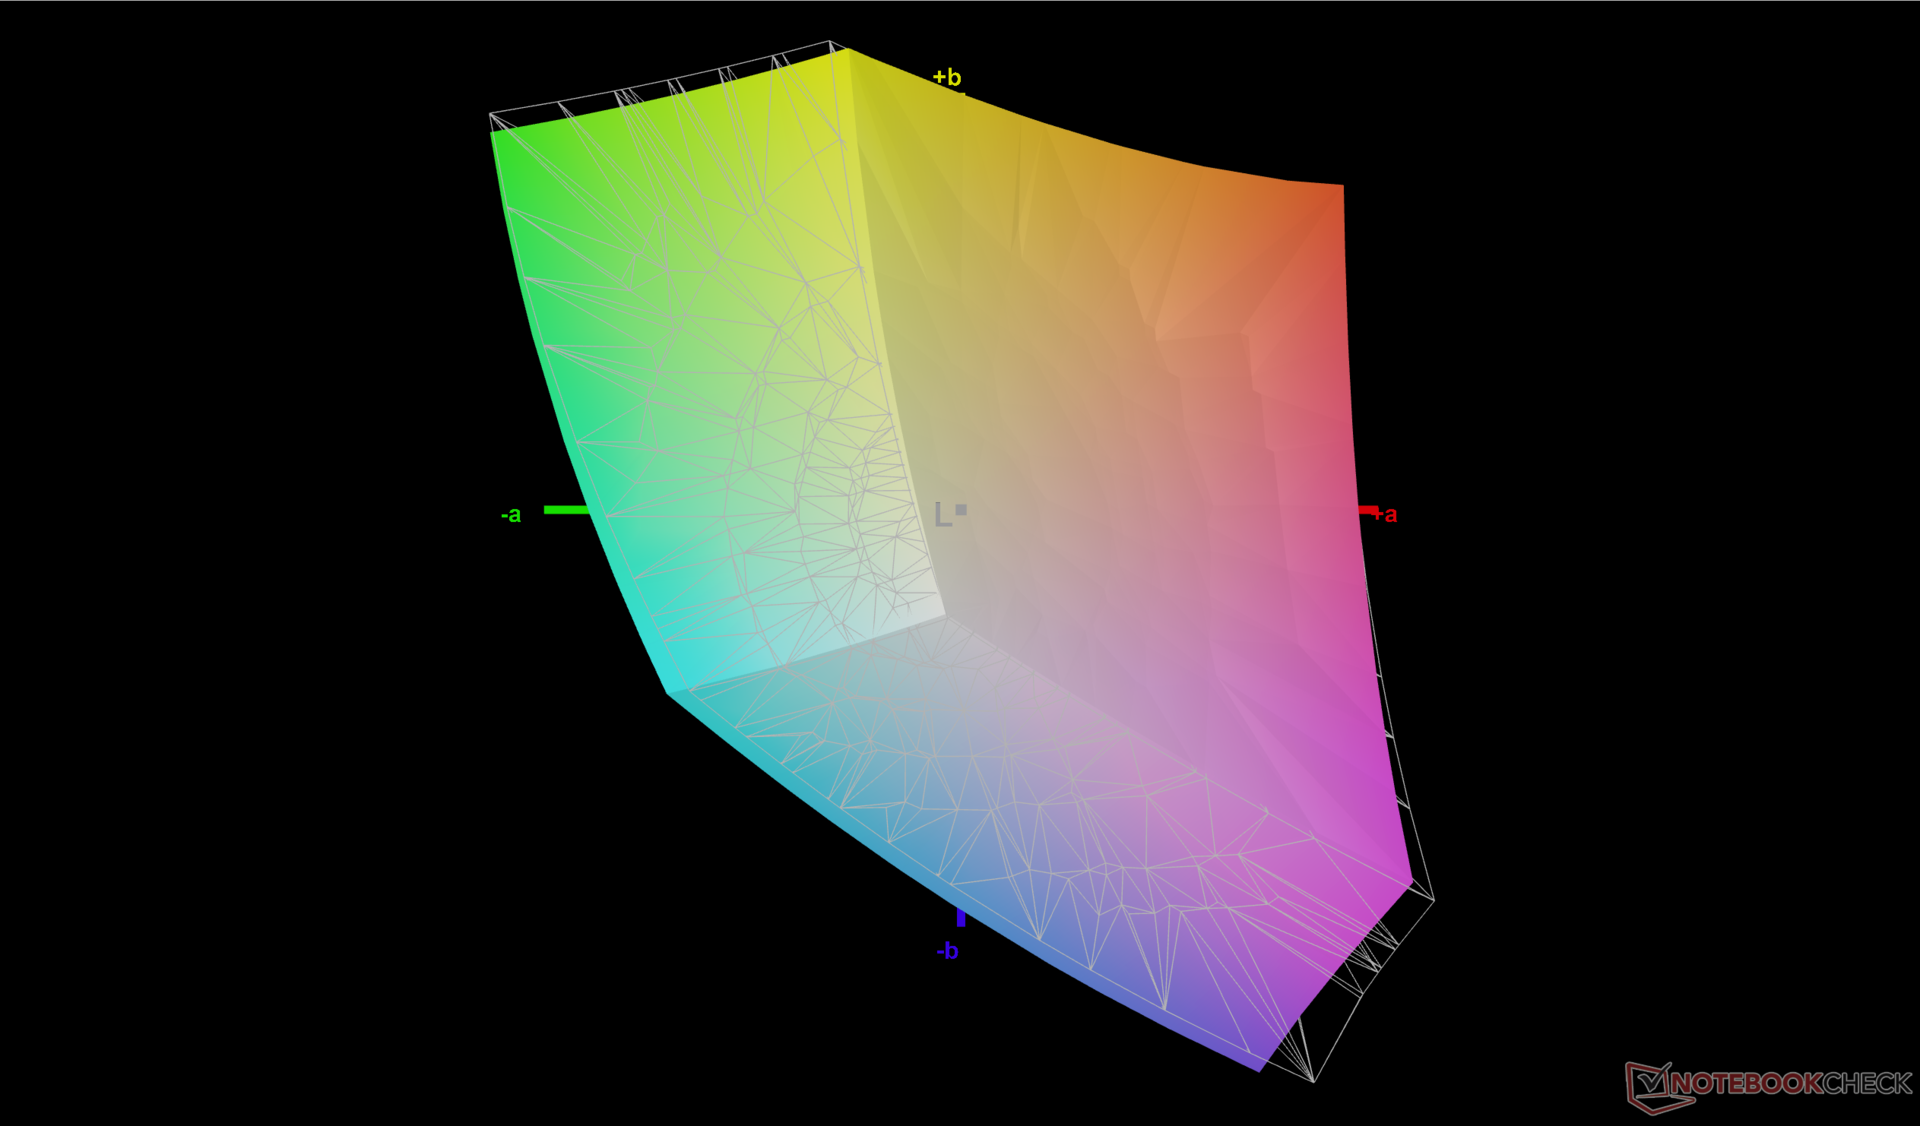
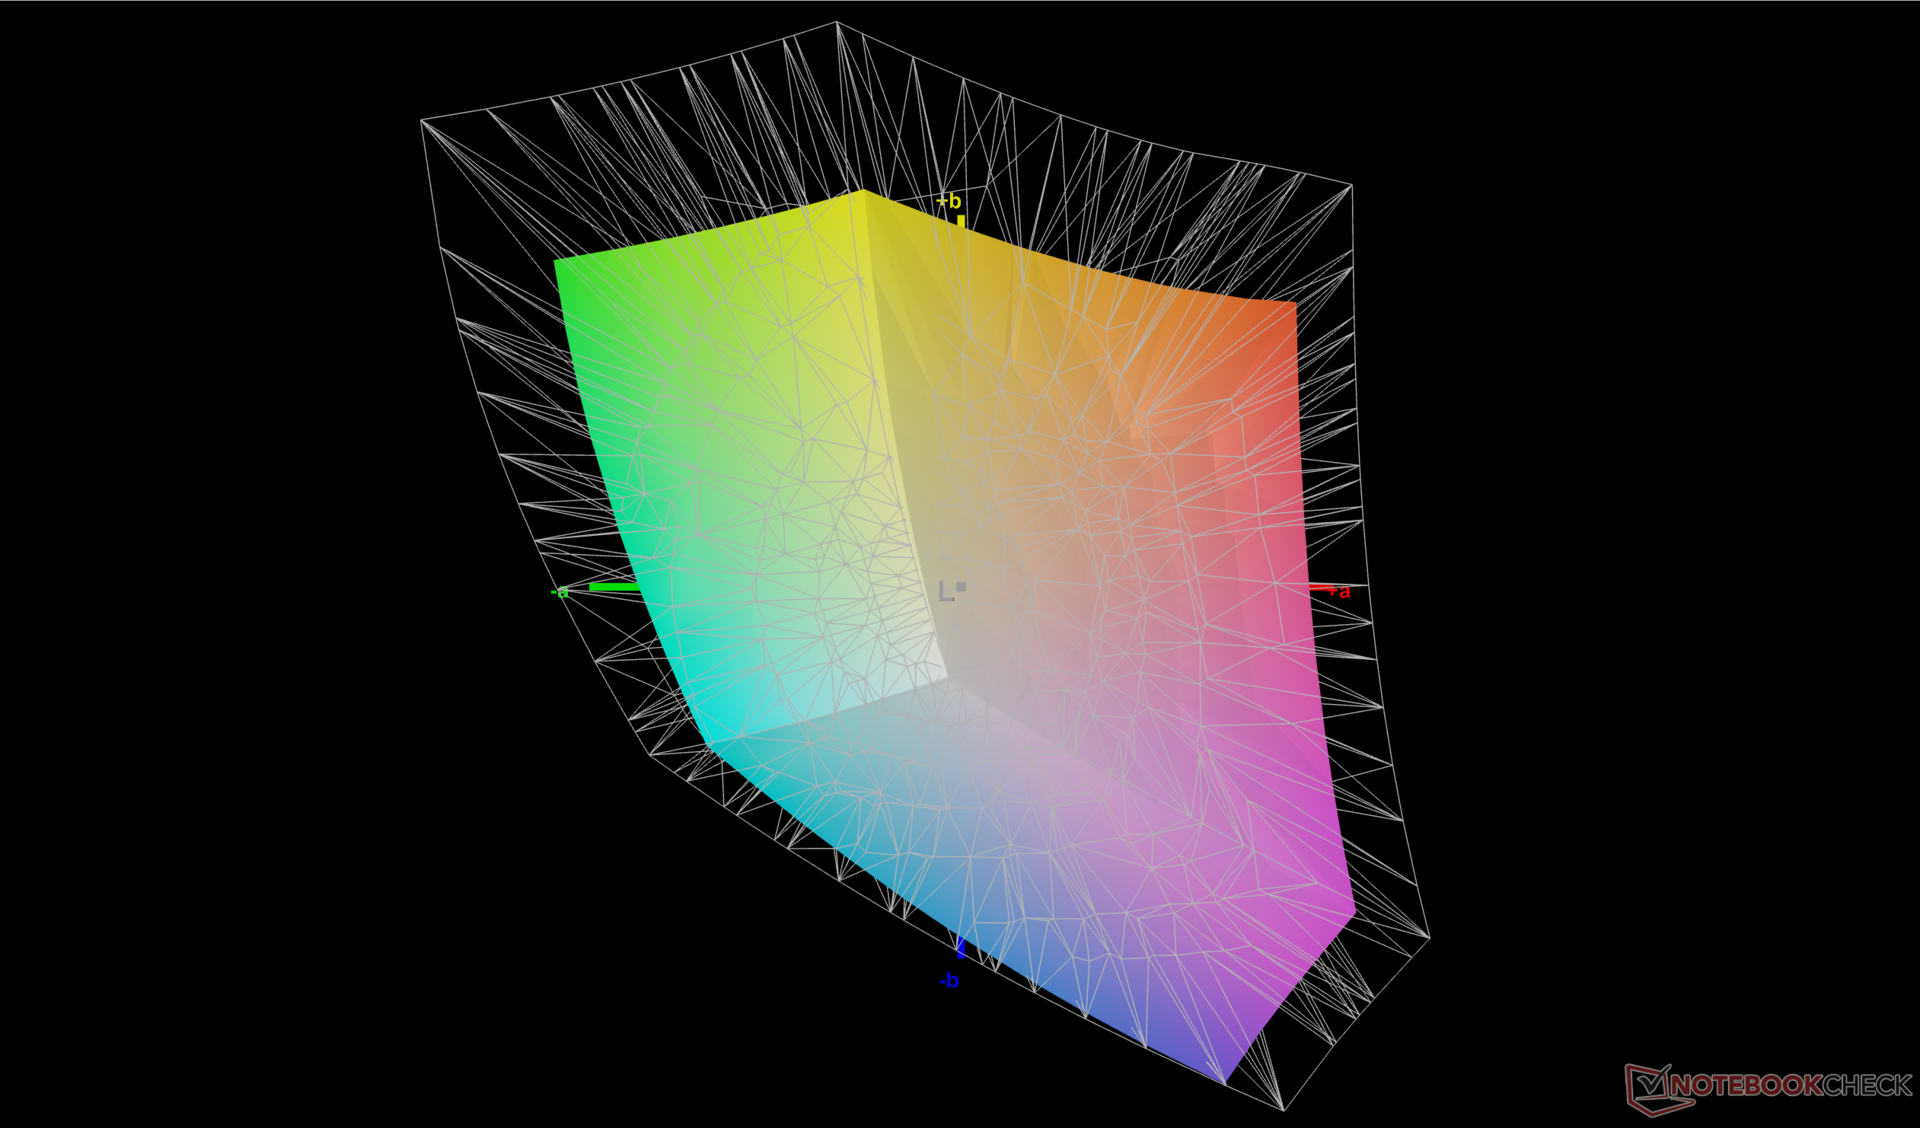
69.3% AdobeRGB 1998 (Argyll 3D)
95.7% sRGB (Argyll 3D)
67% Display P3 (Argyll 3D)
Gamma: 2.1
CCT: 6461 K
| Lenovo Yoga 7 16IAP7 Lenovo LEN160WQXGA, IPS, 2560x1600, 16" | Huawei MateBook D 16 2022 BOE NV160WUM-NH0, IPS, 1920x1200, 16" | Dell Inspiron 16 7620 2-in-1 BOE NV16N45, IPS, 1920x1200, 16" | Acer Swift X SFX16-51G-5388 Chi Mei N161HCA-EA3, , 1920x1080, 16.1" | LG Gram 16 (2021) LG Philips LP160WQ1-SPA1, IPS, 2560x1600, 16" | Lenovo IdeaPad 5 Pro 16ACH IPS LED, 2560x1600, 16" | |
|---|---|---|---|---|---|---|
| Display | -0% | 0% | -2% | 23% | 5% | |
| Display P3 Coverage (%) | 67 | 66.2 -1% | 67 0% | 65.1 -3% | 95.8 43% | 71 6% |
| sRGB Coverage (%) | 95.7 | 96.4 1% | 95.9 0% | 95.65 0% | 99.8 4% | 99 3% |
| AdobeRGB 1998 Coverage (%) | 69.3 | 68.3 -1% | 69.3 0% | 66.75 -4% | 83.8 21% | 73.3 6% |
| Response Times | 20% | 14% | 18% | -2% | 60% | |
| Response Time Grey 50% / Grey 80% * (ms) | 36 ? | 30.5 ? 15% | 32 ? 11% | 30 ? 17% | 44 ? -22% | 16.4 ? 54% |
| Response Time Black / White * (ms) | 24.8 ? | 18.7 ? 25% | 20.8 ? 16% | 20 ? 19% | 20 ? 19% | 8.8 ? 65% |
| PWM Frequency (Hz) | 24940 ? | |||||
| Screen | -30% | -48% | 8% | -88% | -14% | |
| Brightness middle (cd/m²) | 393.7 | 319 -19% | 320.7 -19% | 276 -30% | 331 -16% | 395 0% |
| Brightness (cd/m²) | 367 | 317 -14% | 309 -16% | 264 -28% | 309 -16% | 375 2% |
| Brightness Distribution (%) | 84 | 90 7% | 90 7% | 85 1% | 88 5% | 90 7% |
| Black Level * (cd/m²) | 0.38 | 0.23 39% | 0.36 5% | 0.16 58% | 0.22 42% | 0.32 16% |
| Contrast (:1) | 1036 | 1387 34% | 891 -14% | 1725 67% | 1505 45% | 1234 19% |
| Colorchecker dE 2000 * | 1.97 | 3.4 -73% | 4.18 -112% | 1.8 9% | 4.64 -136% | 2.6 -32% |
| Colorchecker dE 2000 max. * | 5.46 | 8.1 -48% | 8.48 -55% | 3.77 31% | 9.82 -80% | 5.4 1% |
| Colorchecker dE 2000 calibrated * | 0.62 | 0.8 -29% | 0.77 -24% | 0.63 -2% | 3.16 -410% | 1.1 -77% |
| Greyscale dE 2000 * | 2.1 | 5.7 -171% | 6.3 -200% | 2.76 -31% | 6.9 -229% | 3.4 -62% |
| Gamma | 2.1 105% | 2.1 105% | 2.21 100% | 2.37 93% | 2.34 94% | 2.12 104% |
| CCT | 6461 101% | 7433 87% | 6258 104% | 6564 99% | 7904 82% | 6140 106% |
| Color Space (Percent of AdobeRGB 1998) (%) | 75.1 | |||||
| Color Space (Percent of sRGB) (%) | 100 | |||||
| Total Average (Program / Settings) | -3% /
-17% | -11% /
-29% | 8% /
7% | -22% /
-52% | 17% /
1% |
* ... smaller is better
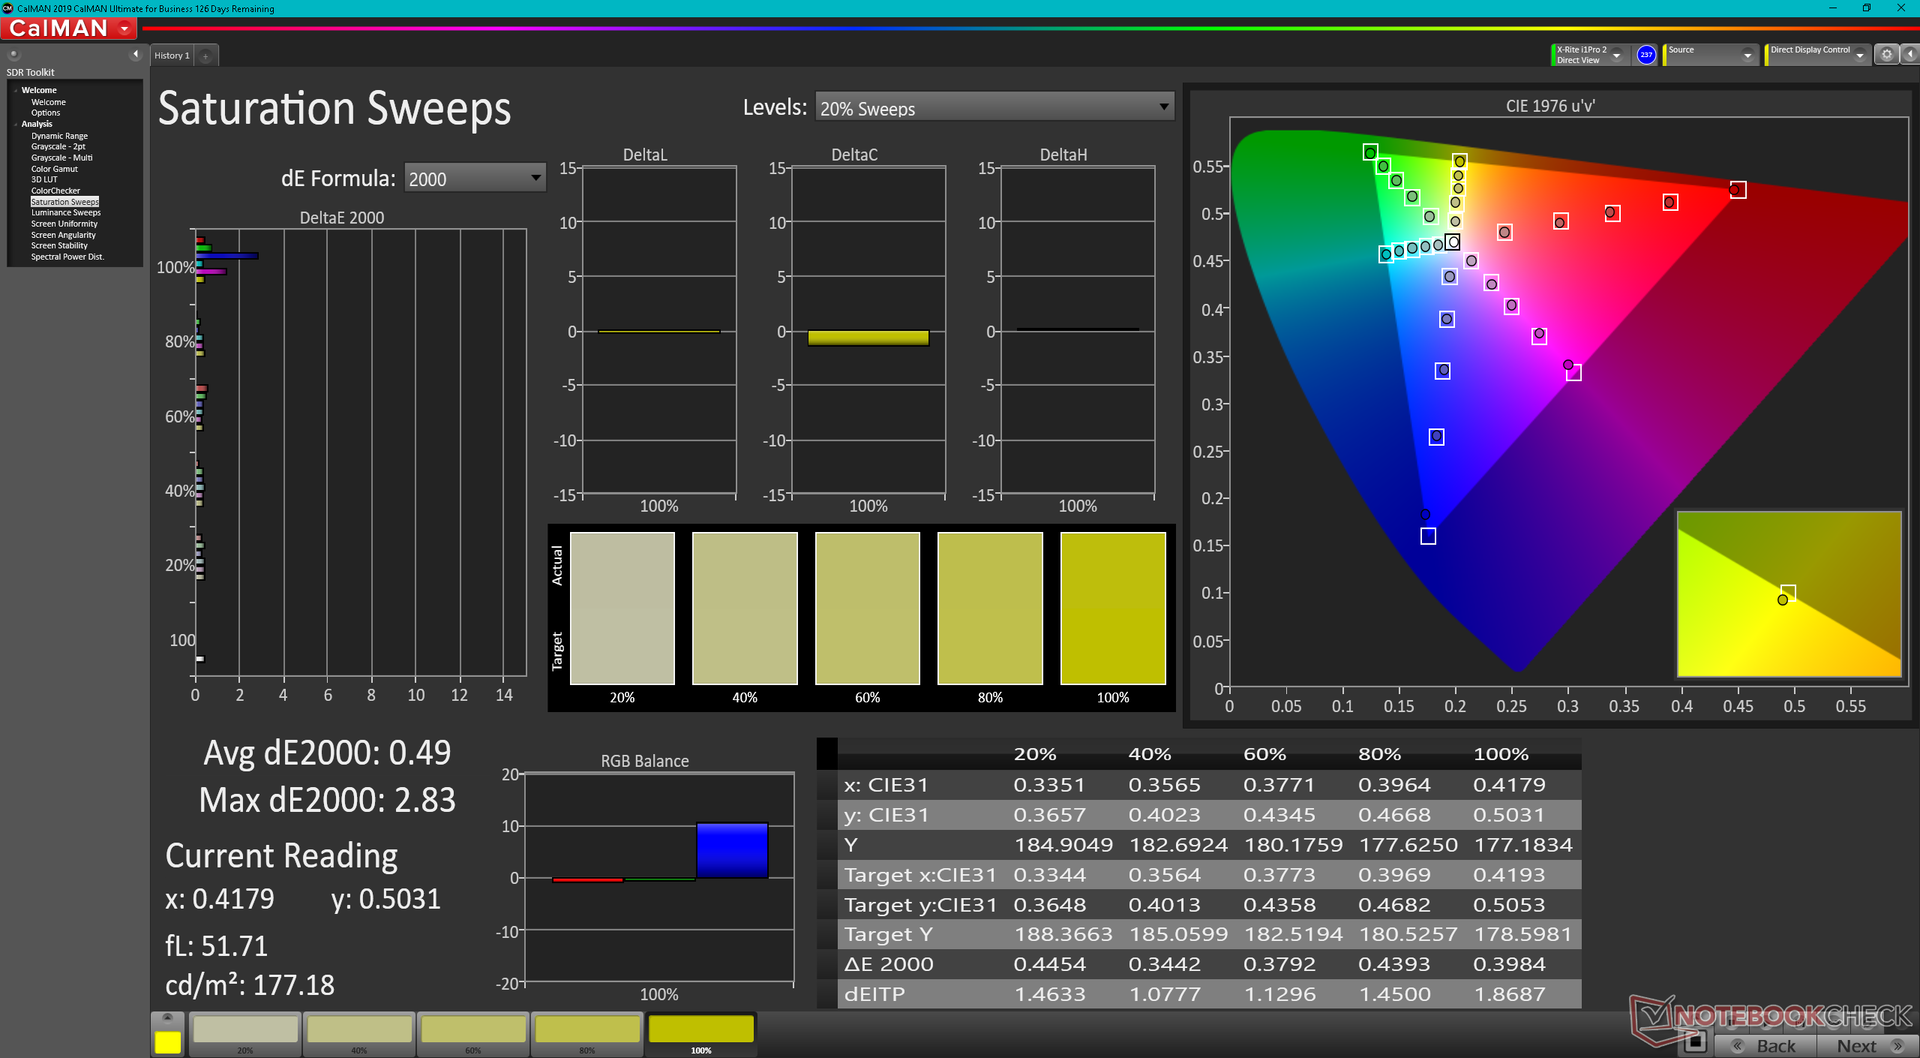
The panel offers >95 percent sRGB coverage to be similar to most other midrange 16-inch convertibles or laptops. The LG Gram 16 is one of the few alternatives to offer an even wider >95 percent P3.
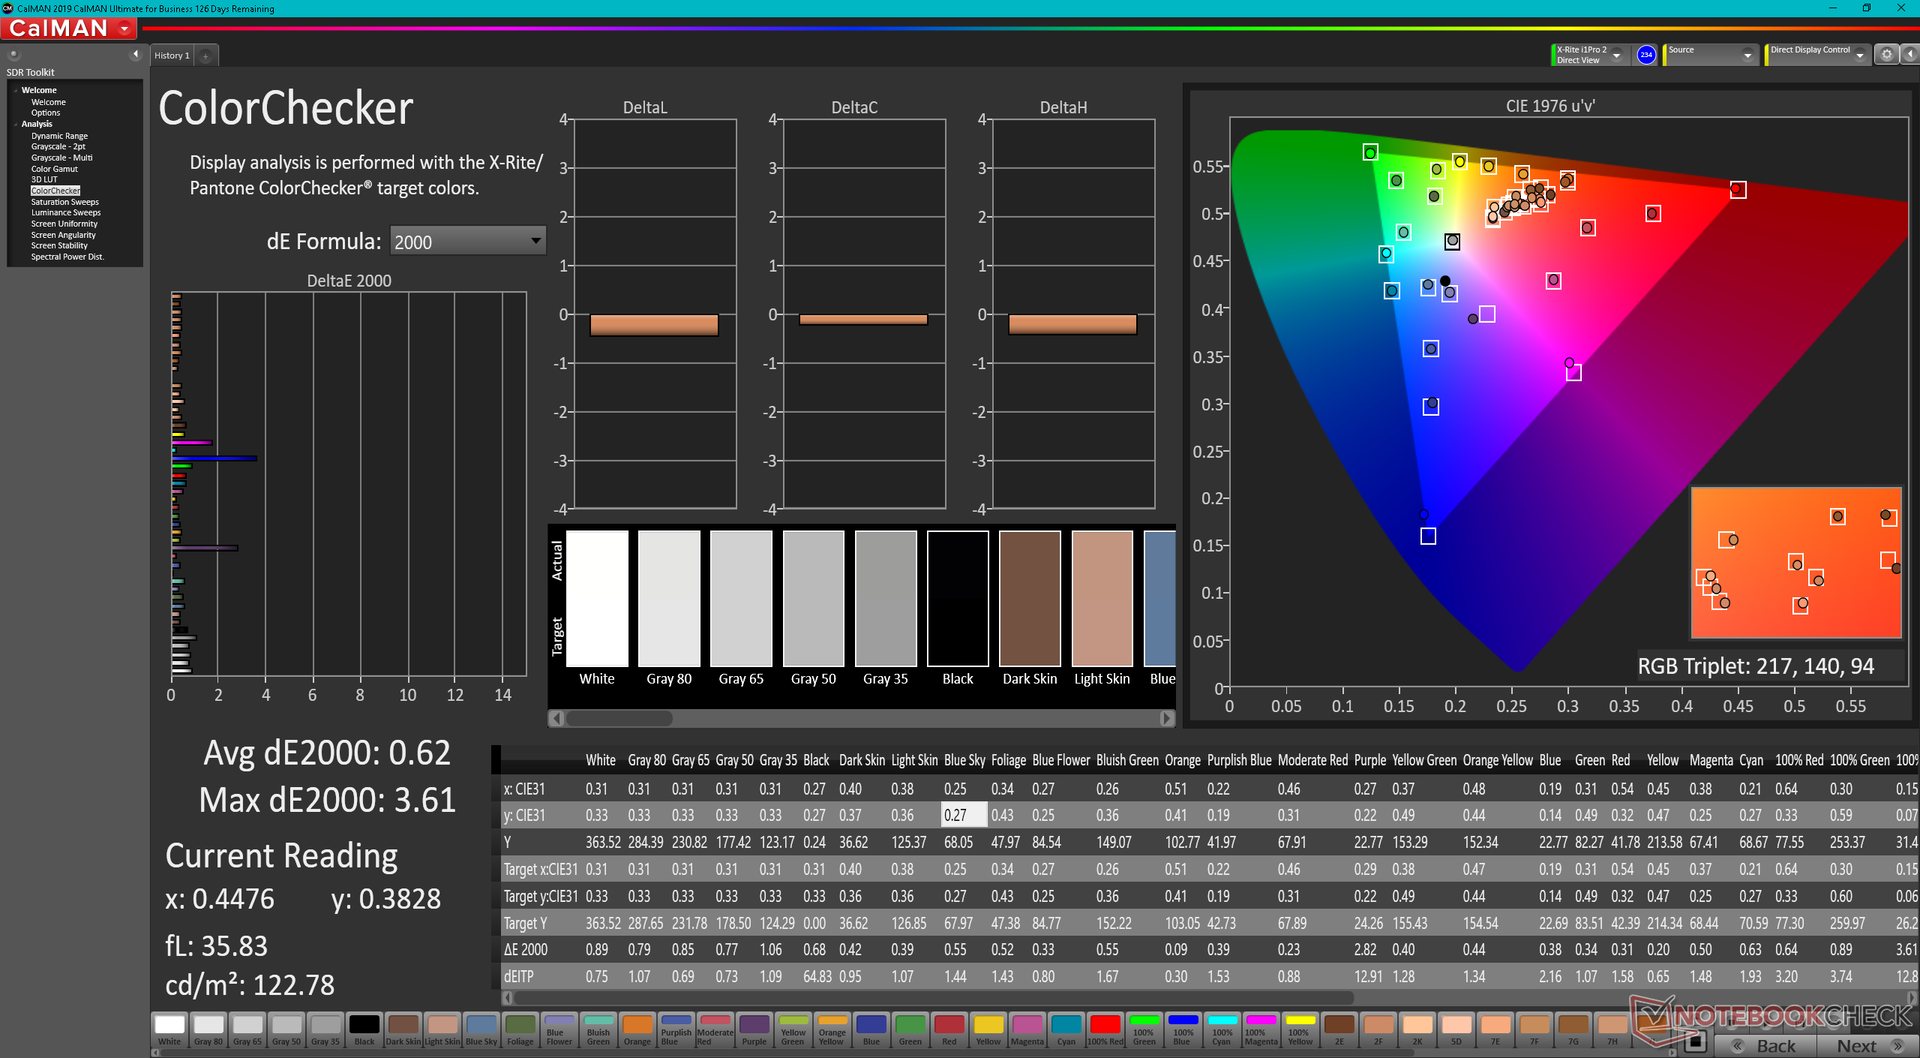
The display is already well calibrated out of the box with average grayscale and color DeltaE values of only 2.1 and 1.97, respectively. We're able to take this even further with our own X-Rite calibration to reduce the average grayscale and color DeltaE values to just 0.5 and 0.62, respectively. Even so, an end-user calibration isn't really needed since the display is already sRGB accurate as shipped.
Display Response Times
| ↔ Response Time Black to White | ||
|---|---|---|
| 24.8 ms ... rise ↗ and fall ↘ combined | ↗ 12.4 ms rise | 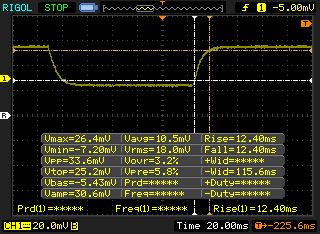 |
| ↘ 12.4 ms fall | ||
| The screen shows good response rates in our tests, but may be too slow for competitive gamers. In comparison, all tested devices range from 0.1 (minimum) to 240 (maximum) ms. » 57 % of all devices are better. This means that the measured response time is worse than the average of all tested devices (20.3 ms). | ||
| ↔ Response Time 50% Grey to 80% Grey | ||
| 36 ms ... rise ↗ and fall ↘ combined | ↗ 18 ms rise | 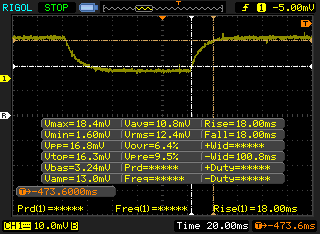 |
| ↘ 18 ms fall | ||
| The screen shows slow response rates in our tests and will be unsatisfactory for gamers. In comparison, all tested devices range from 0.165 (minimum) to 636 (maximum) ms. » 49 % of all devices are better. This means that the measured response time is worse than the average of all tested devices (31.7 ms). | ||
Screen Flickering / PWM (Pulse-Width Modulation)
| Screen flickering / PWM not detected | 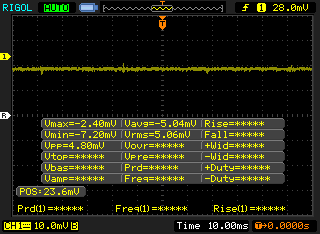 | ||
In comparison: 53 % of all tested devices do not use PWM to dim the display. If PWM was detected, an average of 8156 (minimum: 5 - maximum: 343500) Hz was measured. | |||
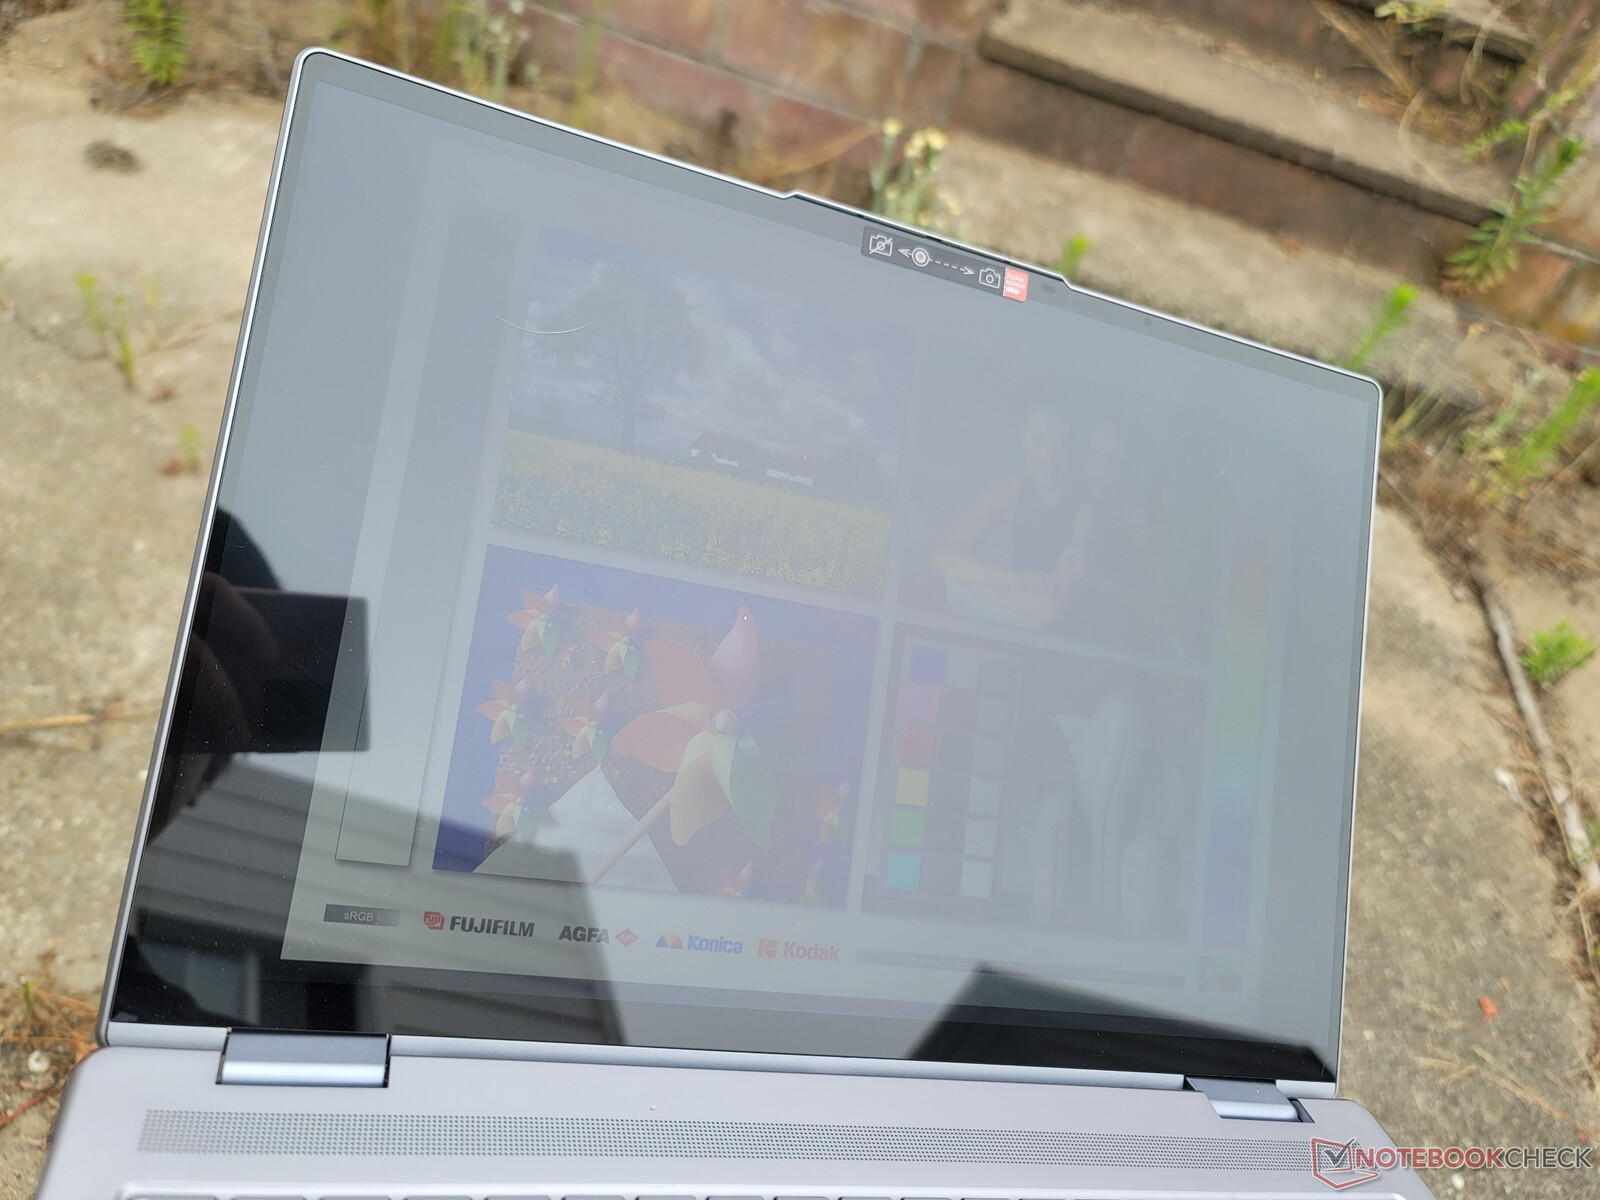
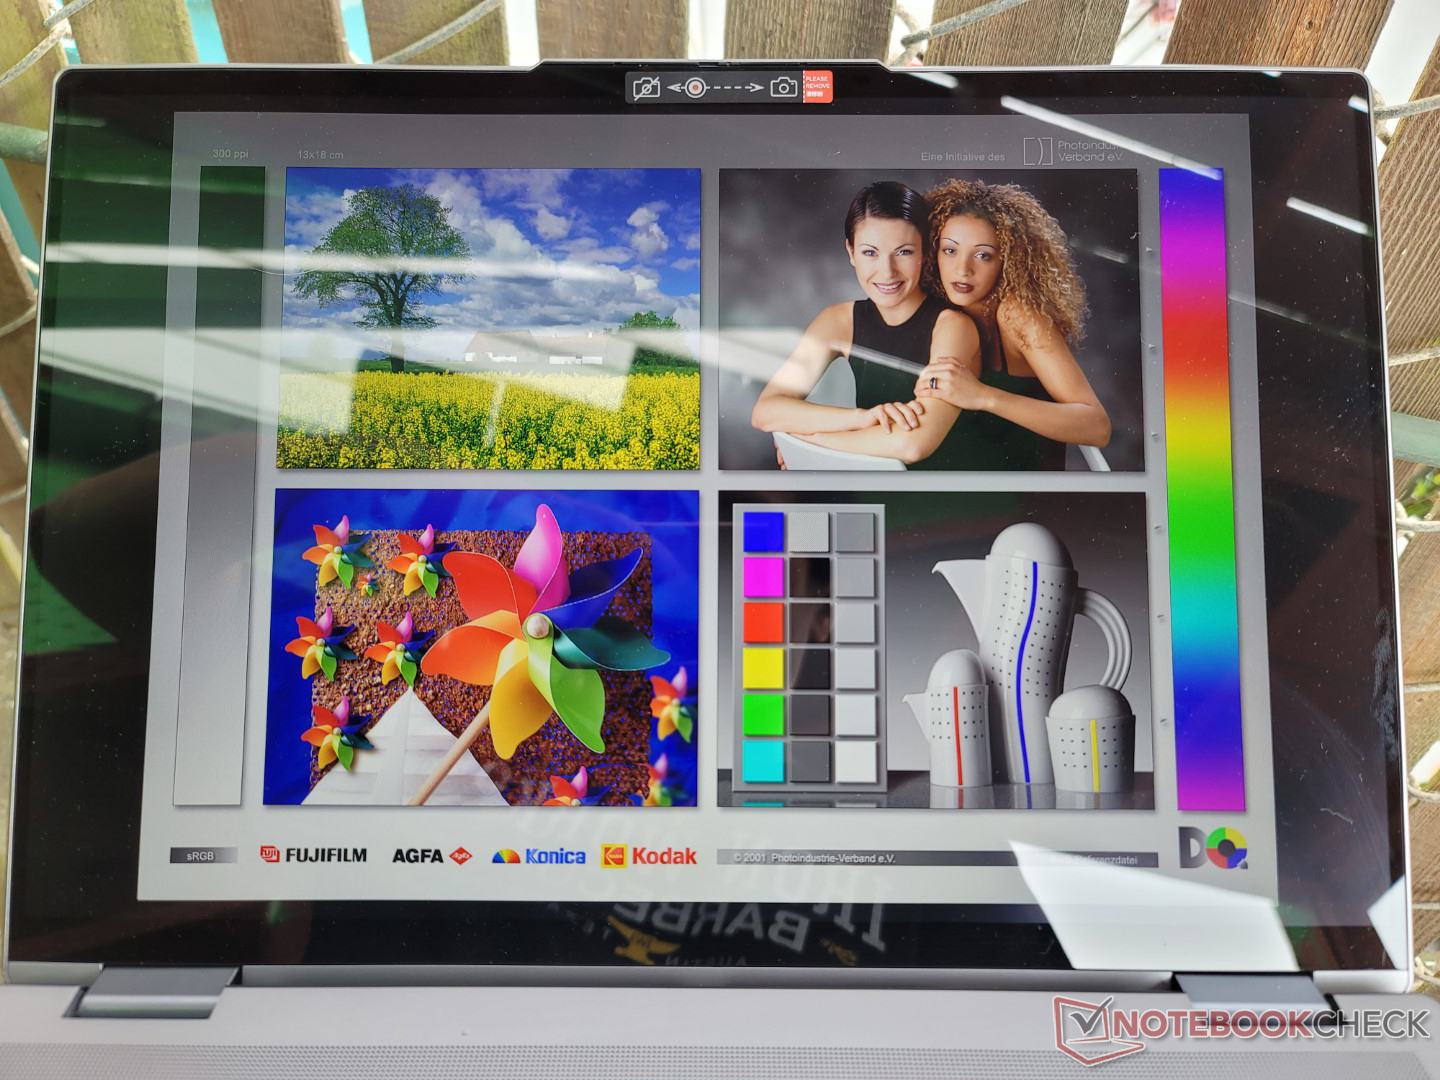
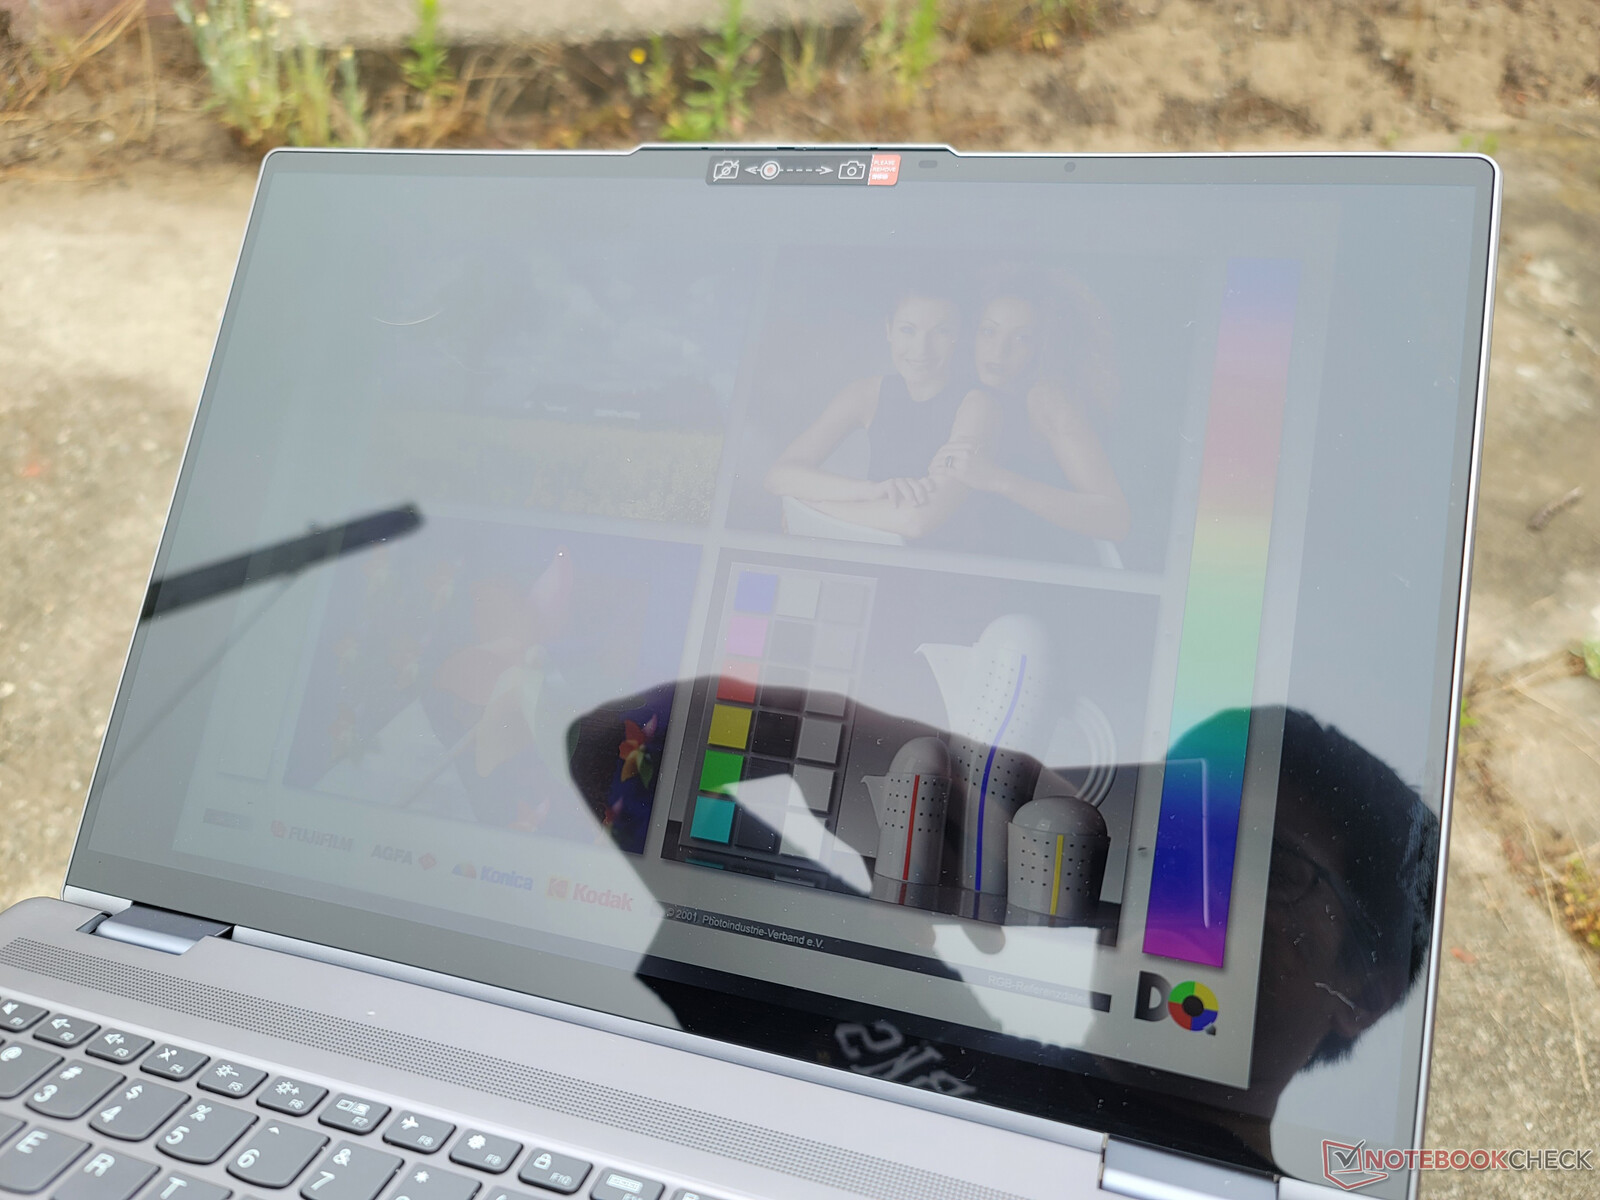
Outdoor visibility is slightly better than on the Inspiron 16 7620 2-in-1 or LG Gram 16 as the Lenovo display is brighter. However, glare is still inevitable and the additional brightness isn't enough to make a huge difference in most cases. You'll still want to work under shade to maximize readability.
Performance — Intel 12th Gen
Testing Conditions
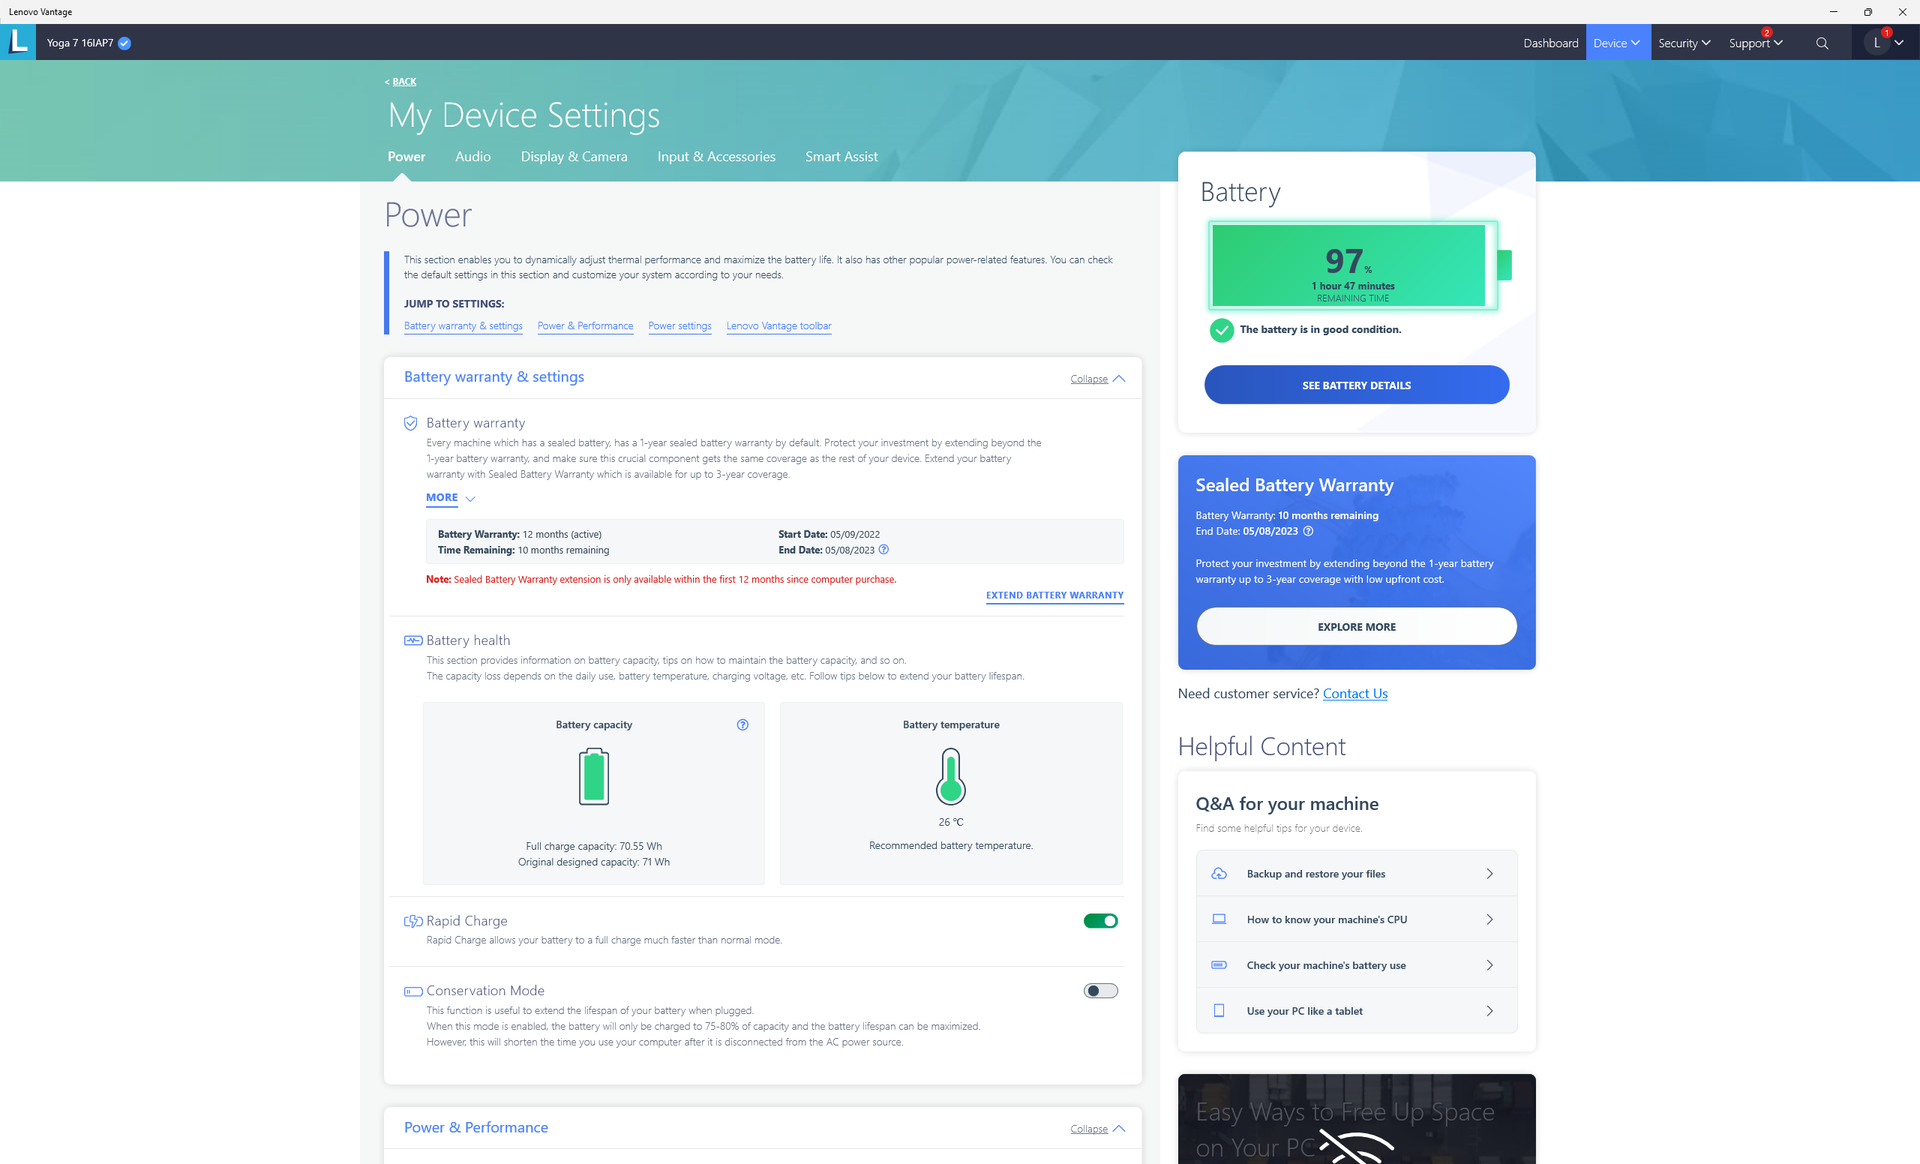
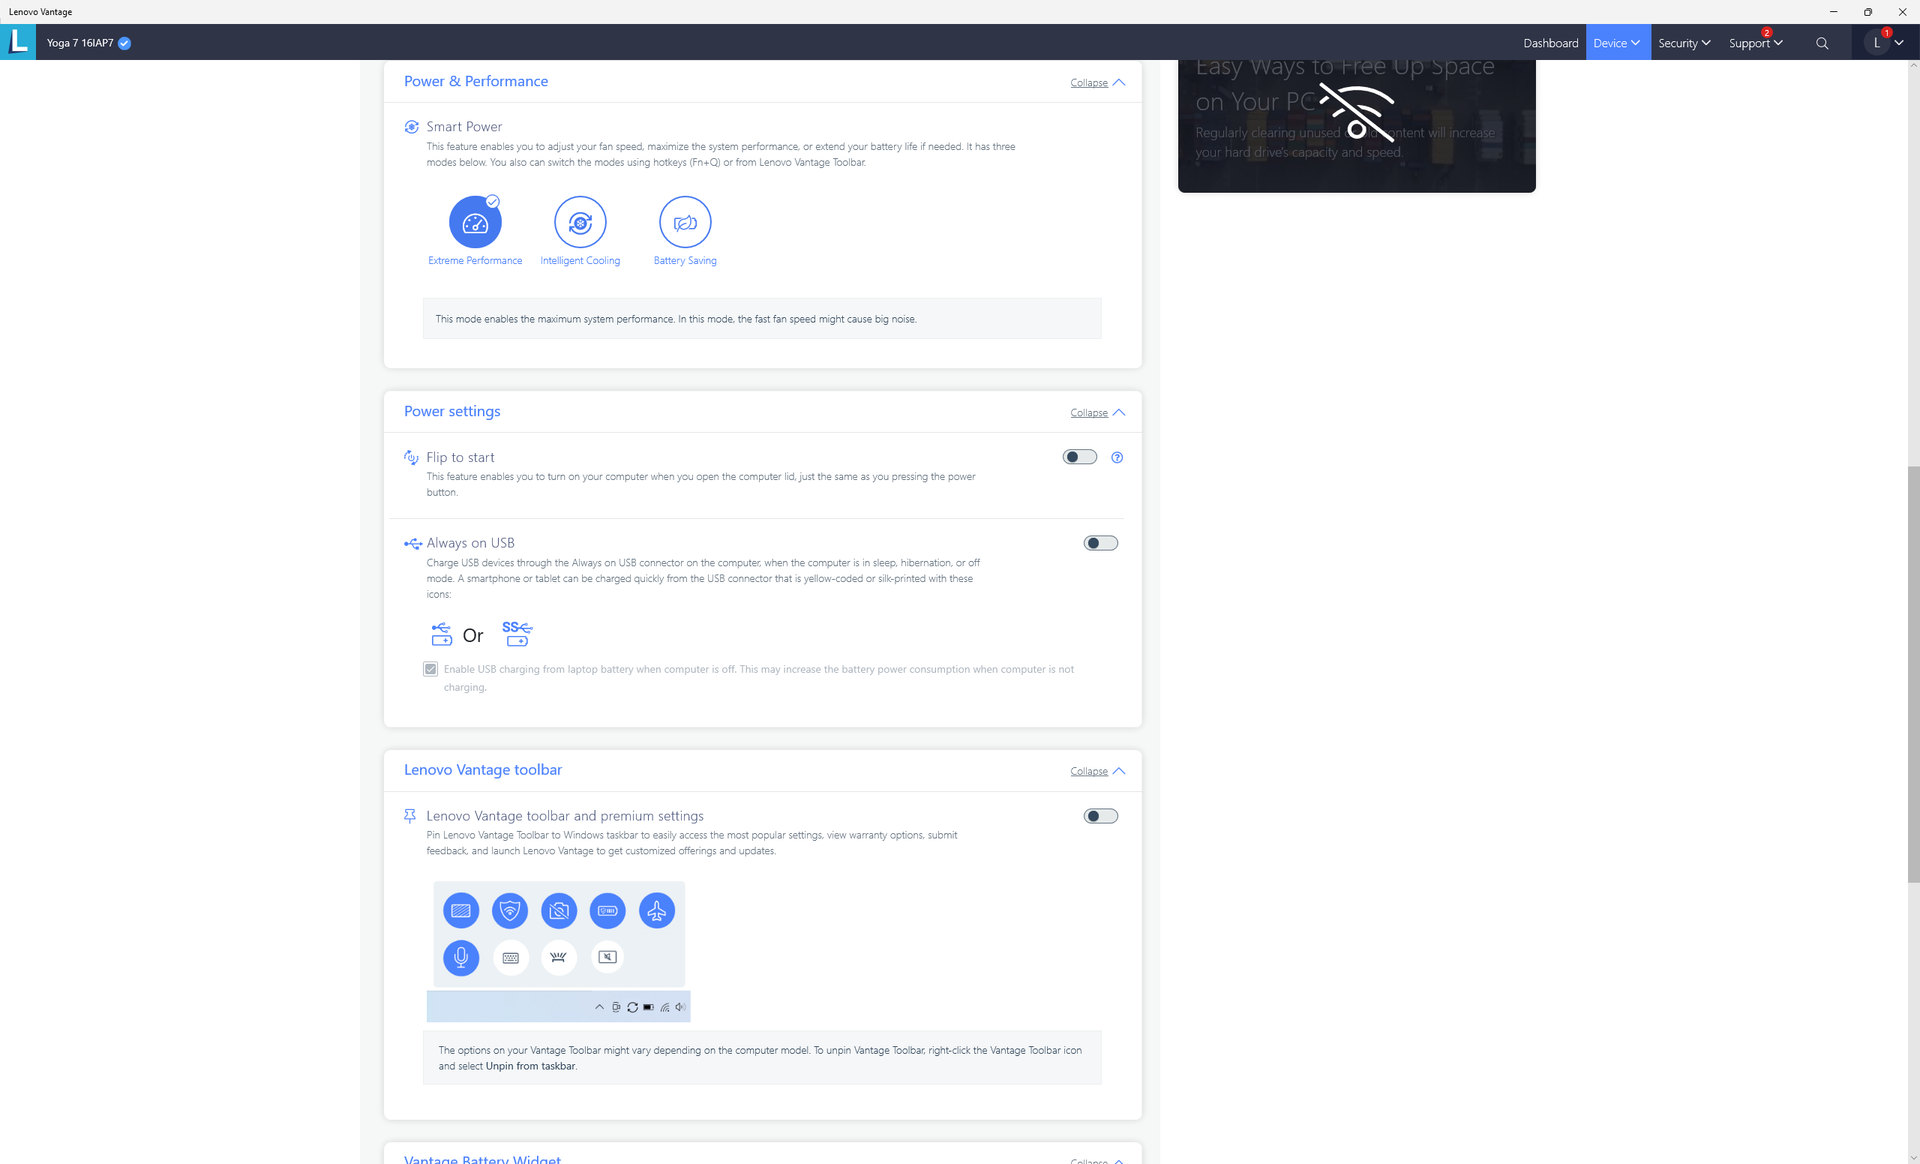
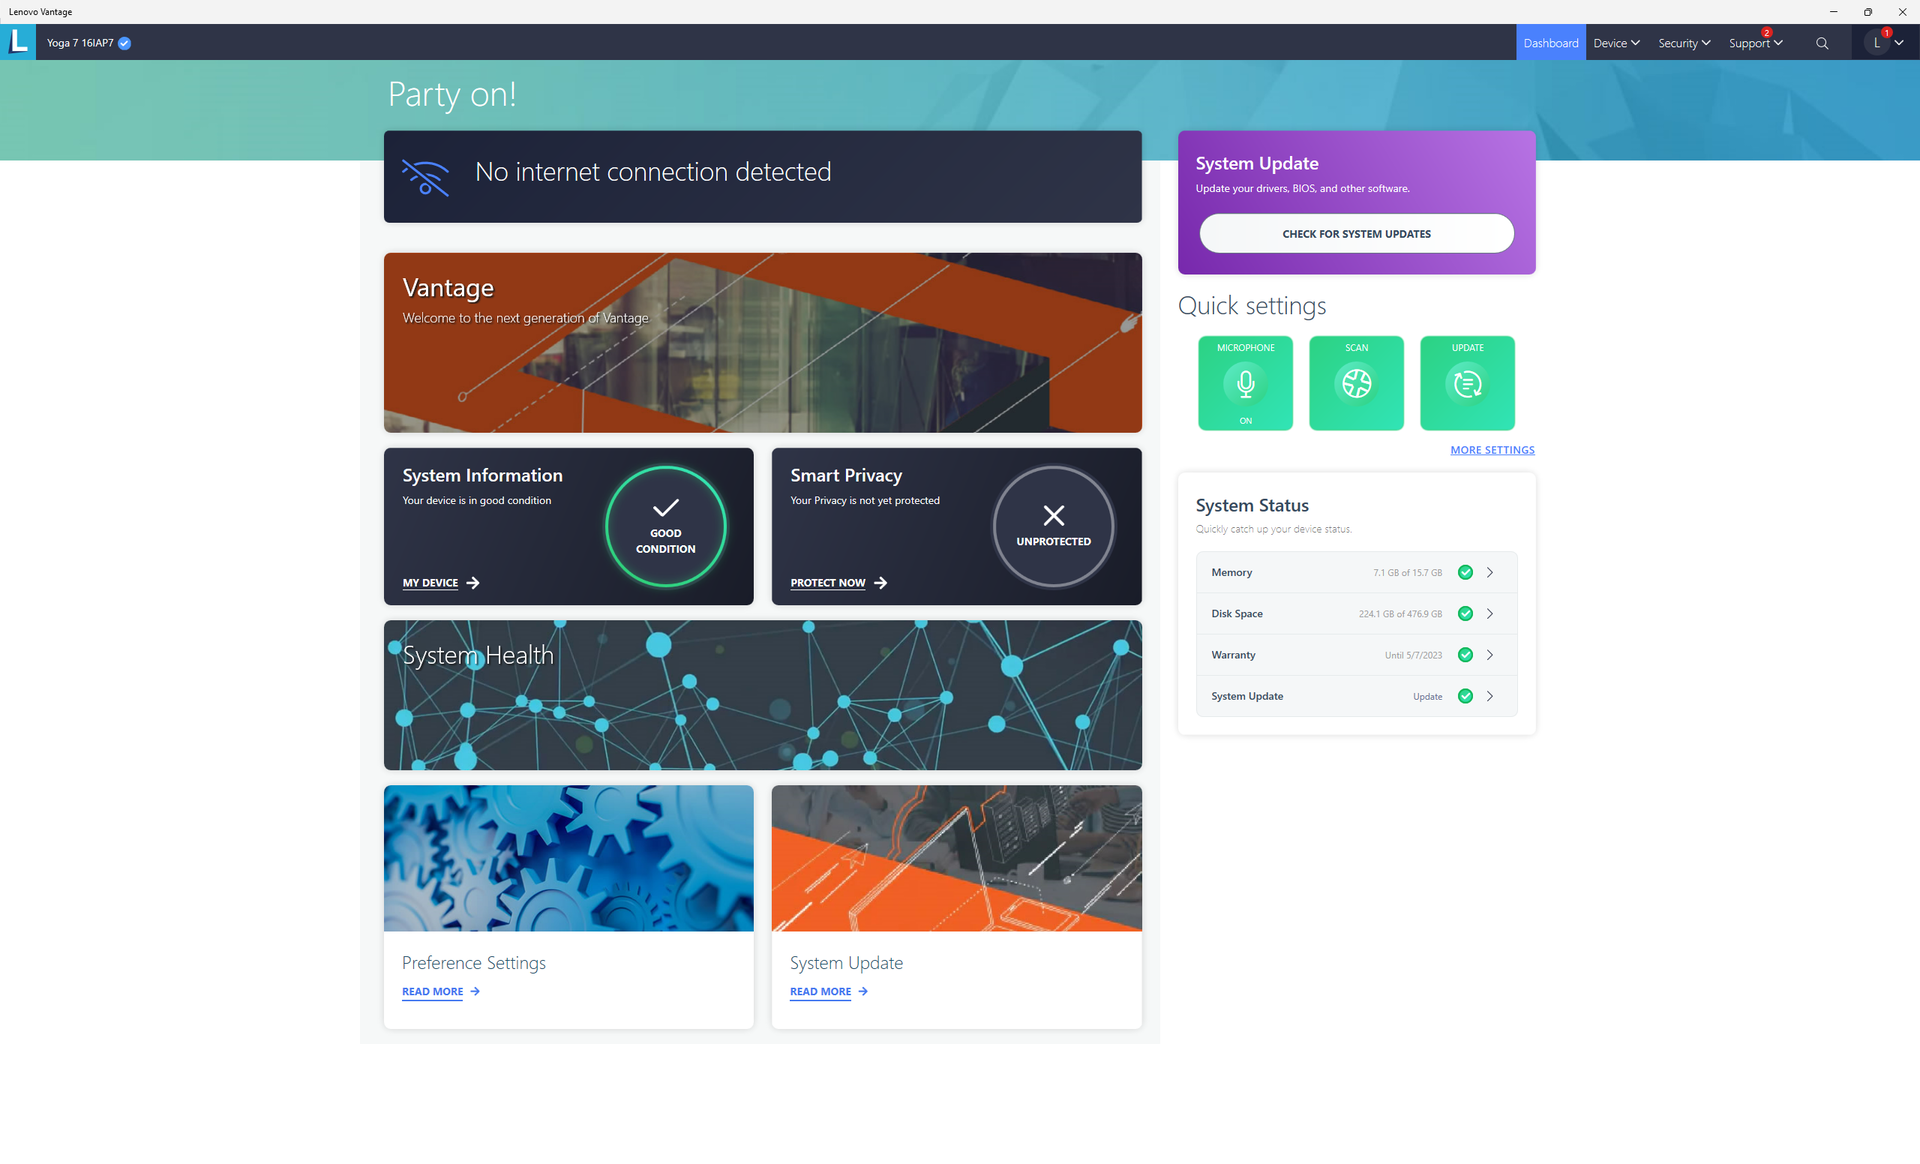
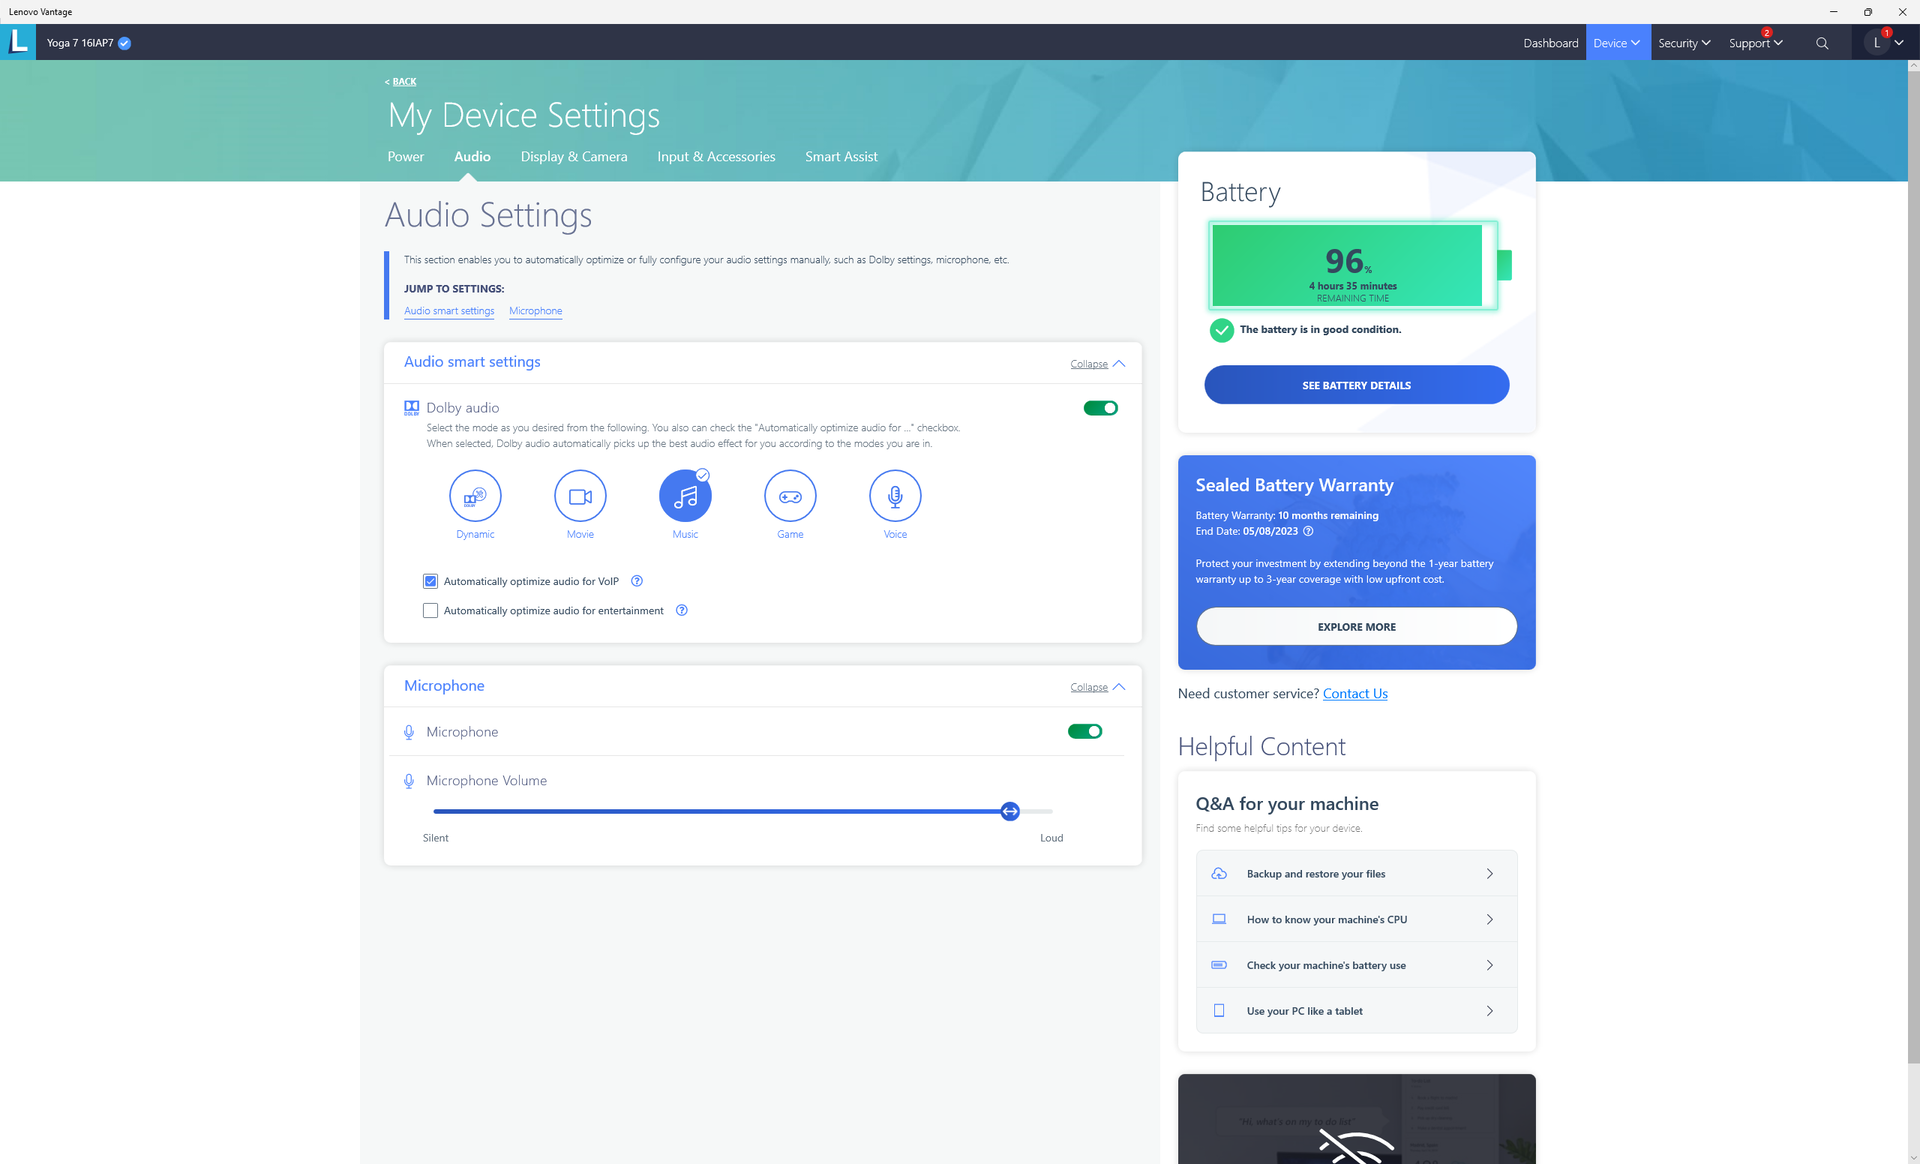
We set our unit to Extreme Performance mode and Performance mode via Lenovo Vantage and Windows, respectively, prior to running any benchmarks below. It's recommended that users become familiar with the pre-installed Lenovo Vantage software as key settings and Lenovo-specific patches can only be found here.
Processor
CPU performance is excellent when only looking at CineBench results. Our Core i7-1260P in the Lenovo can outperform the average laptop in our database equipped with the same processor by 20 to 30 percent accordingly. In reality, however, the Lenovo system is unable to maintain high Turbo Boost clock rates for extended periods and so this advantage shrinks over time as shown by our CineBench R15 xT loop graph below. When compared to the MSI Summit E14 Flip Evo with the same CPU, for example, our Lenovo system would be faster by about 30 percent during the start of the CineBench loop test before ending up slower by about 14 percent. In other words, the Lenovo system excels during short bursts of high loads, but it starts to fall behind when running high loads for extended periods.
The "slower" Core i5-1240P can sometimes perform faster than our Core i7-1260P depending on the models involved. In fact, opting for the Core i7-12700H configuration instead of the Core i7-1260P will only bring a very slight processor performance boost based on our experience with the Huawei MateBook D 16.
Cinebench R15 Multi Loop
Cinebench R23: Multi Core | Single Core
Cinebench R15: CPU Multi 64Bit | CPU Single 64Bit
Blender: v2.79 BMW27 CPU
7-Zip 18.03: 7z b 4 | 7z b 4 -mmt1
Geekbench 5.5: Multi-Core | Single-Core
HWBOT x265 Benchmark v2.2: 4k Preset
LibreOffice : 20 Documents To PDF
R Benchmark 2.5: Overall mean
* ... smaller is better
AIDA64: FP32 Ray-Trace | FPU Julia | CPU SHA3 | CPU Queen | FPU SinJulia | FPU Mandel | CPU AES | CPU ZLib | FP64 Ray-Trace | CPU PhotoWorxx
| Performance rating | |
| Lenovo IdeaPad 5 Pro 16ACH | |
| Huawei MateBook D 16 2022 | |
| Lenovo Yoga 7 16IAP7 | |
| Average Intel Core i7-1260P | |
| Dell Inspiron 16 7620 2-in-1 | |
| Acer Swift X SFX16-51G-5388 | |
| LG Gram 16 (2021) | |
| AIDA64 / FP32 Ray-Trace | |
| Lenovo IdeaPad 5 Pro 16ACH | |
| Huawei MateBook D 16 2022 | |
| Lenovo Yoga 7 16IAP7 | |
| Average Intel Core i7-1260P (2176 - 10898, n=26) | |
| Acer Swift X SFX16-51G-5388 | |
| Dell Inspiron 16 7620 2-in-1 | |
| LG Gram 16 (2021) | |
| AIDA64 / FPU Julia | |
| Lenovo IdeaPad 5 Pro 16ACH | |
| Huawei MateBook D 16 2022 | |
| Lenovo Yoga 7 16IAP7 | |
| Average Intel Core i7-1260P (11015 - 56906, n=26) | |
| Acer Swift X SFX16-51G-5388 | |
| Dell Inspiron 16 7620 2-in-1 | |
| LG Gram 16 (2021) | |
| AIDA64 / CPU SHA3 | |
| Lenovo IdeaPad 5 Pro 16ACH | |
| Huawei MateBook D 16 2022 | |
| Lenovo Yoga 7 16IAP7 | |
| Acer Swift X SFX16-51G-5388 | |
| Average Intel Core i7-1260P (669 - 2709, n=26) | |
| Dell Inspiron 16 7620 2-in-1 | |
| LG Gram 16 (2021) | |
| AIDA64 / CPU Queen | |
| Huawei MateBook D 16 2022 | |
| Lenovo IdeaPad 5 Pro 16ACH | |
| Lenovo Yoga 7 16IAP7 | |
| Dell Inspiron 16 7620 2-in-1 | |
| Average Intel Core i7-1260P (42571 - 82493, n=26) | |
| LG Gram 16 (2021) | |
| Acer Swift X SFX16-51G-5388 | |
| AIDA64 / FPU SinJulia | |
| Lenovo IdeaPad 5 Pro 16ACH | |
| Huawei MateBook D 16 2022 | |
| Dell Inspiron 16 7620 2-in-1 | |
| Average Intel Core i7-1260P (2901 - 6975, n=26) | |
| Lenovo Yoga 7 16IAP7 | |
| Acer Swift X SFX16-51G-5388 | |
| LG Gram 16 (2021) | |
| AIDA64 / FPU Mandel | |
| Lenovo IdeaPad 5 Pro 16ACH | |
| Huawei MateBook D 16 2022 | |
| Lenovo Yoga 7 16IAP7 | |
| Acer Swift X SFX16-51G-5388 | |
| Average Intel Core i7-1260P (5950 - 26376, n=26) | |
| Dell Inspiron 16 7620 2-in-1 | |
| LG Gram 16 (2021) | |
| AIDA64 / CPU AES | |
| Lenovo IdeaPad 5 Pro 16ACH | |
| Huawei MateBook D 16 2022 | |
| Acer Swift X SFX16-51G-5388 | |
| LG Gram 16 (2021) | |
| Average Intel Core i7-1260P (16041 - 92356, n=26) | |
| Lenovo Yoga 7 16IAP7 | |
| Dell Inspiron 16 7620 2-in-1 | |
| AIDA64 / CPU ZLib | |
| Lenovo IdeaPad 5 Pro 16ACH | |
| Huawei MateBook D 16 2022 | |
| Dell Inspiron 16 7620 2-in-1 | |
| Lenovo Yoga 7 16IAP7 | |
| Average Intel Core i7-1260P (259 - 771, n=26) | |
| Acer Swift X SFX16-51G-5388 | |
| LG Gram 16 (2021) | |
| AIDA64 / FP64 Ray-Trace | |
| Lenovo IdeaPad 5 Pro 16ACH | |
| Huawei MateBook D 16 2022 | |
| Lenovo Yoga 7 16IAP7 | |
| Average Intel Core i7-1260P (1237 - 5858, n=26) | |
| Acer Swift X SFX16-51G-5388 | |
| Dell Inspiron 16 7620 2-in-1 | |
| LG Gram 16 (2021) | |
| AIDA64 / CPU PhotoWorxx | |
| LG Gram 16 (2021) | |
| Lenovo Yoga 7 16IAP7 | |
| Huawei MateBook D 16 2022 | |
| Acer Swift X SFX16-51G-5388 | |
| Average Intel Core i7-1260P (13261 - 43652, n=26) | |
| Dell Inspiron 16 7620 2-in-1 | |
| Lenovo IdeaPad 5 Pro 16ACH | |
System Performance
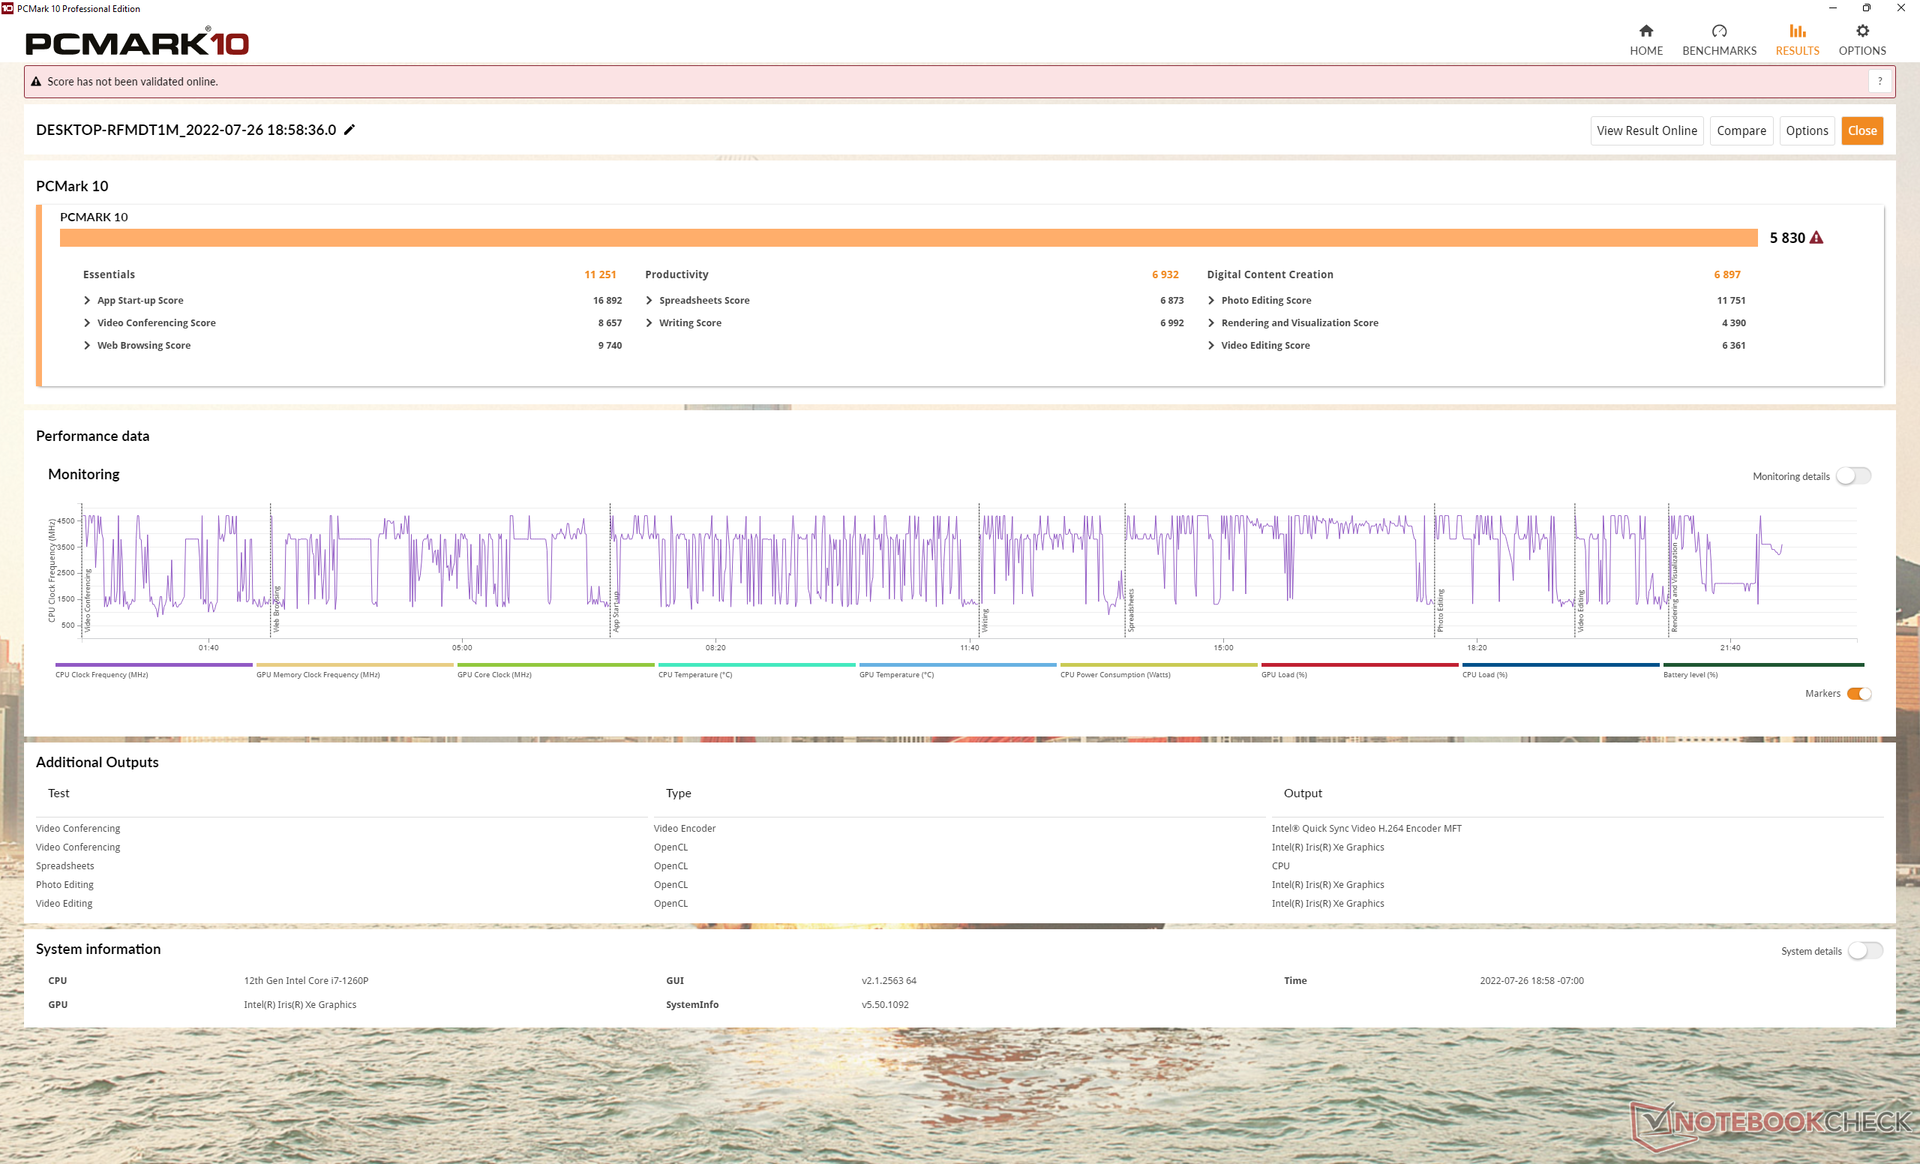
PCMark 10 results are excellent and close to what we recorded on the Core H-powered Huawei MateBook D 16 or Ryzen H-powered Lenovo IdeaPad 5 Pro 16. Scores are noticeably higher than the Dell Inspiron 16 7620 even though they both carry the same Core i7-1260P CPU likely because the Dell model ships with a slower M.2 SSD.
CrossMark: Overall | Productivity | Creativity | Responsiveness
| PCMark 10 / Score | |
| Huawei MateBook D 16 2022 | |
| Lenovo IdeaPad 5 Pro 16ACH | |
| Lenovo Yoga 7 16IAP7 | |
| Acer Swift X SFX16-51G-5388 | |
| Average Intel Core i7-1260P, Intel Iris Xe Graphics G7 96EUs (4796 - 6068, n=17) | |
| Dell Inspiron 16 7620 2-in-1 | |
| LG Gram 16 (2021) | |
| PCMark 10 / Essentials | |
| Huawei MateBook D 16 2022 | |
| Lenovo Yoga 7 16IAP7 | |
| Average Intel Core i7-1260P, Intel Iris Xe Graphics G7 96EUs (9260 - 11251, n=17) | |
| LG Gram 16 (2021) | |
| Lenovo IdeaPad 5 Pro 16ACH | |
| Dell Inspiron 16 7620 2-in-1 | |
| Acer Swift X SFX16-51G-5388 | |
| PCMark 10 / Productivity | |
| Acer Swift X SFX16-51G-5388 | |
| Lenovo IdeaPad 5 Pro 16ACH | |
| Huawei MateBook D 16 2022 | |
| Average Intel Core i7-1260P, Intel Iris Xe Graphics G7 96EUs (6167 - 8629, n=17) | |
| Lenovo Yoga 7 16IAP7 | |
| LG Gram 16 (2021) | |
| Dell Inspiron 16 7620 2-in-1 | |
| PCMark 10 / Digital Content Creation | |
| Lenovo Yoga 7 16IAP7 | |
| Huawei MateBook D 16 2022 | |
| Lenovo IdeaPad 5 Pro 16ACH | |
| Acer Swift X SFX16-51G-5388 | |
| Average Intel Core i7-1260P, Intel Iris Xe Graphics G7 96EUs (5231 - 6908, n=17) | |
| Dell Inspiron 16 7620 2-in-1 | |
| LG Gram 16 (2021) | |
| CrossMark / Overall | |
| Huawei MateBook D 16 2022 | |
| Lenovo Yoga 7 16IAP7 | |
| Average Intel Core i7-1260P, Intel Iris Xe Graphics G7 96EUs (1484 - 1811, n=16) | |
| Dell Inspiron 16 7620 2-in-1 | |
| Acer Swift X SFX16-51G-5388 | |
| CrossMark / Productivity | |
| Huawei MateBook D 16 2022 | |
| Lenovo Yoga 7 16IAP7 | |
| Average Intel Core i7-1260P, Intel Iris Xe Graphics G7 96EUs (1486 - 1755, n=16) | |
| Dell Inspiron 16 7620 2-in-1 | |
| Acer Swift X SFX16-51G-5388 | |
| CrossMark / Creativity | |
| Huawei MateBook D 16 2022 | |
| Lenovo Yoga 7 16IAP7 | |
| Average Intel Core i7-1260P, Intel Iris Xe Graphics G7 96EUs (1451 - 1872, n=16) | |
| Dell Inspiron 16 7620 2-in-1 | |
| Acer Swift X SFX16-51G-5388 | |
| CrossMark / Responsiveness | |
| Huawei MateBook D 16 2022 | |
| Average Intel Core i7-1260P, Intel Iris Xe Graphics G7 96EUs (1253 - 1807, n=16) | |
| Lenovo Yoga 7 16IAP7 | |
| Dell Inspiron 16 7620 2-in-1 | |
| Acer Swift X SFX16-51G-5388 | |
| PCMark 10 Score | 5830 points | |
Help | ||
| AIDA64 / Memory Copy | |
| Lenovo Yoga 7 16IAP7 | |
| LG Gram 16 (2021) | |
| Huawei MateBook D 16 2022 | |
| Acer Swift X SFX16-51G-5388 | |
| Average Intel Core i7-1260P (25125 - 71544, n=25) | |
| Lenovo IdeaPad 5 Pro 16ACH | |
| Dell Inspiron 16 7620 2-in-1 | |
| AIDA64 / Memory Read | |
| Lenovo Yoga 7 16IAP7 | |
| LG Gram 16 (2021) | |
| Huawei MateBook D 16 2022 | |
| Average Intel Core i7-1260P (24983 - 72065, n=25) | |
| Acer Swift X SFX16-51G-5388 | |
| Lenovo IdeaPad 5 Pro 16ACH | |
| Dell Inspiron 16 7620 2-in-1 | |
| AIDA64 / Memory Write | |
| LG Gram 16 (2021) | |
| Acer Swift X SFX16-51G-5388 | |
| Lenovo Yoga 7 16IAP7 | |
| Huawei MateBook D 16 2022 | |
| Average Intel Core i7-1260P (23512 - 66799, n=25) | |
| Dell Inspiron 16 7620 2-in-1 | |
| Lenovo IdeaPad 5 Pro 16ACH | |
| AIDA64 / Memory Latency | |
| Acer Swift X SFX16-51G-5388 | |
| Huawei MateBook D 16 2022 | |
| Lenovo Yoga 7 16IAP7 | |
| LG Gram 16 (2021) | |
| Lenovo IdeaPad 5 Pro 16ACH | |
| Average Intel Core i7-1260P (77.9 - 118.4, n=21) | |
* ... smaller is better
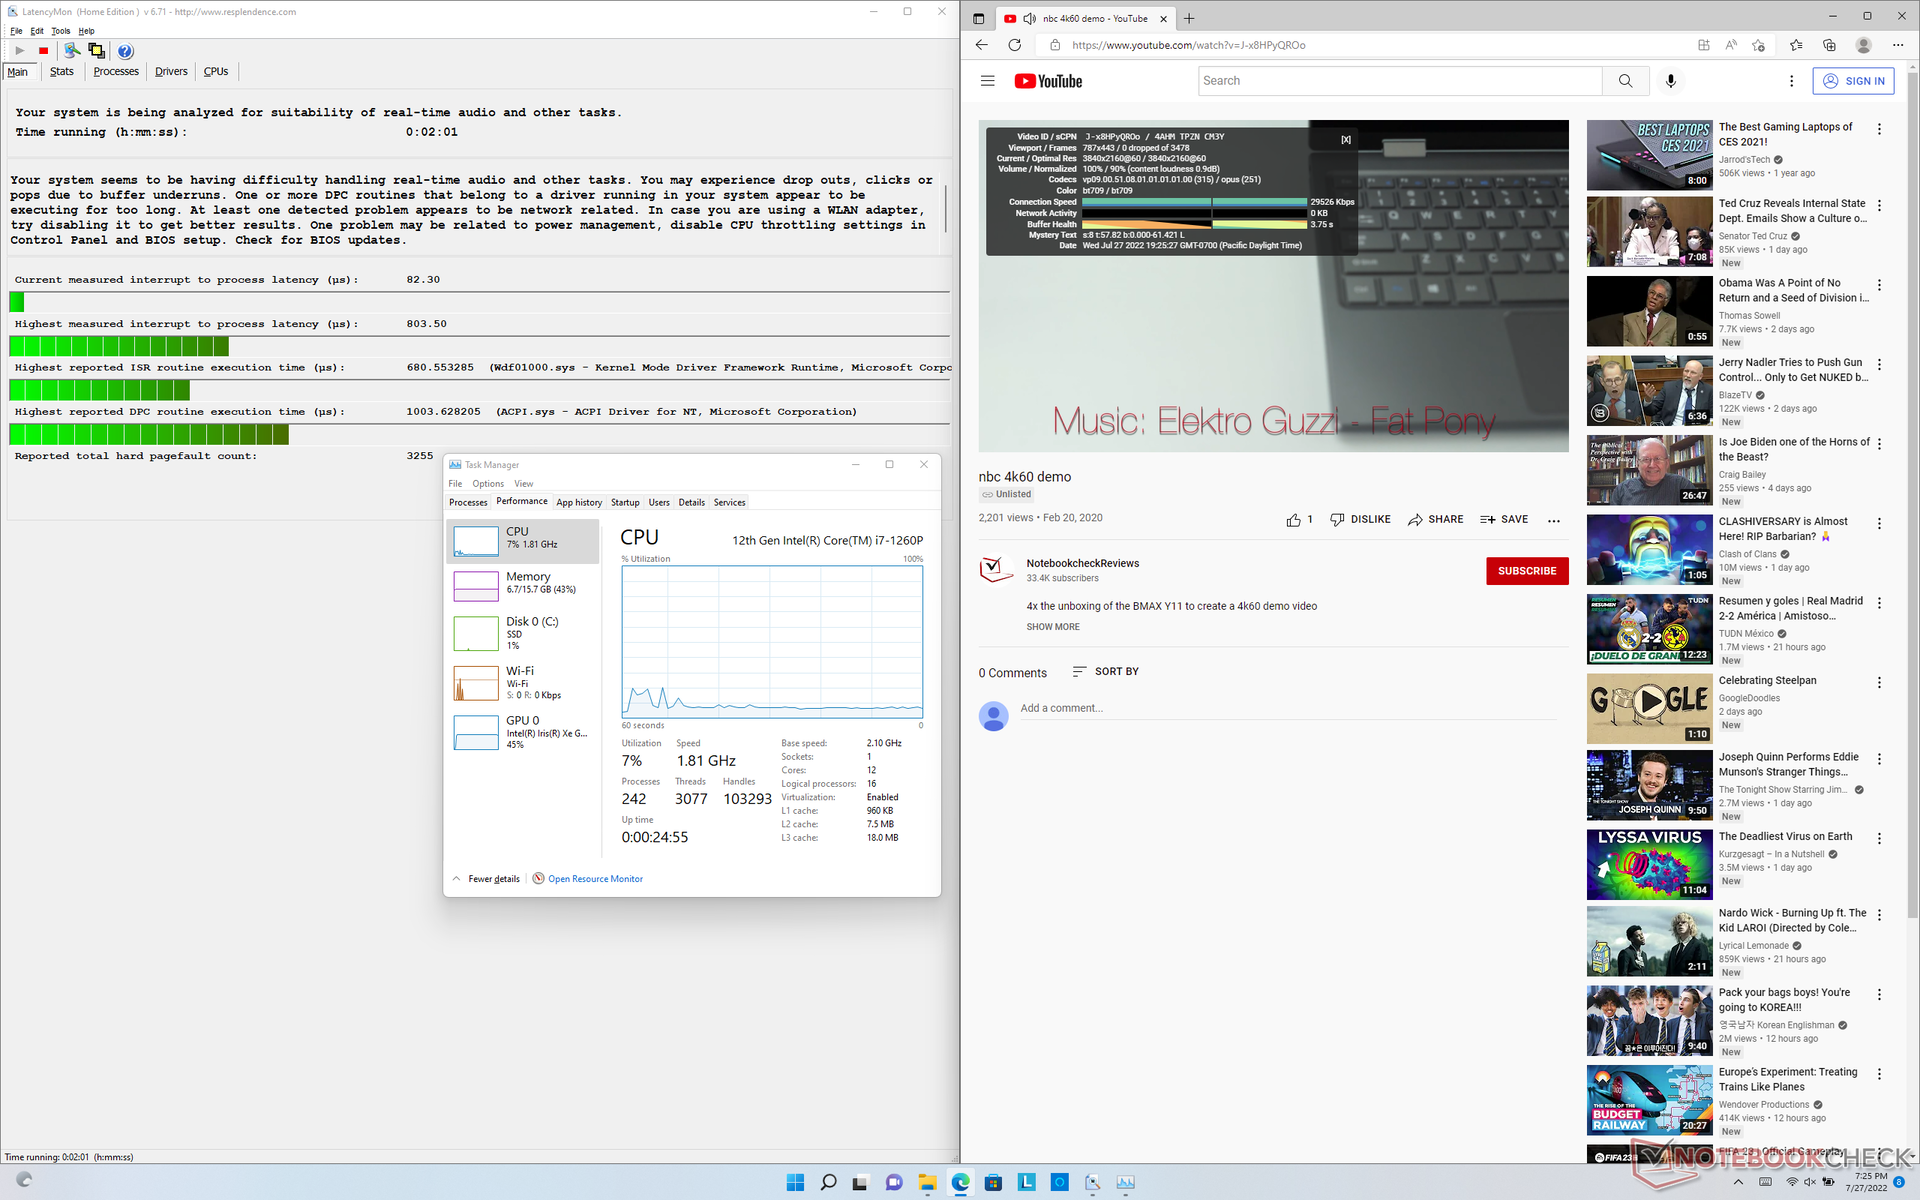
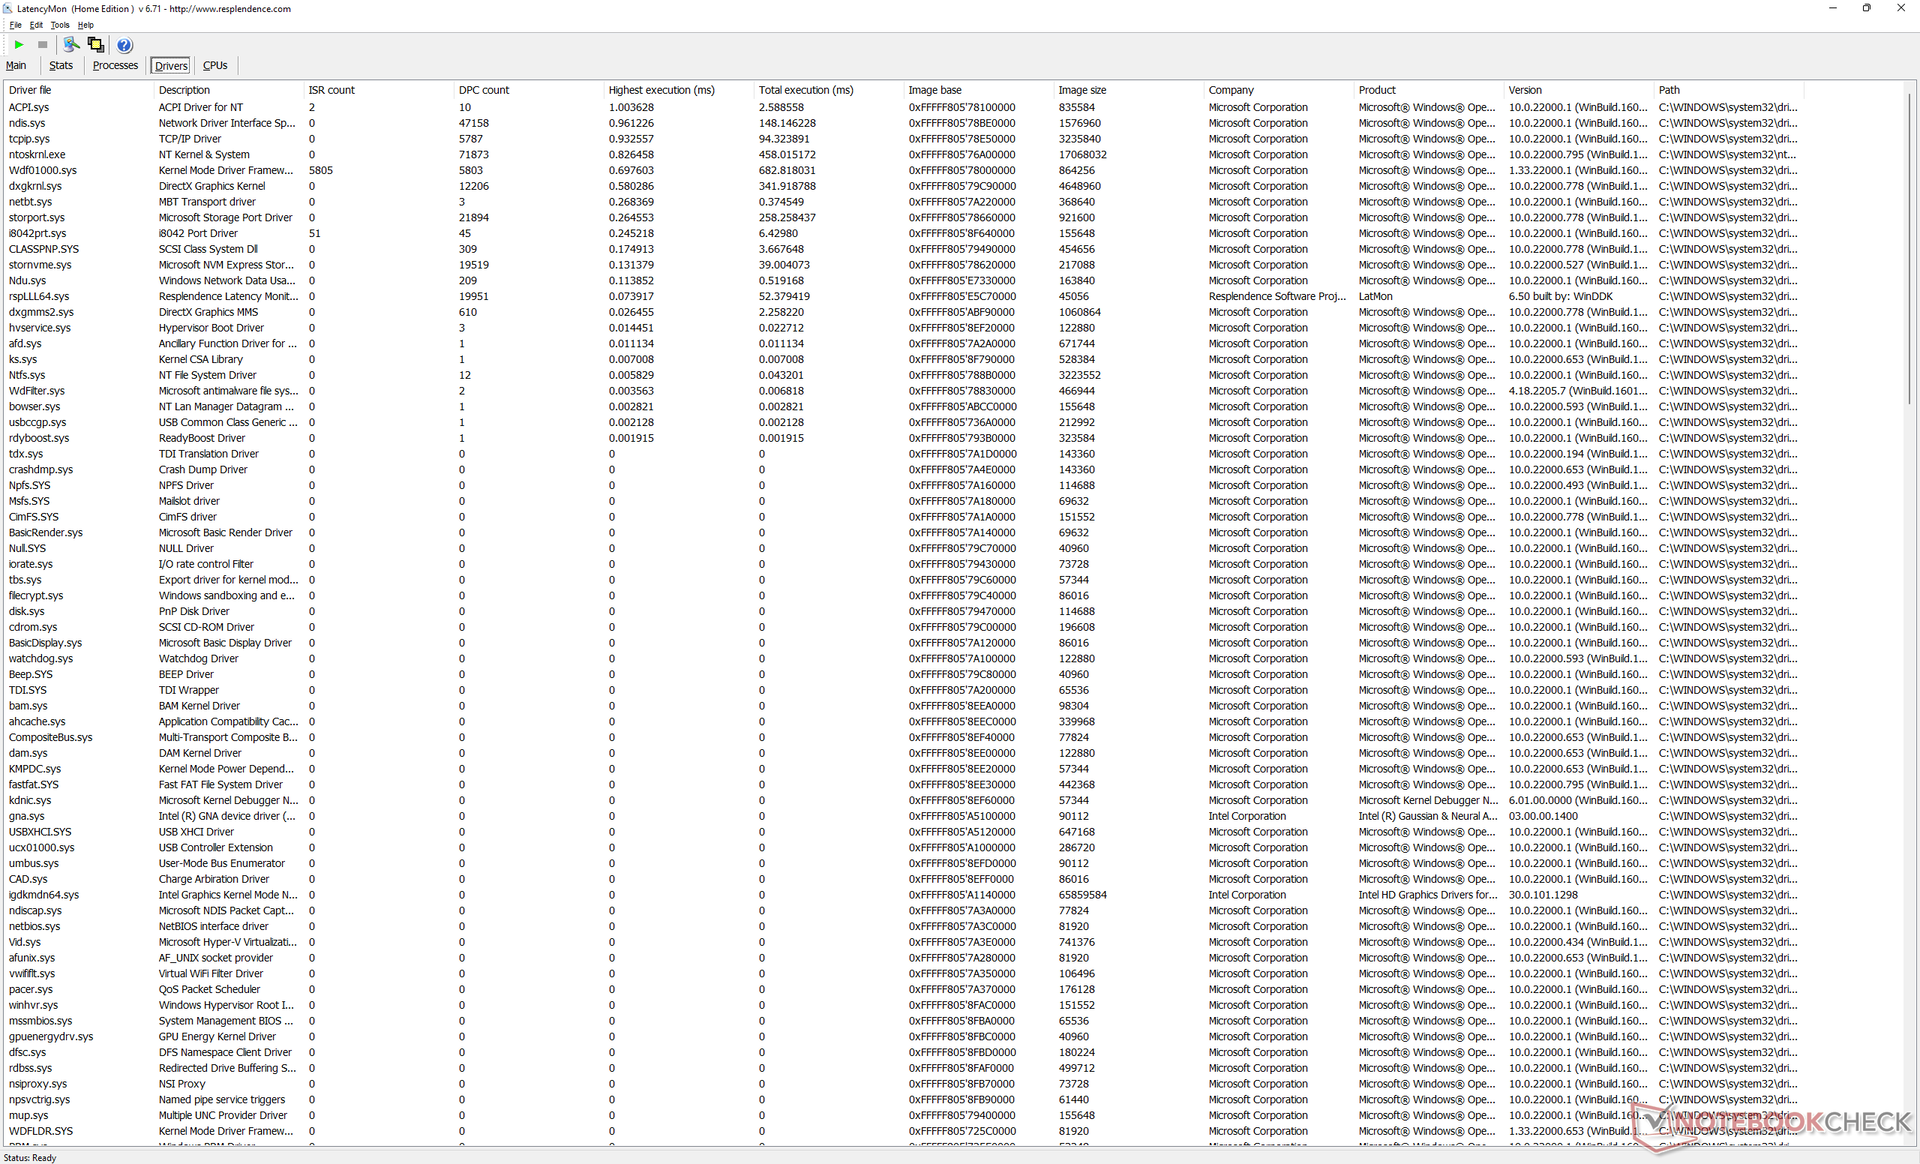
DPC Latency
LatencyMon reveals minor DPC issues when opening multiple browser tabs on our homepage. 4K video playback at 60 FPS is otherwise excellent and with no dropped frames.
| DPC Latencies / LatencyMon - interrupt to process latency (max), Web, Youtube, Prime95 | |
| Huawei MateBook D 16 2022 | |
| Lenovo Yoga 7 16IAP7 | |
| Dell Inspiron 16 7620 2-in-1 | |
| Lenovo IdeaPad 5 Pro 16ACH | |
| LG Gram 16 (2021) | |
* ... smaller is better
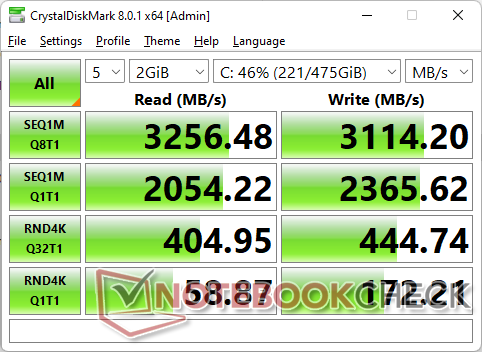
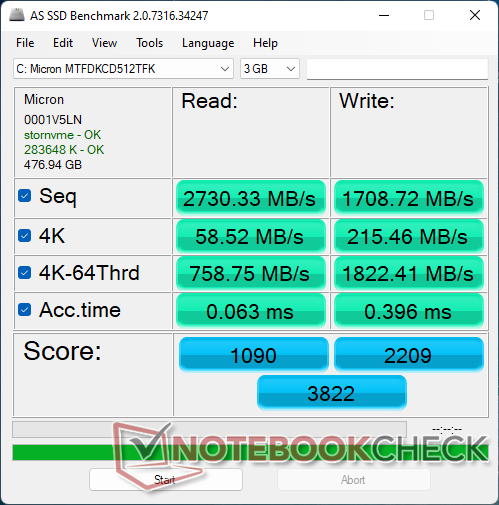
Storage Devices — One Internal Drive Only
Our unit ships with a 512 GB Micron MTFDKCD512TFK PCIe3 x4 NVMe SSD for sequential read and write rates of up to 3200 MB/s and 3100 MB/s, respectively, which are similar to what most high-end PCIe3 drives have to offer. However, 4k q32 t16 read and write rates are much slower than expected when compared to the Samsung PM981a.
The drive in our unit would exhibit no performance throttling issues when running DiskSpd in a loop.

| Drive Performance rating - Percent | |
| LG Gram 16 (2021) | |
| Huawei MateBook D 16 2022 | |
| Lenovo Yoga 7 16IAP7 | |
| Lenovo IdeaPad 5 Pro 16ACH | |
| Acer Swift X SFX16-51G-5388 | |
| Dell Inspiron 16 7620 2-in-1 | |
* ... smaller is better
Disk Throttling: DiskSpd Read Loop, Queue Depth 8
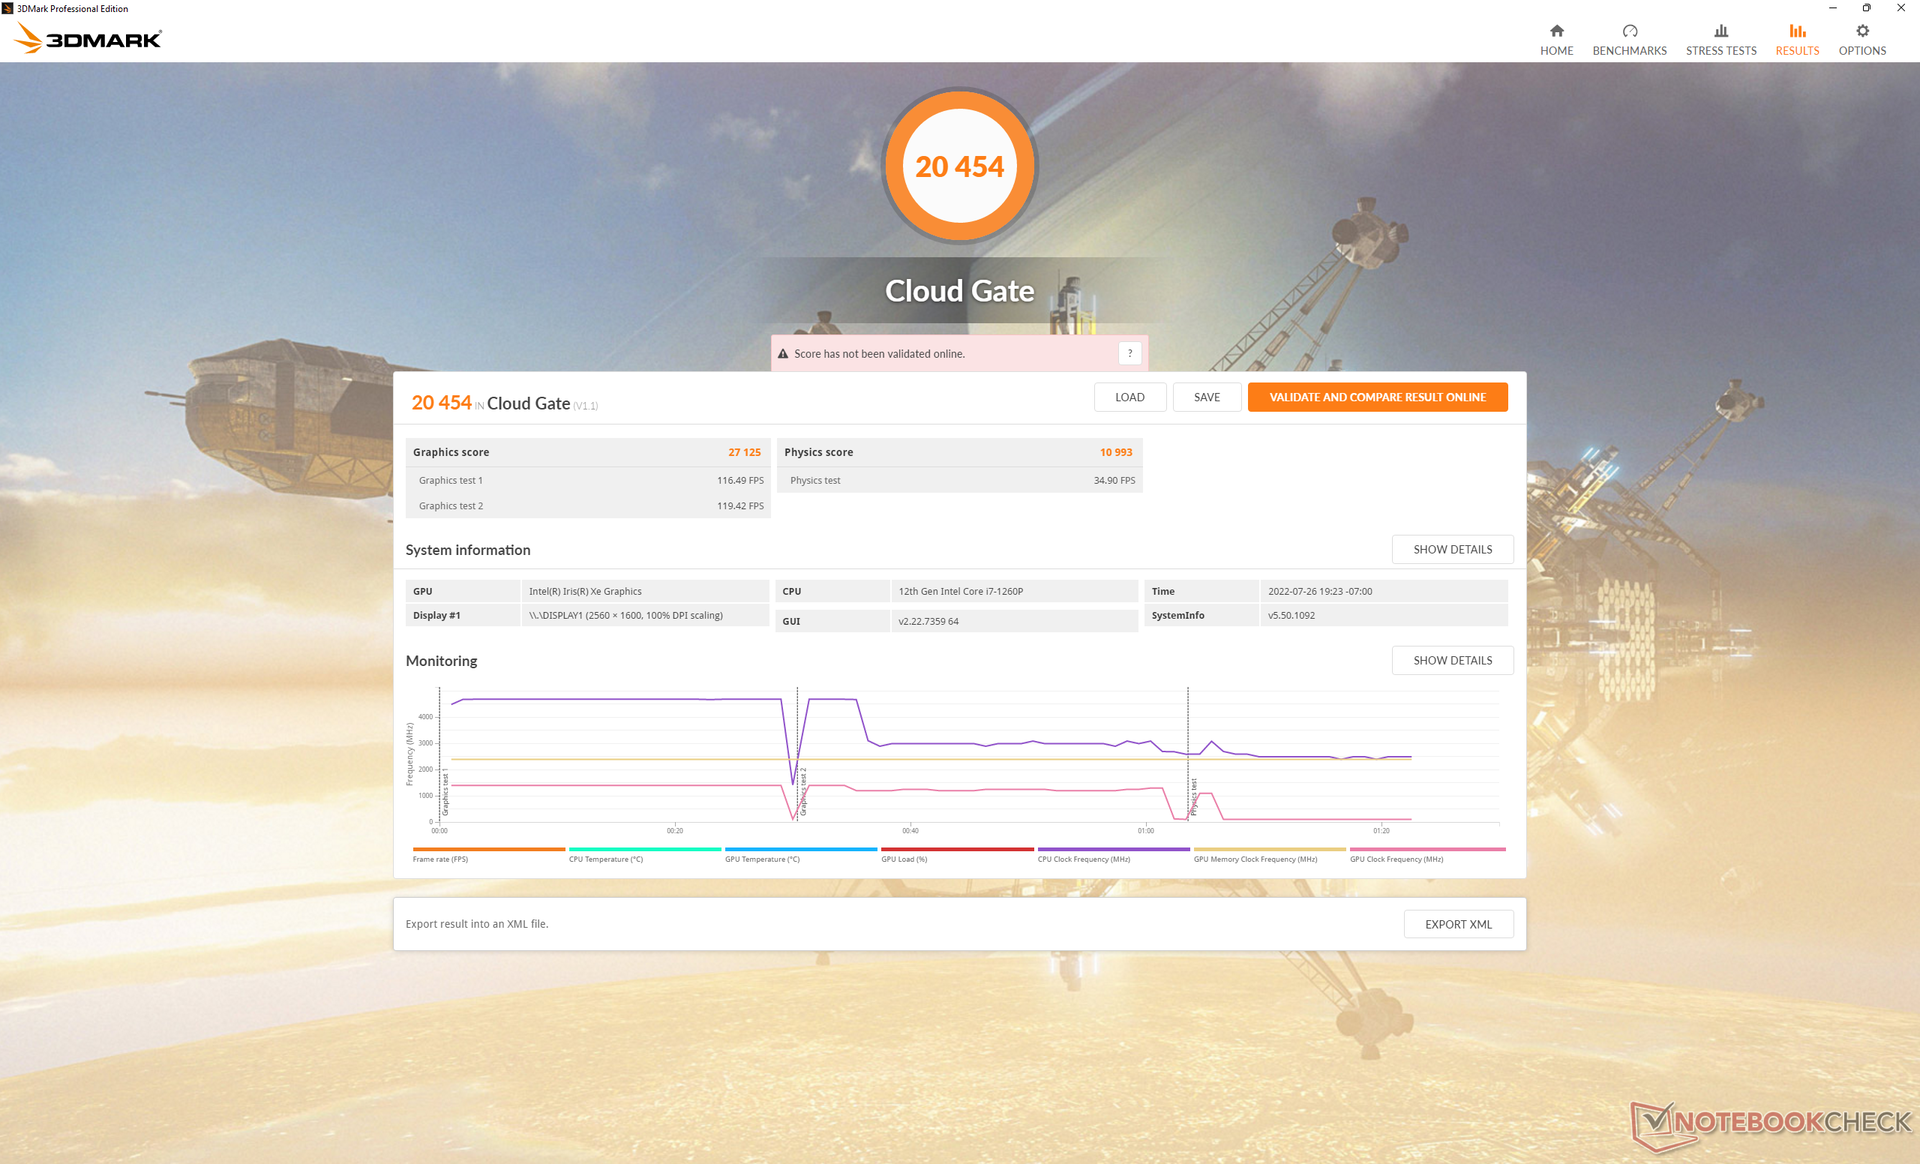
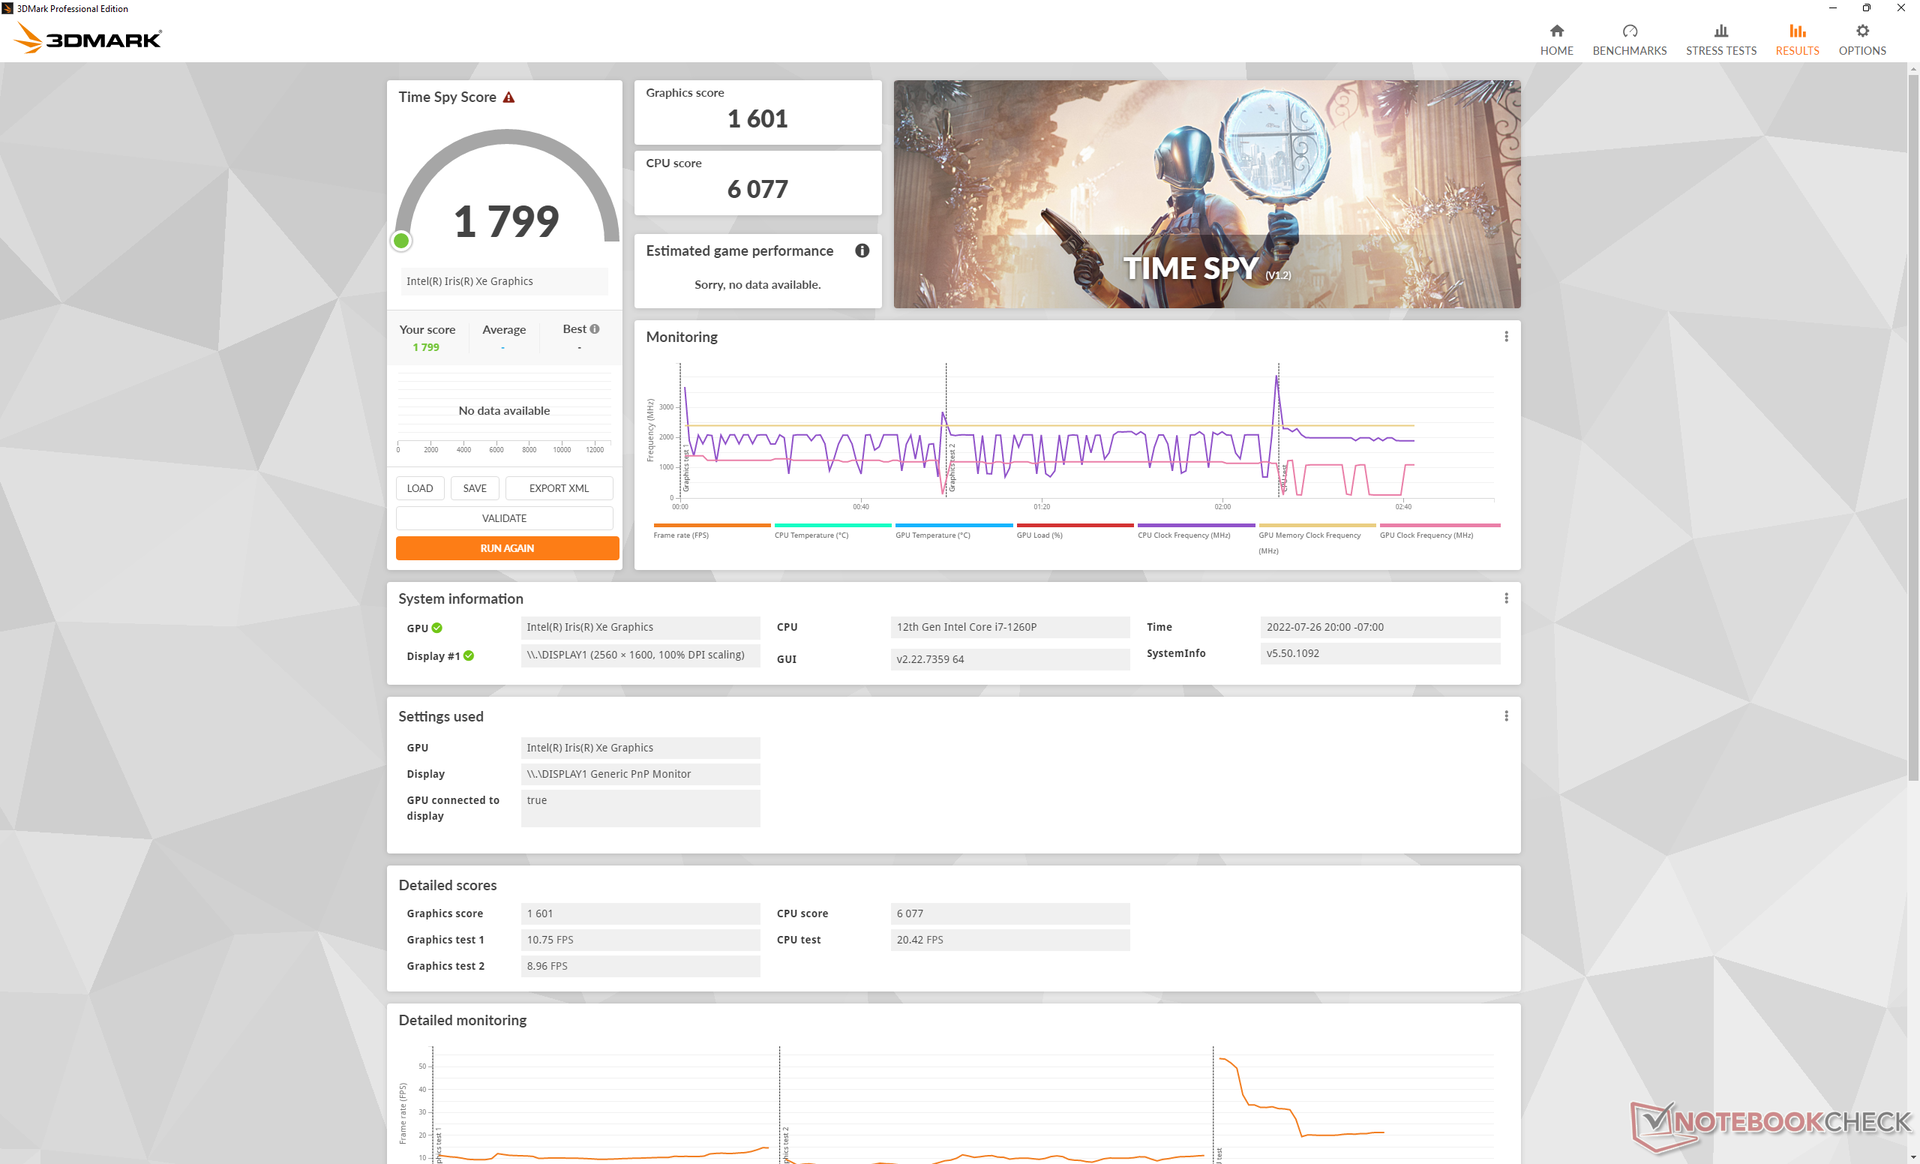
GPU Performance
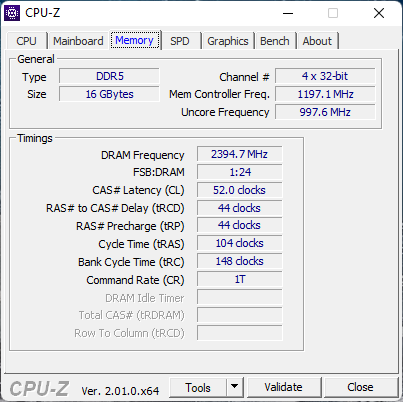
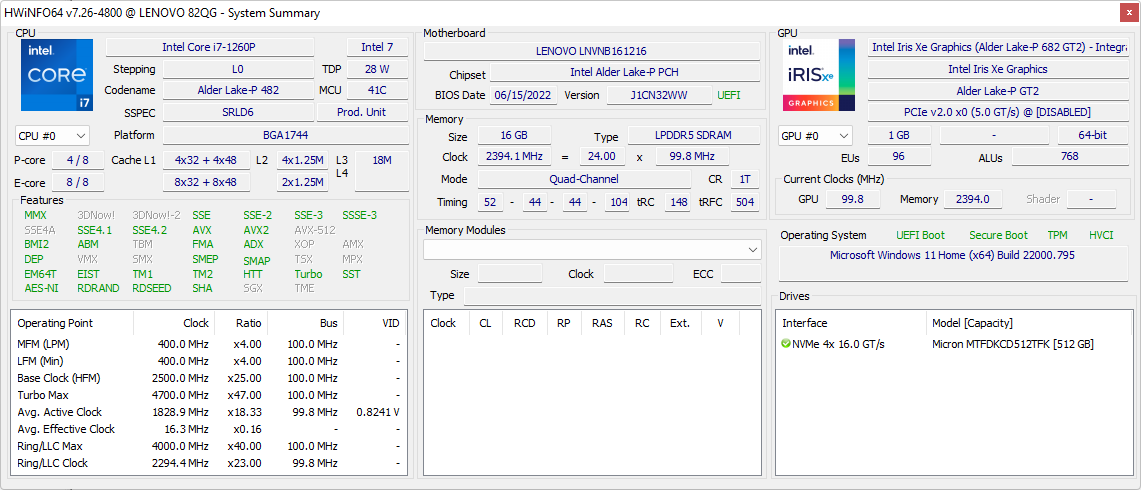
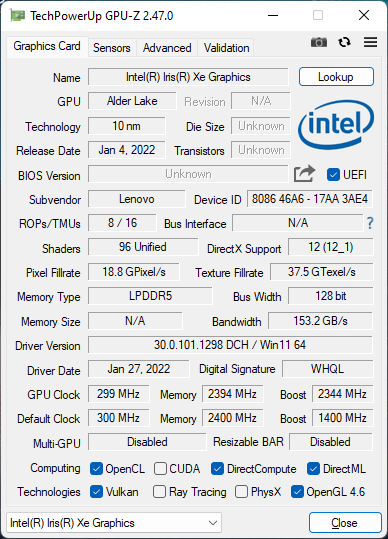
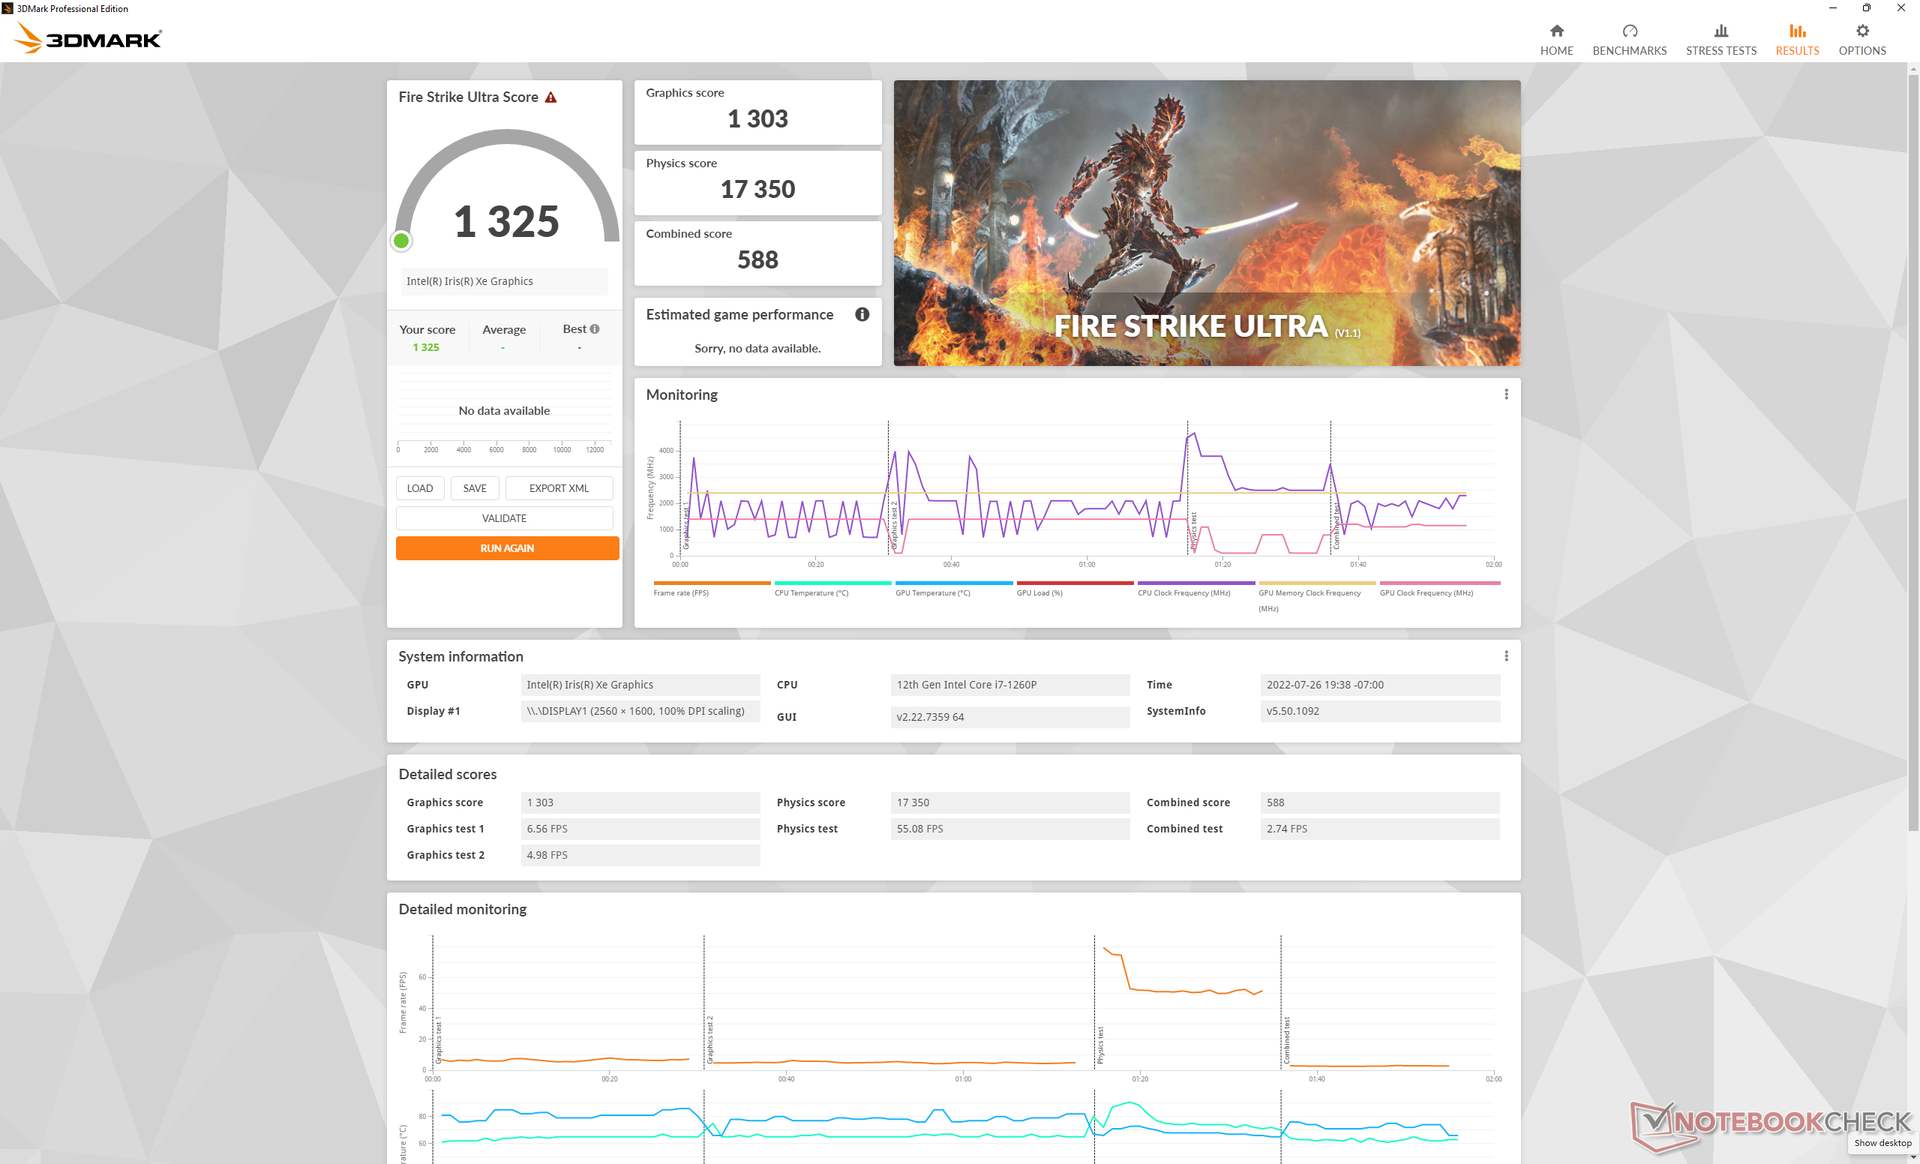
Raw graphics performance is slightly faster than the average laptop in our database equipped with the same integrated Iris Xe 96 EUs. The uptick is likely due in part to the faster LPDDR5-4800 RAM whereas most laptops are still on DDR4-3200. The year-over-year benefits are otherwise only marginal since the core graphics architecture has not changed despite all the CPU differences between 11th gen Tiger Lake and 12th gen Alder Lake.
Upgrading to an Intel Arc A370M configuration will net users 60 to 150 percent faster GPU performance than our Iris Xe 96 EUs based on our time with the Asus ZenBook Flip 15 Q539ZD.

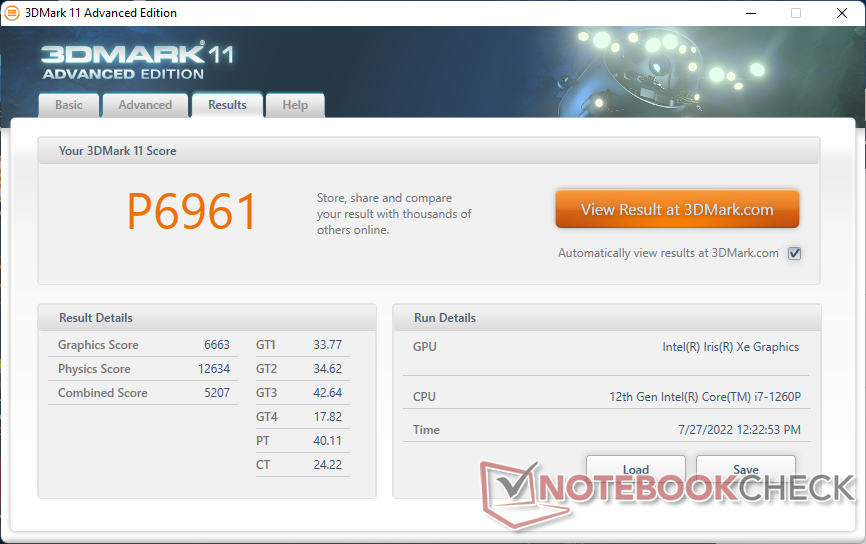
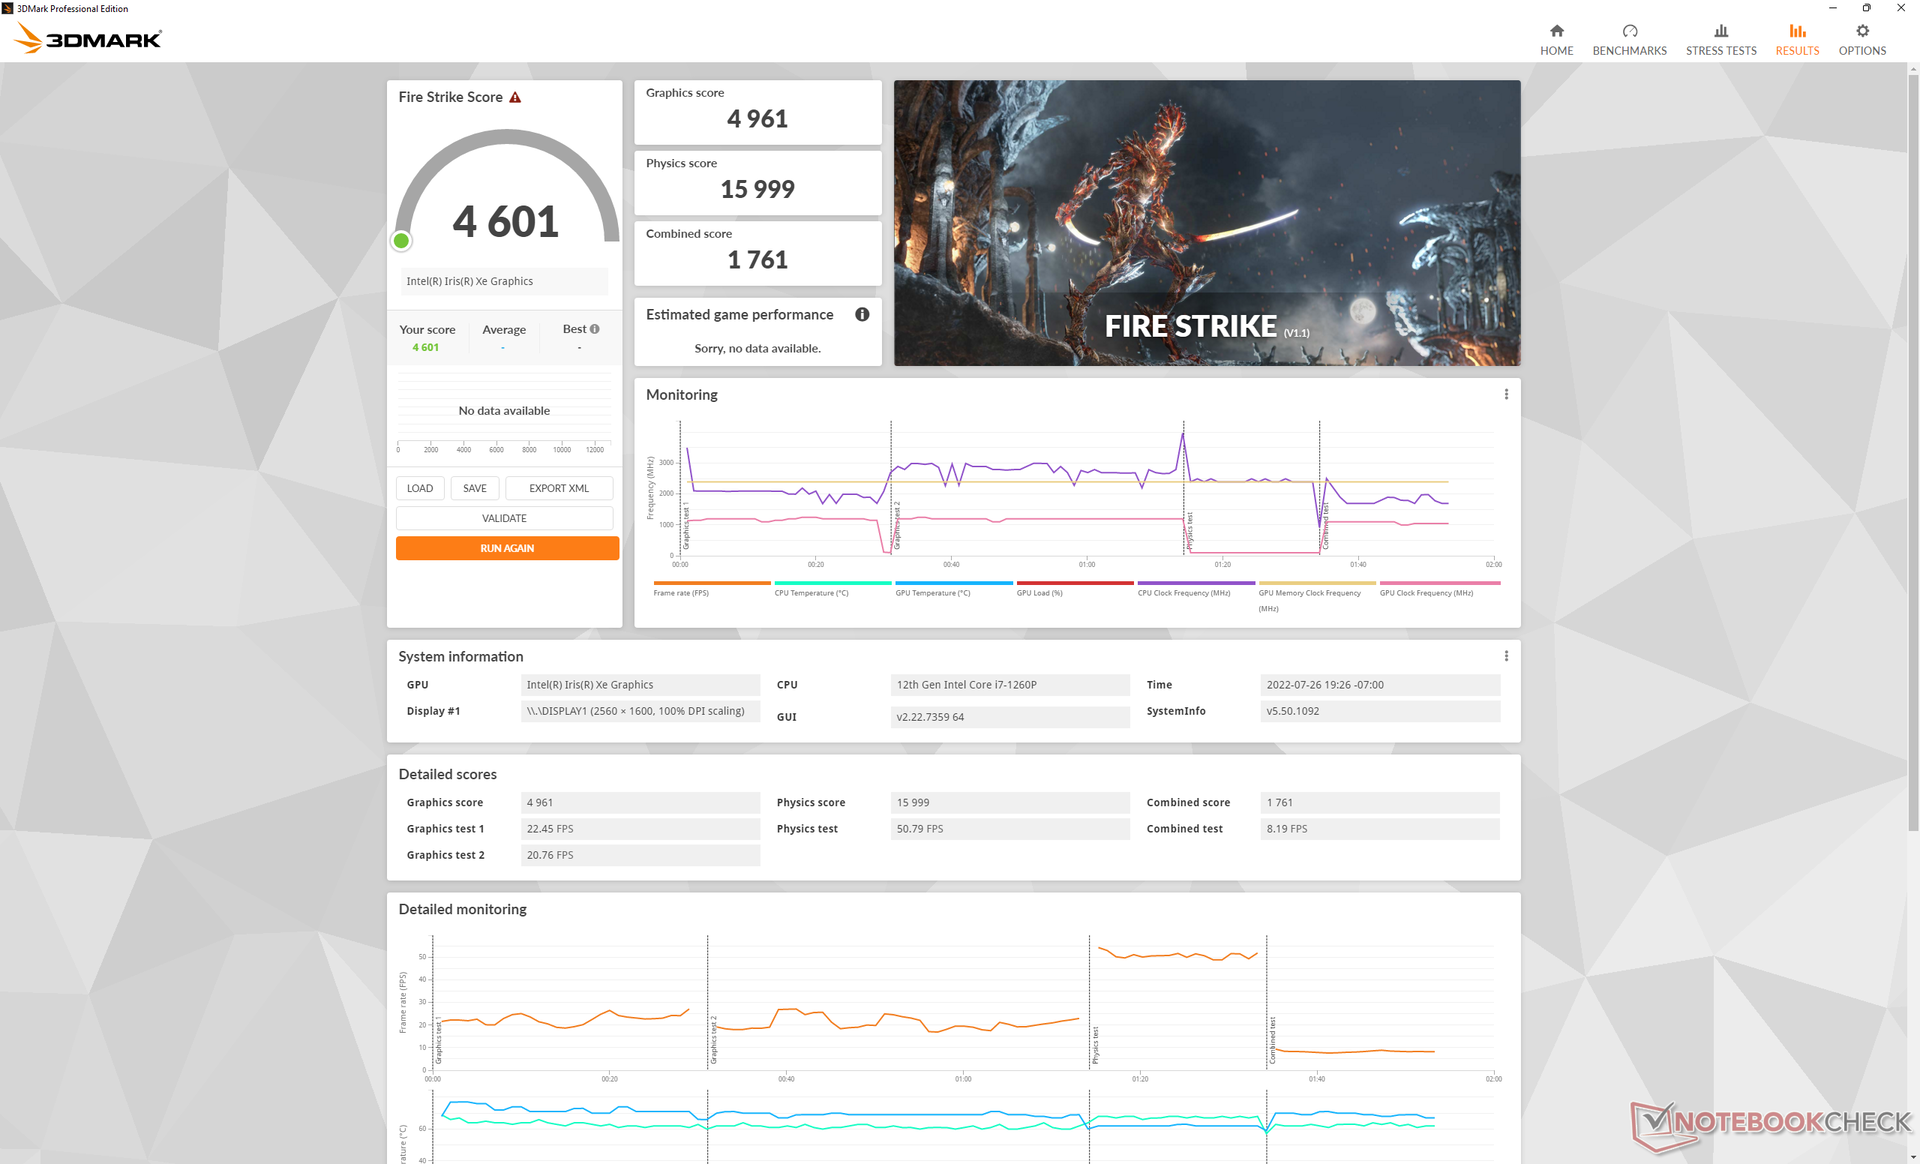
| 3DMark 11 Performance | 7279 points | |
| 3DMark Cloud Gate Standard Score | 20454 points | |
| 3DMark Fire Strike Score | 4601 points | |
| 3DMark Time Spy Score | 1799 points | |
Help | ||
Witcher 3 FPS Chart
| low | med. | high | ultra | |
|---|---|---|---|---|
| GTA V (2015) | 117.1 | 91 | 19.6 | 9.25 |
| The Witcher 3 (2015) | 78.3 | 51.4 | 29.1 | 13.7 |
| Dota 2 Reborn (2015) | 118.4 | 86.6 | 62.3 | 52.4 |
| Final Fantasy XV Benchmark (2018) | 40.4 | 22.6 | 16 | |
| X-Plane 11.11 (2018) | 42.6 | 30.1 | 29.1 | |
| Strange Brigade (2018) | 95.5 | 44.5 | 35.4 | 28.7 |
| Cyberpunk 2077 1.6 (2022) | 18.8 | 15.7 | 12 | 9.7 |
Emissions
System Noise
Fan noise and behavior are dependent on the three Lenovo Vantage power profile settings: Battery Saving, Intelligent Cooling, and Extreme Performance. Battery Saving is recommended if browsing or streaming or else the internal fan will pick up quite quickly when heavier loads are introduced. Running Witcher 3 on Intelligent Cooling mode and Extreme Performance mode would result in a fan noise level of 37.7 dB(A) and 40 dB(A), respectively, which are slightly louder levels than what we observed on the Dell Inspiron 16 7620 2-in-1. The system is otherwise reasonably quiet at well under 30 dB(A) during most daily tasks.
Noise level
| Idle |
| 23.6 / 23.6 / 23.6 dB(A) |
| Load |
| 37.7 / 40.2 dB(A) |
 | ||
30 dB silent 40 dB(A) audible 50 dB(A) loud |
||
min: | ||
| Lenovo Yoga 7 16IAP7 Iris Xe G7 96EUs, i7-1260P, Micron 2450 512GB MTFDKCD512TFK | Huawei MateBook D 16 2022 Iris Xe G7 96EUs, i7-12700H, Silicon Motion PCIe-8 SSD | Dell Inspiron 16 7620 2-in-1 Iris Xe G7 96EUs, i7-1260P, Toshiba KBG40ZNS512G NVMe | Acer Swift X SFX16-51G-5388 GeForce RTX 3050 4GB Laptop GPU, i5-11320H, Samsung PM991 MZVLQ512HBLU | LG Gram 16 (2021) Iris Xe G7 96EUs, i7-1165G7, SK Hynix PC601 1TB HFS001TD9TNG | Lenovo IdeaPad 5 Pro 16ACH GeForce GTX 1650 Mobile, R7 5800H, Micron 2300 512GB MTFDHBA512TDV | |
|---|---|---|---|---|---|---|
| Noise | -7% | 5% | -11% | 0% | -10% | |
| off / environment * (dB) | 23.6 | 24.2 -3% | 23.2 2% | 25.4 -8% | 26 -10% | 24.04 -2% |
| Idle Minimum * (dB) | 23.6 | 24.2 -3% | 23.5 -0% | 25.4 -8% | 26 -10% | 24.04 -2% |
| Idle Average * (dB) | 23.6 | 25.8 -9% | 23.5 -0% | 25.4 -8% | 26 -10% | 24.04 -2% |
| Idle Maximum * (dB) | 23.6 | 30.5 -29% | 23.5 -0% | 27.8 -18% | 26 -10% | 24.04 -2% |
| Load Average * (dB) | 37.7 | 39.8 -6% | 29.4 22% | 41 -9% | 30.8 18% | 41.3 -10% |
| Witcher 3 ultra * (dB) | 40 | 39.8 -0% | 35.6 11% | 49.21 -23% | ||
| Load Maximum * (dB) | 40.2 | 39.8 1% | 39.7 1% | 47 -17% | 31.1 23% | 52.93 -32% |
* ... smaller is better
Temperature — Pretty Cool
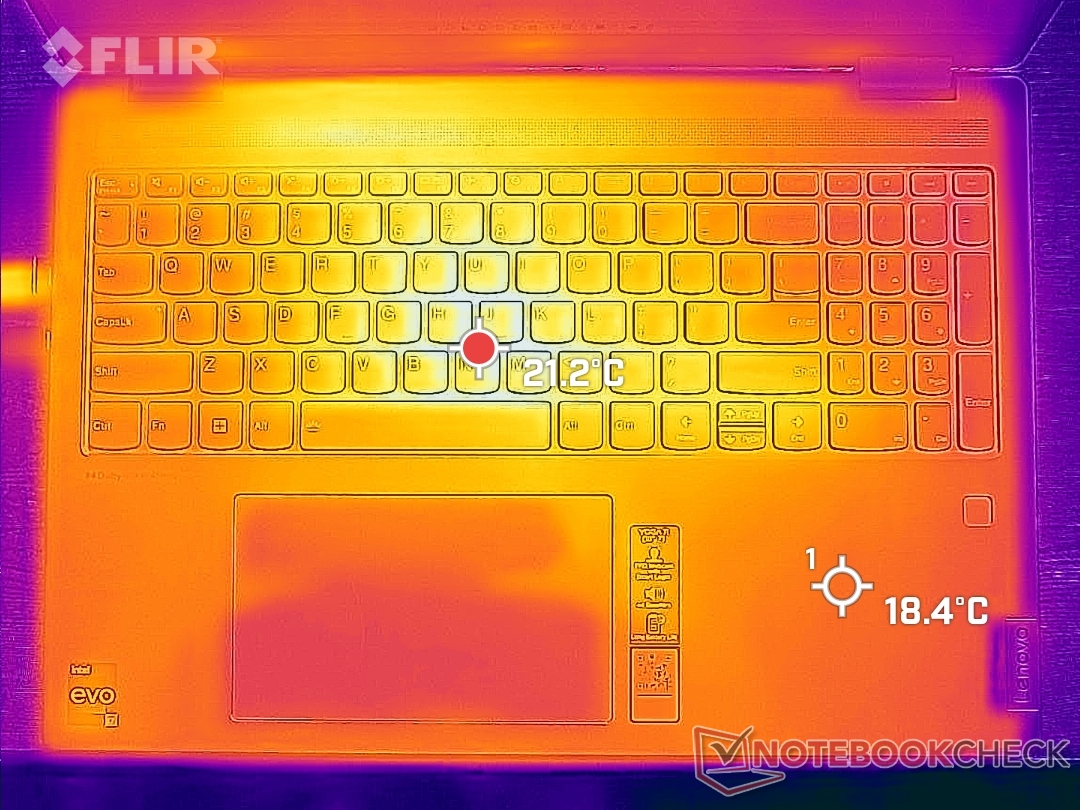
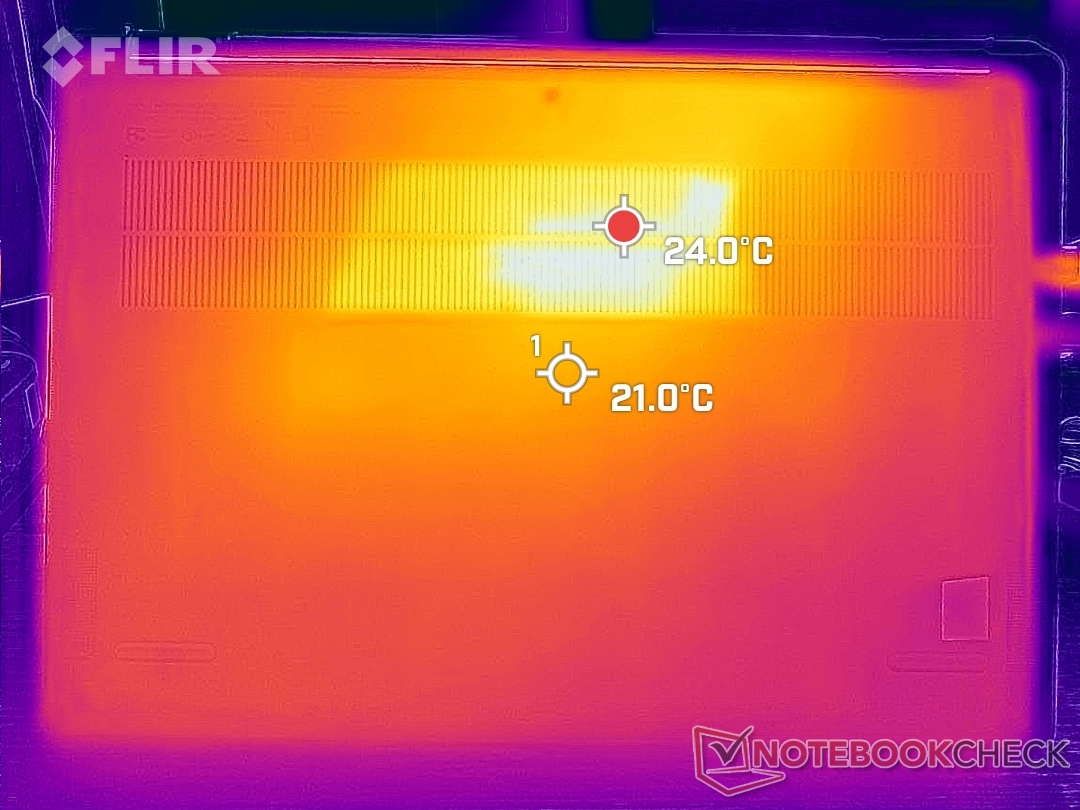
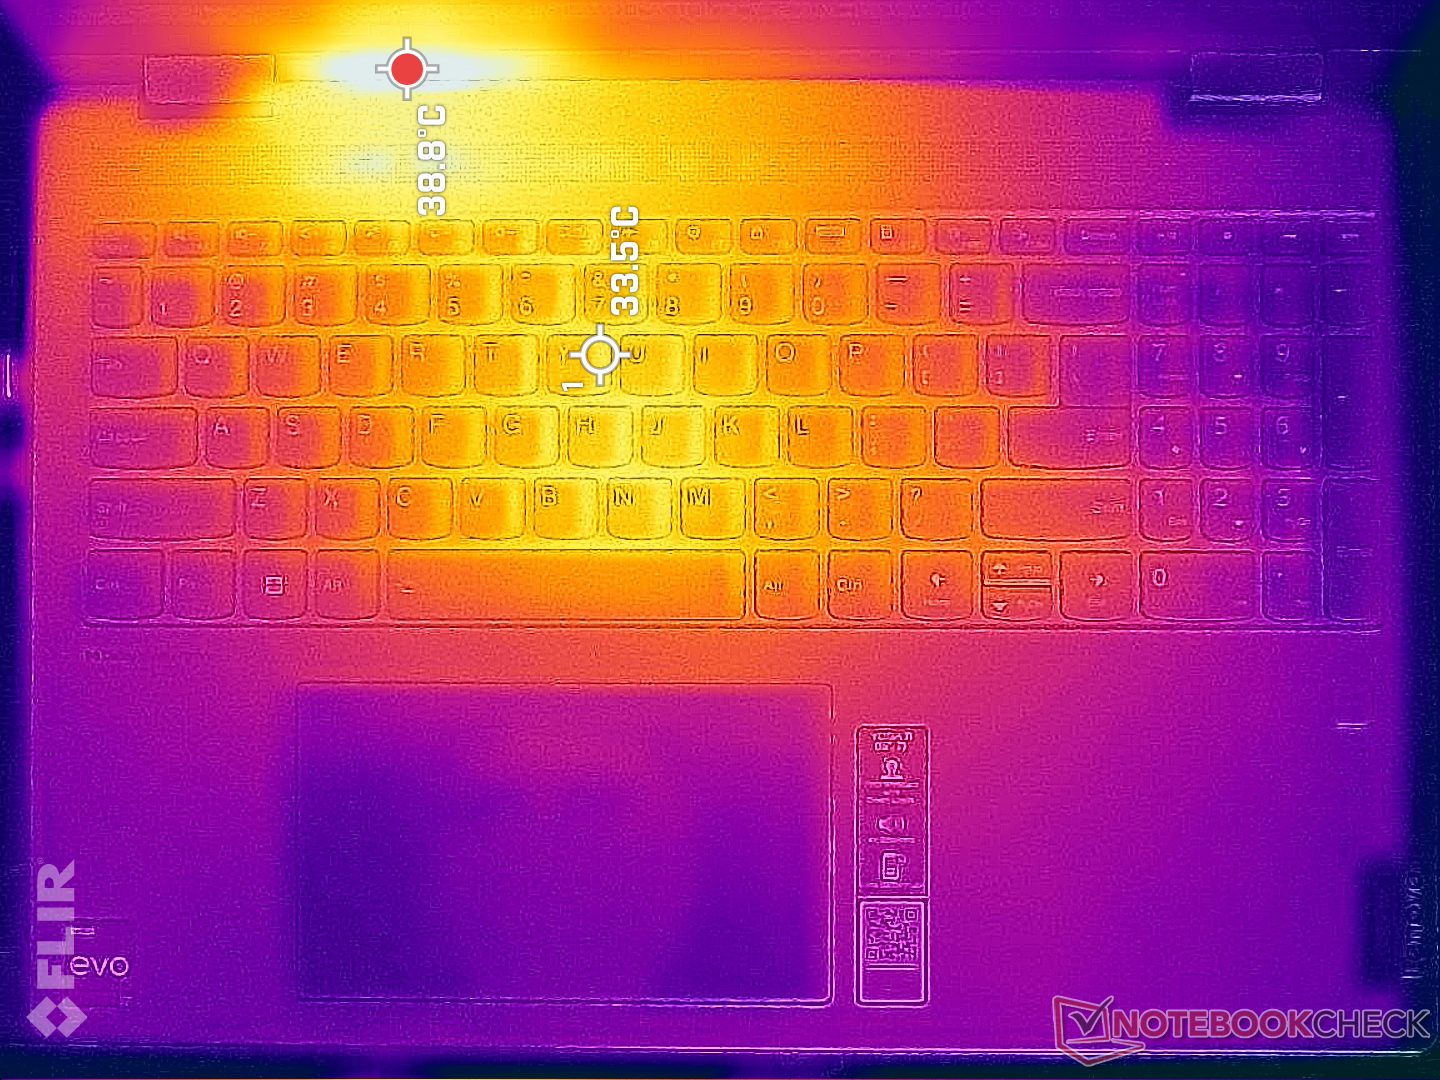
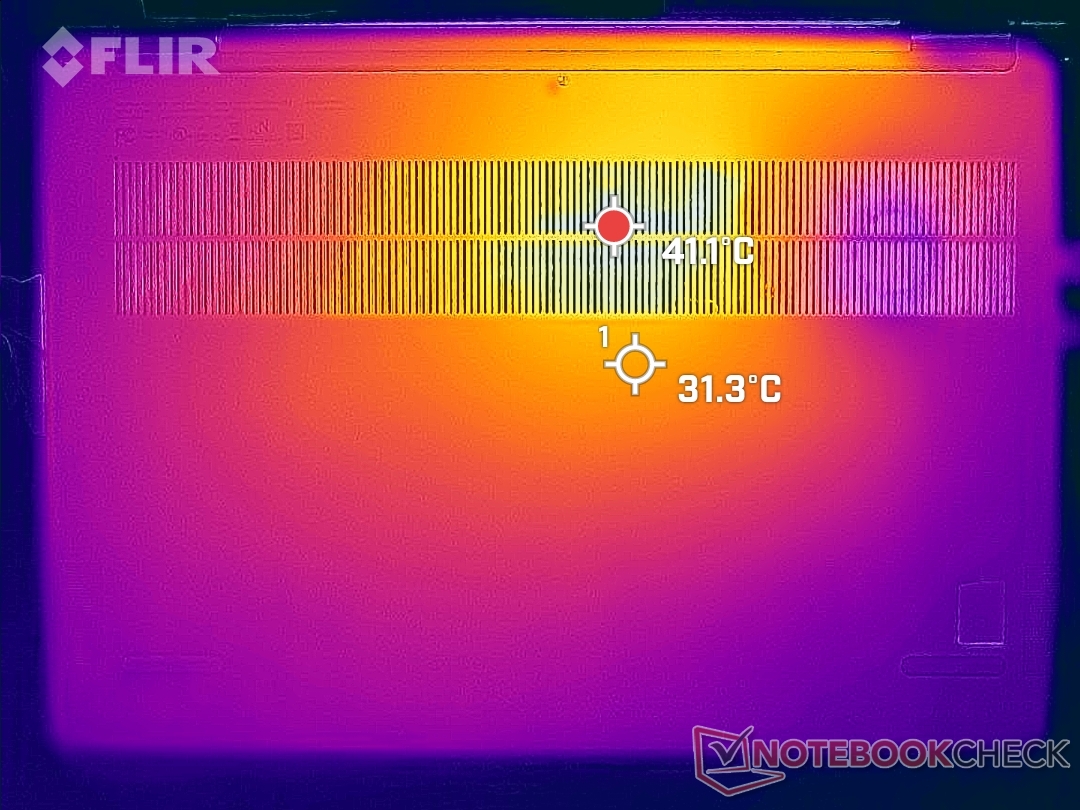
Surface temperatures are not that warm even when running demanding loads. Hot spots on the top and bottom can reach 39 C and 35 C, respectively, compared to 41 C to 48 C on the Huawei MateBook D 16 2022 or 45 C to 47 C on the LG Gram 16. These hot spots are toward the rear of the chassis leaving the palm rests cooler.
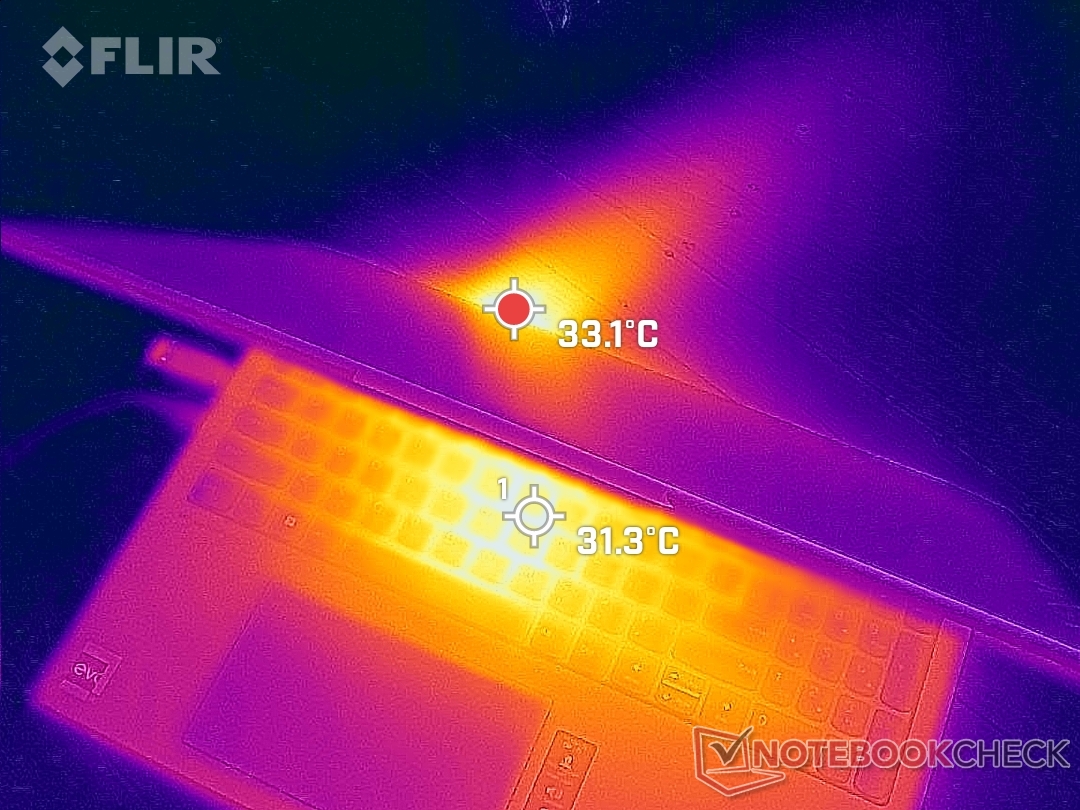
(+) The maximum temperature on the upper side is 39 °C / 102 F, compared to the average of 35.4 °C / 96 F, ranging from 19.6 to 60 °C for the class Convertible.
(+) The bottom heats up to a maximum of 34.2 °C / 94 F, compared to the average of 36.8 °C / 98 F
(+) In idle usage, the average temperature for the upper side is 19.3 °C / 67 F, compared to the device average of 30.3 °C / 87 F.
(+) The palmrests and touchpad are cooler than skin temperature with a maximum of 23.4 °C / 74.1 F and are therefore cool to the touch.
(+) The average temperature of the palmrest area of similar devices was 27.9 °C / 82.2 F (+4.5 °C / 8.1 F).
| Lenovo Yoga 7 16IAP7 Intel Core i7-1260P, Intel Iris Xe Graphics G7 96EUs | Huawei MateBook D 16 2022 Intel Core i7-12700H, Intel Iris Xe Graphics G7 96EUs | Dell Inspiron 16 7620 2-in-1 Intel Core i7-1260P, Intel Iris Xe Graphics G7 96EUs | Acer Swift X SFX16-51G-5388 Intel Core i5-11320H, NVIDIA GeForce RTX 3050 4GB Laptop GPU | LG Gram 16 (2021) Intel Core i7-1165G7, Intel Iris Xe Graphics G7 96EUs | Lenovo IdeaPad 5 Pro 16ACH AMD Ryzen 7 5800H, NVIDIA GeForce GTX 1650 Mobile | |
|---|---|---|---|---|---|---|
| Heat | -30% | -39% | -41% | -22% | -36% | |
| Maximum Upper Side * (°C) | 39 | 41.8 -7% | 42.2 -8% | 52.4 -34% | 46.9 -20% | 51.9 -33% |
| Maximum Bottom * (°C) | 34.2 | 47.3 -38% | 47.4 -39% | 50 -46% | 45.1 -32% | 51.5 -51% |
| Idle Upper Side * (°C) | 21.2 | 28.3 -33% | 32.2 -52% | 30.3 -43% | 26.4 -25% | 27.2 -28% |
| Idle Bottom * (°C) | 21.6 | 30.2 -40% | 33.6 -56% | 30.4 -41% | 24.1 -12% | 28.5 -32% |
* ... smaller is better
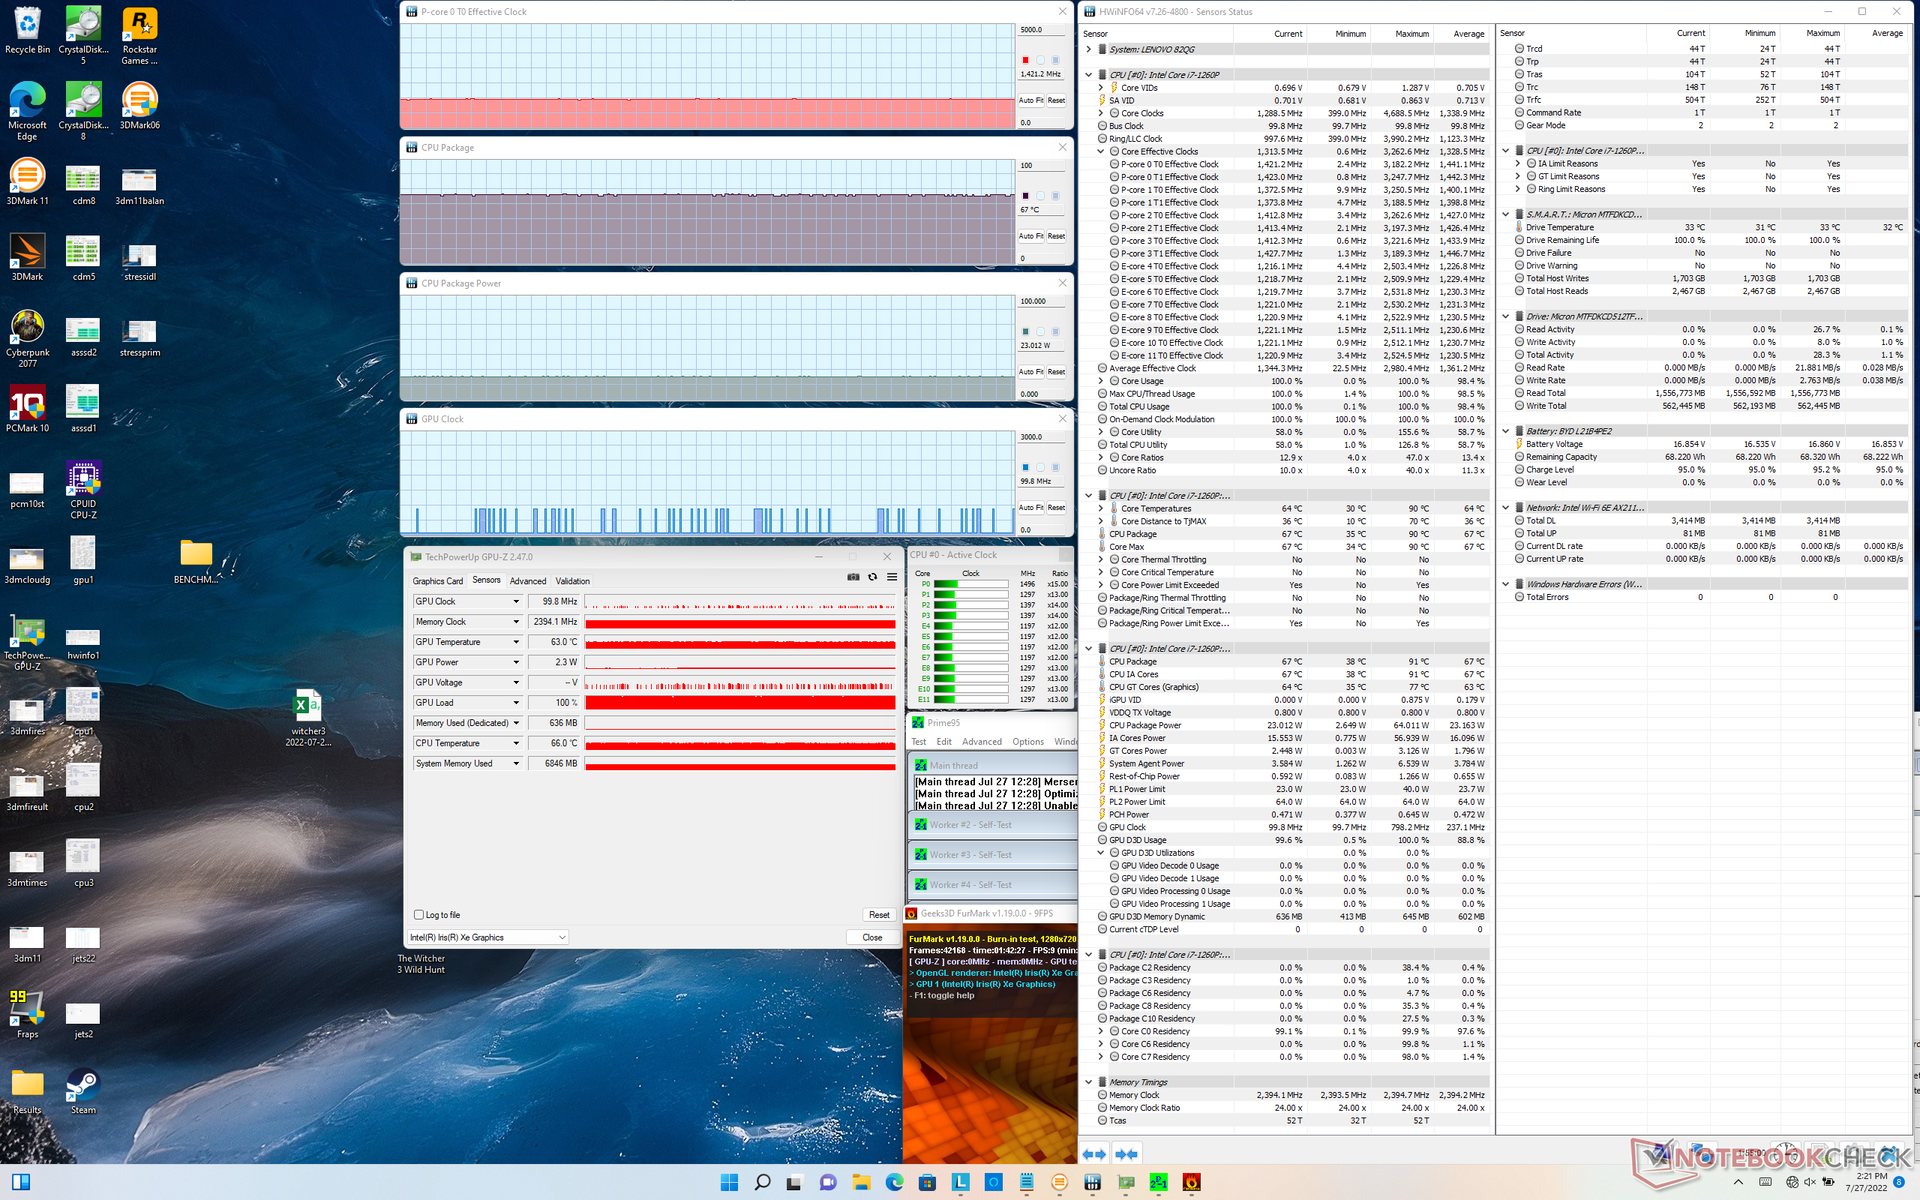
Stress Test
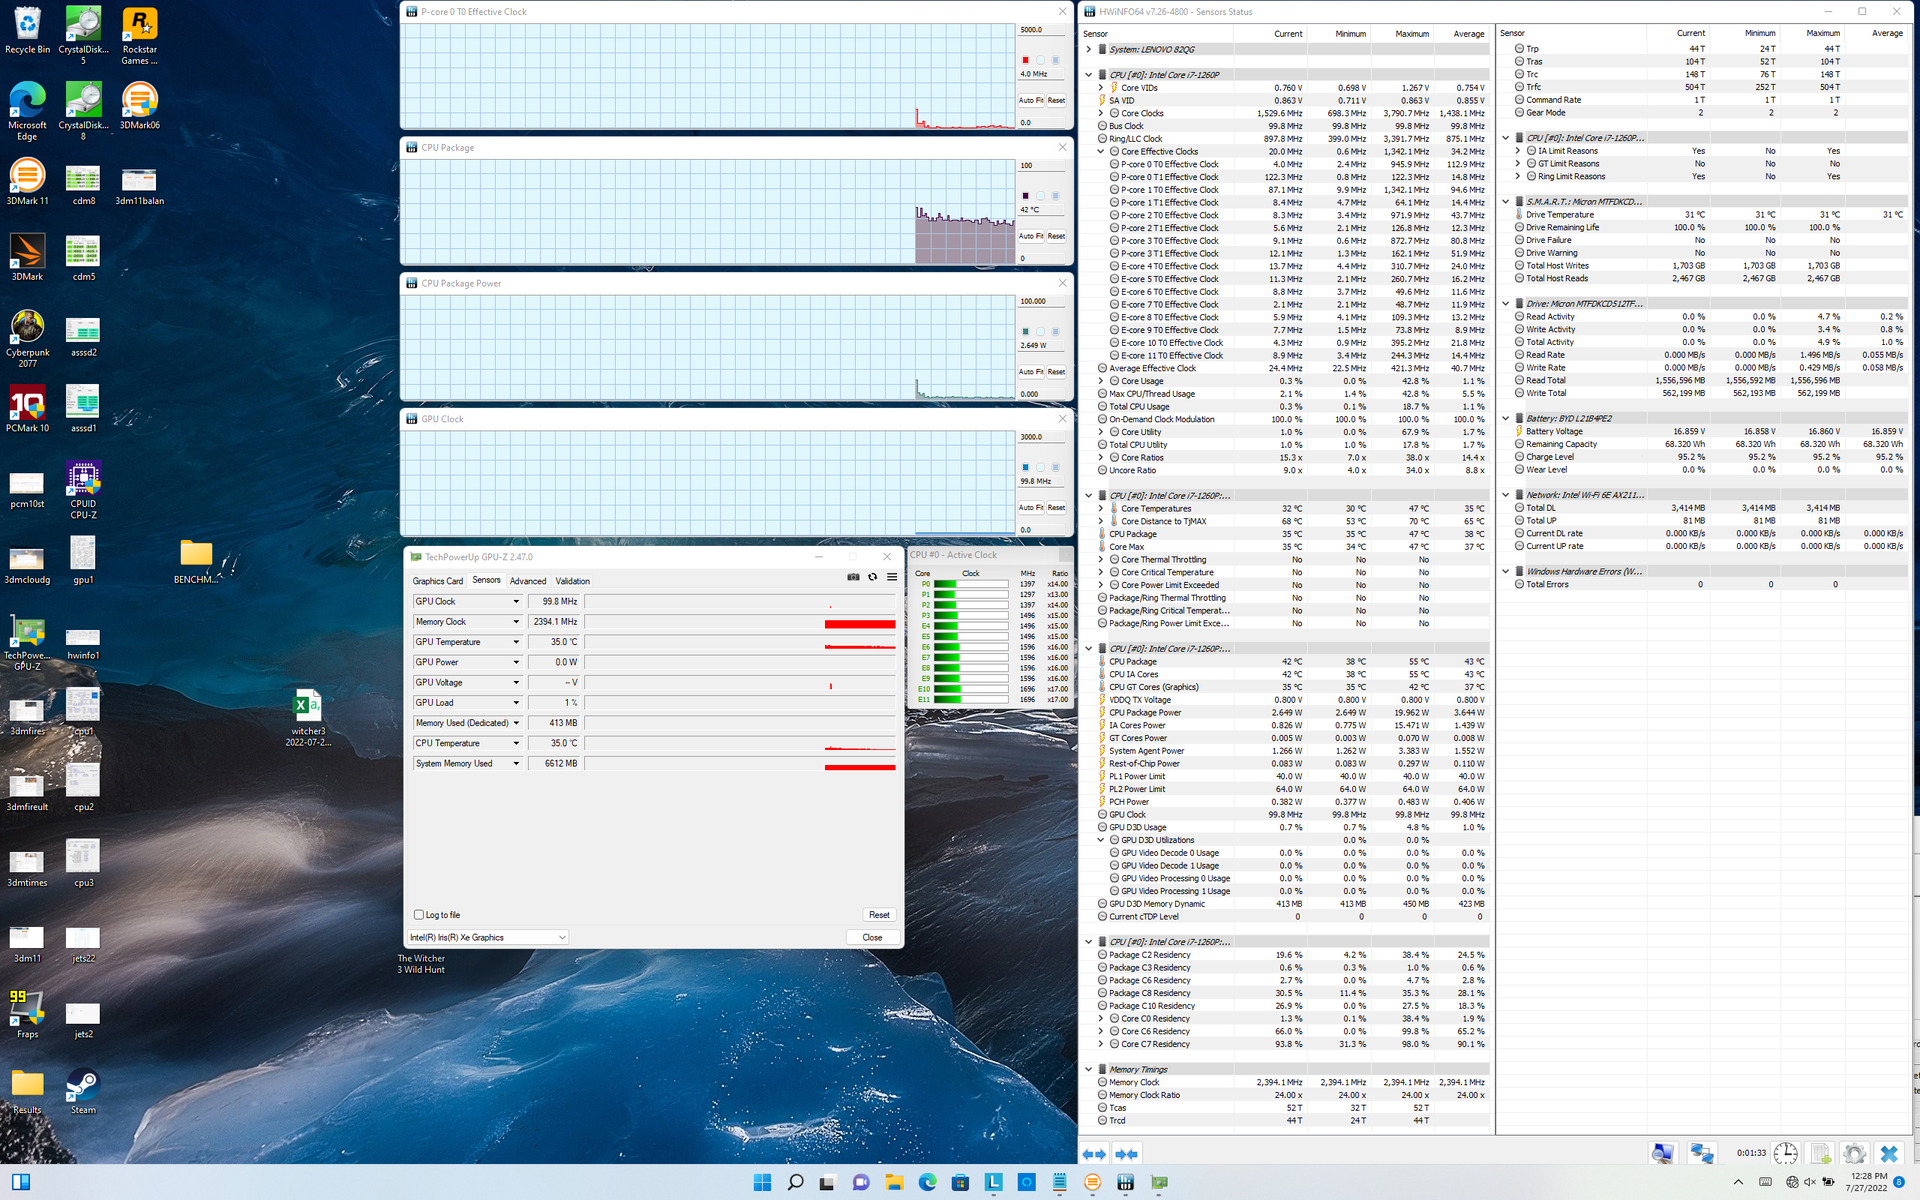
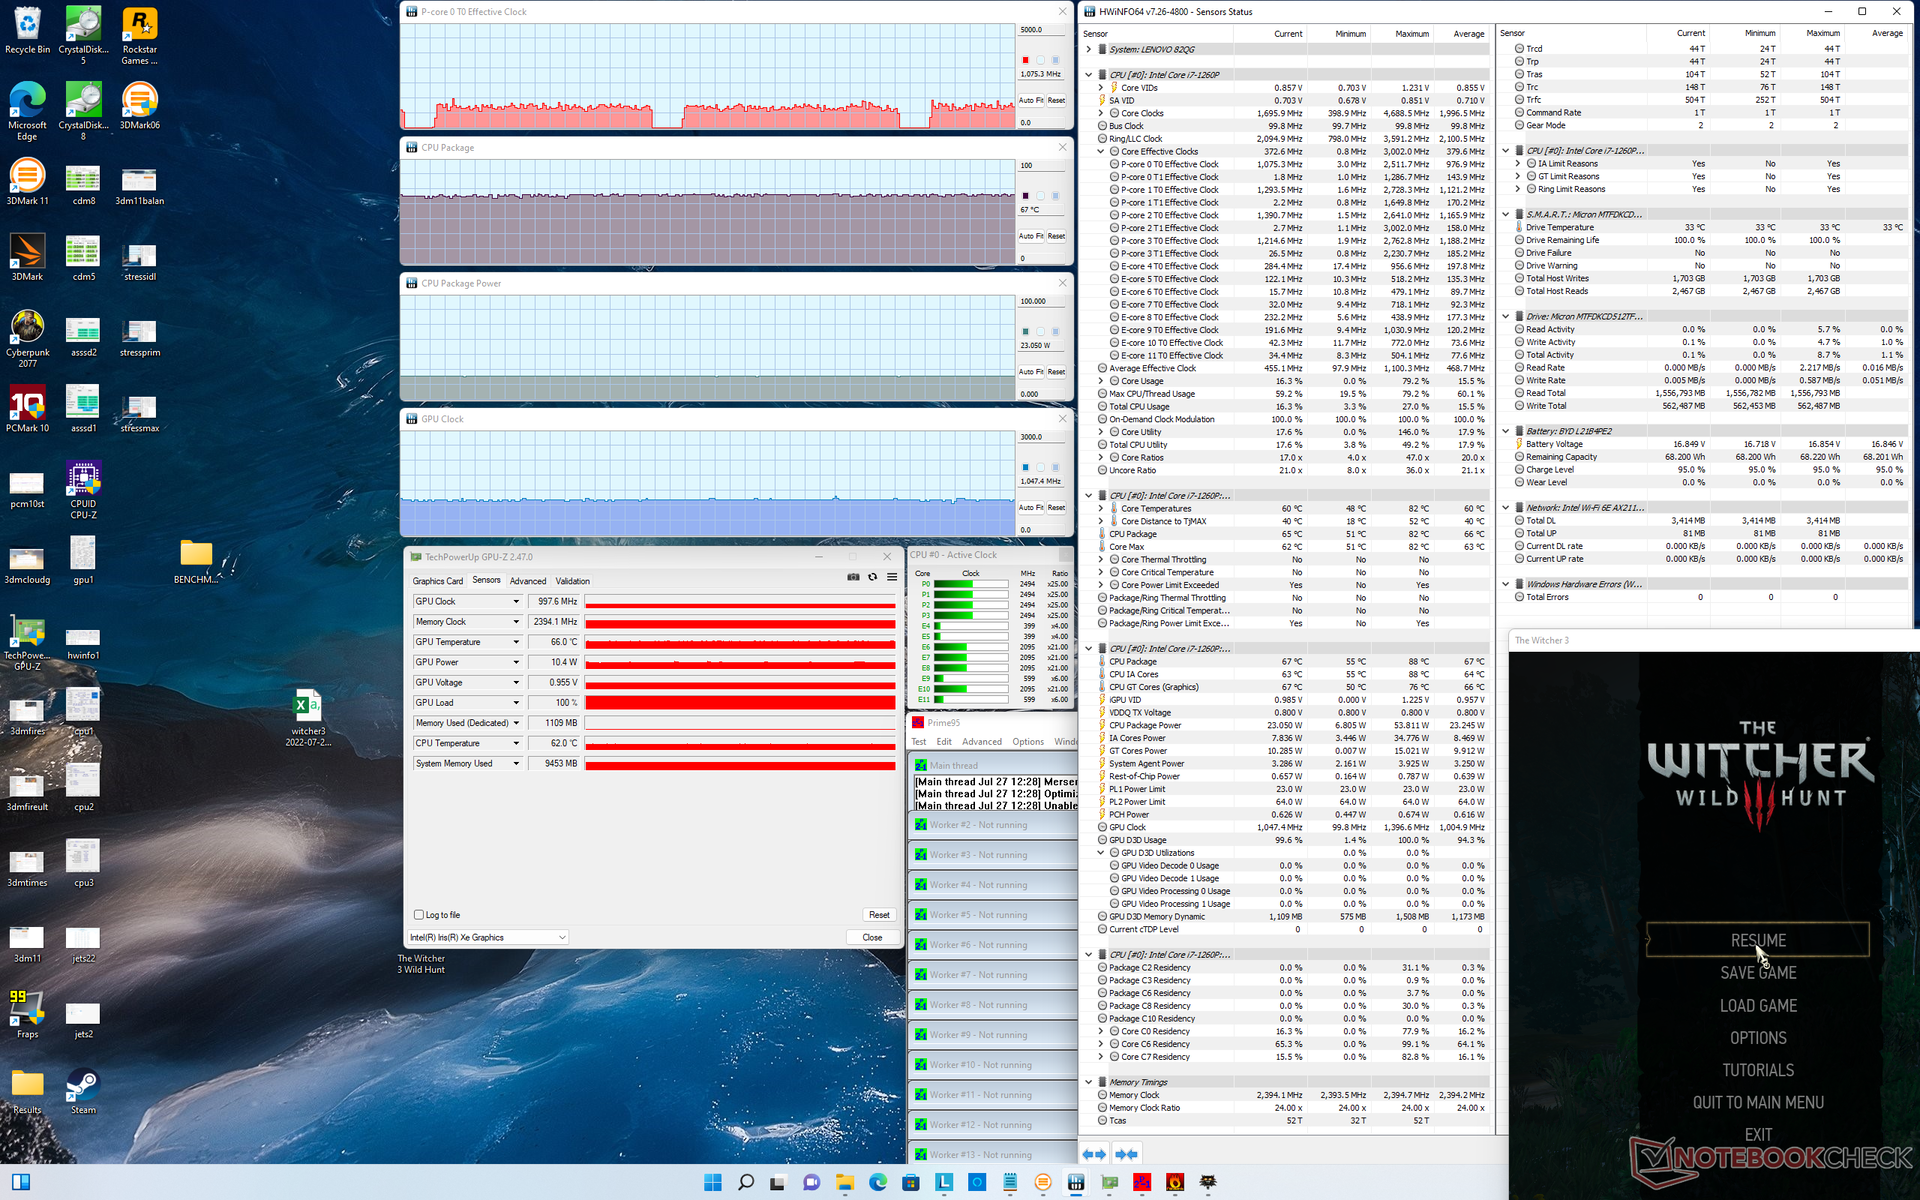
When stressed under Prime95, clock rates and CPU board package power draw would spike to 3.2 GHz and 64 W, respectively, for only a few seconds until core temperature reaches 91 C. Thereafter, the CPU would drop to 2.2 GHz and 38 W before finally stabilizing at about 1.6 GHz, 23 W, and 66 C. The steady decline in performance over time matches our CineBench R15 xT loop test results mentioned above. Running this same test on the MSI Summit E14 Flip Evo with the same CPU shows slightly higher stable clock rates and CPU power draw of 1.9 GHz and 28 W, respectively, albeit at a higher core temperature of 82 C.
GPU clock rates and temperature would stabilize at 998 MHz and 67 C, respectively, when running Witcher 3 on Extreme Performance mode. Repeating this same test on Intelligent Cooling mode would result in slightly lower CPU and GPU clock rates and cooler core temperature as shown by the table below. Running this same test on the Dell Inspiron 16 7620 2-in-1 would result in higher GPU clock rates and temperature of 1296 MHz and 82 C, respectively. The comparatively lower core temperatures of the Lenovo may be responsible for the cooler surface temperatures as mentioned above.
Running on battery power does not limit performance. A 3DMark 11 test on batteries would return essentially the same Physics and Graphics scores as on mains.
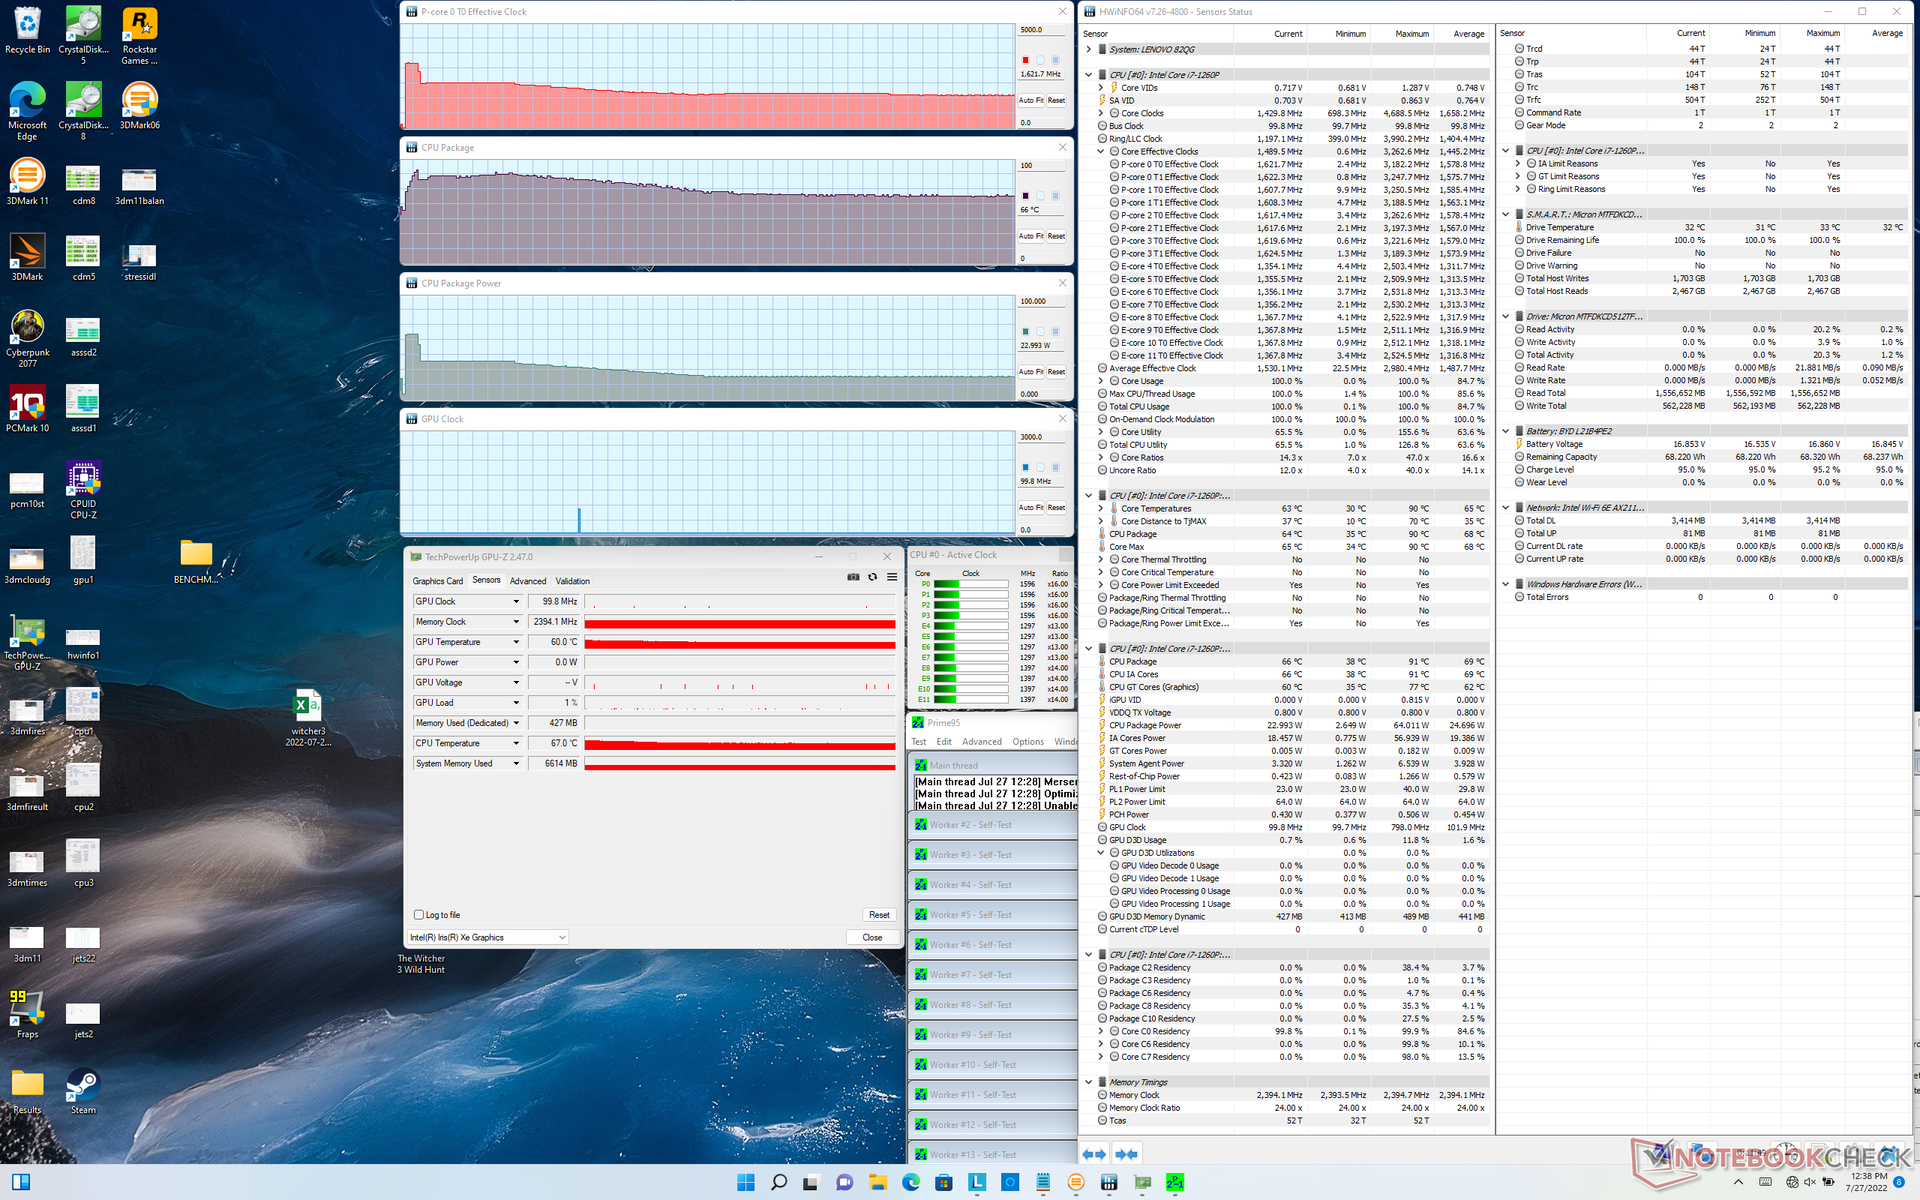
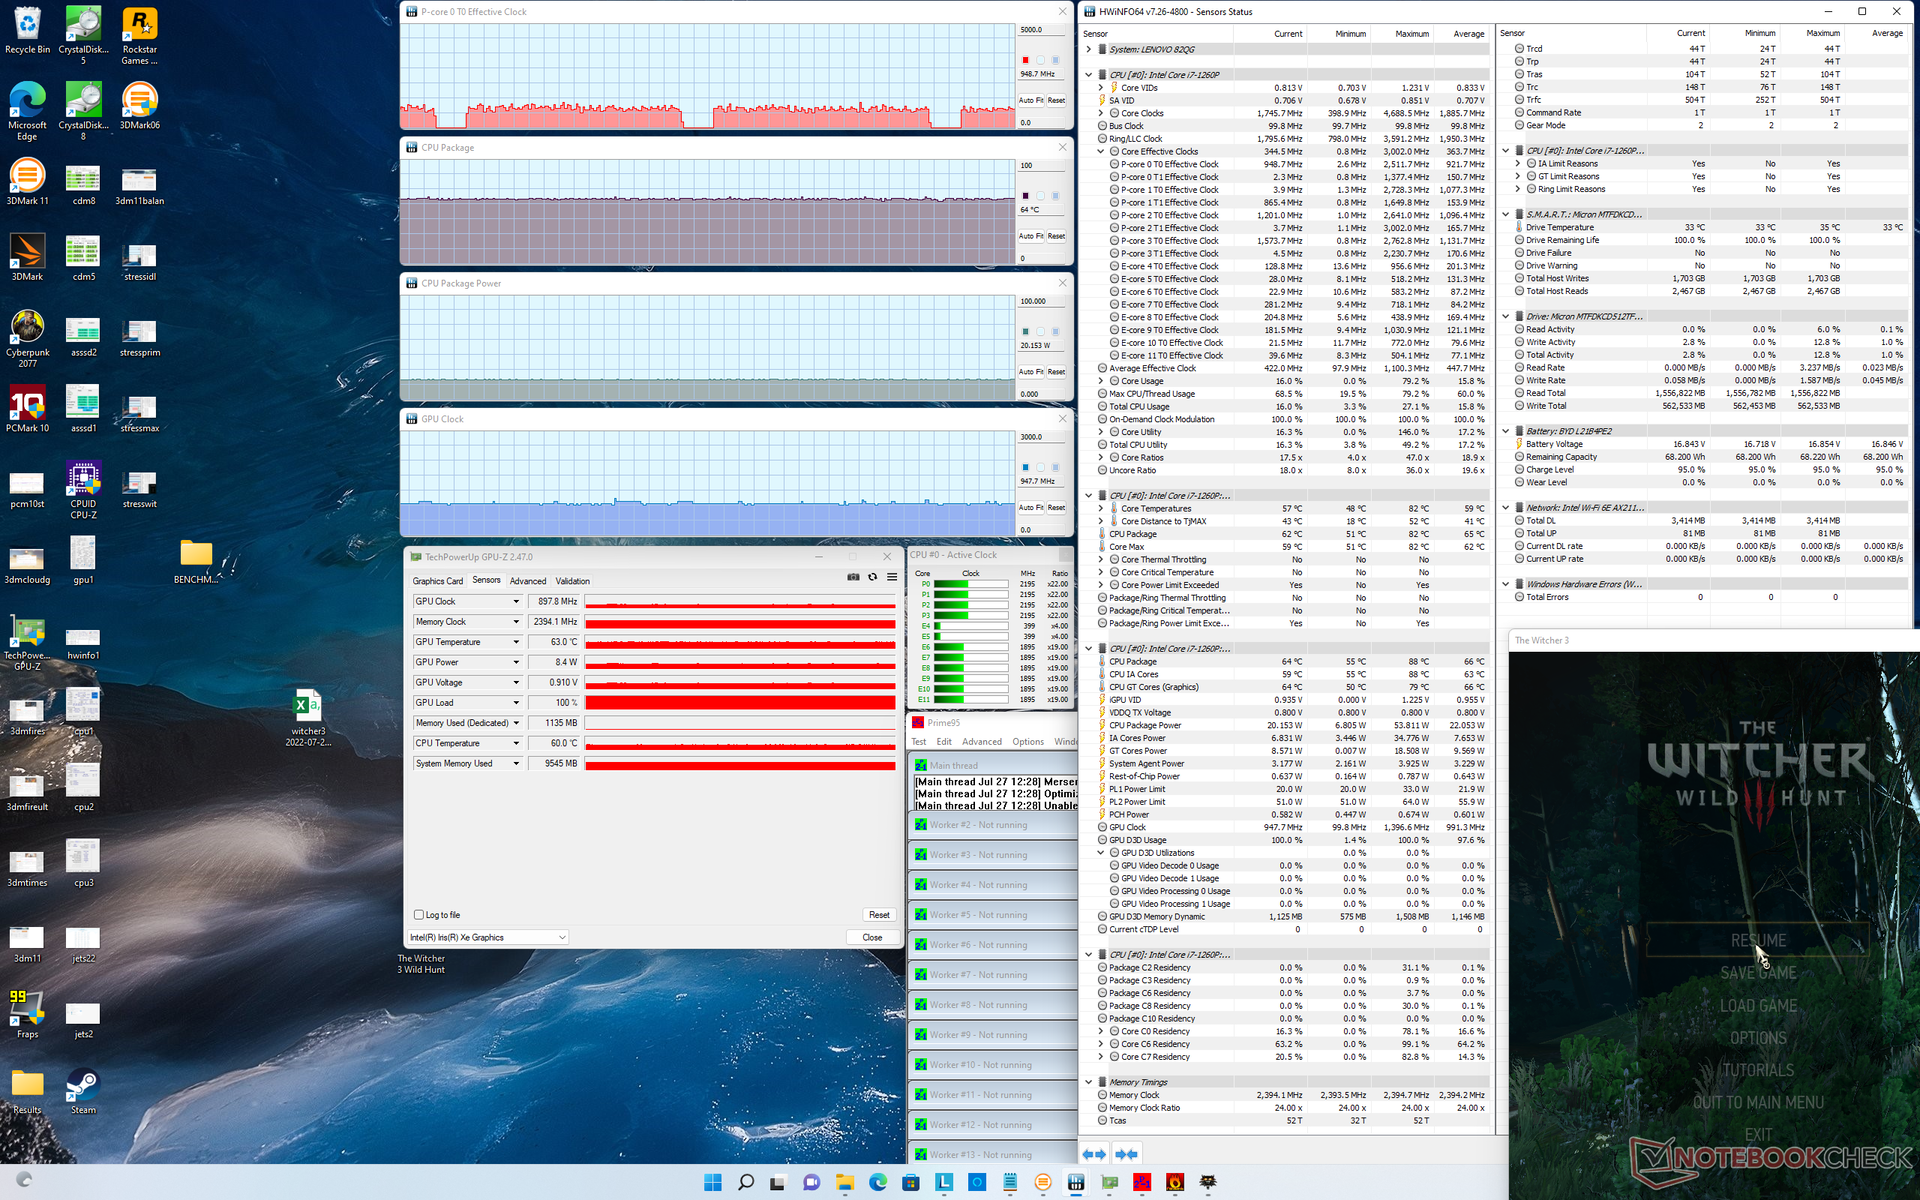
| CPU Clock (GHz) | GPU Clock (MHz) | Average CPU Temperature (°C) | |
| System Idle | -- | -- | 42 |
| Prime95 Stress | 1.6 | -- | 66 |
| Prime95 + FurMark Stress | 1.4 | 100 | 67 |
| Witcher 3 Stress (Intelligent Cooling mode) | 0.95 | 898 | 64 |
| Witcher 3 Stress Extreme Performance mode) | 1.1 | 998 | 67 |
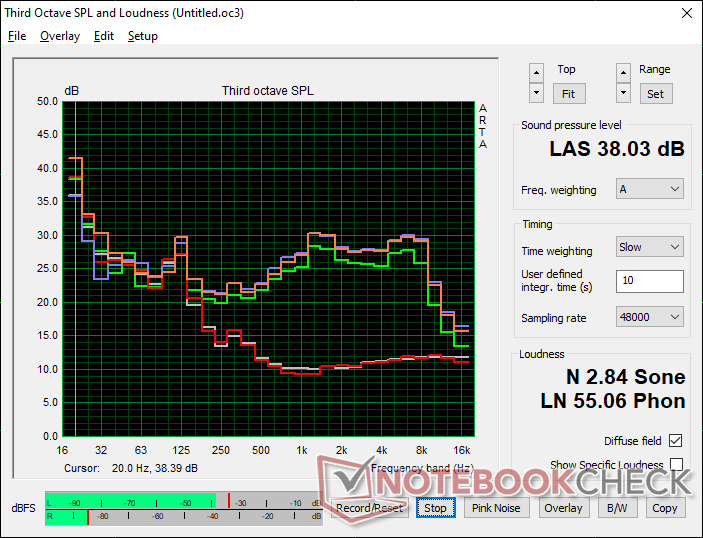
Speakers
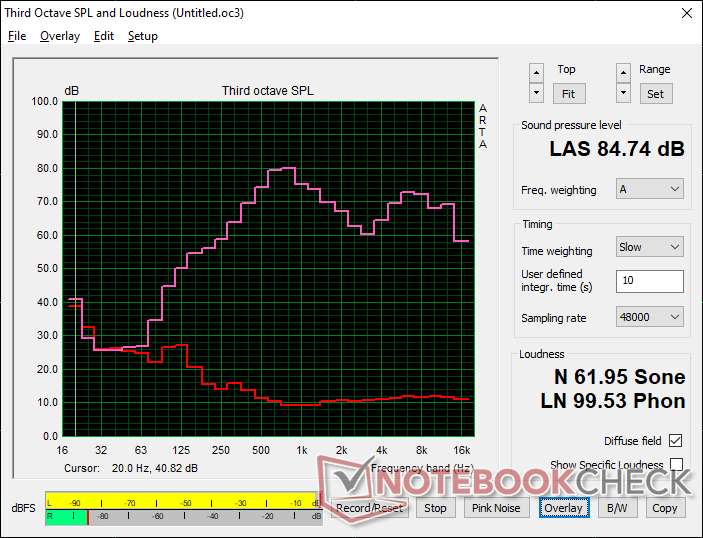
Lenovo Yoga 7 16IAP7 audio analysis
(+) | speakers can play relatively loud (84.7 dB)
Bass 100 - 315 Hz
(±) | reduced bass - on average 13.4% lower than median
(±) | linearity of bass is average (8.6% delta to prev. frequency)
Mids 400 - 2000 Hz
(±) | higher mids - on average 5.7% higher than median
(+) | mids are linear (6.4% delta to prev. frequency)
Highs 2 - 16 kHz
(+) | balanced highs - only 3.9% away from median
(+) | highs are linear (6% delta to prev. frequency)
Overall 100 - 16.000 Hz
(+) | overall sound is linear (13.2% difference to median)
Compared to same class
» 17% of all tested devices in this class were better, 3% similar, 81% worse
» The best had a delta of 6%, average was 20%, worst was 57%
Compared to all devices tested
» 13% of all tested devices were better, 3% similar, 85% worse
» The best had a delta of 4%, average was 24%, worst was 134%
Apple MacBook Pro 16 2021 M1 Pro audio analysis
(+) | speakers can play relatively loud (84.7 dB)
Bass 100 - 315 Hz
(+) | good bass - only 3.8% away from median
(+) | bass is linear (5.2% delta to prev. frequency)
Mids 400 - 2000 Hz
(+) | balanced mids - only 1.3% away from median
(+) | mids are linear (2.1% delta to prev. frequency)
Highs 2 - 16 kHz
(+) | balanced highs - only 1.9% away from median
(+) | highs are linear (2.7% delta to prev. frequency)
Overall 100 - 16.000 Hz
(+) | overall sound is linear (4.6% difference to median)
Compared to same class
» 0% of all tested devices in this class were better, 0% similar, 100% worse
» The best had a delta of 5%, average was 17%, worst was 45%
Compared to all devices tested
» 0% of all tested devices were better, 0% similar, 100% worse
» The best had a delta of 4%, average was 24%, worst was 134%
Energy Management
Power Consumption — A Demanding 16-inch System
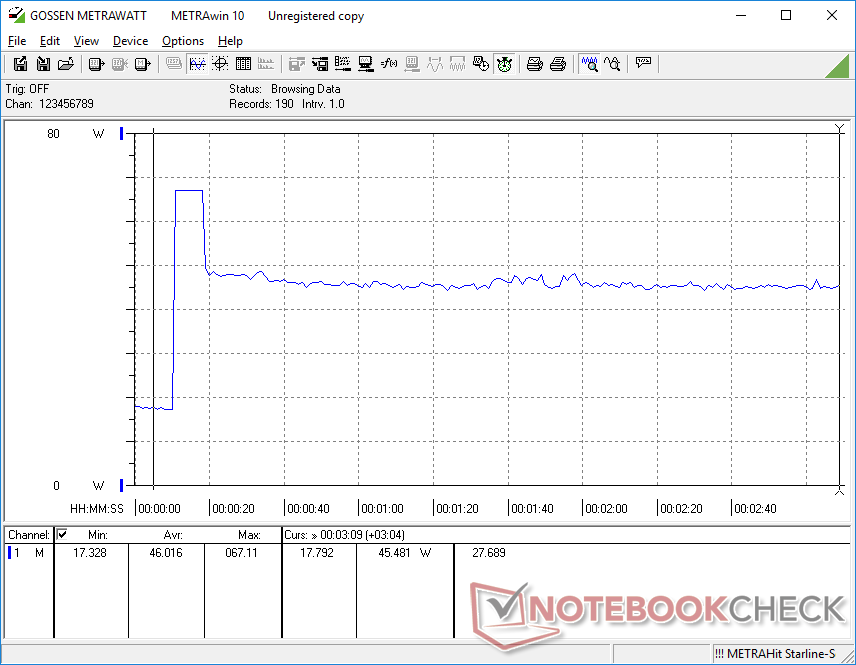
The Lenovo demands slightly more power than the Inspiron 16 7620 2-in-1 likely due to the higher native resolution of our Lenovo (1600p vs 1200p) and slightly faster graphics performance from the integrated Iris Xe GPU. Consumption is relatively high at about 60 W when gaming to be comparable to the more powerful Acer Swift X or twice that of the LG Gram 16 powered by the older 11th gen Core i7-1165G7.
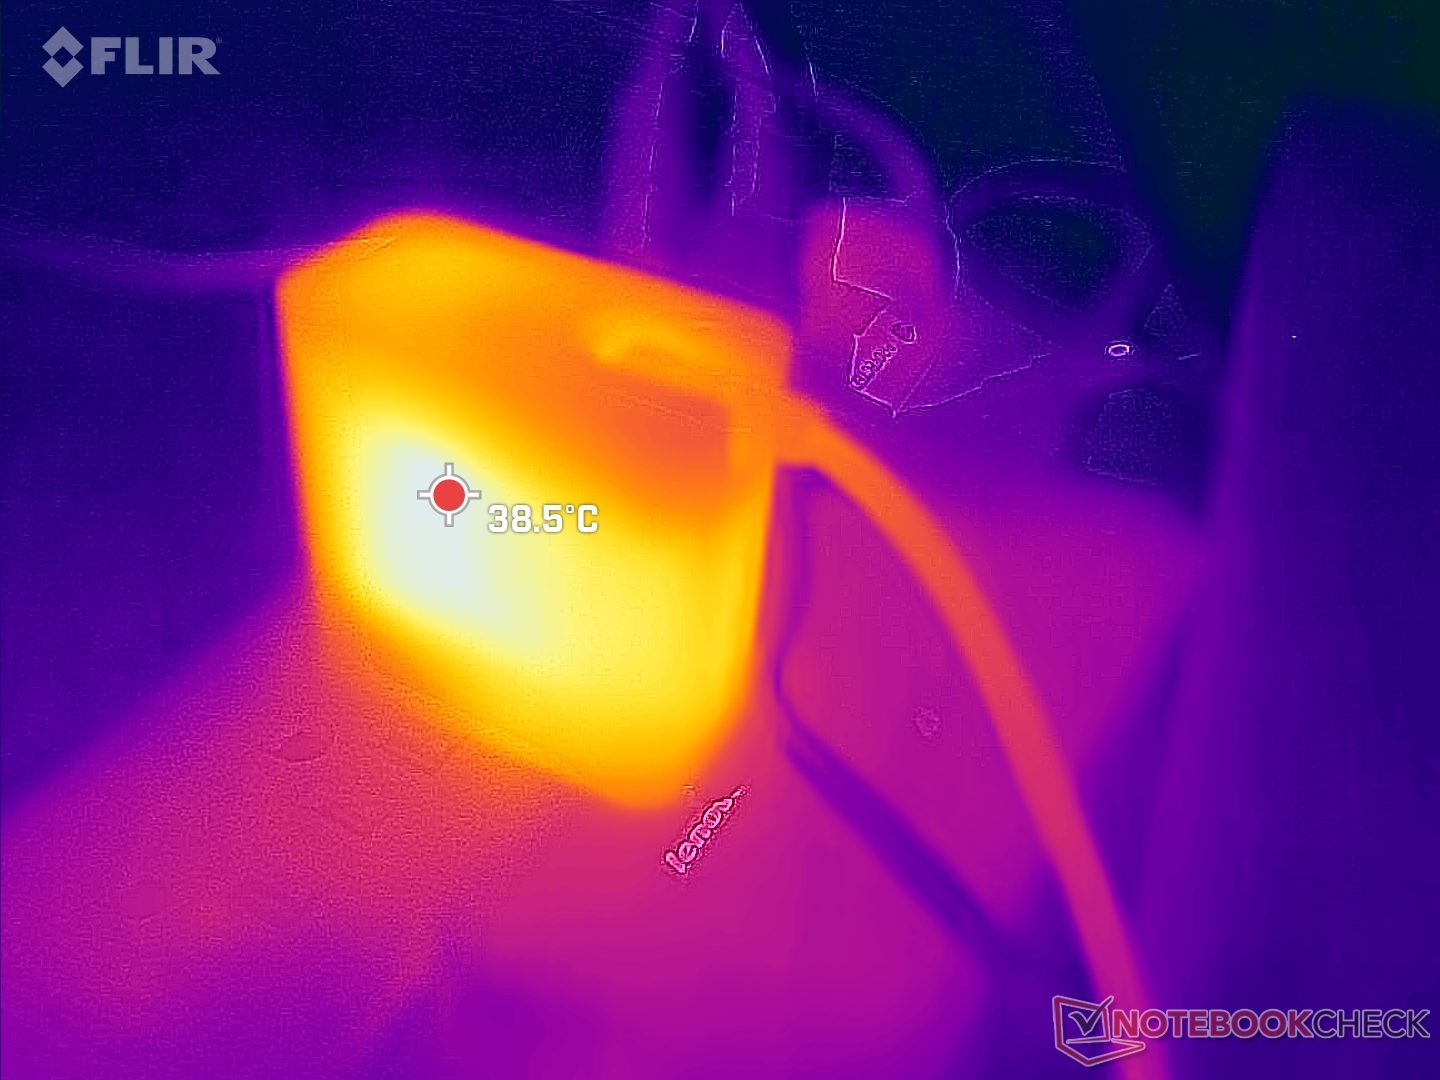
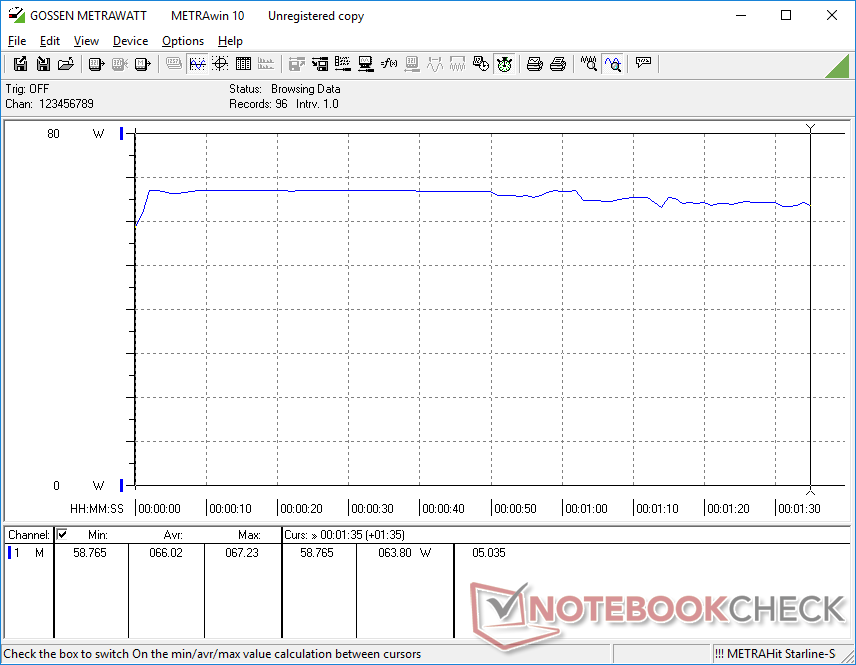
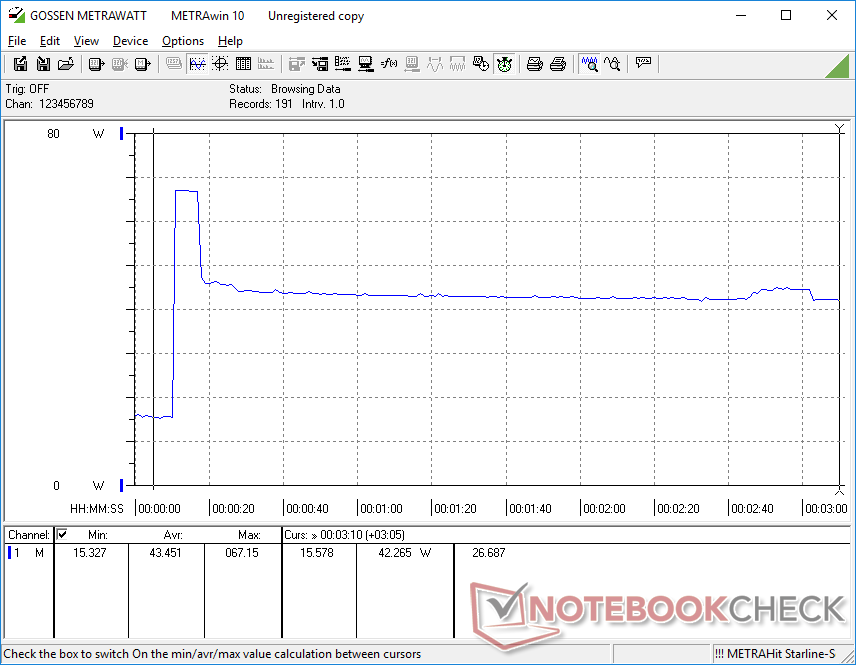
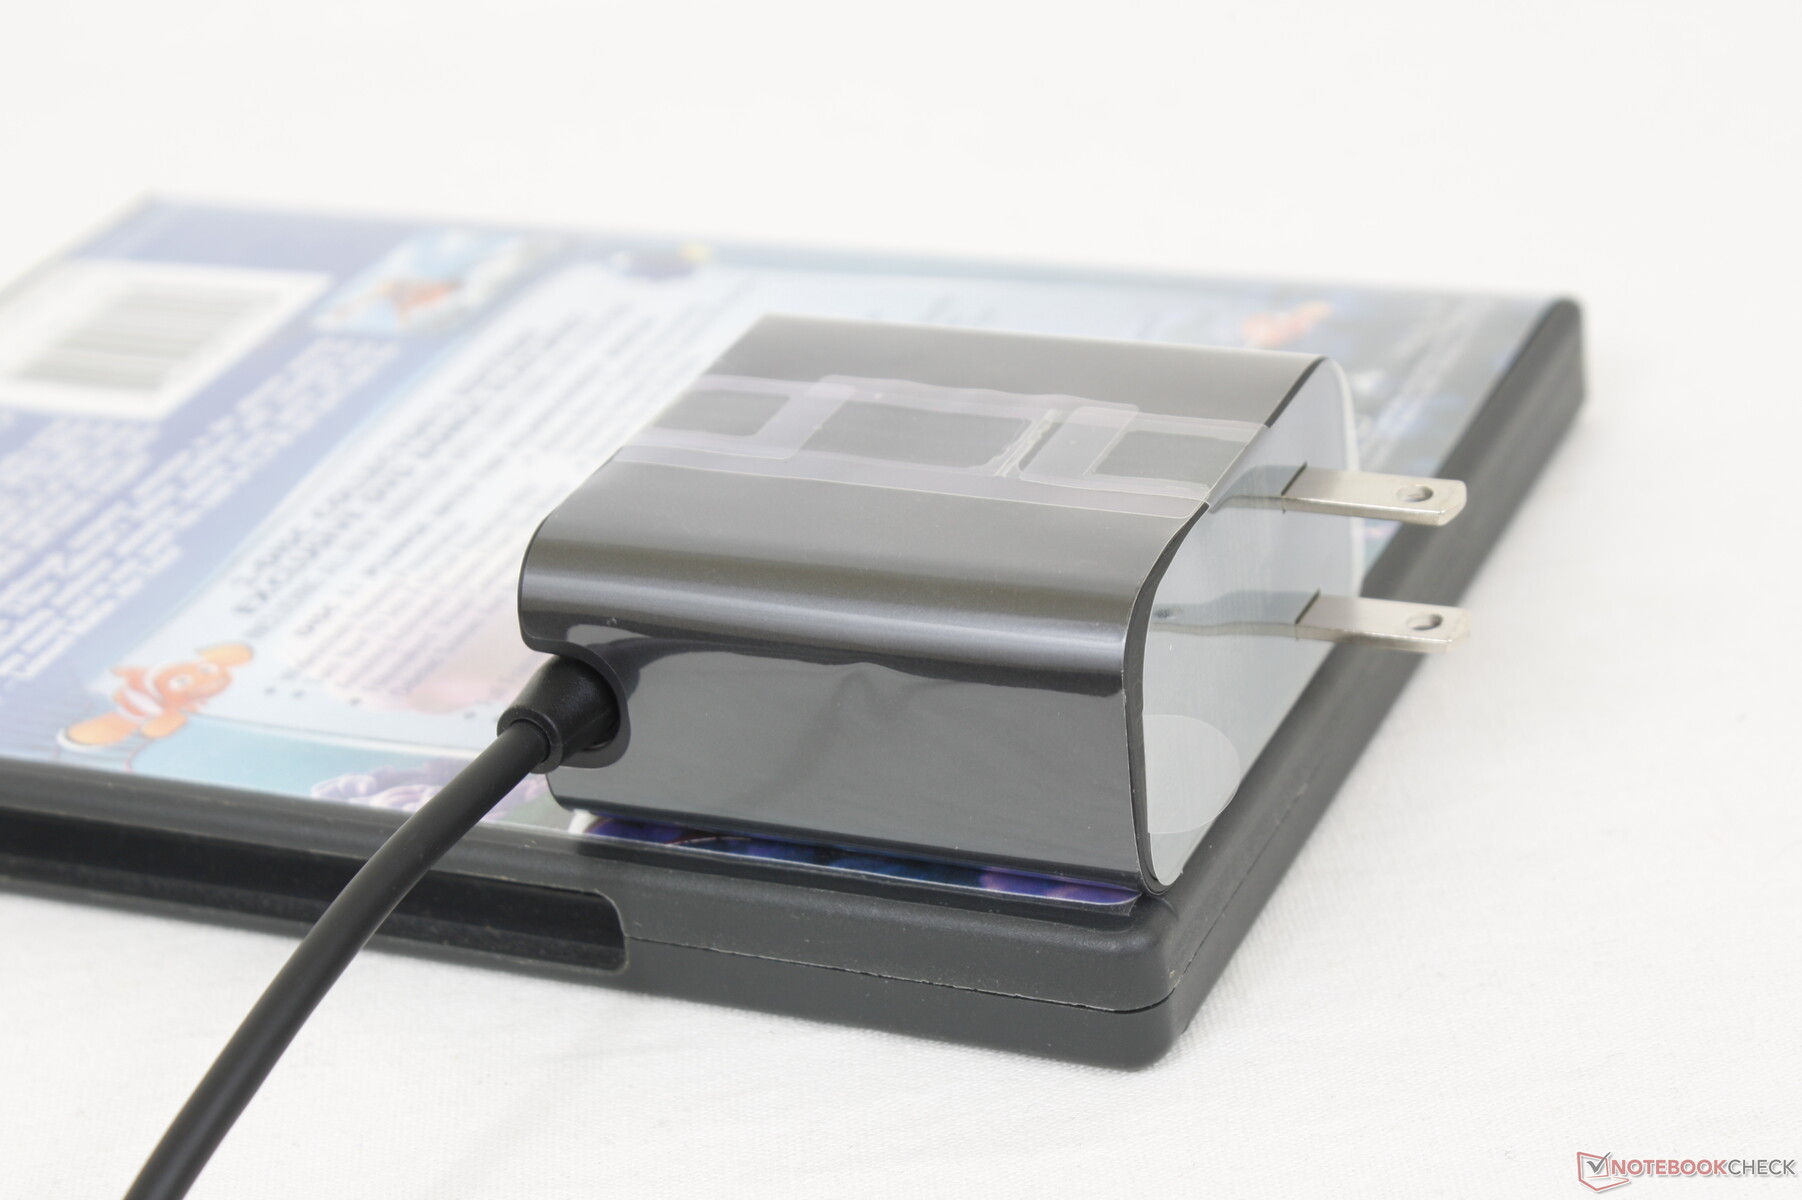
We're able to measure a maximum draw of 67 W from the small (5.6 x 5.6 x 2.9 cm) 65 W USB-C AC adapter. This rate is only temporary before falling by as much as 25 W as shown below due to the limited Turbo Boost potential of the system.
| Off / Standby | |
| Idle | |
| Load |
|
Key:
min: | |
| Lenovo Yoga 7 16IAP7 i7-1260P, Iris Xe G7 96EUs, Micron 2450 512GB MTFDKCD512TFK, IPS, 2560x1600, 16" | Huawei MateBook D 16 2022 i7-12700H, Iris Xe G7 96EUs, Silicon Motion PCIe-8 SSD, IPS, 1920x1200, 16" | Dell Inspiron 16 7620 2-in-1 i7-1260P, Iris Xe G7 96EUs, Toshiba KBG40ZNS512G NVMe, IPS, 1920x1200, 16" | Acer Swift X SFX16-51G-5388 i5-11320H, GeForce RTX 3050 4GB Laptop GPU, Samsung PM991 MZVLQ512HBLU, , 1920x1080, 16.1" | LG Gram 16 (2021) i7-1165G7, Iris Xe G7 96EUs, SK Hynix PC601 1TB HFS001TD9TNG, IPS, 2560x1600, 16" | Lenovo IdeaPad 5 Pro 16ACH R7 5800H, GeForce GTX 1650 Mobile, Micron 2300 512GB MTFDHBA512TDV, IPS LED, 2560x1600, 16" | |
|---|---|---|---|---|---|---|
| Power Consumption | -9% | 9% | -23% | 20% | -35% | |
| Idle Minimum * (Watt) | 6.6 | 6.1 8% | 5.3 20% | 7 -6% | 3.8 42% | 5.7 14% |
| Idle Average * (Watt) | 8.3 | 10.6 -28% | 8.3 -0% | 10.1 -22% | 9 -8% | 9.3 -12% |
| Idle Maximum * (Watt) | 9.8 | 11.5 -17% | 9.6 2% | 15 -53% | 11.3 -15% | 11 -12% |
| Load Average * (Watt) | 66 | 65.5 1% | 54.3 18% | 63.3 4% | 35.2 47% | 83.4 -26% |
| Witcher 3 ultra * (Watt) | 52 | 61.2 -18% | 43.9 16% | 63.3 -22% | 94.4 -82% | |
| Load Maximum * (Watt) | 67.1 | 68.4 -2% | 70 -4% | 94 -40% | 43.5 35% | 128.7 -92% |
* ... smaller is better
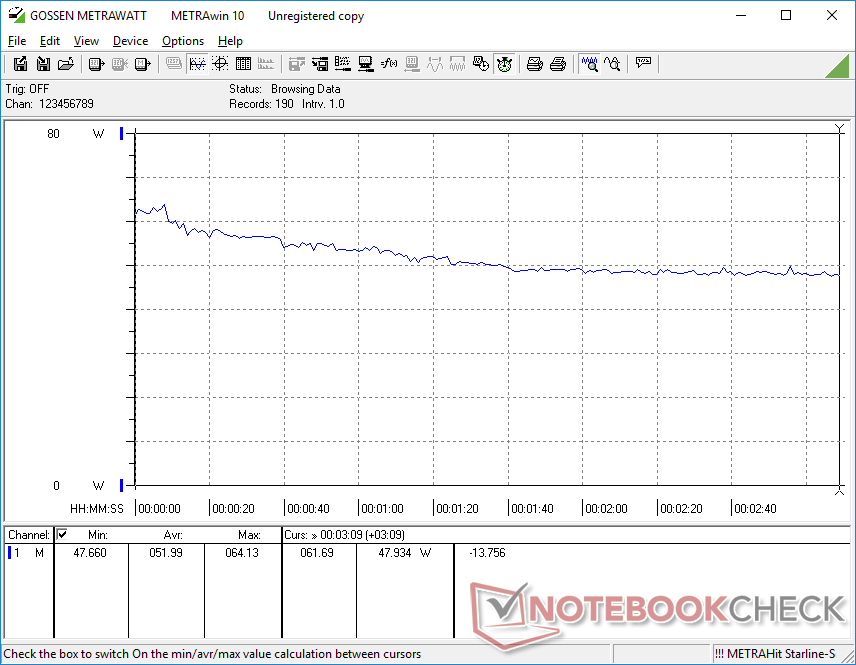
Power Consumption Witcher 3 / Stresstest
Power Consumption external Monitor
Battery Life
We're able to record just under 8 hours of real-world WLAN use from the internal 71 Wh battery whereas the Inspiron 16 7620 or LG Gram 16 can last for several hours longer. It's worth noting that Yoga 7 16 SKUs with the discrete Intel Arc option have a much larger 99 Wh battery. 8 hours should nonetheless be manageable for most users.
Charging from empty to full capacity takes about 90 minutes.
| Lenovo Yoga 7 16IAP7 i7-1260P, Iris Xe G7 96EUs, 71 Wh | Huawei MateBook D 16 2022 i7-12700H, Iris Xe G7 96EUs, 60 Wh | Dell Inspiron 16 7620 2-in-1 i7-1260P, Iris Xe G7 96EUs, 87 Wh | Acer Swift X SFX16-51G-5388 i5-11320H, GeForce RTX 3050 4GB Laptop GPU, 58.7 Wh | LG Gram 16 (2021) i7-1165G7, Iris Xe G7 96EUs, 80 Wh | Lenovo IdeaPad 5 Pro 16ACH R7 5800H, GeForce GTX 1650 Mobile, 75 Wh | |
|---|---|---|---|---|---|---|
| Battery runtime | -10% | 64% | -9% | 120% | 24% | |
| Reader / Idle (h) | 12.2 | 17 39% | 28.6 134% | |||
| WiFi v1.3 (h) | 7.9 | 7.1 -10% | 14.6 85% | 8.1 3% | 15.7 99% | 12.6 59% |
| Load (h) | 1.9 | 3.2 68% | 1.5 -21% | 4.3 126% | 1.7 -11% | |
| H.264 (h) | 8.4 | 20.1 | 10.4 | |||
| Gaming (h) | 1.1 |
Pros
Cons
Verdict — Quality Convertible If You Don't Mind The Weight
The three 16-inch convertibles to choose from at the moment are the Lenovo Yoga 7 16 Gen 7, Dell Inspiron 16 7620 2-in-1, and the LG Gram 16 2-in-1. The Lenovo is unique is that it offers discrete Intel Arc A370M graphics while the Dell offers discrete GeForce MX550 graphics. If your workloads can benefit from the extra graphics horsepower, then the Lenovo and Dell are essentially neck-to-neck. The smaller differences like RAM (soldered vs. upgradeable on the Dell) or touchscreen (1600p at 400 nits vs. 1200p at 300 nits or 2400p at 400 nits on the Dell) are down to user preferences. It's too bad that neither model have 90 Hz or 120 Hz display options which can make all the difference in terms of responsiveness and UI fluidity.
The Lenovo Yoga 7 16 Gen 7 is strong and with plenty of features including optional Intel Arc graphics. However, its hefty 2 kg weight makes tablet mode more cumbersome in most situations than the lighter LG Gram 16 2-in-1.
If you can live with integrated Iris Xe graphics, then much of the appeal of the Lenovo goes down the drain because the LG Gram 16 2-in-1 is 28 percent lighter while offering the same resolution touchscreen and the same 2x Thunderbolt 4 ports. It even has deeper colors, longer battery life, support for two internal SSDs, and an included active stylus free of charge. The Lenovo is certainly built stronger, but the savings in weight and the advantages elsewhere on the LG model make it worth a close look if you're considering the Lenovo.
Price and Availability
The Lenovo Yoga 7 16IAP7 is now shipping at Best Buy with the Core i7-1260P CPU starting at $1430 USD. Alternatively, users can purchase directly from Lenovo where more SKUs are available including the Intel Arc A370M GPU for $1400.
Lenovo Yoga 7 16IAP7
- 08/03/2022 v7 (old)
Allen Ngo
More articles related to this device
Lenovo Yoga 7 16IAP7 (Yoga 7 Series)Related Articles


Price comparison
