LG Gram 16 16T90P Convertible Review: Lighter Than Most 15.6-inch Laptops
LG announced two 16-inch Gram laptops at CES 2021: the Gram 16 clamshell and the Gram 16 convertible each powered by the latest Intel 11th gen Tiger Lake-U CPUs. The unit we'll be looking at today is the Gram 16 convertible which is notable for being one of the first 16:10 2-in-1 laptops in its size class. The system doesn't come cheap at around $1600+ USD retail despite its lack of any discrete graphics options.
Direct competitors are few and far between at the moment. Thus, we'll be comparing the Gram 16 2-in-1 to flagship more well-known 15.6-inch convertibles instead like the Dell XPS 15 2-in-1, HP Spectre x360 15, Asus ZenBook 15 Flip, or the Lenovo Yoga C940 15.
More LG reviews:
potential competitors in comparison
Rating | Date | Model | Weight | Height | Size | Resolution | Price |
|---|---|---|---|---|---|---|---|
| 85.8 % v7 (old) | 04 / 2021 | LG Gram 16 2-in-1 16T90P i7-1165G7, Iris Xe G7 96EUs | 1.5 kg | 17 mm | 16.00" | 2560x1600 | |
| 84.1 % v7 (old) | 03 / 2021 | Honor MagicBook Pro 10210U i5-10210U, GeForce MX350 | 1.7 kg | 16.9 mm | 16.10" | 1920x1080 | |
| 89.7 % v7 (old) | 12 / 2019 | Apple MacBook Pro 16 2019 i9 5500M i9-9880H, Radeon Pro 5500M | 2 kg | 16.2 mm | 16.00" | 3072x1920 | |
| 86.8 % v7 (old) | 05 / 2020 | Dell XPS 15 9500 Core i5 i5-10300H, UHD Graphics 630 | 1.8 kg | 18 mm | 15.60" | 1920x1200 | |
| 85 % v7 (old) | 01 / 2020 | HP Spectre X360 15-5ZV31AV i7-10510U, GeForce MX250 | 2.1 kg | 19.3 mm | 15.60" | 3840x2160 | |
| 87 % v7 (old) | 12 / 2020 | Asus ZenBook UX535-M01440 i7-10750H, GeForce GTX 1650 Ti Max-Q | 2 kg | 20 mm | 15.60" | 3840x2160 |
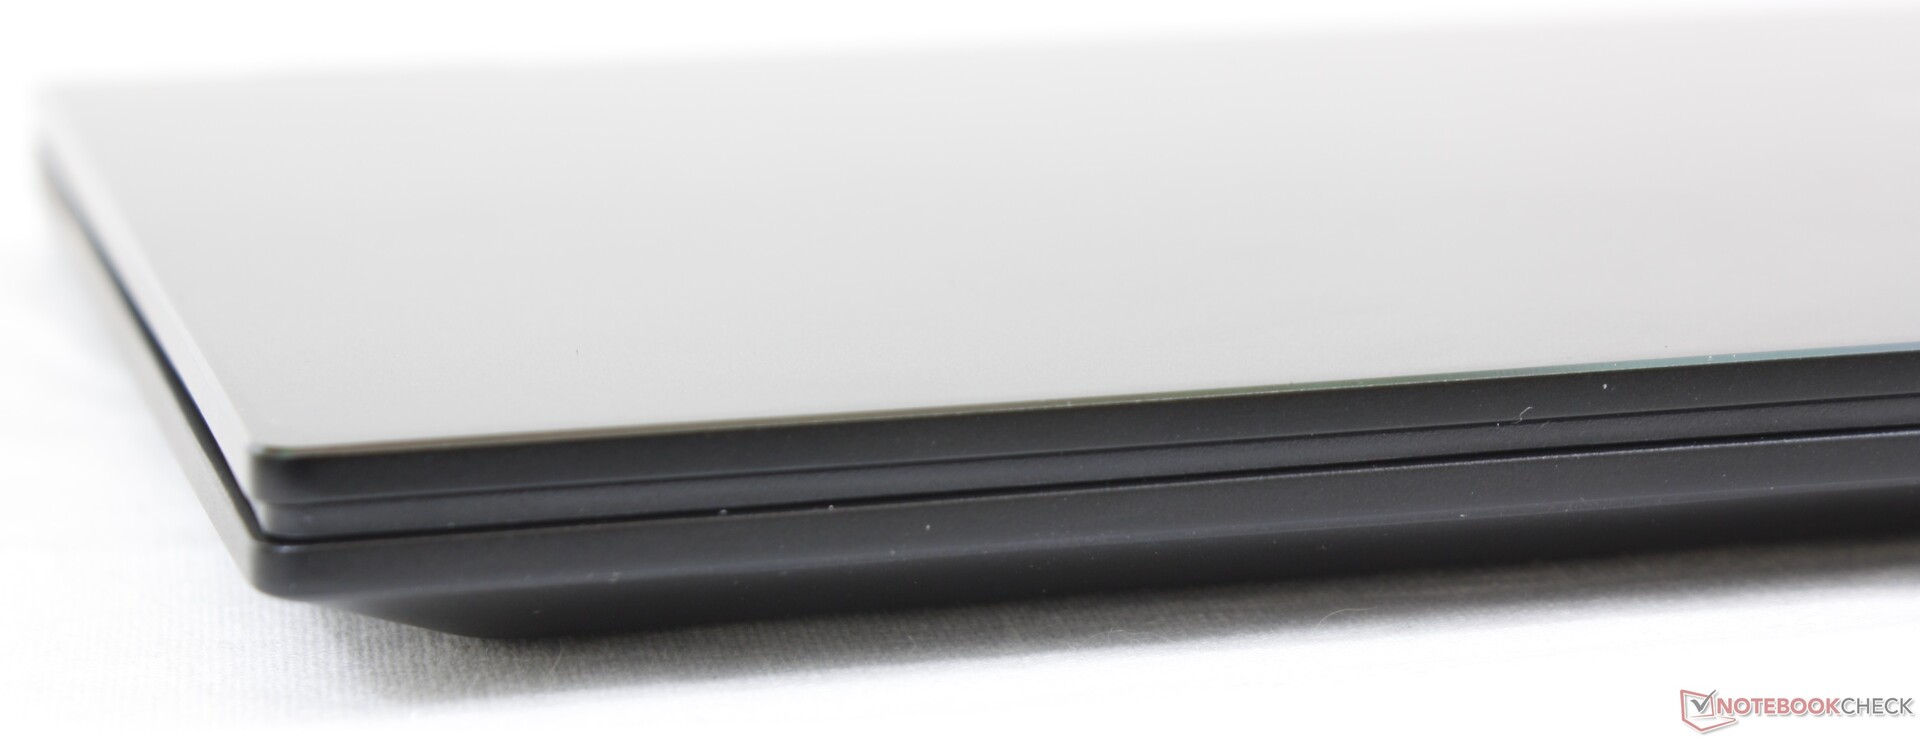
Case
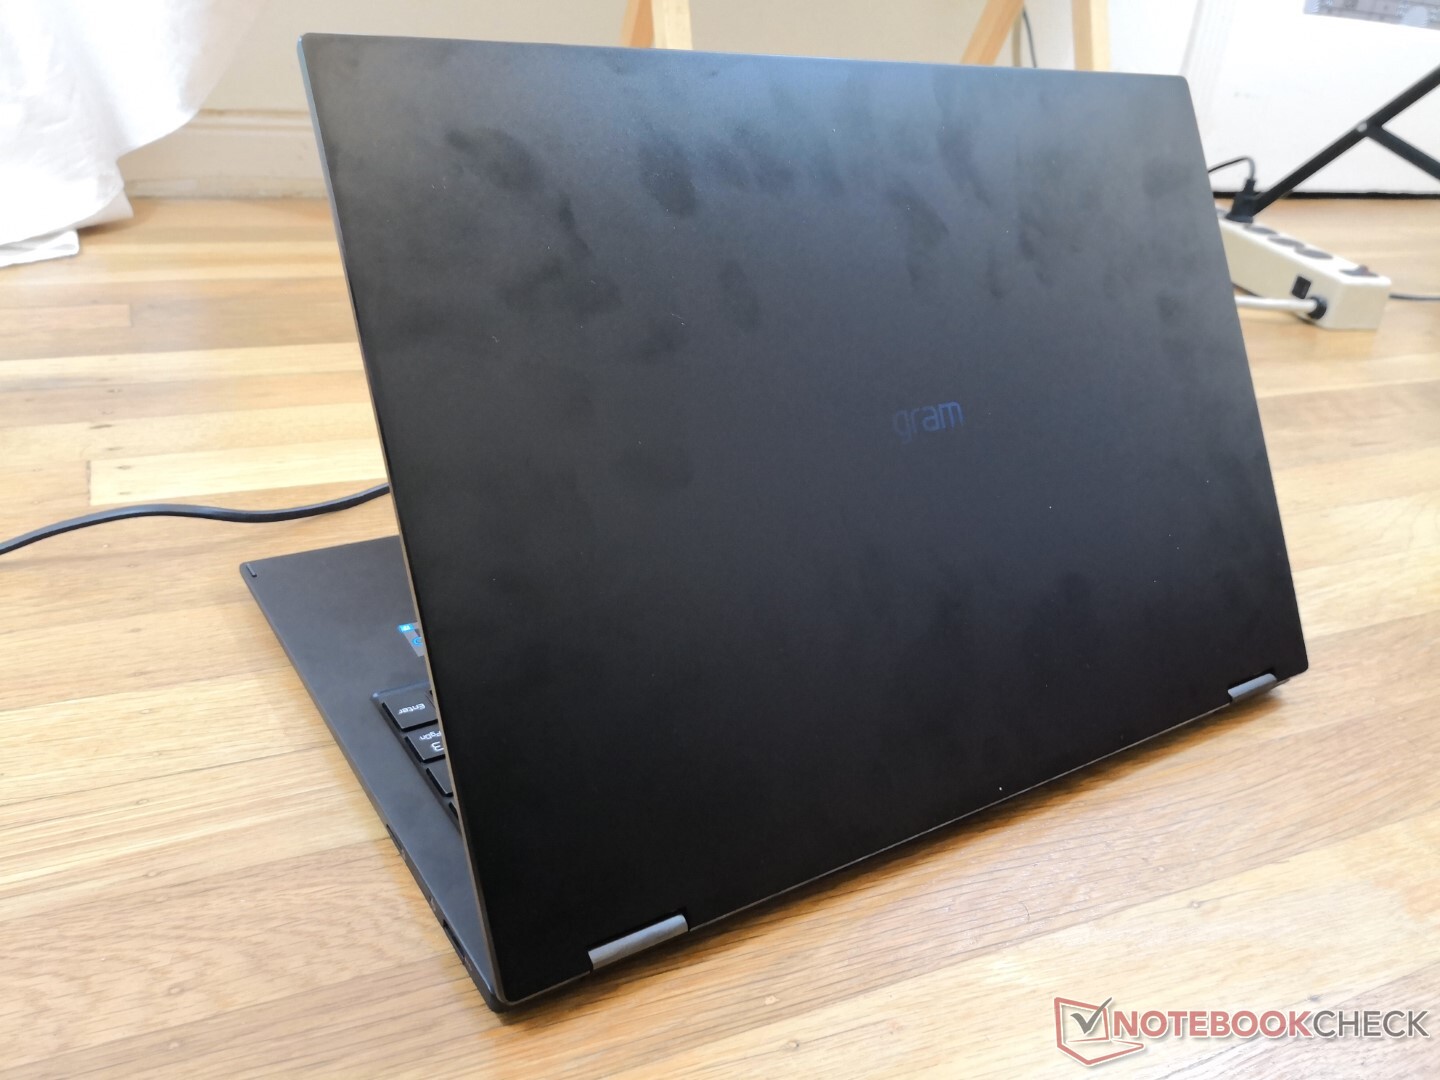
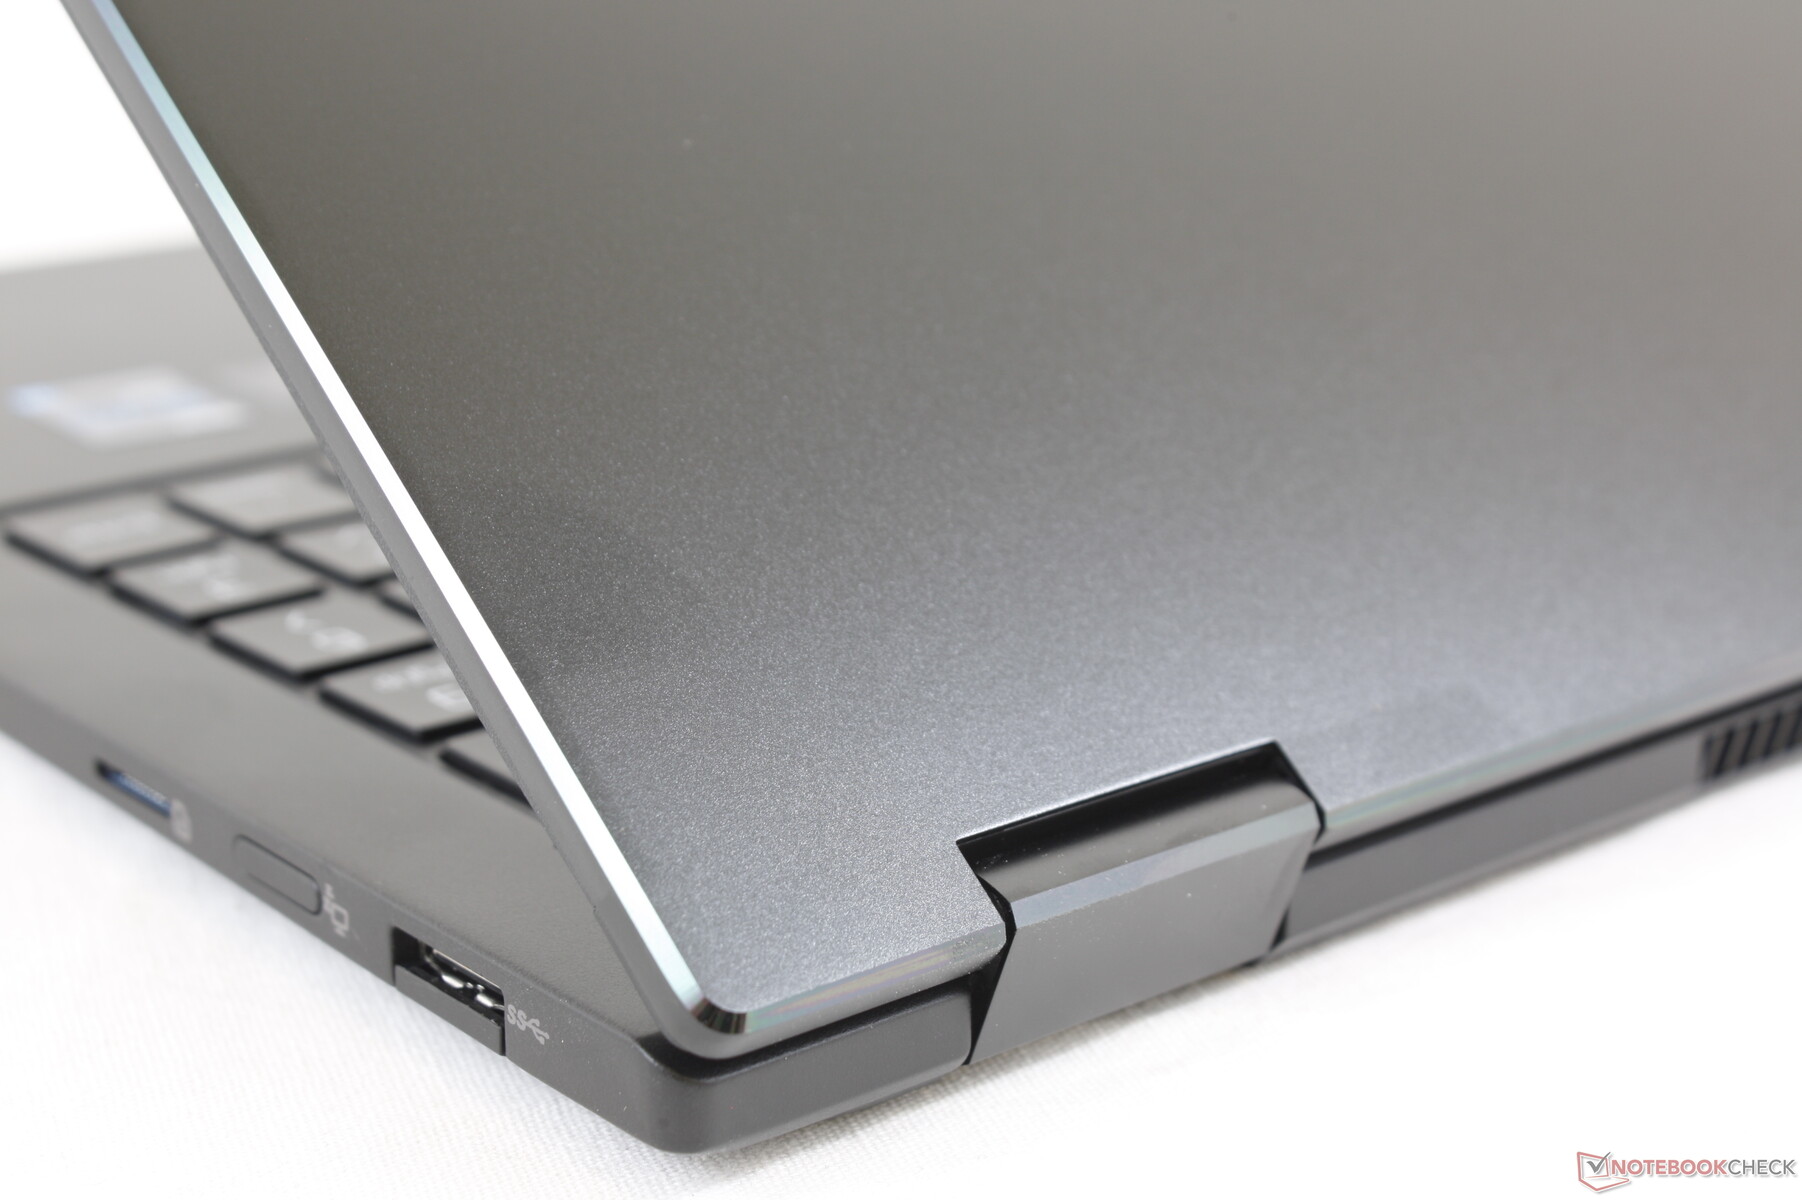
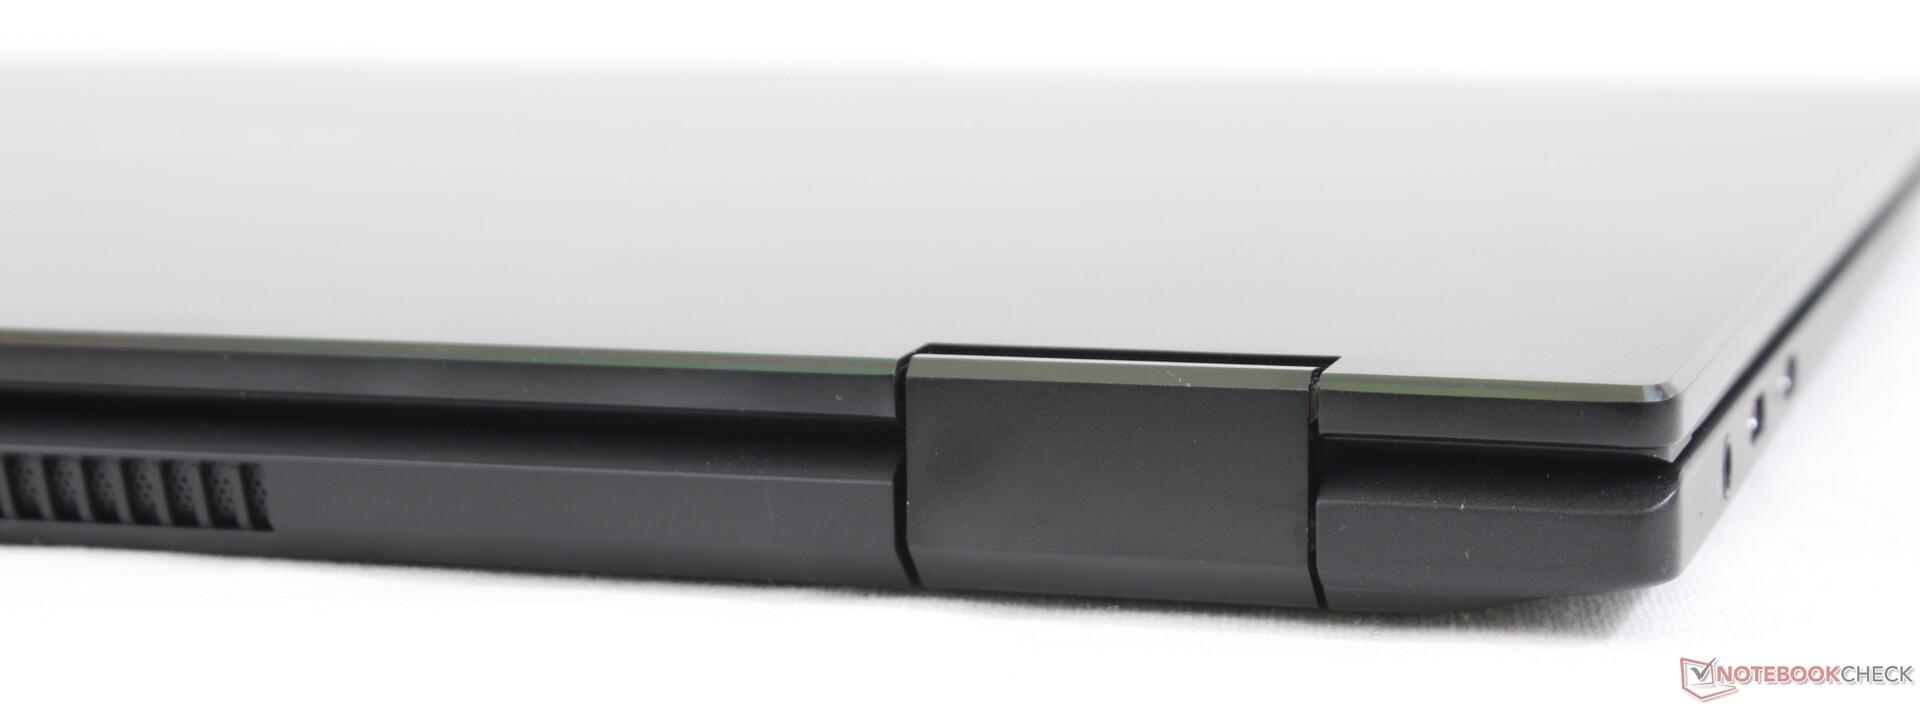
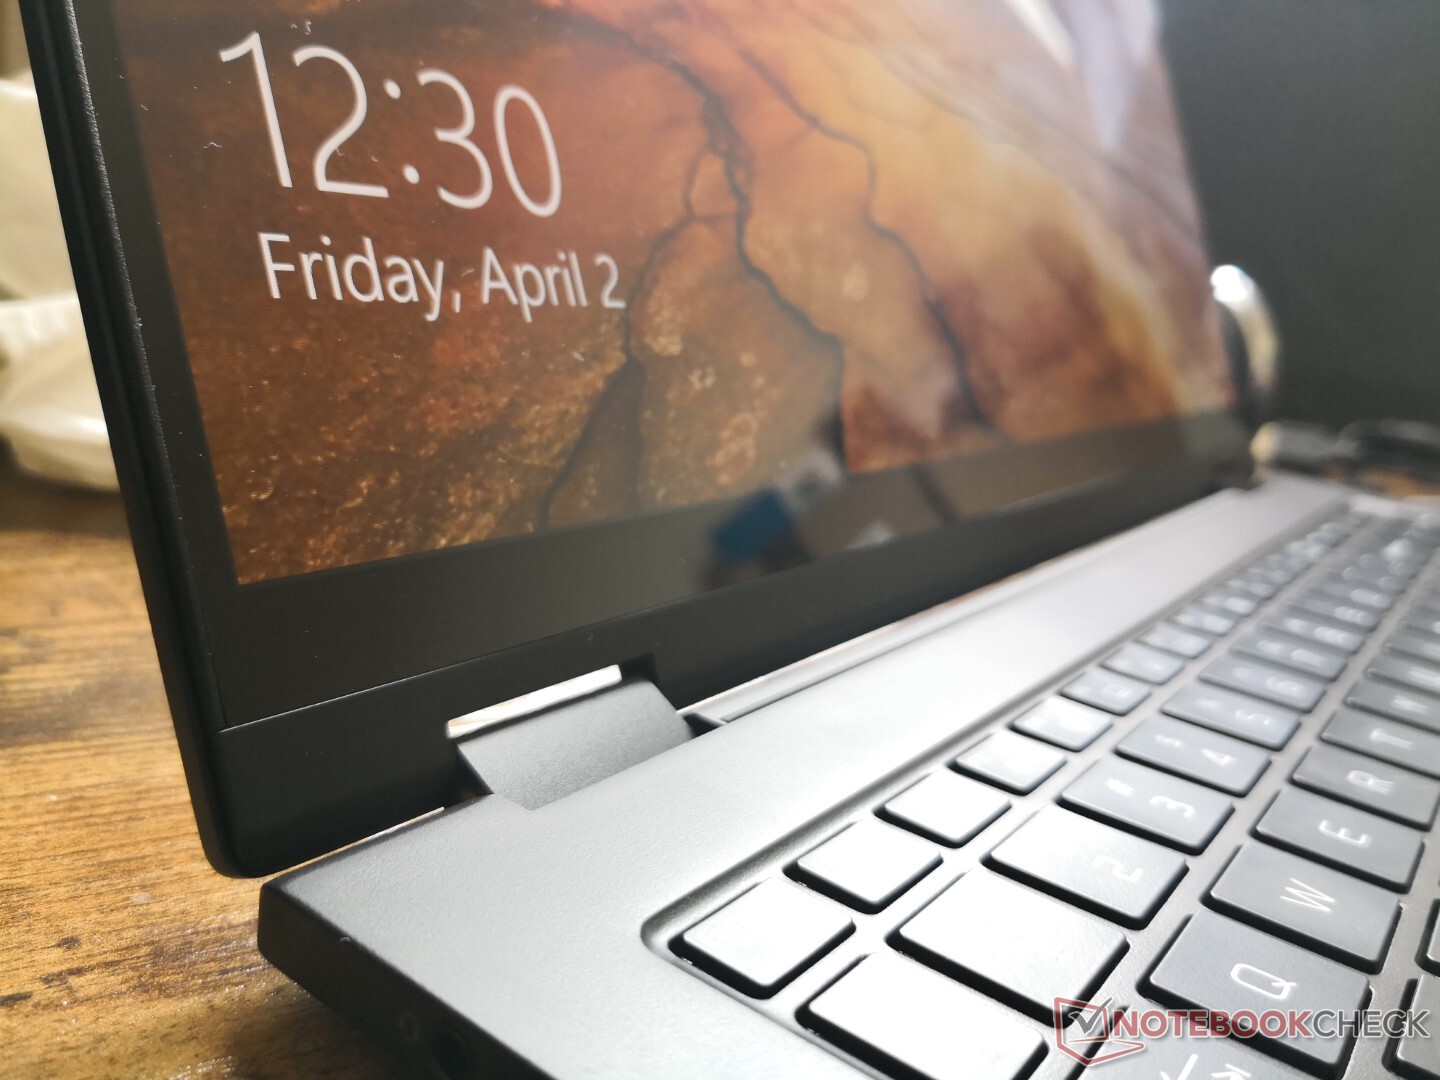
The metal chassis looks good, but it's a couple of steps down from the similarly priced HP Spectre or Dell XPS. The base, for example, is more susceptible to twisting and creaking while the lid flexes more easily. The two hinges in particular are probably the weakest aspect of the otherwise sleek chassis because they do a poor job at preventing the lid from teetering in laptop mode. First impressions are therefore excellent from a distance and just average when switching between modes.
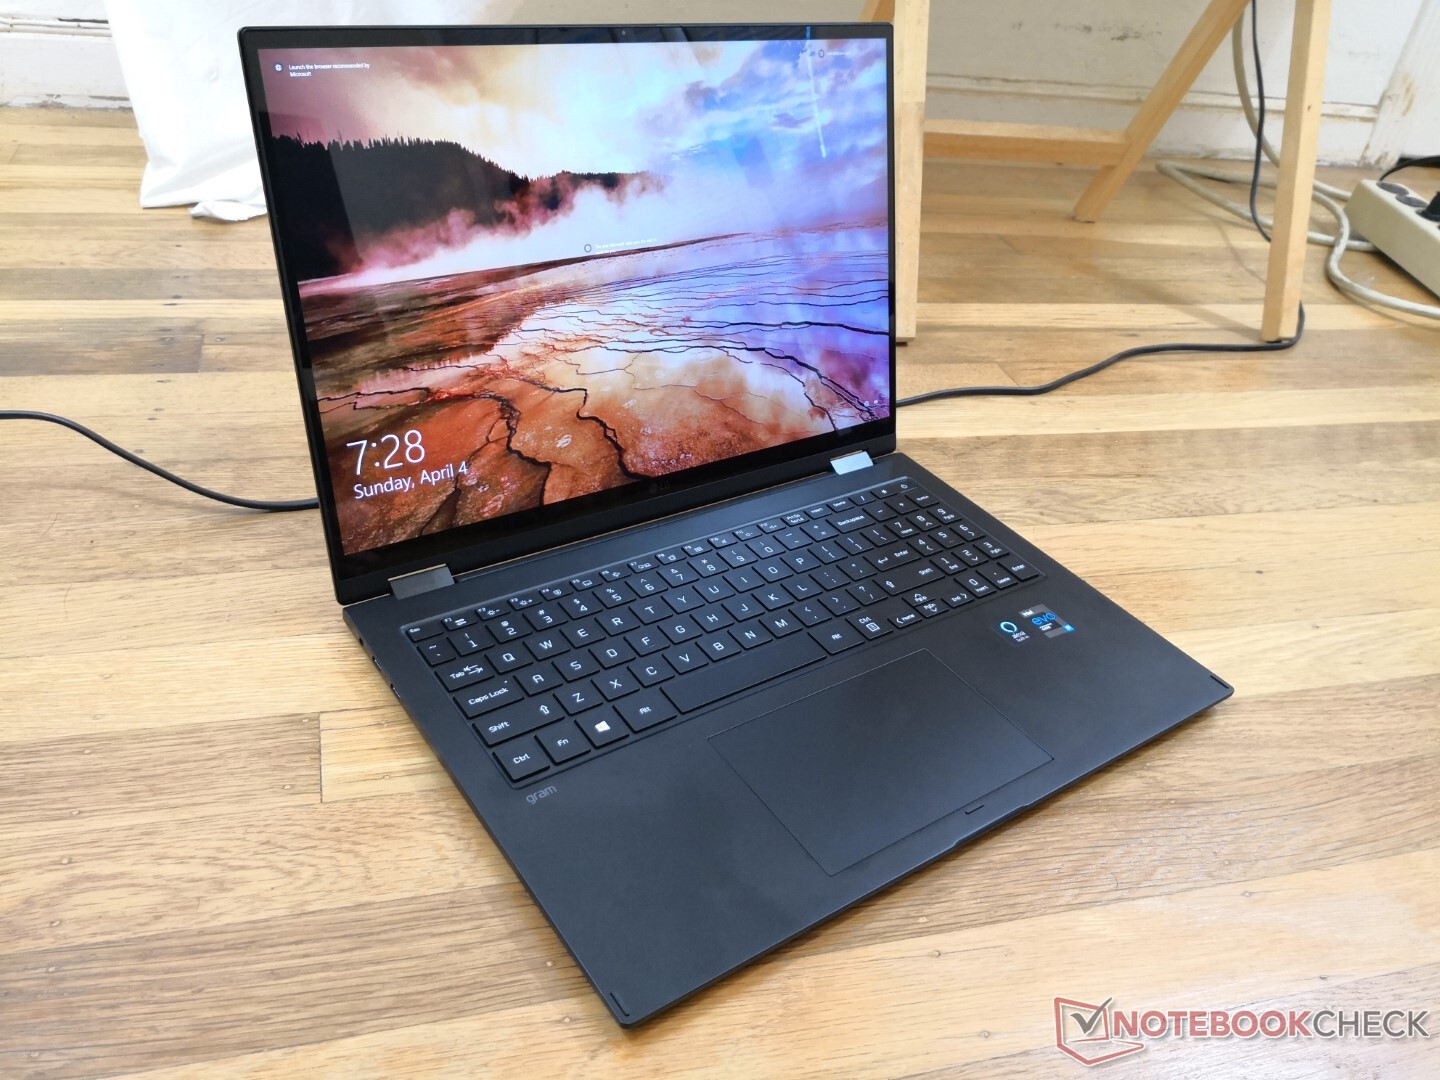
The LG is much lighter than most 15.6-inch laptops or convertibles despite its larger 16-inch screen size. The Spectre x360 15, for example, is well over half a kilogram heavier. Overall dimensions are very similar to the MacBook Pro 16 albeit a hair thicker.

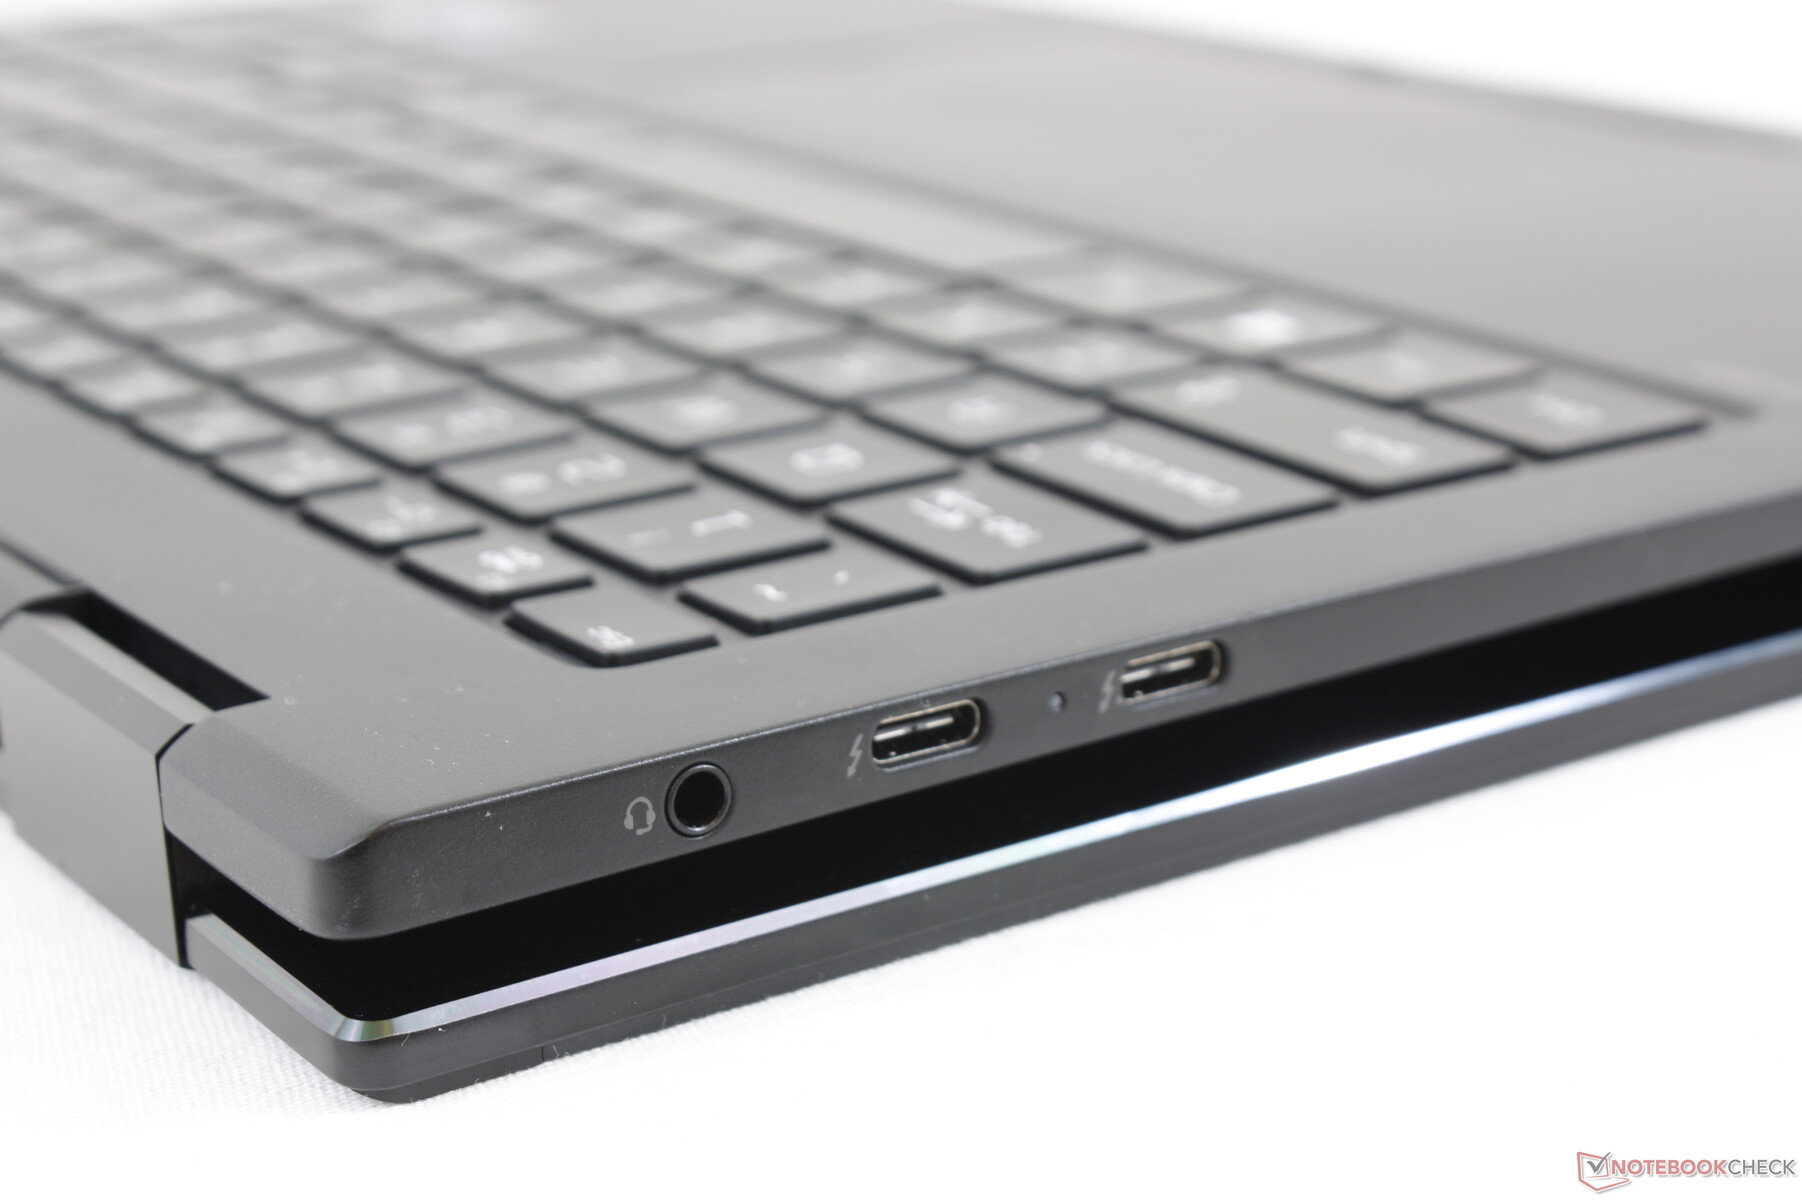
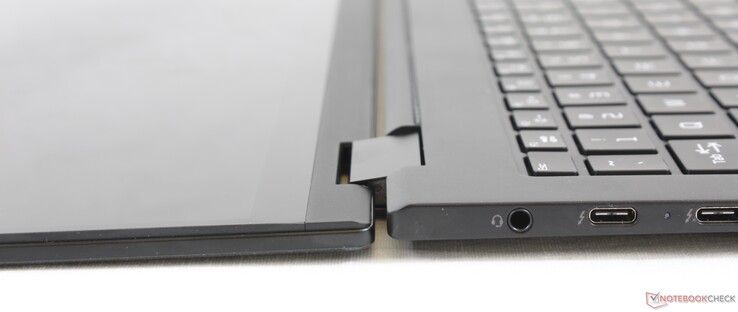
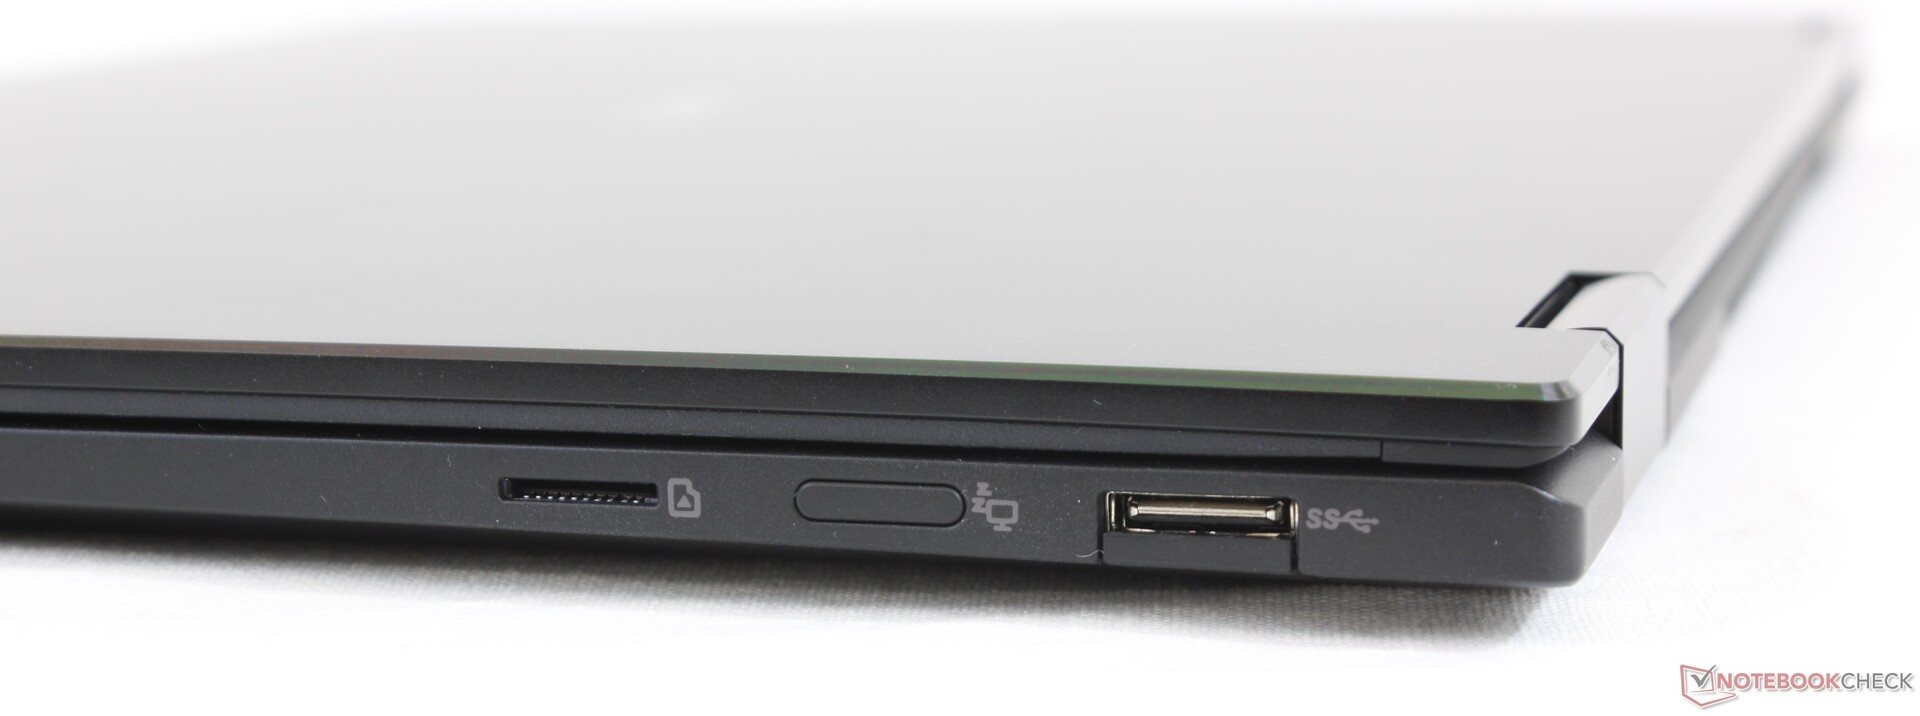
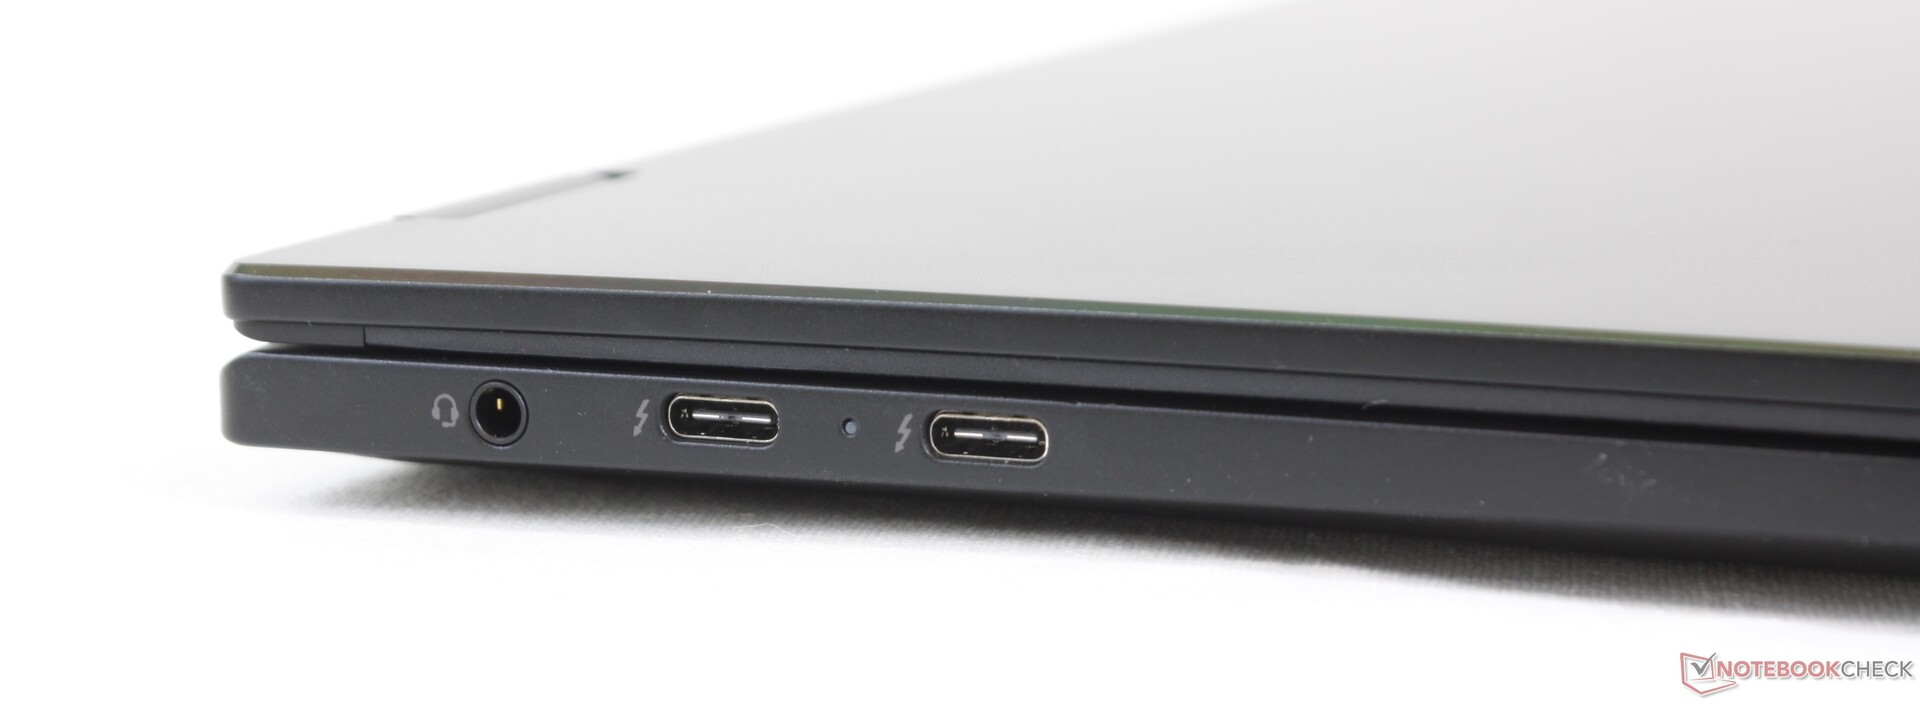
Connectivity
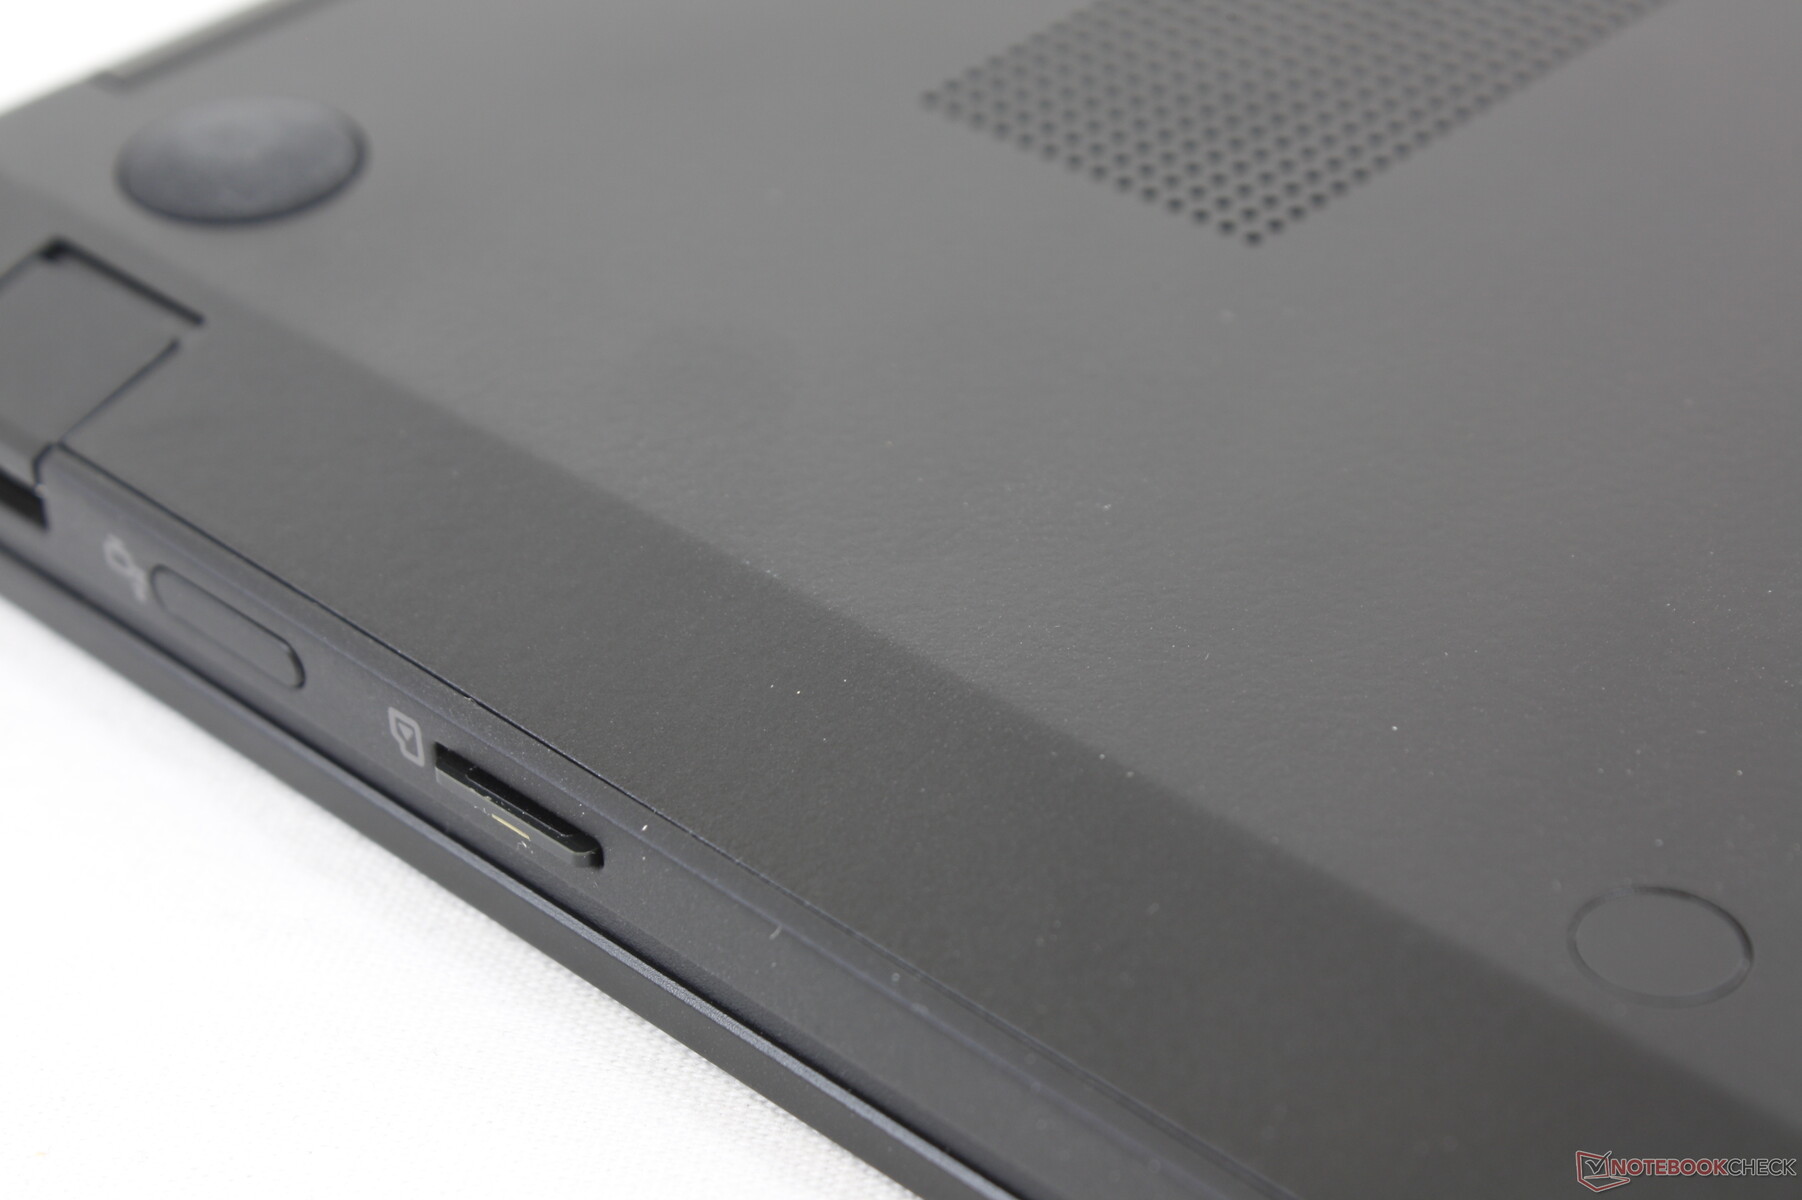
Port options are decent for a 16-inch form factor. To make the most of the system, however, owners will have to invest in USB-C adapters or docking stations. Keep in mind that the USB-A port along the right edge is covered by a flap which can be difficult to open up without first lifting the whole laptop.
External graphics is supported via Thunderbolt 4 to turn the Gram 16 into a powerhouse should users decide to go down that route.
SD Card Reader
Transfer rates from the spring-loaded MicroSD card reader are similar to the card readers on previous Gram laptops to suggest that LG has made no changes or improvements here. For such an expensive laptop, we were hoping for faster speeds like on the XPS 15 or XPS 13 where MicroSD card transfer rates are two to three times faster.
| SD Card Reader | |
| average JPG Copy Test (av. of 3 runs) | |
| Dell XPS 15 9500 Core i5 (Toshiba Exceria Pro SDXC 64 GB UHS-II) | |
| HP Spectre X360 15-5ZV31AV (Toshiba Exceria Pro M501 UHS-II) | |
| LG Gram 16 2-in-1 16T90P (Toshiba Exceria Pro M501 UHS-II) | |
| Asus ZenBook UX535-M01440 (Toshiba Exceria Pro M501 microSDXC 64GB) | |
| maximum AS SSD Seq Read Test (1GB) | |
| Dell XPS 15 9500 Core i5 (Toshiba Exceria Pro SDXC 64 GB UHS-II) | |
| HP Spectre X360 15-5ZV31AV (Toshiba Exceria Pro M501 UHS-II) | |
| LG Gram 16 2-in-1 16T90P (Toshiba Exceria Pro M501 UHS-II) | |
| Asus ZenBook UX535-M01440 (Toshiba Exceria Pro M501 microSDXC 64GB) | |
Communication
Wi-Fi 6 and Bluetooth 5.1 are provided by a soldered Intel AX201 module. We experienced no connectivity issues when paired to our Netgear RAX200 test router.
Webcam

")
")
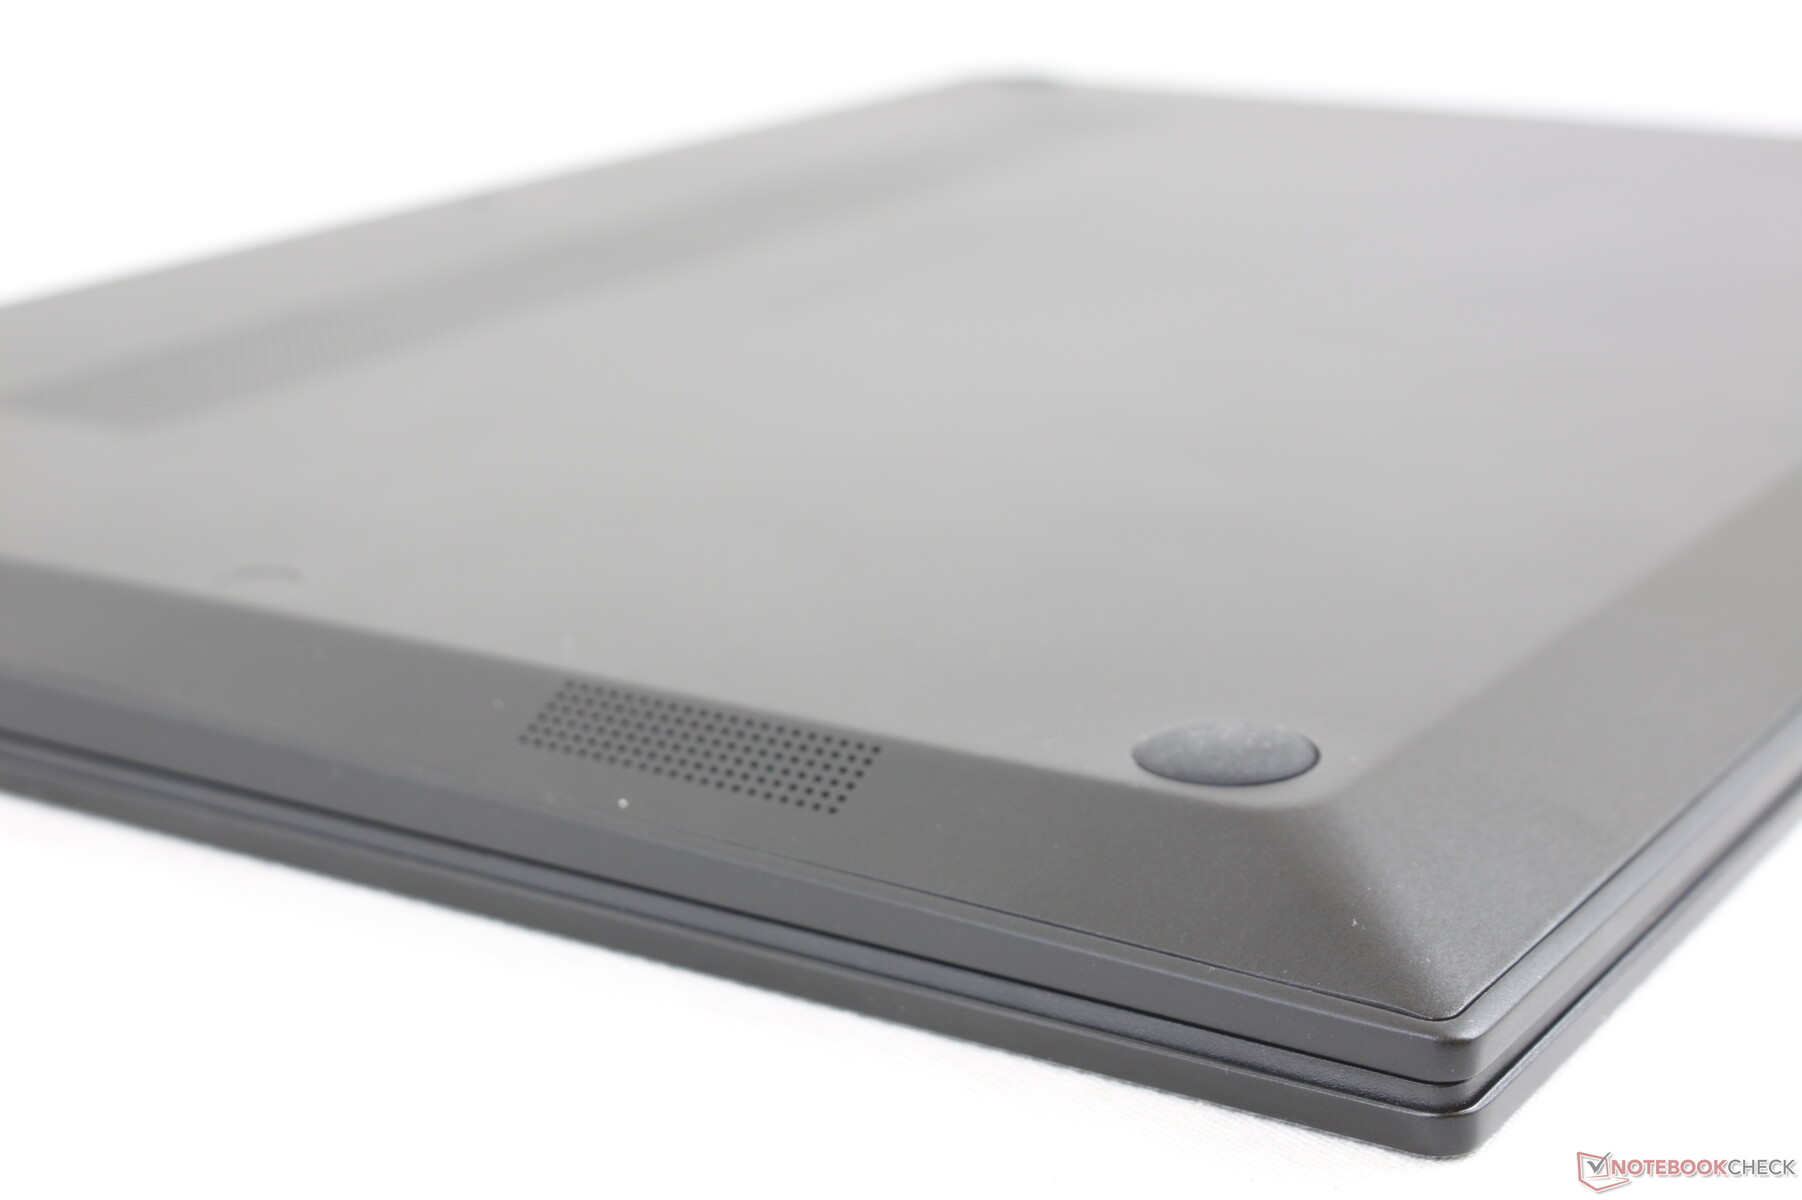
Maintenance
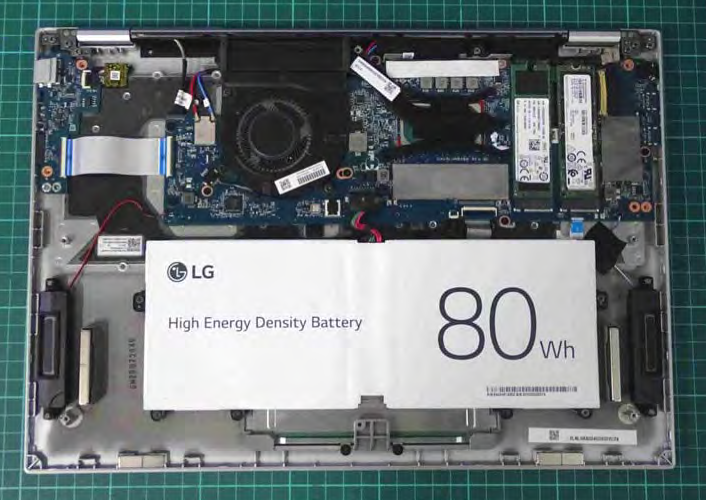
Like all Gram laptops before it, the Gram 16 2-in-1 is not easily serviceable. The screws on the bottom are covered beneath stickers and glued rubber feet to dissuade user upgrades. This is a shame because the system comes with two M.2 2280 slots that owners could have easily exploited for additional storage.
The United States FCC has several images of the laptop motherboard available to the public.
Accessories and Warranty
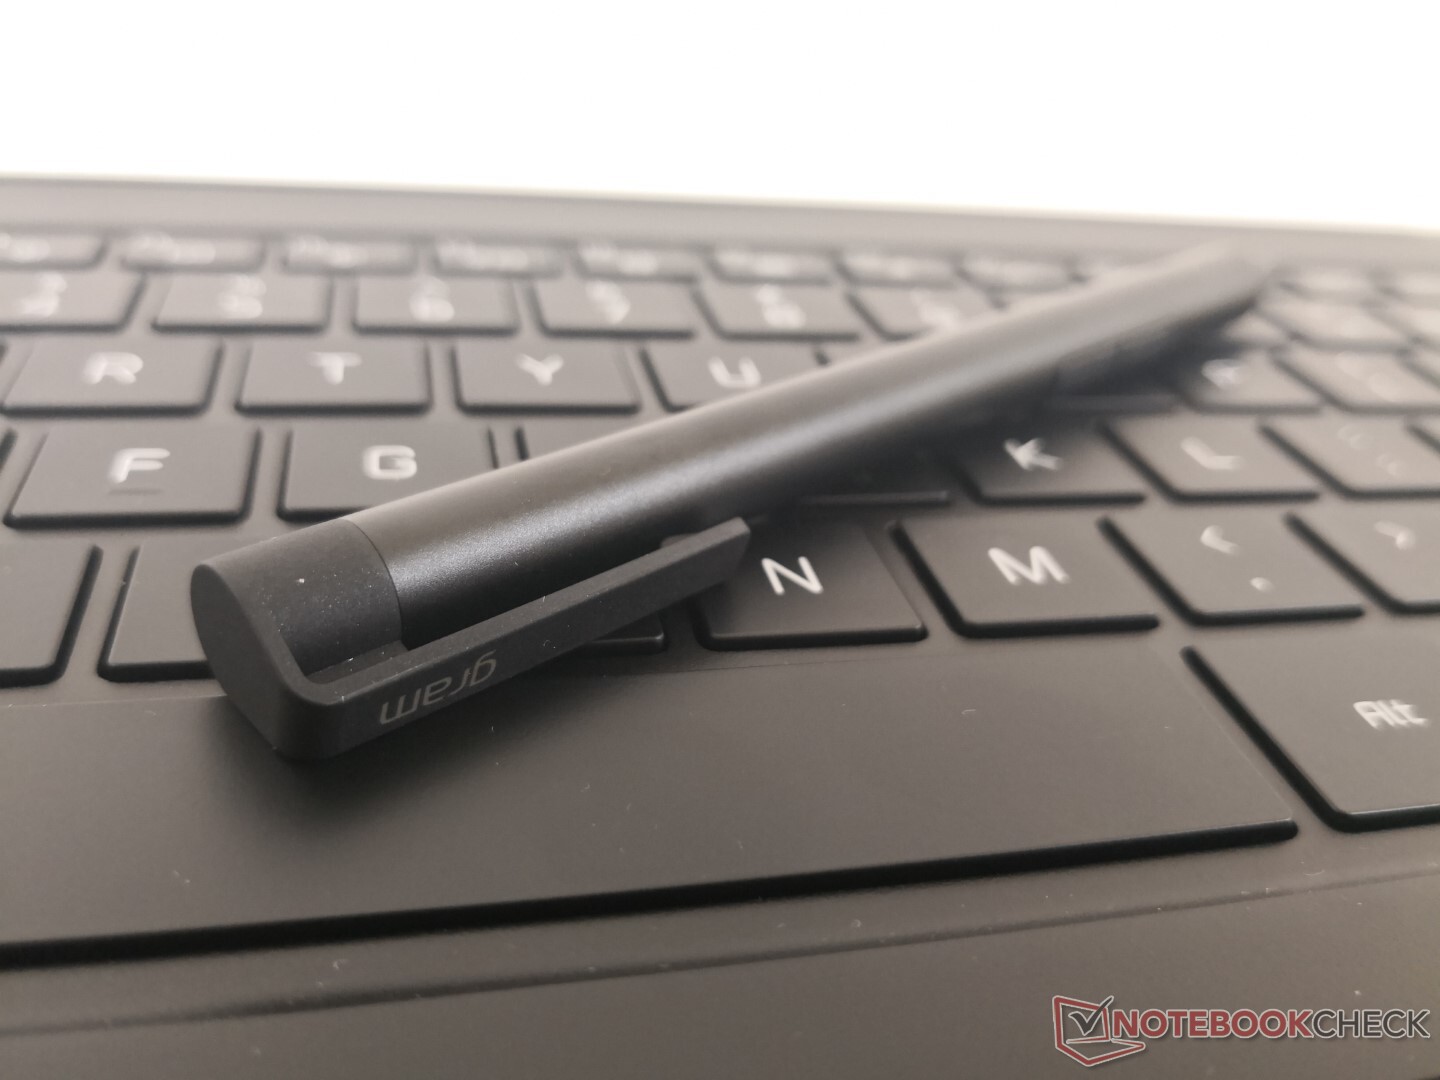
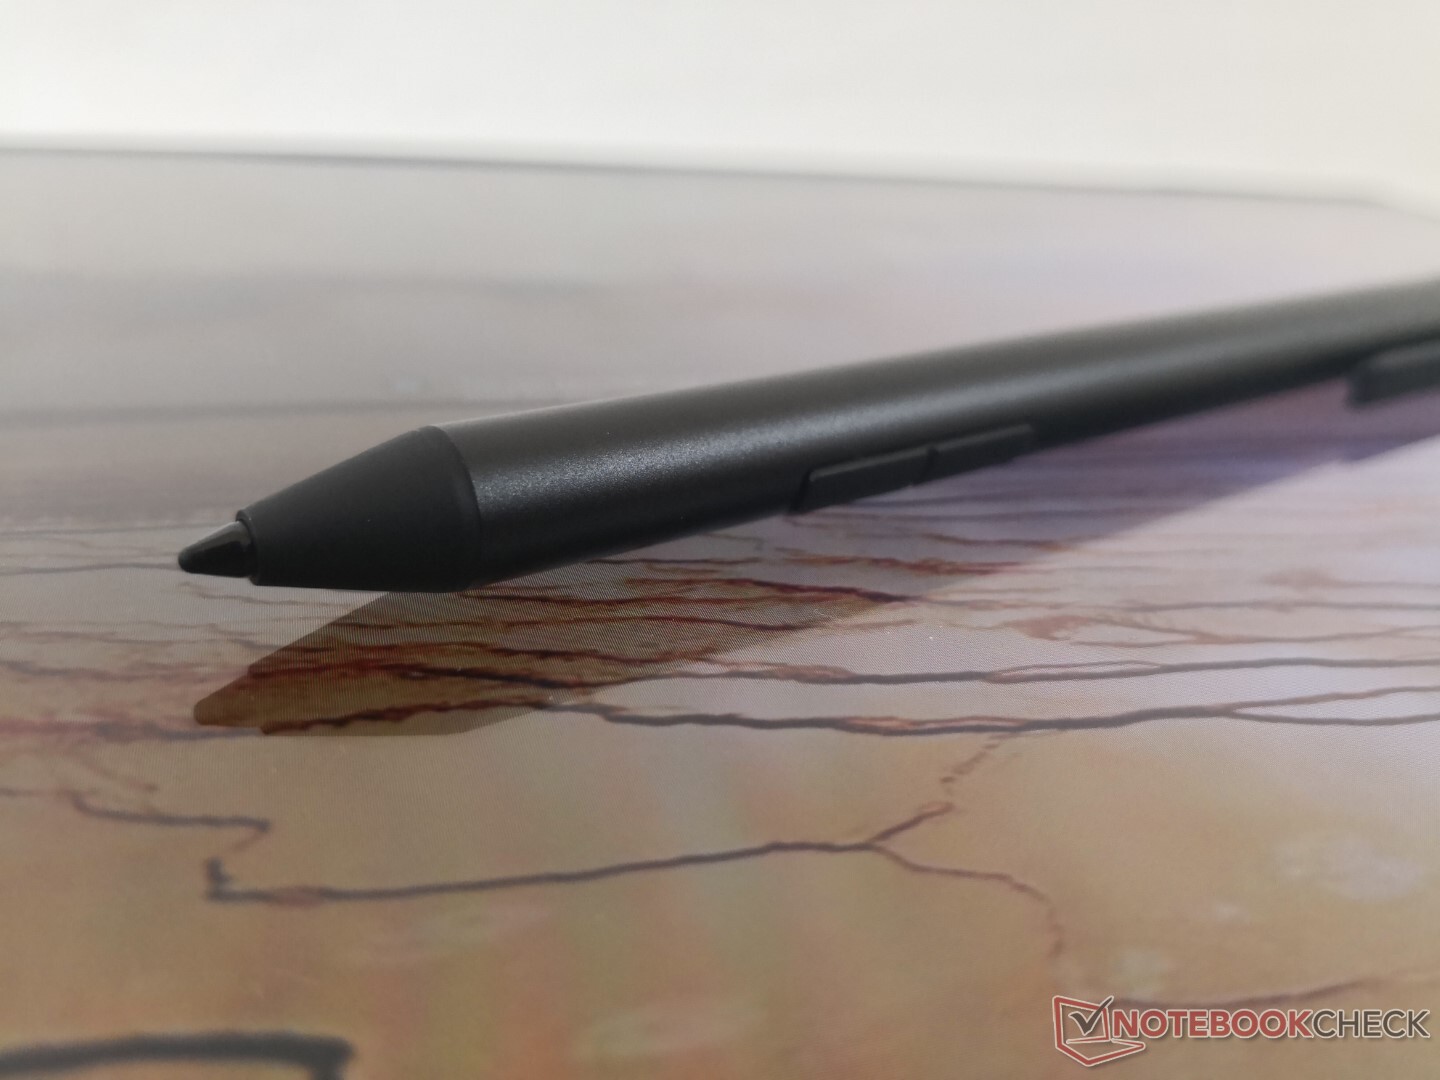
The box includes a USB-C to HDMI adapter and an active stylus pen (ESP-201-21A-5) with battery and two extra pen tips. A cleaning cloth would have been a nice extra.
The standard one-year limited manufacturer warranty applies.
Input Devices
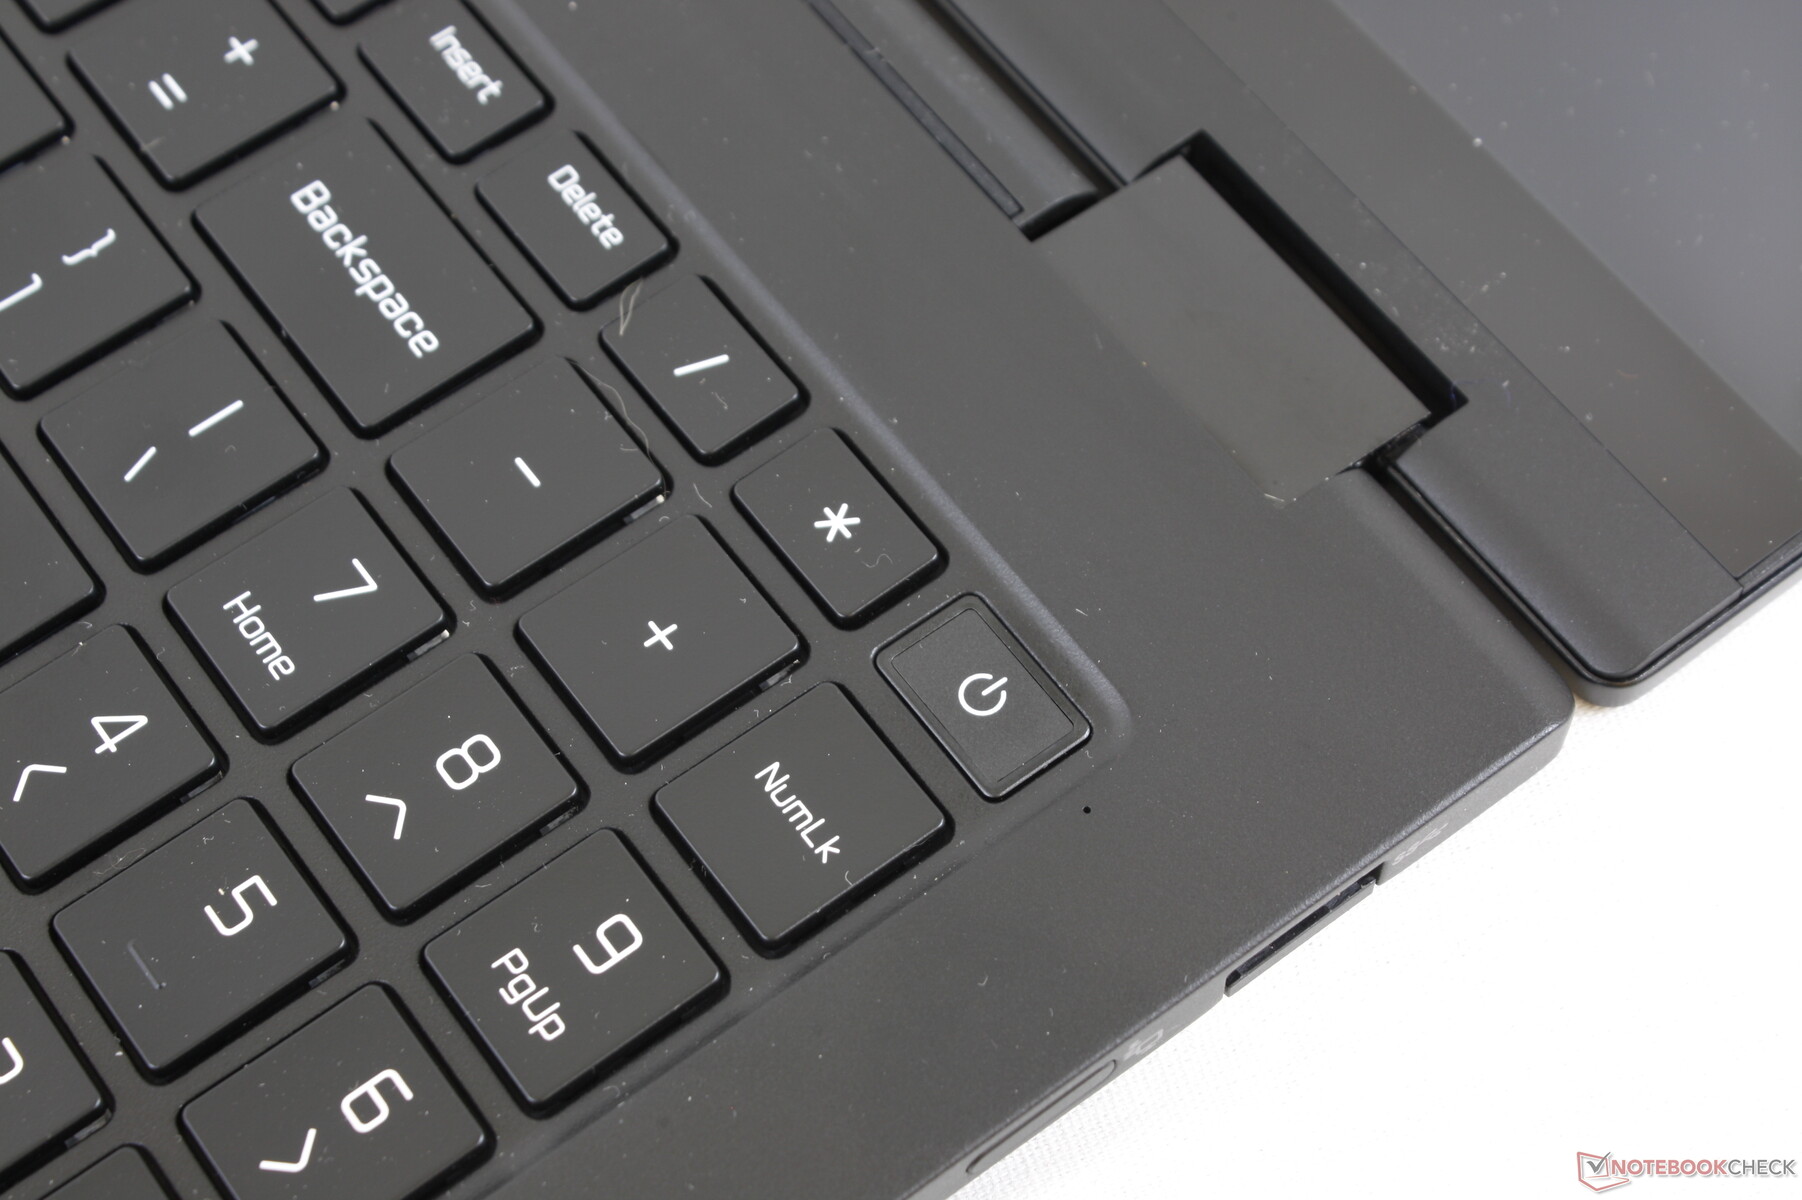
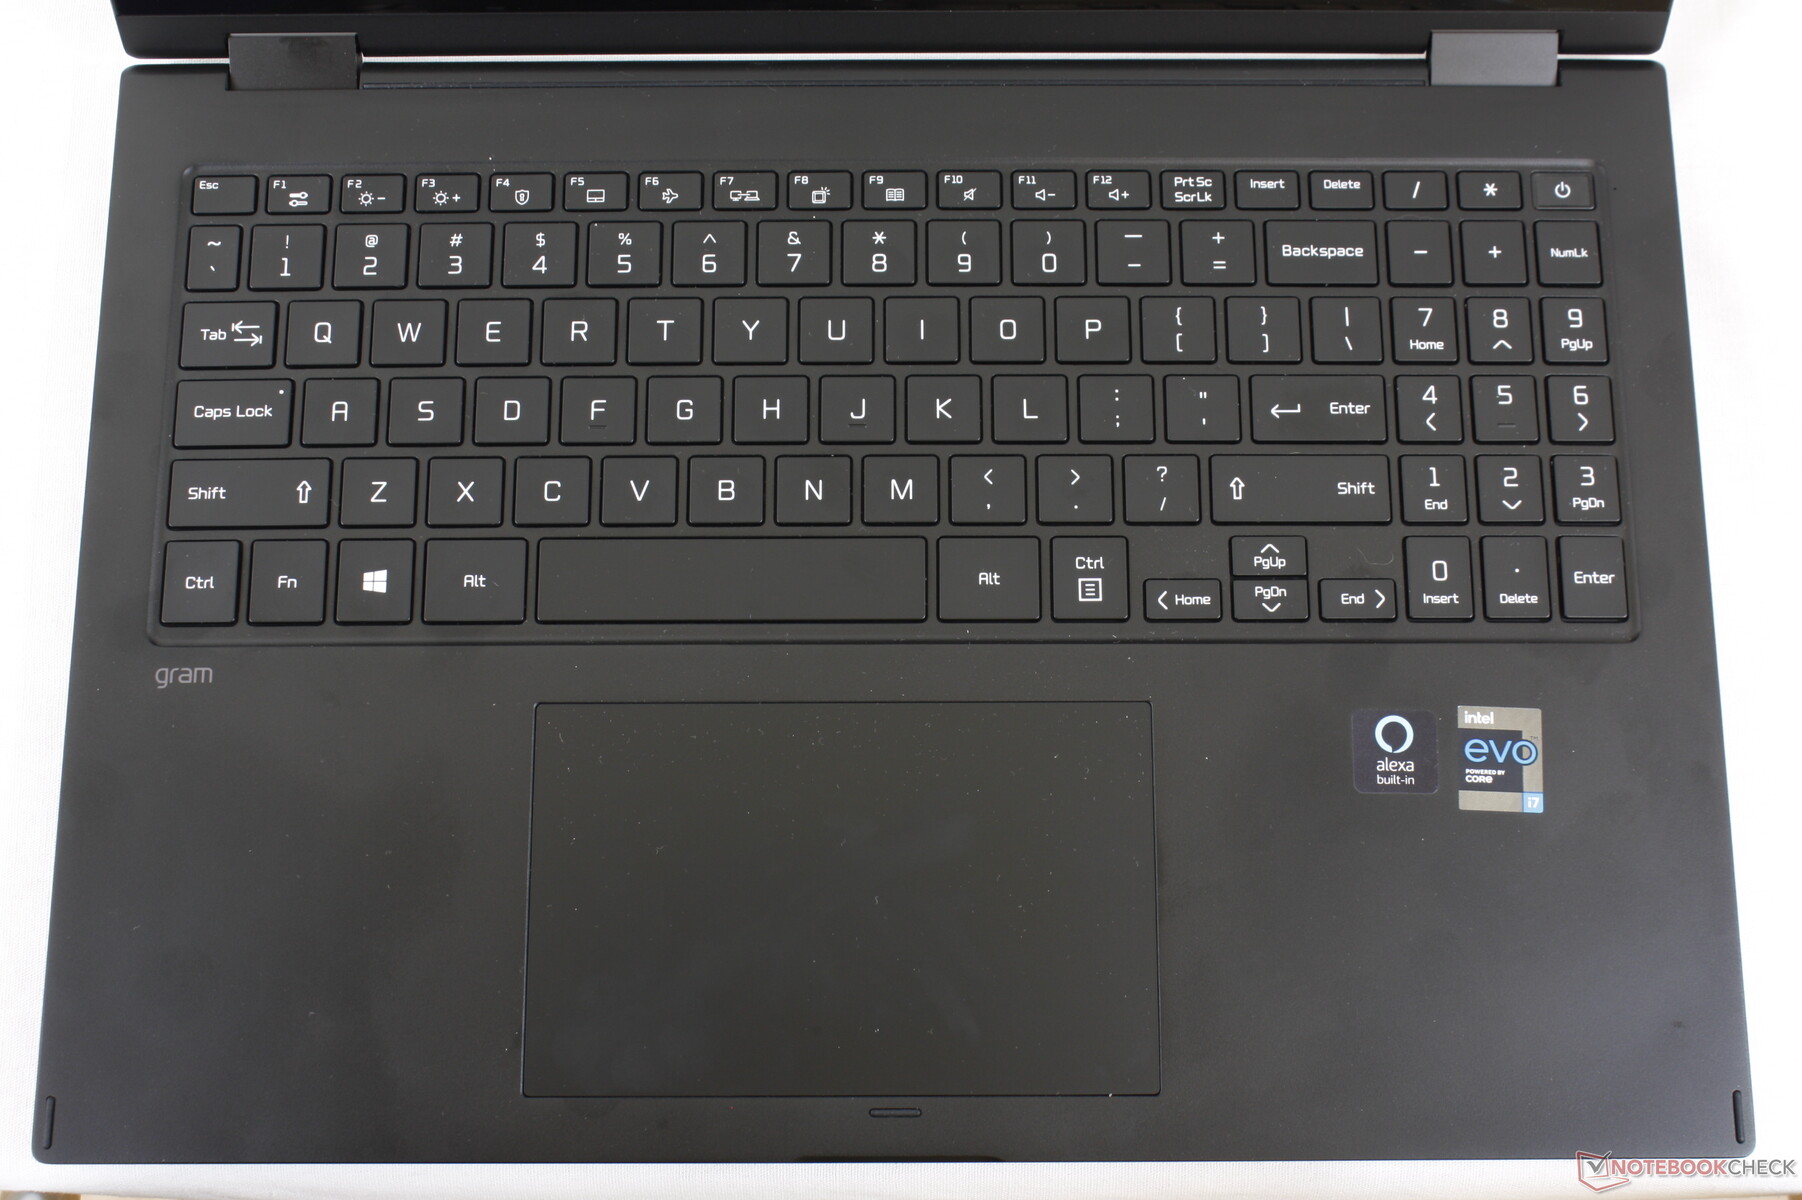
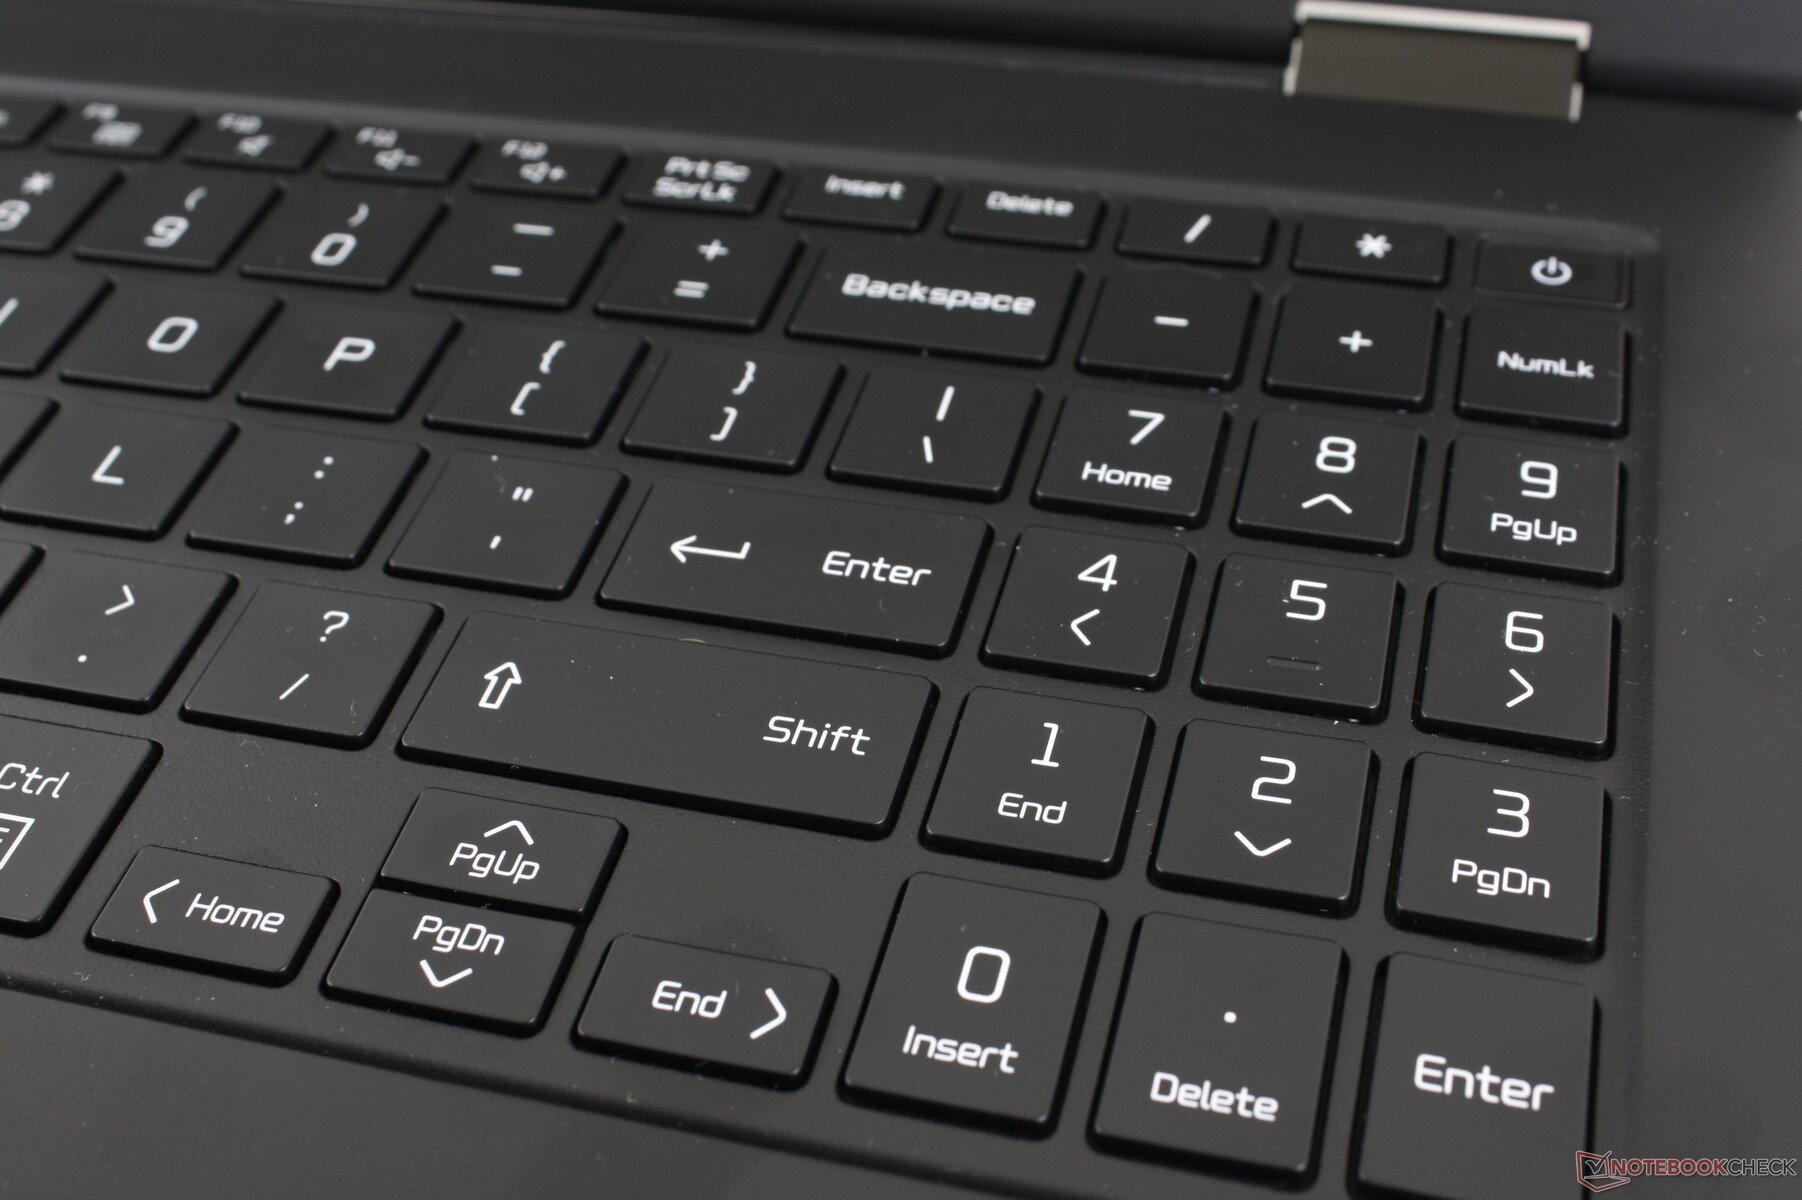
Keyboard
The keys here have crisper feedback than the Dell XPS 15, Razer Blade 15, Asus ZenBook 15, and many other Ultrabooks for that matter to be more comfortable for typing. Travel also feels deeper than expected despite how thin and light the chassis is. Clatter is loud as a consequence of the firm feedback.
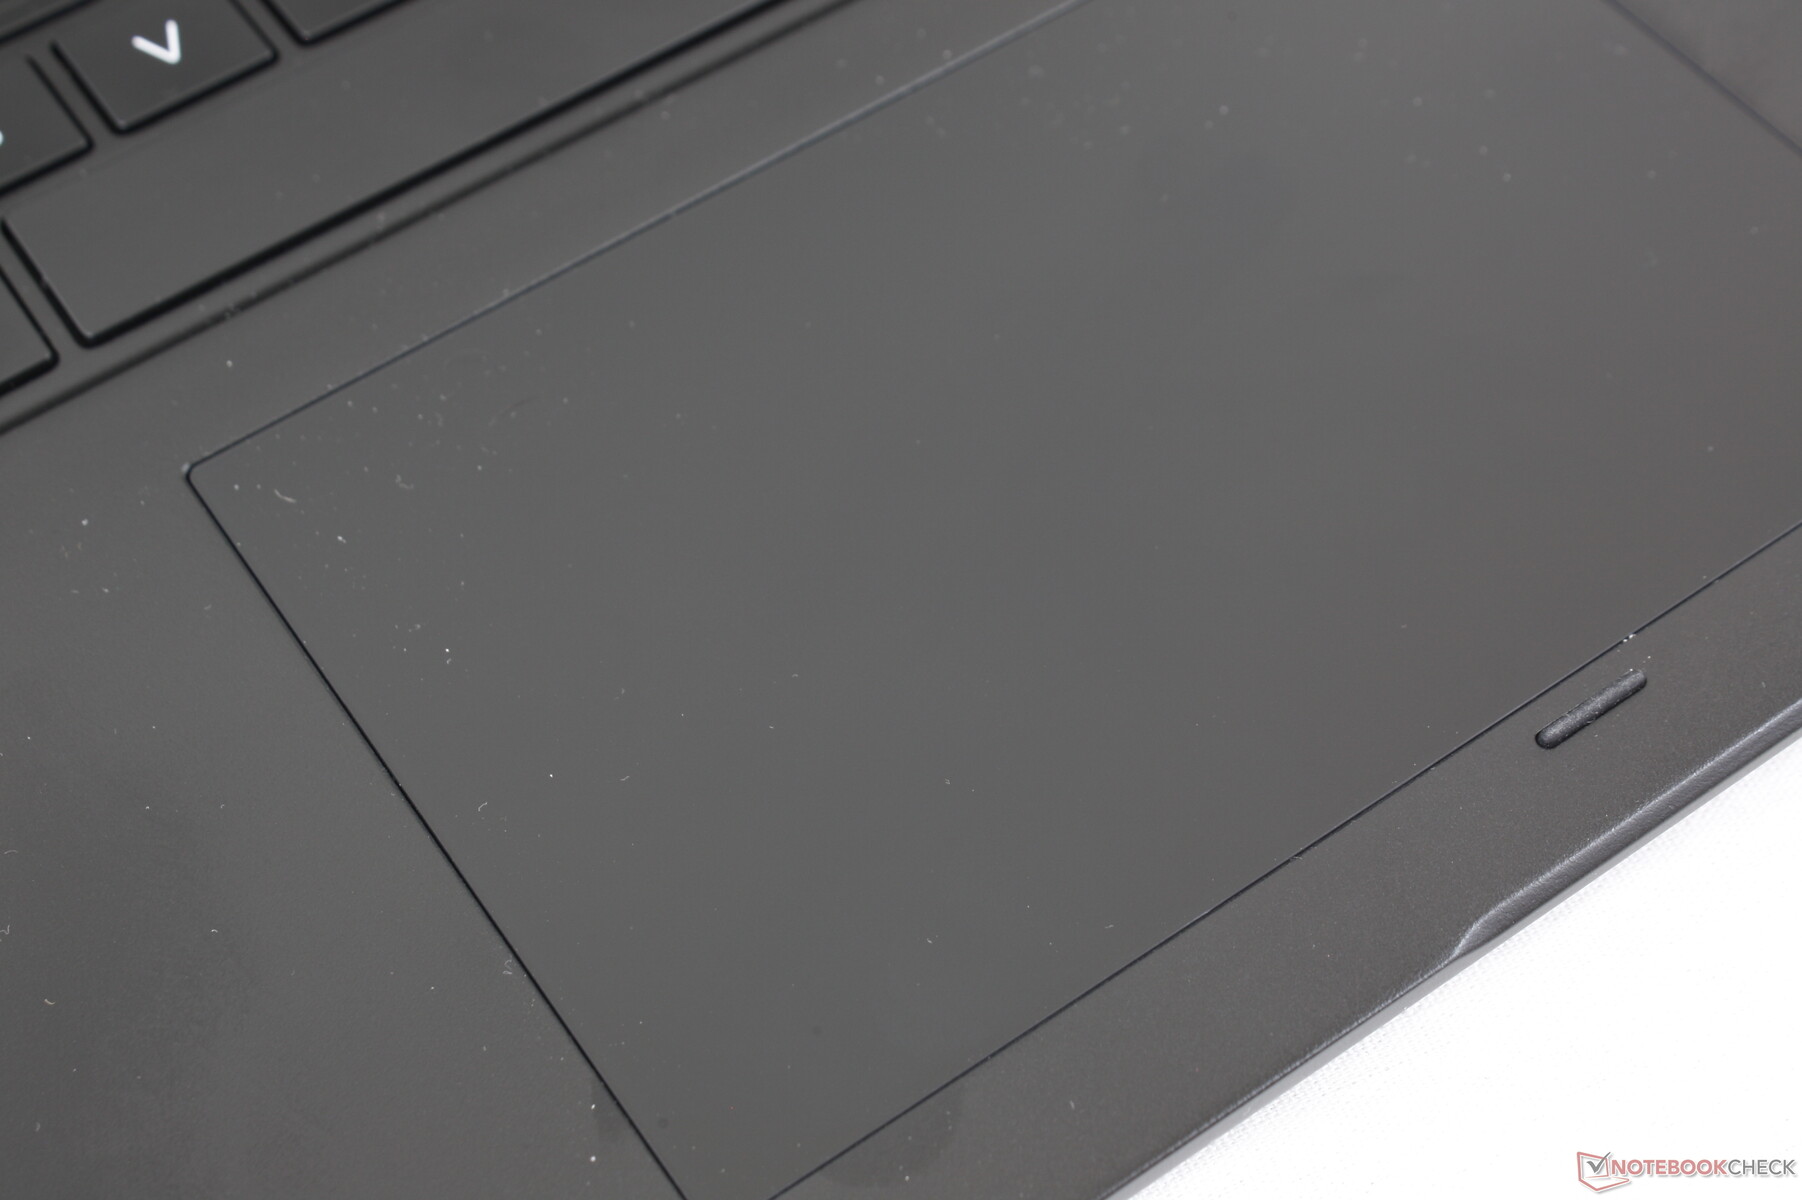
Touchpad
The clickpad is reasonably large (13.2 x 8.3 cm) with smooth traction and just a bit of friction to avoid feeling slippery. Meanwhile, its integrated click keys are shallow and with moderate feedback, but clatter is louder than expected. It's a reliable and pain-free trackpad so long as users aren't bothered by the audible click when pressing down.

Display
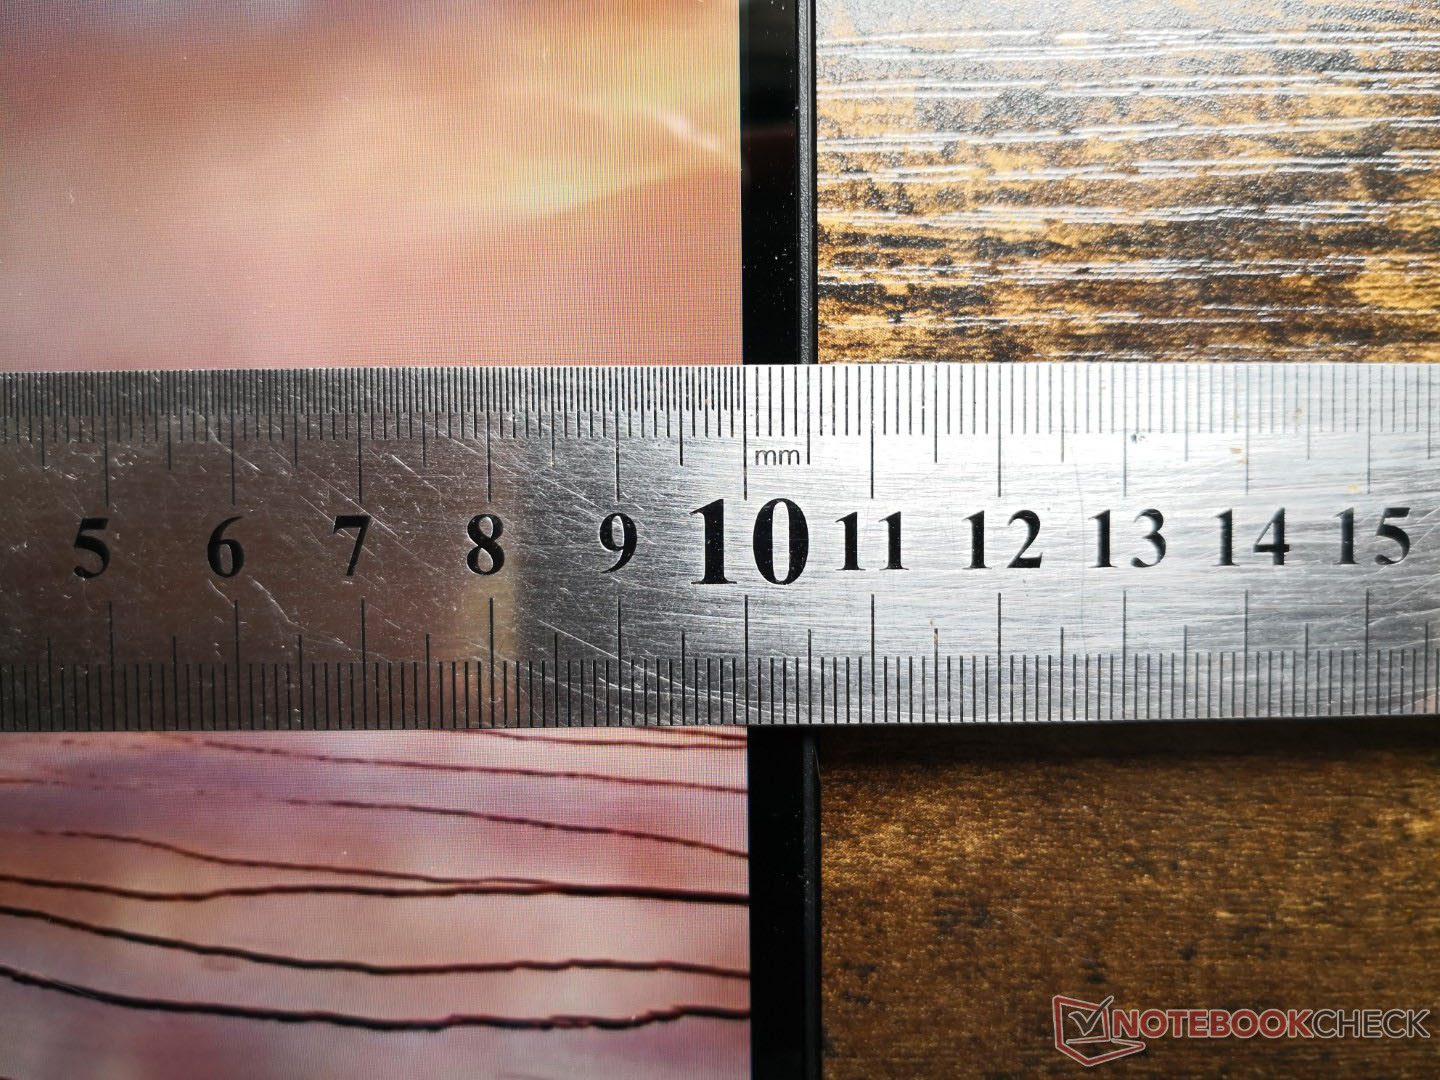
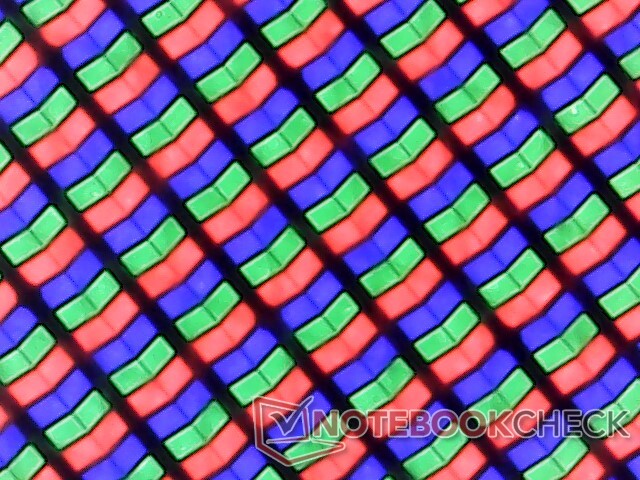
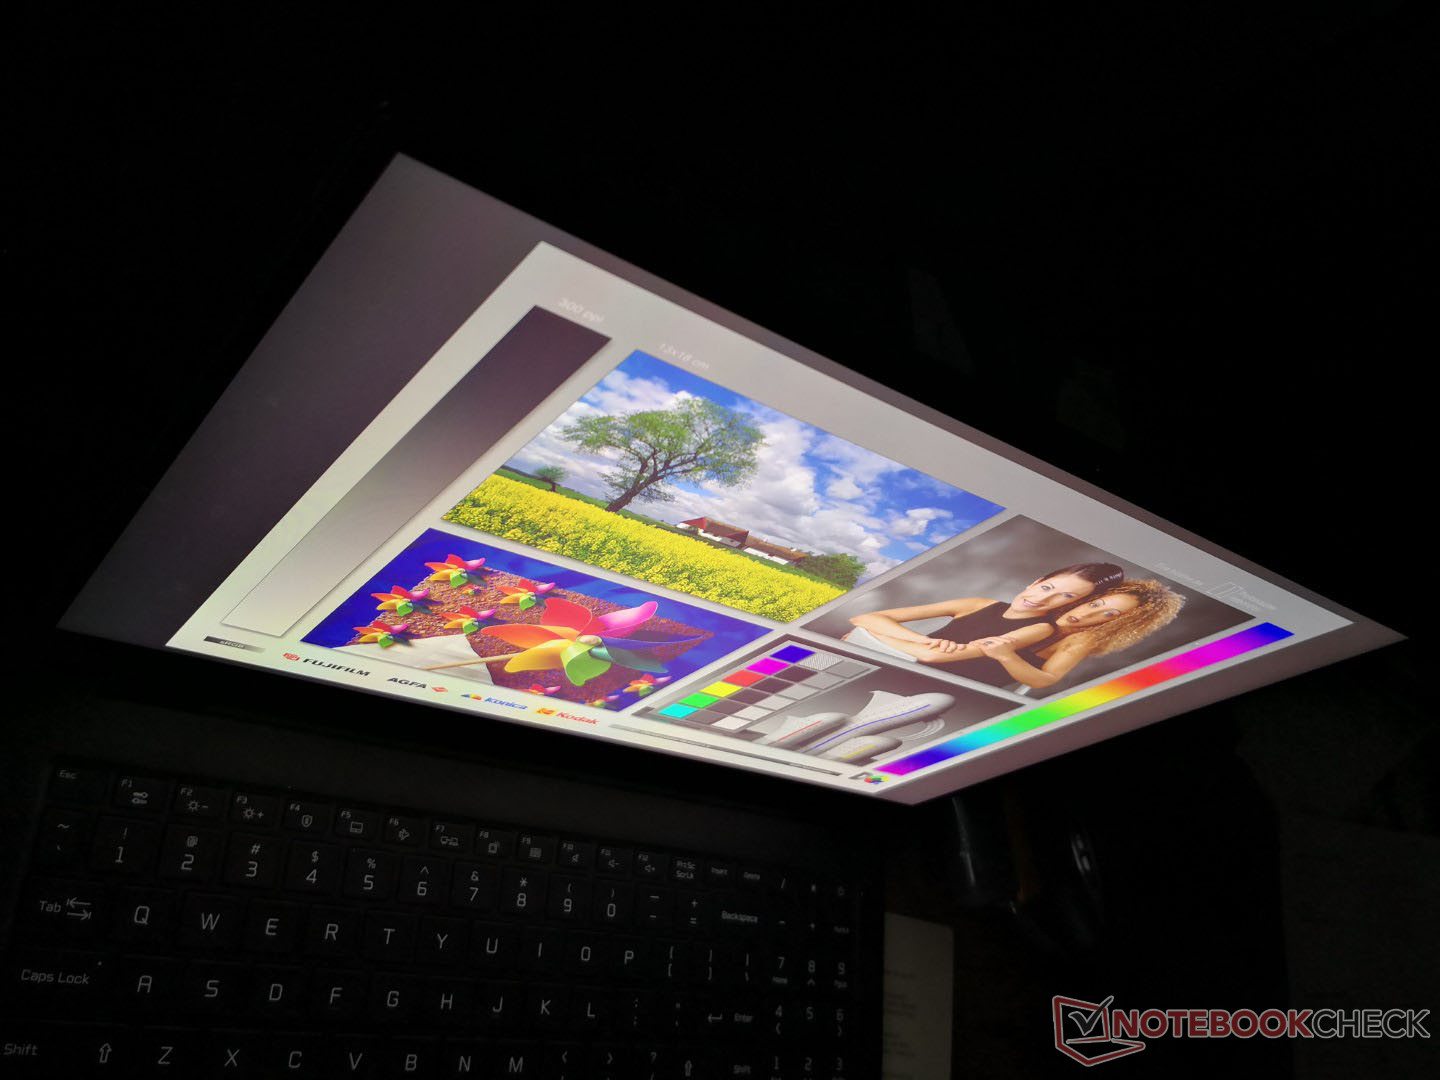
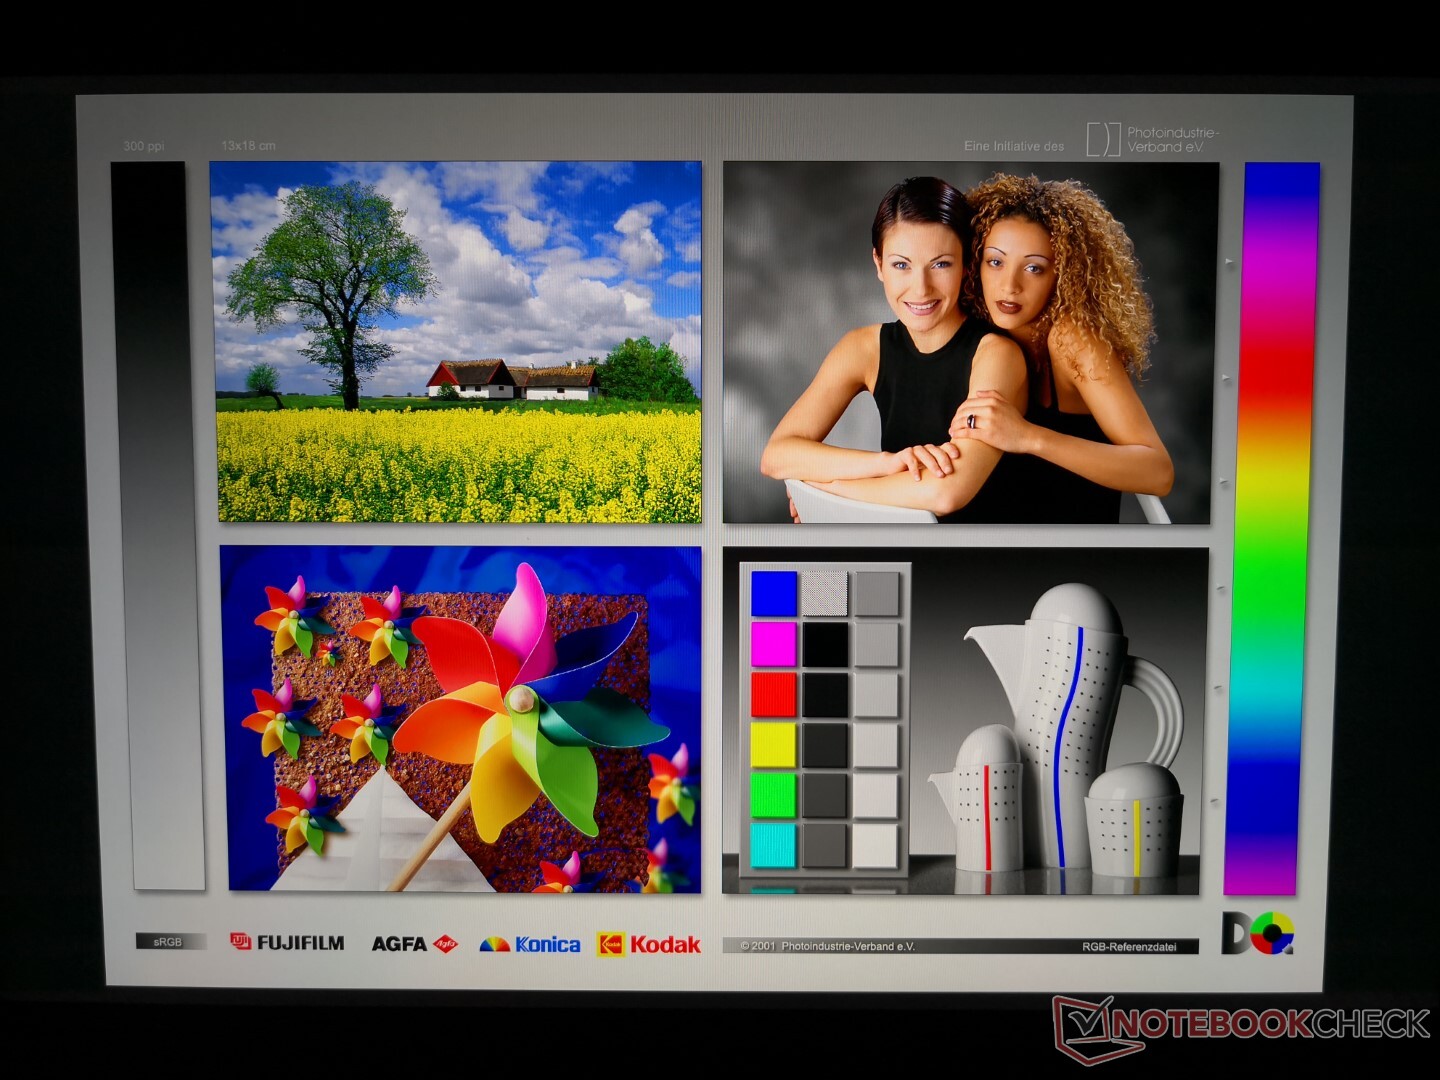
Every Gram laptop we've tested thus far has had an amazing display and the Gram 16 2-in-1 is no different. Its 16-inch 16:10 touchscreen here is uncommon since most other laptops tend to be 15- or 17-inches with either 16:9 or 3:2 aspect ratios. Naturally, LG is the manufacturer for its own LP160WQ1-SPA1 IPS panel which can be found on no other laptop in our database at the moment to make the Gram 16 even more unique.
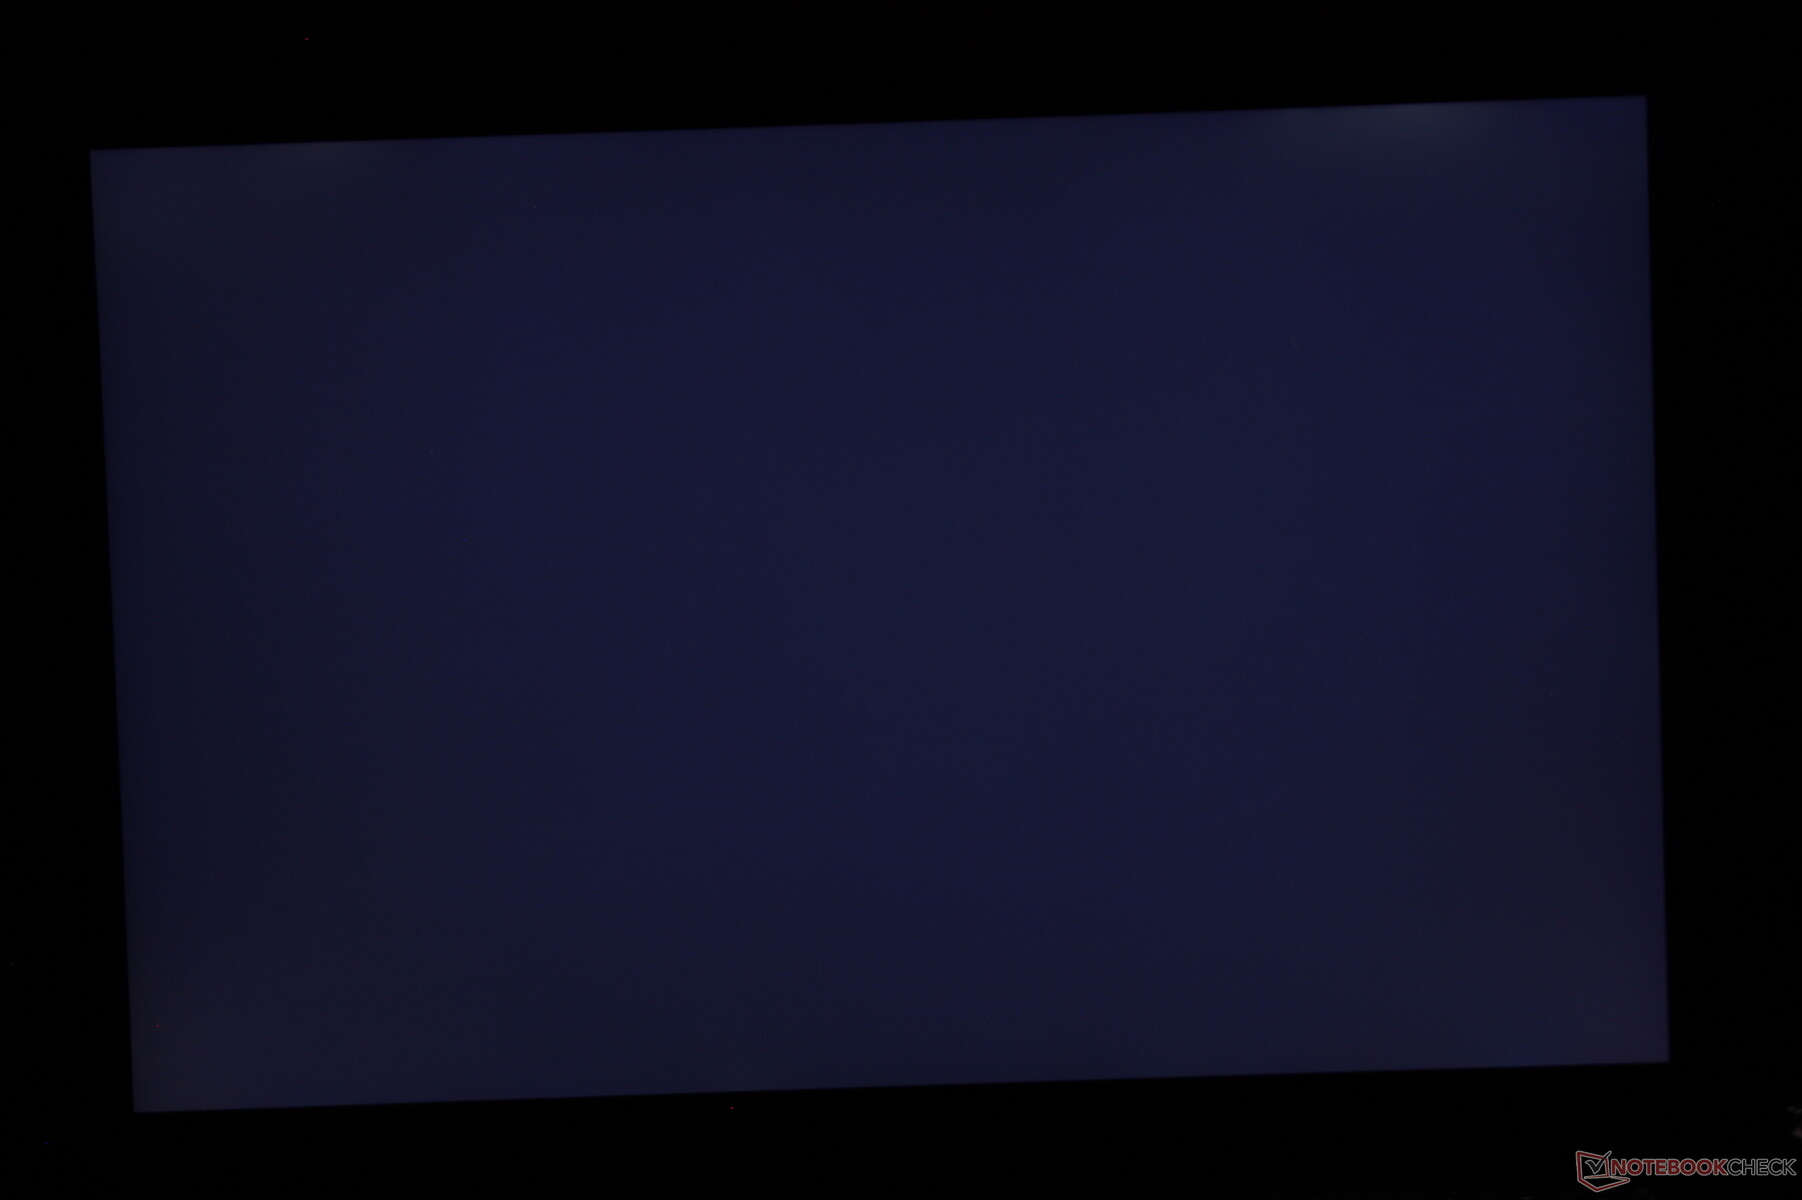
Though display quality is excellent, maximum brightness could have been brighter. The Gram 16 2-in-1 is much dimmer than the displays on the MacBook Pro 16 or XPS 15 by up to 2x which is disappointing for such a travel-friendly design.
| |||||||||||||||||||||||||
Brightness Distribution: 92 %
Center on Battery: 325.3 cd/m²
Contrast: 929:1 (Black: 0.35 cd/m²)
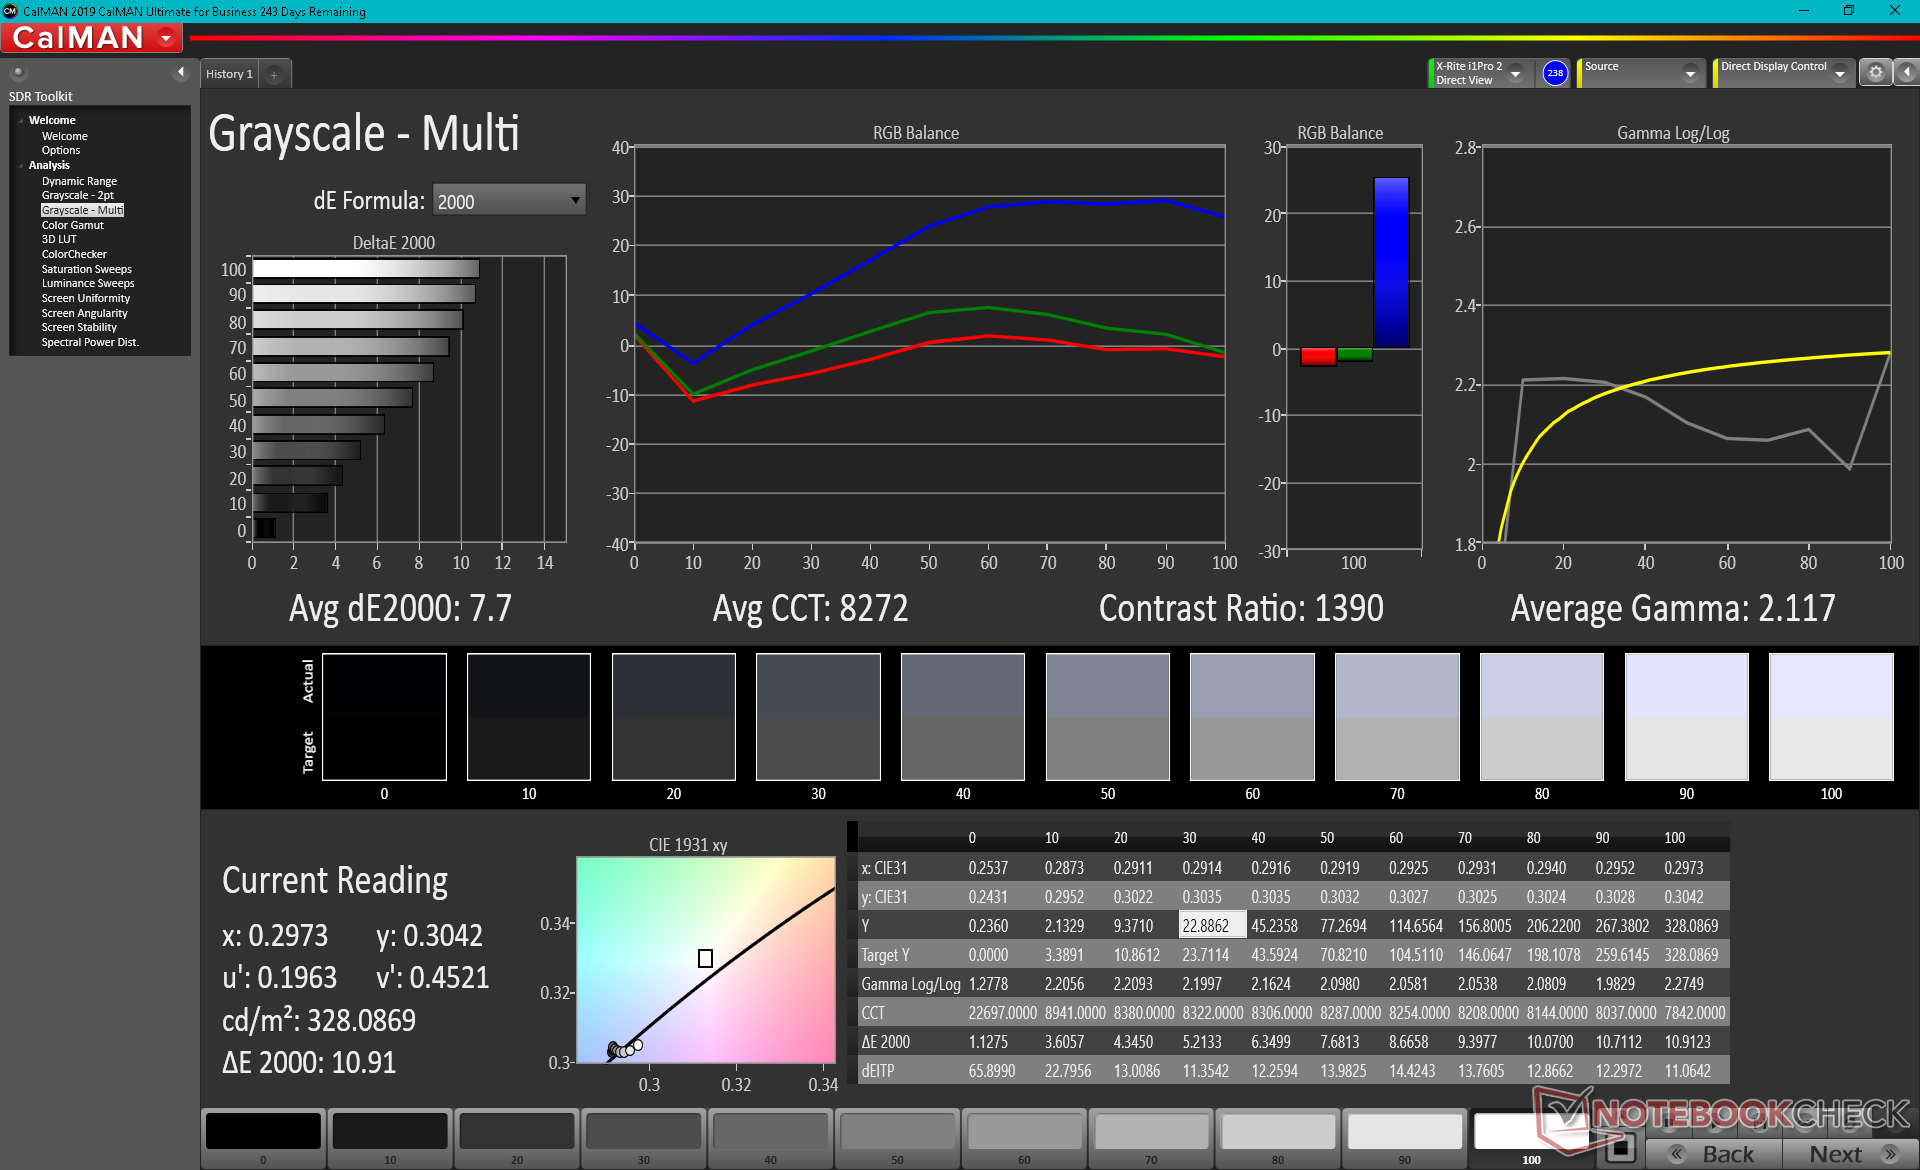
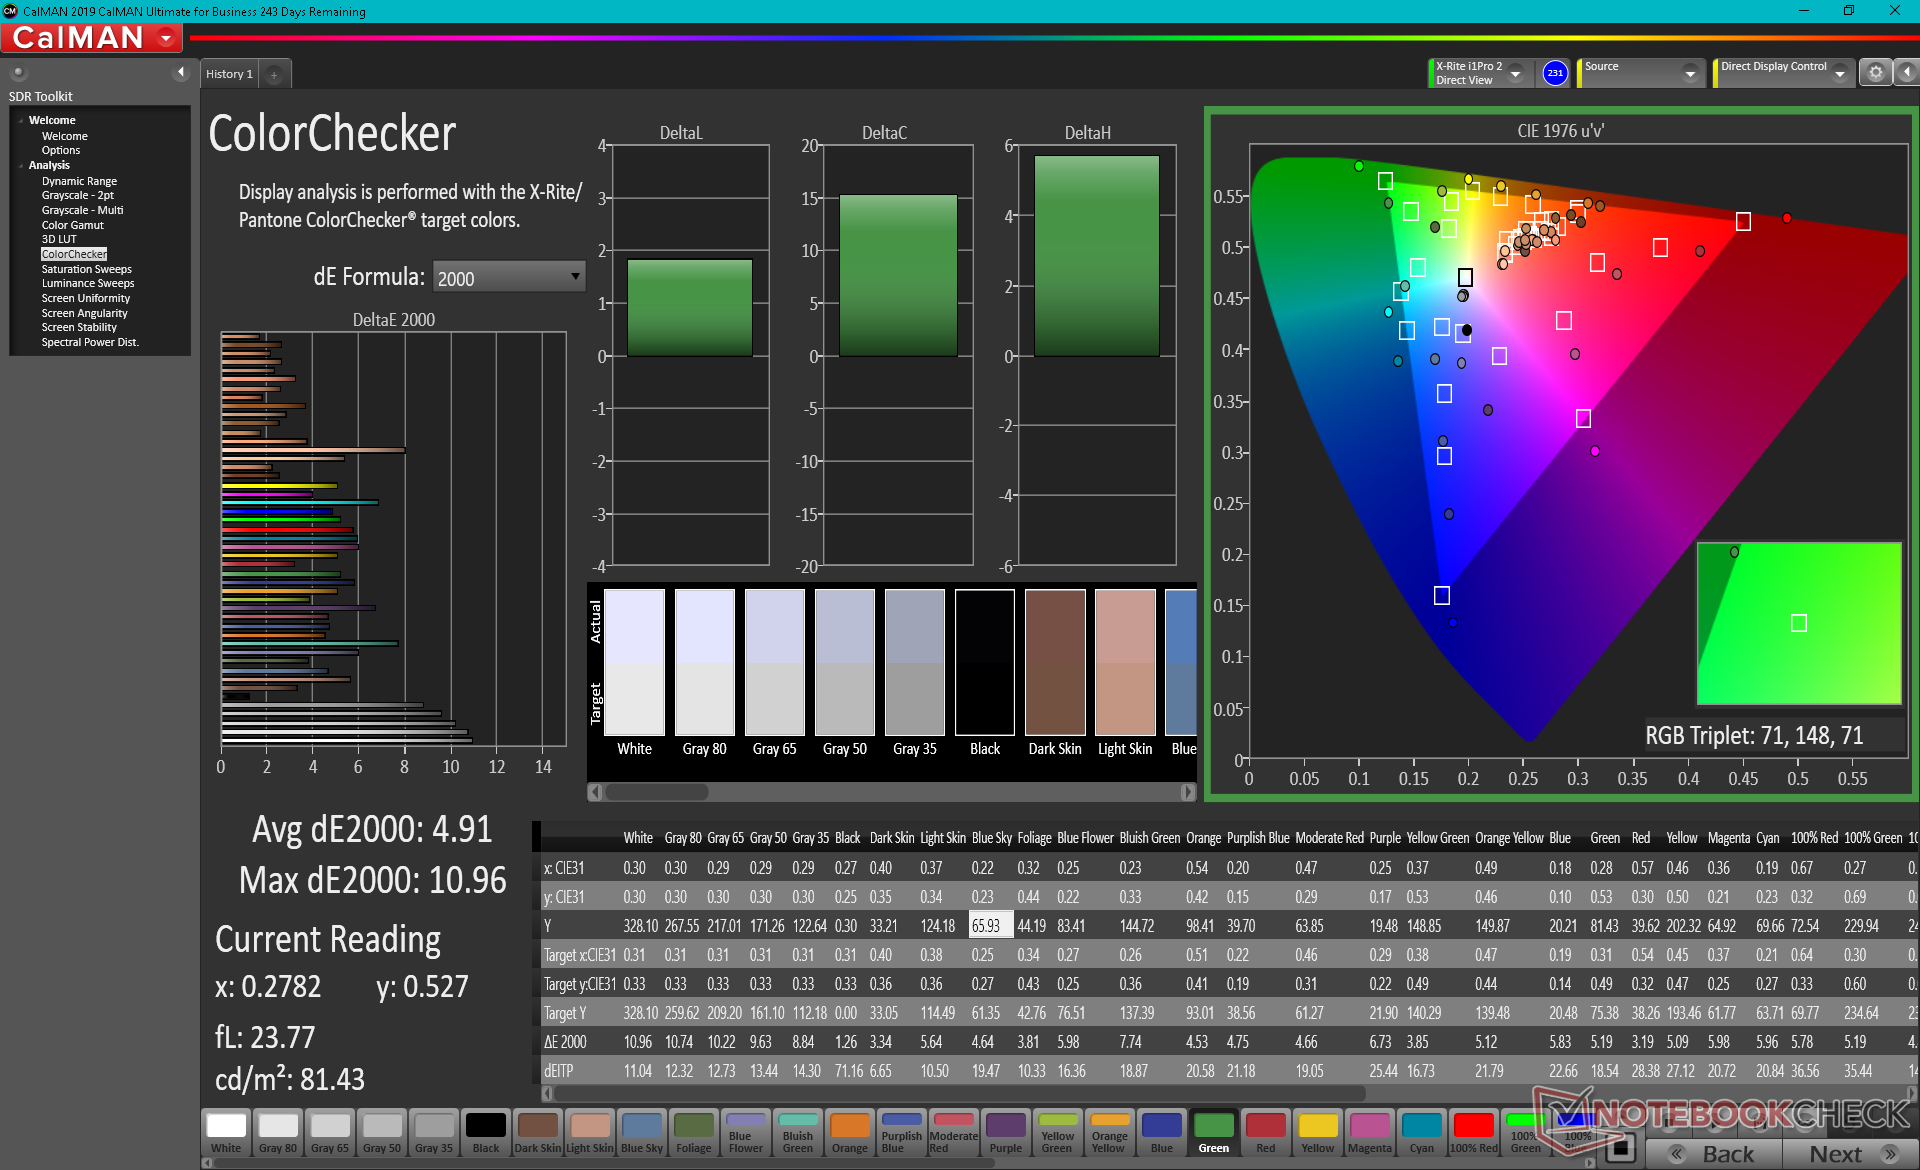
ΔE ColorChecker Calman: 4.91 | ∀{0.5-29.43 Ø4.71}
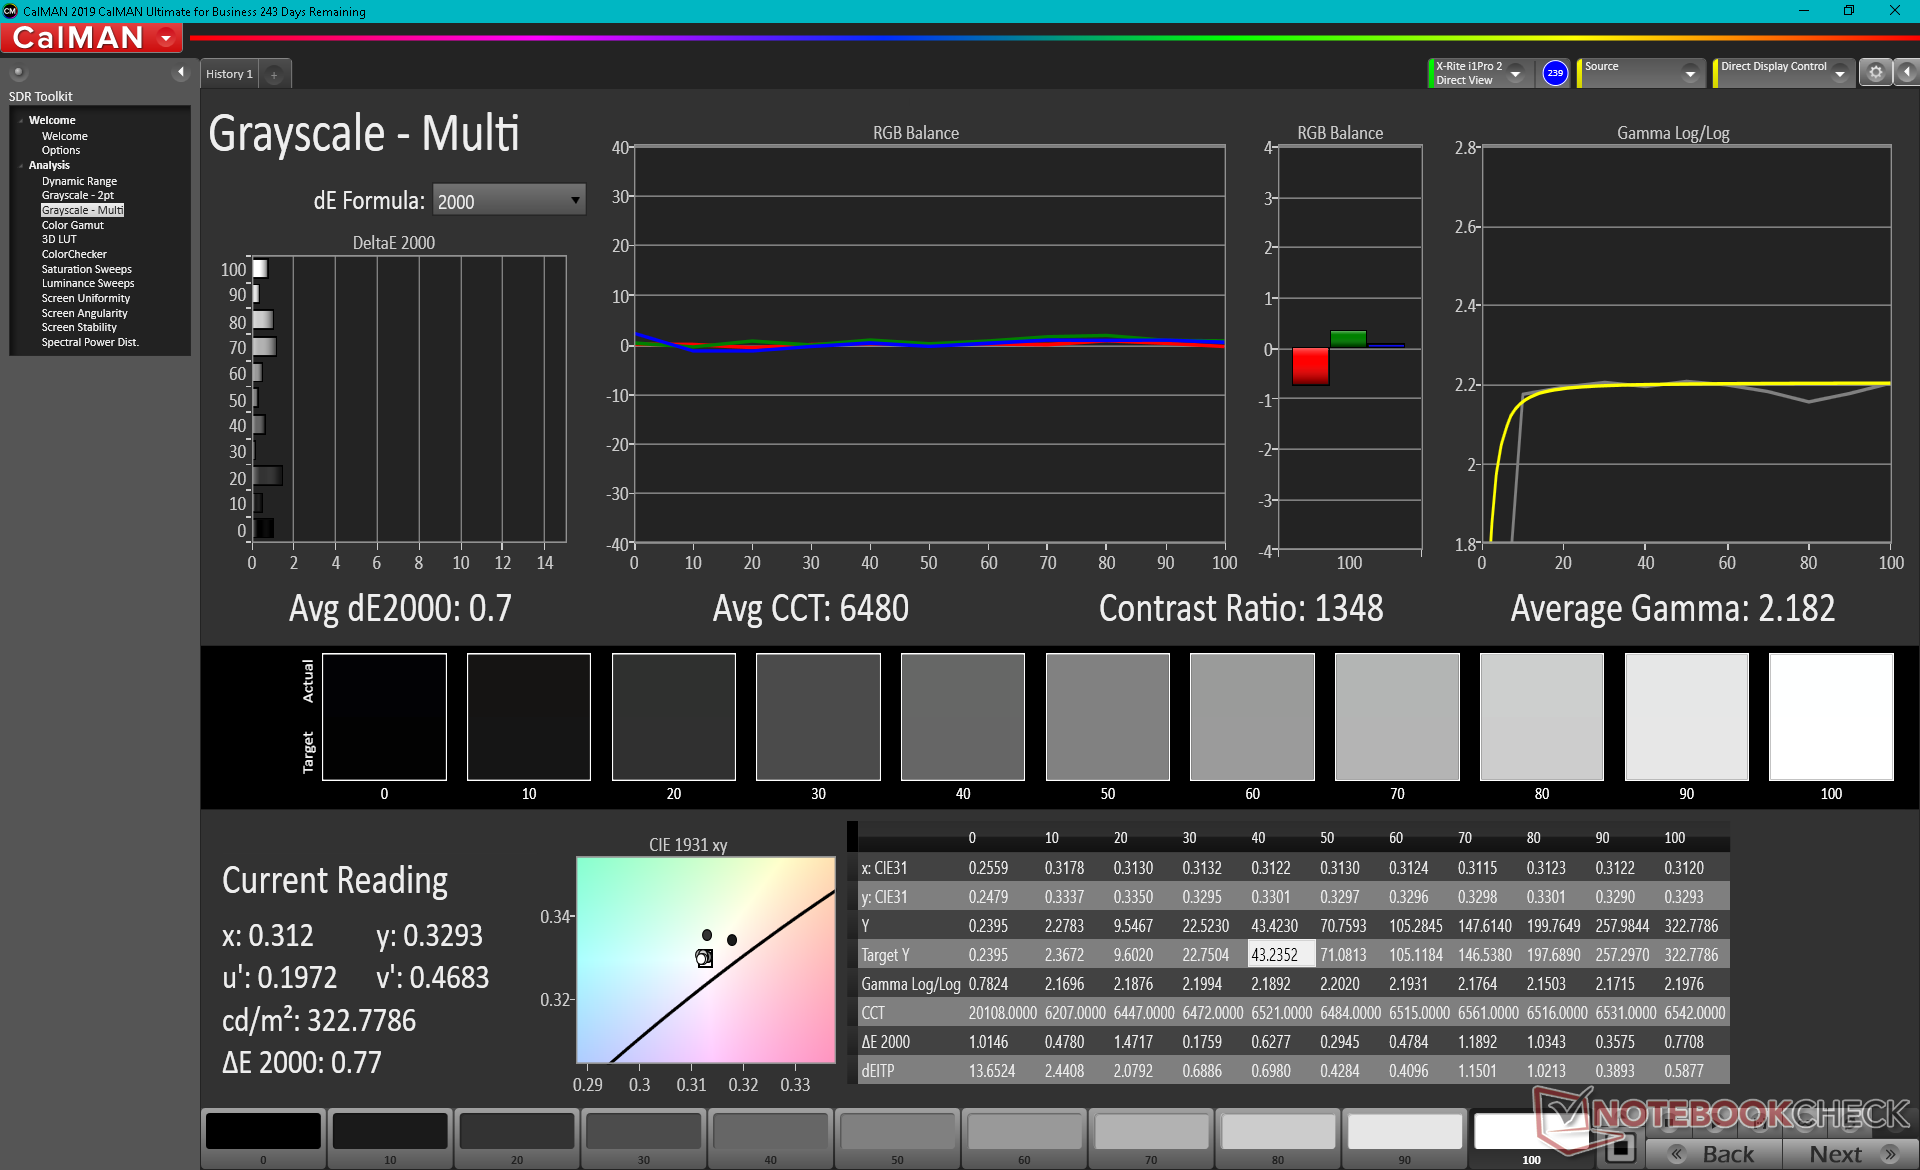
calibrated: 2.83
ΔE Greyscale Calman: 7.7 | ∀{0.09-98 Ø4.96}
99.8% sRGB (Argyll 1.6.3 3D)
75.8% AdobeRGB 1998 (Argyll 1.6.3 3D)
84.7% AdobeRGB 1998 (Argyll 3D)
99.9% sRGB (Argyll 3D)
96.3% Display P3 (Argyll 3D)
Gamma: 2.12
CCT: 8272 K
| LG Gram 16 2-in-1 16T90P LG Philips LP160WQ1-SPA1, IPS, 16", 2560x1600 | Honor MagicBook Pro 10210U Chi Mei N161HCA-EA3, IPS, 16.1", 1920x1080 | Apple MacBook Pro 16 2019 i9 5500M APPA044, IPS, 16", 3072x1920 | Dell XPS 15 9500 Core i5 Sharp LQ156N1, IPS, 15.6", 1920x1200 | HP Spectre X360 15-5ZV31AV AU Optronics AUO30EB, IPS, 15.6", 3840x2160 | Asus ZenBook UX535-M01440 BOE0866, IPS, 15.6", 3840x2160 | |
|---|---|---|---|---|---|---|
| Display | -16% | -7% | -18% | -15% | ||
| Display P3 Coverage (%) | 96.3 | 67 -30% | 81.5 -15% | 68.3 -29% | 68.8 -29% | |
| sRGB Coverage (%) | 99.9 | 99.3 -1% | 100 0% | 94.3 -6% | 99.5 0% | |
| AdobeRGB 1998 Coverage (%) | 84.7 | 69.2 -18% | 79.6 -6% | 68.4 -19% | 70.1 -17% | |
| Response Times | 11% | -37% | -11% | -54% | 9% | |
| Response Time Grey 50% / Grey 80% * (ms) | 36.4 ? | 35.2 ? 3% | 52.4 ? -44% | 42 ? -15% | 56.8 ? -56% | 34 ? 7% |
| Response Time Black / White * (ms) | 26.8 ? | 22 ? 18% | 34.9 ? -30% | 28.8 ? -7% | 40.8 ? -52% | 24 ? 10% |
| PWM Frequency (Hz) | 25000 ? | 131700 | ||||
| Screen | 33% | 39% | 29% | 11% | 29% | |
| Brightness middle (cd/m²) | 325.3 | 339 4% | 519 60% | 592 82% | 284.6 -13% | 402 24% |
| Brightness (cd/m²) | 311 | 317 2% | 477 53% | 565 82% | 285 -8% | 375 21% |
| Brightness Distribution (%) | 92 | 86 -7% | 86 -7% | 85 -8% | 85 -8% | 84 -9% |
| Black Level * (cd/m²) | 0.35 | 0.25 29% | 0.39 -11% | 0.46 -31% | 0.25 29% | 0.35 -0% |
| Contrast (:1) | 929 | 1356 46% | 1331 43% | 1287 39% | 1138 22% | 1149 24% |
| Colorchecker dE 2000 * | 4.91 | 0.9 82% | 2.28 54% | 3.19 35% | 3.52 28% | 2.47 50% |
| Colorchecker dE 2000 max. * | 10.96 | 2.92 73% | 6.54 40% | 5.45 50% | 5.56 49% | 4.32 61% |
| Colorchecker dE 2000 calibrated * | 2.83 | 0.74 74% | 0.86 70% | 2.03 28% | 3 -6% | 2.36 17% |
| Greyscale dE 2000 * | 7.7 | 2 74% | 0.9 88% | 3.9 49% | 3.2 58% | 2.26 71% |
| Gamma | 2.12 104% | 2.238 98% | 2145 0% | 2.25 98% | 2.28 96% | 2.49 88% |
| CCT | 8272 79% | 6631 98% | 6572 99% | 6522 100% | 7070 92% | 6285 103% |
| Color Space (Percent of AdobeRGB 1998) (%) | 75.8 | 69 -9% | 78 3% | 71.6 -6% | 61.1 -19% | 99 31% |
| Color Space (Percent of sRGB) (%) | 99.8 | 92 -8% | 100 0% | 93.8 -6% | ||
| Total Average (Program / Settings) | 9% /
21% | 1% /
27% | 4% /
17% | -20% /
-2% | 8% /
17% |
* ... smaller is better
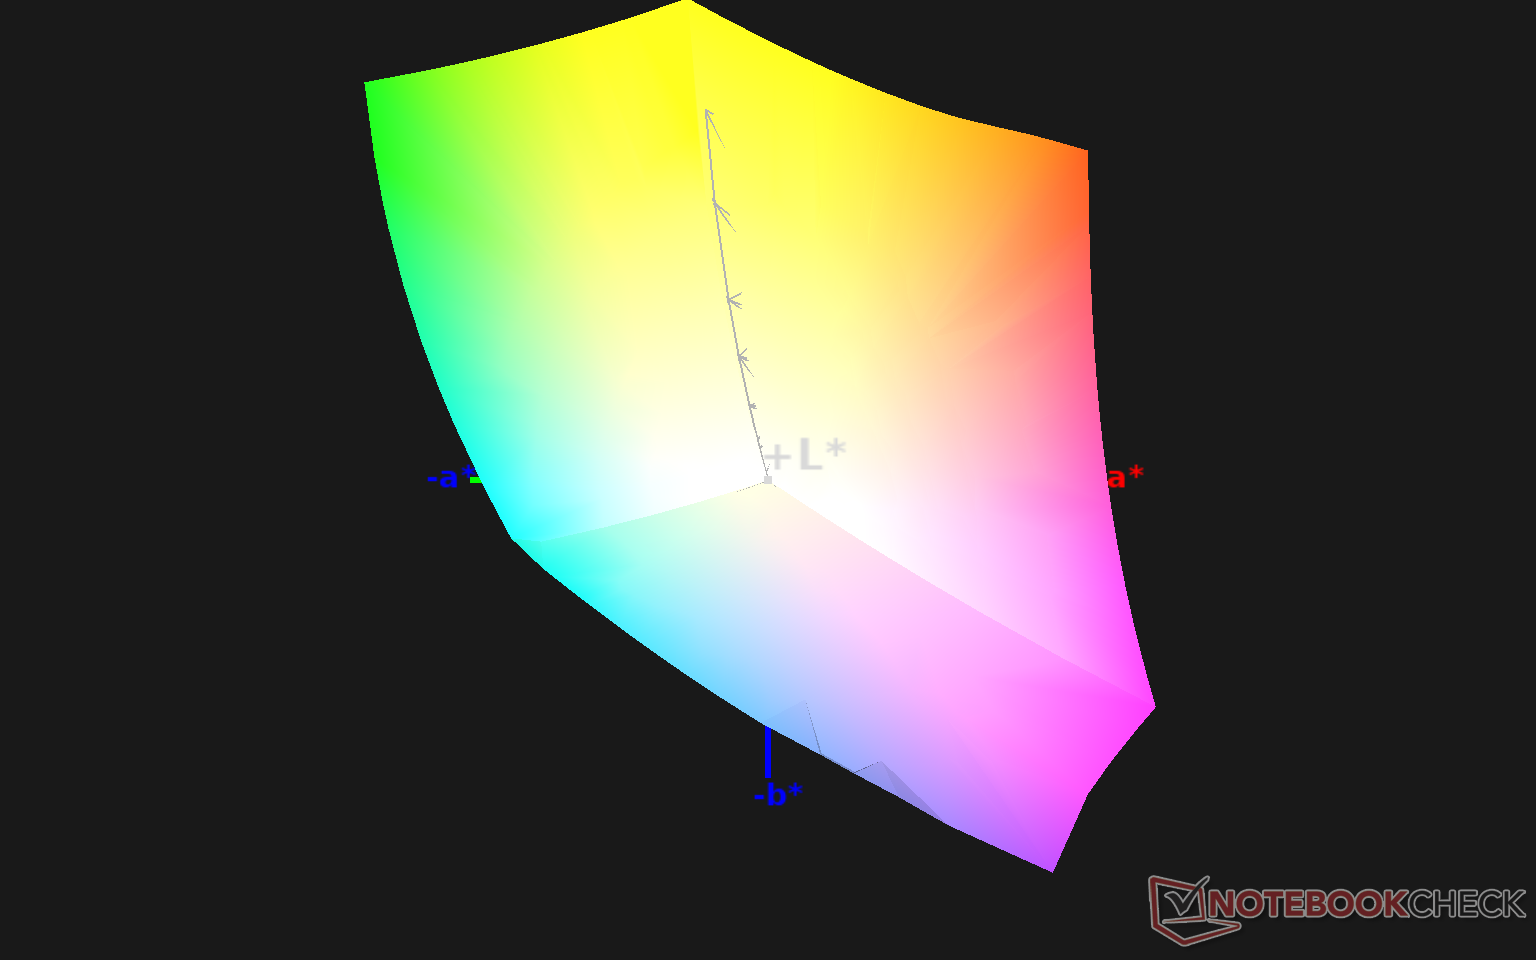
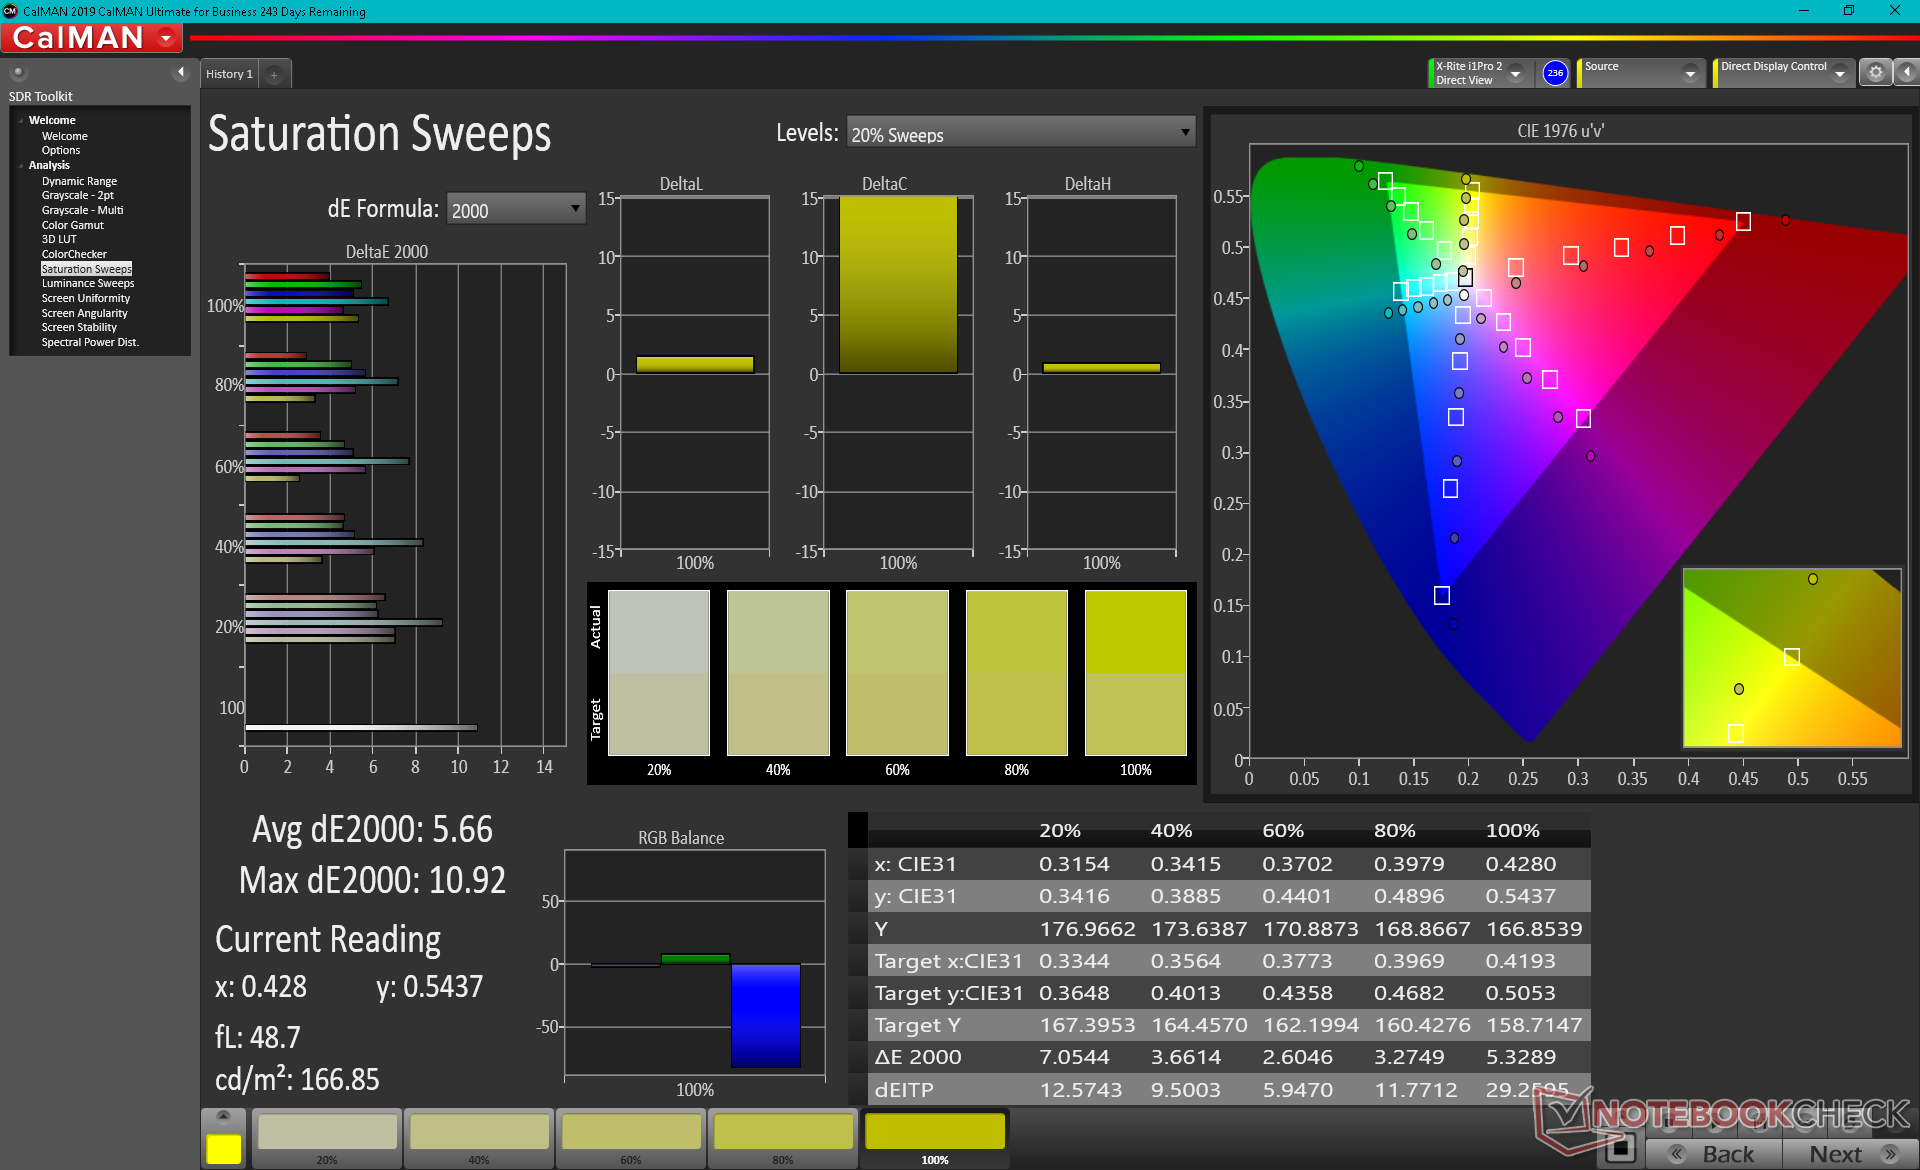
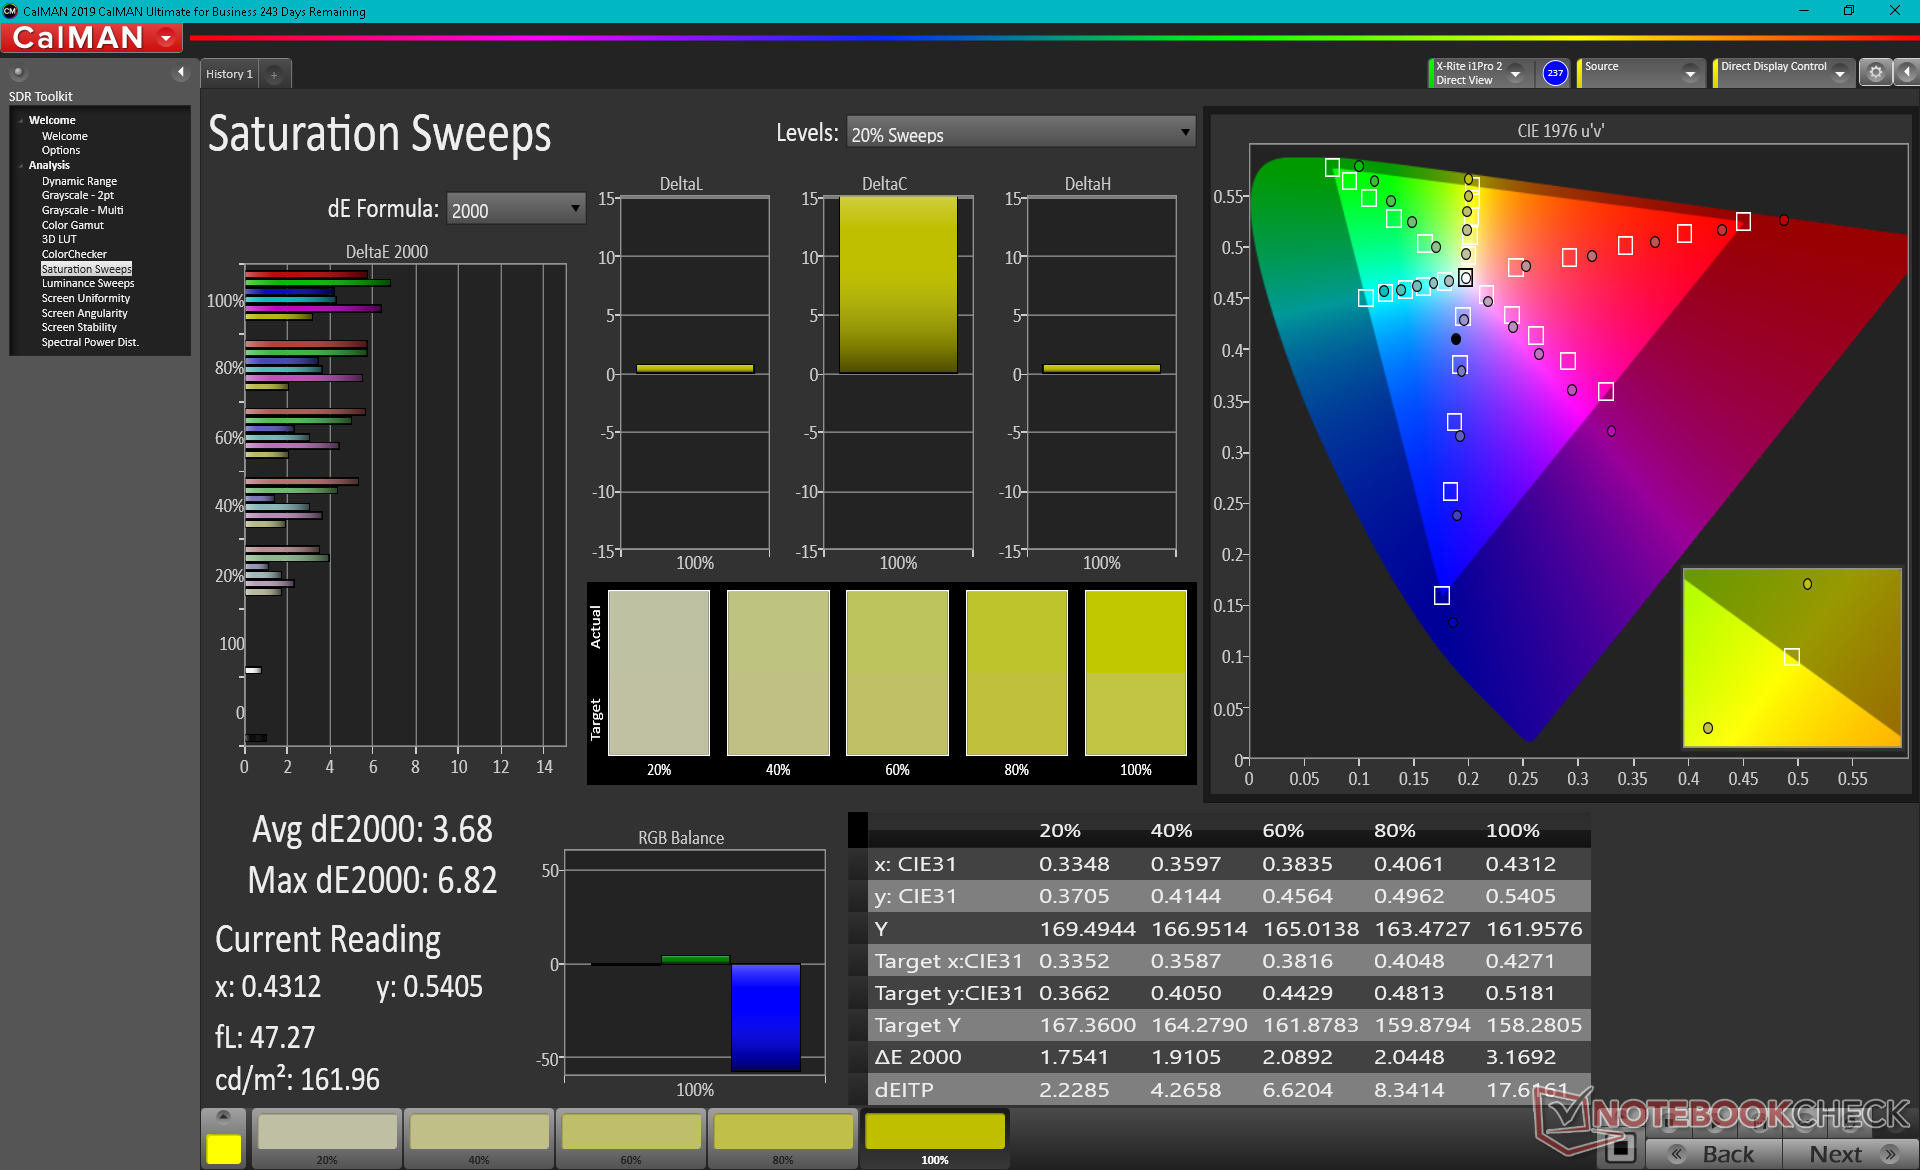
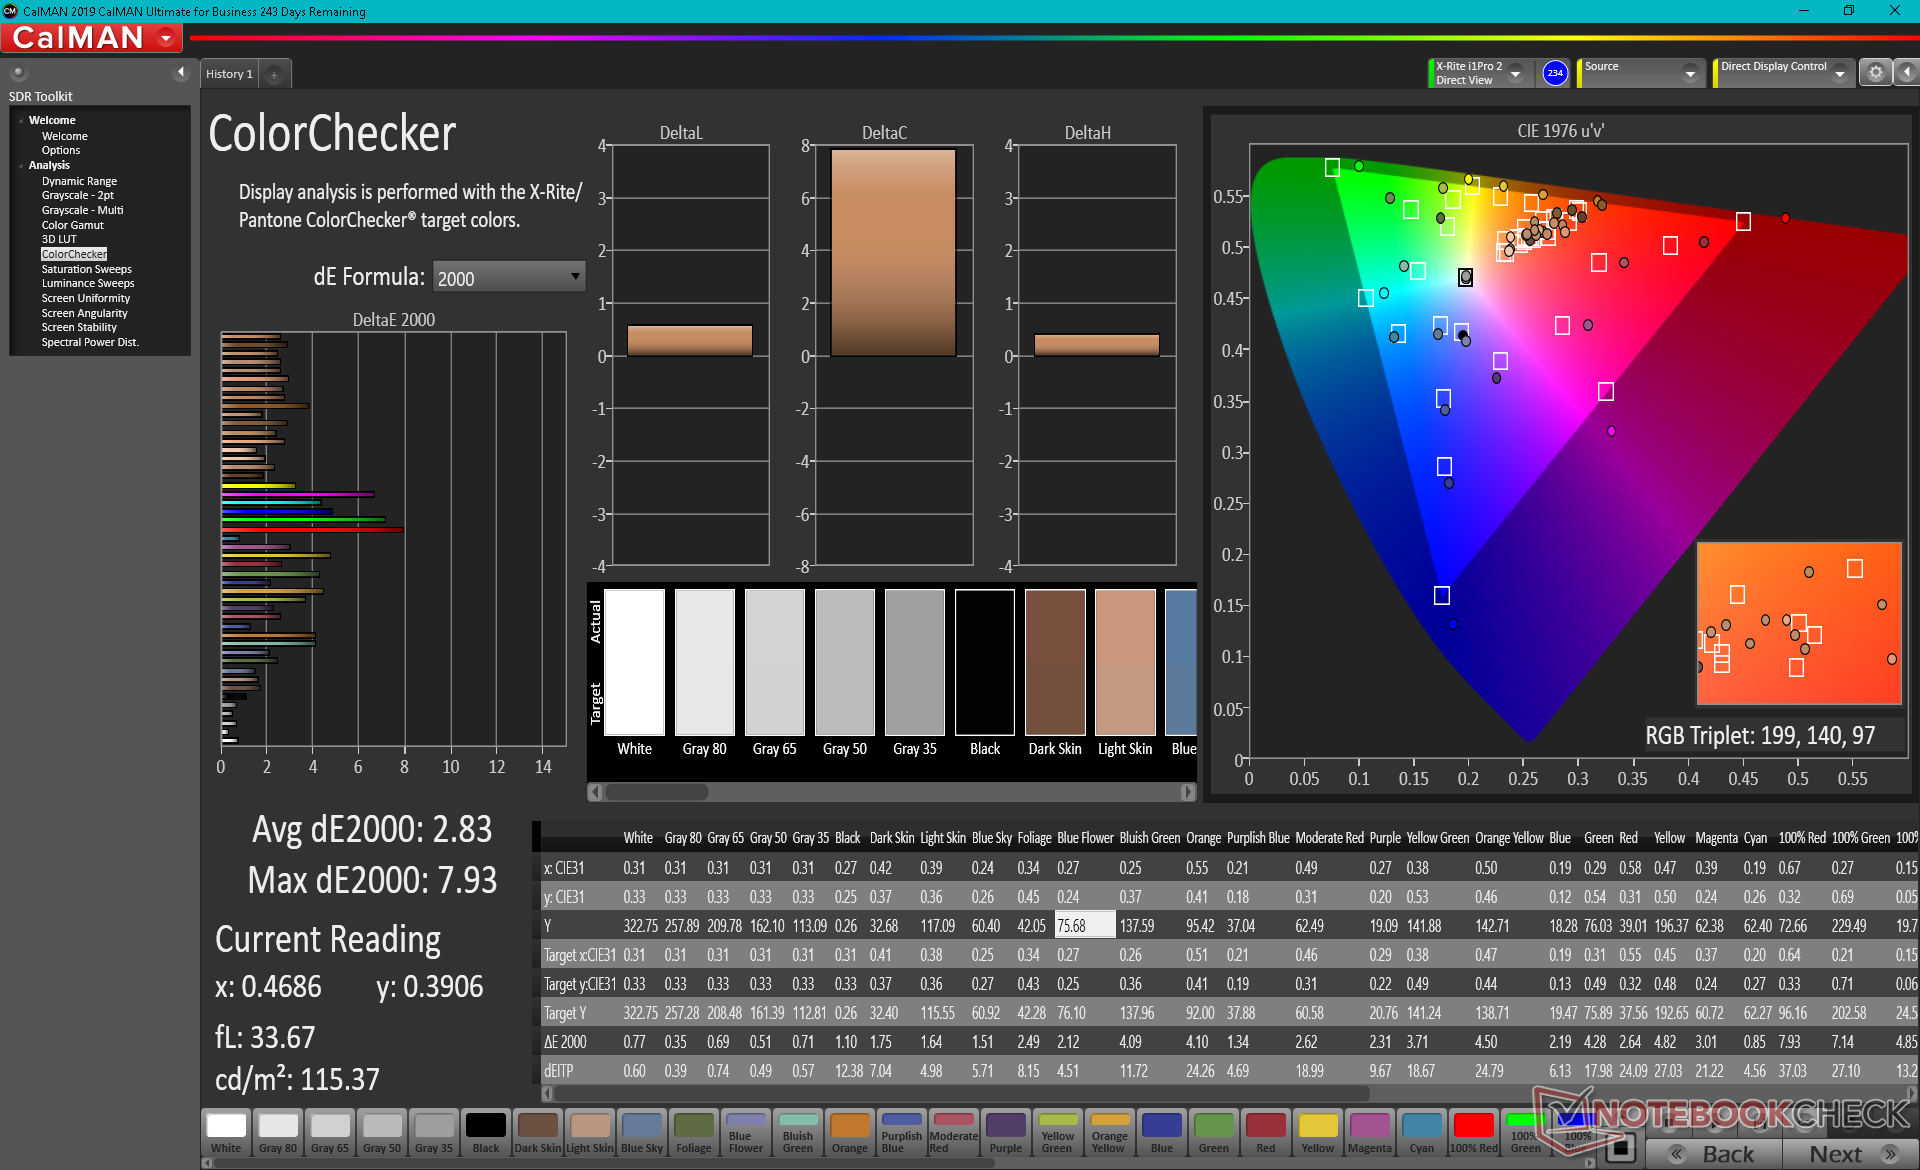
Color space covers all of sRGB and 76 percent of AdobeRGB. Its volume, however, reaches beyond the AdobeRGB standard to signify a DCI-P3 target instead not unlike the Gram 16 clamshell. It's therefore very likely that LG is using the exact same IPS panel for both its Gram 16 clamshell and 2-in-1 models. This would also make the Gram 16 series one of the very few 16-inch laptops to offer DCI-P3 coverage with the MacBook Pro 16 being the most well known.

X-Rite colorimeter measurements show an overly cool color temperature out of the box and color accuracy subsequently suffers at lower saturation levels. Our calibration attempt brings down the color temperature to improve grayscale significantly.
Display Response Times
| ↔ Response Time Black to White | ||
|---|---|---|
| 26.8 ms ... rise ↗ and fall ↘ combined | ↗ 14.4 ms rise | 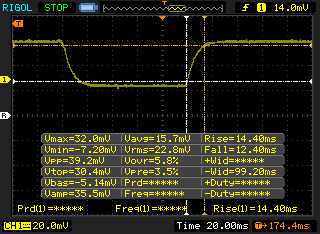 |
| ↘ 12.4 ms fall | ||
| The screen shows relatively slow response rates in our tests and may be too slow for gamers. In comparison, all tested devices range from 0.1 (minimum) to 240 (maximum) ms. » 67 % of all devices are better. This means that the measured response time is worse than the average of all tested devices (19.8 ms). | ||
| ↔ Response Time 50% Grey to 80% Grey | ||
| 36.4 ms ... rise ↗ and fall ↘ combined | ↗ 18 ms rise | 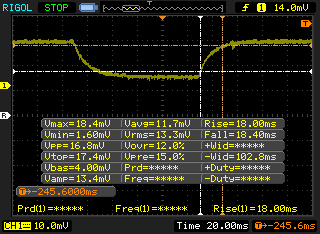 |
| ↘ 18.4 ms fall | ||
| The screen shows slow response rates in our tests and will be unsatisfactory for gamers. In comparison, all tested devices range from 0.165 (minimum) to 636 (maximum) ms. » 52 % of all devices are better. This means that the measured response time is worse than the average of all tested devices (30.9 ms). | ||
Screen Flickering / PWM (Pulse-Width Modulation)
| Screen flickering / PWM not detected |  | ||
In comparison: 52 % of all tested devices do not use PWM to dim the display. If PWM was detected, an average of 7744 (minimum: 5 - maximum: 343500) Hz was measured. | |||
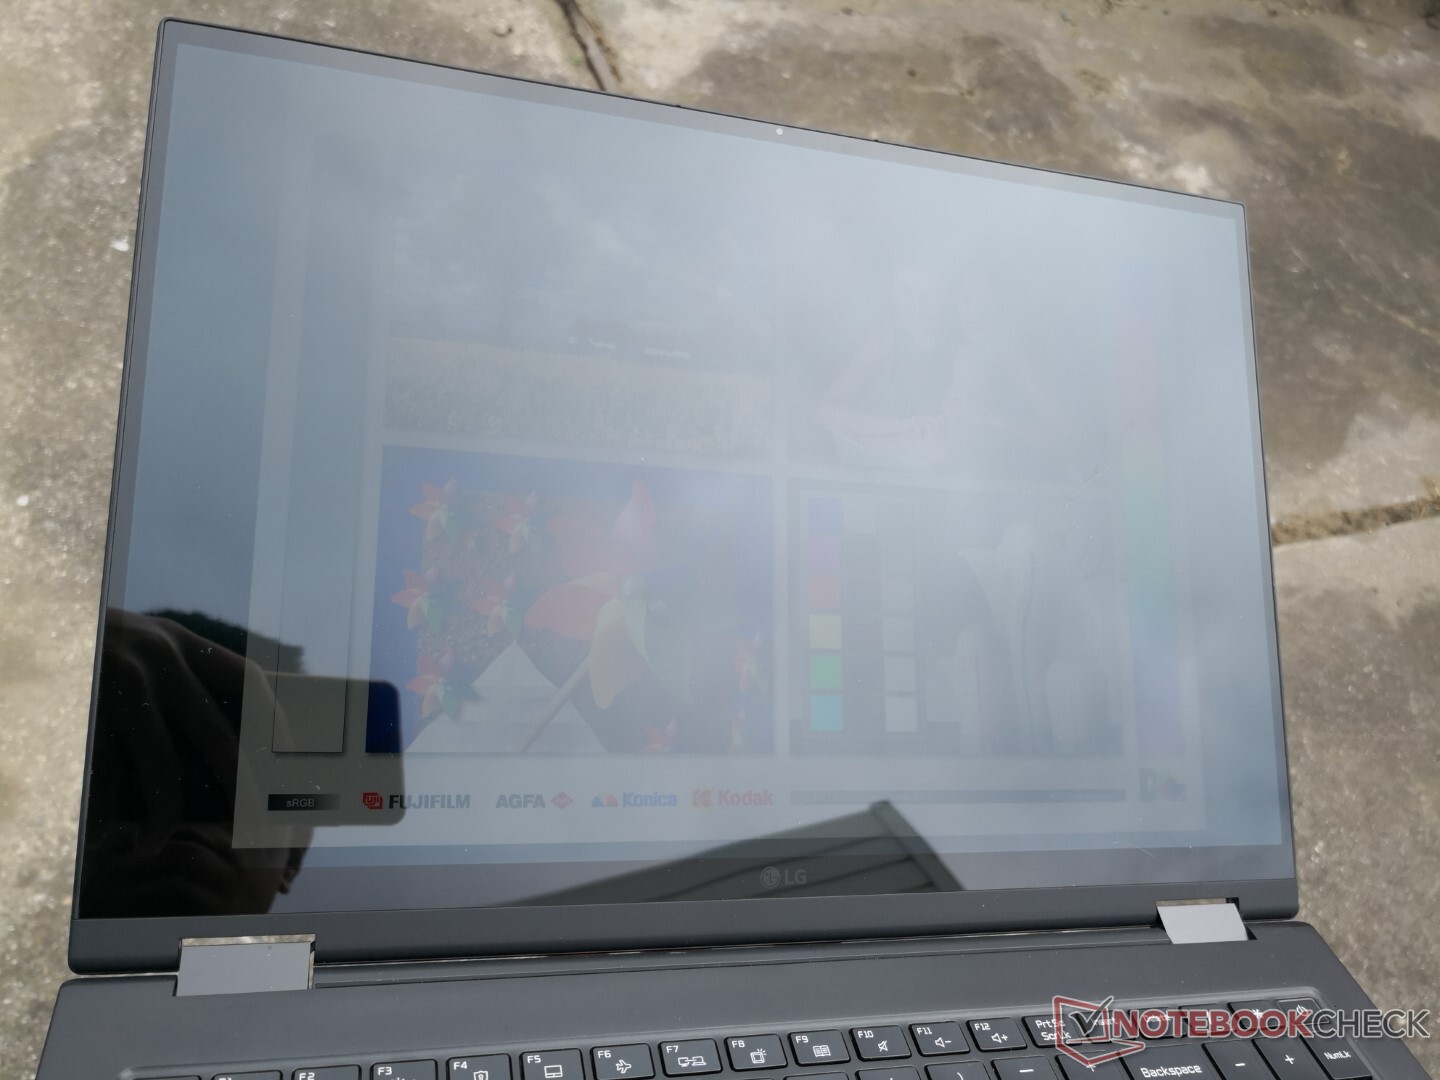
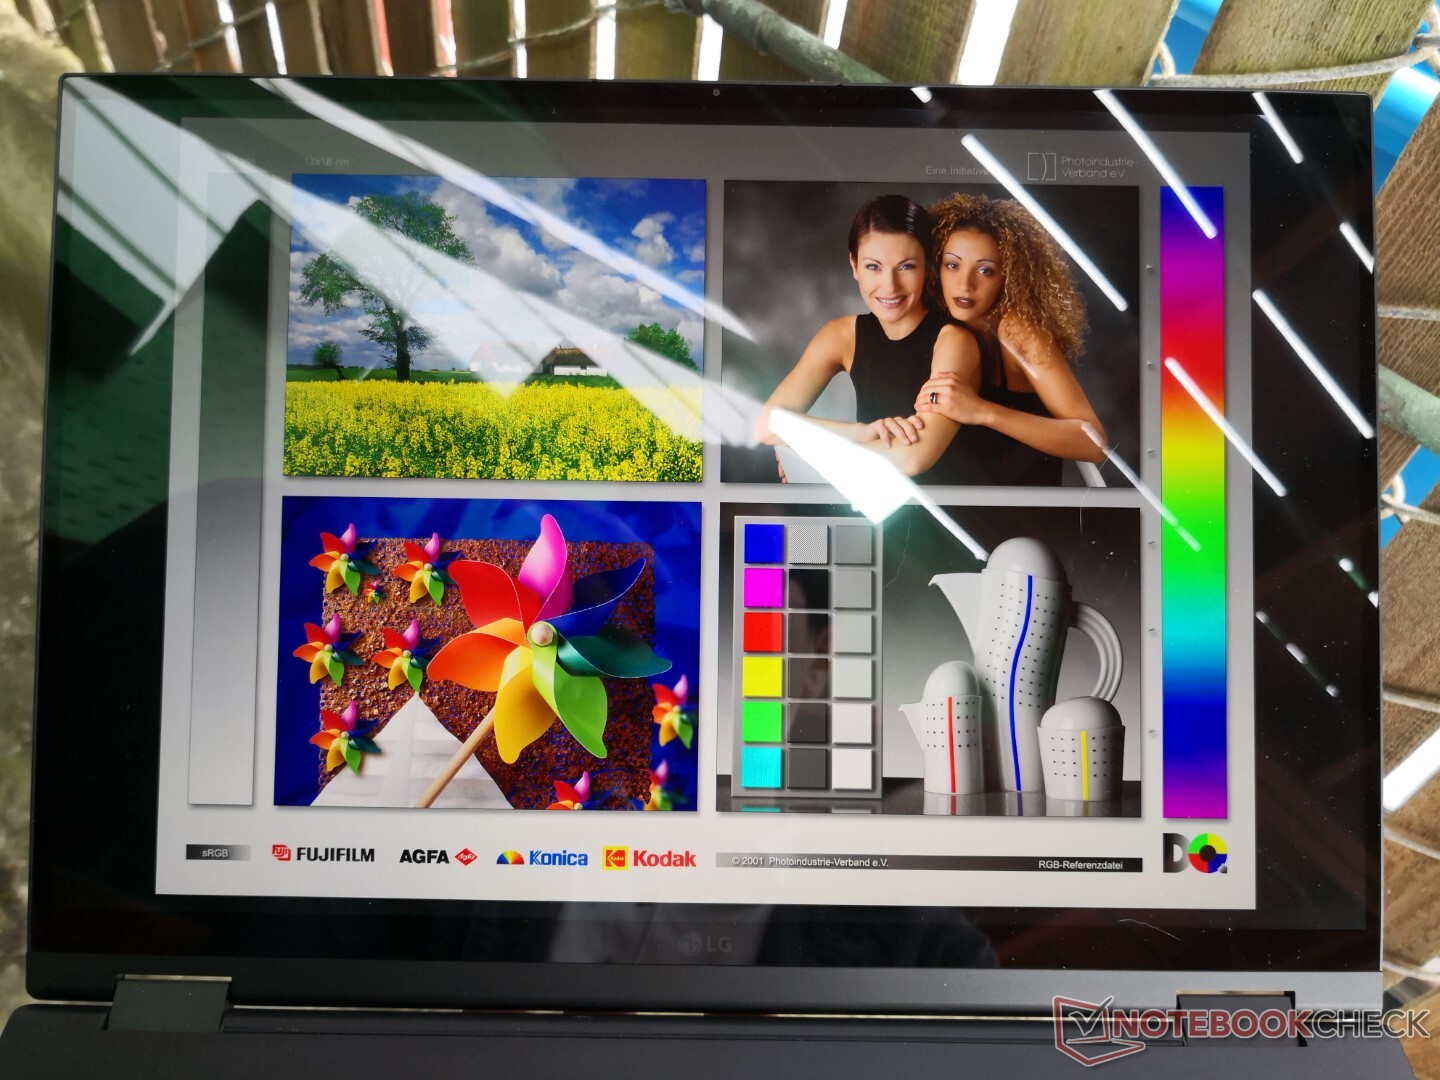
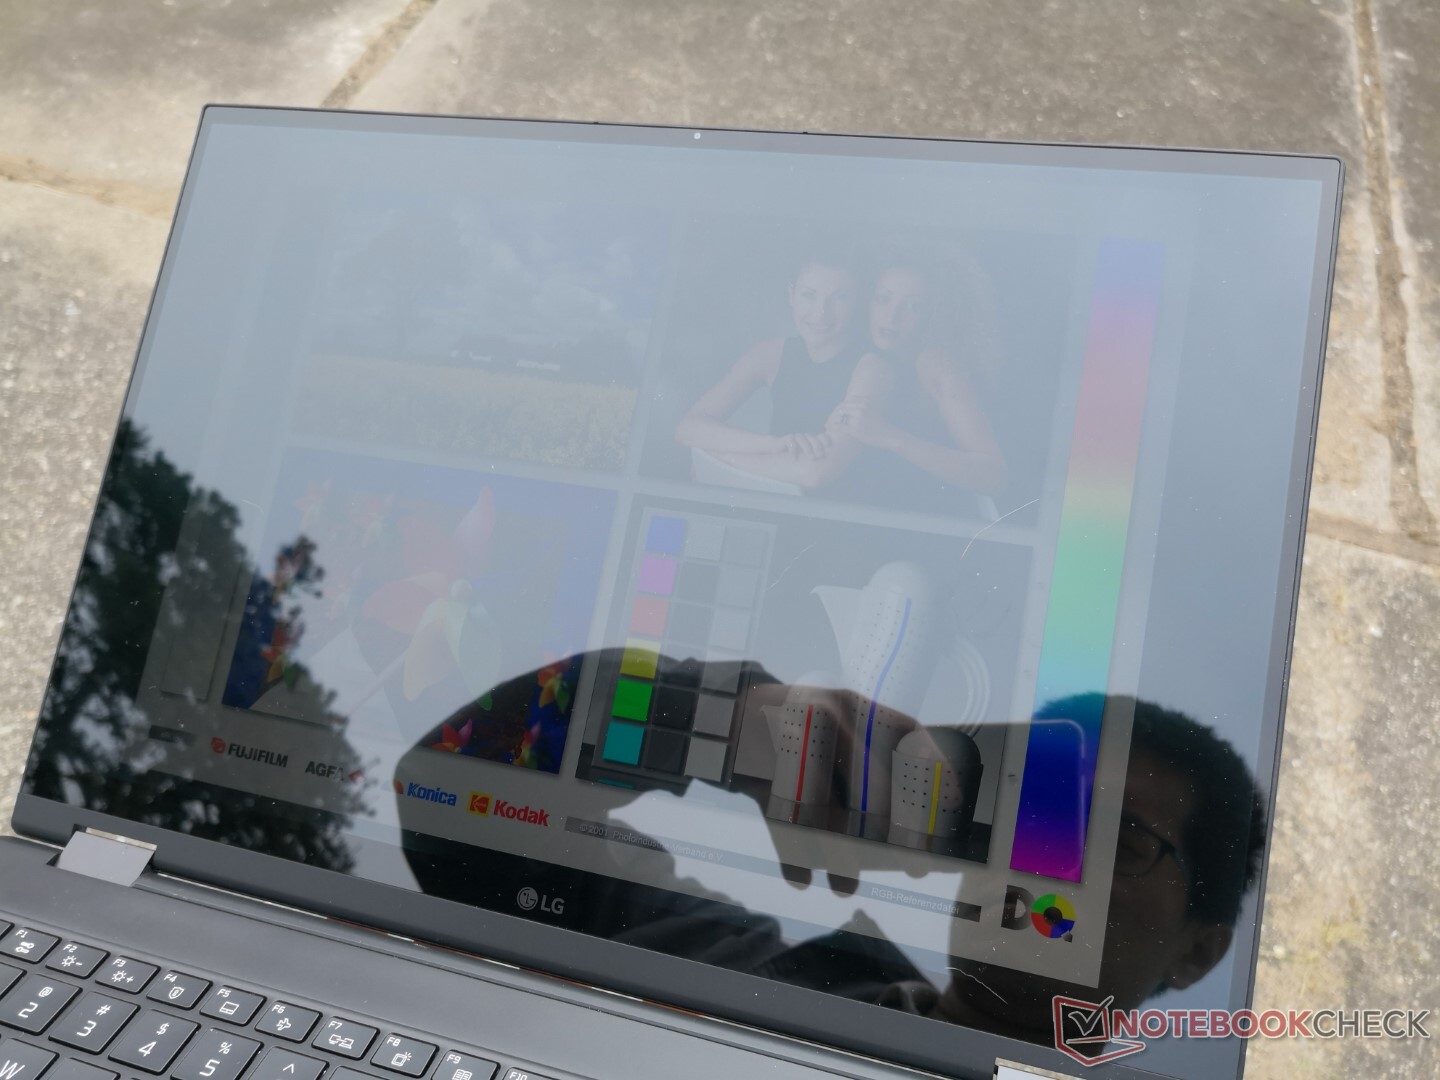
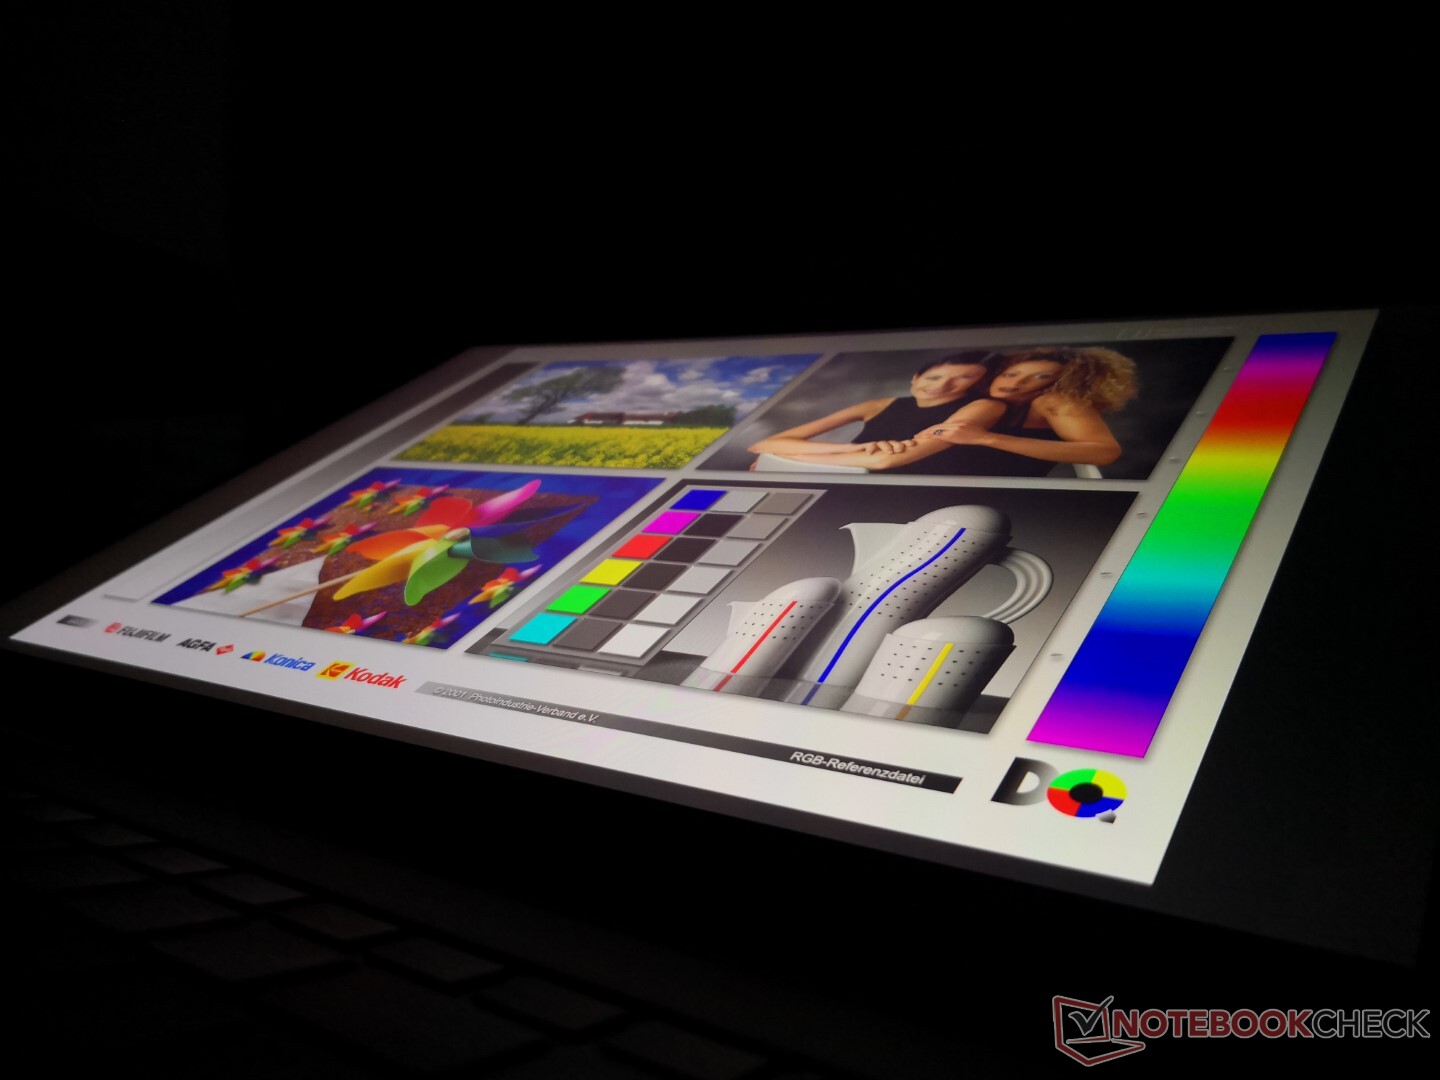
Outdoor visibility isn't as good as we had hoped. Generally, we believe that convertible laptops should have brighter displays than clamshells as owners would be more likely to use convertible laptops outdoors or on-the-go. The display on the LG Gram 16 2-in-1 isn't significantly brighter than the display on the Gram 15 clamshell which is disappointing to see. Glare is almost unavoidable as shown by the pictures below.
Performance
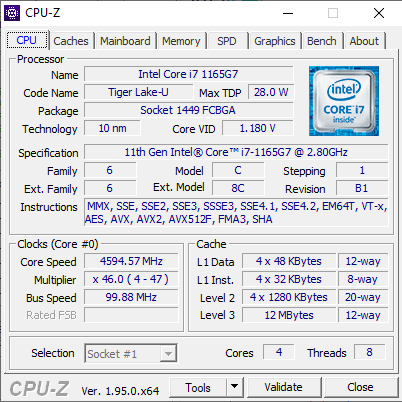
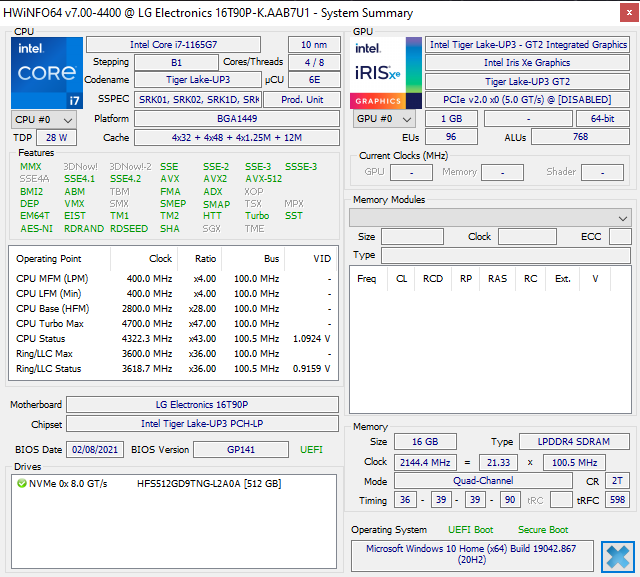
Like other Gram laptops in its family, the Gram 16 2-in-1 relies only on a Core U-series CPU to keep overall weight and thickness to a minimum. The 11th gen Core i7-1165G7 is a huge upgrade over both 10th gen Ice Lake and 8th gen Whiskey Lake-U in terms of graphics performance which is what the older Gram laptops were sorely lacking. There are still no AMD options, however, likely to keep production costs under control.
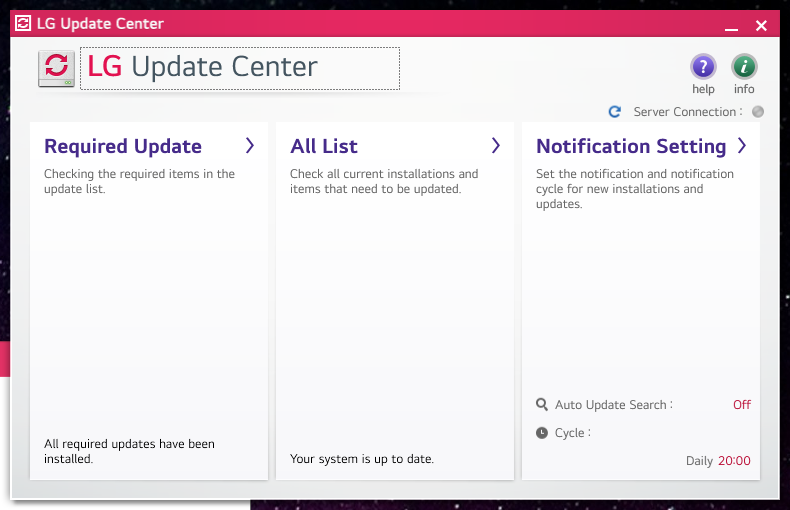
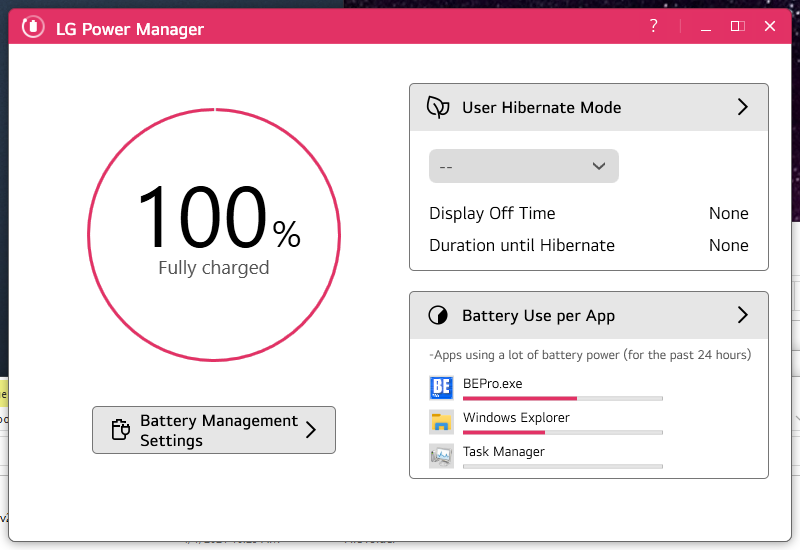
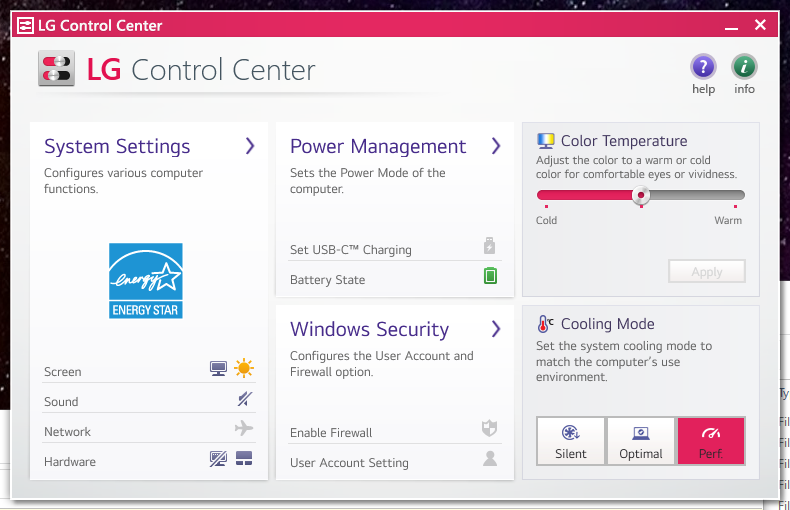
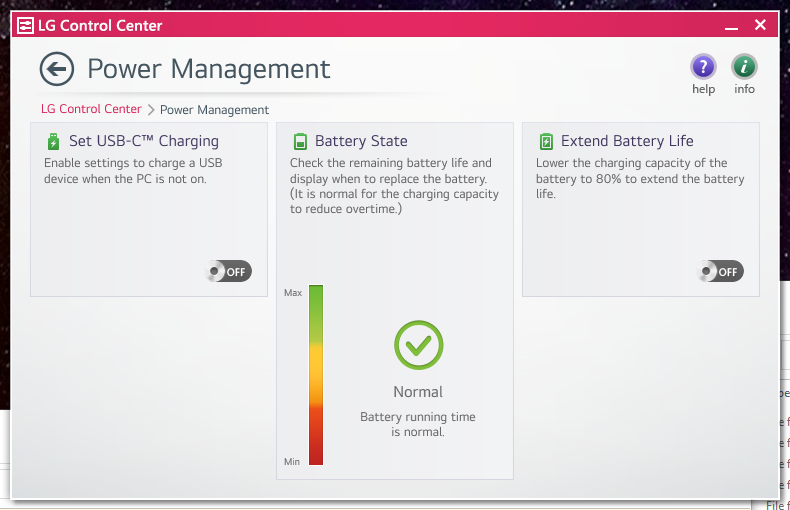
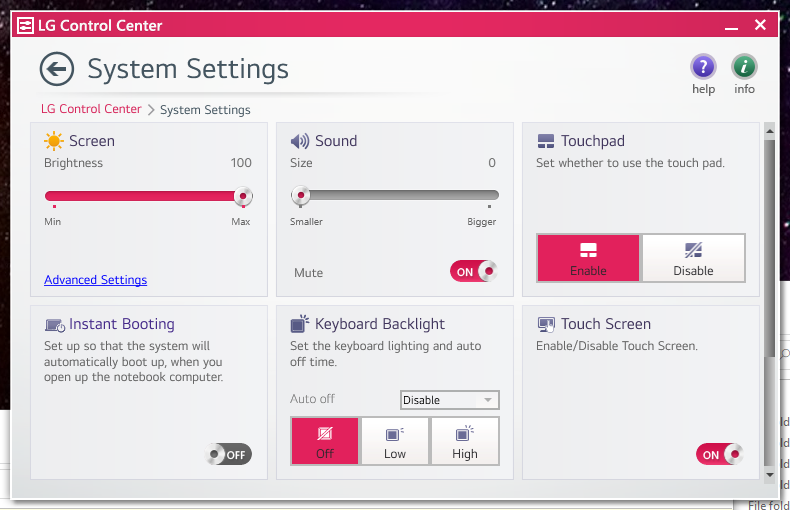
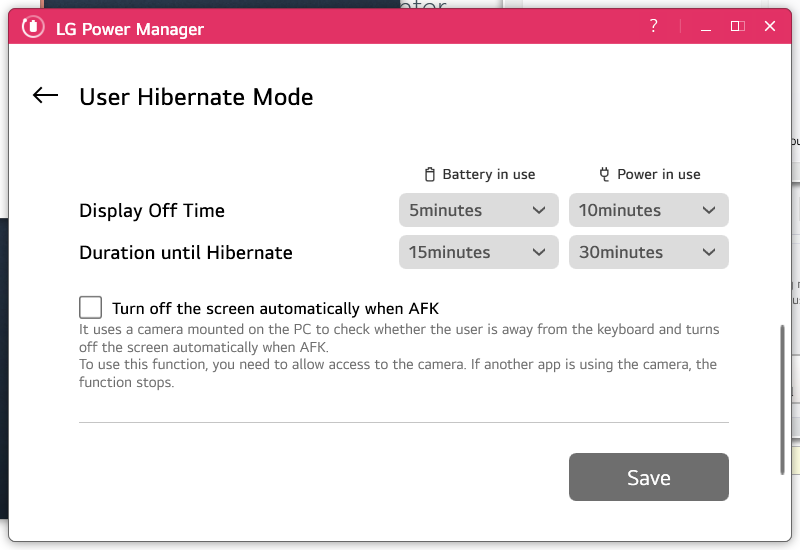
It's highly recommended that owners become familiar with the pre-installed LG Control Center, Update, and Reader Mode applications as their in-app settings directly influence the user experience. Control Center in particular is important as the Silent, Optimal, and Performance power profile settings are toggled here. Our system was set to Performance mode prior to running any performance benchmarks below. Annoyingly, the power profile automatically resets to Optimal mode each and every time the PC restarts.
Processor
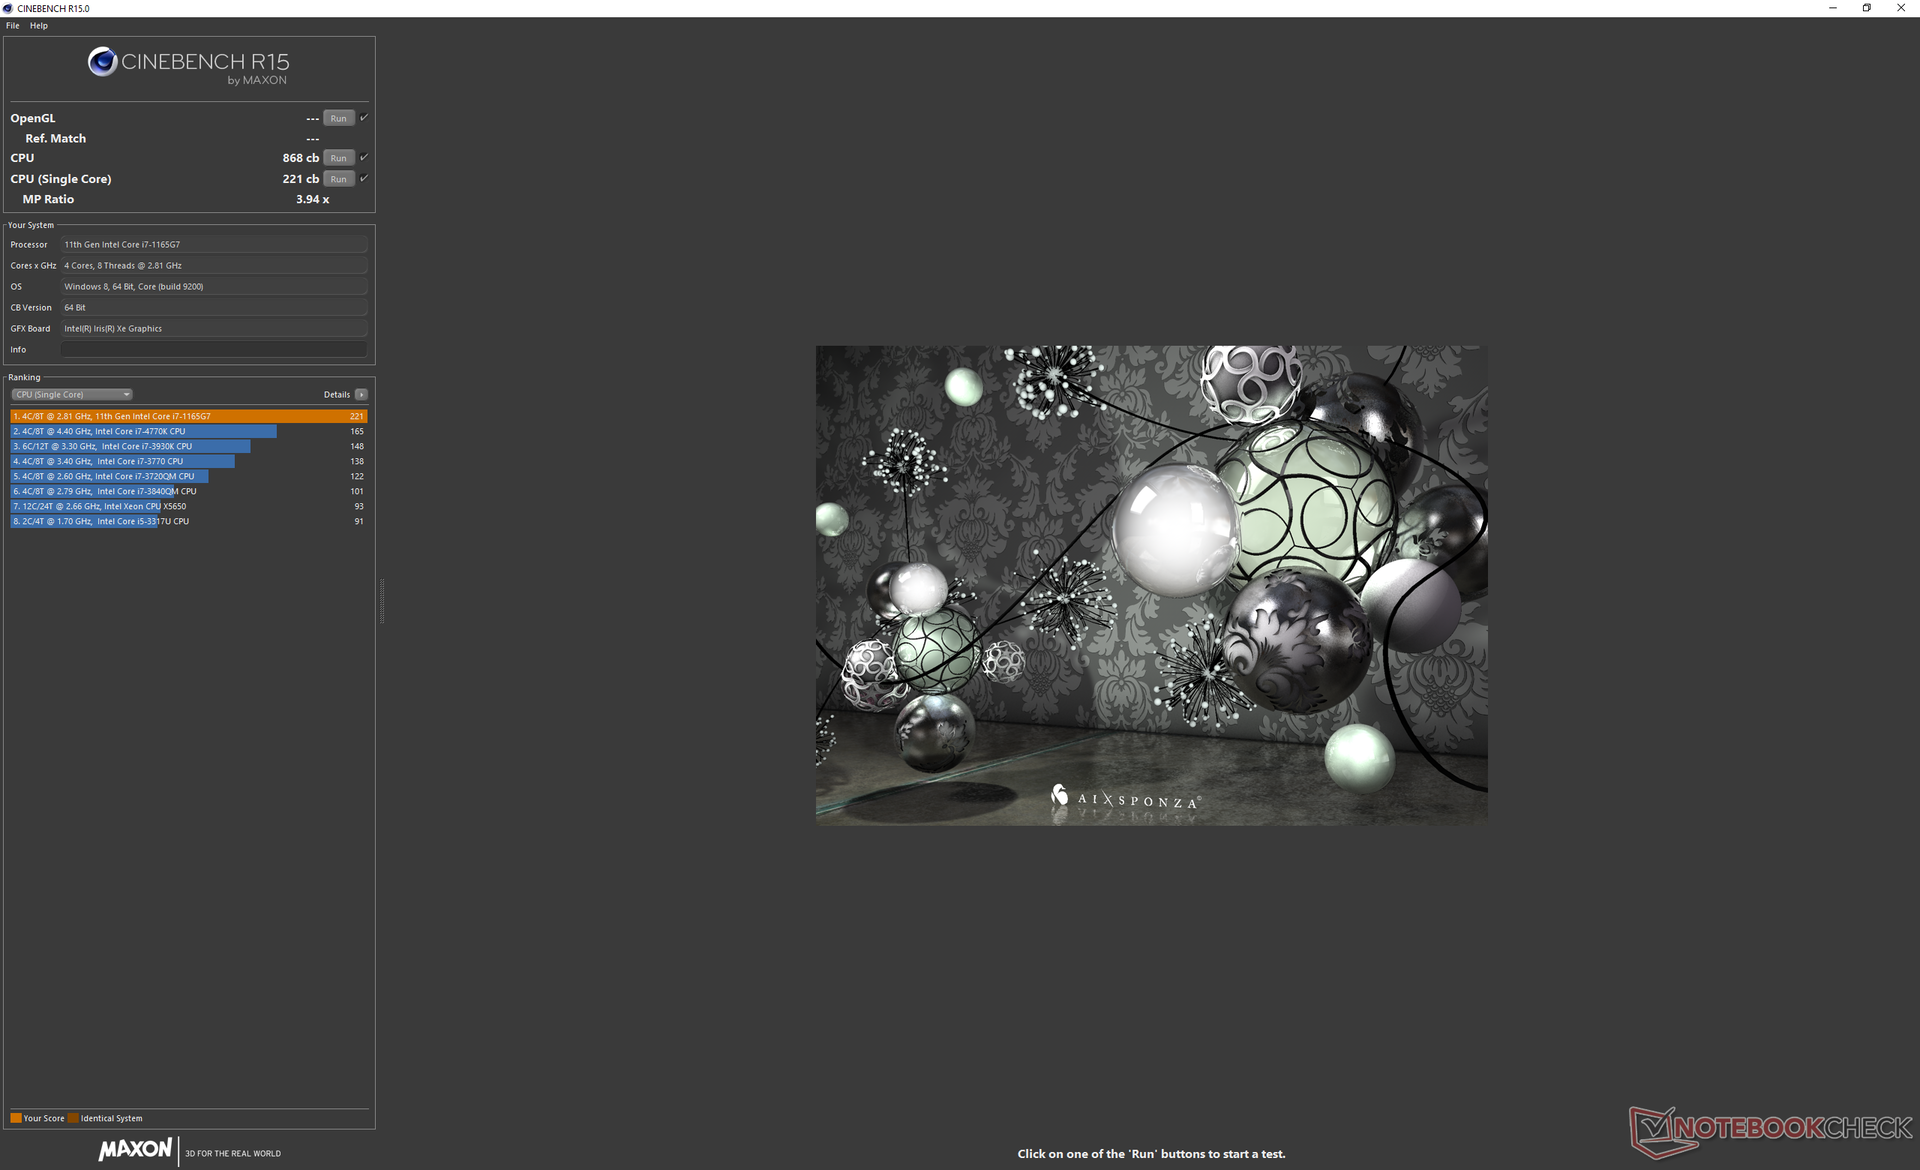
While single-thread performance is excellent, multi-thread performance is a mixed bag with results that are generally lower than the average Core i7-1165G7 laptop in our database. CineBench R15 xT, for example, is roughly 20 percent slower than expected due to the system's very short Turbo Boost potential. The Dell Inspiron 15 7506 2-in-1 and Asus VivoBook 15 each with the same Core i7-1165G7 CPU are able to consistently maintain faster CPU clock rates than our Gram convertible when under the same stressful benchmark conditions.
Despite the somewhat underwhelming processor performance, overall performance is still an upgrade over existing Gram laptops running on Ice Lake or older CPUs by wide margins.

Cinebench R15: CPU Multi 64Bit | CPU Single 64Bit
Blender: v2.79 BMW27 CPU
7-Zip 18.03: 7z b 4 -mmt1 | 7z b 4
Geekbench 5.5: Single-Core | Multi-Core
HWBOT x265 Benchmark v2.2: 4k Preset
LibreOffice : 20 Documents To PDF
R Benchmark 2.5: Overall mean
| HWBOT x265 Benchmark v2.2 / 4k Preset | |
| Apple MacBook Pro 16 2019 i9 5500M | |
| Lenovo ThinkPad E15 Gen2-20T9S00K00 | |
| Dell XPS 15 9500 Core i5 | |
| LG Gram 16 2-in-1 16T90P | |
| Average Intel Core i7-1165G7 (1.39 - 8.47, n=80) | |
| Honor MagicBook Pro 10210U | |
| HP Envy x360 15-ee0257ng | |
| Lenovo ThinkPad T15 Gen1-20S7S02U00 | |
| Acer Aspire 5 A515-56-511A | |
| Acer Swift 3 SF314-42-R27B | |
Cinebench R15: CPU Multi 64Bit | CPU Single 64Bit
Blender: v2.79 BMW27 CPU
7-Zip 18.03: 7z b 4 -mmt1 | 7z b 4
Geekbench 5.5: Single-Core | Multi-Core
HWBOT x265 Benchmark v2.2: 4k Preset
LibreOffice : 20 Documents To PDF
R Benchmark 2.5: Overall mean
* ... smaller is better
System Performance
PCMark results are excellent and within just a few percentage points of the average laptop in our database equipped with the same Core i7-1165G7 CPU. We experienced no software or hardware issues during our time with the test unit.
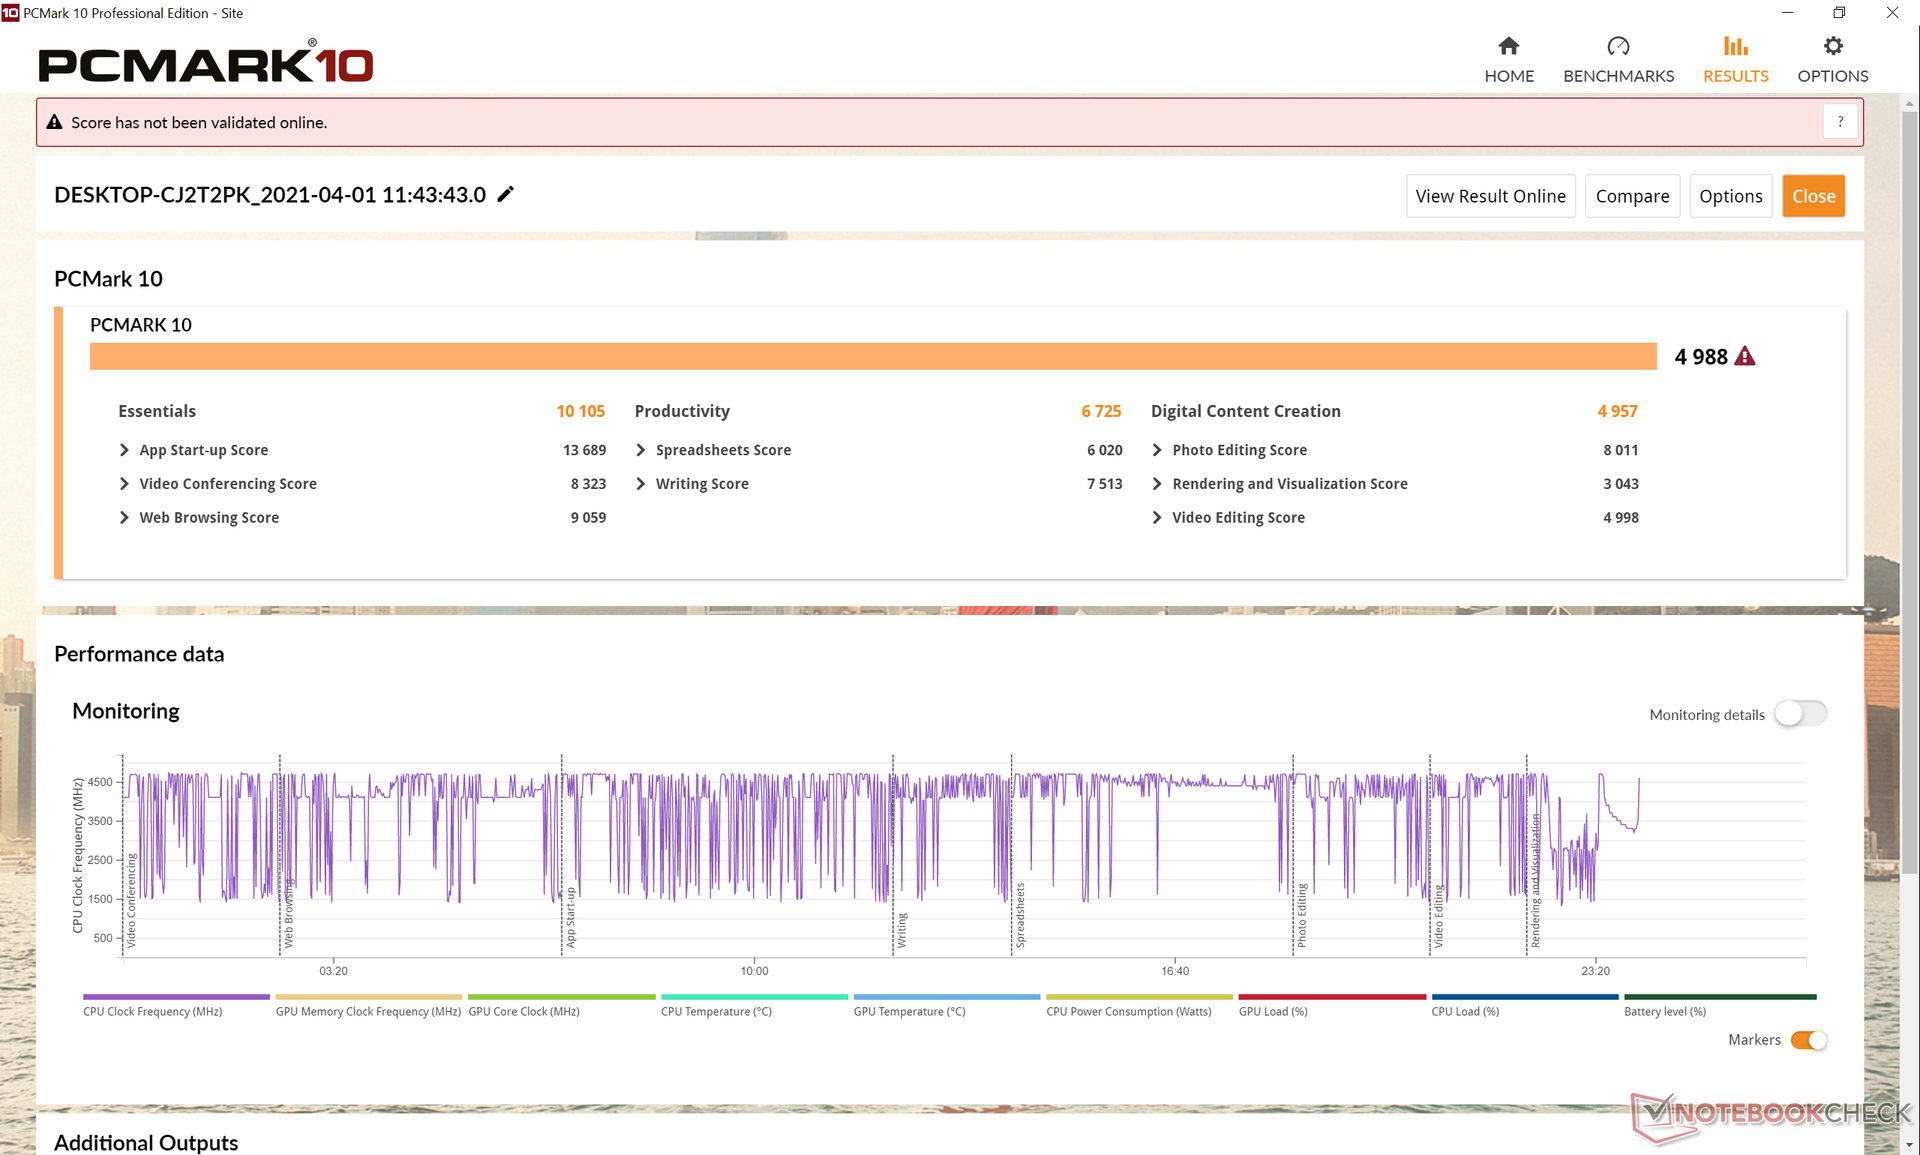
| PCMark 10 Score | 4988 points | |
Help | ||
DPC Latency
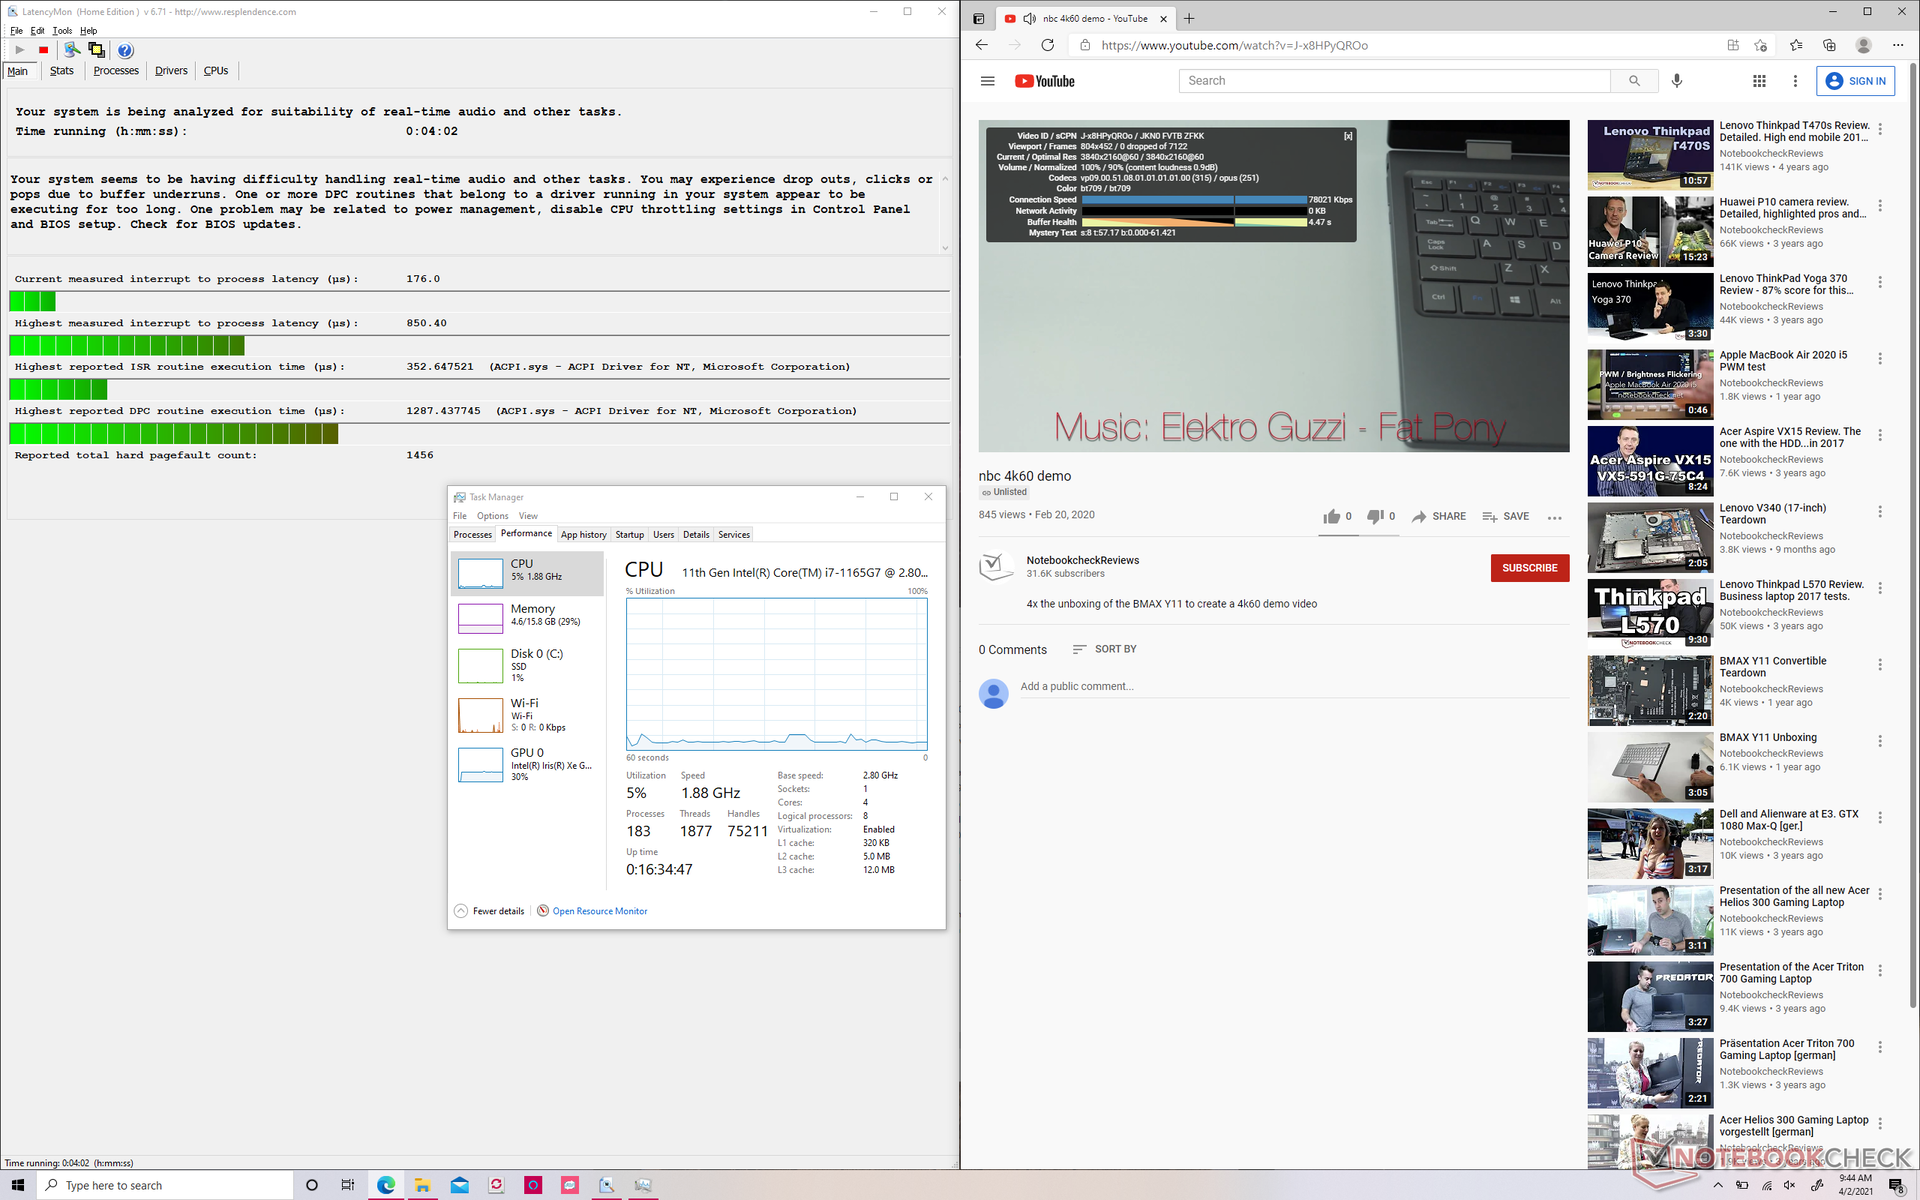
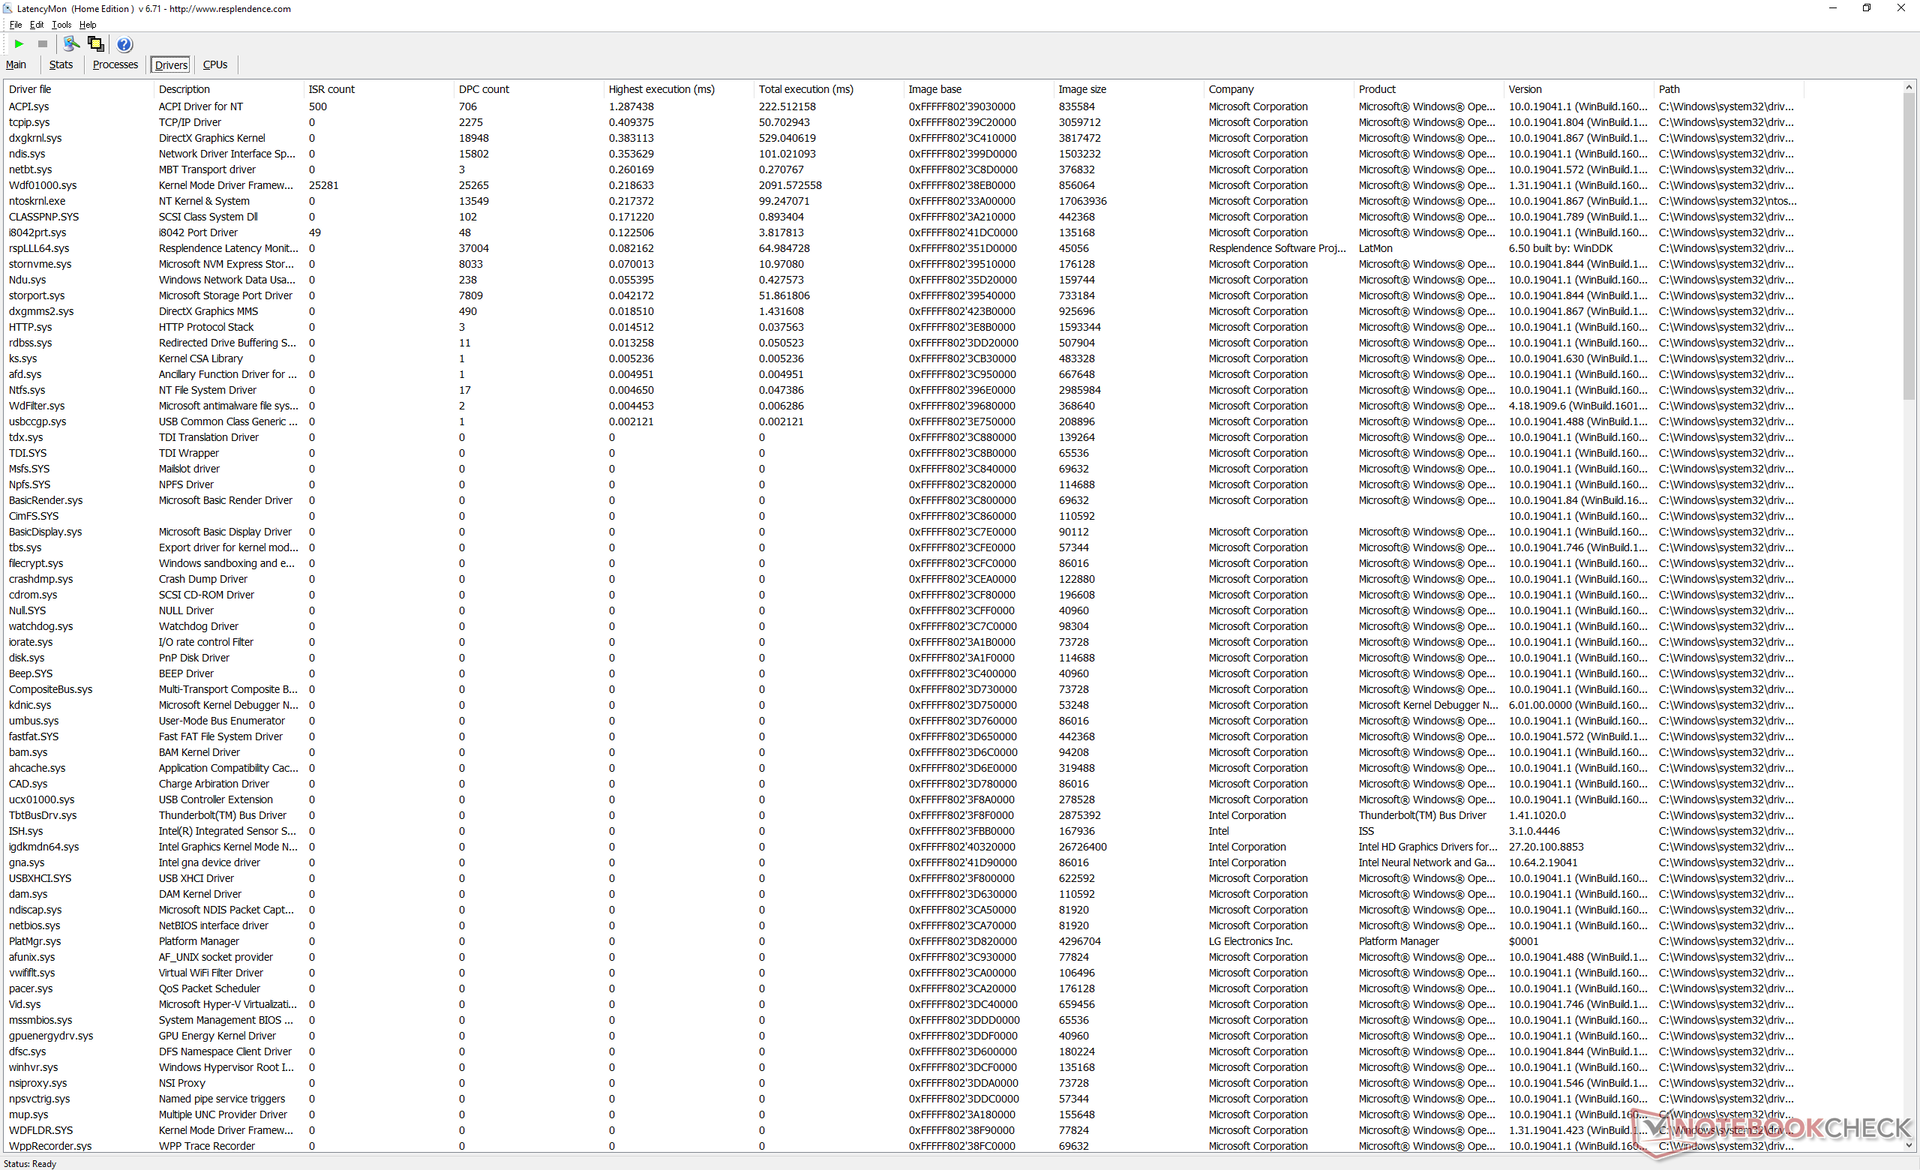
LatencyMon shows minor DPC latency issues when opening multiple tabs on our homepage. 4K video playback at 60 FPS is smooth and with no dropped frames during testing.
| DPC Latencies / LatencyMon - interrupt to process latency (max), Web, Youtube, Prime95 | |
| Dell XPS 15 9500 Core i5 | |
| LG Gram 16 2-in-1 16T90P | |
| Asus ZenBook UX535-M01440 | |
| Honor MagicBook Pro 10210U | |
* ... smaller is better
Storage Devices
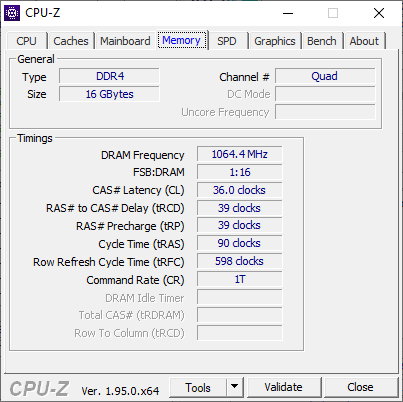
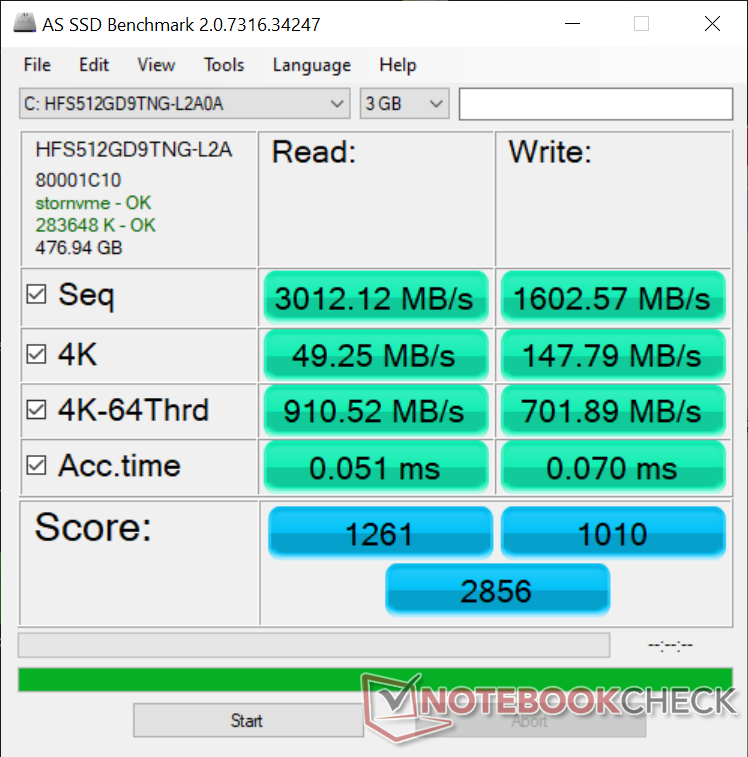
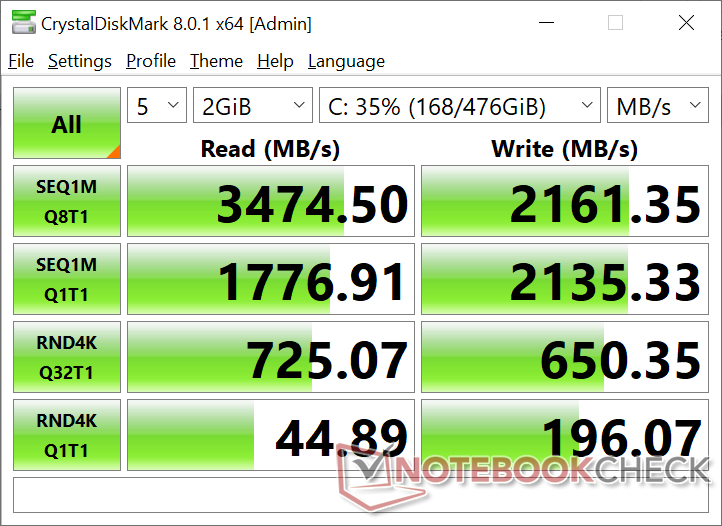
LG Gram laptops come with drives from either SK Hynix or Samsung. In our case, the Gram 16 2-in-1 ships with the SK Hynix PC401 for excellent sequential read and write rates reaching 2000 to 3000 MB/s. Users can add a second M.2 drive if they can carefully remove the bottom panel.
| LG Gram 16 2-in-1 16T90P SK Hynix PC401 512GB M.2 (HFS512GD9TNG) | Honor MagicBook Pro 10210U Toshiba XG6 KXG60ZNV512G | Apple MacBook Pro 16 2019 i9 5500M Apple SSD AP1024 7171 | Dell XPS 15 9500 Core i5 Toshiba KBG40ZNS256G NVMe | HP Spectre X360 15-5ZV31AV Intel SSD 660p 2TB SSDPEKNW020T8 | |
|---|---|---|---|---|---|
| AS SSD | 12% | 5% | -90% | -17% | |
| Seq Read (MB/s) | 3012 | 2654 -12% | 2531 -16% | 1423 -53% | 1220 -59% |
| Seq Write (MB/s) | 1603 | 802 -50% | 2289 43% | 766 -52% | 1152 -28% |
| 4K Read (MB/s) | 49.25 | 42.15 -14% | 15.85 -68% | 42.21 -14% | 52.3 6% |
| 4K Write (MB/s) | 147.8 | 118.2 -20% | 39.88 -73% | 74.8 -49% | 146.6 -1% |
| 4K-64 Read (MB/s) | 911 | 1411 55% | 1267 39% | 973 7% | 652 -28% |
| 4K-64 Write (MB/s) | 702 | 1344 91% | 1749 149% | 218.8 -69% | 847 21% |
| Access Time Read * (ms) | 0.051 | 0.075 -47% | 0.122 -139% | 0.125 -145% | 0.077 -51% |
| Access Time Write * (ms) | 0.07 | 0.035 50% | 0.095 -36% | 0.552 -689% | 0.106 -51% |
| Score Read (Points) | 1261 | 1718 36% | 1536 22% | 1157 -8% | 826 -34% |
| Score Write (Points) | 1010 | 1542 53% | 2018 100% | 370 -63% | 1109 10% |
| Score Total (Points) | 2856 | 4048 42% | 4317 51% | 2094 -27% | 2371 -17% |
| Copy ISO MB/s (MB/s) | 1891 | 1961 4% | 1995 5% | 1151 -39% | 2070 9% |
| Copy Program MB/s (MB/s) | 595 | 480.5 -19% | 584 -2% | 499.4 -16% | 571 -4% |
| Copy Game MB/s (MB/s) | 1282 | 1191 -7% | 1135 -11% | 733 -43% | 1219 -5% |
| CrystalDiskMark 5.2 / 6 | -21% | -23% | -37% | -23% | |
| Write 4K (MB/s) | 202.4 | 162 -20% | 55.5 -73% | 93.3 -54% | 151.5 -25% |
| Read 4K (MB/s) | 45.48 | 46.52 2% | 16.21 -64% | 45.9 1% | 59.3 30% |
| Write Seq (MB/s) | 2136 | 1638 -23% | 1959 -8% | 1211 -43% | 1424 -33% |
| Read Seq (MB/s) | 1843 | 1922 4% | 1763 -4% | 1633 -11% | 1609 -13% |
| Write 4K Q32T1 (MB/s) | 681 | 410.3 -40% | 398.5 -41% | 273.1 -60% | 393.6 -42% |
| Read 4K Q32T1 (MB/s) | 754 | 493.5 -35% | 648 -14% | 356 -53% | 369.4 -51% |
| Write Seq Q32T1 (MB/s) | 2149 | 1085 -50% | 2727 27% | 1198 -44% | 1946 -9% |
| Read Seq Q32T1 (MB/s) | 3473 | 3212 -8% | 3242 -7% | 2269 -35% | 1934 -44% |
| Total Average (Program / Settings) | -5% /
-0% | -9% /
-5% | -64% /
-71% | -20% /
-19% |
* ... smaller is better

Disk Throttling: DiskSpd Read Loop, Queue Depth 8
GPU Performance
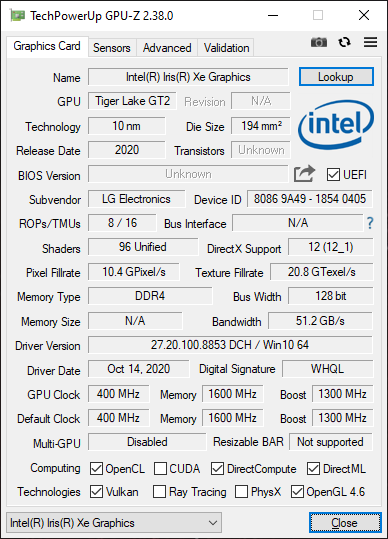
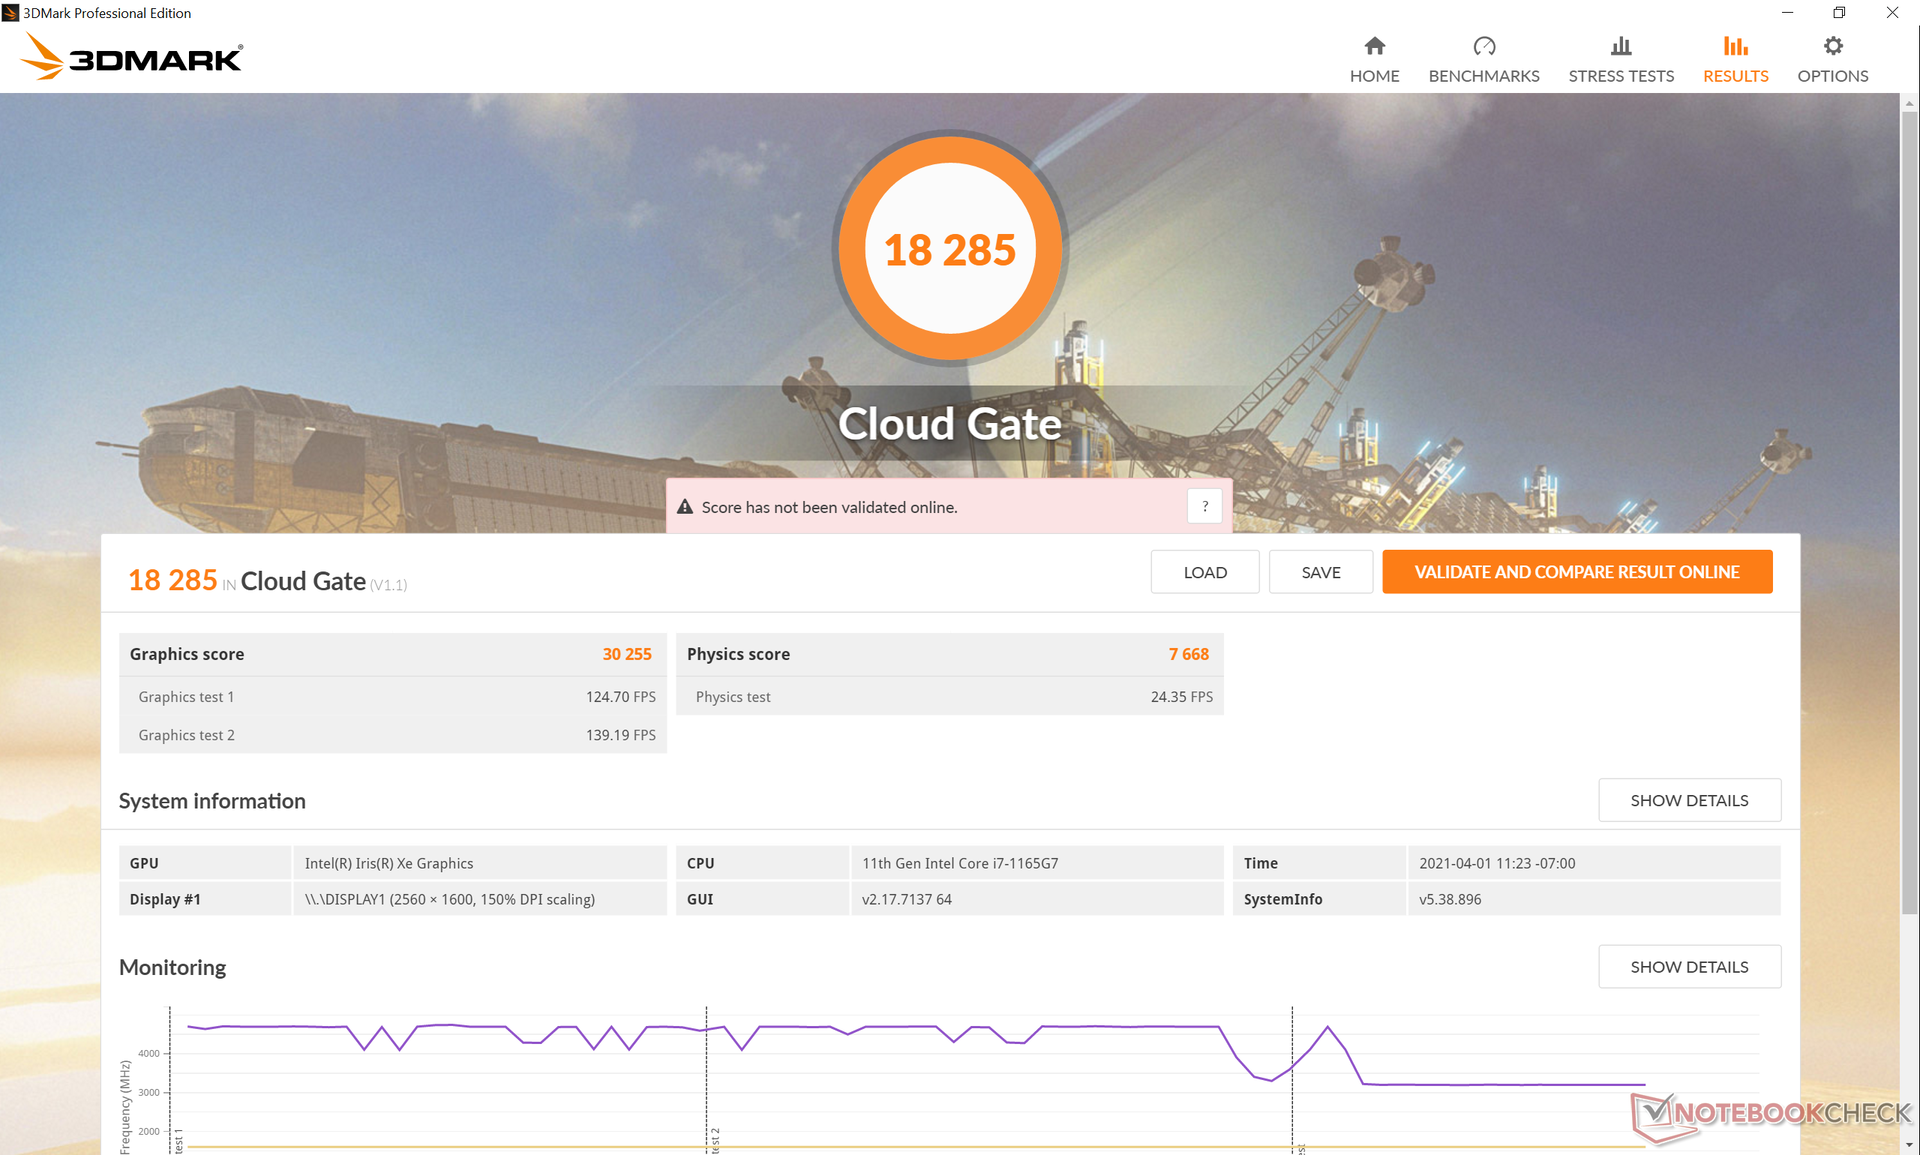
Graphics performance is where we expect it to be relative to other laptops with the same Iris Xe GPU. They are especially improved over the underwhelming Iris Plus Graphics G7 that we experienced on last year's Gram 15. Nonetheless, performance in games may not be very steady. Simply idling on Witcher 3, for example, would see frame rates fluctuate between 53 and 57 FPS as shown by the graph below.
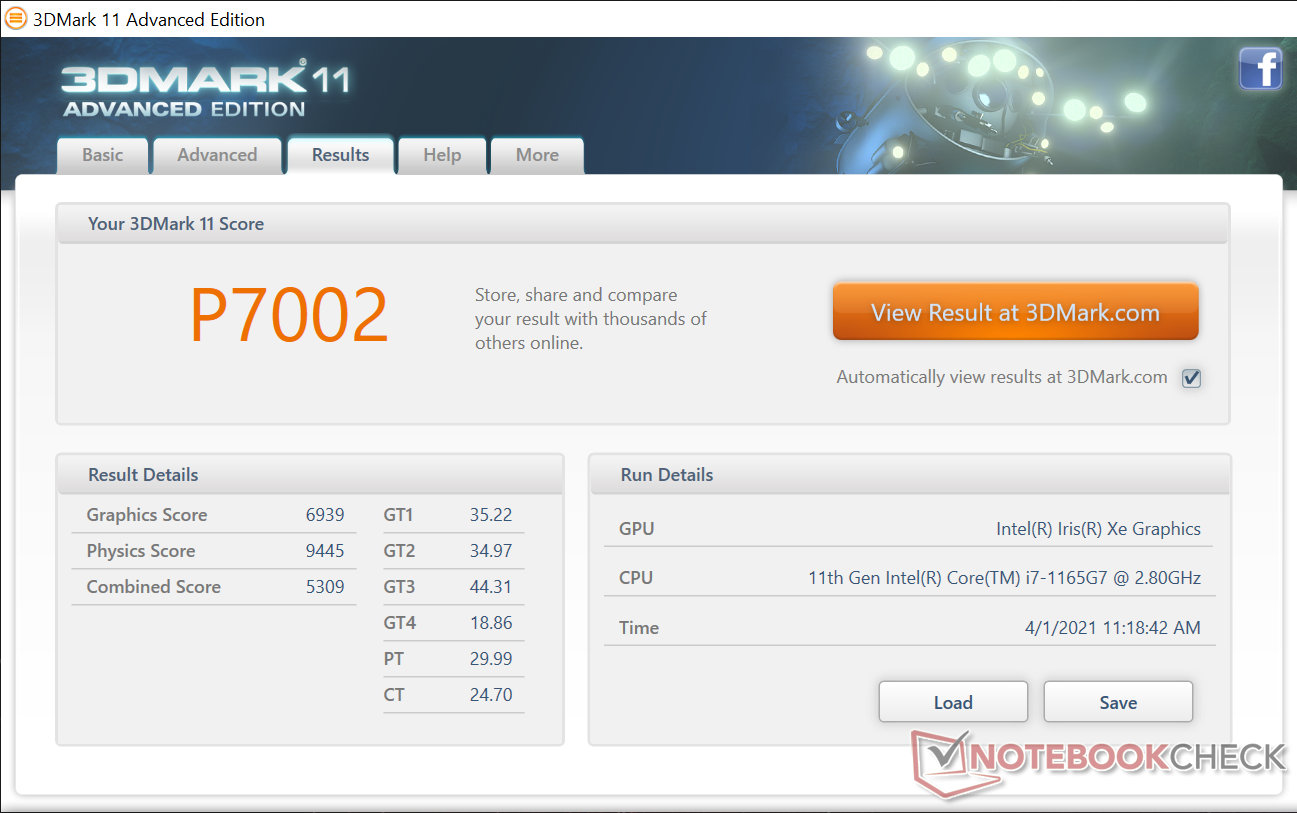
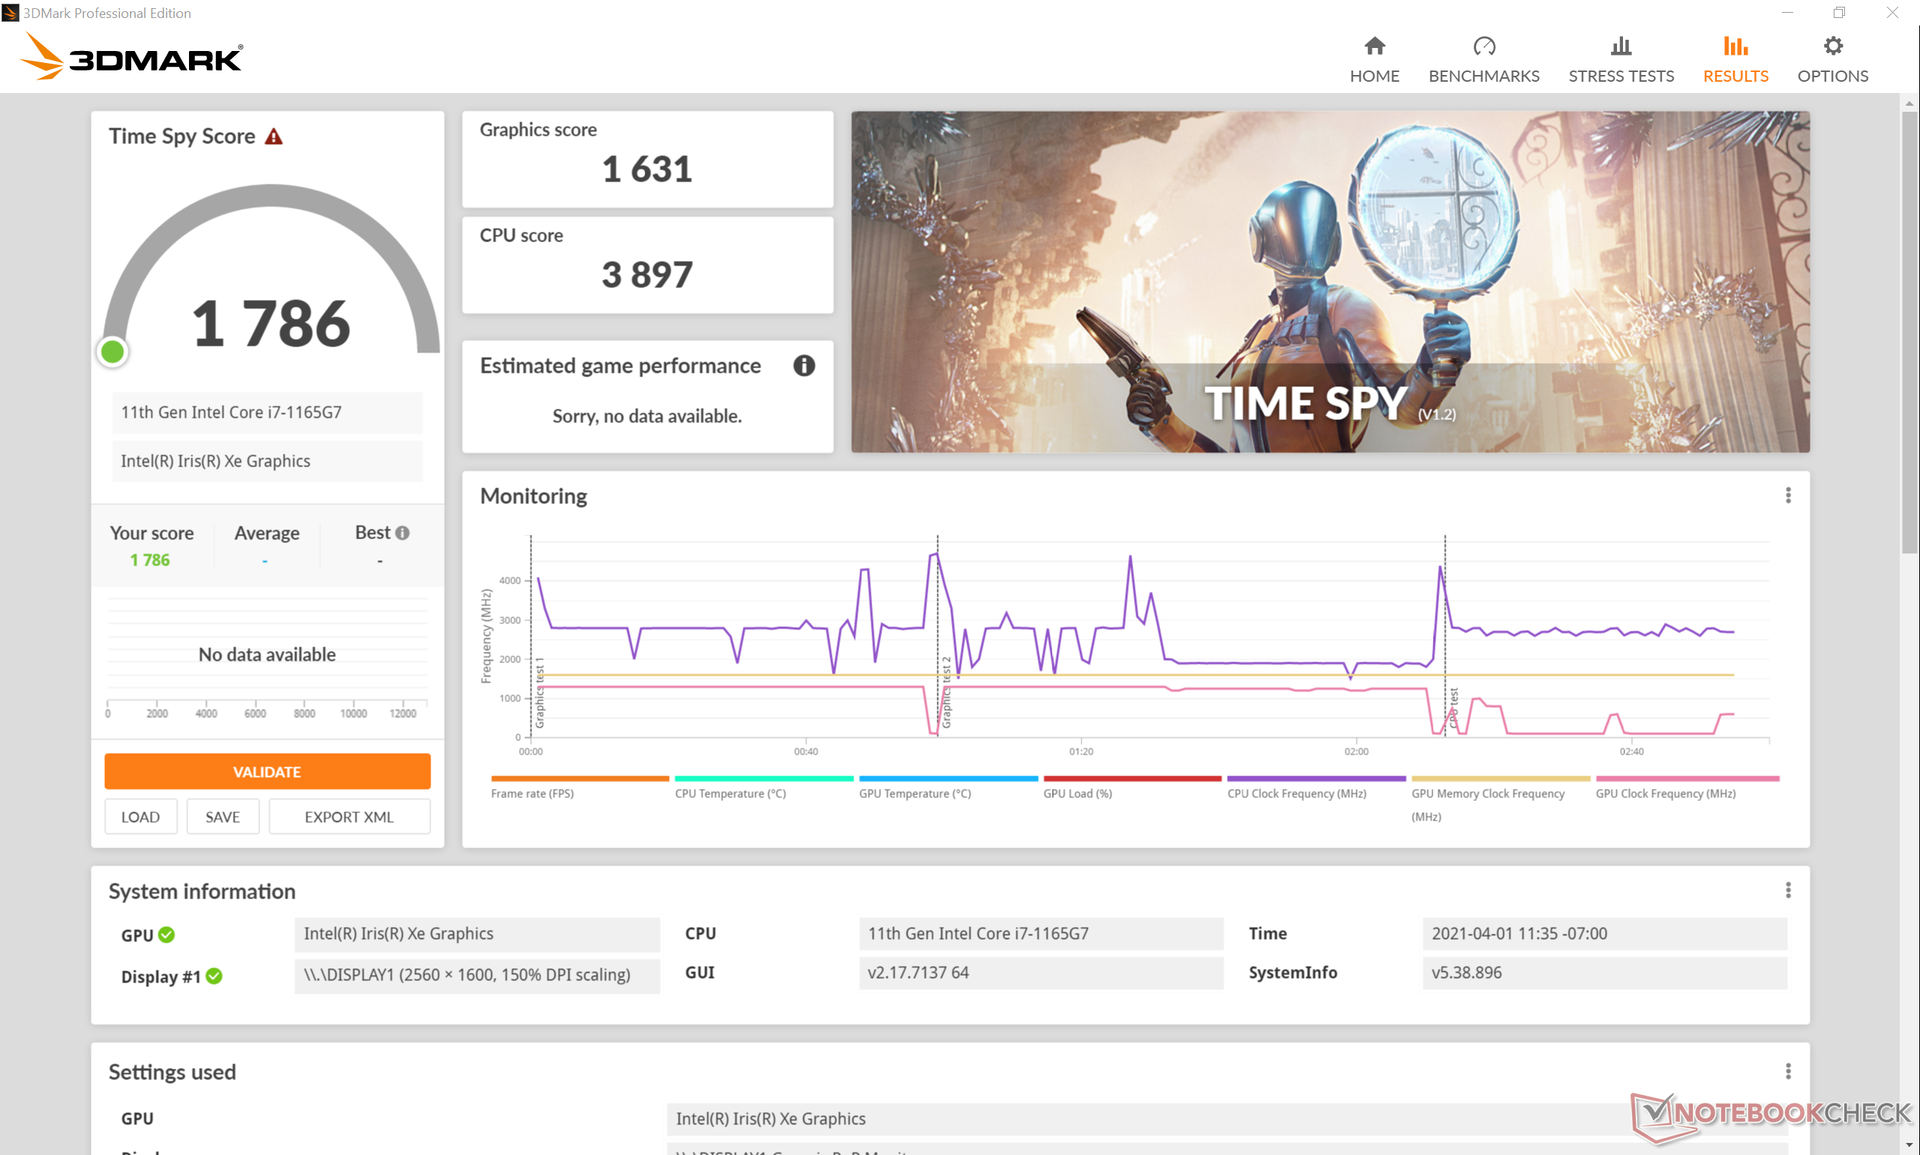
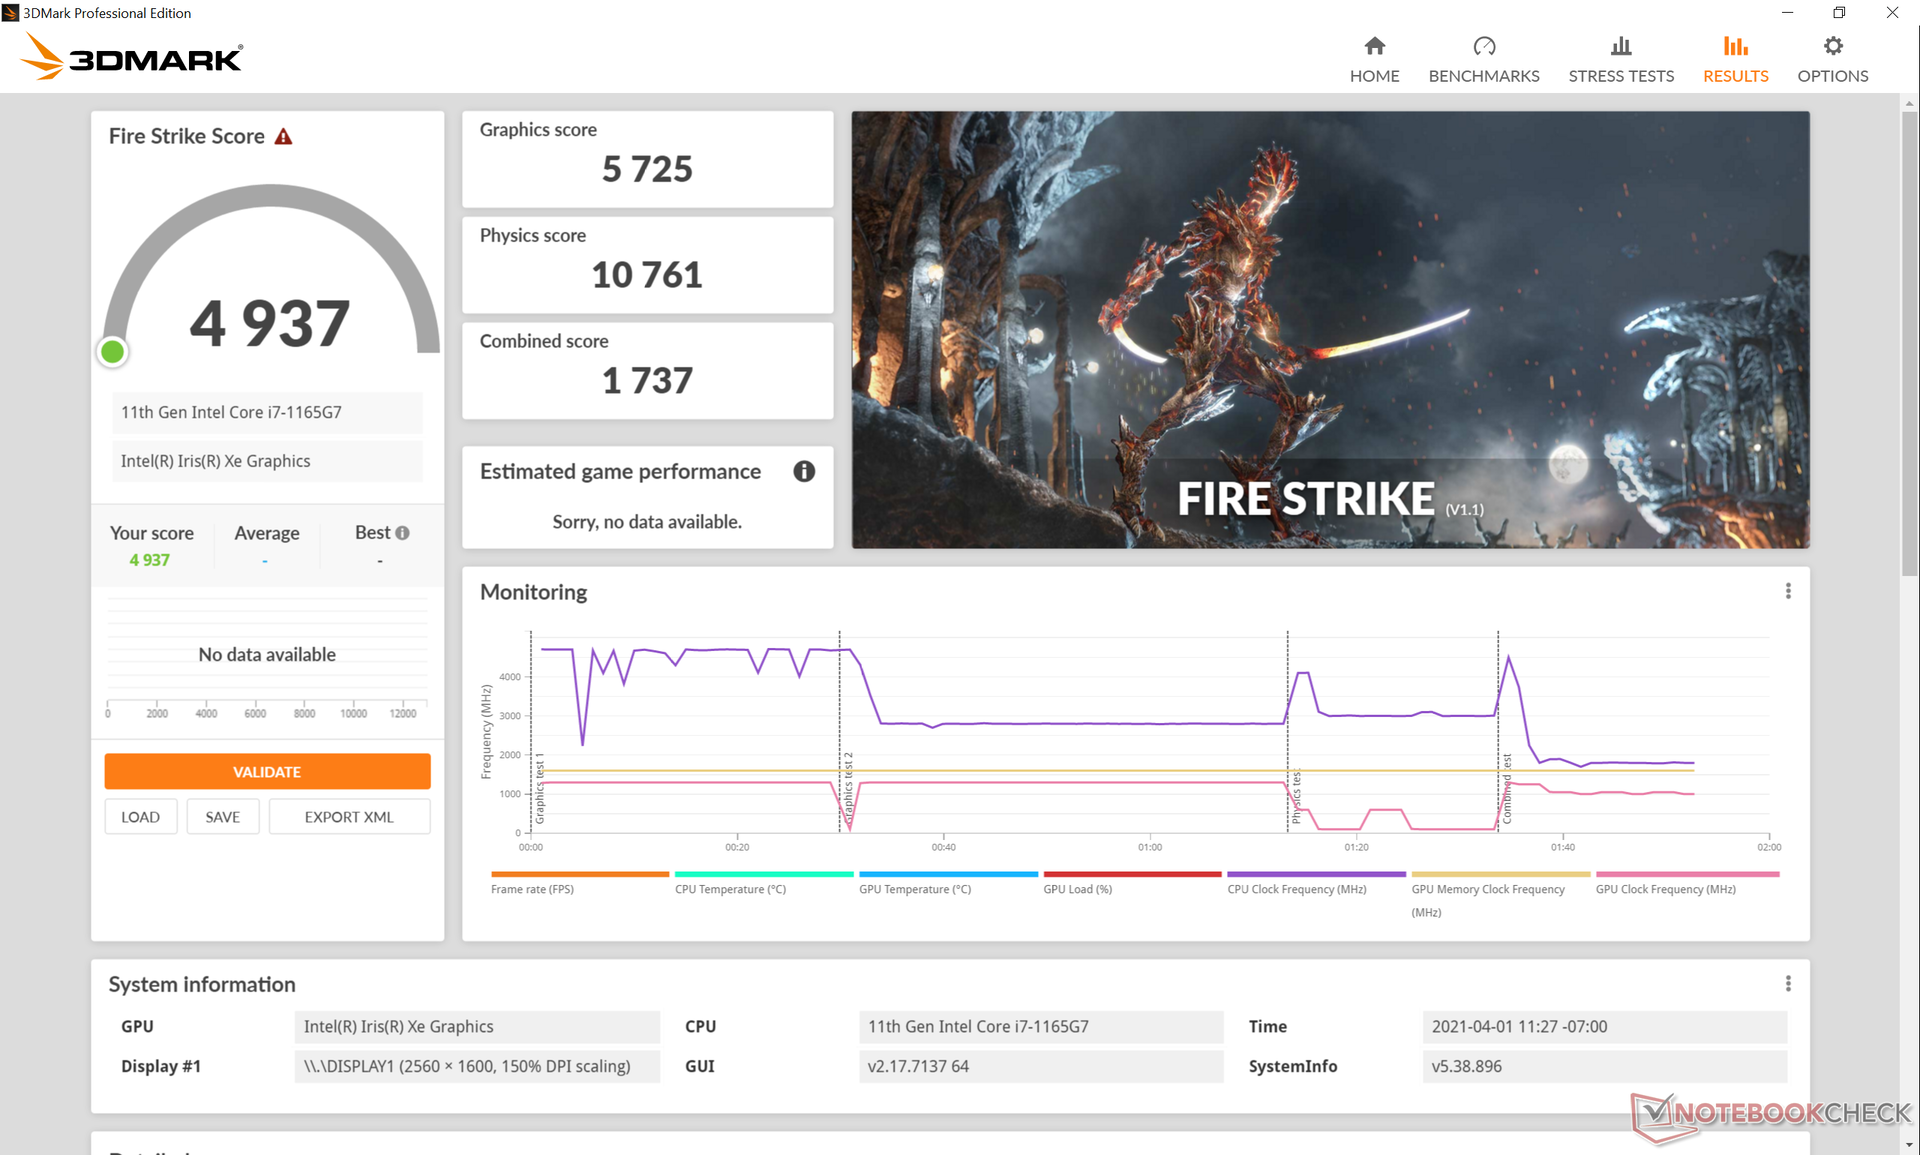
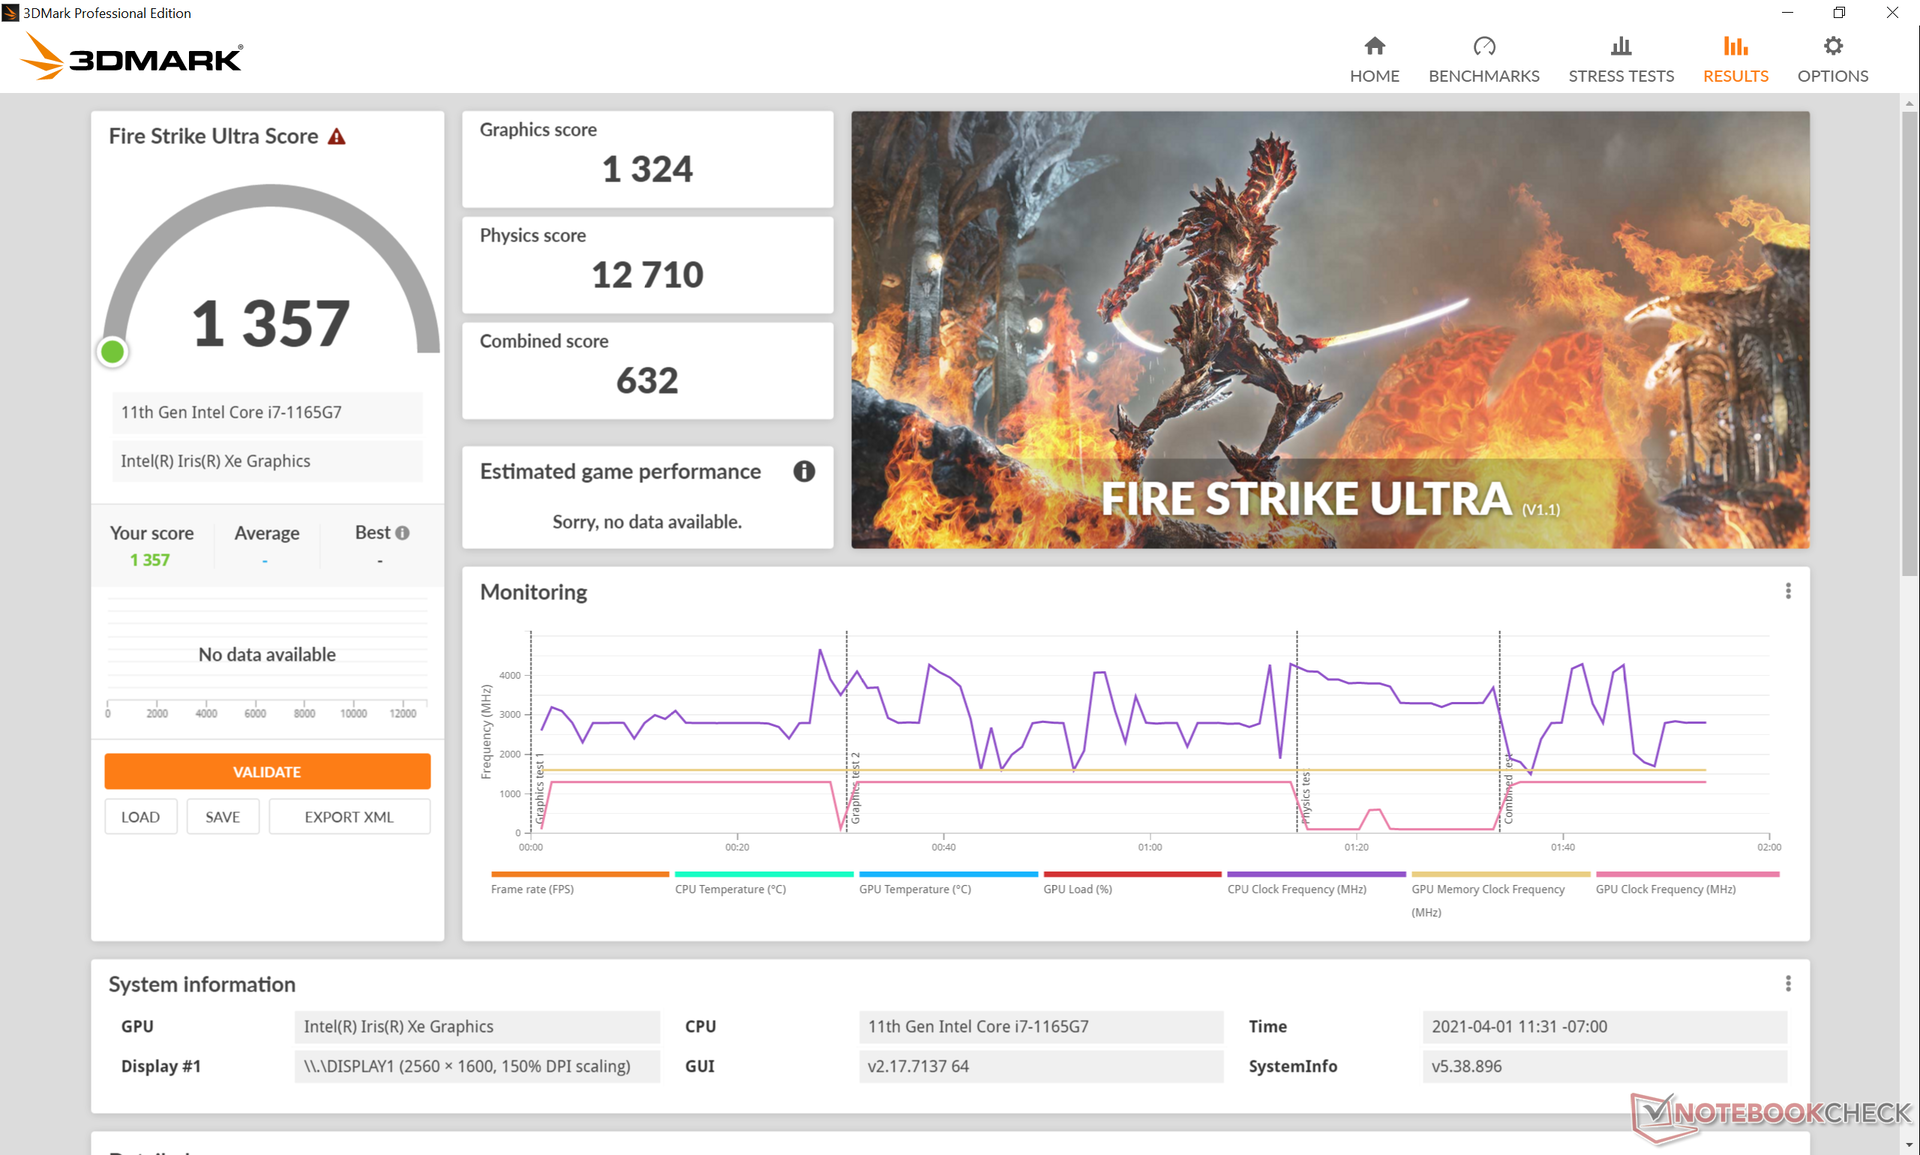
| 3DMark 11 Performance | 7002 points | |
| 3DMark Cloud Gate Standard Score | 18285 points | |
| 3DMark Fire Strike Score | 4937 points | |
| 3DMark Time Spy Score | 1786 points | |
Help | ||
| Strange Brigade | |
| 1280x720 lowest AF:1 | |
| LG Gram 16 2-in-1 16T90P | |
| Dell Inspiron 15 7000 7506 2-in-1 Black Edition | |
| Average Intel Iris Xe Graphics G7 96EUs (48.5 - 115.1, n=172) | |
| 1920x1080 medium AA:medium AF:4 | |
| LG Gram 16 2-in-1 16T90P | |
| Dell Inspiron 15 7000 7506 2-in-1 Black Edition | |
| Average Intel Iris Xe Graphics G7 96EUs (18.2 - 51.4, n=170) | |
| 1920x1080 high AA:high AF:8 | |
| Dell Inspiron 15 7000 7506 2-in-1 Black Edition | |
| LG Gram 16 2-in-1 16T90P | |
| Average Intel Iris Xe Graphics G7 96EUs (15.4 - 39.8, n=169) | |
| 1920x1080 ultra AA:ultra AF:16 | |
| Dell Inspiron 15 7000 7506 2-in-1 Black Edition | |
| LG Gram 16 2-in-1 16T90P | |
| Average Intel Iris Xe Graphics G7 96EUs (13.2 - 31.7, n=167) | |
| low | med. | high | ultra | |
|---|---|---|---|---|
| GTA V (2015) | 93.1 | 81.5 | 28 | 12.3 |
| The Witcher 3 (2015) | 97.1 | 60.5 | 44.7 | 15.3 |
| Dota 2 Reborn (2015) | 82.8 | 69 | 50.1 | 40.9 |
| Final Fantasy XV Benchmark (2018) | 36.1 | 20.7 | 16.2 | |
| X-Plane 11.11 (2018) | 43.3 | 35.2 | 35.3 | |
| Strange Brigade (2018) | 97.8 | 41 | 32 | 25.8 |
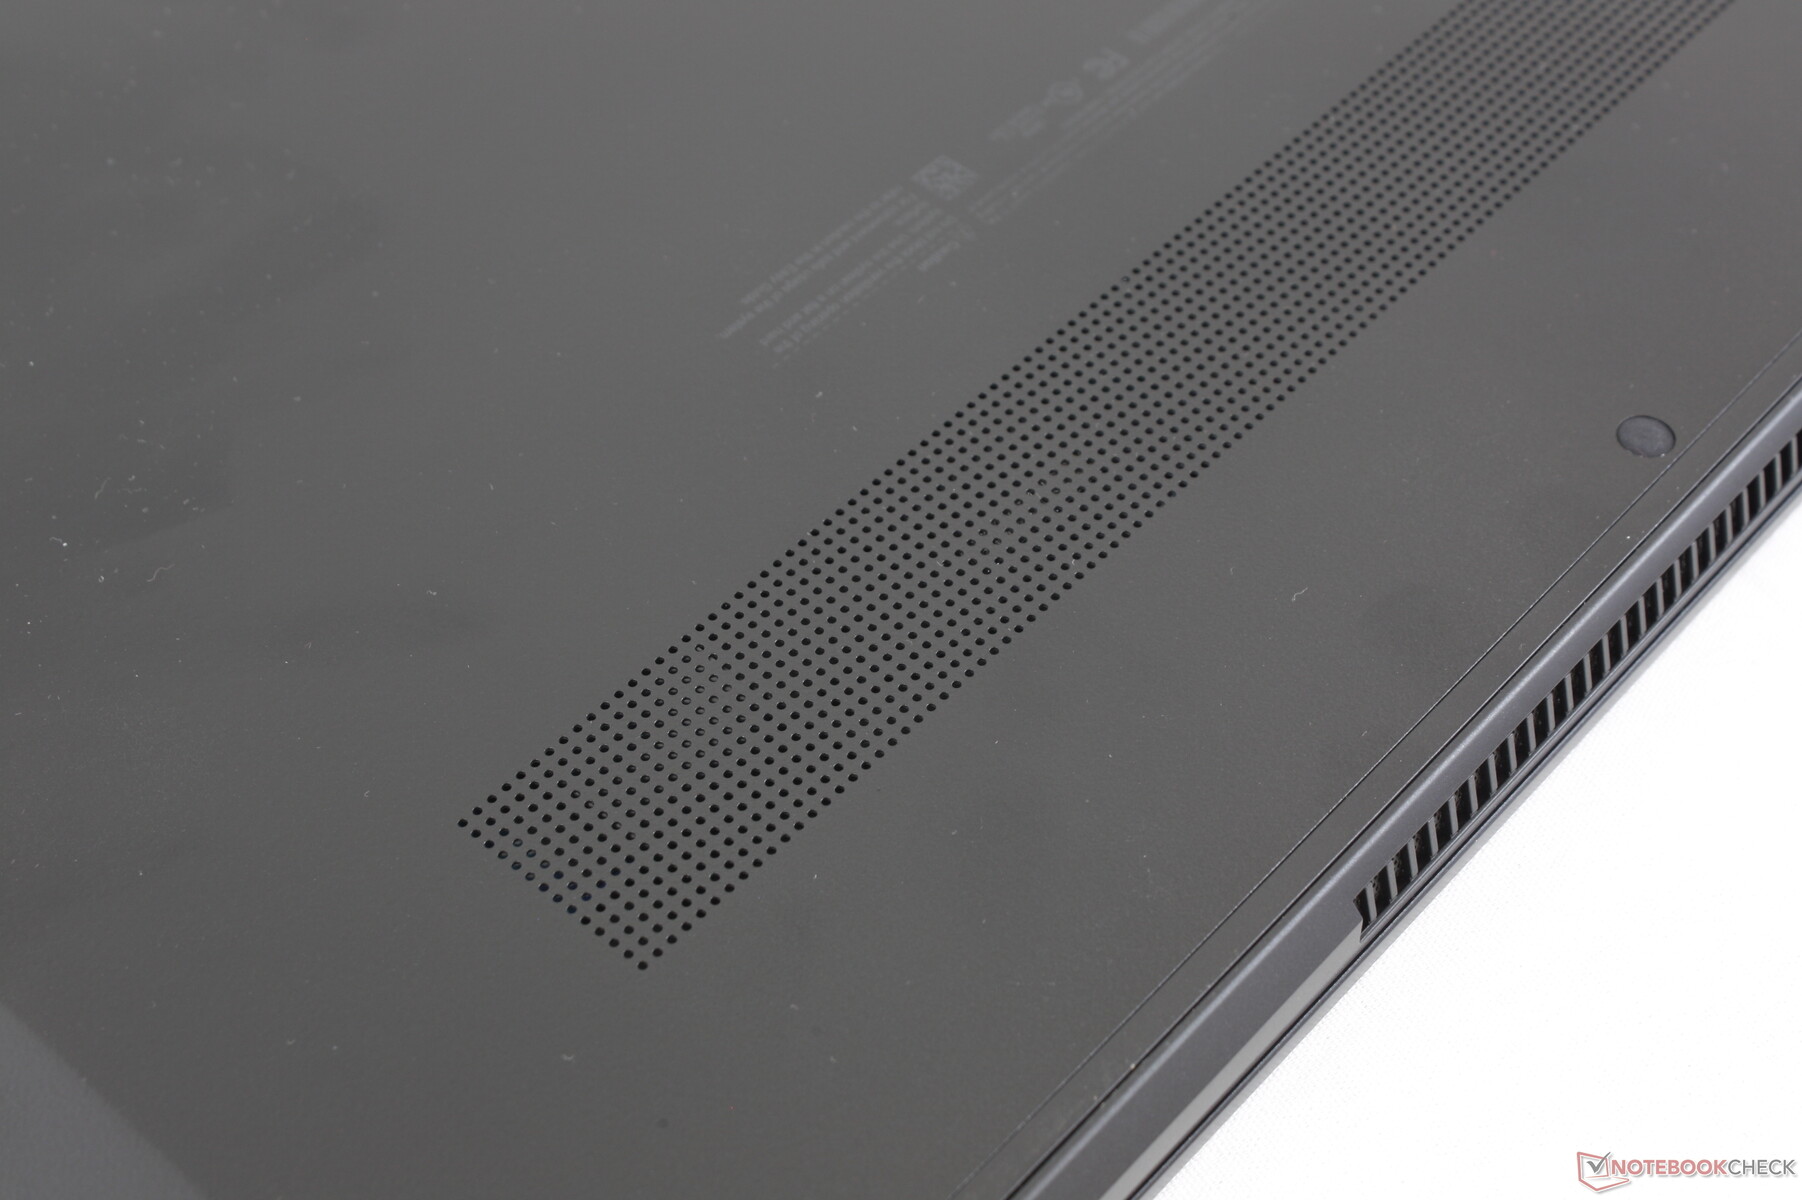
Emissions
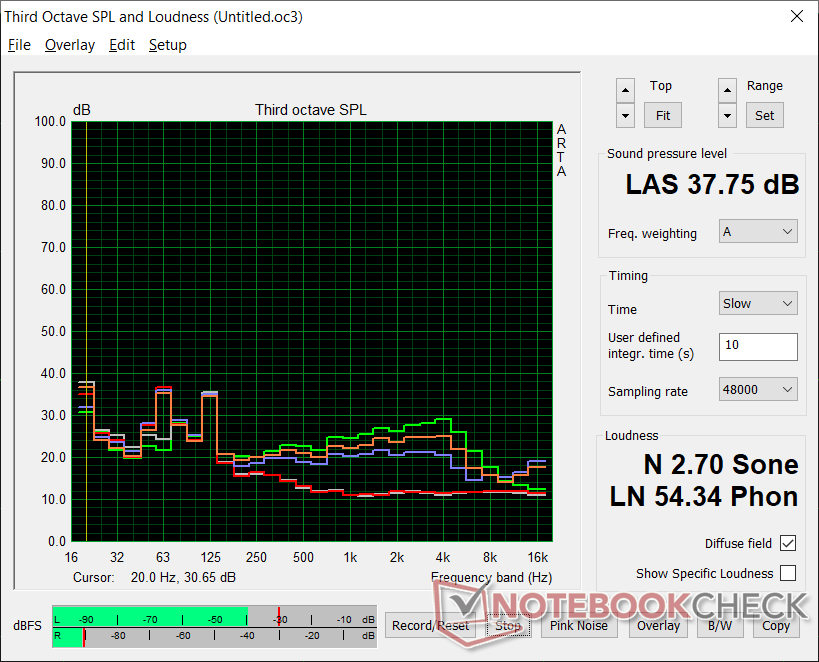
System Noise
The single internal fan will idle when the system is idle or running very low loads. After a bit of browsing or video streaming, fan noise may jump to 29.2 dB(A) which is still quiet enough to be mostly unnoticeable. Higher loads like games may induce a maximum fan noise of 37.8 dB(A) which would still be quieter than most other Ultrabooks under similar conditions.
Our test unit exhibits slight electronic noise or coil whine that is only noticeable when placing an ear near the keyboard keys.
| LG Gram 16 2-in-1 16T90P Iris Xe G7 96EUs, i7-1165G7, SK Hynix PC401 512GB M.2 (HFS512GD9TNG) | Honor MagicBook Pro 10210U GeForce MX350, i5-10210U, Toshiba XG6 KXG60ZNV512G | Apple MacBook Pro 16 2019 i9 5500M Radeon Pro 5500M, i9-9880H, Apple SSD AP1024 7171 | Dell XPS 15 9500 Core i5 UHD Graphics 630, i5-10300H, Toshiba KBG40ZNS256G NVMe | HP Spectre X360 15-5ZV31AV GeForce MX250, i7-10510U, Intel SSD 660p 2TB SSDPEKNW020T8 | |
|---|---|---|---|---|---|
| Noise | -7% | -23% | -7% | -14% | |
| off / environment * (dB) | 25.1 | 24 4% | 29.8 -19% | 28 -12% | 30.1 -20% |
| Idle Minimum * (dB) | 25.2 | 24 5% | 29.9 -19% | 28 -11% | 30.1 -19% |
| Idle Average * (dB) | 25.2 | 25 1% | 29.9 -19% | 28 -11% | 30.1 -19% |
| Idle Maximum * (dB) | 25.2 | 27 -7% | 29.9 -19% | 28 -11% | 30.1 -19% |
| Load Average * (dB) | 32.1 | 39 -21% | 43 -34% | 28 13% | 30.1 6% |
| Witcher 3 ultra * (dB) | 34.9 | 40 -15% | 45.4 -30% | 39.7 -14% | |
| Load Maximum * (dB) | 37.8 | 44 -16% | 46.1 -22% | 41.9 -11% | 42 -11% |
* ... smaller is better
Noise level
| Idle |
| 25.2 / 25.2 / 25.2 dB(A) |
| Load |
| 32.1 / 37.8 dB(A) |
 | ||
30 dB silent 40 dB(A) audible 50 dB(A) loud |
||
min: | ||
Temperature
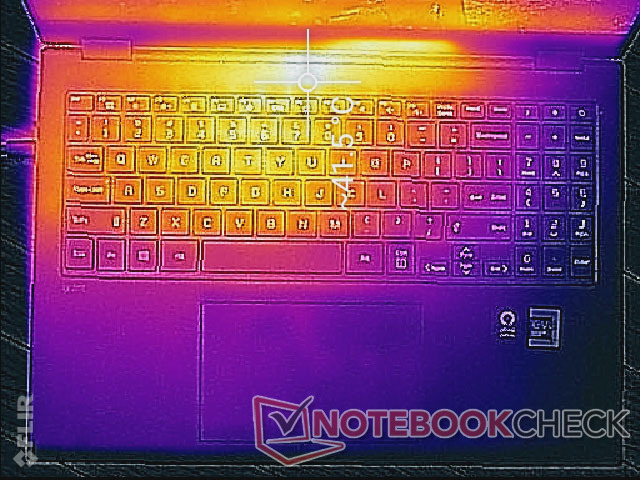
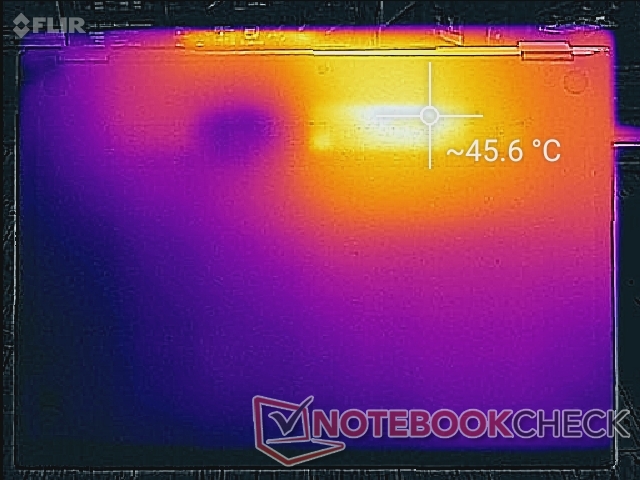
Surface temperatures are not an issue no matter the load. Hot spots can become as warm as 41 C to 46 C when gaming similar to what we recorded on the Dell XPS 15 2-in-1, but these areas are more toward the rear of the chassis further away from the palm rests and keyboard.
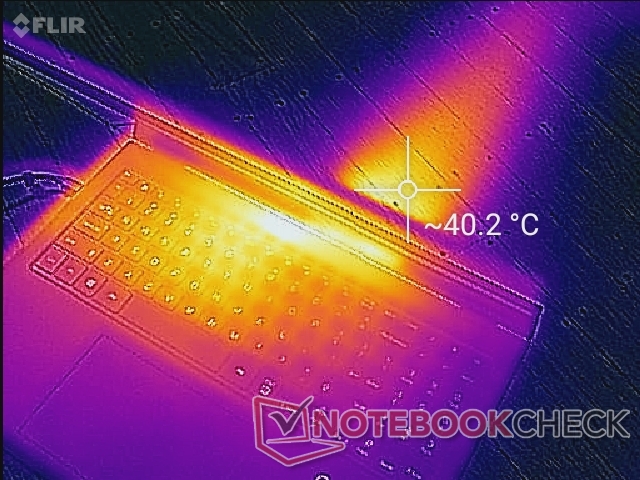
(±) The maximum temperature on the upper side is 42.2 °C / 108 F, compared to the average of 35.4 °C / 96 F, ranging from 19.6 to 60 °C for the class Convertible.
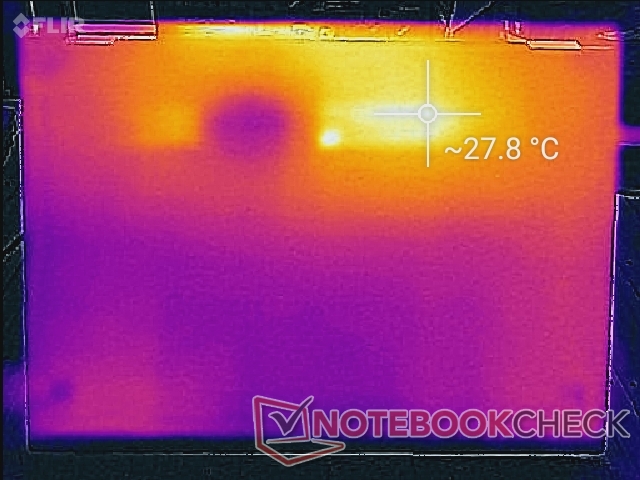
(-) The bottom heats up to a maximum of 46.2 °C / 115 F, compared to the average of 36.9 °C / 98 F
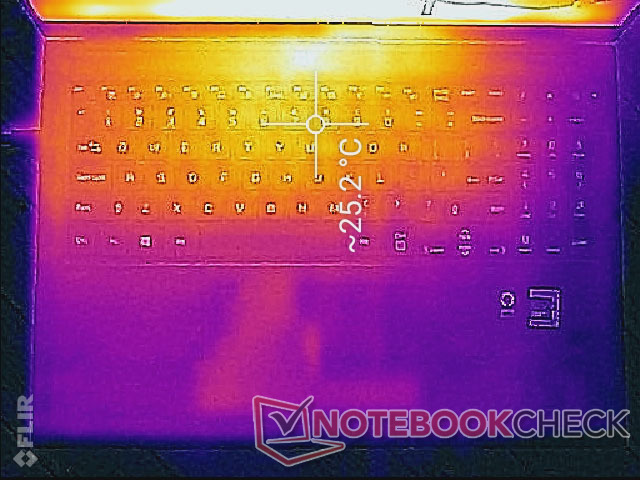
(+) In idle usage, the average temperature for the upper side is 23.9 °C / 75 F, compared to the device average of 30.3 °C / 87 F.
(+) The palmrests and touchpad are cooler than skin temperature with a maximum of 25.2 °C / 77.4 F and are therefore cool to the touch.
(+) The average temperature of the palmrest area of similar devices was 28 °C / 82.4 F (+2.8 °C / 5 F).
Stress Test
Running Prime95 shows exactly how poor the CPU Turbo Boost sustainability can be on the Gram 16. Clock rates would boost to 4.1 GHz for only the first three or so seconds before reaching 96 C. Thereafter, clock rates would steadily drop and stabilize at the 1.8 GHz to 2.4 GHz range in order to maintain a cooler core temperature of around 77 C. The limited capacity of the cooling solution appears to be wholly responsible for the weak Turbo Boost performance.
Running Witcher 3 shows relatively stable CPU and GPU clock rates despite the fluctuations in frame rates noted above. The mid 70 C range looks to be the sweet spot LG has set for this laptop when running demanding loads.
Running on batteries results in limited graphics performance. A 3DMark 11 test on battery power would return Physics and Graphics scores of 10638 and 6355 points, respectively, compared to 9445 and 6939 points when on mains.
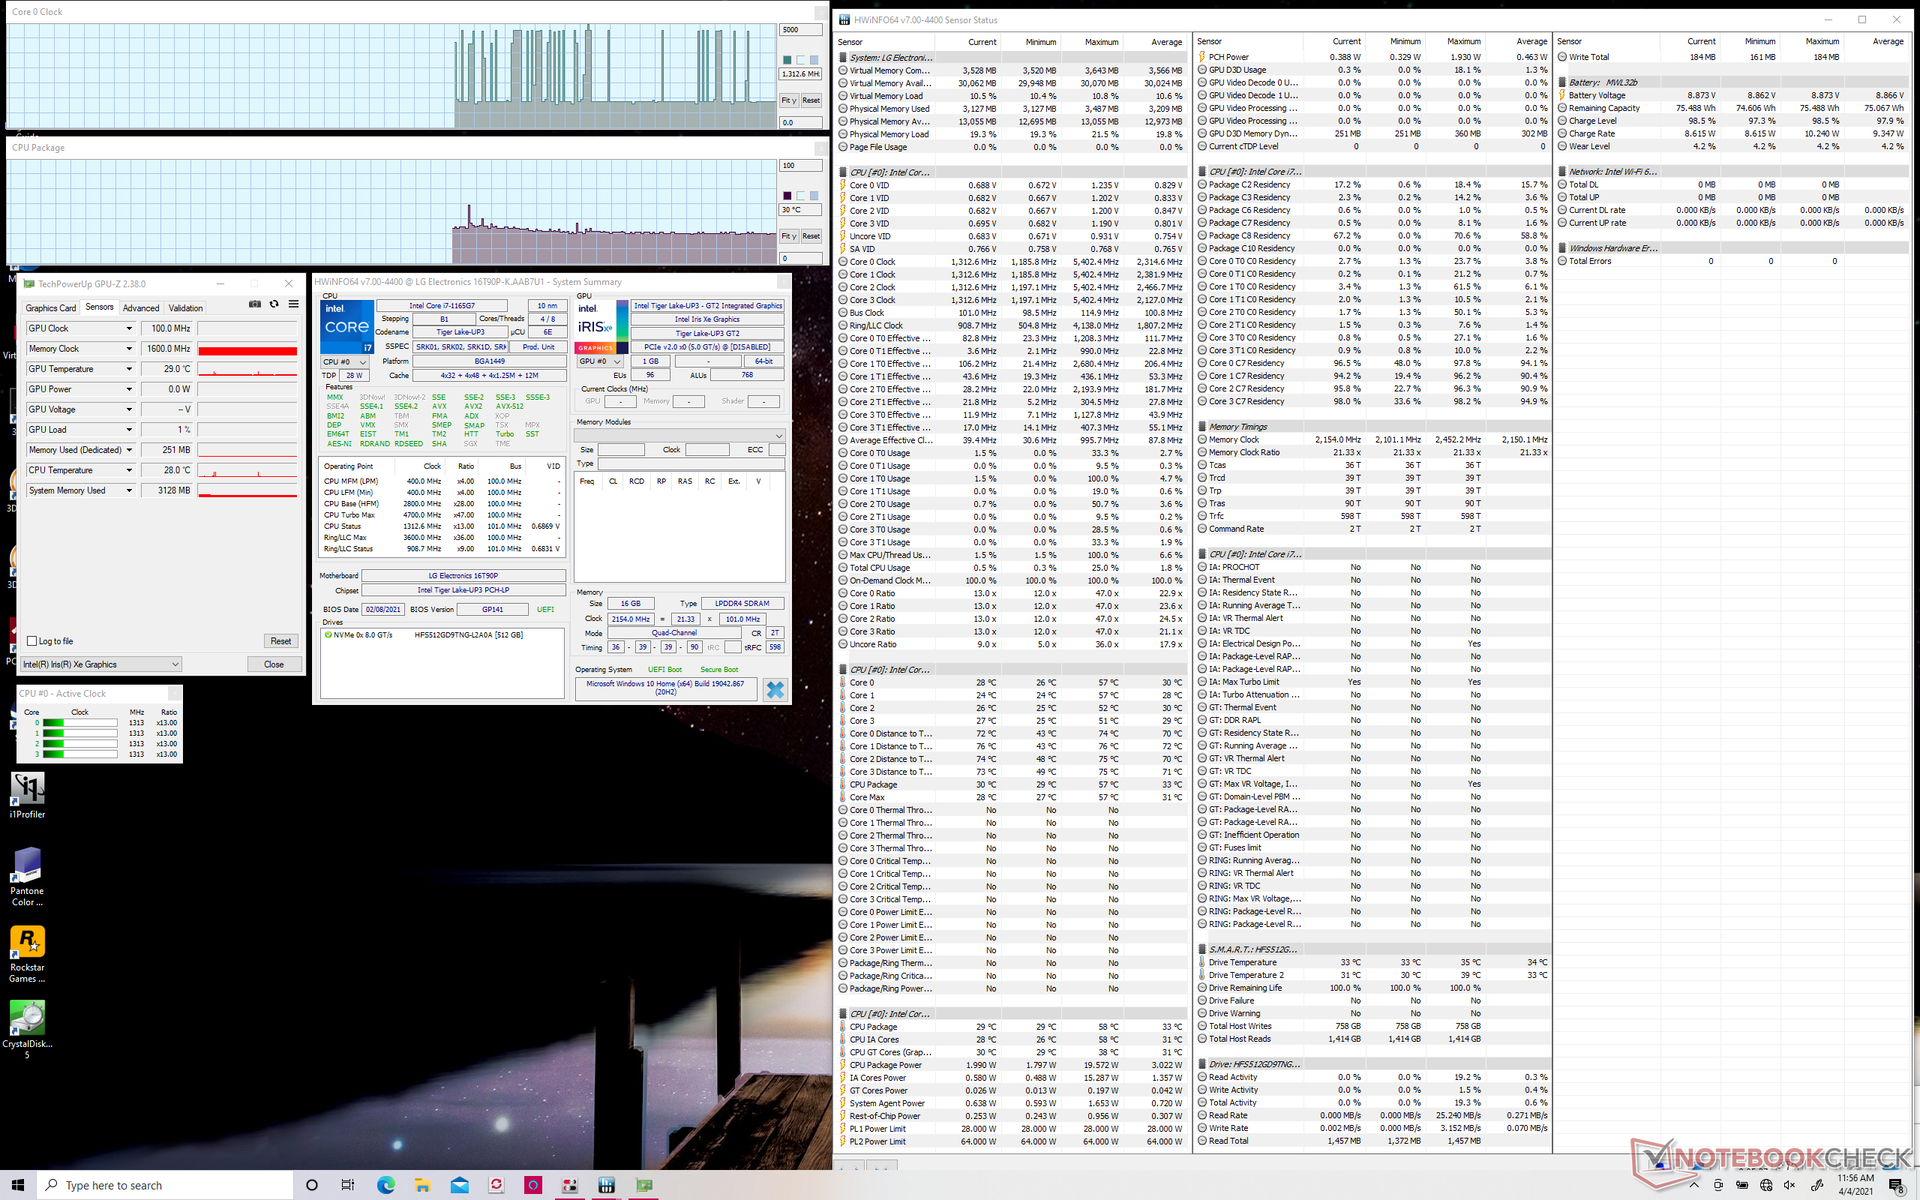
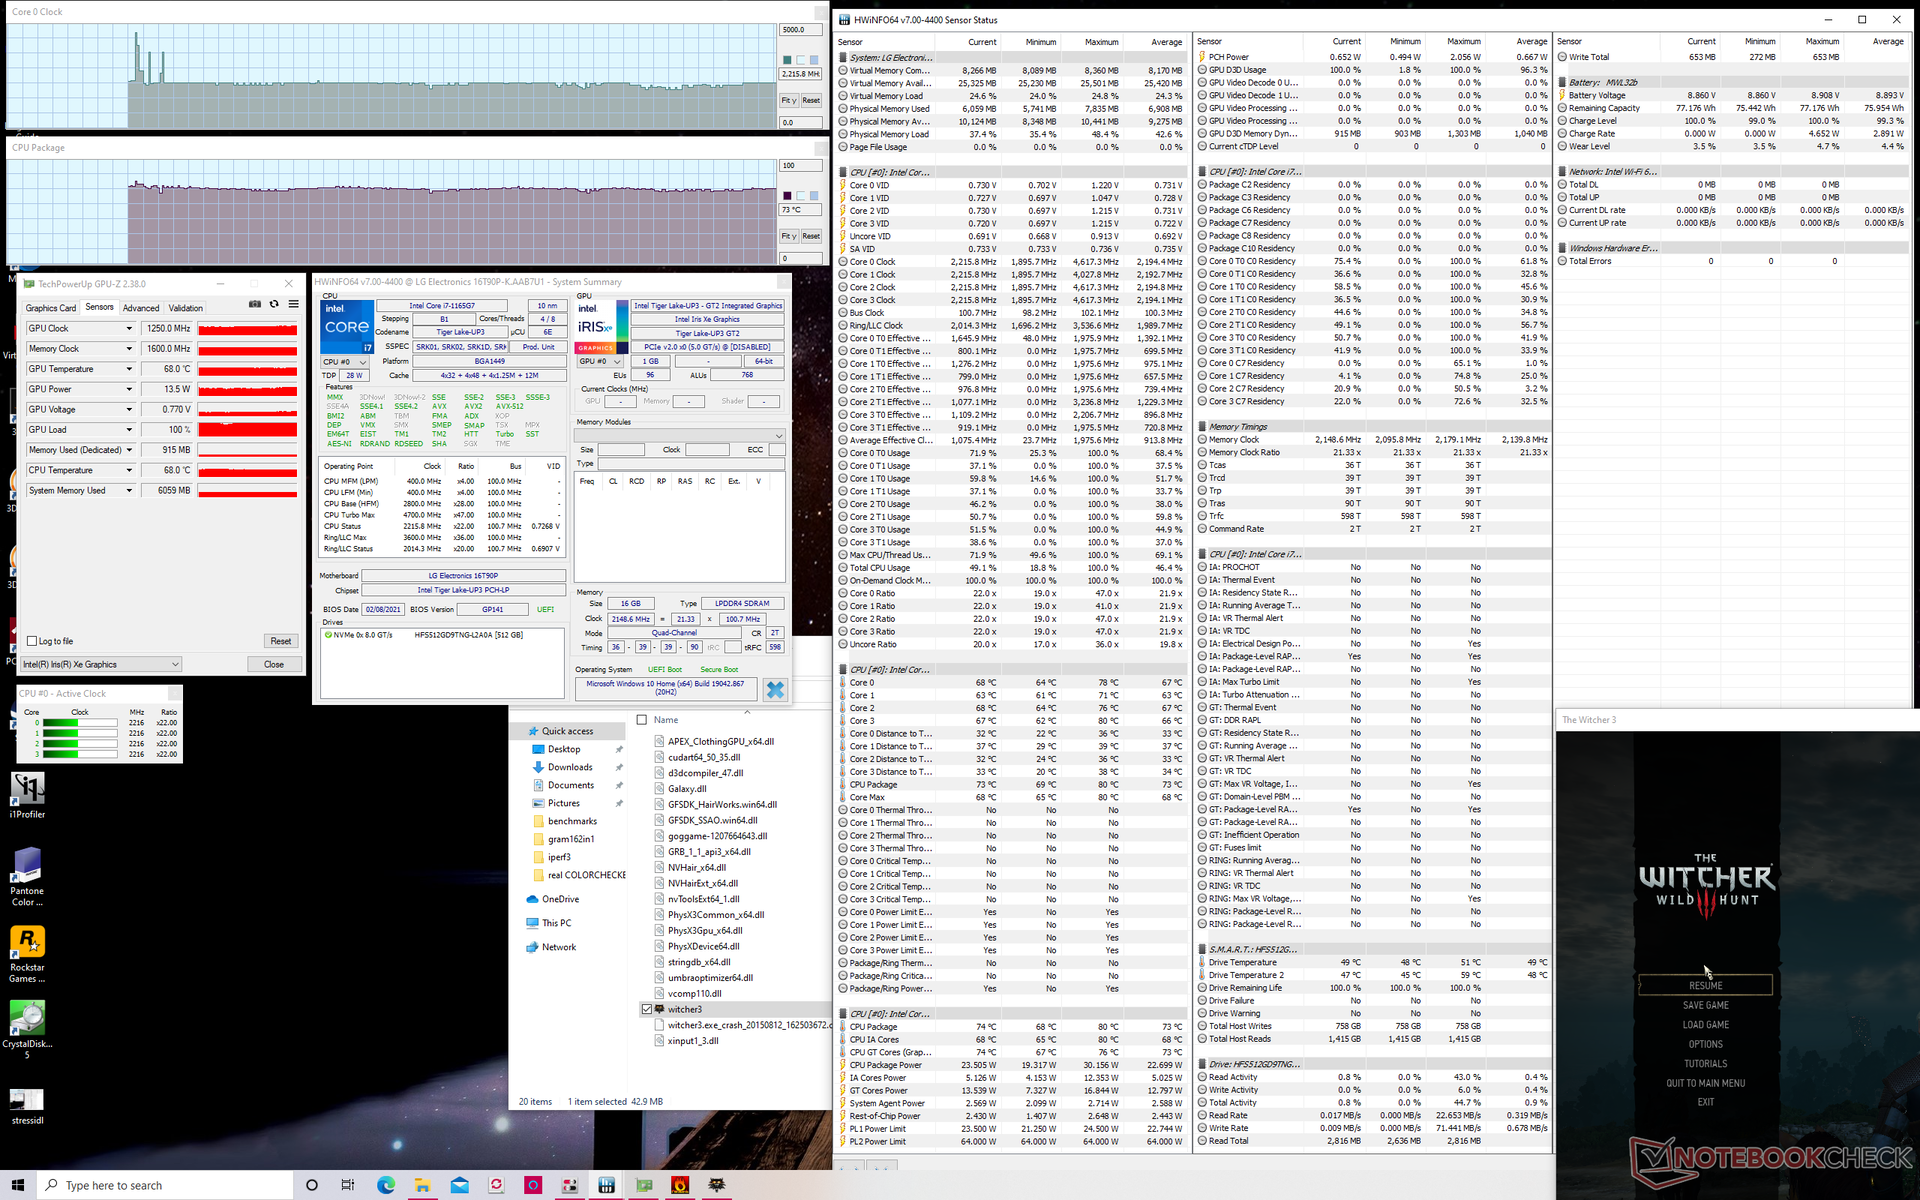
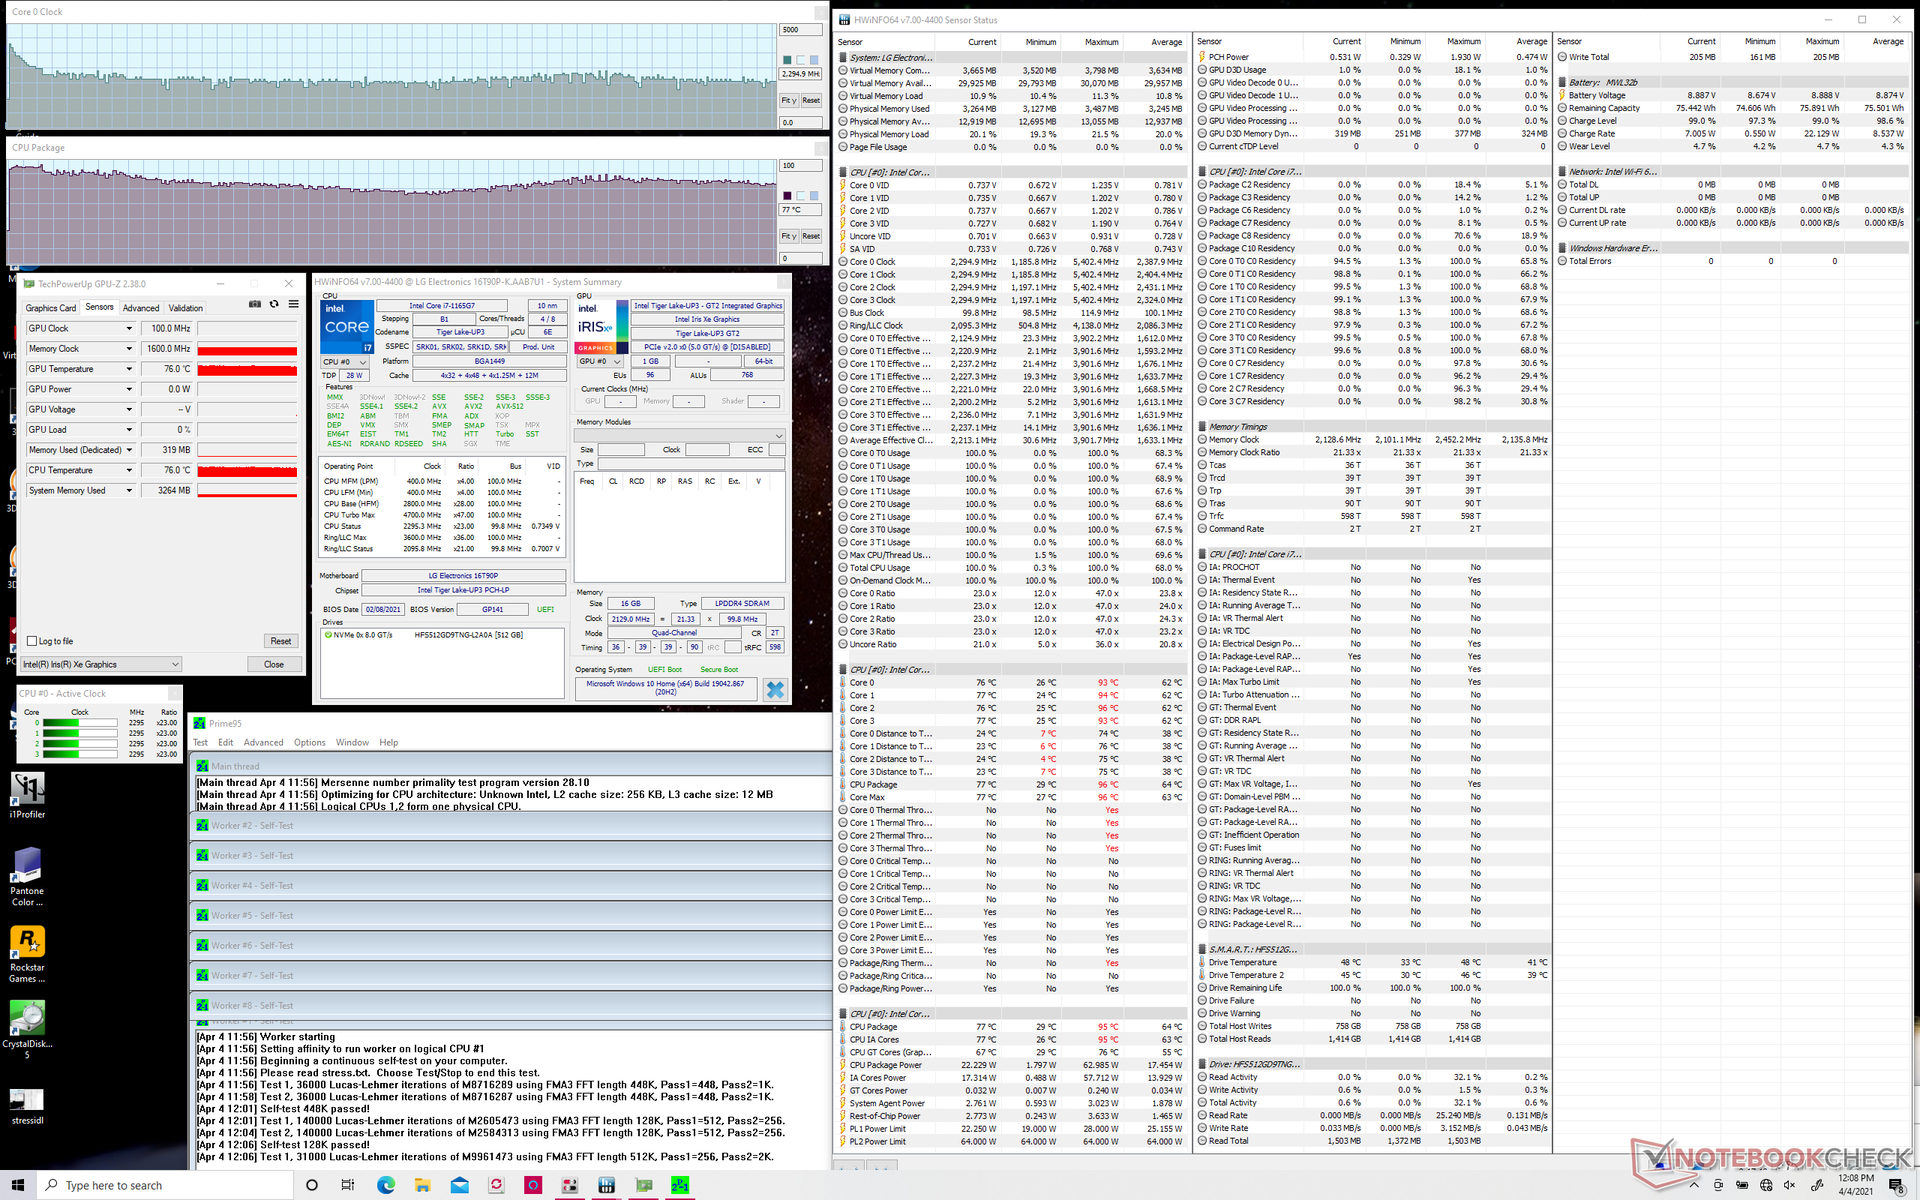
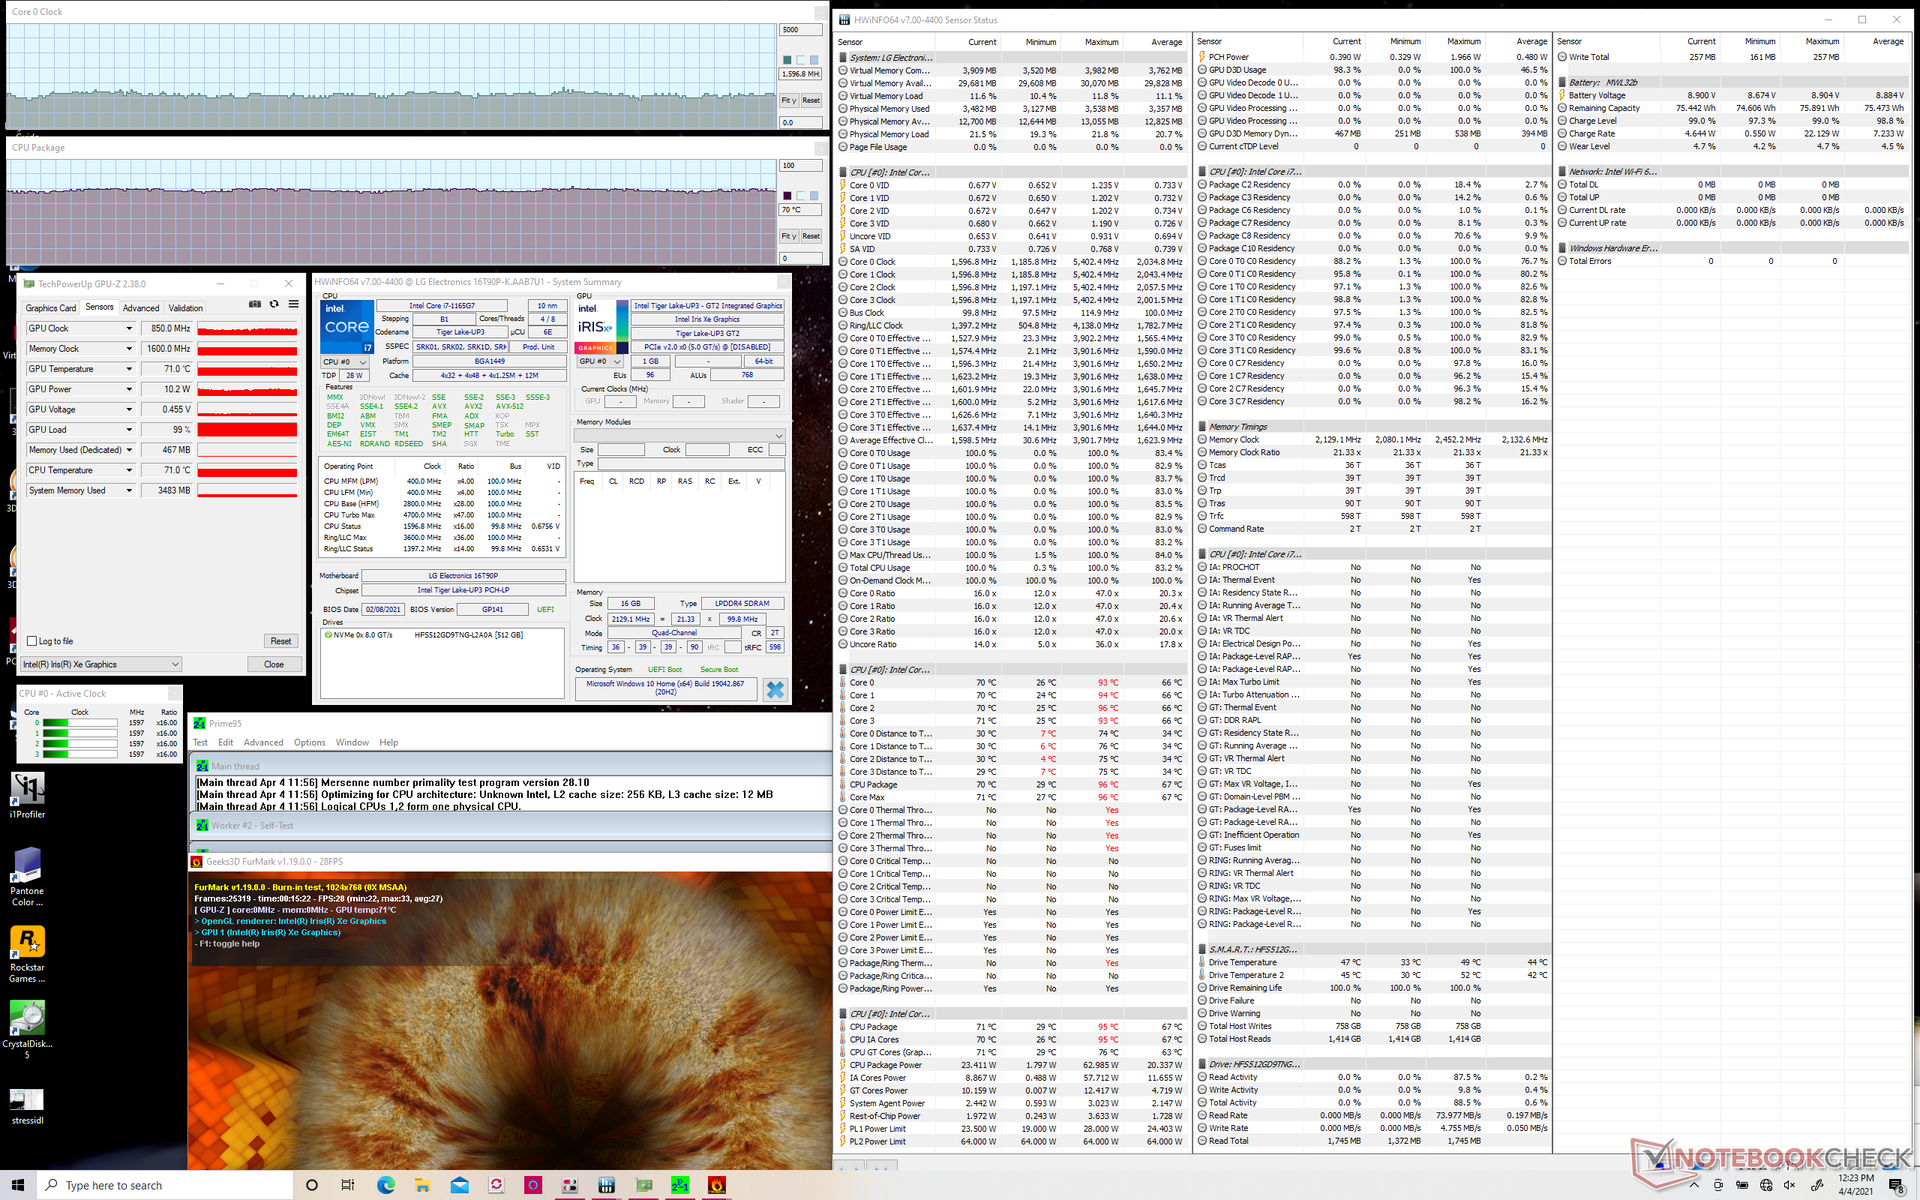
| CPU Clock (GHz) | GPU Clock (MHz) | Average CPU Temperature (°C) | |
| System Idle | -- | -- | 30 |
| Prime95 Stress | 1.8 - 2.4 | -- | ~77 |
| Prime95 + FurMark Stress | 1.4 - 1.6 | ~850 | 70 |
| Witcher 3 Stress | 2.2 | 1200 - 1250 | 73 |
Speakers


LG Gram 16 2-in-1 16T90P audio analysis
(±) | speaker loudness is average but good (79.1 dB)
Bass 100 - 315 Hz
(±) | reduced bass - on average 12.8% lower than median
(±) | linearity of bass is average (11.2% delta to prev. frequency)
Mids 400 - 2000 Hz
(±) | higher mids - on average 5.2% higher than median
(+) | mids are linear (4.5% delta to prev. frequency)
Highs 2 - 16 kHz
(+) | balanced highs - only 2.5% away from median
(+) | highs are linear (4.2% delta to prev. frequency)
Overall 100 - 16.000 Hz
(±) | linearity of overall sound is average (15.2% difference to median)
Compared to same class
» 25% of all tested devices in this class were better, 5% similar, 71% worse
» The best had a delta of 6%, average was 20%, worst was 57%
Compared to all devices tested
» 22% of all tested devices were better, 4% similar, 74% worse
» The best had a delta of 4%, average was 23%, worst was 134%
Apple MacBook 12 (Early 2016) 1.1 GHz audio analysis
(+) | speakers can play relatively loud (83.6 dB)
Bass 100 - 315 Hz
(±) | reduced bass - on average 11.3% lower than median
(±) | linearity of bass is average (14.2% delta to prev. frequency)
Mids 400 - 2000 Hz
(+) | balanced mids - only 2.4% away from median
(+) | mids are linear (5.5% delta to prev. frequency)
Highs 2 - 16 kHz
(+) | balanced highs - only 2% away from median
(+) | highs are linear (4.5% delta to prev. frequency)
Overall 100 - 16.000 Hz
(+) | overall sound is linear (10.2% difference to median)
Compared to same class
» 7% of all tested devices in this class were better, 2% similar, 90% worse
» The best had a delta of 5%, average was 18%, worst was 53%
Compared to all devices tested
» 5% of all tested devices were better, 1% similar, 94% worse
» The best had a delta of 4%, average was 23%, worst was 134%
Energy Management
Power Consumption
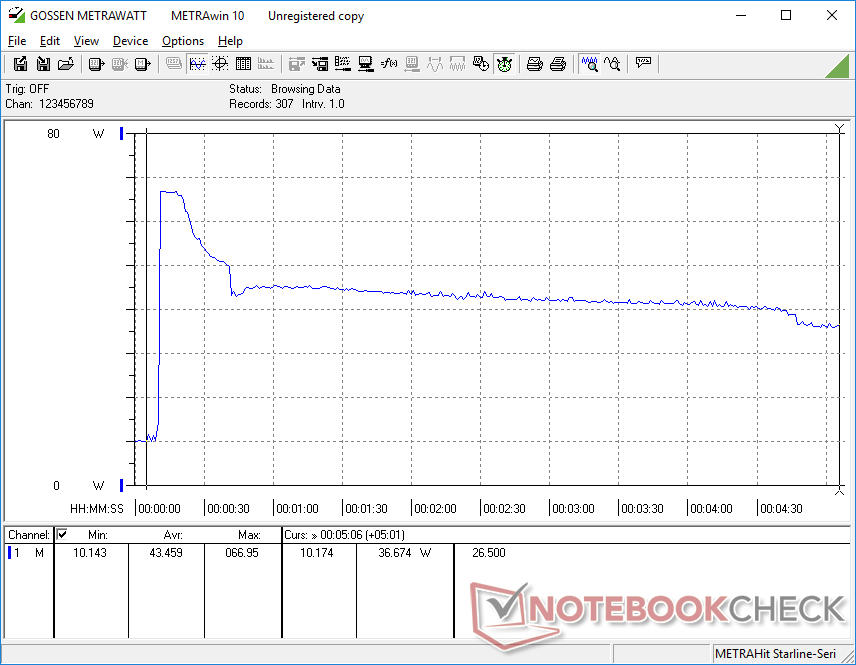
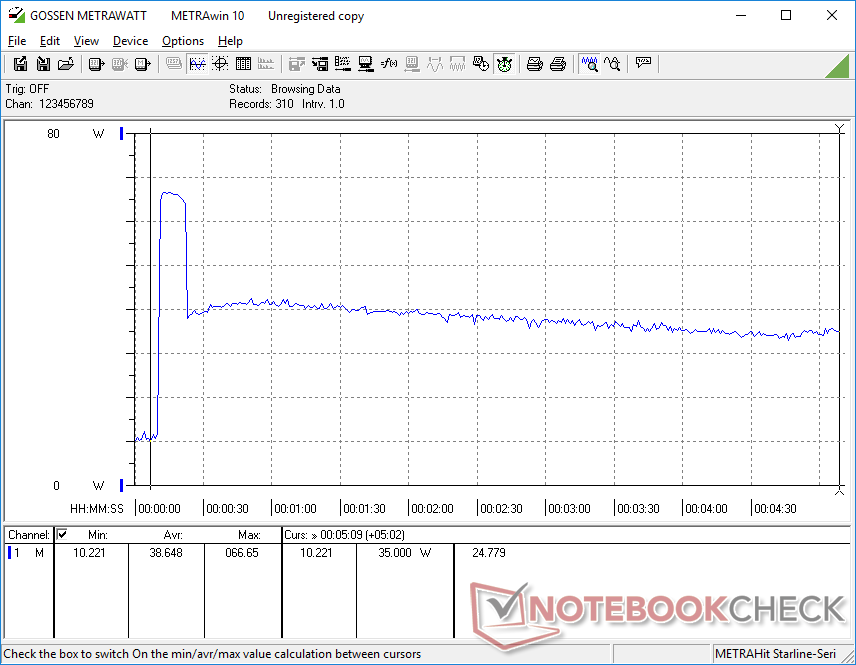
Idling on desktop consumes between 4 W and 11 W depending on the brightness setting and power profile. Gaming consumes around 39 W to 46 W to be much lower than other 15.6-inch laptops equipped with GeForce MX graphics while still being higher than the slower Ice Lake-powered Gram 15.
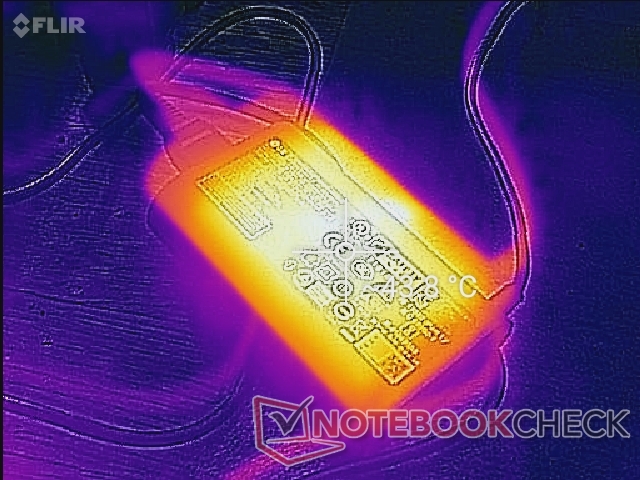
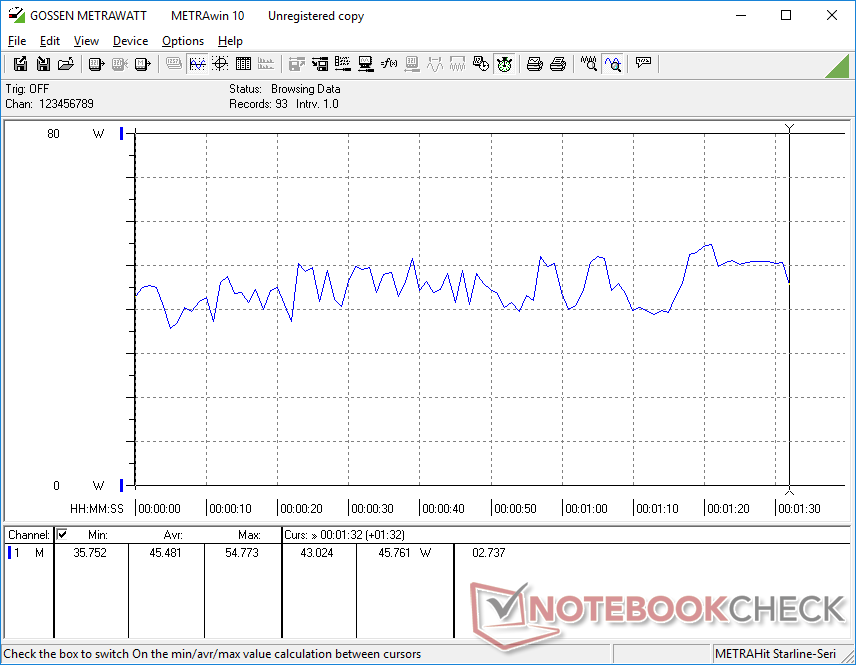
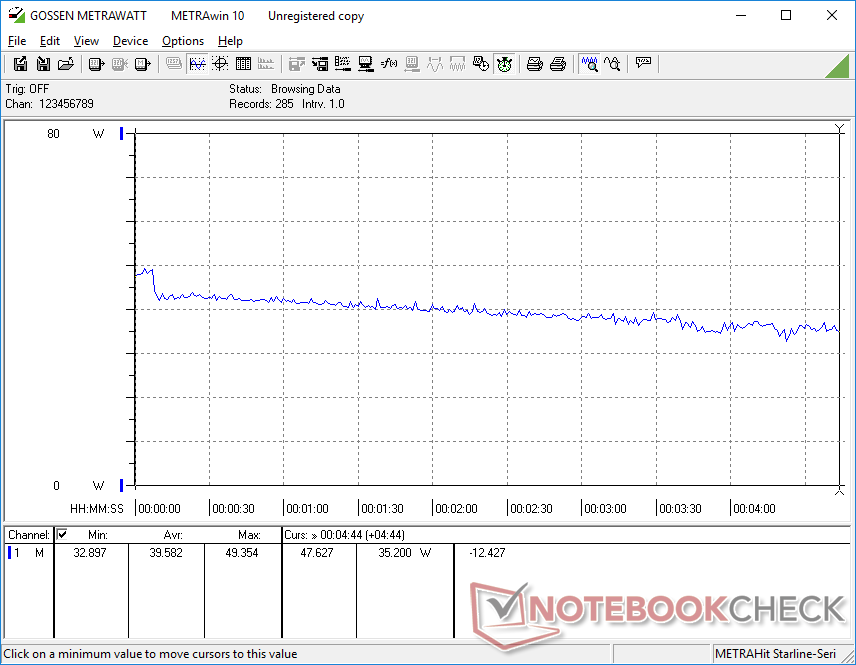
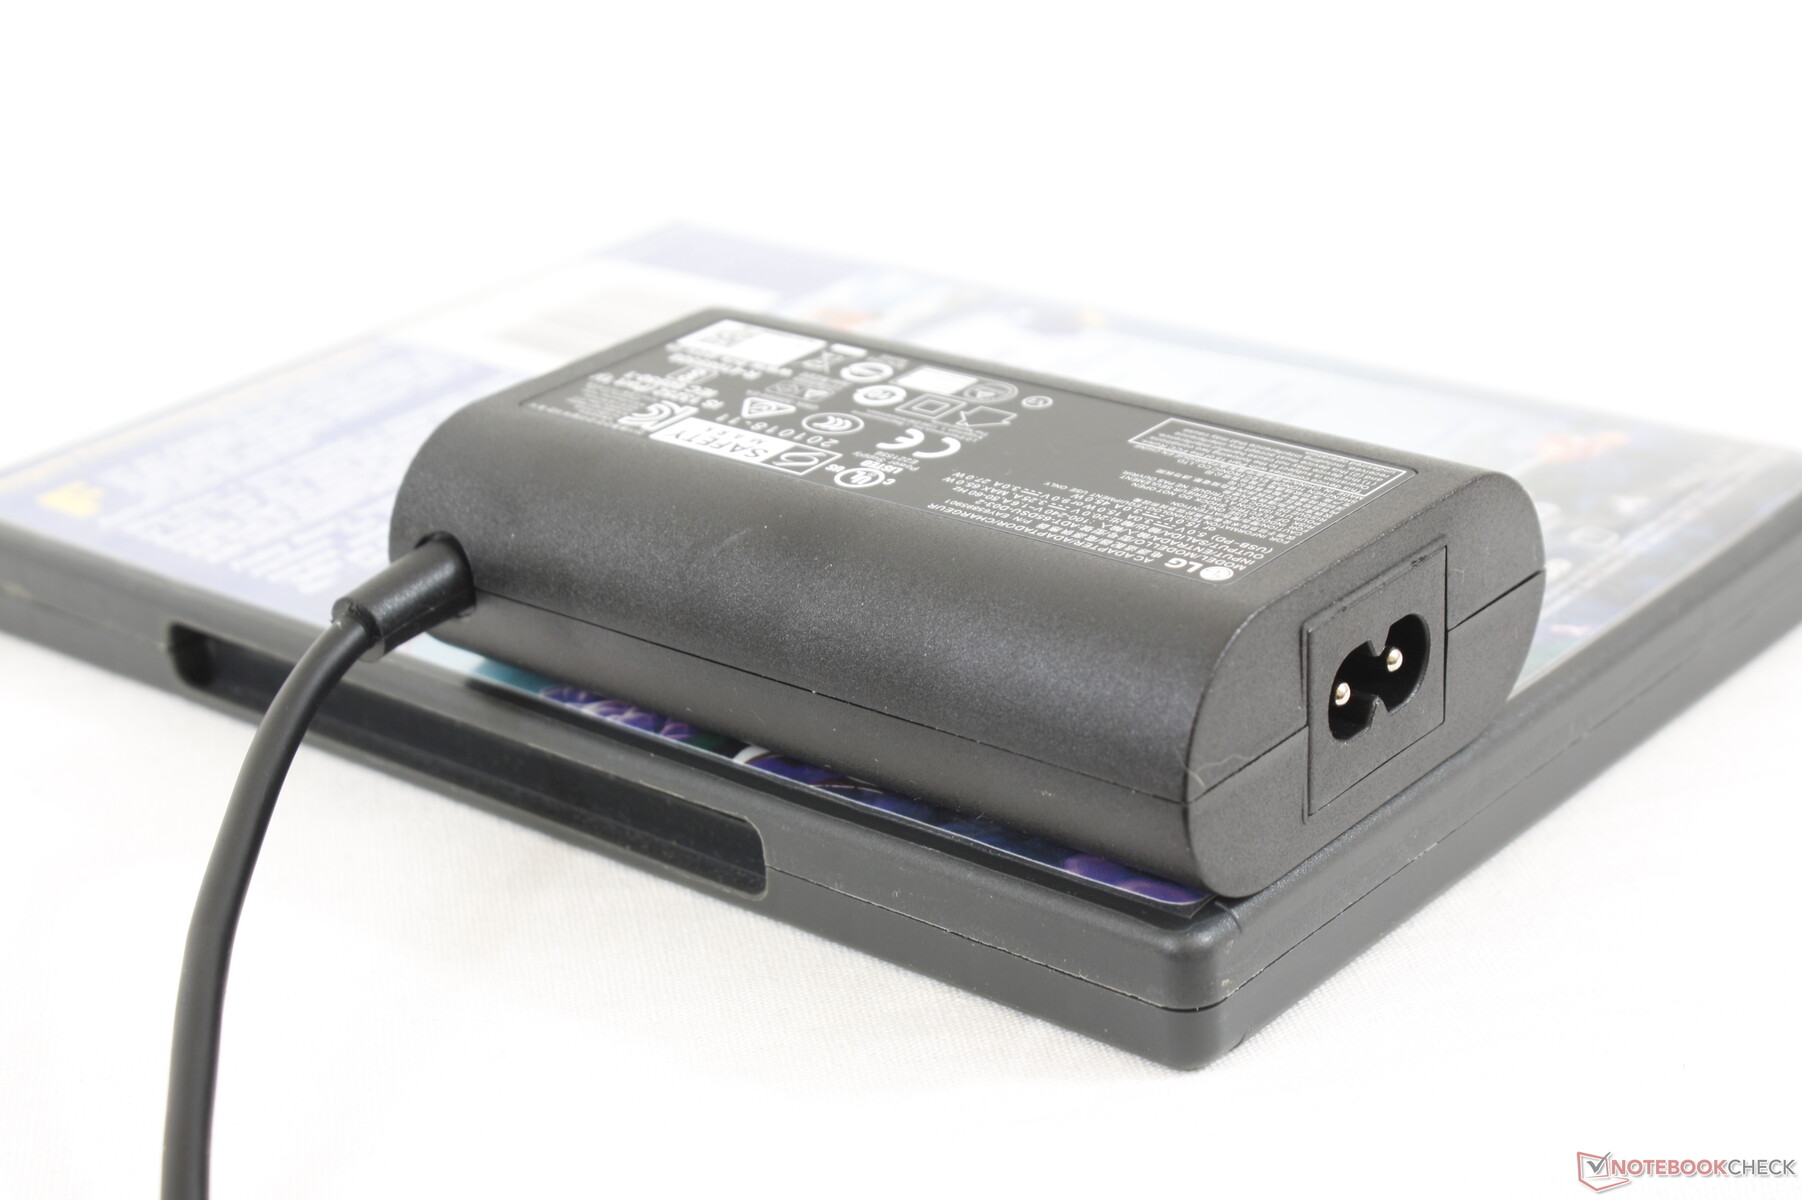
We're able to record a maximum consumption of 67 W from the small (~9.8 x 8 x 2.7 cm) 65 W AC adapter when under extreme Prime95 stress. This rate only lasts for just a few seconds as shown by the graphs below due to thermal limitations.
| Off / Standby | |
| Idle | |
| Load |
|
Key:
min: | |
| LG Gram 16 2-in-1 16T90P i7-1165G7, Iris Xe G7 96EUs, SK Hynix PC401 512GB M.2 (HFS512GD9TNG), IPS, 2560x1600, 16" | Honor MagicBook Pro 10210U i5-10210U, GeForce MX350, Toshiba XG6 KXG60ZNV512G, IPS, 1920x1080, 16.1" | Apple MacBook Pro 16 2019 i9 5500M i9-9880H, Radeon Pro 5500M, Apple SSD AP1024 7171, IPS, 3072x1920, 16" | Dell XPS 15 9500 Core i5 i5-10300H, UHD Graphics 630, Toshiba KBG40ZNS256G NVMe, IPS, 1920x1200, 15.6" | HP Spectre X360 15-5ZV31AV i7-10510U, GeForce MX250, Intel SSD 660p 2TB SSDPEKNW020T8, IPS, 3840x2160, 15.6" | Asus ZenBook UX535-M01440 i7-10750H, GeForce GTX 1650 Ti Max-Q, WDC PC SN730 SDBPNTY-1T00, IPS, 3840x2160, 15.6" | |
|---|---|---|---|---|---|---|
| Power Consumption | -32% | -67% | 8% | -21% | -48% | |
| Idle Minimum * (Watt) | 4.4 | 7 -59% | 3.7 16% | 2.9 34% | 5.2 -18% | 4.4 -0% |
| Idle Average * (Watt) | 9 | 10 -11% | 12.1 -34% | 7.6 16% | 8.5 6% | 9.8 -9% |
| Idle Maximum * (Watt) | 10.1 | 14 -39% | 17 -68% | 8 21% | 8.7 14% | 14.5 -44% |
| Load Average * (Watt) | 45.5 | 63 -38% | 91.5 -101% | 41.7 8% | 65.6 -44% | 83 -82% |
| Witcher 3 ultra * (Watt) | 39.6 | 59 -49% | 103 -160% | 56.5 -43% | 67 -69% | |
| Load Maximum * (Watt) | 67 | 65 3% | 102.3 -53% | 94.8 -41% | 92.4 -38% | 123 -84% |
* ... smaller is better
Battery Life
The large 80 Wh battery capacity and power-efficient Tiger Lake-U CPU naturally lead to very long runtimes. We're able to record over 15 hours of real-world WLAN use at 150 nits brightness to be several hours longer than most other 15.6-inch laptops. Charging from empty to full capacity, however, is a bit slower at almost 2.5 hours.
| LG Gram 16 2-in-1 16T90P i7-1165G7, Iris Xe G7 96EUs, 80 Wh | Honor MagicBook Pro 10210U i5-10210U, GeForce MX350, 56 Wh | Apple MacBook Pro 16 2019 i9 5500M i9-9880H, Radeon Pro 5500M, 99.8 Wh | Dell XPS 15 9500 Core i5 i5-10300H, UHD Graphics 630, 56 Wh | HP Spectre X360 15-5ZV31AV i7-10510U, GeForce MX250, 84 Wh | Asus ZenBook UX535-M01440 i7-10750H, GeForce GTX 1650 Ti Max-Q, 96 Wh | |
|---|---|---|---|---|---|---|
| Battery runtime | -29% | -43% | -30% | -14% | -32% | |
| Reader / Idle (h) | 29.6 | 24.7 -17% | 26.4 -11% | 22.6 -24% | 18.3 -38% | |
| WiFi v1.3 (h) | 15.7 | 10.1 -36% | 12 -24% | 9.3 -41% | 10.8 -31% | 10.1 -36% |
| Load (h) | 2.6 | 1.7 -35% | 1 -62% | 1.6 -38% | 2.9 12% | 2 -23% |
| Witcher 3 ultra (h) | 0.9 |
Pros
Cons
Verdict
Although convertible laptops with large displays aren't anything new, they're not exactly known to be very light. The LG Gram 16 convertible challenges this perception by not just being one of the lightest 16-inch laptops in the market, but also by being lighter than many laptops with smaller 15.6-inch displays. This noticeable weight advantage is the most important trump card for the Gram 16 convertible.
The LG Gram 16 2-in-1 is both quiet and incredibly lightweight for its category. However, raw CPU performance suffers, the display is prone to glare, and the hinges could have certainly been tauter.
Cutting down on weight by significant margins has its disadvantages. The Gram 16 convertible suffers from many of the same drawbacks as the Gram 13, Gram 14, Gram 15, and Gram 17 including a weaker and more flexible chassis than the HP Spectre x360 15, more difficult serviceability, and below-average processor performance. LG continues to utilize small cooling solutions with short heat pipes which severely limit the Turbo Boost potential of the CPU. The weak hinges are especially disappointing as they don't give the sense of longevity we would like to have for a $1500 laptop.
The rest of the laptop is buoyed by the large battery, sharp and vivid colors, Thunderbolt 4 support, and excellent keyboard. If you don't mind a heavier convertible, however, then you'll definitely get a lot more performance out of an HP Spectre x360 or Asus ZenBook convertible instead.
Price and availability
Availability is limited at the time of writing. Best Buy is selling a few configurations starting at $1749 USD.
LG Gram 16 2-in-1 16T90P
- 04/05/2021 v7 (old)
Allen Ngo
Price comparison
