

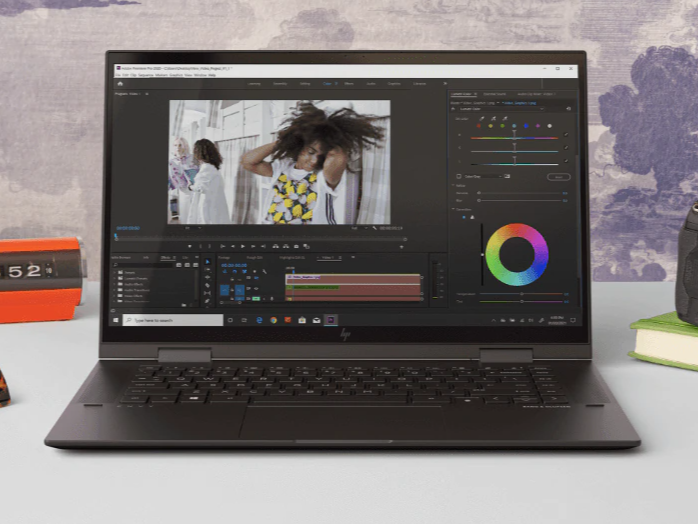
HP Envy x360 15 Ryzen 7 5700U Convertible Review: Faster Than The Spectre x360 15
The 2021 Envy x360 15 replaces the Ryzen 4000U-powered 2020 model with new Ryzen 5000U CPUs and a new keyboard deck. It's currently one of the few convertible laptops in the market with the Ryzen 7 5700U whereas most others come with 11th gen Intel Tiger Lake instead. The Envy x360 series is positioned as a mid-range consumer product in between the lower-end Pavilion x360 series and higher-end Spectre x360 series. A key difference between the Spectre series and Envy series is that the former is currently limited to only Intel CPUs even if AMD happens to have faster processors.
Competitors in this space include other mid-range to upper mid-range to high-end 15.6-inch 2-in-1 laptops like the Samsung Galaxy Book Flex 15, Asus ZenBook Flip 15, or Lenovo Yoga C740-15. Our specific configuration under review retails for about $999 USD.
More HP reviews:
potential competitors in comparison
Rating | Date | Model | Weight | Height | Size | Resolution | Price |
|---|---|---|---|---|---|---|---|
| 86.4 % v7 (old) | 05 / 2021 | HP Envy x360 15-eu0097nr R7 5700U, Vega 8 | 1.9 kg | 18.4 mm | 15.60" | 1920x1080 | |
| 82.8 % v7 (old) | 09 / 2020 | HP Envy x360 15-ee0257ng R5 4500U, Vega 6 | 2 kg | 18.9 mm | 15.60" | 1920x1080 | |
| 87.3 % v7 (old) | 10 / 2020 | Samsung Galaxy Book Flex 15-NP950 i7-1065G7, GeForce MX250 | 1.6 kg | 14.9 mm | 15.60" | 1920x1080 | |
| 86.5 % v7 (old) | 03 / 2020 | Asus ZenBook Flip 15 UX563FD-A1027T i7-10510U, GeForce GTX 1050 Max-Q | 1.9 kg | 19.9 mm | 15.60" | 3840x2160 | |
| 84.8 % v7 (old) | 01 / 2020 | Lenovo Yoga C740-15IML i7-10510U, UHD Graphics 620 | 1.9 kg | 17.25 mm | 15.60" | 1920x1080 | |
| 85 % v7 (old) | 01 / 2020 | HP Spectre X360 15-5ZV31AV i7-10510U, GeForce MX250 | 2.1 kg | 19.3 mm | 15.60" | 3840x2160 |
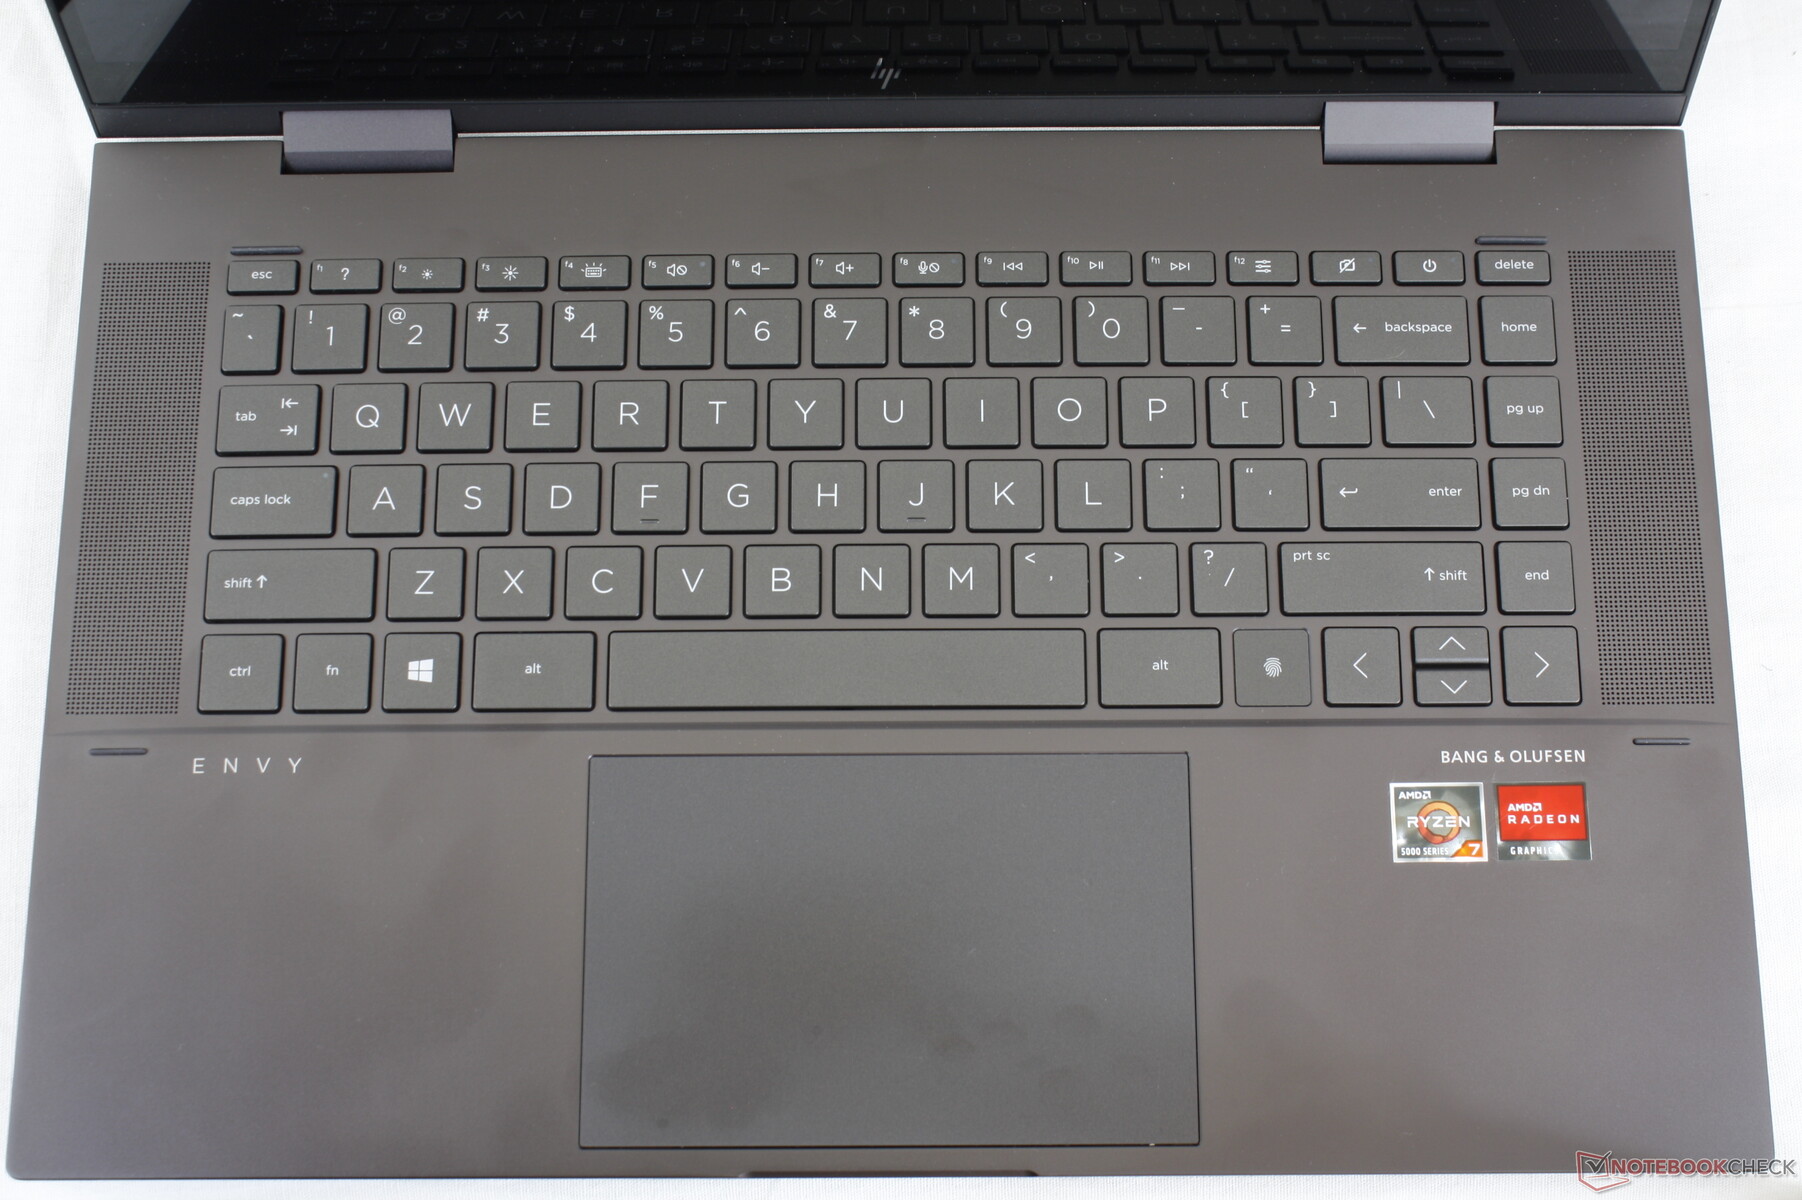
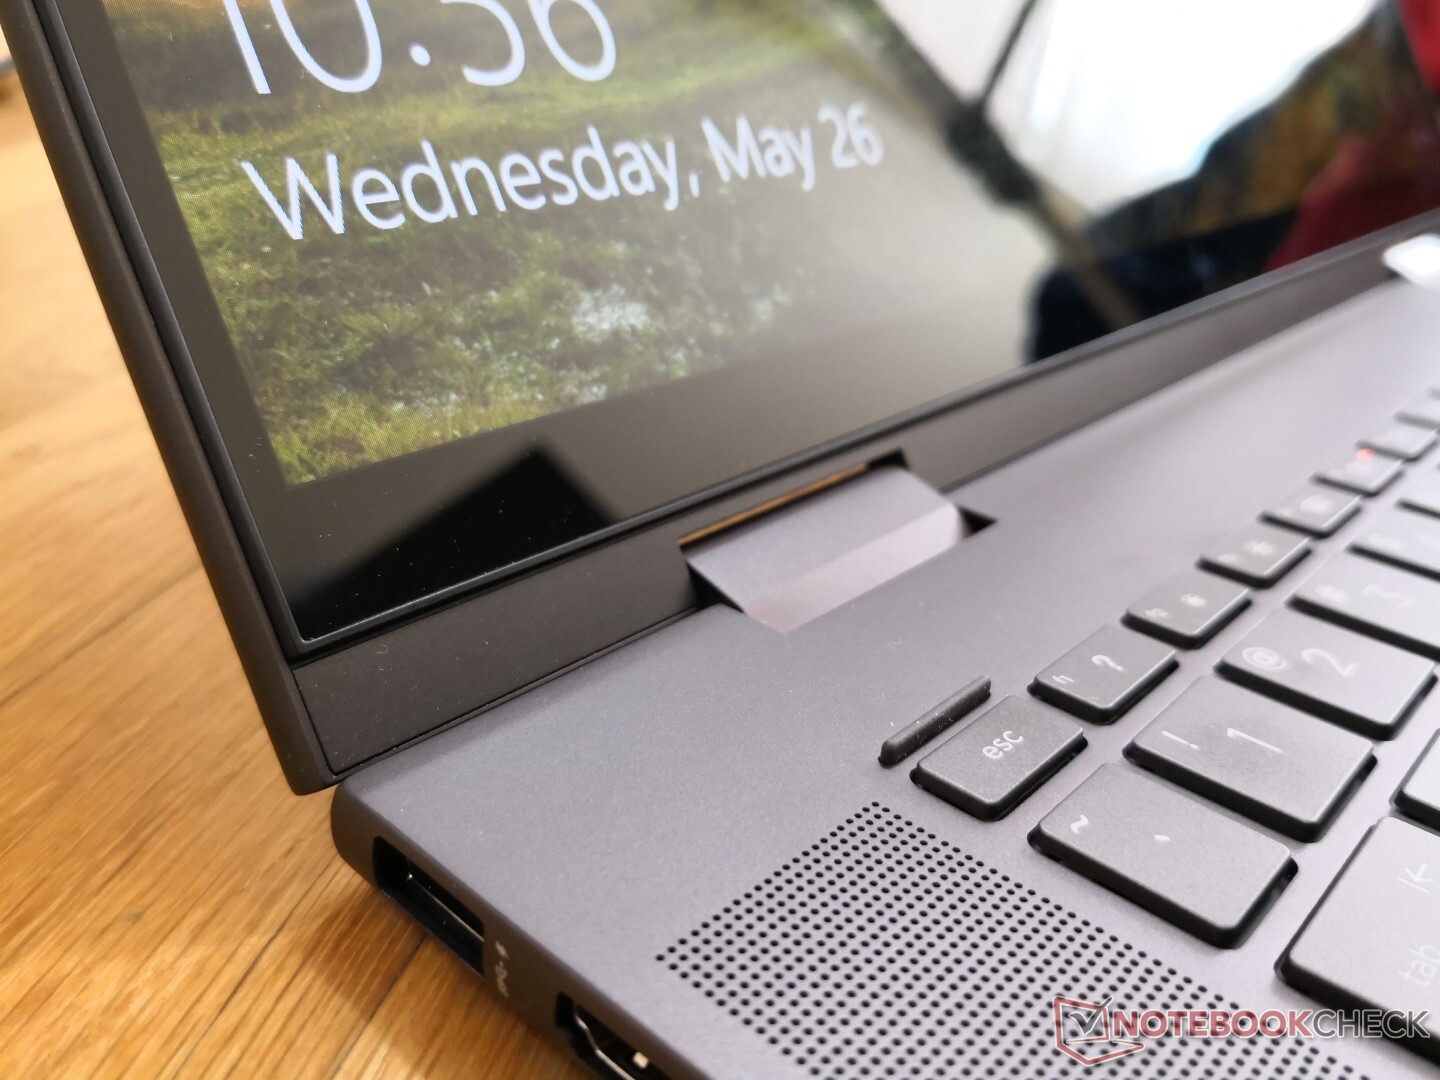
Case - New Keyboard and Touchpad
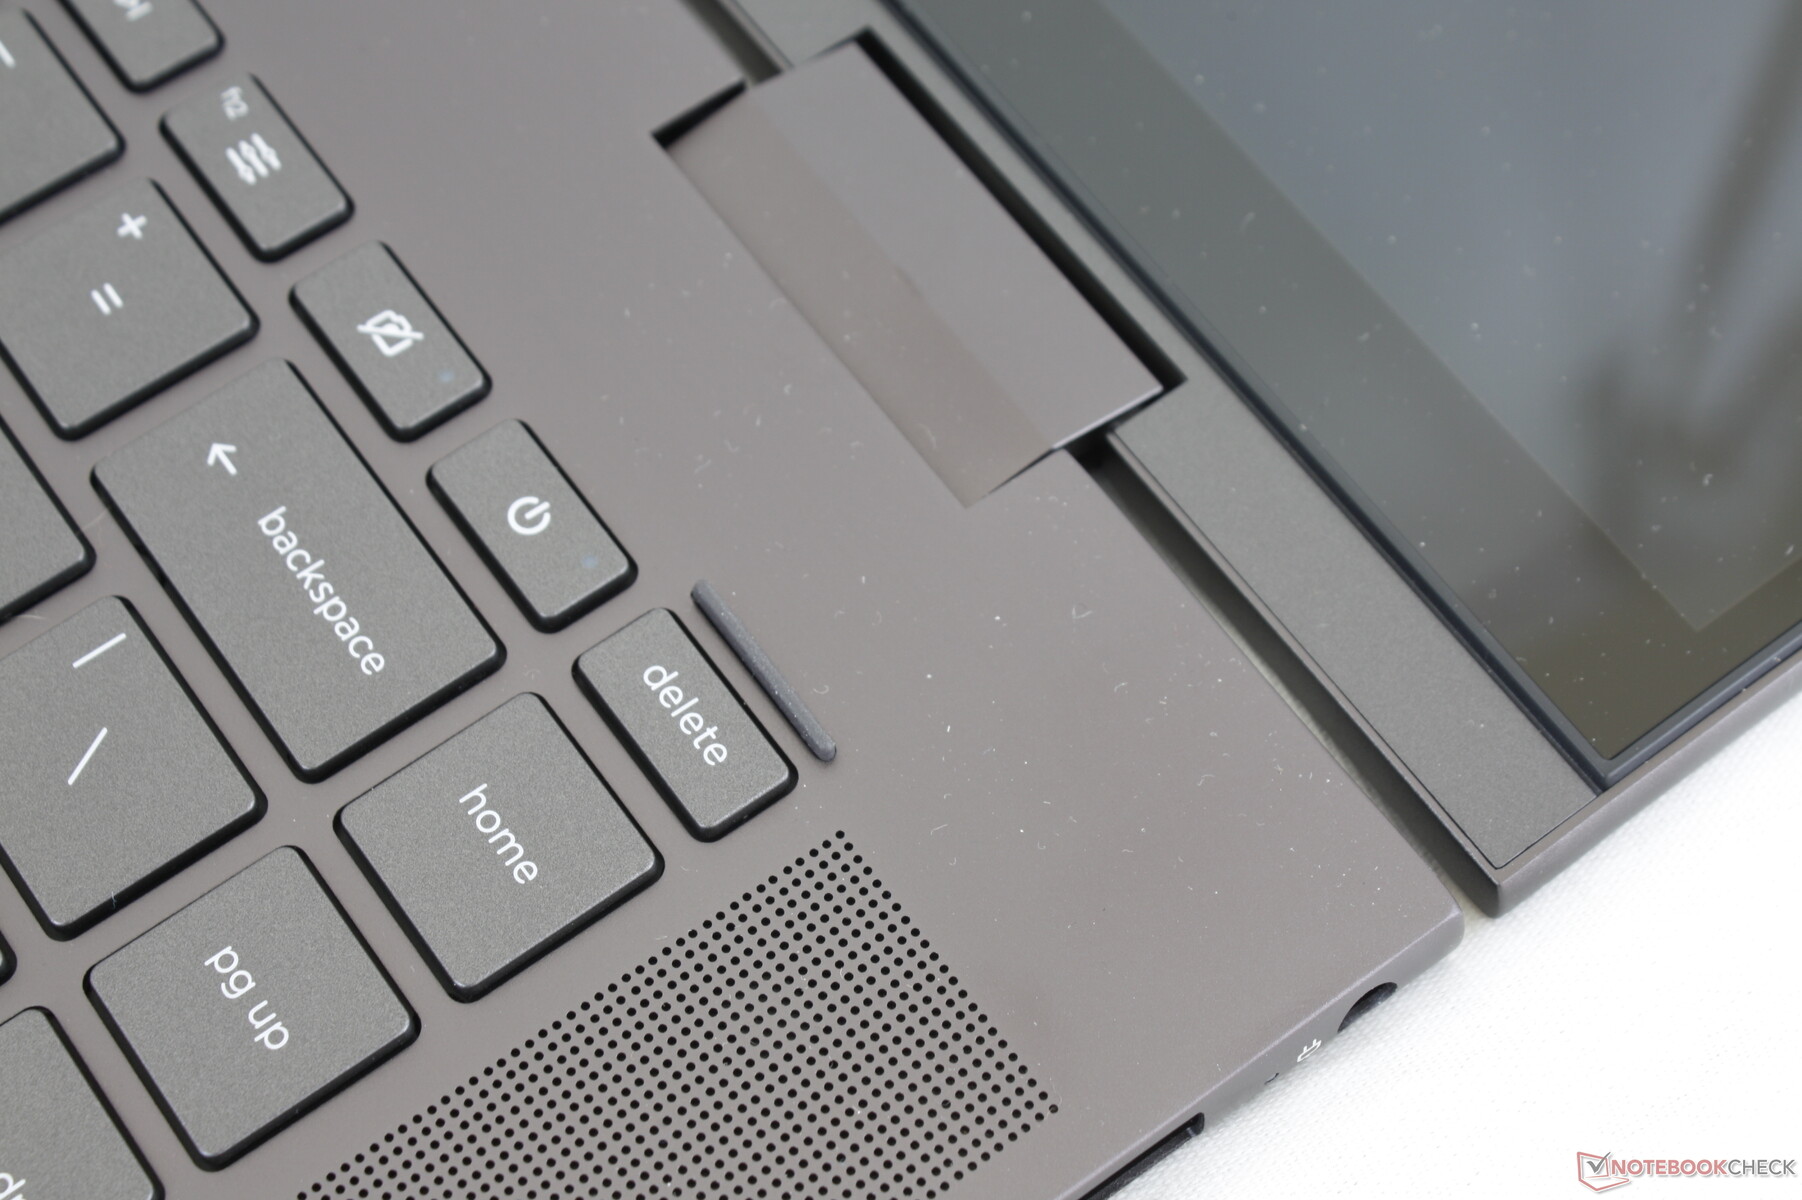
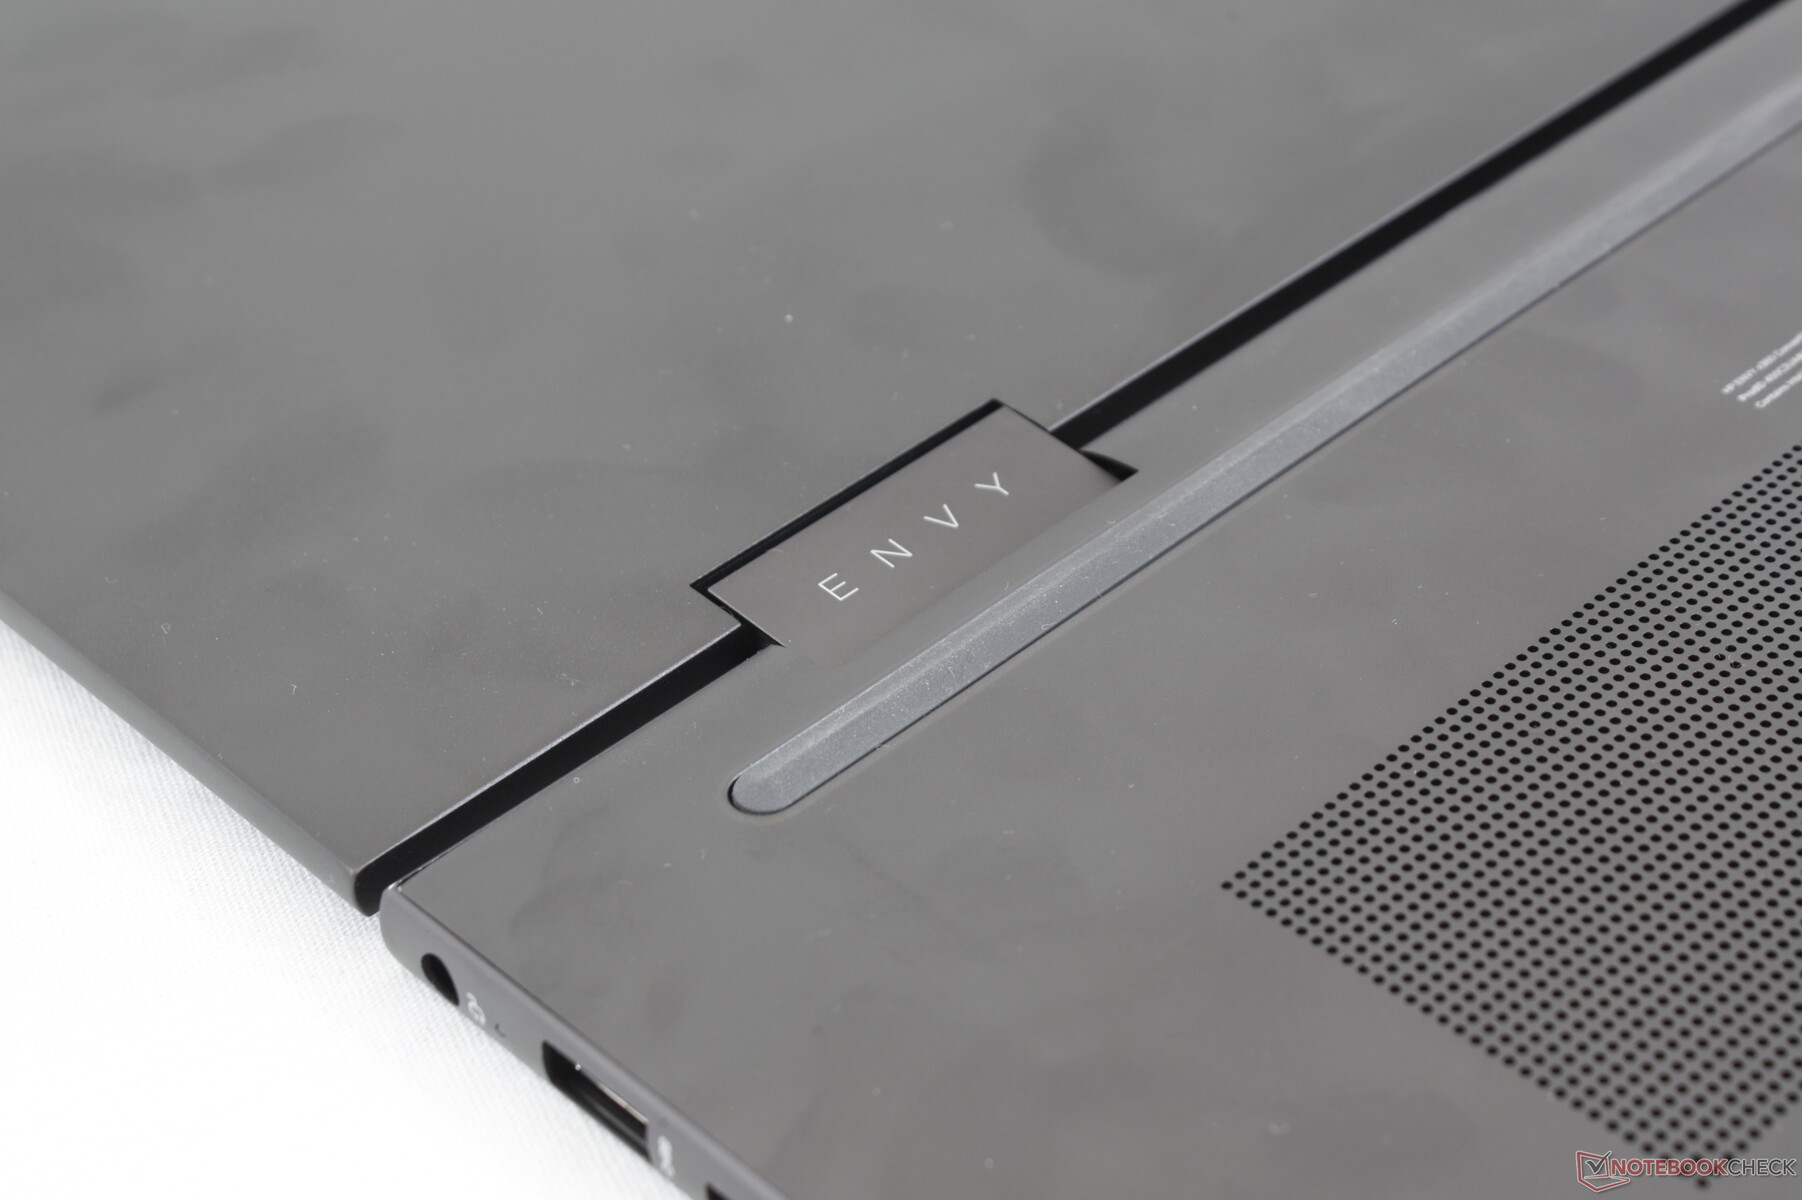
HP uses the same chassis materials as on the 2020 model for similar texture and impressions. Rigidity is good but not as tight as the Spectre x360 15 which is firmer around its base and lid. Applying pressure on the keyboard center or lid of the Envy x360 15, for example, results in slightly more surface depressions.
Visually, the differences between the 2020 and 2021 models are obvious: HP has dropped the NumPad and added grilles along the edges of the keyboard much like on the Razer Blade 15. The clickpad has also been enlarged.
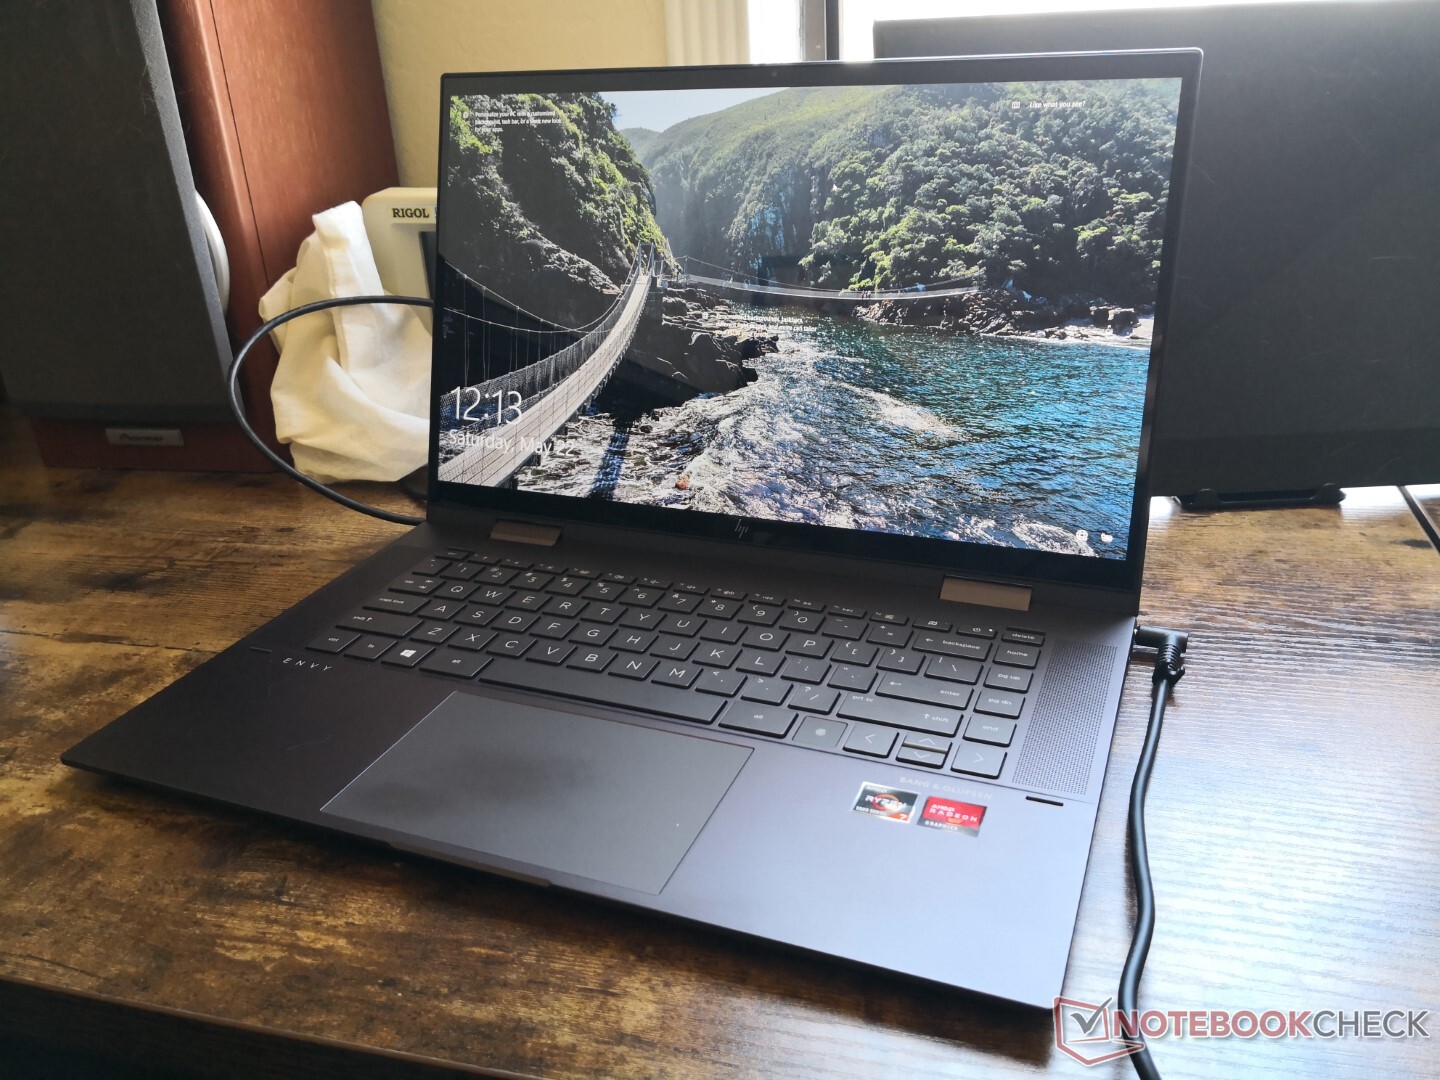
Dimensions and weight are a tad bit thinner (18.4 mm vs. 18.9 mm) and lighter (1.9 kg vs. 2.0 kg) than the 2020 version. Most notably, the new Envy is significantly smaller and lighter than the older 2019 HP Spectre x360 15 design. The Samsung Galaxy Book Flex 15 is even lighter and thinner but also significantly more expensive.
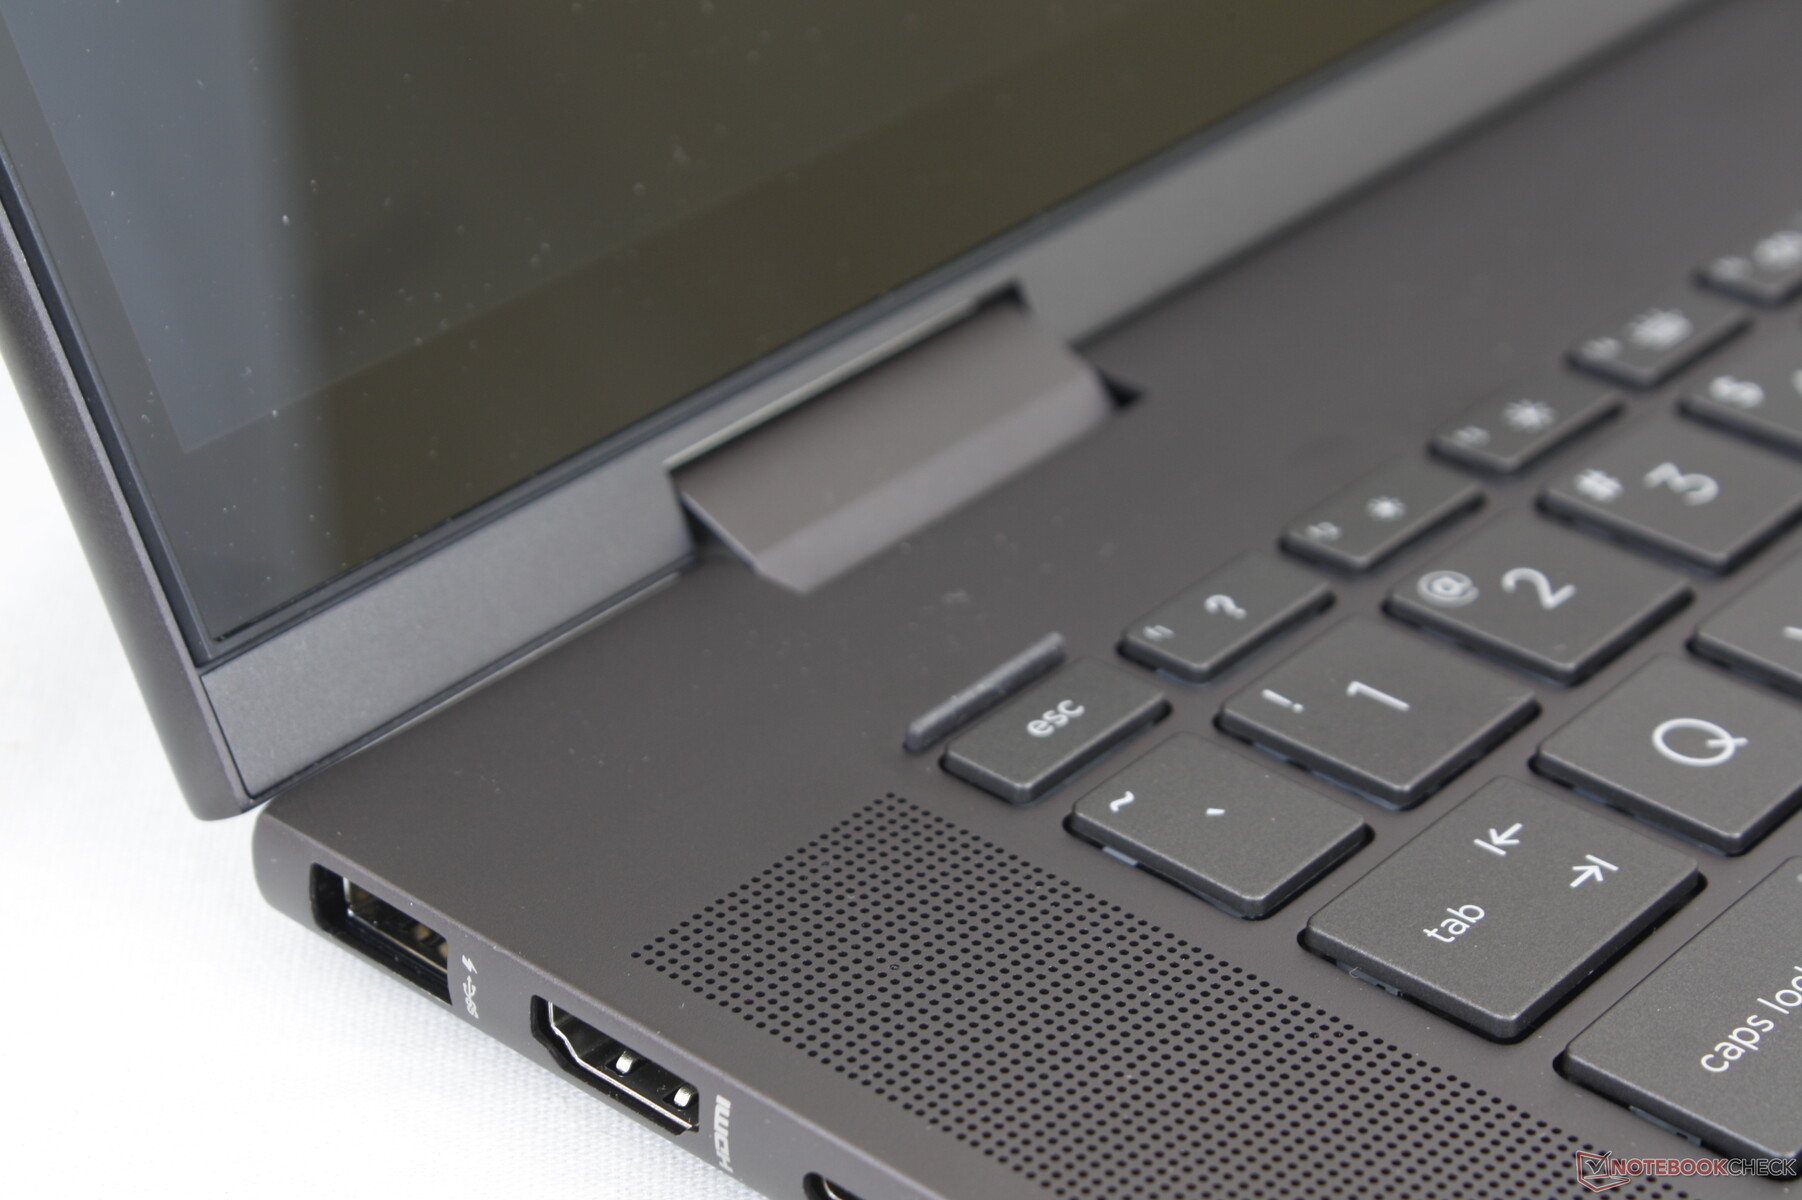
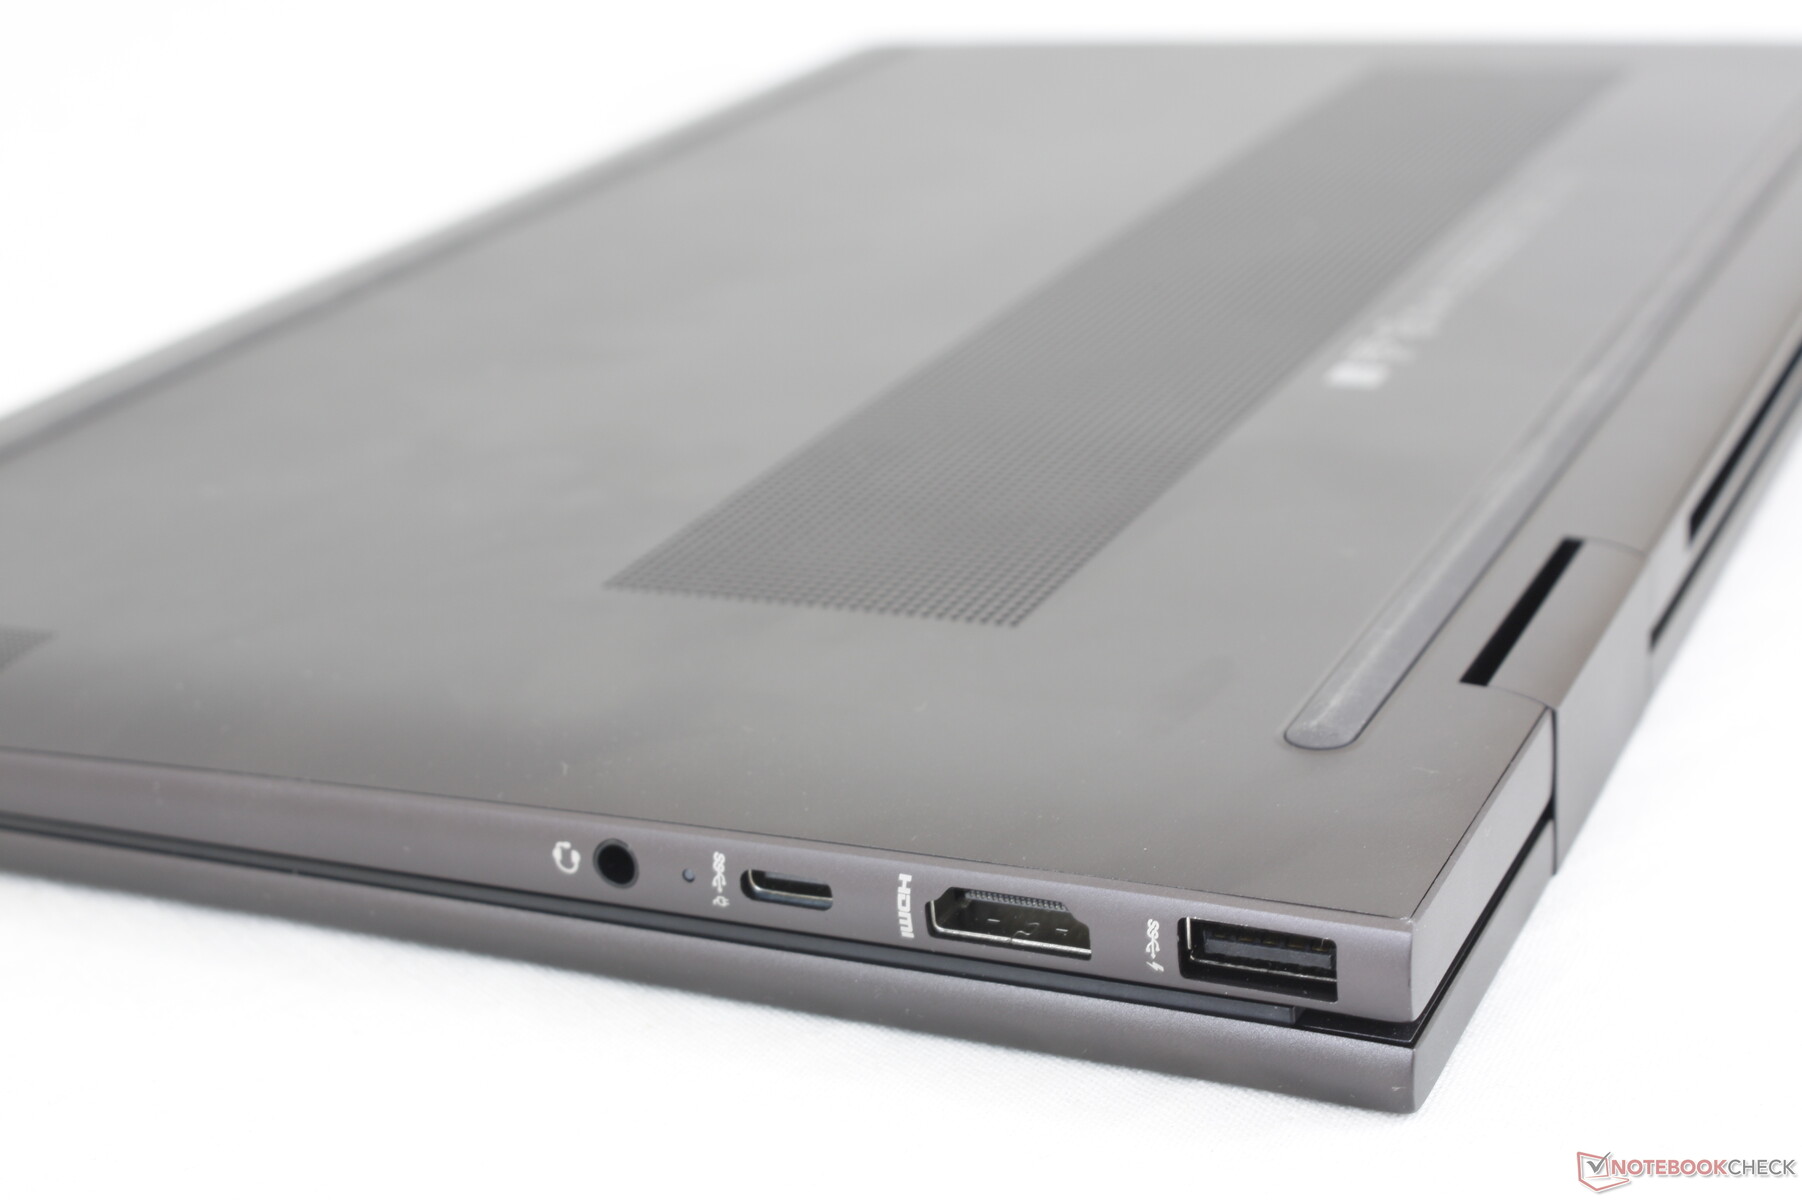
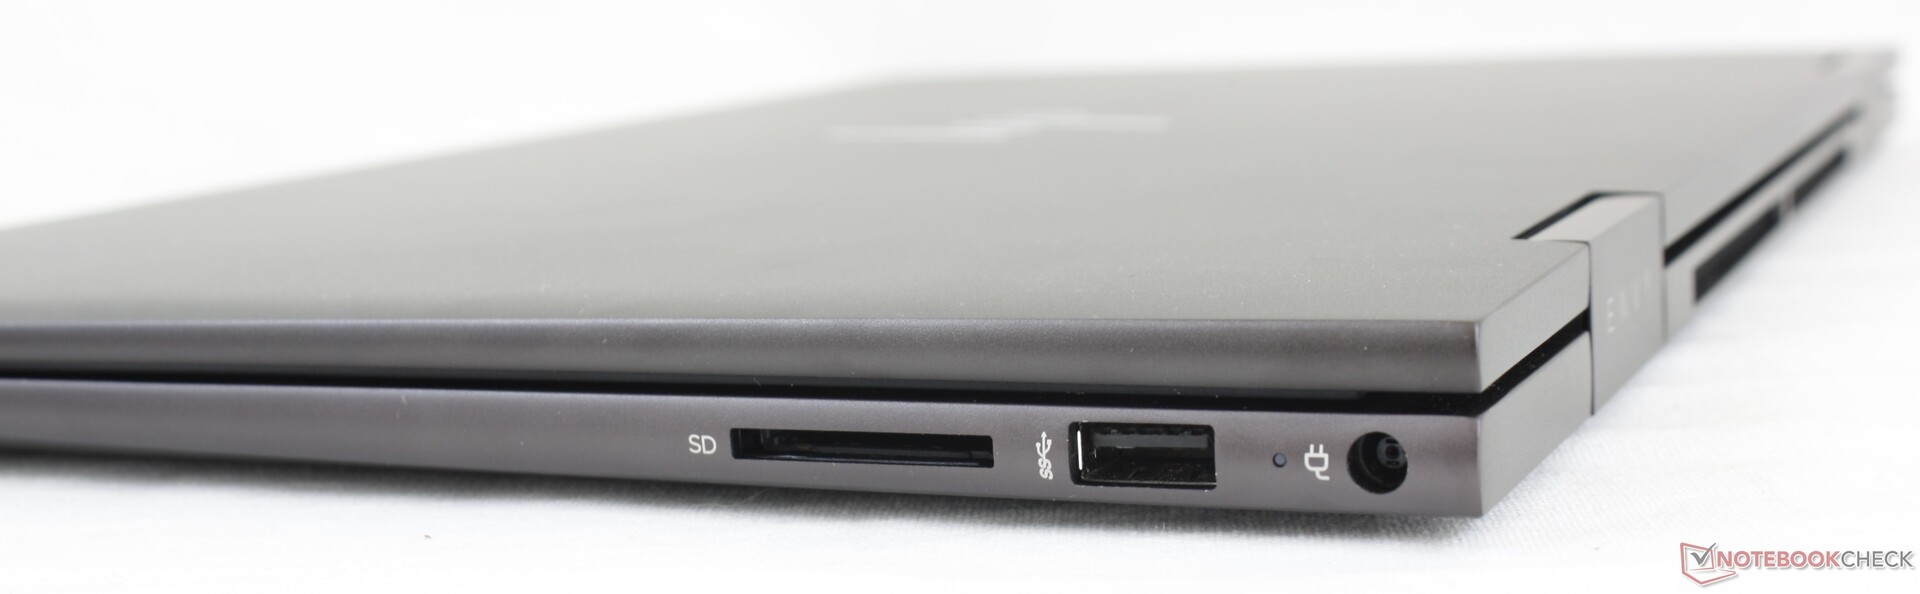
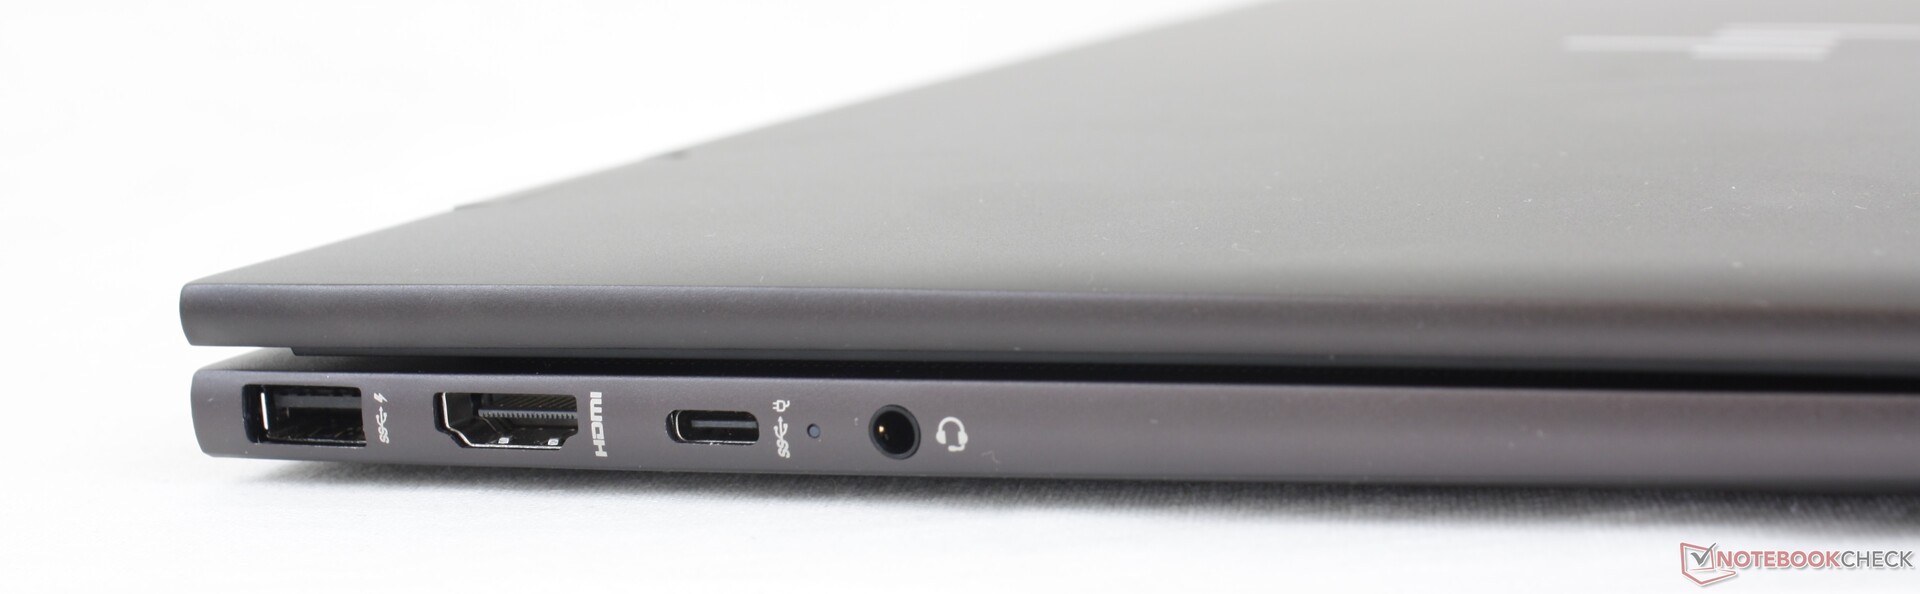
Connectivity - All The Core Essentials
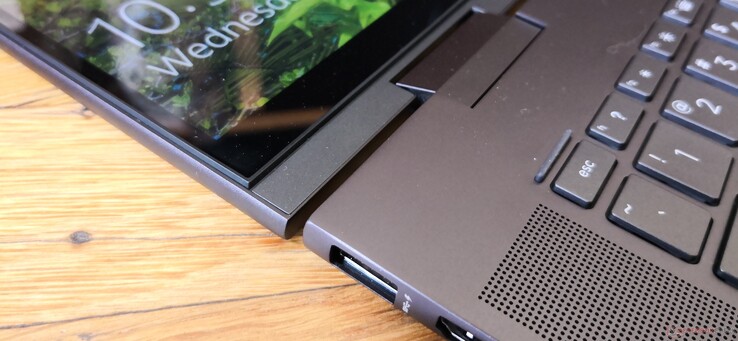
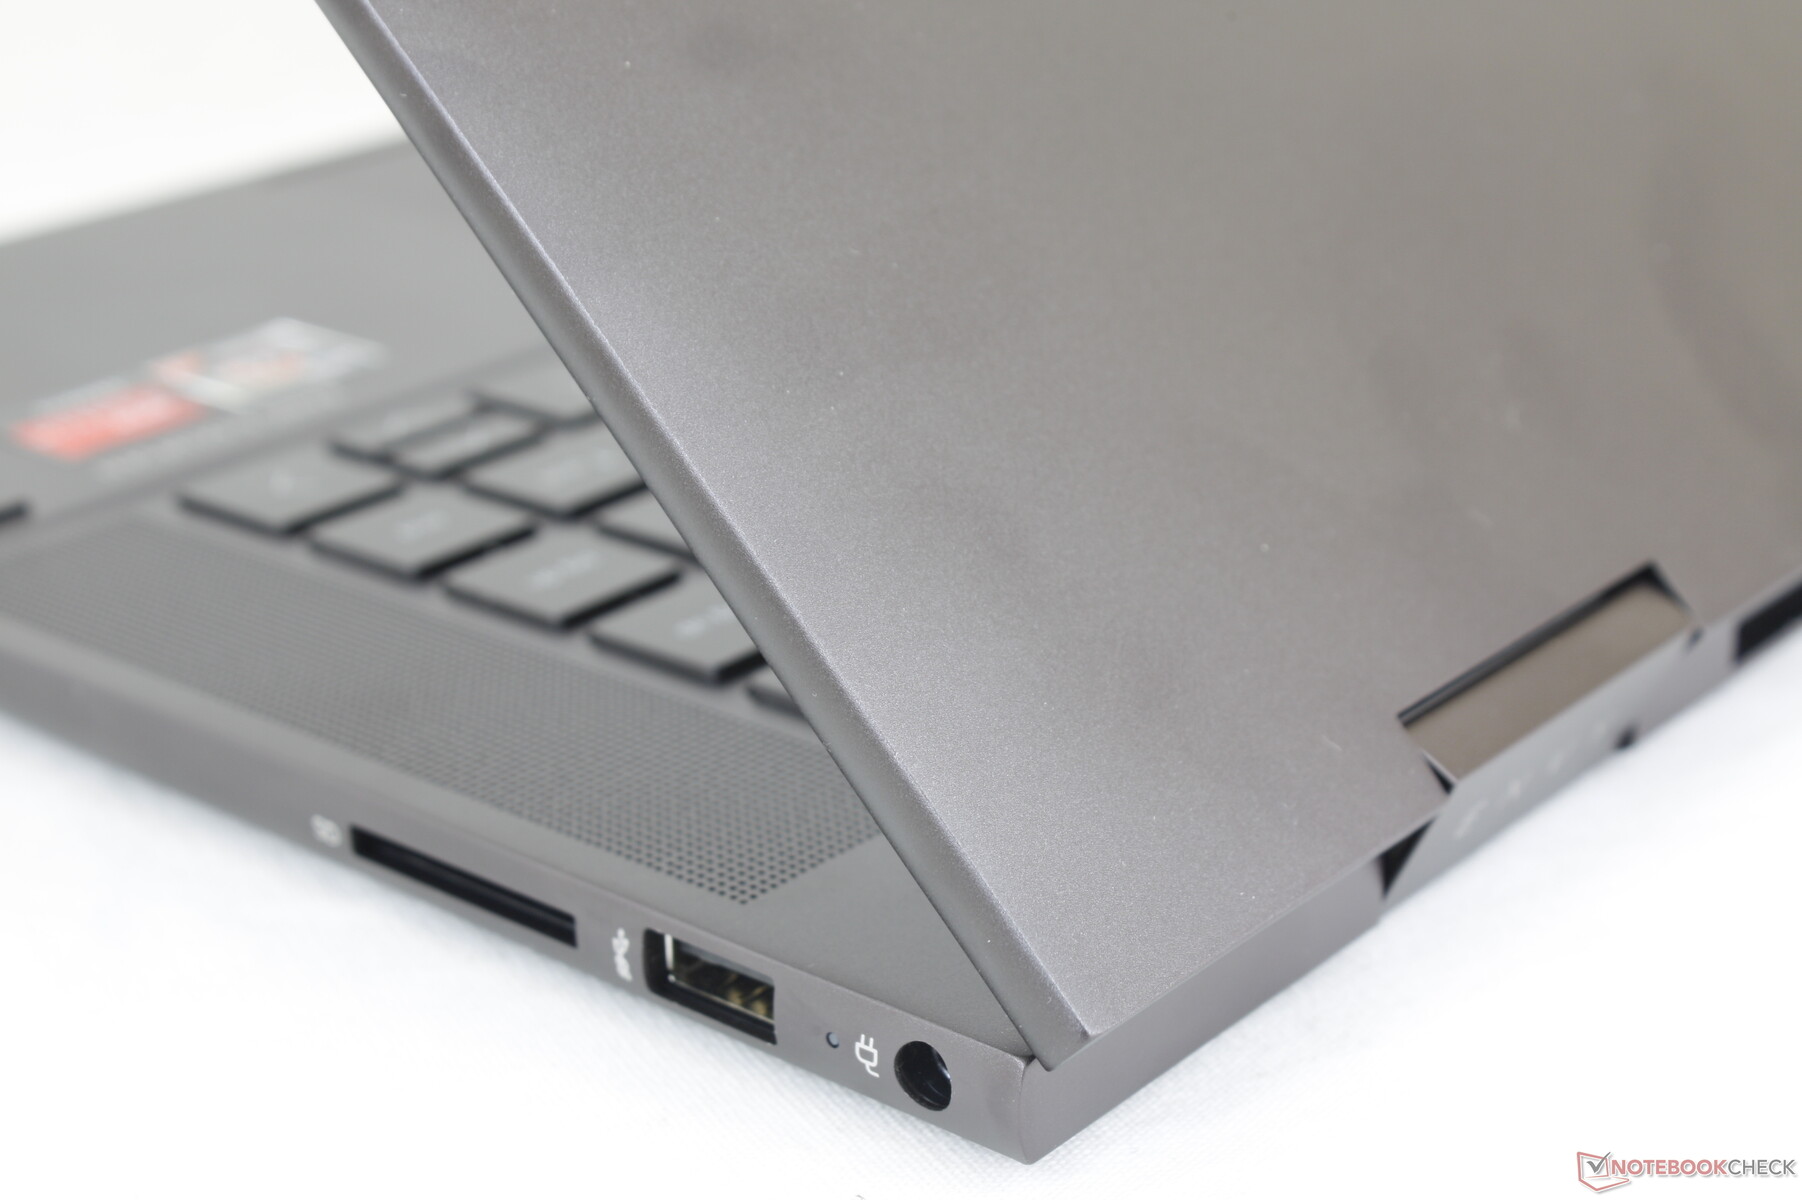
Ports have been rearranged year-over-year, but they still remain tightly packed and easy to reach. We like how the flap over the USB-A port on the 2020 model is now gone for easier access.
Thunderbolt is not supported much like on most other Ryzen-powered laptops. Fortunately, DisplayPort-over-USB and Power Delivery are present for connecting external monitors.
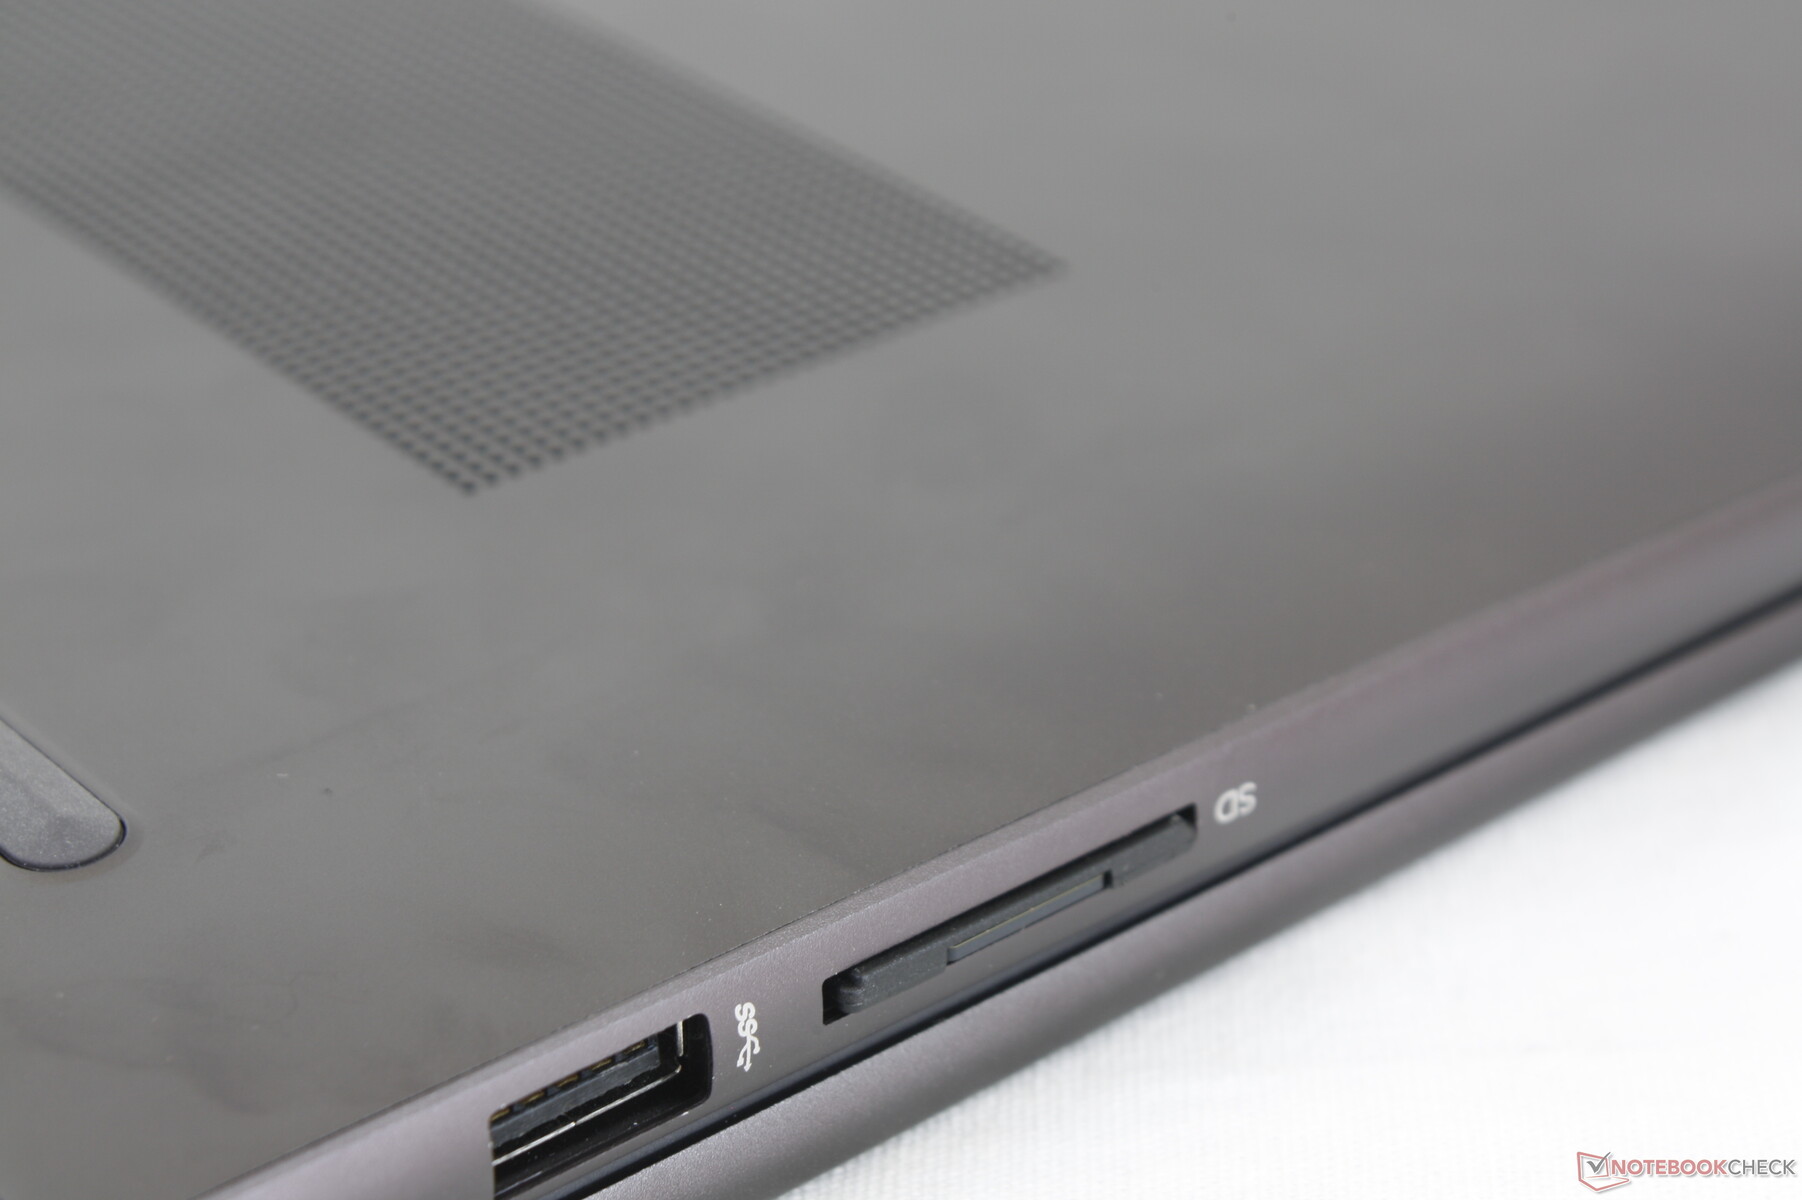
SD Card Reader
Moving 1 GB of pictures from our UHS-II test card to desktop takes about 14 seconds compared to just a few seconds on the pricier Spectre x360 15.
| SD Card Reader | |
| average JPG Copy Test (av. of 3 runs) | |
| HP Spectre X360 15-5ZV31AV (Toshiba Exceria Pro M501 UHS-II) | |
| Samsung Galaxy Book Flex 15-NP950 (Toshiba Exceria Pro M501 microSDXC 64GB) | |
| HP Envy x360 15-ee0257ng (Toshiba Exceria Pro SDXC 64 GB UHS-II) | |
| Asus ZenBook Flip 15 UX563FD-A1027T (Toshiba Exceria Pro SDXC 64 GB UHS-II) | |
| HP Envy x360 15-eu0097nr (AV PRO microSD 128 GB V60) | |
| maximum AS SSD Seq Read Test (1GB) | |
| HP Spectre X360 15-5ZV31AV (Toshiba Exceria Pro M501 UHS-II) | |
| Samsung Galaxy Book Flex 15-NP950 (Toshiba Exceria Pro M501 microSDXC 64GB) | |
| HP Envy x360 15-ee0257ng (Toshiba Exceria Pro SDXC 64 GB UHS-II) | |
| HP Envy x360 15-eu0097nr (AV PRO microSD 128 GB V60) | |
Communication
Webcam


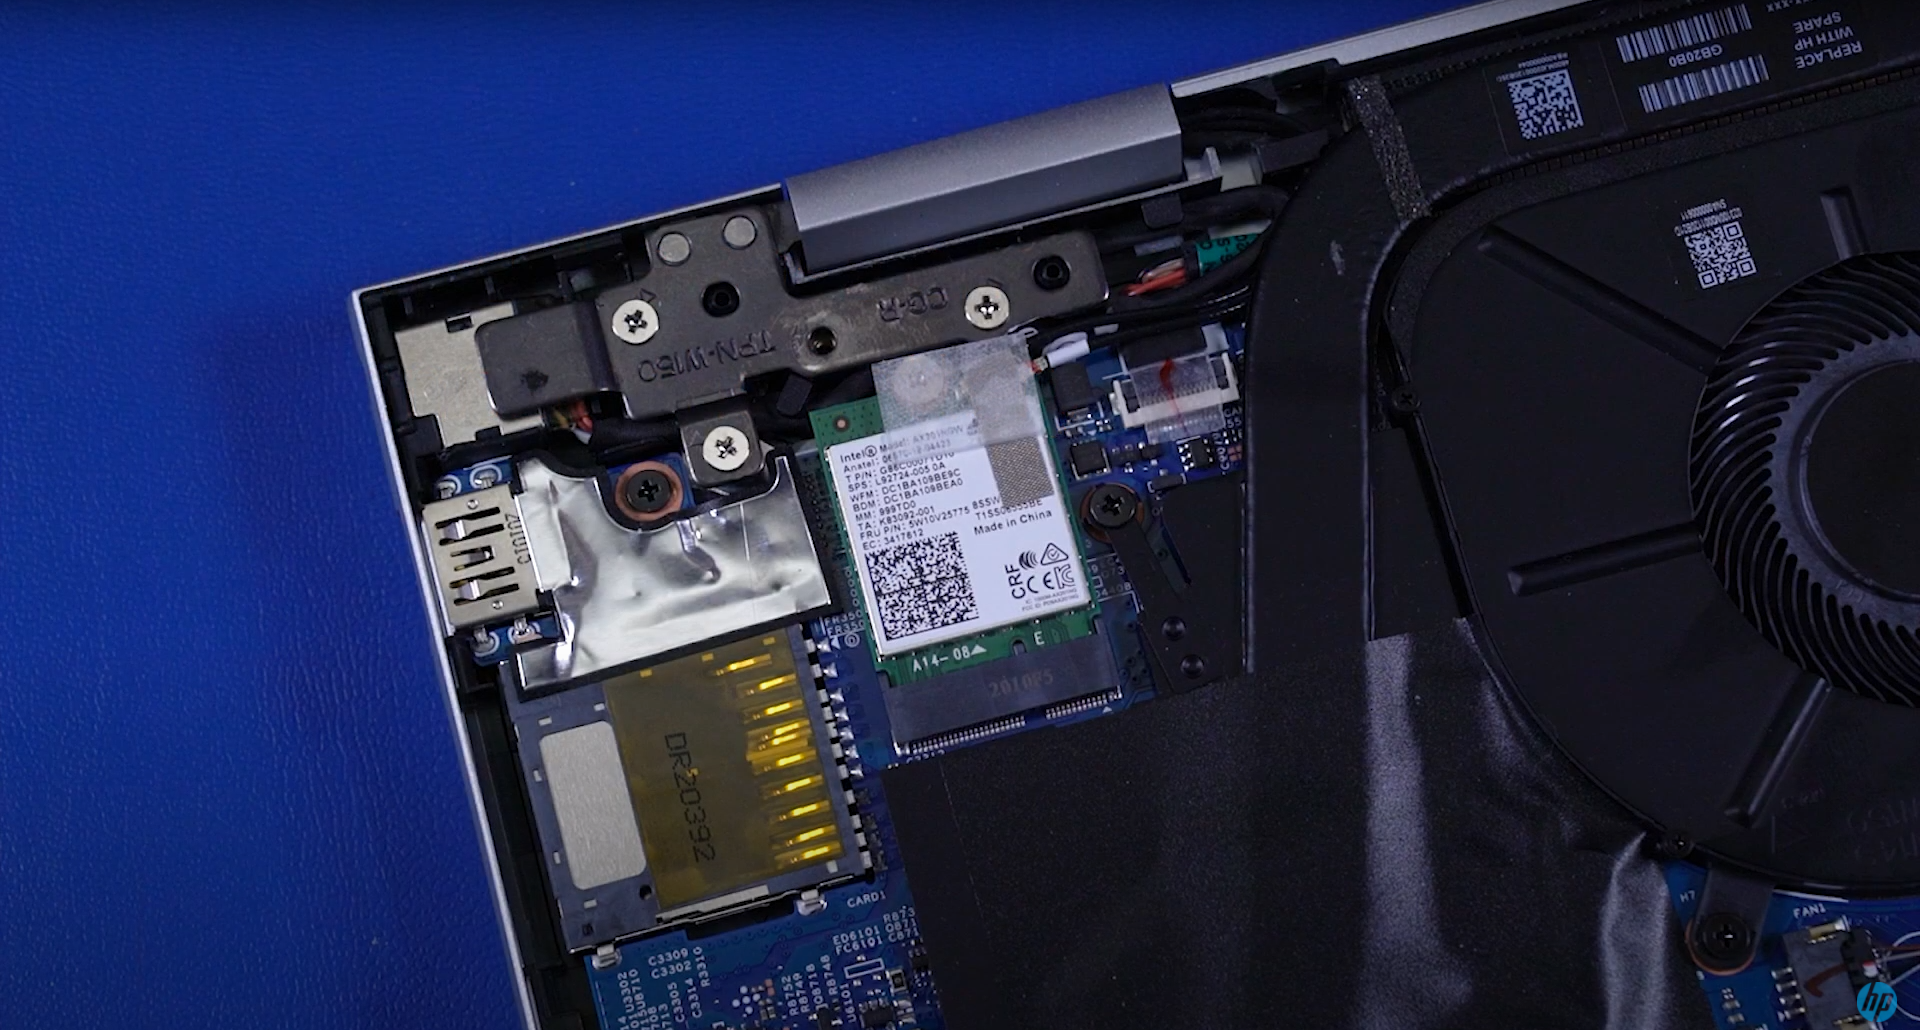
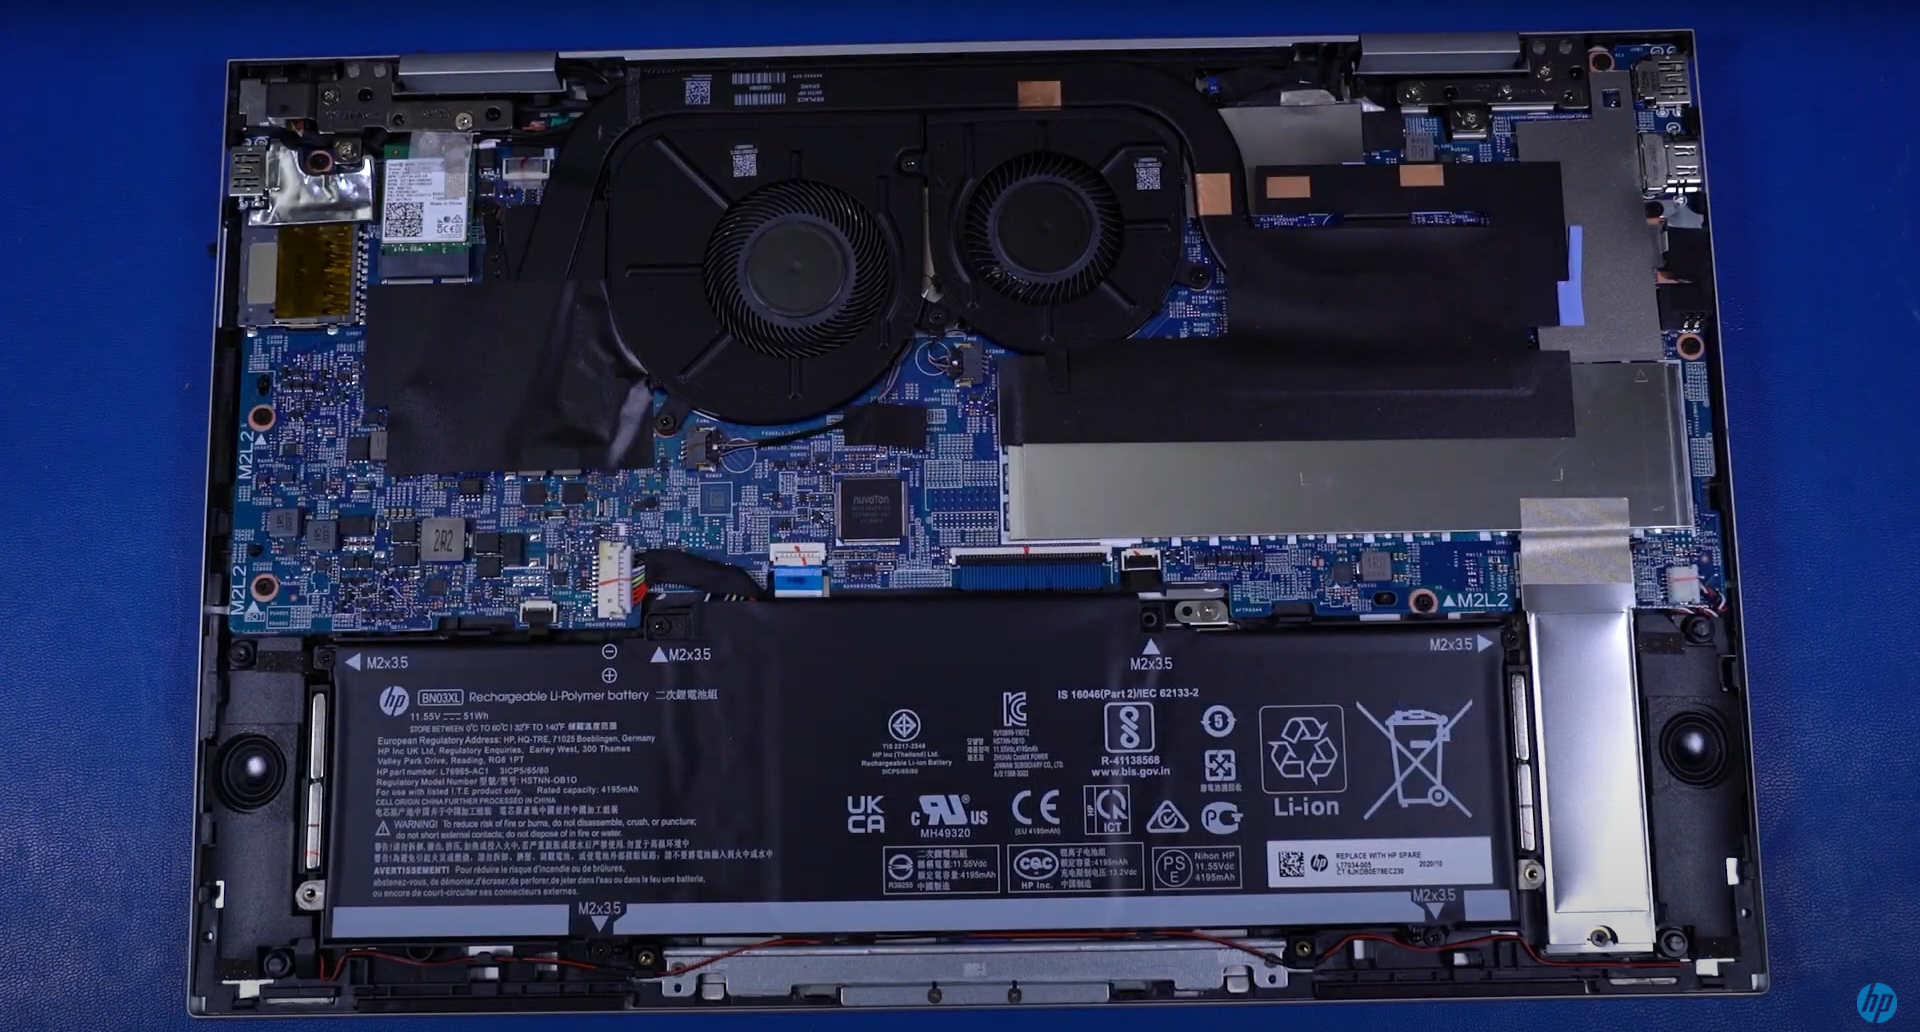
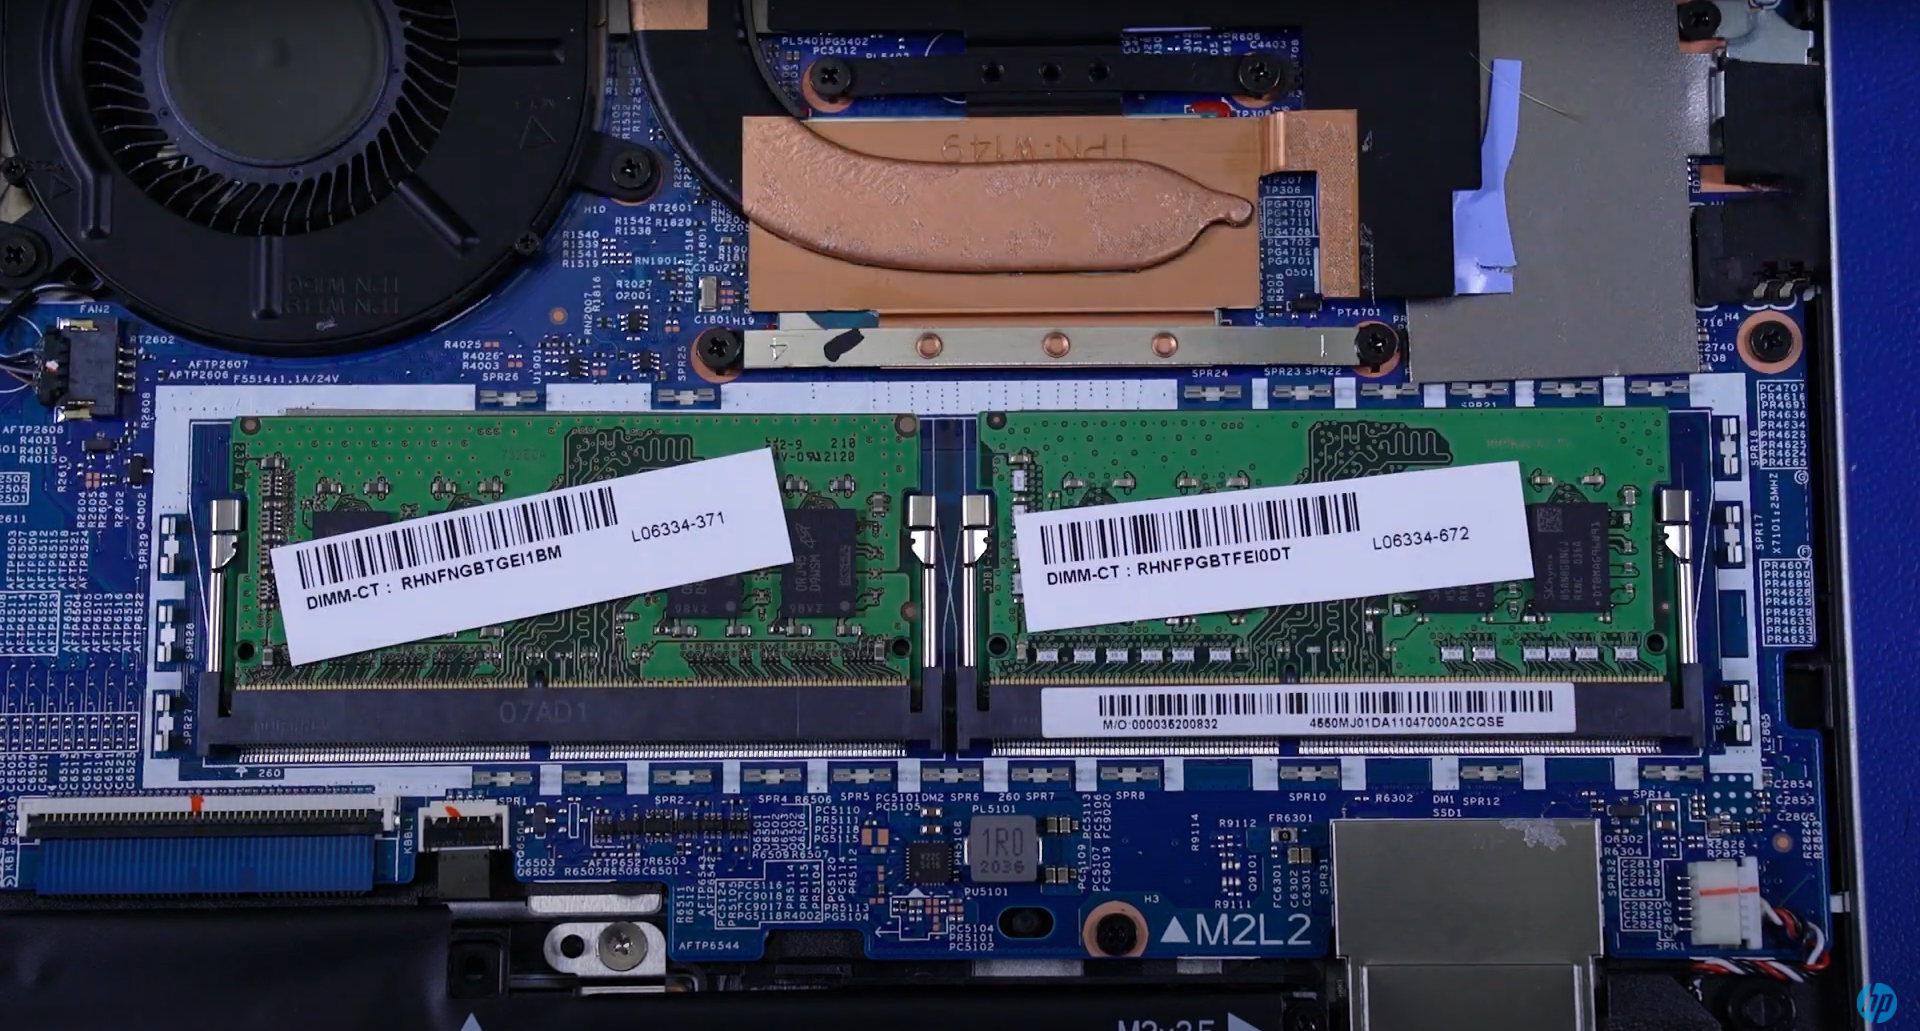
Maintenance
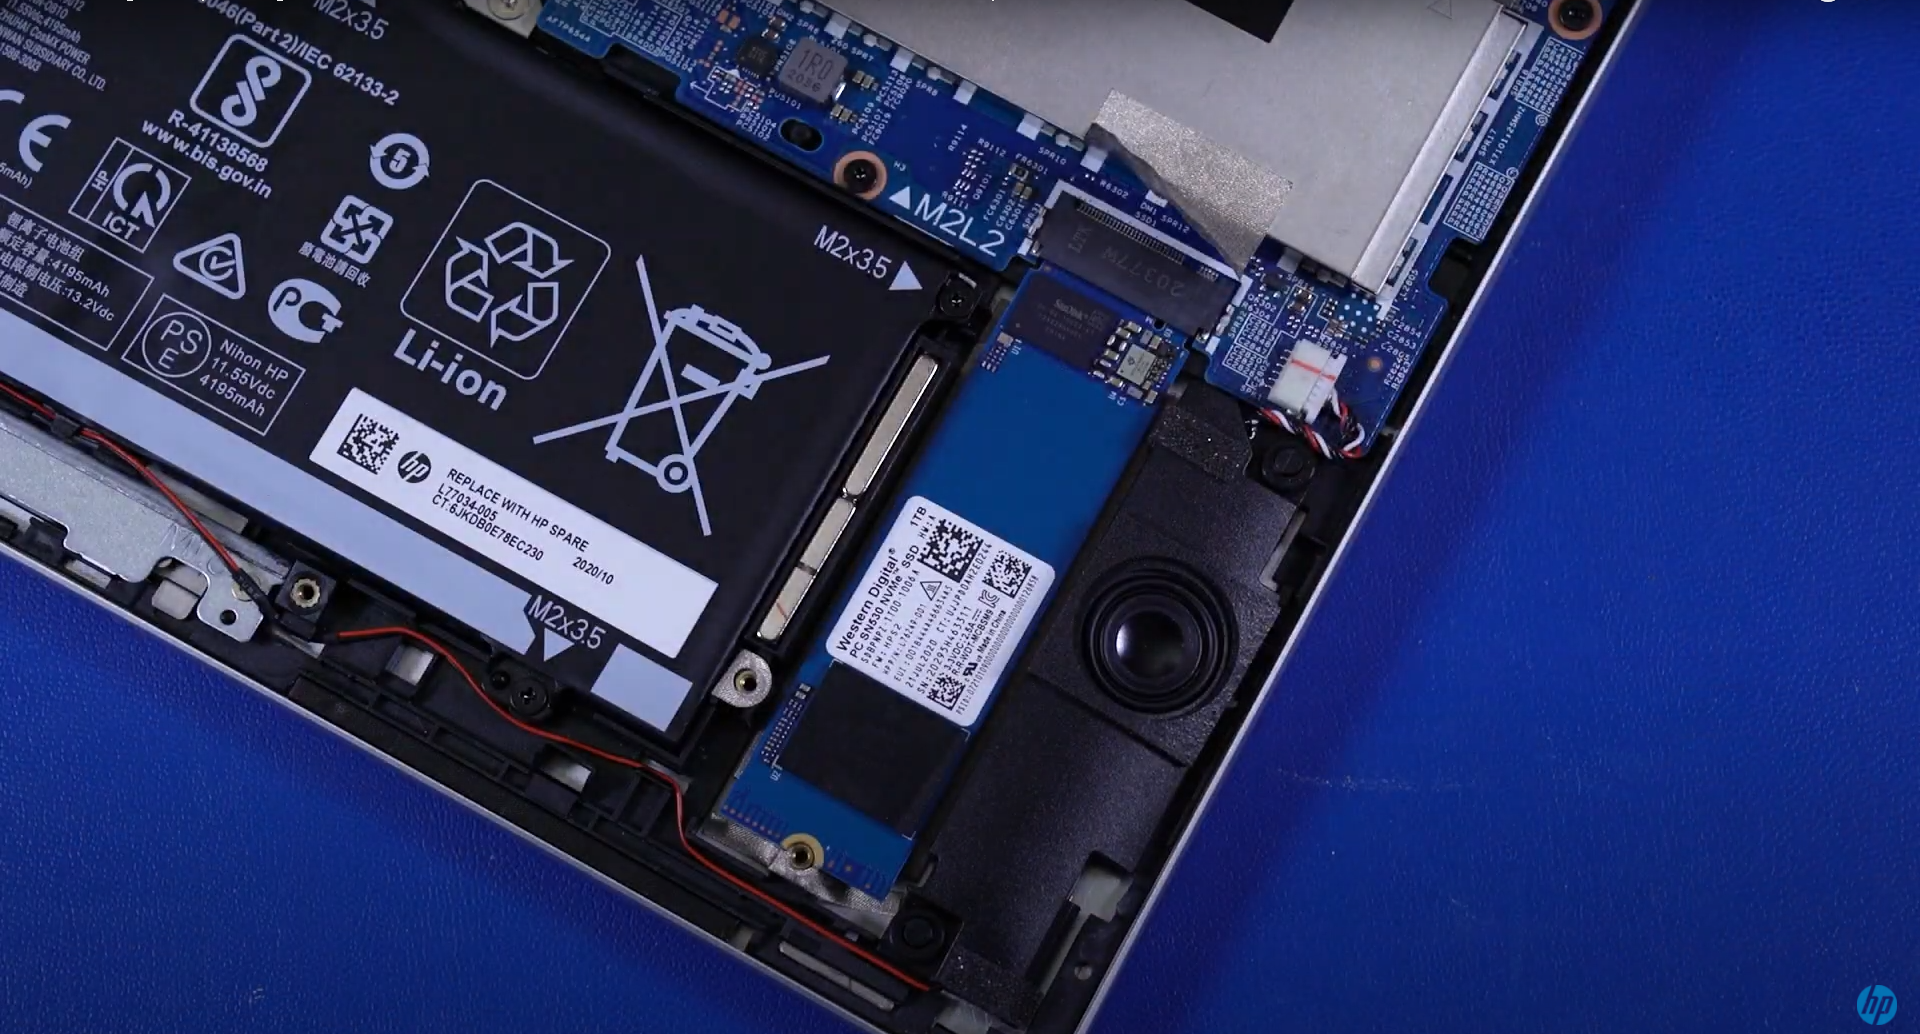
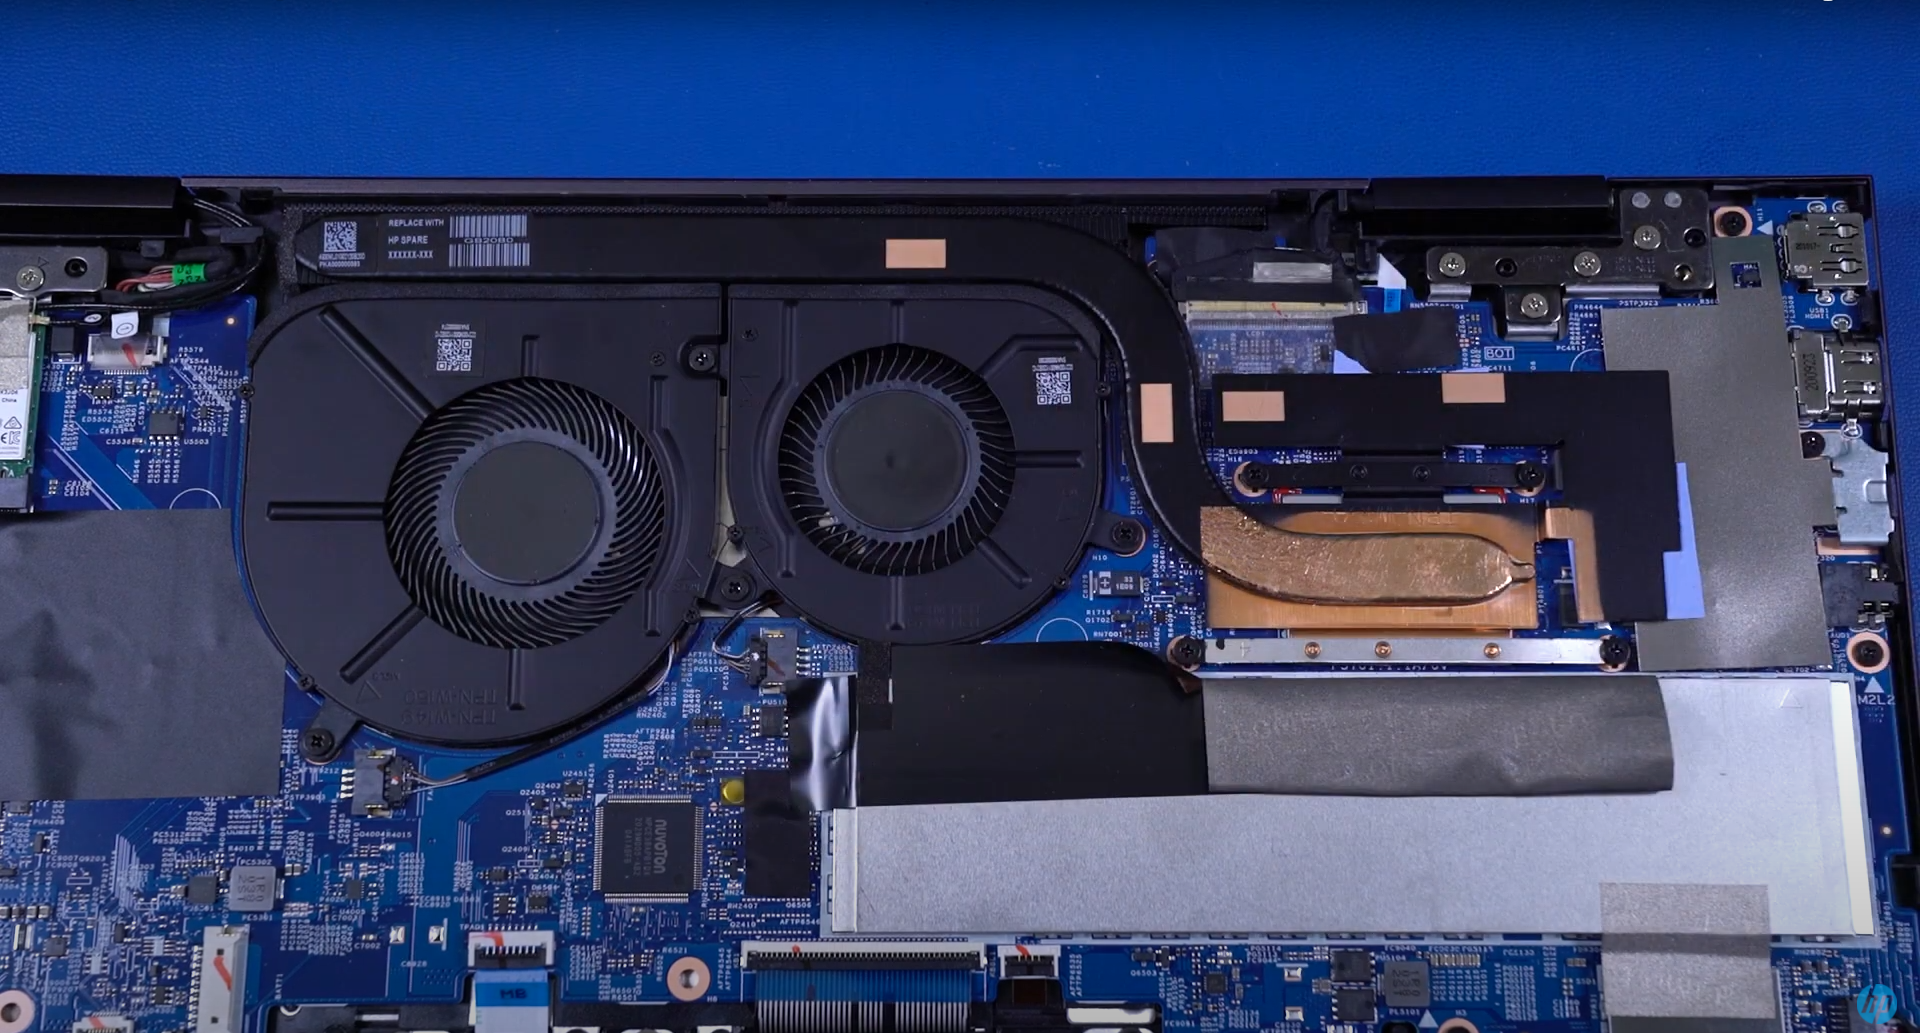
The bad news is that there are several screws tucked underneath the glued rubber feet on the bottom plate. The good news is that HP has a very helpful disassembly video to aid owners who wish to upgrade or service the laptop. The two SODIMM slots and single M.2 2280 slot are protected under aluminum plates.
Accessories and Warranty
There are no extras in the retail box, but optional accessories are available like the HP 930 Creator wireless mouse. The standard one-year limited warranty applies with extensive options if ordered directly from HP.
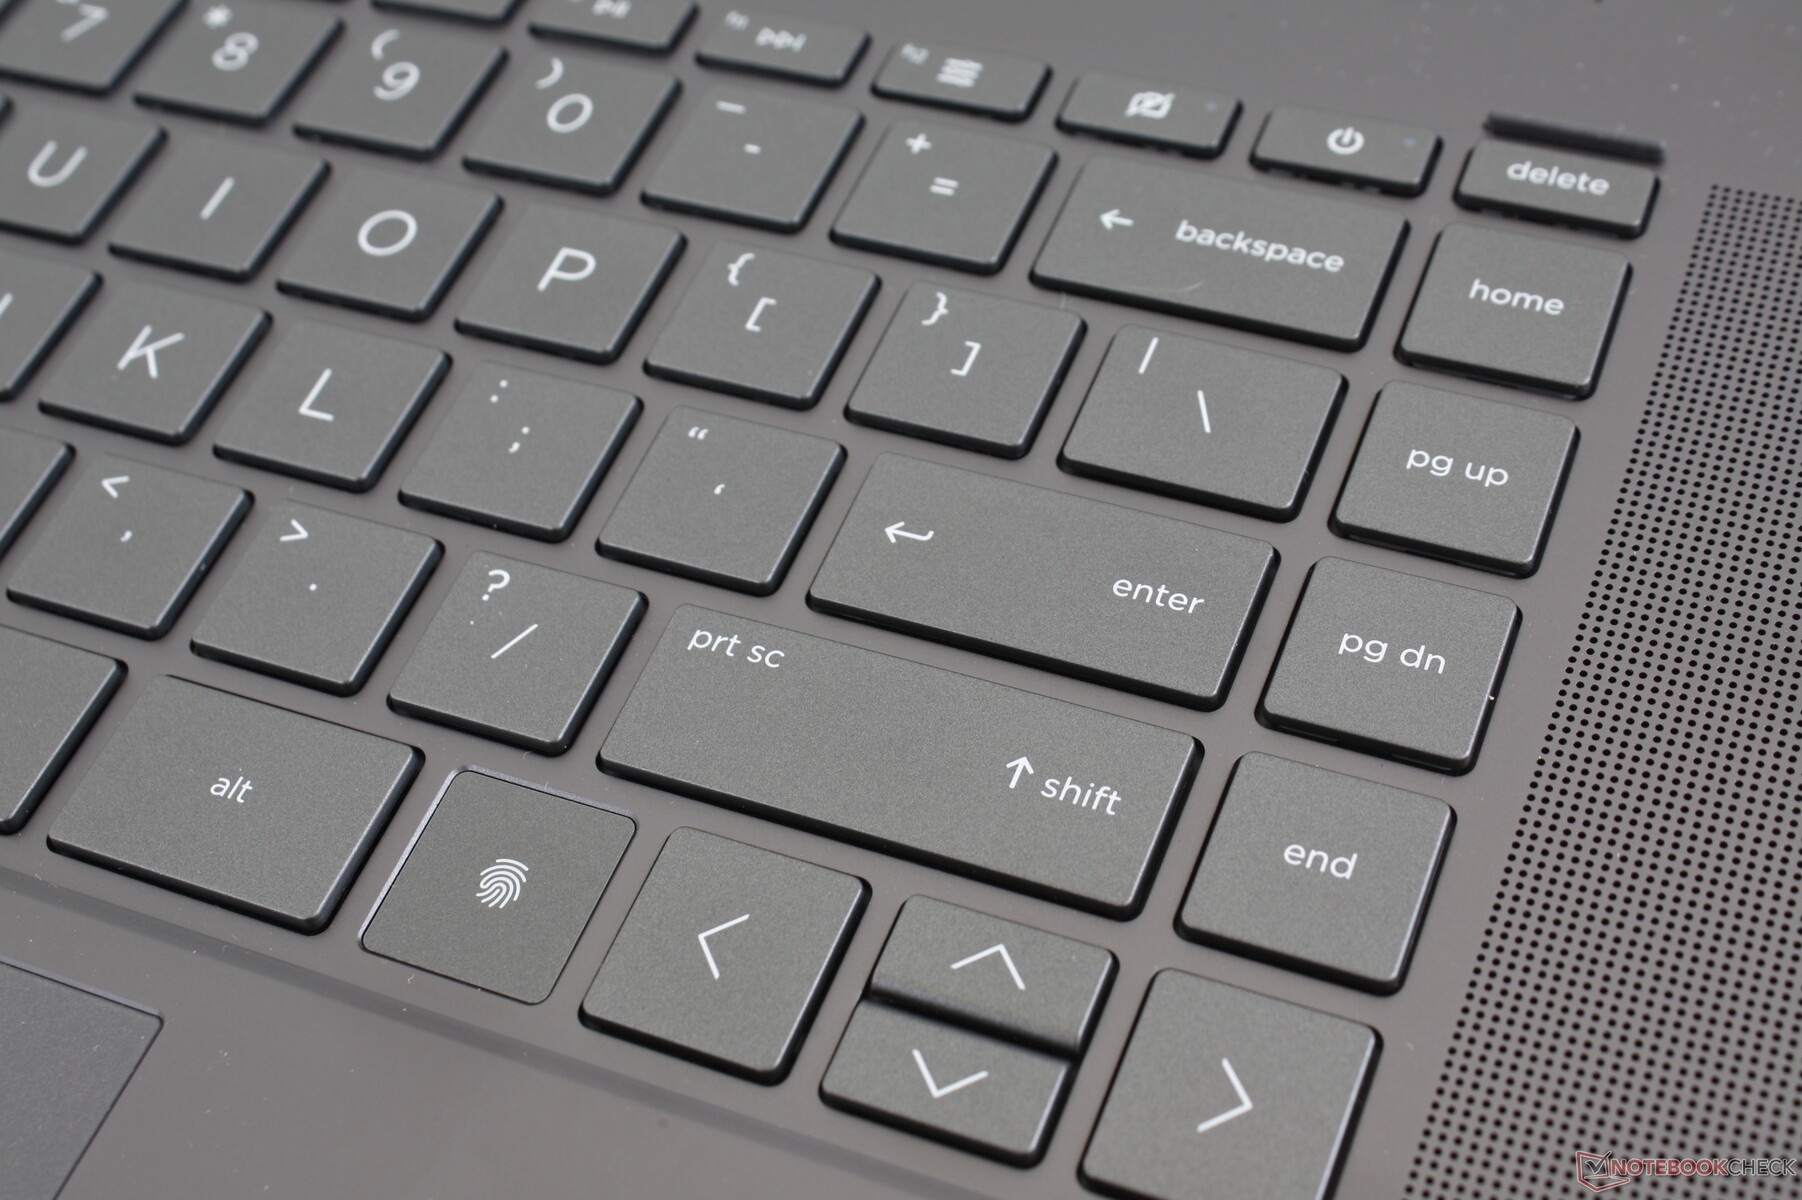
Input Devices - Missing NumPad Is A Bummer
Keyboard
The keyboard is exactly the same as on the Envy 15 Creator and so our existing comments apply here. We generally prefer the keyboards on most higher-end HP laptops like the Envy, Spectre, or EliteBook series because they tend to offer deeper, crisper, and more uniform feedback than most other models. Even so, we would love to see larger arrow keys like on the Summit B15 or a customizable HP Programmable key like on some EliteBook models.
A two-level single-zone white backlight comes standard and all printed symbols become lit.
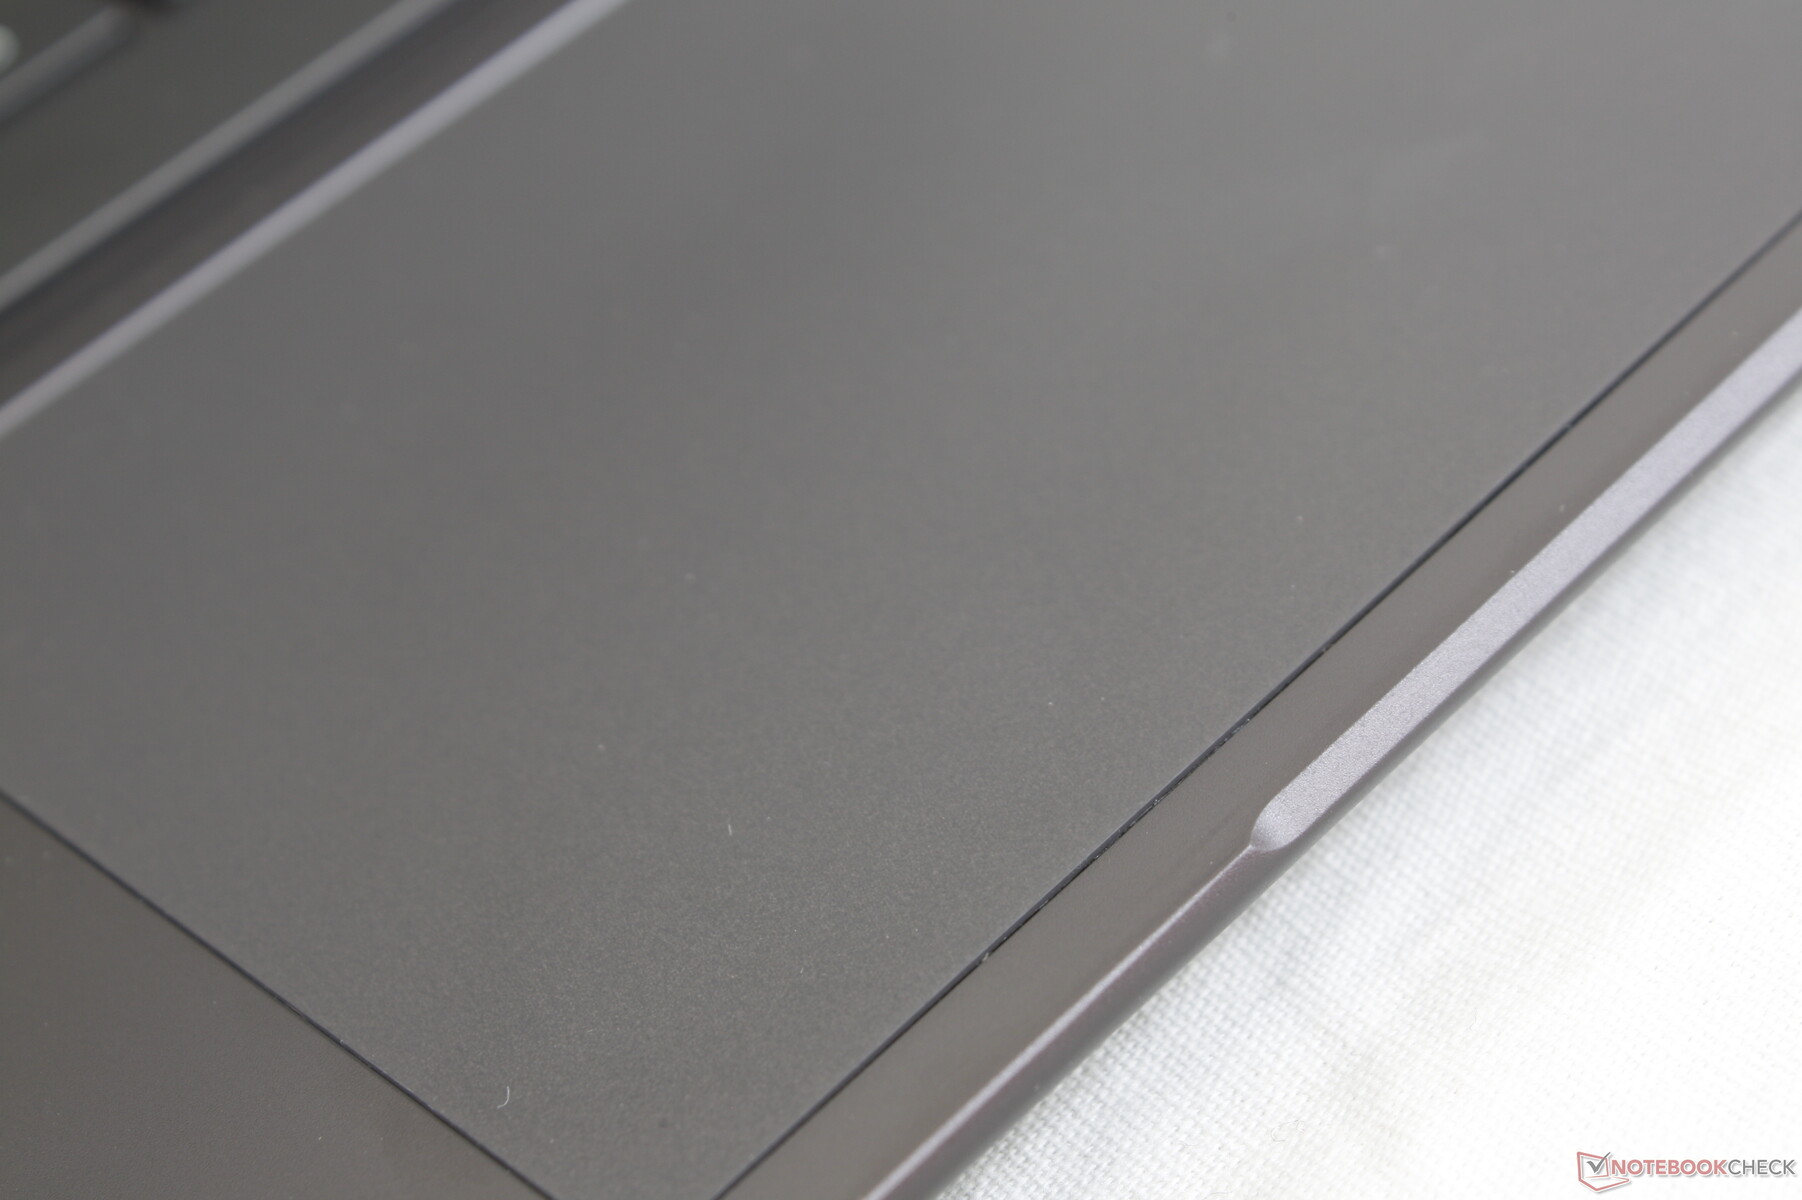
Touchpad
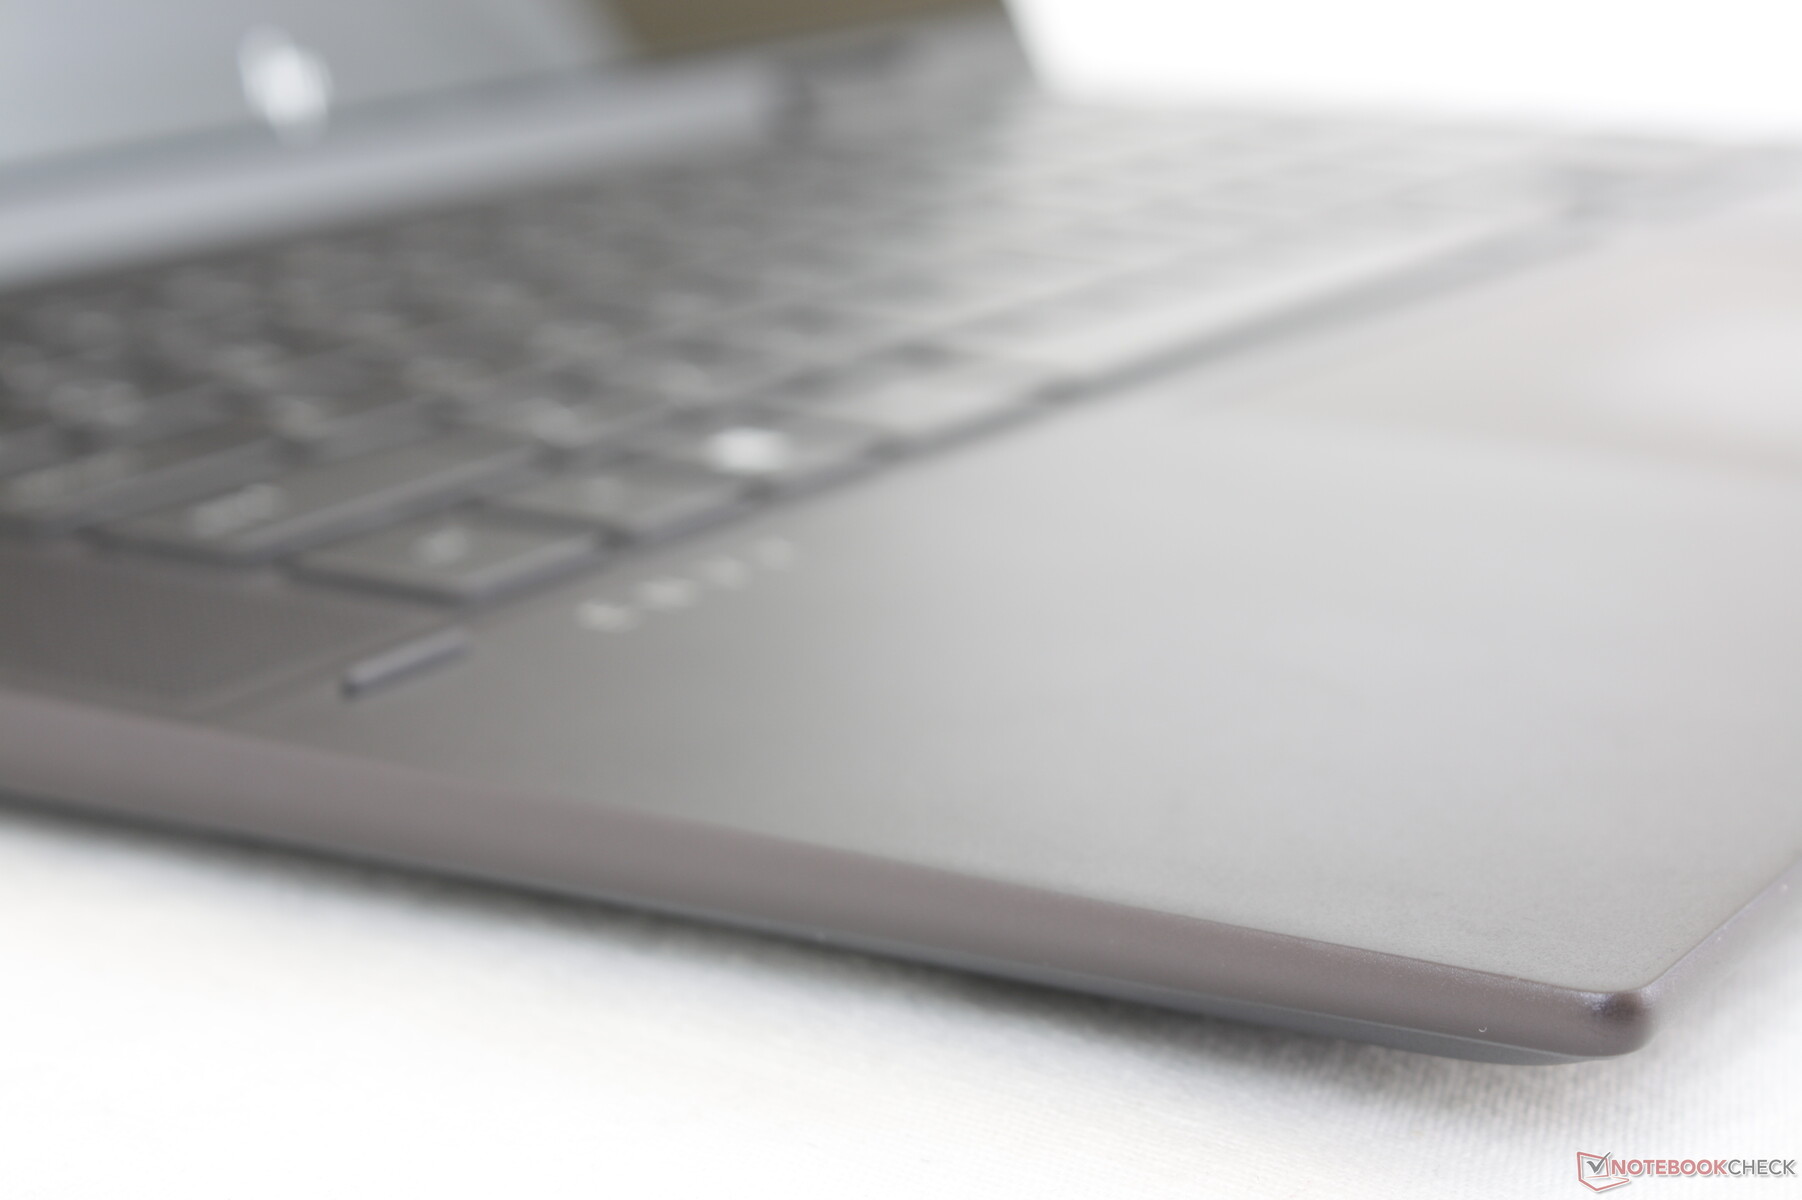
Surface area is slightly larger than on the 2020 version (12.5 x 8 cm vs. 11.5 x 7.3 cm) for easier multi-touch inputs and scrolling. Traction is smooth at fast speeds, but the finger tends to stick when gliding at medium speeds or slower. Expect unsightly grease and fingerprints to accumulate very quickly.
Feedback when clicking on the clickpad is relatively loud despite the somewhat spongy and shallow feel.

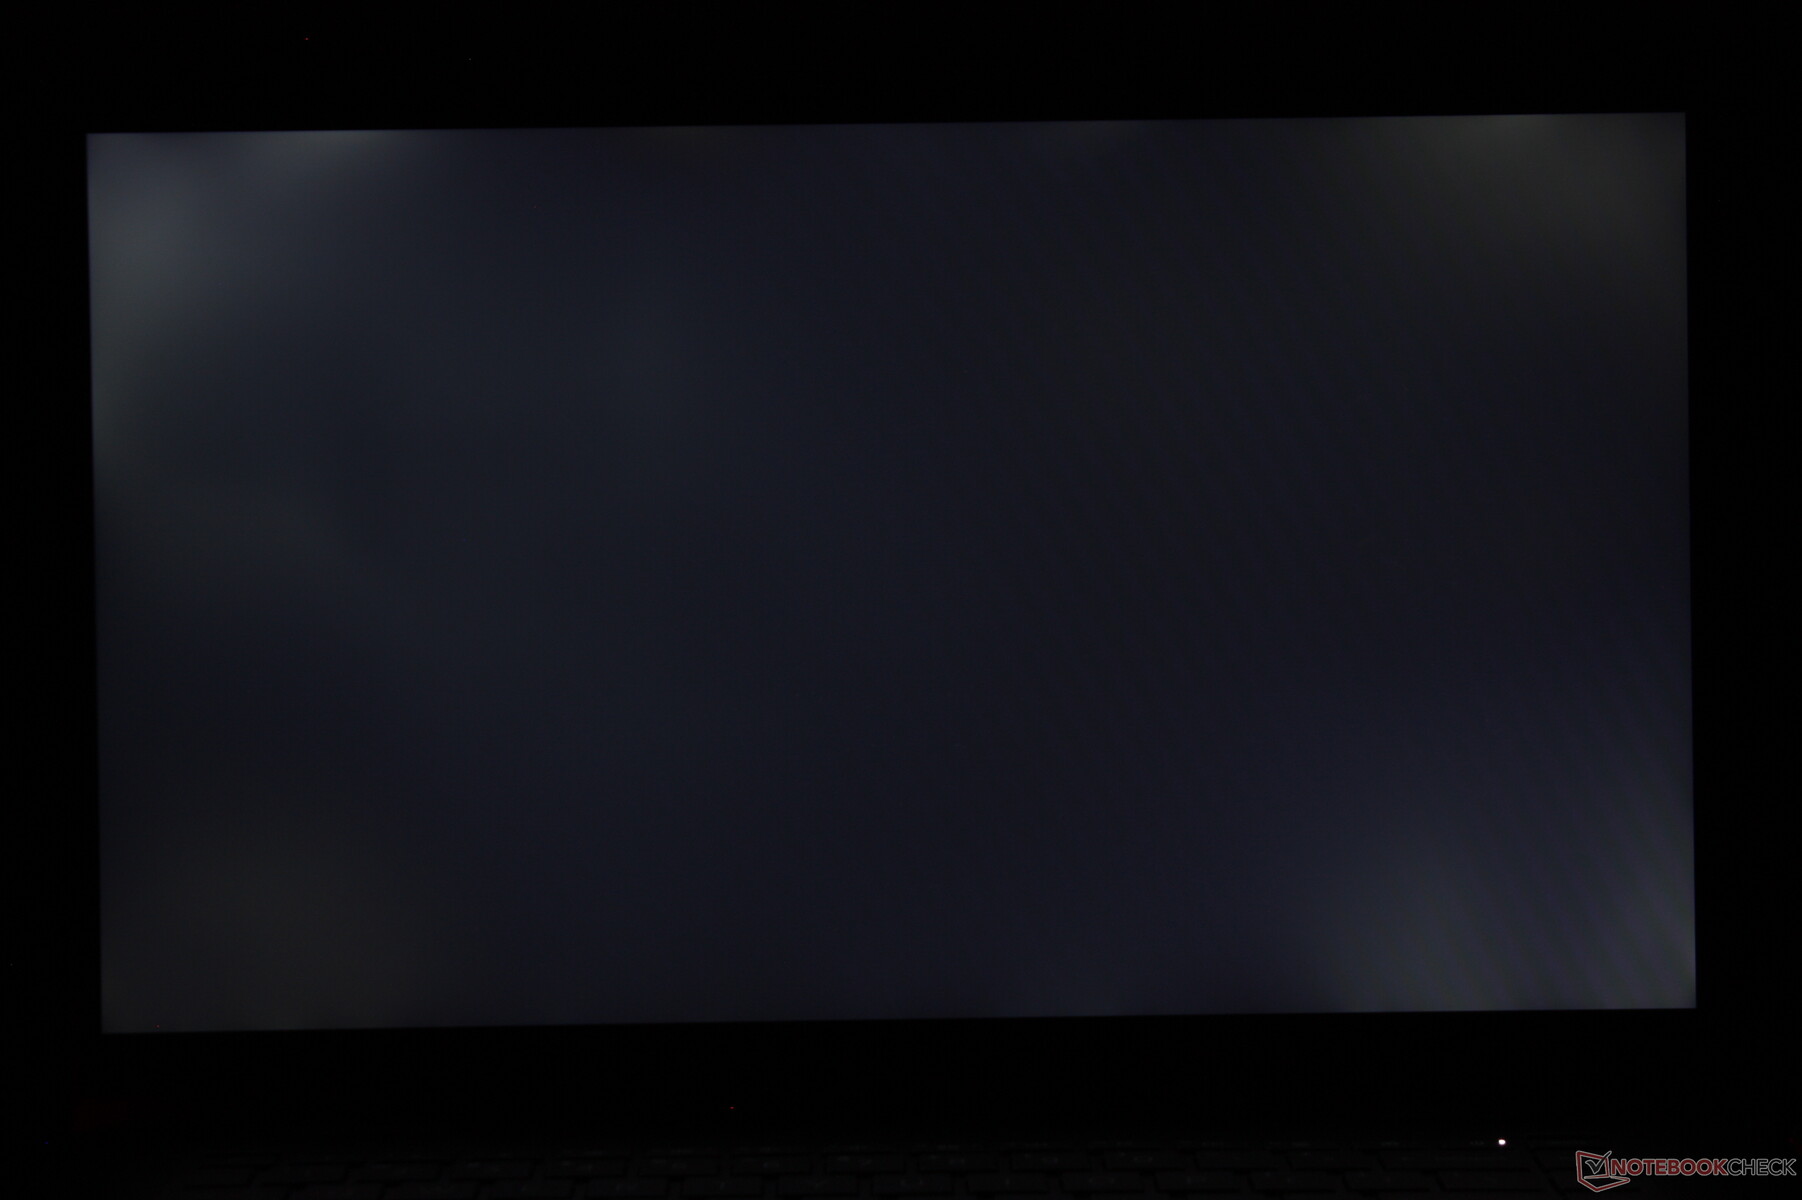
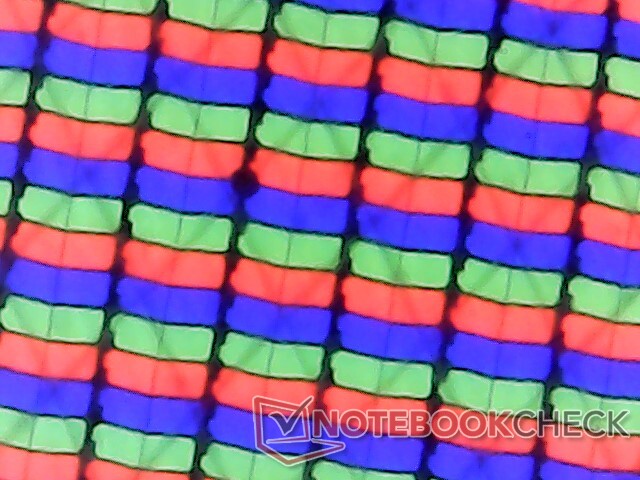
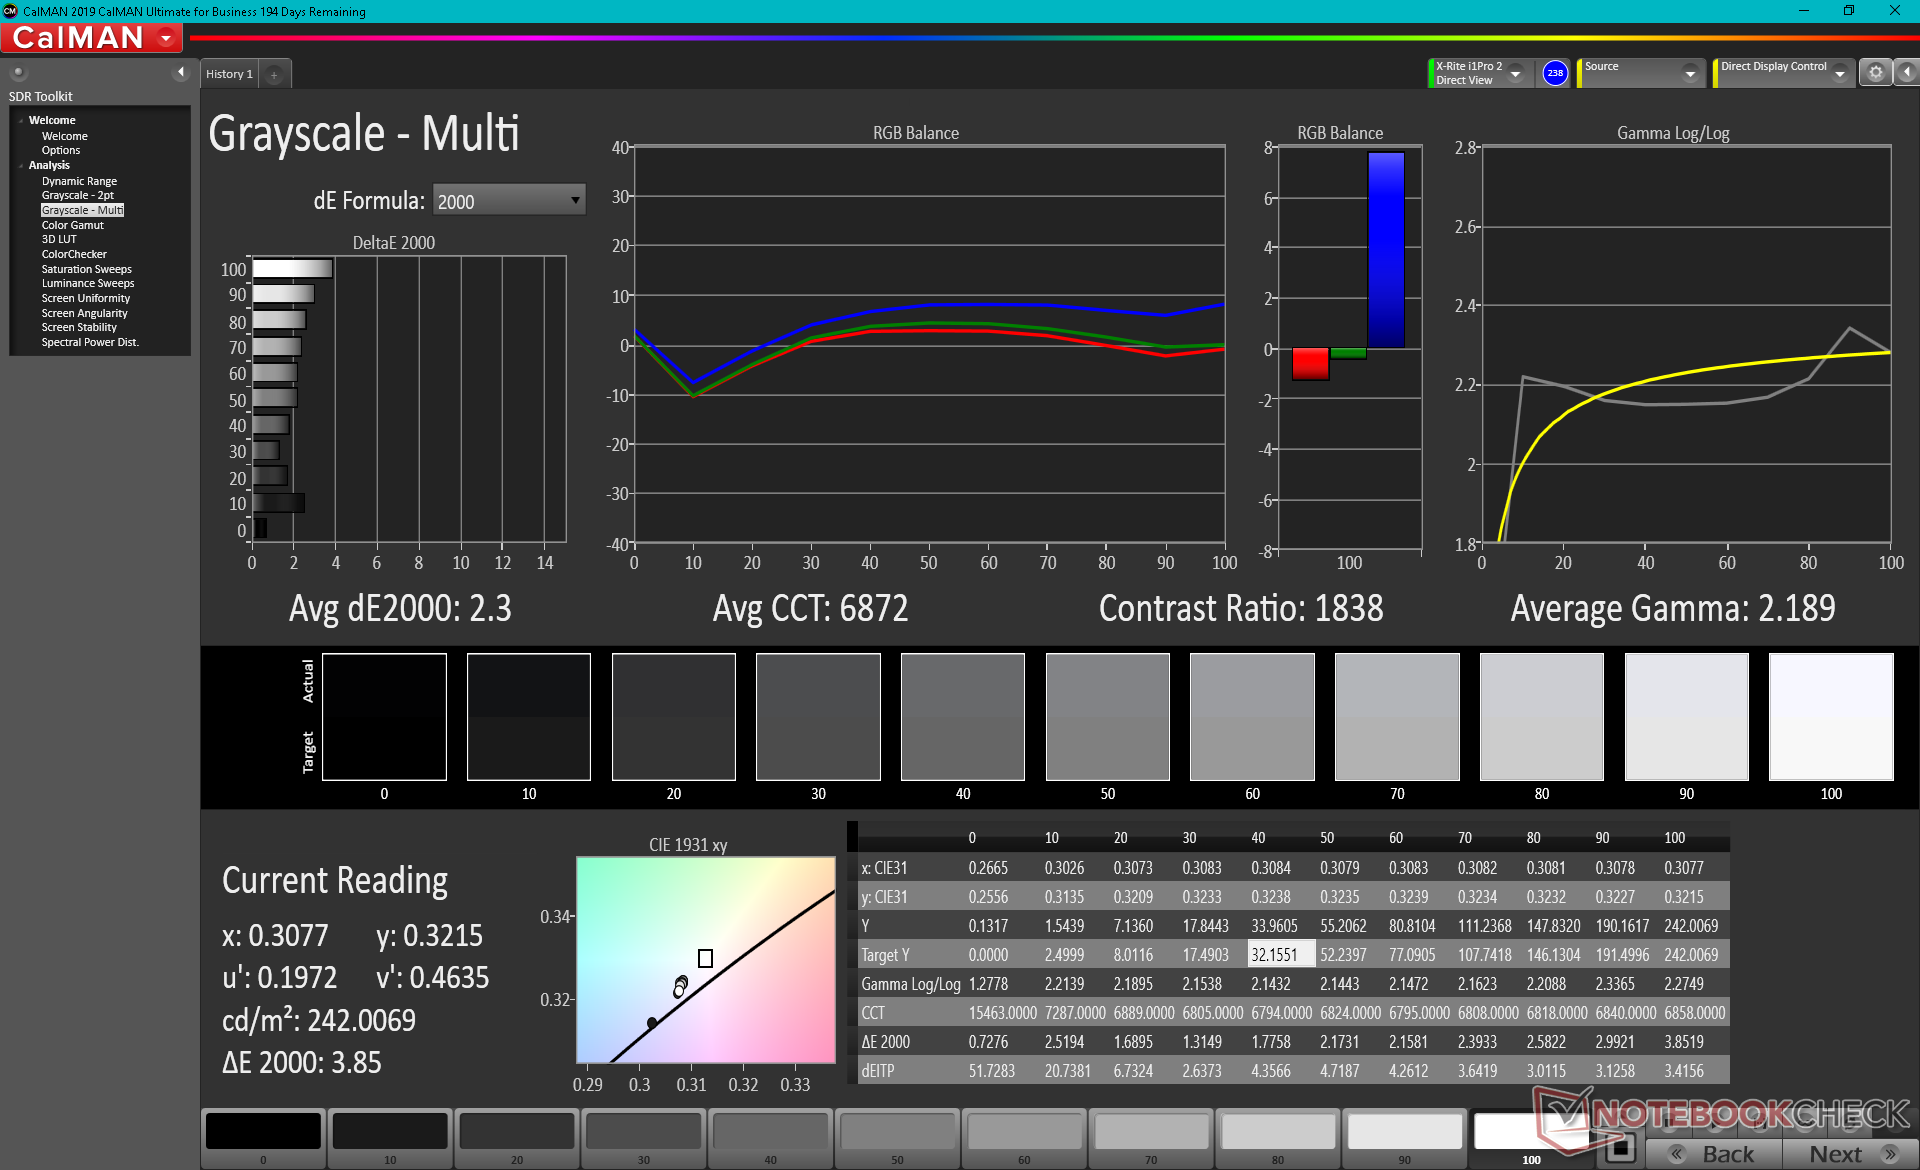
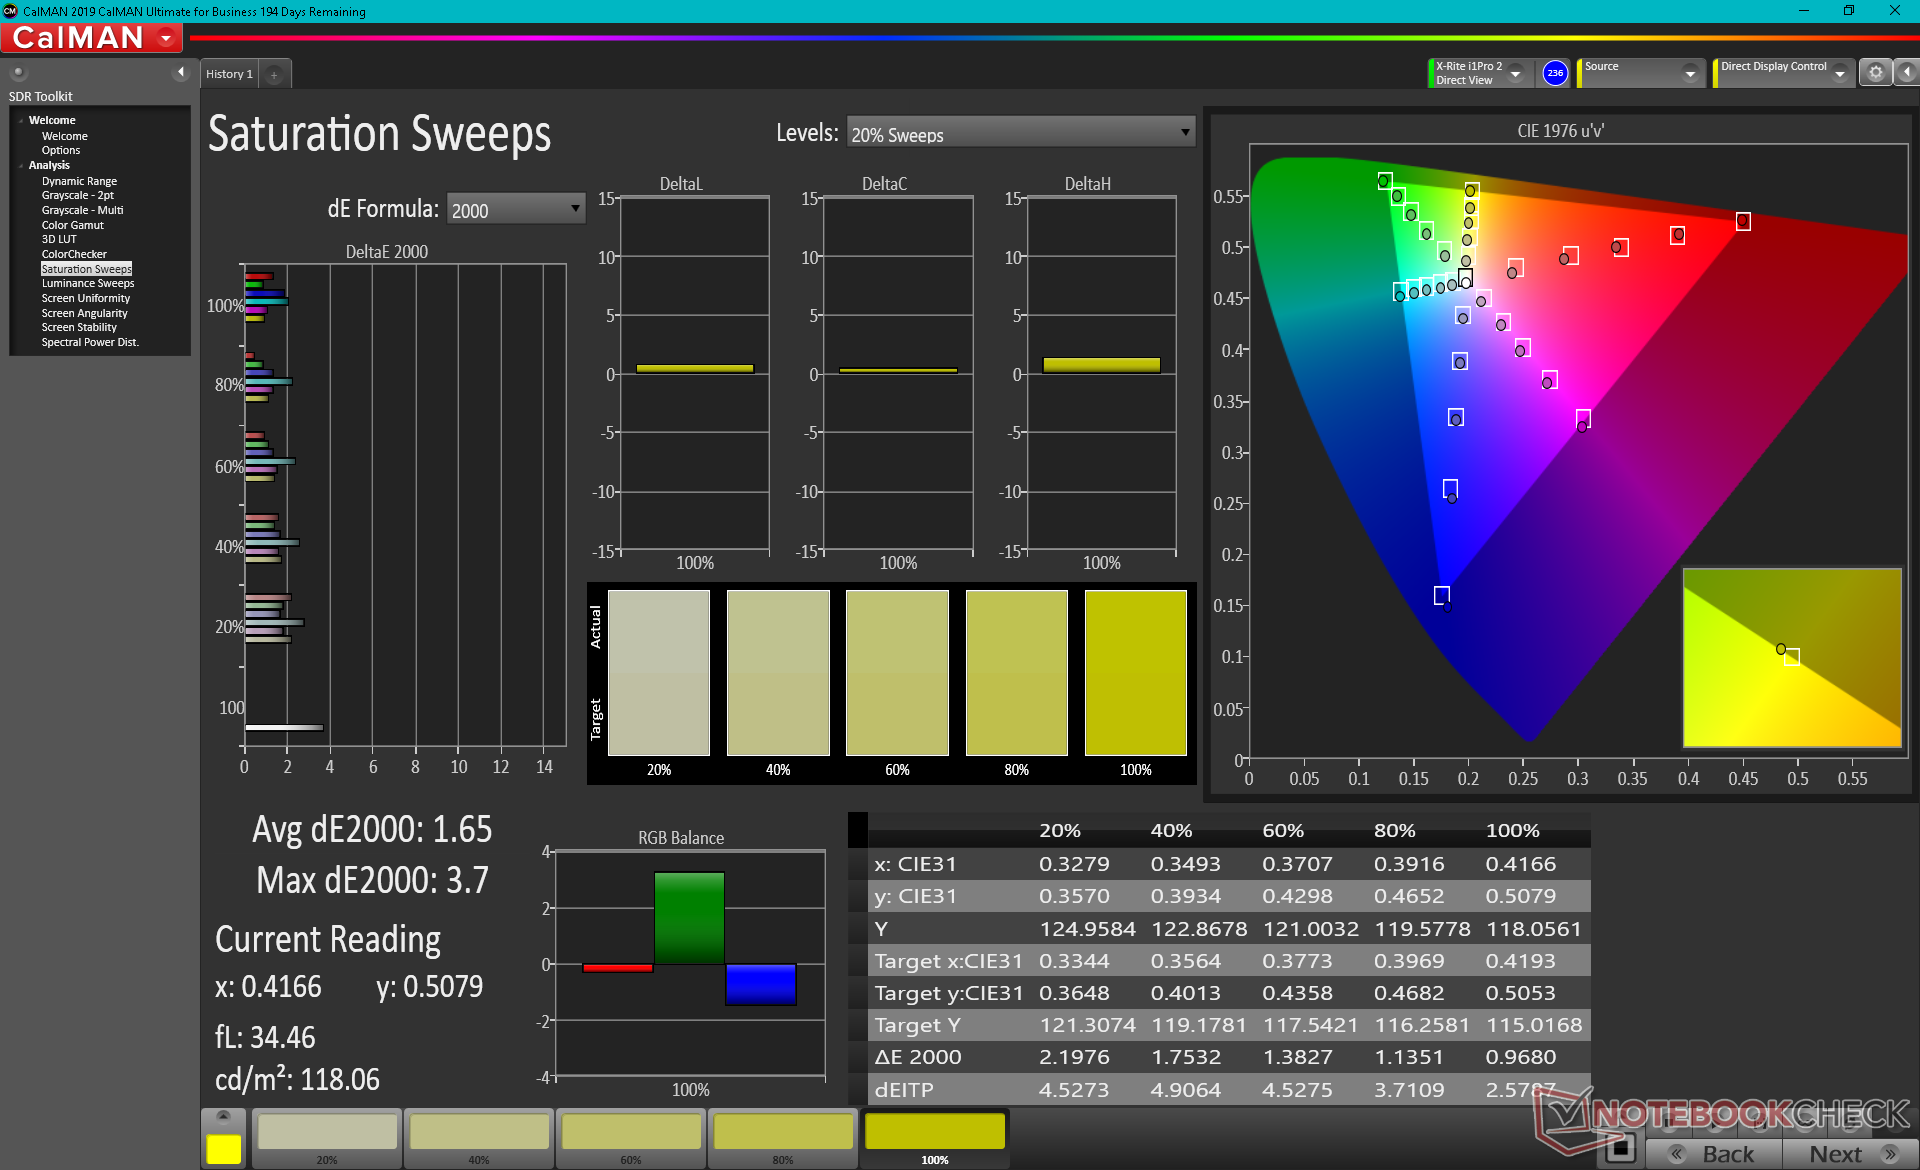
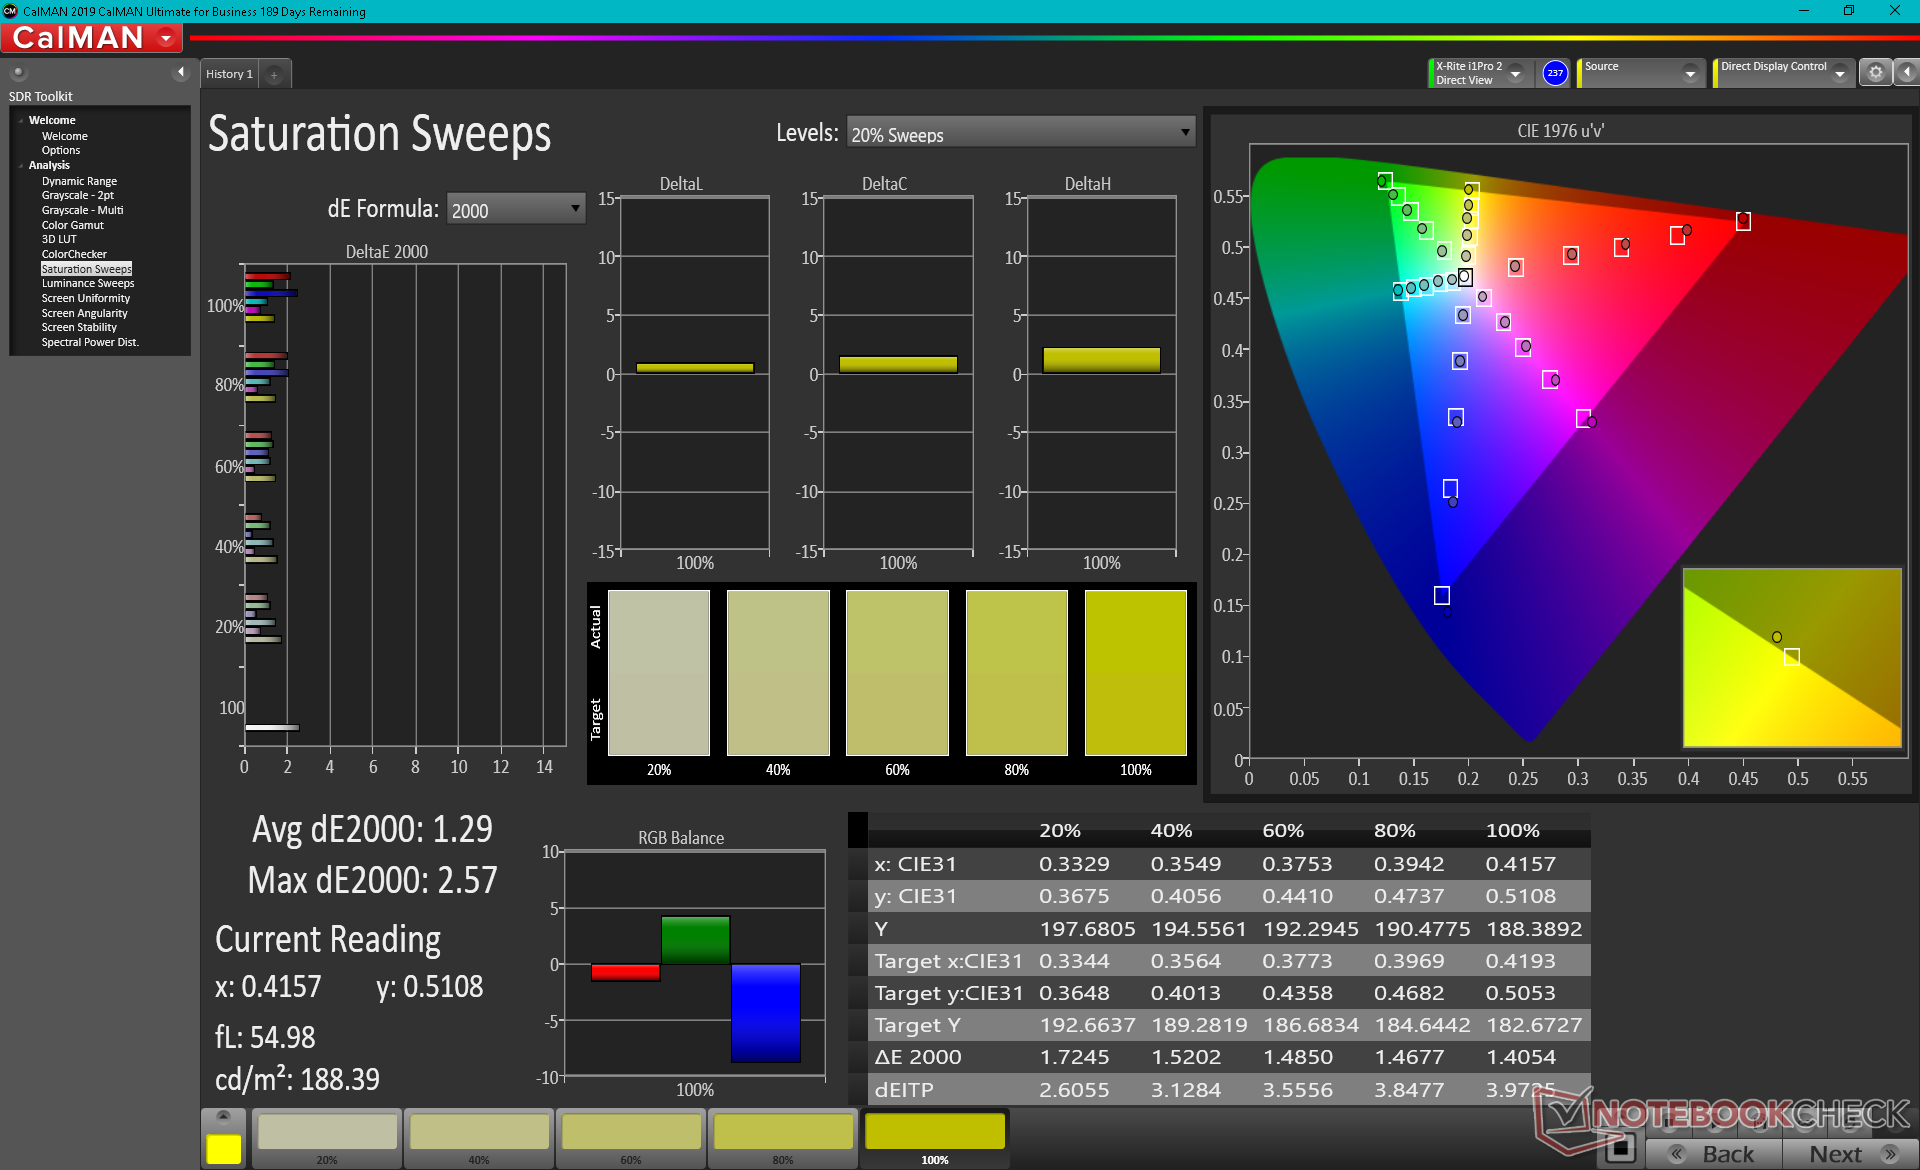
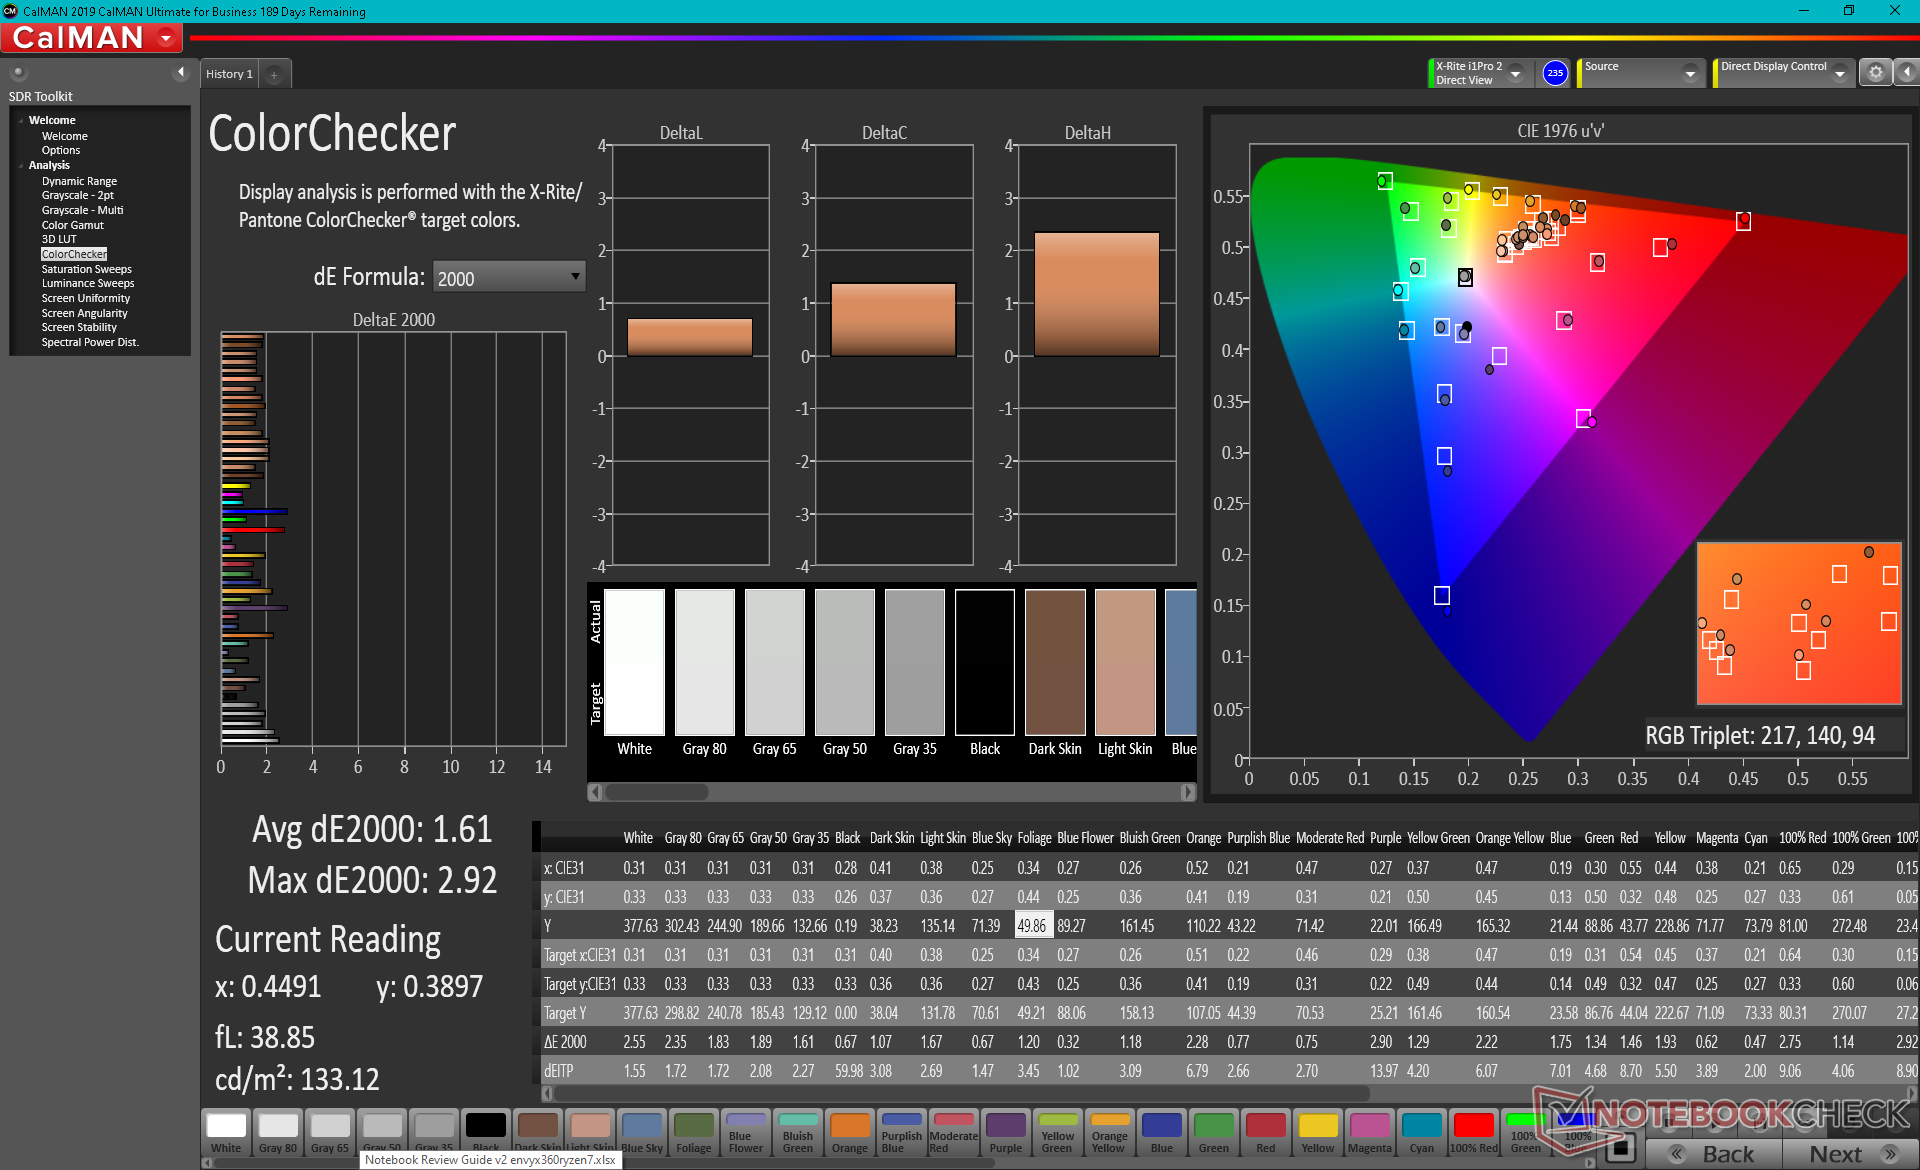
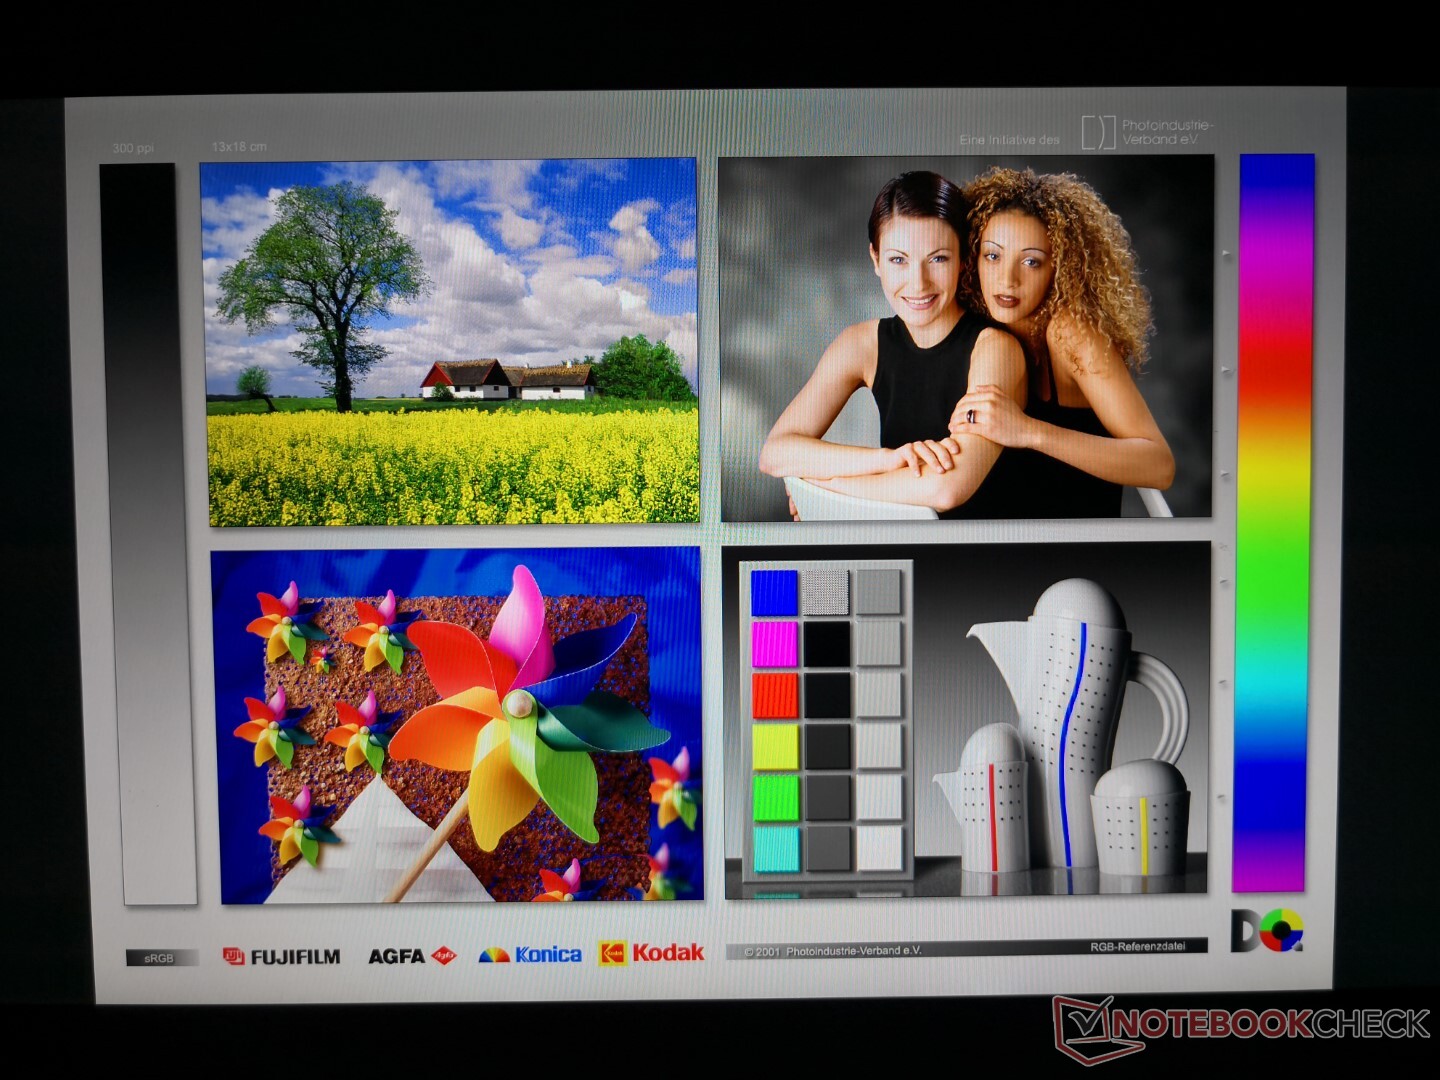
Display - Surprisingly Well Calibrated
HP has dropped the BOE panel on last year's model for an AU Optronics panel and the results are significantly better in terms of color coverage and accuracy as shown by the table below. It doesn't even take a colorimeter to notice the more vibrant colors between the two models. Black-white and gray-gray response times, however, have taken a hit to be almost two times slower than before. Ghosting is therefore more noticeable on the 2021 model than on the 2020 model which appears to be the price to pay for the improved colors.

| |||||||||||||||||||||||||
Brightness Distribution: 87 %
Center on Battery: 337.2 cd/m²
Contrast: 1405:1 (Black: 0.24 cd/m²)
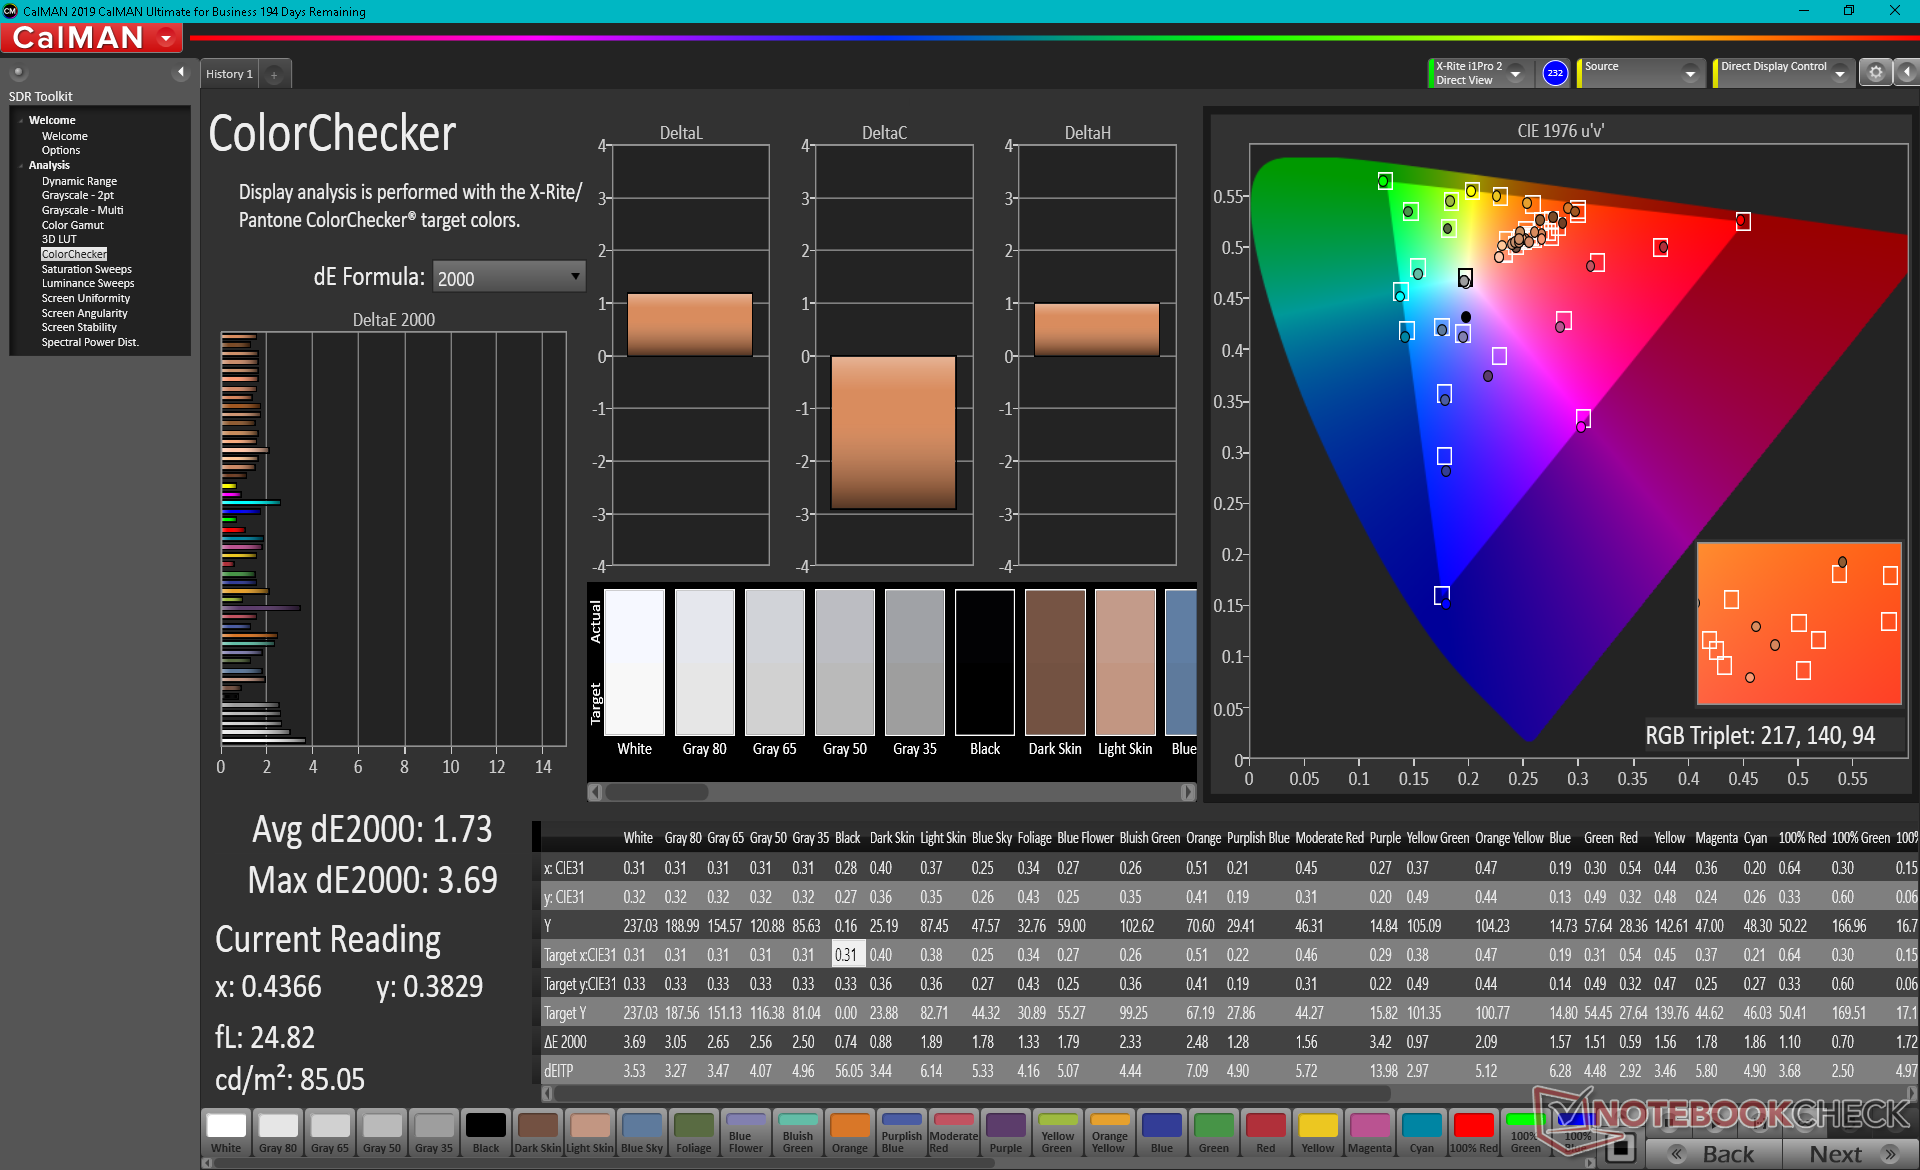
ΔE ColorChecker Calman: 1.73 | ∀{0.5-29.43 Ø4.78}
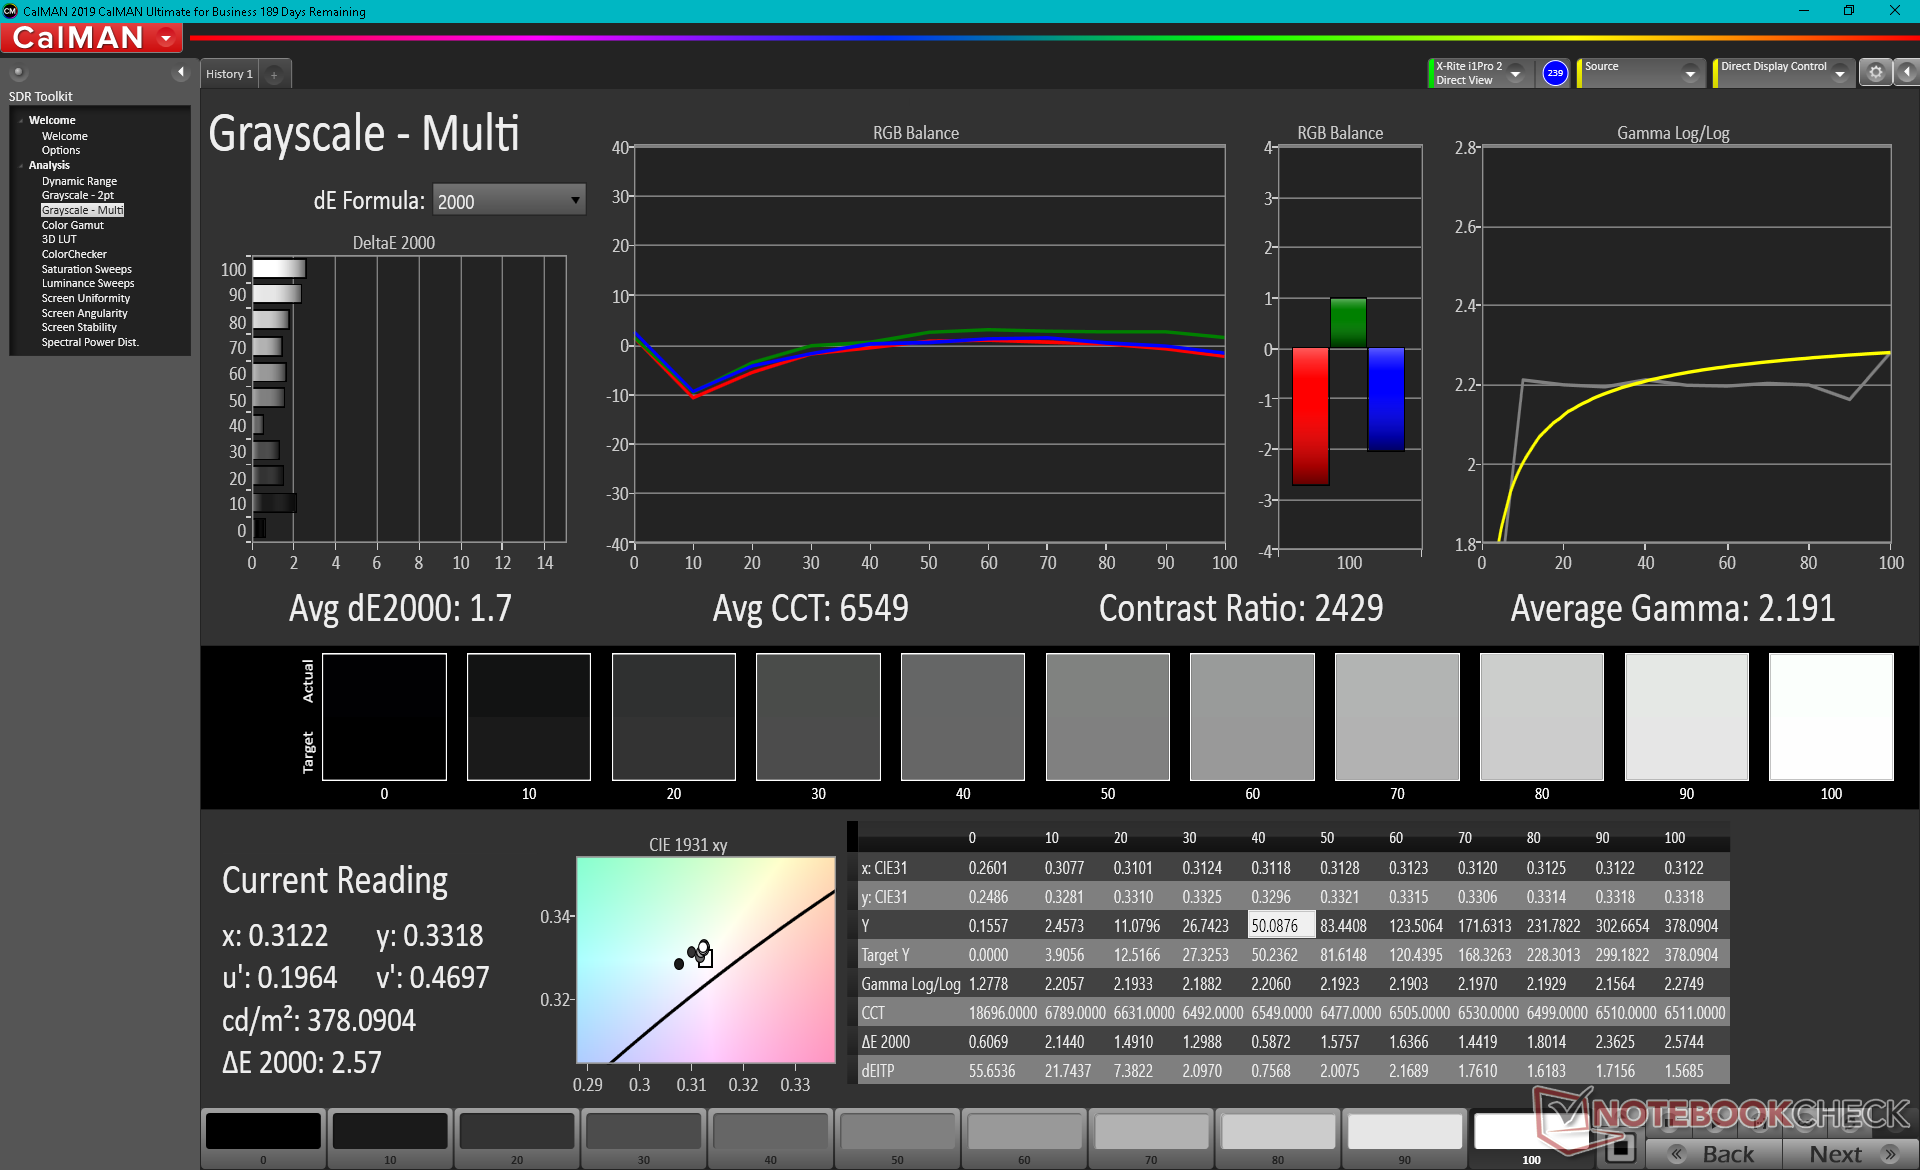
calibrated: 1.61
ΔE Greyscale Calman: 2.3 | ∀{0.09-98 Ø5}
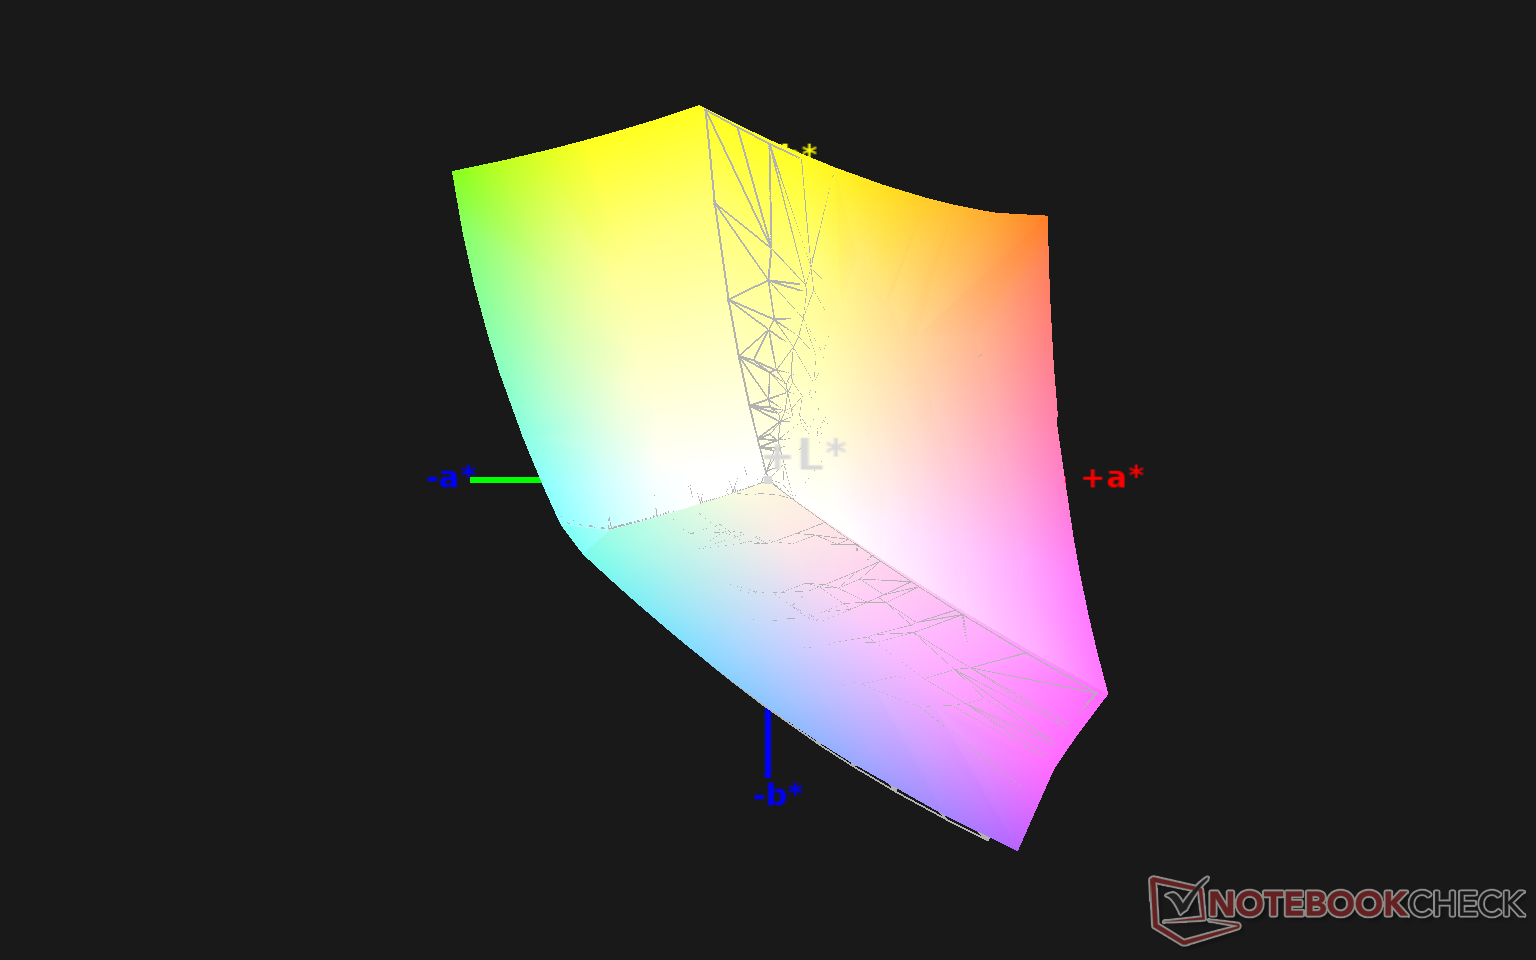
99.6% sRGB (Argyll 1.6.3 3D)
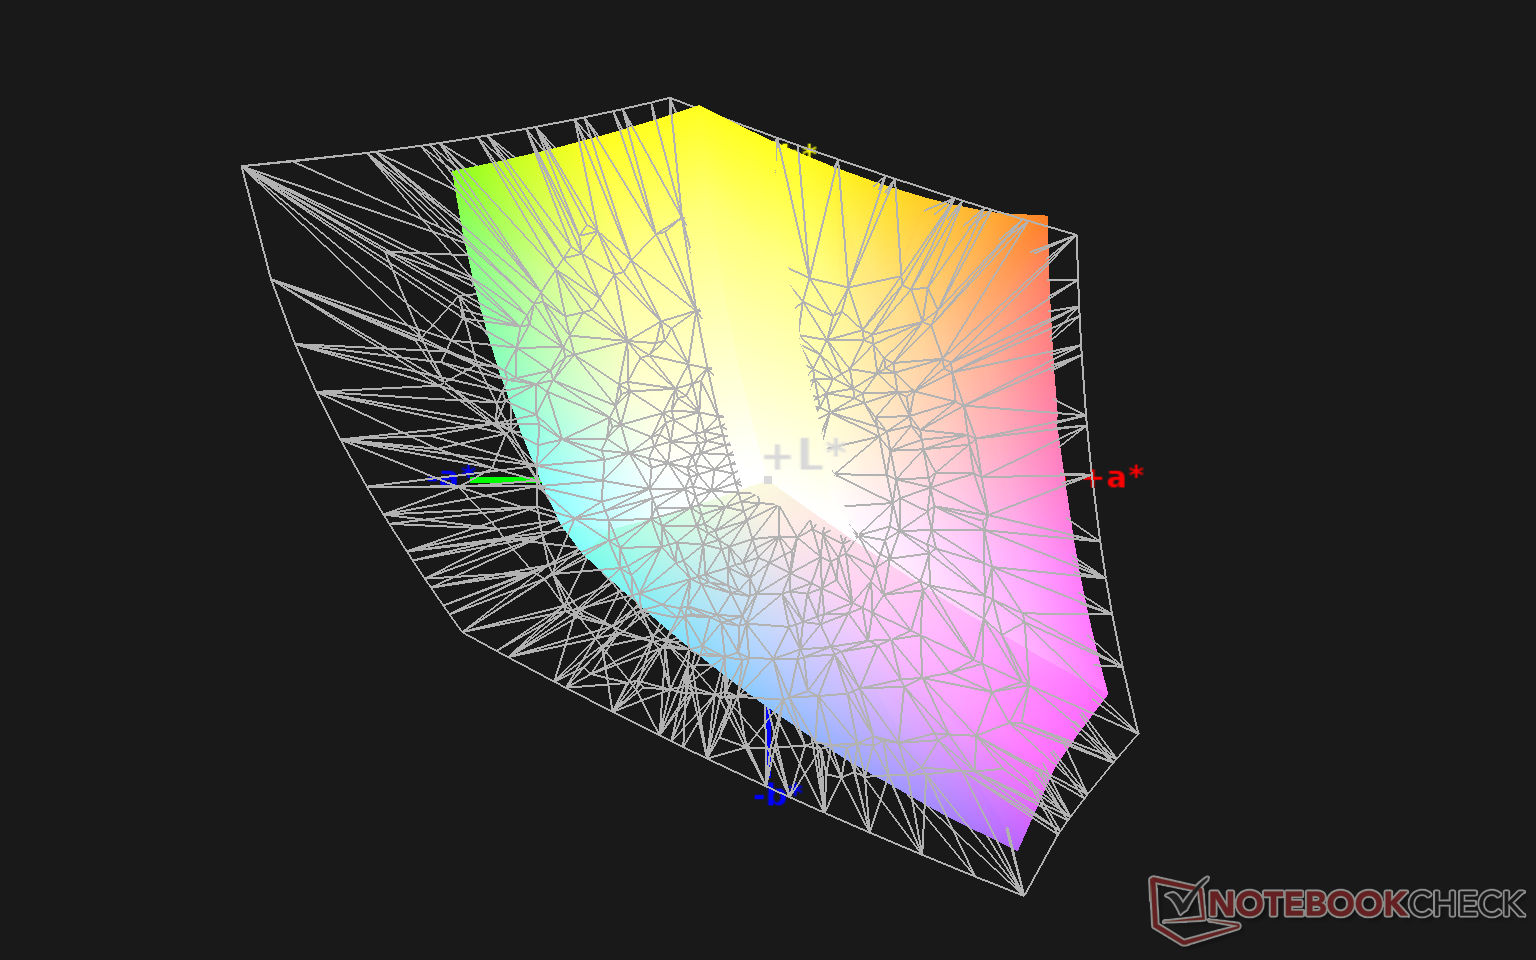
64.1% AdobeRGB 1998 (Argyll 1.6.3 3D)
70.1% AdobeRGB 1998 (Argyll 3D)
99.1% sRGB (Argyll 3D)
69% Display P3 (Argyll 3D)
Gamma: 2.19
CCT: 6872 K
| HP Envy x360 15-eu0097nr AUOA08B, IPS, 15.6", 1920x1080 | HP Envy x360 15-ee0257ng BOE NV156FHM-N4T, IPS, 15.6", 1920x1080 | Samsung Galaxy Book Flex 15-NP950 BOE HF NE156FHM-N51, IPS, QLED, 15.6", 1920x1080 | Asus ZenBook Flip 15 UX563FD-A1027T BOE HF NE156QUM-N64, IPS, 15.6", 3840x2160 | Lenovo Yoga C740-15IML B156HAN02.5, IPS LED, 15.6", 1920x1080 | HP Spectre X360 15-5ZV31AV AU Optronics AUO30EB, IPS, 15.6", 3840x2160 | |
|---|---|---|---|---|---|---|
| Display | -40% | 23% | -3% | -42% | -3% | |
| Display P3 Coverage (%) | 69 | 40.43 -41% | 99 43% | 66.2 -4% | 39.04 -43% | 68.3 -1% |
| sRGB Coverage (%) | 99.1 | 59.6 -40% | 99.9 1% | 97.2 -2% | 57.9 -42% | 94.3 -5% |
| AdobeRGB 1998 Coverage (%) | 70.1 | 41.77 -40% | 86.9 24% | 68.3 -3% | 40.33 -42% | 68.4 -2% |
| Response Times | 47% | 17% | 8% | 19% | 3% | |
| Response Time Grey 50% / Grey 80% * (ms) | 60.4 ? | 34 ? 44% | 53 ? 12% | 60 ? 1% | 50.8 ? 16% | 56.8 ? 6% |
| Response Time Black / White * (ms) | 40.8 ? | 21 ? 49% | 32 ? 22% | 35 ? 14% | 32.4 ? 21% | 40.8 ? -0% |
| PWM Frequency (Hz) | ||||||
| Screen | -103% | -34% | -2% | -121% | -31% | |
| Brightness middle (cd/m²) | 337.2 | 314 -7% | 436 29% | 351 4% | 286 -15% | 284.6 -16% |
| Brightness (cd/m²) | 337 | 280 -17% | 406 20% | 335 -1% | 268 -20% | 285 -15% |
| Brightness Distribution (%) | 87 | 72 -17% | 88 1% | 87 0% | 83 -5% | 85 -2% |
| Black Level * (cd/m²) | 0.24 | 0.275 -15% | 0.34 -42% | 0.31 -29% | 0.2 17% | 0.25 -4% |
| Contrast (:1) | 1405 | 1142 -19% | 1282 -9% | 1132 -19% | 1430 2% | 1138 -19% |
| Colorchecker dE 2000 * | 1.73 | 5.94 -243% | 3.53 -104% | 1.74 -1% | 7.3 -322% | 3.52 -103% |
| Colorchecker dE 2000 max. * | 3.69 | 21.71 -488% | 8.43 -128% | 2.76 25% | 21.7 -488% | 5.56 -51% |
| Colorchecker dE 2000 calibrated * | 1.61 | 5.15 -220% | 5.1 -217% | 3 -86% | ||
| Greyscale dE 2000 * | 2.3 | 2.97 -29% | 5.34 -132% | 2.22 3% | 7 -204% | 3.2 -39% |
| Gamma | 2.19 100% | 2.4 92% | 2.4 92% | 2.35 94% | 2.35 94% | 2.28 96% |
| CCT | 6872 95% | 6581 99% | 7409 88% | 6667 97% | 5847 111% | 7070 92% |
| Color Space (Percent of AdobeRGB 1998) (%) | 64.1 | 38.1 -41% | 78 22% | 62 -3% | 36.9 -42% | 61.1 -5% |
| Color Space (Percent of sRGB) (%) | 99.6 | 59.1 -41% | 100 0% | 97 -3% | 57.5 -42% | 93.8 -6% |
| Total Average (Program / Settings) | -32% /
-73% | 2% /
-16% | 1% /
-1% | -48% /
-89% | -10% /
-22% |
* ... smaller is better
HP advertises full sRGB coverage which we can confirm with our own independent measurements. The deeper colors are a noticeable improvement over the cheap panel on last year's Envy x360 15 which covered only 59 percent of sRGB.
The display is already very accurate out of the box with average grayscale and color deltaE values of just 2.3 and 1.73, respectively. We attempted to calibrate the panel ourselves even further which resulted in even better average deltaE values of just 1.7 and 1.61. Graphics editors will definitely appreciate the color accurate display on what is considered to be a mid-range laptop series.
Display Response Times
| ↔ Response Time Black to White | ||
|---|---|---|
| 40.8 ms ... rise ↗ and fall ↘ combined | ↗ 24.4 ms rise | 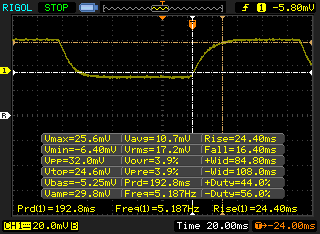 |
| ↘ 16.4 ms fall | ||
| The screen shows slow response rates in our tests and will be unsatisfactory for gamers. In comparison, all tested devices range from 0.1 (minimum) to 240 (maximum) ms. » 98 % of all devices are better. This means that the measured response time is worse than the average of all tested devices (20.2 ms). | ||
| ↔ Response Time 50% Grey to 80% Grey | ||
| 60.4 ms ... rise ↗ and fall ↘ combined | ↗ 28.8 ms rise | 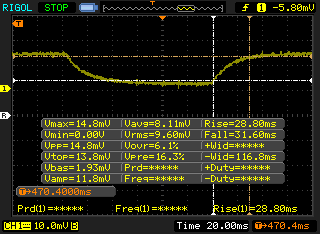 |
| ↘ 31.6 ms fall | ||
| The screen shows slow response rates in our tests and will be unsatisfactory for gamers. In comparison, all tested devices range from 0.165 (minimum) to 636 (maximum) ms. » 96 % of all devices are better. This means that the measured response time is worse than the average of all tested devices (31.6 ms). | ||
Screen Flickering / PWM (Pulse-Width Modulation)
| Screen flickering / PWM not detected |  | ||
In comparison: 53 % of all tested devices do not use PWM to dim the display. If PWM was detected, an average of 8111 (minimum: 5 - maximum: 343500) Hz was measured. | |||
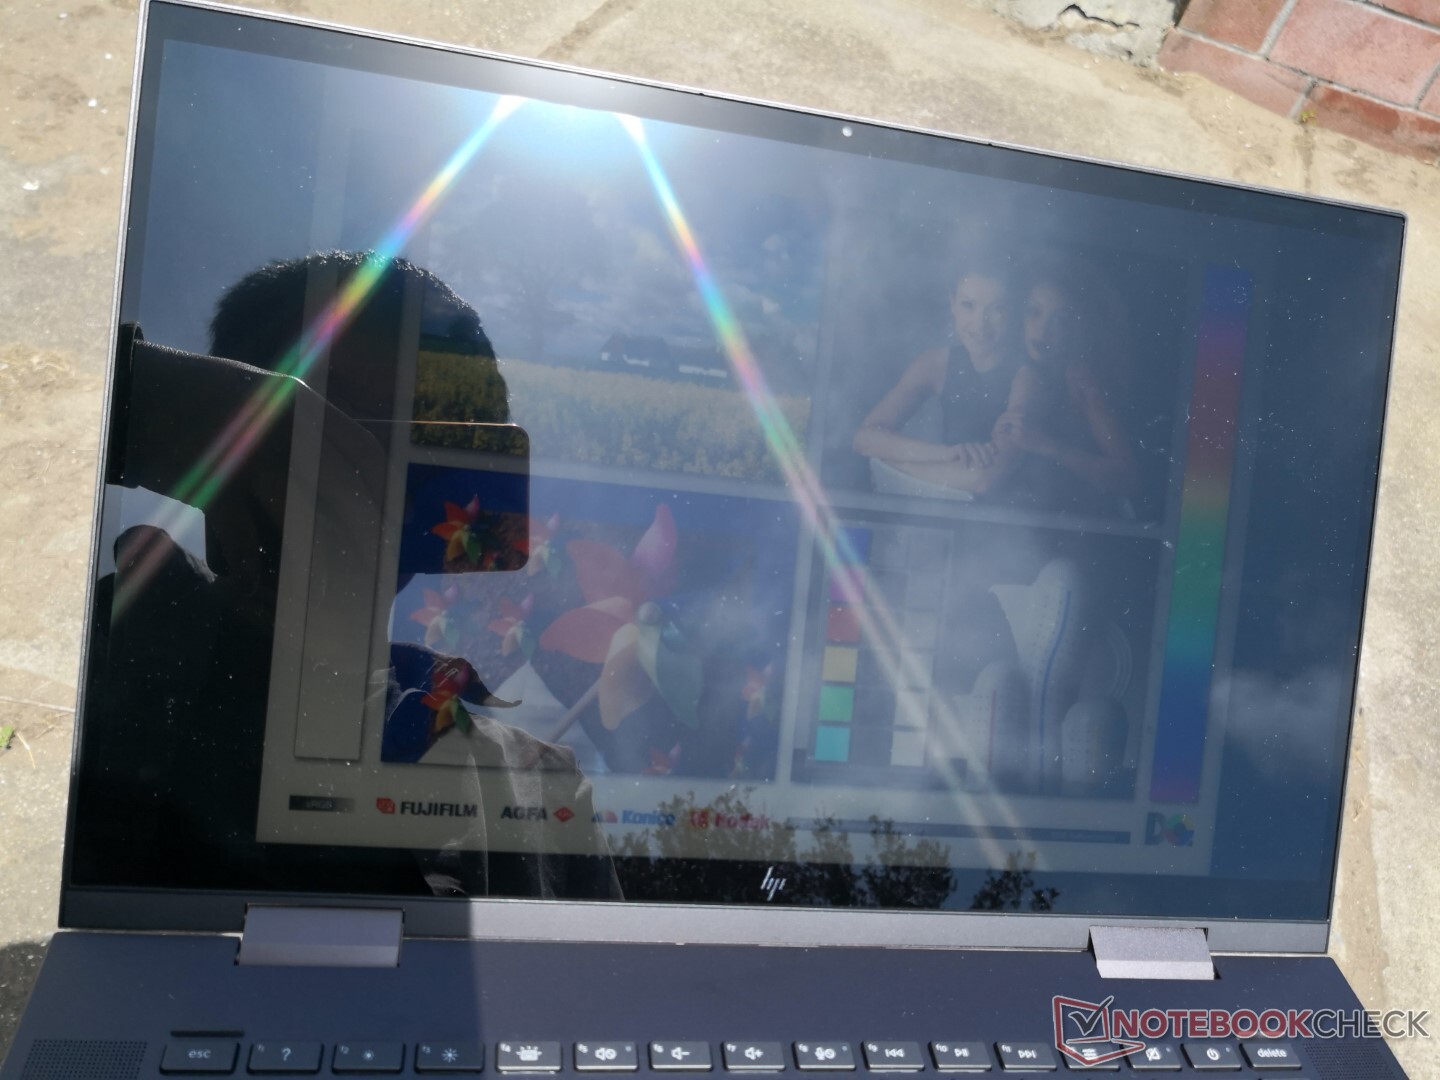
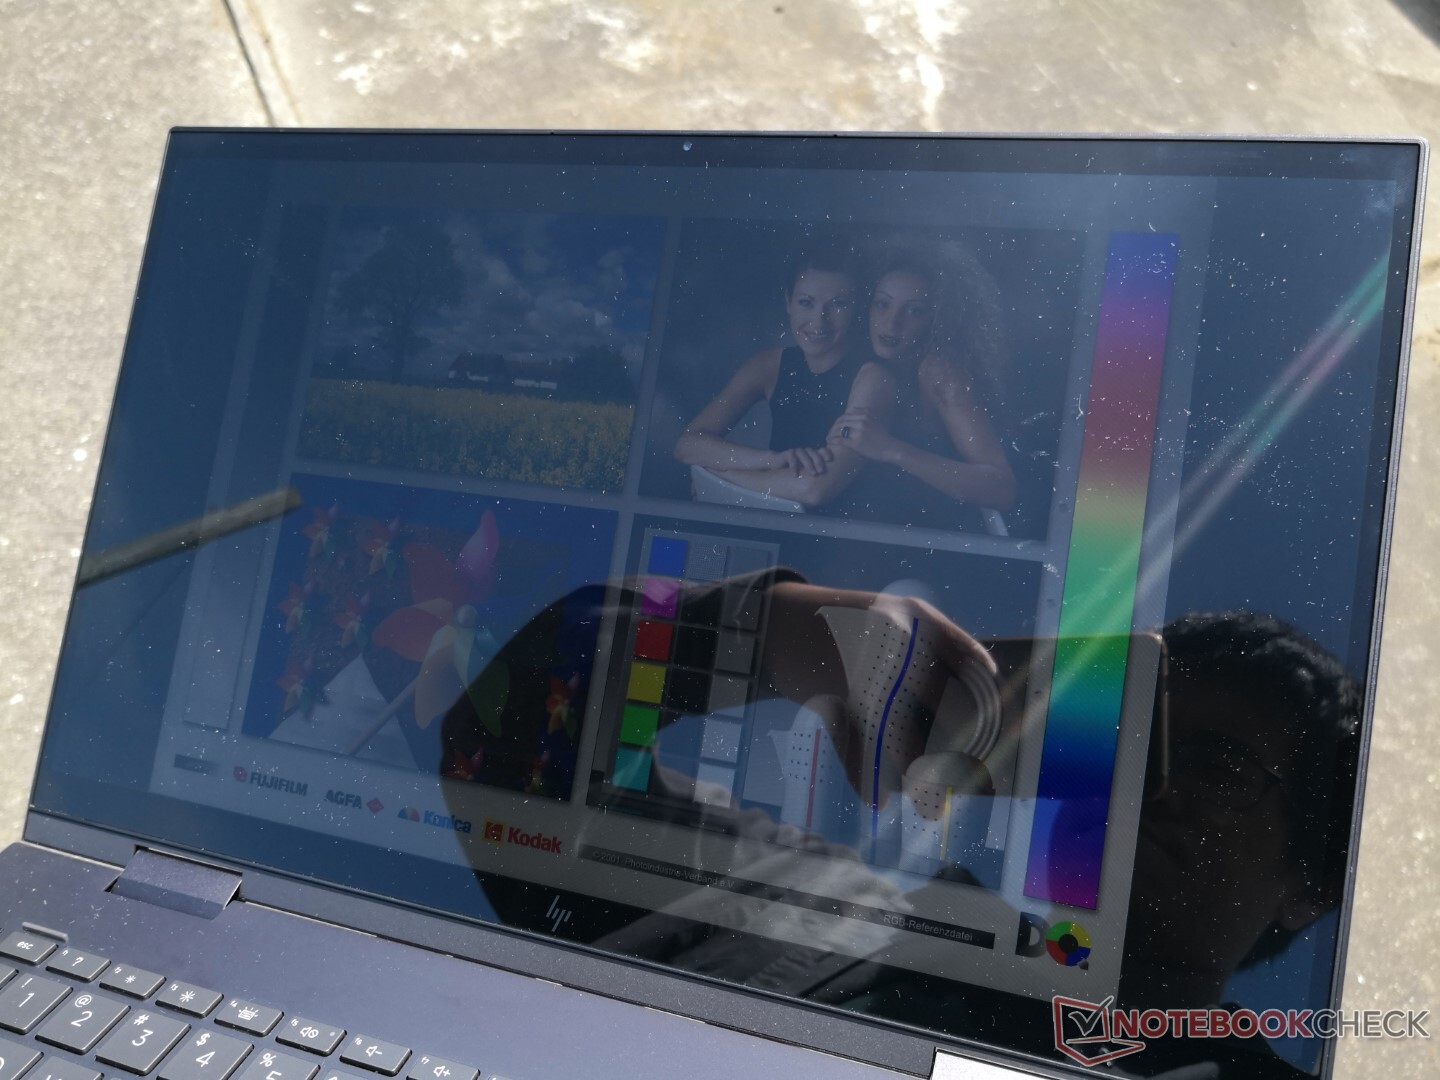
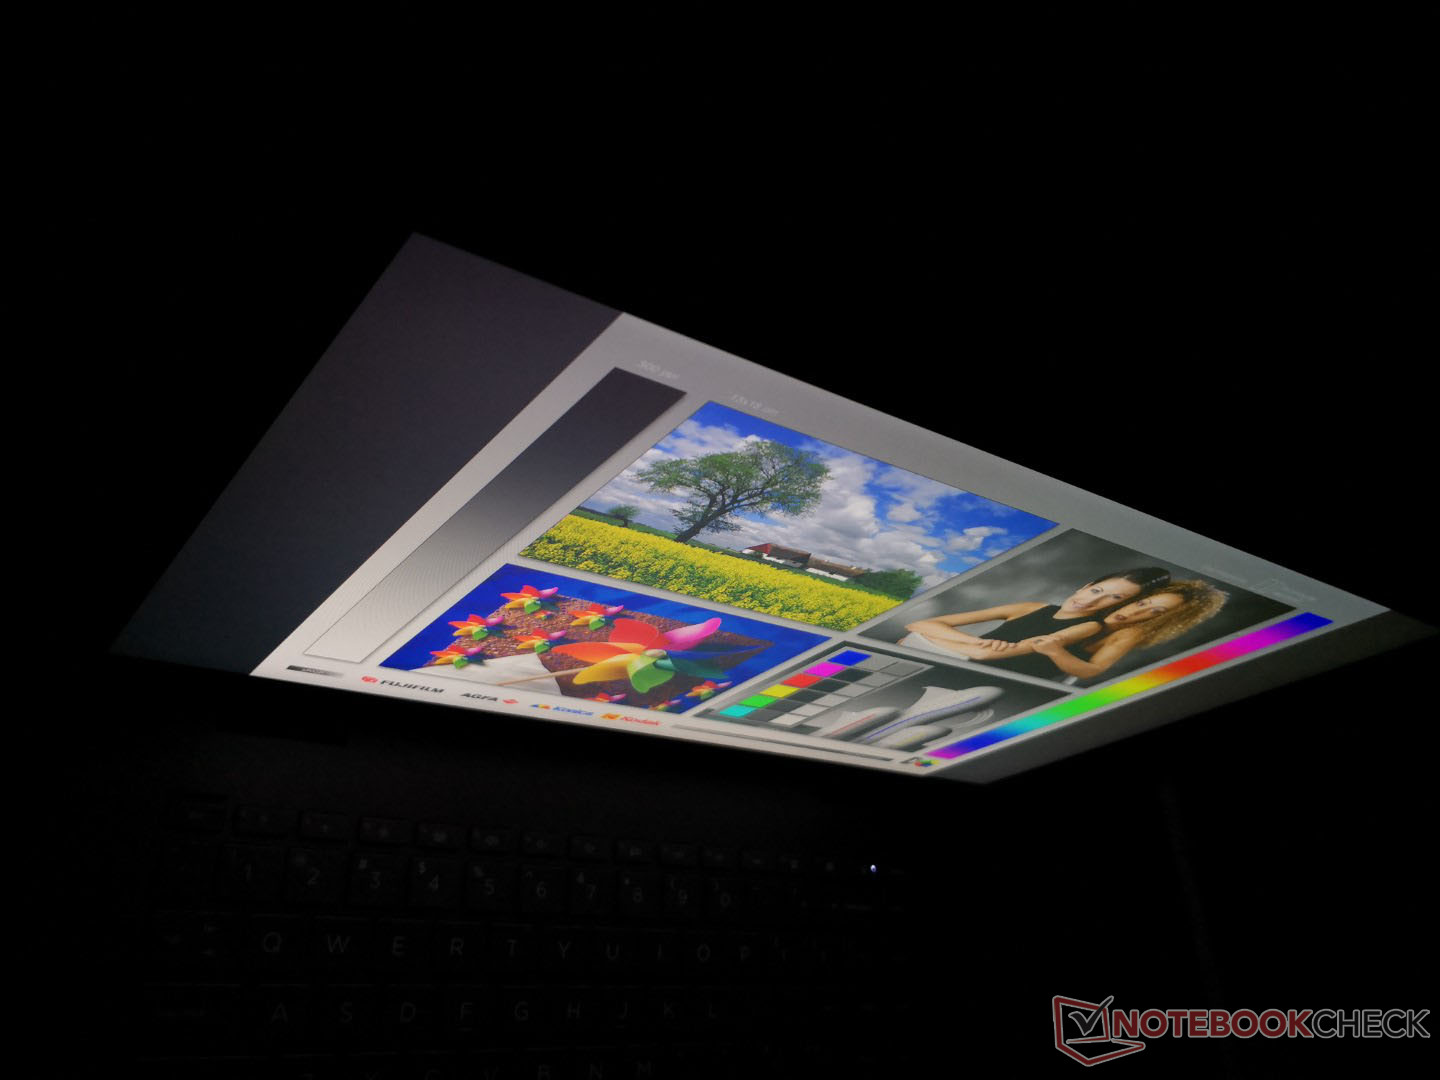
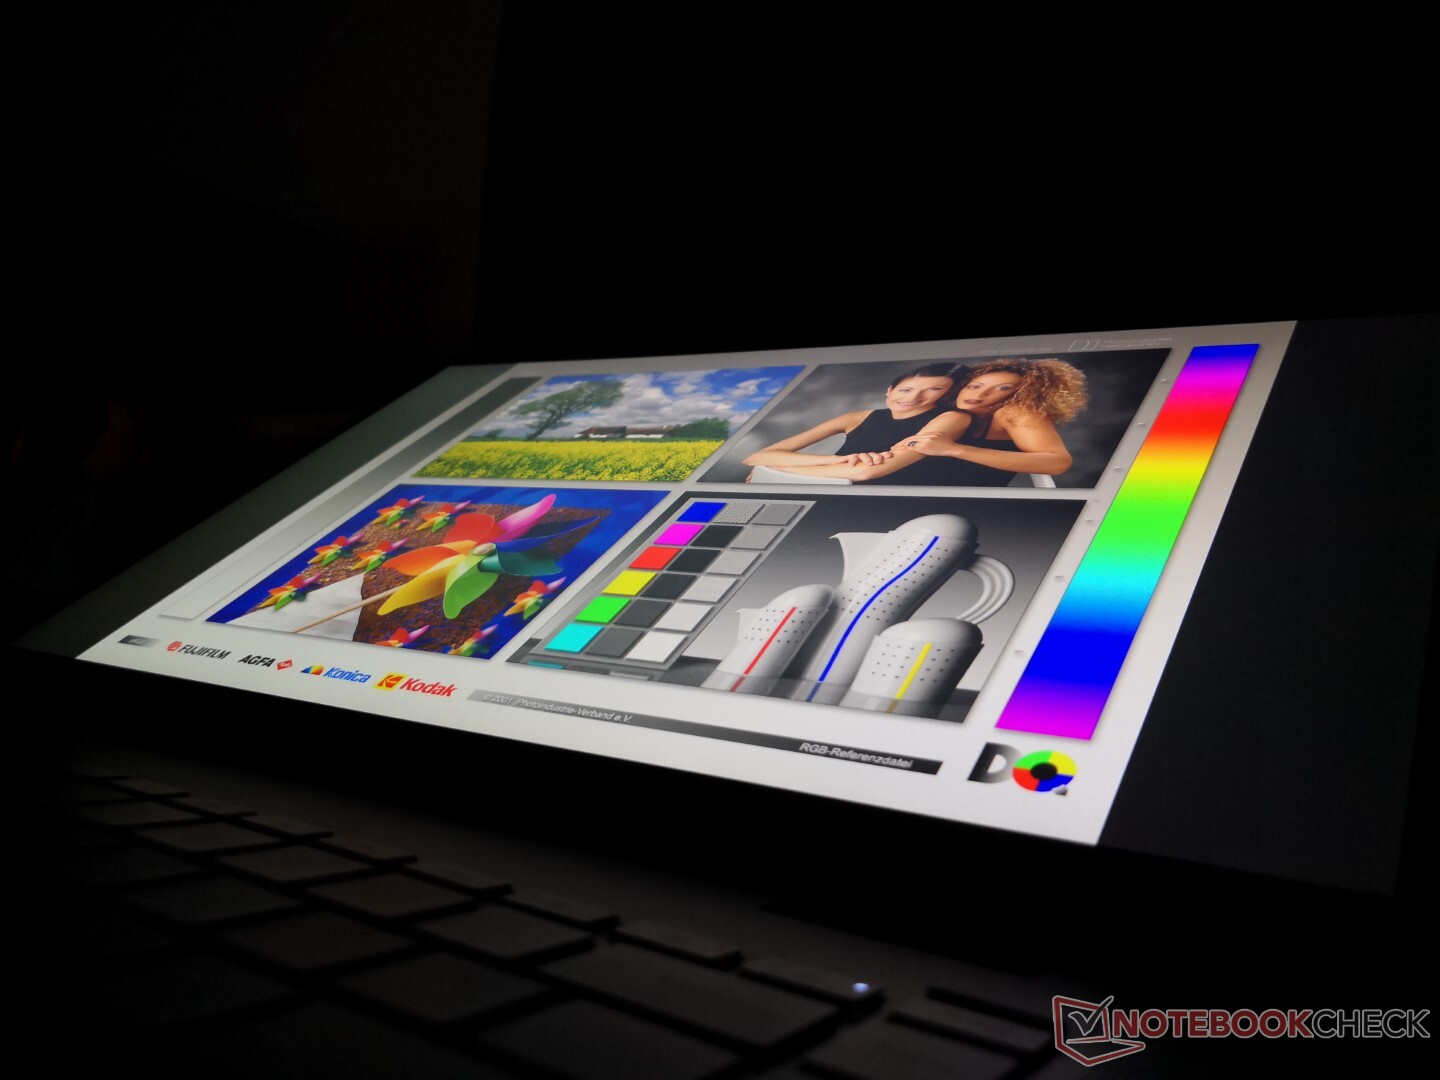
Outdoor visibility is decent when under shade and poor when under sunlight. Expect some glare no matter the ambient lighting due to the very glossy touchscreen. Users should disable AMD Vari-Bright through the Radeon software or else maximum brightness will drop significantly when on battery power.

Performance - Pushing ULV To Its Limits
Though HP formally announced SKUs with the Ryzen 5 5500U, Ryzen 7 5700U, and Ryzen 7 5800U earlier this year, only the first two appear to be available for purchase at the time of writing. There are also Tiger Lake options for those who prefer Intel and value Thunderbolt support. SKUs with discrete GeForce MX450 graphics and 4K OLED touchscreens were also promised but they have yet to be made widely available.
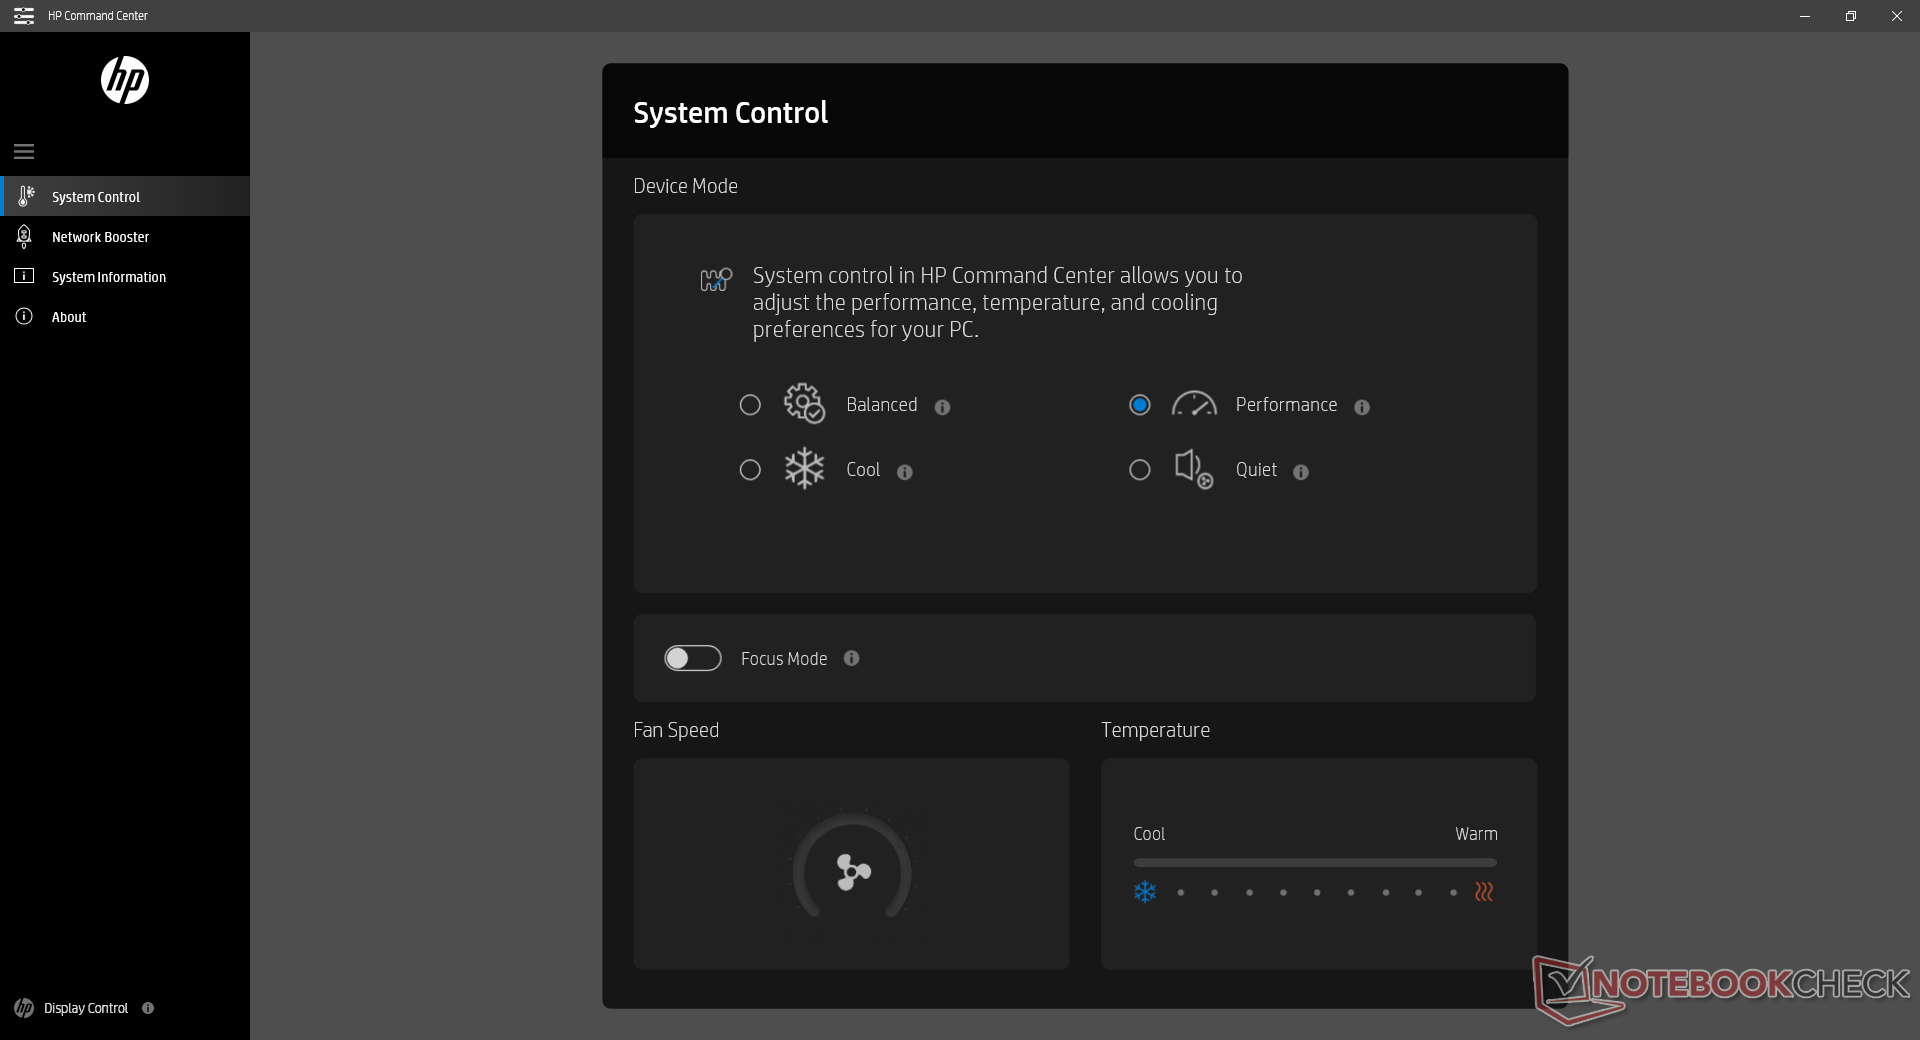
Our system was set to Performance mode via HP Command Center prior to running any performance benchmarks below for the highest possible scores. We recommend users become familiar with this software as fan noise and performance are tied to this software.
Processor
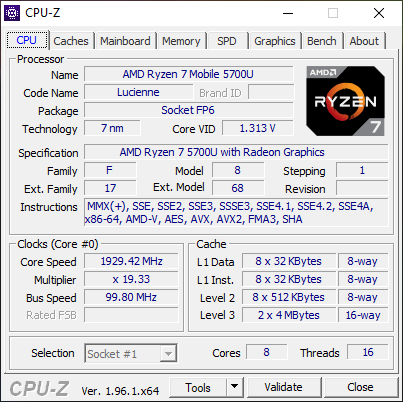
One would expect a mid-range laptop like the Envy x360 15 to come with mid-range processors, but this is not the case as the Ryzen 7 5700U is a high-end CPU with oftentimes superior performance than even the fastest Core U-powered Spectre x360 15 models. The 2020 HP Spectre X360 15 with the Core i7-10510U, for example, is roughly 60 percent and 25 percent slower in multi-threaded and single-threaded workloads, respectively, than our cheaper Envy x360 15. Even the performance sustainability of the Envy is excellent as shown by our CineBench R15 xT loop results below. Much like with the recent AMD-powered Lenovo IdeaPad Flex 14, this Envy is one of the fastest convertibles in its size class you can find.
Cinebench R23: Multi Core | Single Core
Cinebench R15: CPU Multi 64Bit | CPU Single 64Bit
Blender: v2.79 BMW27 CPU
7-Zip 18.03: 7z b 4 -mmt1 | 7z b 4
Geekbench 5.5: Single-Core | Multi-Core
HWBOT x265 Benchmark v2.2: 4k Preset
LibreOffice : 20 Documents To PDF
R Benchmark 2.5: Overall mean
| Cinebench R23 / Multi Core | |
| Lenovo Yoga Slim 7-14ARE | |
| HP Envy x360 15-eu0097nr | |
| Average AMD Ryzen 7 5700U (4861 - 10139, n=20) | |
| Asus ZenBook 13 UM325S | |
| ADATA XPG Xenia Xe | |
| Cinebench R23 / Single Core | |
| ADATA XPG Xenia Xe | |
| Asus ZenBook 13 UM325S | |
| HP Envy x360 15-eu0097nr | |
| Average AMD Ryzen 7 5700U (1177 - 1268, n=20) | |
| Lenovo Yoga Slim 7-14ARE | |
| HWBOT x265 Benchmark v2.2 / 4k Preset | |
| HP Envy x360 15-eu0097nr | |
| Lenovo Yoga Slim 7-14ARE | |
| Asus ZenBook 13 UM325S | |
| Average AMD Ryzen 7 5700U (6.08 - 12.1, n=20) | |
| Lenovo ThinkPad E15 Gen2-20T9S00K00 | |
| ADATA XPG Xenia Xe | |
| Lenovo ThinkBook 15 Gen2 ITL | |
| Lenovo IdeaPad 5 15IIL05 | |
| Samsung Galaxy Book Flex 15-NP950 | |
| HP Envy x360 15-ee0257ng | |
Cinebench R23: Multi Core | Single Core
Cinebench R15: CPU Multi 64Bit | CPU Single 64Bit
Blender: v2.79 BMW27 CPU
7-Zip 18.03: 7z b 4 -mmt1 | 7z b 4
Geekbench 5.5: Single-Core | Multi-Core
HWBOT x265 Benchmark v2.2: 4k Preset
LibreOffice : 20 Documents To PDF
R Benchmark 2.5: Overall mean
* ... smaller is better
System Performance
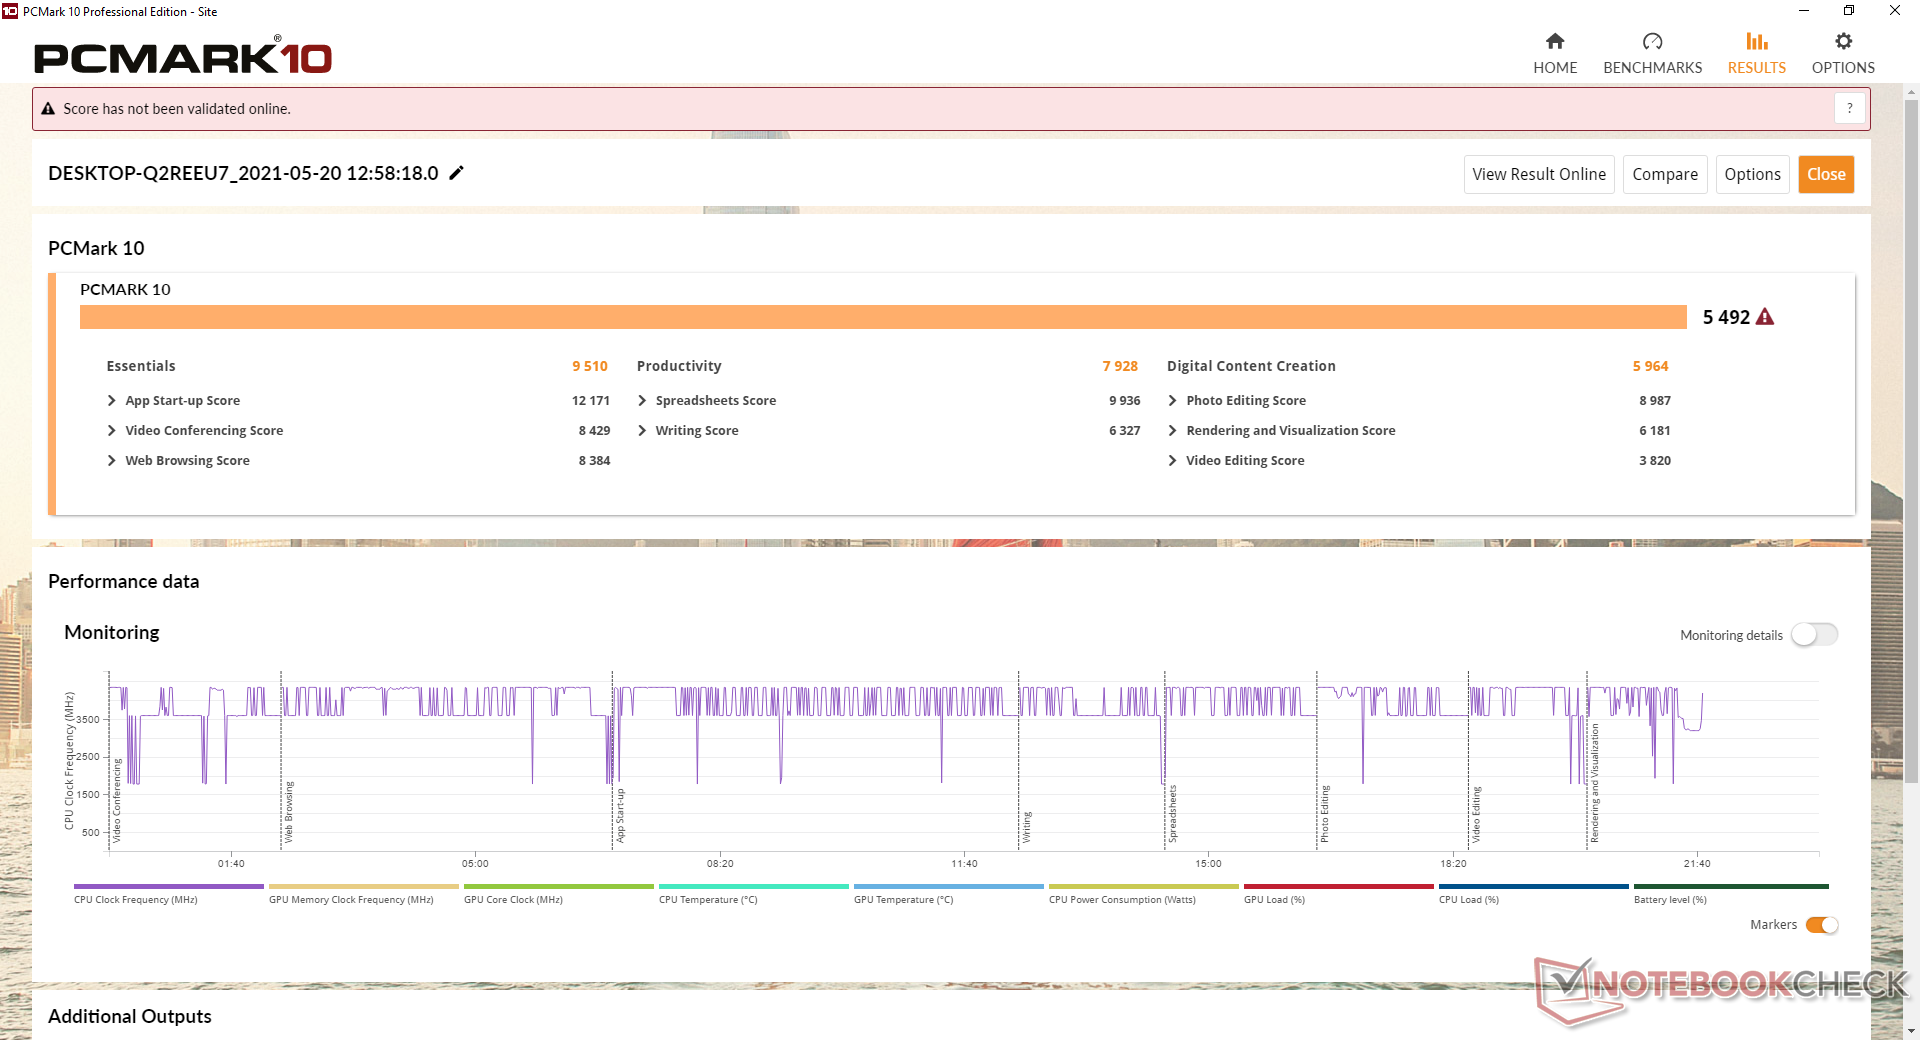
| PCMark 10 Score | 5492 points | |
Help | ||
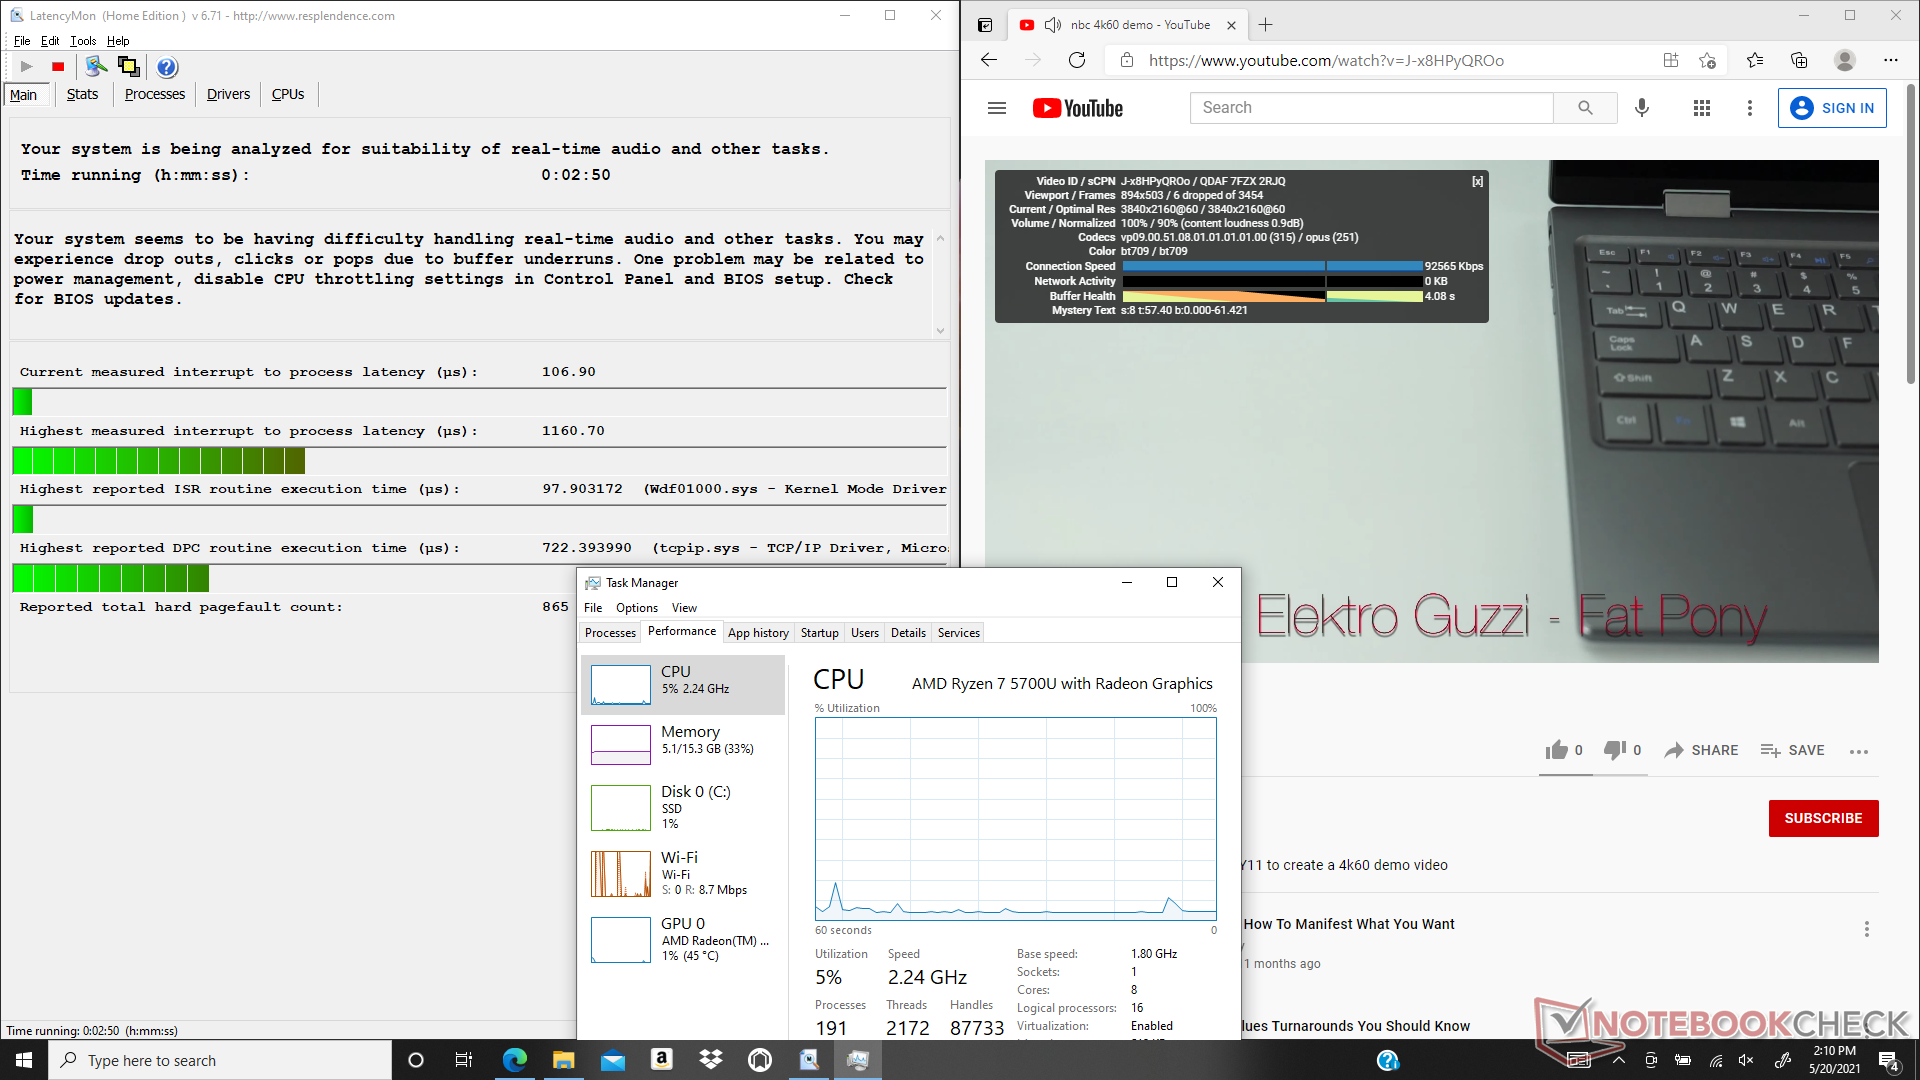
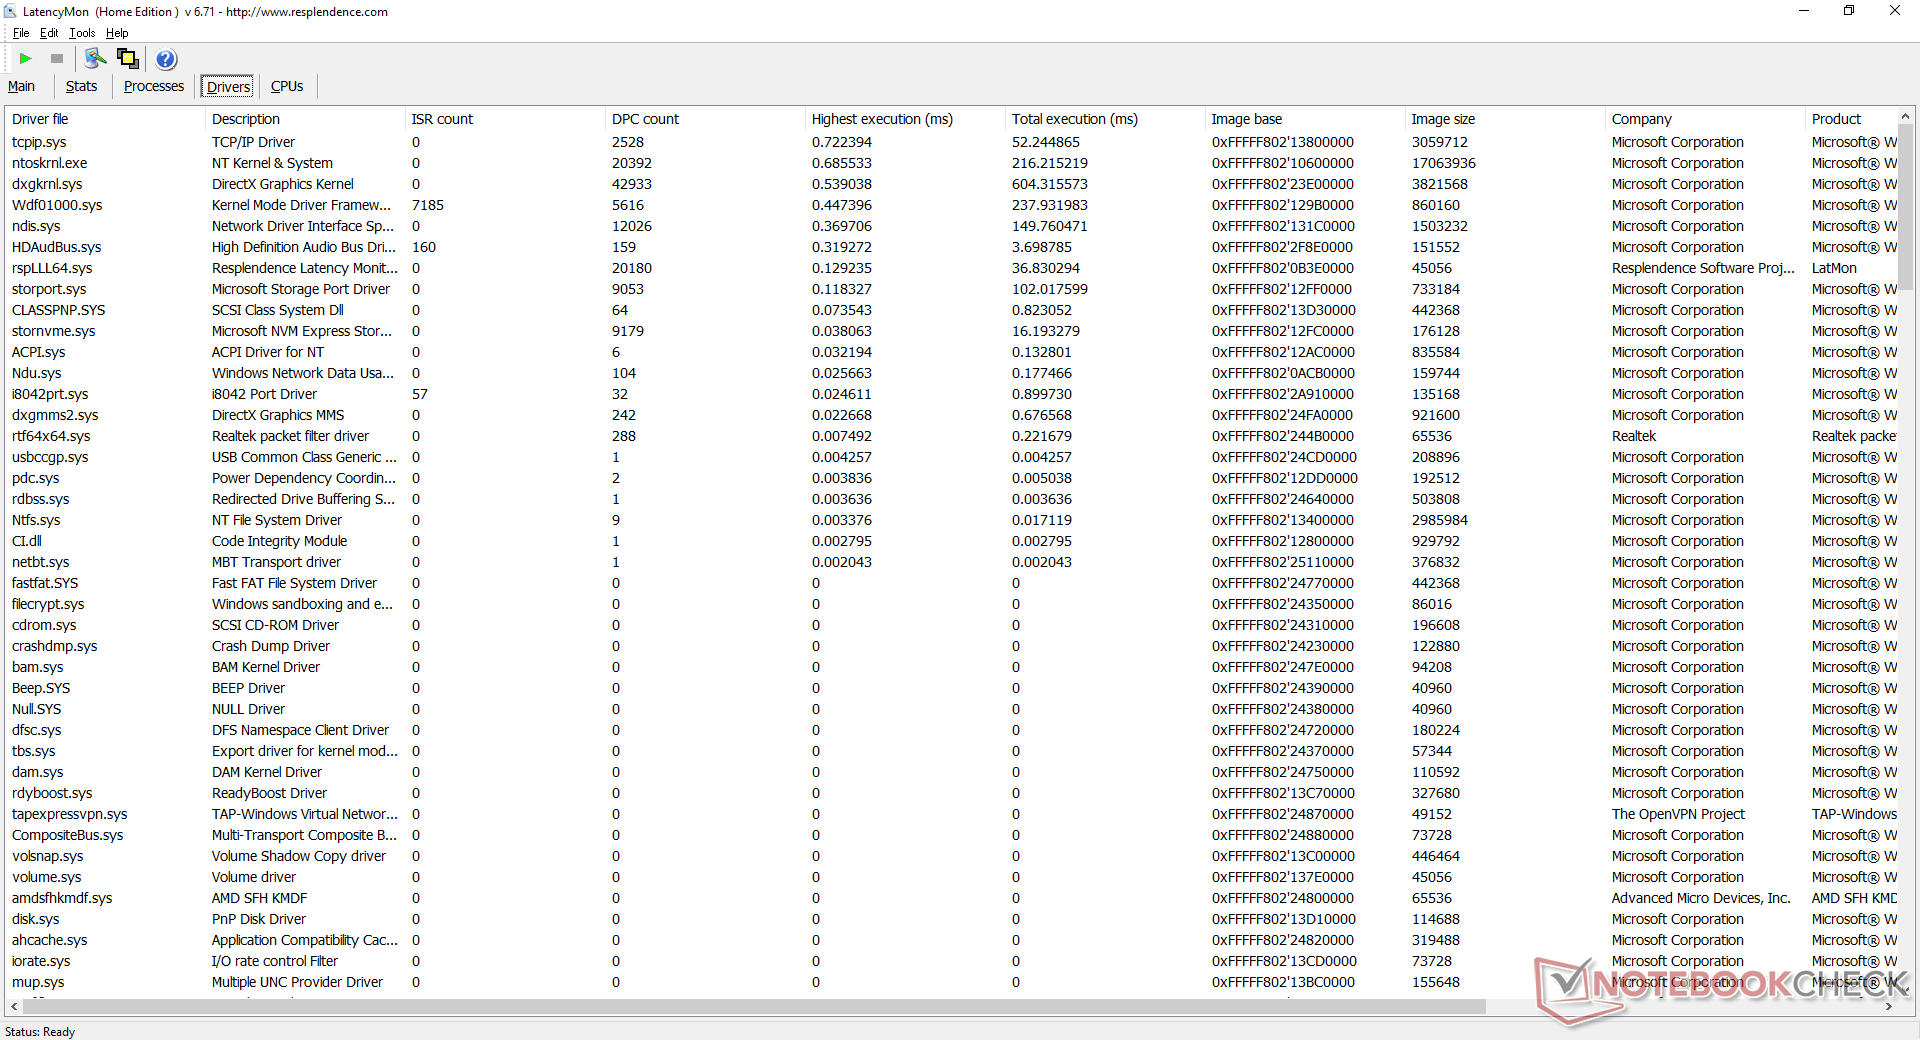
DPC Latency
LatencyMon shows minor DPC latency issues when opening multiple tabs on our homepage. 4K UHD playback at 60 FPS is smooth with just 6 dropped frames during a minute-long video test.
| DPC Latencies / LatencyMon - interrupt to process latency (max), Web, Youtube, Prime95 | |
| HP Envy x360 15-eu0097nr | |
| Samsung Galaxy Book Flex 15-NP950 | |
| HP Envy x360 15-ee0257ng | |
* ... smaller is better
Storage Devices
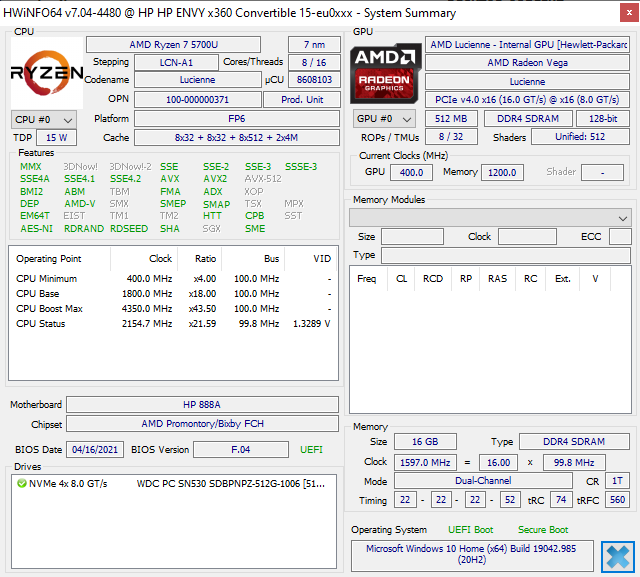
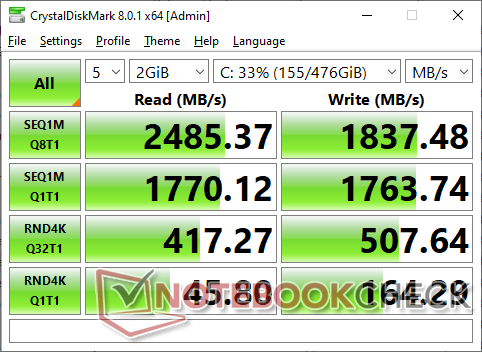
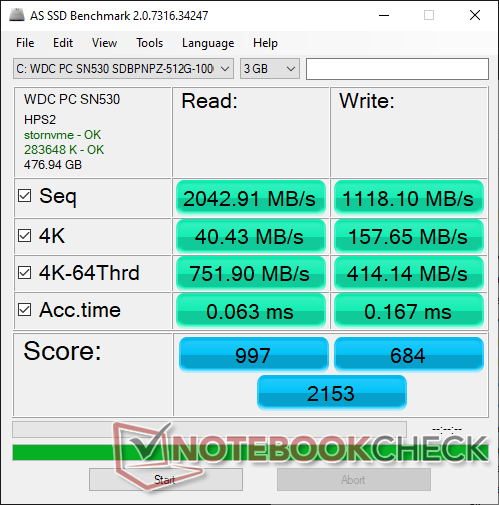
The Western Digital SN530 SDBPNPZ-512G is a mid-range PCIe 3.0 x4 NVMe SSD with a maximum read rate of 2400 MB/s which we are able to confirm with our DiskSpd Read loop test. The Samsung PM981a series is faster, but it is typically found on more expensive laptops like the Razer Blade or Samsung Galaxy Book Flex 15 instead. There are no Intel Optane options unlike on the HP Spectre series.
| HP Envy x360 15-eu0097nr WDC PC SN530 SDBPNPZ-512G | HP Envy x360 15-ee0257ng Intel SSD 660p SSDPEKNW512G8 | Samsung Galaxy Book Flex 15-NP950 Samsung SSD PM981a MZVLB512HBJQ | Asus ZenBook Flip 15 UX563FD-A1027T Samsung SSD PM981 MZVLB1T0HALR | Lenovo Yoga C740-15IML Samsung SSD PM981 MZVLB512HAJQ | HP Spectre X360 15-5ZV31AV Intel SSD 660p 2TB SSDPEKNW020T8 | |
|---|---|---|---|---|---|---|
| AS SSD | -9% | 72% | 45% | 61% | 14% | |
| Seq Read (MB/s) | 2043 | 1587 -22% | 2453 20% | 2739 34% | 2732 34% | 1220 -40% |
| Seq Write (MB/s) | 1118 | 864 -23% | 2339 109% | 1307 17% | 1477 32% | 1152 3% |
| 4K Read (MB/s) | 40.43 | 51.6 28% | 60.3 49% | 47.43 17% | 57.7 43% | 52.3 29% |
| 4K Write (MB/s) | 157.6 | 125.1 -21% | 142 -10% | 126 -20% | 136.3 -14% | 146.6 -7% |
| 4K-64 Read (MB/s) | 752 | 323.1 -57% | 1357 80% | 1013 35% | 1021 36% | 652 -13% |
| 4K-64 Write (MB/s) | 414.1 | 724 75% | 1467 254% | 1371 231% | 1651 299% | 847 105% |
| Access Time Read * (ms) | 0.063 | 0.101 -60% | 0.044 30% | 0.082 -30% | 0.062 2% | 0.077 -22% |
| Access Time Write * (ms) | 0.167 | 0.046 72% | 0.027 84% | 0.029 83% | 0.028 83% | 0.106 37% |
| Score Read (Points) | 997 | 533 -47% | 1662 67% | 1335 34% | 1352 36% | 826 -17% |
| Score Write (Points) | 684 | 935 37% | 1843 169% | 1628 138% | 1935 183% | 1109 62% |
| Score Total (Points) | 2153 | 1725 -20% | 4361 103% | 3582 66% | 3929 82% | 2371 10% |
| Copy ISO MB/s (MB/s) | 1344 | 1323 -2% | 2254 68% | 1931 44% | 1972 47% | 2070 54% |
| Copy Program MB/s (MB/s) | 630 | 340.8 -46% | 521 -17% | 457.9 -27% | 642 2% | 571 -9% |
| Copy Game MB/s (MB/s) | 1220 | 823 -33% | 1242 2% | 1242 2% | 1090 -11% | 1219 0% |
| CrystalDiskMark 5.2 / 6 | -25% | 26% | 11% | 20% | -6% | |
| Write 4K (MB/s) | 161 | 104.5 -35% | 173.4 8% | 137.8 -14% | 142.3 -12% | 151.5 -6% |
| Read 4K (MB/s) | 44.54 | 49.7 12% | 50.9 14% | 44.15 -1% | 47.56 7% | 59.3 33% |
| Write Seq (MB/s) | 1761 | 981 -44% | 2168 23% | 2073 18% | 2185 24% | 1424 -19% |
| Read Seq (MB/s) | 1645 | 1517 -8% | 1854 13% | 2165 32% | 2235 36% | 1609 -2% |
| Write 4K Q32T1 (MB/s) | 533 | 398.8 -25% | 520 -2% | 431.9 -19% | 515 -3% | 393.6 -26% |
| Read 4K Q32T1 (MB/s) | 420.3 | 338.4 -19% | 585 39% | 427.7 2% | 413.4 -2% | 369.4 -12% |
| Write Seq Q32T1 (MB/s) | 1835 | 982 -46% | 2994 63% | 2253 23% | 2981 62% | 1946 6% |
| Read Seq Q32T1 (MB/s) | 2430 | 1650 -32% | 3551 46% | 3480 43% | 3565 47% | 1934 -20% |
| Total Average (Program / Settings) | -17% /
-14% | 49% /
55% | 28% /
32% | 41% /
46% | 4% /
7% |
* ... smaller is better

Disk Throttling: DiskSpd Read Loop, Queue Depth 8
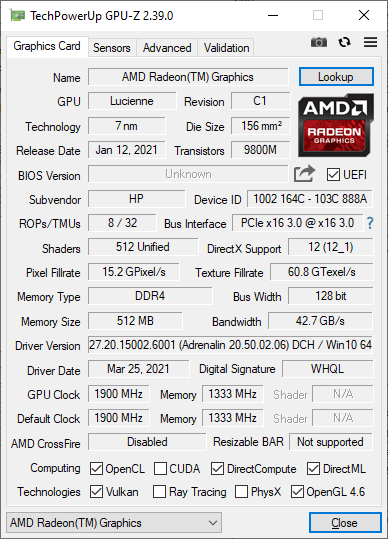
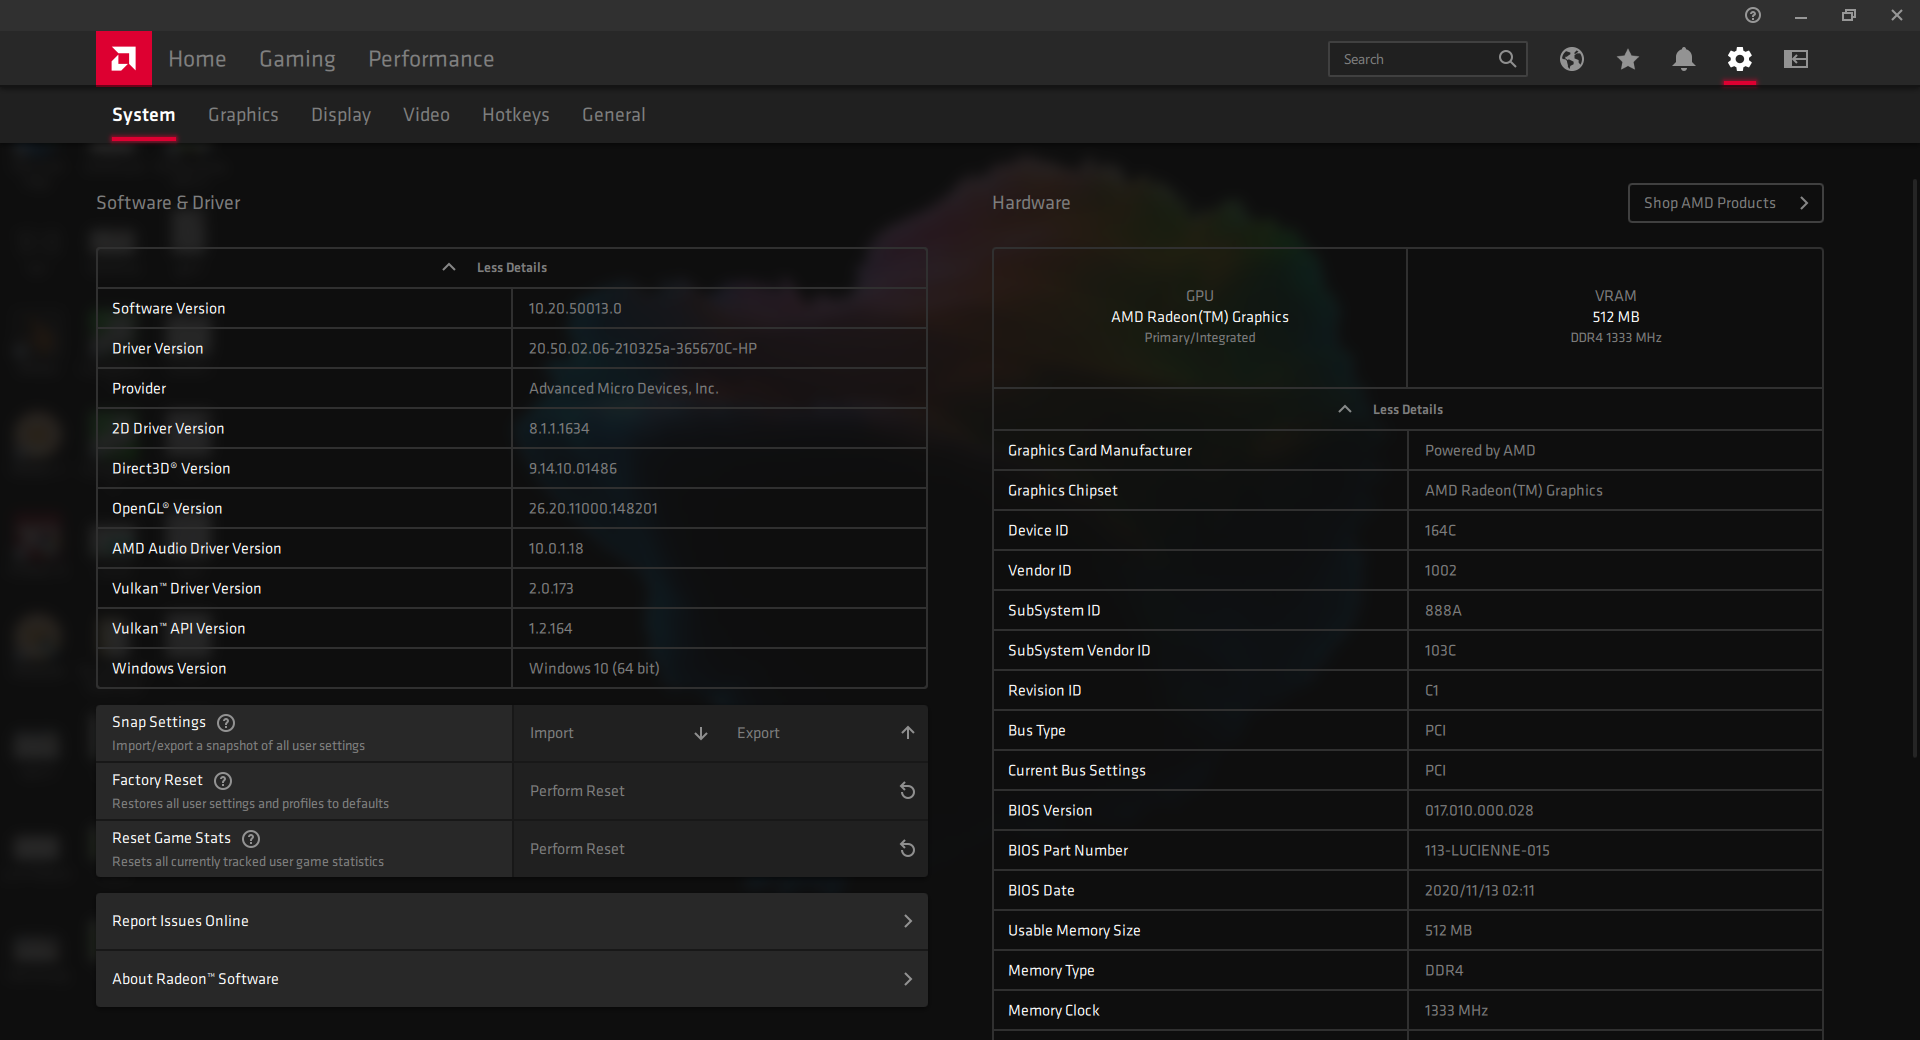
GPU Performance - New Ryzen CPU, Same Vega 8 GPU
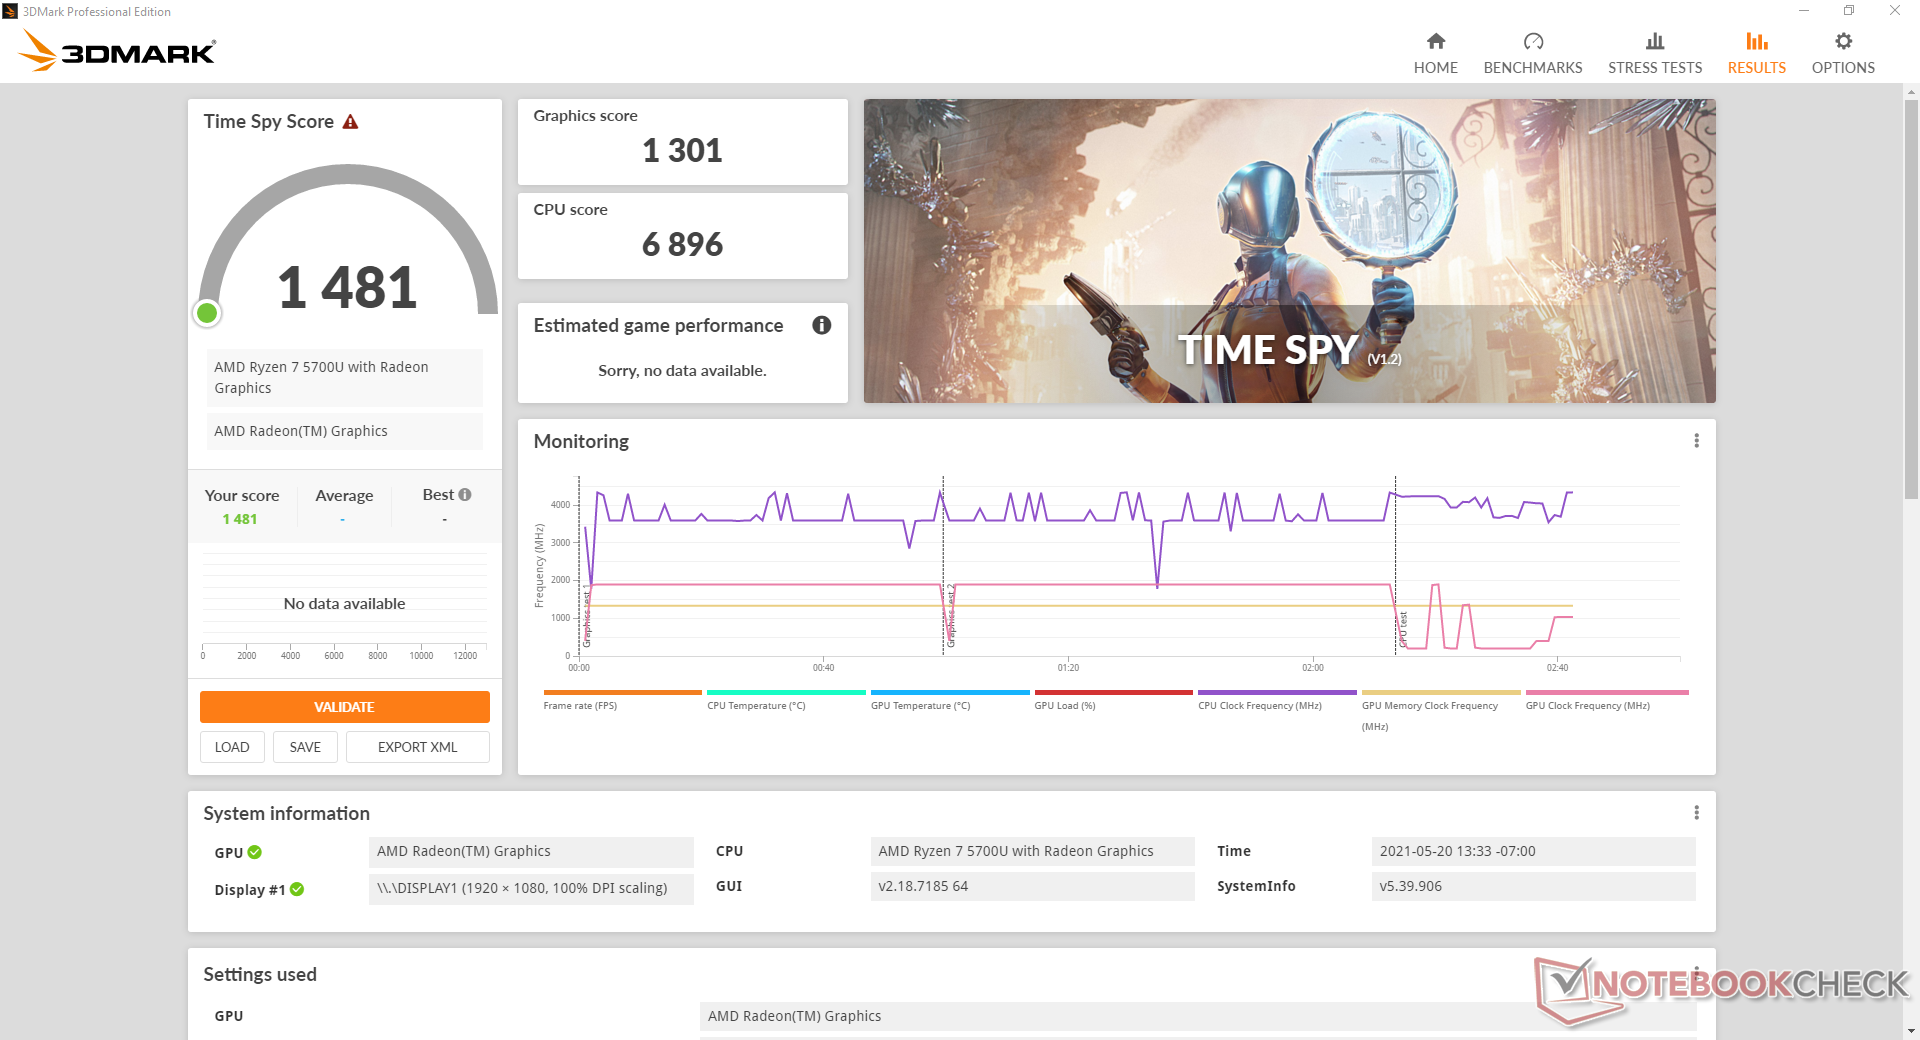
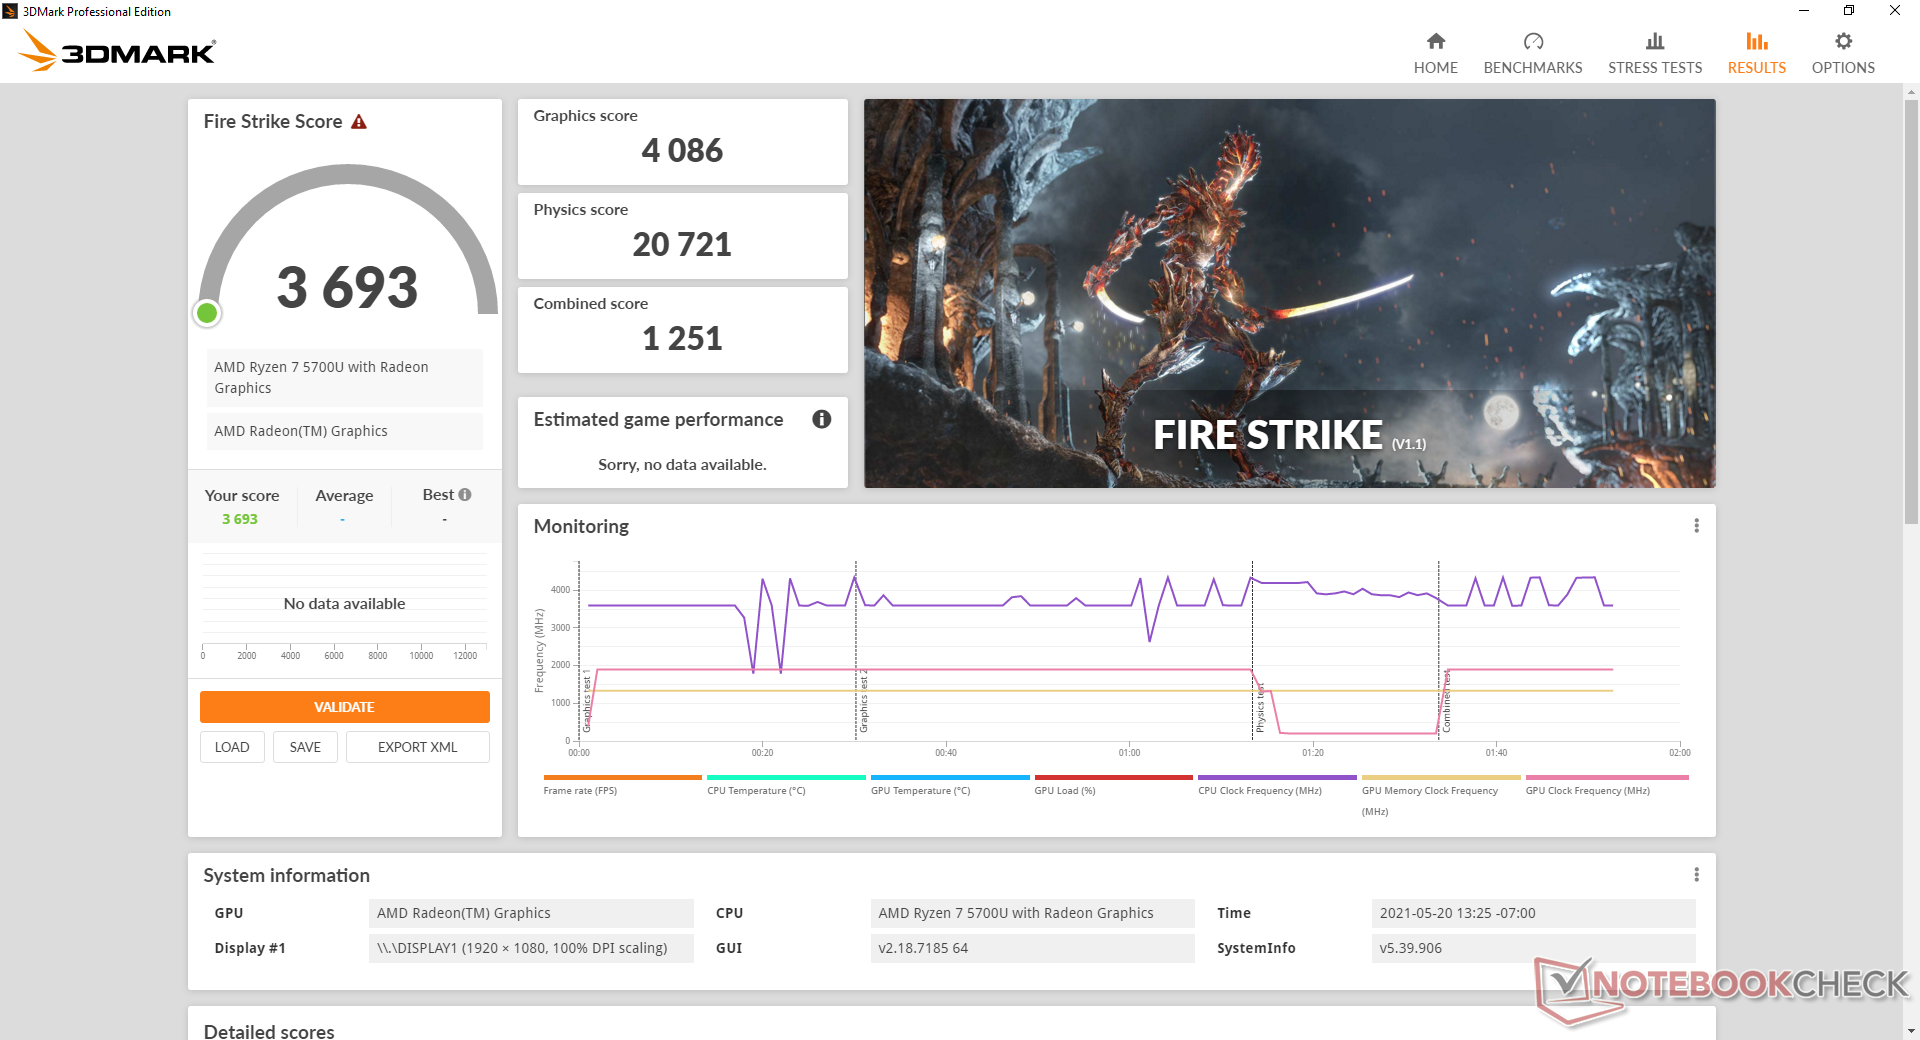
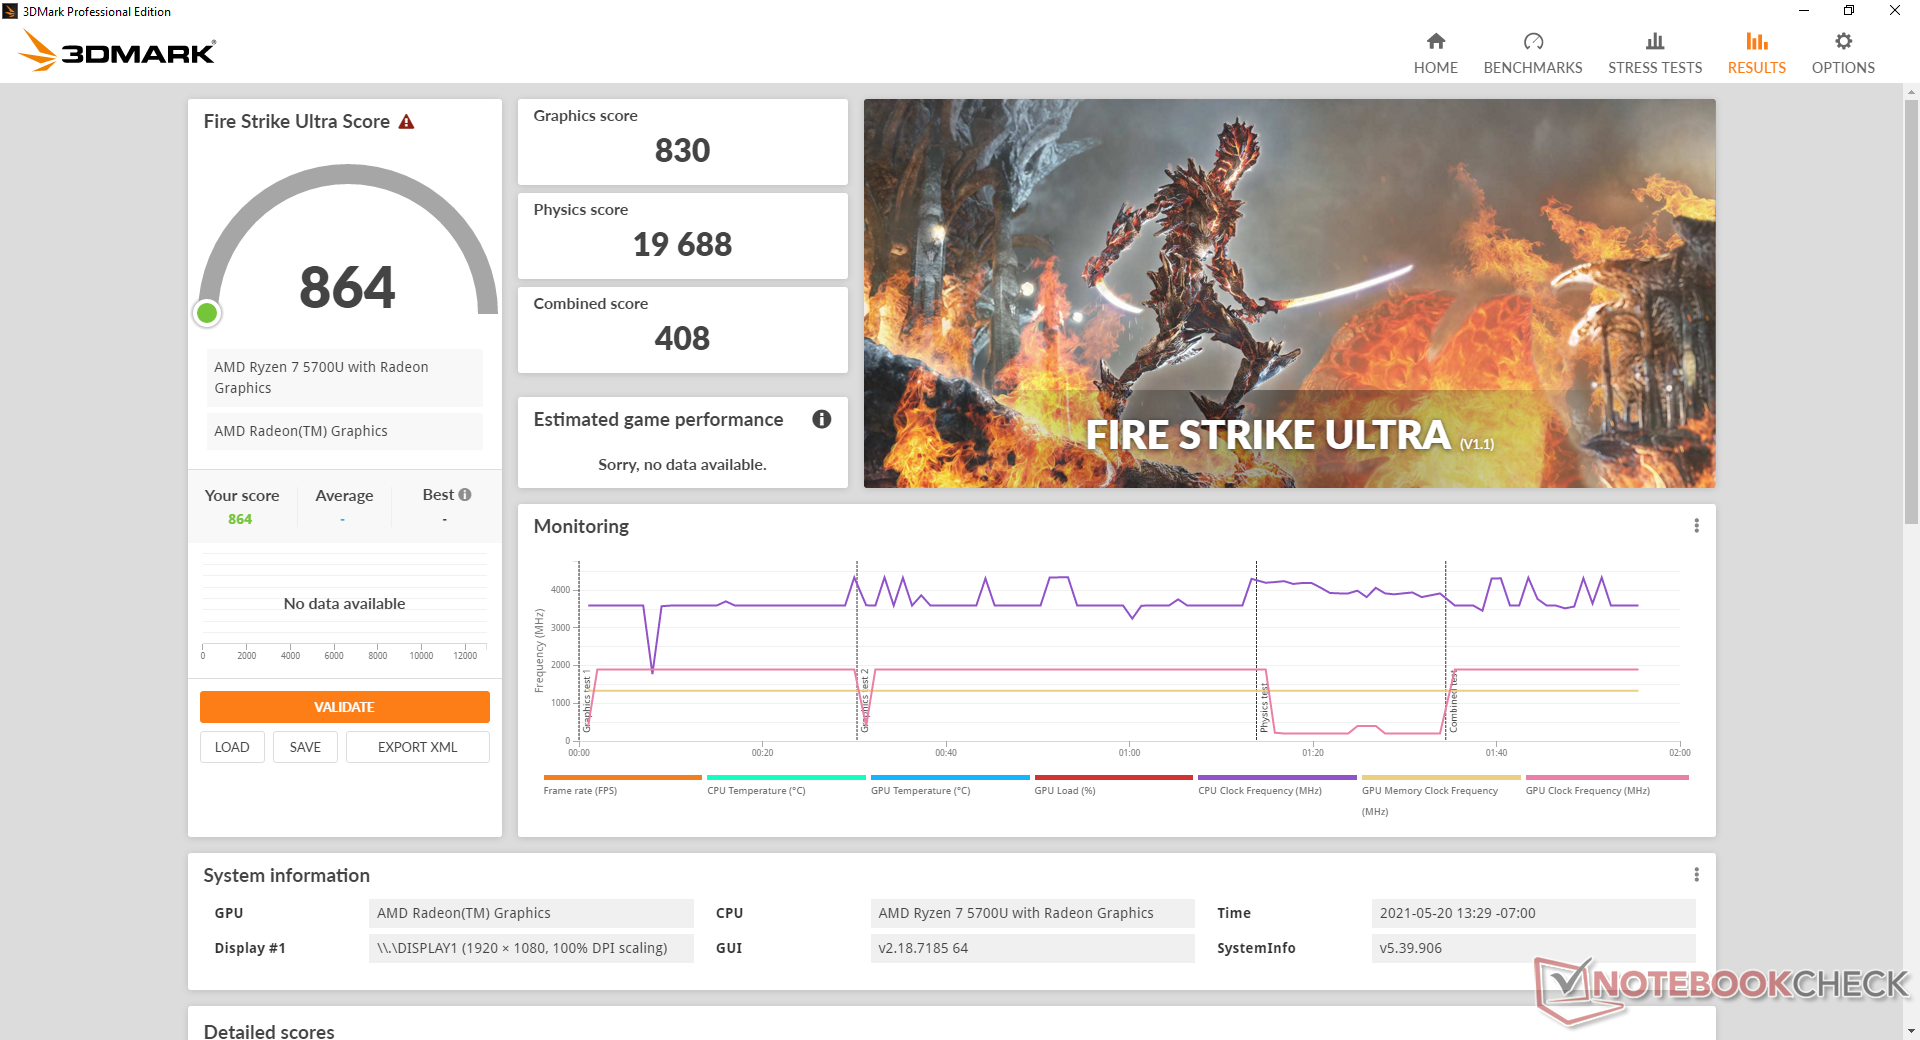
Despite being a 5000U series CPU, the Ryzen 5700U comes with the same integrated Radeon RX Vega 8 GPU as found on most Ryzen 4000U series CPUs. 3DMark results are therefore just slightly better year-over-year by only 4 to 11 percent when compared to the Ryzen 7 4800U in the Lenovo Yoga Slim 7. Gaming performance is generally on par with the GeForce MX250, but the variance can be high due to driver and optimization differences between AMD and Nvidia. GTA V, for example, can run up to 35 percent faster on laptops with the GeForce MX250.
If raw GPU power is a priority, then the Spectre x360 15 series and its GeForce GTX options will still be significantly faster.
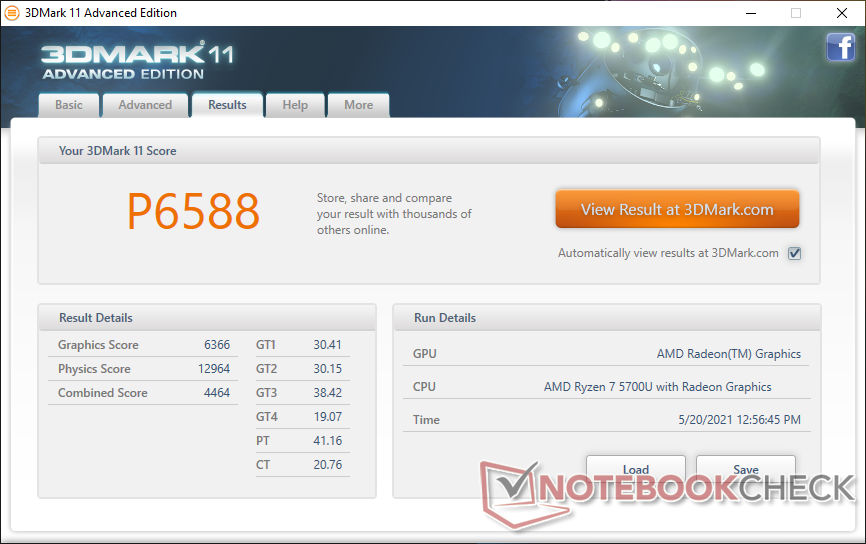
| 3DMark 11 Performance | 6588 points | |
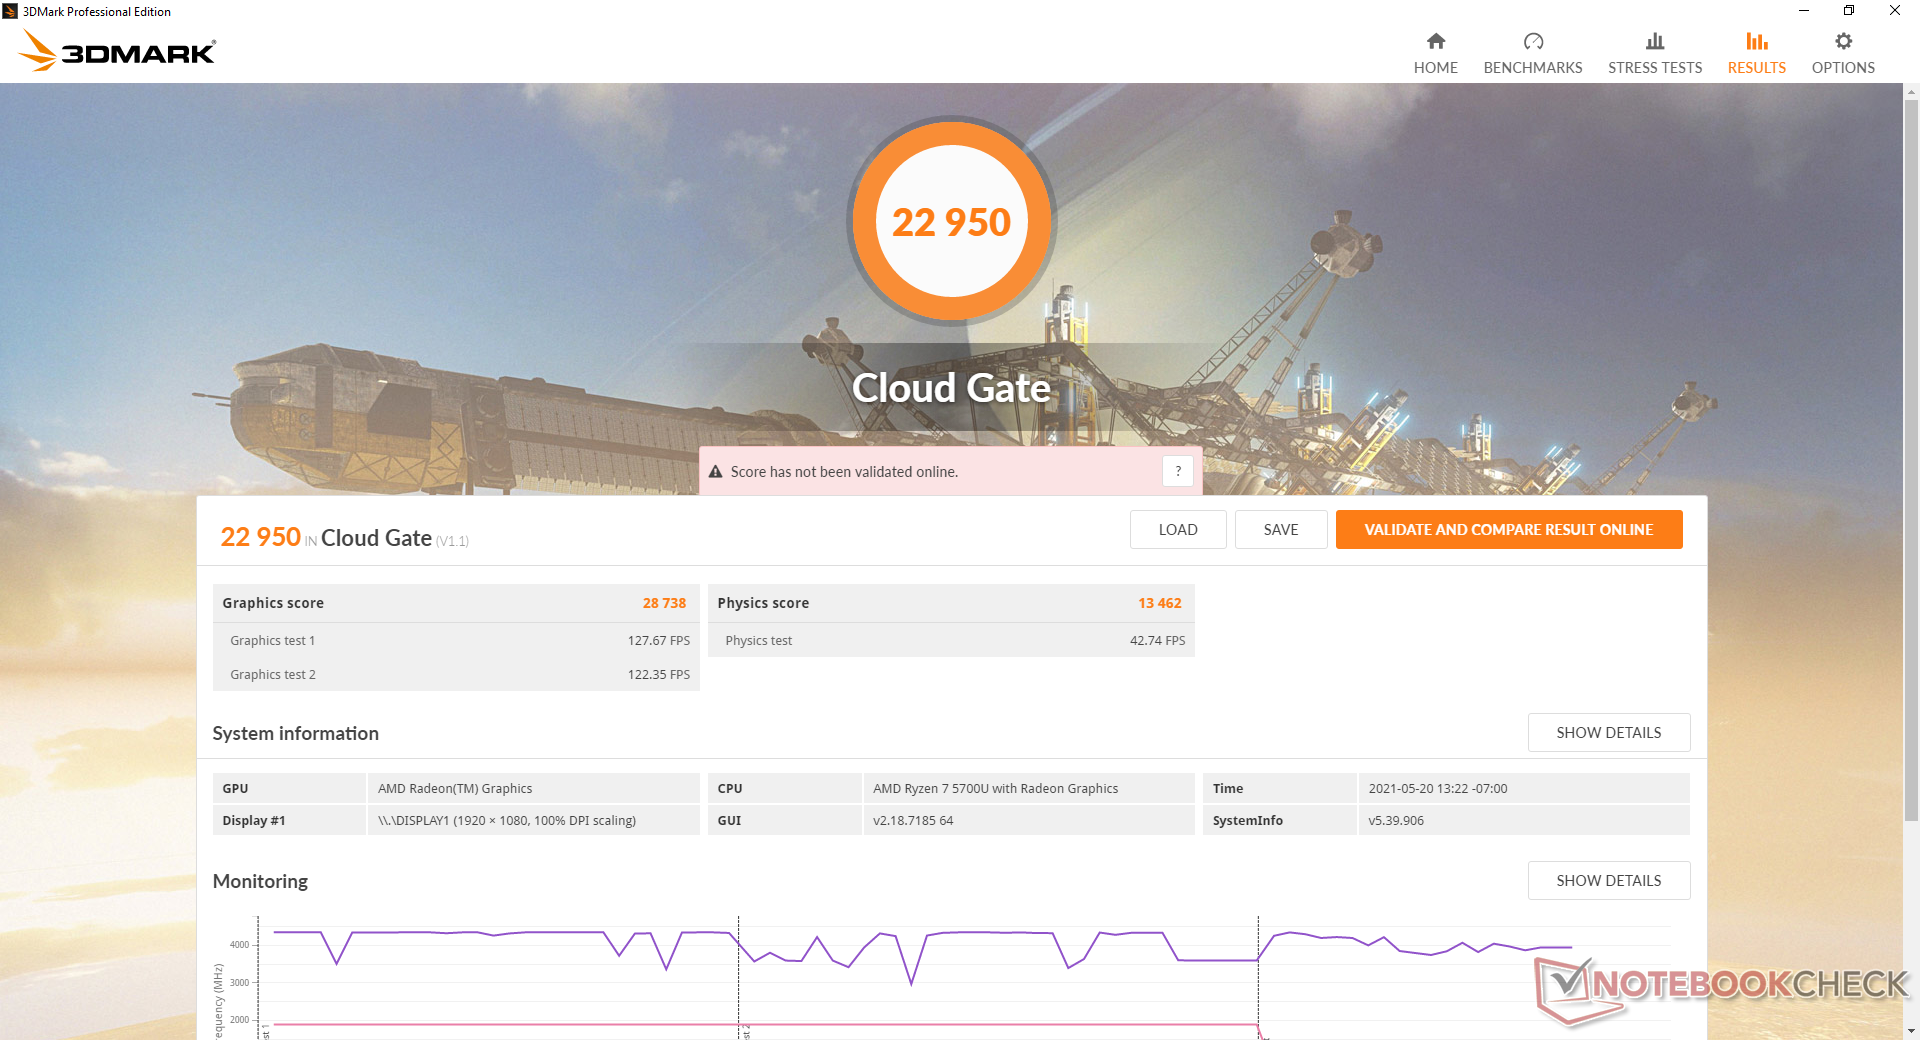
| 3DMark Cloud Gate Standard Score | 22950 points | |
| 3DMark Fire Strike Score | 3693 points | |
| 3DMark Time Spy Score | 1481 points | |
Help | ||
| low | med. | high | ultra | |
|---|---|---|---|---|
| GTA V (2015) | 104 | 93.3 | 28.5 | 11.5 |
| The Witcher 3 (2015) | 77.5 | 49.5 | 23.7 | 15.1 |
| Dota 2 Reborn (2015) | 101 | 83.9 | 56.4 | 53.3 |
| Final Fantasy XV Benchmark (2018) | 39.2 | 19.9 | 13.5 | |
| X-Plane 11.11 (2018) | 45.1 | 37.1 | 33 | |
| Strange Brigade (2018) | 85 | 33.9 | 28.6 | 24.4 |
Emissions - Quiet Under Most Conditions
System Noise
The system is very quiet even when set to performance mode. Running the first benchmark scene of 3DMark 06 would induce a fan noise of just 26.3 dB(A) to be barely audible meaning we would have to repeat the test multiple times to really get the fans moving. Fan noise when gaming is also quite low in the 30 to 36 dB(A) range compared to the high 30 dB(A) range on most other convertibles.
| HP Envy x360 15-eu0097nr Vega 8, R7 5700U, WDC PC SN530 SDBPNPZ-512G | HP Envy x360 15-ee0257ng Vega 6, R5 4500U, Intel SSD 660p SSDPEKNW512G8 | Samsung Galaxy Book Flex 15-NP950 GeForce MX250, i7-1065G7, Samsung SSD PM981a MZVLB512HBJQ | Asus ZenBook Flip 15 UX563FD-A1027T GeForce GTX 1050 Max-Q, i7-10510U, Samsung SSD PM981 MZVLB1T0HALR | Lenovo Yoga C740-15IML UHD Graphics 620, i7-10510U, Samsung SSD PM981 MZVLB512HAJQ | HP Spectre X360 15-5ZV31AV GeForce MX250, i7-10510U, Intel SSD 660p 2TB SSDPEKNW020T8 | |
|---|---|---|---|---|---|---|
| Noise | -20% | -11% | -20% | -14% | -20% | |
| off / environment * (dB) | 25 | 27 -8% | 24.9 -0% | 30.3 -21% | 29.3 -17% | 30.1 -20% |
| Idle Minimum * (dB) | 25.1 | 27 -8% | 24.9 1% | 30.3 -21% | 29.3 -17% | 30.1 -20% |
| Idle Average * (dB) | 25.1 | 27 -8% | 24.9 1% | 30.3 -21% | 29.3 -17% | 30.1 -20% |
| Idle Maximum * (dB) | 25.1 | 27 -8% | 24.9 1% | 30.3 -21% | 29.6 -18% | 30.1 -20% |
| Load Average * (dB) | 26.3 | 43.2 -64% | 38.4 -46% | 33.7 -28% | 32.4 -23% | 30.1 -14% |
| Witcher 3 ultra * (dB) | 30.8 | 38.4 -25% | 37.4 -21% | 39.7 -29% | ||
| Load Maximum * (dB) | 35.5 | 43.2 -22% | 38.5 -8% | 38.9 -10% | 33.3 6% | 42 -18% |
* ... smaller is better
Noise level
| Idle |
| 25.1 / 25.1 / 25.1 dB(A) |
| Load |
| 26.3 / 35.5 dB(A) |
 | ||
30 dB silent 40 dB(A) audible 50 dB(A) loud |
||
min: | ||
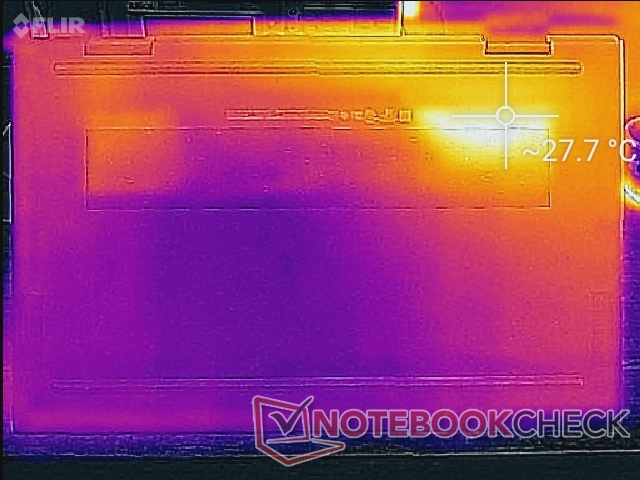
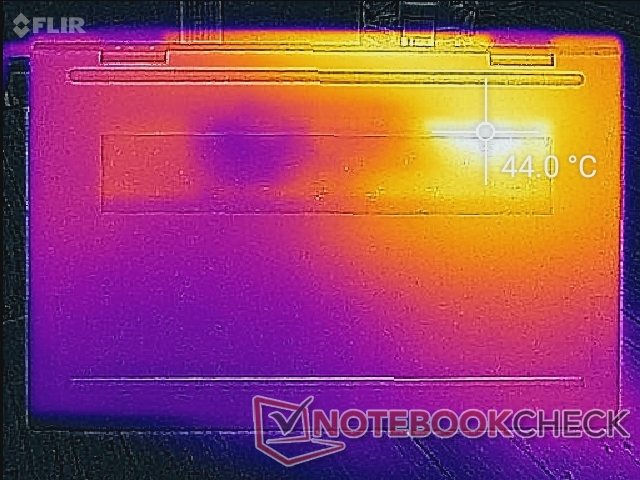
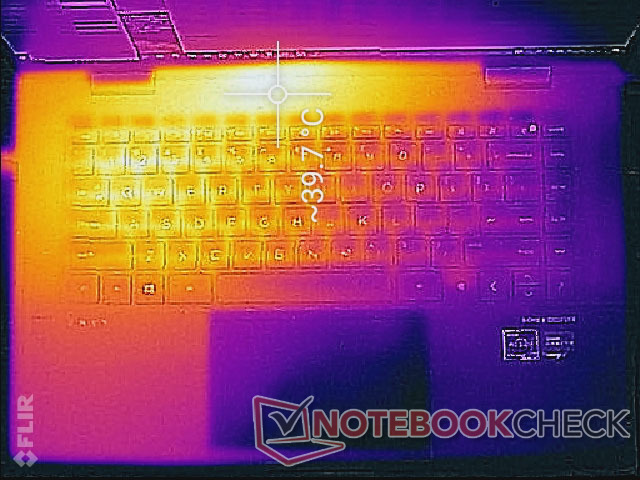
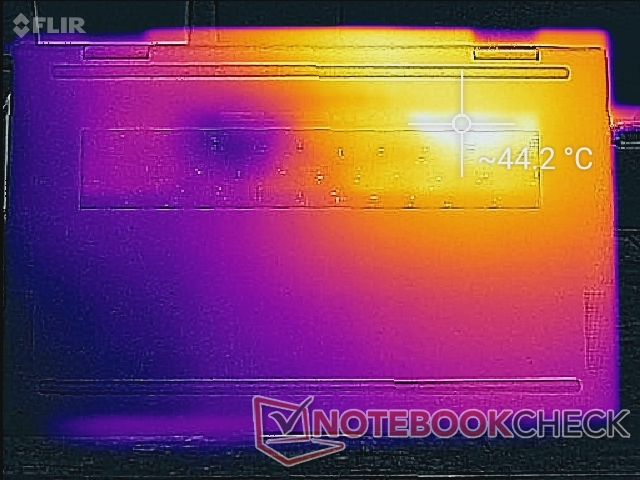
Temperature
Surface temperatures are generally cool during most day-to-day loads. Running higher loads will warm the left half of the system much more than the right half due to the positioning of the processor inside. The WASD keys in particular can become as warm as 39 C when gaming compared to just 29 C on the other half of the keyboard. Hot spots on the Spectre x360 15 can become even warmer at 47 C to 55 C, but its symmetrical temperature profile is preferable.
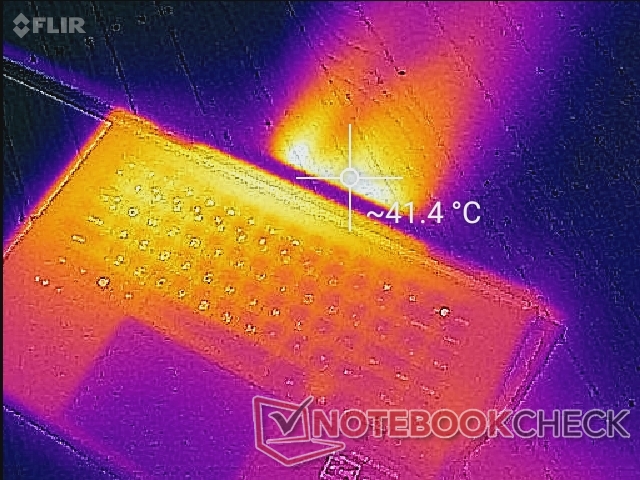
(+) The maximum temperature on the upper side is 39.6 °C / 103 F, compared to the average of 35.4 °C / 96 F, ranging from 19.6 to 60 °C for the class Convertible.
(±) The bottom heats up to a maximum of 44.4 °C / 112 F, compared to the average of 36.8 °C / 98 F
(+) In idle usage, the average temperature for the upper side is 22.6 °C / 73 F, compared to the device average of 30.3 °C / 87 F.
(+) Playing The Witcher 3, the average temperature for the upper side is 31 °C / 88 F, compared to the device average of 30.3 °C / 87 F.
(+) The palmrests and touchpad are cooler than skin temperature with a maximum of 30 °C / 86 F and are therefore cool to the touch.
(-) The average temperature of the palmrest area of similar devices was 27.9 °C / 82.2 F (-2.1 °C / -3.8 F).


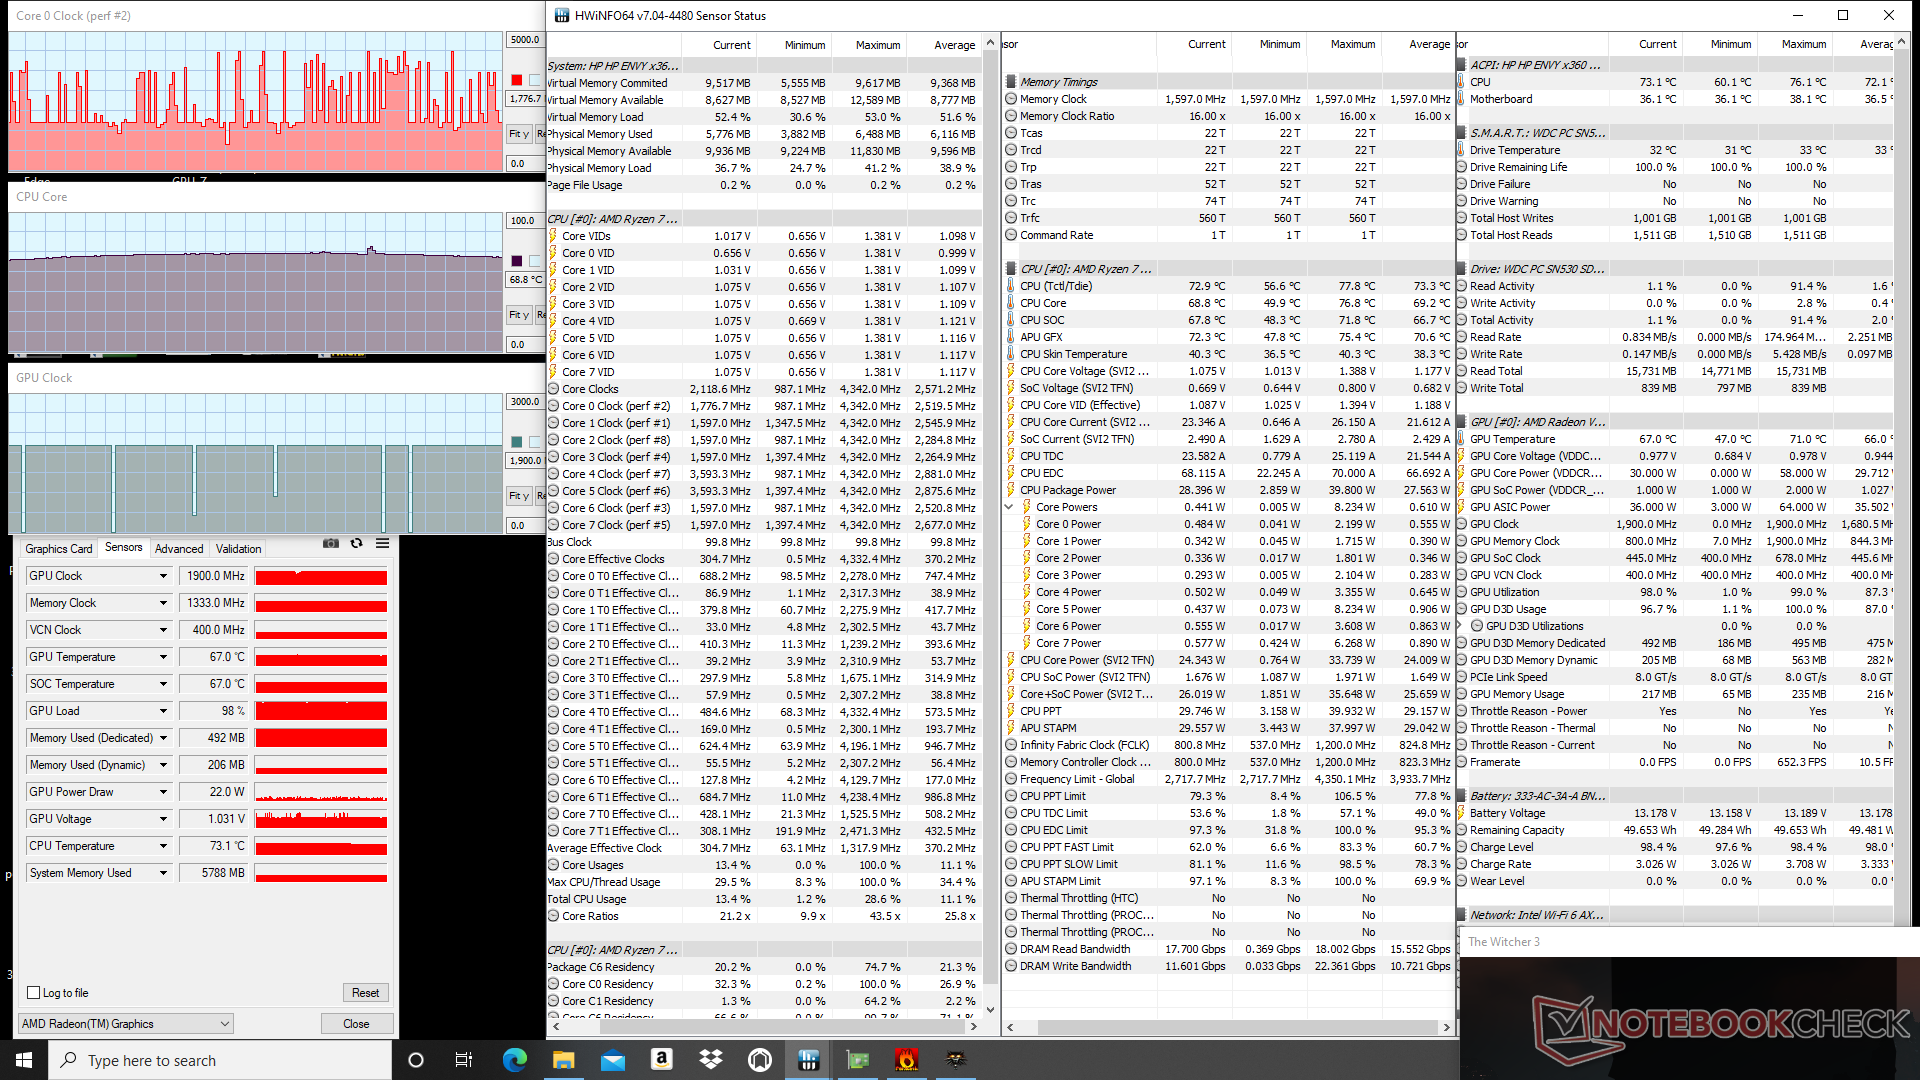
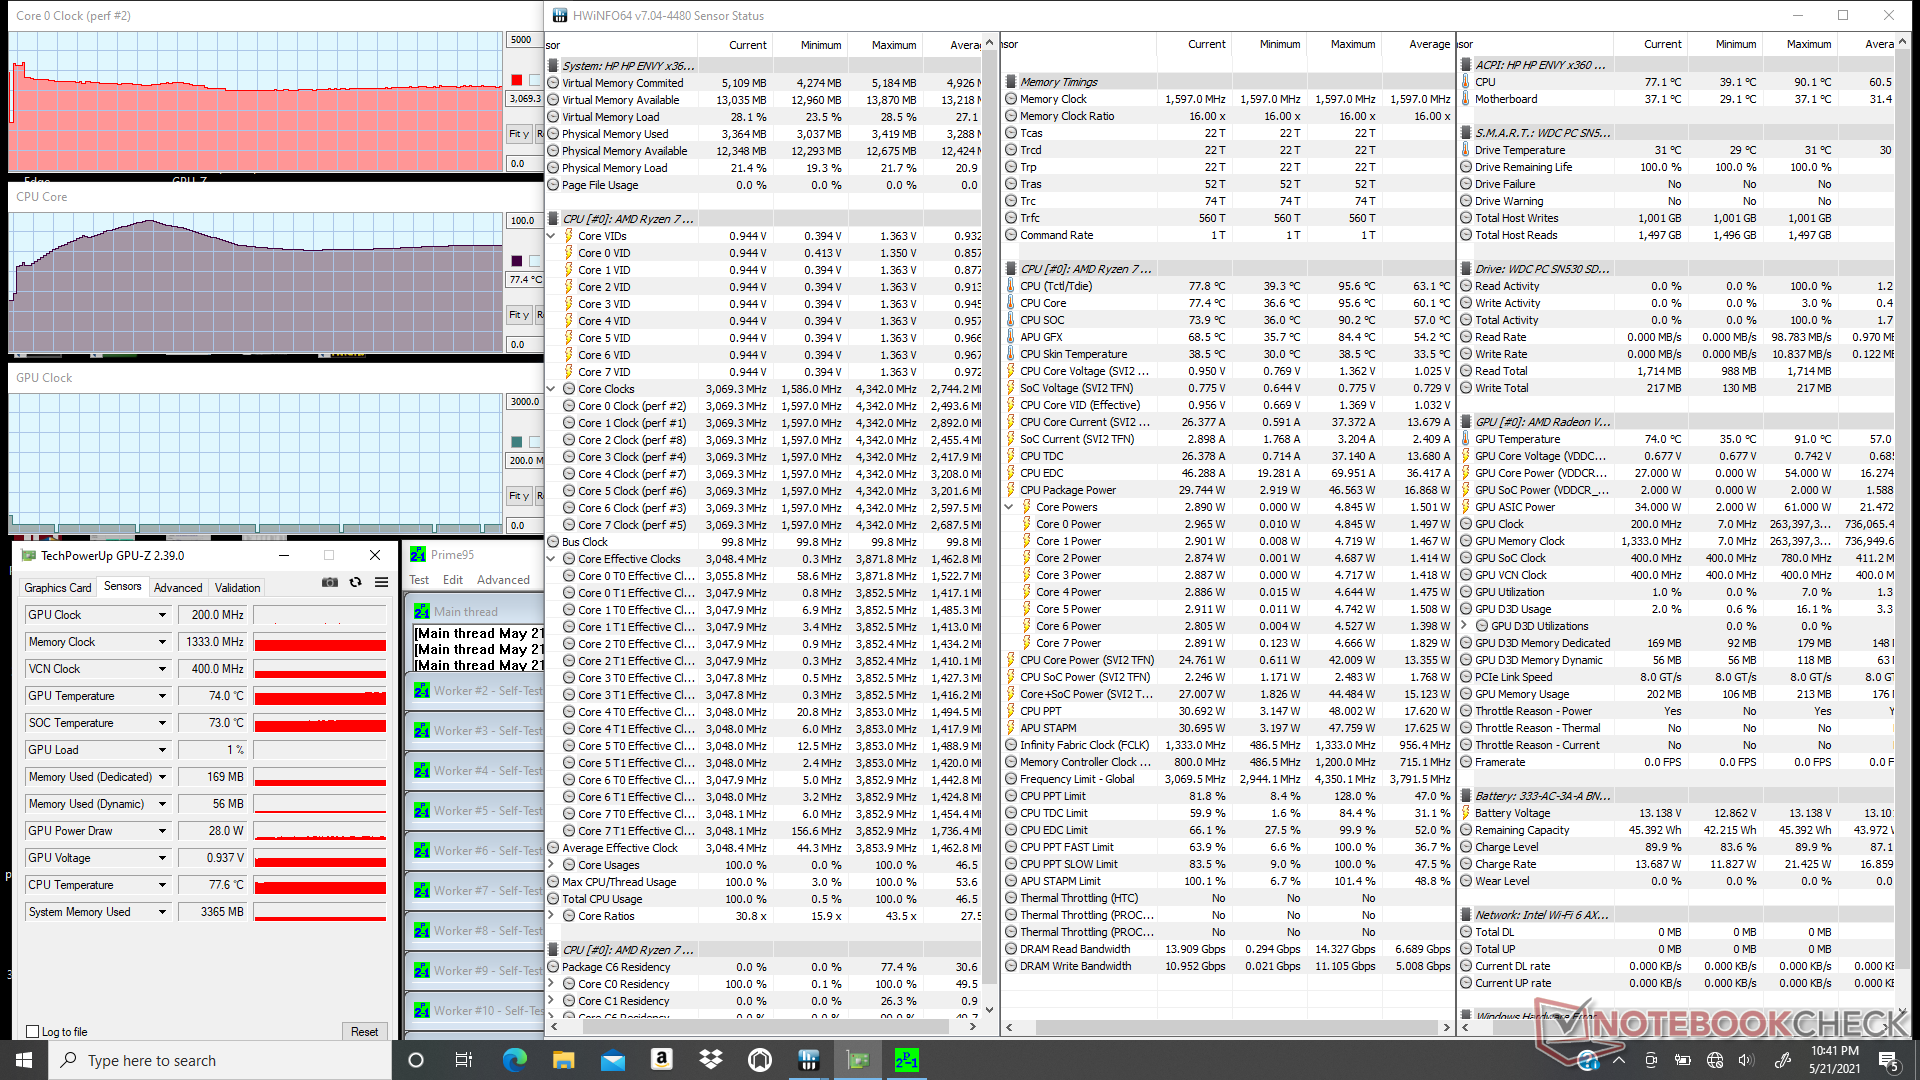
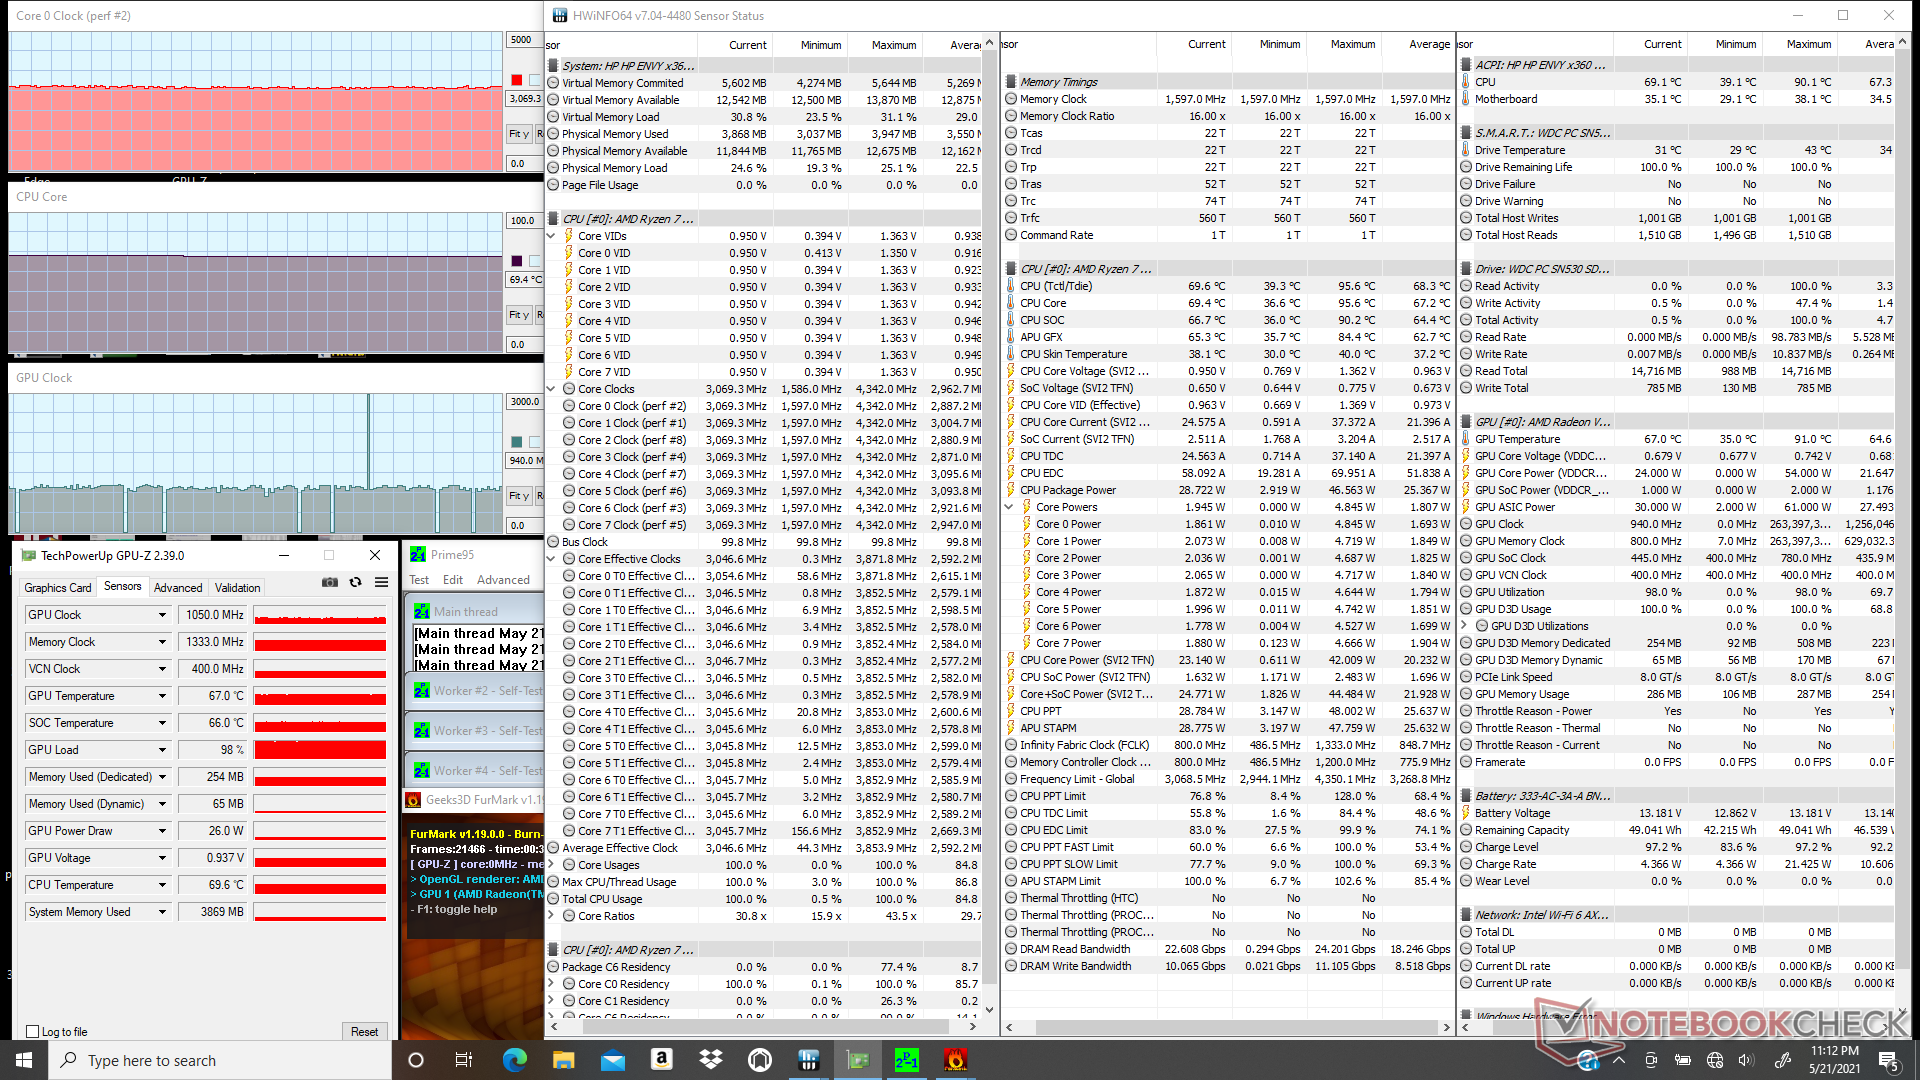
Stress Test
When stressed with Prime95, the CPU would boost to 3.9 GHz for just a couple of seconds before dropping to the 3.1 to 3.4 GHz range. Core temperature would then continue to climb until reaching 96 C. At that point, clock rates would stabilize at 3.1 GHz in order to maintain a cooler core temperature of 78 C. In comparison, the MSI Summit B15 with the popular Core i7-1165G7 would stabilize at a warmer 90 C when under similar Prime95 stress.
Running on batteries will impact graphics performance slightly. A 3DMark 11 test on battery power would return Physics and Graphics scores of 12985 and 6094 points, respectively, compared to 12964 and 6366 points when on mains.
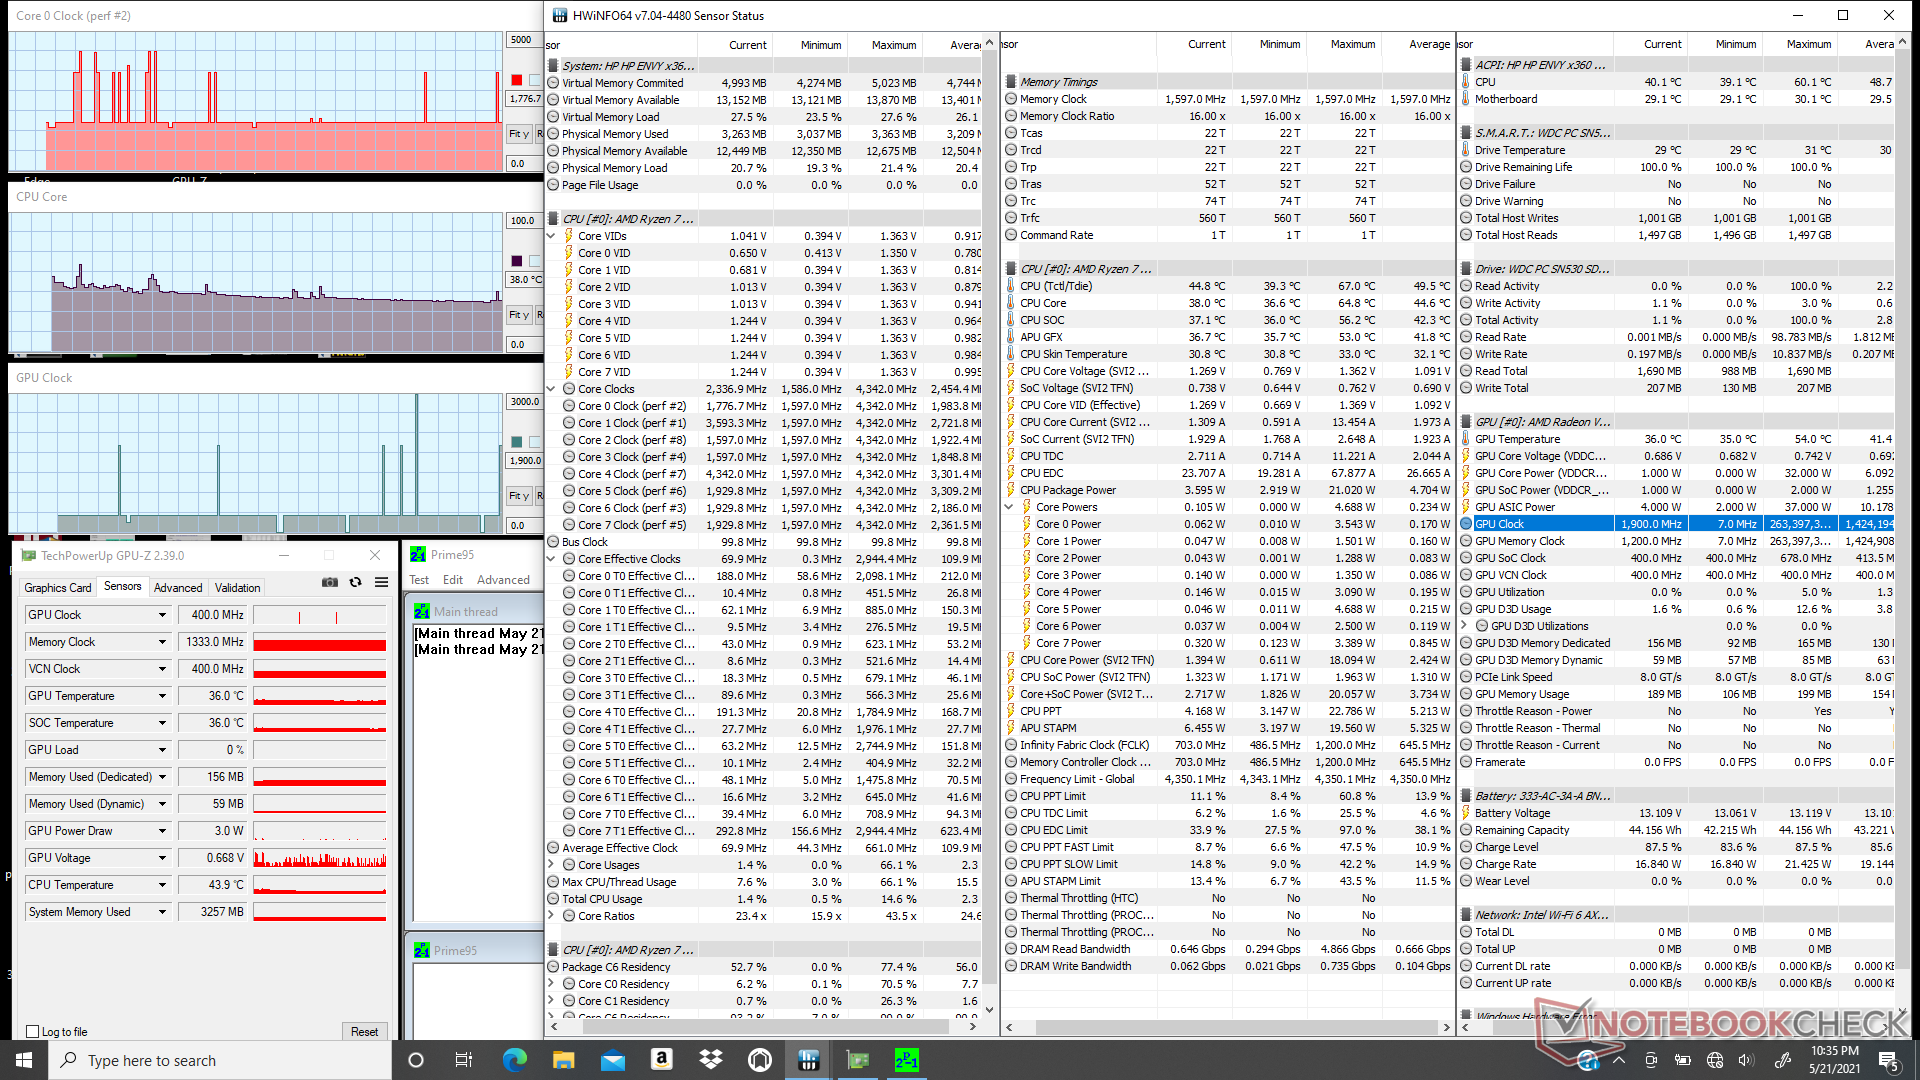
| CPU Clock (GHz) | GPU Clock (MHz) | Average CPU Temperature (°C) | |
| System Idle | -- | -- | 38 |
| Prime95 Stress | 3.1 | -- | 78 |
| Prime95 + FurMark Stress | 3.1 | 1050 | 69 |
| Witcher 3 Stress | 1.5+ | 1900 | 69 |
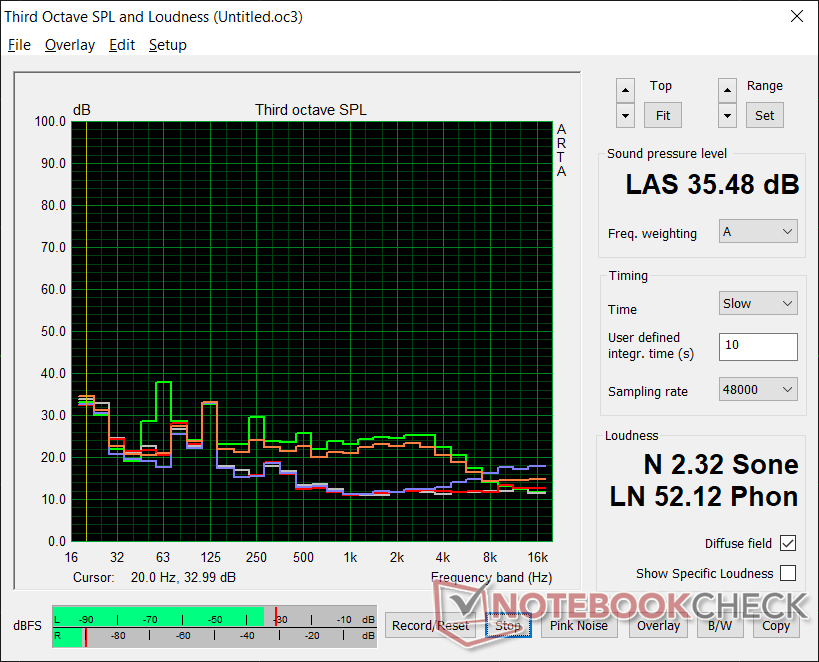
Speakers
Interestingly, the laptop only has two speakers despite the fact that it has four speaker grilles (two along the edges of the keyboard and two along the bottom corners). The audio capabilities of the laptop can look deceiving as a result. Audio quality is otherwise pretty good with a balanced pink noise curve to show decent bass reproduction. Maximum volume, however, could be a little louder.


HP Envy x360 15-eu0097nr audio analysis
(±) | speaker loudness is average but good (74.8 dB)
Bass 100 - 315 Hz
(-) | nearly no bass - on average 15.1% lower than median
(±) | linearity of bass is average (13.8% delta to prev. frequency)
Mids 400 - 2000 Hz
(+) | balanced mids - only 2.8% away from median
(+) | mids are linear (2.4% delta to prev. frequency)
Highs 2 - 16 kHz
(+) | balanced highs - only 3.1% away from median
(+) | highs are linear (5.6% delta to prev. frequency)
Overall 100 - 16.000 Hz
(+) | overall sound is linear (14.8% difference to median)
Compared to same class
» 23% of all tested devices in this class were better, 4% similar, 73% worse
» The best had a delta of 6%, average was 20%, worst was 57%
Compared to all devices tested
» 19% of all tested devices were better, 4% similar, 77% worse
» The best had a delta of 4%, average was 24%, worst was 134%
Apple MacBook 12 (Early 2016) 1.1 GHz audio analysis
(+) | speakers can play relatively loud (83.6 dB)
Bass 100 - 315 Hz
(±) | reduced bass - on average 11.3% lower than median
(±) | linearity of bass is average (14.2% delta to prev. frequency)
Mids 400 - 2000 Hz
(+) | balanced mids - only 2.4% away from median
(+) | mids are linear (5.5% delta to prev. frequency)
Highs 2 - 16 kHz
(+) | balanced highs - only 2% away from median
(+) | highs are linear (4.5% delta to prev. frequency)
Overall 100 - 16.000 Hz
(+) | overall sound is linear (10.2% difference to median)
Compared to same class
» 7% of all tested devices in this class were better, 2% similar, 91% worse
» The best had a delta of 5%, average was 18%, worst was 53%
Compared to all devices tested
» 4% of all tested devices were better, 1% similar, 94% worse
» The best had a delta of 4%, average was 24%, worst was 134%
Energy Management - Power Efficient For An Octa-Core System
Power Consumption
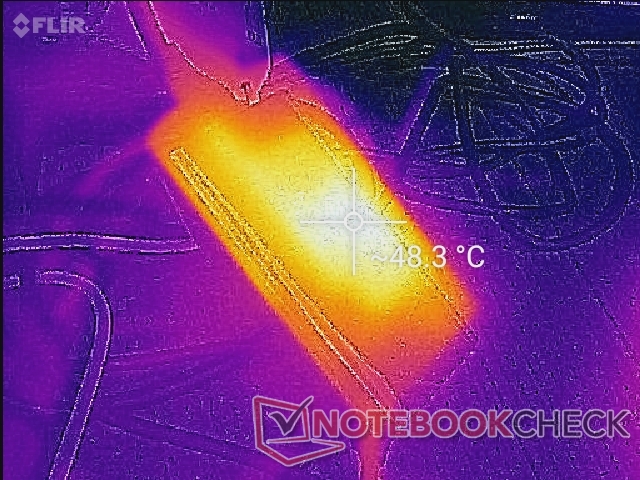
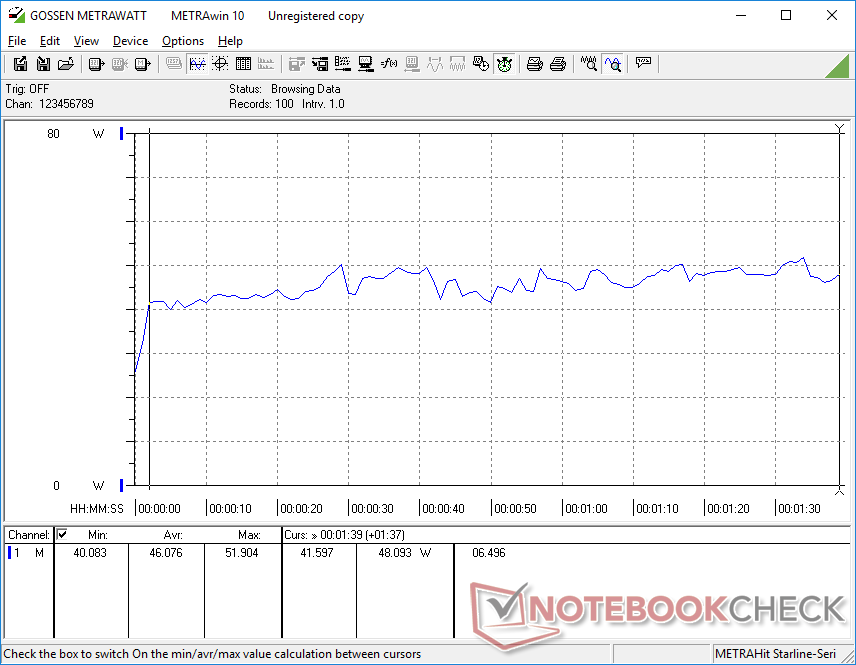
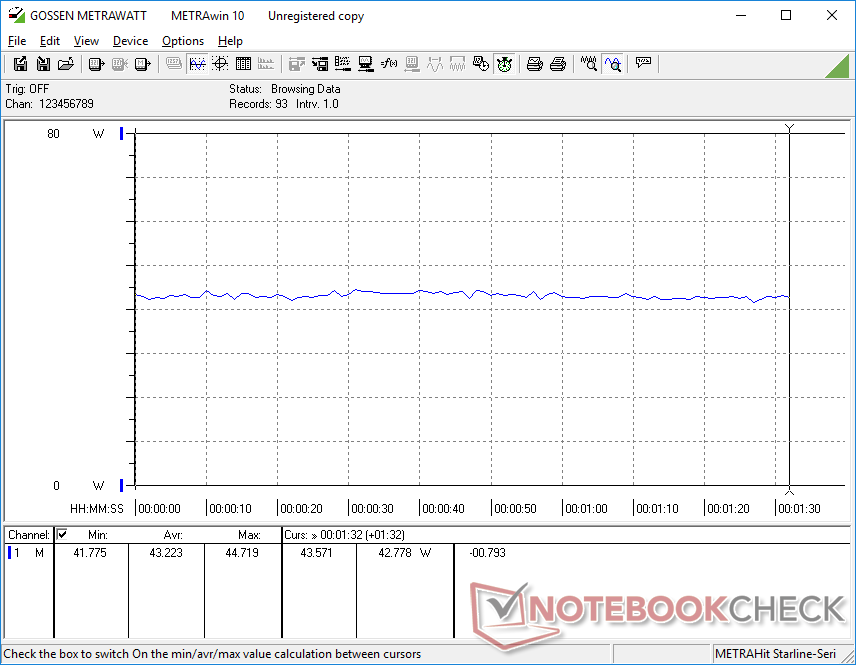
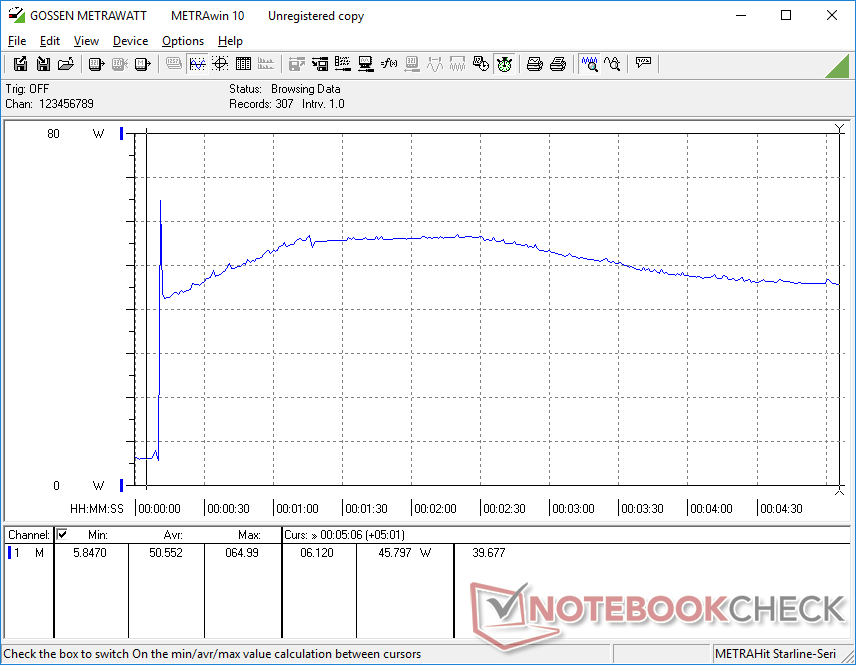
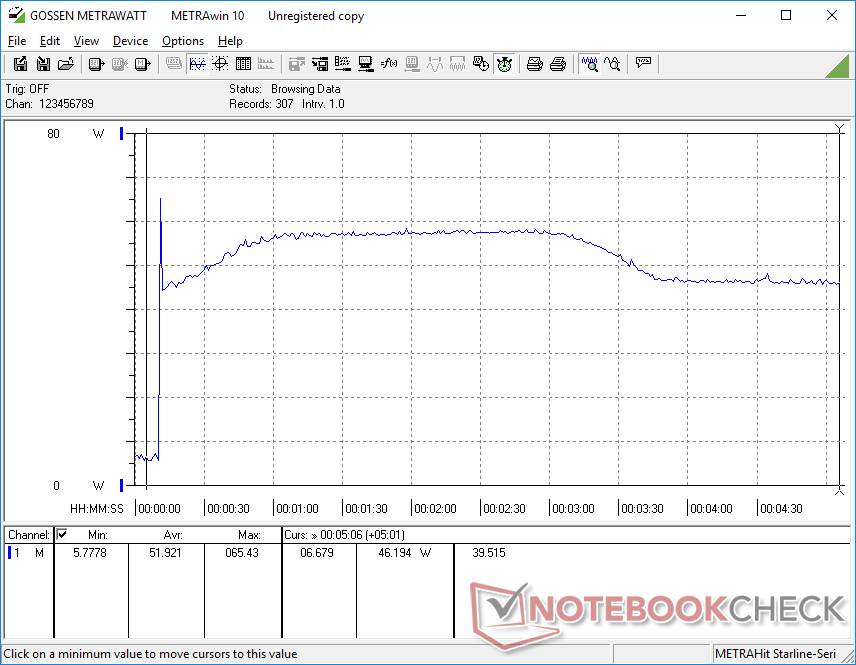
Idling on desktop consumes between 3 W and 6 W depending on the power profile and brightness setting. When gaming, consumption may range between 43 W and 46 W to be very similar to what we recorded on last year's model despite the processor upgrade. Much like Tiger Lake, performance-per-watt is very high on this AMD-based system when compared to laptops with discrete GeForce MX graphics like the Samsung Galaxy Book Flex 15 or HP Spectre X360 15. These alternatives would consume about 12 W to 15 W more each when under similar gaming conditions.
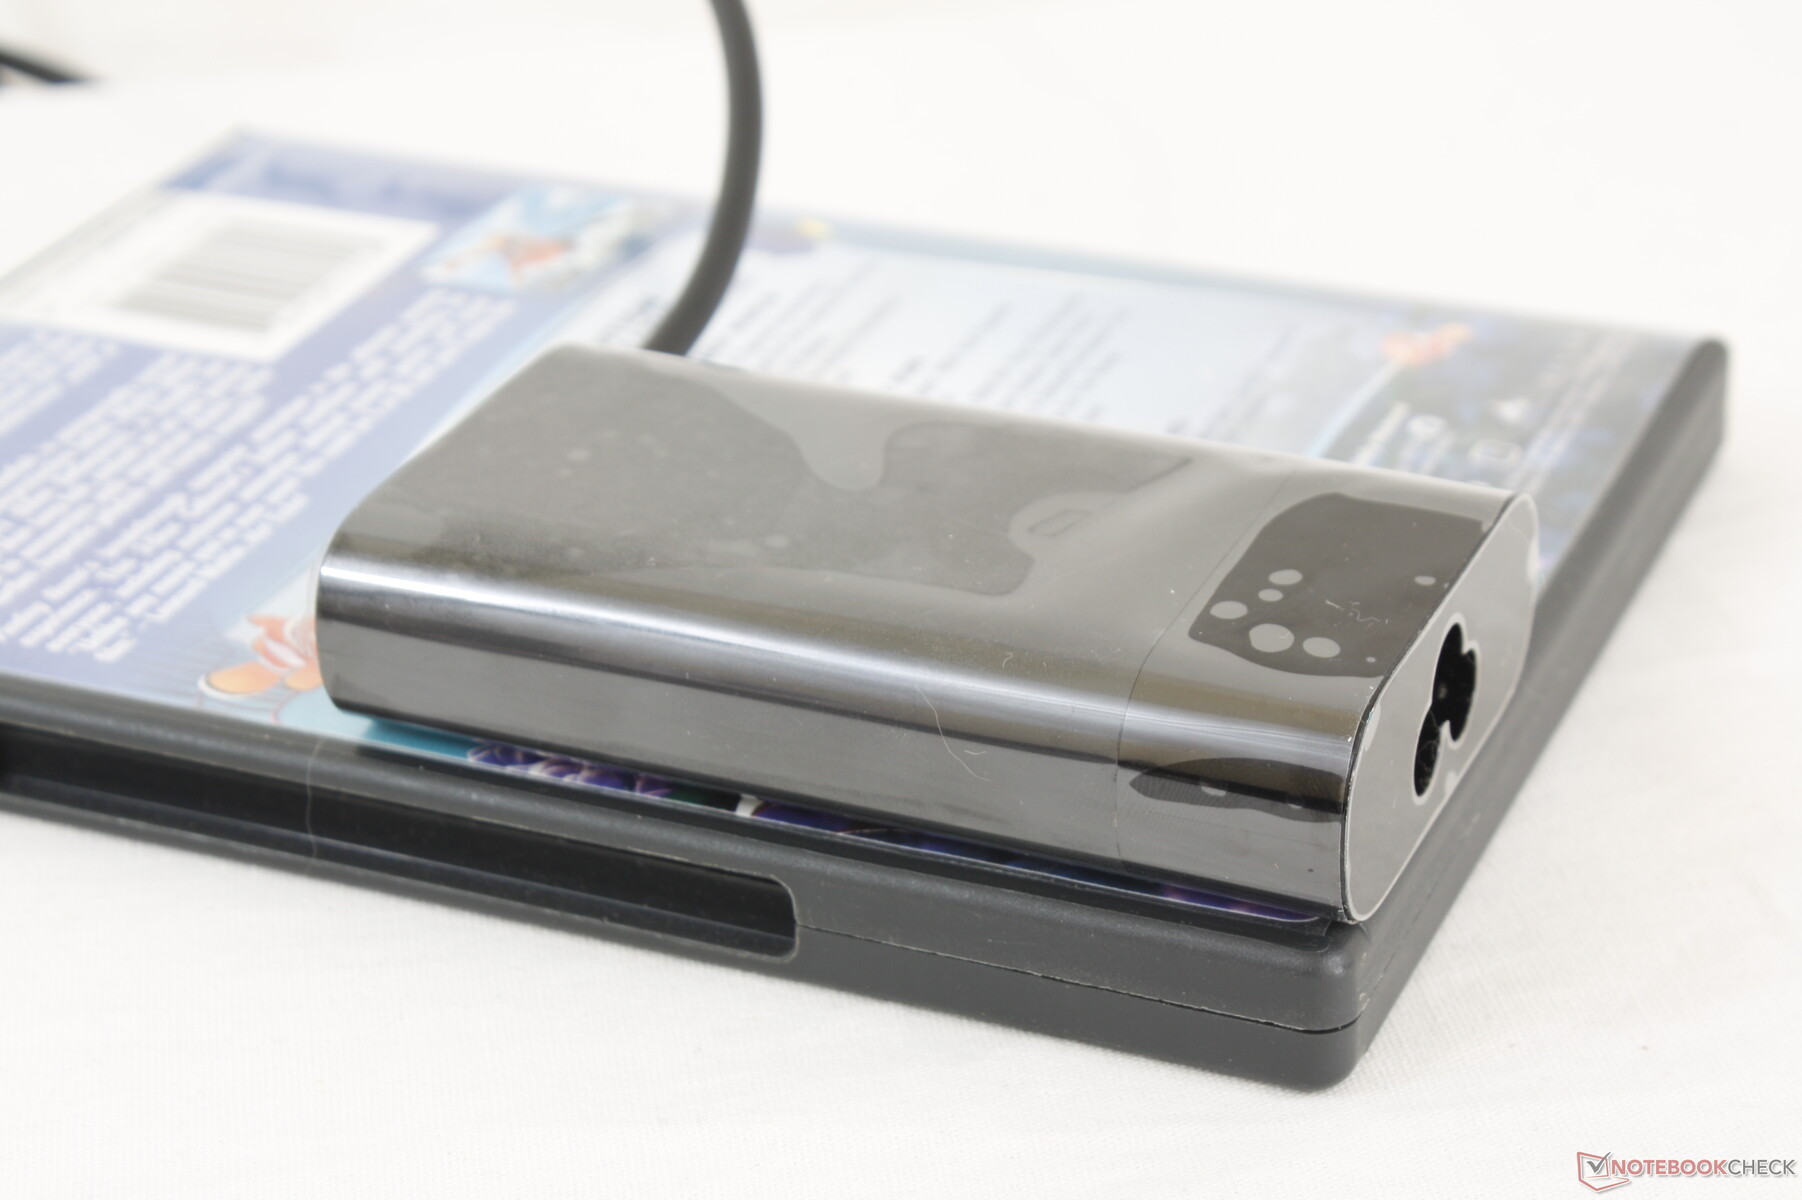
We're able to measure a temporary maximum draw of 65.4 W from the small (~9.8 x 5.3 x 2.2 cm) 65 W AC barrel adapter as shown by our graphs below. We hope to see HP drop the barrel adapter for a universal USB-C one on future models while also adding a second USB-C port.
| Off / Standby | |
| Idle | |
| Load |
|
Key:
min: | |
| HP Envy x360 15-eu0097nr R7 5700U, Vega 8, WDC PC SN530 SDBPNPZ-512G, IPS, 1920x1080, 15.6" | HP Envy x360 15-ee0257ng R5 4500U, Vega 6, Intel SSD 660p SSDPEKNW512G8, IPS, 1920x1080, 15.6" | Samsung Galaxy Book Flex 15-NP950 i7-1065G7, GeForce MX250, Samsung SSD PM981a MZVLB512HBJQ, IPS, QLED, 1920x1080, 15.6" | Asus ZenBook Flip 15 UX563FD-A1027T i7-10510U, GeForce GTX 1050 Max-Q, Samsung SSD PM981 MZVLB1T0HALR, IPS, 3840x2160, 15.6" | Lenovo Yoga C740-15IML i7-10510U, UHD Graphics 620, Samsung SSD PM981 MZVLB512HAJQ, IPS LED, 1920x1080, 15.6" | HP Spectre X360 15-5ZV31AV i7-10510U, GeForce MX250, Intel SSD 660p 2TB SSDPEKNW020T8, IPS, 3840x2160, 15.6" | |
|---|---|---|---|---|---|---|
| Power Consumption | -24% | -34% | -58% | -14% | -44% | |
| Idle Minimum * (Watt) | 3.5 | 3.9 -11% | 4.2 -20% | 2.3 34% | 2.97 15% | 5.2 -49% |
| Idle Average * (Watt) | 5.7 | 7 -23% | 8.7 -53% | 10.3 -81% | 7.2 -26% | 8.5 -49% |
| Idle Maximum * (Watt) | 5.8 | 10.5 -81% | 11.3 -95% | 11 -90% | 9.9 -71% | 8.7 -50% |
| Load Average * (Watt) | 46 | 48 -4% | 58 -26% | 77 -67% | 40.8 11% | 65.6 -43% |
| Witcher 3 ultra * (Watt) | 42.1 | 44.6 -6% | 68 -62% | 56.5 -34% | ||
| Load Maximum * (Watt) | 65.4 | 65 1% | 67 -2% | 118 -80% | 64.7 1% | 92.4 -41% |
* ... smaller is better
Battery Life
Runtimes are excellent at almost 10 hours of real-world WLAN use to be comparable to last year's model. Charging from empty to full capacity takes just over 2 hours. The system can also be recharged via USB-C.
| HP Envy x360 15-eu0097nr R7 5700U, Vega 8, 51 Wh | HP Envy x360 15-ee0257ng R5 4500U, Vega 6, 51 Wh | Samsung Galaxy Book Flex 15-NP950 i7-1065G7, GeForce MX250, 69.7 Wh | Asus ZenBook Flip 15 UX563FD-A1027T i7-10510U, GeForce GTX 1050 Max-Q, 71 Wh | Lenovo Yoga C740-15IML i7-10510U, UHD Graphics 620, 60.3 Wh | HP Spectre X360 15-5ZV31AV i7-10510U, GeForce MX250, 84 Wh | |
|---|---|---|---|---|---|---|
| Battery runtime | -5% | 18% | -15% | -16% | -2% | |
| Reader / Idle (h) | 23.8 | 19.5 -18% | 22.6 -5% | |||
| WiFi v1.3 (h) | 9.9 | 9.4 -5% | 11.7 18% | 9.4 -5% | 10.4 5% | 10.8 9% |
| Load (h) | 3.2 | 2.5 -22% | 2 -37% | 2.9 -9% |
Pros
Cons
Verdict - Outperforms Most Other 15.6-inch Convertibles
The AMD-powered 2021 Envy x360 15 is essentially a leaner and faster version of the Spectre x360 15. Owners would be skipping out on a few luxuries like the gold trims, diamond-cut corners, faster SD reader, Thunderbolt support and IR camera, but core characteristics like keyboard tactility, colors, and chassis quality remain strong. For the core home or office user, those missing features might not mean all that much when the system is already so fast and lightweight.
A nice surprise on the 2021 model is its full sRGB touchscreen which comes very well calibrated without any end-user tinkering. Such a feature is uncommon on convertible laptops especially at this price range.
A no-frills convertible laptop with insanely fast processor performance and a well-calibrated full sRGB touchscreen. It's a better deal than the HP Spectre if you don't mind missing out on GeForce GTX graphics or Thunderbolt.
All CPU options for the Spectre x360 15 at the moment are slower than the Ryzen 7 5700U. It's odd to see a mid-range HP model outperform a more expensive flagship model in this scenario, but the GeForce GTX options for the Spectre will significantly outperform our Envy model graphics-wise. If you're just a light editor and gamer, then the Envy may be the more balanced option.
Price and availability
Out configuration is available directly from HP starting at $999 USD. Newegg and Walmart also have the new model in stock for slightly more.
HP Envy x360 15-eu0097nr
- 05/26/2021 v7 (old)
Allen Ngo
Price comparison
