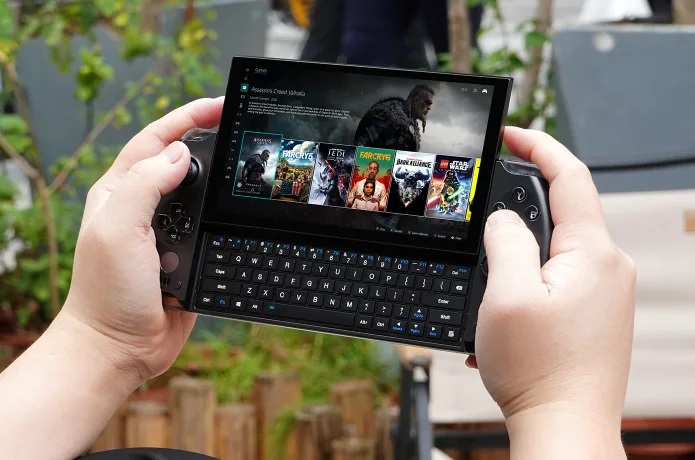
GPD Win 4 handheld PC review: 1080p Ryzen 7 gaming in the palm of your hand
The 2023 GPD Win 4 handheld Windows PC is the direct successor to the 2021 Win 3. Aside from the processor swap from 11th gen Intel to the more powerful AMD Zen 3+, its design has also been fully revamped from the ground up to be an overall stronger machine as our review will show.
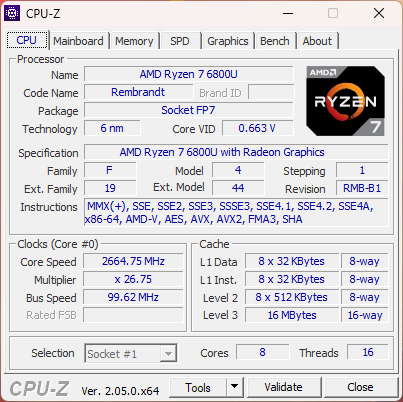
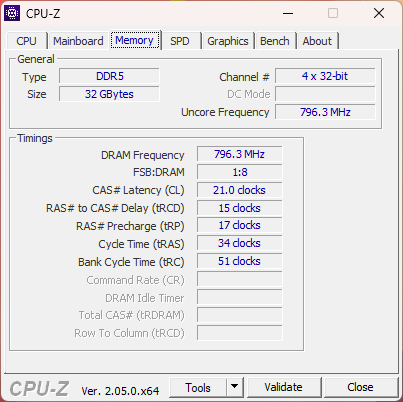
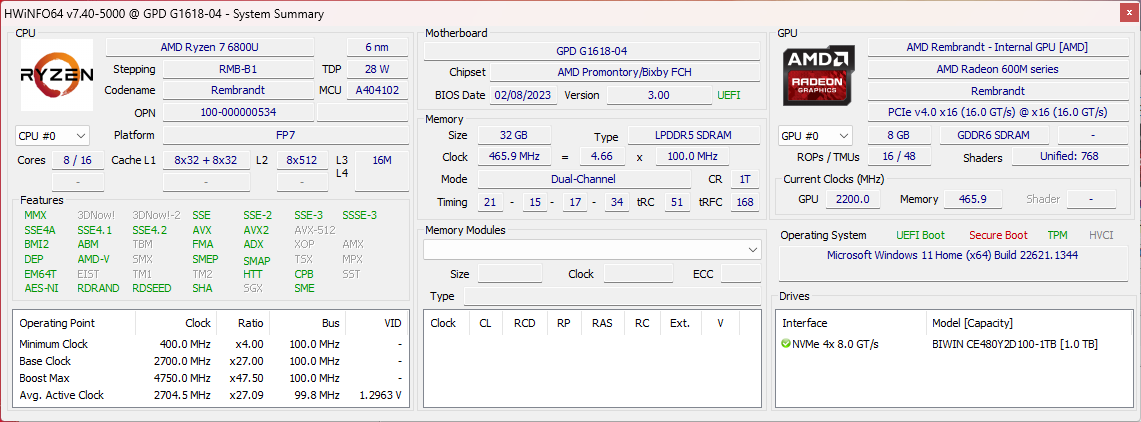
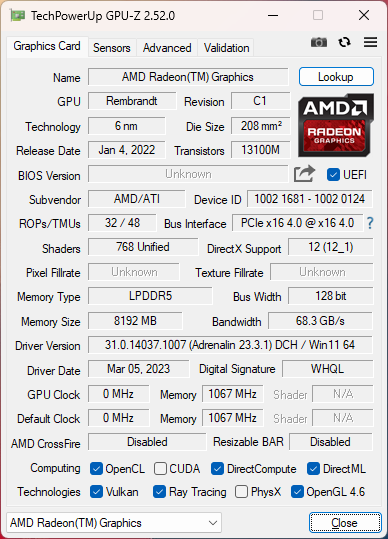
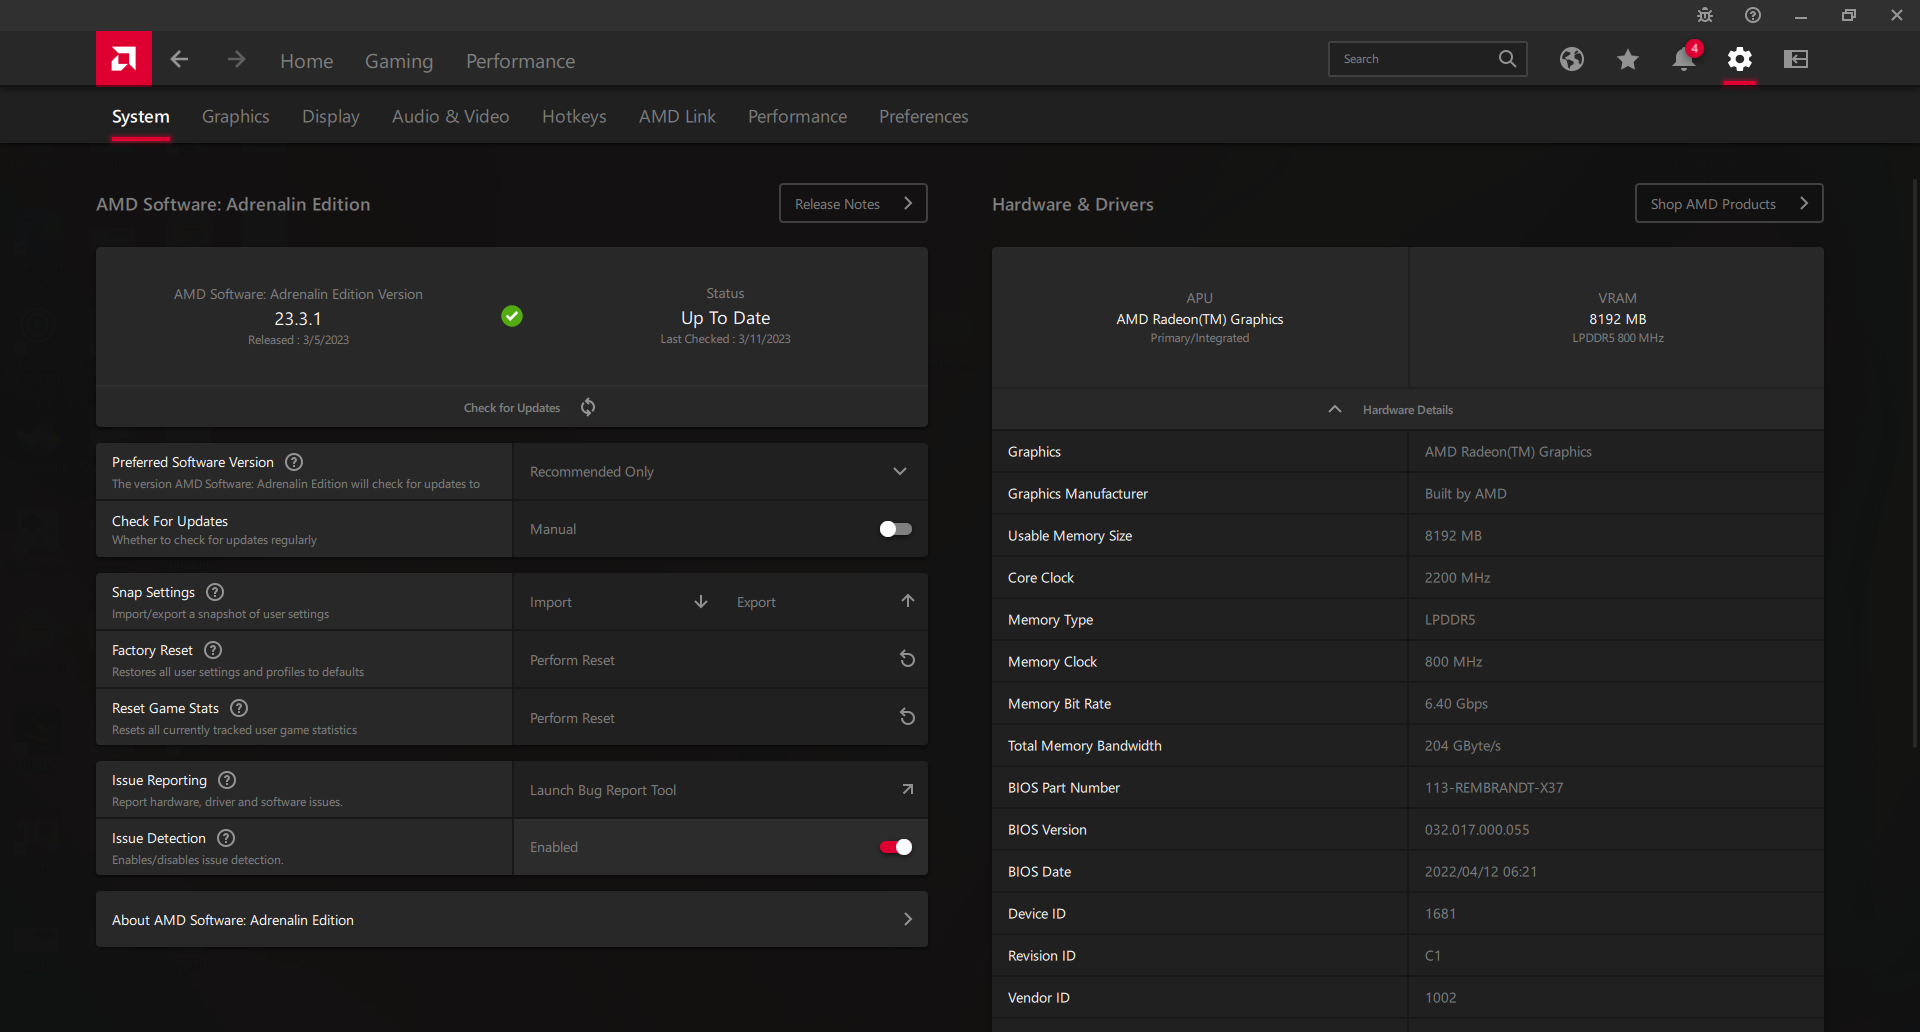
The Win 4 utilizes the same Ryzen 7 6800U processor as found on flagship Ultrabooks like the Asus ZenBook S13. All configurations at the moment differ only in RAM (16 or 32 GB LPDDR5-6400) and SSD capacity (1 or 2 TB) while the AMD processor and 6-inch 1080p IPS touchscreen remain static. More manufacturer-provided information on the Win 4 can be found on its Indiegogo page.
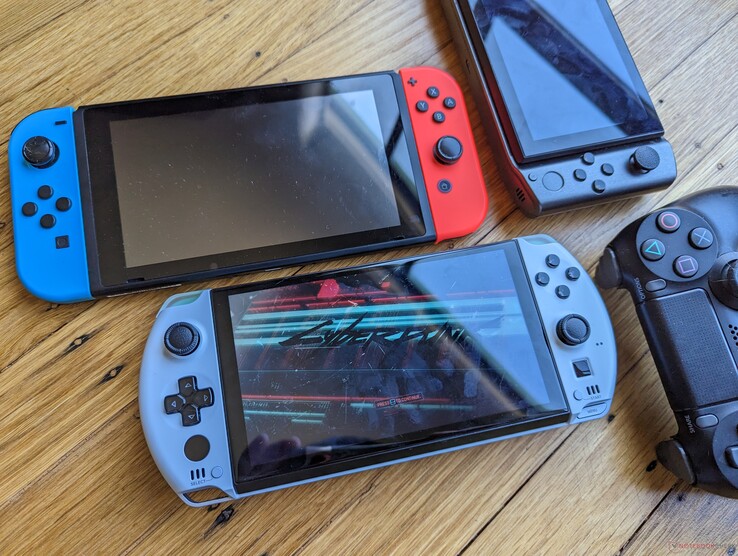
Competitors include the Steam Deck, Nintendo Switch, and the OneXPlayer. Our comparisons below include U-series-powered subnotebooks as well.
More GPD reviews:
Potential Competitors in Comparison
Rating | Date | Model | Weight | Height | Size | Resolution | Price |
|---|---|---|---|---|---|---|---|
| 80.3 % v7 (old) | 03 / 2023 | GPD Win 4 R7 6800U, Radeon 680M | 607 g | 28 mm | 6.00" | 1920x1080 | |
| 84.5 % v7 (old) | 07 / 2022 | GPD Win Max 2 i7-1260P, Iris Xe G7 96EUs | 1 kg | 23 mm | 10.10" | 2560x1600 | |
v (old) | 01 / 2021 | GPD Win 3 i5-1135G7, Iris Xe G7 80EUs | 553 g | 27 mm | 5.50" | 1280x720 | |
| 85.5 % v7 (old) | 10 / 2020 | Razer Blade Stealth i7-1165G7 GTX 1650 Ti Max-Q i7-1165G7, GeForce GTX 1650 Ti Max-Q | 1.4 kg | 15.3 mm | 13.30" | 1920x1080 | |
| 90.1 % v7 (old) | 11 / 2022 | Dell XPS 13 9315 2-in-1 Core i5-1230U i5-1230U, Iris Xe G7 80EUs | 764 g | 7.4 mm | 13.00" | 2880x1920 | |
| 90.1 % v7 (old) | 07 / 2022 | Asus Zenbook S 13 OLED R7 6800U, Radeon 680M | 1.1 kg | 14.9 mm | 13.30" | 2880x1800 |
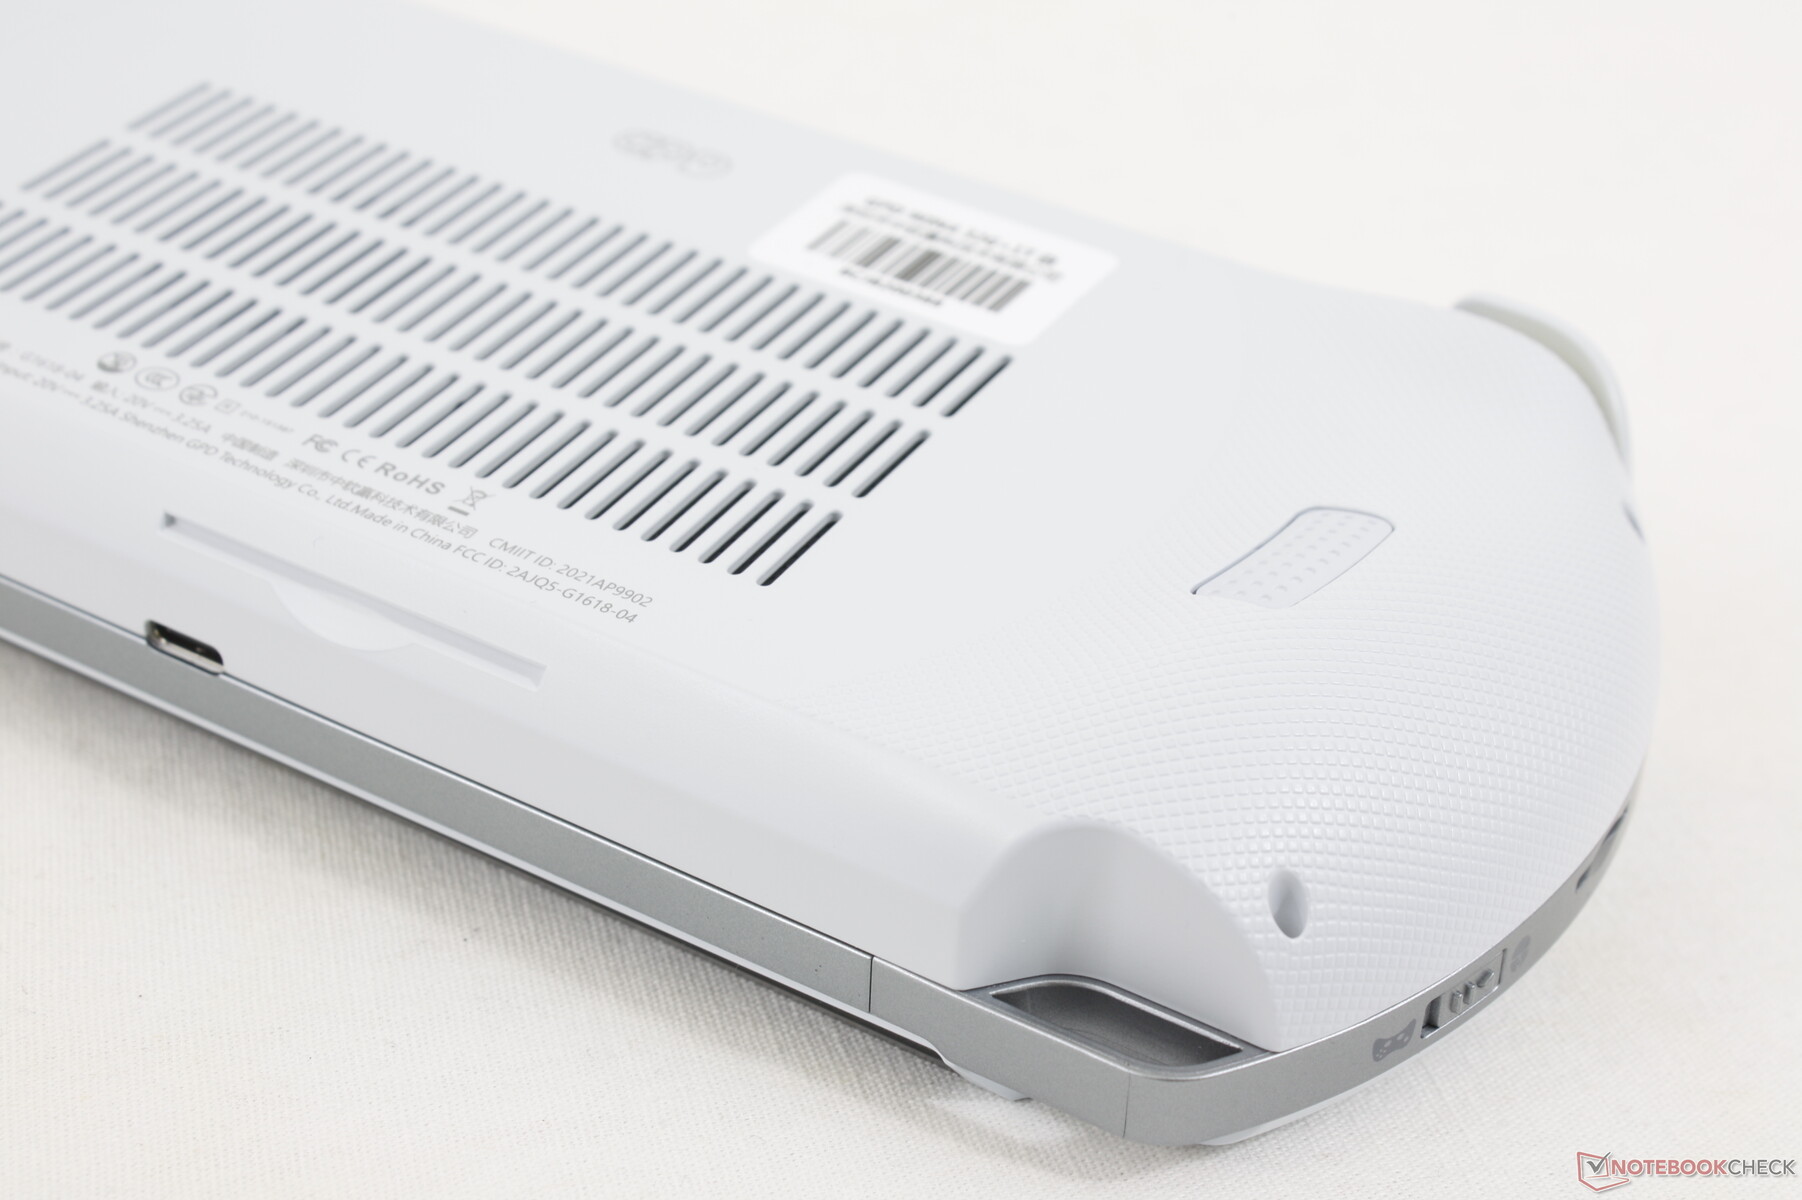
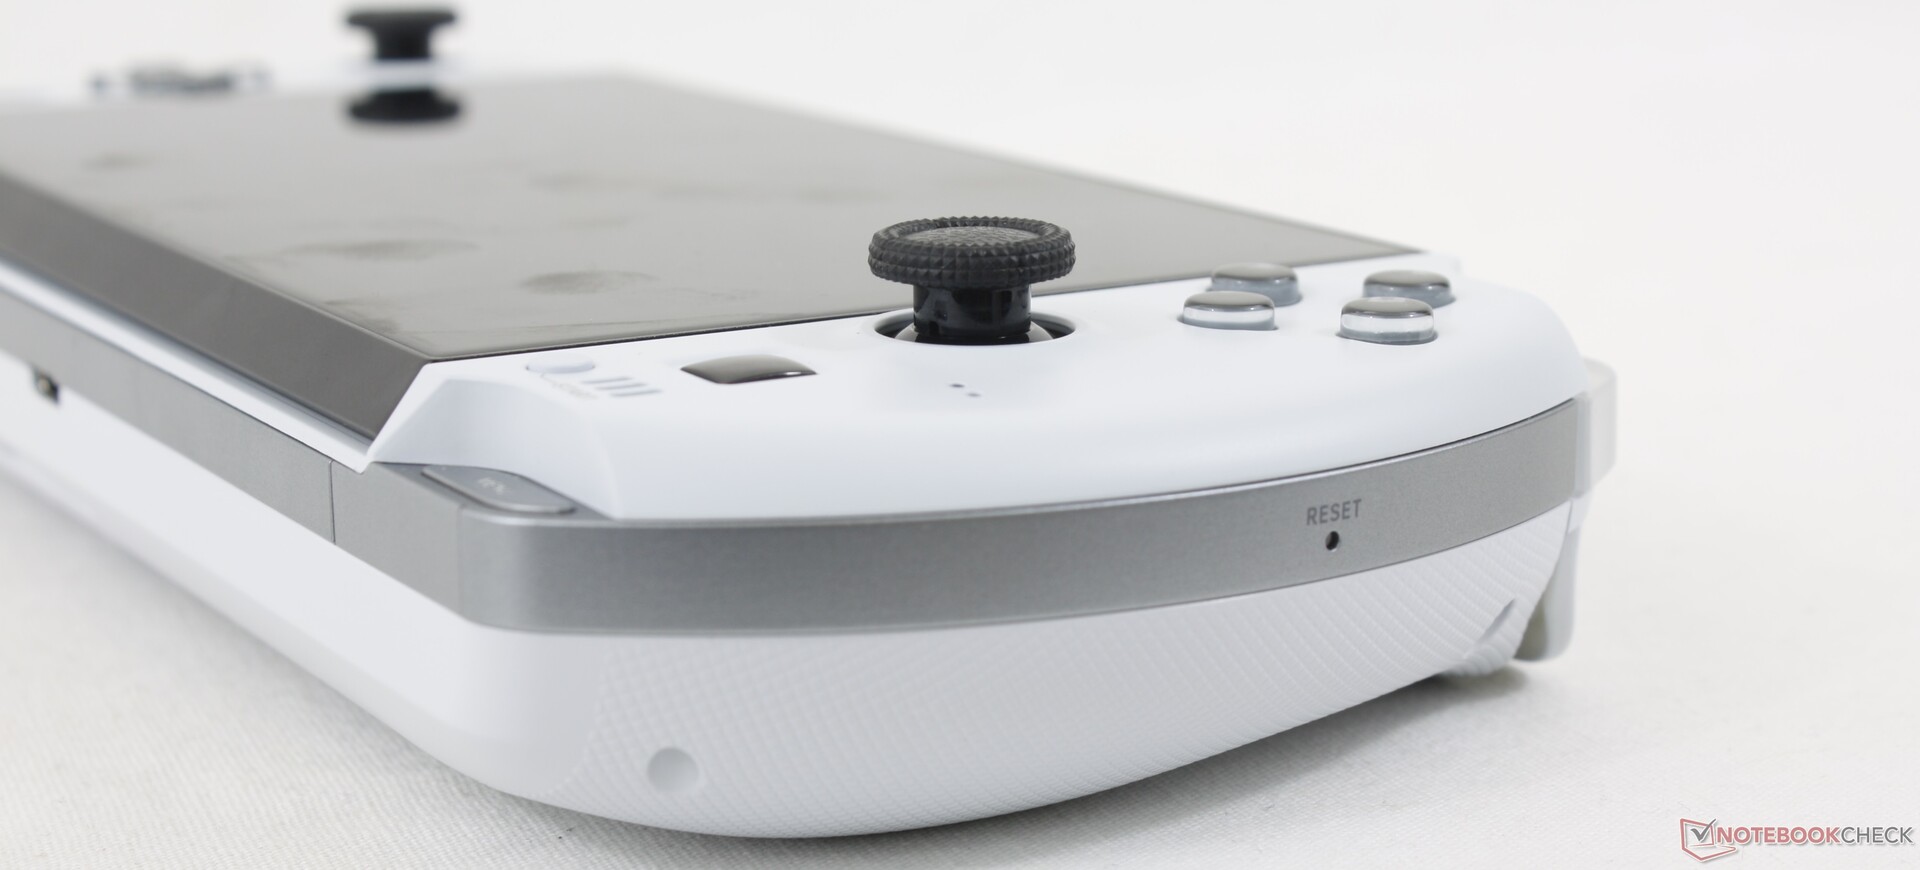
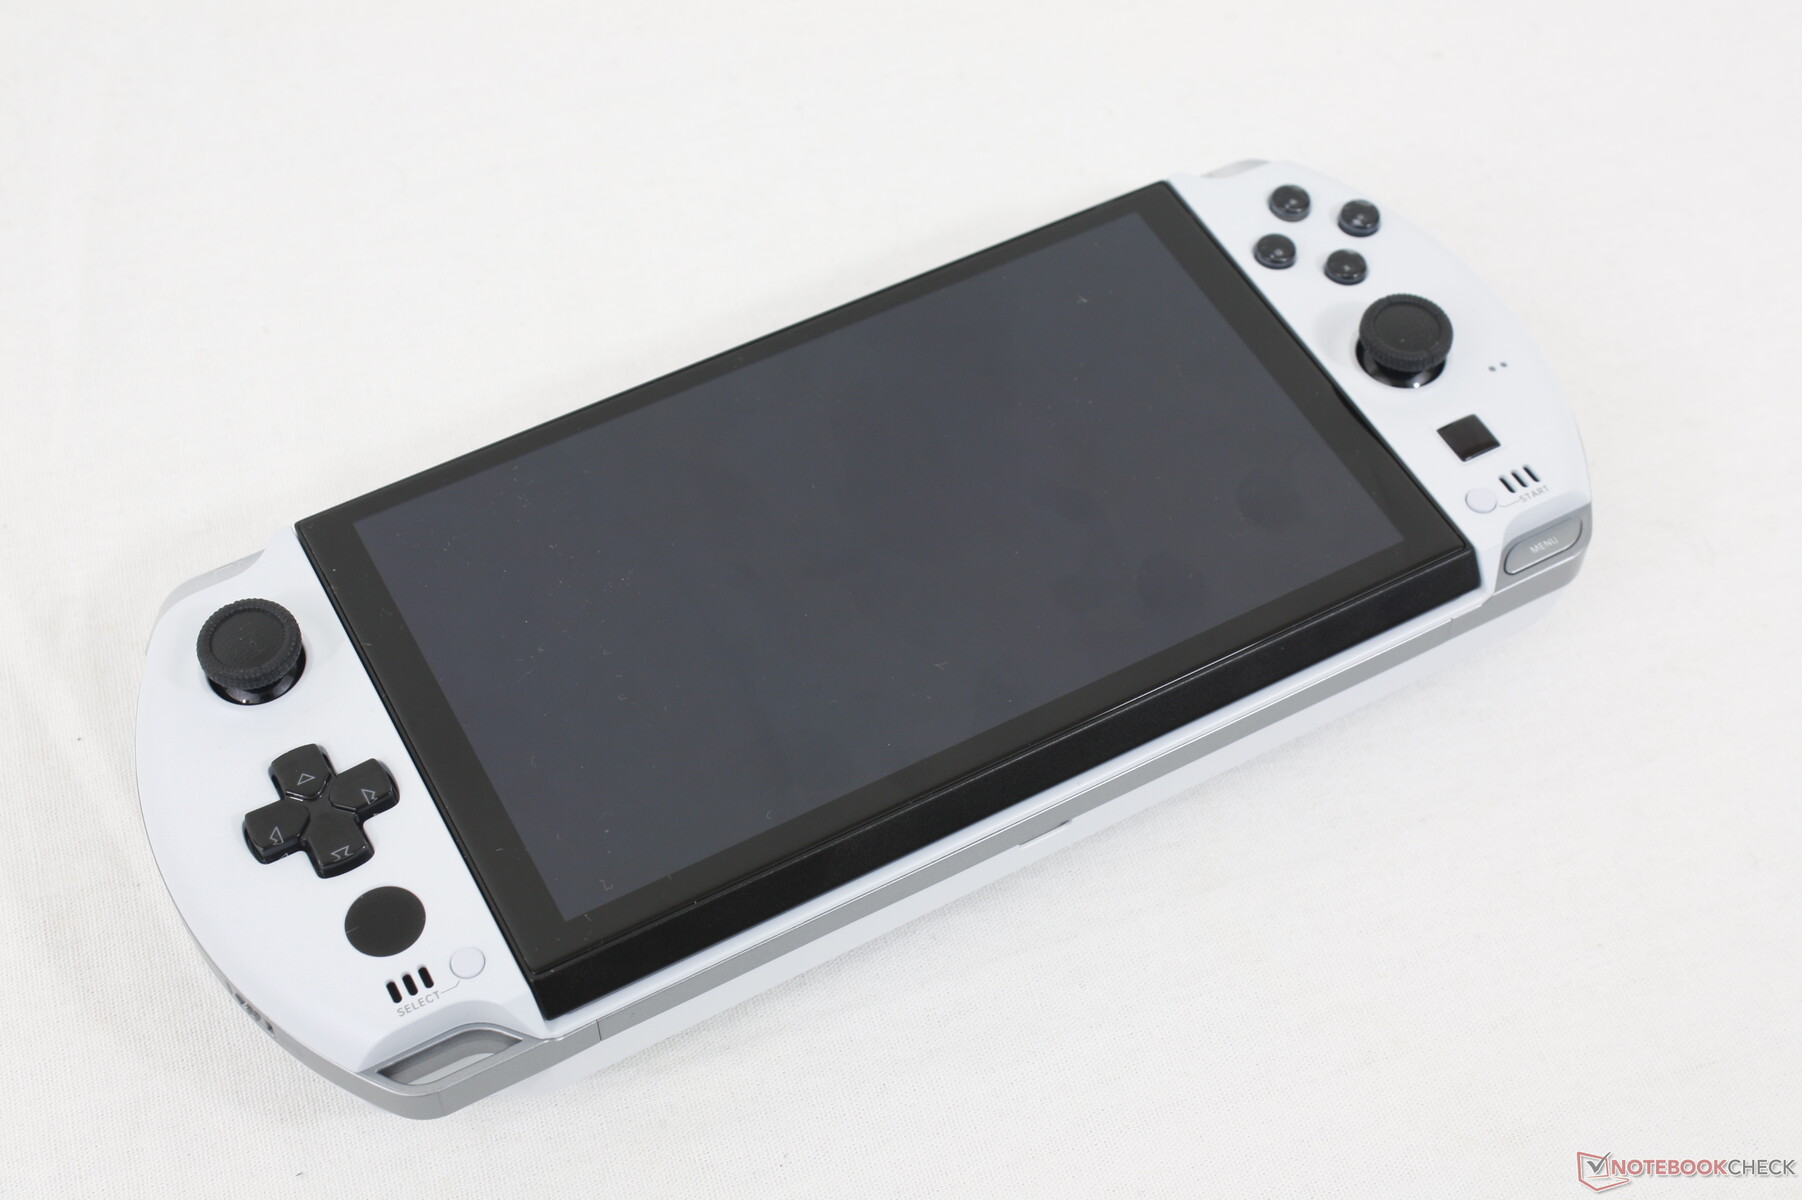
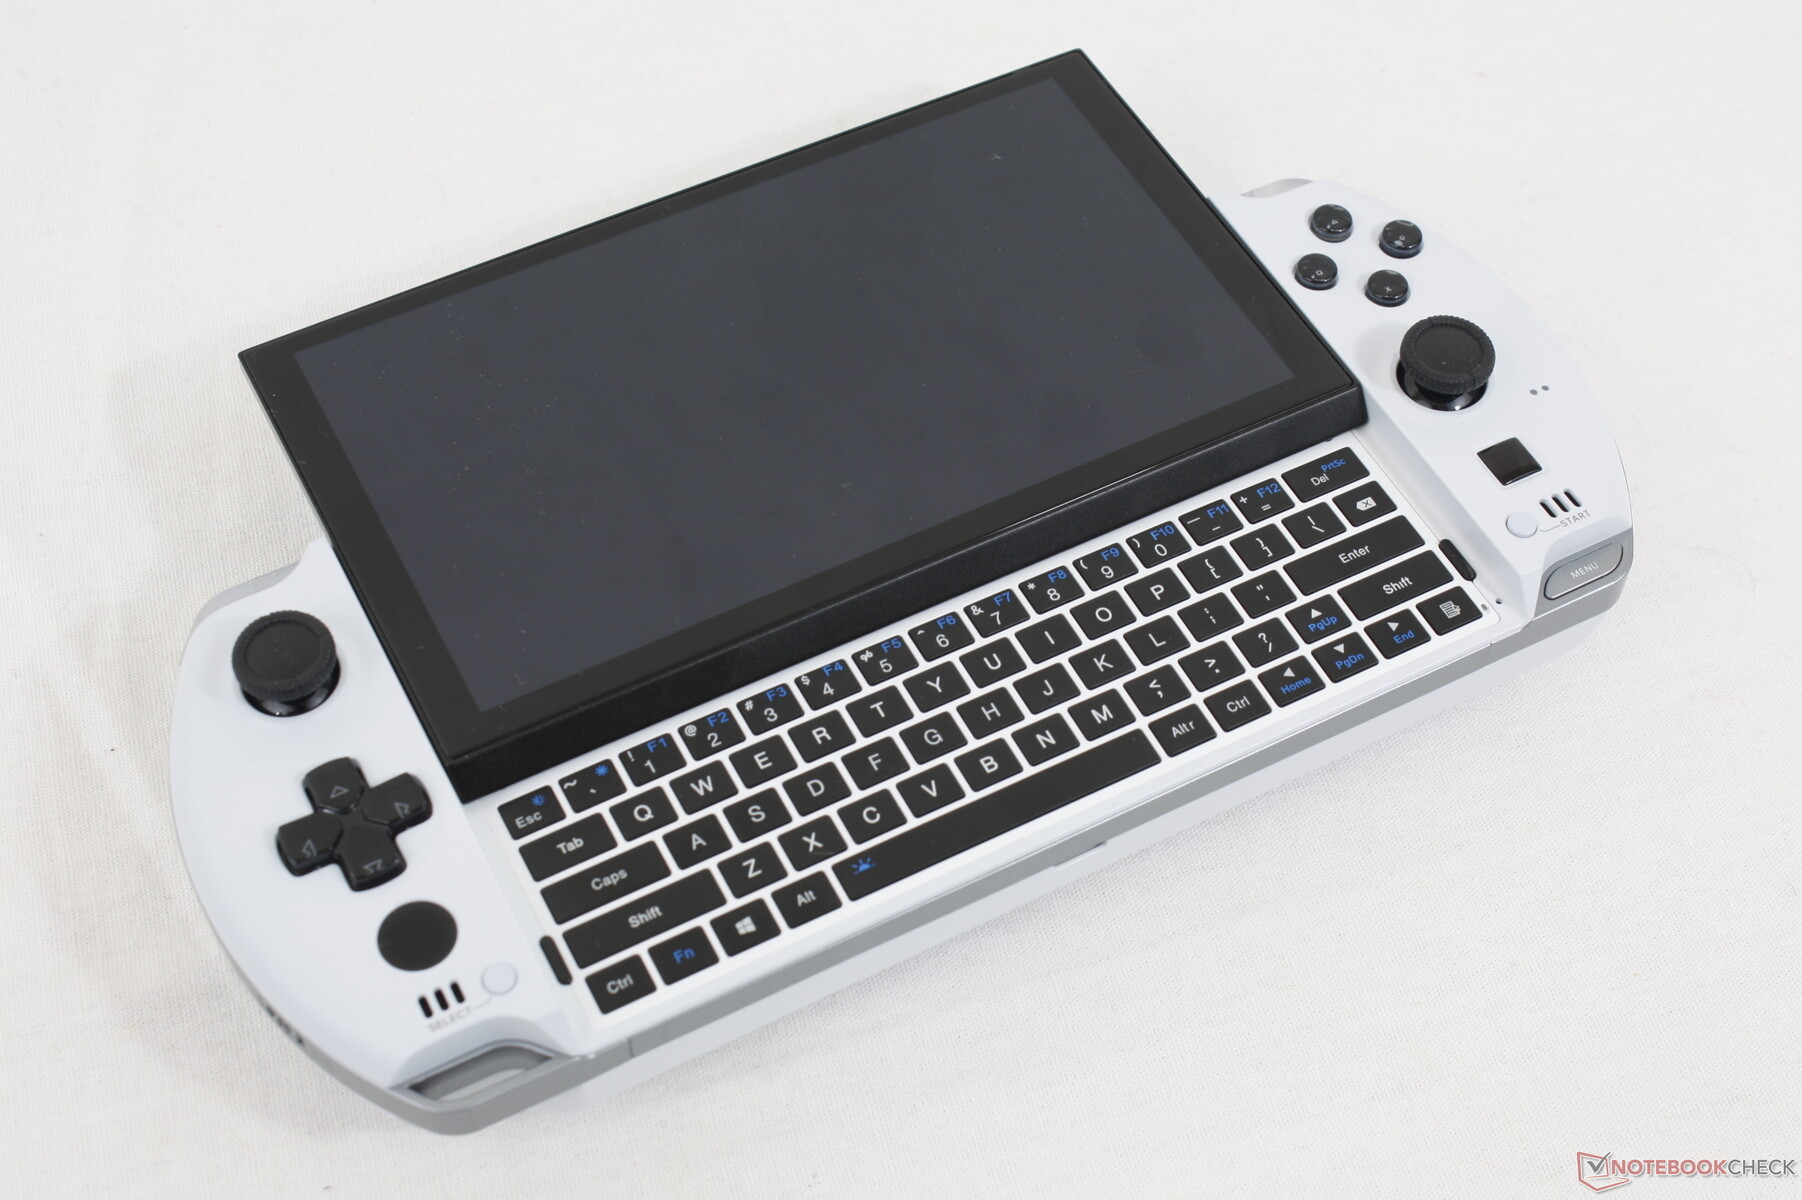
Case — Look Like a Vita, Sting Like a Switch
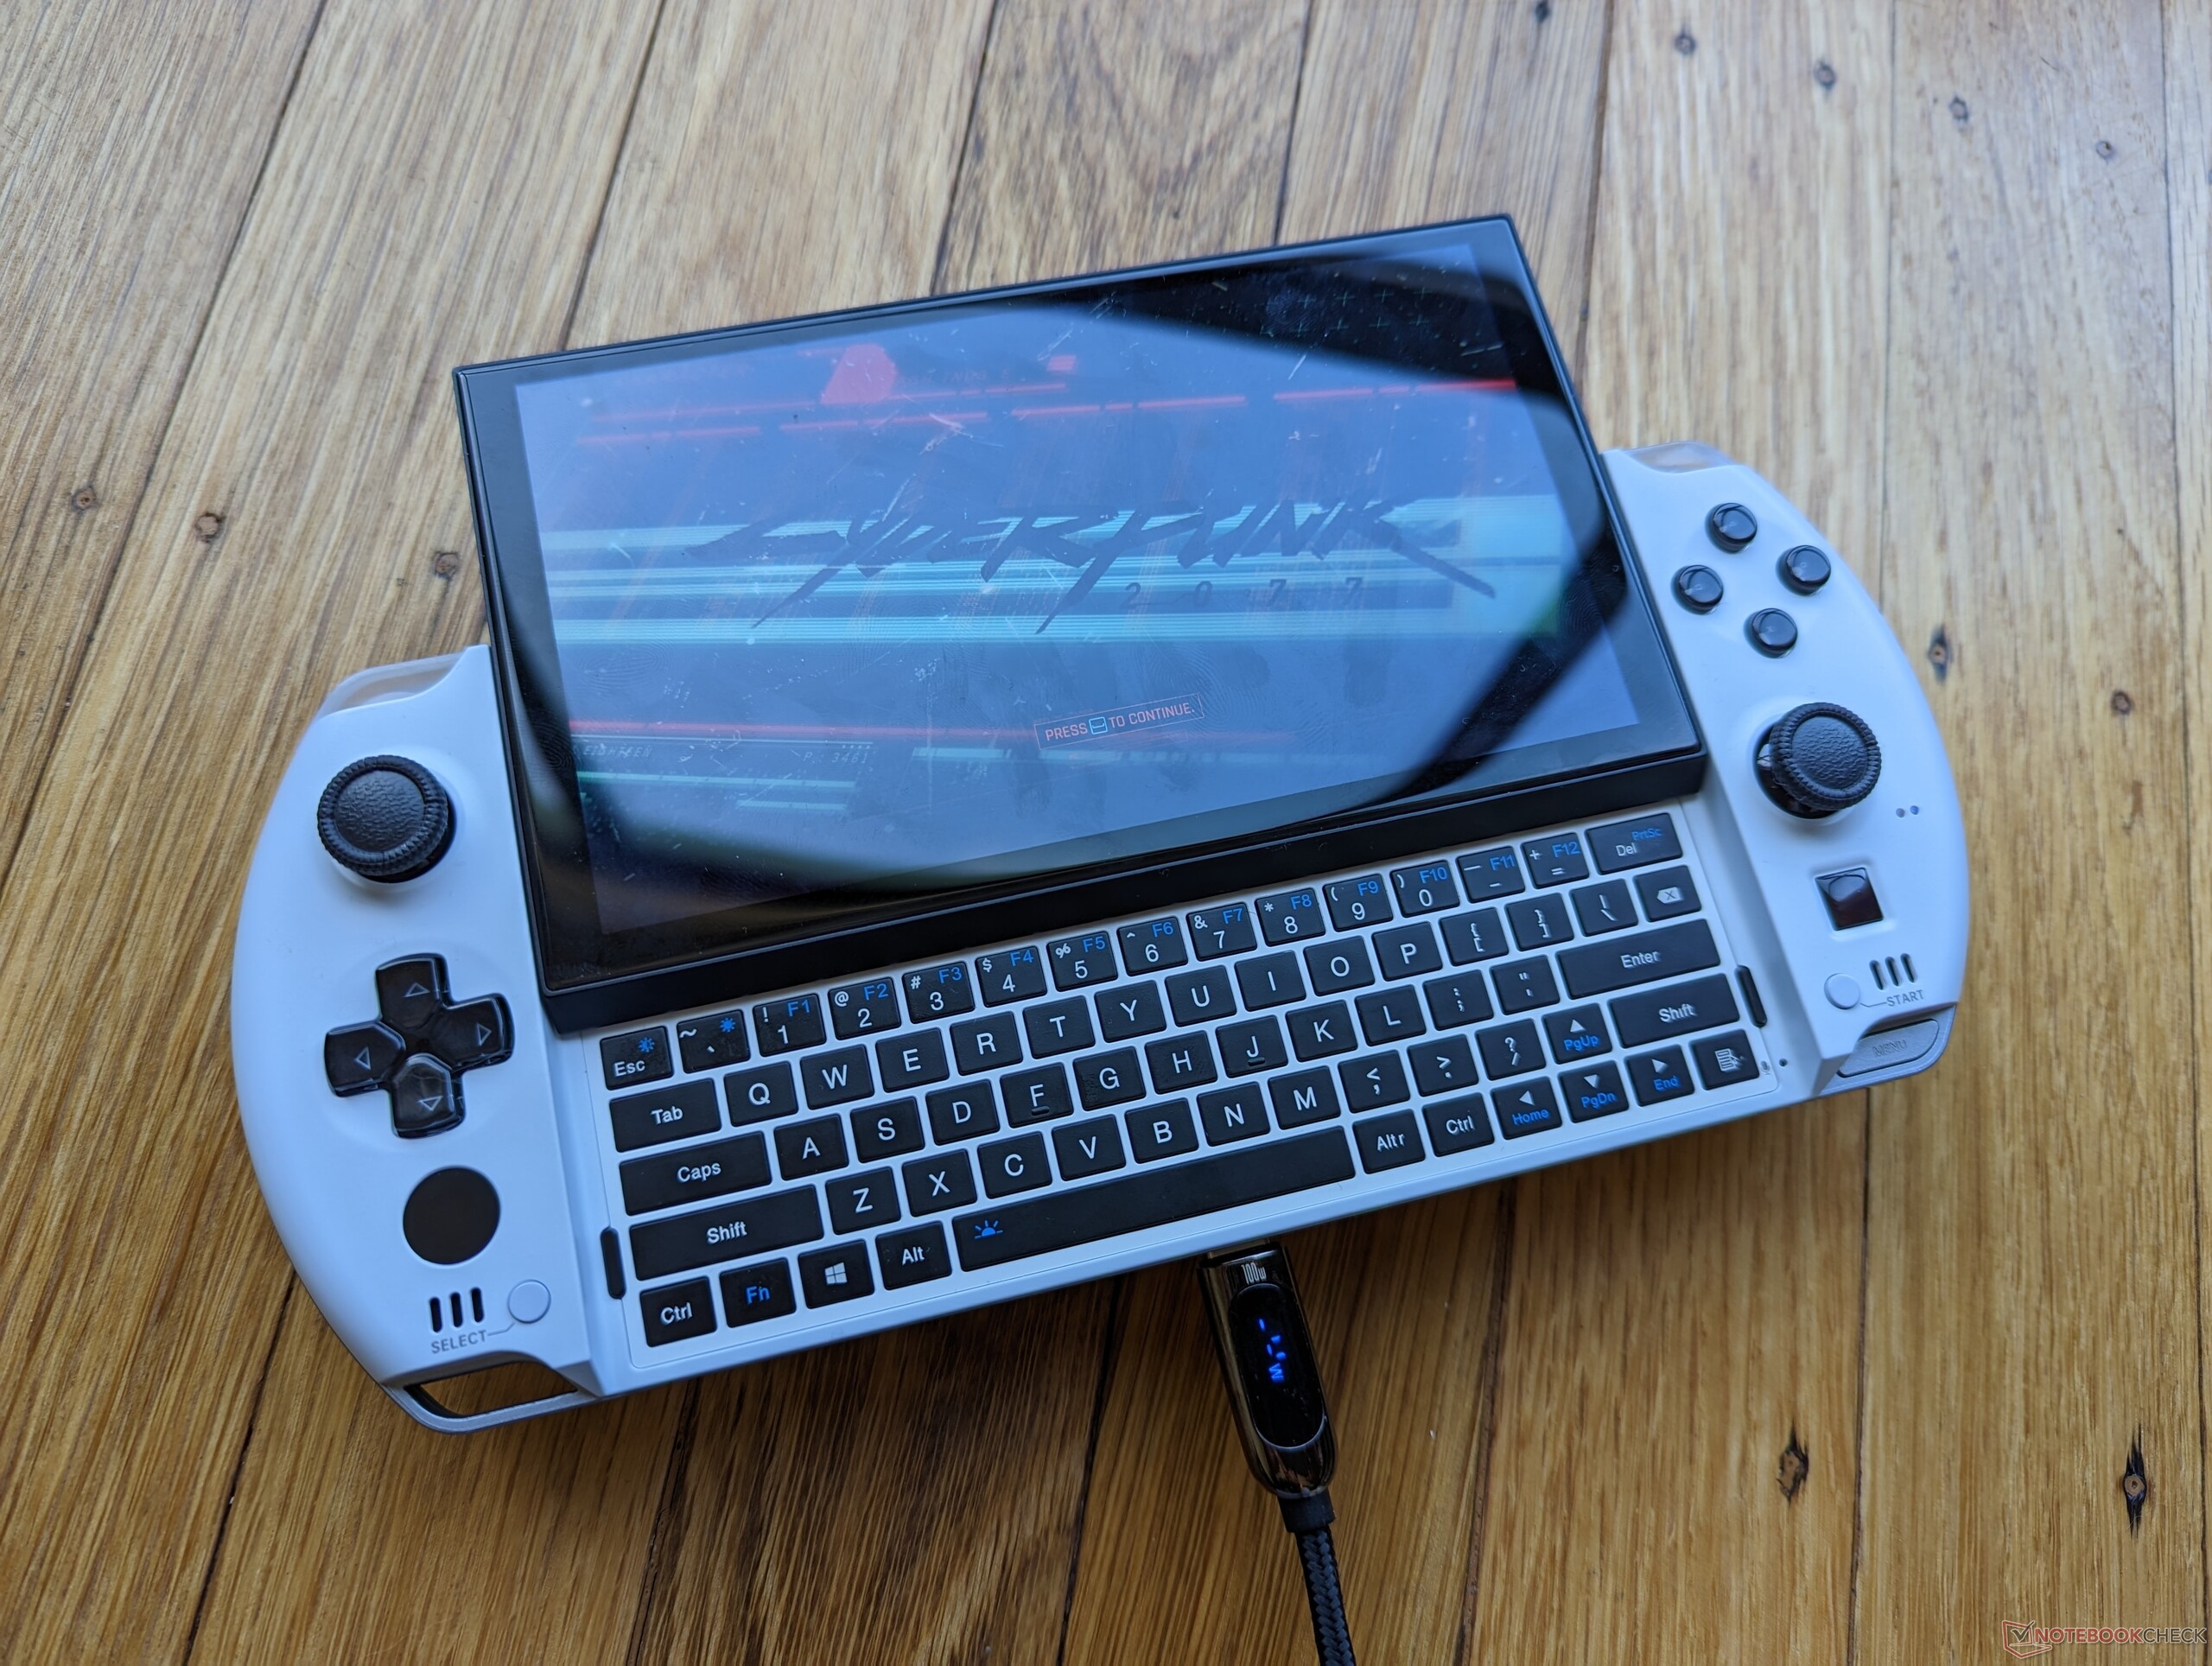
The chassis consists of gray magnesium alloy, ABS plastic in white or black color options, and edge-to-edge Gorilla Glass 5 protection for the touchscreen. The overall design is an evolution of the Win 3 while incorporating features from Sony and Nintendo handhelds. Its shape and gamepad size, for example, are similar to the PSP and Switch, respectively. The end result is a more attractive and gamer-y look than the outgoing Win 3.
Chassis rigidity was good on the Win 3 and it’s now even better on the Win 4. Our unit would exhibit minimal flexing or twisting and no assembly defects or gaps despite all the different materials and moving parts that make up the case. There is some audible creaking when applying pressure on the back, but it is of no major concern. Overall build quality could pass as an official handheld from any of the major game developers.
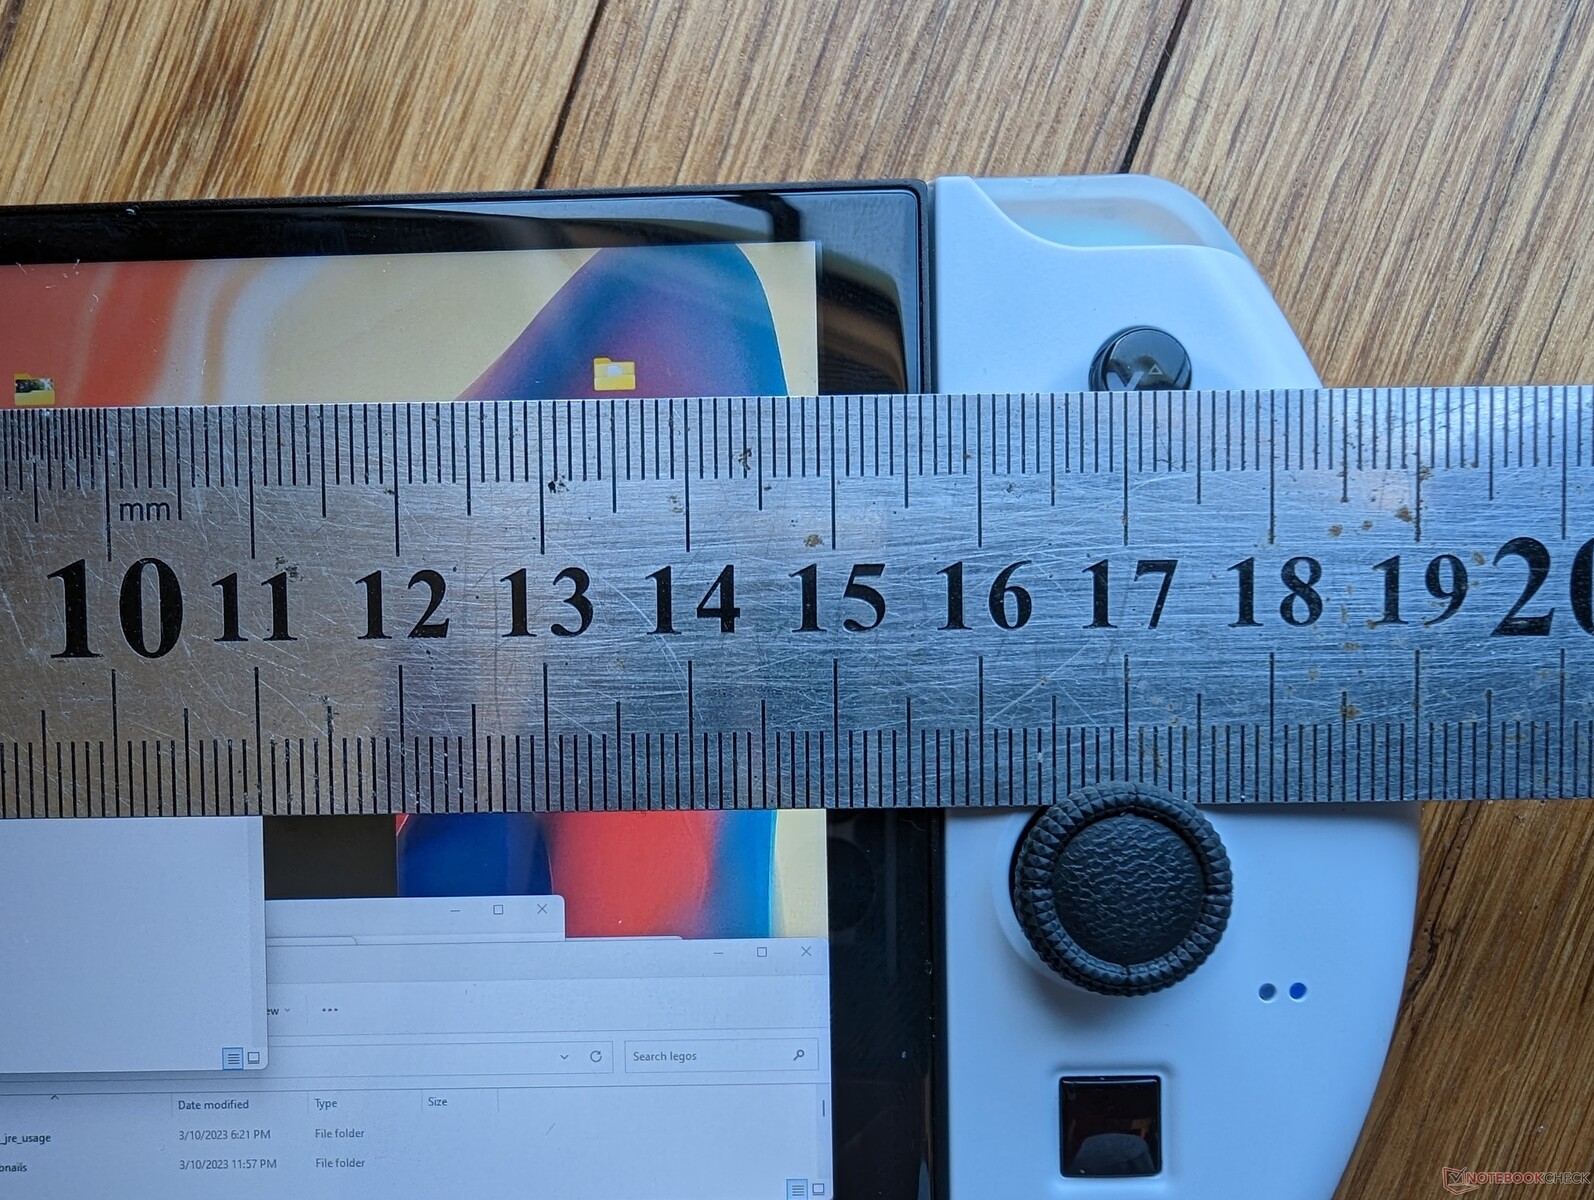
The model is thicker, larger, and heavier than the older Win 3 as shown by our size comparison chart below. In return, users get a larger 6-inch screen, much more powerful hardware, more ports, and a stronger build. This is certainly a handheld more fit for a bag or purse rather than a pants pocket.
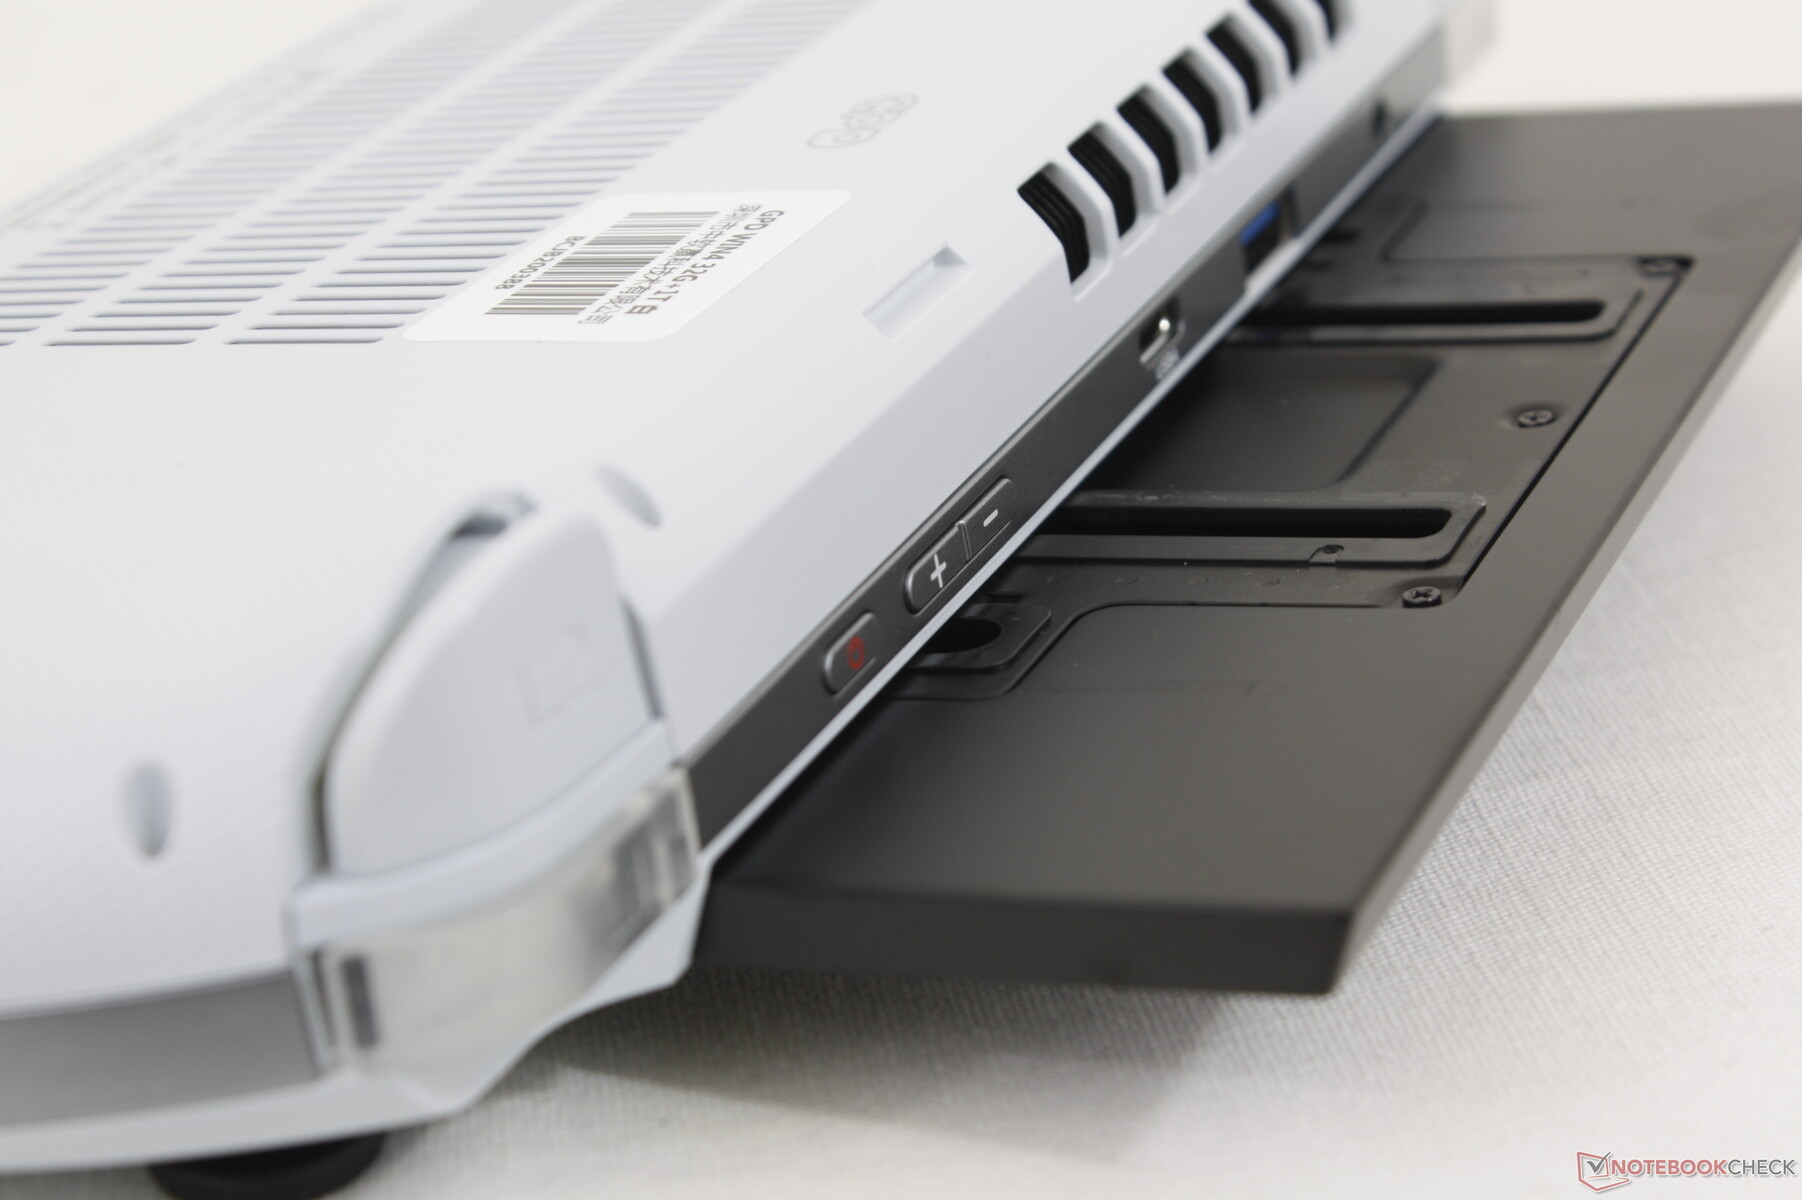
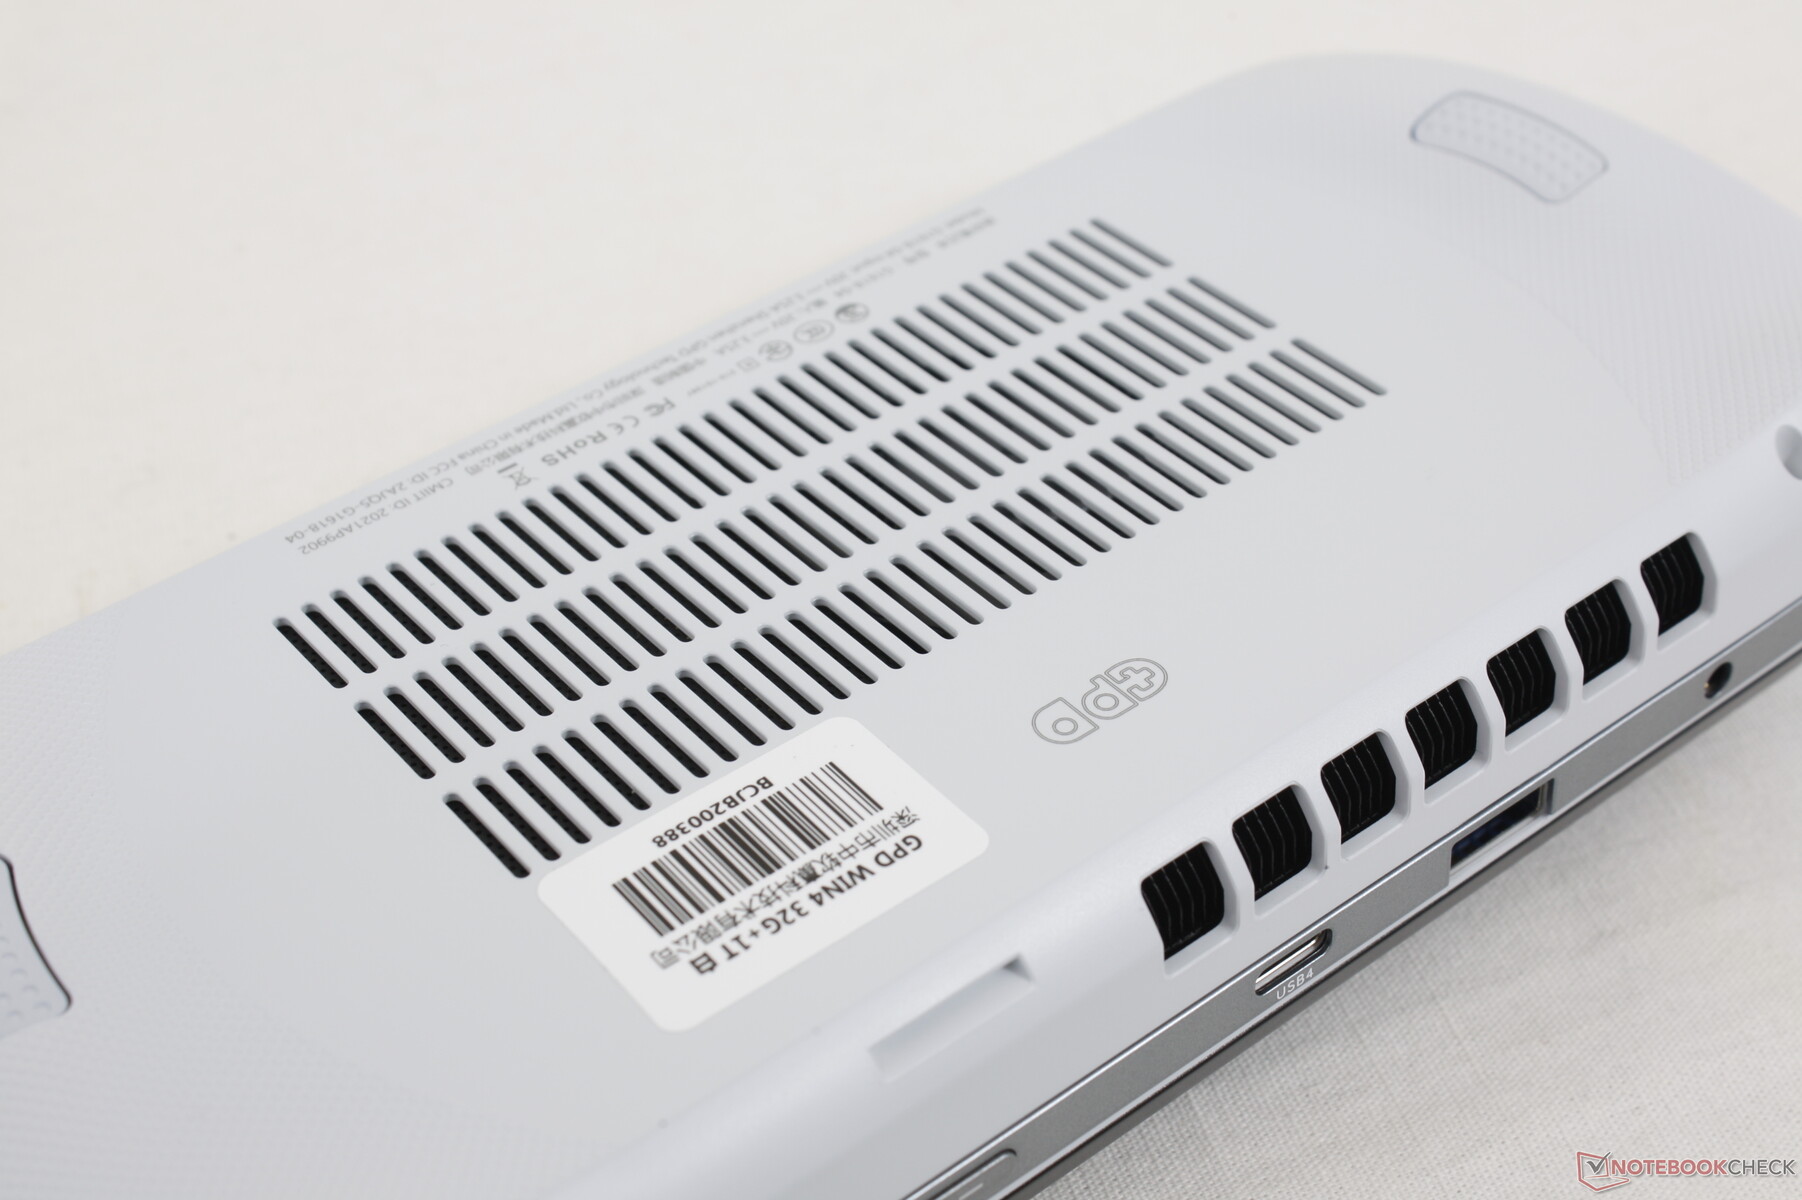
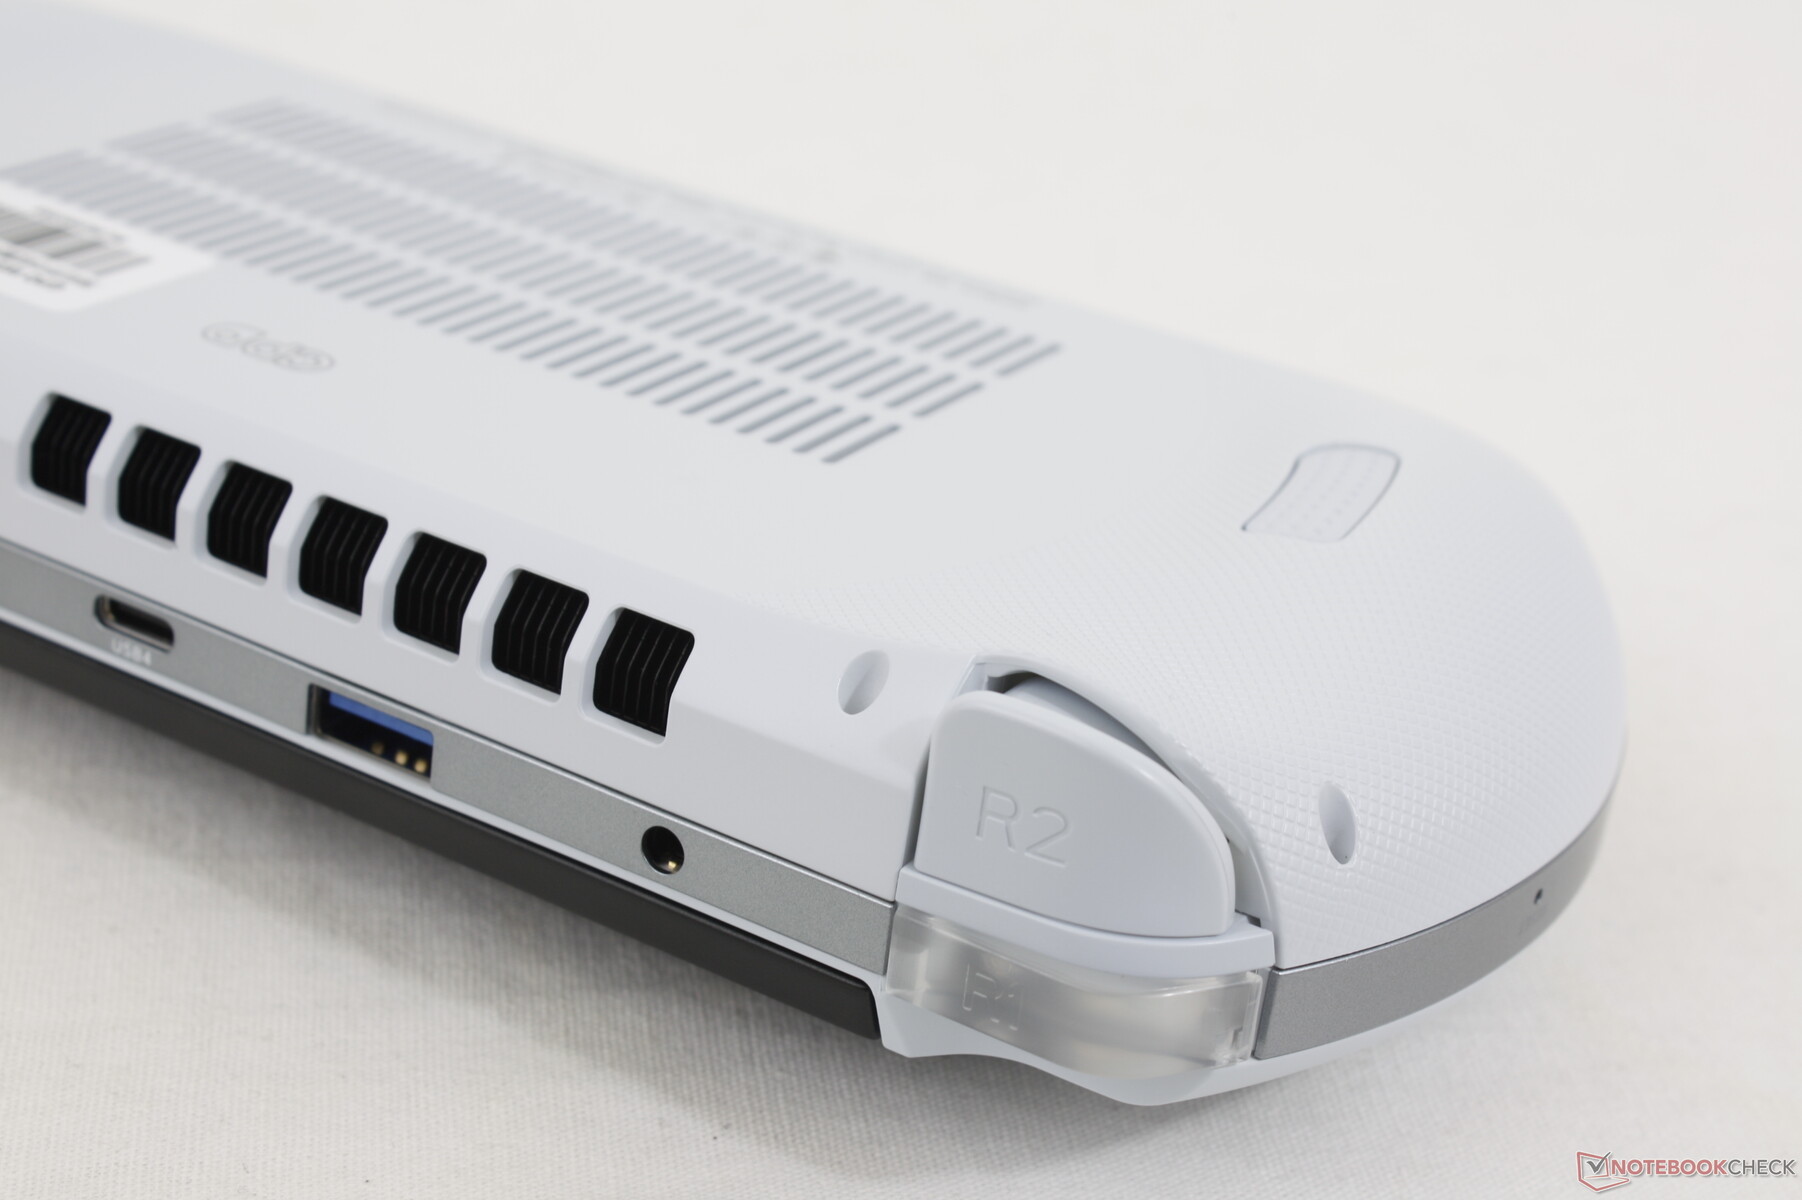
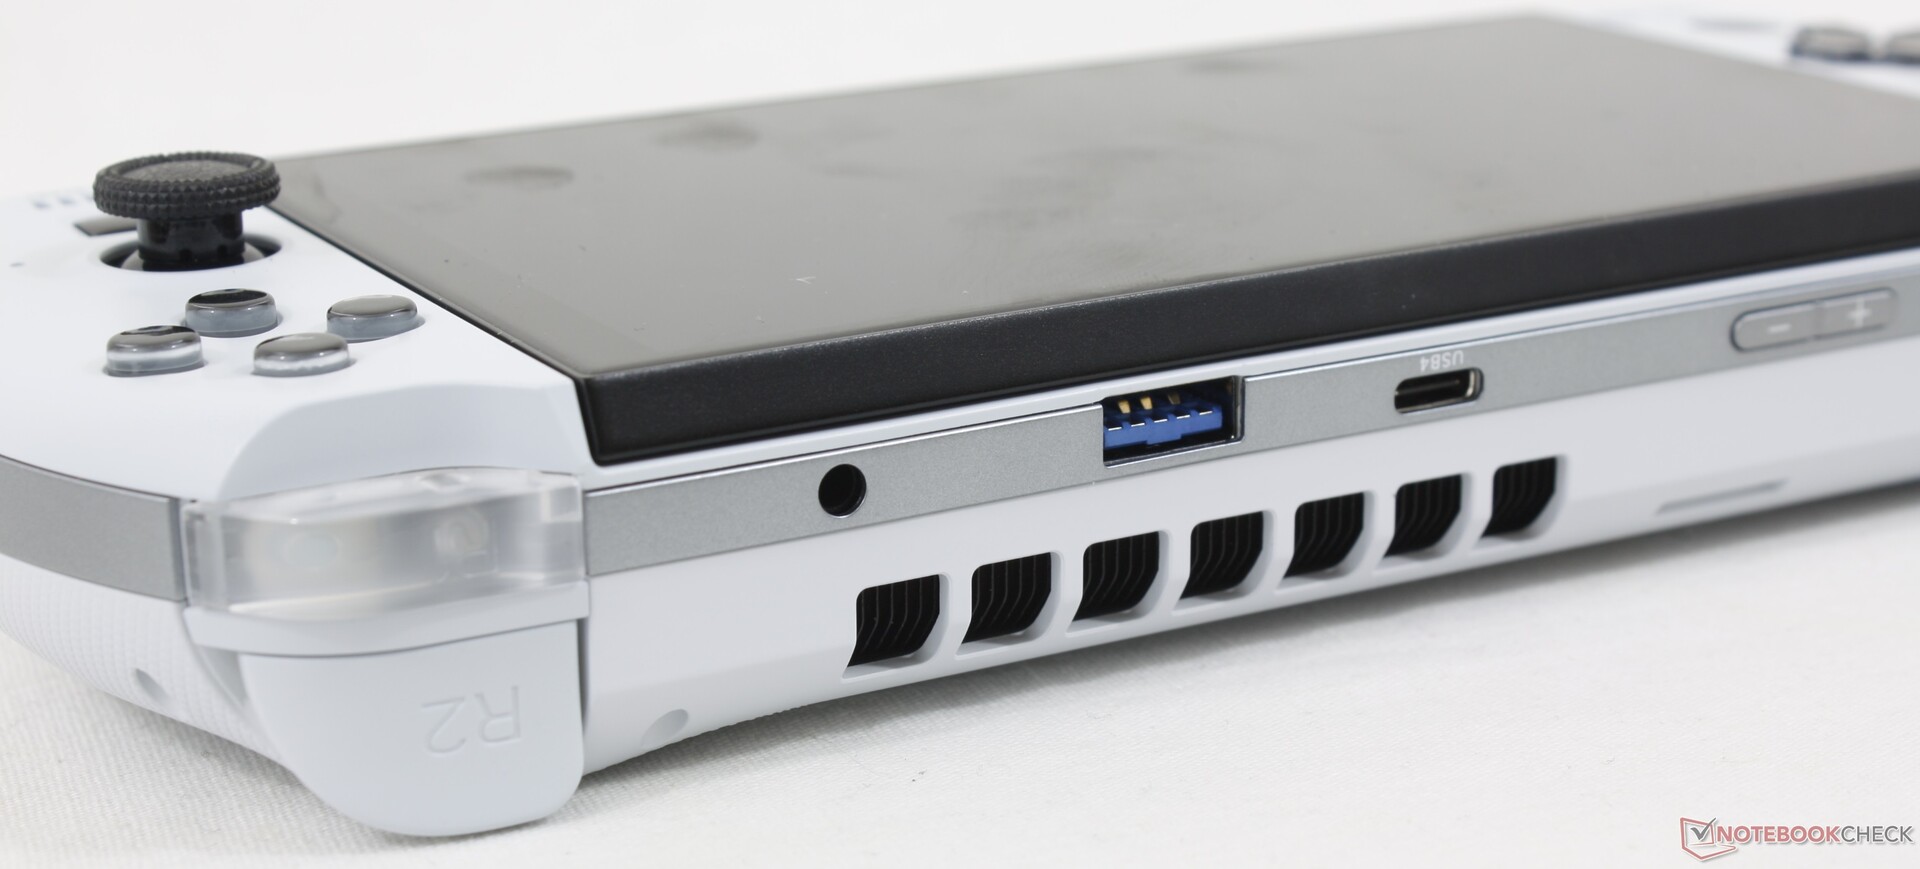
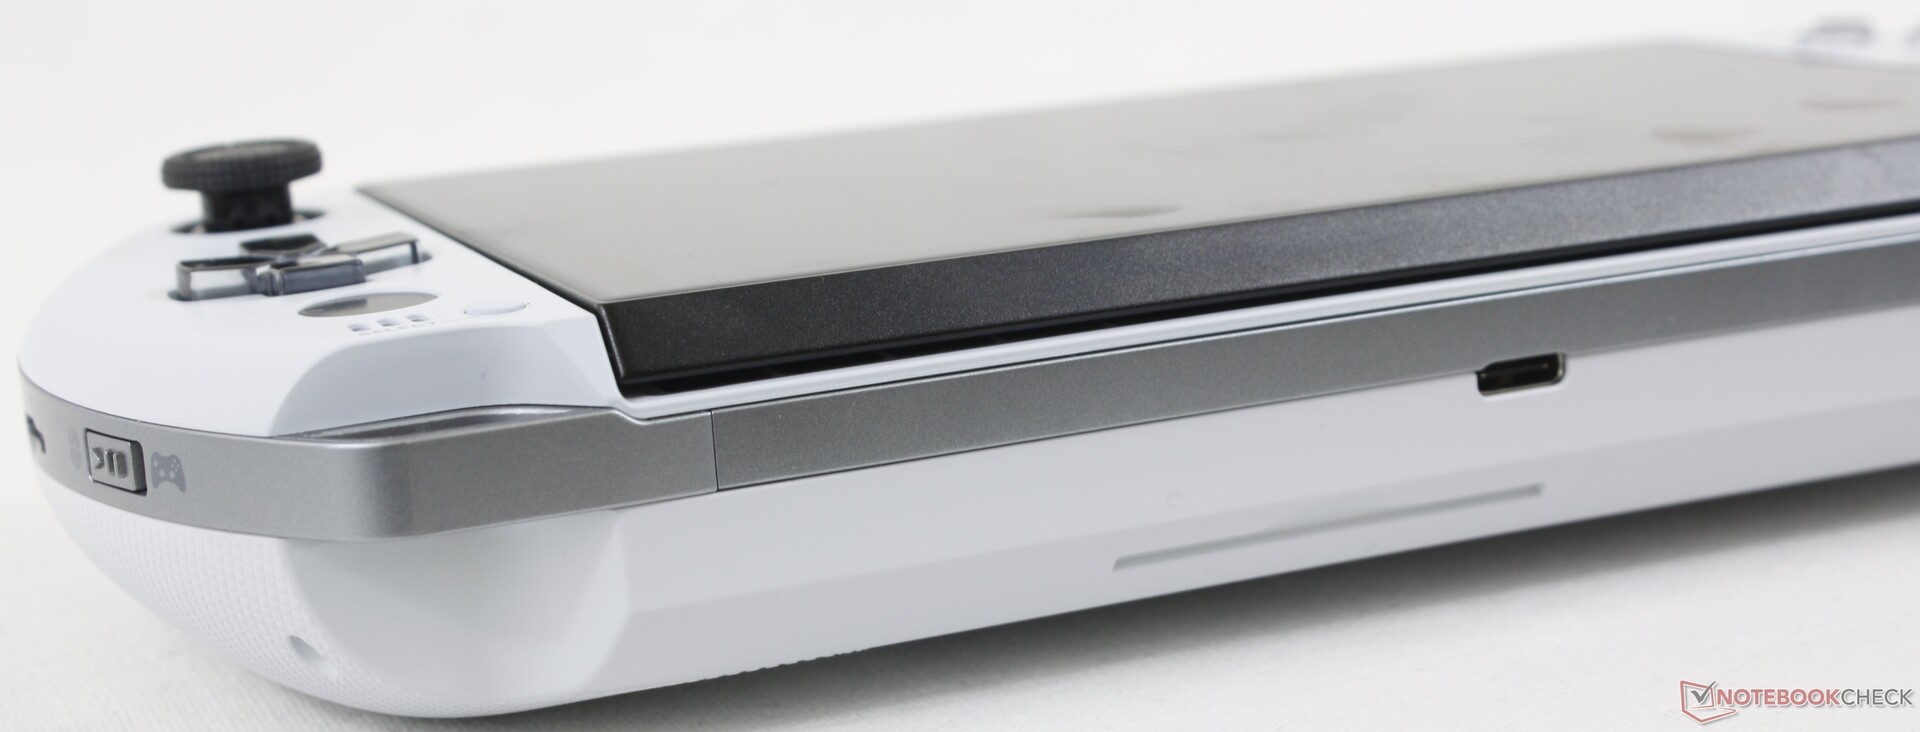
Connectivity — Yes, eGPUs Are Supported!
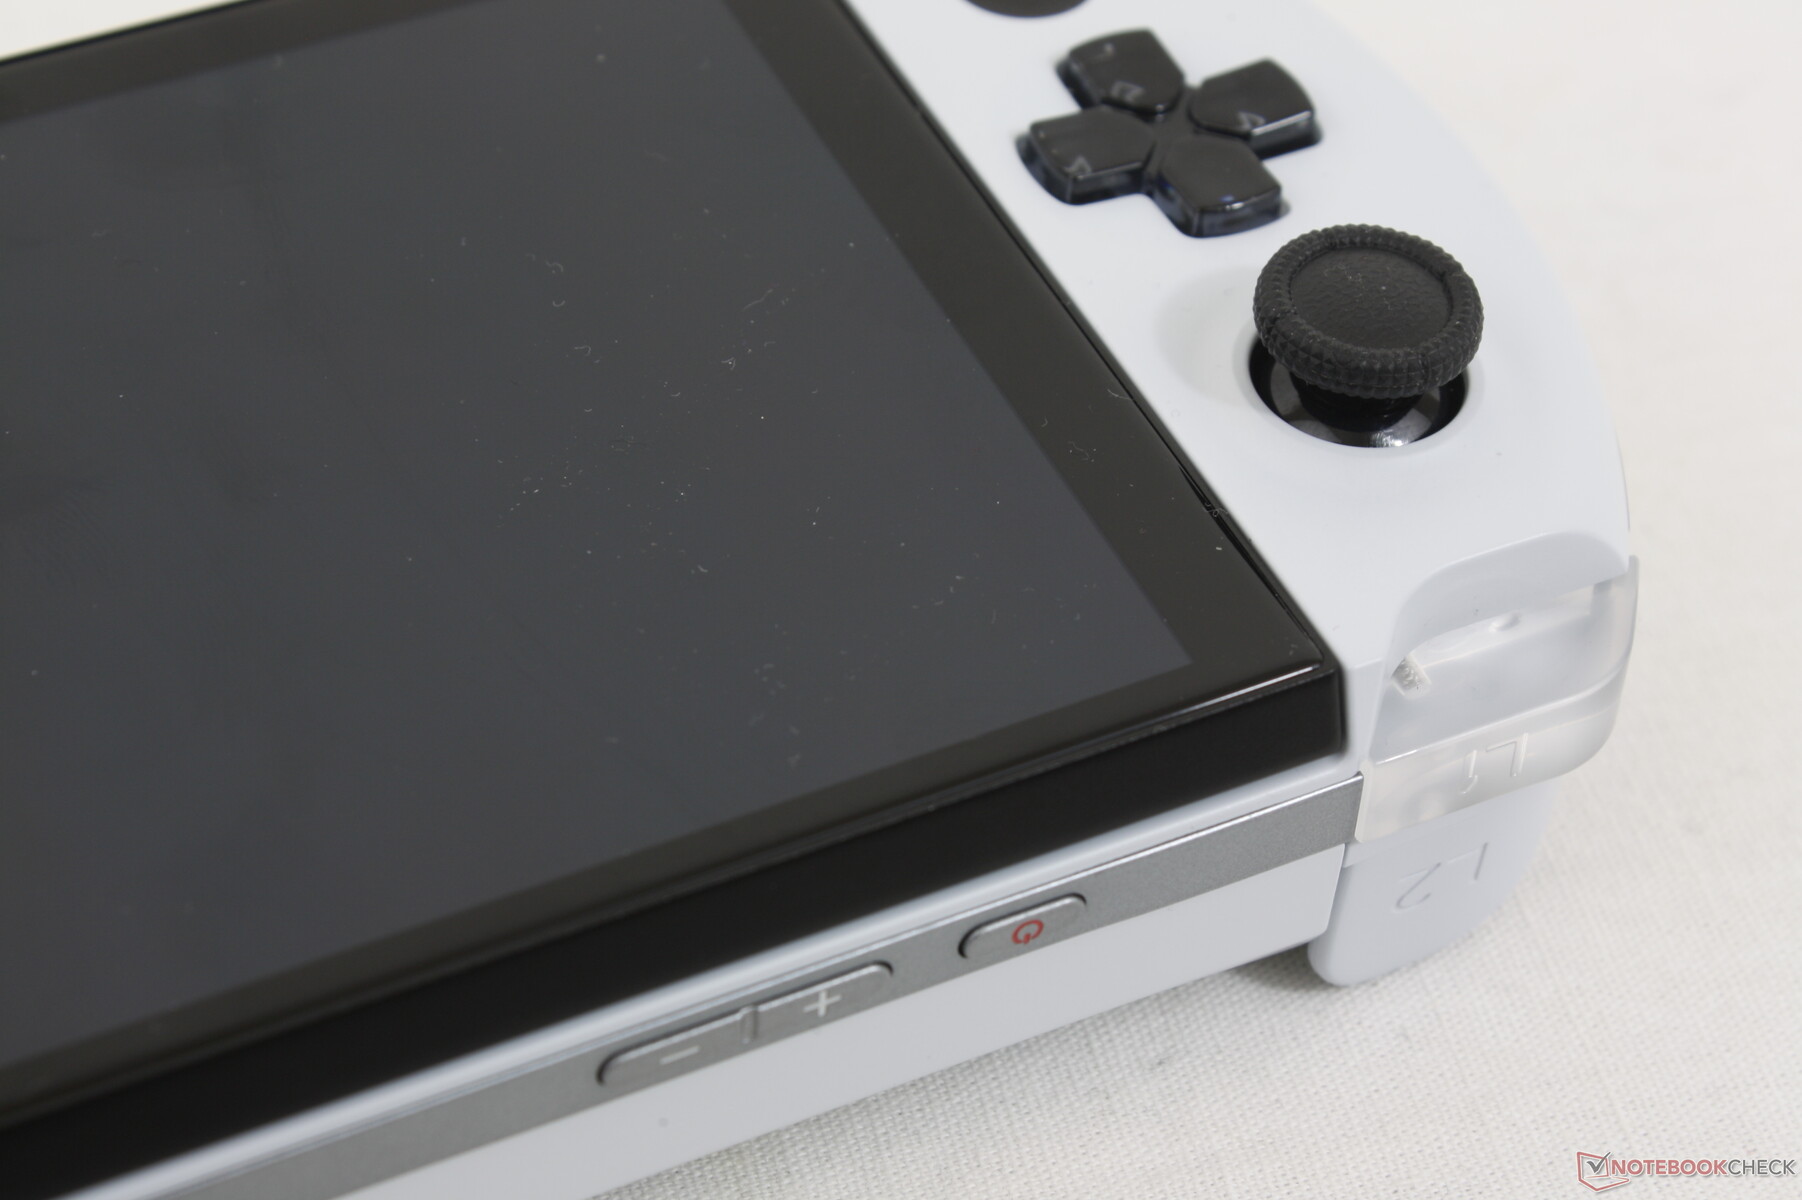
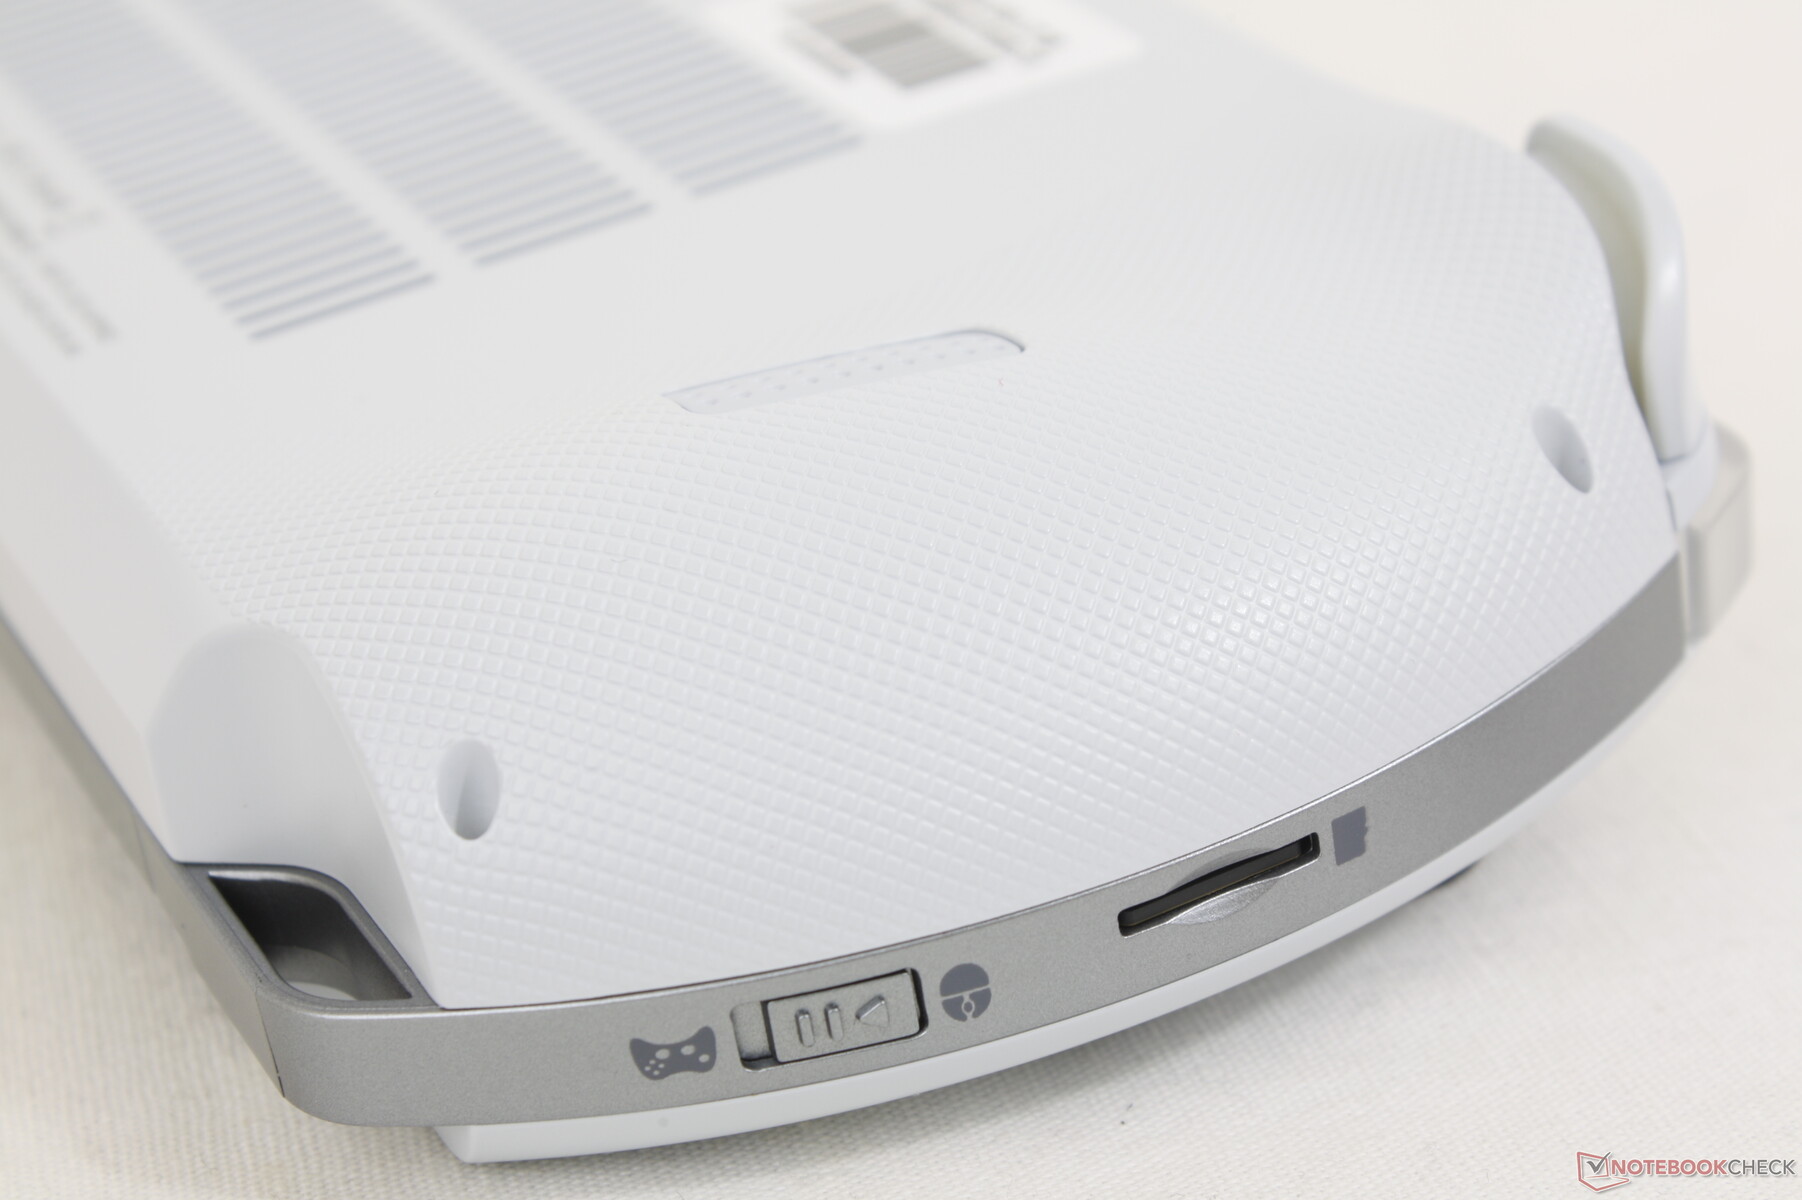
The model integrates two USB-C ports and one USB-A. The top USB-C port supports USB4 meaning the system is compatible with external GPU docking stations. Otherwise, both USB-C ports can be used for charging or connecting to external monitors whereas the Nintendo Switch can only be recharged via its USB-C port on the bottom.
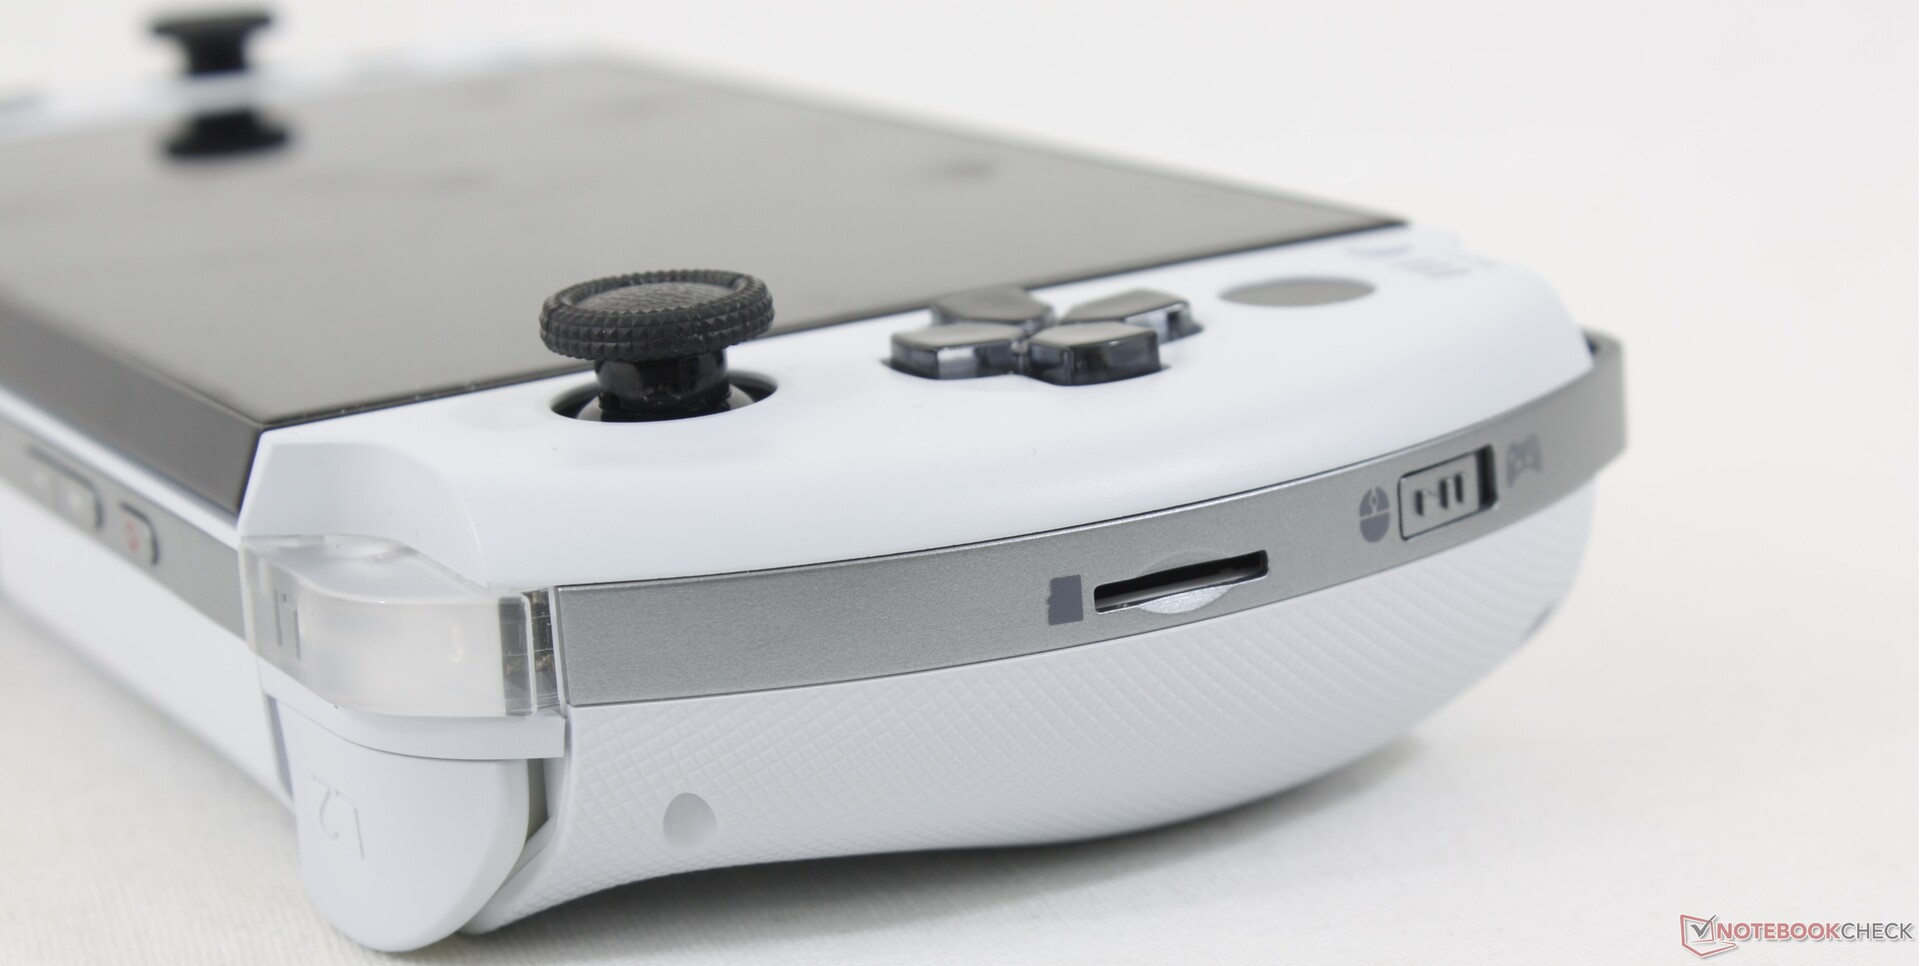
SD Card Reader
The spring-loaded MicroSD reader returns from the Win 3. Performance is decent even though it's half the speed of the MicroSD reader in the Win MAX 2. It is nonetheless handy for transferring games to the Win 4.
| SD Card Reader | |
| average JPG Copy Test (av. of 3 runs) | |
| GPD Win Max 2 (Toshiba Exceria Pro SDXC 64 GB UHS-II) | |
| GPD Win 3 (Toshiba Exceria Pro M501 32 GB UHS-II) | |
| GPD Win 4 (AV Pro SD microSD 128 GB V60) | |
| maximum AS SSD Seq Read Test (1GB) | |
| GPD Win Max 2 (Toshiba Exceria Pro SDXC 64 GB UHS-II) | |
| GPD Win 4 (AV Pro SD microSD 128 GB V60) | |
| GPD Win 3 (Toshiba Exceria Pro M501 32 GB UHS-II) | |
Communication
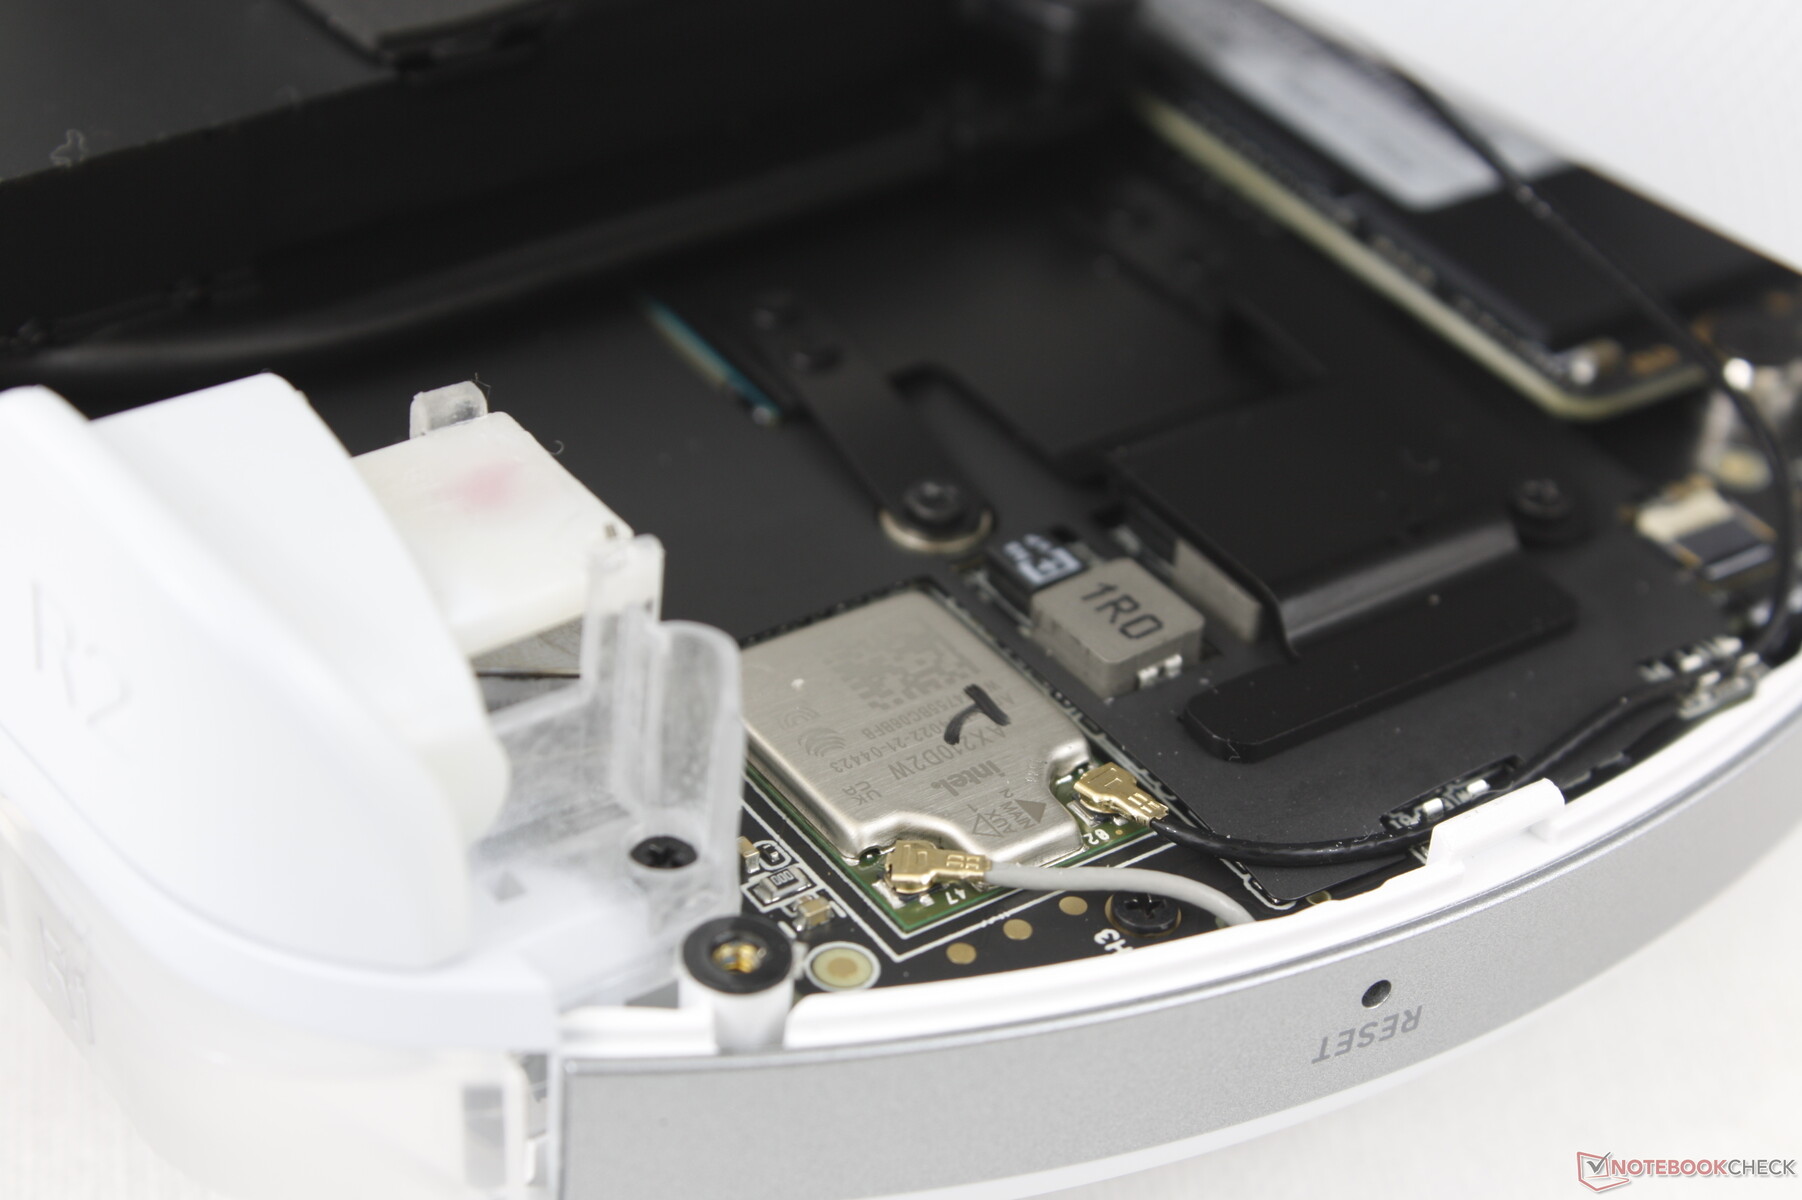
An Intel AX210 comes standard for Wi-Fi 6E compatibility. Wi-Fi 6E is not necessarily always faster than Wi-Fi 6 in terms of real-world transfer rates, but it benefits from reduced latency which can help when streaming games.
| Networking | |
| iperf3 transmit AX12 | |
| GPD Win 3 | |
| Razer Blade Stealth i7-1165G7 GTX 1650 Ti Max-Q | |
| iperf3 receive AX12 | |
| Razer Blade Stealth i7-1165G7 GTX 1650 Ti Max-Q | |
| GPD Win 3 | |
| iperf3 transmit AXE11000 | |
| Asus Zenbook S 13 OLED | |
| GPD Win 4 | |
| iperf3 receive AXE11000 | |
| Asus Zenbook S 13 OLED | |
| GPD Win 4 | |
| iperf3 transmit AXE11000 6GHz | |
| GPD Win Max 2 | |
| Dell XPS 13 9315 2-in-1 Core i5-1230U | |
| GPD Win 4 | |
| iperf3 receive AXE11000 6GHz | |
| GPD Win Max 2 | |
| Dell XPS 13 9315 2-in-1 Core i5-1230U | |
| GPD Win 4 | |
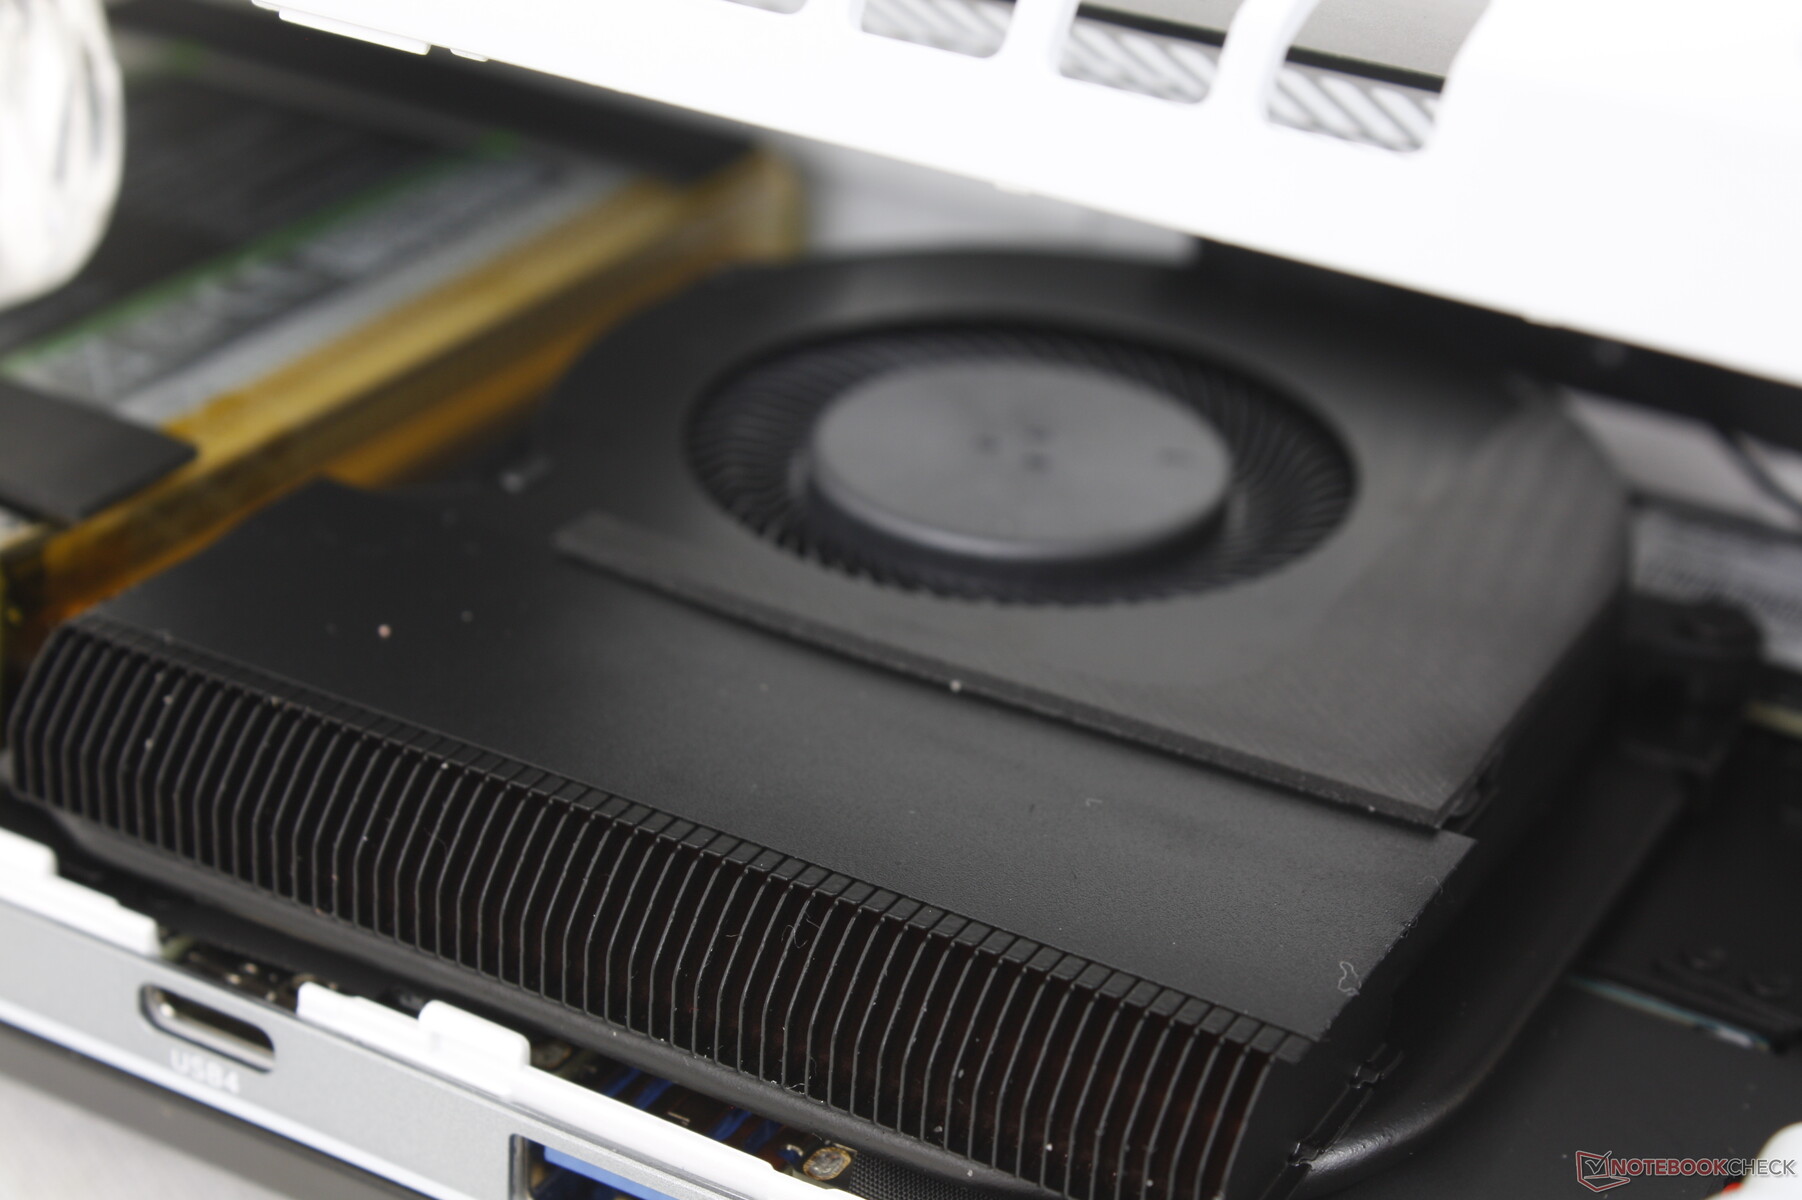
Maintenance
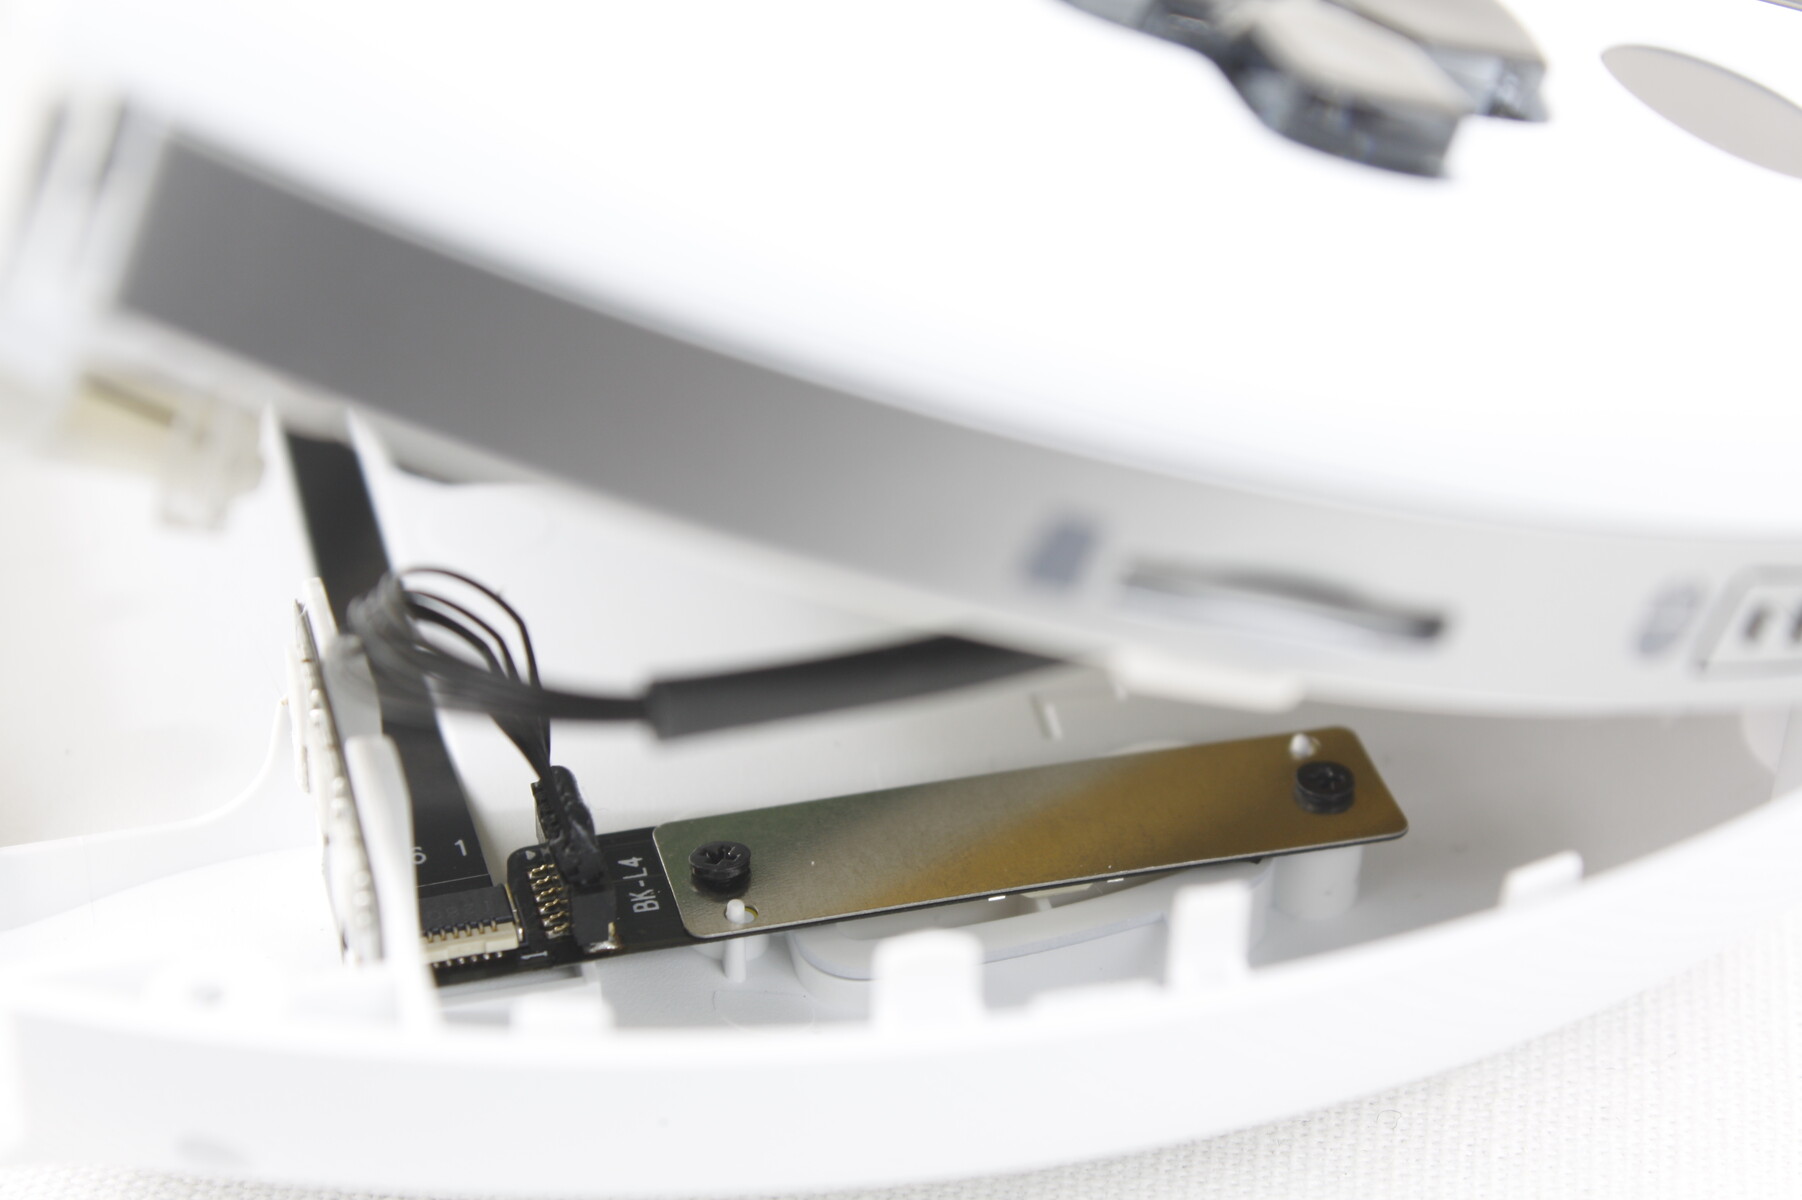
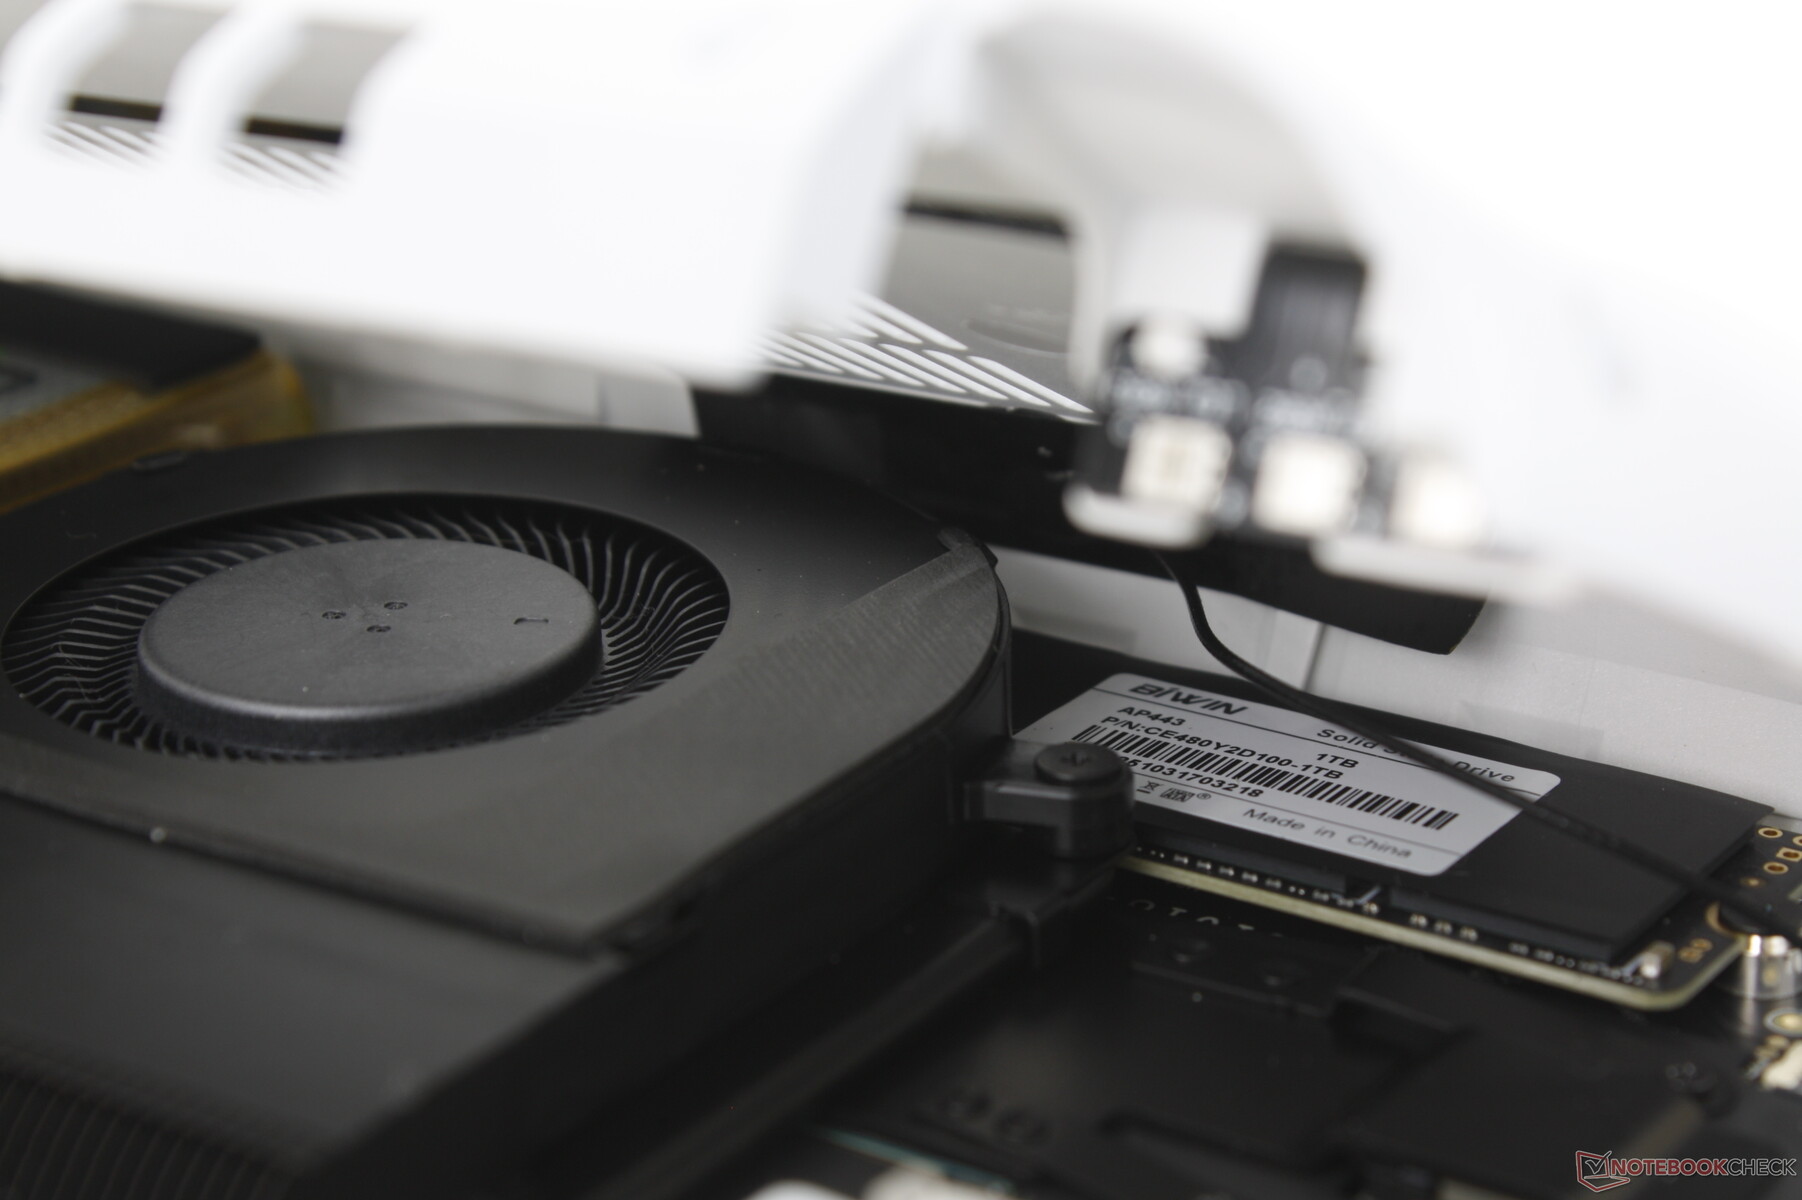
The plastic back panel is secured by six very small Philips screws. Unfortunately on our unit, the latches around the edges of the back panel are extremely tight and difficult to remove without damaging the unit which is a shame because the GPD Win 3 was otherwise easy to service. We can see that the M.2 2280 SSD is removable while the WLAN and RAM modules are soldered.
Keep in mind that the back panel is connected to the motherboard via a fragile ribbon cable because of the rear buttons. Thus, you would still have to be careful to not rip off the back panel or risk damaging the buttons.
Accessories and Warranty
There are no included accessories in the retail box other than the AC adapter and paperwork. Optional extras include a back-mounted 4G LTE adapter and an official USB-C docking station. It's too bad that the model that does not come with a free carrying case or screen protector.
The standard one-year limited manufacturer warranty applies if purchased in the US.
Input Devices
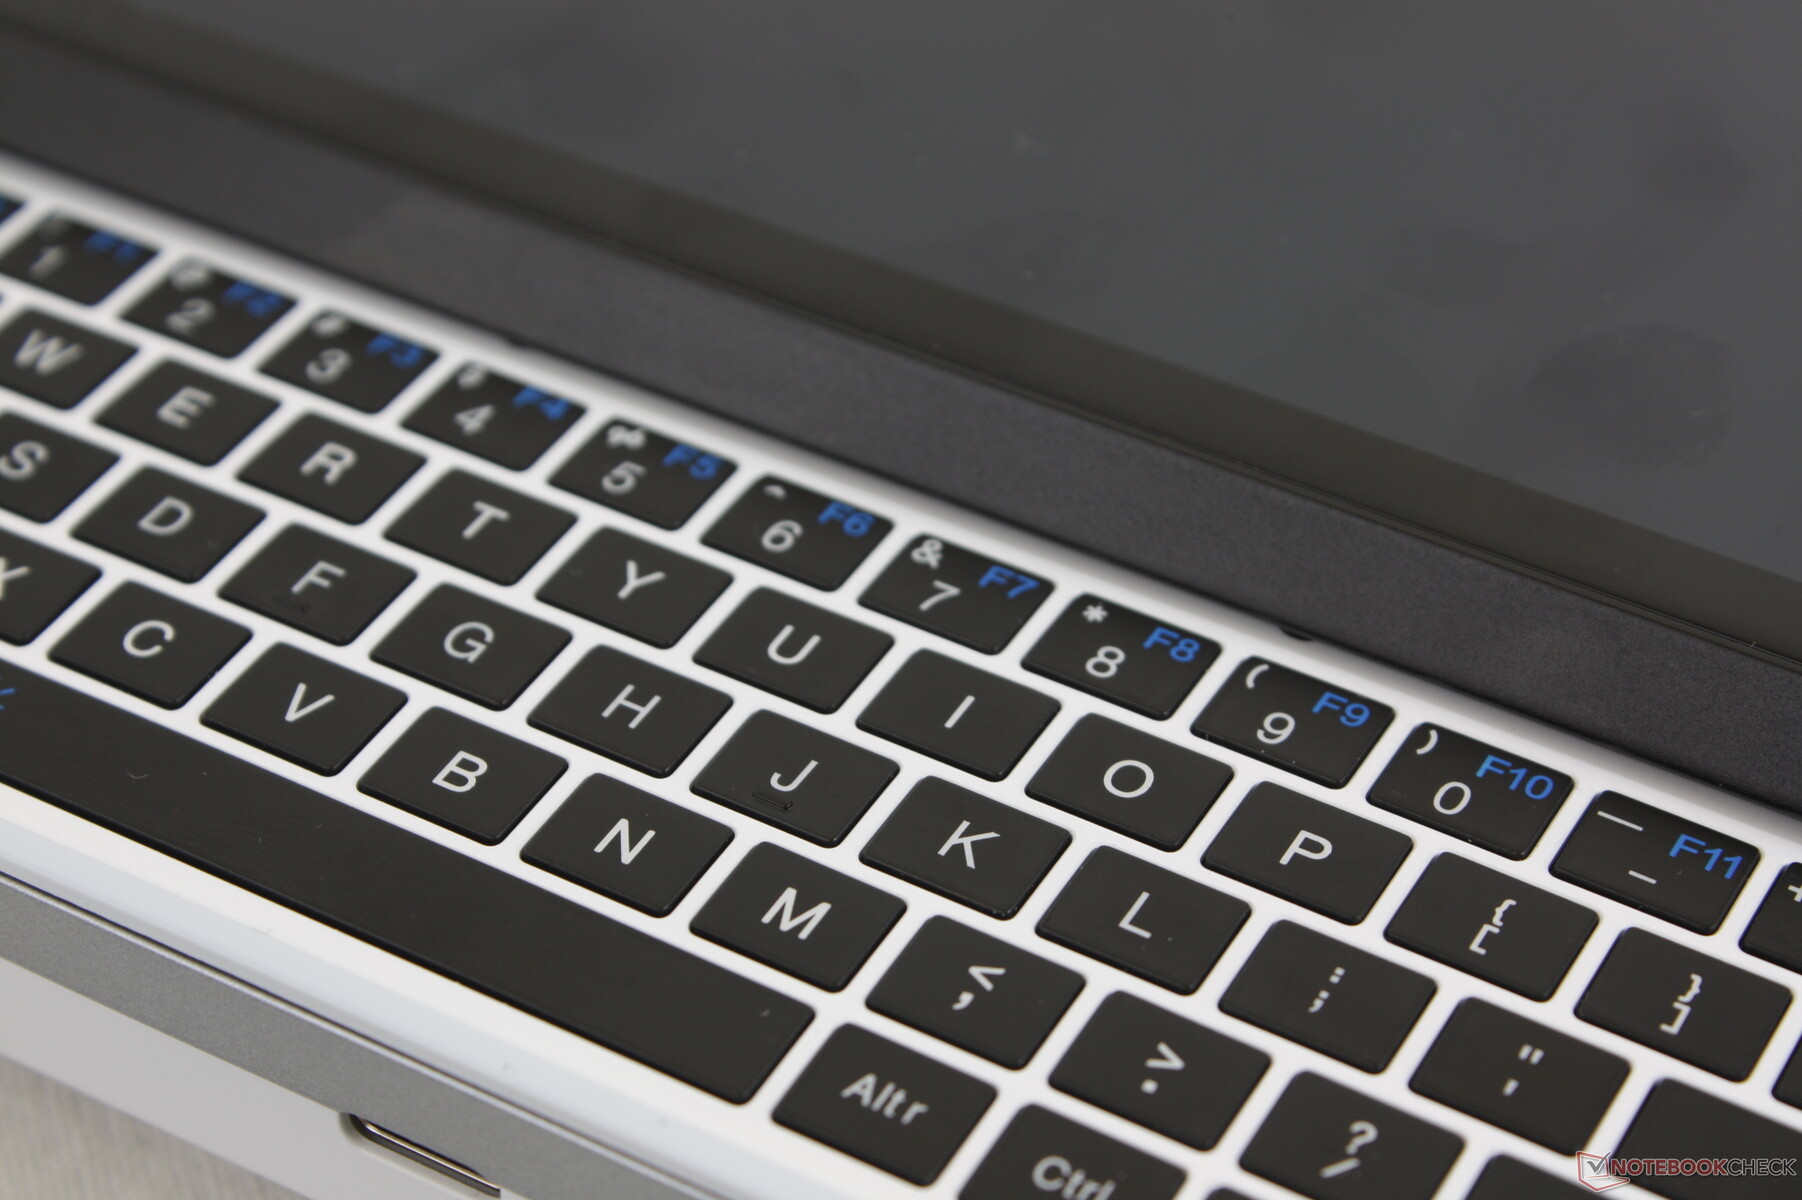
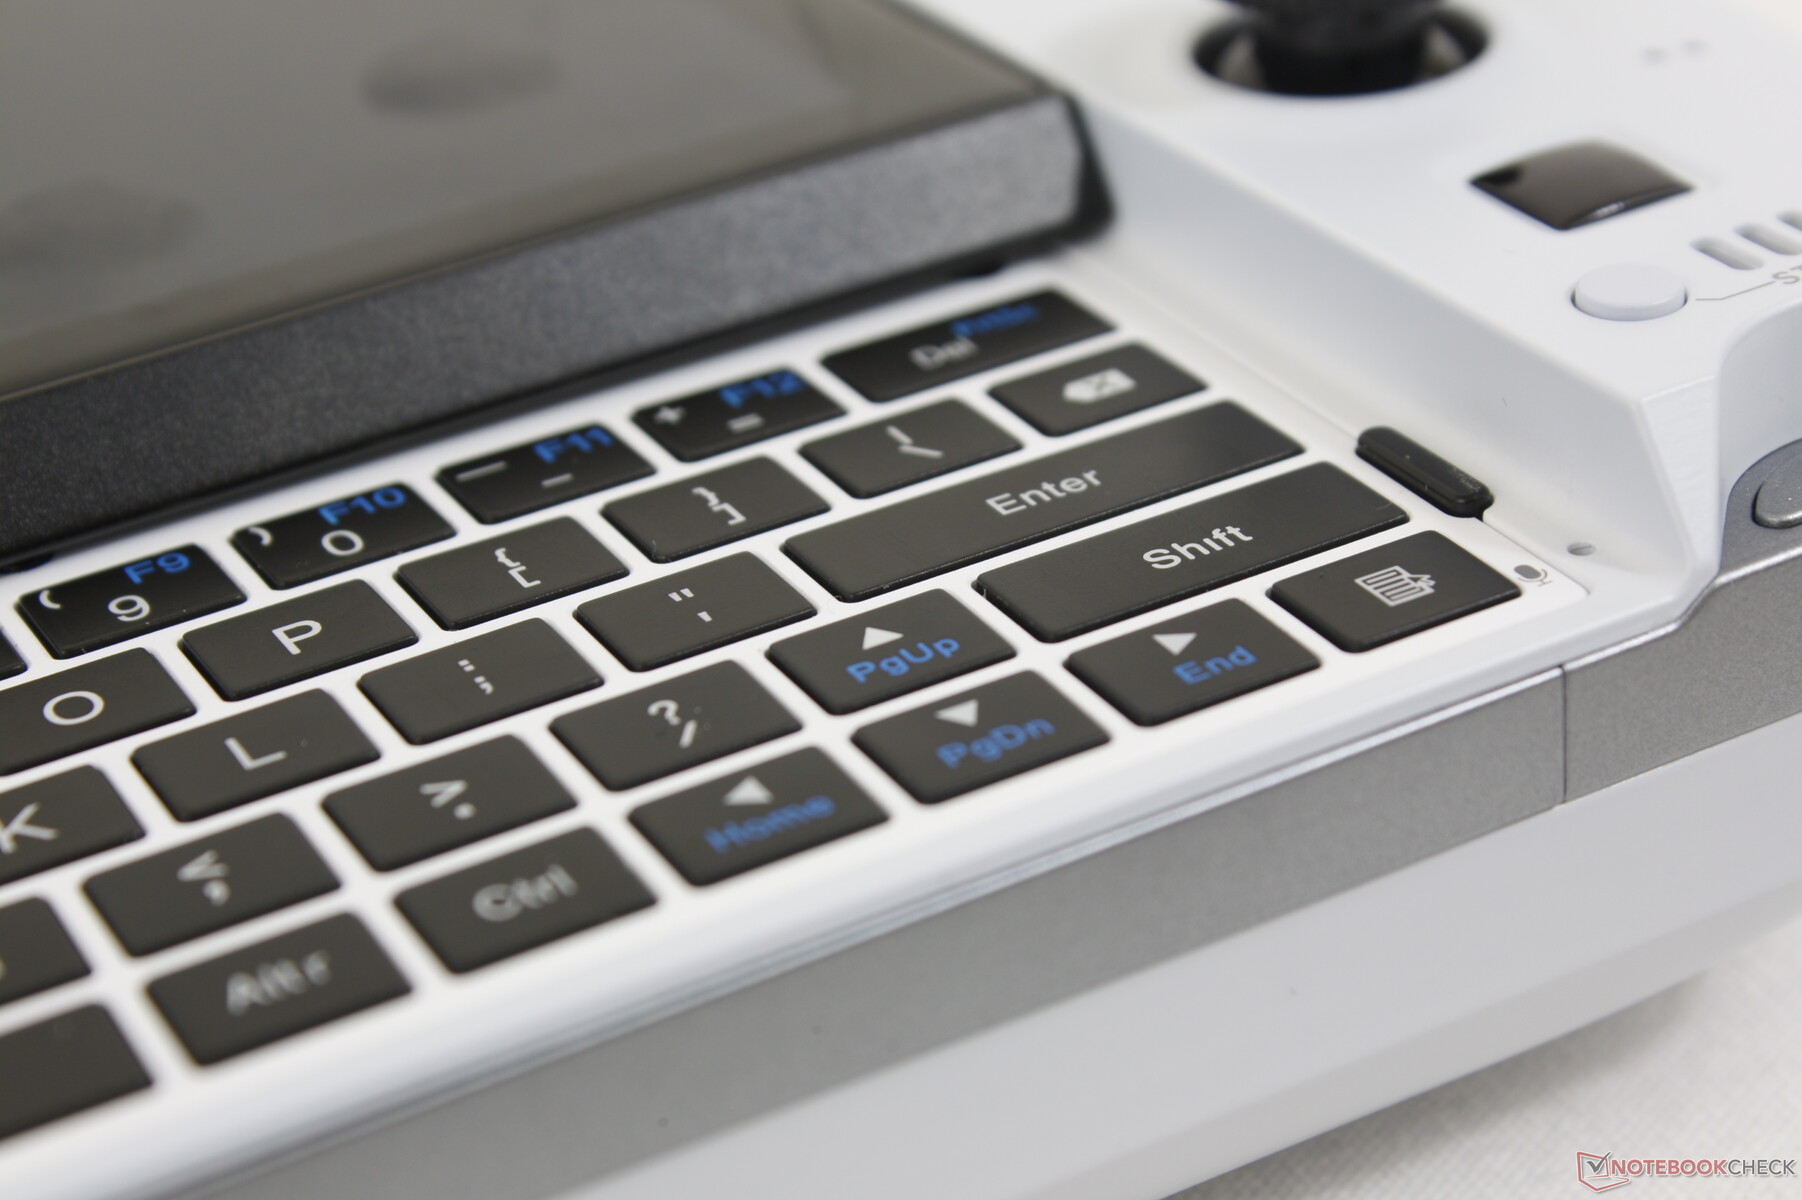
Keyboard — More Reliable than the Win 3
The keyboard has been completely revamped from touch-sensitive keys on the Win 3 to tactile physical keys on the Win 4. They're clicky for better feedback, but typing speed is still far slower than a typical touchscreen keyboard or smartphone. They're good enough for the occasional inputs only.
Note that the bug we experienced on the Win 3 has been fixed on the Win 4; sliding the screen up and down no longer presses any buttons on the keyboard.
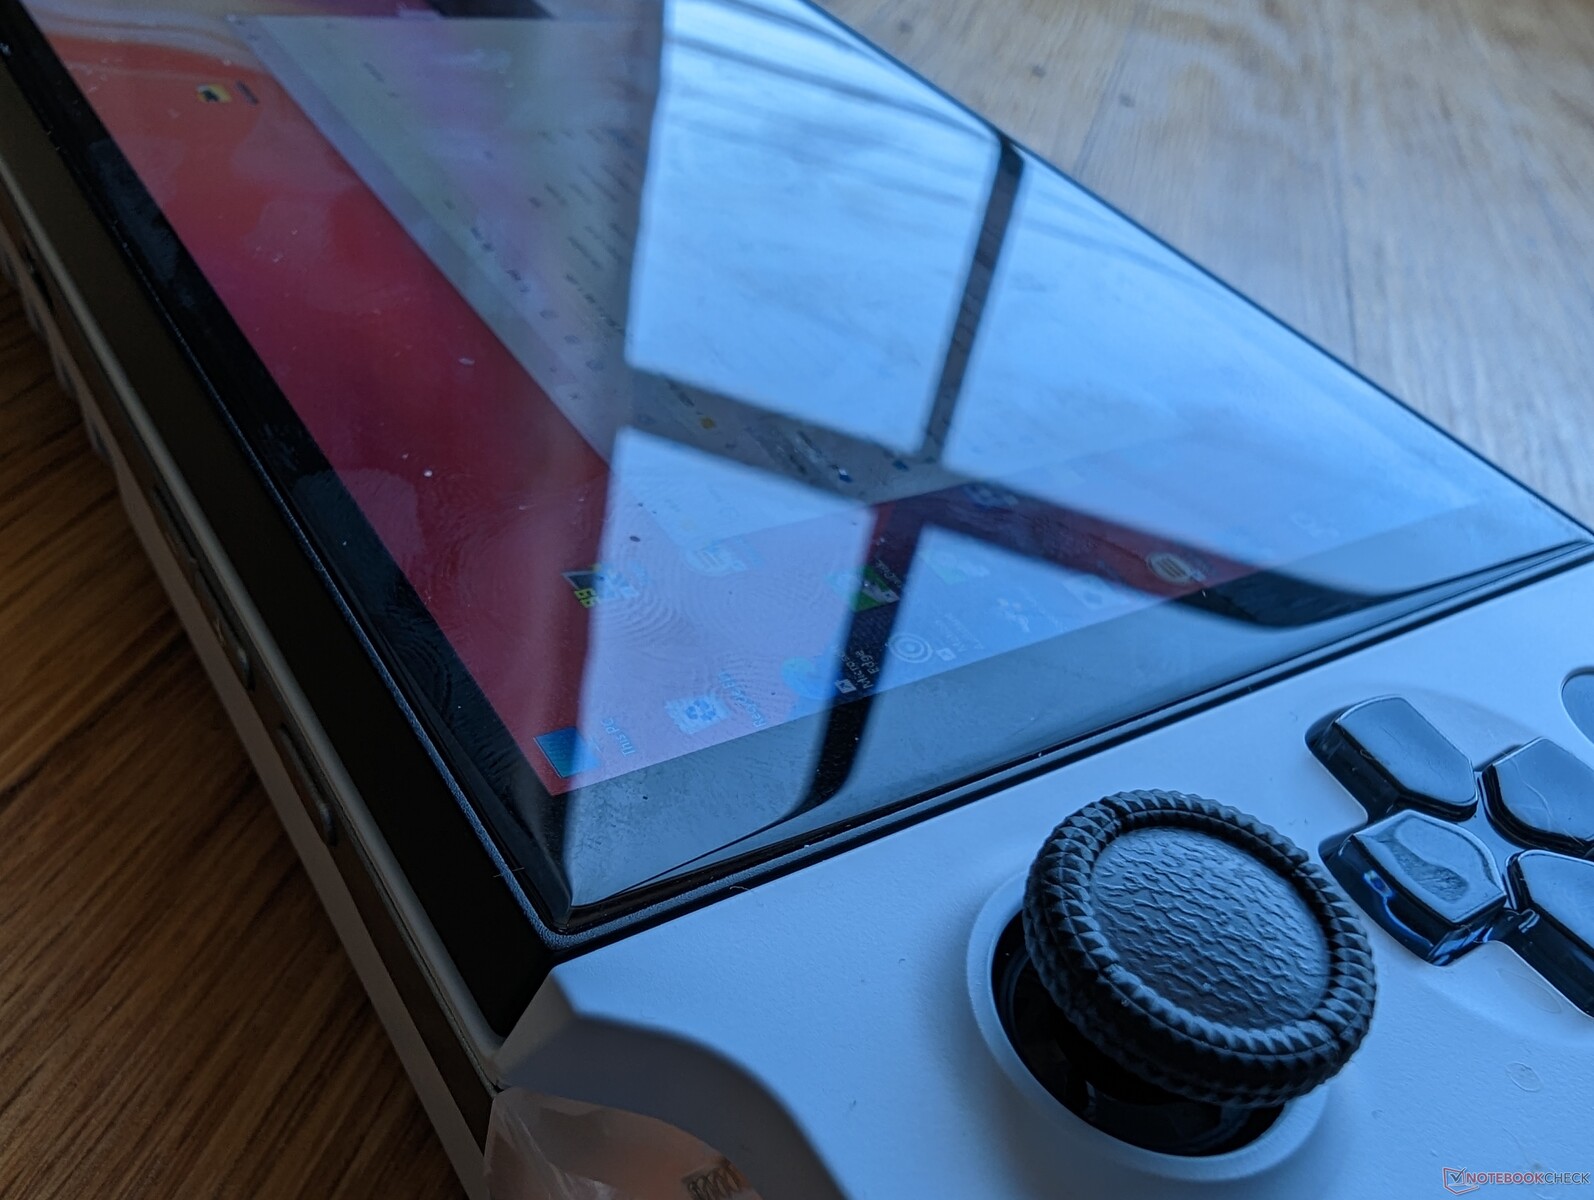
Gamepad — Like Playing on a Switch
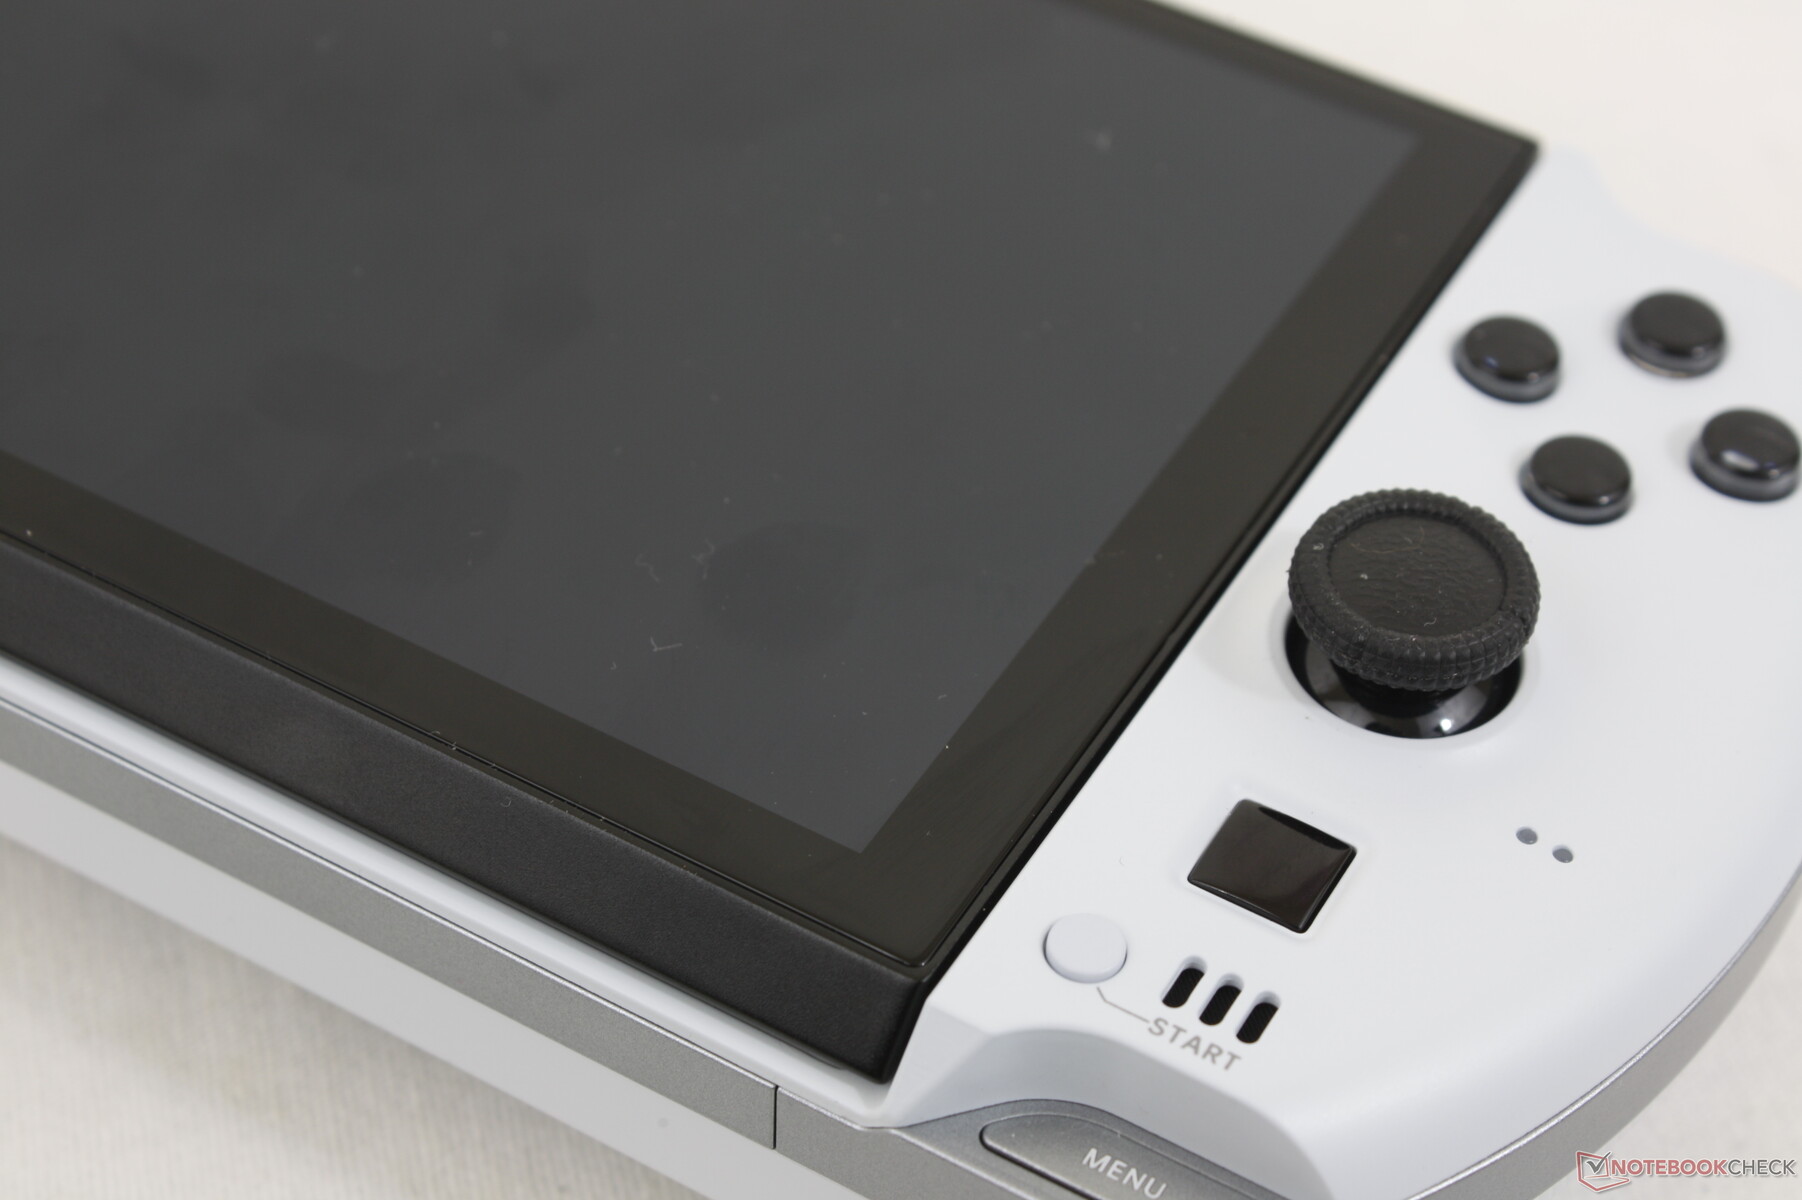
It's not a coincidence that the joysticks and buttons on the Win 4 are exactly the same size as the ones on the Nintendo Switch. After all, why change something that already works on the most popular handheld console? The main advantage here is that if you're comfortable playing on the Switch, then the Win 4 gamepad will feel very familiar. On the other hand, users who find the Switch buttons too small or cramped aren't going to find a better experience on the Win 4. Instead, our main concern is that the gamepad buttons are not removable and so any wear over time can be difficult to service whereas console controllers can be cheaply replaced.
The two rear shoulder buttons (L2, R2) have more travel than the same buttons on the Switch. It's a small but noticeable improvement to bring the controller experience a bit closer to a regular XBox or PS gamepad.
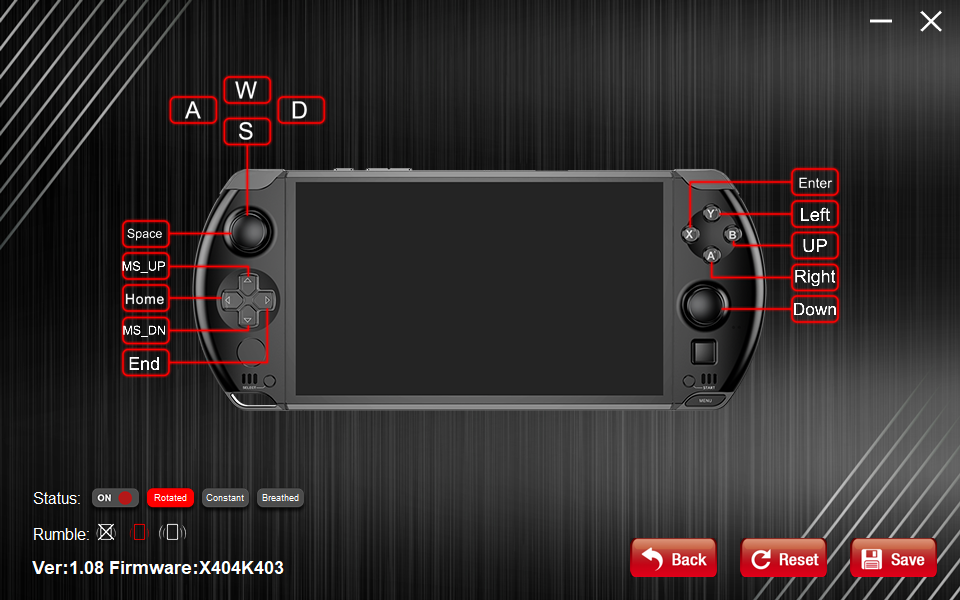
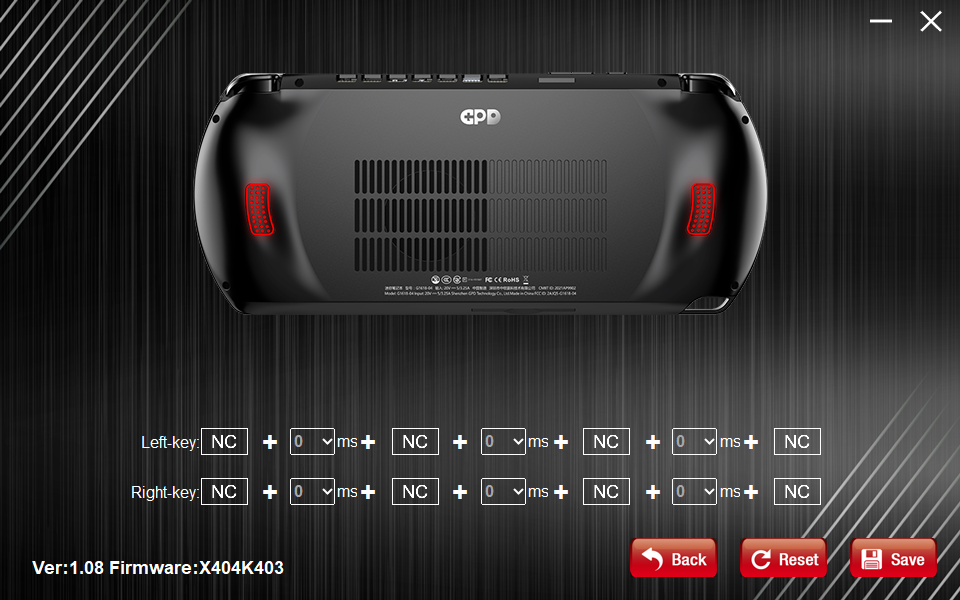
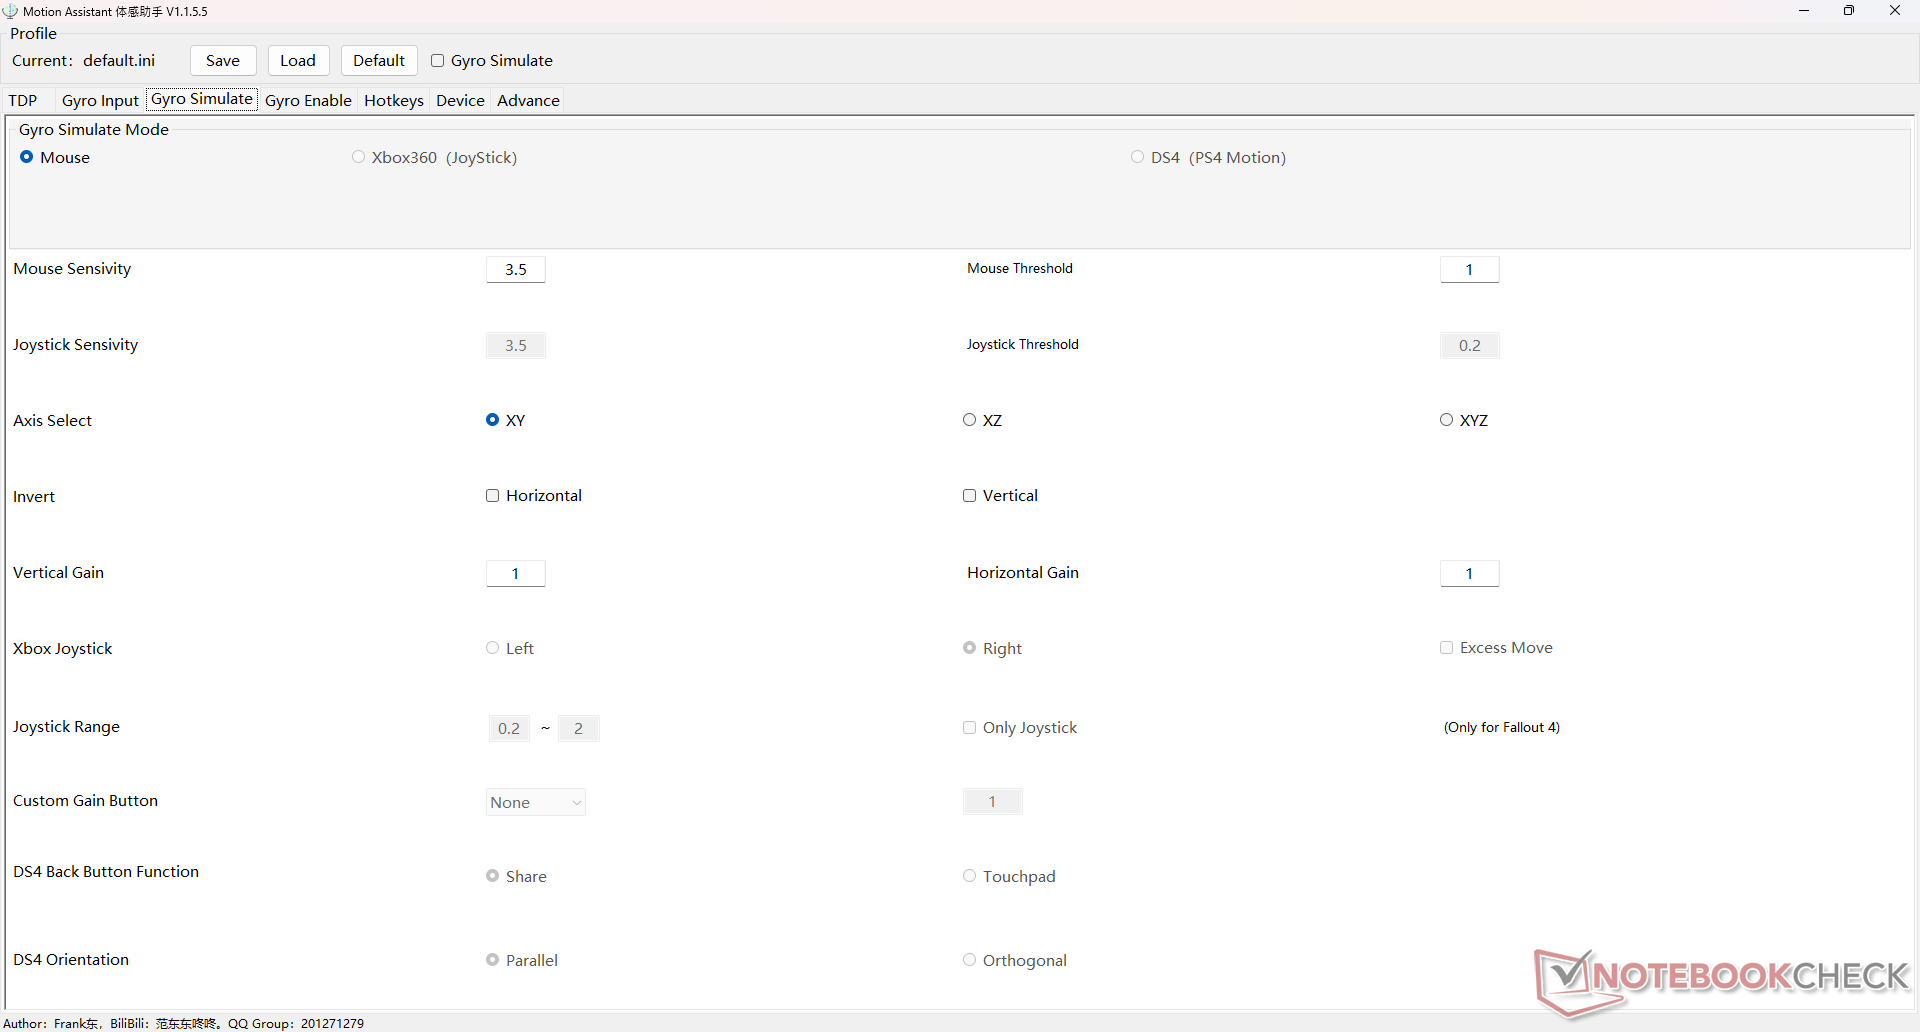
There are two modes for the gamepad much like on the Win 3: Mouse and Gamepad. If on Mouse mode, the gamepad buttons are pre-mapped to the following keys as shown by the screenshot below. If on Gamepad mode, Windows will recognize the gamepad as a standard XBox controller for automatic compatibility with Steam and other titles. In either case, the pre-installed software WinControls lets users remap the buttons as needed.
None of the gamepad buttons are backlit except for the L1 and R1 shoulder buttons.
Display — Full 1080p IPS at 60 Hz
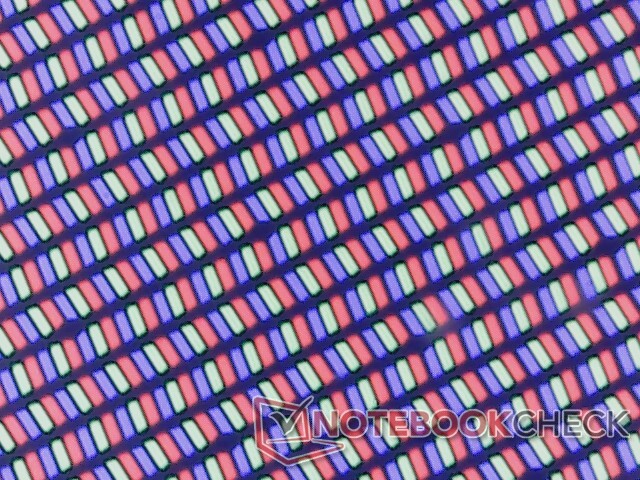
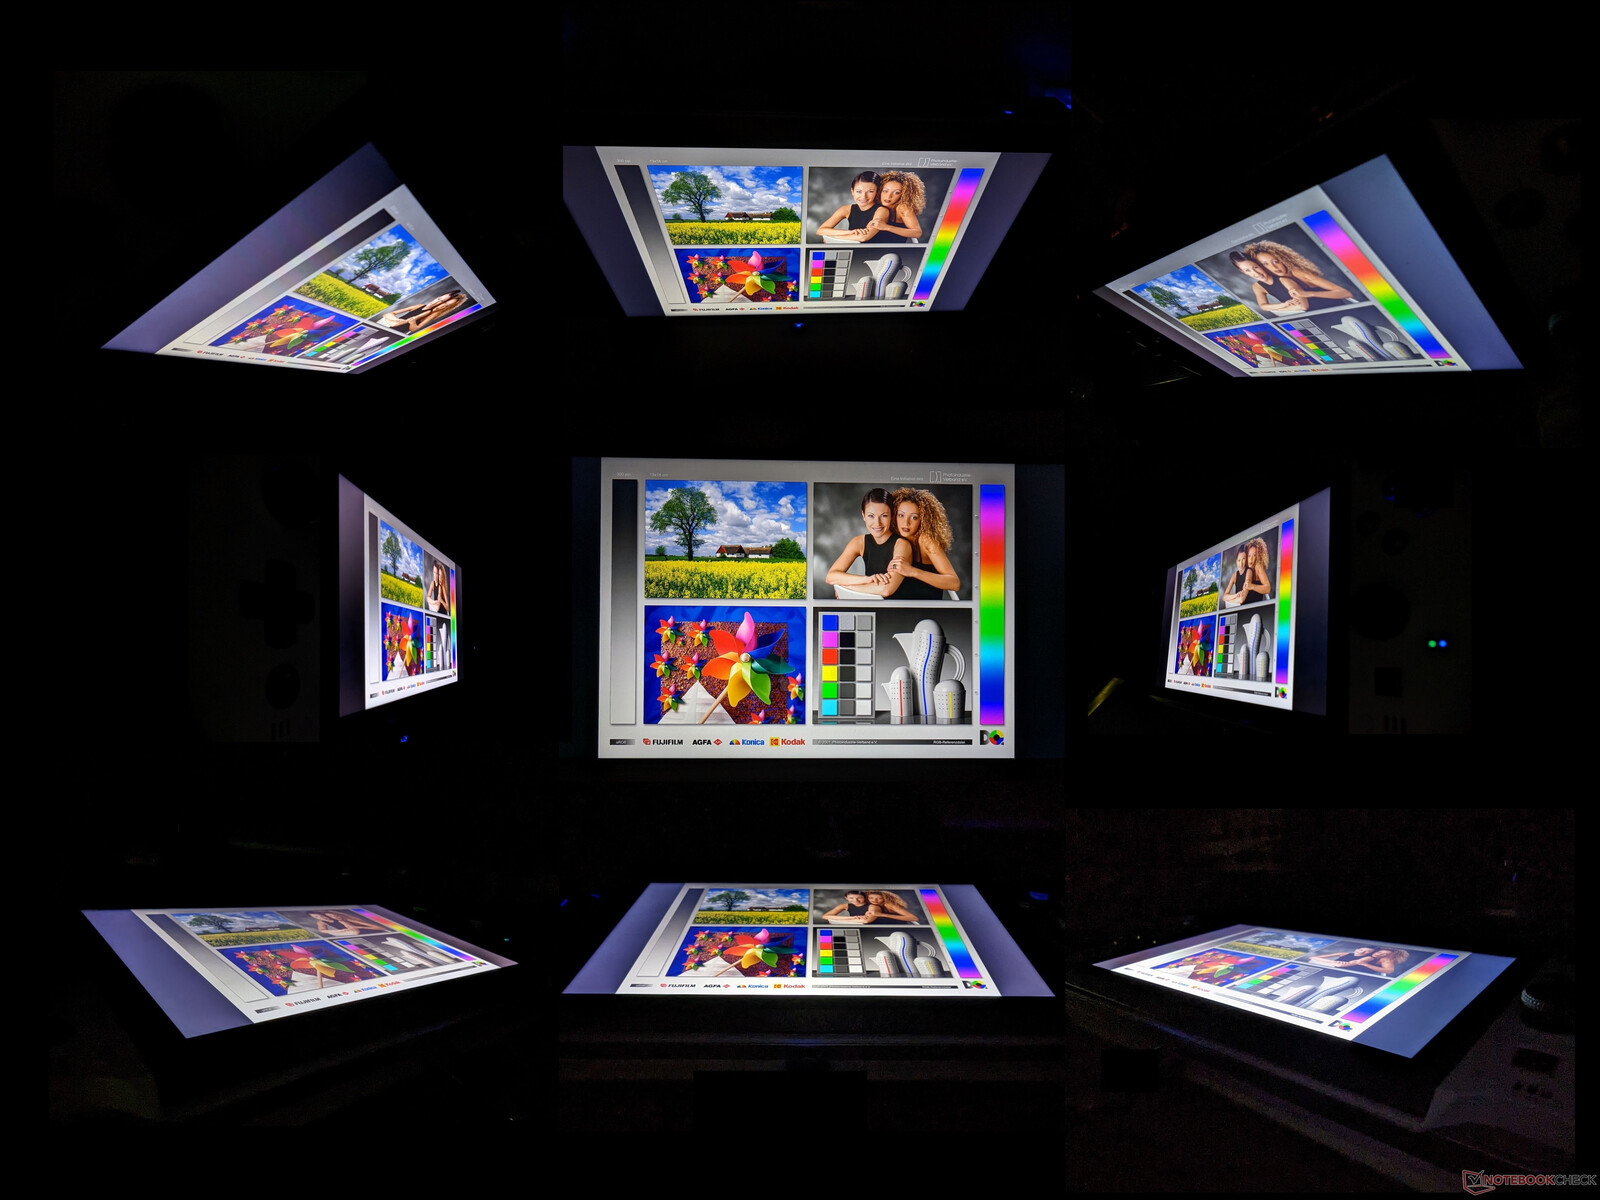
A major drawback to the Win 3 was its small screen size of just 5.5-inches. Many PC titles are not optimized for such small displays and so HUDs and UI icons would often appear tiny. The Win 4 addresses this concern with a larger 6-inch screen and a higher 1080p native resolution. Black-white response times are faster as well while color gamut and contrast ratio remain about the same as on the Win 3. The IPS display may not be laminated like on the iPad Pro, but it is nonetheless very sharp and of high quality.
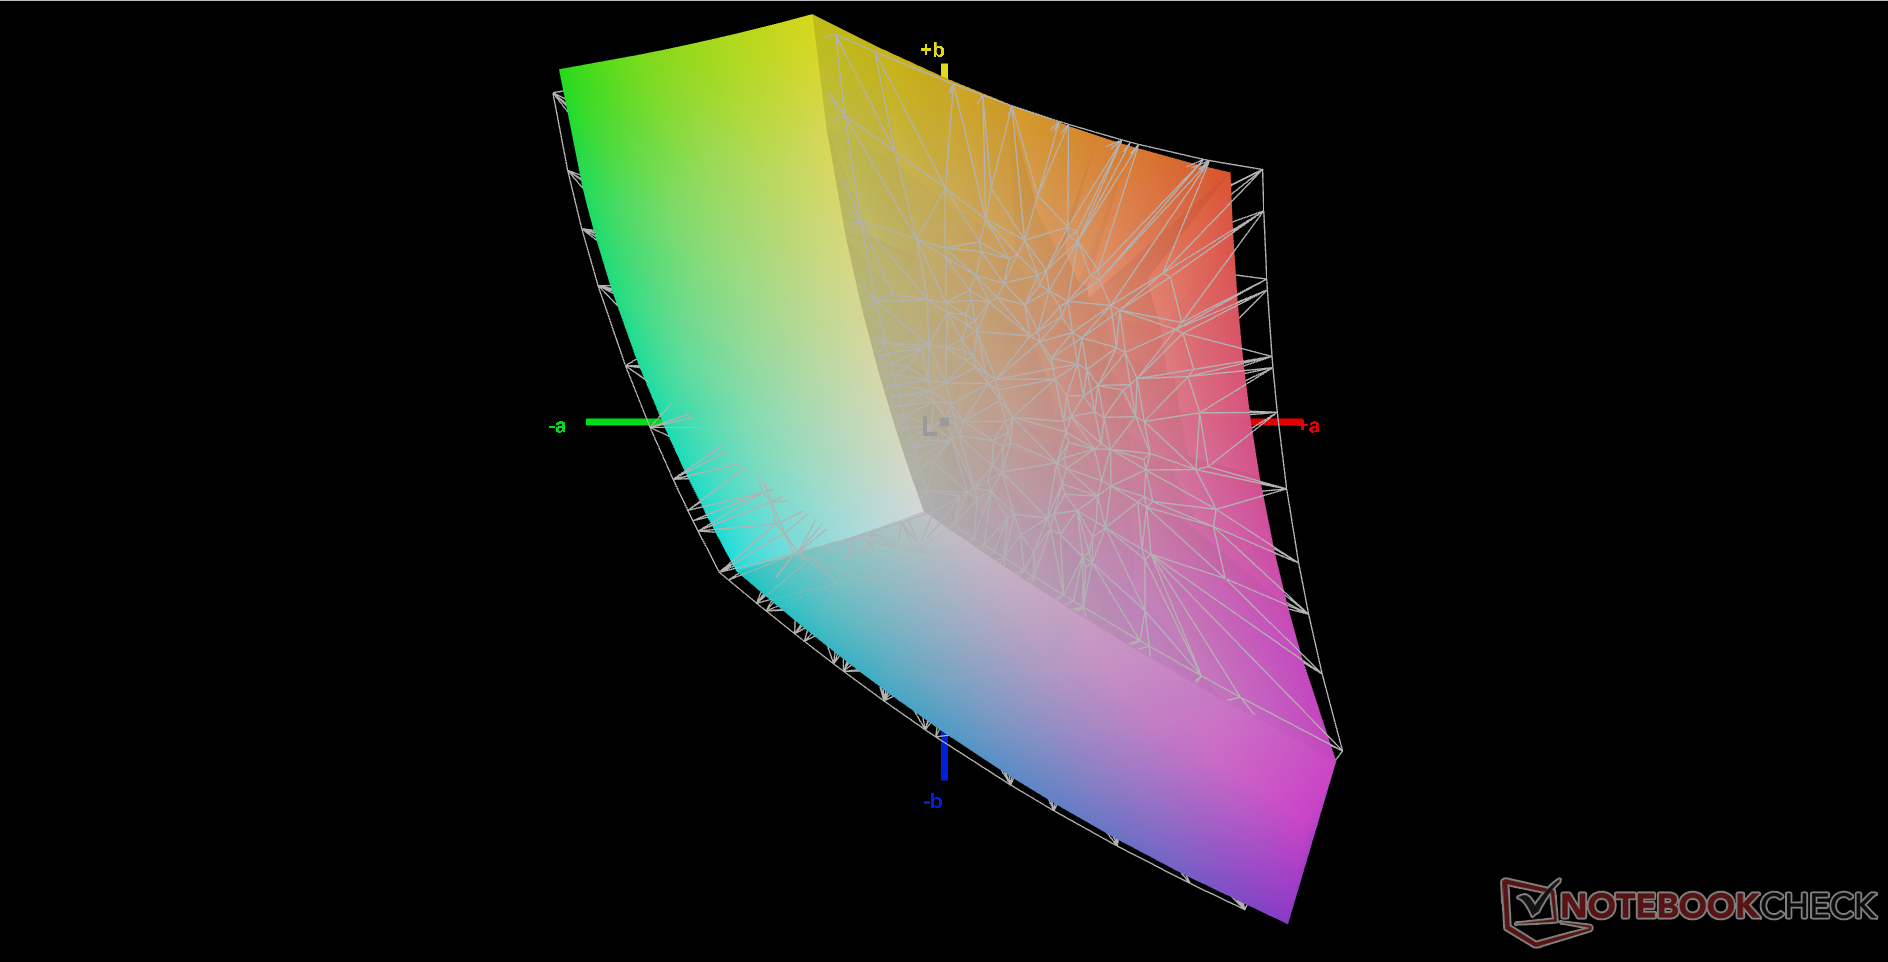
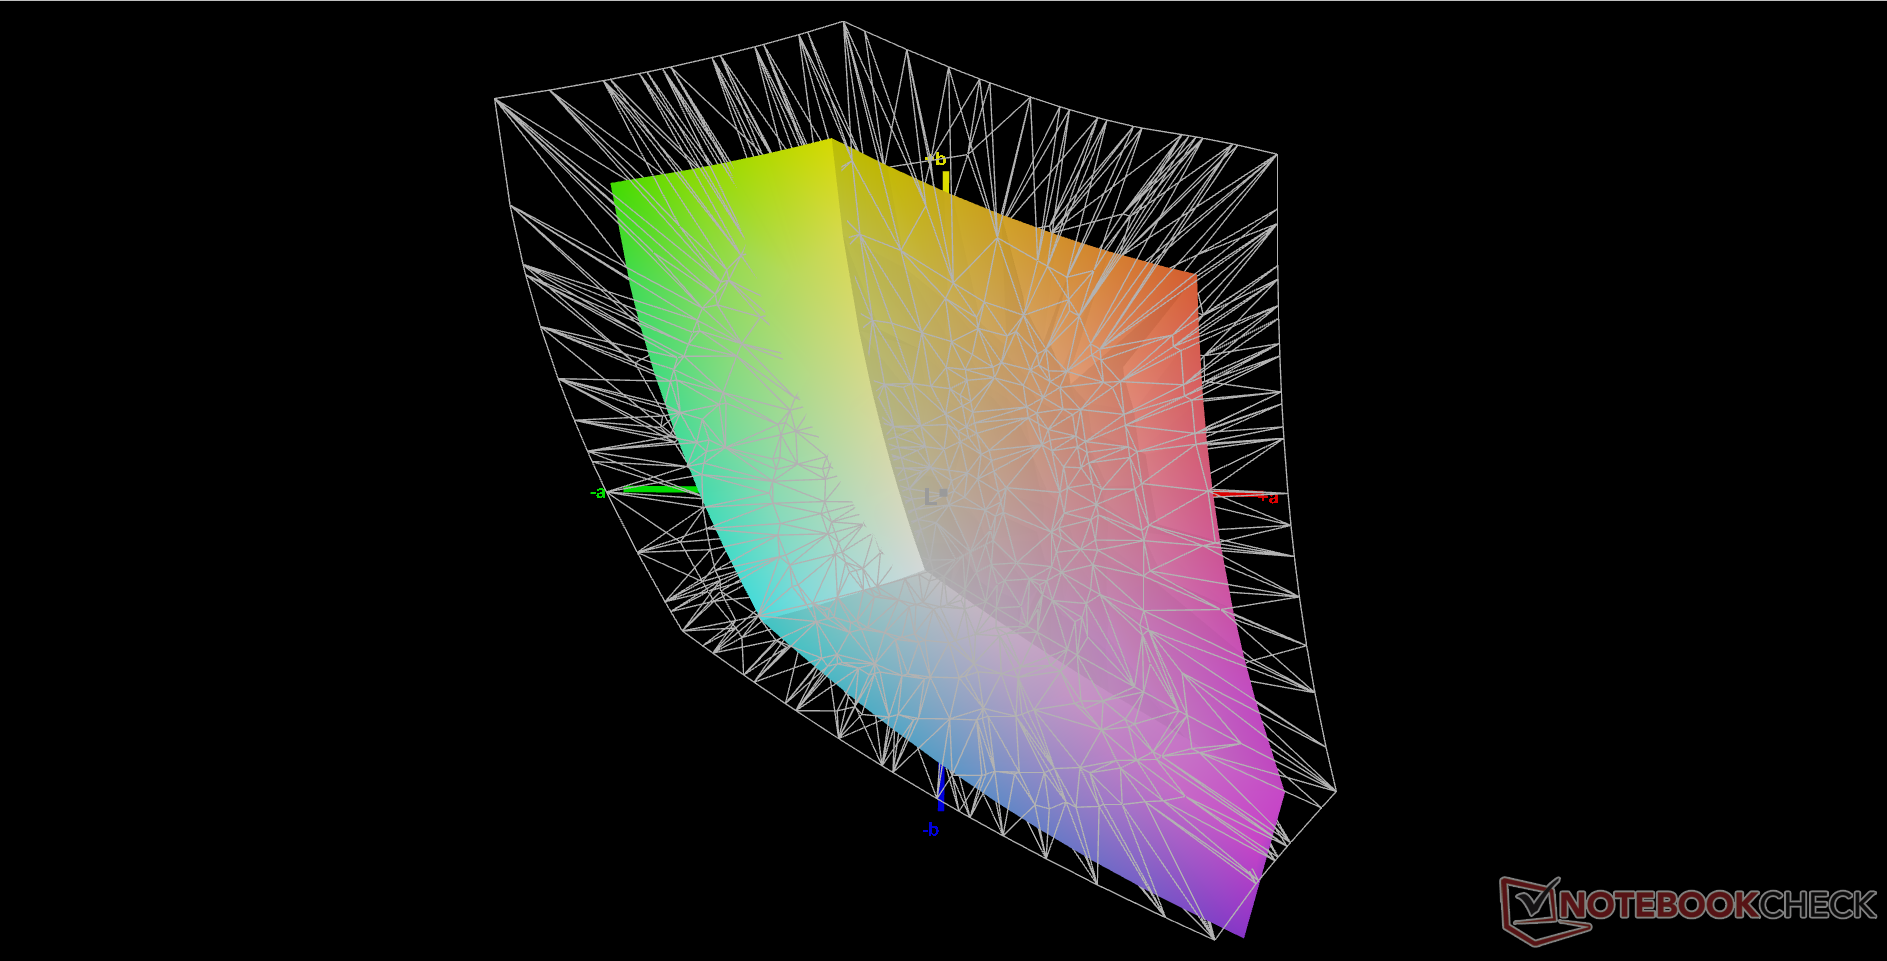
The ~90 percent sRGB gamut allows for deep colors that rival many midrange to higher-end laptop displays. There are unfortunately no OLED options which would have expanded colors even more to cover P3.
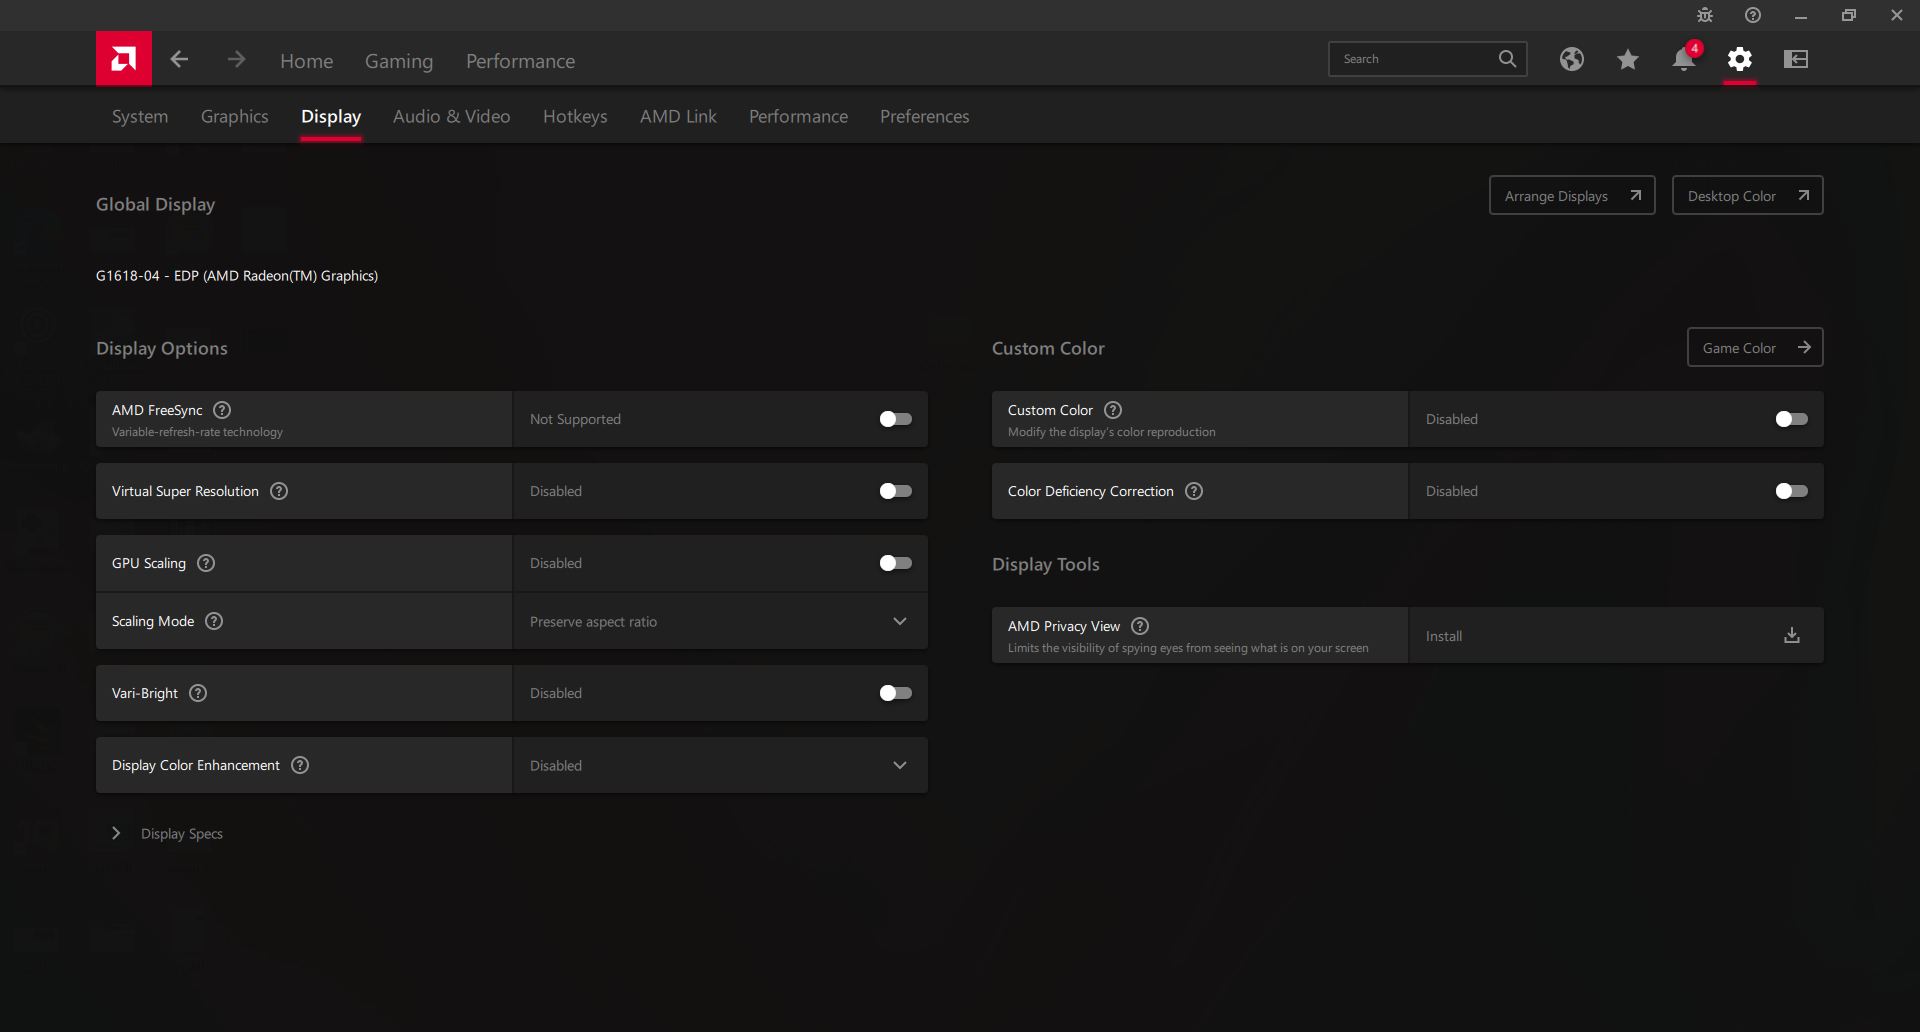
It's worth noting that the display does not support adaptive sync or FreeSync. This feature would have been perfect for the system considering that the Radeon 680M often performs in the 40 to 60 FPS range at 1080p.
| |||||||||||||||||||||||||
Brightness Distribution: 81 %
Center on Battery: 413.1 cd/m²
Contrast: 1059:1 (Black: 0.39 cd/m²)
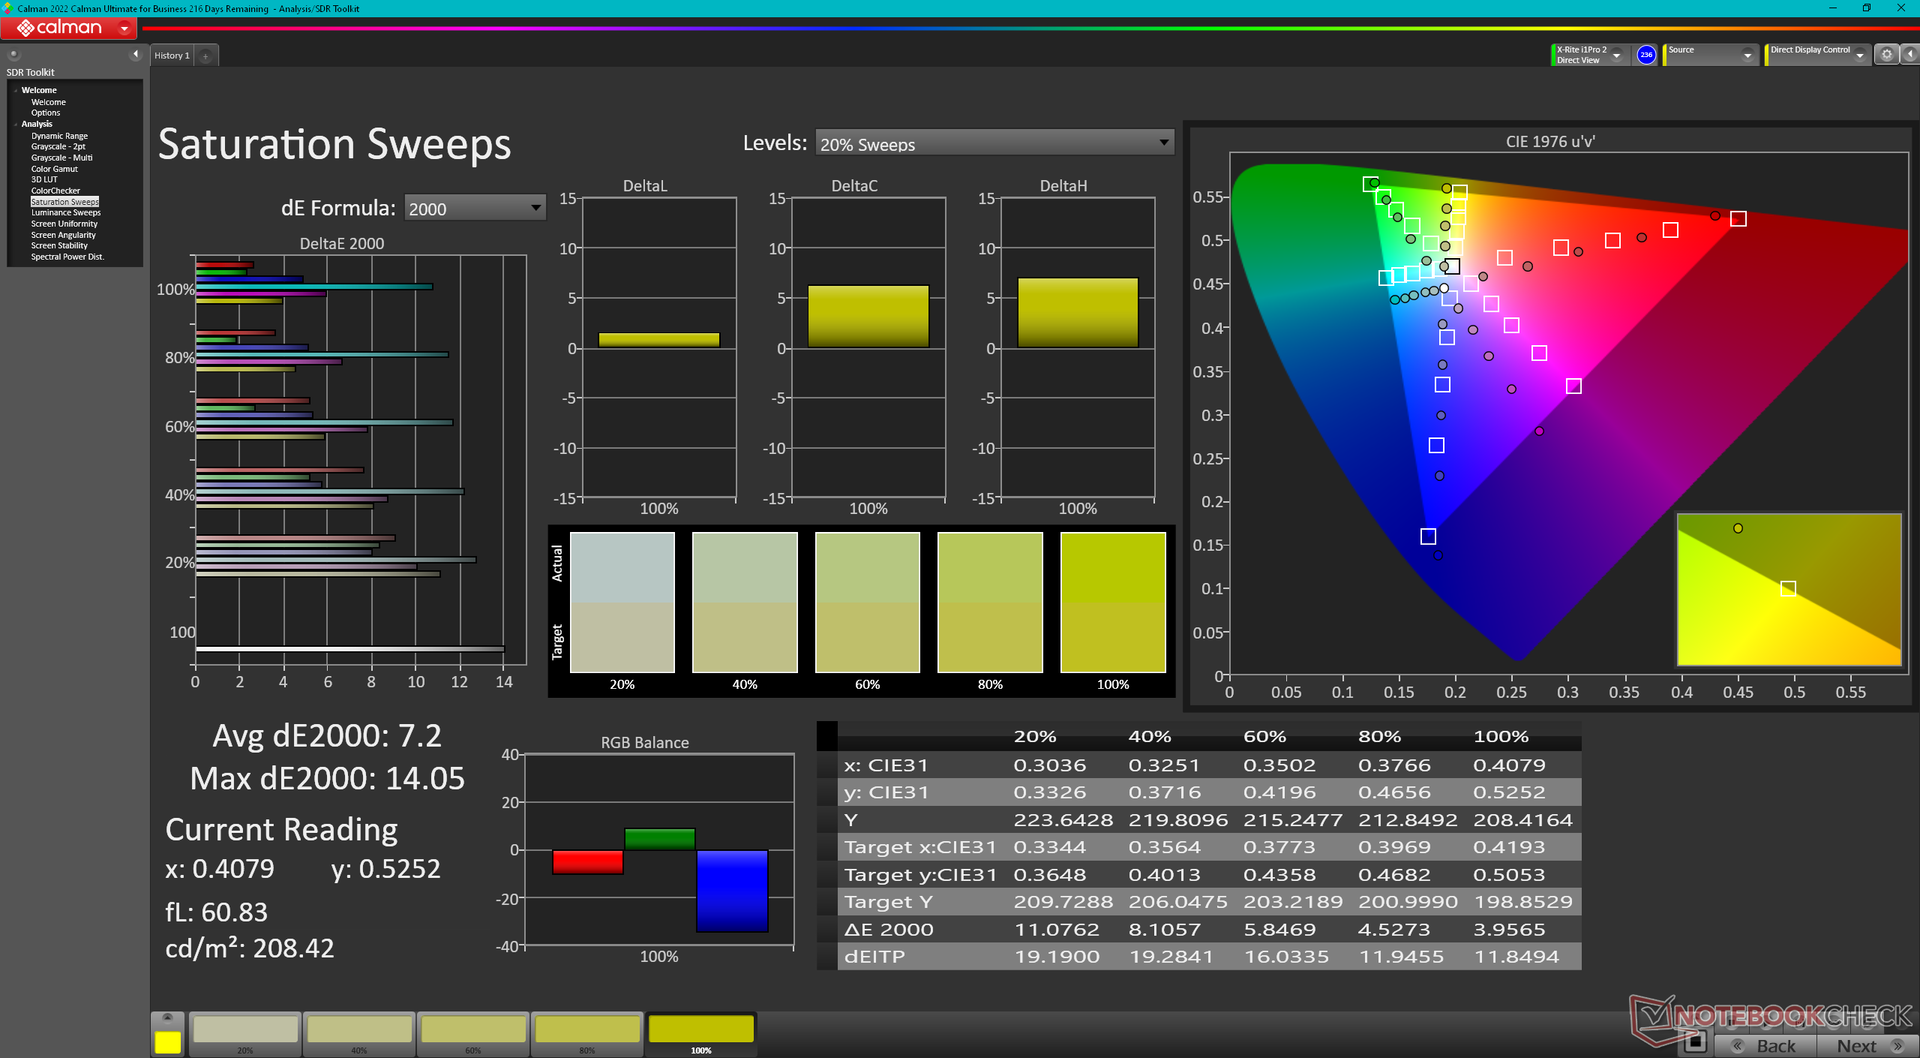
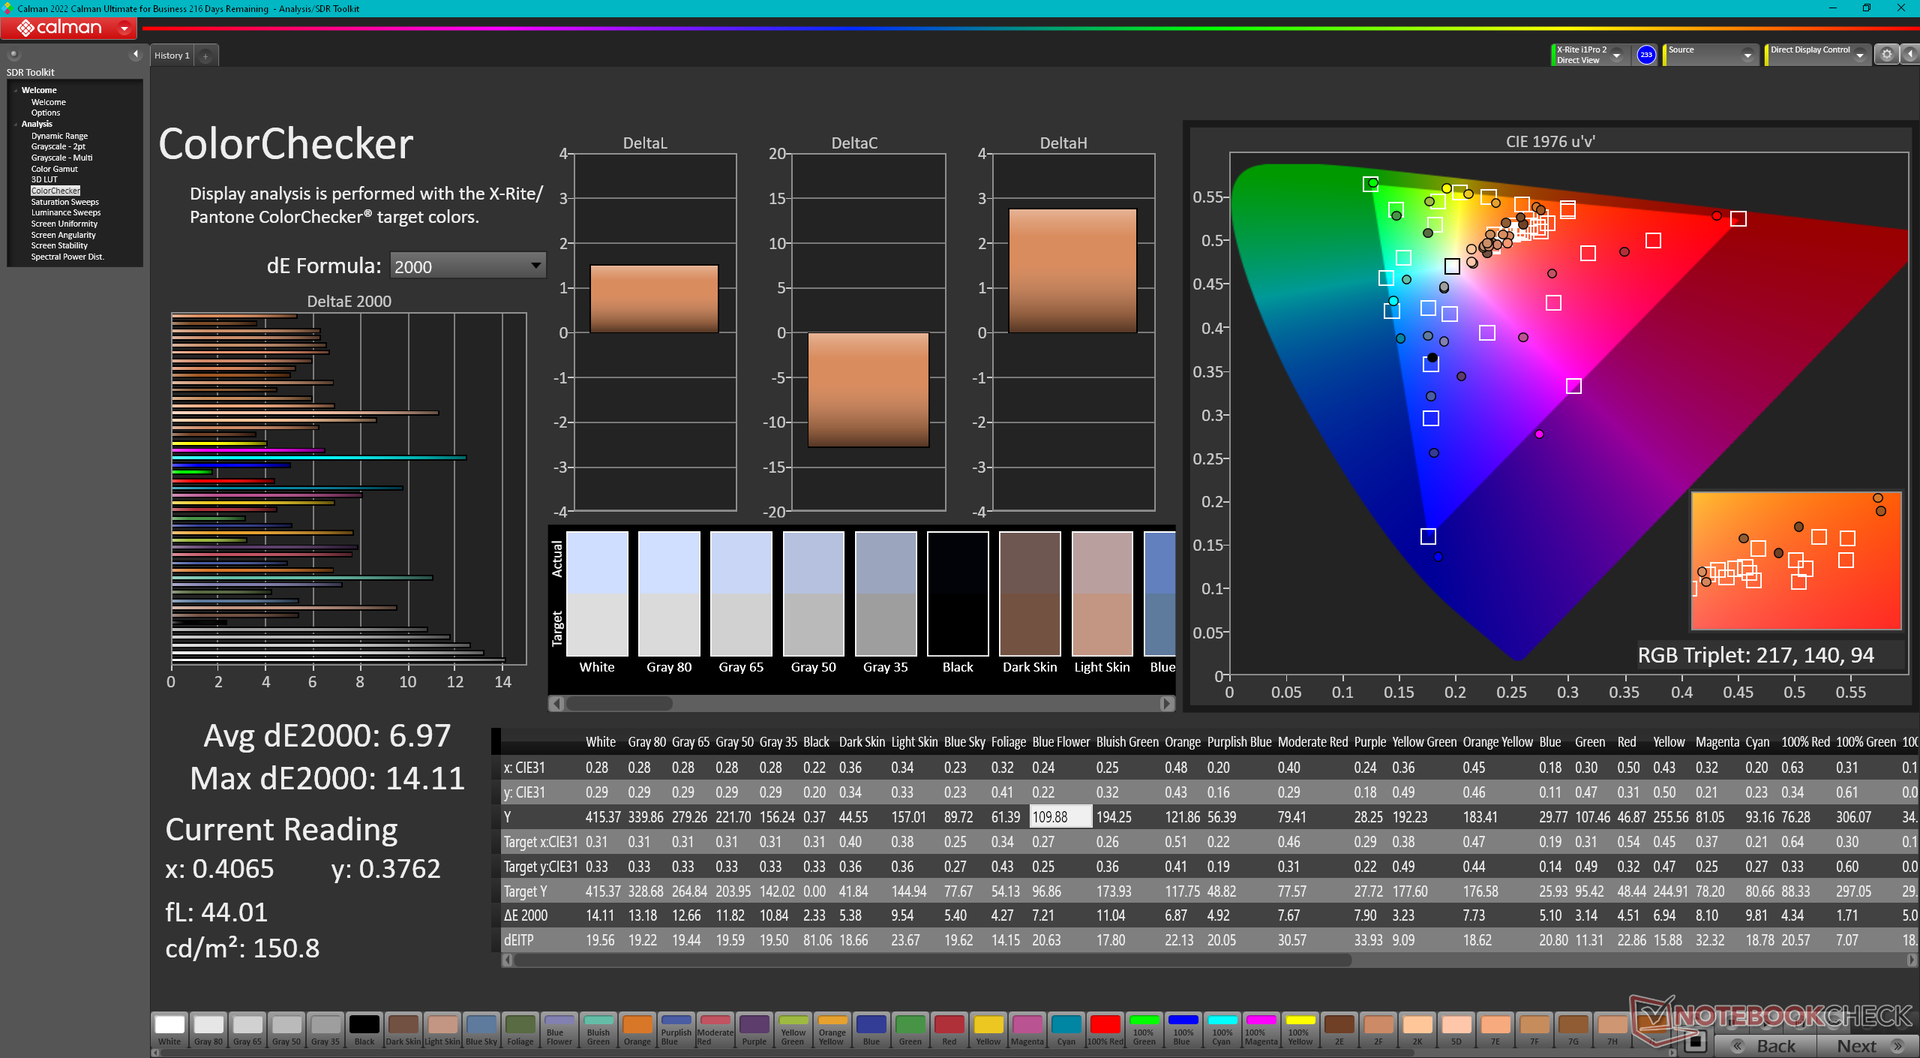
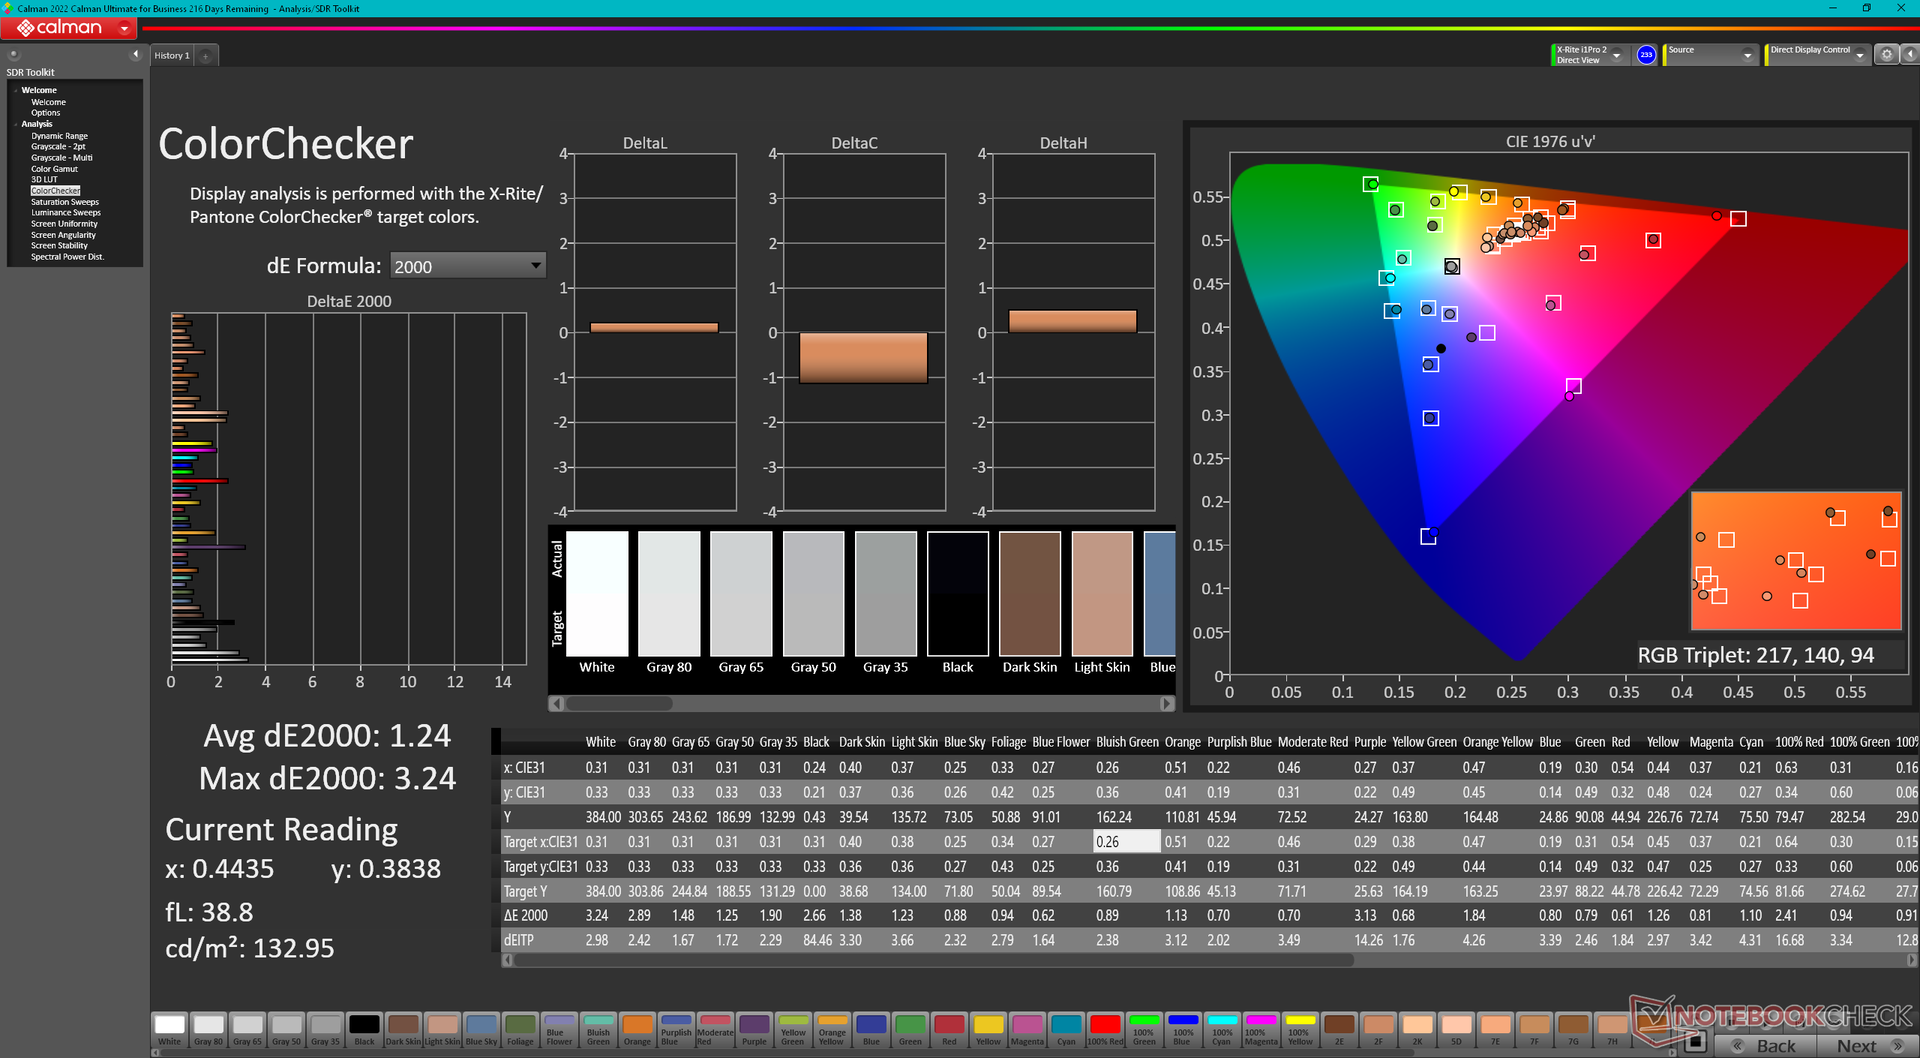
ΔE ColorChecker Calman: 6.97 | ∀{0.5-29.43 Ø4.72}
calibrated: 1.24
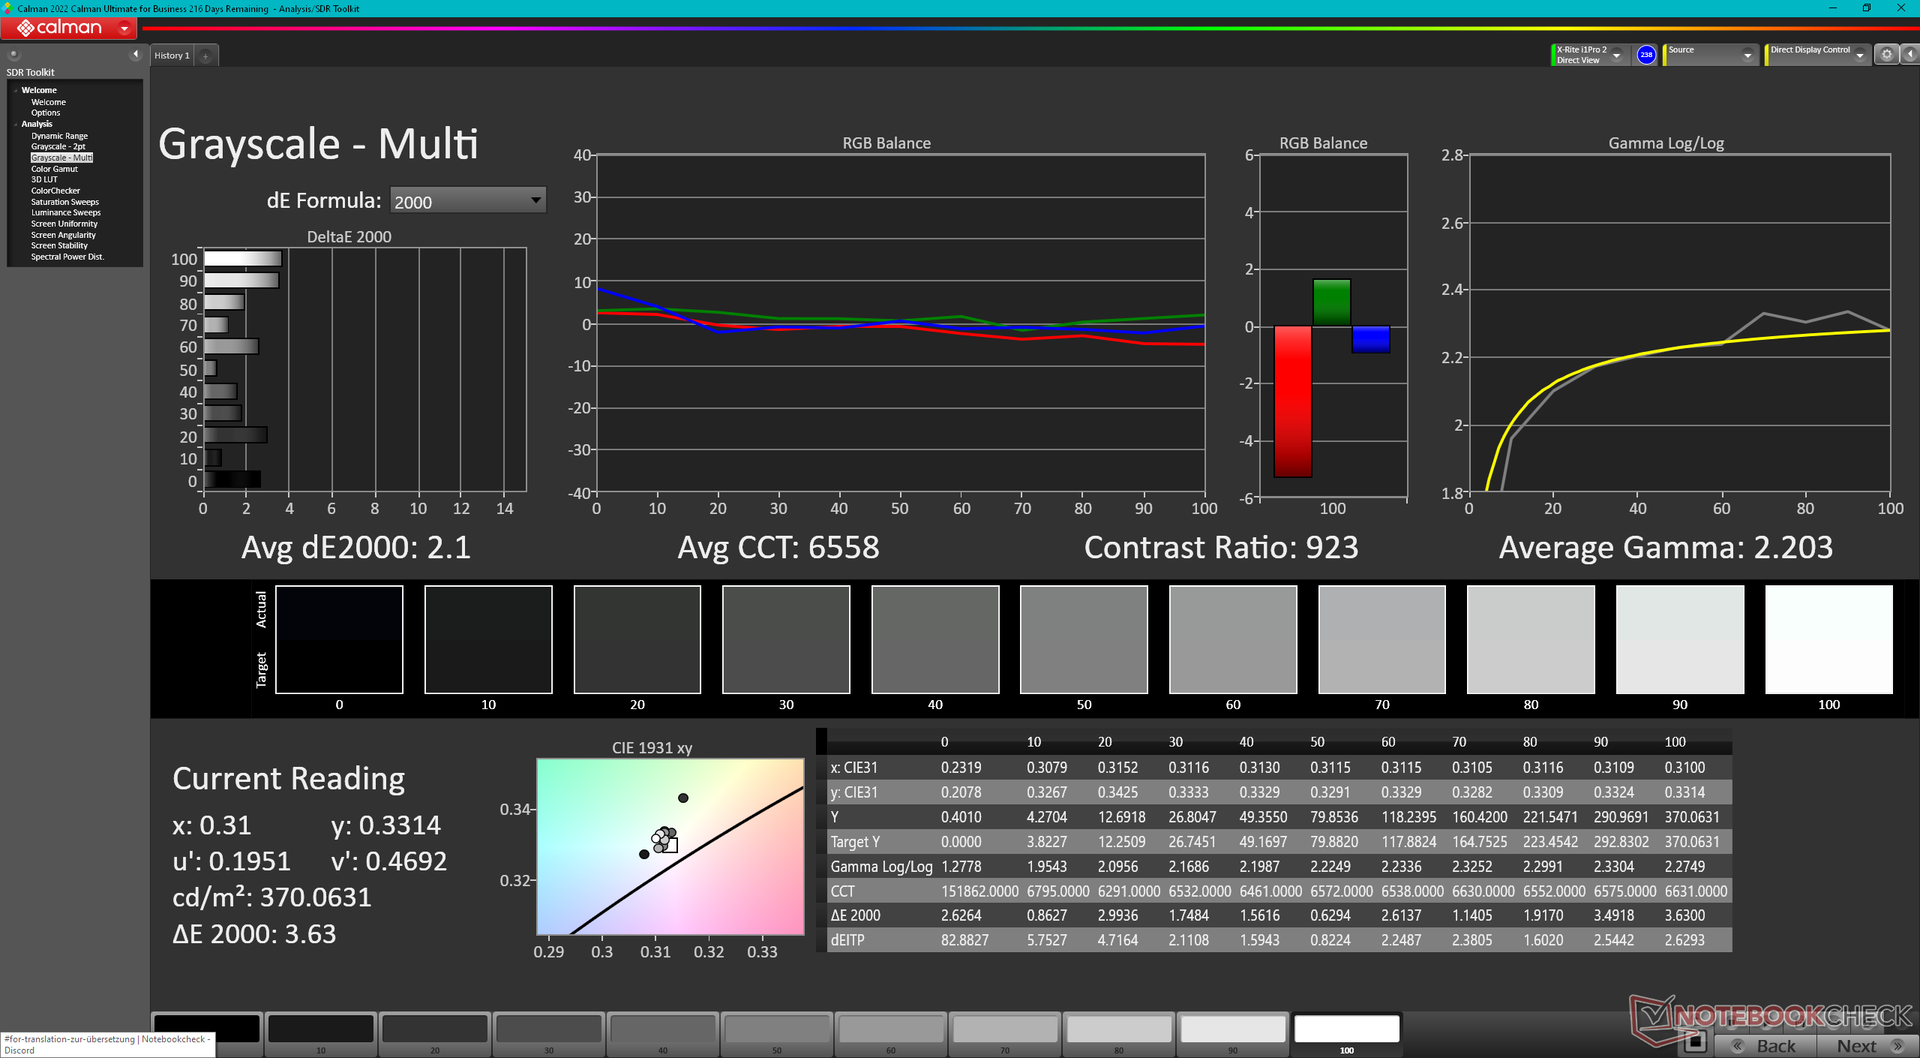
ΔE Greyscale Calman: 9.9 | ∀{0.09-98 Ø4.97}
64.6% AdobeRGB 1998 (Argyll 3D)
92% sRGB (Argyll 3D)
63.1% Display P3 (Argyll 3D)
Gamma: 2.04
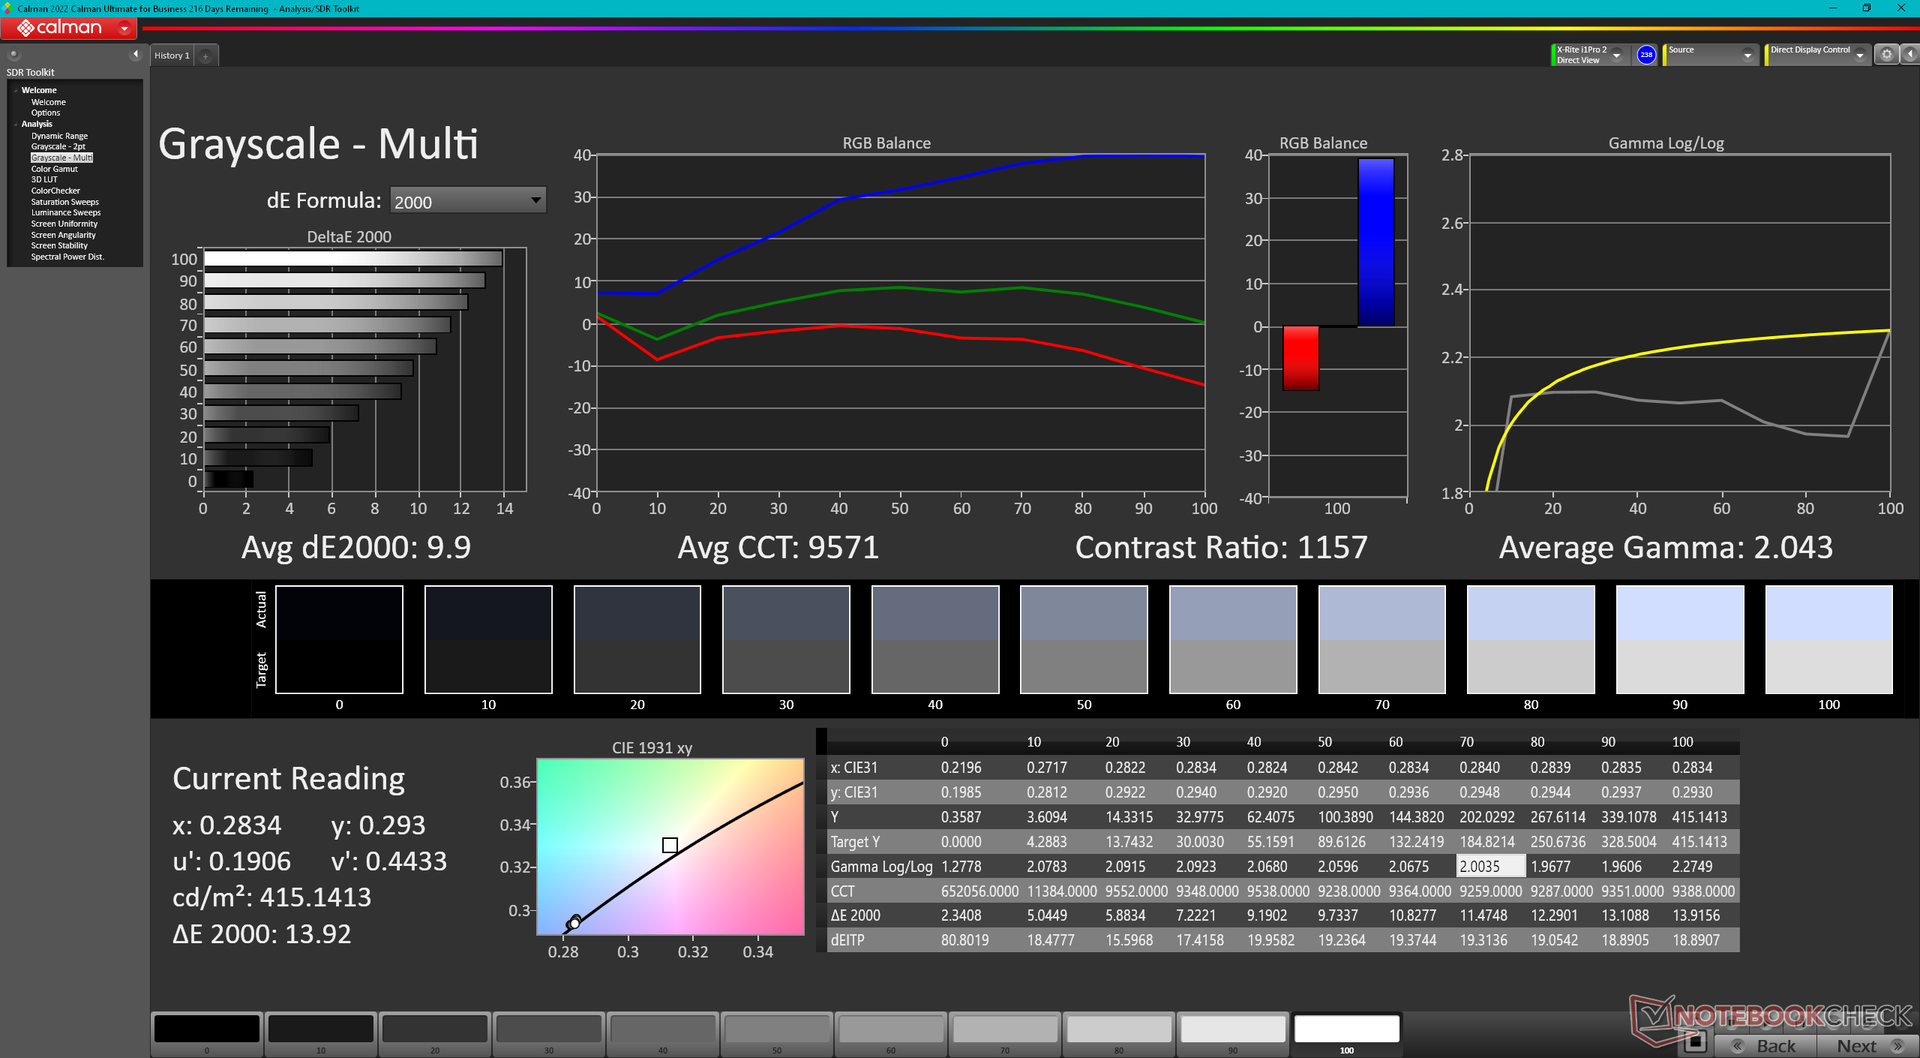
CCT: 9571 K
| GPD Win 4 G1618-04, IPS, 1920x1080, 6" | GPD Win Max 2 Toshiba HX_10.1_LCD, IPS, 2560x1600, 10.1" | GPD Win 3 IPS, 1280x720, 5.5" | Razer Blade Stealth i7-1165G7 GTX 1650 Ti Max-Q Sharp LQ133M1JW46, IPS, 1920x1080, 13.3" | Dell XPS 13 9315 2-in-1 Core i5-1230U BOE NE13A1M, IPS, 2880x1920, 13" | Asus Zenbook S 13 OLED SDC4172, OLED, 2880x1800, 13.3" | |
|---|---|---|---|---|---|---|
| Display | 4% | -5% | 5% | 11% | 39% | |
| Display P3 Coverage (%) | 63.1 | 69.8 11% | 59.5 -6% | 66 5% | 70.7 12% | 99.8 58% |
| sRGB Coverage (%) | 92 | 91 -1% | 89.6 -3% | 97.4 6% | 99.8 8% | 100 9% |
| AdobeRGB 1998 Coverage (%) | 64.6 | 66.6 3% | 61.4 -5% | 67.1 4% | 72.6 12% | 97.8 51% |
| Response Times | 16% | -36% | -98% | -42% | 92% | |
| Response Time Grey 50% / Grey 80% * (ms) | 26.8 ? | 21.2 ? 21% | 40 ? -49% | 57.6 ? -115% | 44 ? -64% | 2.1 ? 92% |
| Response Time Black / White * (ms) | 20.9 ? | 18.7 ? 11% | 25.6 ? -22% | 37.6 ? -80% | 24.8 ? -19% | 1.68 ? 92% |
| PWM Frequency (Hz) | 240.4 ? | |||||
| Screen | 8% | -9% | 24% | 41% | 196% | |
| Brightness middle (cd/m²) | 413.1 | 396.7 -4% | 468.8 13% | 356.8 -14% | 507 23% | 336 -19% |
| Brightness (cd/m²) | 407 | 381 -6% | 460 13% | 336 -17% | 486 19% | 338 -17% |
| Brightness Distribution (%) | 81 | 89 10% | 93 15% | 88 9% | 87 7% | 99 22% |
| Black Level * (cd/m²) | 0.39 | 0.36 8% | 0.45 -15% | 0.34 13% | 0.34 13% | 0.02 95% |
| Contrast (:1) | 1059 | 1102 4% | 1042 -2% | 1049 -1% | 1491 41% | 16800 1486% |
| Colorchecker dE 2000 * | 6.97 | 6.31 9% | 9 -29% | 1.63 77% | 2.04 71% | 1.8 74% |
| Colorchecker dE 2000 max. * | 14.11 | 10.23 27% | 15.5 -10% | 5.03 64% | 3.1 78% | 3.8 73% |
| Colorchecker dE 2000 calibrated * | 1.24 | 1.44 -16% | 1.91 -54% | 1.08 13% | 0.86 31% | 1.8 -45% |
| Greyscale dE 2000 * | 9.9 | 5.5 44% | 10.9 -10% | 3 70% | 1.8 82% | 0.9 91% |
| Gamma | 2.04 108% | 2.17 101% | 2.13 103% | 2.23 99% | 2.12 104% | 2.22 99% |
| CCT | 9571 68% | 7502 87% | 10972 59% | 6434 101% | 6561 99% | 6580 99% |
| Color Space (Percent of AdobeRGB 1998) (%) | 56.6 | 62 | ||||
| Color Space (Percent of sRGB) (%) | 89.2 | 97.6 | ||||
| Total Average (Program / Settings) | 9% /
9% | -17% /
-12% | -23% /
2% | 3% /
22% | 109% /
147% |
* ... smaller is better
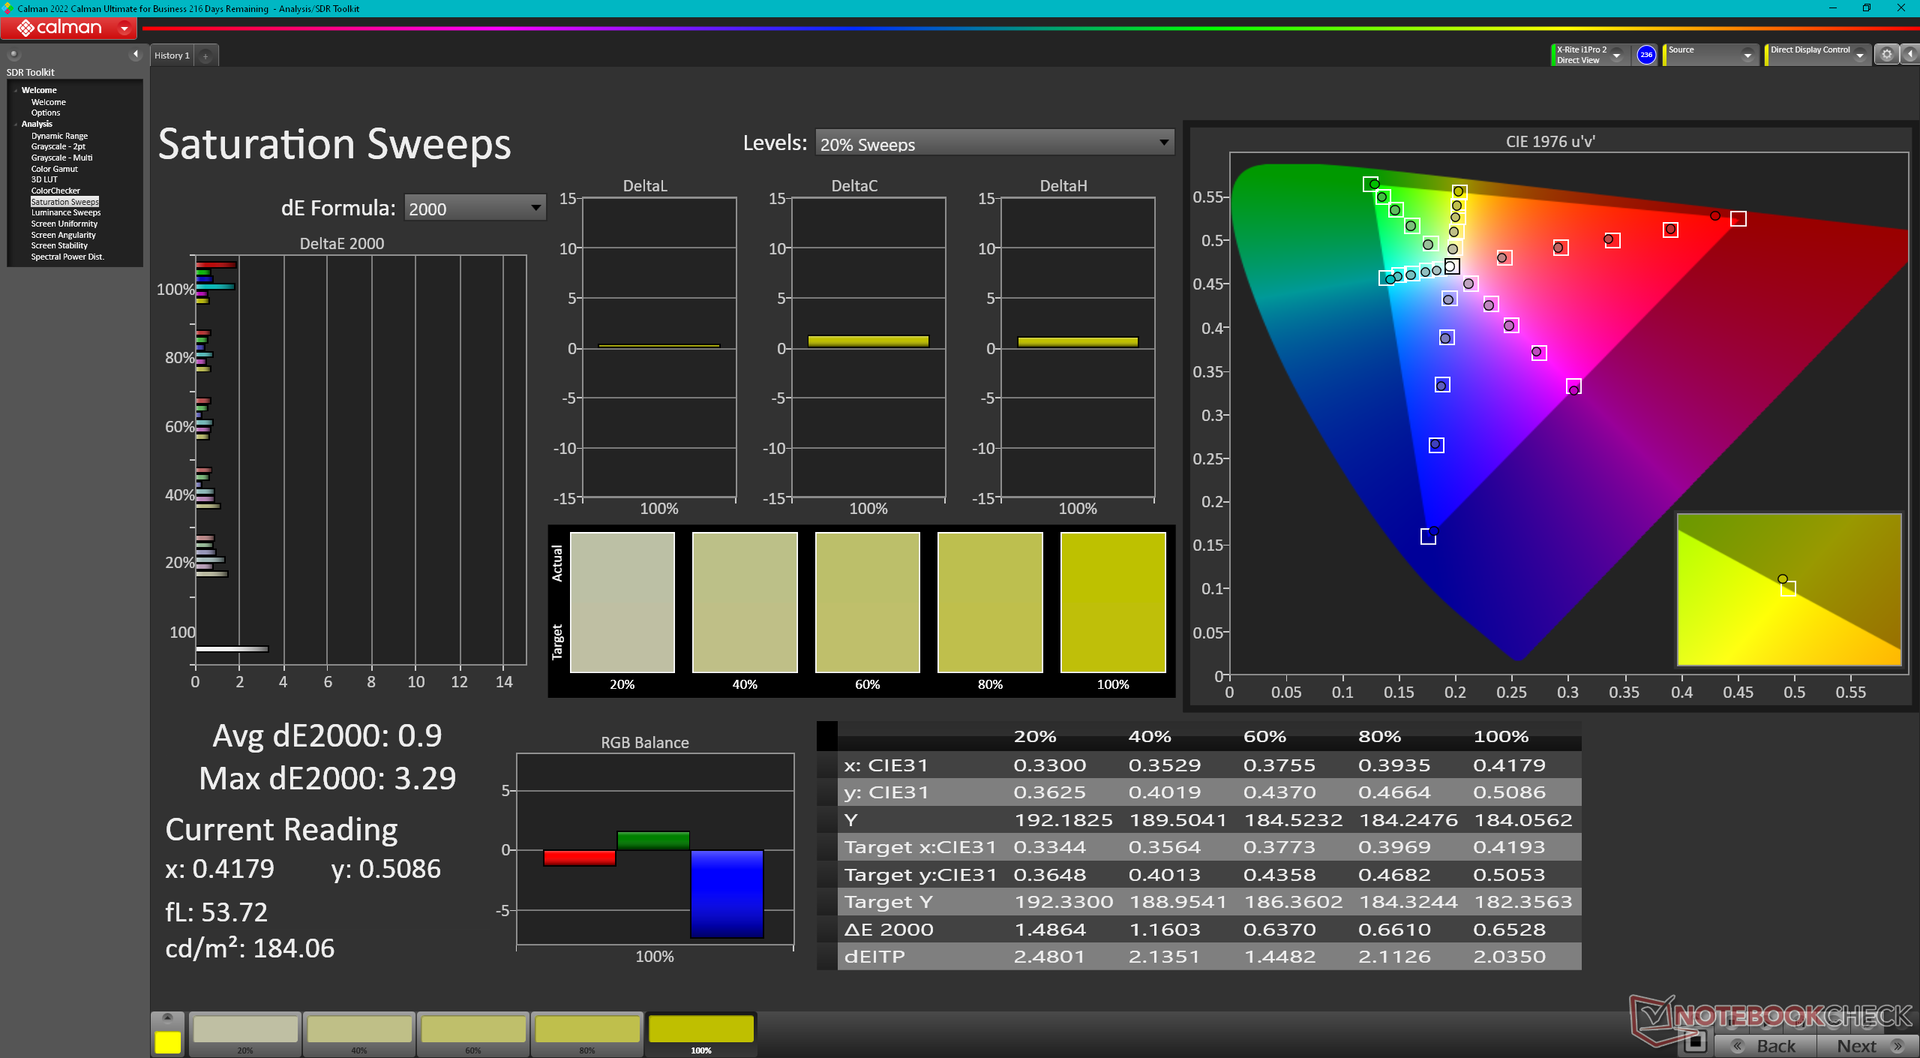
The display is poorly calibreated out of the box. Color temperature in particular is too cool at 9571 and so the screen appear overly blue. Calibrating the display ourselves with an X-Rite colorimeter would improve average grayscale and color deltaE values significantly from 9.9 and 6.97 to just 2.1 and 1.24, respectively. We recommend applying our calibrated ICM profile above to get more sRGB-accurate colors out of the display.
Display Response Times
| ↔ Response Time Black to White | ||
|---|---|---|
| 20.9 ms ... rise ↗ and fall ↘ combined | ↗ 11.4 ms rise | 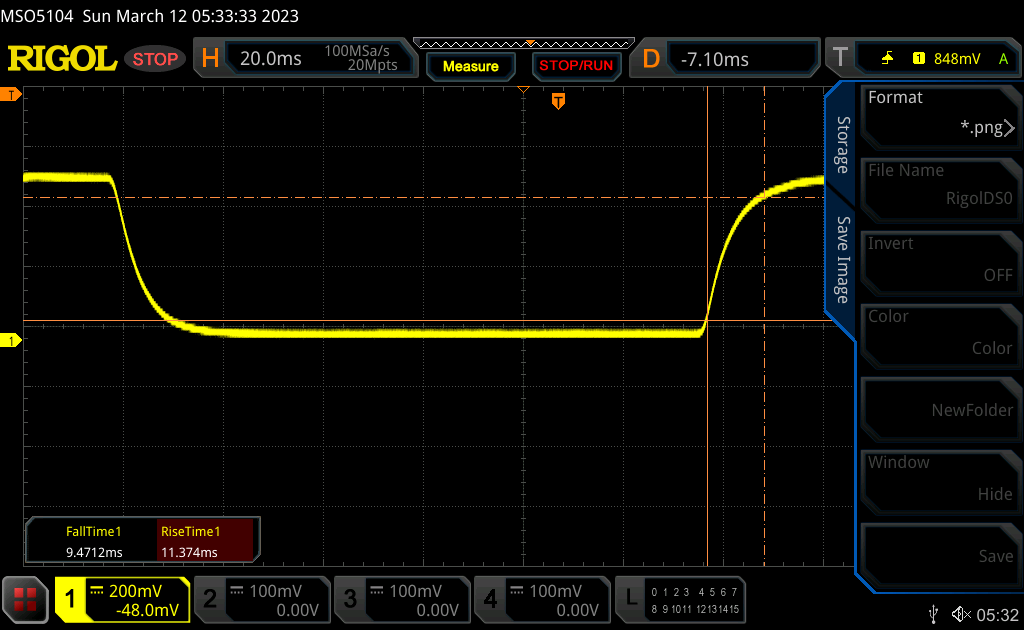 |
| ↘ 9.5 ms fall | ||
| The screen shows good response rates in our tests, but may be too slow for competitive gamers. In comparison, all tested devices range from 0.1 (minimum) to 240 (maximum) ms. » 47 % of all devices are better. This means that the measured response time is similar to the average of all tested devices (19.8 ms). | ||
| ↔ Response Time 50% Grey to 80% Grey | ||
| 26.8 ms ... rise ↗ and fall ↘ combined | ↗ 12.5 ms rise | 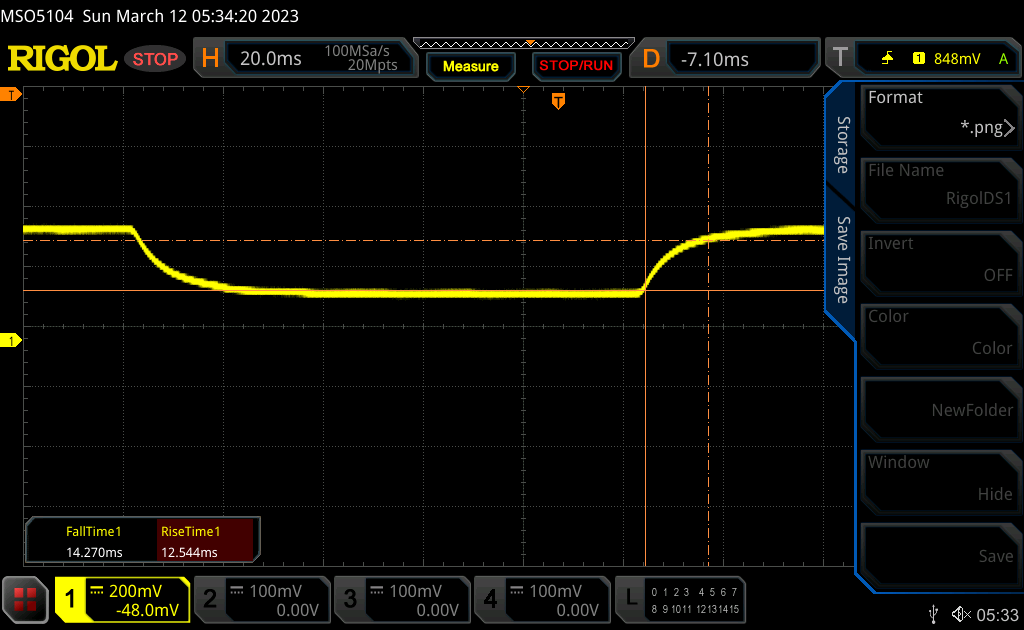 |
| ↘ 14.3 ms fall | ||
| The screen shows relatively slow response rates in our tests and may be too slow for gamers. In comparison, all tested devices range from 0.165 (minimum) to 636 (maximum) ms. » 37 % of all devices are better. This means that the measured response time is better than the average of all tested devices (31 ms). | ||
Screen Flickering / PWM (Pulse-Width Modulation)
| Screen flickering / PWM not detected | 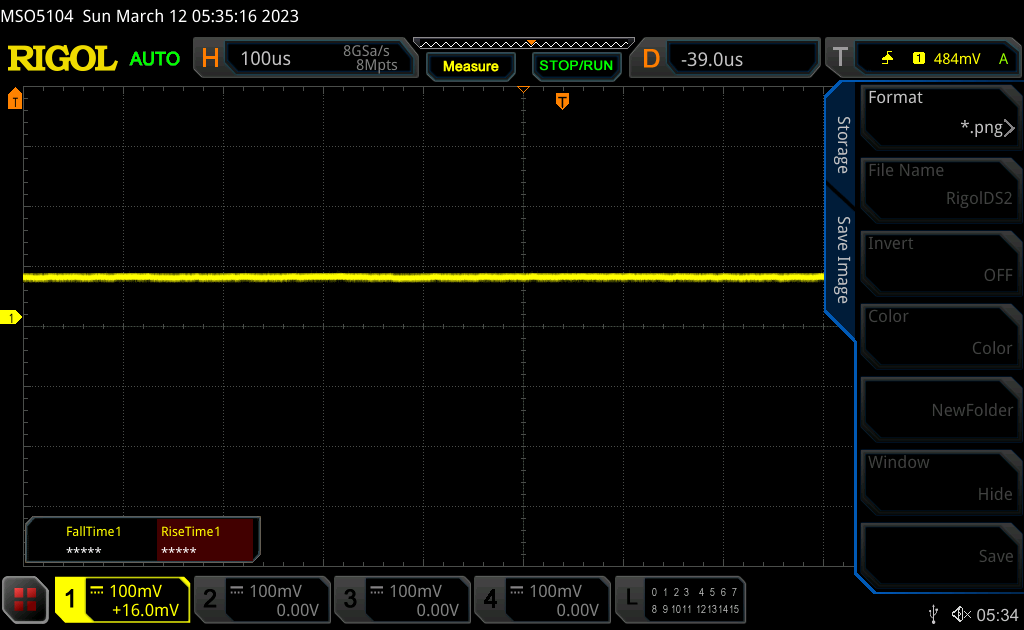 | ||
In comparison: 52 % of all tested devices do not use PWM to dim the display. If PWM was detected, an average of 7769 (minimum: 5 - maximum: 343500) Hz was measured. | |||
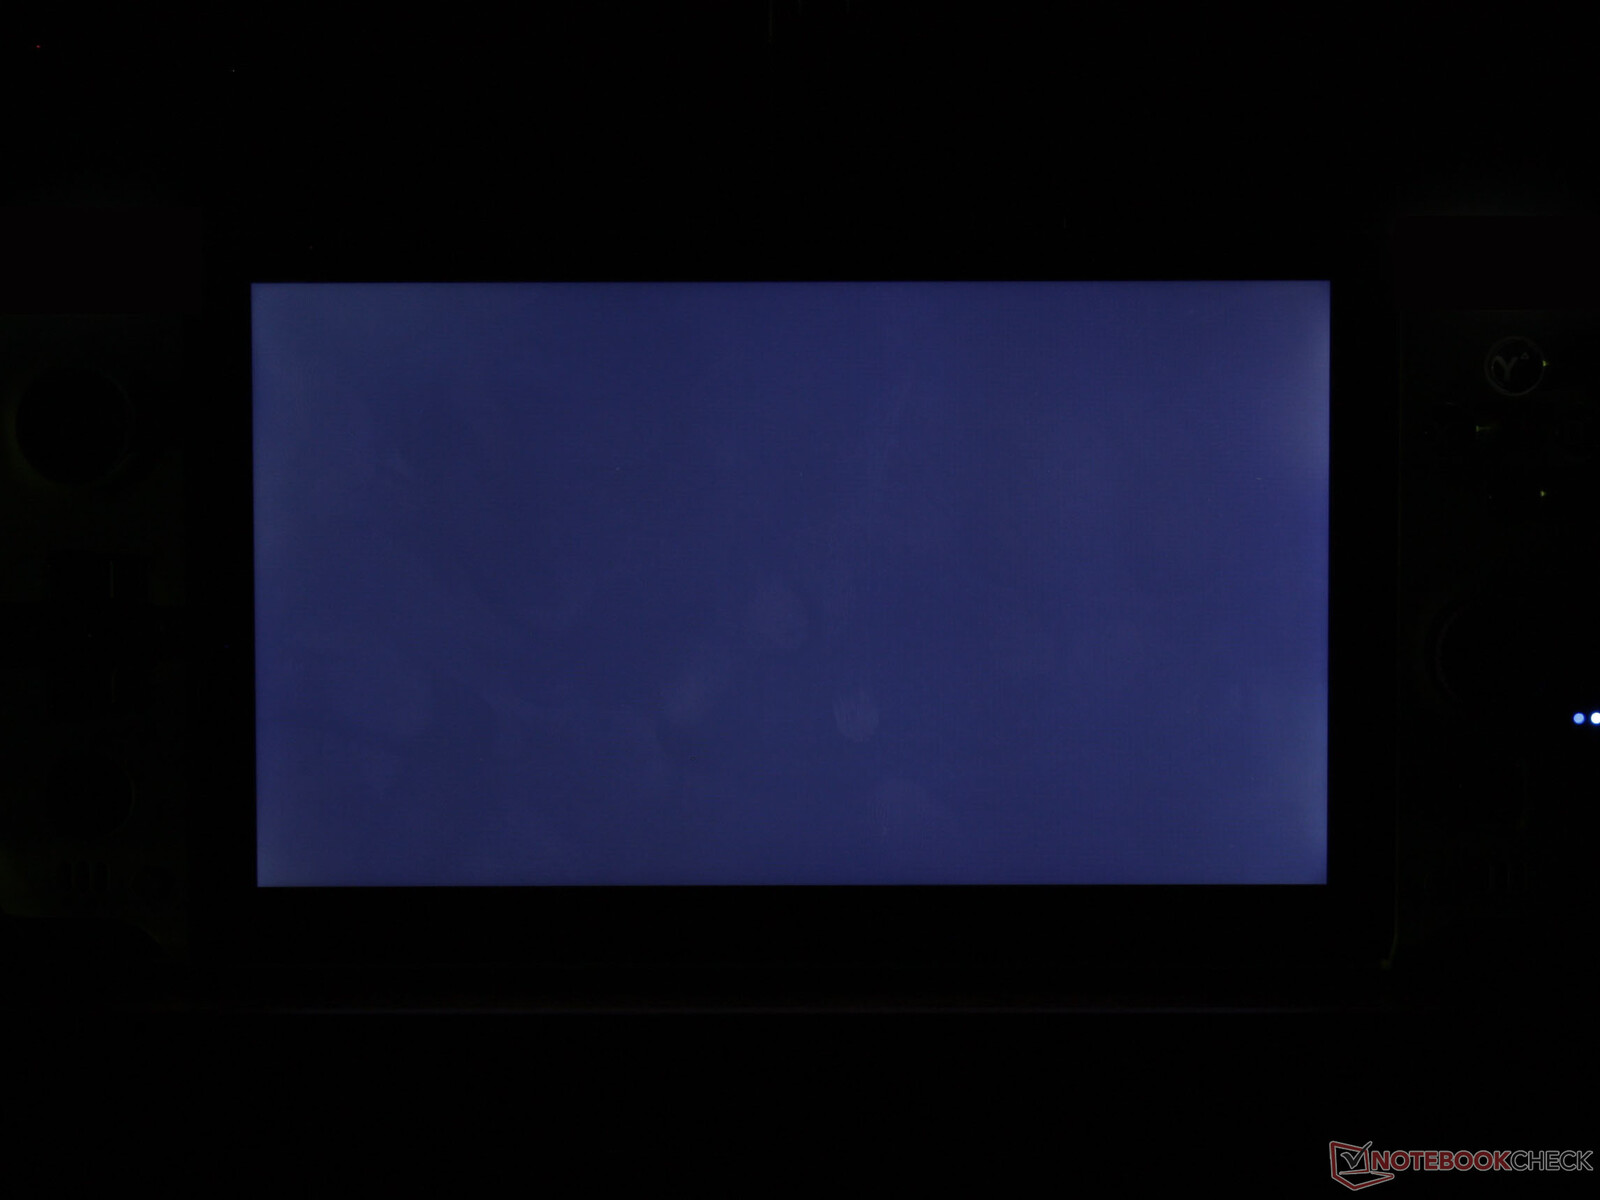
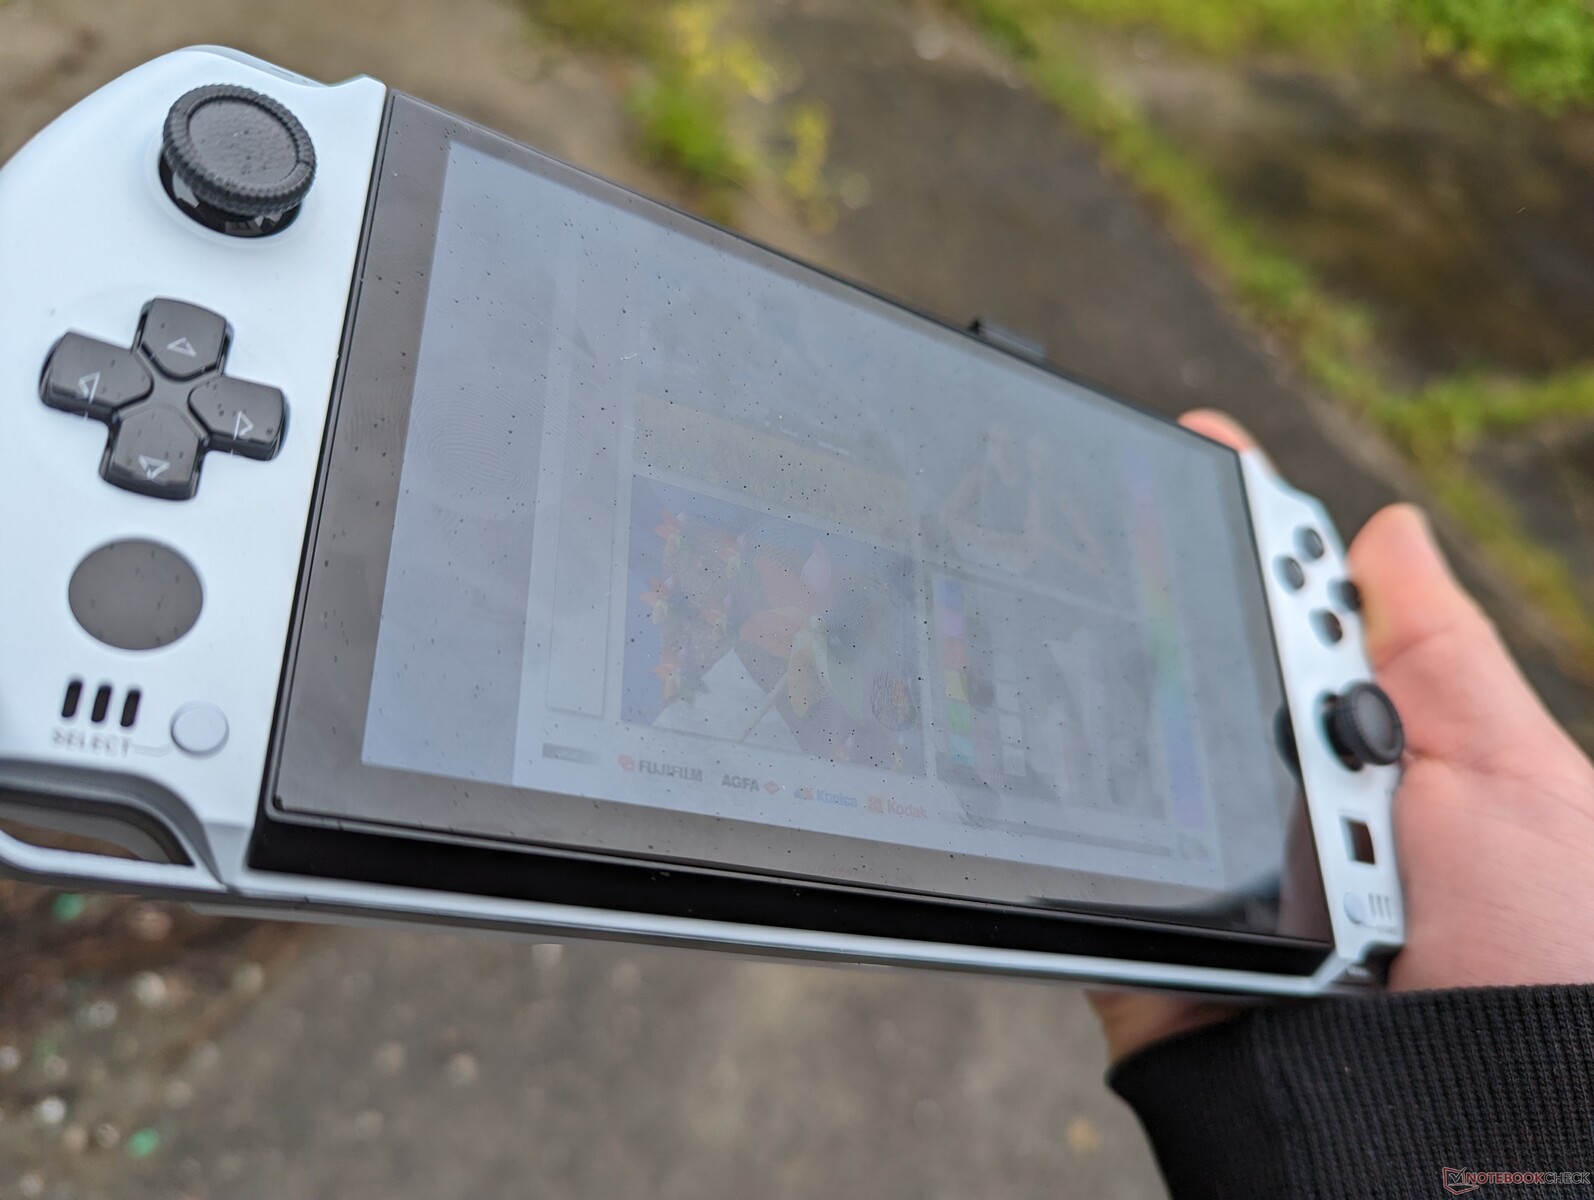
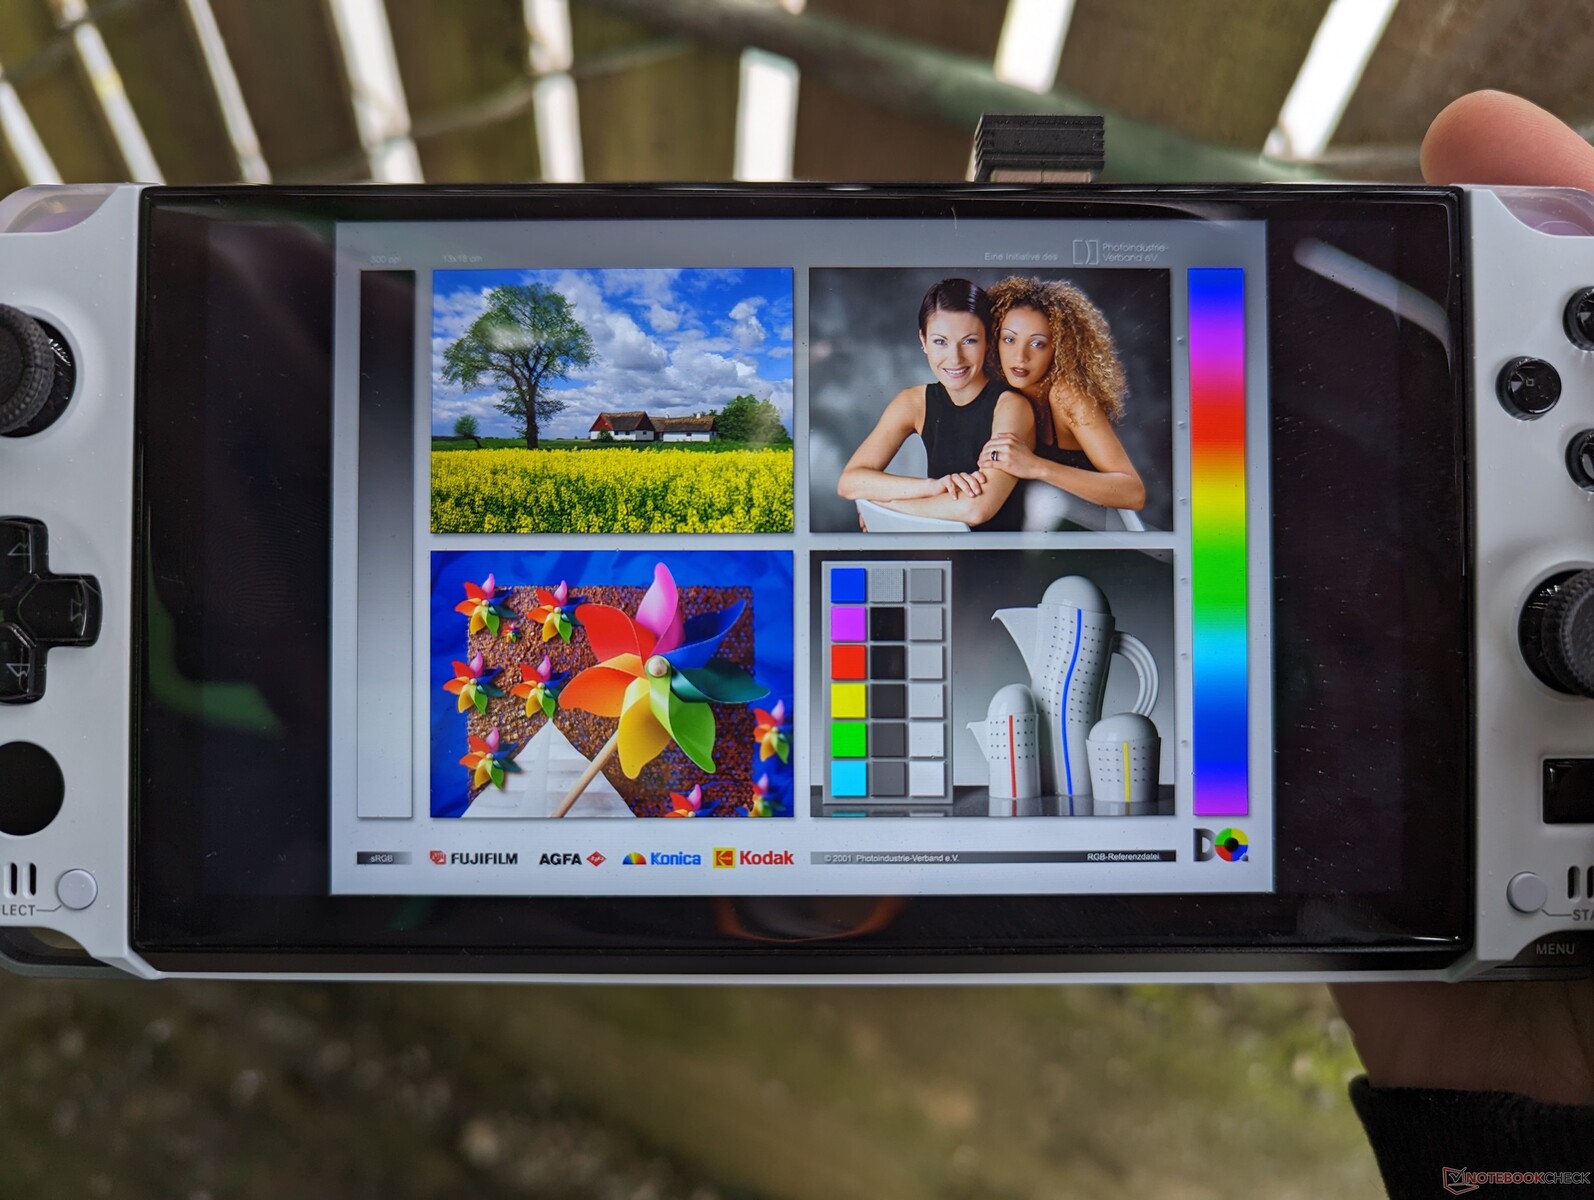
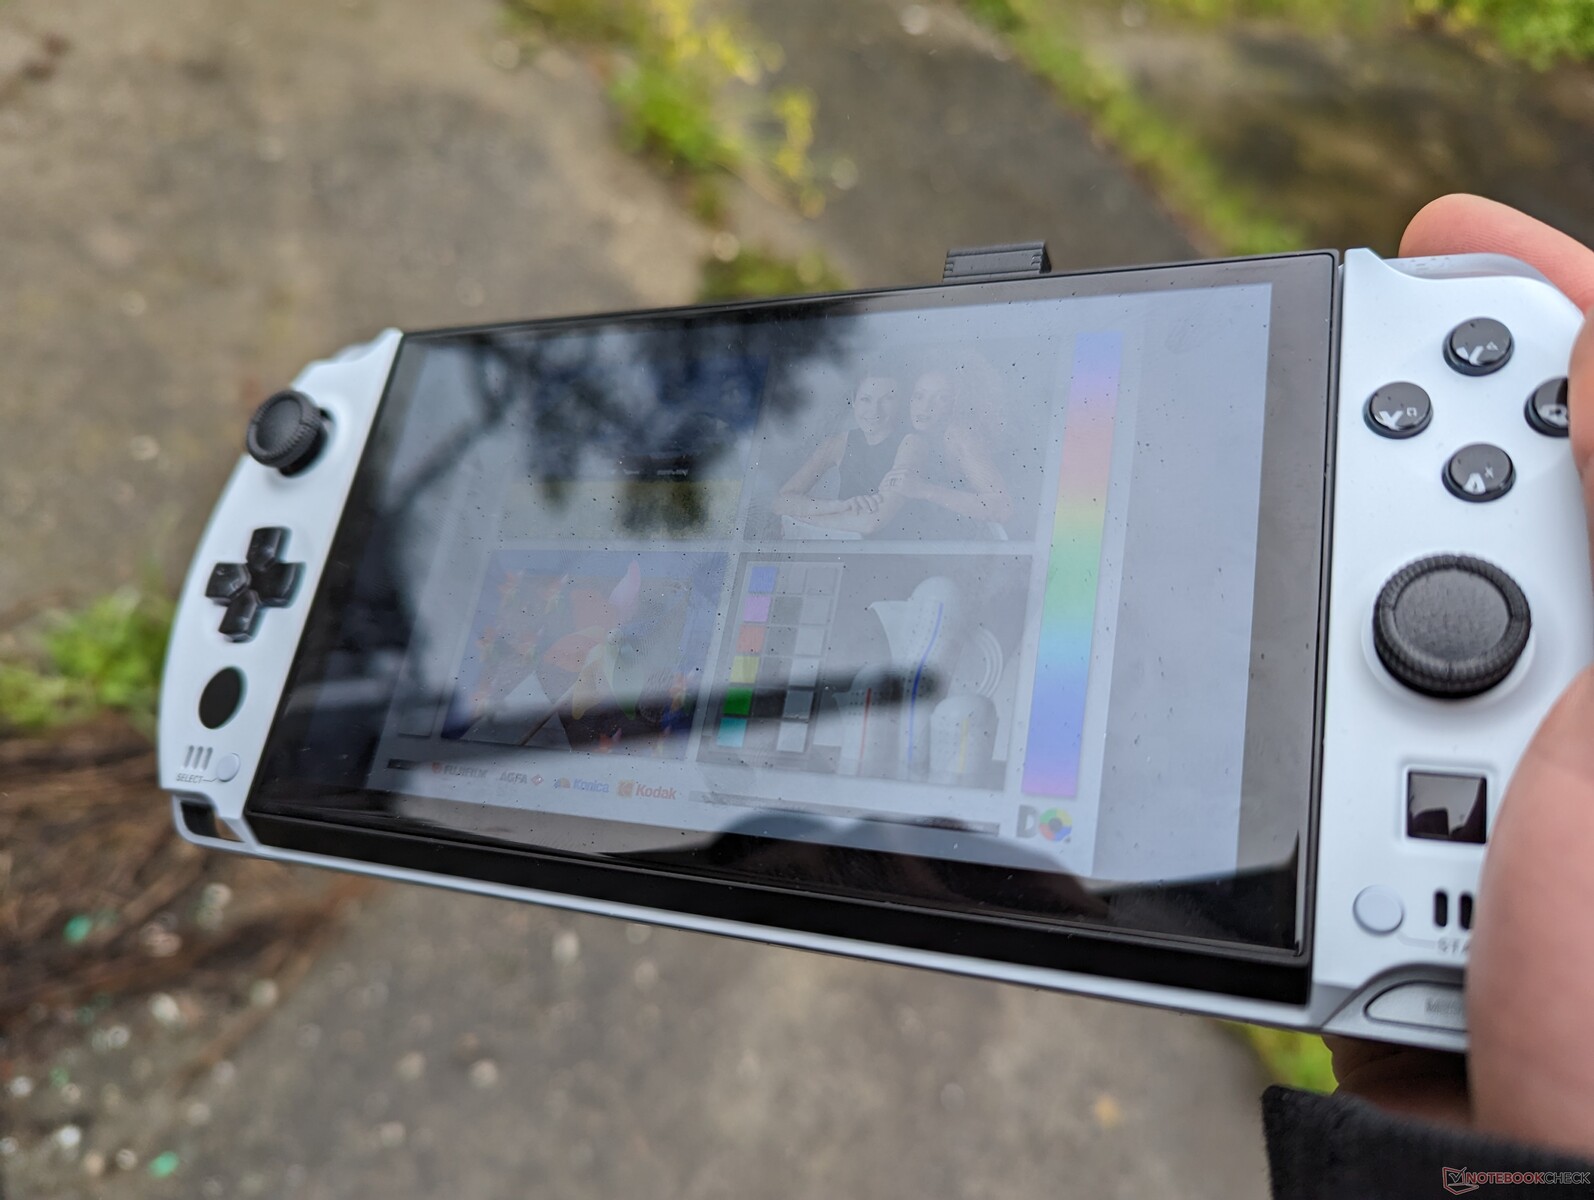
Outdoor visibility is pretty good if under shade. Anything brighter, however, and glare becomes an issue on the glossy screen. The 400-nit screen is not nearly as bright as on most popular smartphones where displays can reach 1000 nits or higher.
Performance — Same Power as the Latest Ultrabooks
Testing Conditions
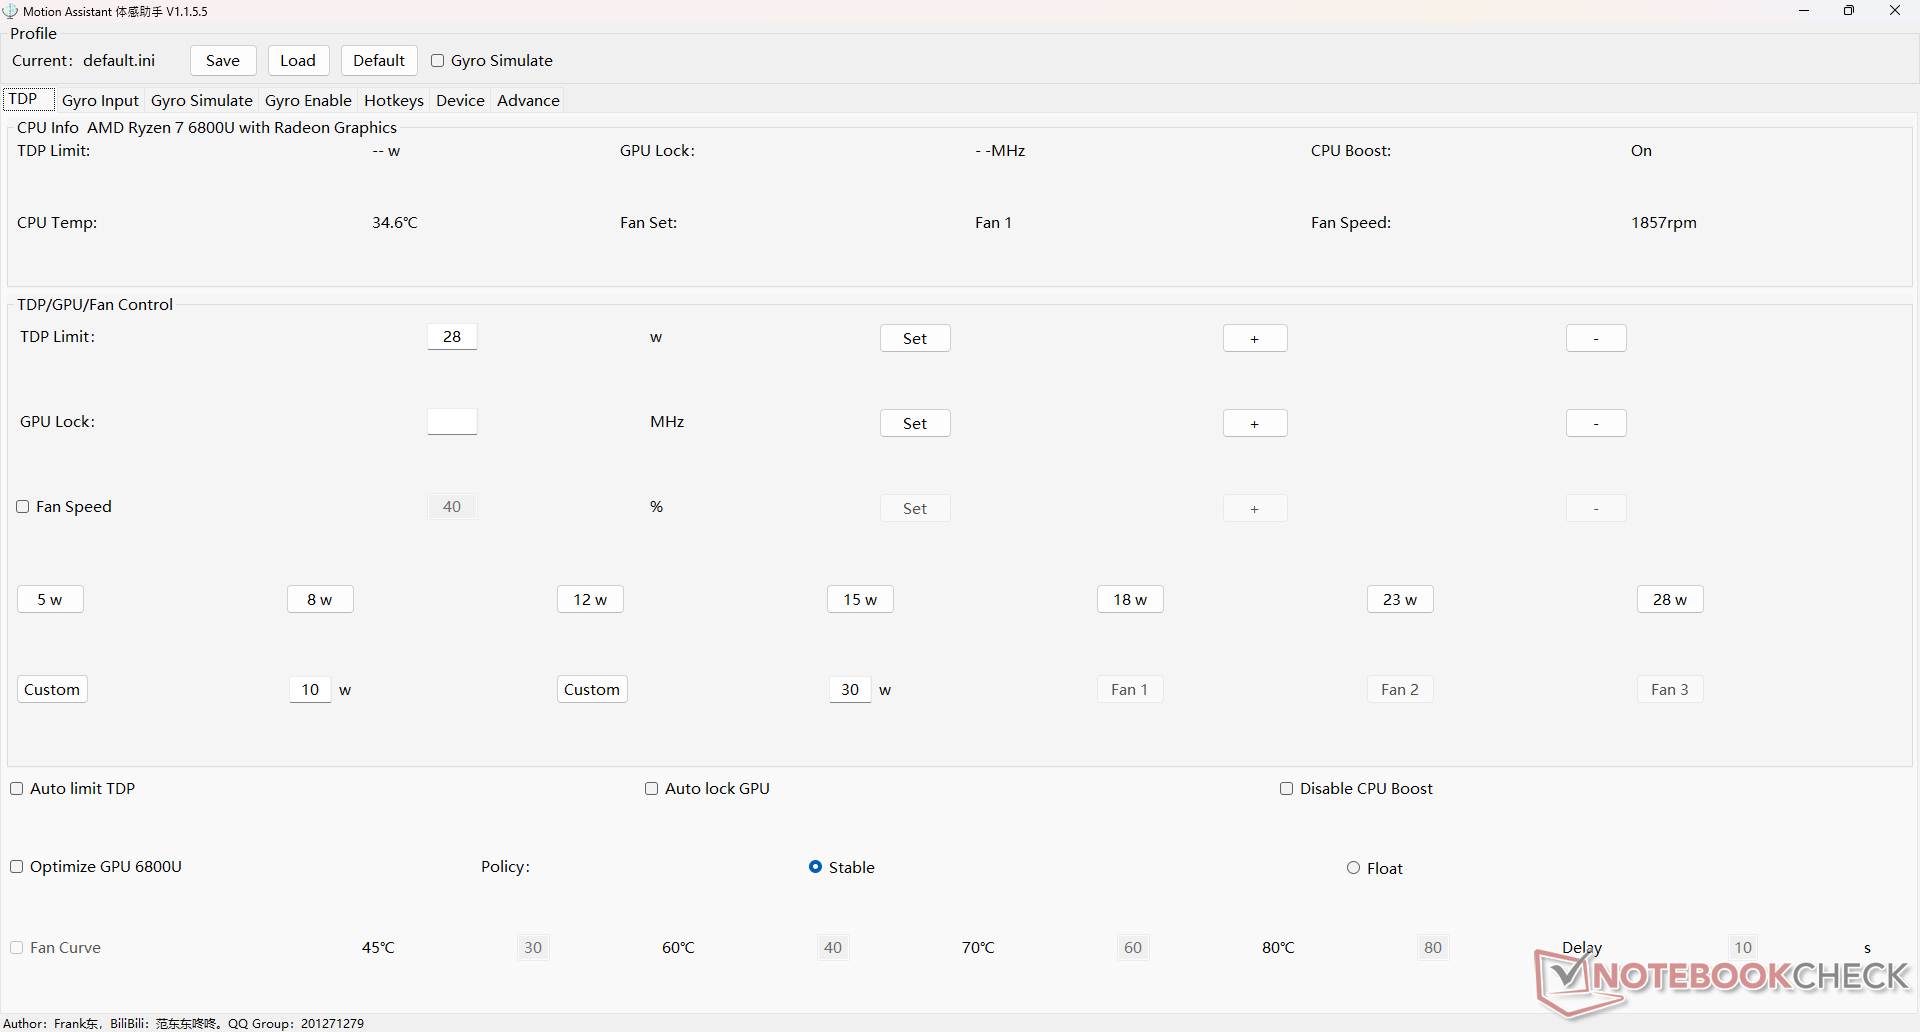
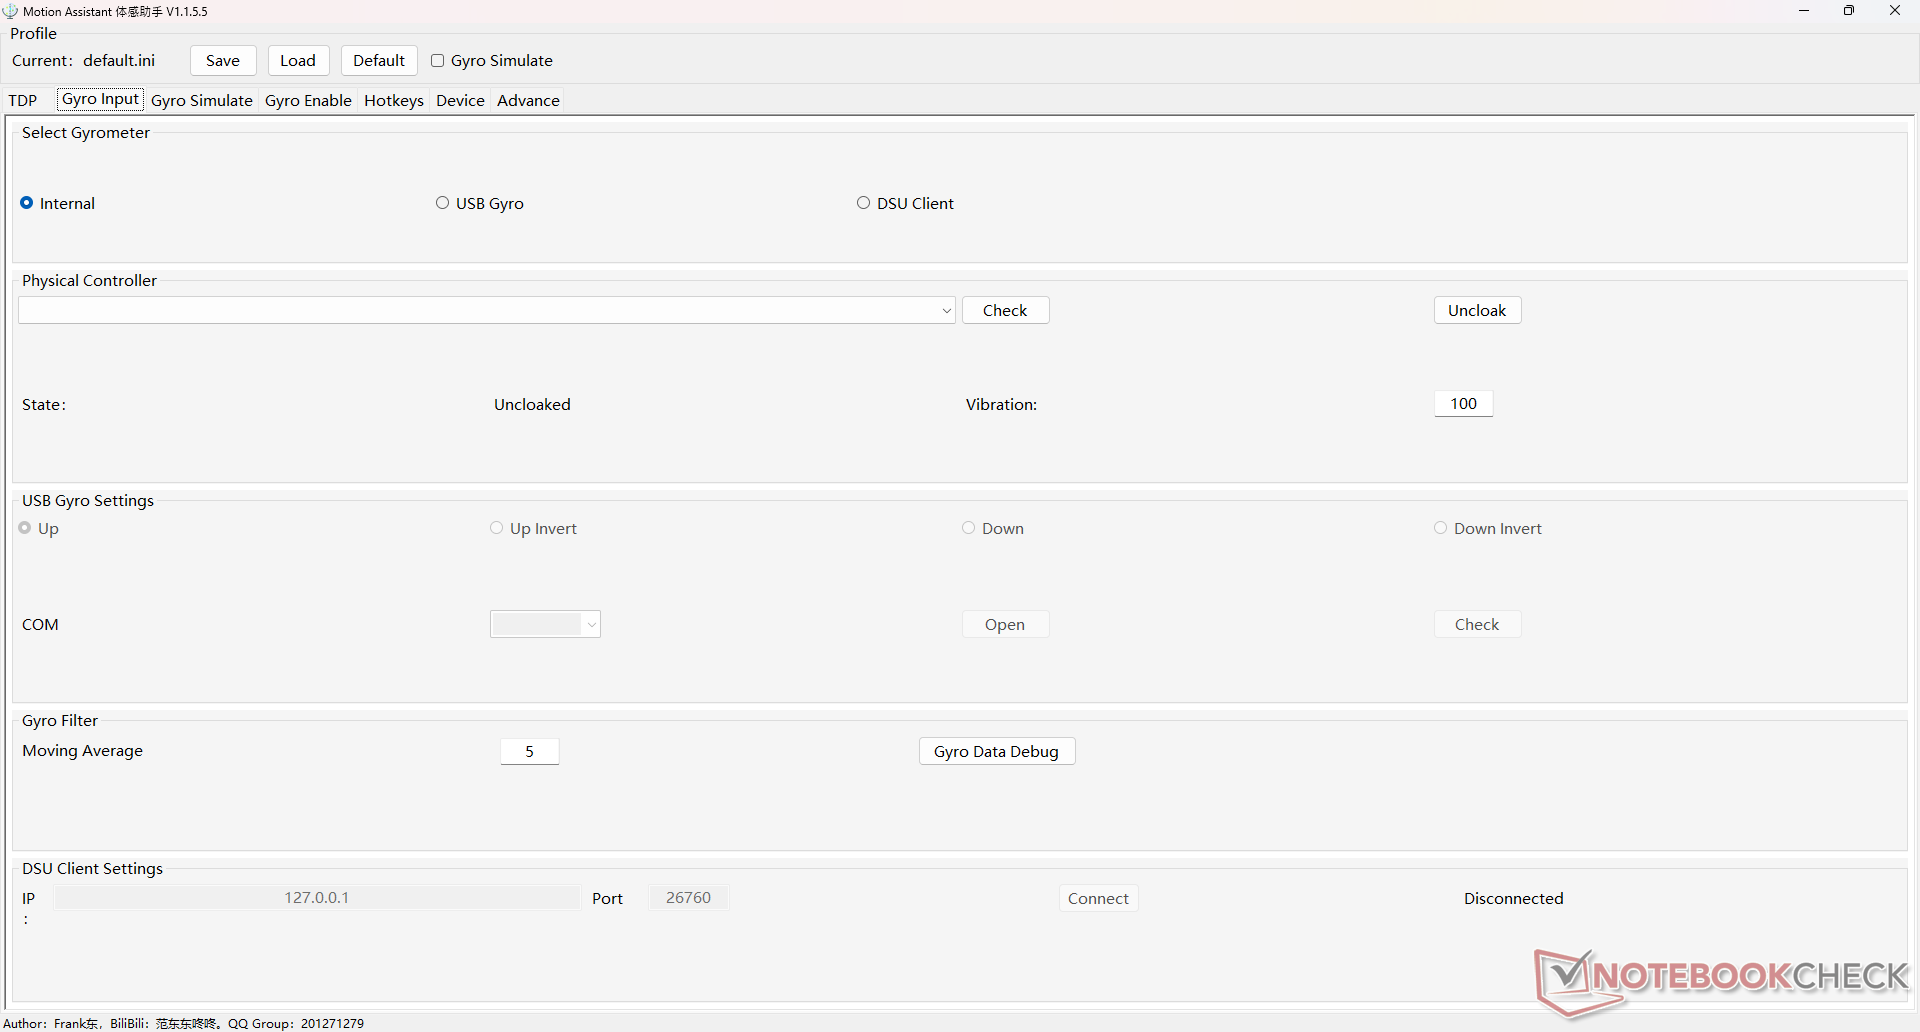
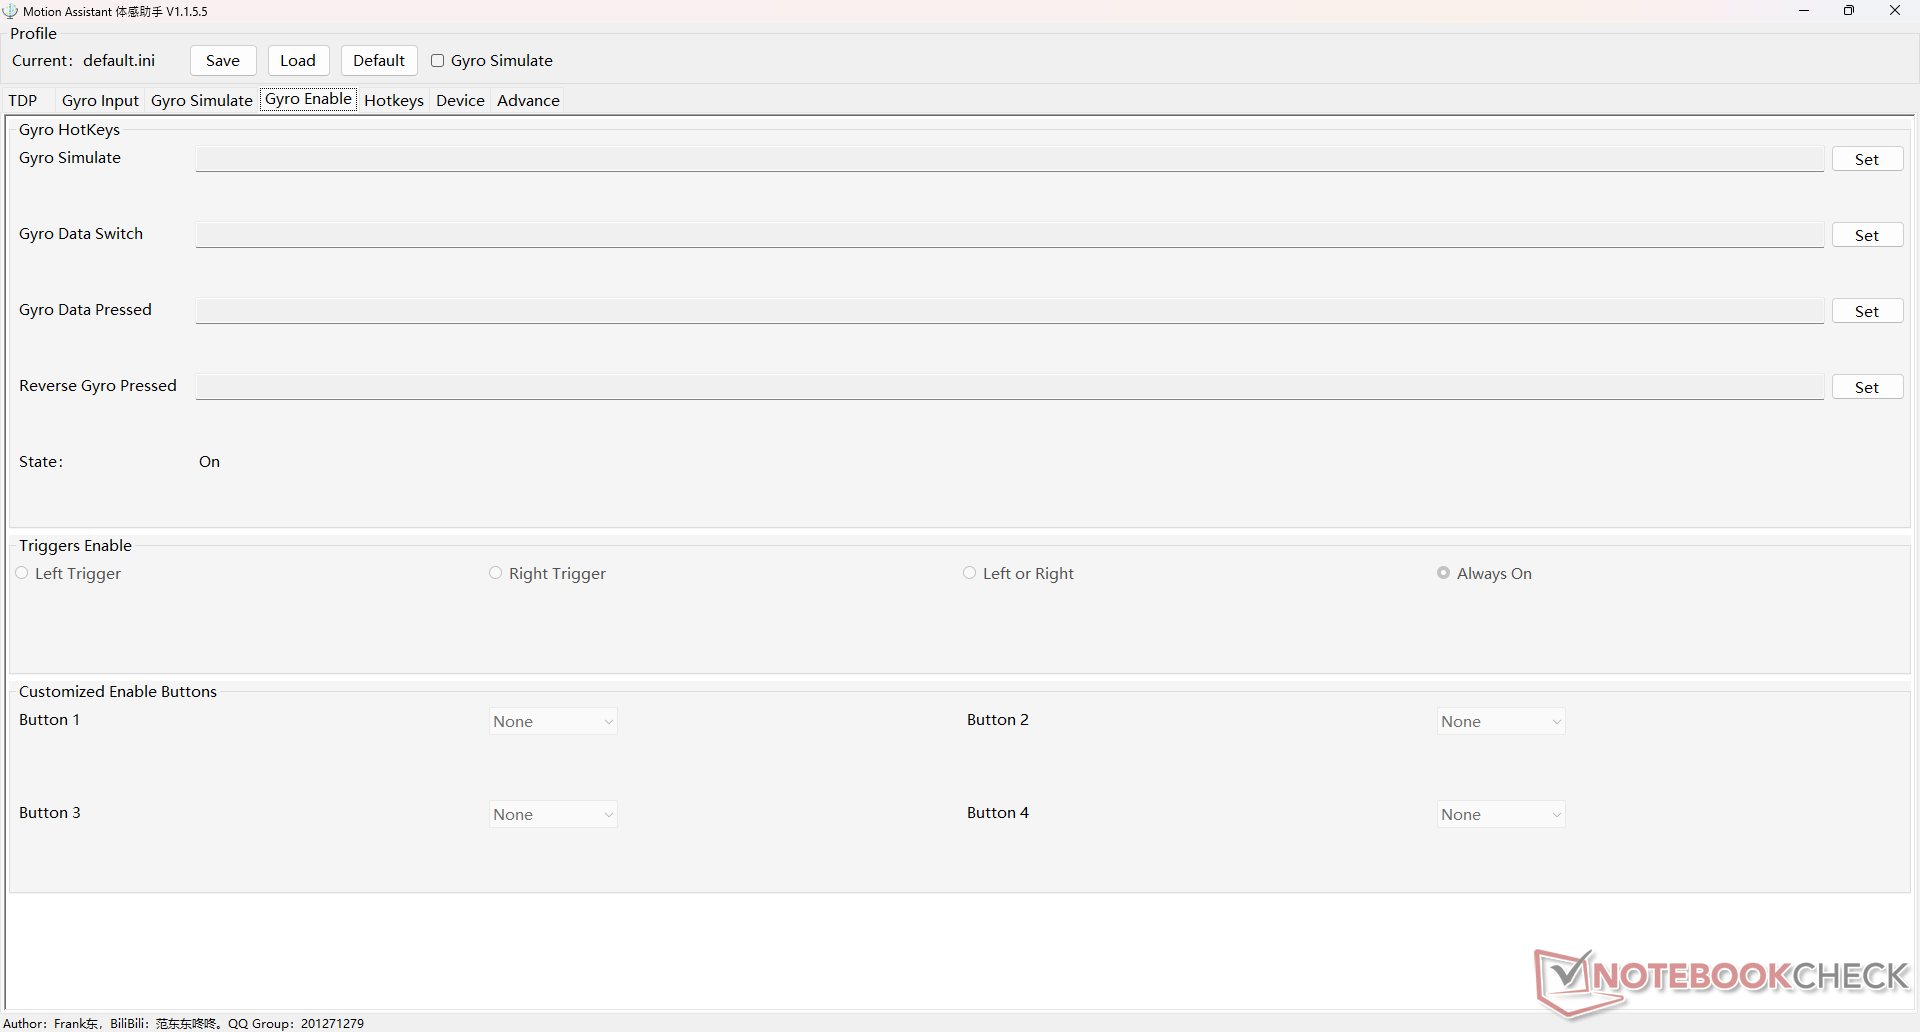
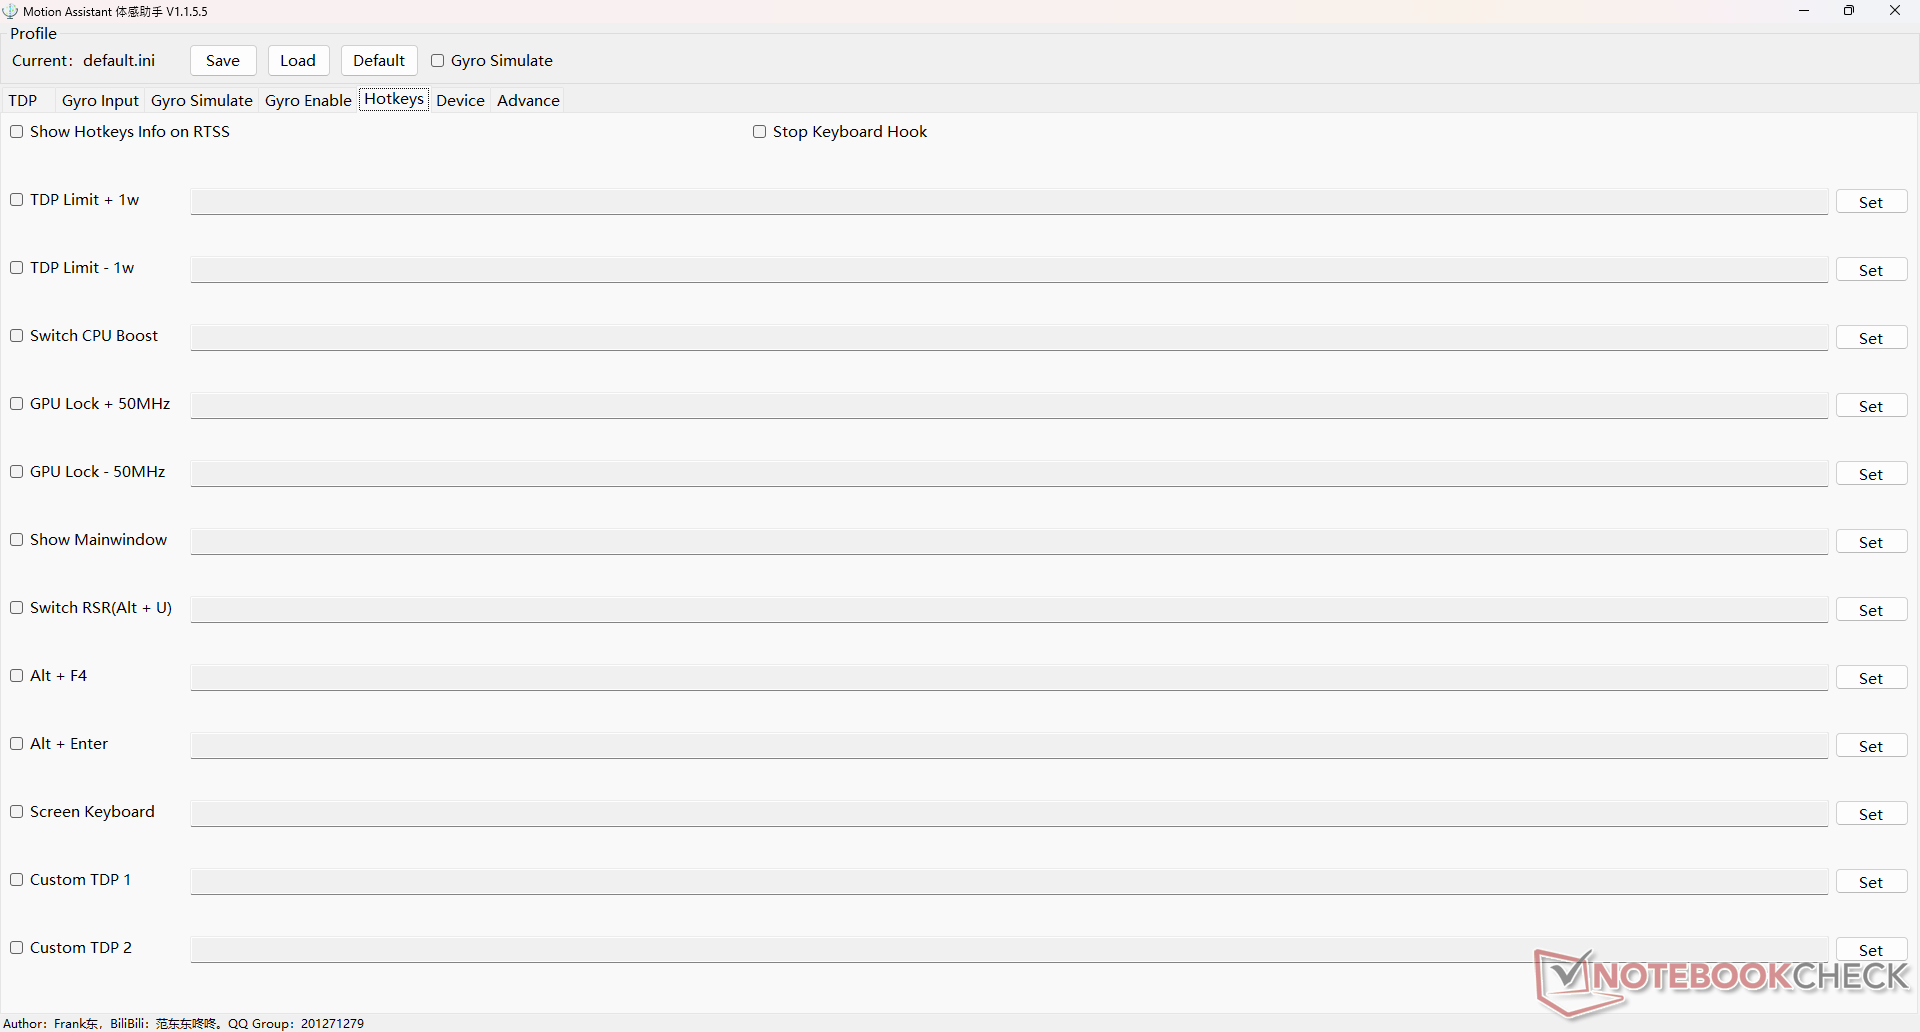
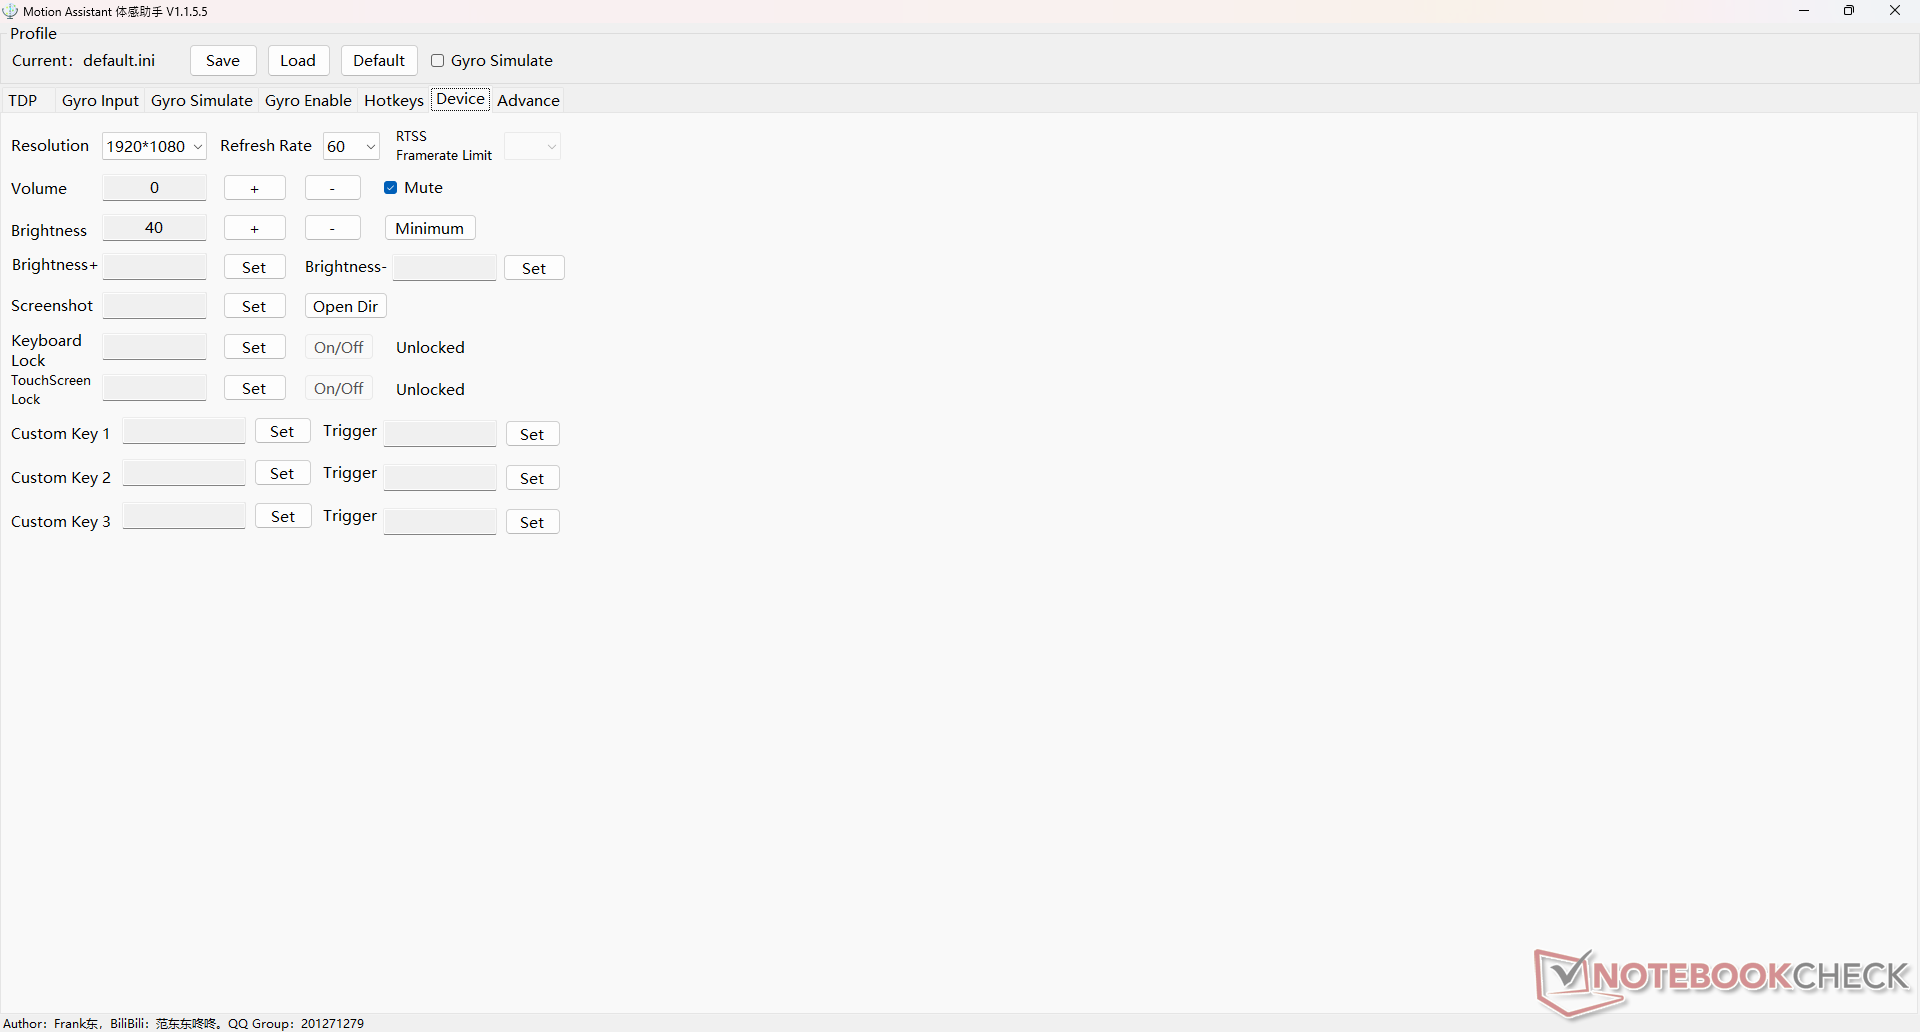
We set Windows to Performance mode and Motion Assistant to 28 W prior to running any benchmarks below. We highly recommend that users become accustomed to Motion Assistant as it is the control center software for the Win 4. The screenshots below show the options that Motion Assistant has to offer.
Processor
The Ryzen 7 6800U is one of the fastest U-series processors in the market. It is the same CPU that powers many of the latest Ultrabooks including the Lenovo Yoga 7 14 or HP EliteBook 845 G9. Raw multi-thread performance is over 2x faster than the Core i5-1135G7 in the previous generation GPD Win 3.
Performance sustainability, however, could be a little better. Running CineBench R15 xT in a loop would result in an initial score of 1776 points before steadily dropping and stabilizing at an 18 percent performance deficit. The Asus Zenbook S13, which carries the same CPU, is able to maintain higher clock rates for longer periods.
Cinebench R15 Multi Loop
Cinebench R23: Multi Core | Single Core
Cinebench R20: CPU (Multi Core) | CPU (Single Core)
Cinebench R15: CPU Multi 64Bit | CPU Single 64Bit
Blender: v2.79 BMW27 CPU
7-Zip 18.03: 7z b 4 | 7z b 4 -mmt1
Geekbench 5.5: Multi-Core | Single-Core
HWBOT x265 Benchmark v2.2: 4k Preset
LibreOffice : 20 Documents To PDF
R Benchmark 2.5: Overall mean
* ... smaller is better
AIDA64: FP32 Ray-Trace | FPU Julia | CPU SHA3 | CPU Queen | FPU SinJulia | FPU Mandel | CPU AES | CPU ZLib | FP64 Ray-Trace | CPU PhotoWorxx
| Performance rating | |
| Average AMD Ryzen 7 6800U | |
| GPD Win 4 | |
| Asus Zenbook S 13 OLED | |
| Dell XPS 13 9315 2-in-1 Core i5-1230U | |
| GPD Win Max 2 | |
| AIDA64 / FP32 Ray-Trace | |
| Average AMD Ryzen 7 6800U (10902 - 12818, n=6) | |
| GPD Win 4 | |
| Asus Zenbook S 13 OLED | |
| Dell XPS 13 9315 2-in-1 Core i5-1230U | |
| GPD Win Max 2 | |
| AIDA64 / FPU Julia | |
| Average AMD Ryzen 7 6800U (67503 - 84031, n=6) | |
| GPD Win 4 | |
| Asus Zenbook S 13 OLED | |
| Dell XPS 13 9315 2-in-1 Core i5-1230U | |
| GPD Win Max 2 | |
| AIDA64 / CPU SHA3 | |
| Average AMD Ryzen 7 6800U (2296 - 2818, n=6) | |
| GPD Win 4 | |
| Asus Zenbook S 13 OLED | |
| Dell XPS 13 9315 2-in-1 Core i5-1230U | |
| GPD Win Max 2 | |
| AIDA64 / CPU Queen | |
| GPD Win 4 | |
| Average AMD Ryzen 7 6800U (62082 - 96306, n=6) | |
| Asus Zenbook S 13 OLED | |
| GPD Win Max 2 | |
| Dell XPS 13 9315 2-in-1 Core i5-1230U | |
| AIDA64 / FPU SinJulia | |
| GPD Win 4 | |
| Average AMD Ryzen 7 6800U (7753 - 11982, n=6) | |
| Asus Zenbook S 13 OLED | |
| GPD Win Max 2 | |
| Dell XPS 13 9315 2-in-1 Core i5-1230U | |
| AIDA64 / FPU Mandel | |
| Average AMD Ryzen 7 6800U (37417 - 45748, n=6) | |
| GPD Win 4 | |
| Asus Zenbook S 13 OLED | |
| Dell XPS 13 9315 2-in-1 Core i5-1230U | |
| GPD Win Max 2 | |
| AIDA64 / CPU AES | |
| GPD Win 4 | |
| Asus Zenbook S 13 OLED | |
| Average AMD Ryzen 7 6800U (50547 - 115681, n=6) | |
| GPD Win Max 2 | |
| Dell XPS 13 9315 2-in-1 Core i5-1230U | |
| AIDA64 / CPU ZLib | |
| Average AMD Ryzen 7 6800U (554 - 755, n=6) | |
| GPD Win 4 | |
| Asus Zenbook S 13 OLED | |
| GPD Win Max 2 | |
| Dell XPS 13 9315 2-in-1 Core i5-1230U | |
| AIDA64 / FP64 Ray-Trace | |
| Average AMD Ryzen 7 6800U (5825 - 6694, n=6) | |
| GPD Win 4 | |
| Asus Zenbook S 13 OLED | |
| Dell XPS 13 9315 2-in-1 Core i5-1230U | |
| GPD Win Max 2 | |
| AIDA64 / CPU PhotoWorxx | |
| Dell XPS 13 9315 2-in-1 Core i5-1230U | |
| GPD Win Max 2 | |
| GPD Win 4 | |
| Average AMD Ryzen 7 6800U (24728 - 27274, n=6) | |
| Asus Zenbook S 13 OLED | |
System Performance
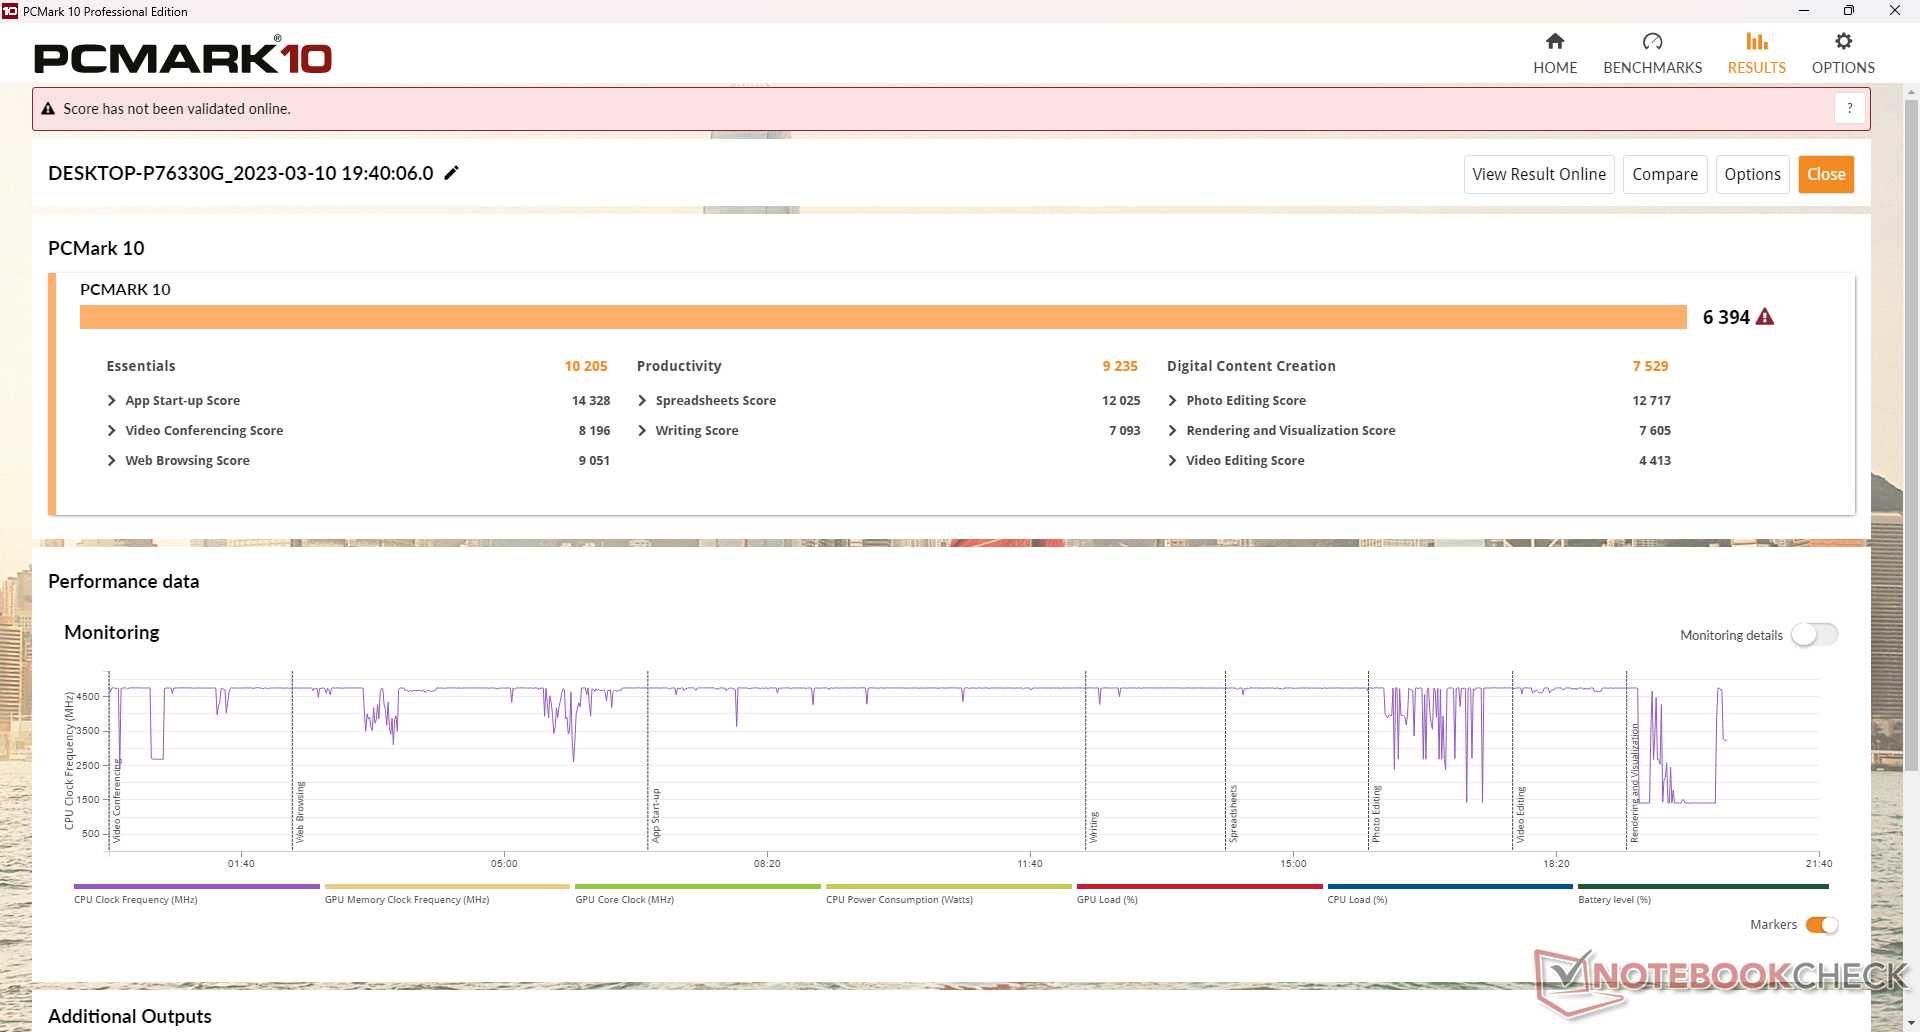
PCMark 10 results are comparable to the latest U-series-powered Ultrabooks while being well ahead of the older Win 3.
CrossMark: Overall | Productivity | Creativity | Responsiveness
| PCMark 10 / Score | |
| GPD Win 4 | |
| Asus Zenbook S 13 OLED | |
| Average AMD Ryzen 7 6800U, AMD Radeon 680M (5057 - 6639, n=7) | |
| Razer Blade Stealth i7-1165G7 GTX 1650 Ti Max-Q | |
| GPD Win Max 2 | |
| Dell XPS 13 9315 2-in-1 Core i5-1230U | |
| GPD Win 3 | |
| PCMark 10 / Essentials | |
| GPD Win Max 2 | |
| Asus Zenbook S 13 OLED | |
| GPD Win 4 | |
| Dell XPS 13 9315 2-in-1 Core i5-1230U | |
| Average AMD Ryzen 7 6800U, AMD Radeon 680M (8143 - 10766, n=6) | |
| GPD Win 3 | |
| Razer Blade Stealth i7-1165G7 GTX 1650 Ti Max-Q | |
| PCMark 10 / Productivity | |
| GPD Win 4 | |
| Asus Zenbook S 13 OLED | |
| Razer Blade Stealth i7-1165G7 GTX 1650 Ti Max-Q | |
| Average AMD Ryzen 7 6800U, AMD Radeon 680M (6089 - 9328, n=6) | |
| GPD Win Max 2 | |
| Dell XPS 13 9315 2-in-1 Core i5-1230U | |
| GPD Win 3 | |
| PCMark 10 / Digital Content Creation | |
| GPD Win 4 | |
| Average AMD Ryzen 7 6800U, AMD Radeon 680M (6066 - 8144, n=6) | |
| Asus Zenbook S 13 OLED | |
| Razer Blade Stealth i7-1165G7 GTX 1650 Ti Max-Q | |
| GPD Win Max 2 | |
| Dell XPS 13 9315 2-in-1 Core i5-1230U | |
| GPD Win 3 | |
| CrossMark / Overall | |
| GPD Win Max 2 | |
| GPD Win 4 | |
| Asus Zenbook S 13 OLED | |
| Average AMD Ryzen 7 6800U, AMD Radeon 680M (1009 - 1575, n=7) | |
| Dell XPS 13 9315 2-in-1 Core i5-1230U | |
| CrossMark / Productivity | |
| GPD Win Max 2 | |
| GPD Win 4 | |
| Asus Zenbook S 13 OLED | |
| Average AMD Ryzen 7 6800U, AMD Radeon 680M (971 - 1596, n=7) | |
| Dell XPS 13 9315 2-in-1 Core i5-1230U | |
| CrossMark / Creativity | |
| GPD Win Max 2 | |
| GPD Win 4 | |
| Asus Zenbook S 13 OLED | |
| Average AMD Ryzen 7 6800U, AMD Radeon 680M (1054 - 1686, n=7) | |
| Dell XPS 13 9315 2-in-1 Core i5-1230U | |
| CrossMark / Responsiveness | |
| GPD Win Max 2 | |
| GPD Win 4 | |
| Average AMD Ryzen 7 6800U, AMD Radeon 680M (994 - 1473, n=7) | |
| Asus Zenbook S 13 OLED | |
| Dell XPS 13 9315 2-in-1 Core i5-1230U | |
| PCMark 10 Score | 6394 points | |
Help | ||
| AIDA64 / Memory Copy | |
| GPD Win Max 2 | |
| Dell XPS 13 9315 2-in-1 Core i5-1230U | |
| GPD Win 4 | |
| Average AMD Ryzen 7 6800U (47010 - 52159, n=6) | |
| Asus Zenbook S 13 OLED | |
| AIDA64 / Memory Read | |
| GPD Win Max 2 | |
| Dell XPS 13 9315 2-in-1 Core i5-1230U | |
| GPD Win 4 | |
| Average AMD Ryzen 7 6800U (39197 - 45084, n=6) | |
| Asus Zenbook S 13 OLED | |
| AIDA64 / Memory Write | |
| Dell XPS 13 9315 2-in-1 Core i5-1230U | |
| GPD Win Max 2 | |
| GPD Win 4 | |
| Average AMD Ryzen 7 6800U (48723 - 51117, n=6) | |
| Asus Zenbook S 13 OLED | |
| AIDA64 / Memory Latency | |
| Asus Zenbook S 13 OLED | |
| Average AMD Ryzen 7 6800U (106.3 - 123.1, n=6) | |
| GPD Win 4 | |
| GPD Win Max 2 | |
| Dell XPS 13 9315 2-in-1 Core i5-1230U | |
* ... smaller is better
DPC Latency
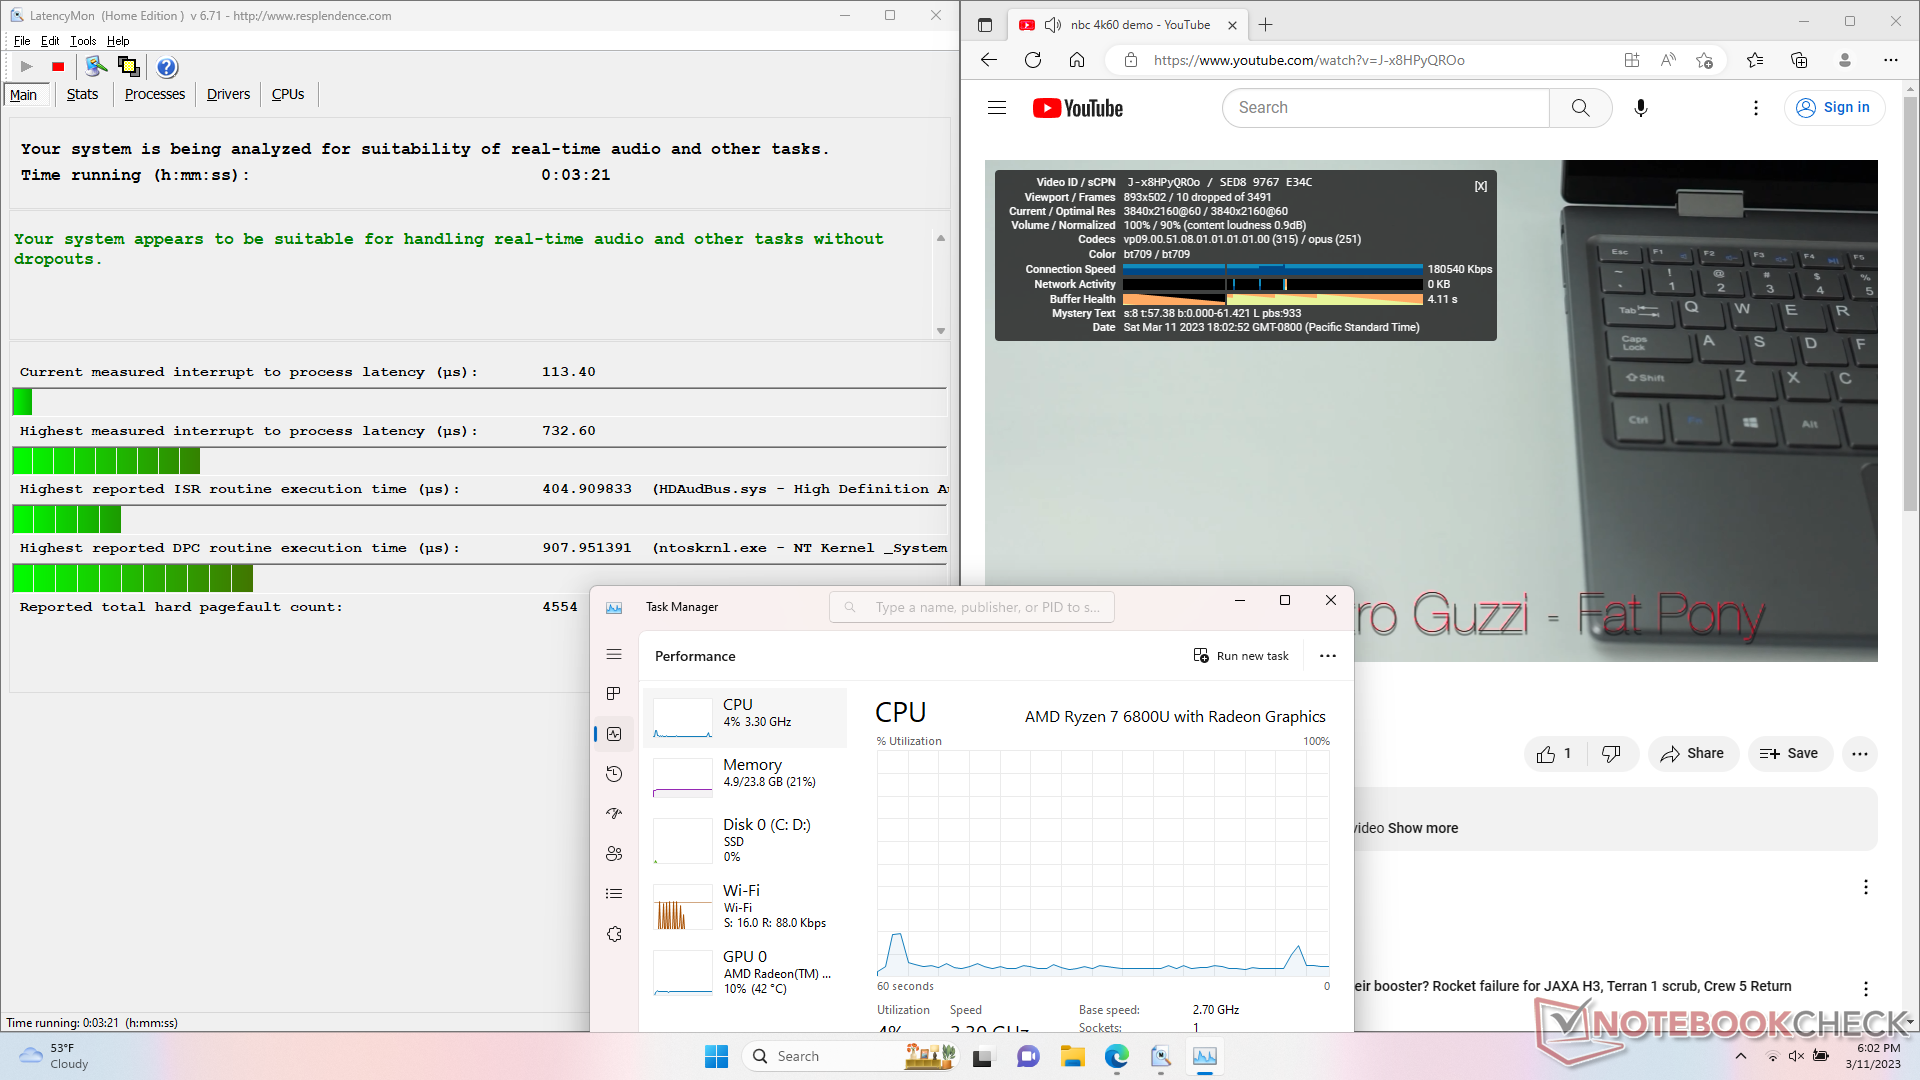
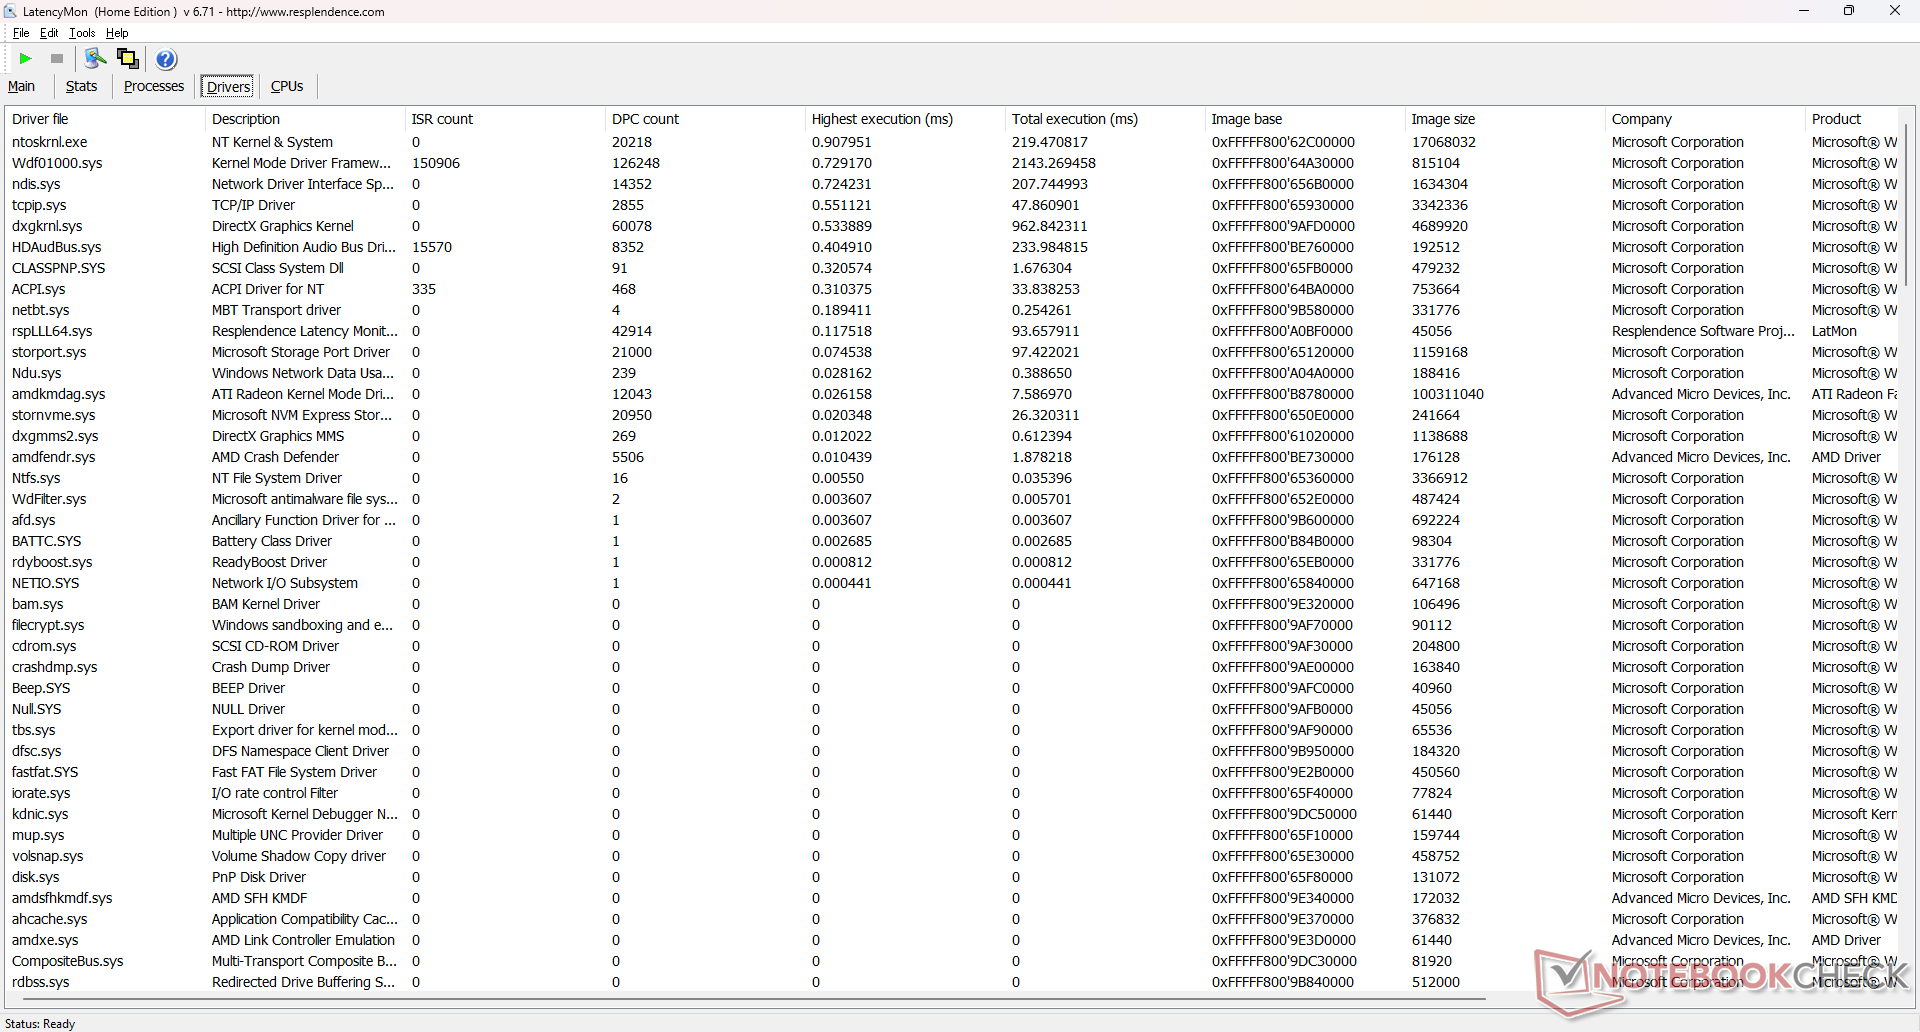
LatencyMon shows no major DPC issues when opening multiple browser tabs of our homepage. However, we're able to record a few dropped frames during our 4K60 video playback test even after multiple retries. The drops are infrequent and mostly unnoticeable, but they should not be occurring at all given the underlying hardware.
| DPC Latencies / LatencyMon - interrupt to process latency (max), Web, Youtube, Prime95 | |
| Dell XPS 13 9315 2-in-1 Core i5-1230U | |
| Razer Blade Stealth i7-1165G7 GTX 1650 Ti Max-Q | |
| GPD Win 3 | |
| GPD Win 4 | |
| Asus Zenbook S 13 OLED | |
| GPD Win Max 2 | |
* ... smaller is better
Storage Devices
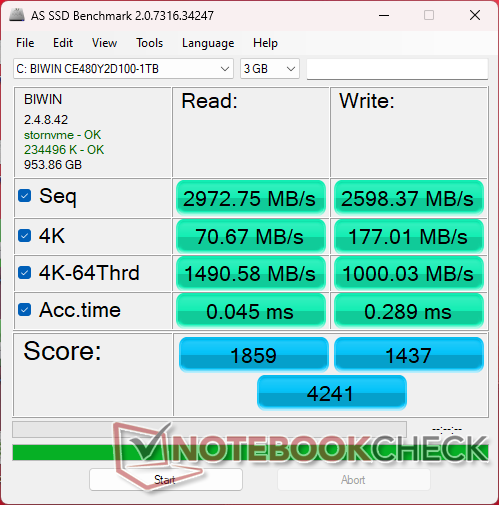
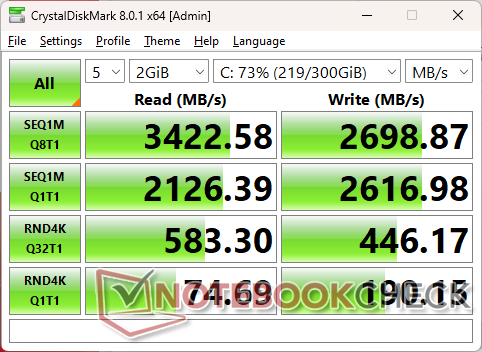
While the motherboard chipset supports PCIe4 x4 M.2 2280 NVMe drives, the unit ships with a slower PCIe3 drive instead. This isn't an issue since the model includes no heat spreader for the SSD and so a fast PCIe4 x4 drive would have likely throttled under stress anyway. The 1 TB Biwin PCIe3 SSD in our unit exhibits no performance throttling over time.

| Drive Performance rating - Percent | |
| Asus Zenbook S 13 OLED | |
| GPD Win Max 2 | |
| GPD Win 4 | |
| GPD Win 3 | |
| Razer Blade Stealth i7-1165G7 GTX 1650 Ti Max-Q | |
| Dell XPS 13 9315 2-in-1 Core i5-1230U | |
* ... smaller is better
Disk Throttling: DiskSpd Read Loop, Queue Depth 8
GPU Performance — Radeon 680M is Excellent for Handheld Gaming
The Radeon 680M is currently the fastest integrated GPU in the market. When compared to the competing Iris Xe Graphics G7 96EUs, the AMD solution is 40 to 45 percent faster or roughly 80 percent faster than the last generation Radeon RX Vega 8 series.
Most games are playable (>30 FPS) at the native resolution of 1080p including even demanding ones like Cyberpunk 2077 or Final Fantasy XV at lower settings. We recommend turning down texture quality and/or anti-aliasing to improve frame rate since these graphical features are much less impactful on small screen screen sizes.
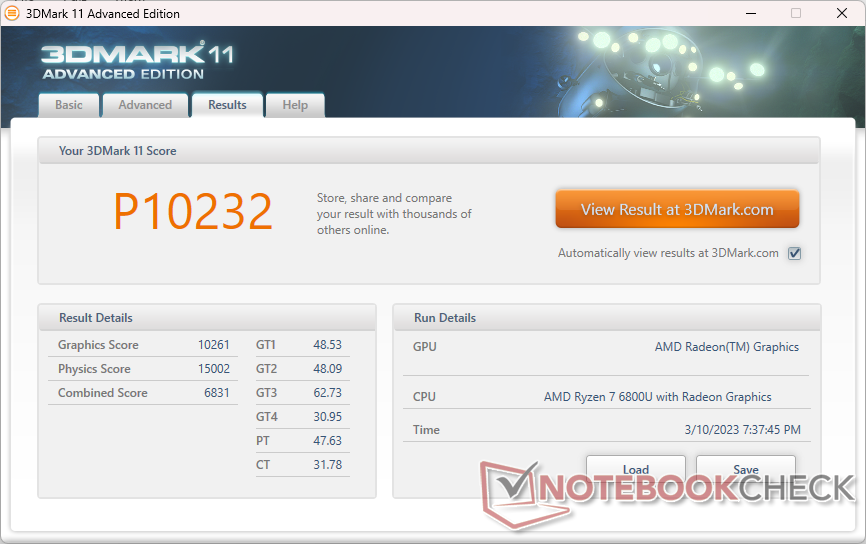
| 3DMark 11 Performance | 10232 points | |
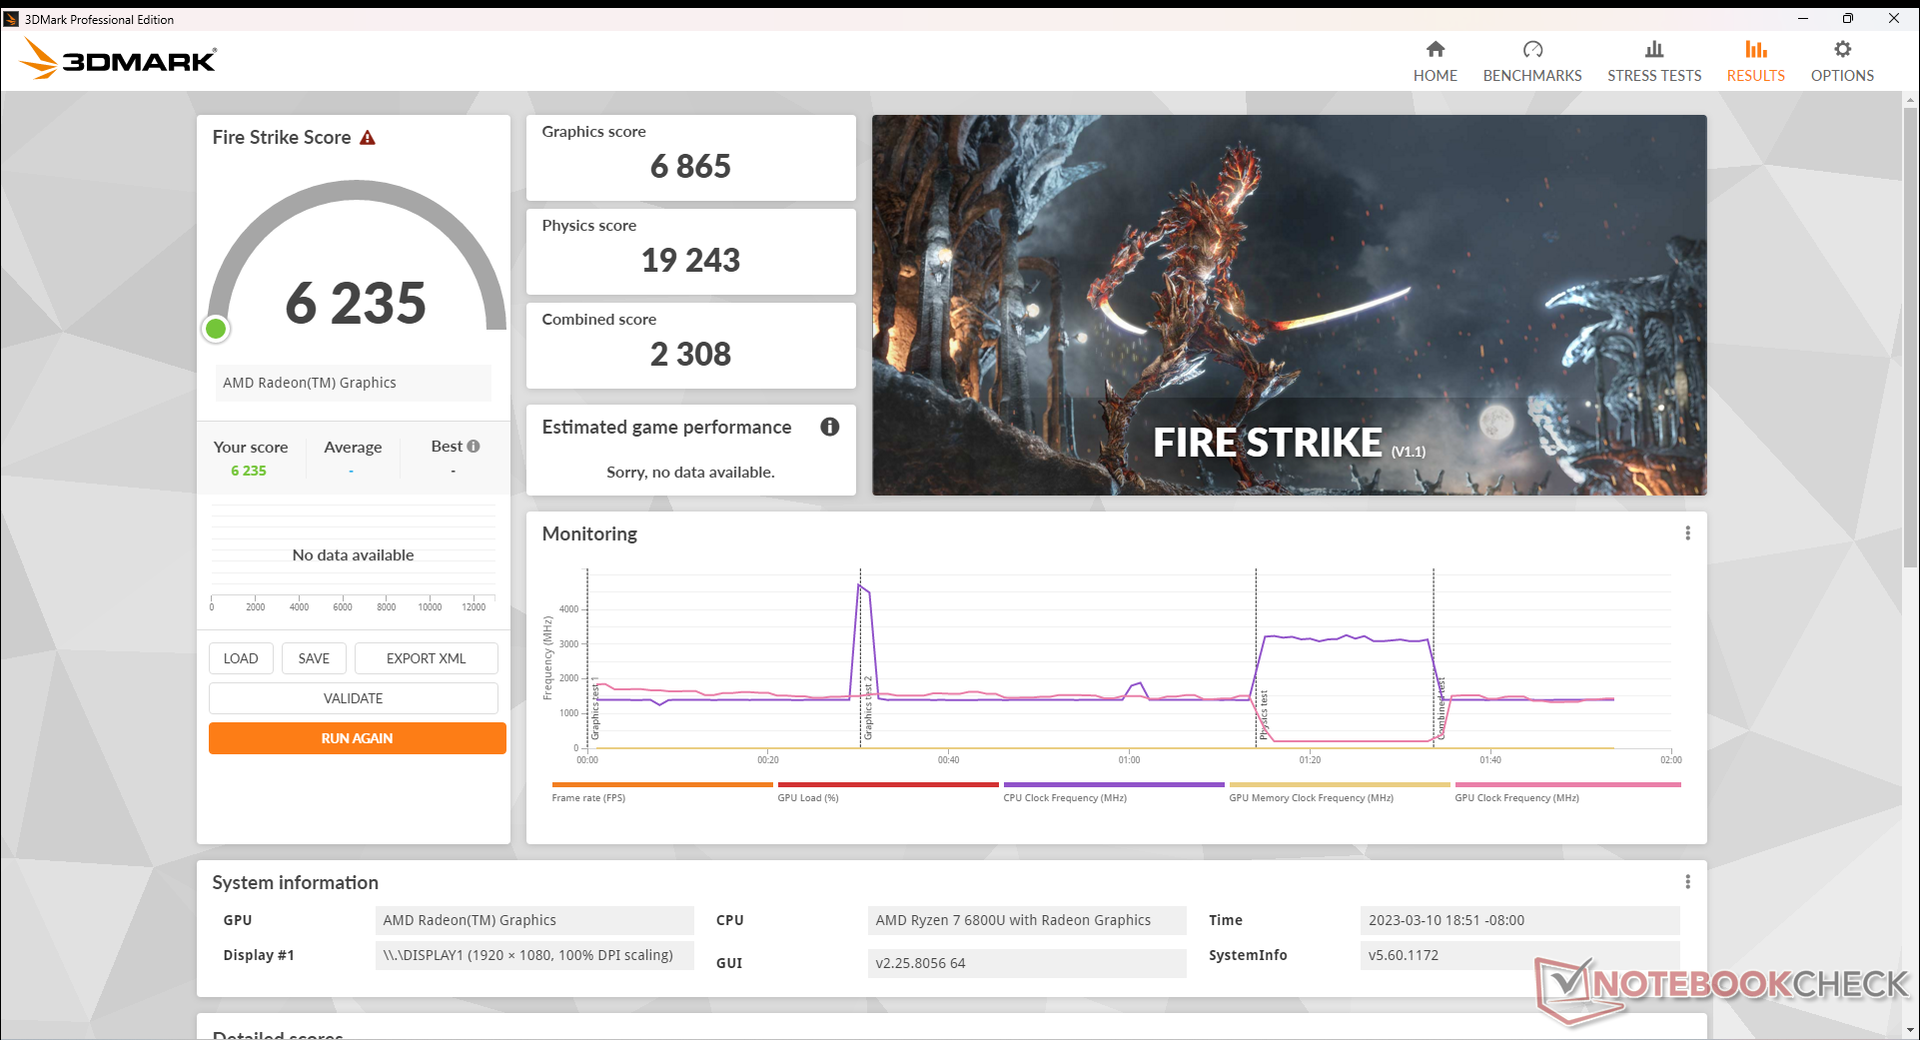
| 3DMark Fire Strike Score | 6235 points | |
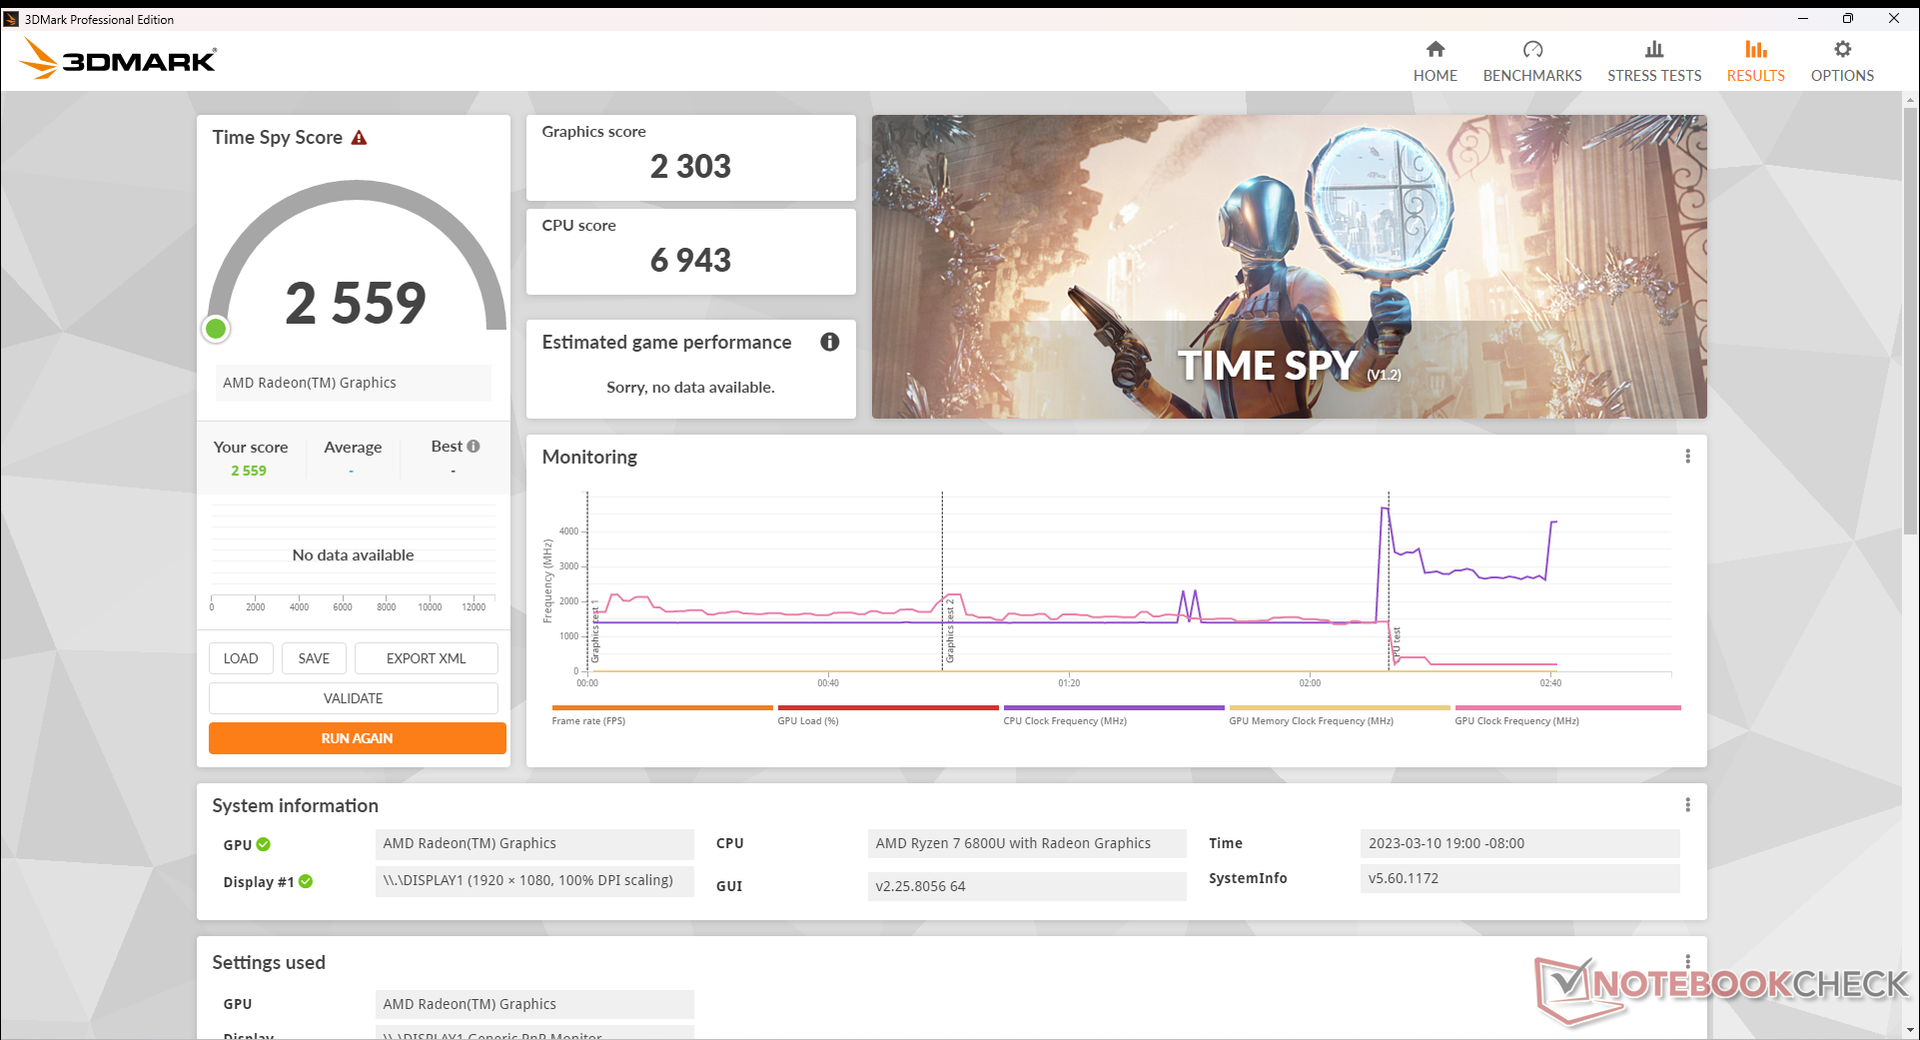
| 3DMark Time Spy Score | 2559 points | |
Help | ||
| Blender | |
| v3.3 Classroom HIP/AMD | |
| Average AMD Radeon 680M (270 - 555, n=34) | |
| GPD Win 4 | |
| v3.3 Classroom OPTIX/RTX | |
| Lenovo Slim 7 Pro X 14ARH7 | |
| MSI Summit E16 Flip A12UDT-031 | |
| v3.3 Classroom CUDA | |
| Lenovo Slim 7 Pro X 14ARH7 | |
| MSI Summit E16 Flip A12UDT-031 | |
| v3.3 Classroom CPU | |
| Dell XPS 13 9315 2-in-1 Core i5-1230U | |
| HP Spectre x360 13.5 14t-ef000 | |
| MSI Summit E16 Flip A12UDT-031 | |
| GPD Win 4 | |
| Average AMD Radeon 680M (389 - 980, n=37) | |
| HP Spectre x360 2-in-1 16-f1075ng | |
| Lenovo Slim 7 Pro X 14ARH7 | |
* ... smaller is better
| F1 22 | |
| 1280x720 Ultra Low Preset AA:T AF:16x | |
| GPD Win 4 | |
| Average AMD Radeon 680M (75.5 - 147.3, n=19) | |
| HP Spectre x360 2-in-1 16-f1075ng | |
| 1920x1080 Low Preset AA:T AF:16x | |
| GPD Win 4 | |
| Average AMD Radeon 680M (44.1 - 85.4, n=25) | |
| HP Spectre x360 2-in-1 16-f1075ng | |
| 1920x1080 Medium Preset AA:T AF:16x | |
| GPD Win 4 | |
| Average AMD Radeon 680M (38 - 75.1, n=25) | |
| HP Spectre x360 2-in-1 16-f1075ng | |
| 1920x1080 High Preset AA:T AF:16x | |
| GPD Win 4 | |
| Average AMD Radeon 680M (30 - 56.2, n=25) | |
| HP Spectre x360 2-in-1 16-f1075ng | |
| 1920x1080 Ultra High Preset AA:T AF:16x | |
| HP Spectre x360 2-in-1 16-f1075ng | |
| GPD Win 4 | |
| Average AMD Radeon 680M (7.85 - 14.7, n=22) | |
Idling on Witcher 3 to test for frame rate stability would reveal significant issues. As shown by the graph below, performance would start out high at over 80 FPS before steadily falling to 65 FPS with constant fluctuations. While the performance drop over time is not unusual, the fluctuations are abnormal and they result in periodic micro-stuttering during gameplay. We tested this twice just to be sure and the results would not improve. Unoptimized CPU utilization of background tasks or applications is typically the cause of such behavior when gaming.
Witcher 3 FPS Chart
| low | med. | high | ultra | |
|---|---|---|---|---|
| GTA V (2015) | 140.3 | 127.6 | 51.4 | 24.8 |
| The Witcher 3 (2015) | 94.3 | 63.8 | 37.5 | 22.8 |
| Dota 2 Reborn (2015) | 120.2 | 100.1 | 76.4 | 67.2 |
| Final Fantasy XV Benchmark (2018) | 57.1 | 32.7 | 23.9 | |
| X-Plane 11.11 (2018) | 56.2 | 41.4 | 33.5 | |
| Strange Brigade (2018) | 145.7 | 57.5 | 47.8 | 41.5 |
| Cyberpunk 2077 1.6 (2022) | 37.7 | 28.9 | 21.6 | 16.7 |
| F1 22 (2022) | 78.1 | 70.4 | 51.5 | 12.6 |
Emissions — Almost Always Audible
System Noise
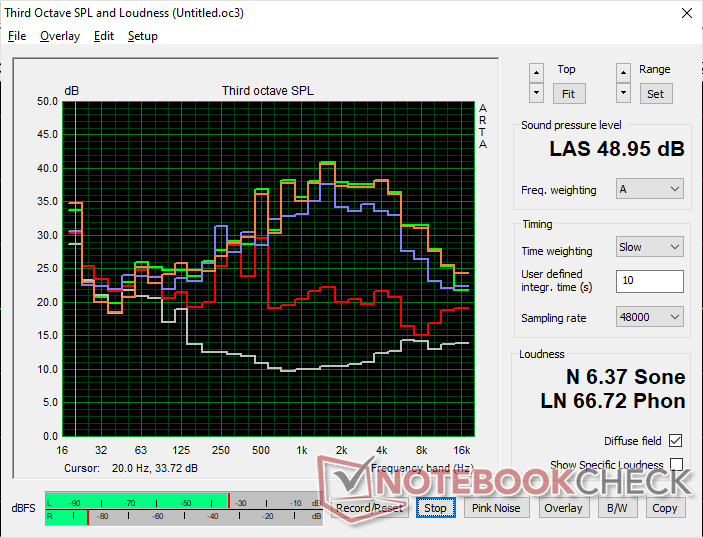
The internal fan is always running no matter the onscreen load. When idling on desktop, for example, fan noise would hover around 31 dB(A) against a background of 24 dB(A) which is already louder than many laptops under similar idling conditions. Users should expect a quiet but noticeable whir when browsing or watching videos.
Running higher loads like games will induce a fan noise of just under 49 dB(A). When considering that most Ultrabooks and gaming laptops top out at around 40 dB(A) and 50 dB(A), respectively, the Win 4 is unfortunately closer to a gaming laptop than an Ultrabook in terms of noise. We wouldn't recommend sneaking in a gaming session with the Win 4 during class.
Noise level
| Idle |
| 31.2 / 31.2 / 33.5 dB(A) |
| Load |
| 45.5 / 49 dB(A) |
 | ||
30 dB silent 40 dB(A) audible 50 dB(A) loud |
||
min: | ||
| GPD Win 4 Radeon 680M, R7 6800U, BiWin CE480Y2D100-1TB | GPD Win Max 2 Iris Xe G7 96EUs, i7-1260P, BiWin NQ200 1TB CNF82GS1D00-1TB | GPD Win 3 Iris Xe G7 80EUs, i5-1135G7, BIWIN NS200 1TB CNF82GS1G02-1TB | Razer Blade Stealth i7-1165G7 GTX 1650 Ti Max-Q GeForce GTX 1650 Ti Max-Q, i7-1165G7, Samsung SSD PM981a MZVLB512HBJQ | Dell XPS 13 9315 2-in-1 Core i5-1230U Iris Xe G7 80EUs, i5-1230U | Asus Zenbook S 13 OLED Radeon 680M, R7 6800U, Samsung PM9A1 MZVL21T0HCLR | |
|---|---|---|---|---|---|---|
| Noise | 18% | 6% | 11% | 19% | ||
| off / environment * (dB) | 24 | 22.6 6% | 27.4 -14% | 25.3 -5% | 24 -0% | |
| Idle Minimum * (dB) | 31.2 | 23.7 24% | 29.1 7% | 25.3 19% | 24 23% | |
| Idle Average * (dB) | 31.2 | 23.7 24% | 29.1 7% | 25.3 19% | 24 23% | |
| Idle Maximum * (dB) | 33.5 | 28.5 15% | 29.1 13% | 27 19% | 24 28% | |
| Load Average * (dB) | 45.5 | 36.5 20% | 40.7 11% | 47.9 -5% | 33.1 27% | |
| Witcher 3 ultra * (dB) | 48.6 | 39.8 18% | 42.8 12% | 38.4 21% | 40.2 17% | |
| Load Maximum * (dB) | 49 | 40.5 17% | 46.3 6% | 45.9 6% | 41.7 15% |
* ... smaller is better
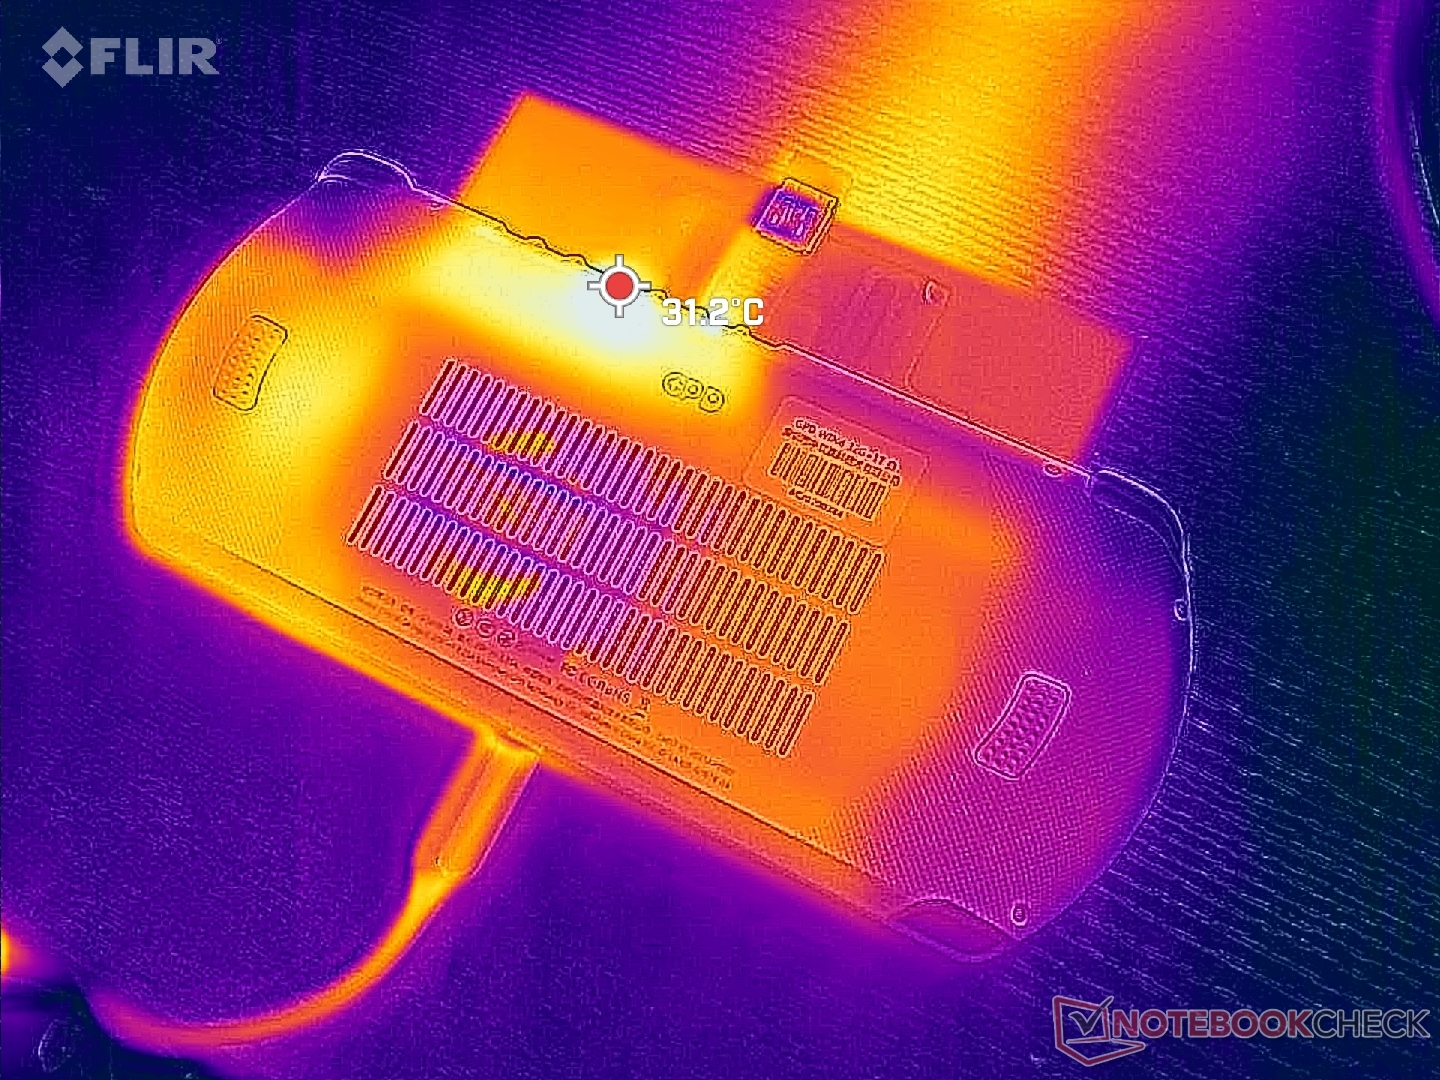
Temperature
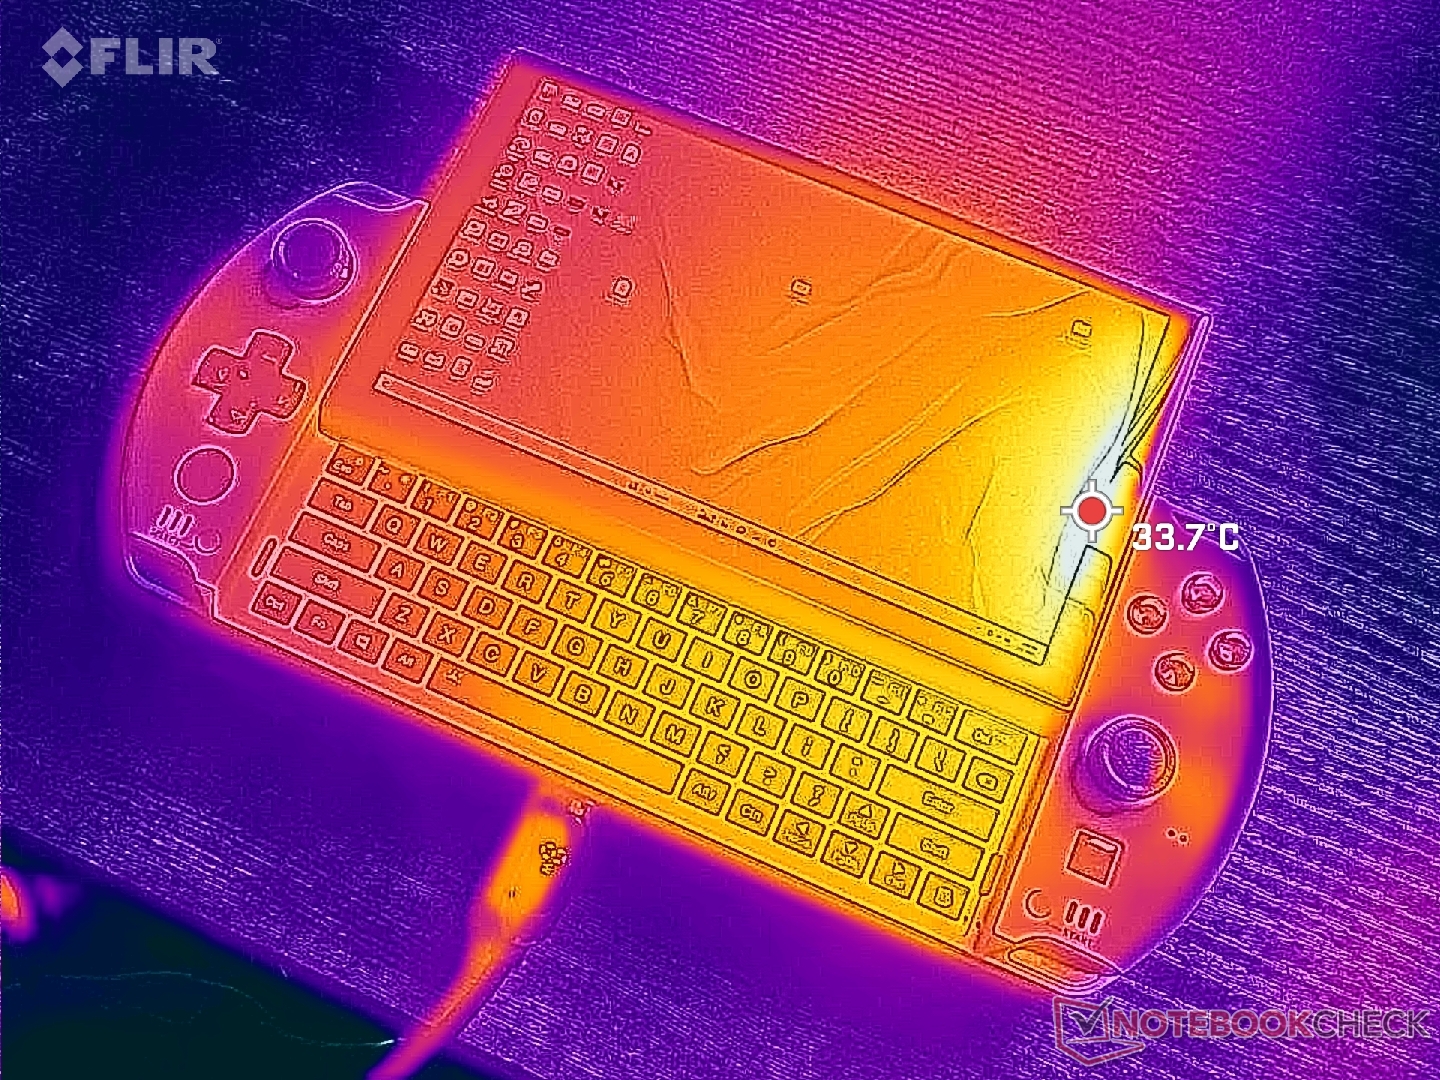
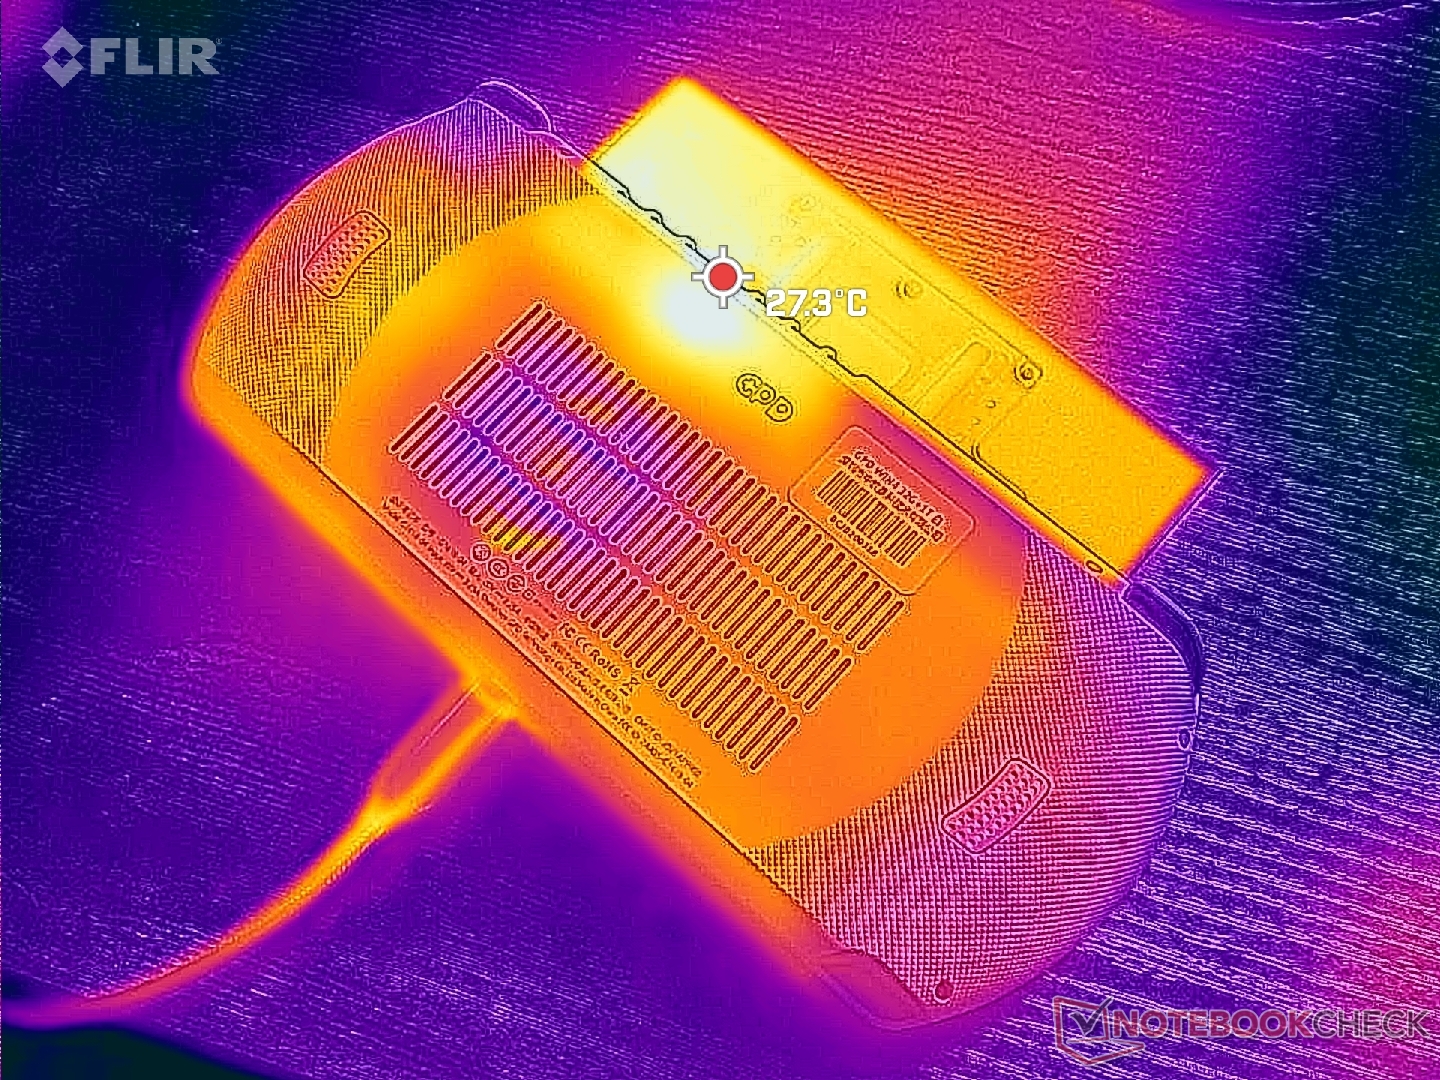
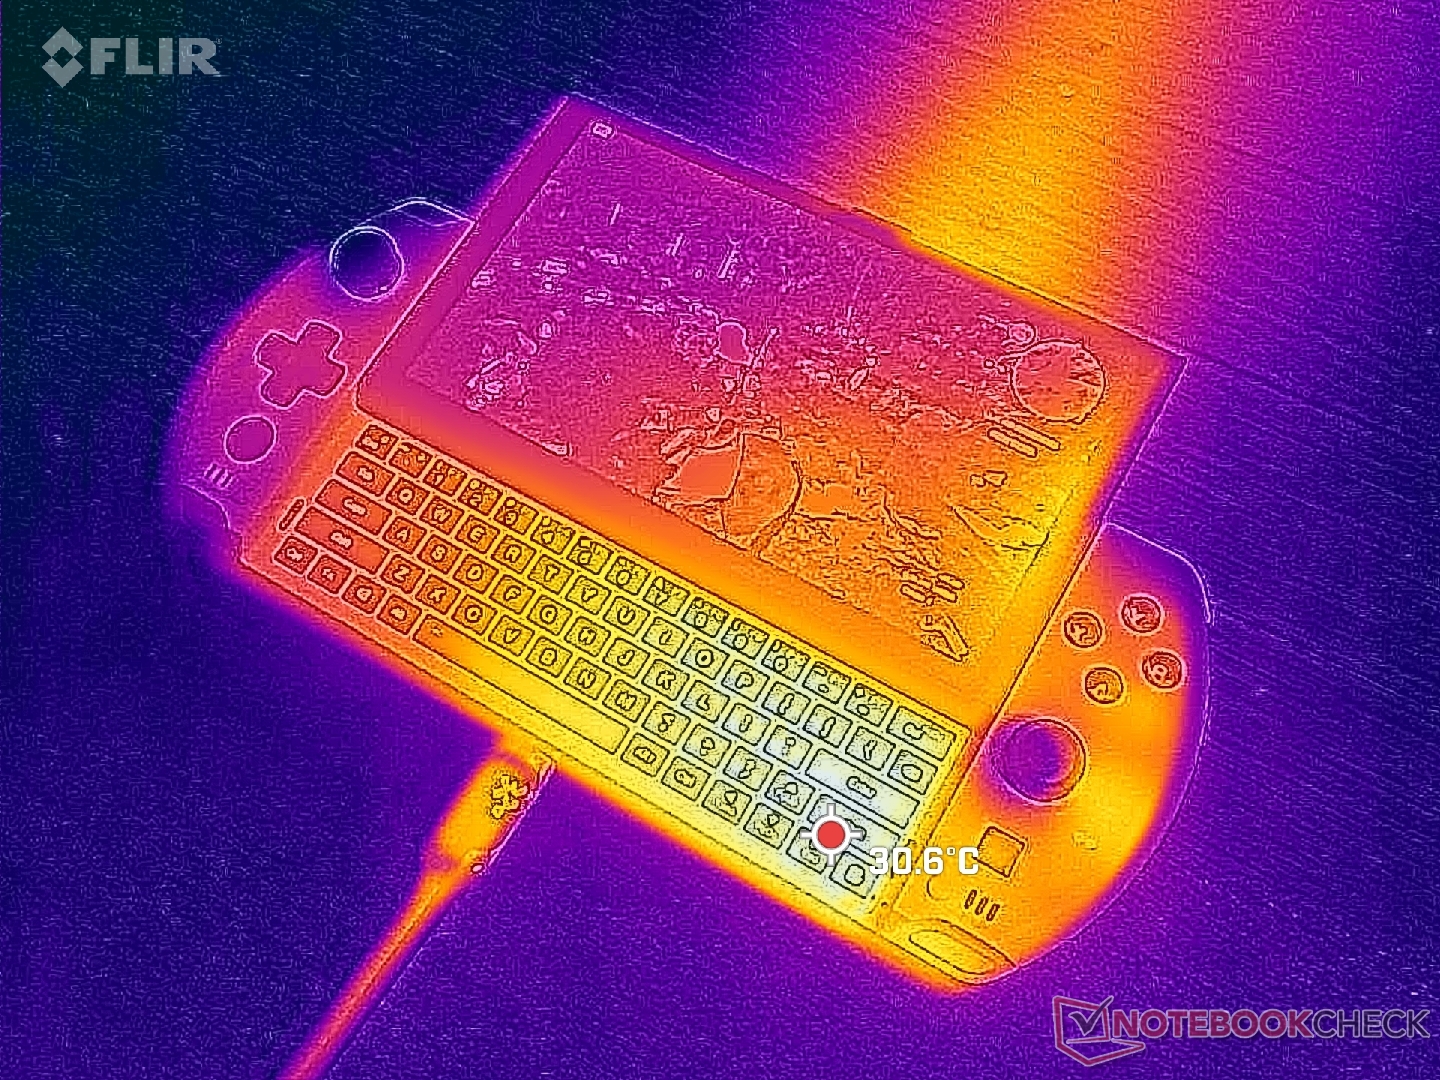
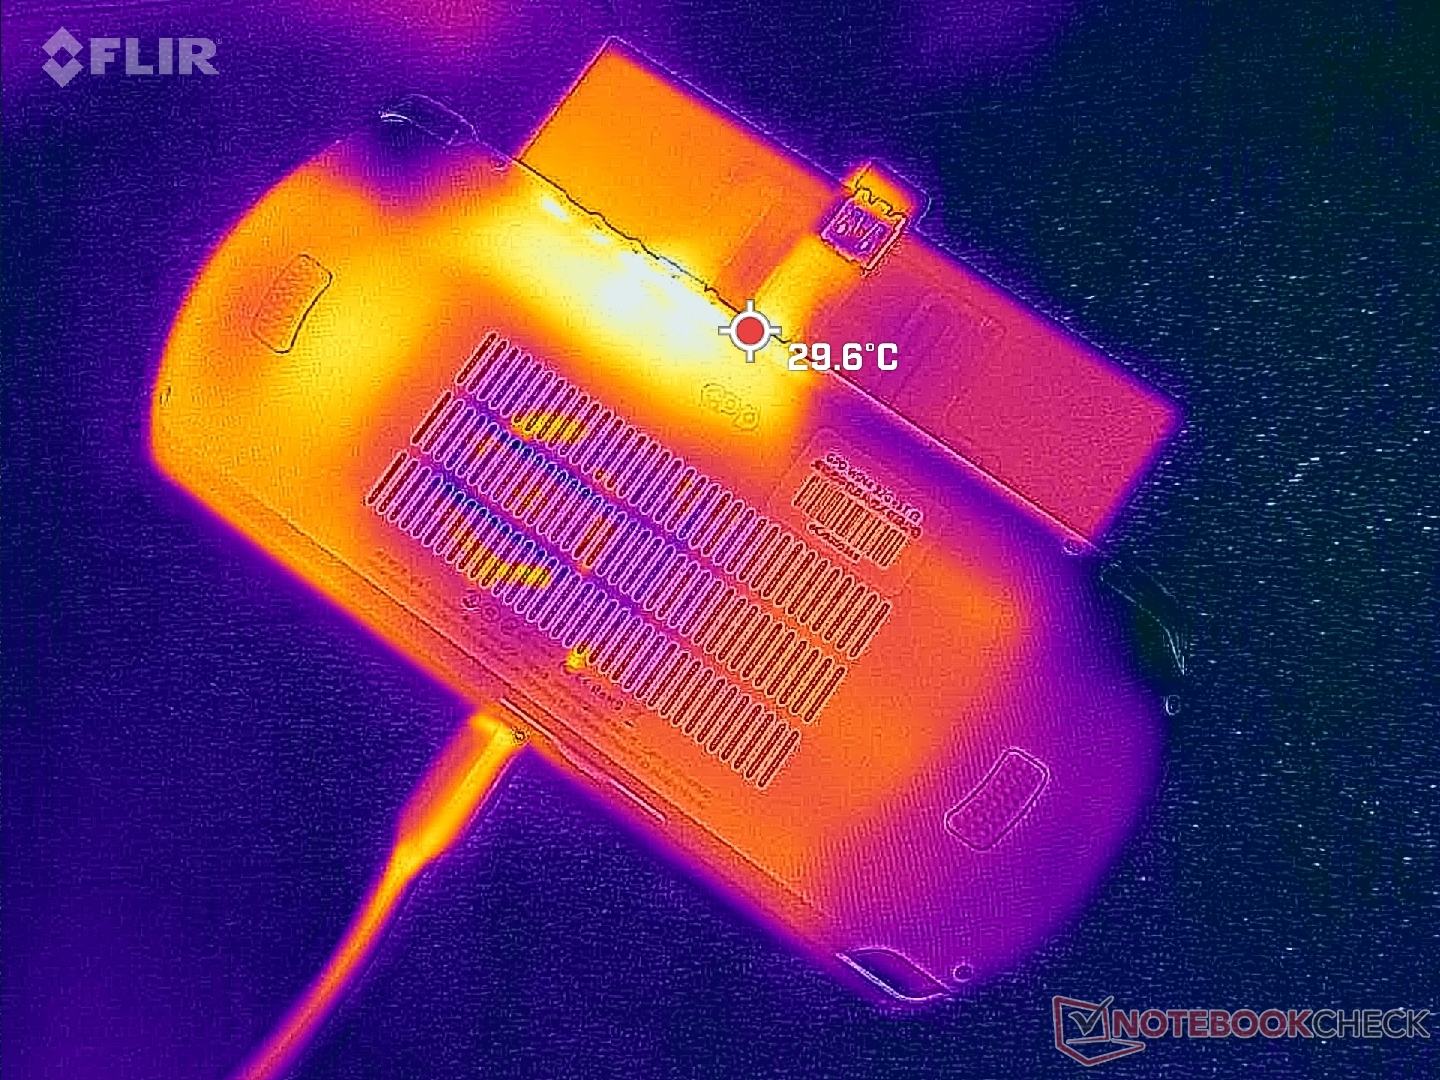
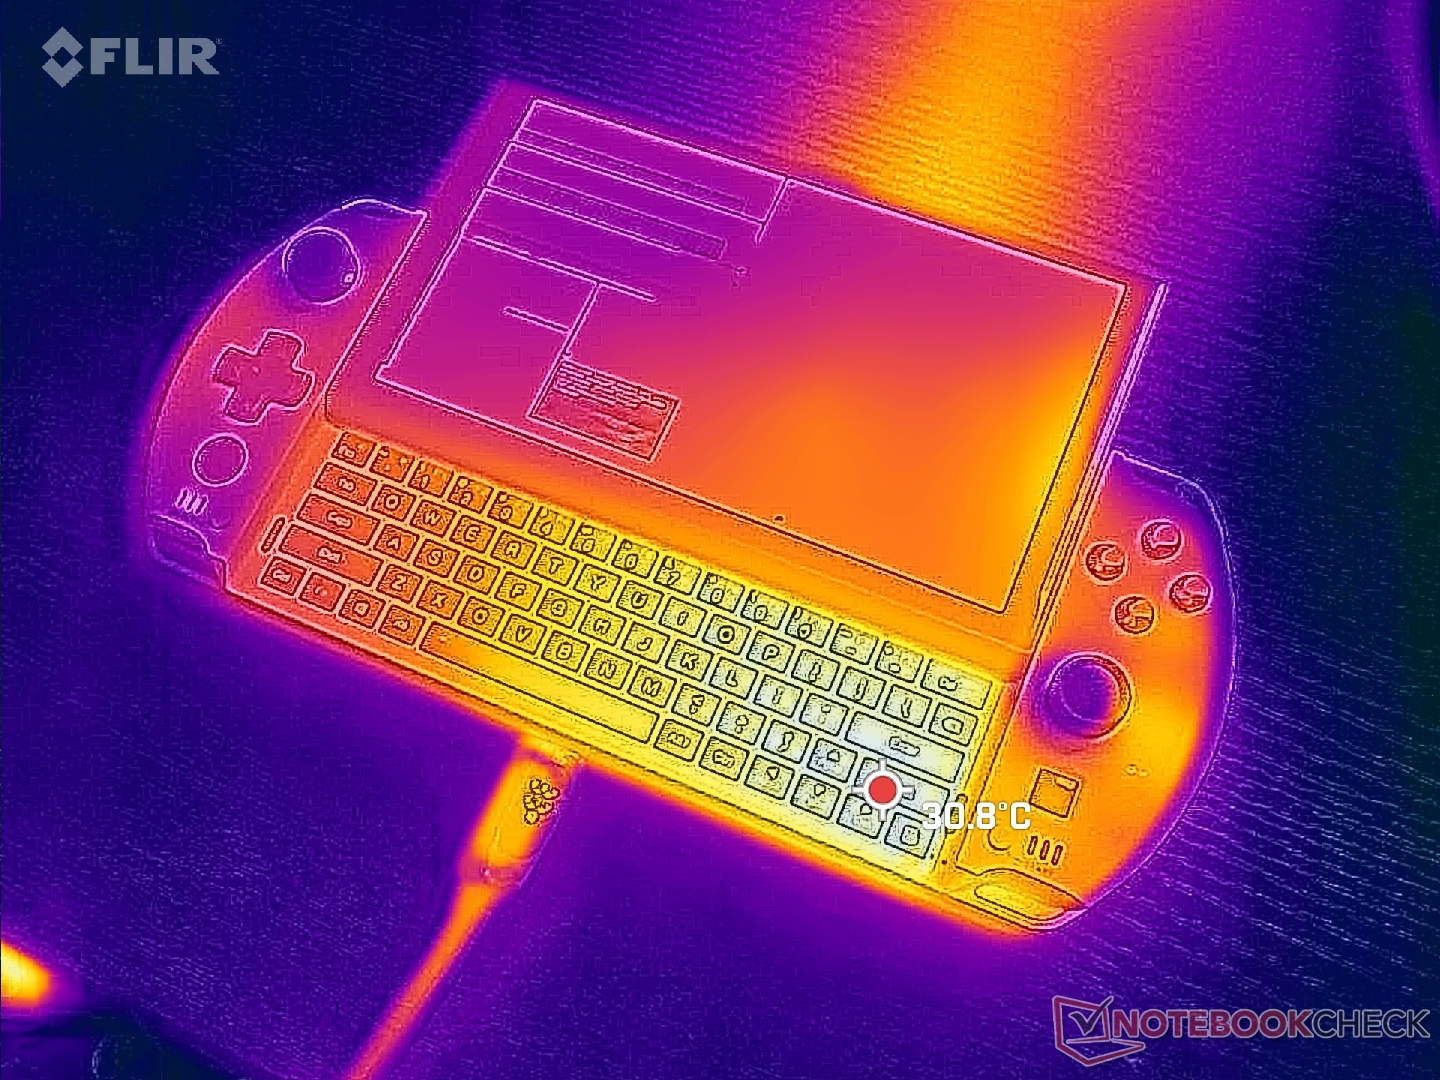
Surface temperatures are never uncomfortably warm despite the high performance-per-volume. Though the system is smaller than a traditional laptop, it is still rather thick and so surface temperatures are not as warm as one might expect.
The right side of the unit is always warmer than the left side by a few degrees C. It's not bothersome, but it's noticeable during gameplay nonetheless. Excess heat exits from the top edge of the unit much like on the Switch.
(+) The maximum temperature on the upper side is 35 °C / 95 F, compared to the average of 35.9 °C / 97 F, ranging from 21.4 to 59 °C for the class Subnotebook.
(+) The bottom heats up to a maximum of 26.8 °C / 80 F, compared to the average of 39.2 °C / 103 F
(+) In idle usage, the average temperature for the upper side is 26 °C / 79 F, compared to the device average of 30.8 °C / 87 F.
(+) Playing The Witcher 3, the average temperature for the upper side is 28.1 °C / 83 F, compared to the device average of 30.8 °C / 87 F.
(+) The palmrests and touchpad are reaching skin temperature as a maximum (32.2 °C / 90 F) and are therefore not hot.
(-) The average temperature of the palmrest area of similar devices was 28.2 °C / 82.8 F (-4 °C / -7.2 F).
| GPD Win 4 AMD Ryzen 7 6800U, AMD Radeon 680M | GPD Win Max 2 Intel Core i7-1260P, Intel Iris Xe Graphics G7 96EUs | Razer Blade Stealth i7-1165G7 GTX 1650 Ti Max-Q Intel Core i7-1165G7, NVIDIA GeForce GTX 1650 Ti Max-Q | Dell XPS 13 9315 2-in-1 Core i5-1230U Intel Core i5-1230U, Intel Iris Xe Graphics G7 80EUs | Asus Zenbook S 13 OLED AMD Ryzen 7 6800U, AMD Radeon 680M | |
|---|---|---|---|---|---|
| Heat | -1% | -40% | -17% | -37% | |
| Maximum Upper Side * (°C) | 35 | 28.6 18% | 44 -26% | 41.8 -19% | 47.9 -37% |
| Maximum Bottom * (°C) | 26.8 | 33 -23% | 47.4 -77% | 38.2 -43% | 56.1 -109% |
| Idle Upper Side * (°C) | 28.4 | 24.6 13% | 32.2 -13% | 27.4 4% | 26.8 6% |
| Idle Bottom * (°C) | 25 | 27.6 -10% | 36 -44% | 27.2 -9% | 27.3 -9% |
* ... smaller is better
Stress Test
When running Prime95 to stress the CPU, clock rates and board power draw would boost to as high as 2.9 GHz and 28 W, respectively, lasting for about 30 seconds or until core temperature reaches 63 C. Thereafter, clock rates and board power draw would steadily drop before stabilizing at about 2.3 GHz and 18 W, respectively. Core temperature is relatively low at 57 C despite the high stress levels; repeating this test on an Intel-powered Lenovo IdeaPad Flex 7i 14 would result in a higher stable core temperature of 71 C.
GPU clock rates and temperature would stabilize at 1316 MHz and 55 C, respectively, when running Witcher 3. Core temperatures are surprisingly conservative even when set to Performance mode.
Running on battery power does not limit performance. A 3DMark 11 test on batteries would return essentially the same CPU and GPU scores as if running on mains.
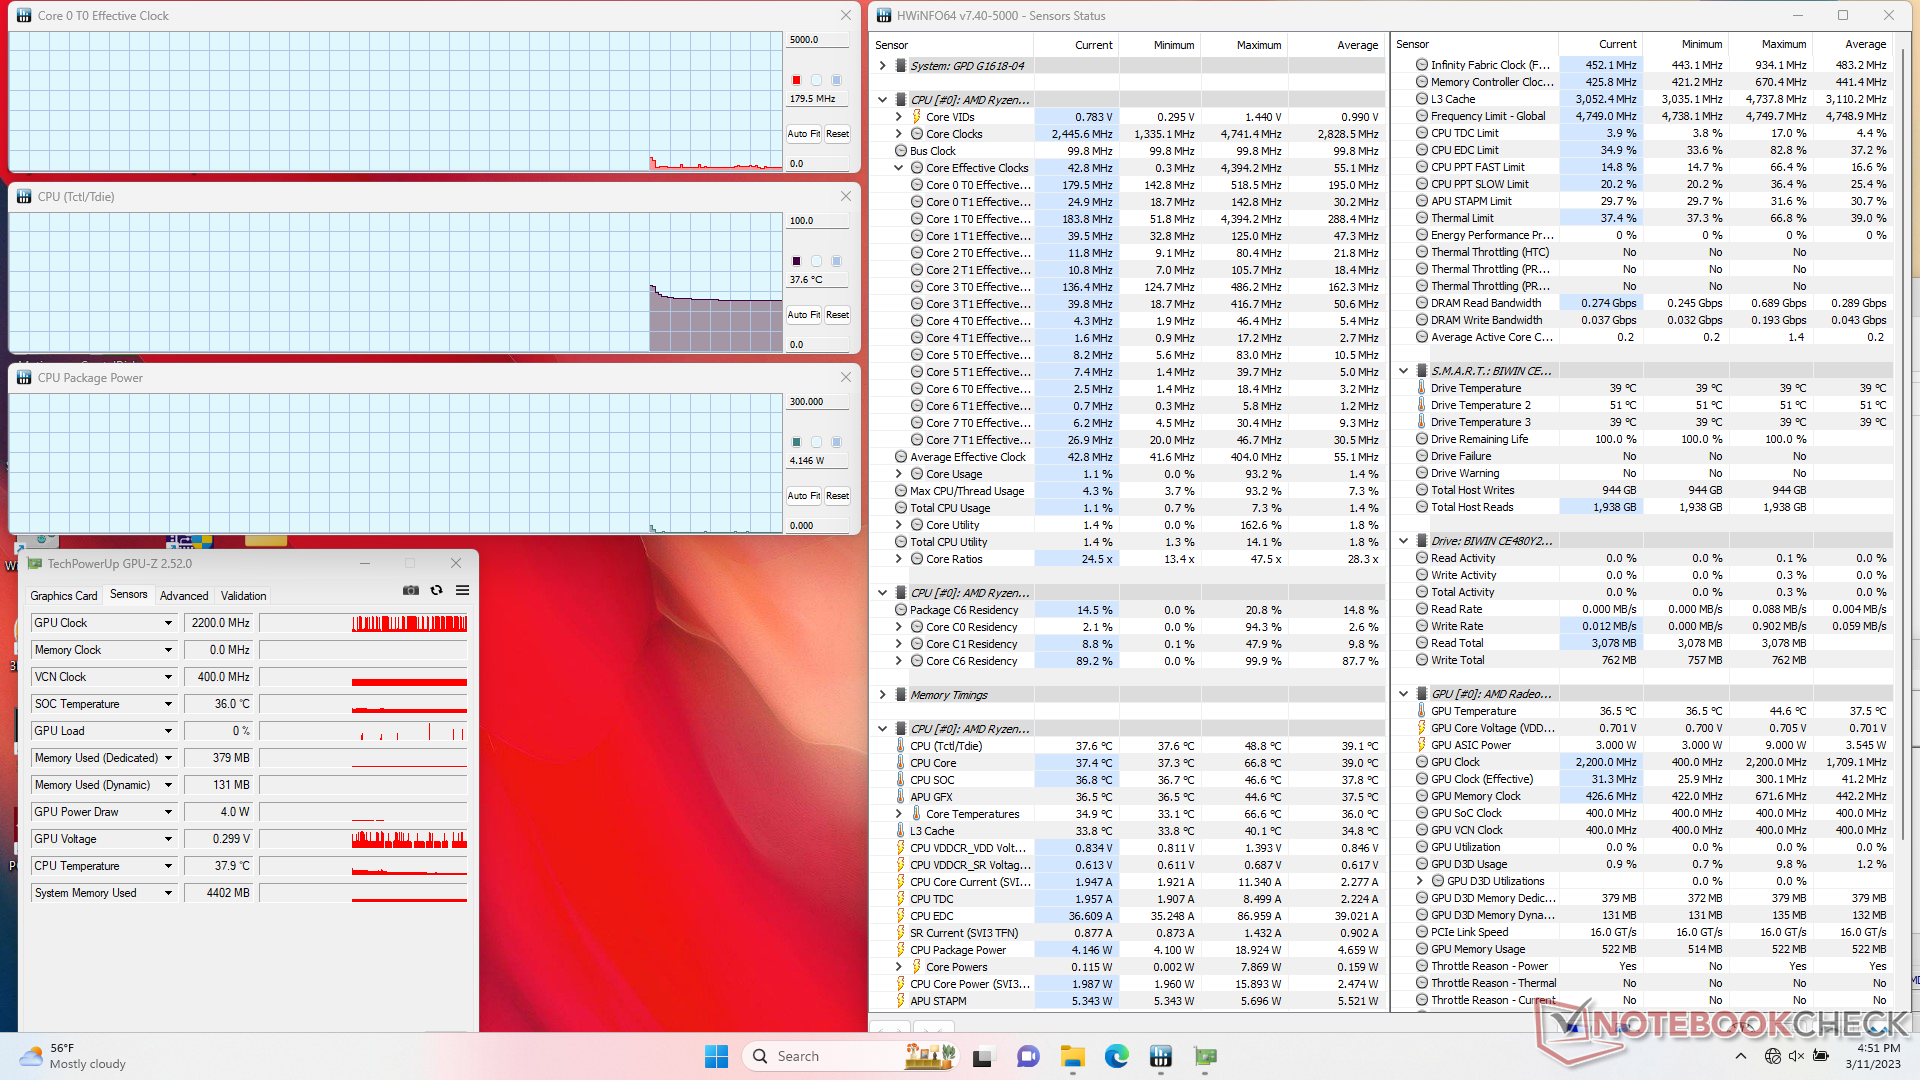
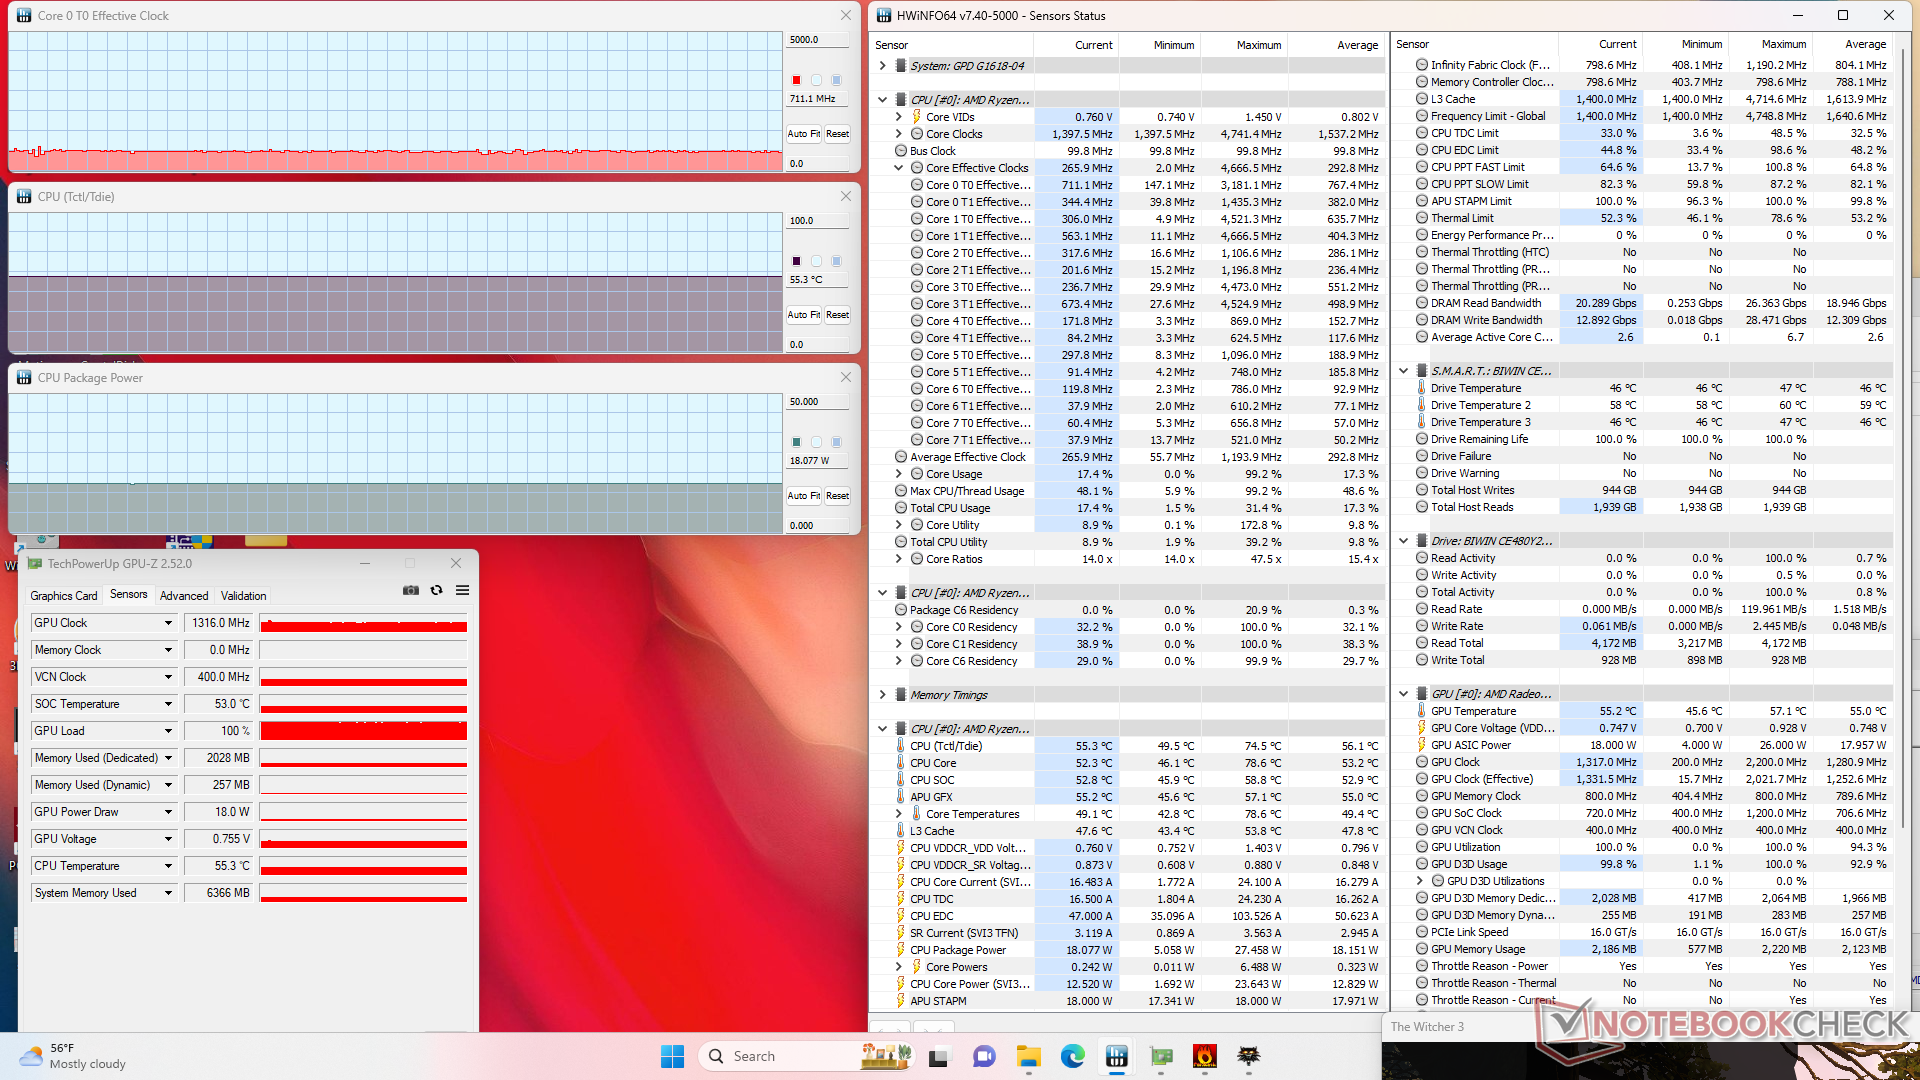
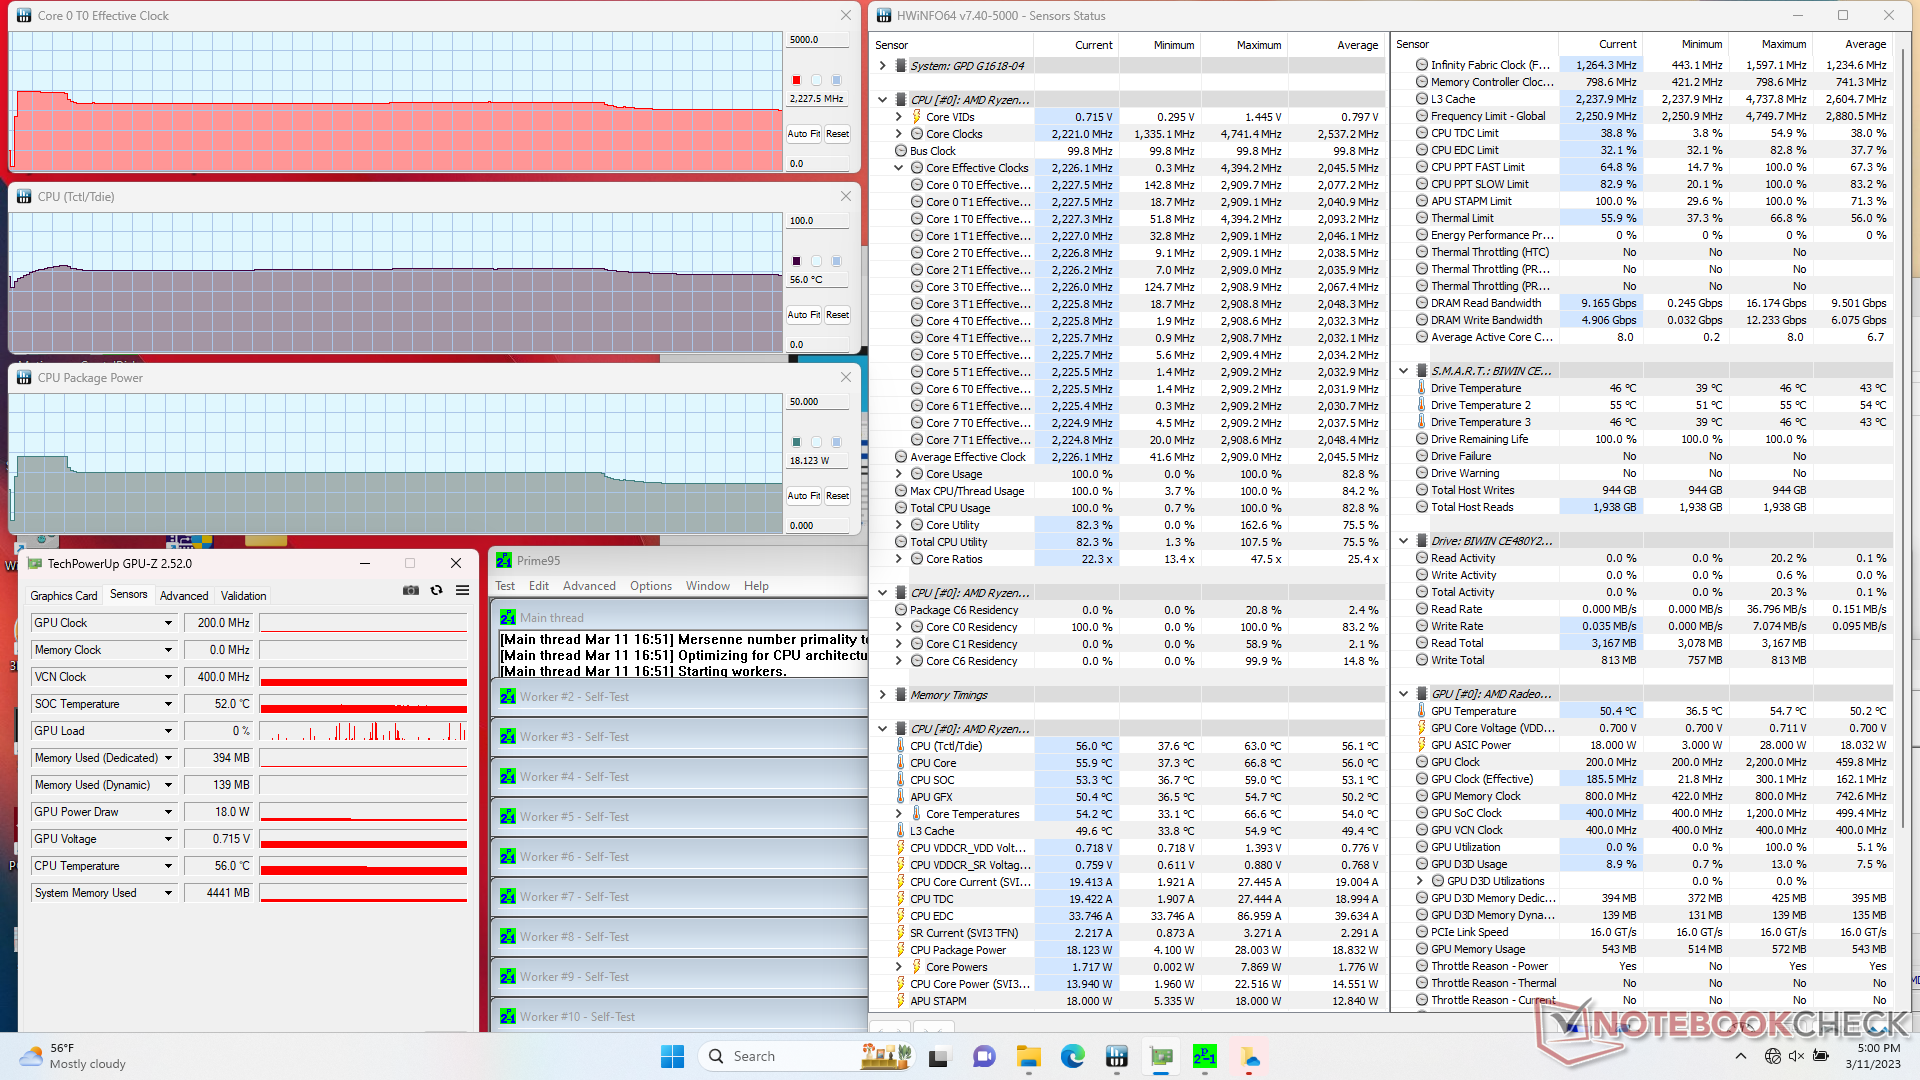
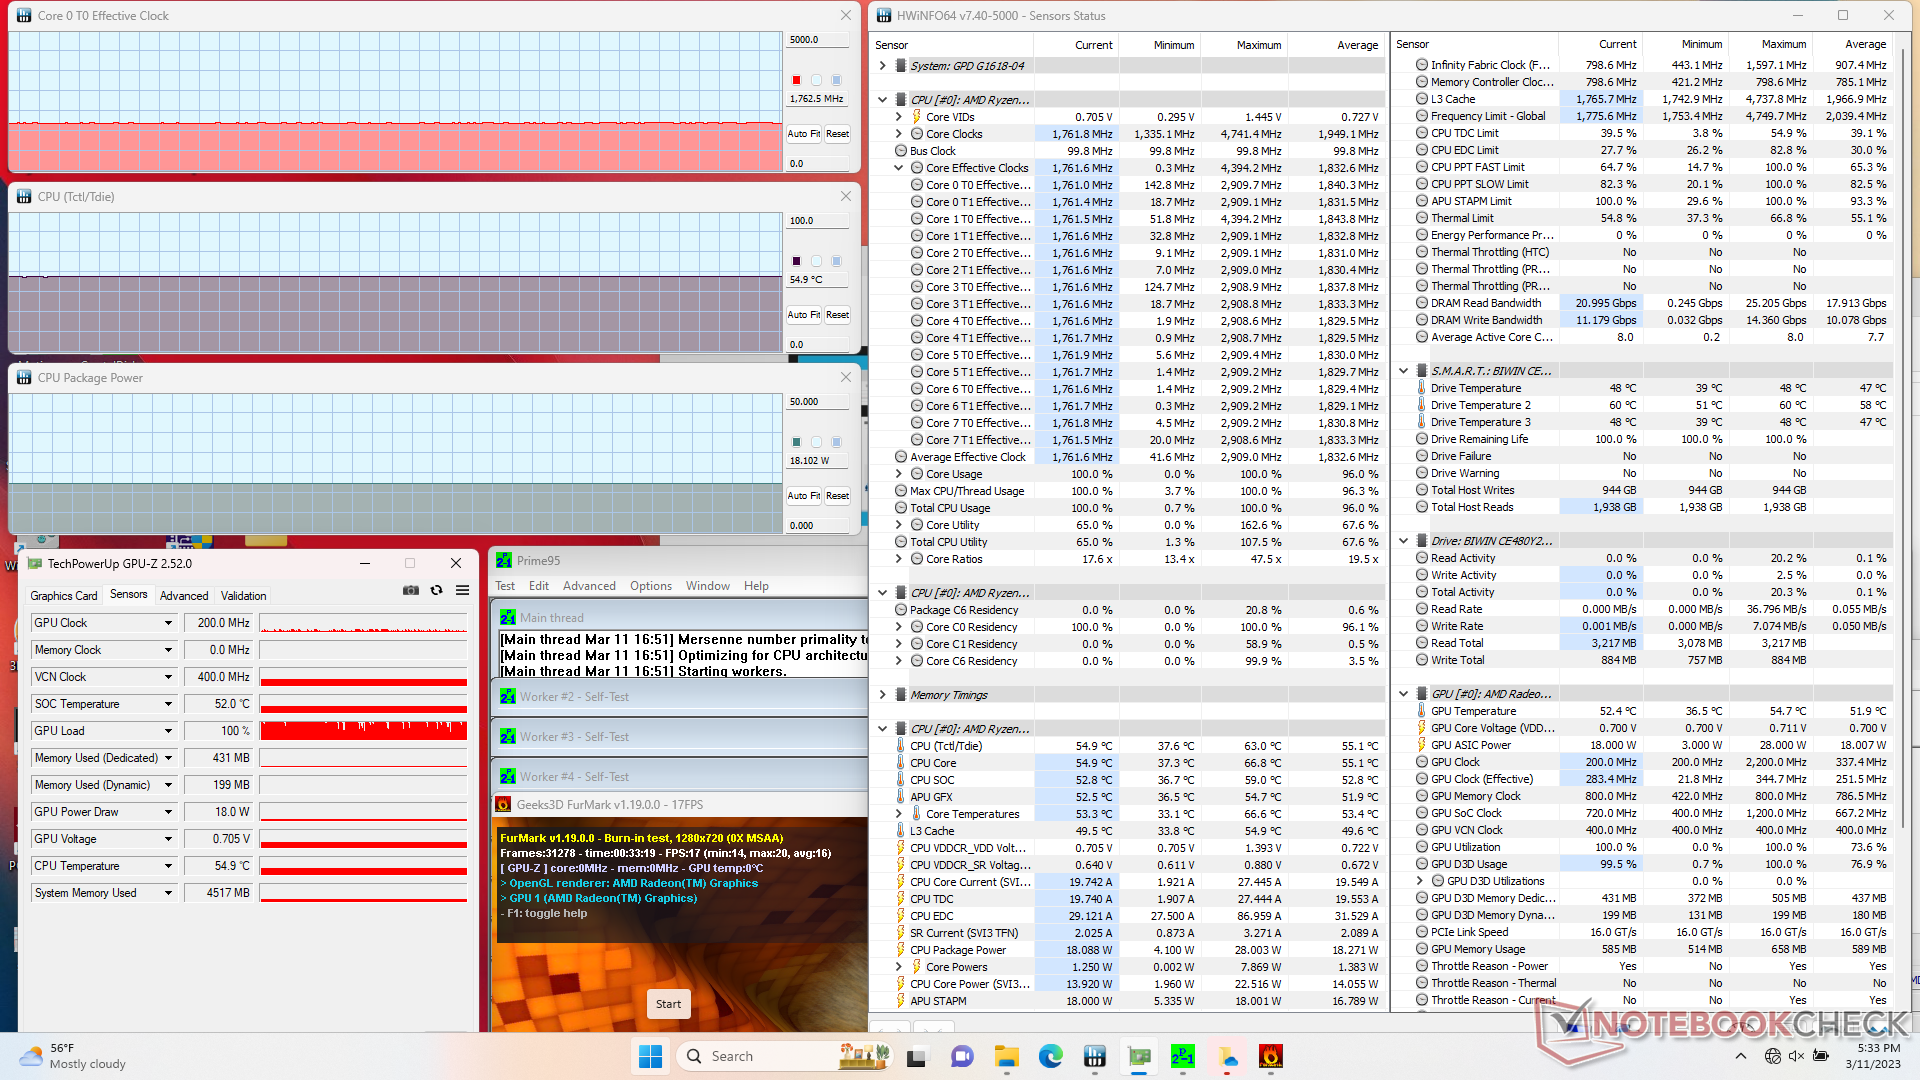
| CPU Clock (GHz) | GPU Clock (MHz) | Average CPU Temperature (°C) | |
| System Idle | -- | -- | 38 |
| Prime95 Stress | 2.2 | -- | 56 |
| Prime95 + FurMark Stress | 1.8 | 200 | 55 |
| Witcher 3 Stress | 0.7 | 1316 | 55 |
Speakers
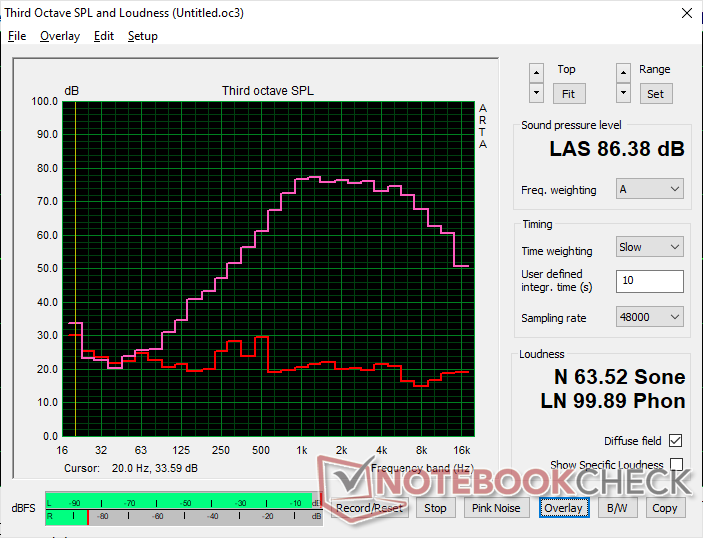
GPD Win 4 audio analysis
(+) | speakers can play relatively loud (86.4 dB)
Bass 100 - 315 Hz
(-) | nearly no bass - on average 26.1% lower than median
(±) | linearity of bass is average (9.1% delta to prev. frequency)
Mids 400 - 2000 Hz
(±) | higher mids - on average 7.3% higher than median
(±) | linearity of mids is average (7.4% delta to prev. frequency)
Highs 2 - 16 kHz
(±) | higher highs - on average 5.6% higher than median
(+) | highs are linear (5.4% delta to prev. frequency)
Overall 100 - 16.000 Hz
(±) | linearity of overall sound is average (25.6% difference to median)
Compared to same class
» 86% of all tested devices in this class were better, 3% similar, 11% worse
» The best had a delta of 5%, average was 18%, worst was 53%
Compared to all devices tested
» 79% of all tested devices were better, 4% similar, 17% worse
» The best had a delta of 4%, average was 24%, worst was 134%
Apple MacBook Pro 16 2021 M1 Pro audio analysis
(+) | speakers can play relatively loud (84.7 dB)
Bass 100 - 315 Hz
(+) | good bass - only 3.8% away from median
(+) | bass is linear (5.2% delta to prev. frequency)
Mids 400 - 2000 Hz
(+) | balanced mids - only 1.3% away from median
(+) | mids are linear (2.1% delta to prev. frequency)
Highs 2 - 16 kHz
(+) | balanced highs - only 1.9% away from median
(+) | highs are linear (2.7% delta to prev. frequency)
Overall 100 - 16.000 Hz
(+) | overall sound is linear (4.6% difference to median)
Compared to same class
» 0% of all tested devices in this class were better, 0% similar, 100% worse
» The best had a delta of 5%, average was 17%, worst was 45%
Compared to all devices tested
» 0% of all tested devices were better, 0% similar, 100% worse
» The best had a delta of 4%, average was 24%, worst was 134%
Energy Management — Power-Hungry for the Size
Power Consumption
Overall power consumption is higher than the Win 3 and many U-series-powered Ultrabooks mostly due to the Ryzen 7 CPU and larger, higher resolution touchscreen. For example, gaming demands 20 to 55 percent more power than on the Core i5-powered Win 3, but this is offset by the 2x faster CPU performance and 1.5x faster GPU performance over the i5-1135G7. Simply idling on desktop demands between 7 W and 13 W which is similar to many Ultrabooks.
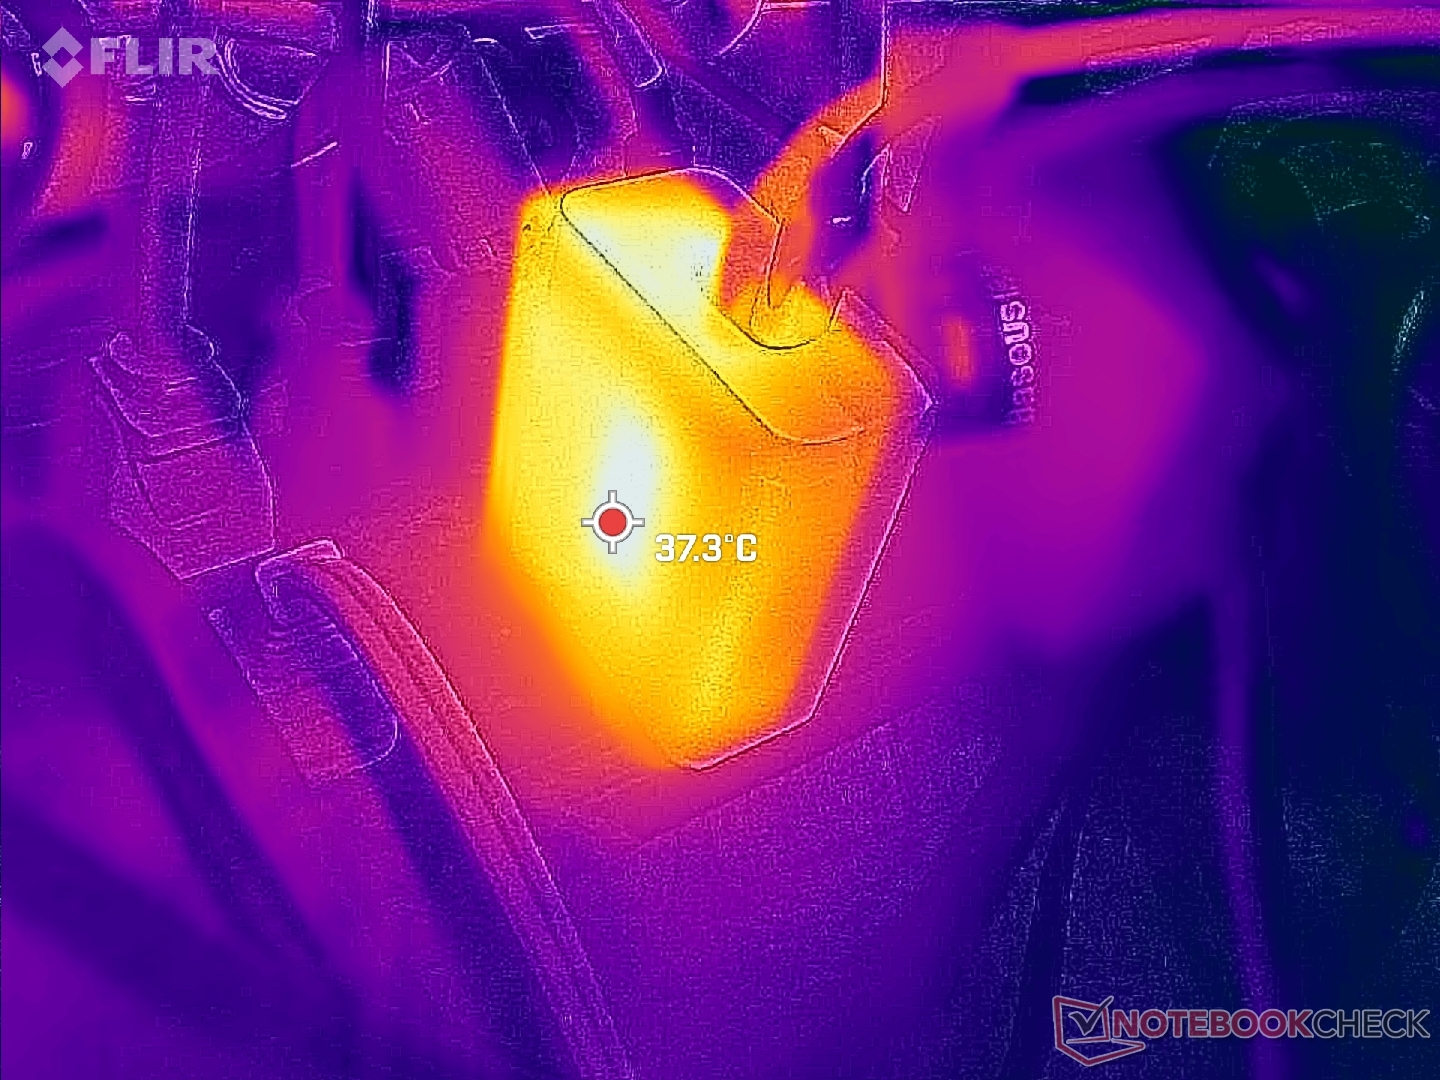
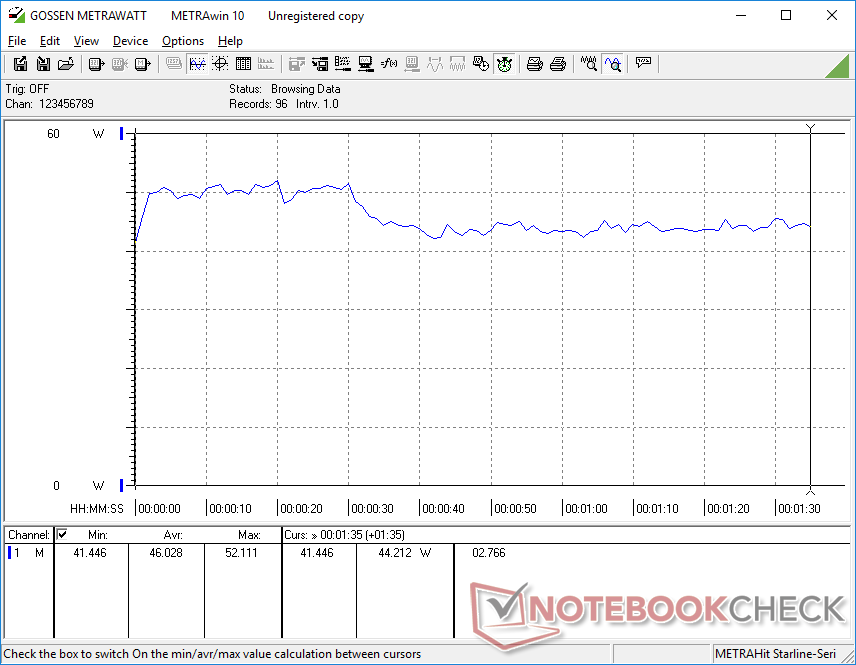
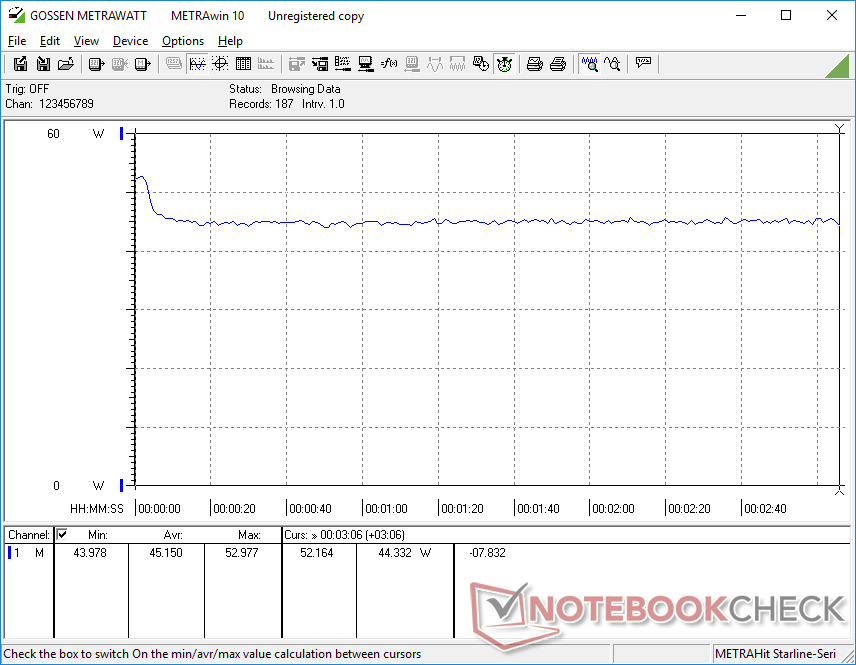
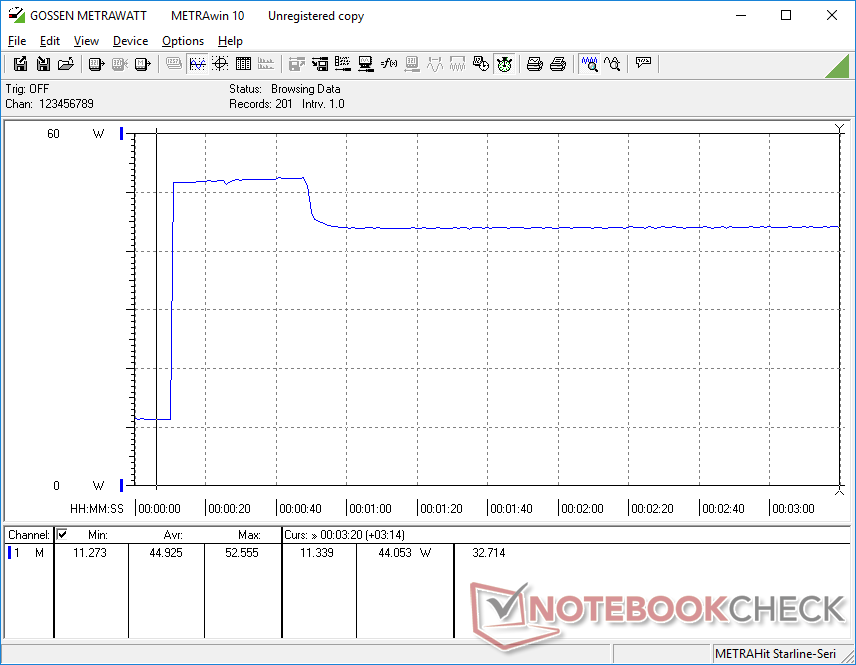
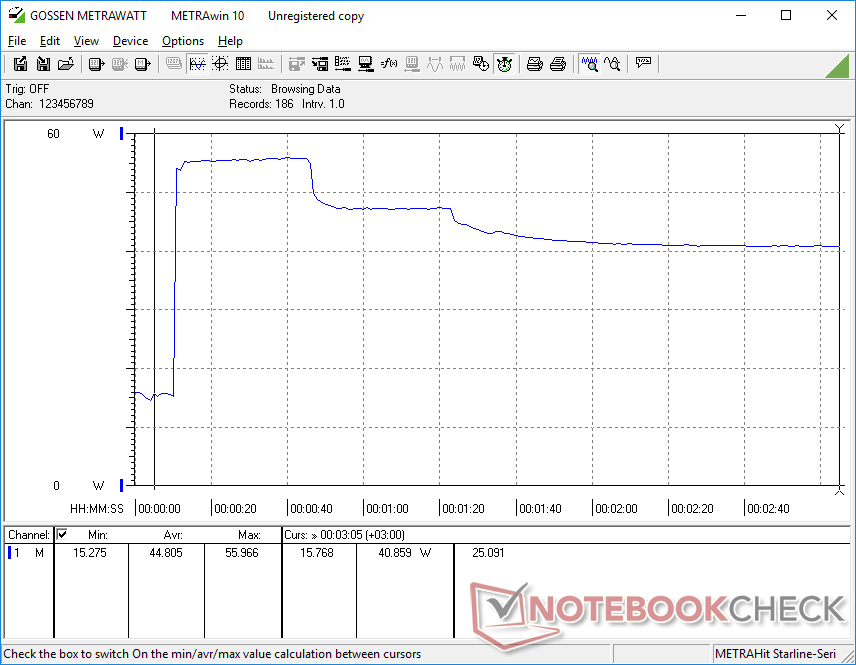
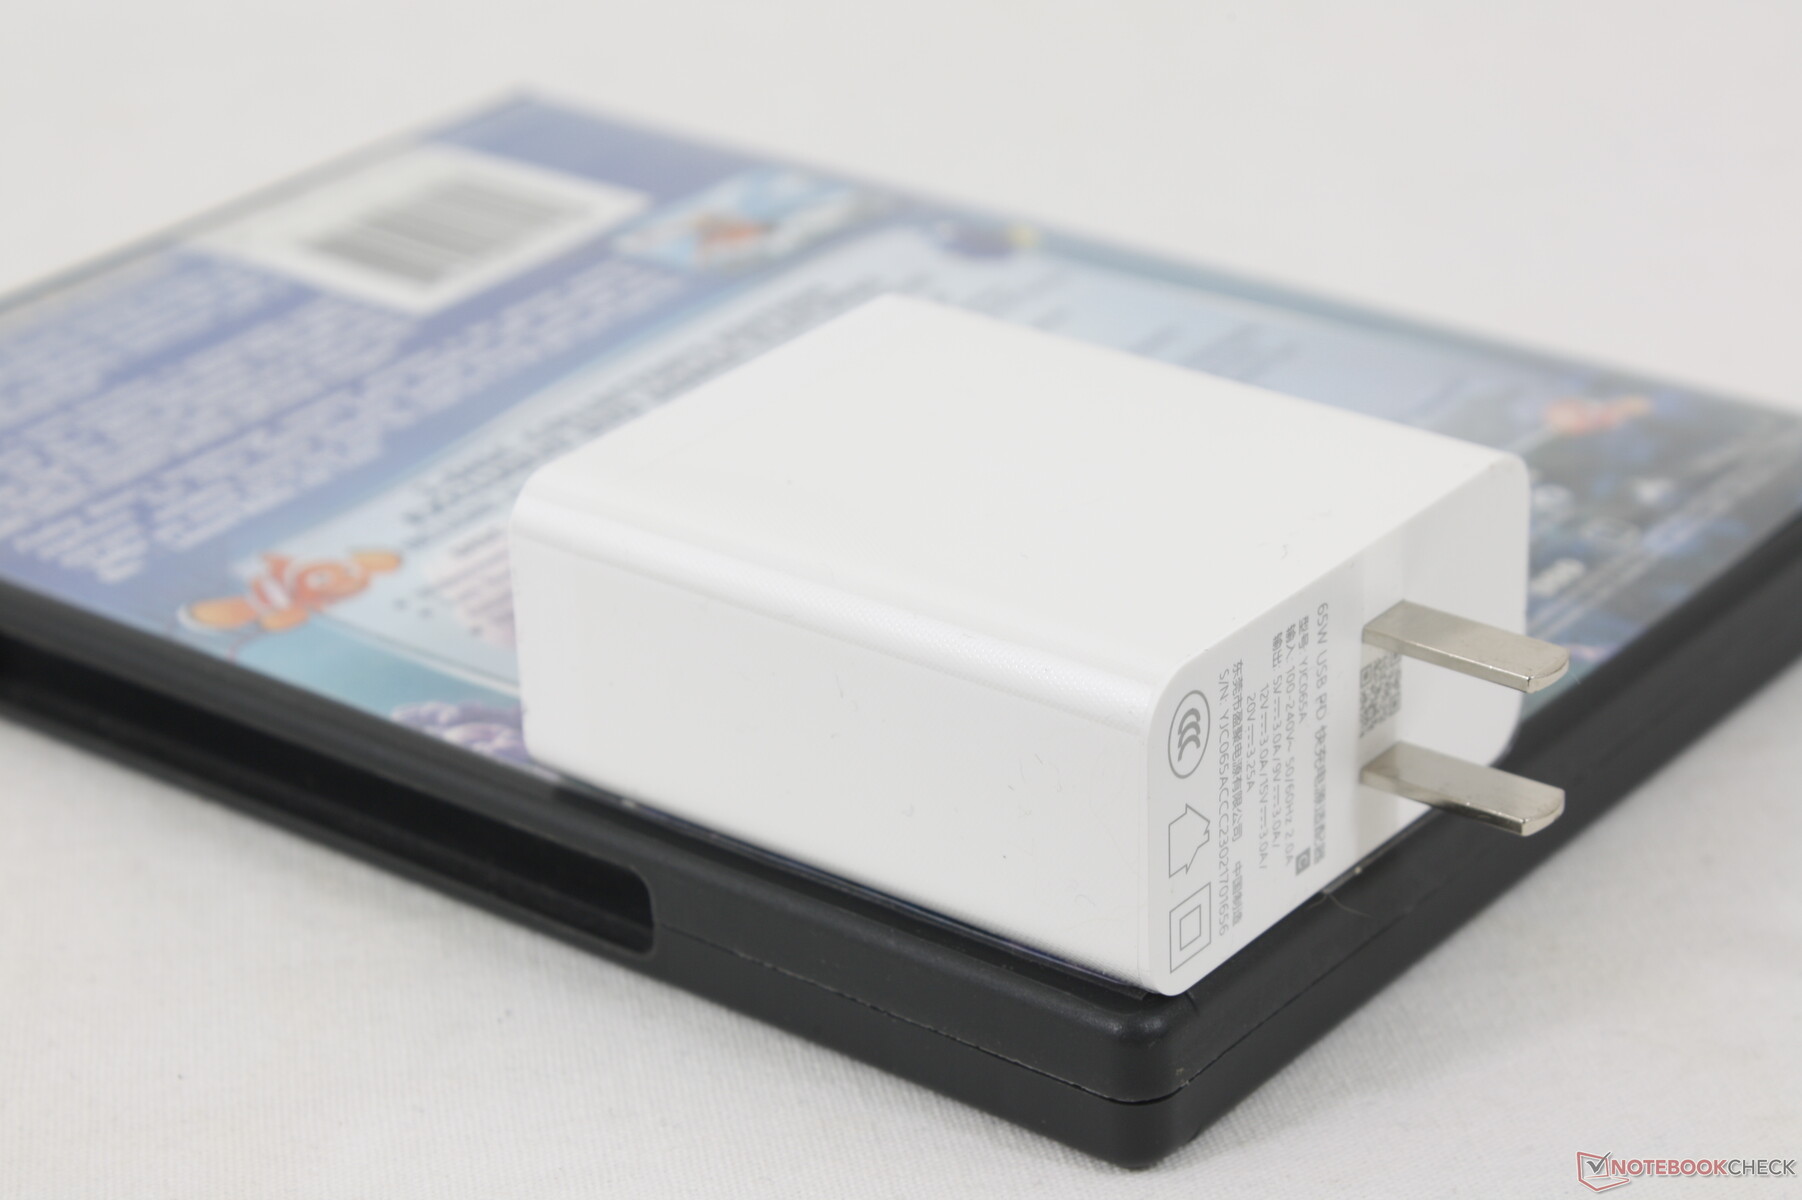
We're able to measure a temporary maximum draw of 56 W from the small (~6.4 x 5.5 x 2.8 cm) 65 W USB-C AC adapter when the processor is at 100 percent utilization. This rate drops after a few seconds of stress as shown by the graphs below due to the limited CPU Boost potential of the model. The prongs on the AC adapter are sadly not retractable.
| Off / Standby | |
| Idle | |
| Load |
|
Key:
min: | |
| GPD Win 4 R7 6800U, Radeon 680M, BiWin CE480Y2D100-1TB, IPS, 1920x1080, 6" | GPD Win Max 2 i7-1260P, Iris Xe G7 96EUs, BiWin NQ200 1TB CNF82GS1D00-1TB, IPS, 2560x1600, 10.1" | GPD Win 3 i5-1135G7, Iris Xe G7 80EUs, BIWIN NS200 1TB CNF82GS1G02-1TB, IPS, 1280x720, 5.5" | Razer Blade Stealth i7-1165G7 GTX 1650 Ti Max-Q i7-1165G7, GeForce GTX 1650 Ti Max-Q, Samsung SSD PM981a MZVLB512HBJQ, IPS, 1920x1080, 13.3" | Dell XPS 13 9315 2-in-1 Core i5-1230U i5-1230U, Iris Xe G7 80EUs, , IPS, 2880x1920, 13" | Asus Zenbook S 13 OLED R7 6800U, Radeon 680M, Samsung PM9A1 MZVL21T0HCLR, OLED, 2880x1800, 13.3" | |
|---|---|---|---|---|---|---|
| Power Consumption | 2% | 45% | -20% | 32% | 18% | |
| Idle Minimum * (Watt) | 7.5 | 5.8 23% | 2.9 61% | 4 47% | 5.2 31% | 4.8 36% |
| Idle Average * (Watt) | 12.4 | 10.2 18% | 4.5 64% | 6.3 49% | 7.9 36% | 8.7 30% |
| Idle Maximum * (Watt) | 13 | 11.5 12% | 4.5 65% | 14.5 -12% | 8 38% | 10.1 22% |
| Load Average * (Watt) | 46 | 47.7 -4% | 38.5 16% | 79.2 -72% | 31.2 32% | 45.6 1% |
| Witcher 3 ultra * (Watt) | 45.2 | 45.6 -1% | 28.9 36% | 68.2 -51% | 28.2 38% | 42.4 6% |
| Load Maximum * (Watt) | 56 | 76.8 -37% | 41.4 26% | 99.4 -78% | 47.6 15% | 49.5 12% |
* ... smaller is better
Power Consumption Witcher 3 / Stresstest
Power Consumption external Monitor
Battery Life
Battery capacity remains almost identical to the Win 3 despite the faster performance and larger overall size of the Win 4. Thus, it's perhaps unsurprising that battery life on the Win 4 is several hours shorter. We're able to record a total runtime of 7.5 hours when browsing the web at 150-nit brightness and just 77 minutes when running demanding games at the maximum brightness setting.
Charging from empty to full capacity takes about 90 minutes much like on most Ultrabooks. Keep in mind that charge rate slows if simultaneously gaming.
| GPD Win 4 R7 6800U, Radeon 680M, 46 Wh | GPD Win Max 2 i7-1260P, Iris Xe G7 96EUs, 70 Wh | GPD Win 3 i5-1135G7, Iris Xe G7 80EUs, 44 Wh | Razer Blade Stealth i7-1165G7 GTX 1650 Ti Max-Q i7-1165G7, GeForce GTX 1650 Ti Max-Q, 53.1 Wh | Dell XPS 13 9315 2-in-1 Core i5-1230U i5-1230U, Iris Xe G7 80EUs, 49.5 Wh | Asus Zenbook S 13 OLED R7 6800U, Radeon 680M, 67 Wh | |
|---|---|---|---|---|---|---|
| Battery runtime | 35% | 26% | 66% | 38% | 54% | |
| Reader / Idle (h) | 9.7 | 15.4 59% | 20.6 112% | 13.6 40% | ||
| WiFi v1.3 (h) | 7.5 | 8.7 16% | 11.3 51% | 9 20% | 9 20% | 9.2 23% |
| Load (h) | 1.3 | 1.7 31% | 1.3 0% | 2 54% | 2.4 85% | |
| H.264 (h) | 15.2 |
Pros
Cons
Verdict — Making the Steam Deck Look Outdated
The Win 4 is a massive improvement over the Win 3 in almost every aspect. The display is bigger, the controls are more tactile, the design is stronger and more attractive, the keyboard is more reliable, and performance is markedly faster. You can slap a PS logo on the front and it would likely fool more than a few eyes.
The new screen, performance, and integrated physical keyboard contribute to the heavier weight, thicker profile, and louder fan noise of the Win 4 which are the three major drawbacks of the model. It may be solidly built, but other gaming handhelds like the Switch or OneXPlayer are thinner and lighter for an easier time gaming on-the-go. Even so, it still has a leg up against the Steam Deck which is both slower and bulkier than the GPD solution.
The GPD Win 4 combines the powerful AMD Radeon 680M GPU with top tier build quality for a handheld that overshadows the Steam Deck in almost every way.
The two missing features of the Win 4 are its poor end-user serviceability and lack of FreeSync support. The densely packed design makes it difficult to replace the internal SSD or any potentially broken buttons while FreeSync would have improved the gaming experience without any additional hardware. For what it's worth, the display has a native 40 Hz mode if users want to target 40 FPS for less frequent screen tearing.
Something that should absolutely be fixed is the poor frame rate stability or micro-stuttering when gaming. Most Ultrabooks and especially gaming laptops do not exhibit this problem and we expect the same from a handheld where gaming is the key selling point.
For future models, we'd love to see GPD incorporate even more technology from current generation gaming laptops to minimize thickness and potentially weight. A move to liquid metal thermal paste, vapor chamber cooling, and a larger diameter internal fan, for example, could allow for greater performance-per-volume. Until then, the GPD Win 4 is easily one of the best and fastest Windows-based gaming handhelds currently available.
Price and Availability
The Indiegogo page for the Win 4 is now live with initial shipments beginning in March 2023. Configurations start at just under $1000 USD for 16 GB of RAM and 1 TB SSD up to $1300 for double the RAM and storage.
Transparency
The selection of devices to be reviewed is made by our editorial team. The test sample was provided to the author as a loan by the manufacturer or retailer for the purpose of this review. The lender had no influence on this review, nor did the manufacturer receive a copy of this review before publication. There was no obligation to publish this review. As an independent media company, Notebookcheck is not subjected to the authority of manufacturers, retailers or publishers.
This is how Notebookcheck is testing
Every year, Notebookcheck independently reviews hundreds of laptops and smartphones using standardized procedures to ensure that all results are comparable. We have continuously developed our test methods for around 20 years and set industry standards in the process. In our test labs, high-quality measuring equipment is utilized by experienced technicians and editors. These tests involve a multi-stage validation process. Our complex rating system is based on hundreds of well-founded measurements and benchmarks, which maintains objectivity. Further information on our test methods can be found here.
Price comparison
