 Deutsch
 English
 Español
 Français
 Italiano
 Nederlands
 Polski
 Português
 Русский
 Türkçe
 Svenska
 Chinese
 Magyar
Lenovo IdeaPad Flex 7 vs. IdeaPad Flex 5 review: Faster processor and better touchscreen
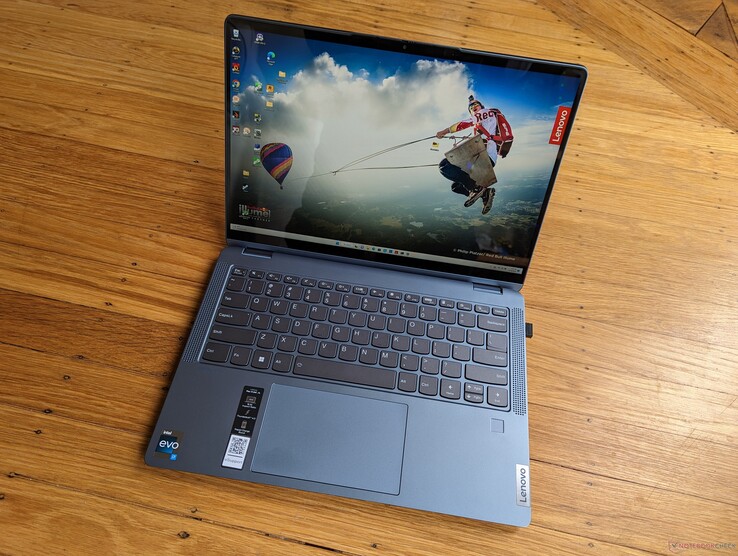
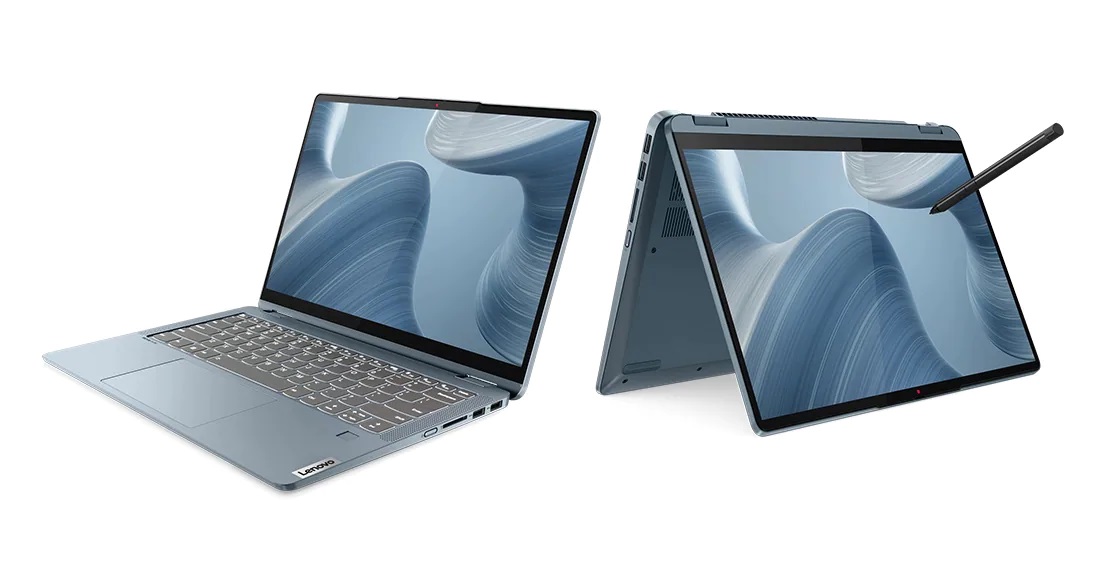
The Lenovo IdeaPad Flex 7i is a midrange convertible in between the cheaper IdeaPad 3 series and more expensive Yoga series. It utilizes the same chassis as the IdeaPad Flex 5 but with faster Core i7 CPU options and a higher resolution touchscreen. Thus, we recommend checking out our existing two reviews on the 2022 IdeaPad Flex 5 for more information on the chassis and its physical features.
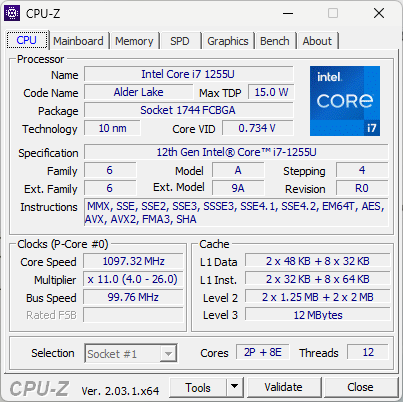
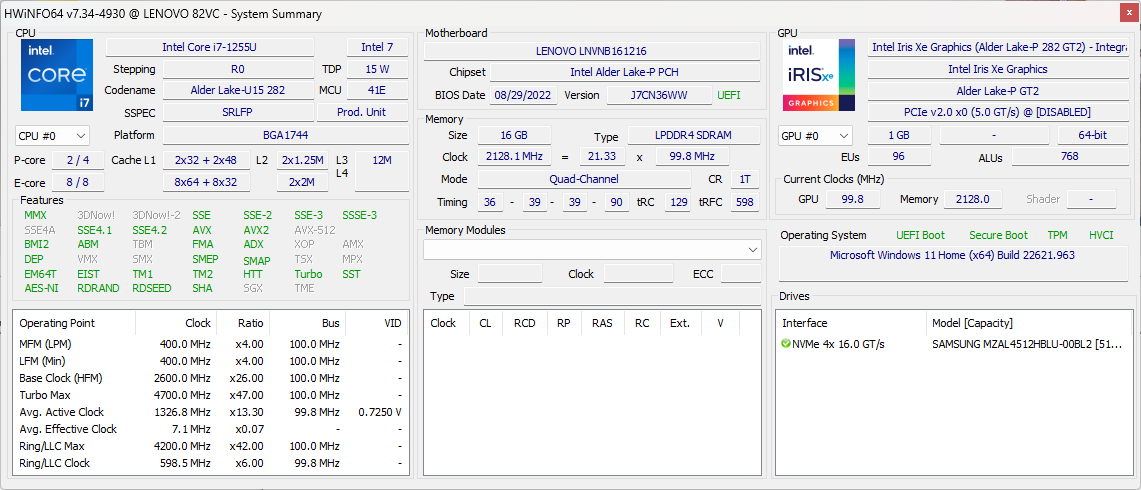
SKUs are limited at the moment outside of our particular review configuration with the Core i7-1255U CPU, 16 GB of soldered RAM, 1400p 16:10 touchscreen, and 512 GB NVMe SSD for approximately $900 to $1000 USD retail. Competitors in this space include other budget to midrange 14-inch convertibles like the Dell Inspiron 14 7420 2-in-1, HP Pavilion x360 14, or Asus VivoBook Flip 14.
More Lenovo reviews:
Potential Competitors in Comparison
Rating | Date | Model | Weight | Height | Size | Resolution | Best Price |
|---|---|---|---|---|---|---|---|
| 83.2 % | 12/2022 | Lenovo IdeaPad Flex 7i 14IAU7 i7-1255U, Iris Xe G7 96EUs | 1.5 kg | 18.9 mm | 14.00" | 2240x1400 | |
| 82.4 % | 08/2022 | Lenovo IdeaPad Flex 5i 14IAU7 i5-1235U, Iris Xe G7 80EUs | 1.6 kg | 17.4 mm | 14.00" | 1920x1200 | |
| 90 % | 09/2022 | Lenovo Yoga 7-14ARB G7 R7 6800U, Radeon 680M | 1.4 kg | 17.4 mm | 14.00" | 2880x1800 | |
| 83.7 % | 06/2022 | Dell Inspiron 14 7420 2-in-1 i7-1255U, Iris Xe G7 96EUs | 1.6 kg | 17.86 mm | 14.00" | 1920x1200 | |
| 81 % | 02/2020 | HP Pavilion x360 14-dh1153ng i5-10210U, UHD Graphics 620 | 1.6 kg | 20.5 mm | 14.00" | 1920x1080 | |
| 79.1 % | 06/2021 | Asus VivoBook Flip 14 TP470EZ i5-1135G7, Xe MAX | 1.5 kg | 18.7 mm | 14.00" | 1920x1080 |
Case
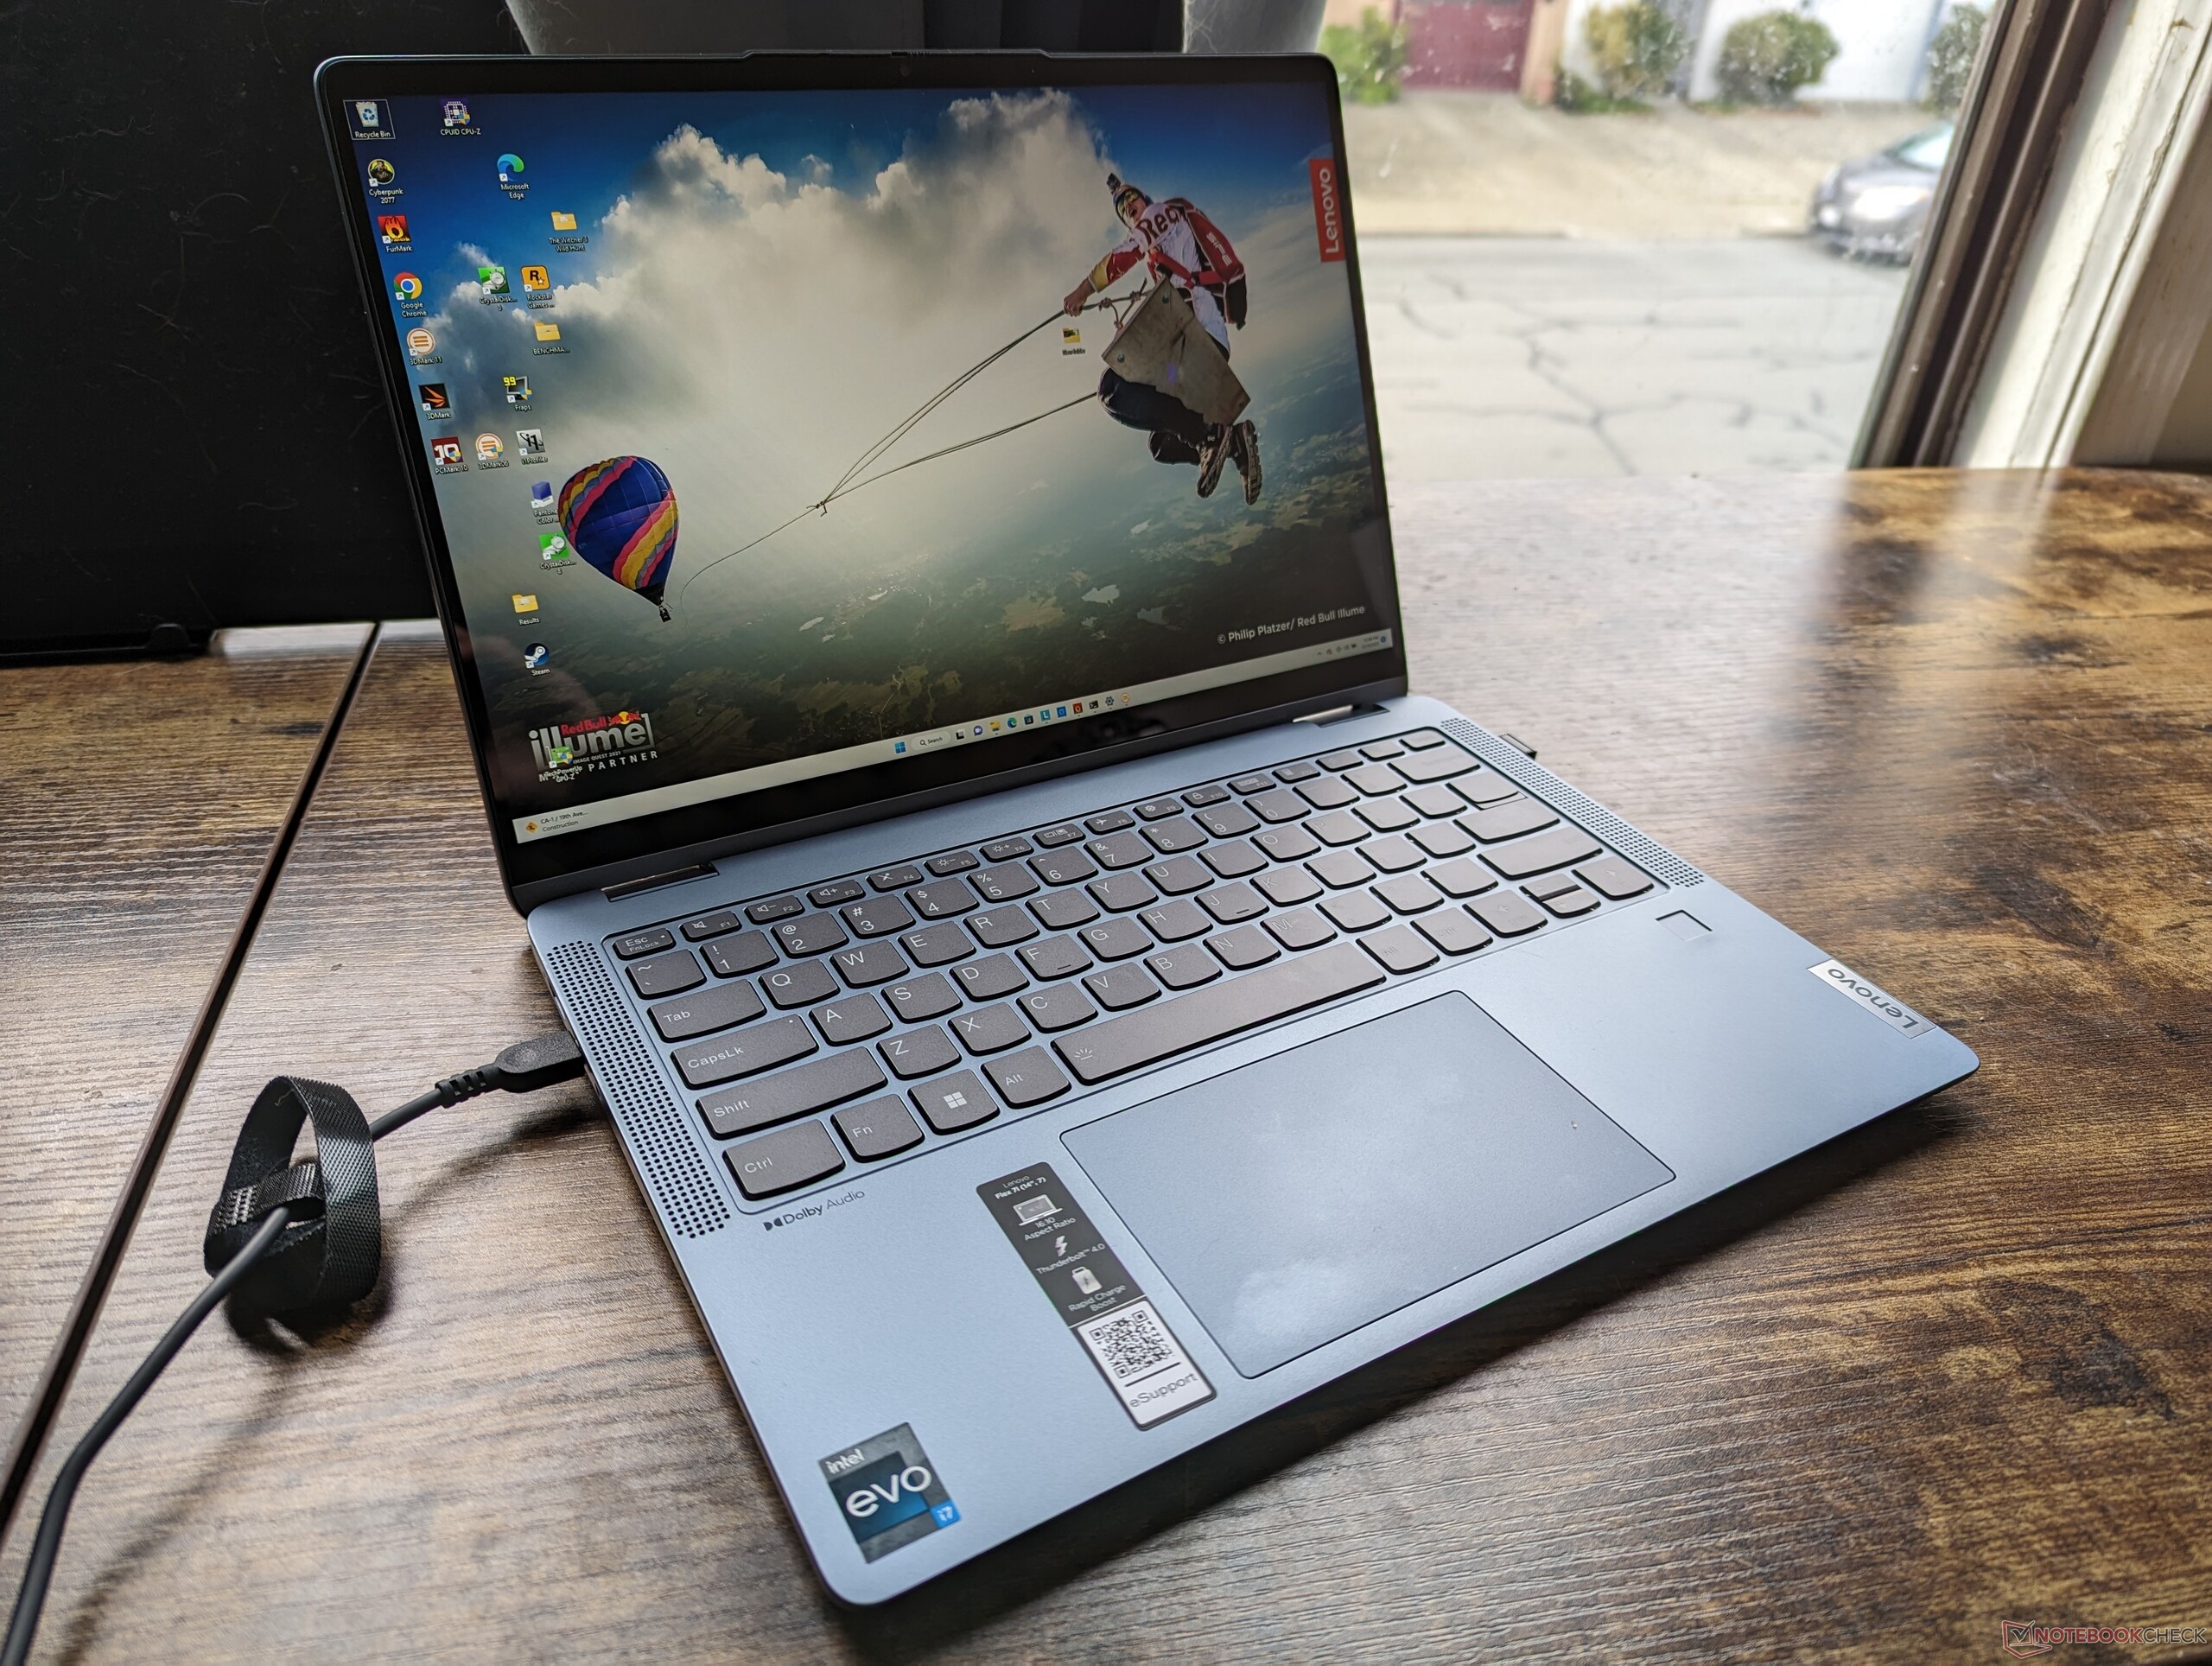
Though the IdeaPad Flex 7i chassis is identical to the IdeaPad Flex 5i, there is one easy way to visually distinguish the two models apart. The IdeaPad Flex 7i drops the proprietary AC charging port along the left edge as it uses USB-C charging only. Unfortunately, Lenovo has not added a second USB-C port to compensate. This is one of the few USB-C laptops to not have two or more USB-C ports which can be frustrating if you have USB-C peripherals.
Thunderbolt 4 is still supported much like on the Flex 5i to support a wide variety of docking stations.
SD Card Reader
| SD Card Reader | |
| average JPG Copy Test (av. of 3 runs) | |
| Lenovo IdeaPad Flex 7i 14IAU7 (Toshiba Exceria Pro SDXC 64 GB UHS-II) | |
| Lenovo IdeaPad Flex 5i 14IAU7 (Toshiba Exceria Pro SDXC 64 GB UHS-II) | |
| Lenovo Yoga 7-14ARB G7 (Angelbird AV Pro V60) | |
| HP Pavilion x360 14-dh1153ng (Toshiba Exceria Pro SDXC 64 GB UHS-II) | |
| Asus VivoBook Flip 14 TP470EZ (AV PRO microSD 128 GB V60) | |
| Dell Inspiron 14 7420 2-in-1 (Toshiba Exceria Pro SDXC 64 GB UHS-II) | |
| maximum AS SSD Seq Read Test (1GB) | |
| Lenovo Yoga 7-14ARB G7 (Angelbird AV Pro V60) | |
| Lenovo IdeaPad Flex 7i 14IAU7 (Toshiba Exceria Pro SDXC 64 GB UHS-II) | |
| Lenovo IdeaPad Flex 5i 14IAU7 (Toshiba Exceria Pro SDXC 64 GB UHS-II) | |
| HP Pavilion x360 14-dh1153ng (Toshiba Exceria Pro SDXC 64 GB UHS-II) | |
| Asus VivoBook Flip 14 TP470EZ (AV PRO microSD 128 GB V60) | |
| Dell Inspiron 14 7420 2-in-1 (Toshiba Exceria Pro SDXC 64 GB UHS-II) | |
Communication
| Networking | |
| iperf3 transmit AX12 | |
| Asus VivoBook Flip 14 TP470EZ | |
| HP Pavilion x360 14-dh1153ng | |
| iperf3 receive AX12 | |
| Asus VivoBook Flip 14 TP470EZ | |
| HP Pavilion x360 14-dh1153ng | |
| iperf3 receive AXE11000 6GHz | |
| Dell Inspiron 14 7420 2-in-1 | |
| Lenovo IdeaPad Flex 7i 14IAU7 | |
| iperf3 receive AXE11000 | |
| Lenovo Yoga 7-14ARB G7 | |
| Lenovo IdeaPad Flex 5i 14IAU7 | |
| Lenovo IdeaPad Flex 7i 14IAU7 | |
| iperf3 transmit AXE11000 | |
| Lenovo Yoga 7-14ARB G7 | |
| Lenovo IdeaPad Flex 5i 14IAU7 | |
| Lenovo IdeaPad Flex 7i 14IAU7 | |
| iperf3 transmit AXE11000 6GHz | |
| Lenovo IdeaPad Flex 7i 14IAU7 | |
| Dell Inspiron 14 7420 2-in-1 | |
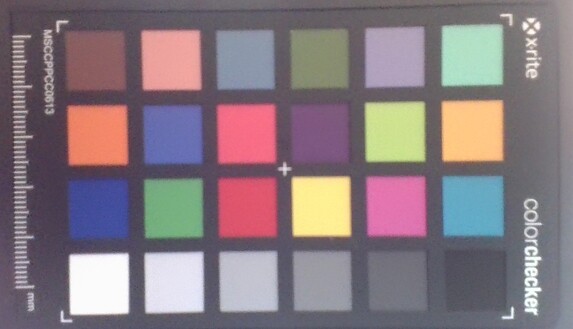
Webcam


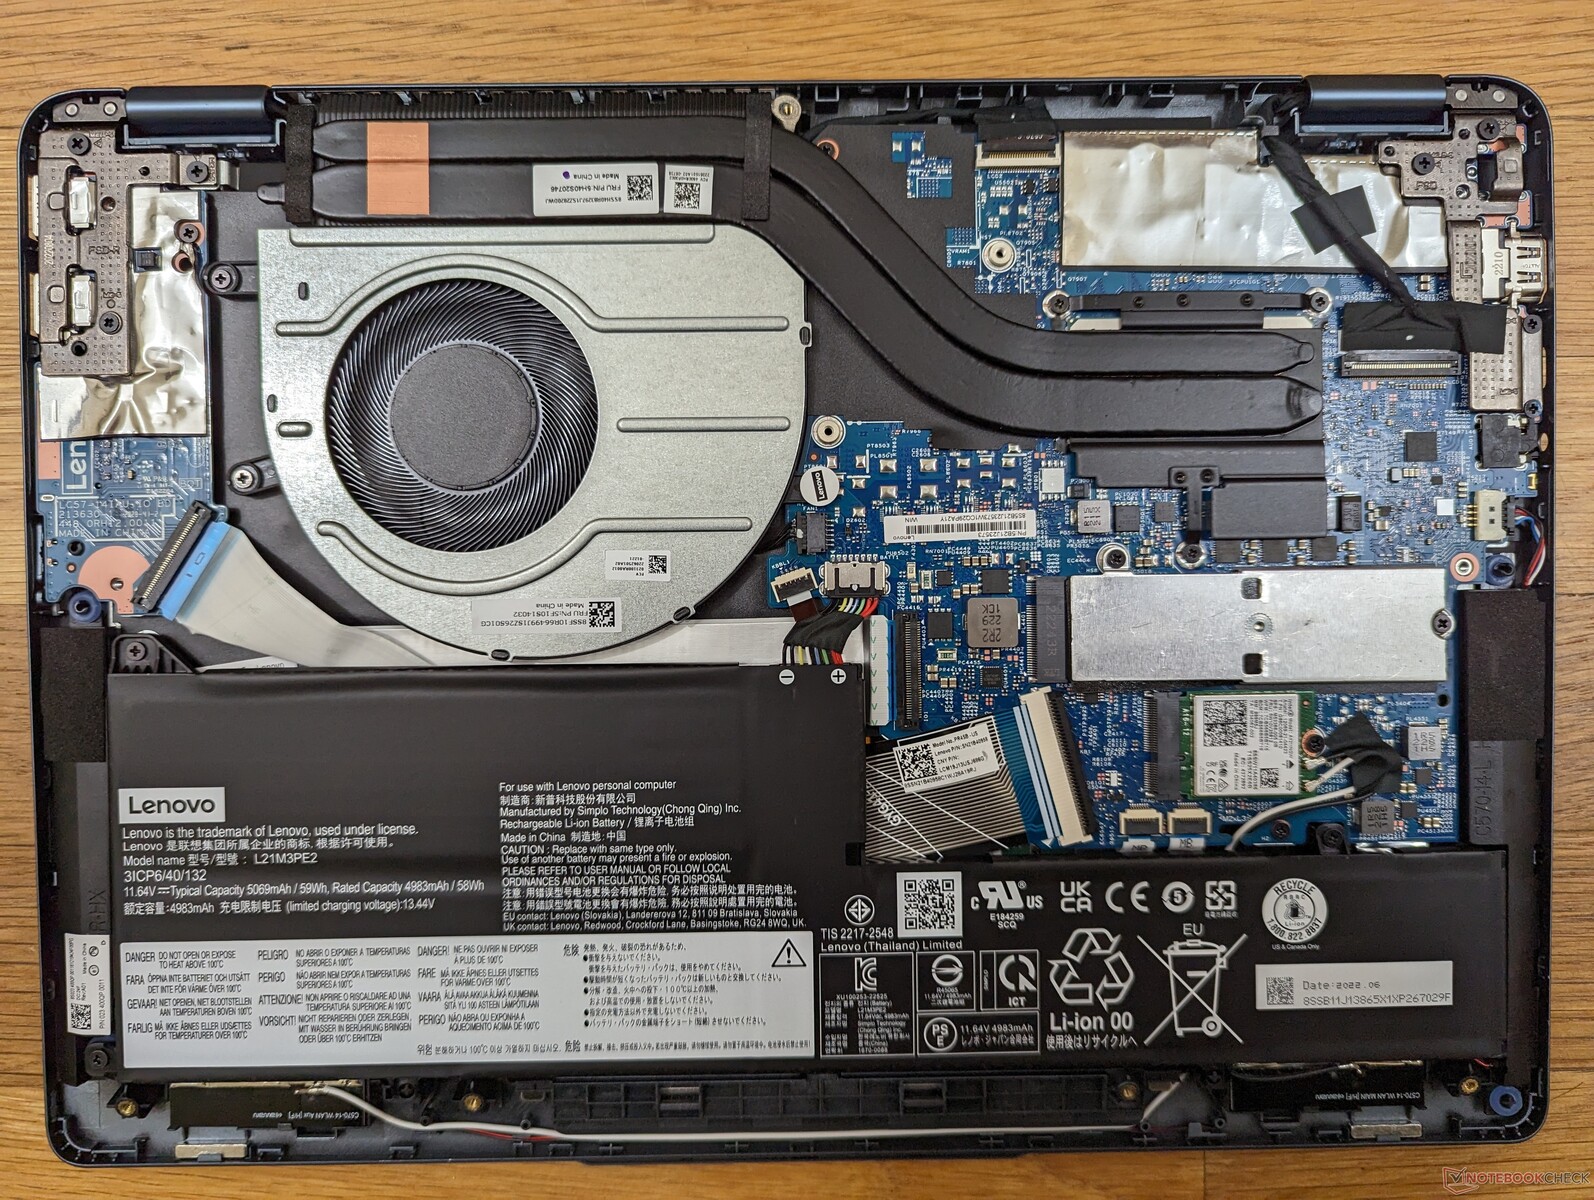
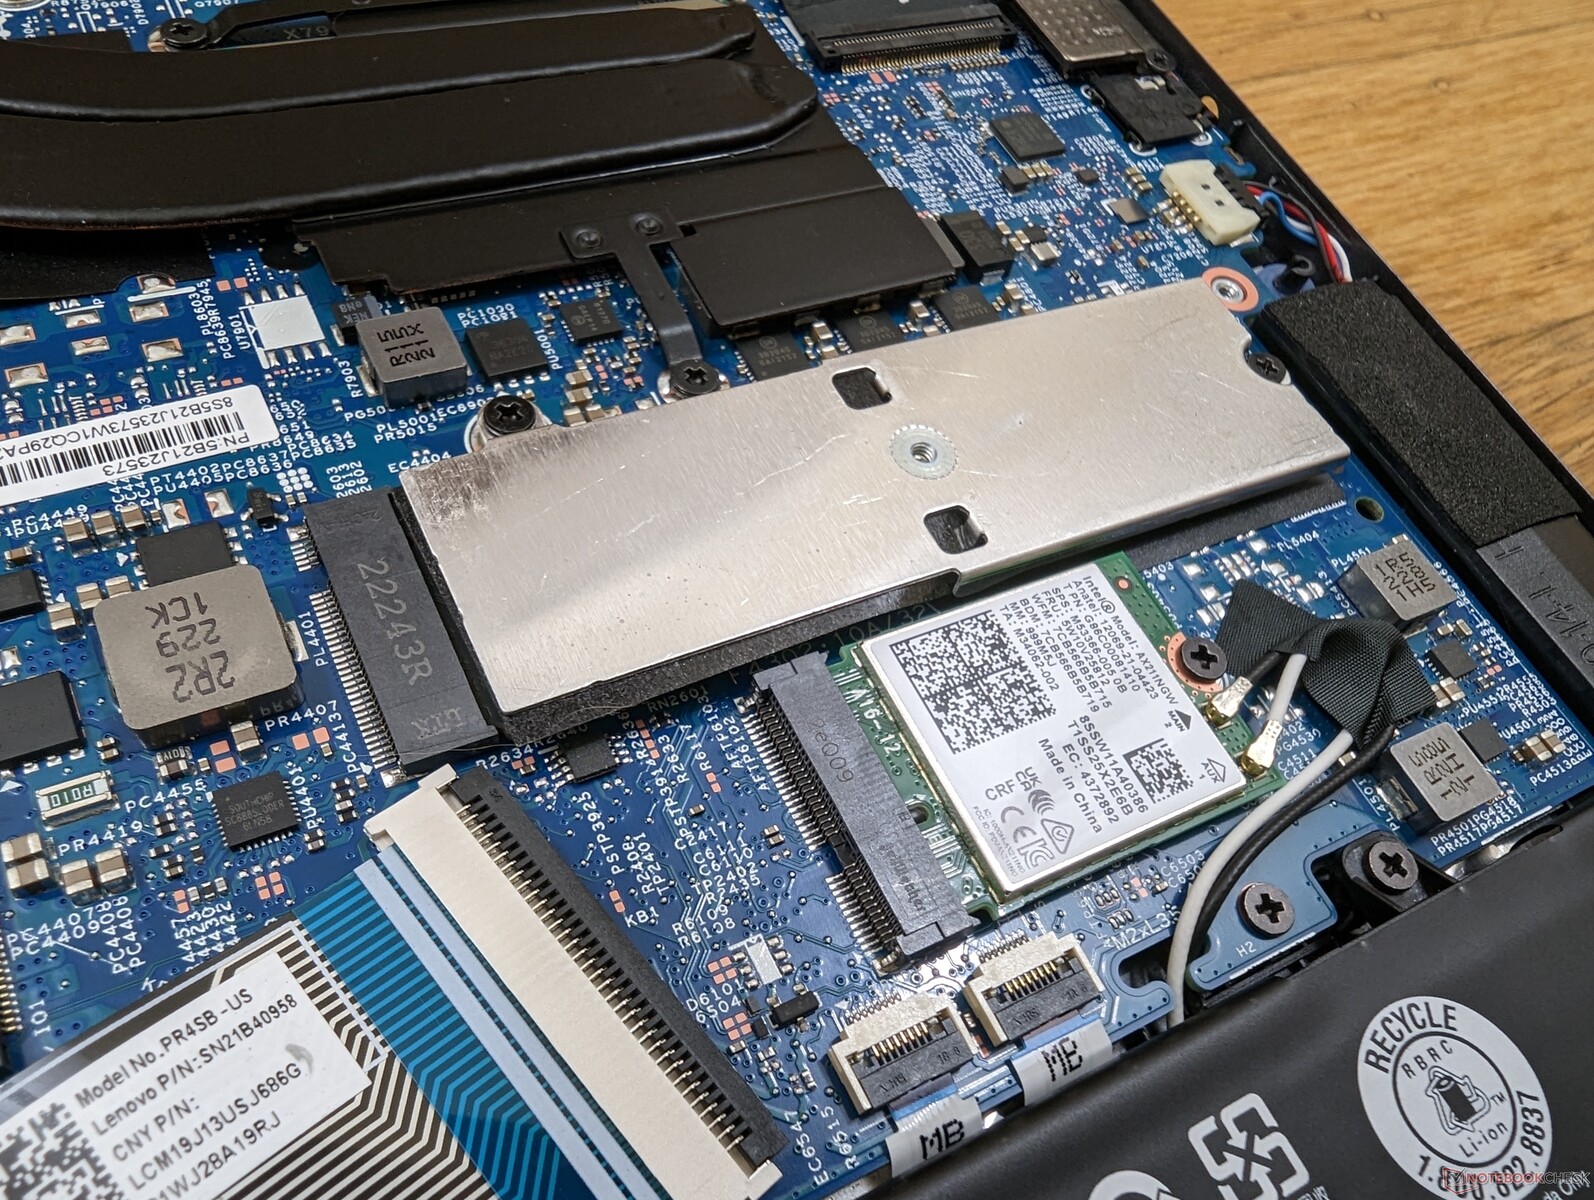
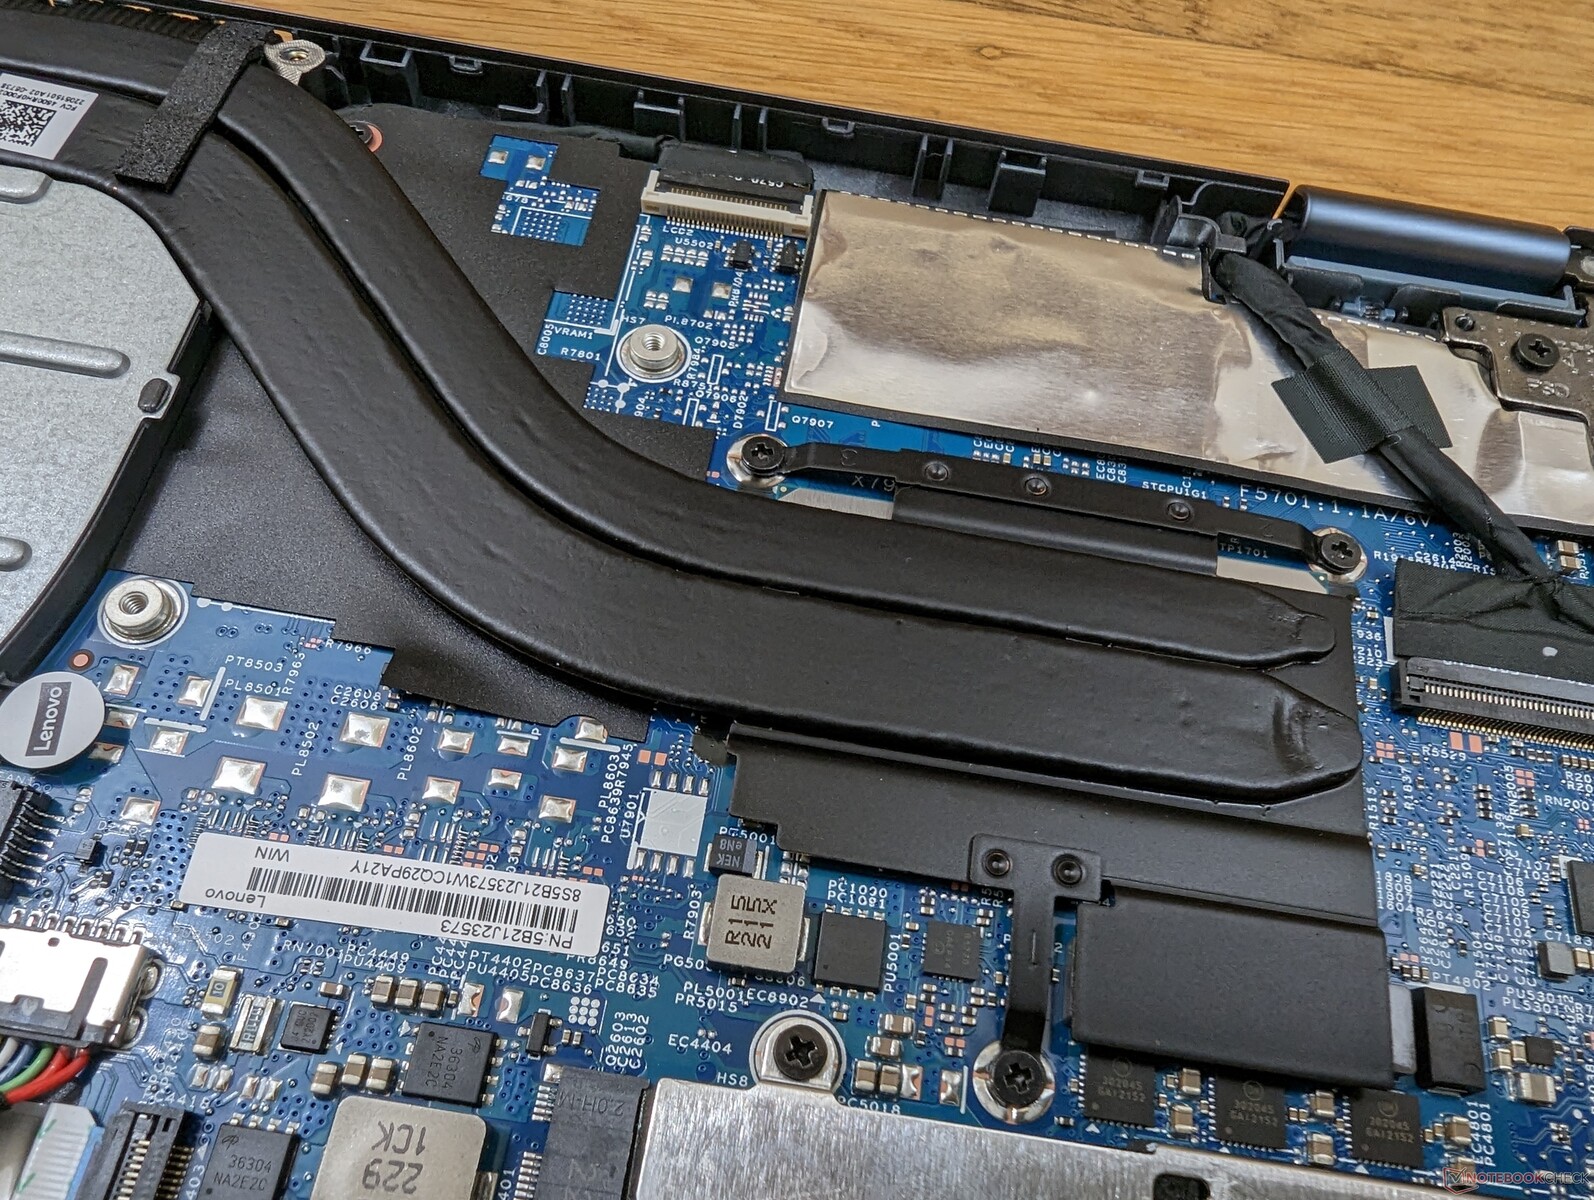
Maintenance
Accessories and Warranty
The retail box includes no extras beyond the AC adapter and paperwork. The active stylus pen is sold separately.
A one-year limited manufacturer warranty applies if purchased in the US.
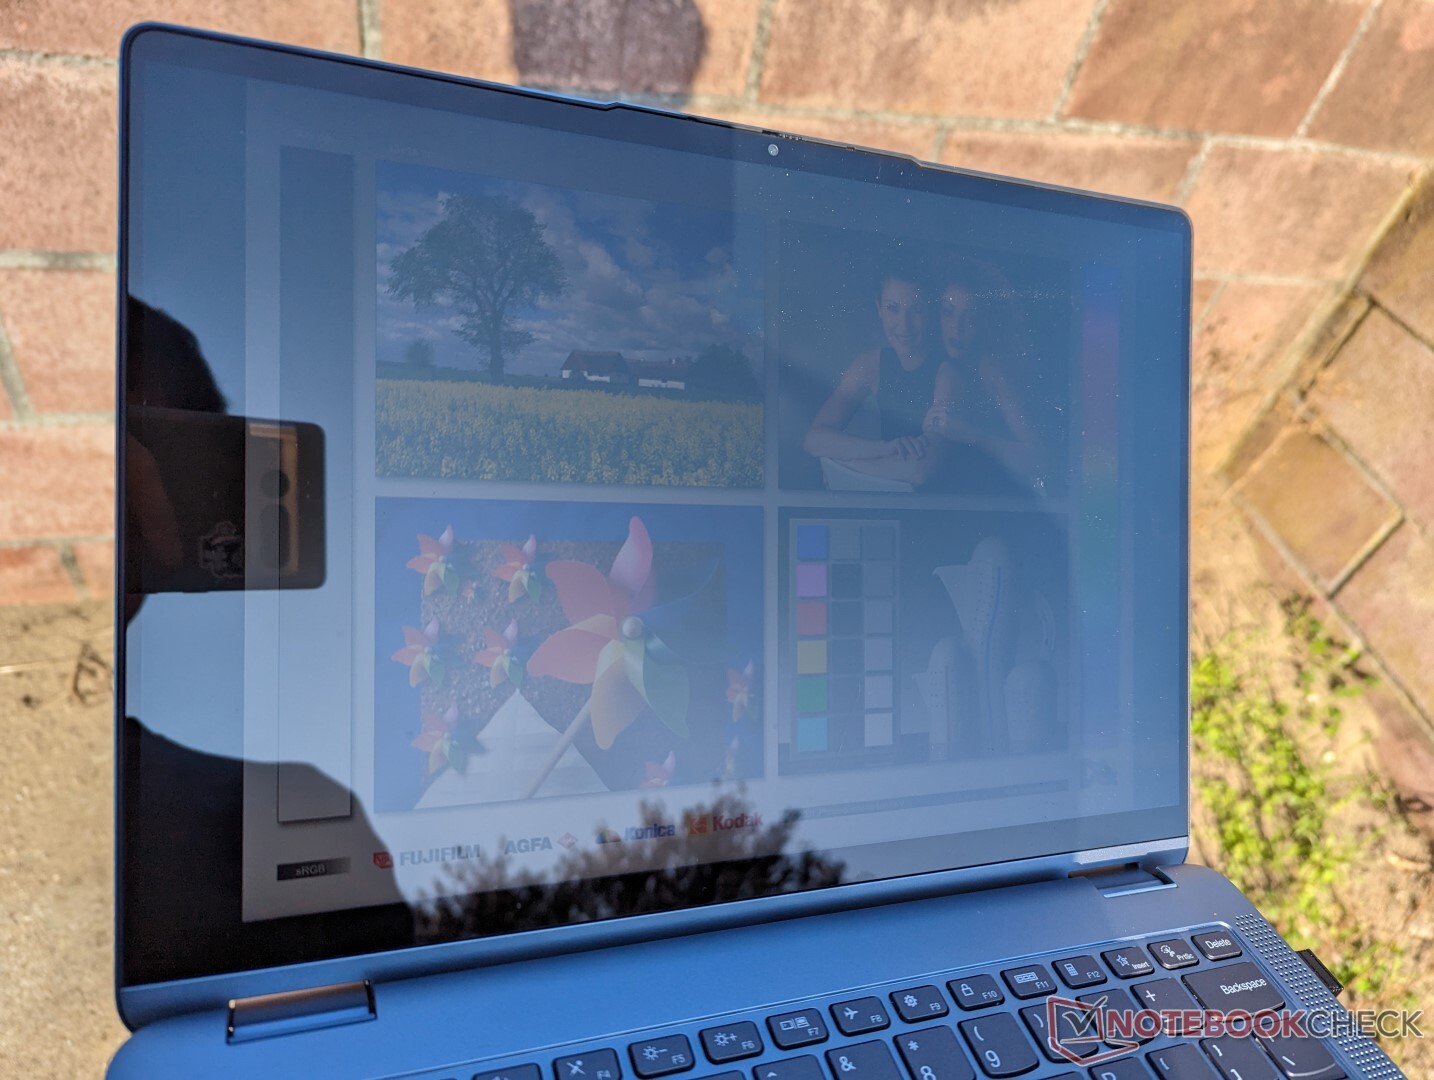
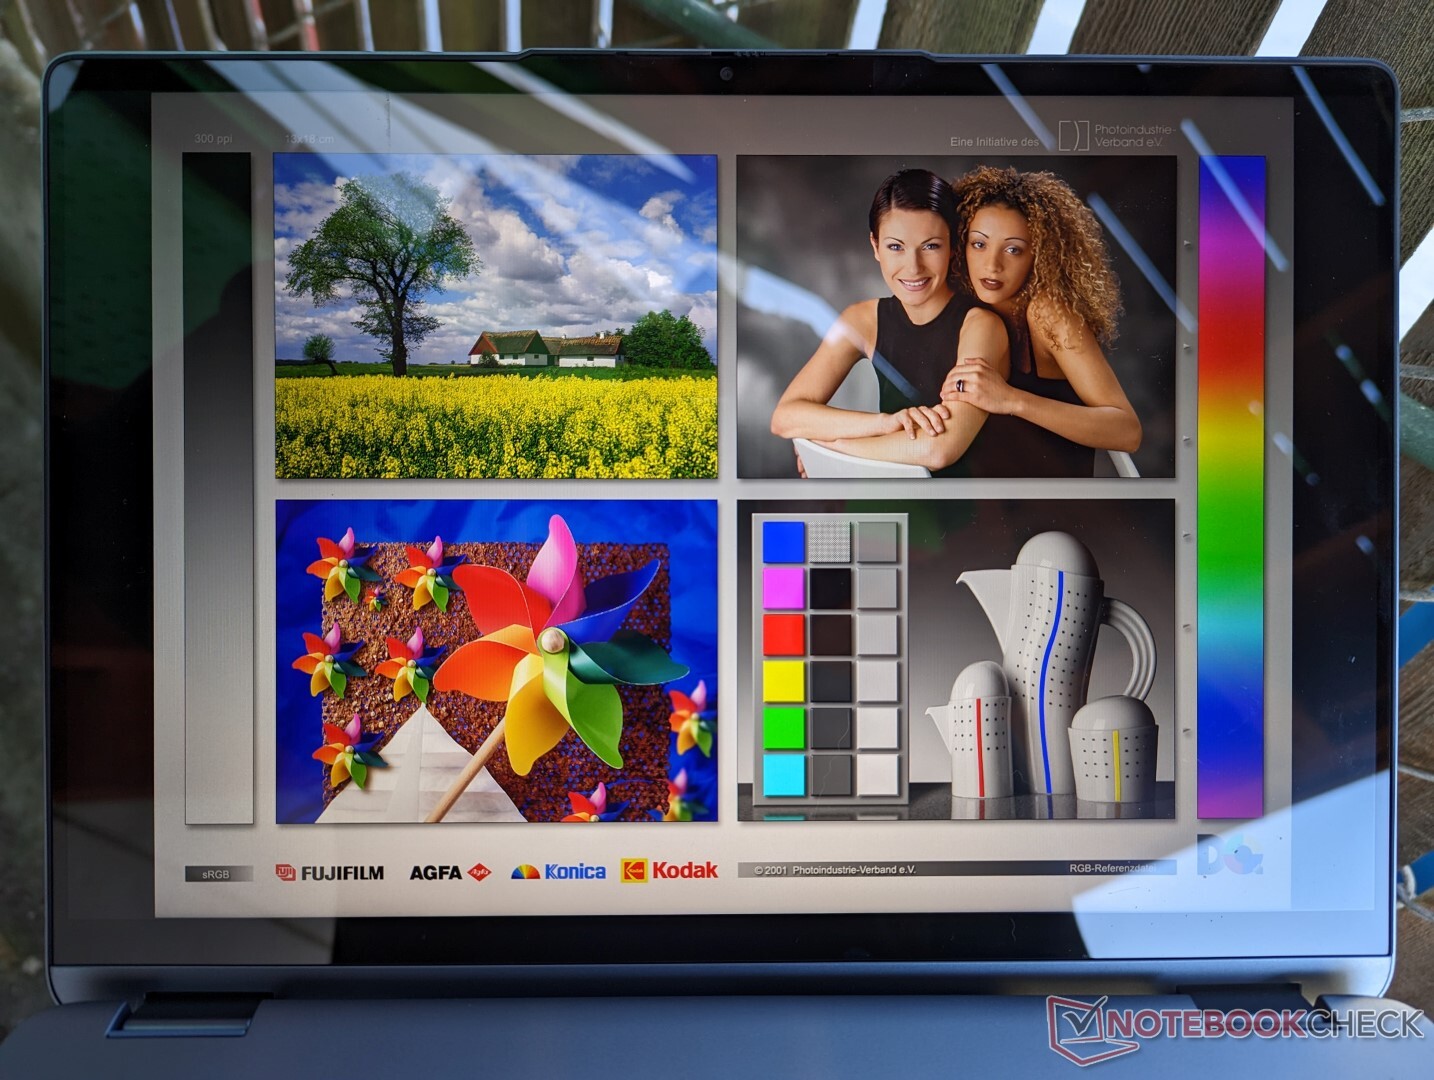
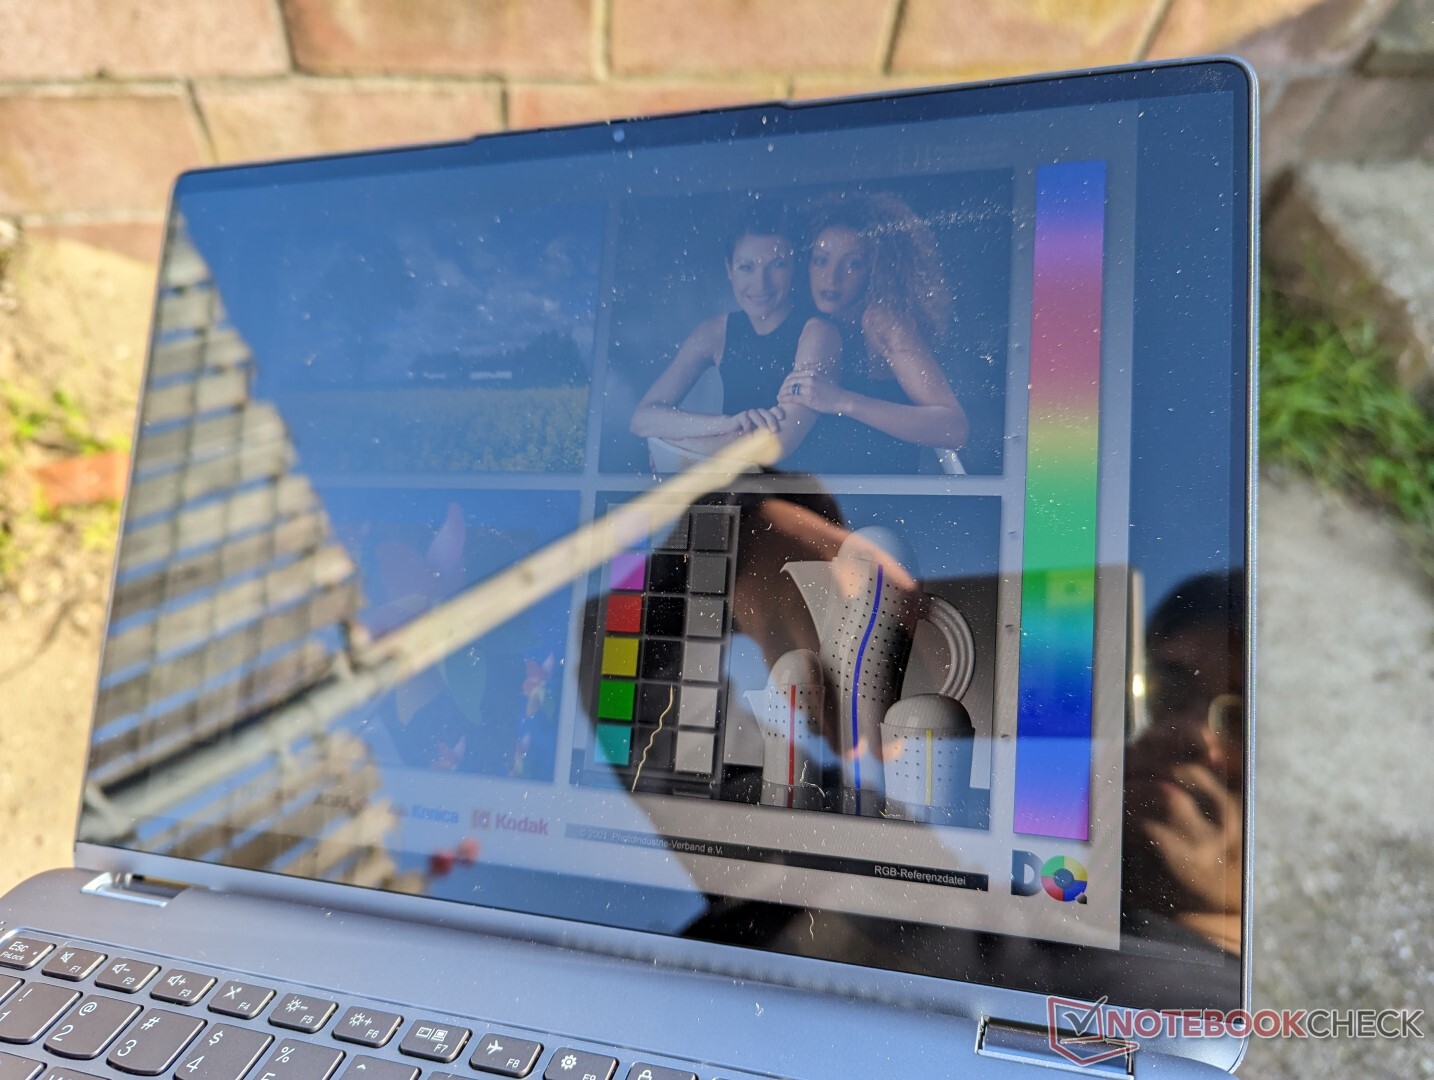
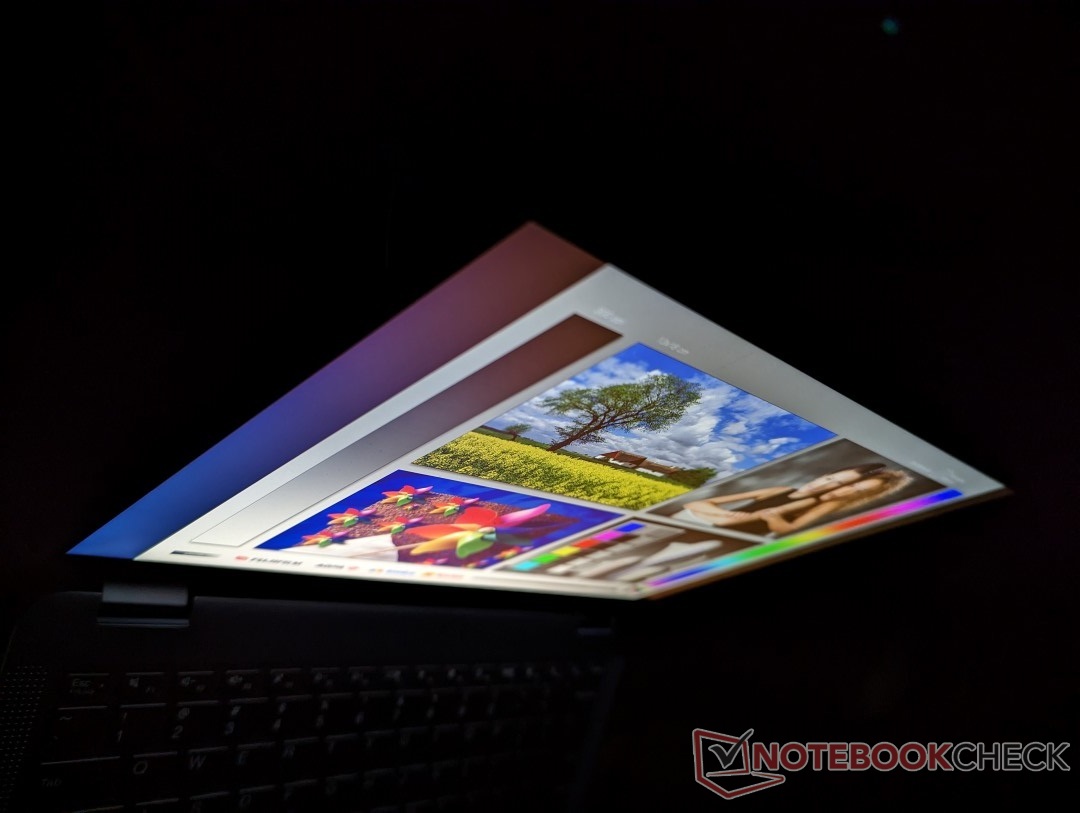
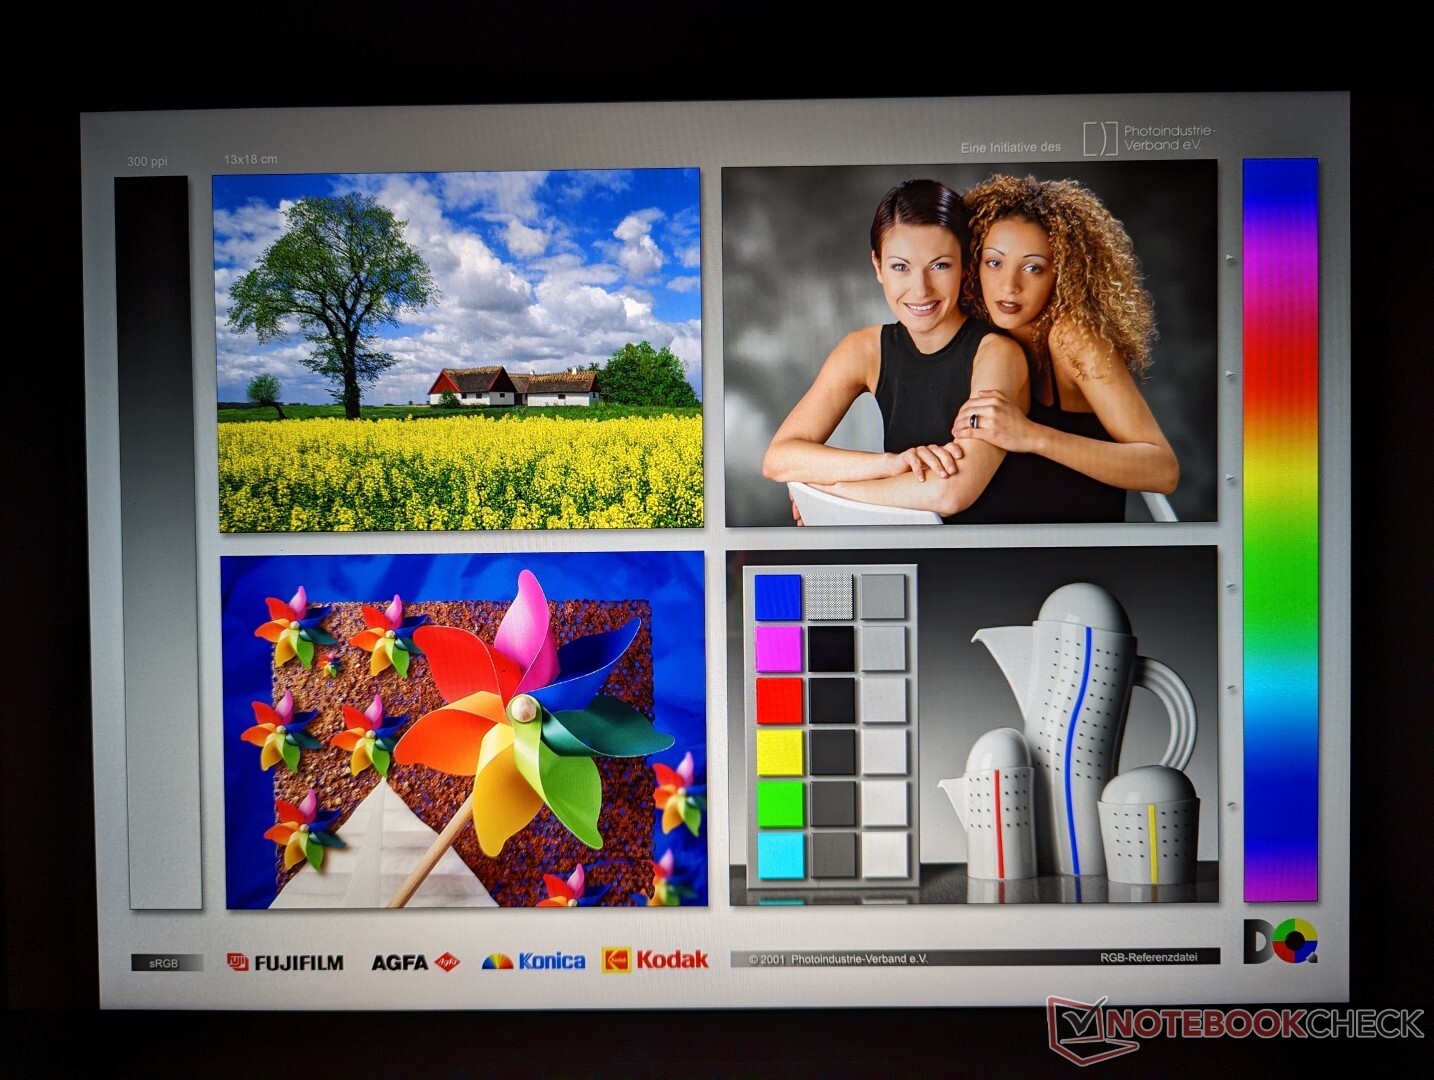
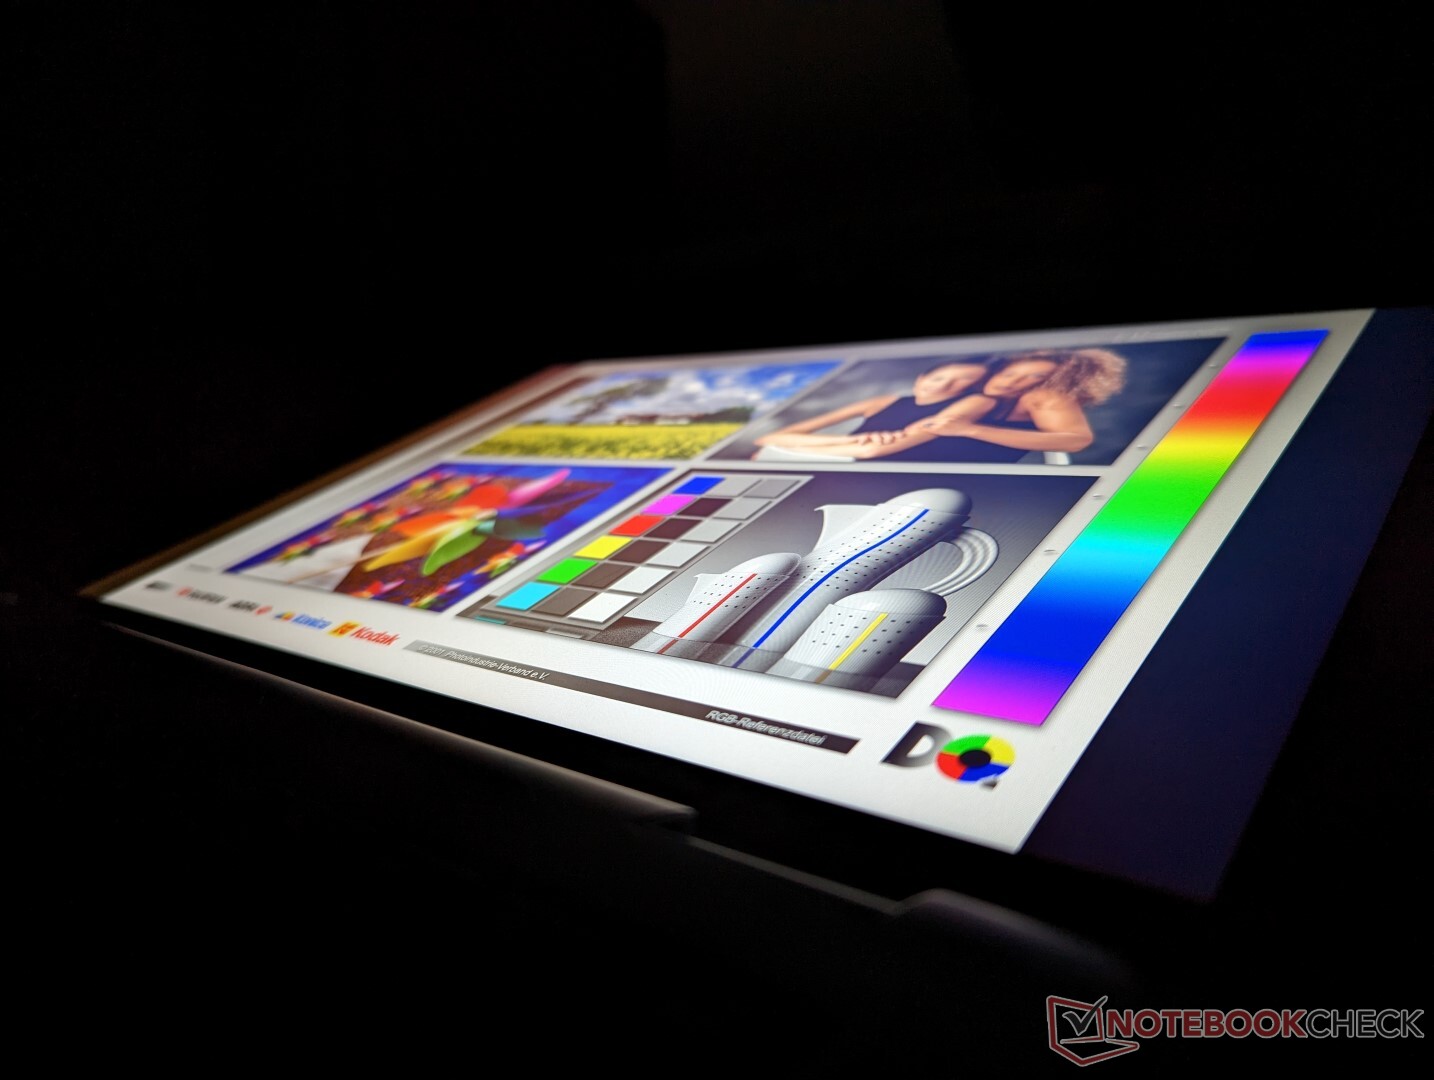
Display
The display is arguably the biggest differentiating factor separating the IdeaPad Flex 7i from the Flex 5i. Whereas the Flex 5i utilizes a 1200p IPS touchscreen with just 60 percent sRGB coverage, our Flex 7i utilizes a higher resolution 2240 x 1400p panel with nearly 100 percent sRGB coverage. The upgrades are significant enough that a user can tell the difference with just the naked eye.
There are a few drawbacks, however, including slight downgrades to maximum brightness, contrast ratio, and response times when compared to the 1200p Flex 5i panel. They're thankfully not enough to really detract from the deeper colors and higher pixel density. Meanwhile, the faster 90 Hz refresh rate options are currently reserved for the costlier Yoga series.


| |||||||||||||||||||||||||
Brightness Distribution: 90 %
Center on Battery: 317.3 cd/m²
Contrast: 1442:1 (Black: 0.22 cd/m²)
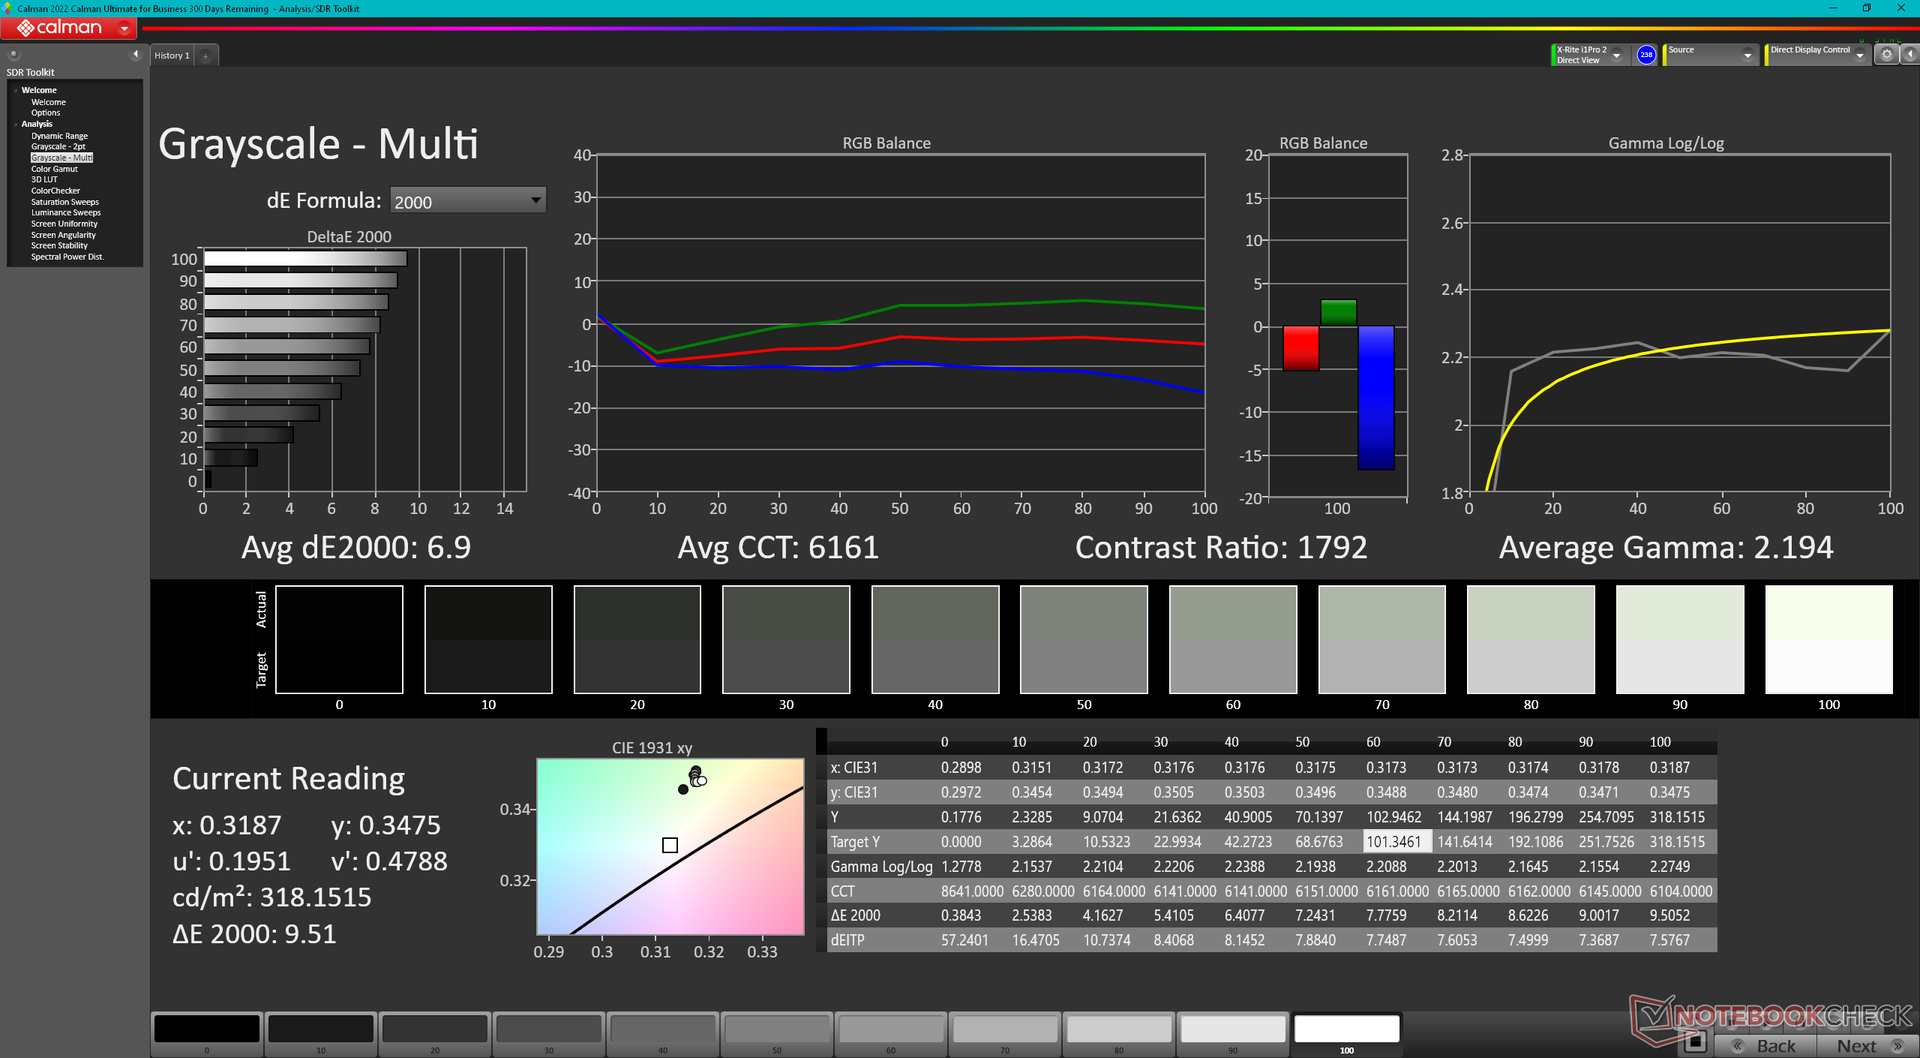
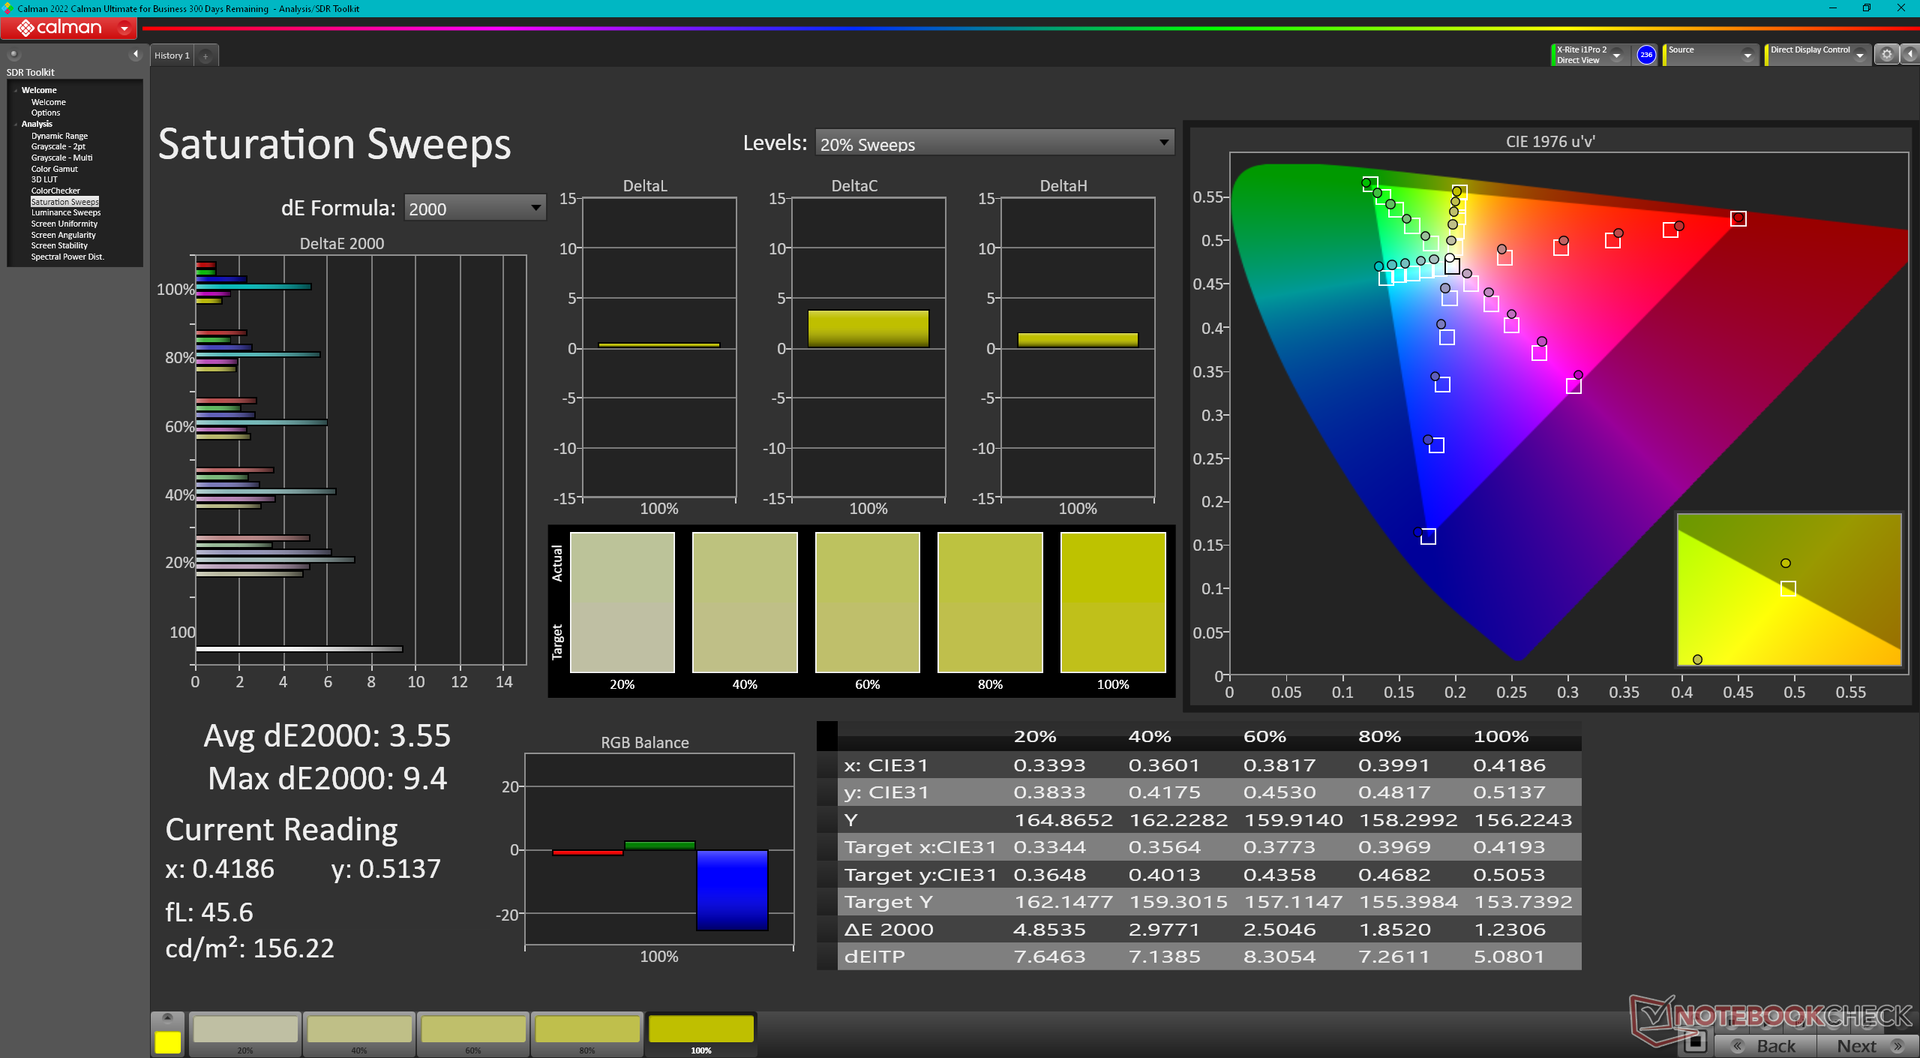
ΔE Color 3.99 | 0.5-29.43 Ø5, calibrated: 0.6
ΔE Greyscale 6.9 | 0.57-98 Ø5.3
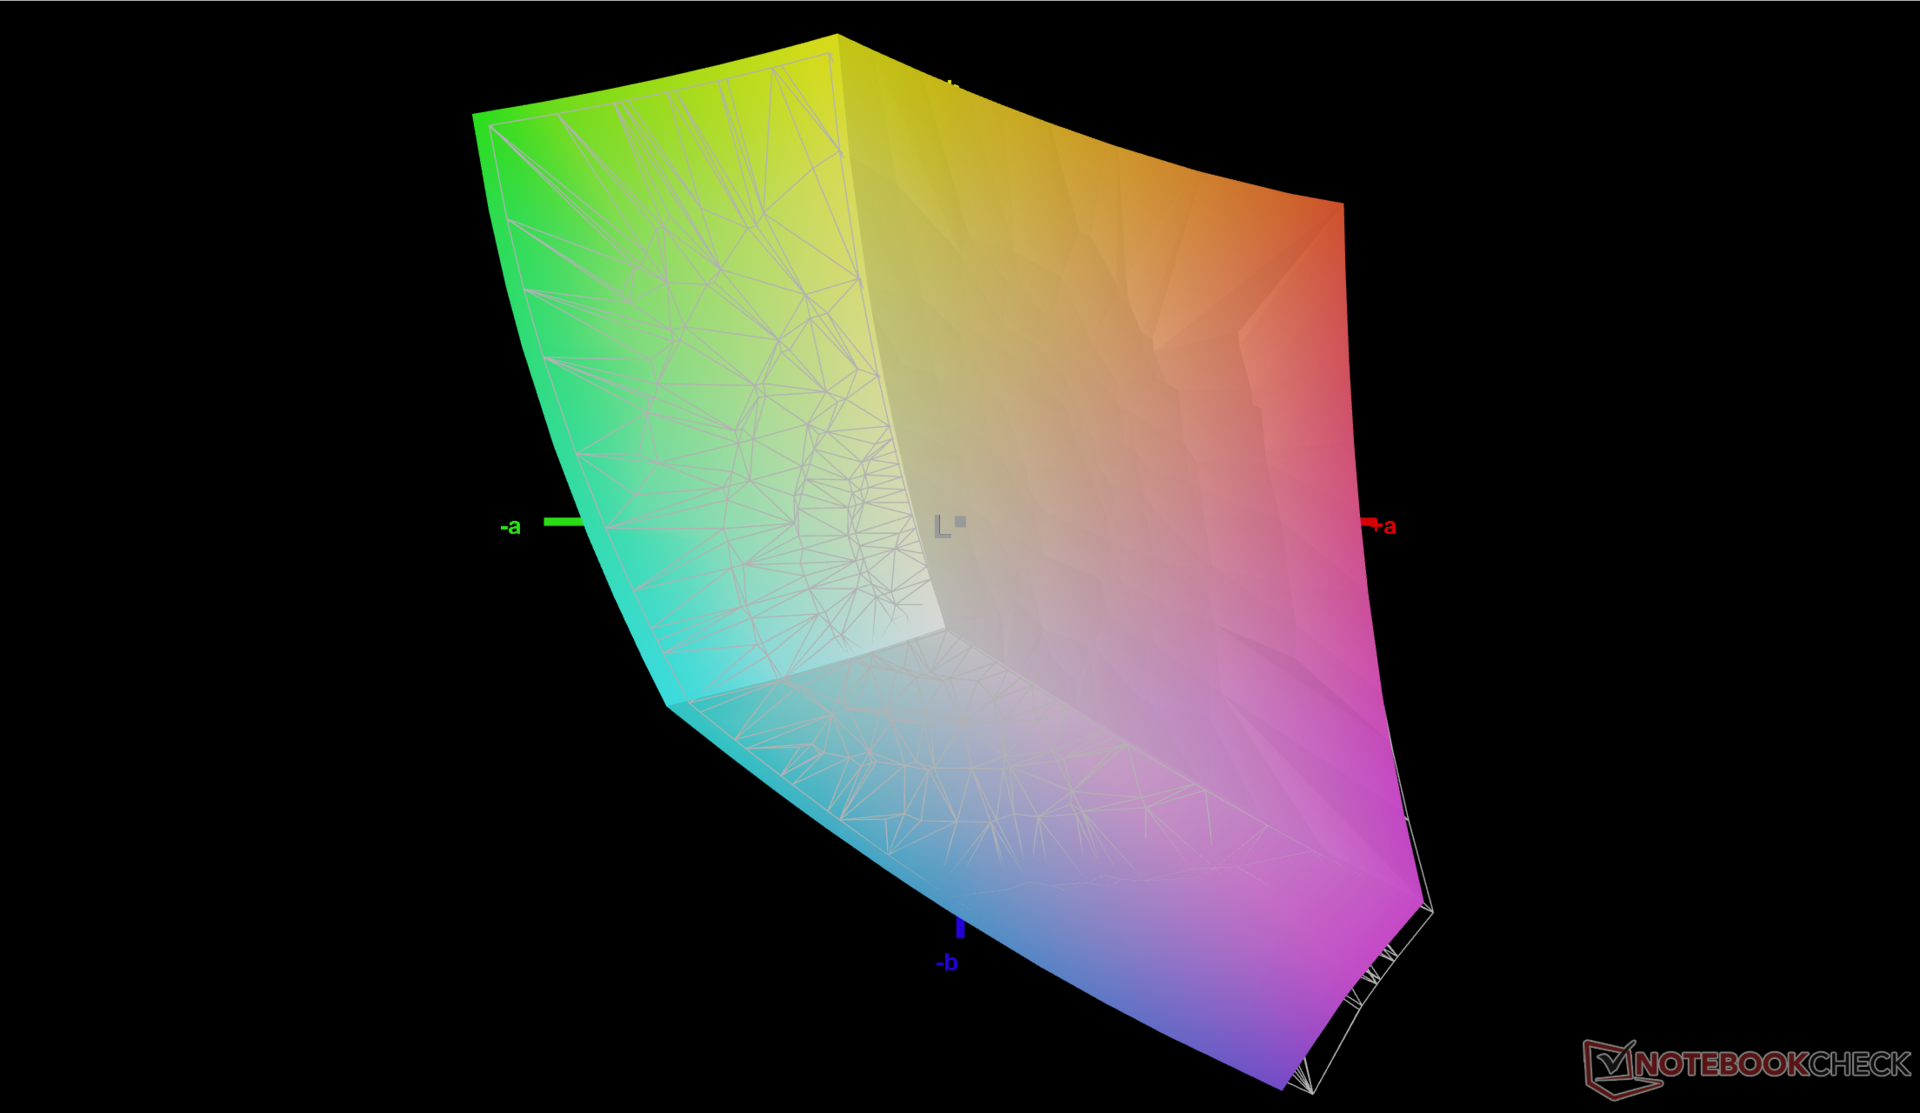
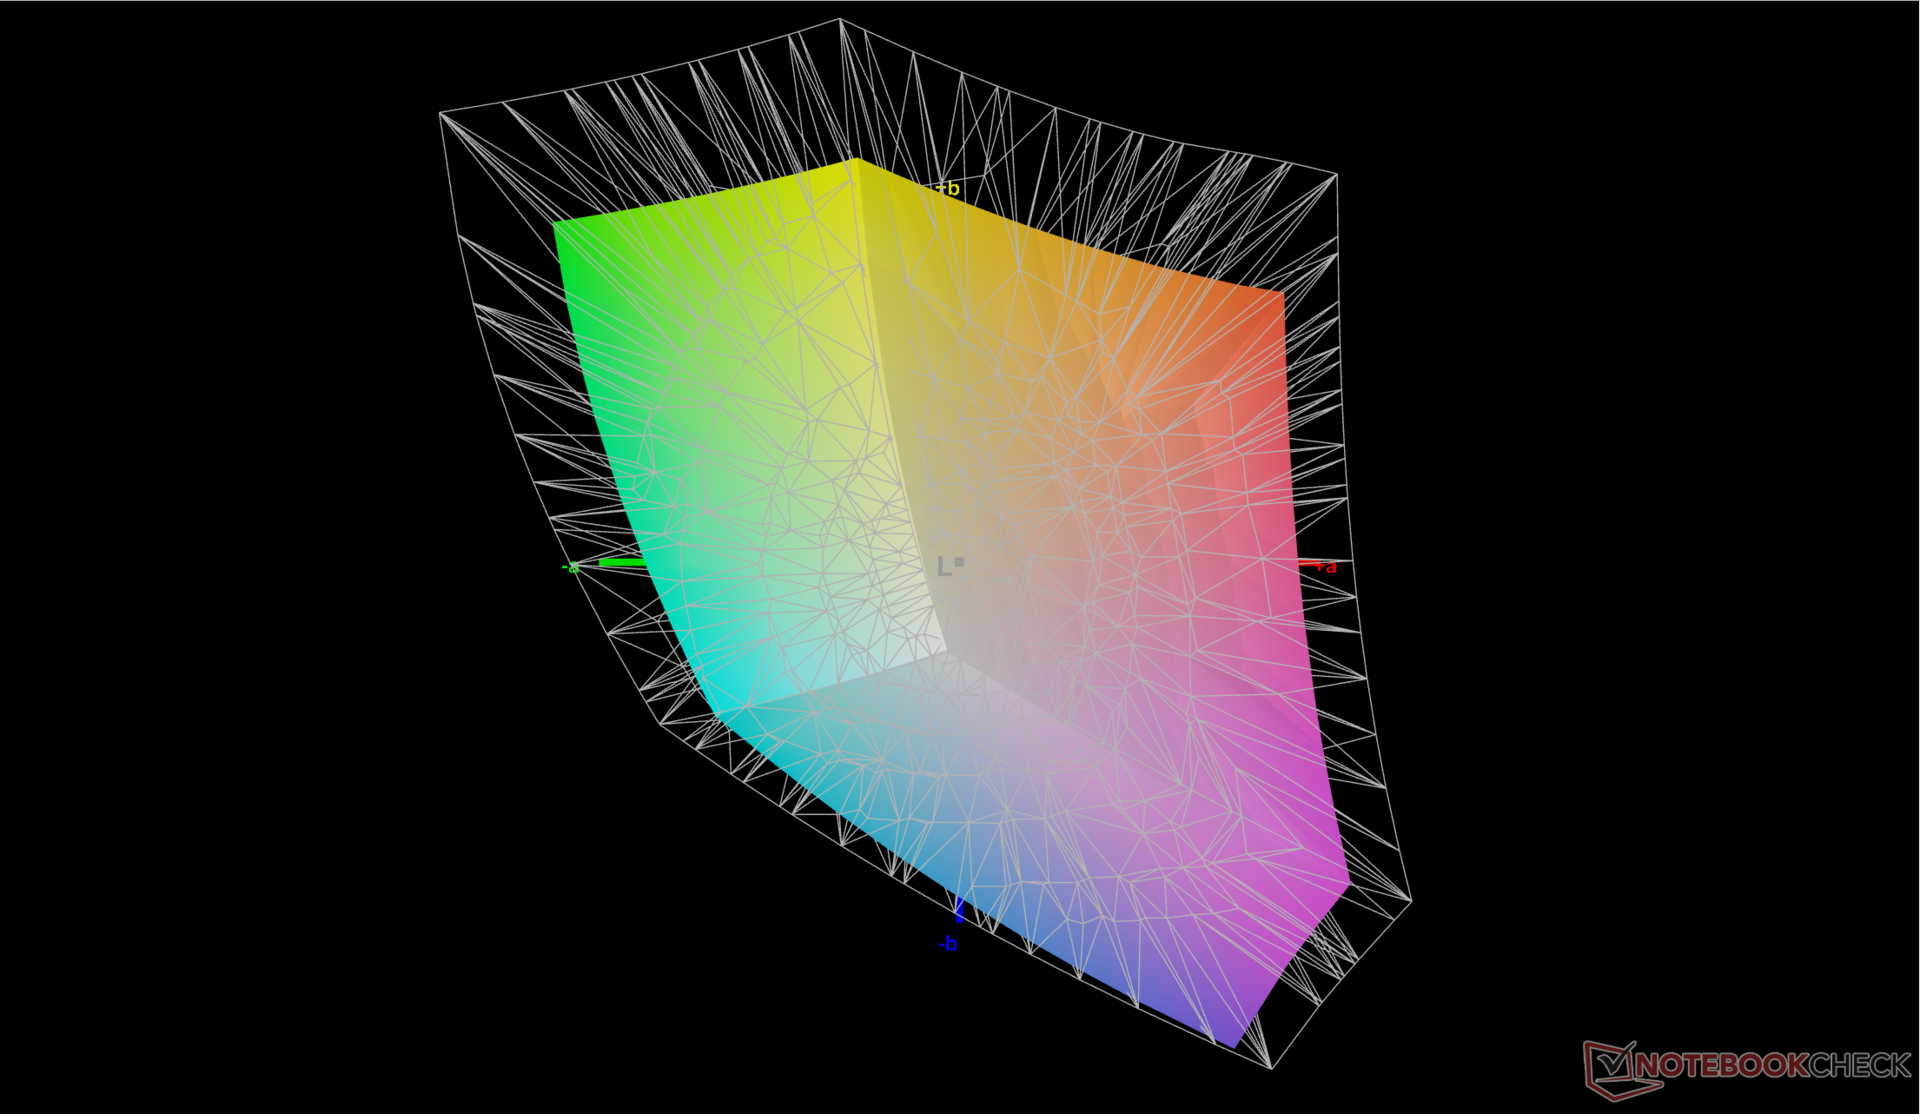
72.2% AdobeRGB 1998 (Argyll 2.2.0 3D)
98% sRGB (Argyll 2.2.0 3D)
69.8% Display P3 (Argyll 2.2.0 3D)
Gamma: 2.19
| Lenovo IdeaPad Flex 7i 14IAU7 BOE CQ NV140DRM-162, IPS, 2240x1400, 14.00 | Lenovo IdeaPad Flex 5i 14IAU7 LEN140WUXGA, IPS, 1920x1200, 14.00 | Lenovo Yoga 7-14ARB G7 LEN140WQ+, OLED, 2880x1800, 14.00 | Dell Inspiron 14 7420 2-in-1 BOE NV14N42, IPS, 1920x1200, 14.00 | HP Pavilion x360 14-dh1153ng BOE NV140FHM-N4K, IPS, 1920x1080, 14.00 | Asus VivoBook Flip 14 TP470EZ Chi Mei CMN N140HCA-EAC, IPS, 1920x1080, 14.00 | |
|---|---|---|---|---|---|---|
| Display | -42% | 27% | -44% | -43% | -39% | |
| Display P3 Coverage | 69.8 | 39.6 -43% | 99.9 43% | 38.6 -45% | 39.35 -44% | 41.6 -40% |
| sRGB Coverage | 98 | 59.6 -39% | 100 2% | 56.2 -43% | 58.8 -40% | 62.1 -37% |
| AdobeRGB 1998 Coverage | 72.2 | 41 -43% | 97.2 35% | 39.9 -45% | 40.65 -44% | 43 -40% |
| Response Times | 25% | 98% | 39% | 2% | 15% | |
| Response Time Grey 50% / Grey 80% * | 44.4 ? | 37.6 ? 15% | 1 ? 98% | 27.2 ? 39% | 44 ? 1% | 39 ? 12% |
| Response Time Black / White * | 33.6 ? | 22 ? 35% | 1 ? 97% | 20.8 ? 38% | 33 ? 2% | 28 ? 17% |
| PWM Frequency | 360 ? | 192 ? | 25000 ? | |||
| Screen | -15% | 58% | -83% | -113% | -72% | |
| Brightness middle | 317.3 | 356.8 12% | 386 22% | 269.4 -15% | 248 -22% | 205 -35% |
| Brightness | 301 | 339 13% | 389 29% | 260 -14% | 238 -21% | 186 -38% |
| Brightness Distribution | 90 | 90 0% | 98 9% | 89 -1% | 74 -18% | 78 -13% |
| Black Level * | 0.22 | 0.14 36% | 0.05 77% | 0.41 -86% | 0.235 -7% | 0.22 -0% |
| Contrast | 1442 | 2549 77% | 7720 435% | 657 -54% | 1055 -27% | 932 -35% |
| Colorchecker dE 2000 * | 3.99 | 4.39 -10% | 2.6 35% | 6.53 -64% | 5.43 -36% | 5.14 -29% |
| Colorchecker dE 2000 max. * | 9.34 | 14.61 -56% | 4.8 49% | 19.76 -112% | 17.96 -92% | 19.57 -110% |
| Colorchecker dE 2000 calibrated * | 0.6 | 2.19 -265% | 1.8 -200% | 3.13 -422% | 5.7 -850% | 3.17 -428% |
| Greyscale dE 2000 * | 6.9 | 3 57% | 2.3 67% | 5.4 22% | 3.18 54% | 4.1 41% |
| Gamma | 2.19 100% | 2.24 98% | 2.21 100% | 2.05 107% | 2.56 86% | 2.2 100% |
| CCT | 6161 106% | 7085 92% | 6121 106% | 6007 108% | 6642 98% | 6807 95% |
| Color Space (Percent of AdobeRGB 1998) | 37.3 | 43.04 | ||||
| Color Space (Percent of sRGB) | 58.4 | 62.1 | ||||
| Total Average (Program / Settings) | -11% /
-15% | 61% /
57% | -29% /
-57% | -51% /
-82% | -32% /
-53% |
* ... smaller is better
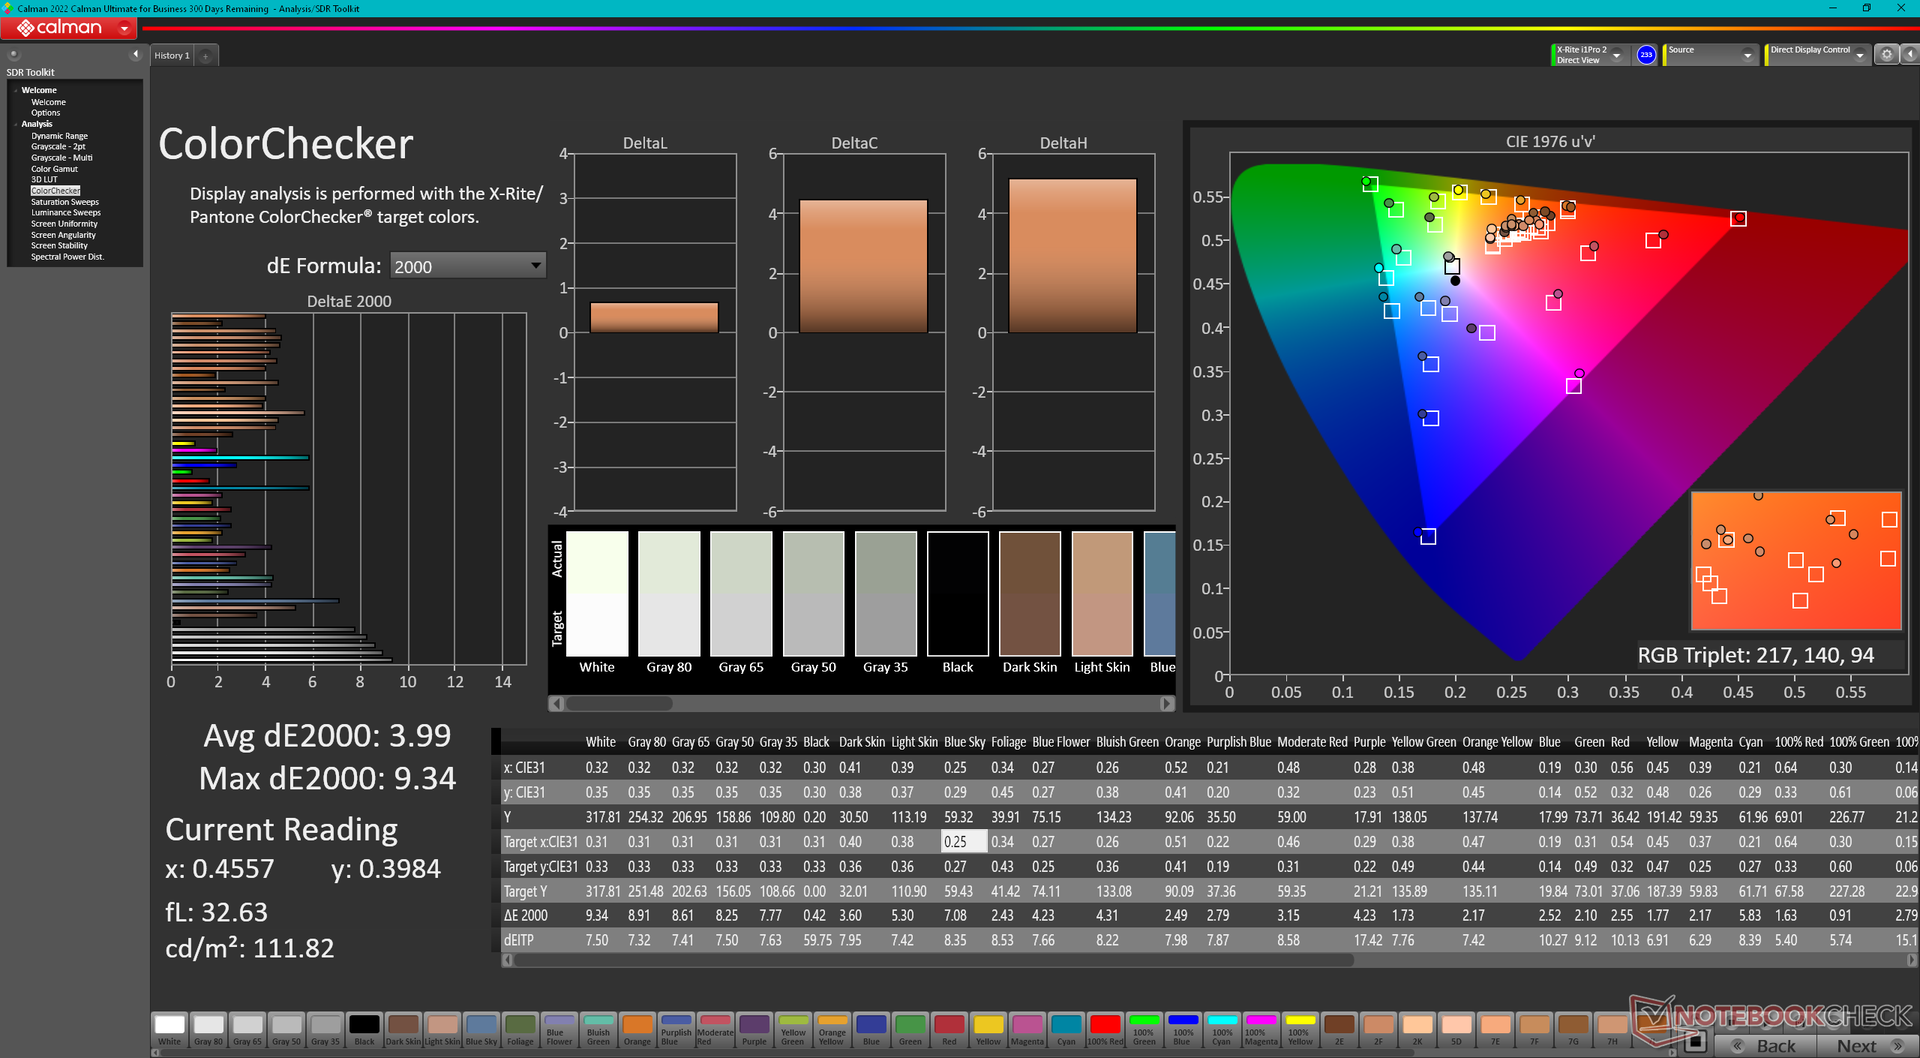
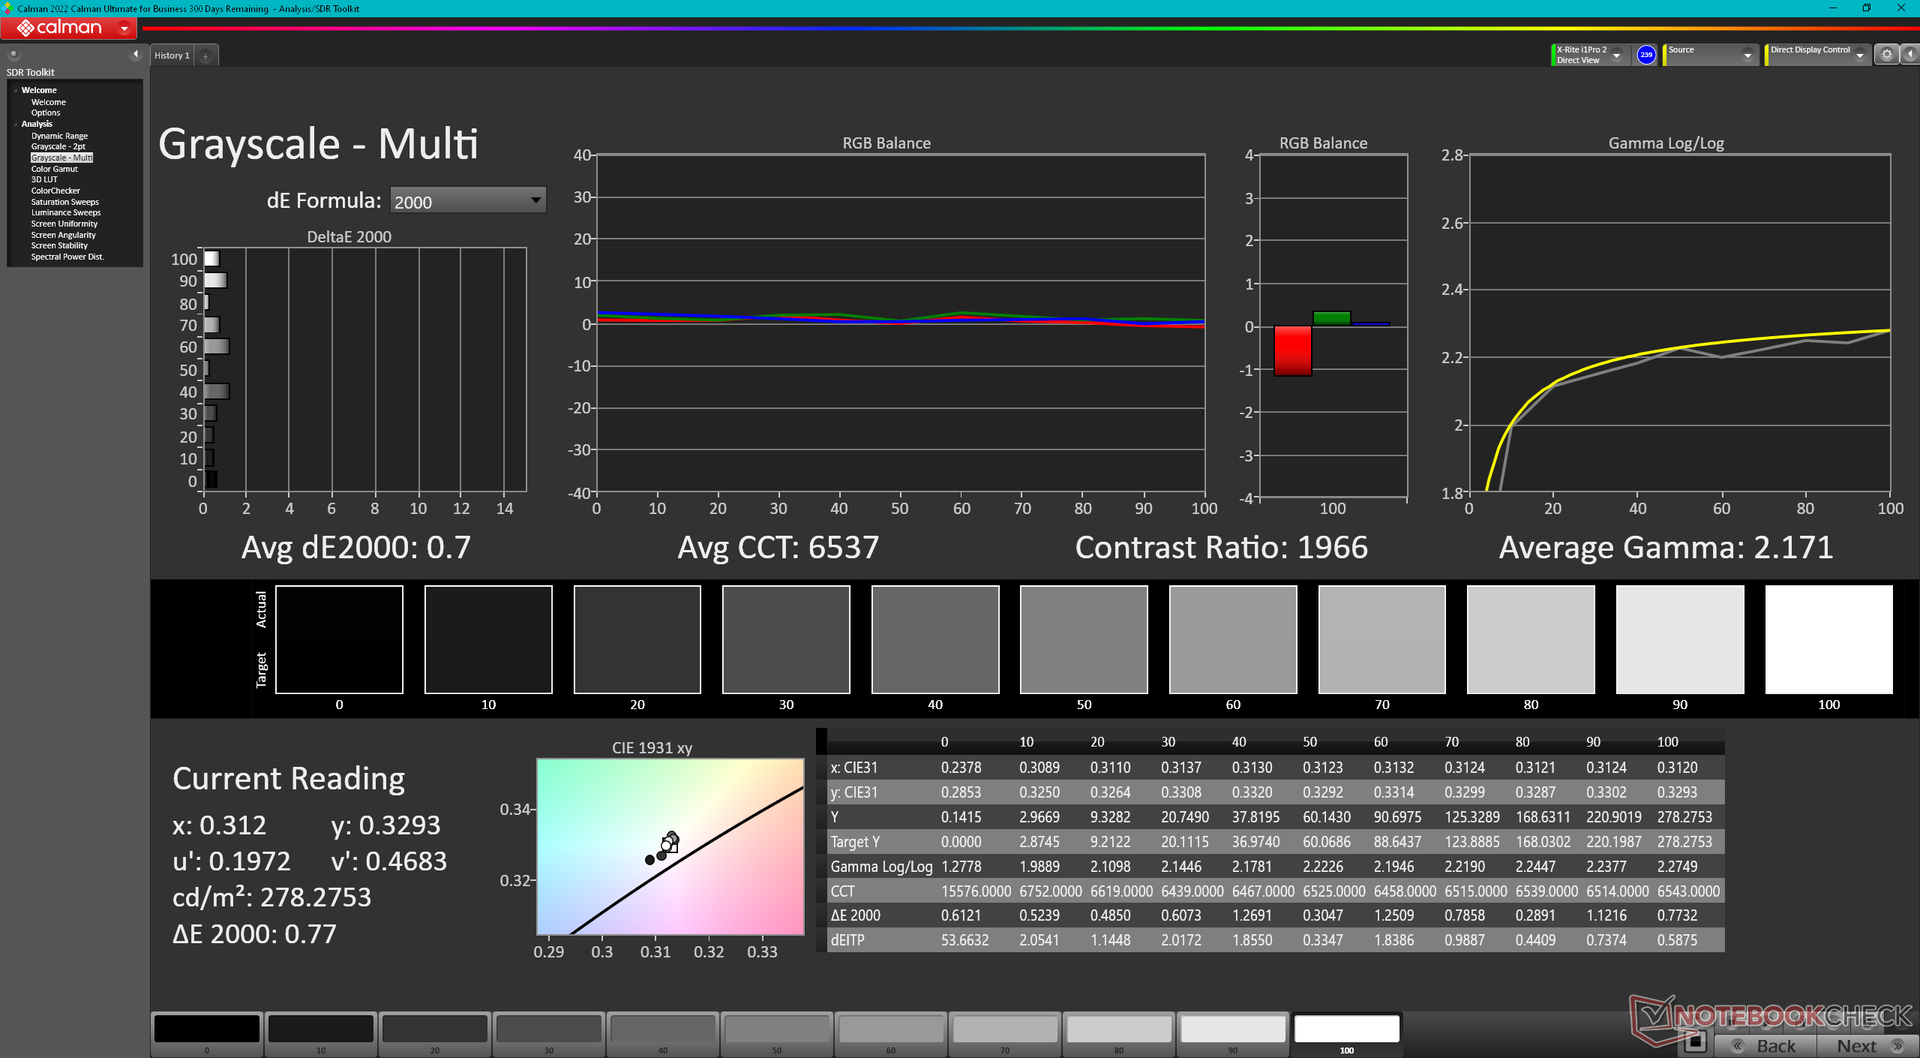
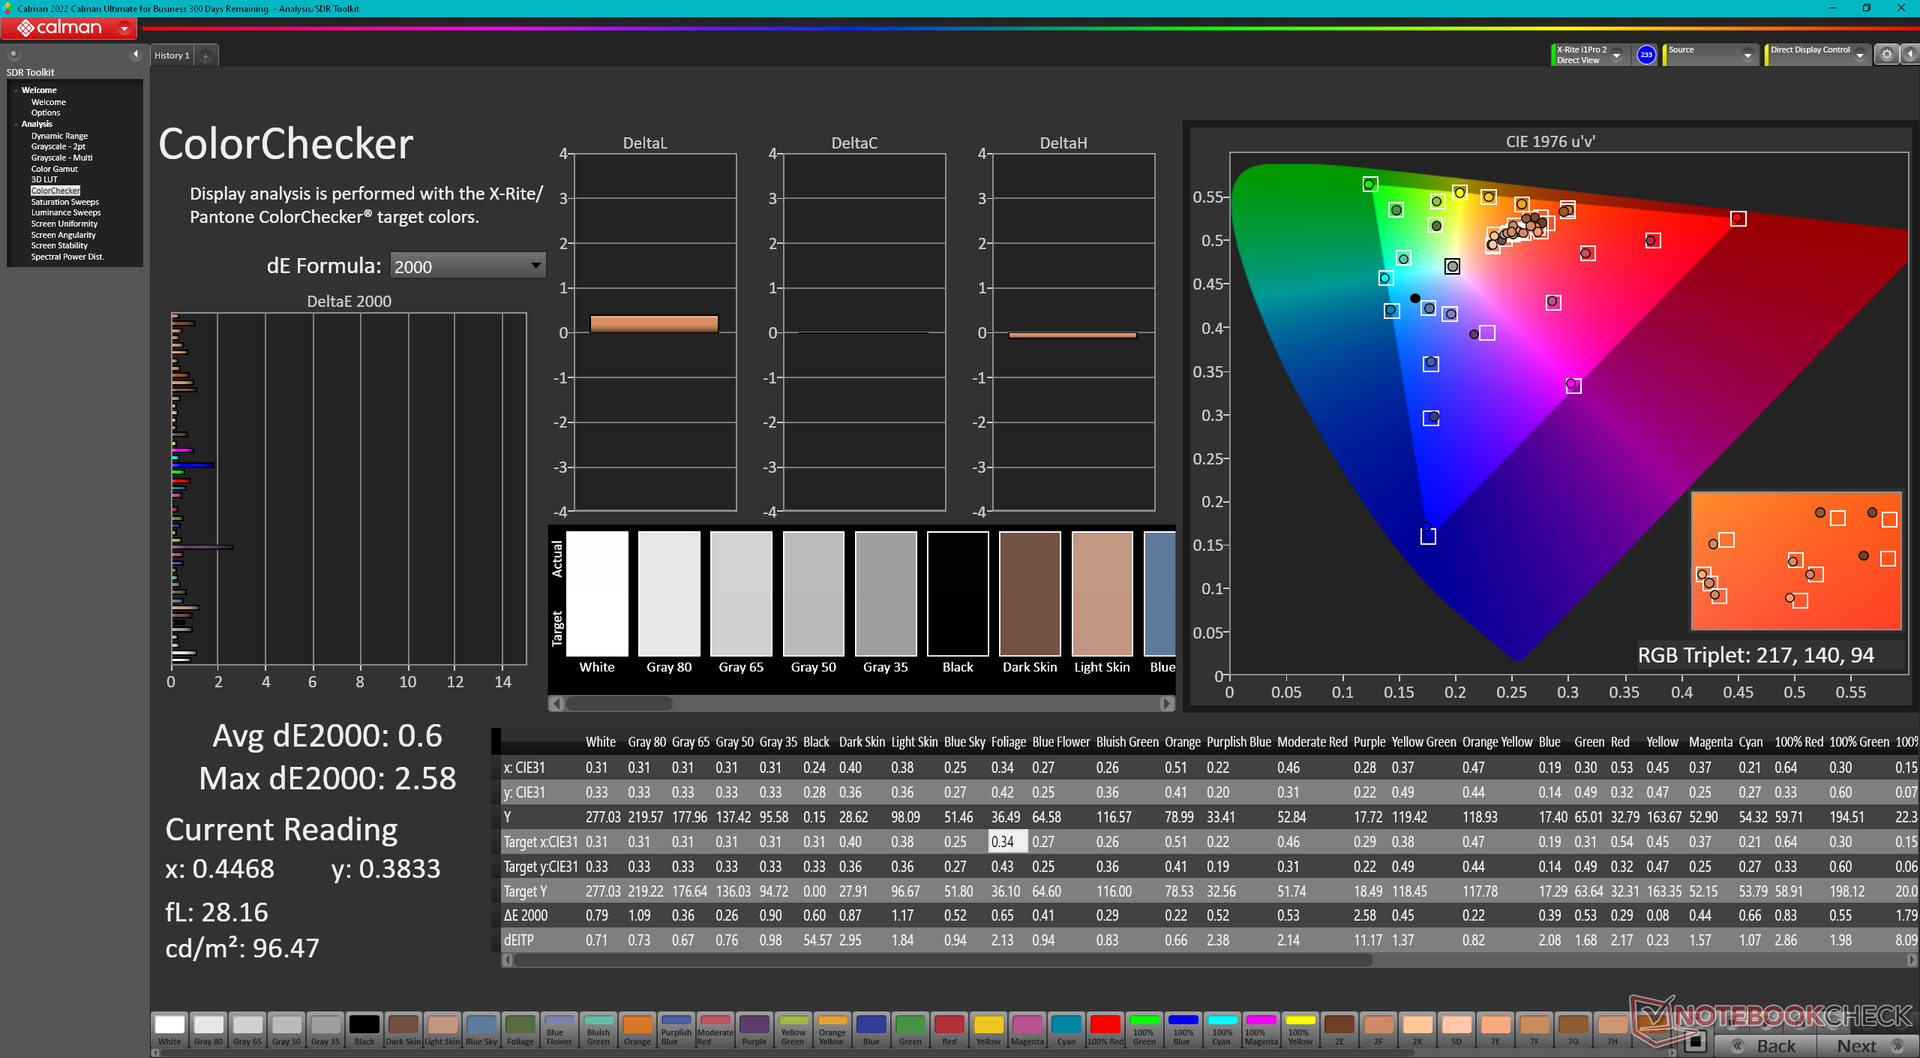
The display is poorly calibrated out of the box which is common for a midrange series like the IdeaPad Flex. Color temperature is too warm and grayscale subsequently suffers as shown by our Calman screenshots below. Once properly calibrated, however, average grayscale and color deltaE values would drop to just 0.7 and 0.6, respectively. It's recommended to apply our calibrated ICM profile above or to calibrate the display on your own to better exploit its full sRGB colors.

Display Response Times
| ↔ Response Time Black to White | ||
|---|---|---|
| 33.6 ms ... rise ↗ and fall ↘ combined | ↗ 18.8 ms rise | 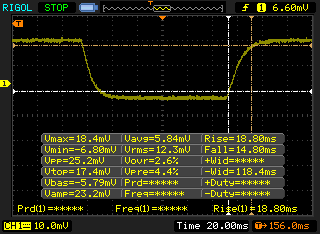 |
| ↘ 14.8 ms fall | ||
| The screen shows slow response rates in our tests and will be unsatisfactory for gamers. In comparison, all tested devices range from 0.1 (minimum) to 240 (maximum) ms. » 89 % of all devices are better. This means that the measured response time is worse than the average of all tested devices (21.5 ms). | ||
| ↔ Response Time 50% Grey to 80% Grey | ||
| 44.4 ms ... rise ↗ and fall ↘ combined | ↗ 24.8 ms rise | 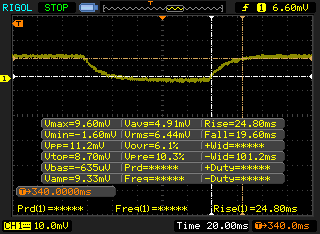 |
| ↘ 19.6 ms fall | ||
| The screen shows slow response rates in our tests and will be unsatisfactory for gamers. In comparison, all tested devices range from 0.2 (minimum) to 636 (maximum) ms. » 72 % of all devices are better. This means that the measured response time is worse than the average of all tested devices (33.7 ms). | ||
Screen Flickering / PWM (Pulse-Width Modulation)
| Screen flickering / PWM not detected | 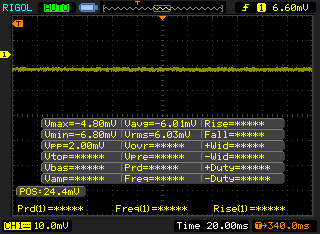 | ||
In comparison: 53 % of all tested devices do not use PWM to dim the display. If PWM was detected, an average of 17915 (minimum: 5 - maximum: 3846000) Hz was measured. | |||
Performance
Testing Conditions
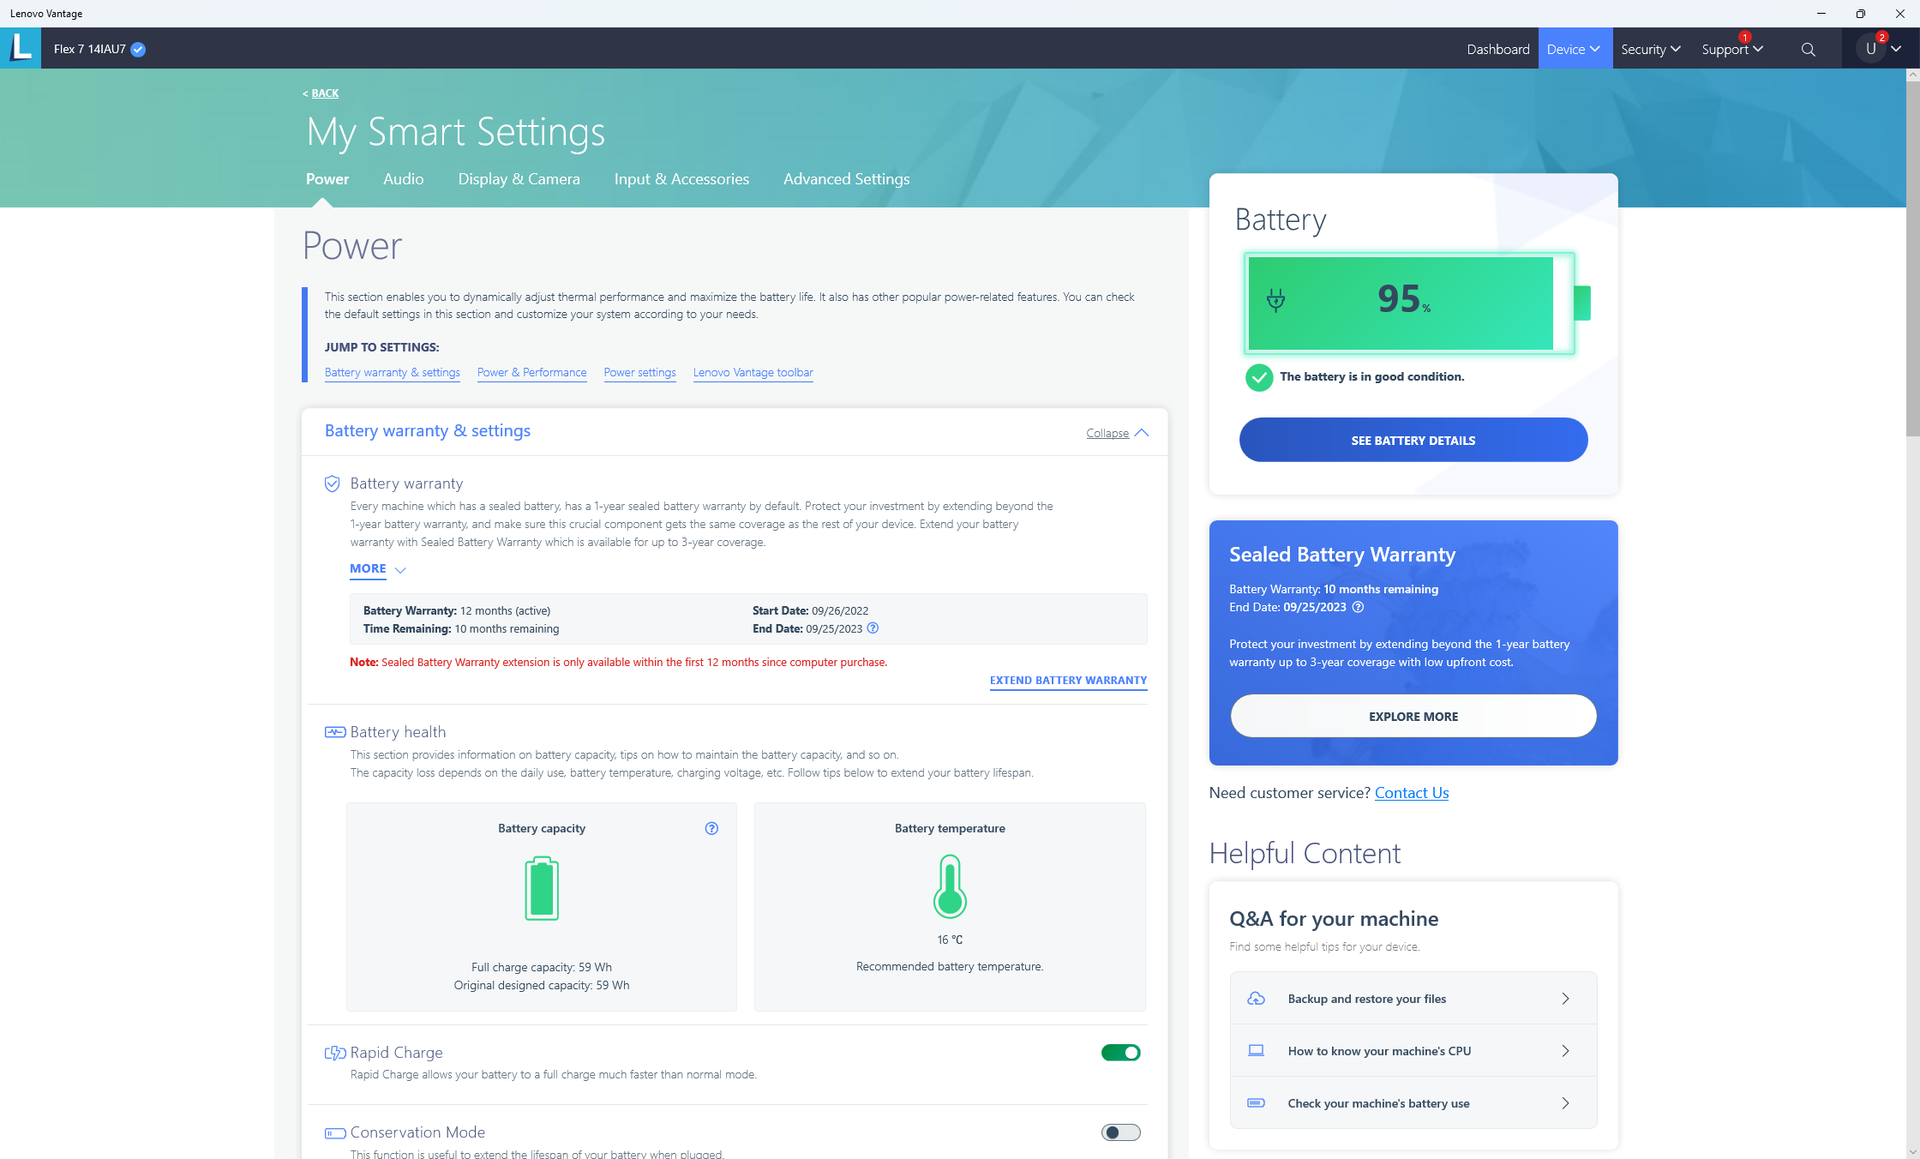
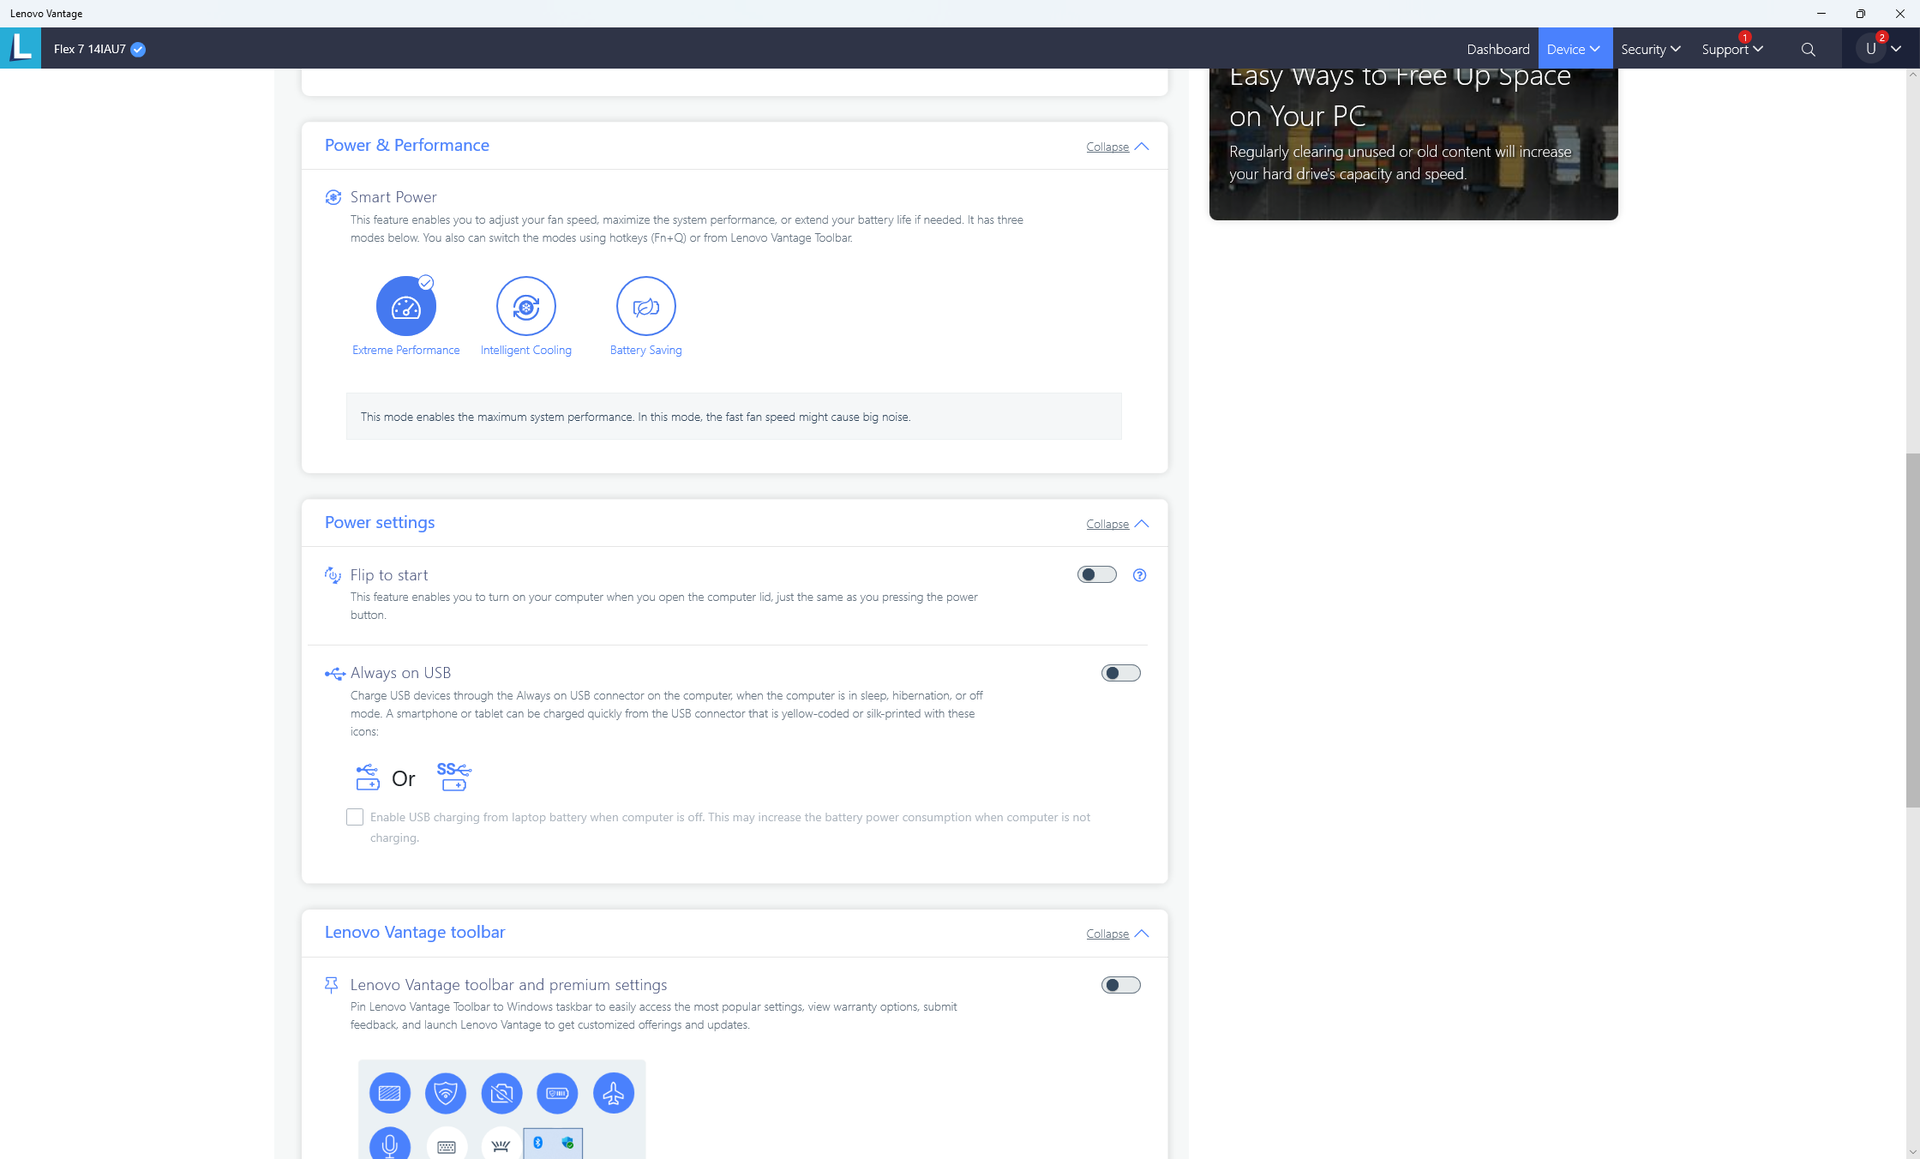
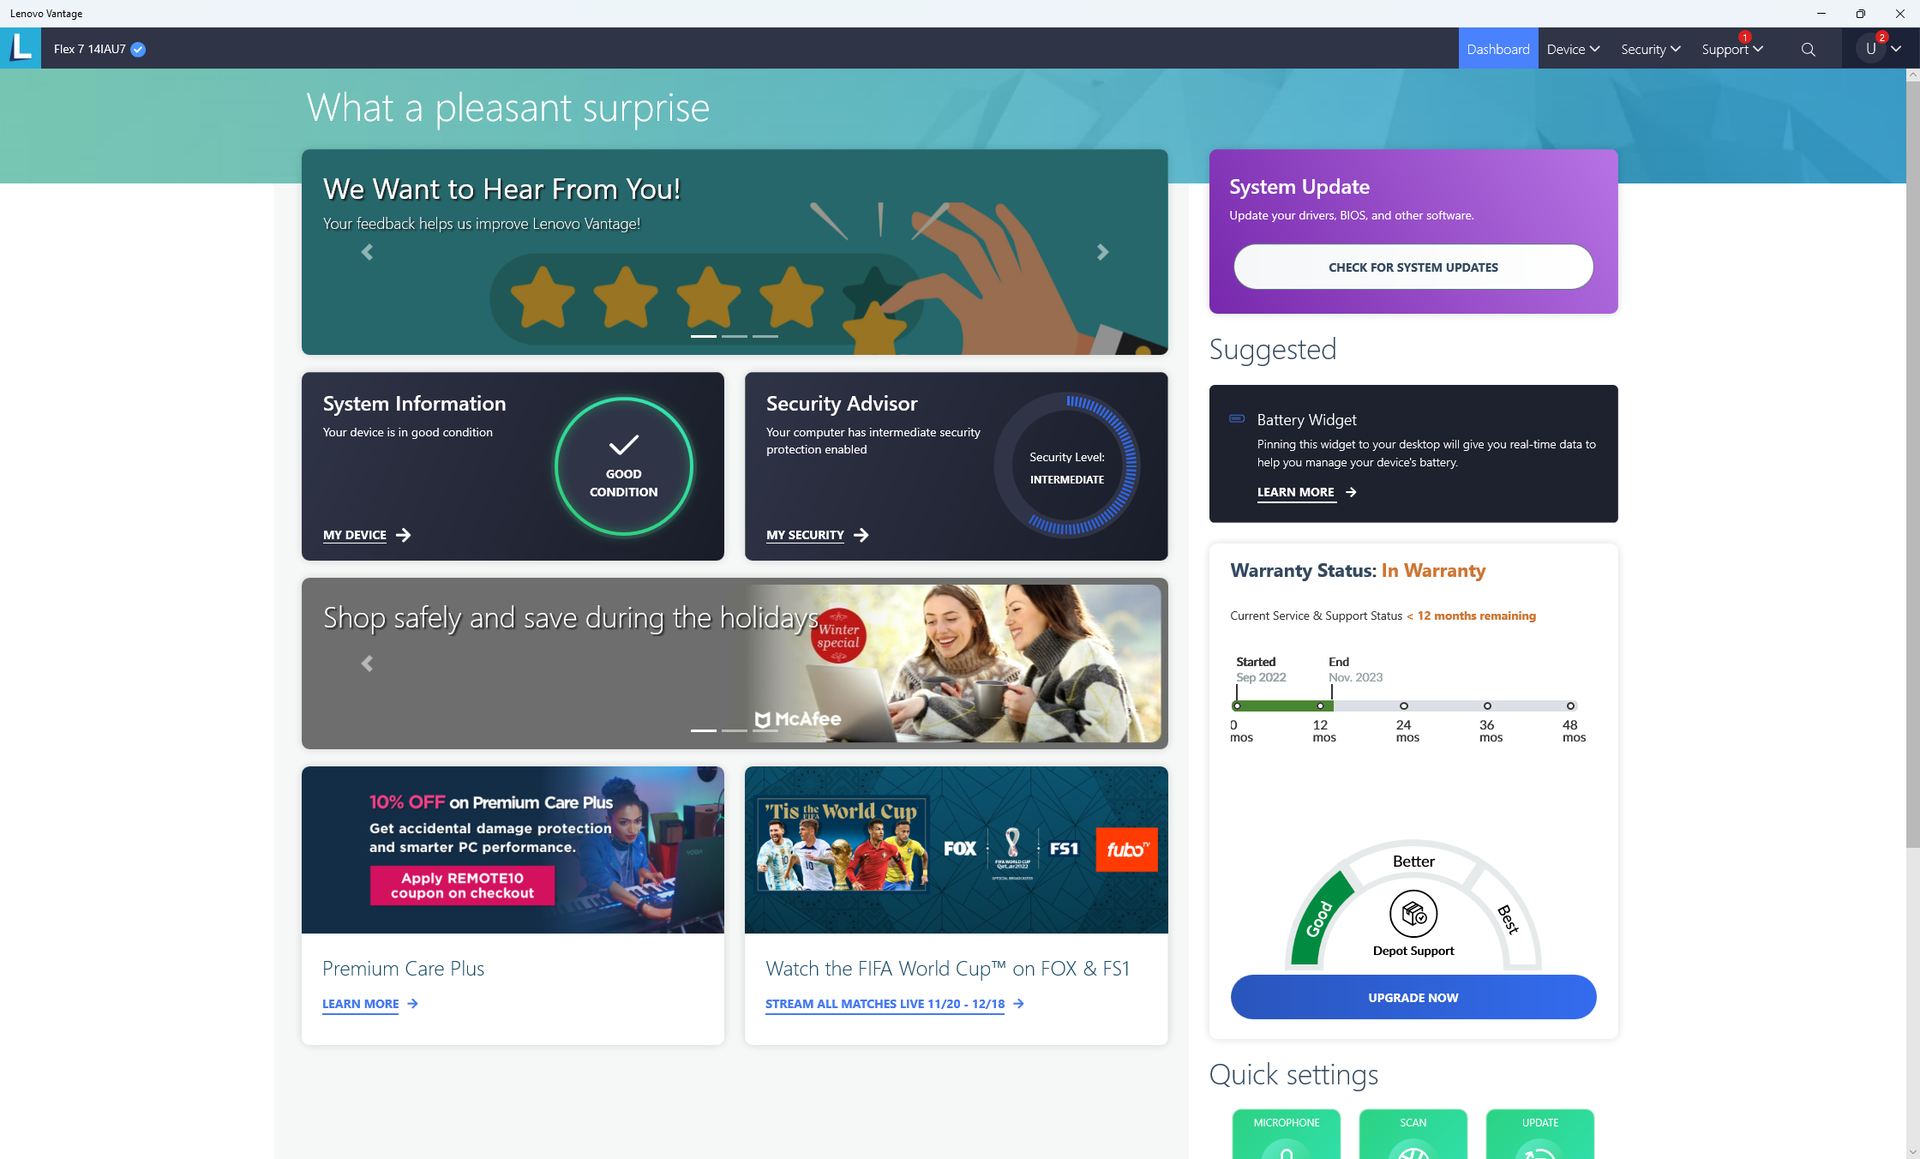
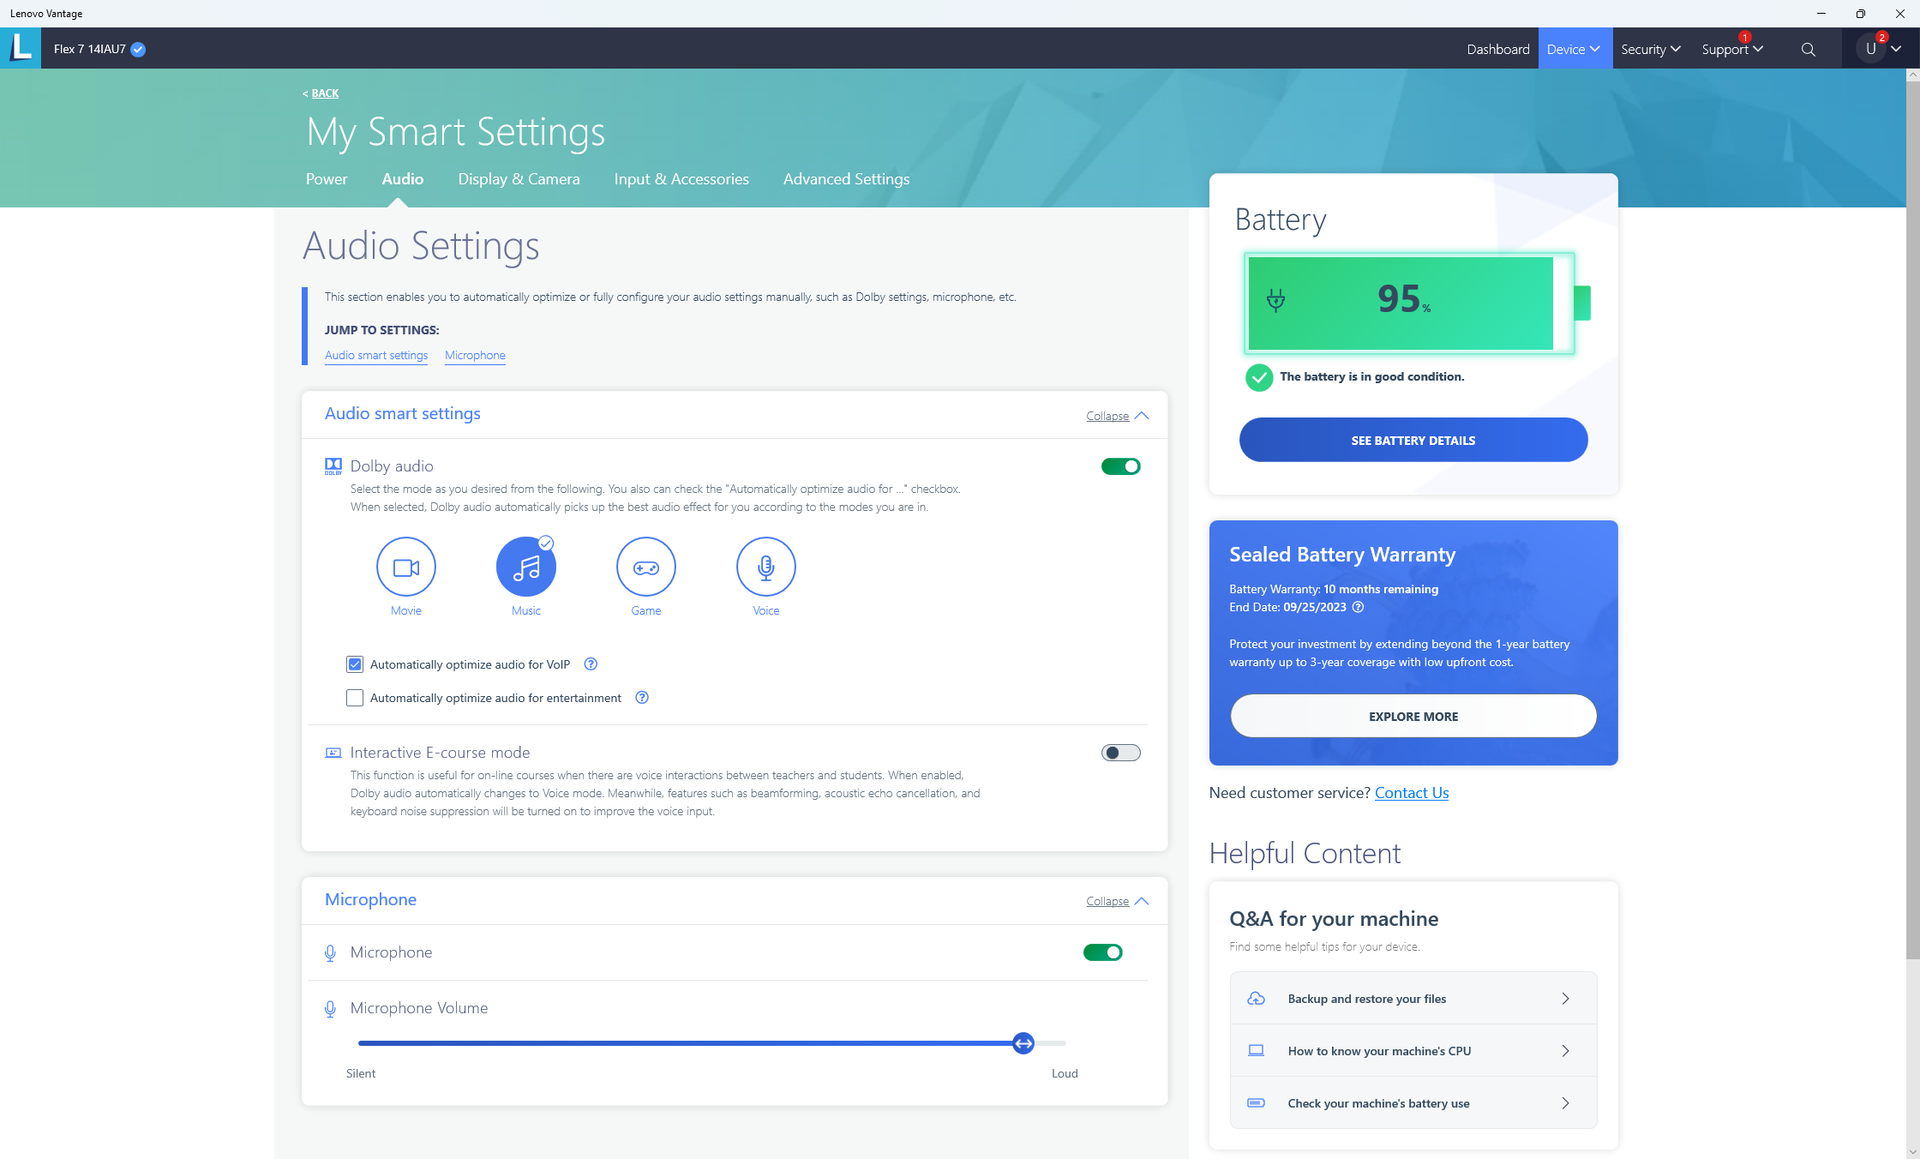
We set our unit to Performance mode via Windows and Extreme Performance mode via Lenovo Vantage prior to running any performance benchmarks below. It's recommended that owners become familiar with Vantage as it is the control hub for critical updates, system settings, warranty options, and more as shown by the screenshots below.
There are three power modes on Lenovo Vantage: Extreme Performance, Intelligent Cooling, and Battery Saving which correlate to the Windows Performance, Balanced, and Power Saver modes, respectively. The system is set to Intelligent Cooling by default.
Processor
CPU performance is excellent and where we expect it to be relative to other laptops with the same Core i7-1255U processor. Nonetheless, it's only marginally faster than the Core i5-1235U in the IdeaPad Flex 5i by about 5 to 10 percent. You would have to consider models with the Core P-series or the Ryzen 7 6800U for a more significant boost in overall performance. The larger 15.6-inch Flex series, for example, includes Core P options.
Turbo Boost sustainability is limited. When running CineBench R5 xT in a loop, our initial score of 1377 points would fall to 1165 points by the second loop to represent a performance drop of about 15 percent. The performance drop can also be observed when running Prime95 as detailed in our Stress Test section below.
Cinebench R15 Multi Loop
Cinebench R20: CPU (Multi Core) | CPU (Single Core)
Cinebench R23: Multi Core | Single Core
Cinebench R15: CPU Multi 64Bit | CPU Single 64Bit
Blender: v2.79 BMW27 CPU
7-Zip 18.03: 7z b 4 | 7z b 4 -mmt1
Geekbench 5.5: Multi-Core | Single-Core
HWBOT x265 Benchmark v2.2: 4k Preset
LibreOffice : 20 Documents To PDF
R Benchmark 2.5: Overall mean
* ... smaller is better
* ... smaller is better
AIDA64: FP32 Ray-Trace | FPU Julia | CPU SHA3 | CPU Queen | FPU SinJulia | FPU Mandel | CPU AES | CPU ZLib | FP64 Ray-Trace | CPU PhotoWorxx
| Performance Rating | |
| Lenovo Yoga 7-14ARB G7 | |
| Lenovo IdeaPad Flex 7i 14IAU7 | |
| Lenovo IdeaPad Flex 5i 14IAU7 | |
| Average Intel Core i7-1255U | |
| Dell Inspiron 14 7420 2-in-1 | |
| AIDA64 / FP32 Ray-Trace | |
| Lenovo Yoga 7-14ARB G7 | |
| Lenovo IdeaPad Flex 7i 14IAU7 | |
| Average Intel Core i7-1255U (4313 - 8127, n=9) | |
| Lenovo IdeaPad Flex 5i 14IAU7 | |
| Dell Inspiron 14 7420 2-in-1 | |
| AIDA64 / FPU Julia | |
| Lenovo Yoga 7-14ARB G7 | |
| Lenovo IdeaPad Flex 7i 14IAU7 | |
| Average Intel Core i7-1255U (19813 - 41353, n=9) | |
| Lenovo IdeaPad Flex 5i 14IAU7 | |
| Dell Inspiron 14 7420 2-in-1 | |
| AIDA64 / CPU SHA3 | |
| Lenovo Yoga 7-14ARB G7 | |
| Lenovo IdeaPad Flex 7i 14IAU7 | |
| Average Intel Core i7-1255U (1325 - 2135, n=9) | |
| Lenovo IdeaPad Flex 5i 14IAU7 | |
| Dell Inspiron 14 7420 2-in-1 | |
| AIDA64 / CPU Queen | |
| Lenovo Yoga 7-14ARB G7 | |
| Lenovo IdeaPad Flex 7i 14IAU7 | |
| Average Intel Core i7-1255U (61460 - 65892, n=9) | |
| Lenovo IdeaPad Flex 5i 14IAU7 | |
| Dell Inspiron 14 7420 2-in-1 | |
| AIDA64 / FPU SinJulia | |
| Lenovo Yoga 7-14ARB G7 | |
| Lenovo IdeaPad Flex 7i 14IAU7 | |
| Average Intel Core i7-1255U (3577 - 5095, n=9) | |
| Lenovo IdeaPad Flex 5i 14IAU7 | |
| Dell Inspiron 14 7420 2-in-1 | |
| AIDA64 / FPU Mandel | |
| Lenovo Yoga 7-14ARB G7 | |
| Lenovo IdeaPad Flex 7i 14IAU7 | |
| Average Intel Core i7-1255U (11759 - 20187, n=9) | |
| Lenovo IdeaPad Flex 5i 14IAU7 | |
| Dell Inspiron 14 7420 2-in-1 | |
| AIDA64 / CPU AES | |
| Lenovo Yoga 7-14ARB G7 | |
| Average Intel Core i7-1255U (27900 - 67458, n=9) | |
| Lenovo IdeaPad Flex 7i 14IAU7 | |
| Lenovo IdeaPad Flex 5i 14IAU7 | |
| Dell Inspiron 14 7420 2-in-1 | |
| AIDA64 / CPU ZLib | |
| Lenovo Yoga 7-14ARB G7 | |
| Lenovo IdeaPad Flex 7i 14IAU7 | |
| Average Intel Core i7-1255U (393 - 640, n=9) | |
| Lenovo IdeaPad Flex 5i 14IAU7 | |
| Dell Inspiron 14 7420 2-in-1 | |
| AIDA64 / FP64 Ray-Trace | |
| Lenovo Yoga 7-14ARB G7 | |
| Lenovo IdeaPad Flex 7i 14IAU7 | |
| Average Intel Core i7-1255U (2474 - 4400, n=9) | |
| Lenovo IdeaPad Flex 5i 14IAU7 | |
| Dell Inspiron 14 7420 2-in-1 | |
| AIDA64 / CPU PhotoWorxx | |
| Lenovo IdeaPad Flex 7i 14IAU7 | |
| Lenovo IdeaPad Flex 5i 14IAU7 | |
| Average Intel Core i7-1255U (13899 - 44054, n=9) | |
| Lenovo Yoga 7-14ARB G7 | |
| Dell Inspiron 14 7420 2-in-1 | |
System Performance
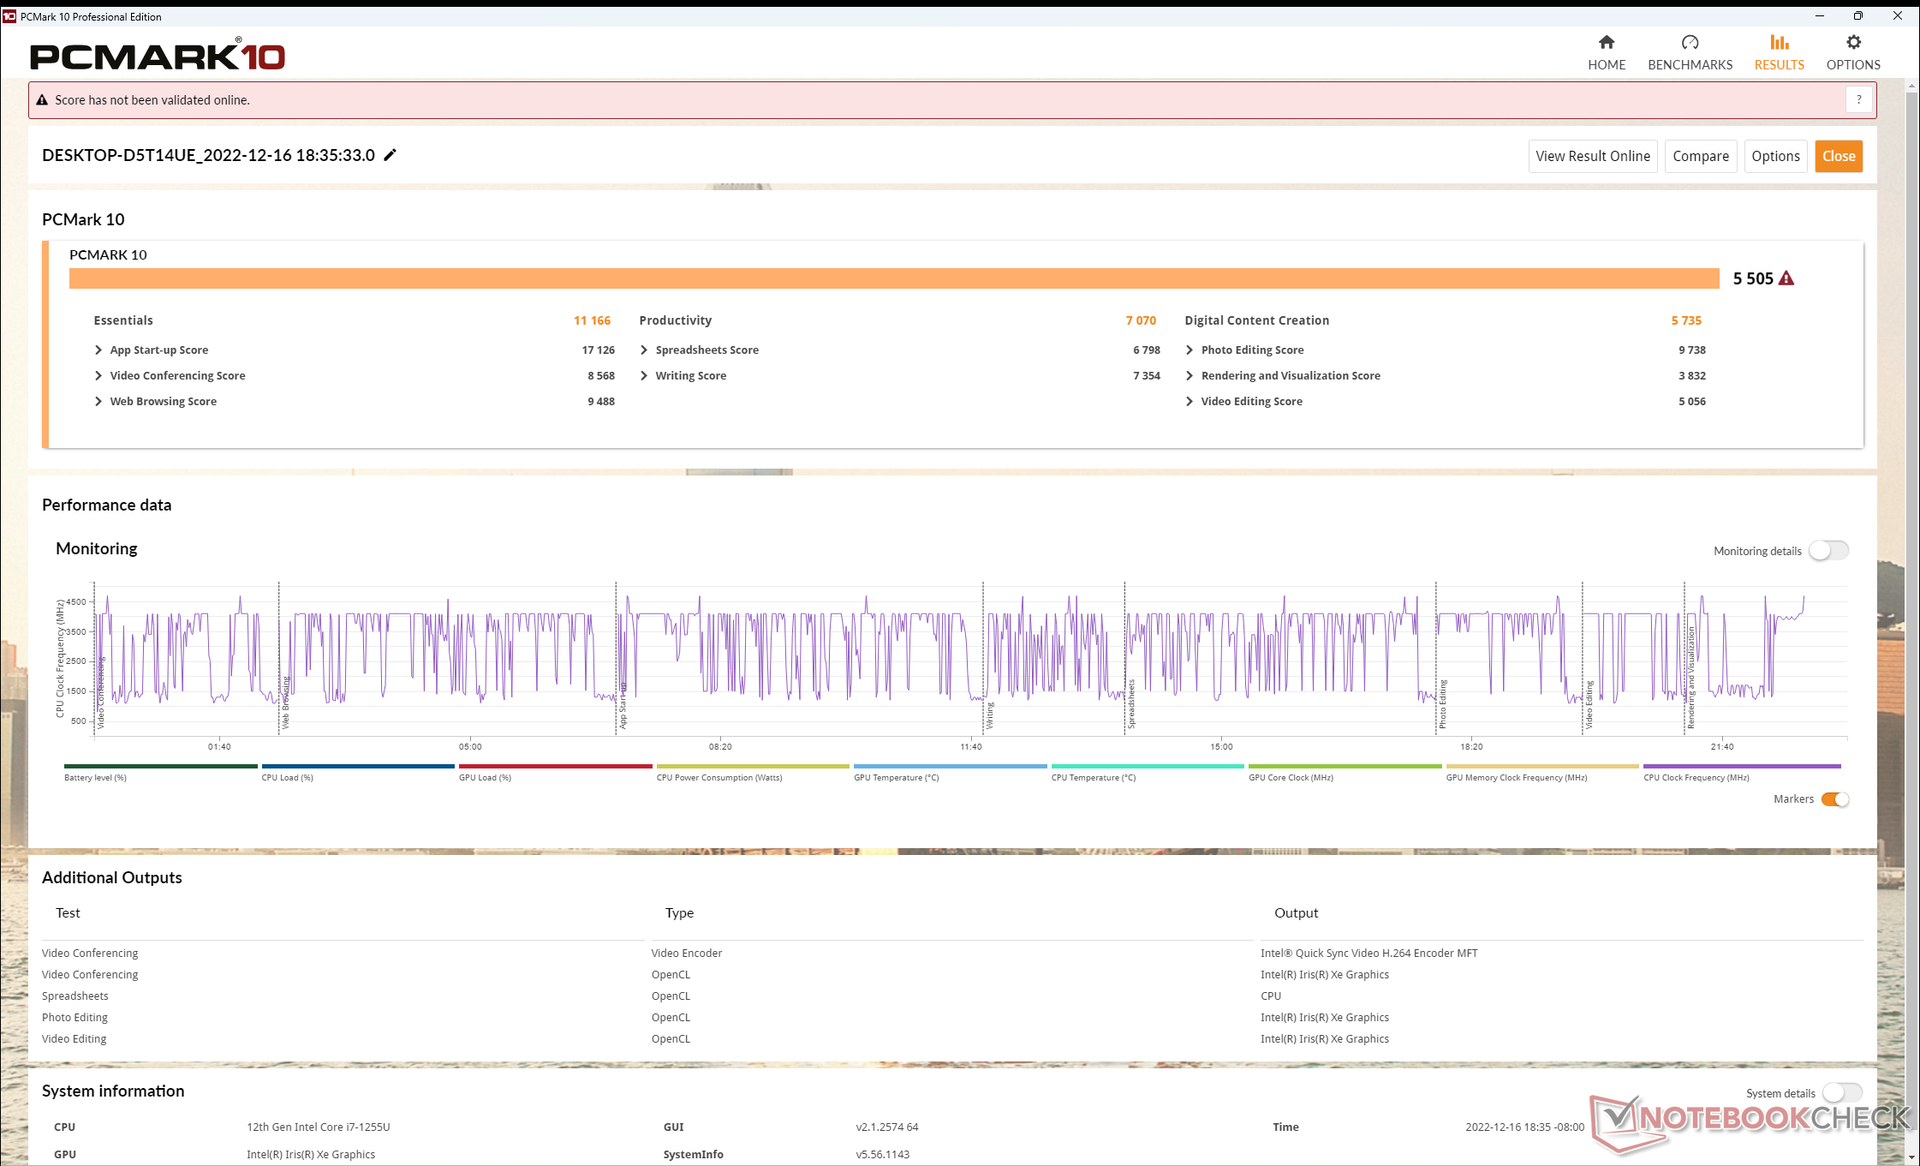
PCMark results are some of the highest for a Core U-based convertible. AMD's latest Ryzen 7 6800U can score even higher as it is a step above Intel's 12th gen mobile series, but you'll have to spring for the pricier Yoga 7 14 for such an option.
CrossMark: Overall | Productivity | Creativity | Responsiveness
| PCMark 10 / Score | |
| Lenovo Yoga 7-14ARB G7 | |
| Lenovo IdeaPad Flex 7i 14IAU7 | |
| Lenovo IdeaPad Flex 5i 14IAU7 | |
| Average Intel Core i7-1255U, Intel Iris Xe Graphics G7 96EUs (4676 - 5523, n=8) | |
| Dell Inspiron 14 7420 2-in-1 | |
| Asus VivoBook Flip 14 TP470EZ | |
| HP Pavilion x360 14-dh1153ng | |
| PCMark 10 / Essentials | |
| Lenovo IdeaPad Flex 5i 14IAU7 | |
| Lenovo IdeaPad Flex 7i 14IAU7 | |
| Lenovo Yoga 7-14ARB G7 | |
| Average Intel Core i7-1255U, Intel Iris Xe Graphics G7 96EUs (9381 - 11654, n=8) | |
| Dell Inspiron 14 7420 2-in-1 | |
| Asus VivoBook Flip 14 TP470EZ | |
| HP Pavilion x360 14-dh1153ng | |
| PCMark 10 / Productivity | |
| Lenovo Yoga 7-14ARB G7 | |
| Lenovo IdeaPad Flex 7i 14IAU7 | |
| Average Intel Core i7-1255U, Intel Iris Xe Graphics G7 96EUs (6530 - 7418, n=8) | |
| HP Pavilion x360 14-dh1153ng | |
| Lenovo IdeaPad Flex 5i 14IAU7 | |
| Dell Inspiron 14 7420 2-in-1 | |
| Asus VivoBook Flip 14 TP470EZ | |
| PCMark 10 / Digital Content Creation | |
| Lenovo Yoga 7-14ARB G7 | |
| Dell Inspiron 14 7420 2-in-1 | |
| Lenovo IdeaPad Flex 5i 14IAU7 | |
| Lenovo IdeaPad Flex 7i 14IAU7 | |
| Average Intel Core i7-1255U, Intel Iris Xe Graphics G7 96EUs (4498 - 6203, n=8) | |
| Asus VivoBook Flip 14 TP470EZ | |
| HP Pavilion x360 14-dh1153ng | |
| CrossMark / Overall | |
| Lenovo Yoga 7-14ARB G7 | |
| Lenovo IdeaPad Flex 5i 14IAU7 | |
| Lenovo IdeaPad Flex 7i 14IAU7 | |
| Average Intel Core i7-1255U, Intel Iris Xe Graphics G7 96EUs (1329 - 1573, n=8) | |
| Dell Inspiron 14 7420 2-in-1 | |
| CrossMark / Productivity | |
| Lenovo Yoga 7-14ARB G7 | |
| Dell Inspiron 14 7420 2-in-1 | |
| Average Intel Core i7-1255U, Intel Iris Xe Graphics G7 96EUs (1364 - 1554, n=8) | |
| Lenovo IdeaPad Flex 5i 14IAU7 | |
| Lenovo IdeaPad Flex 7i 14IAU7 | |
| CrossMark / Creativity | |
| Lenovo Yoga 7-14ARB G7 | |
| Lenovo IdeaPad Flex 7i 14IAU7 | |
| Lenovo IdeaPad Flex 5i 14IAU7 | |
| Average Intel Core i7-1255U, Intel Iris Xe Graphics G7 96EUs (1372 - 1660, n=8) | |
| Dell Inspiron 14 7420 2-in-1 | |
| CrossMark / Responsiveness | |
| Lenovo Yoga 7-14ARB G7 | |
| Lenovo IdeaPad Flex 5i 14IAU7 | |
| Average Intel Core i7-1255U, Intel Iris Xe Graphics G7 96EUs (1117 - 1434, n=8) | |
| Dell Inspiron 14 7420 2-in-1 | |
| Lenovo IdeaPad Flex 7i 14IAU7 | |
| PCMark 10 Score | 5505 points | |
Help | ||
| AIDA64 / Memory Copy | |
| Lenovo IdeaPad Flex 7i 14IAU7 | |
| Lenovo IdeaPad Flex 5i 14IAU7 | |
| Lenovo Yoga 7-14ARB G7 | |
| Average Intel Core i7-1255U (22846 - 67017, n=9) | |
| Dell Inspiron 14 7420 2-in-1 | |
| AIDA64 / Memory Read | |
| Lenovo IdeaPad Flex 7i 14IAU7 | |
| Lenovo IdeaPad Flex 5i 14IAU7 | |
| Average Intel Core i7-1255U (22877 - 67398, n=9) | |
| Lenovo Yoga 7-14ARB G7 | |
| Dell Inspiron 14 7420 2-in-1 | |
| AIDA64 / Memory Write | |
| Lenovo IdeaPad Flex 5i 14IAU7 | |
| Lenovo IdeaPad Flex 7i 14IAU7 | |
| Lenovo Yoga 7-14ARB G7 | |
| Average Intel Core i7-1255U (22883 - 65839, n=9) | |
| Dell Inspiron 14 7420 2-in-1 | |
| AIDA64 / Memory Latency | |
| Lenovo IdeaPad Flex 5i 14IAU7 | |
| Lenovo Yoga 7-14ARB G7 | |
| Lenovo IdeaPad Flex 7i 14IAU7 | |
| Average Intel Core i7-1255U (76 - 163.2, n=9) | |
| Dell Inspiron 14 7420 2-in-1 | |
* ... smaller is better
DPC Latency
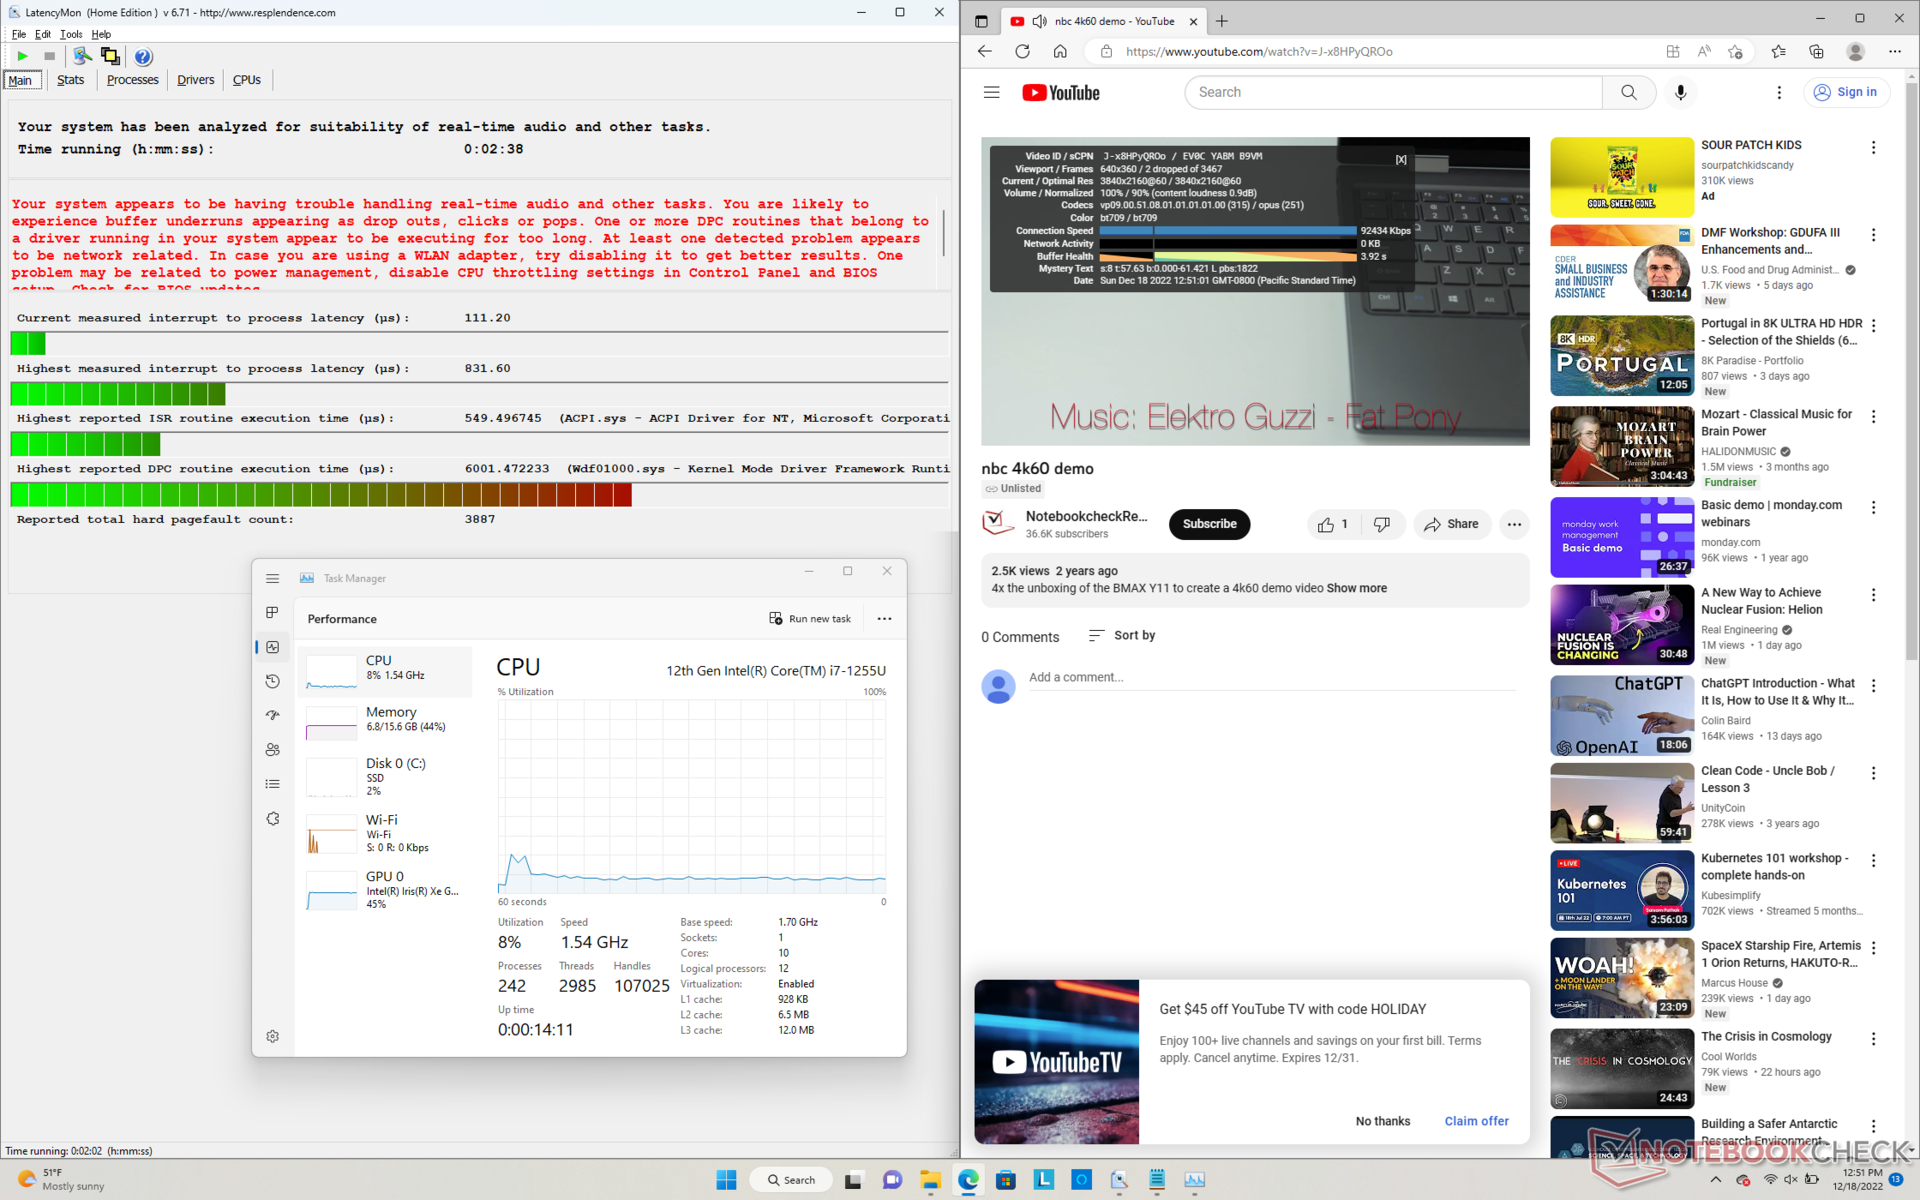
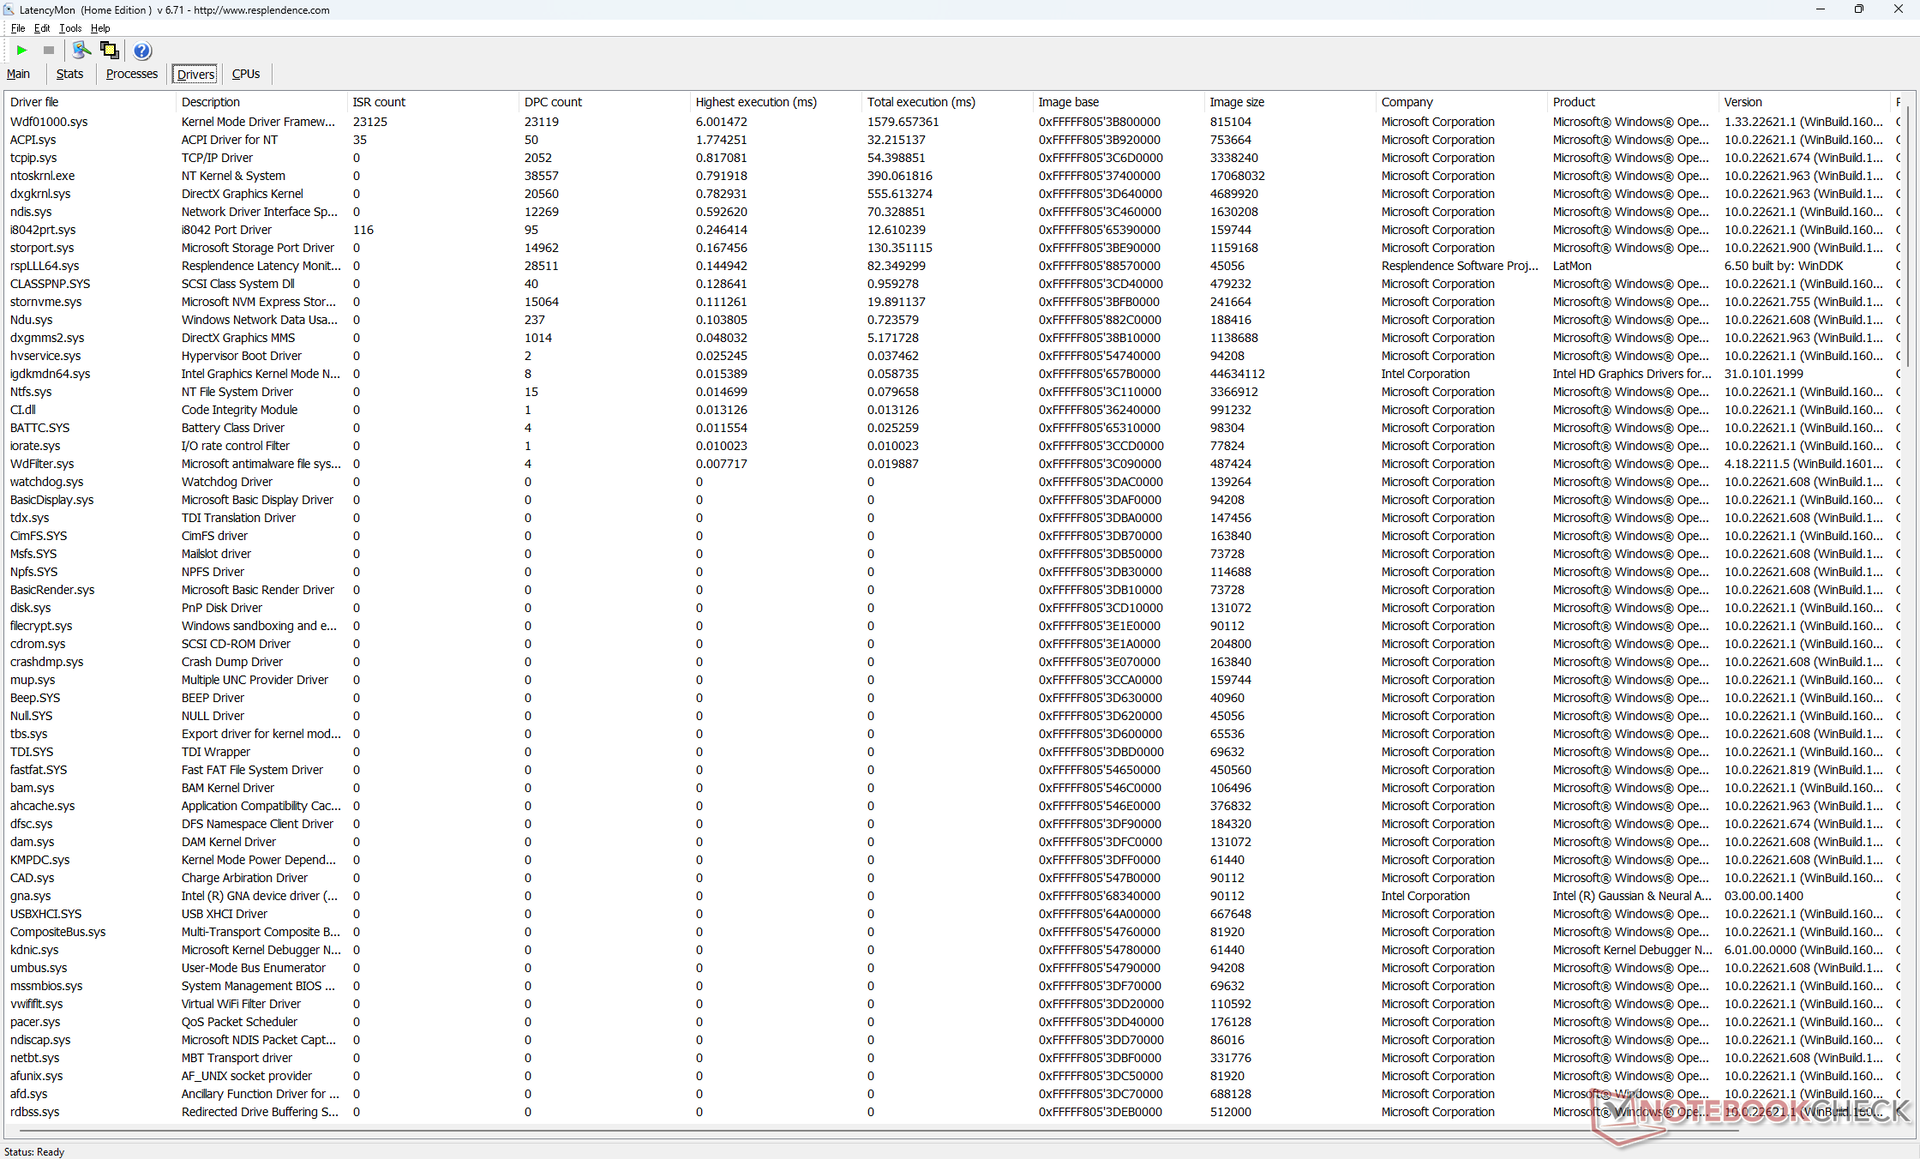
LatencyMon reveals DPC issues when opening multiple browser tabs of our homepage. 4K video playback at 60 FPS is otherwise excellent with just two dropped frames during our minute-long test video.
| DPC Latencies / LatencyMon - interrupt to process latency (max), Web, Youtube, Prime95 | |
| Lenovo Yoga 7-14ARB G7 | |
| Lenovo IdeaPad Flex 5i 14IAU7 | |
| Lenovo IdeaPad Flex 7i 14IAU7 | |
| Dell Inspiron 14 7420 2-in-1 | |
| Asus VivoBook Flip 14 TP470EZ | |
* ... smaller is better
Storage Devices
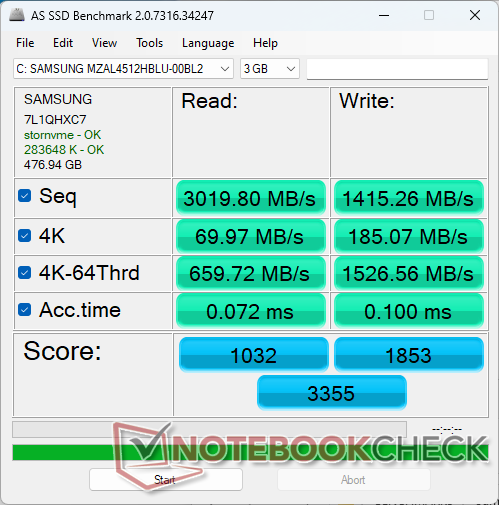
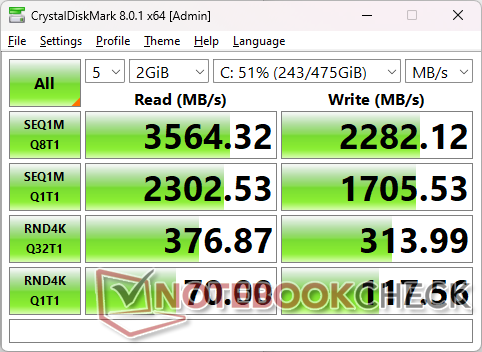
Our unit ships with the same Samsung PM9B1 512GB MZAL4512HBLU M.2 SSD as found on the Flex 5i. Though it's a PCIe4 x4 NVMe SSD, its performance is more akin to a PCIe3 x4 drive. It also suffers from performance throttling after a minute or two into our DiskSpd loop stress test as shown by the graph below.


* ... smaller is better
Disk Throttling: DiskSpd Read Loop, Queue Depth 8
GPU Performance
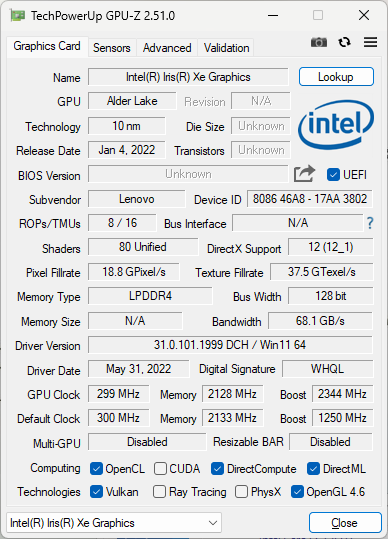
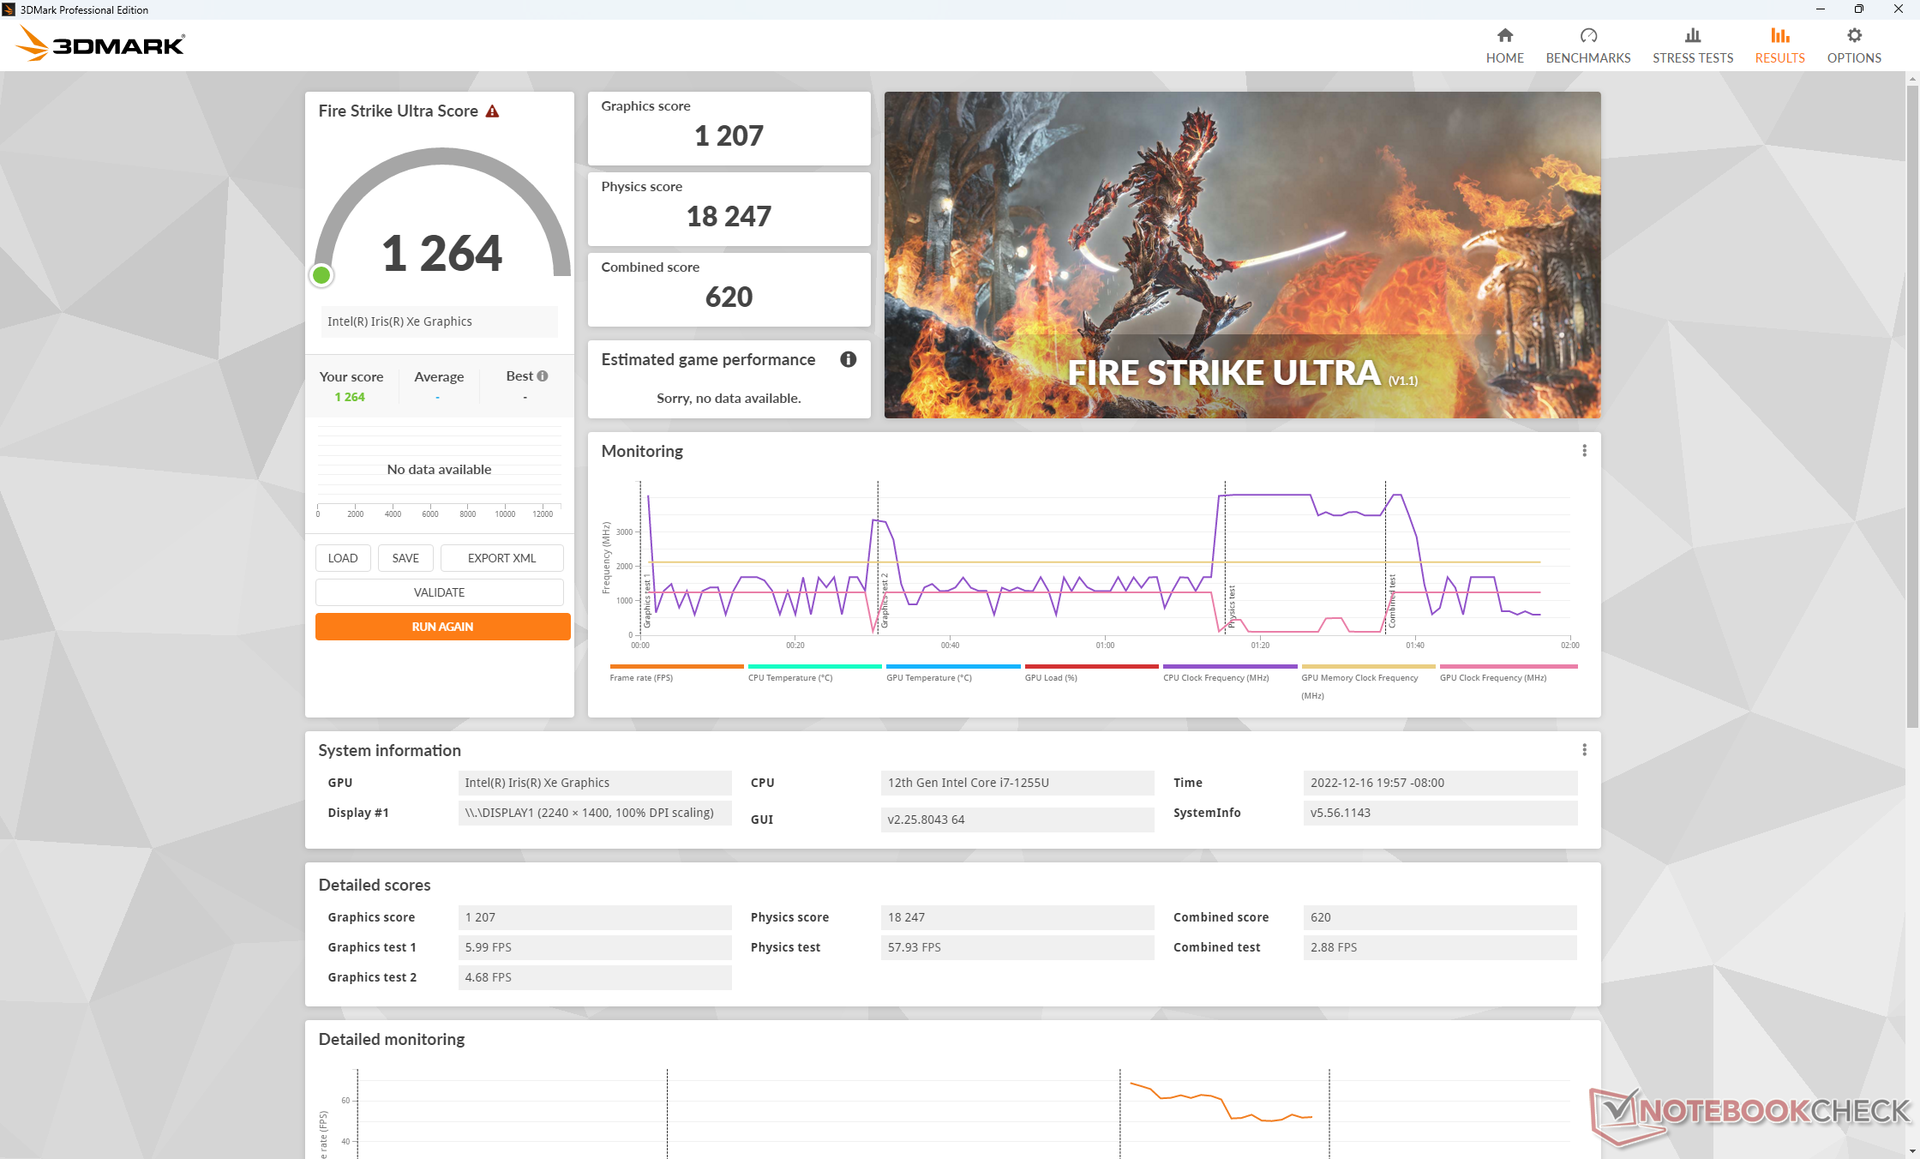
Our integrated Iris Xe 96 EUs solution is about 5 to 10 percent faster than the average laptop in our database equipped with the same GPU. When compared to the Iris Xe 80 EUs in the Flex 5i, graphics on our Flex 7i can be up to 25 percent faster. Performance is good enough to play most games at 1080p albeit with all settings on low.
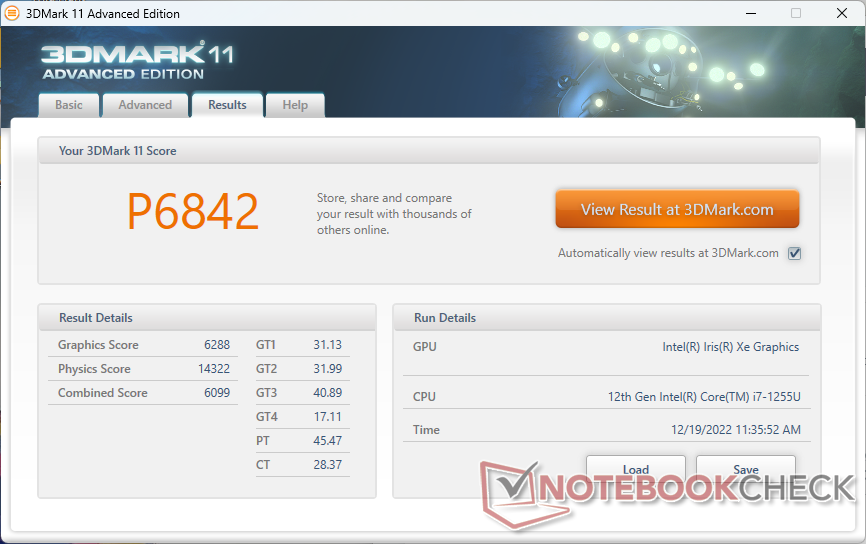
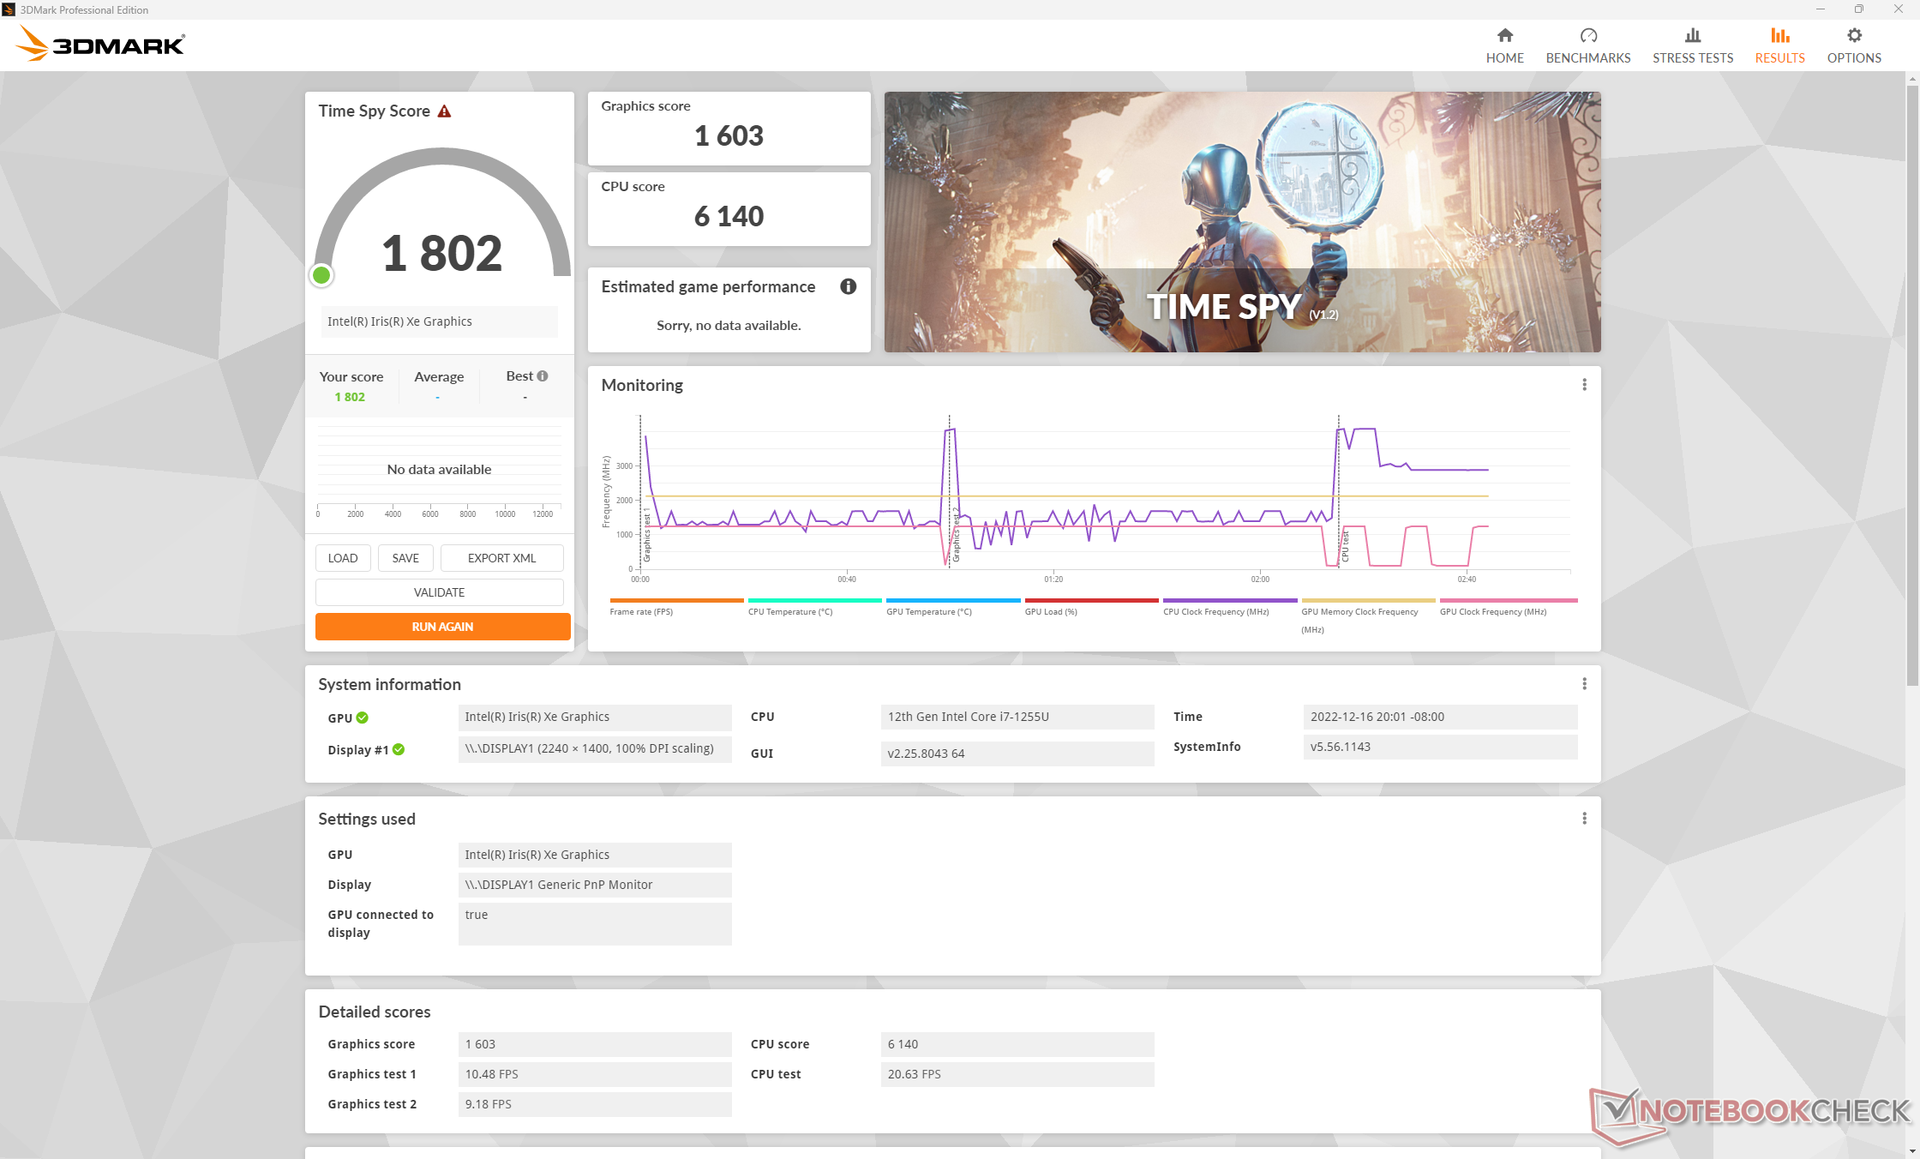
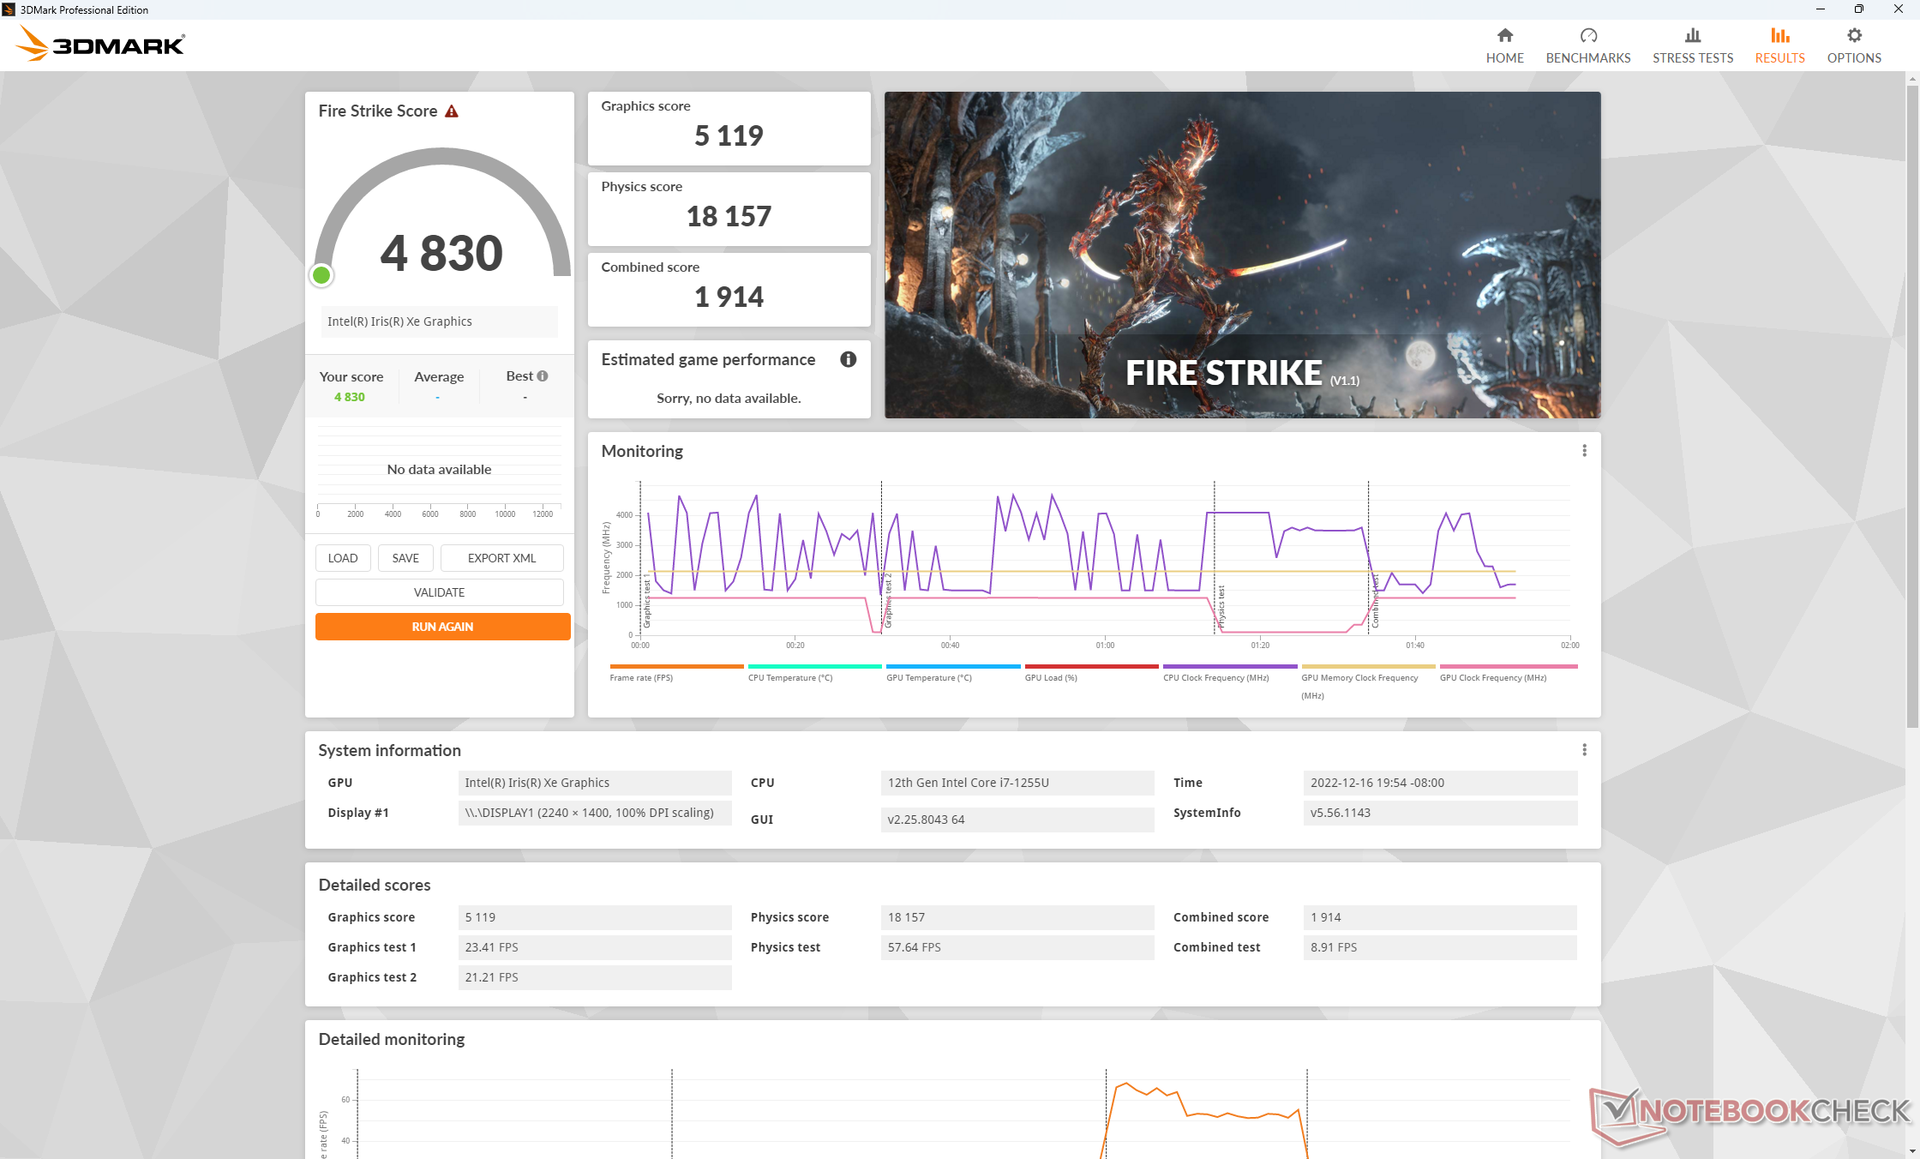
Be sure to enable Extreme Performance mode or else processor performance is reduced as shown by our 3DMark 11 results below.

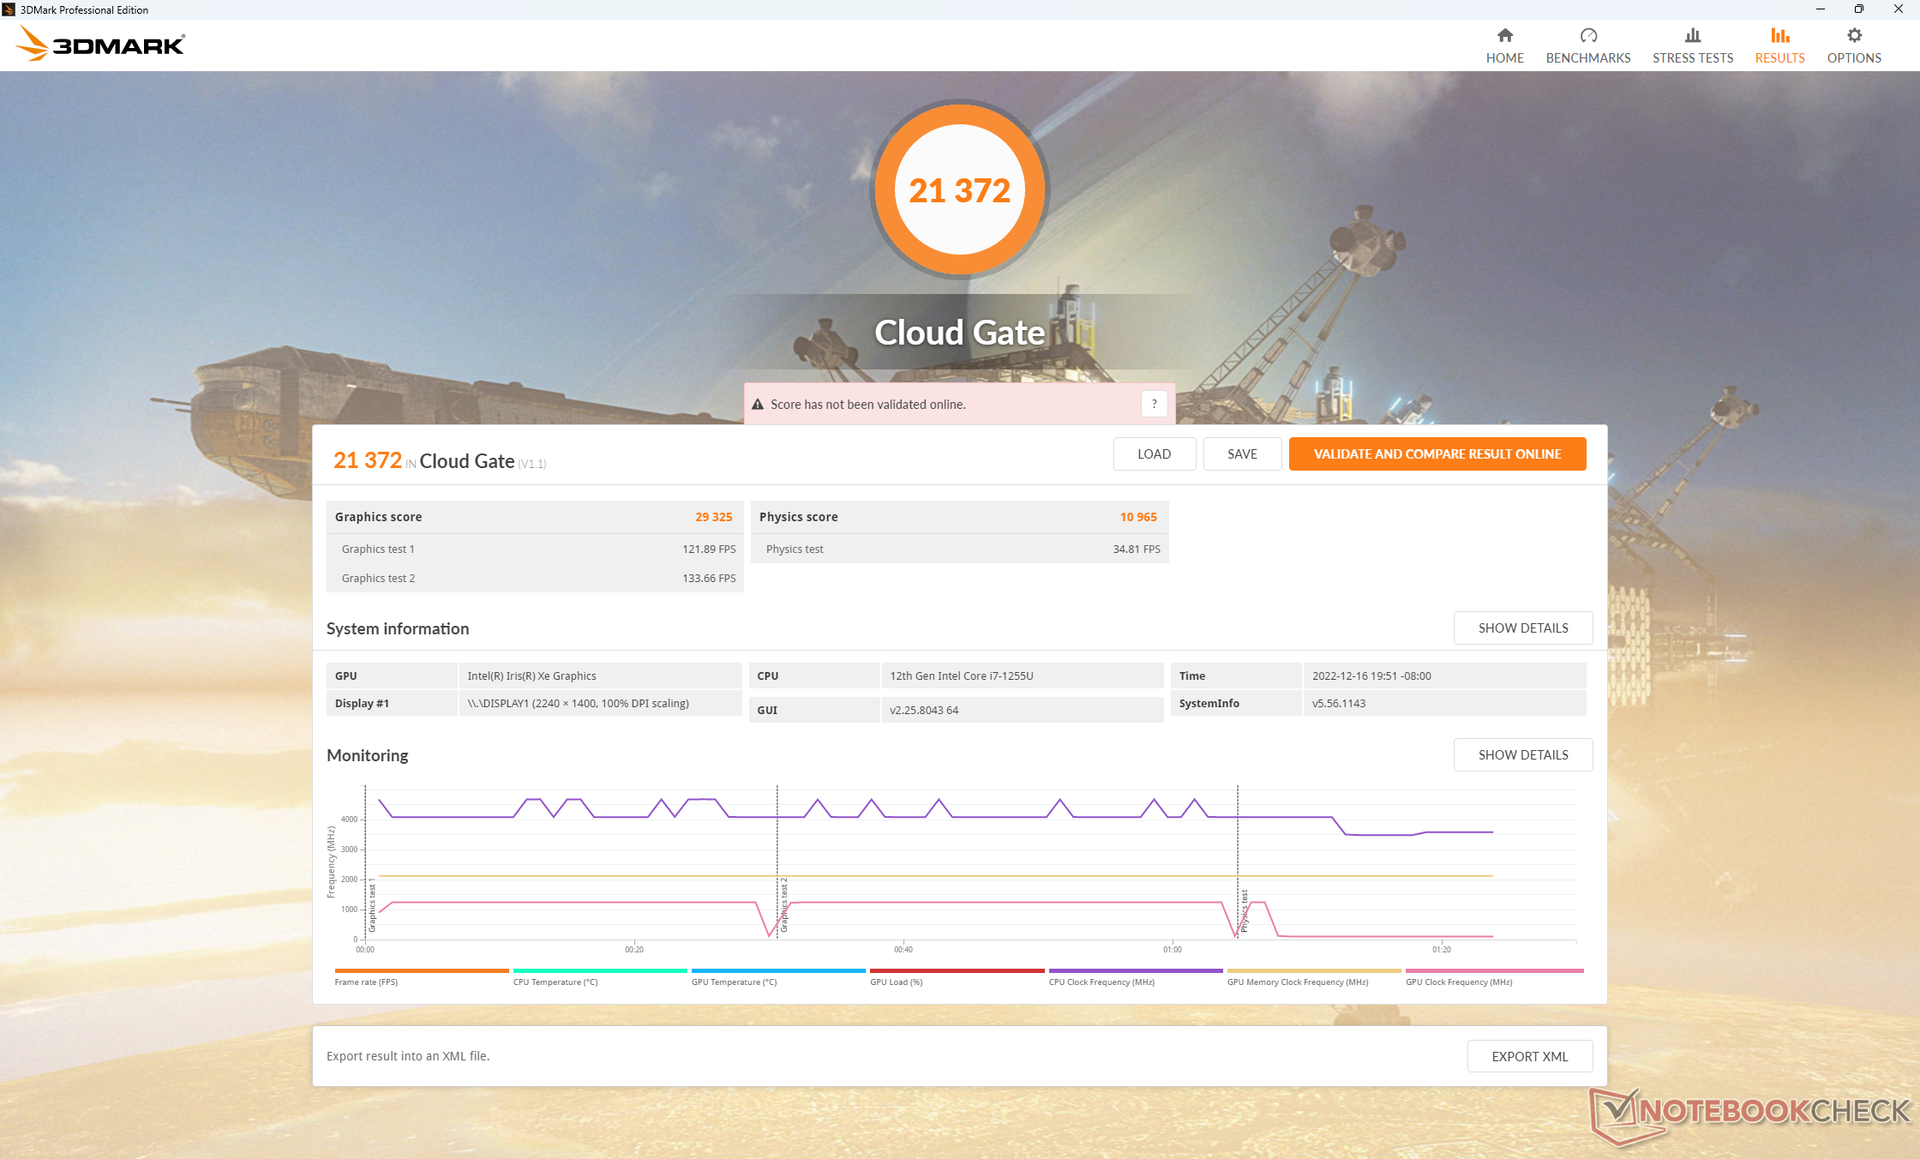
| 3DMark 11 Performance | 6853 points | |
| 3DMark Cloud Gate Standard Score | 21372 points | |
| 3DMark Fire Strike Score | 4830 points | |
| 3DMark Time Spy Score | 1802 points | |
Help | ||
Idling on Witcher 3 shows stable frame rates throughout save for one blip where frame rates temporarily dipped to the 40 FPS range. This suggests that handling of background activity could have been better to prevent performance interruption of programs that are in focus.
Witcher 3 FPS Chart
| low | med. | high | ultra | |
| GTA V (2015) | 104.7 | 91.3 | 23.1 | 9.99 |
| The Witcher 3 (2015) | 88.4 | 55.4 | 31.3 | 13.8 |
| Dota 2 Reborn (2015) | 104.5 | 82.2 | 65.2 | 58.1 |
| Final Fantasy XV Benchmark (2018) | 44.4 | 23.9 | 23.9 | |
| X-Plane 11.11 (2018) | 54.2 | 40 | 35.3 | |
| Strange Brigade (2018) | 88.5 | 40.4 | 32 | 25.9 |
| Cyberpunk 2077 1.6 (2022) | 22.8 | 18.8 | 14.3 | 10.9 |
Emissions
System Noise
Fan noise characteristics and behavior are essentially identical to what we measured on the Flex 5i despite their performance differences. The fans would top out at 38 dB(A) when running demanding loads like games while less demanding loads like browsing or streaming much quieter at 28 dB(A) or lower. Note that the fan noise ceiling on Intelligent Cooling mode is slightly lower at 36.3 dB(A) compared to the 38 dB(A) if on Extreme Performance mode. The system is still quieter than most other 14-inch convertibles regardless including the Inspiron 14 7420 2-in-1.

Noise Level
| Idle |
| 23.3 / 23.3 / 23.3 dB(A) |
| Load |
| 34.3 / 37.8 dB(A) |
 | ||
30 dB silent 40 dB(A) audible 50 dB(A) loud |
||
min: | ||
| Lenovo IdeaPad Flex 7i 14IAU7 Iris Xe G7 96EUs, i7-1255U, Samsung PM9B1 512GB MZAL4512HBLU | Lenovo IdeaPad Flex 5i 14IAU7 Iris Xe G7 80EUs, i5-1235U, Samsung PM9B1 512GB MZAL4512HBLU | Lenovo Yoga 7-14ARB G7 Radeon 680M, R7 6800U, Kioxia BG5 KBG50ZNT1T02 | Dell Inspiron 14 7420 2-in-1 Iris Xe G7 96EUs, i7-1255U, WDC PC SN530 SDBPMPZ-512G | HP Pavilion x360 14-dh1153ng UHD Graphics 620, i5-10210U, Intel Optane Memory H10 with Solid State Storage 32GB + 512GB HBRPEKNX0202A(L/H) | Asus VivoBook Flip 14 TP470EZ Xe MAX, i5-1135G7, Intel SSD 660p SSDPEKNW512G8 | |
|---|---|---|---|---|---|---|
| Noise | 1% | -12% | -5% | -17% | -21% | |
| off / environment * | 23.3 | 22.9 2% | 24.5 -5% | 23.1 1% | 29.8 -28% | 29.95 -29% |
| Idle Minimum * | 23.3 | 23 1% | 24.5 -5% | 24.7 -6% | 29.8 -28% | 29.95 -29% |
| Idle Average * | 23.3 | 23 1% | 24.5 -5% | 24.7 -6% | 29.8 -28% | 29.95 -29% |
| Idle Maximum * | 23.3 | 23 1% | 28.1 -21% | 24.7 -6% | 29.8 -28% | 29.95 -29% |
| Load Average * | 34.3 | 33.5 2% | 42.8 -25% | 27.7 19% | 32.7 5% | 39.84 -16% |
| Witcher 3 ultra * | 37.8 | 38 -1% | 42.8 -13% | 45.1 -19% | 42.3 -12% | |
| Load Maximum * | 37.8 | 37.8 -0% | 42.8 -13% | 45.1 -19% | 35.2 7% | 39.84 -5% |
* ... smaller is better
Temperature
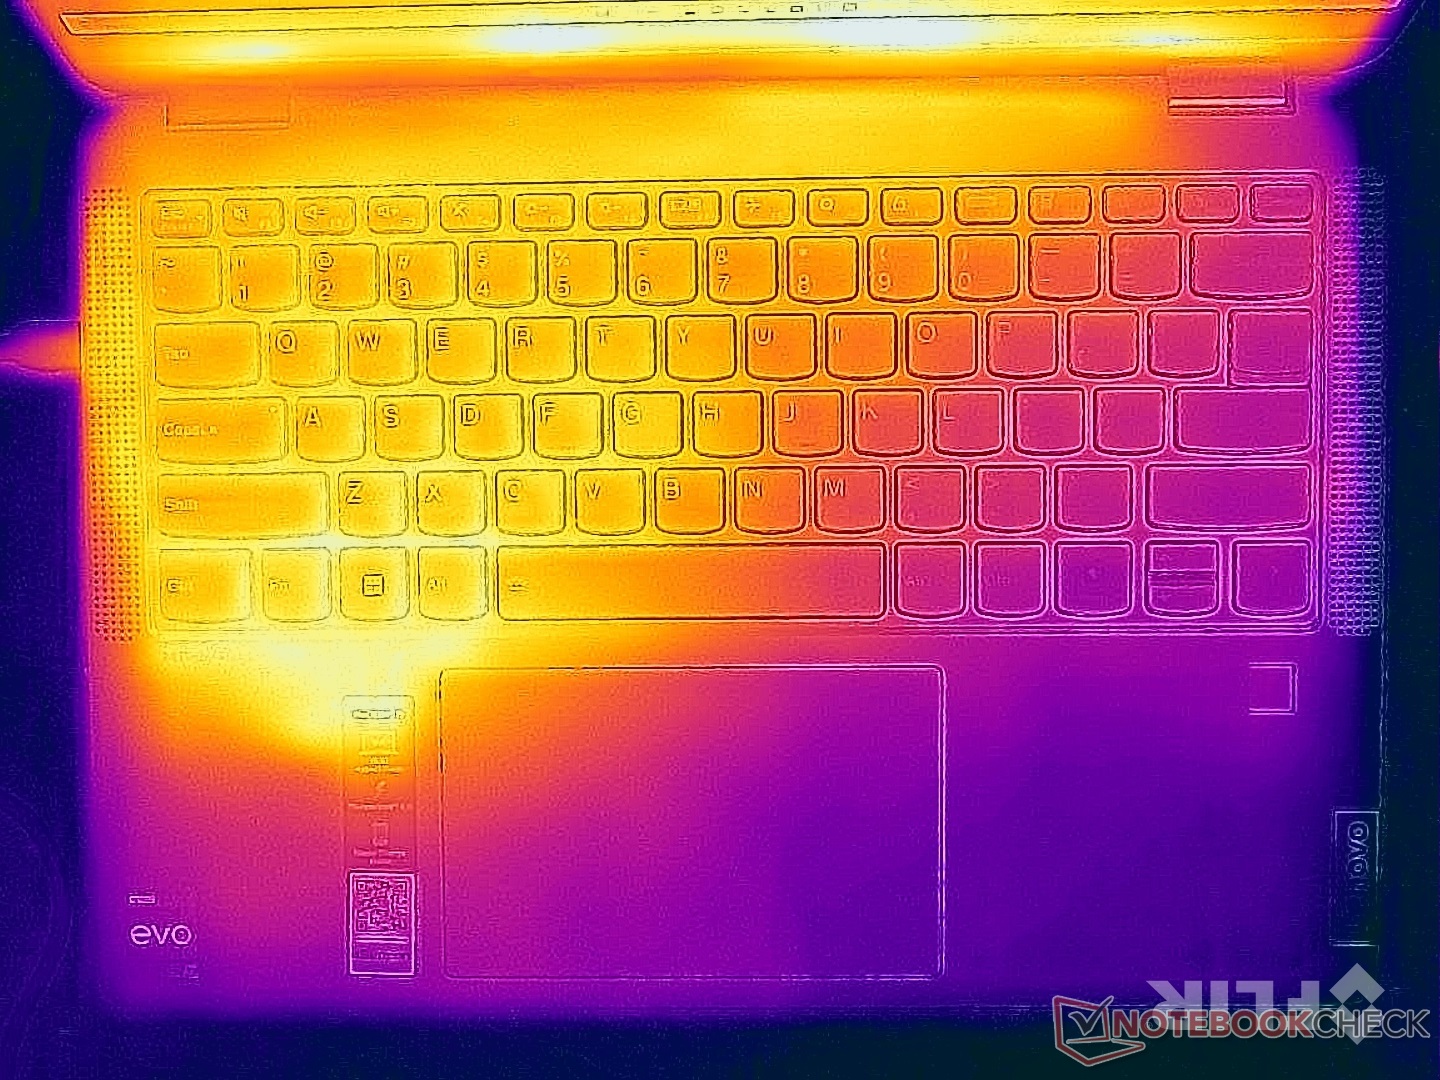
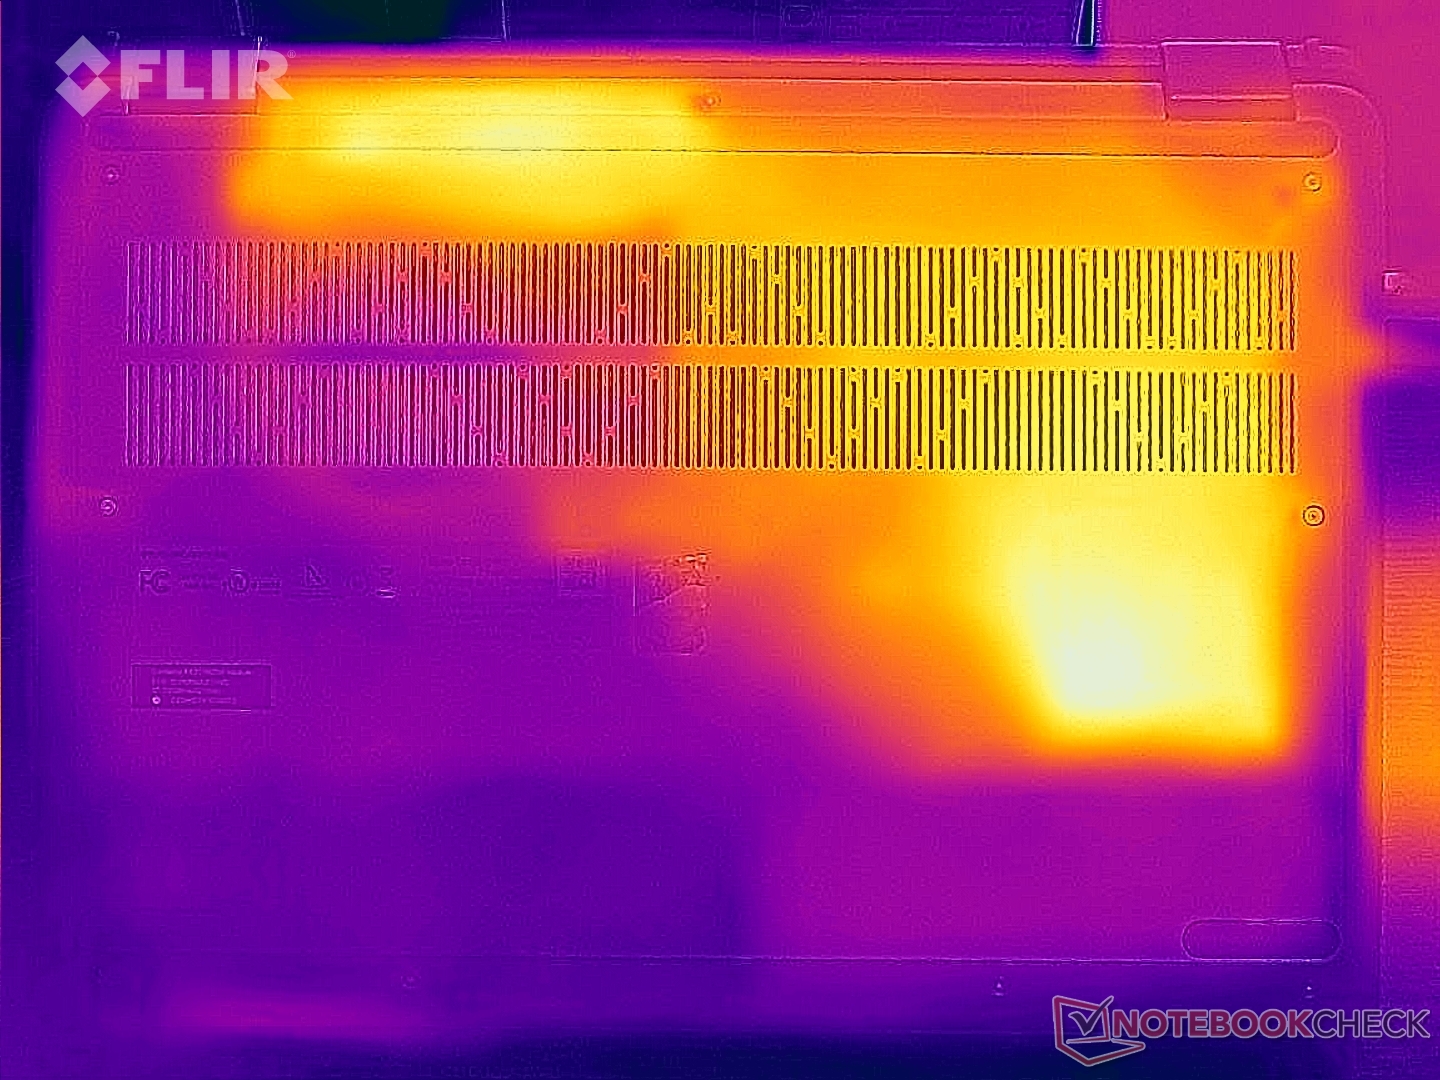
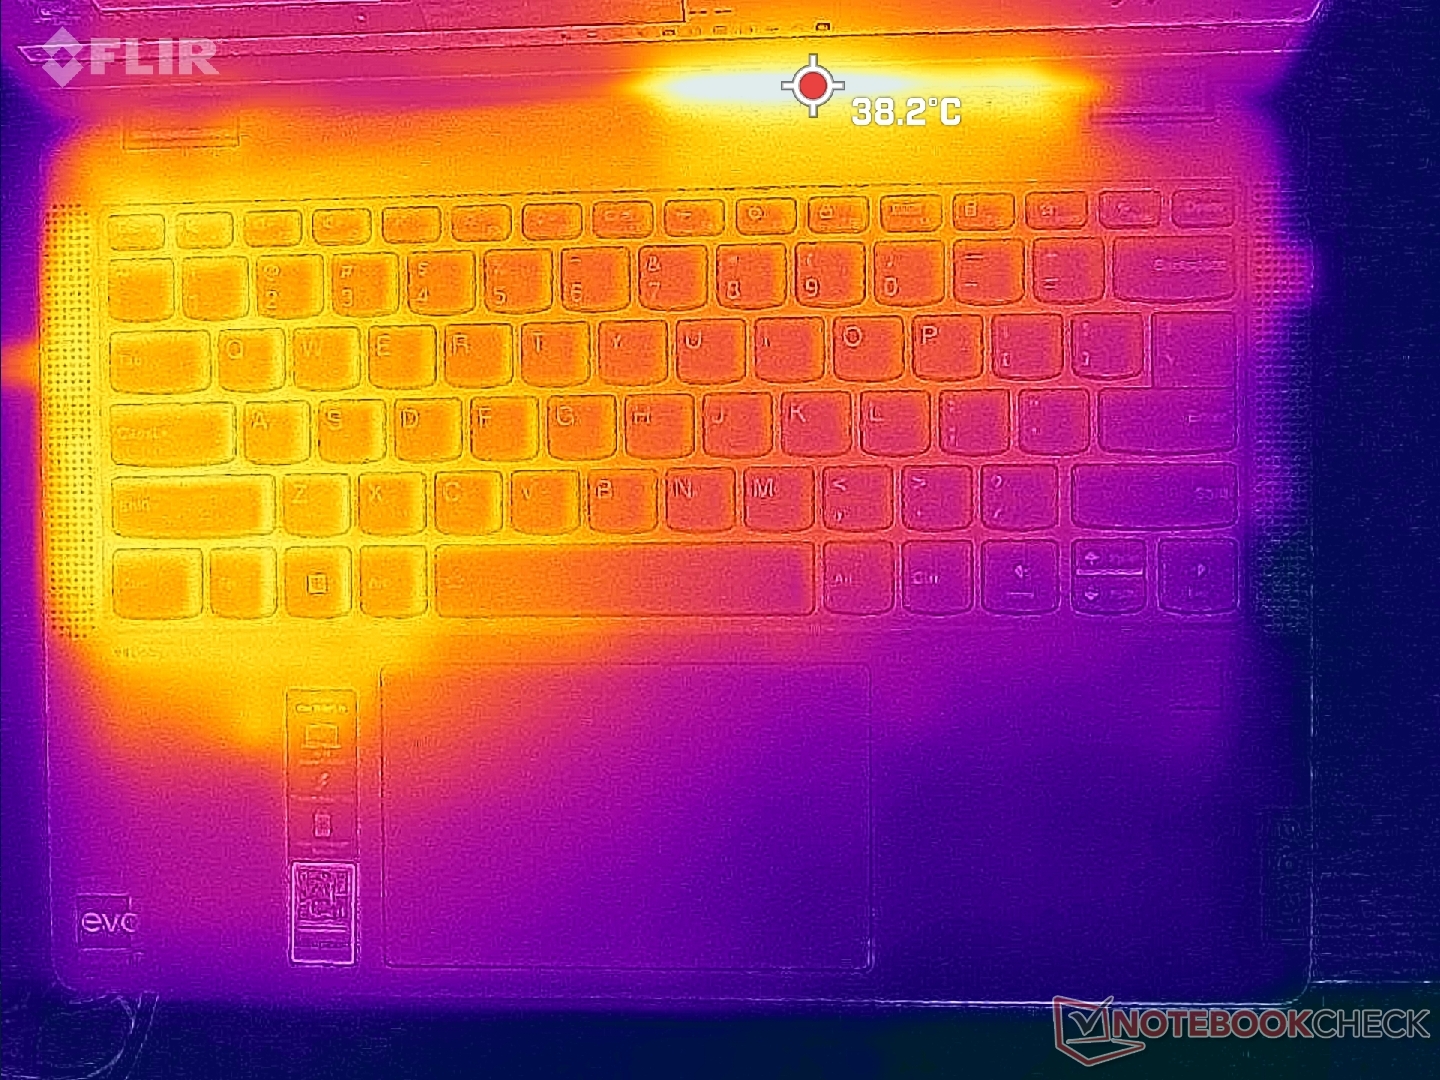
Surface temperatures are warmest on the left side of the laptop while the right side remains much cooler. Hot spots can reach 35 C and 39 C on the keyboard deck and bottom surface, respectively, compared to 38 C to 46 C on the Inspiron 7420 2-in-1. The system never becomes uncomfortably warm to the skin when holding it in tablet mode.
(+) The maximum temperature on the upper side is 35.4 °C / 96 F, compared to the average of 35.3 °C / 96 F, ranging from 19.6 to 55.7 °C for the class Convertible.
(+) The bottom heats up to a maximum of 38.8 °C / 102 F, compared to the average of 36.8 °C / 98 F
(+) In idle usage, the average temperature for the upper side is 20.6 °C / 69 F, compared to the device average of 30.2 °C / 86 F.
(+) The palmrests and touchpad are cooler than skin temperature with a maximum of 28.4 °C / 83.1 F and are therefore cool to the touch.
(±) The average temperature of the palmrest area of similar devices was 28.1 °C / 82.6 F (-0.3 °C / -0.5 F).

| Lenovo IdeaPad Flex 7i 14IAU7 Intel Core i7-1255U, Intel Iris Xe Graphics G7 96EUs | Lenovo IdeaPad Flex 5i 14IAU7 Intel Core i5-1235U, Intel Iris Xe Graphics G7 80EUs | Lenovo Yoga 7-14ARB G7 AMD Ryzen 7 6800U, AMD Radeon 680M | Dell Inspiron 14 7420 2-in-1 Intel Core i7-1255U, Intel Iris Xe Graphics G7 96EUs | HP Pavilion x360 14-dh1153ng Intel Core i5-10210U, Intel UHD Graphics 620 | Asus VivoBook Flip 14 TP470EZ Intel Core i5-1135G7, Intel Iris Xe MAX Graphics | |
|---|---|---|---|---|---|---|
| Heat | -22% | -16% | -16% | -4% | -19% | |
| Maximum Upper Side * | 35.4 | 39 -10% | 42.3 -19% | 38.2 -8% | 35.7 -1% | 41 -16% |
| Maximum Bottom * | 38.8 | 40 -3% | 45.4 -17% | 45.6 -18% | 36.4 6% | 41.2 -6% |
| Idle Upper Side * | 22.6 | 31.2 -38% | 26.2 -16% | 27.4 -21% | 24.3 -8% | 29.6 -31% |
| Idle Bottom * | 24.2 | 33.2 -37% | 26.6 -10% | 28.4 -17% | 27.6 -14% | 30 -24% |
* ... smaller is better
Stress Test
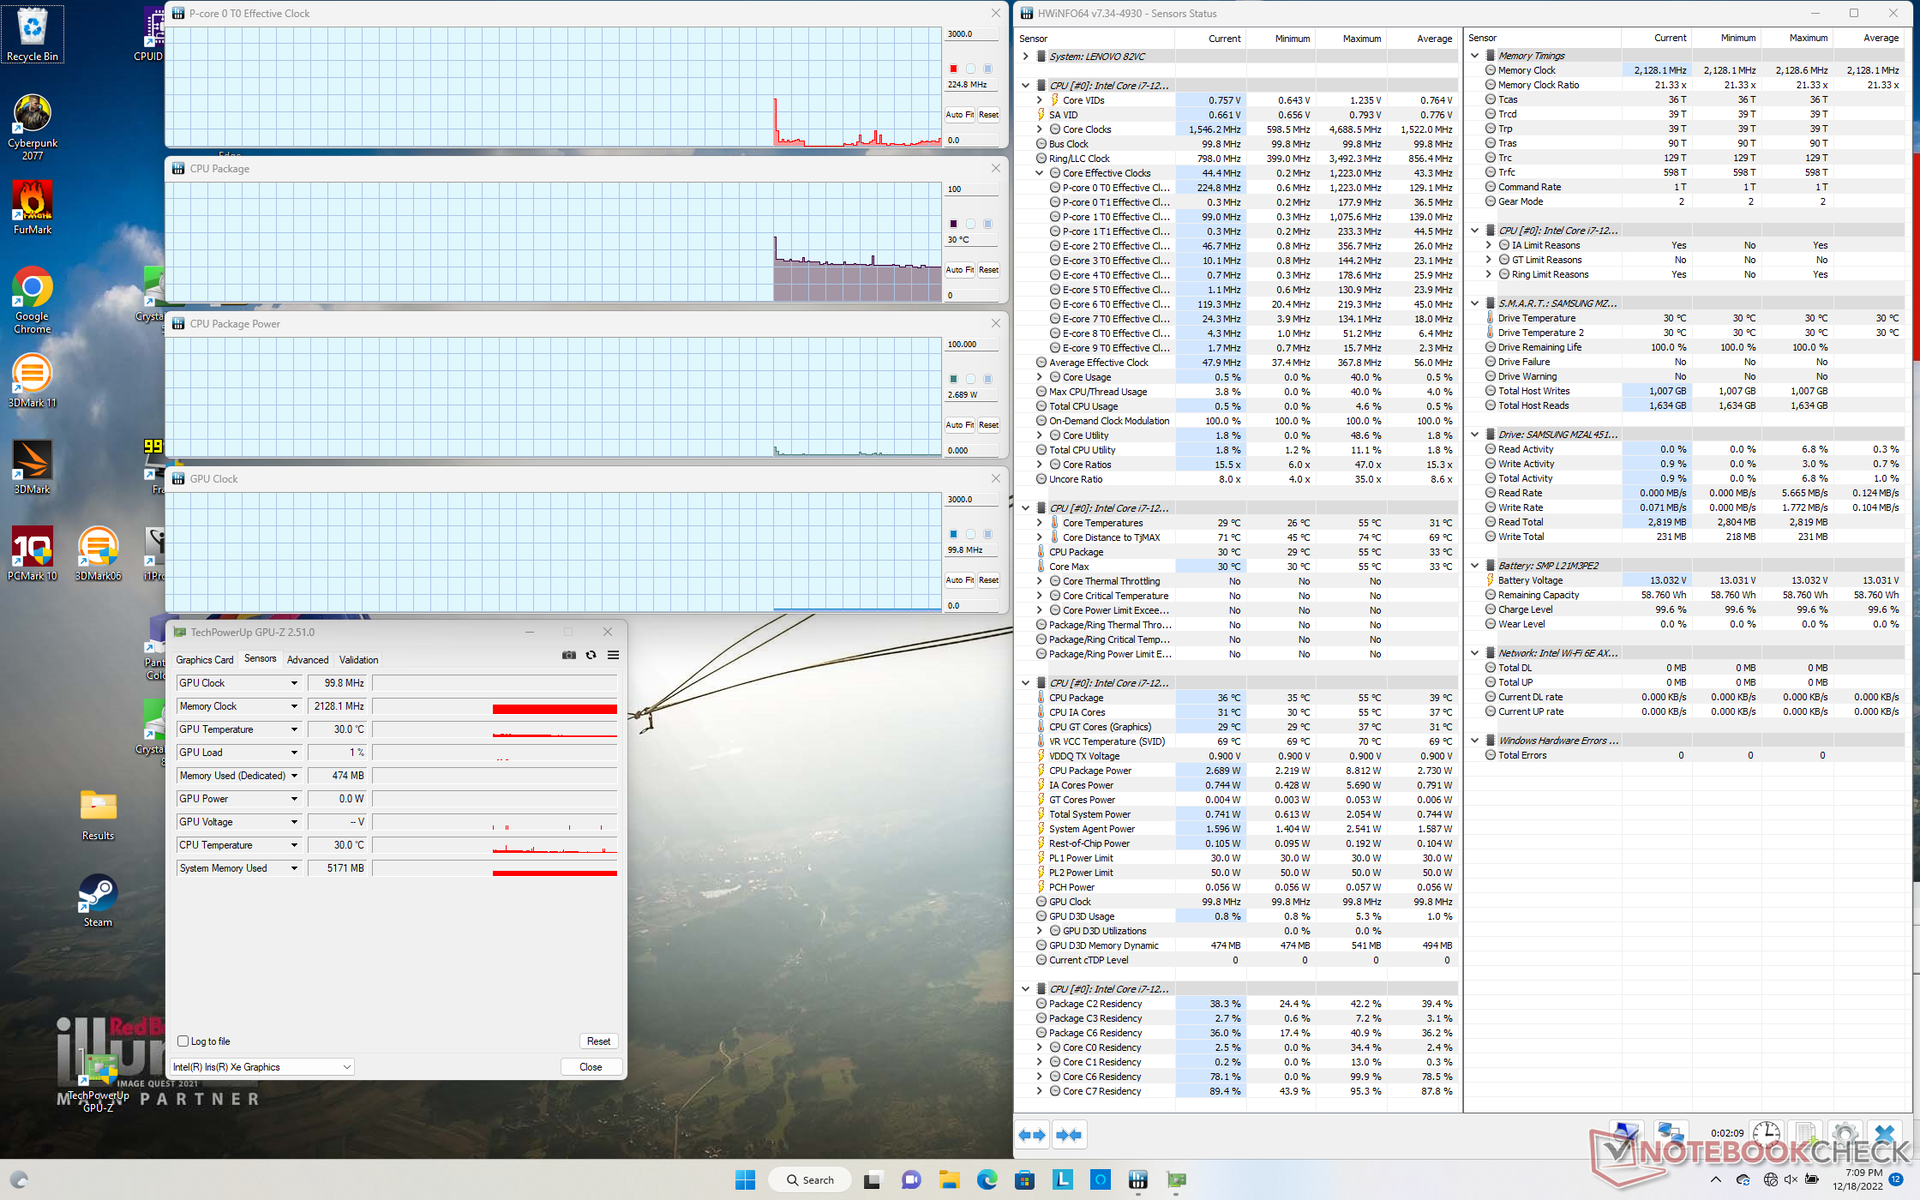
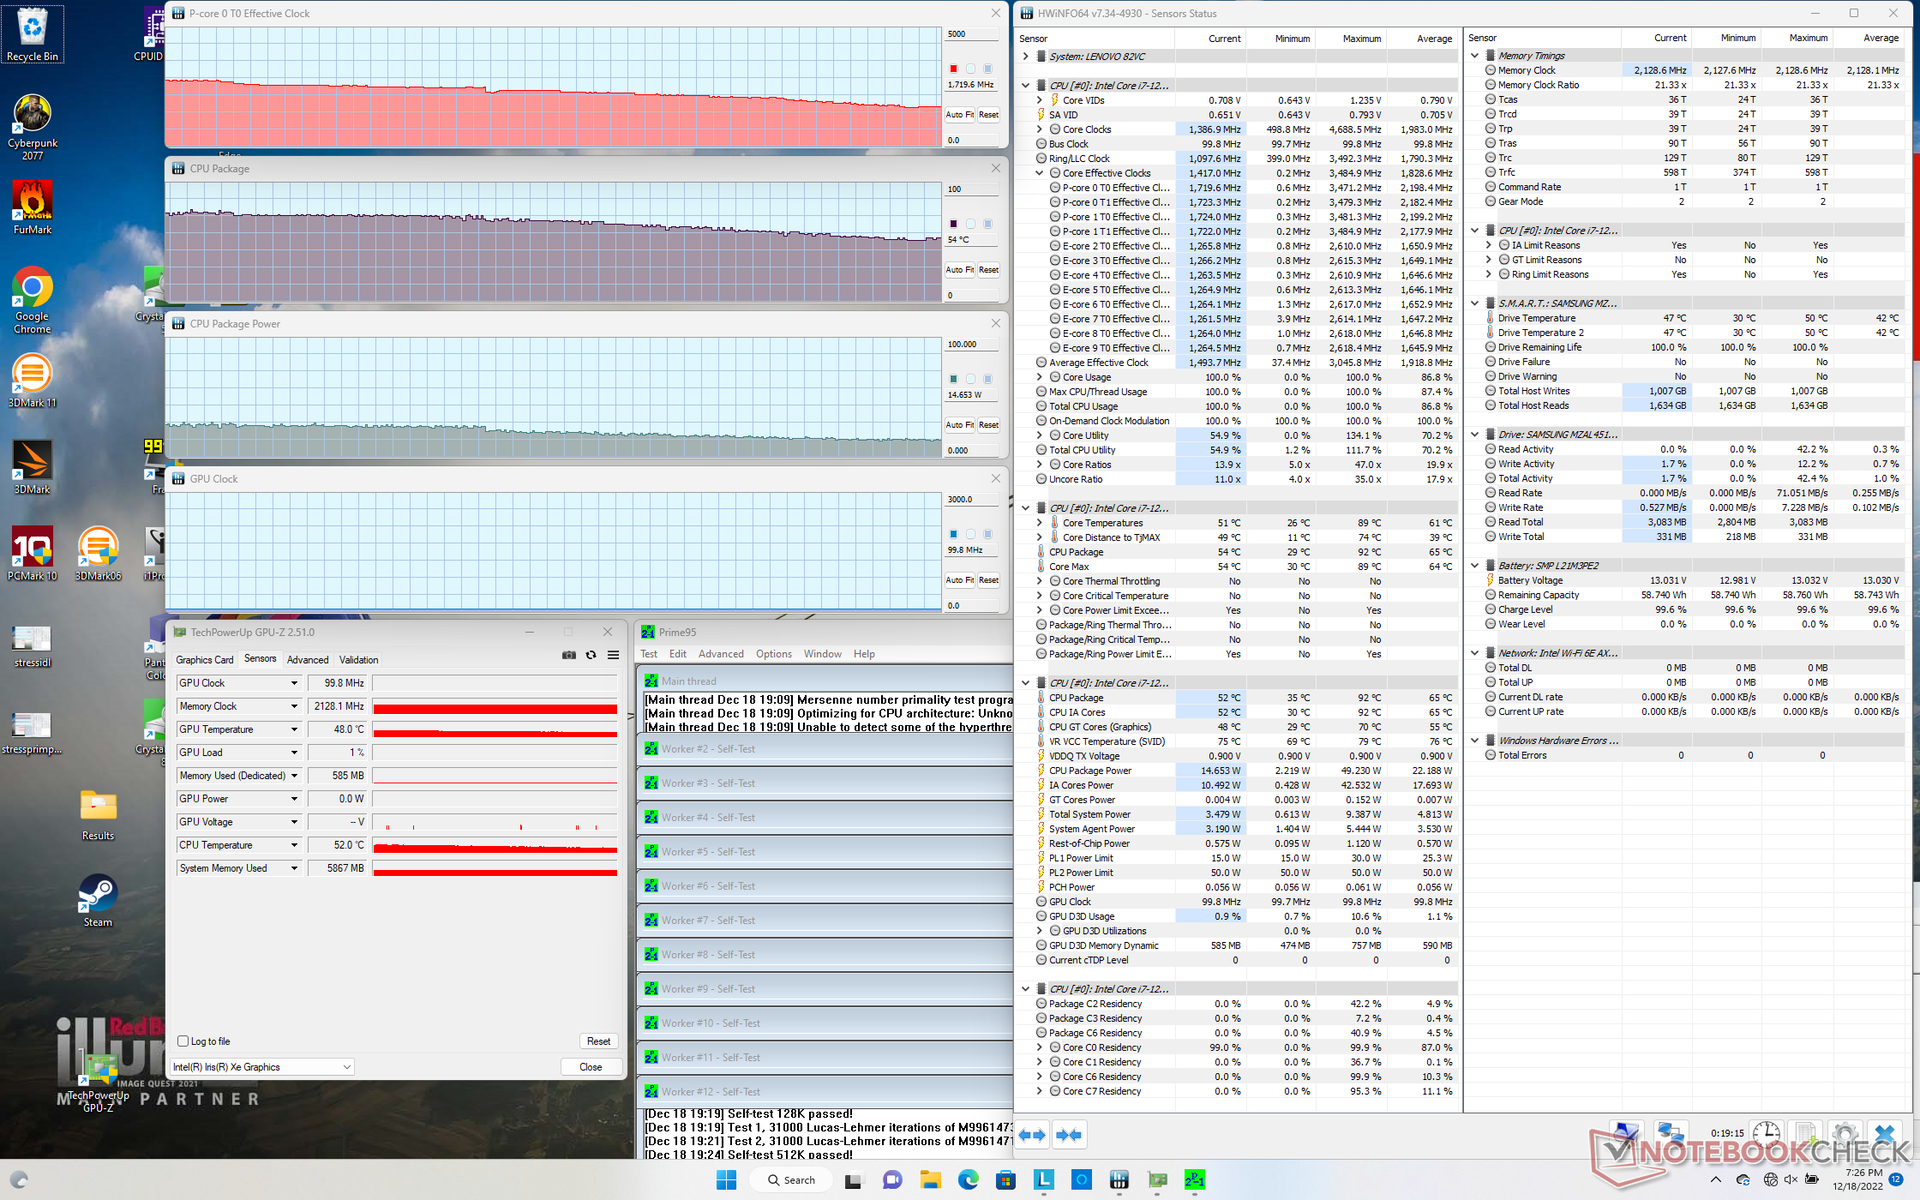
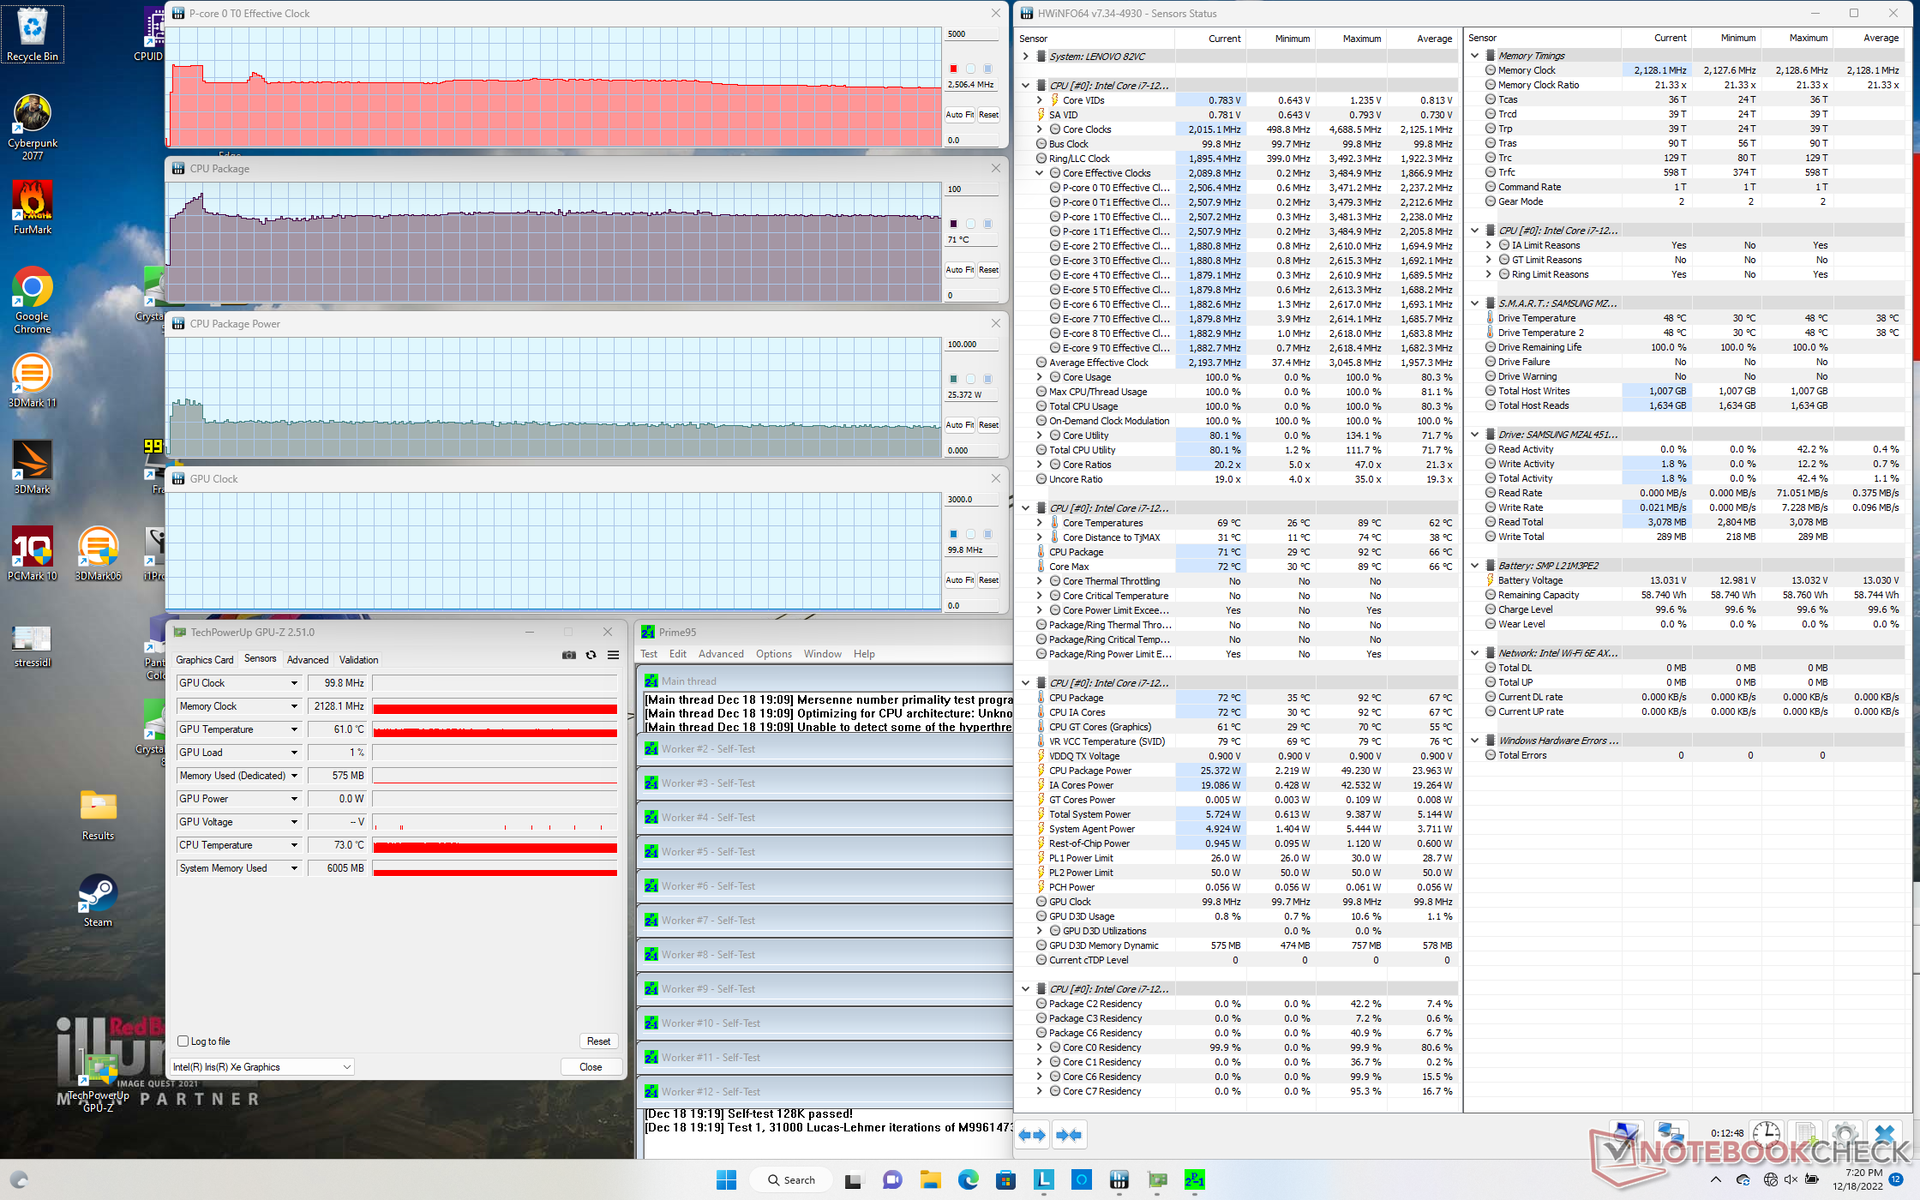
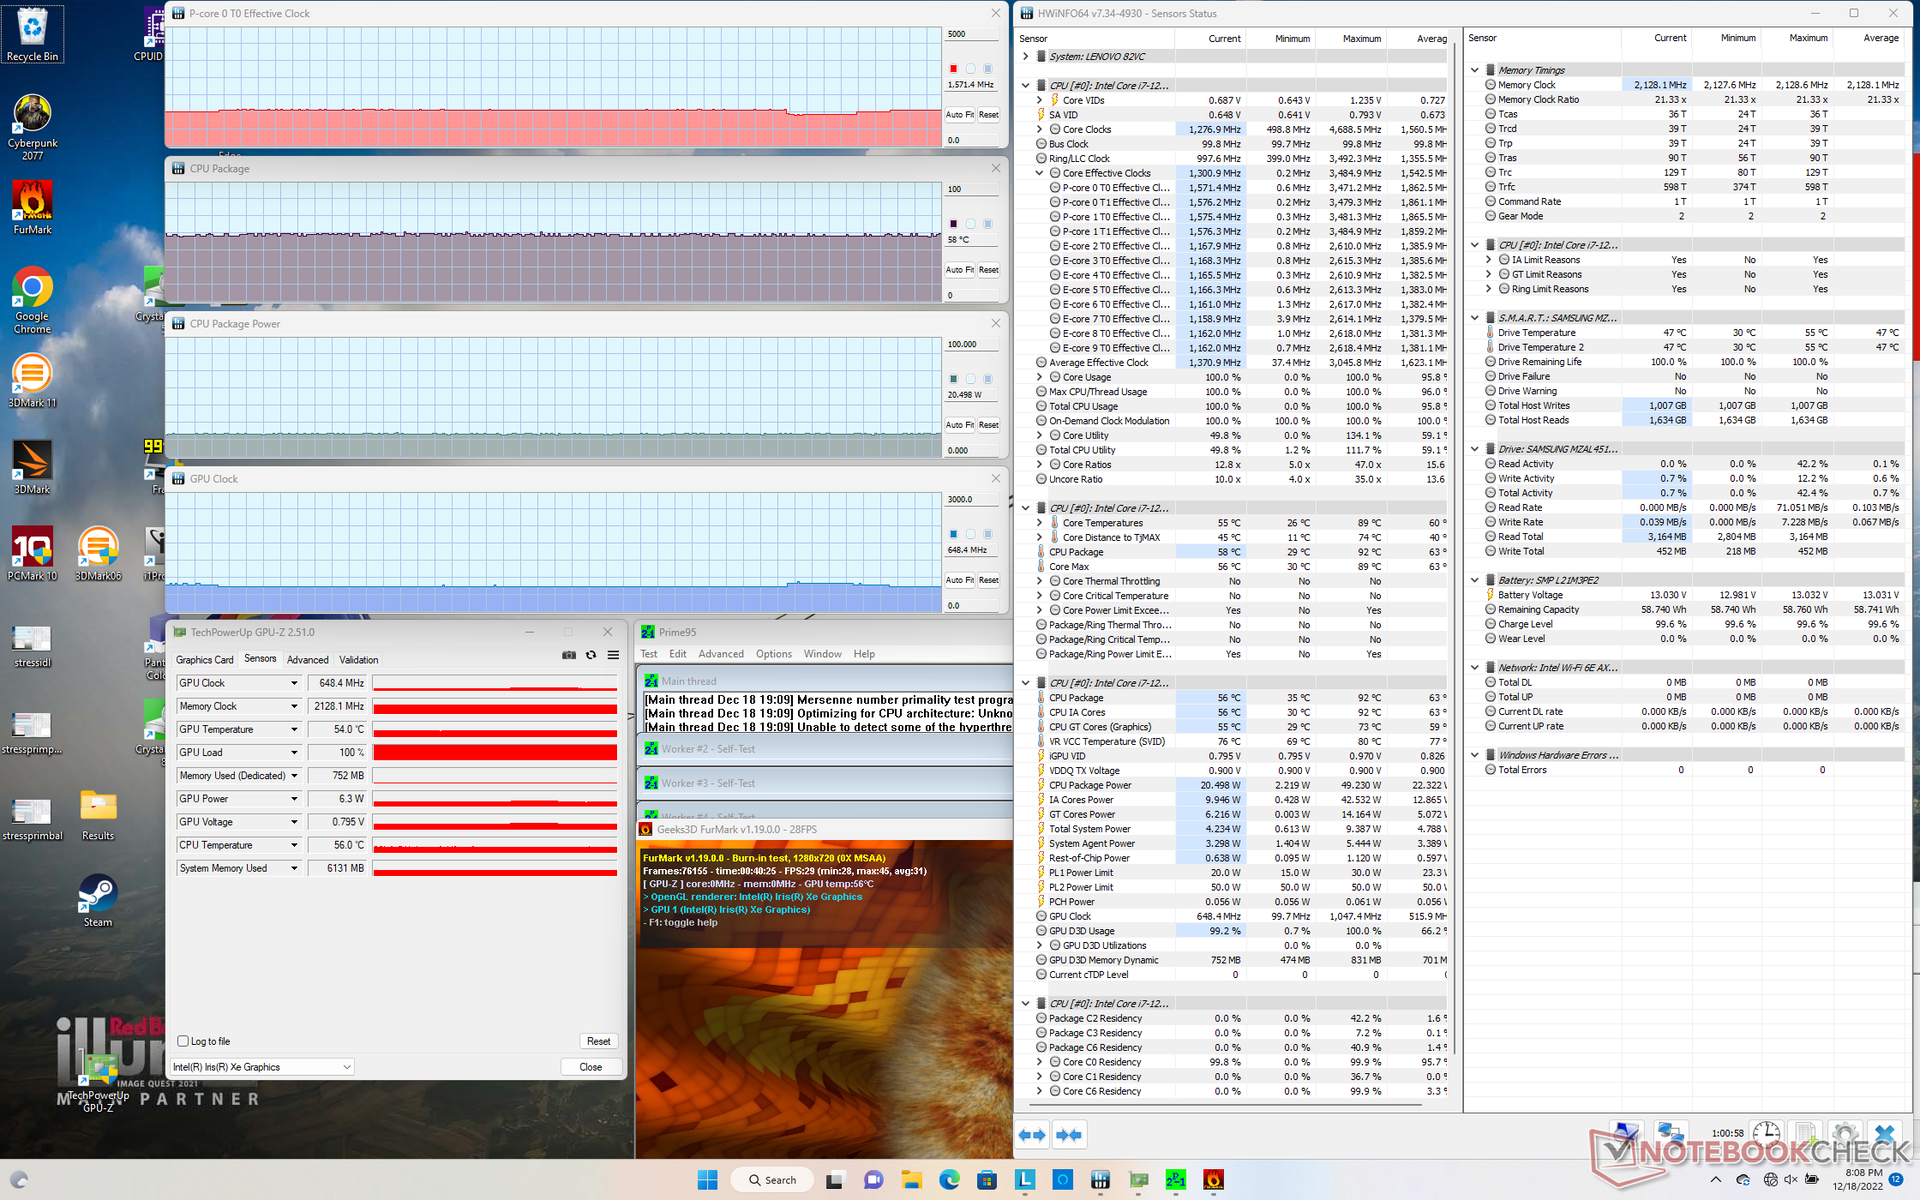
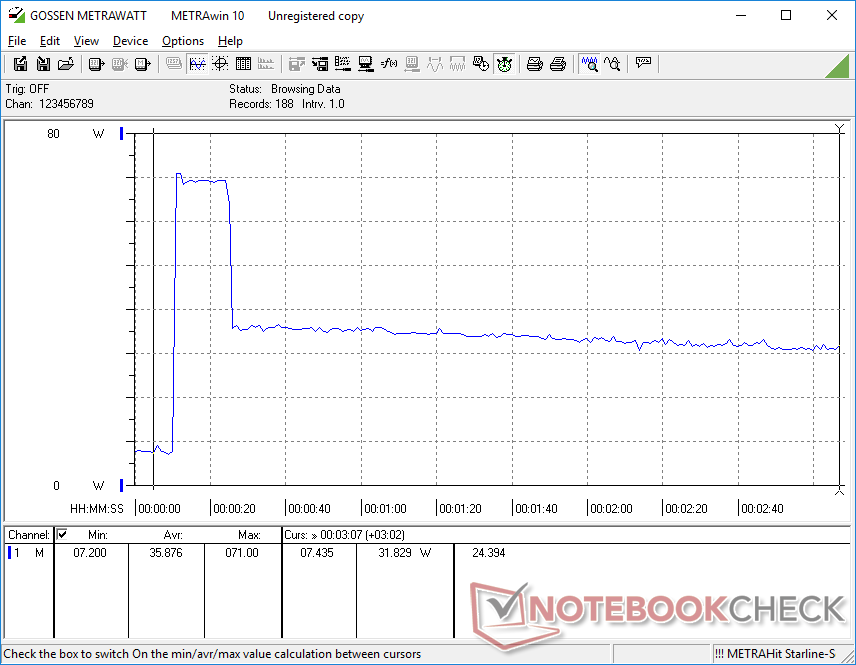
When running Prime95 on Extreme Performance mode, CPU clock rate and temperature would boost to 3.4 GHz and 49 W for about 20 seconds or until core temperature reaches 92 C. Thereafter, clock rates and temperature would fall until stabilizing at around 2.5 GHz and 71 C, respectively, and with a final board power draw of 25 W. If running on Intelligent Cooling mode instead, performance would fall even further to a board power draw of just 15 W as shown by the screenshots below. You'll want to enable Extreme Performance mode when running more demanding applications as a result.
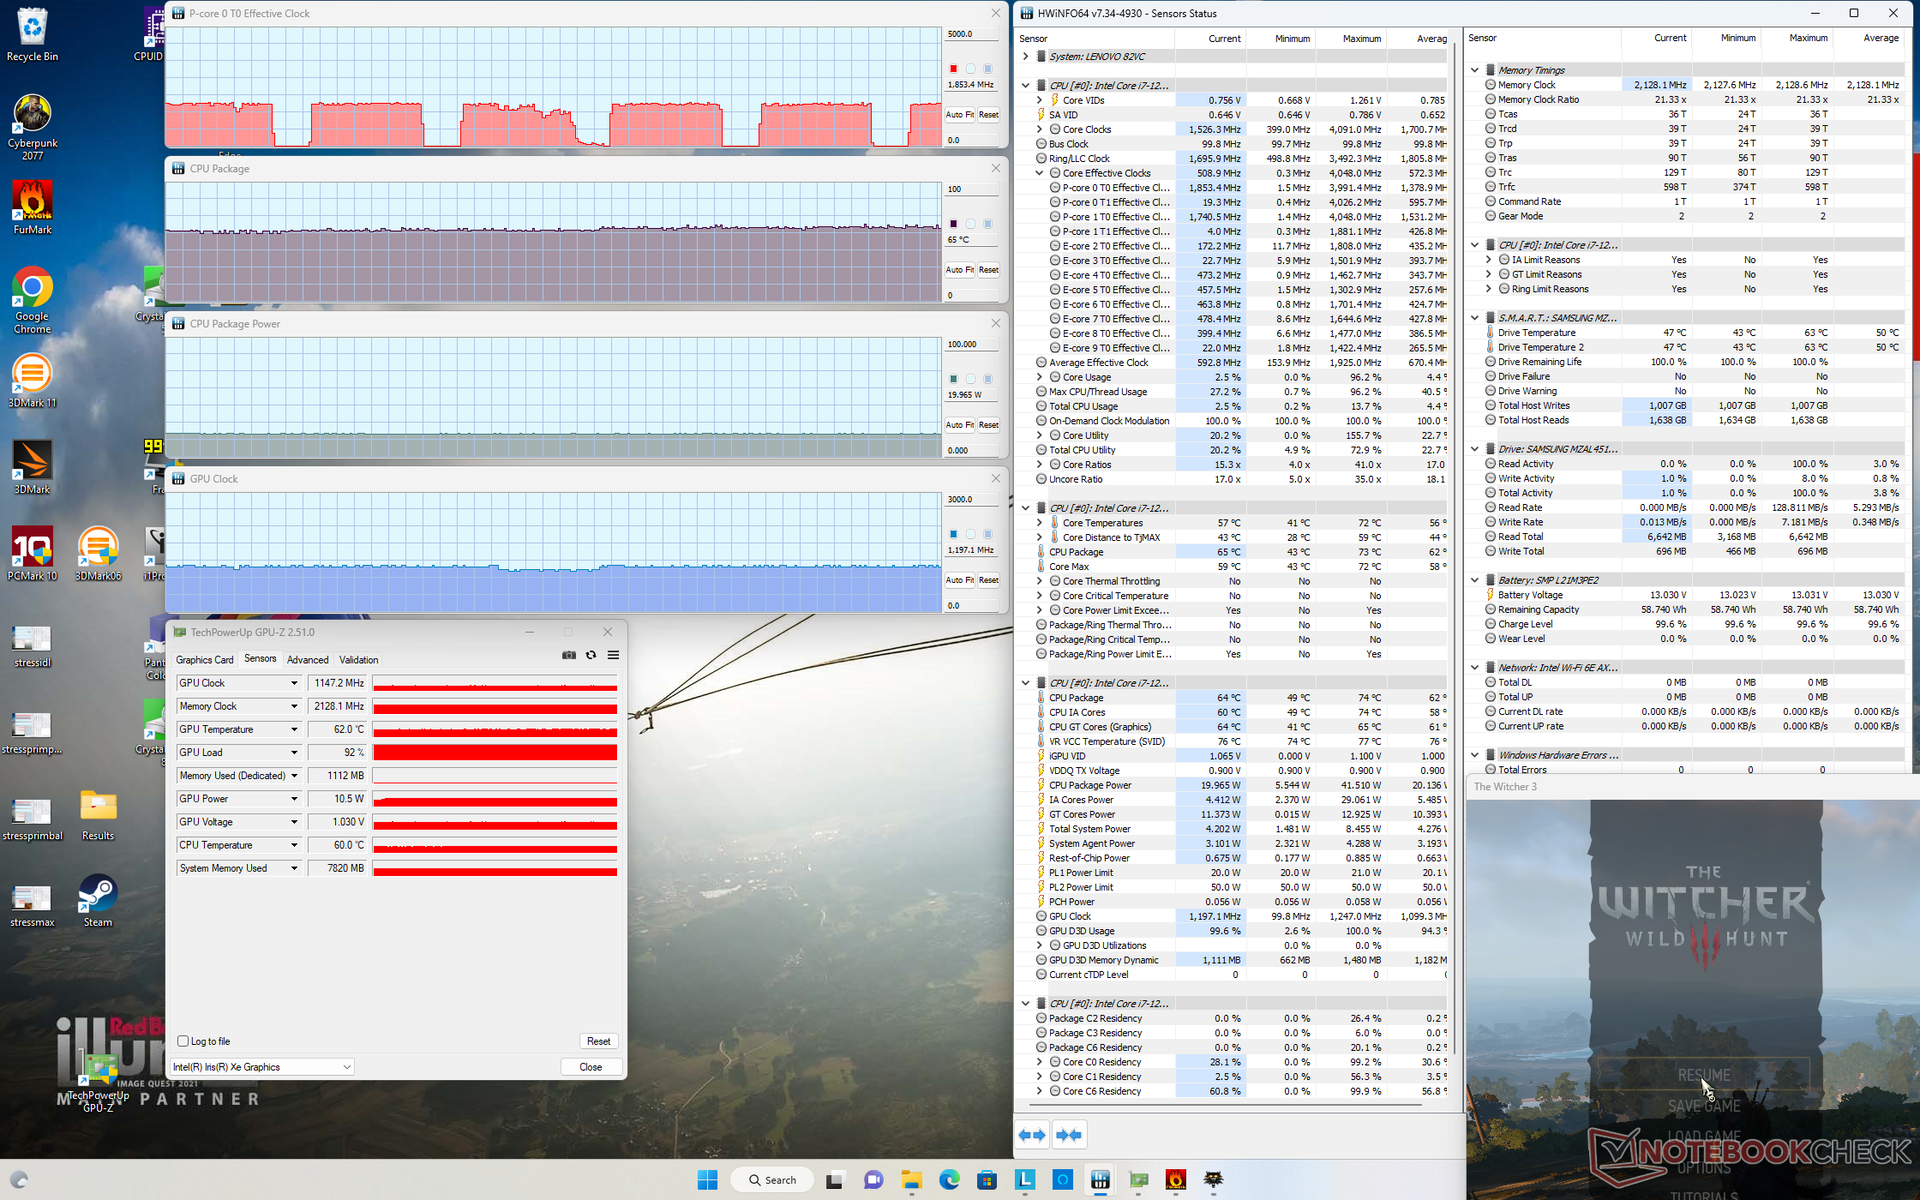
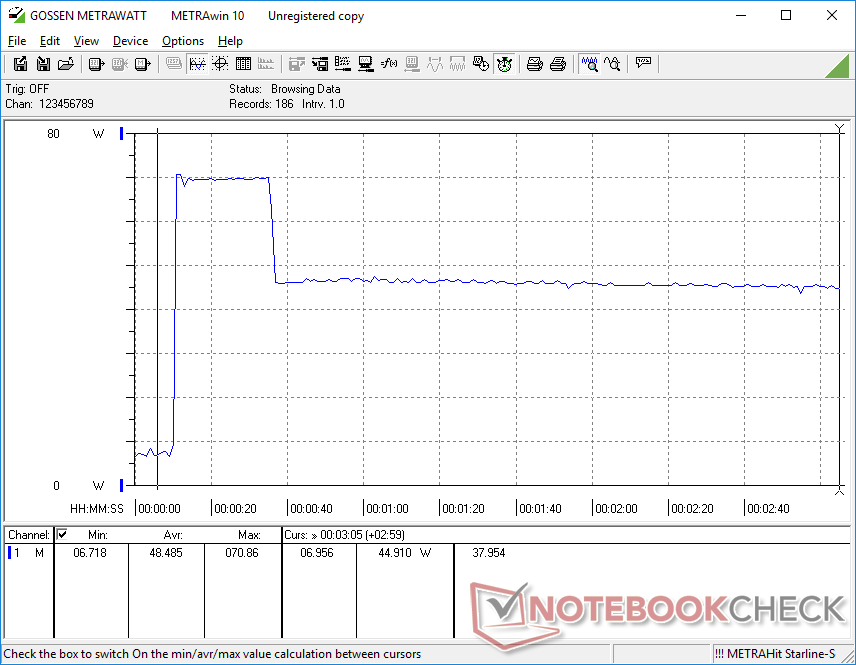
Running higher loads like games will see a stable GPU clock rate and temperature of 1137 MHz and 65 C, respectively, compared to 1100 MHz and 58 C on the HP Dragonfly Folio G3 powered by the same GPU.
CPU performance is reduced if running on battery power. A 3DMark 11 test on batteries would return Physics and Graphics scores of just 12601 and 6302 points, respectively, compared to 16437 and 6220 points when on mains.
| CPU Clock (GHz) | GPU Clock (MHz) | Average CPU Temperature (°C) | |
| System Idle | -- | -- | 30 |
| Prime95 Stress (Intelligent Cooling mode) | 1.7 | -- | 54 |
| Prime95 Stress (Extreme Performance mode) | 2.5 | -- | 71 |
| Prime95 + FurMark Stress (Extreme Performance mode) | 1.5 | 648 | 58 |
| Witcher 3 Stress (Extreme Performance mode) | 1.8 | 1147 | 65 |
Speakers
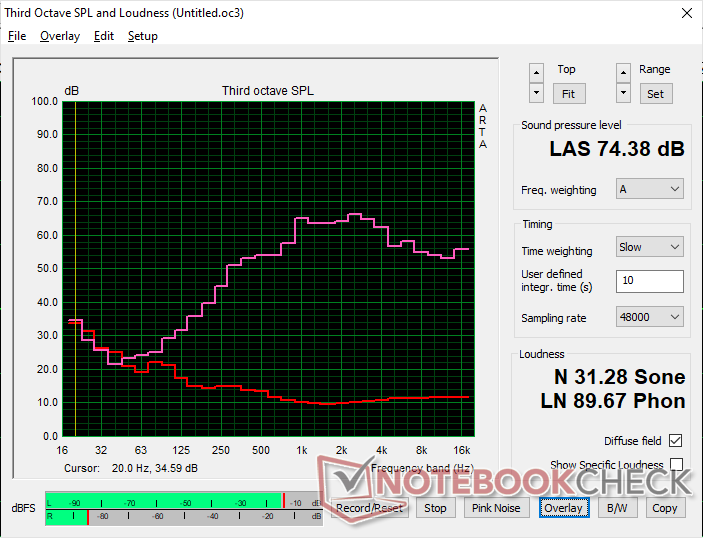
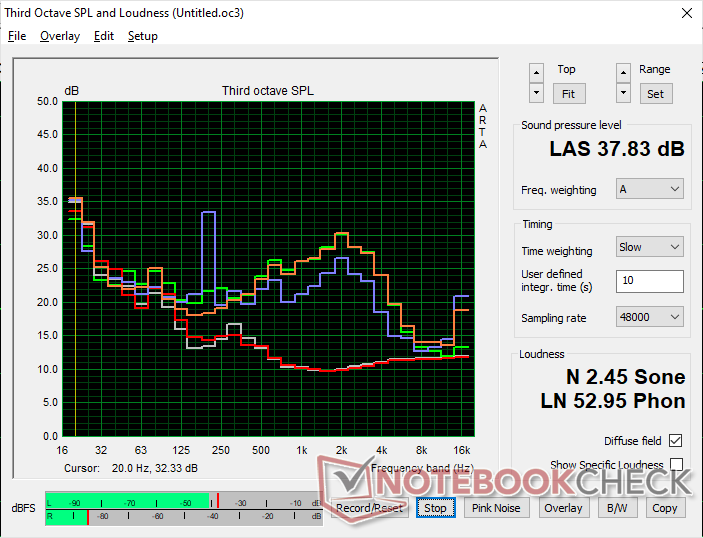
Lenovo IdeaPad Flex 7i 14IAU7 audio analysis
(±) | speaker loudness is average but good (74.4 dB)
Bass 100 - 315 Hz
(-) | nearly no bass - on average 16.3% lower than median
(±) | linearity of bass is average (9.9% delta to prev. frequency)
Mids 400 - 2000 Hz
(±) | higher mids - on average 5.3% higher than median
(+) | mids are linear (4.7% delta to prev. frequency)
Highs 2 - 16 kHz
(+) | balanced highs - only 4.9% away from median
(+) | highs are linear (5.7% delta to prev. frequency)
Overall 100 - 16.000 Hz
(±) | linearity of overall sound is average (20.3% difference to median)
Compared to same class
» 47% of all tested devices in this class were better, 8% similar, 45% worse
» The best had a delta of 6%, average was 21%, worst was 57%
Compared to all devices tested
» 47% of all tested devices were better, 8% similar, 44% worse
» The best had a delta of 4%, average was 25%, worst was 134%
Apple MacBook Pro 16 2021 M1 Pro audio analysis
(+) | speakers can play relatively loud (84.7 dB)
Bass 100 - 315 Hz
(+) | good bass - only 3.8% away from median
(+) | bass is linear (5.2% delta to prev. frequency)
Mids 400 - 2000 Hz
(+) | balanced mids - only 1.3% away from median
(+) | mids are linear (2.1% delta to prev. frequency)
Highs 2 - 16 kHz
(+) | balanced highs - only 1.9% away from median
(+) | highs are linear (2.7% delta to prev. frequency)
Overall 100 - 16.000 Hz
(+) | overall sound is linear (4.6% difference to median)
Compared to same class
» 0% of all tested devices in this class were better, 0% similar, 100% worse
» The best had a delta of 5%, average was 18%, worst was 45%
Compared to all devices tested
» 0% of all tested devices were better, 0% similar, 100% worse
» The best had a delta of 4%, average was 25%, worst was 134%
Energy Management
Power Consumption
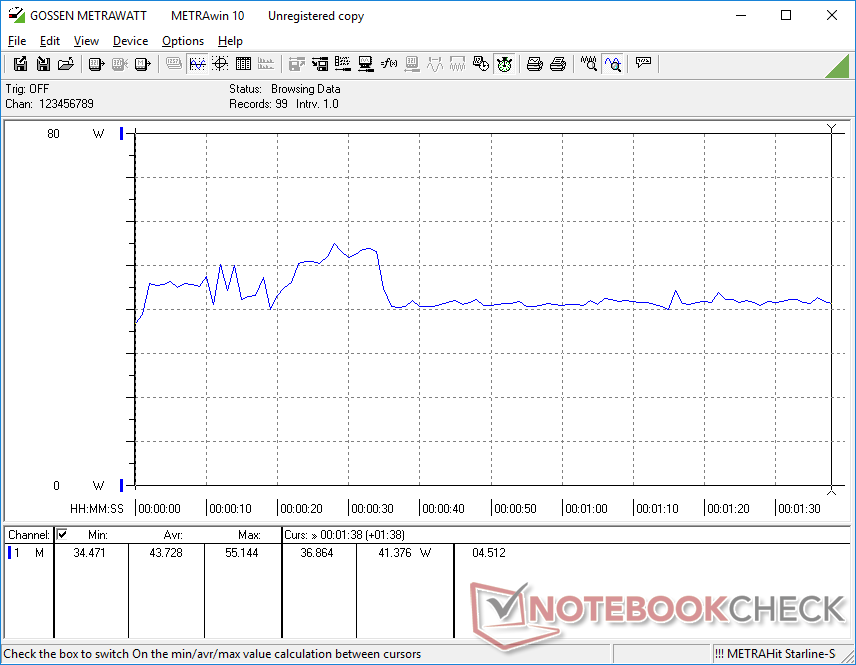
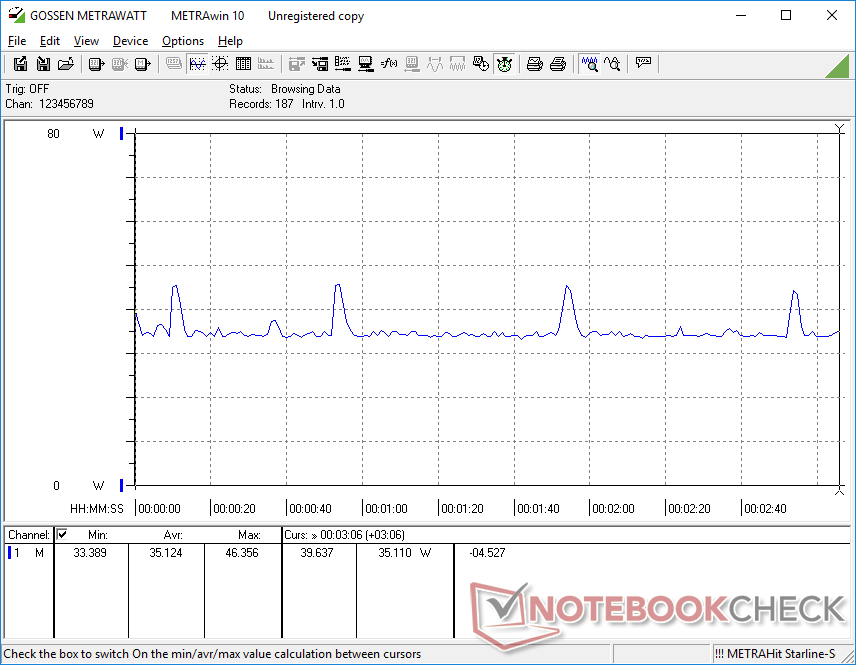
Overall power consumption is slightly higher than what we recorded on the IdeaPad Flex 5i when under similar conditions likely due to the slightly higher native resolution display of the Flex 7i and its faster performance levels overall.
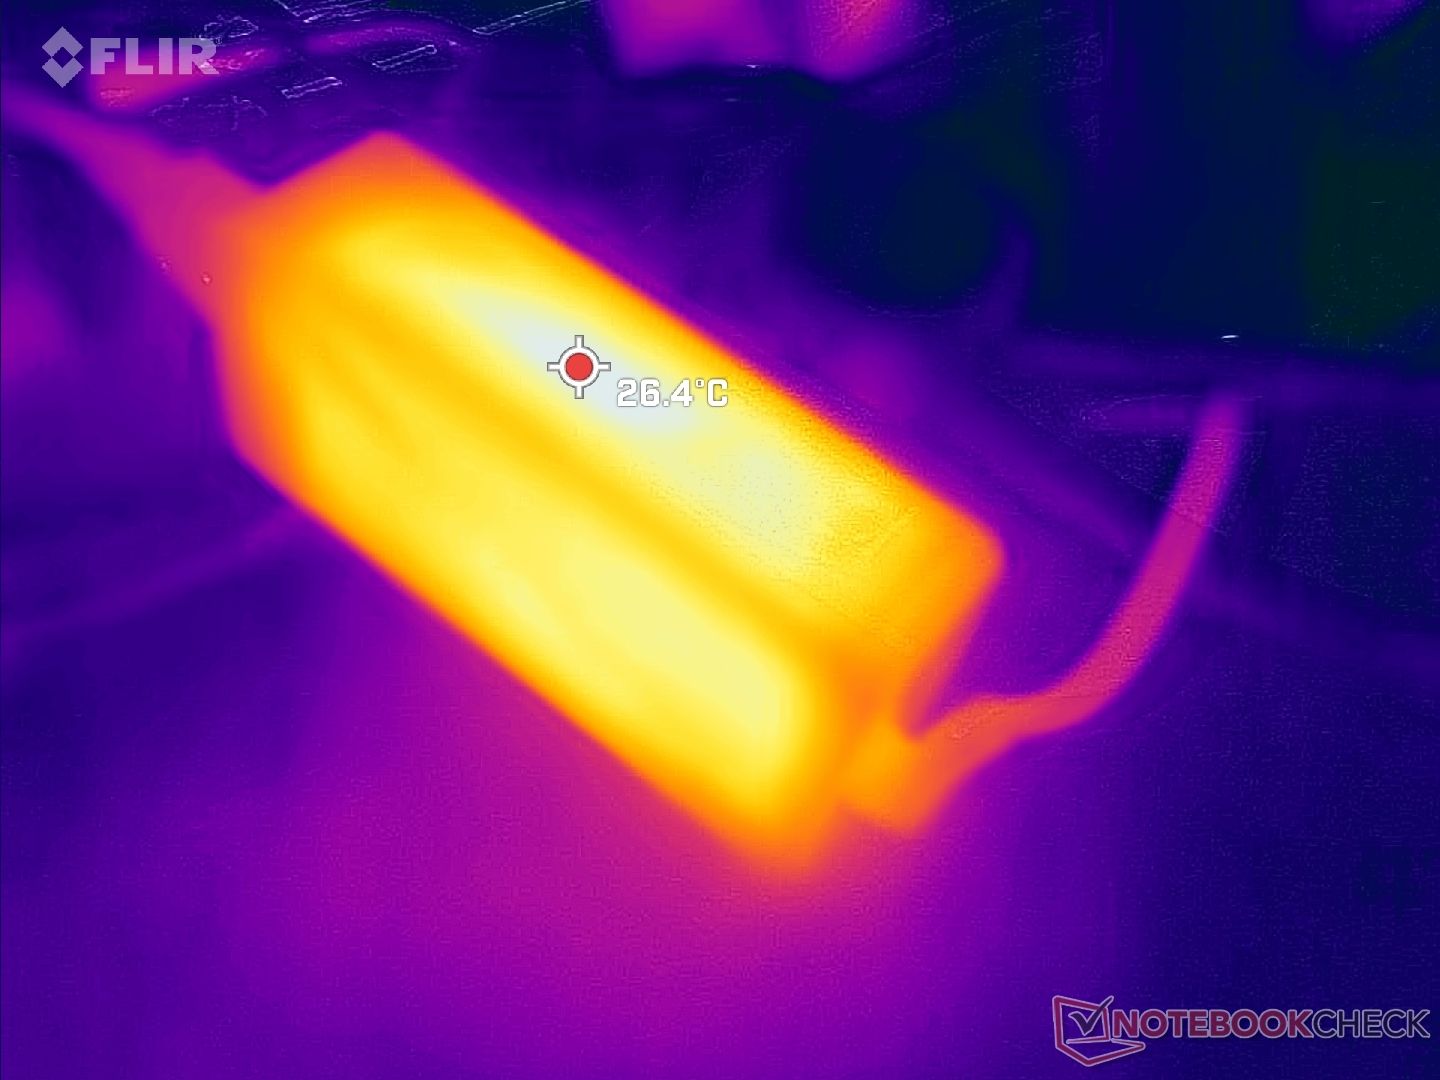
We're able to record a maximum draw of 71 W from the small (~11 x 4.8 x 3 cm) 65 W USB-C AC adapter when running Prime95. This rate only lasts for about 20 seconds due to the limited Turbo Boost potential of the system. Consumption will instead range between 35 W and 45 W when running demanding loads for extended periods.
| Off / Standby | |
| Idle | |
| Load |
|
| Lenovo IdeaPad Flex 7i 14IAU7 i7-1255U, Iris Xe G7 96EUs, Samsung PM9B1 512GB MZAL4512HBLU, IPS, 2240x1400, 14.00 | Lenovo IdeaPad Flex 5i 14IAU7 i5-1235U, Iris Xe G7 80EUs, Samsung PM9B1 512GB MZAL4512HBLU, IPS, 1920x1200, 14.00 | Lenovo Yoga 7-14ARB G7 R7 6800U, Radeon 680M, Kioxia BG5 KBG50ZNT1T02, OLED, 2880x1800, 14.00 | Dell Inspiron 14 7420 2-in-1 i7-1255U, Iris Xe G7 96EUs, WDC PC SN530 SDBPMPZ-512G, IPS, 1920x1200, 14.00 | HP Pavilion x360 14-dh1153ng i5-10210U, UHD Graphics 620, Intel Optane Memory H10 with Solid State Storage 32GB + 512GB HBRPEKNX0202A(L/H), IPS, 1920x1080, 14.00 | Asus VivoBook Flip 14 TP470EZ i5-1135G7, Xe MAX, Intel SSD 660p SSDPEKNW512G8, IPS, 1920x1080, 14.00 | |
|---|---|---|---|---|---|---|
| Power Consumption | 13% | 6% | 13% | 44% | -29% | |
| Idle Minimum * | 7.1 | 4.9 31% | 5.1 28% | 5.2 27% | 3.3 54% | 8.6 -21% |
| Idle Average * | 11 | 8.5 23% | 8.2 25% | 8.2 25% | 5.8 47% | 9.56 13% |
| Idle Maximum * | 11.4 | 10.4 9% | 8.7 24% | 9.9 13% | 7.9 31% | 25.82 -126% |
| Load Average * | 43.7 | 42.4 3% | 51.4 -18% | 44.4 -2% | 27 38% | 47 -8% |
| Witcher 3 ultra * | 35.1 | 32.9 6% | 46.3 -32% | 35 -0% | 45.9 -31% | |
| Load Maximum * | 71 | 68.9 3% | 64.8 9% | 62.5 12% | 37 48% | 69.48 2% |
* ... smaller is better
Power Consumption Witcher 3 / Stresstest
Power Consumption external Monitor
Battery Life
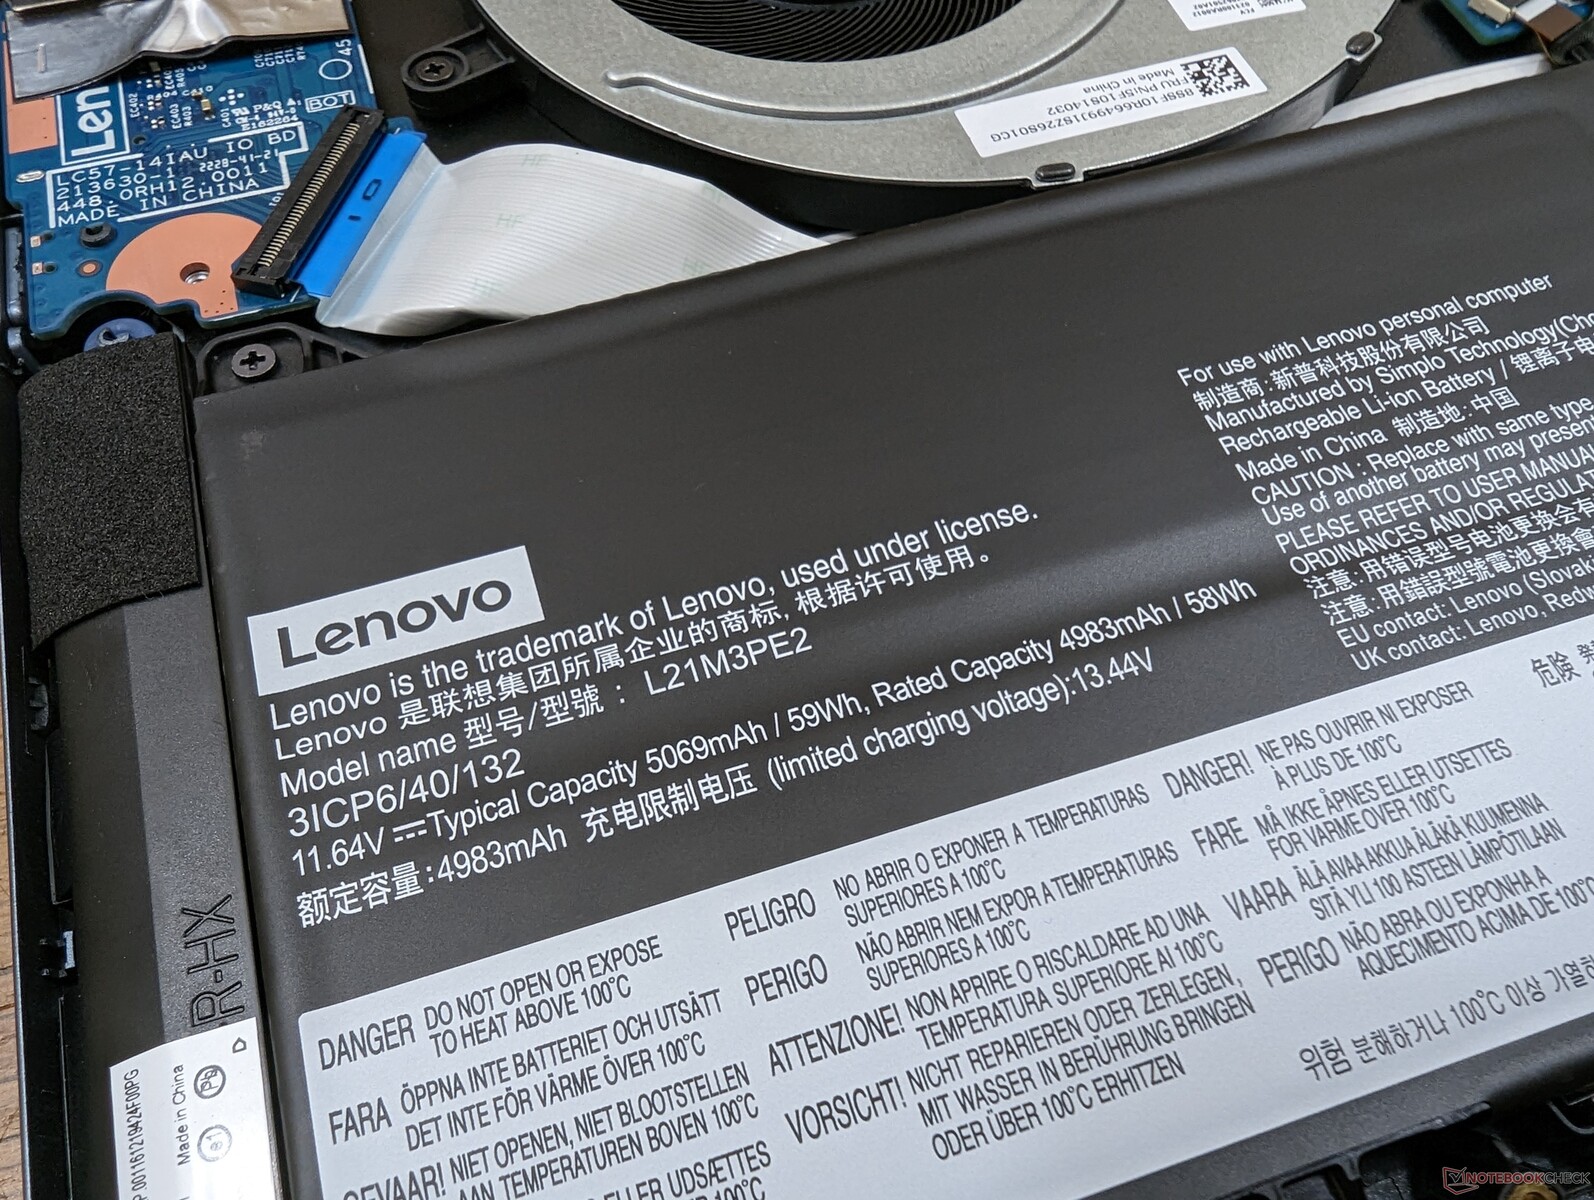
Battery capacity is up from 53 Wh on the Flex 5i to 59 Wh on the Flex 7i. Runtime is nonetheless shorter on our Flex 7i unit by about two hours.
Charging from empty to full takes about 90 minutes. The first charge cycle can be extremely slow, but subsequent cycles should charge much faster. Rapid Charge is enabled by default on Lenovo Vantage.
| Lenovo IdeaPad Flex 7i 14IAU7 i7-1255U, Iris Xe G7 96EUs, 59 Wh | Lenovo IdeaPad Flex 5i 14IAU7 i5-1235U, Iris Xe G7 80EUs, 52.5 Wh | Lenovo Yoga 7-14ARB G7 R7 6800U, Radeon 680M, 71 Wh | Dell Inspiron 14 7420 2-in-1 i7-1255U, Iris Xe G7 96EUs, 54 Wh | HP Pavilion x360 14-dh1153ng i5-10210U, UHD Graphics 620, 41 Wh | Asus VivoBook Flip 14 TP470EZ i5-1135G7, Xe MAX, 42 Wh | |
|---|---|---|---|---|---|---|
| Battery Runtime | 20% | 29% | 0% | -17% | -3% | |
| WiFi v1.3 | 453 | 542 20% | 584 29% | 455 0% | 377 -17% | 440.9 -3% |
| Reader / Idle | 1437 | 954 | 856 | |||
| Load | 53 | 110 | 127 | 88 | ||
| H.264 | 762 | 525 |
Pros
Cons
Verdict — Great Display And Performance For The Price
The IdeaPad Flex 7 is a few steps forward and a few steps back when compared to the IdeaPad Flex 5. It has a slightly bigger battery, but battery life doesn't appear to be any longer. It now supports USB-C charging only, but there is just one USB-C port for charging and accessories. And finally, the touchscreen is of a higher resolution and with deeper colors, but response times and brightness are slightly slower and dimmer, respectively.
The IdeaPad Flex 7i comes with an excellent 1400p touchscreen that's better than most other 14-inch convertibles in the sub $1000 USD price range. Other than that, nothing else about the model sticks out when compared to the competition.
Fortunately, the drawbacks aren't enough to overcome the core strengths of the model. More specifically, the display is sharper and more vibrant than the one on the Inspiron 14 7420 2-in-1 while performance is faster than the Core i5-powered IdeaPad Flex 5 without needing to be louder or warmer. These two advantages will be the main reason for choosing the Lenovo model over others given similar prices. For future models, Lenovo should absolutely integrate a second USB-C port to improve versatility.
Price and Availability
The 2022 IdeaPad Flex 7i is now shipping on Amazon for $1100 USD in our exact configuration. It is otherwise currently out of stock at Lenovo.com.
Lenovo IdeaPad Flex 7i 14IAU7
-
12/21/2022 v7
Allen Ngo
More articles related to this device
Lenovo IdeaPad Flex 7i 14IAU7 (IdeaPad Flex Series)Related Articles


Pricecompare
