Acer Enduro Urban N3 EUN314 laptop review: Part rugged, part Ultrabook
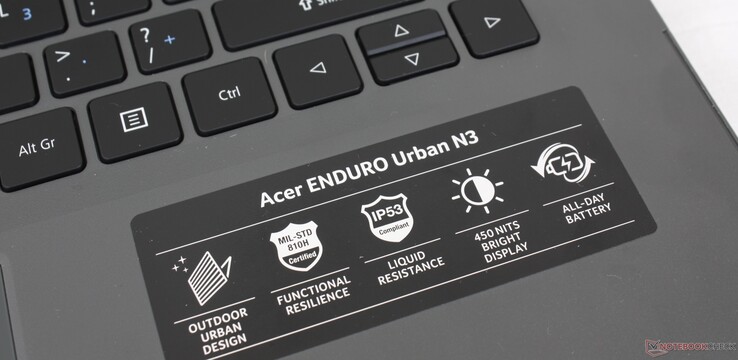
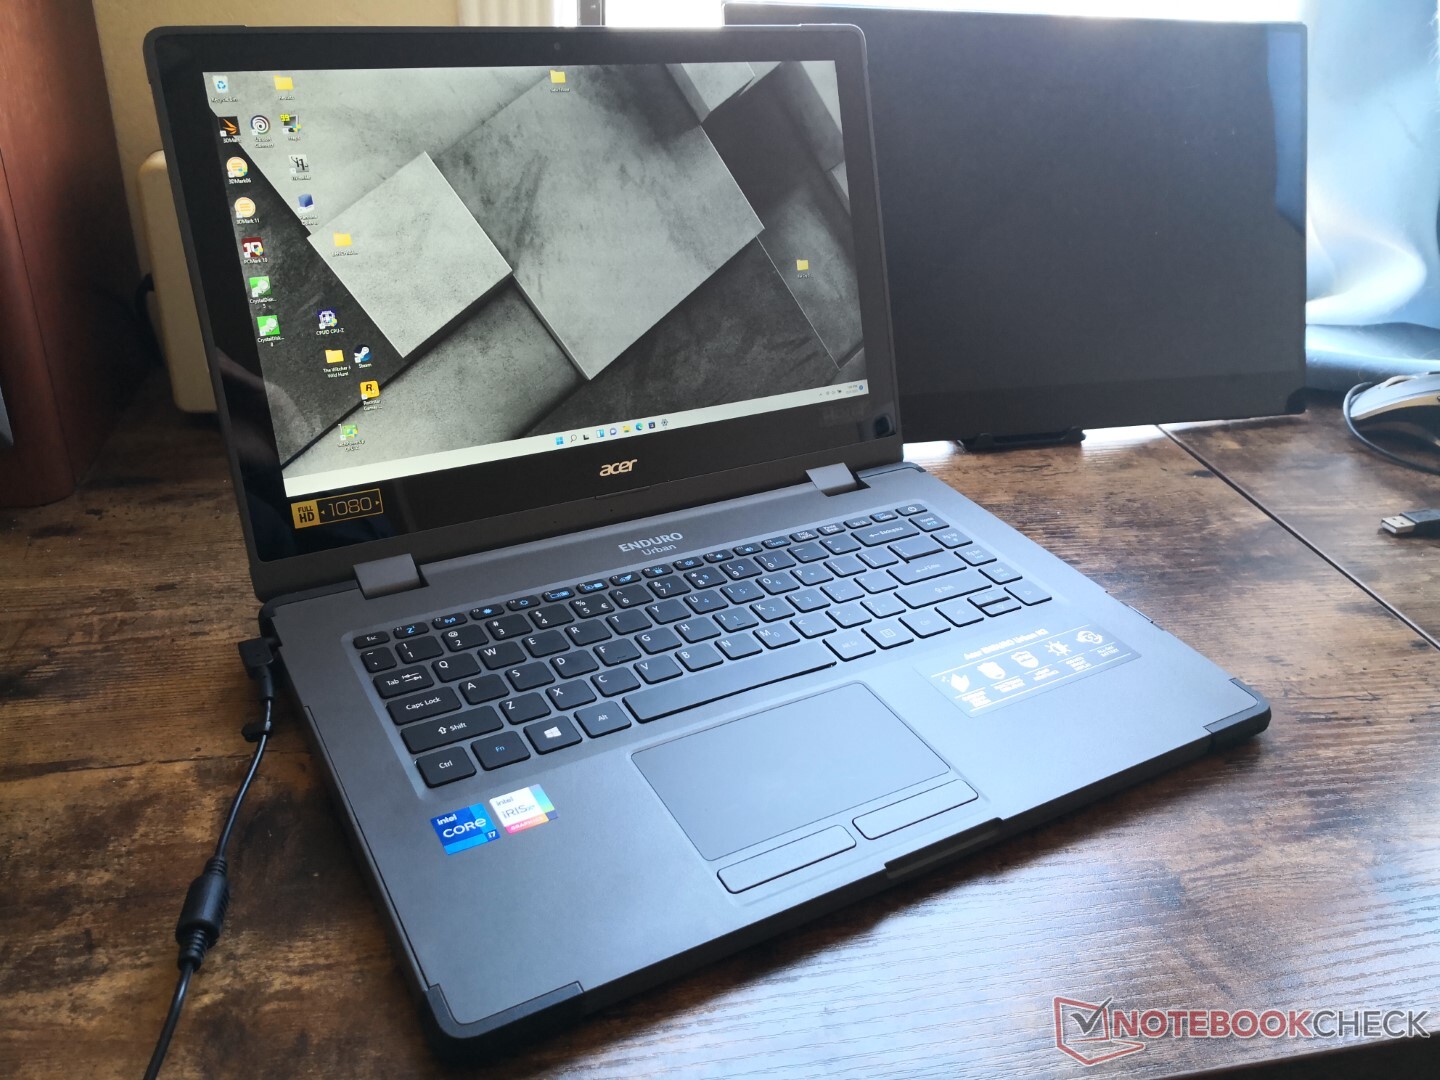
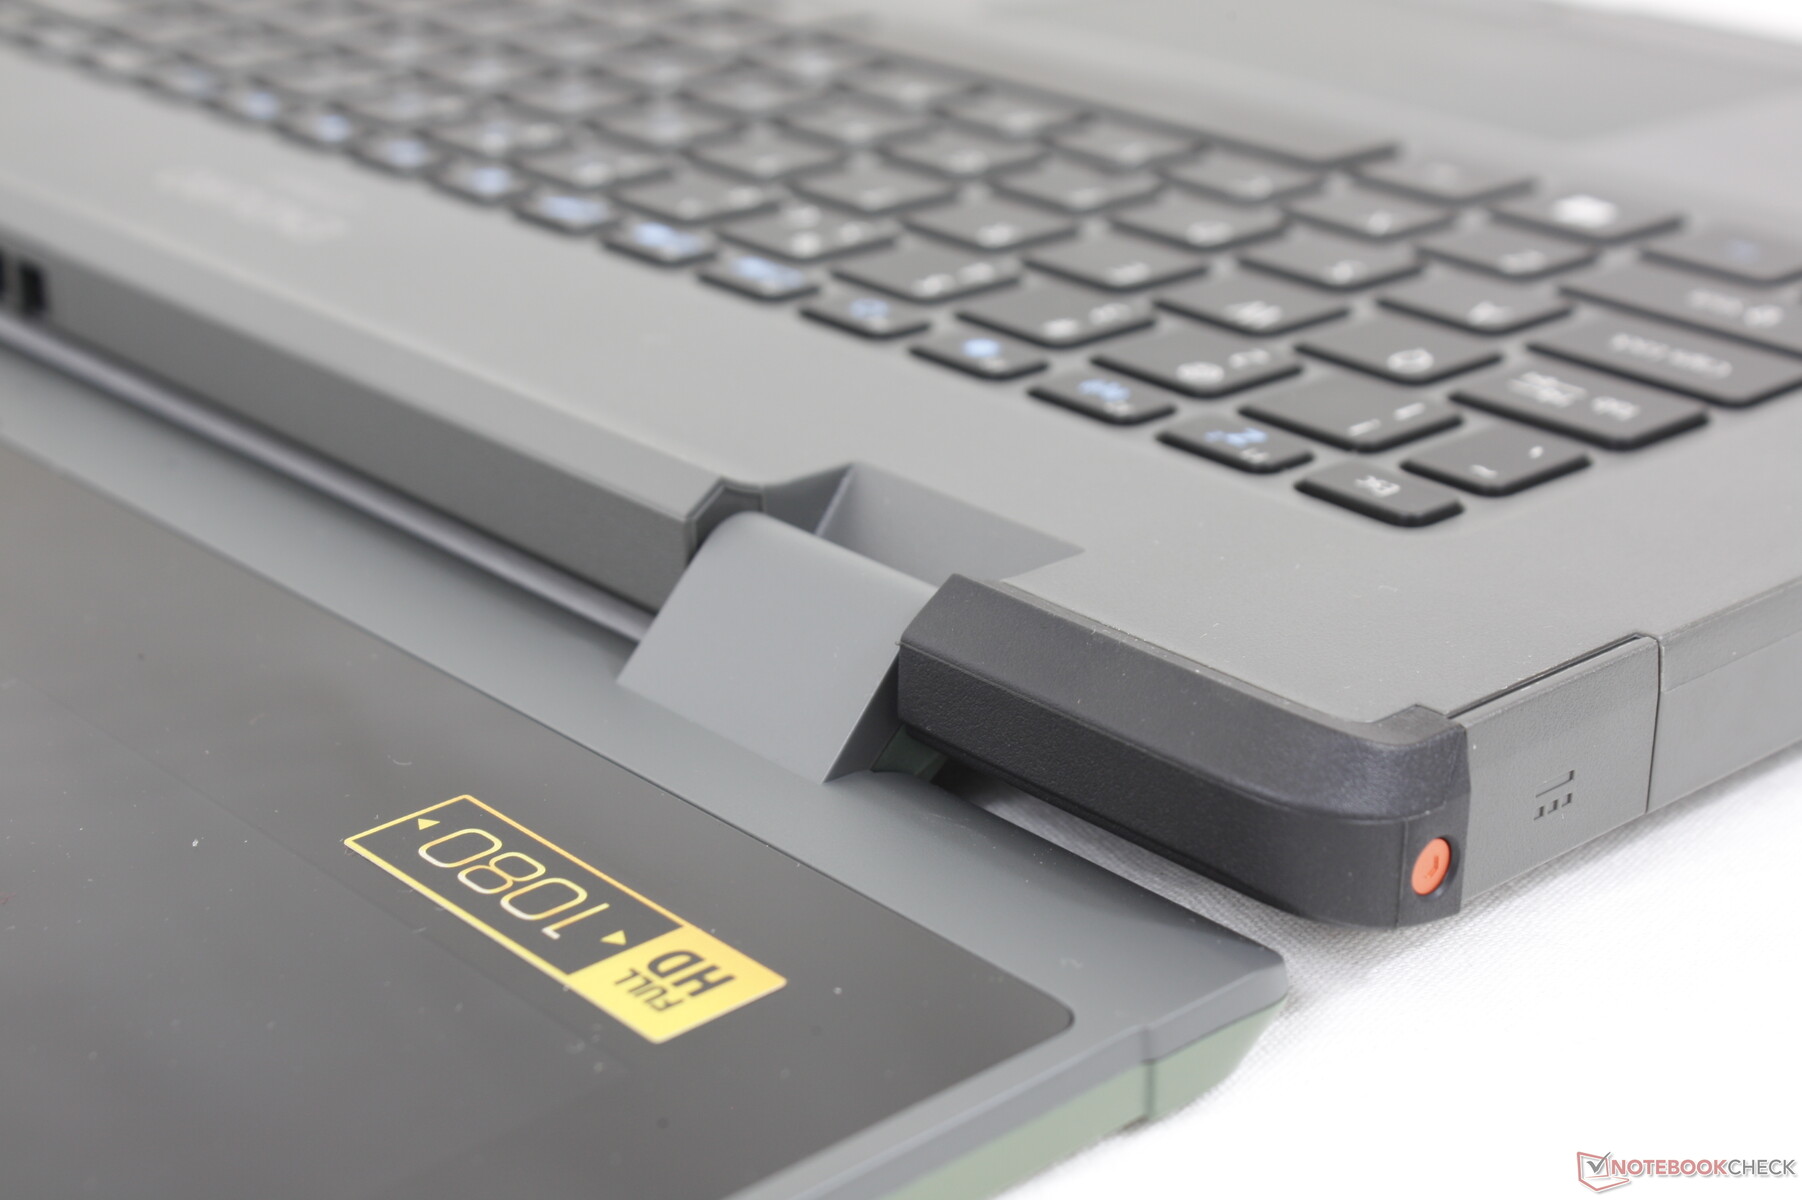
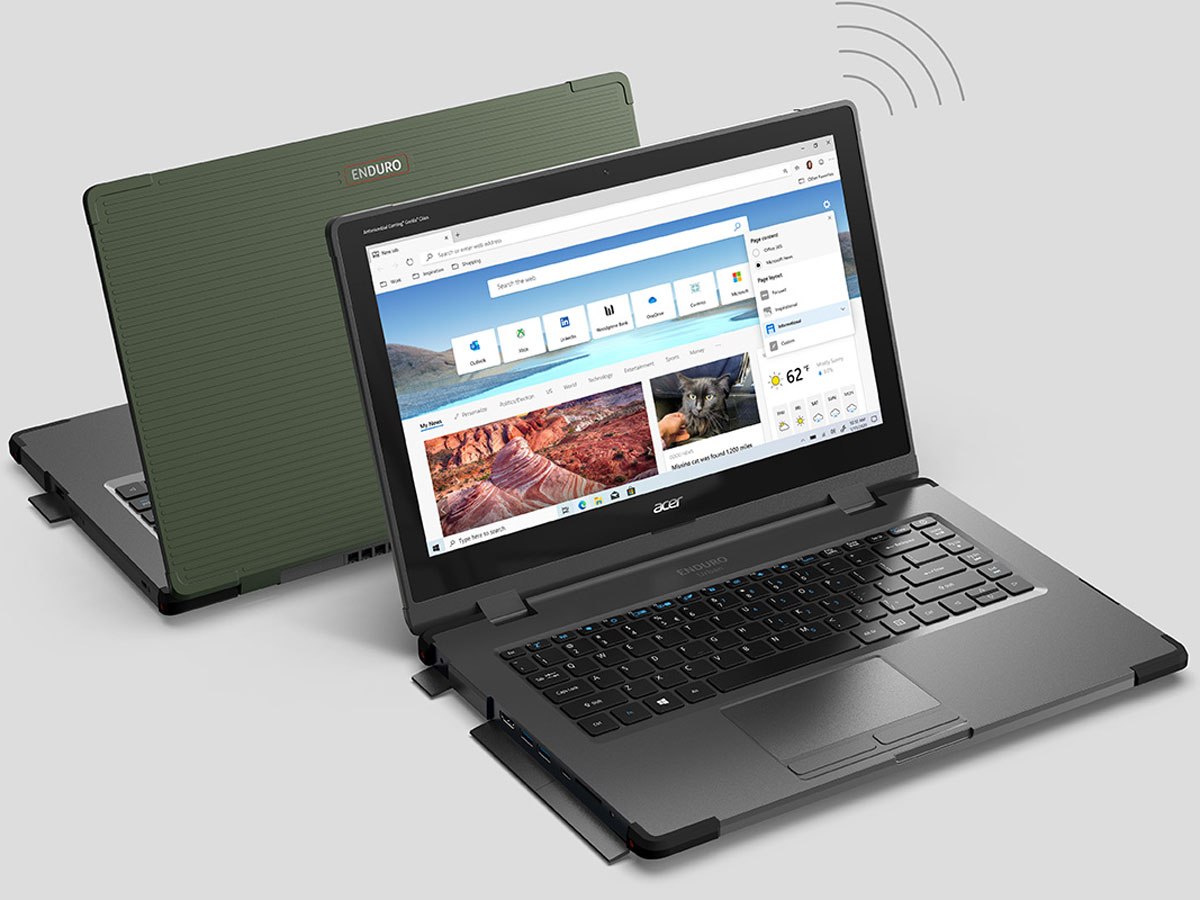
If a rugged or semi-rugged laptop and an Ultrabook had a baby, then it would probably look a lot like the Acer Enduro Urban N3. This 14-inch laptop integrates some common features of rugged laptops including shock absorbent bumpers and water-resistant I/O ports while retaining the portability of a traditional Ultrabook.
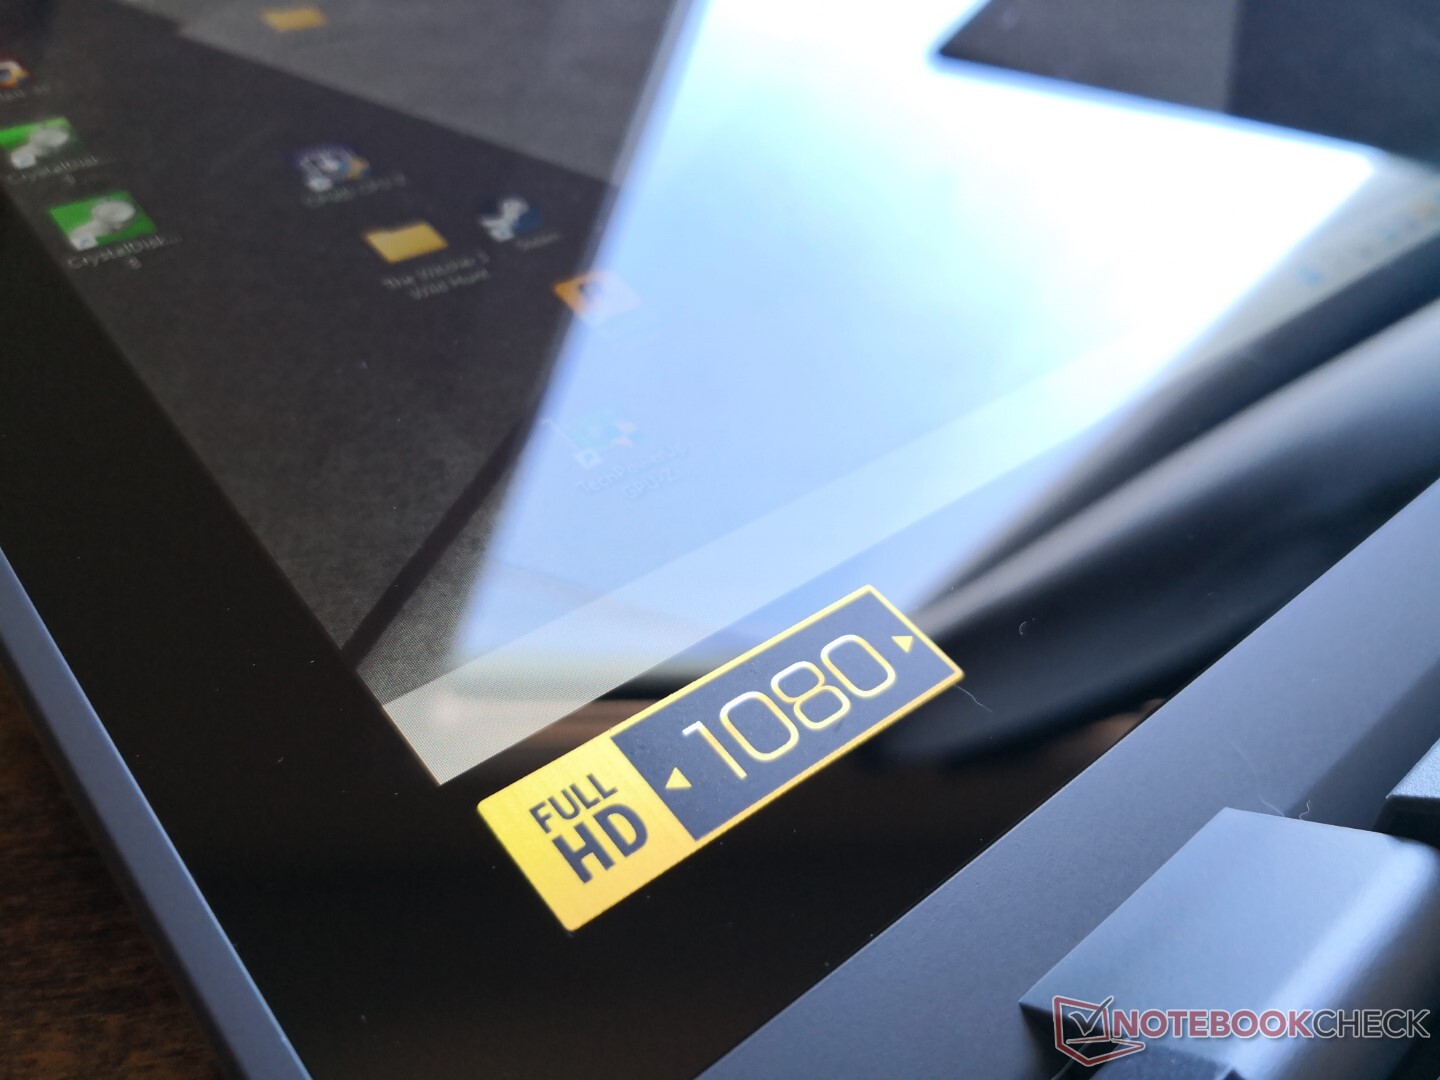
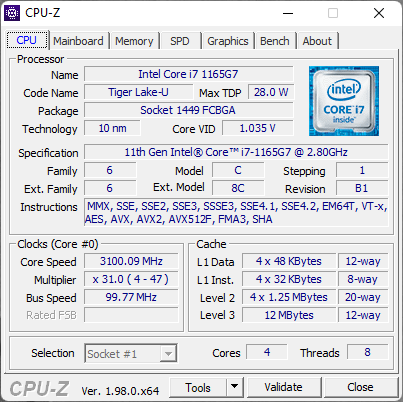
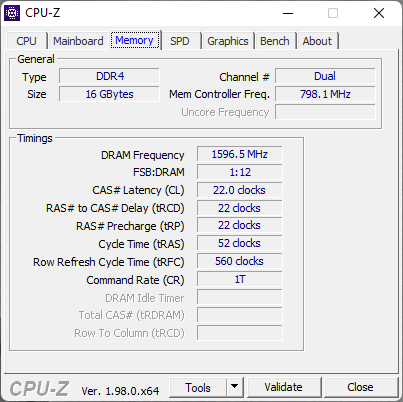
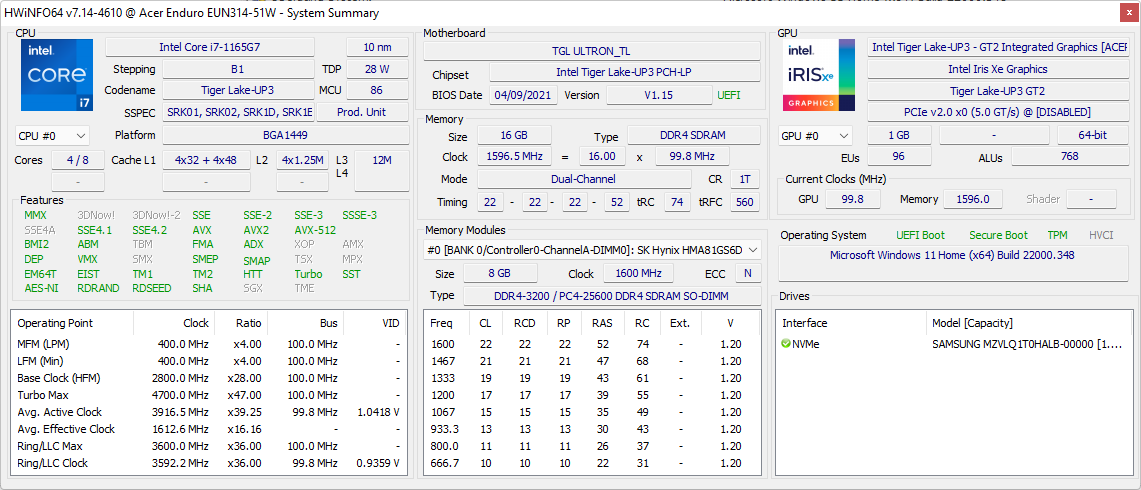
Our configuration in review includes the 11th gen Core i7-1165G7 CPU, 16 GB RAM, and 1 TB NVMe SSD for about $999 USD which is much cheaper than many rugged or semi-rugged systems. Other SKUs are available with the older 10th gen Core i5-10210U CPU or discrete GeForce MX230 graphics, but all options include the same 1080p display.
More Acer reviews:
Potential Competitors in Comparison
Rating | Date | Model | Weight | Height | Size | Resolution | Price |
|---|---|---|---|---|---|---|---|
| 82.4 % v7 (old) | 12 / 2021 | Acer Enduro Urban N3 EUN314 i7-1165G7, Iris Xe G7 96EUs | 1.8 kg | 21.95 mm | 14.00" | 1920x1080 | |
| 89.2 % v6 (old) | 03 / 2019 | Dell Latitude 5420 Rugged-P85G i7-8650U, Radeon RX 540 | 2.8 kg | 32.9 mm | 14.00" | 1920x1080 | |
| 83.9 % v7 (old) | 09 / 2021 | Panasonic Toughbook FZ-55 MK2 i7-1185G7, Iris Xe G7 96EUs | 2.3 kg | 33 mm | 14.00" | 1920x1080 | |
v (old) | 04 / 2021 | Durabook S14I i7-1165G7, Iris Xe G7 96EUs | 3 kg | 38.1 mm | 14.00" | 1920x1080 | |
| 81.9 % v6 (old) | 10 / 2018 | Getac S410 i5-8550U, UHD Graphics 620 | 3.2 kg | 34.9 mm | 14.00" | 1366x768 |
Case
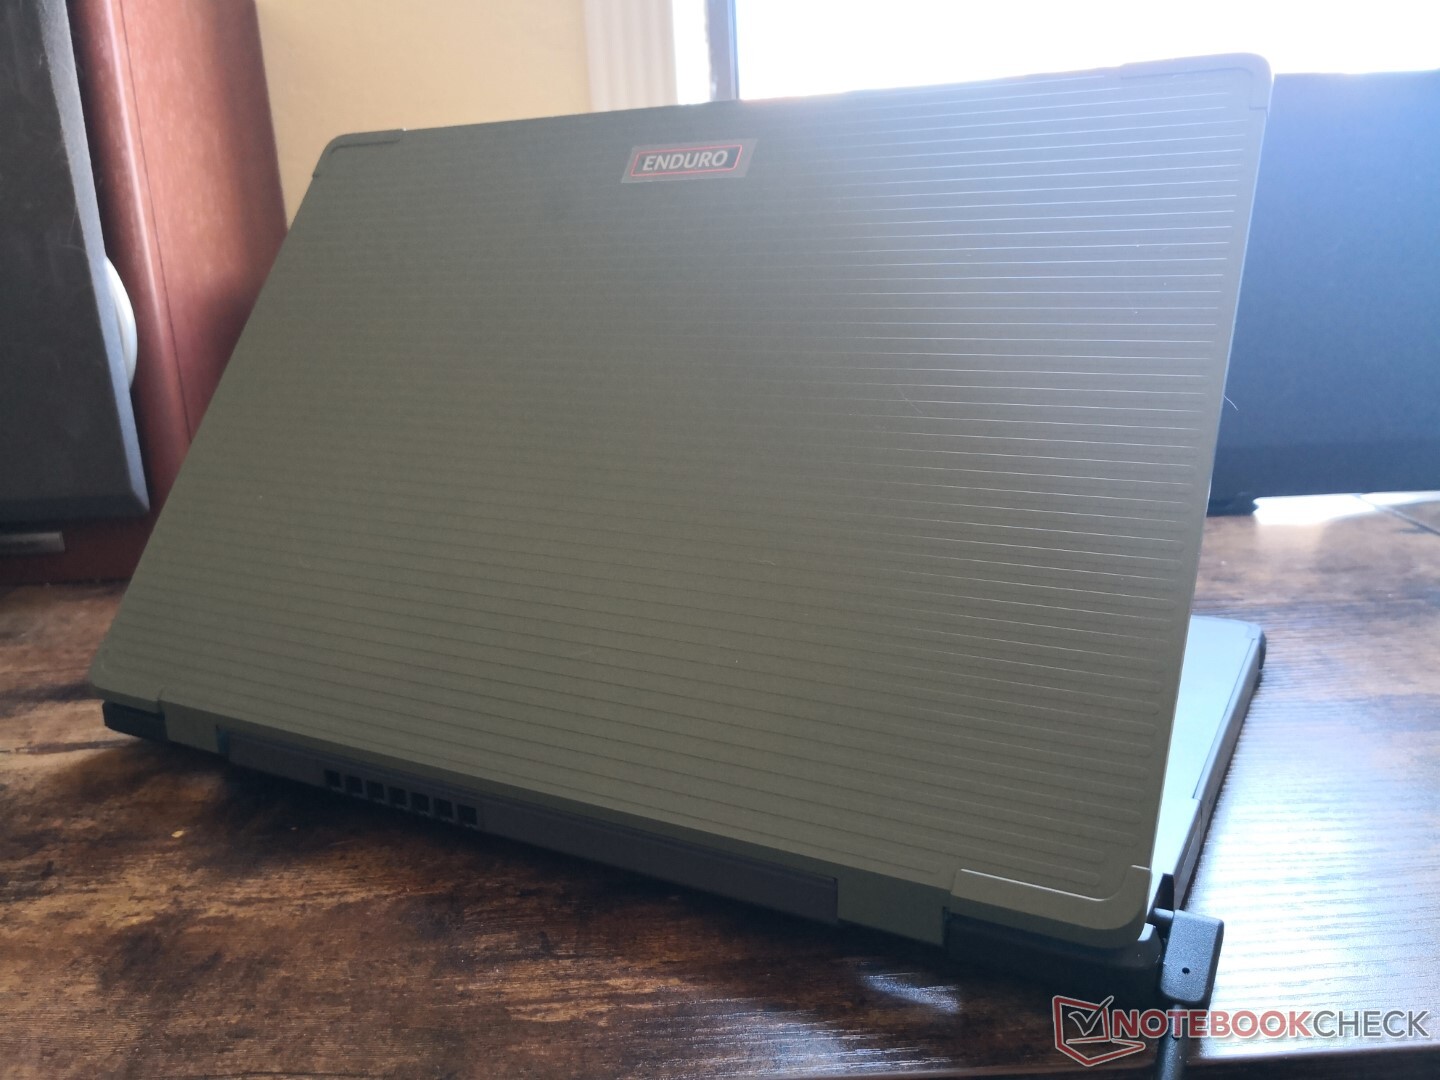
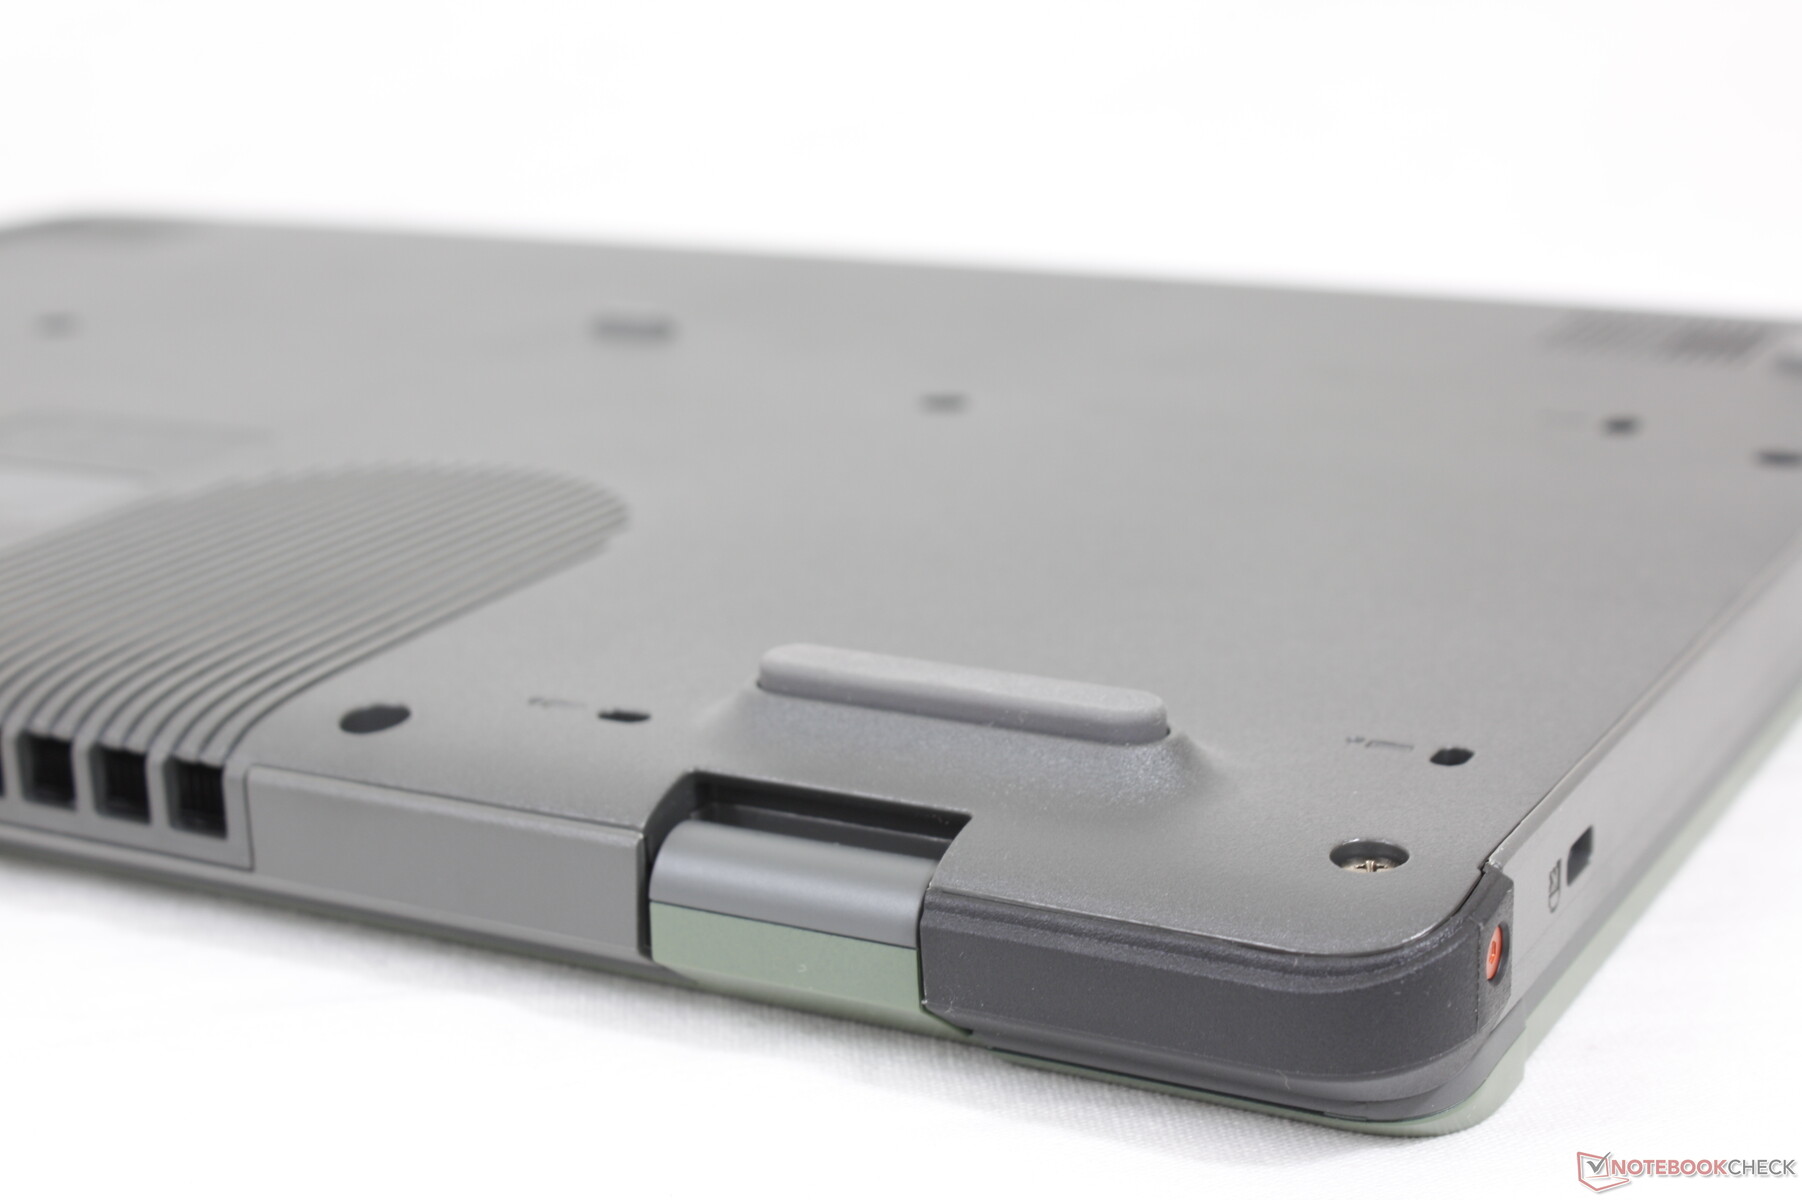
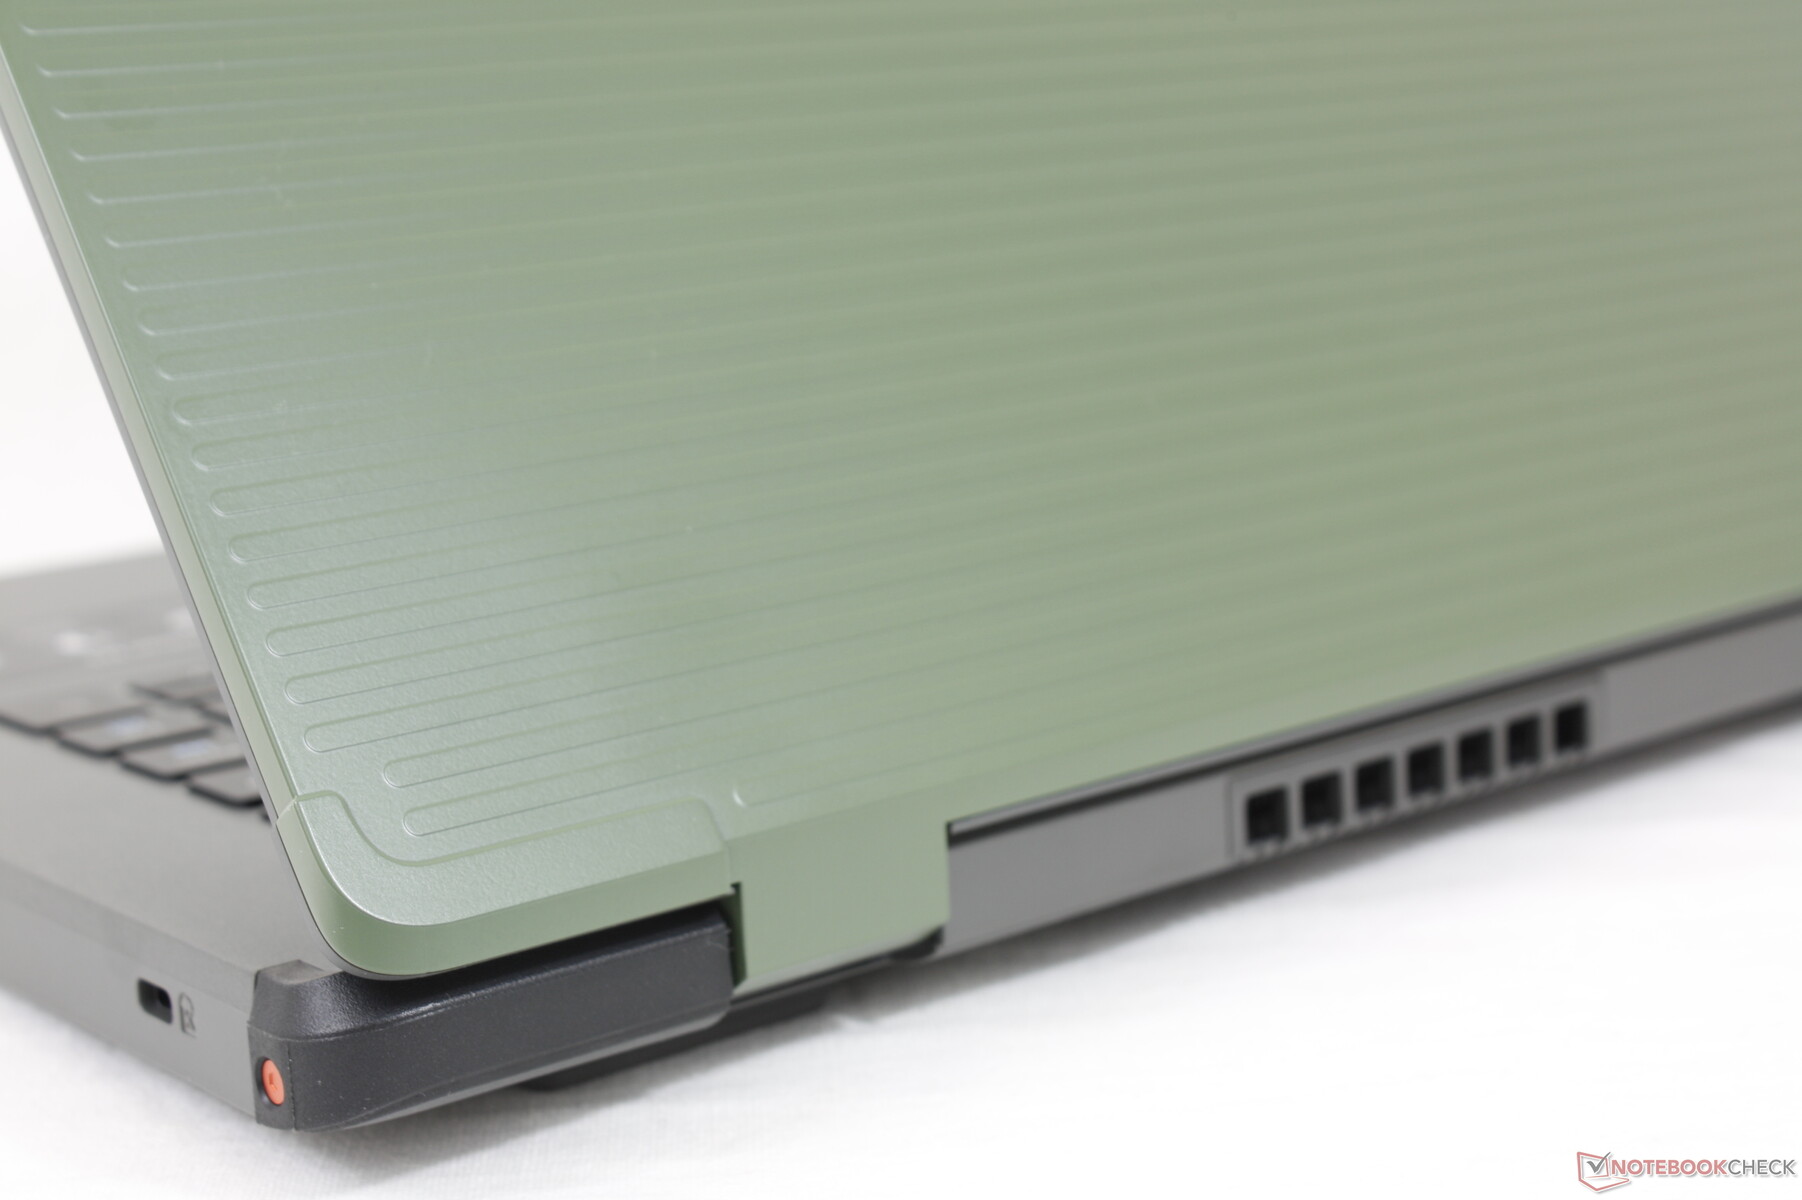
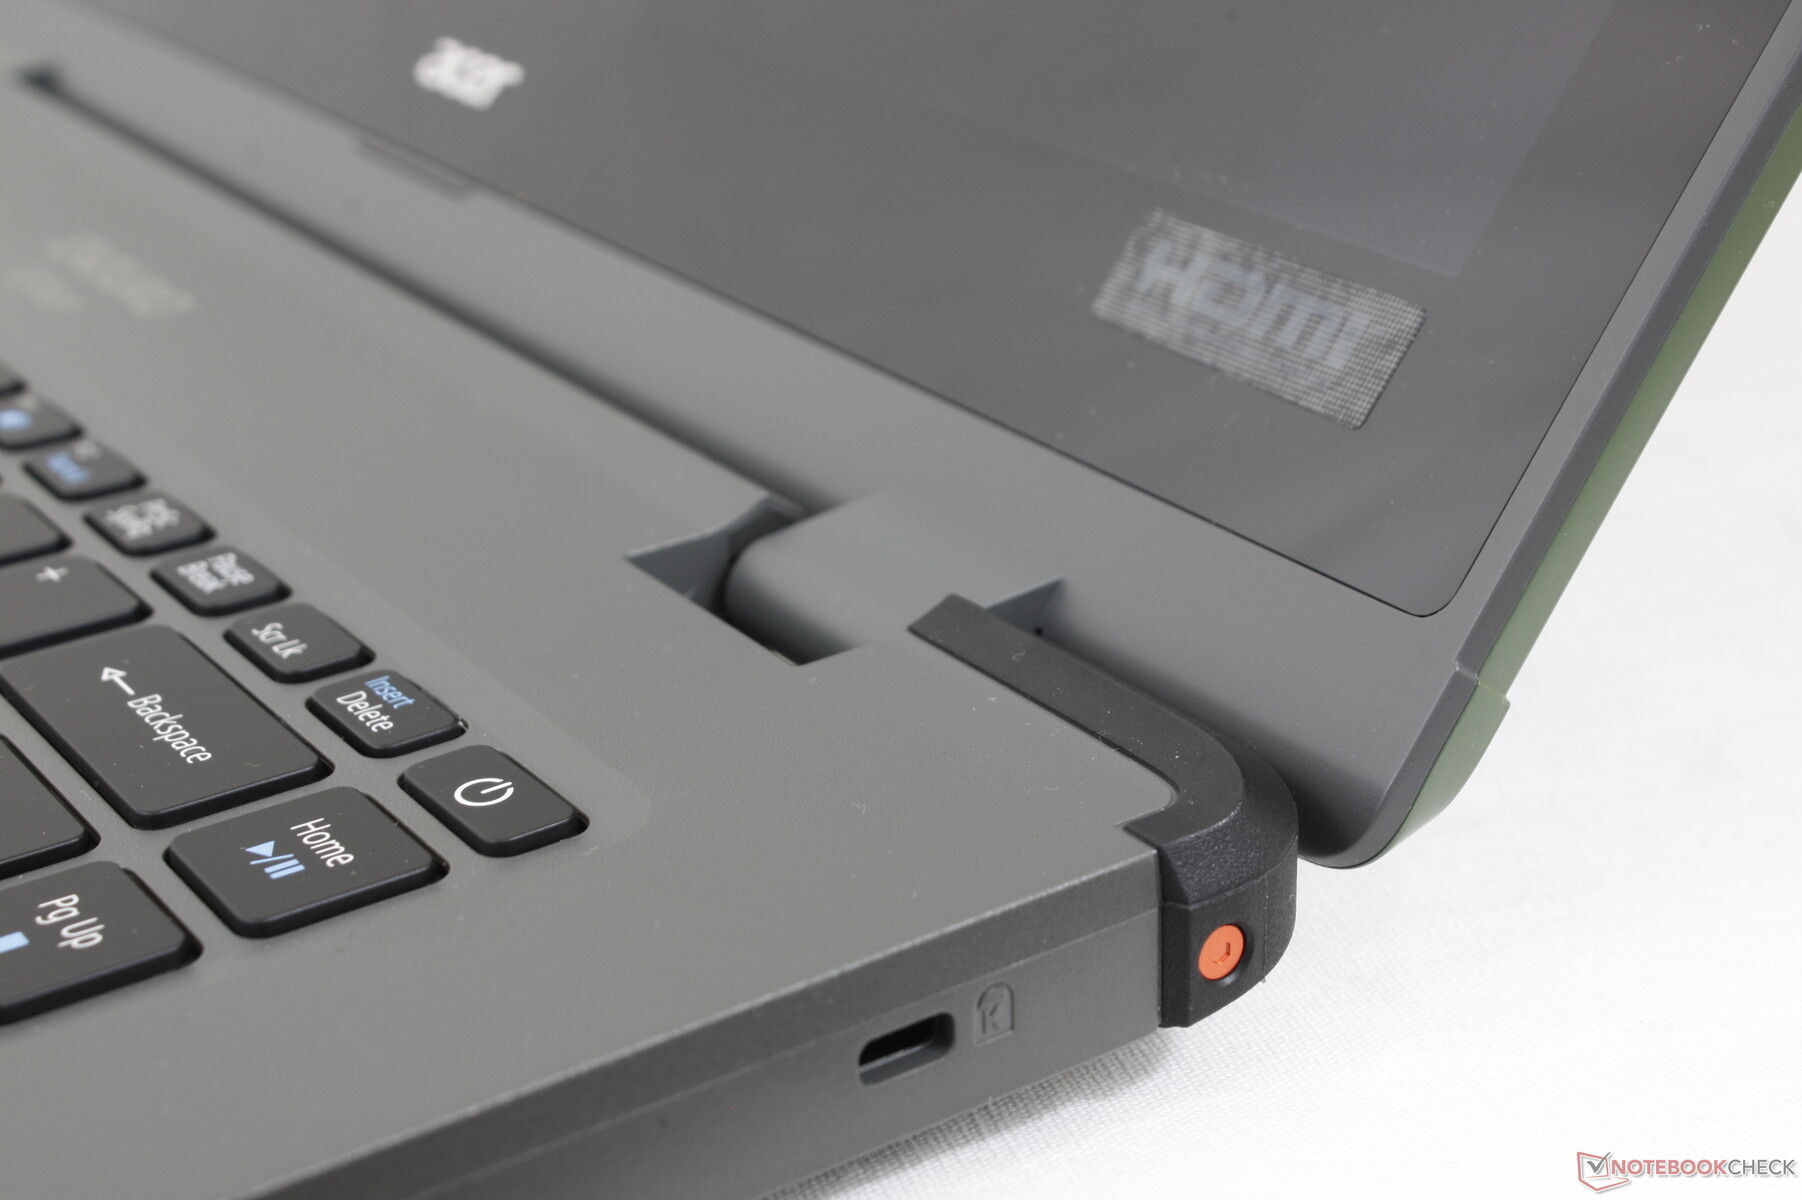
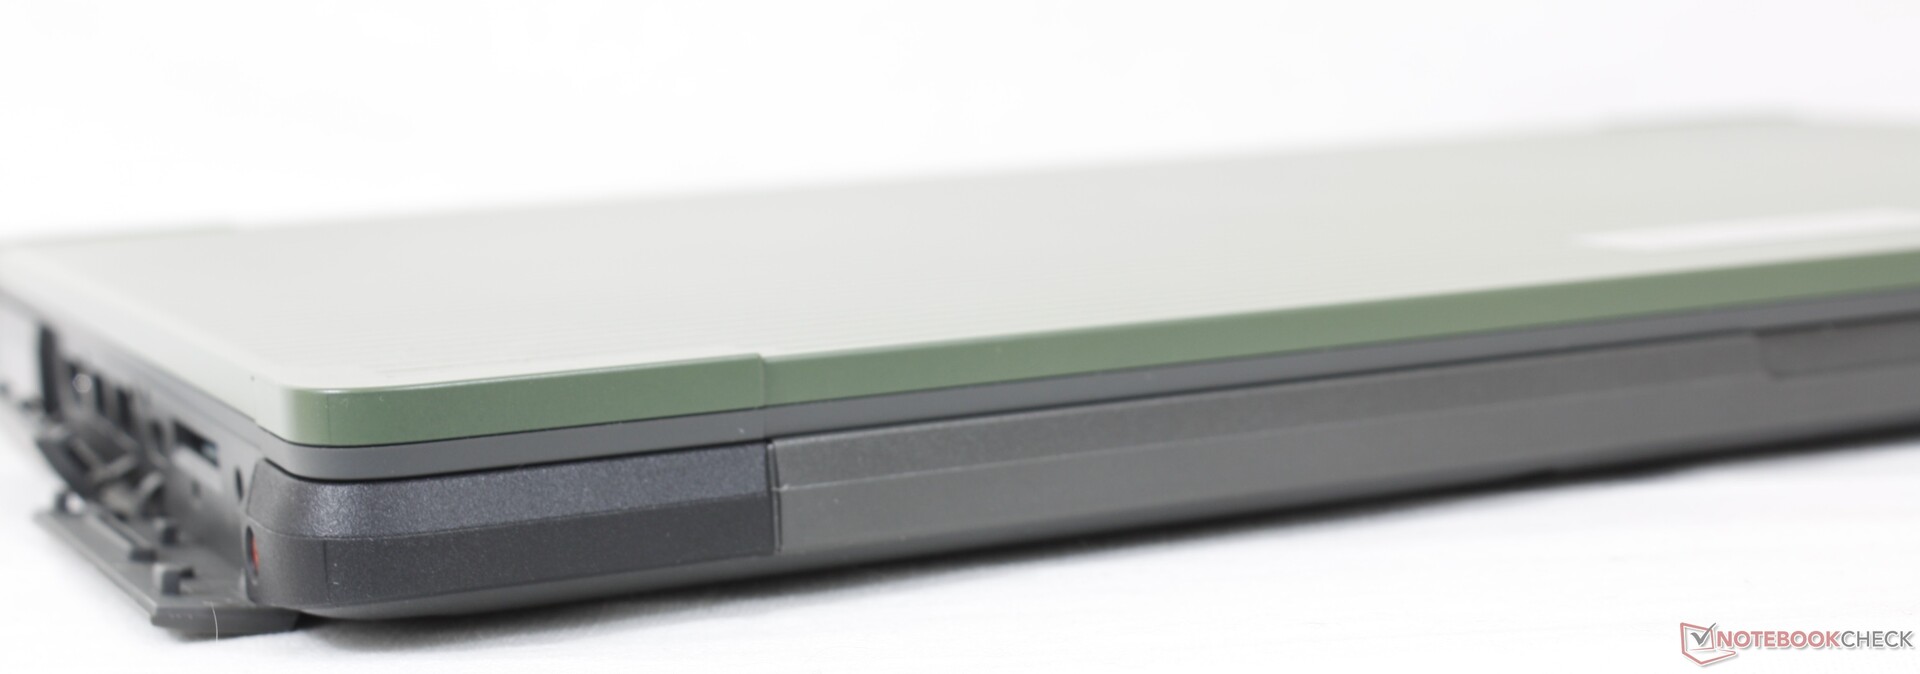
The most notable features of the Urban N3 are its portability and small size relative to other 14-inch rugged devices. At just 1.8 kg, the Acer system is several hundred grams lighter than the Getac S410 or Panasonic Toughbook FZ-55 MK2 to be much closer in size to a typical 15.6-inch consumer laptop. Its thick bezels can be unsightly, but rugged families like the Enduro have always been about function over form.
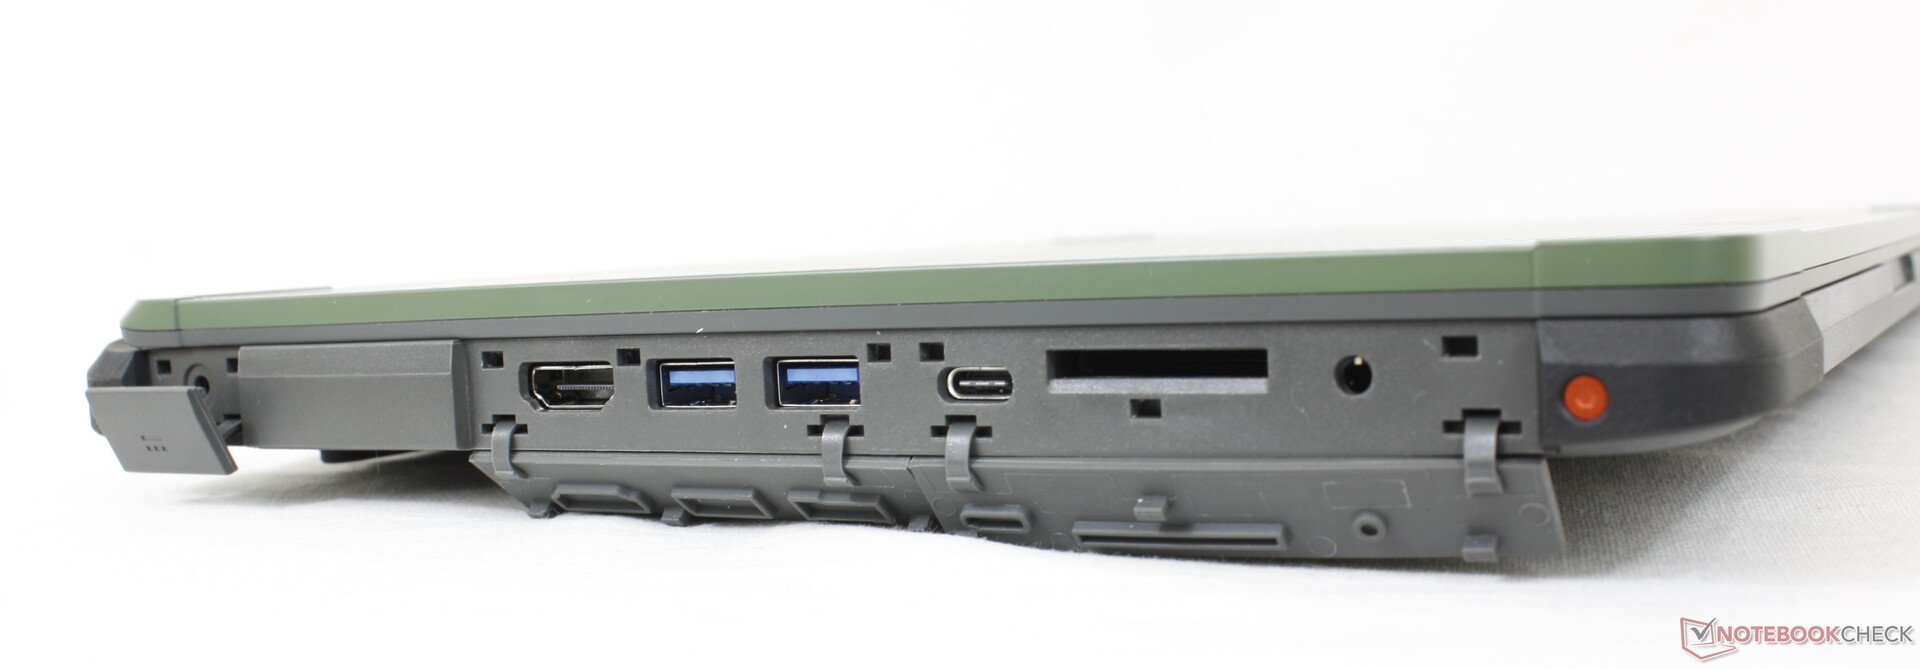
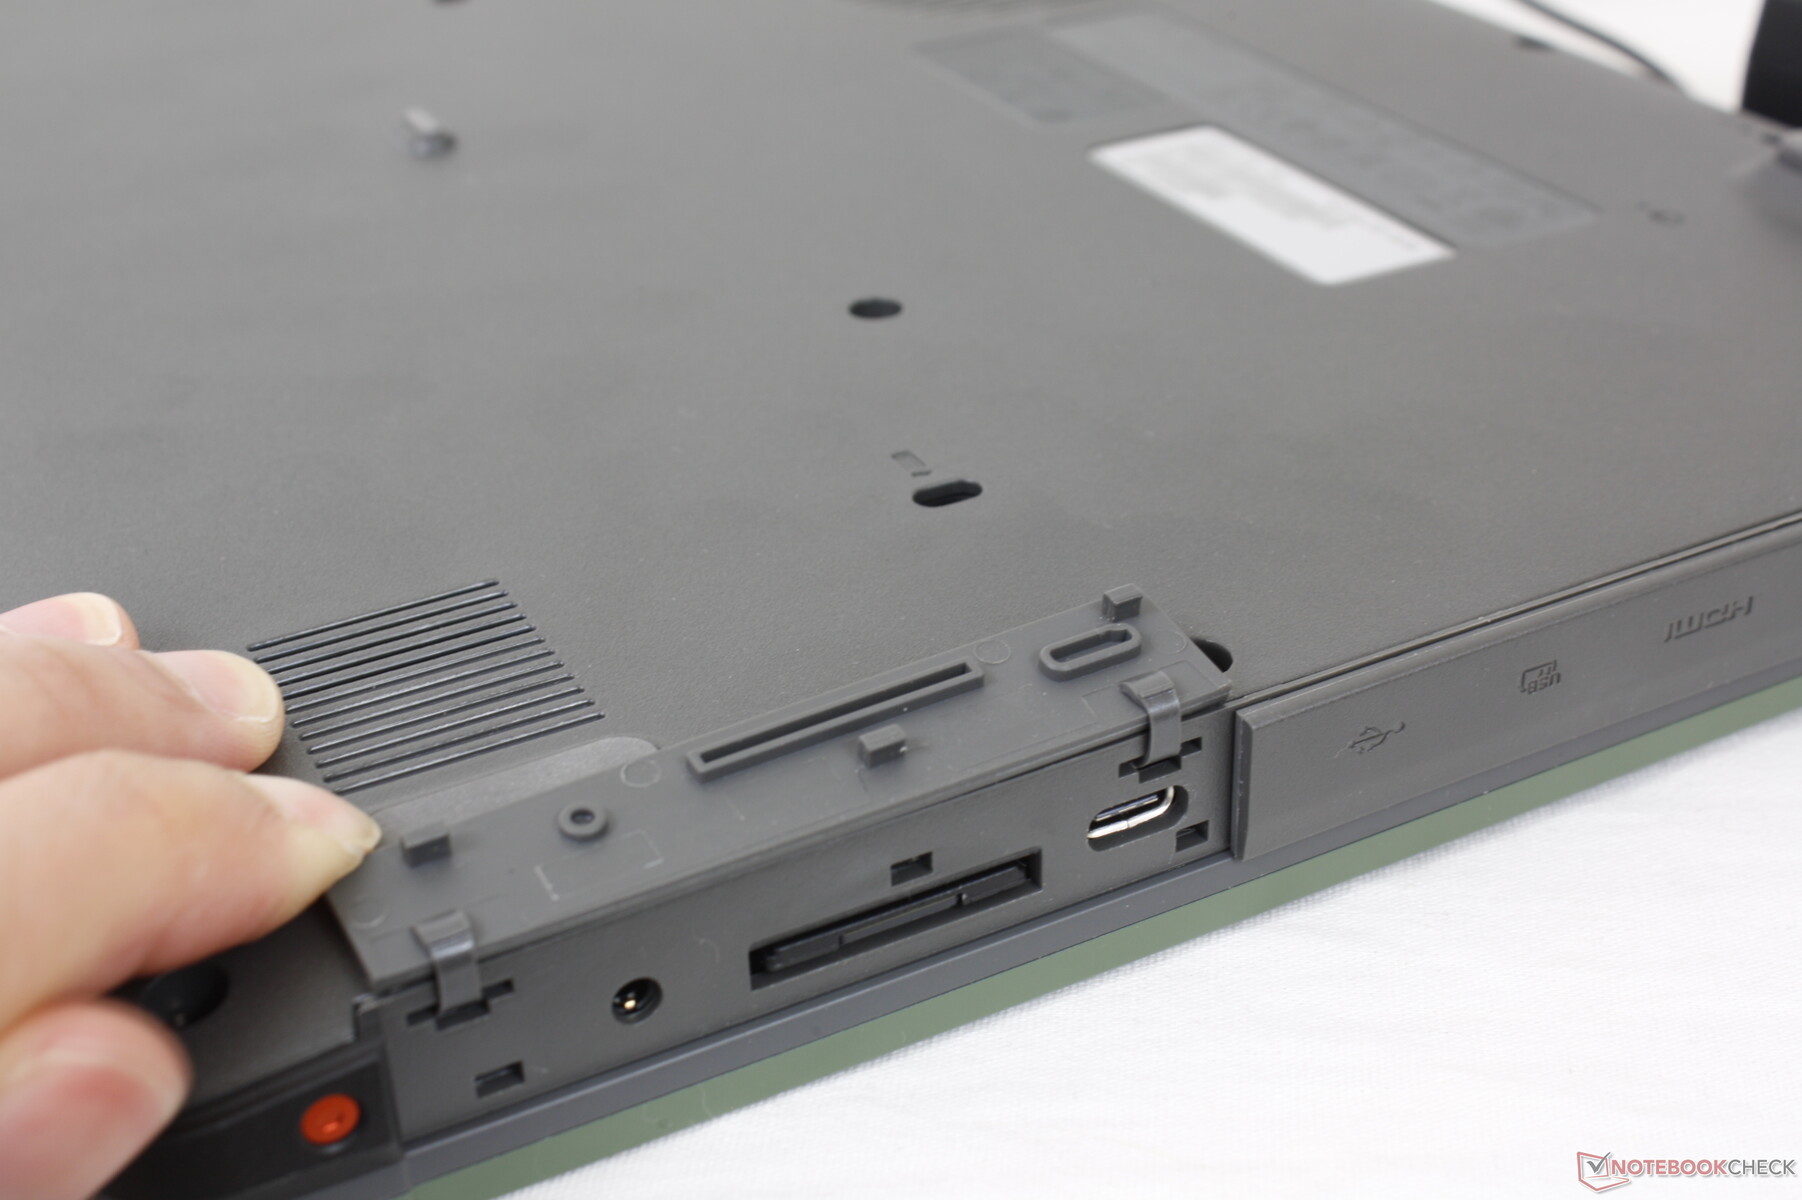
Connectivity
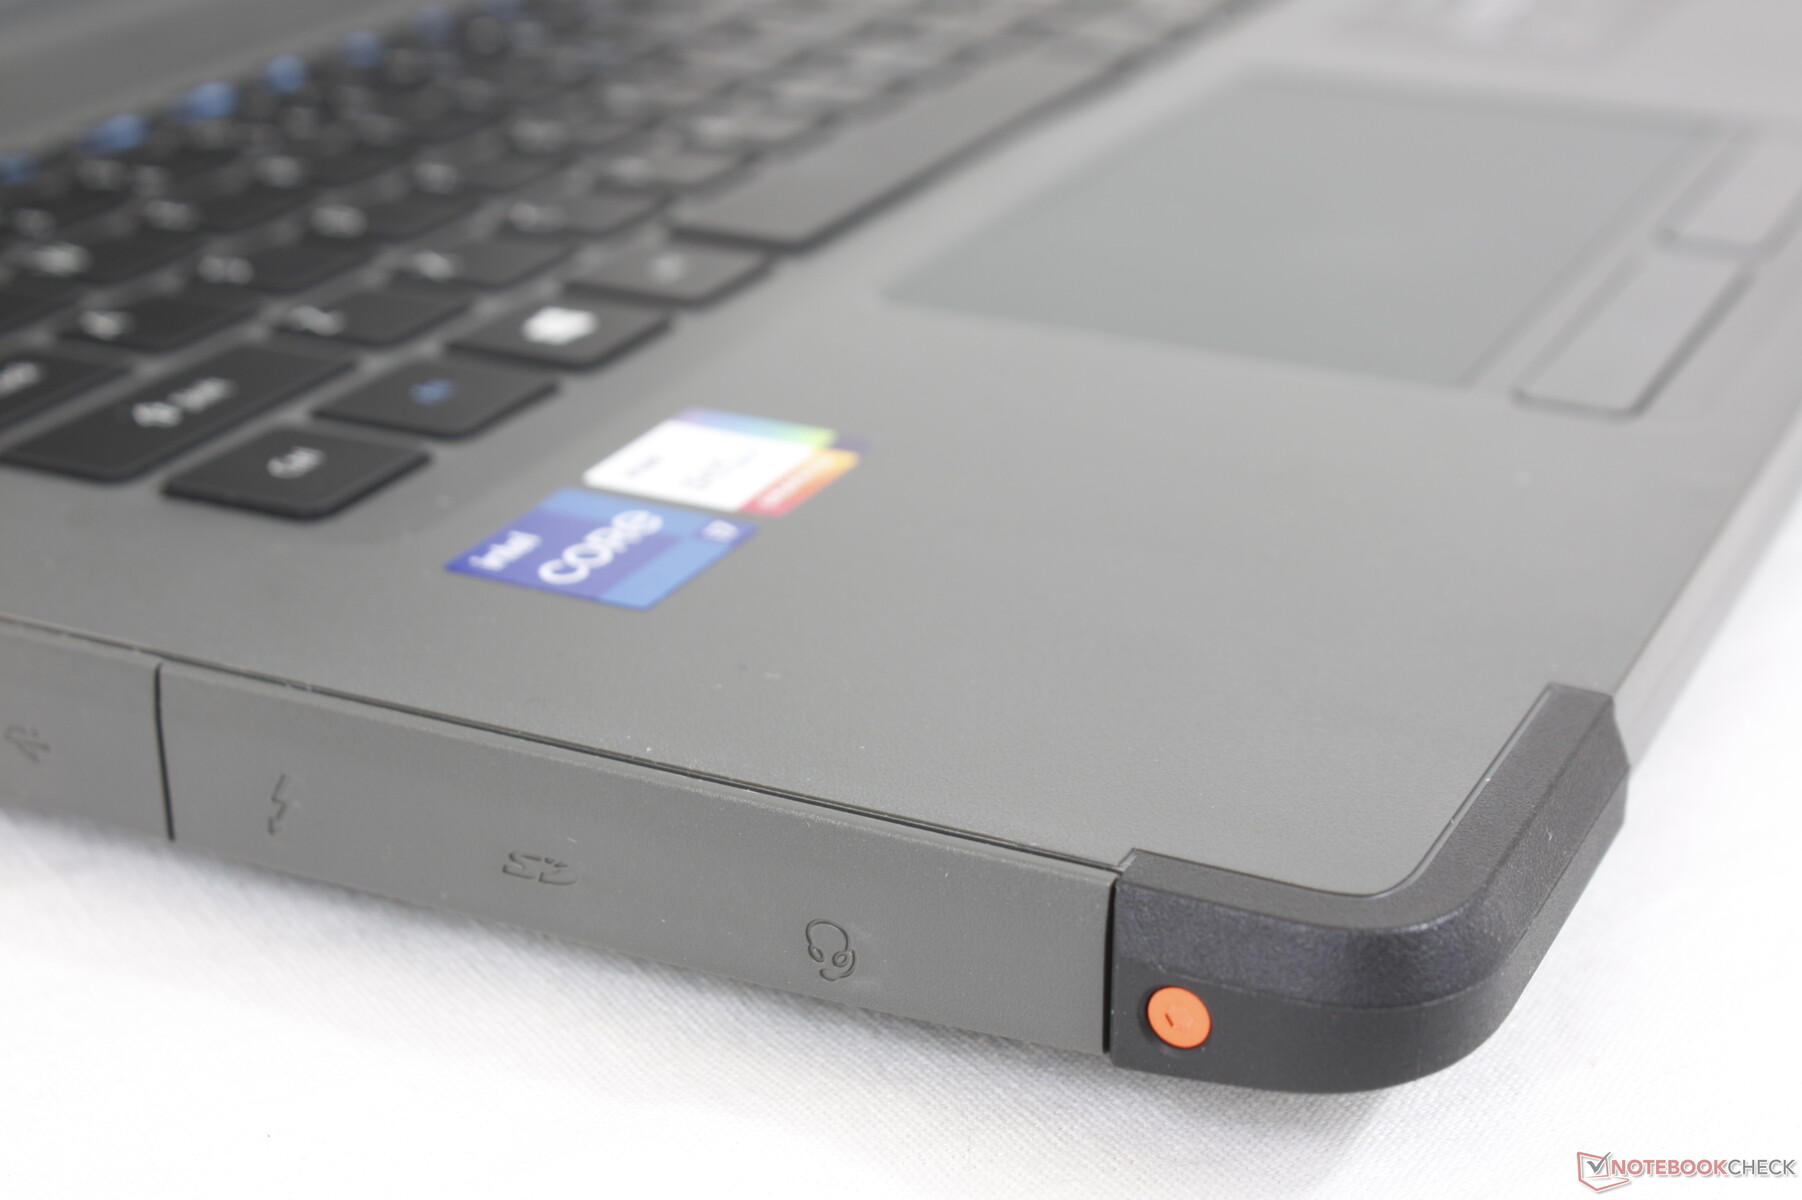
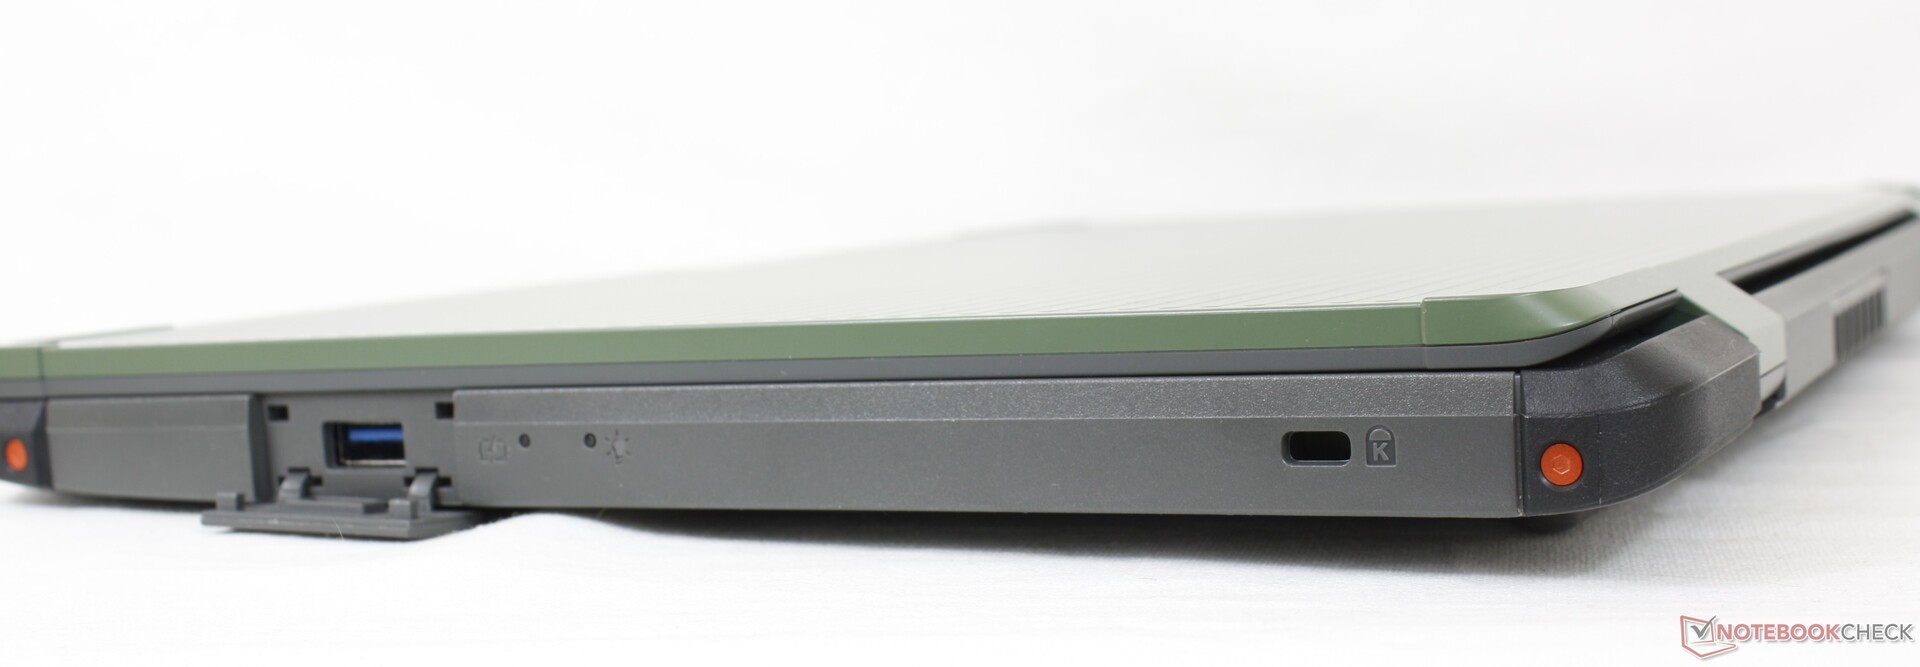
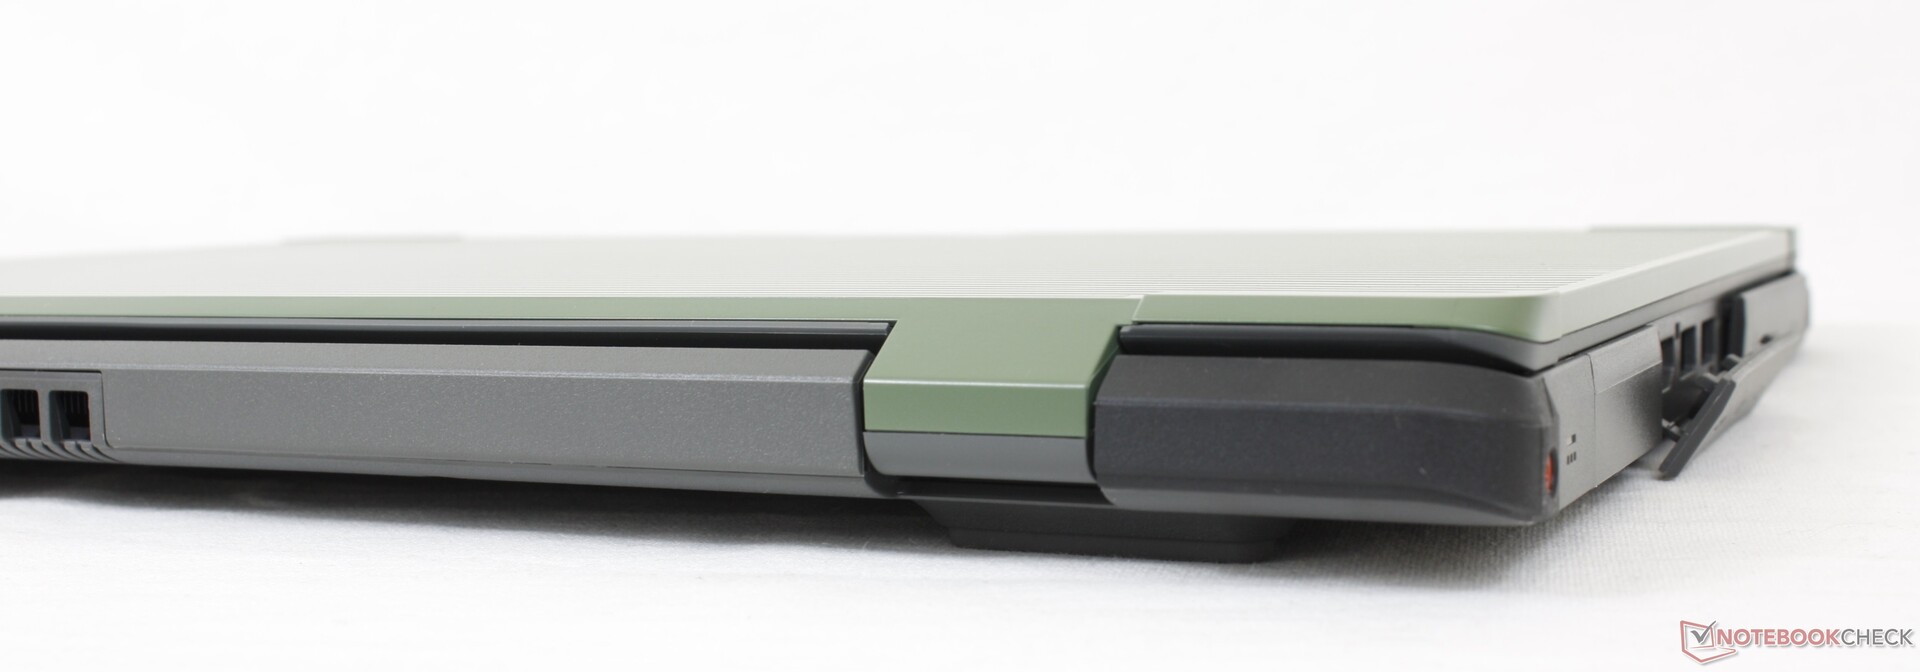
Port options are similar to many Ultrabooks including the all-important Thunderbolt 4 port. Regulars on rugged laptops like Serial RS232, VGA, and RJ-45 are omitted.
SD Card Reader
The integrated SD card reader is slow. Moving 1 GB of pictures from our UHS-II test card to desktop takes about 45 seconds compared to 12 seconds on the Getac S410.
| SD Card Reader | |
| average JPG Copy Test (av. of 3 runs) | |
| Dell Latitude 5420 Rugged-P85G (Toshiba Exceria Pro SDXC 64 GB UHS-II) | |
| Getac S410 (Toshiba Exceria Pro SDXC 64 GB UHS-II) | |
| Panasonic Toughbook FZ-55 MK2 (AV Pro V60) | |
| Acer Enduro Urban N3 EUN314 (AV Pro V60) | |
| Durabook S14I (Angelbird 128GB AV Pro UHS-II) | |
| maximum AS SSD Seq Read Test (1GB) | |
| Dell Latitude 5420 Rugged-P85G (Toshiba Exceria Pro SDXC 64 GB UHS-II) | |
| Panasonic Toughbook FZ-55 MK2 (AV Pro V60) | |
| Getac S410 (Toshiba Exceria Pro SDXC 64 GB UHS-II) | |
| Durabook S14I (Angelbird 128GB AV Pro UHS-II) | |
| Acer Enduro Urban N3 EUN314 (AV Pro V60) | |
Communication
Webcam
The 720p webcam is of poor quality with no privacy shutter or IR camera.


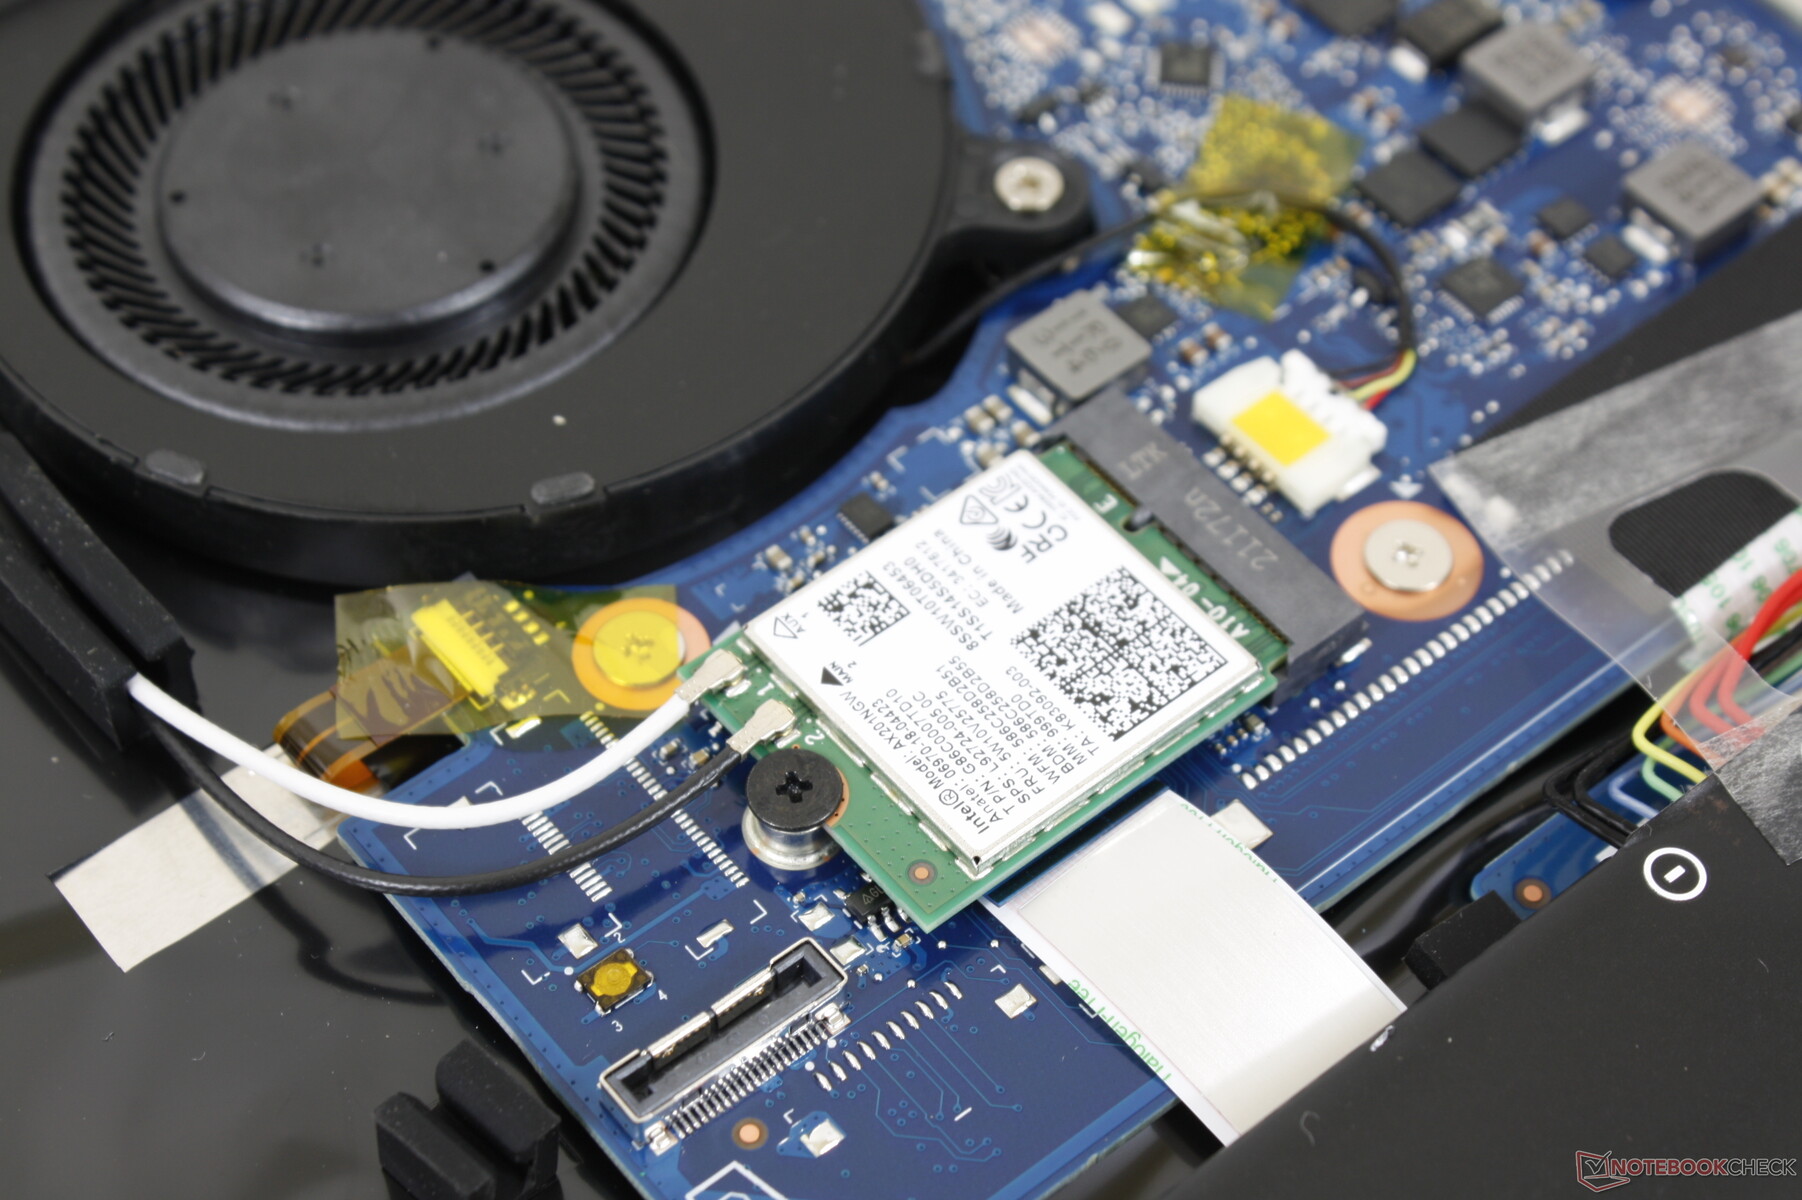
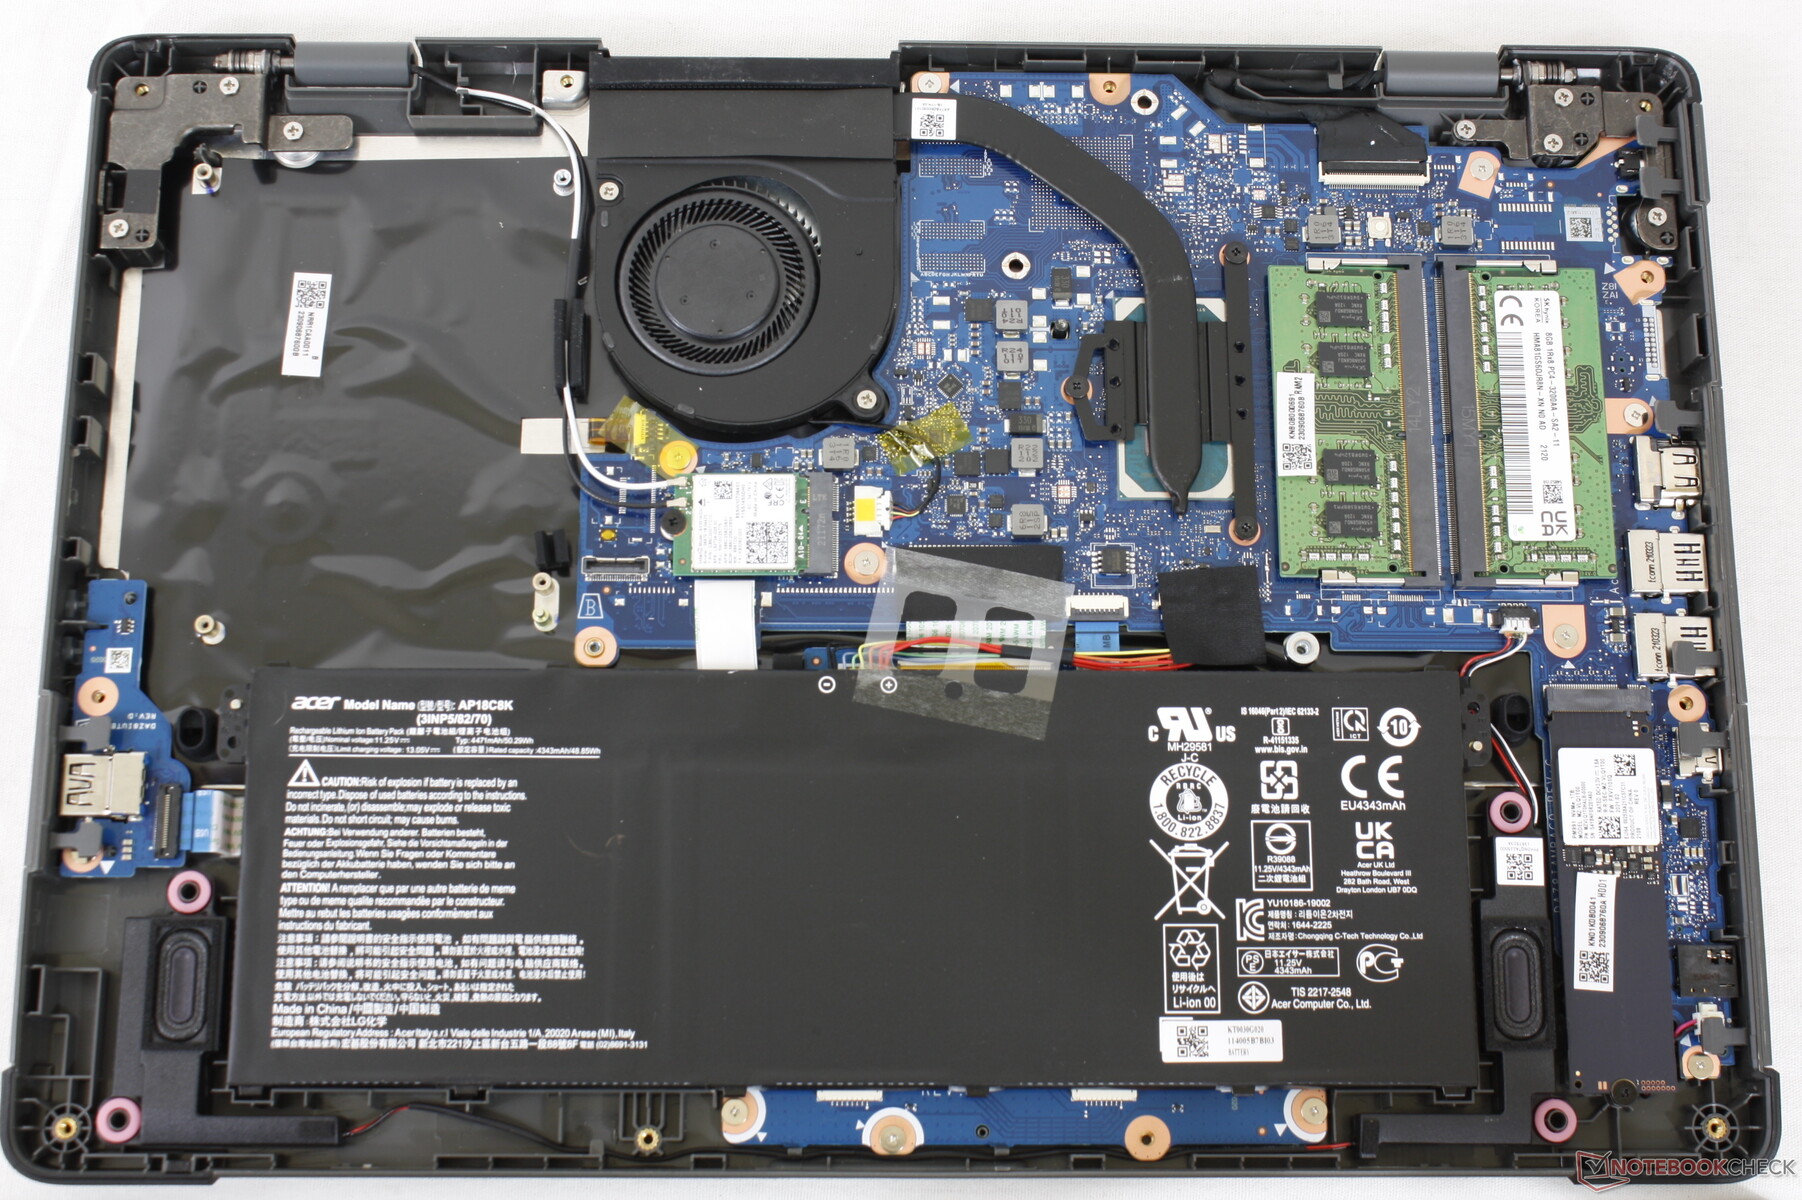
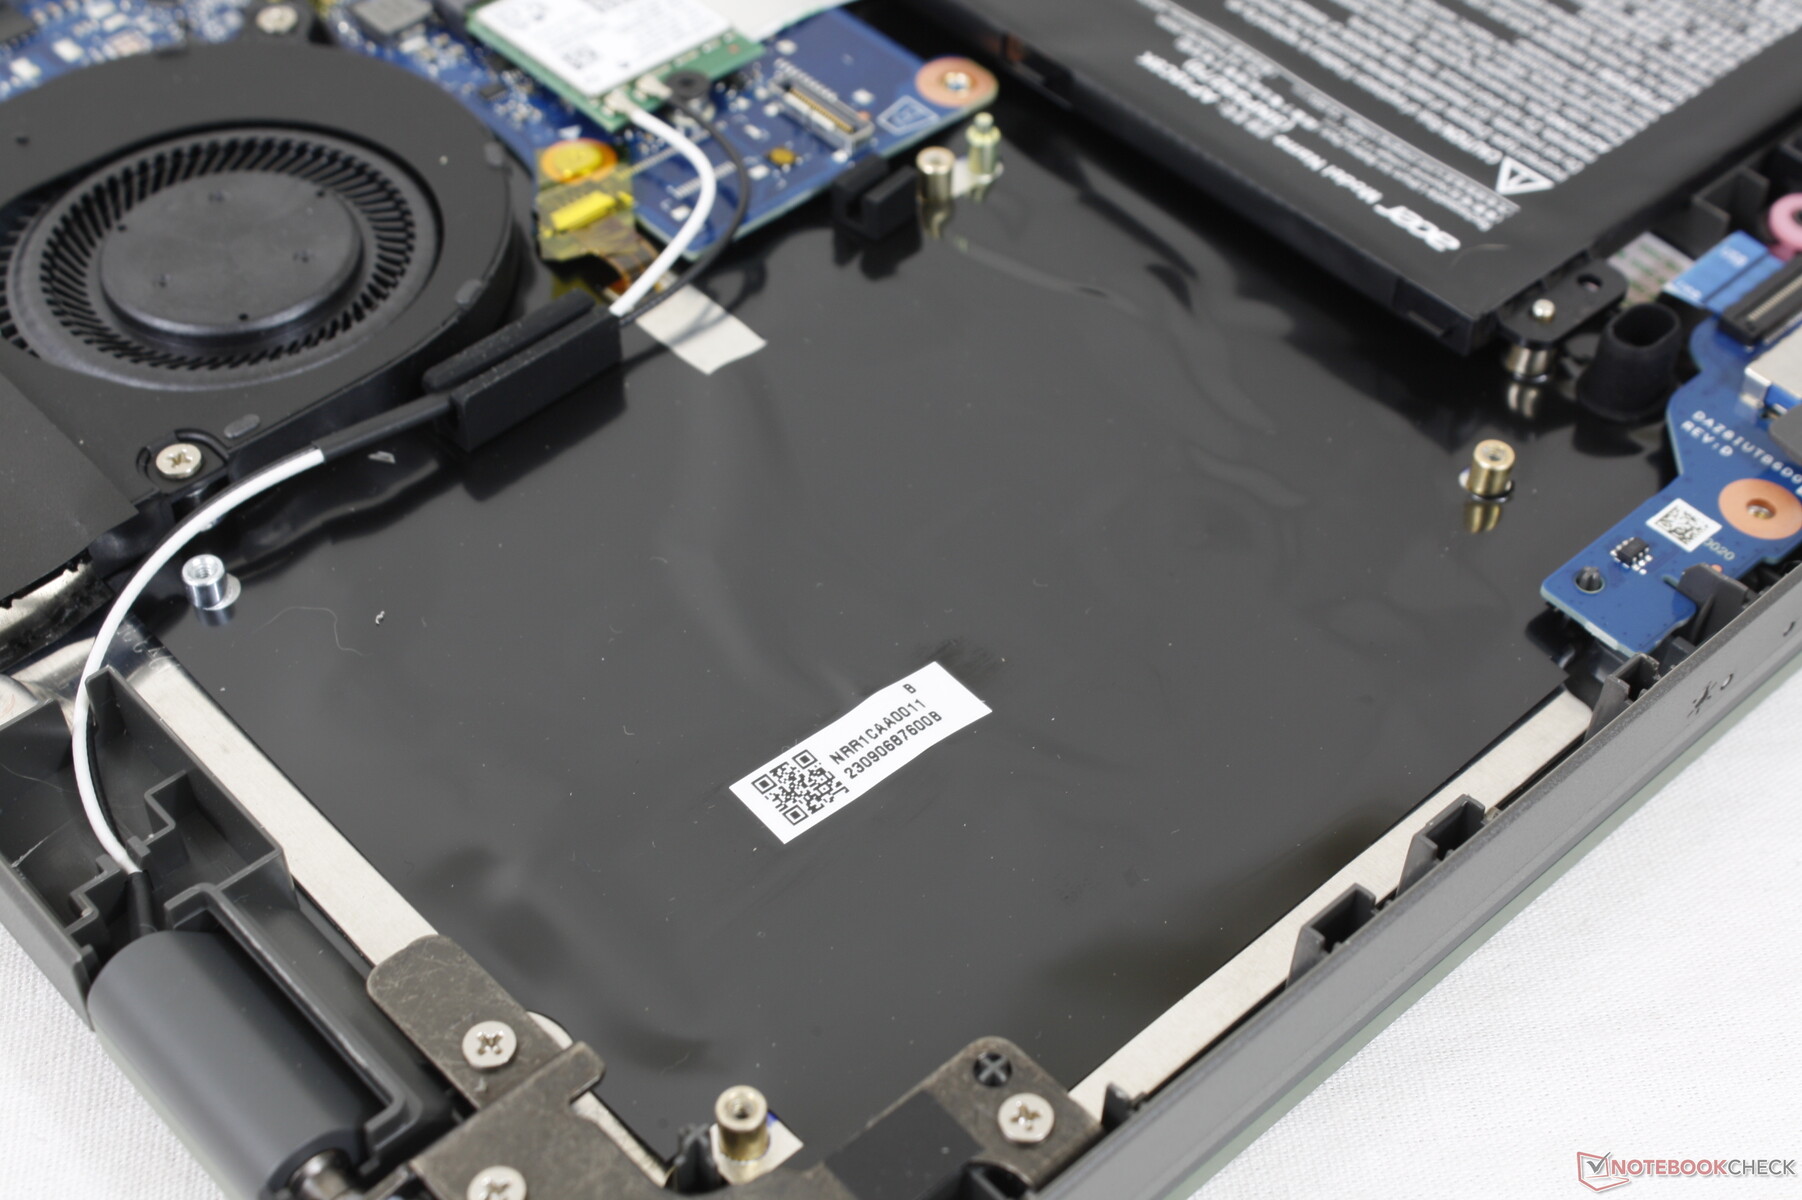
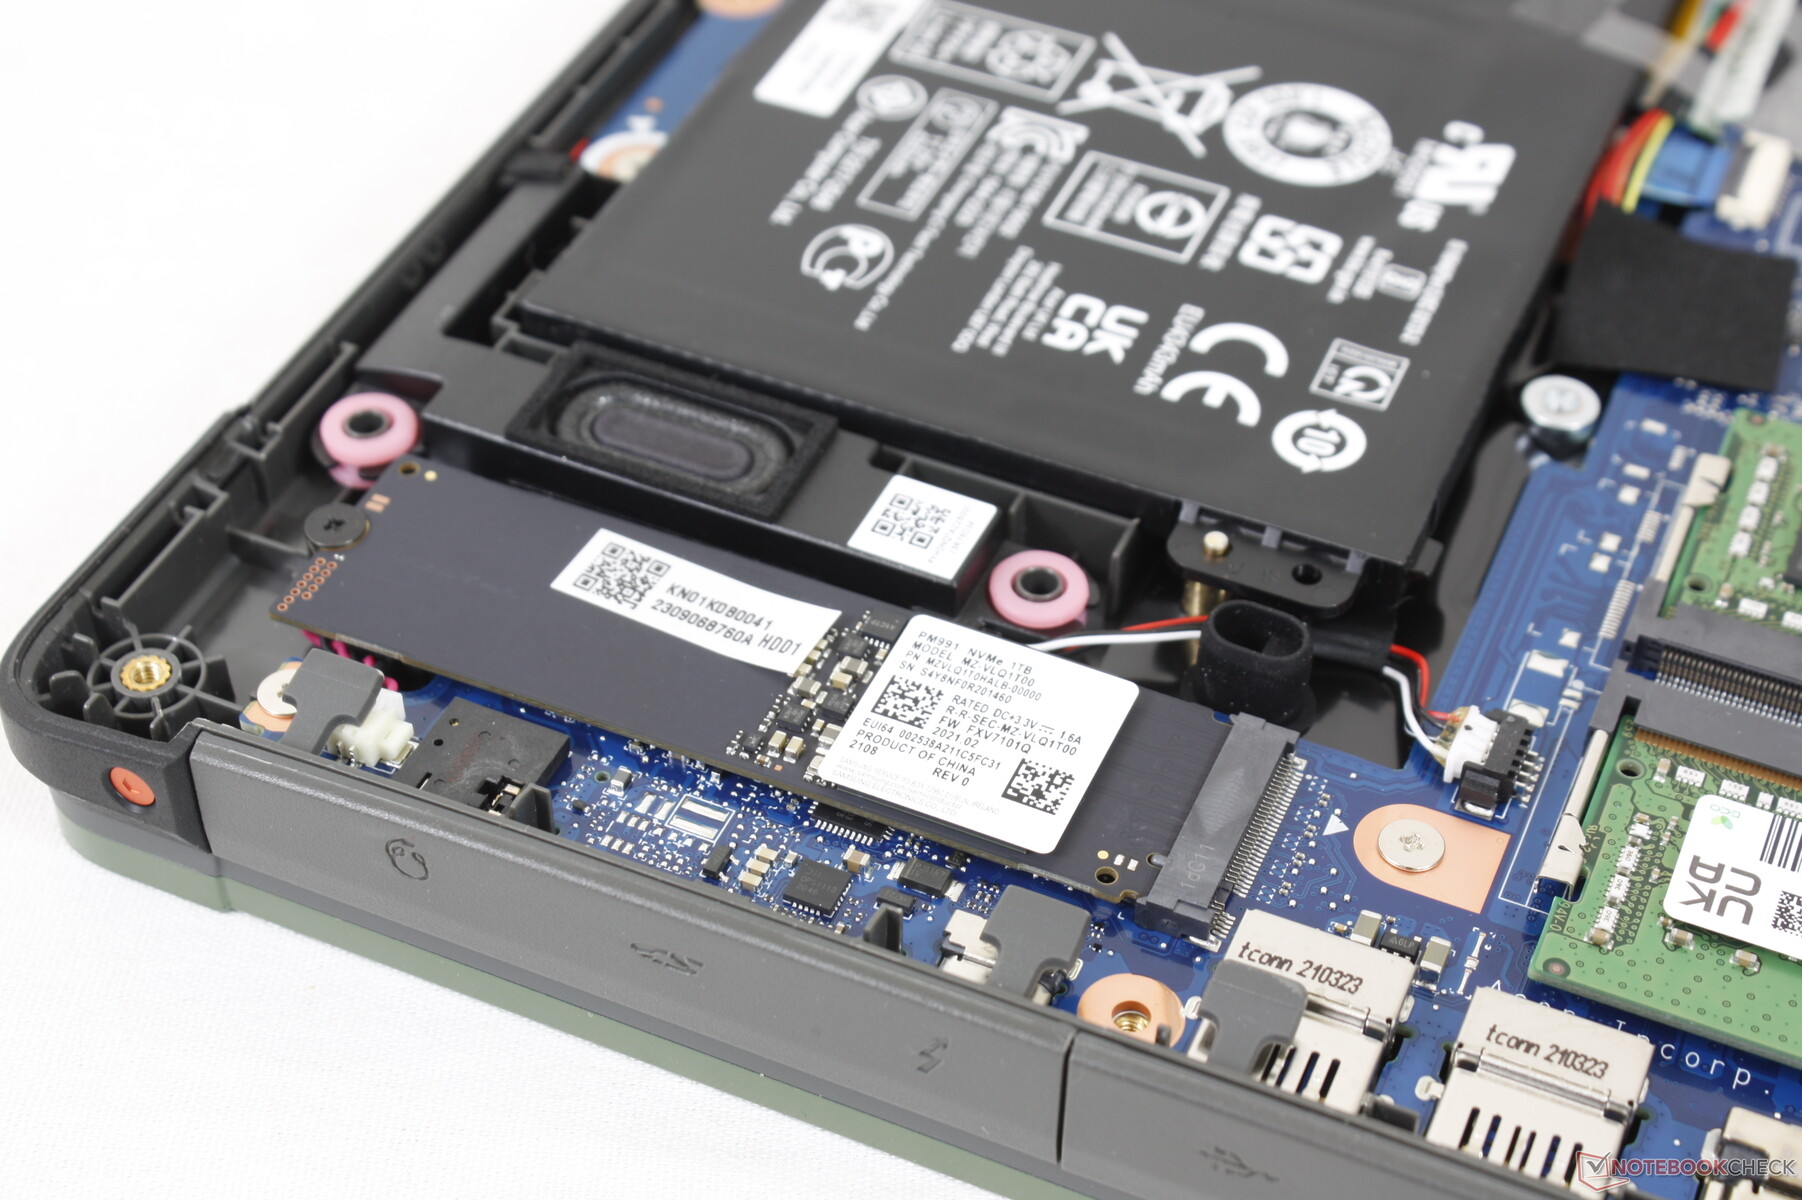
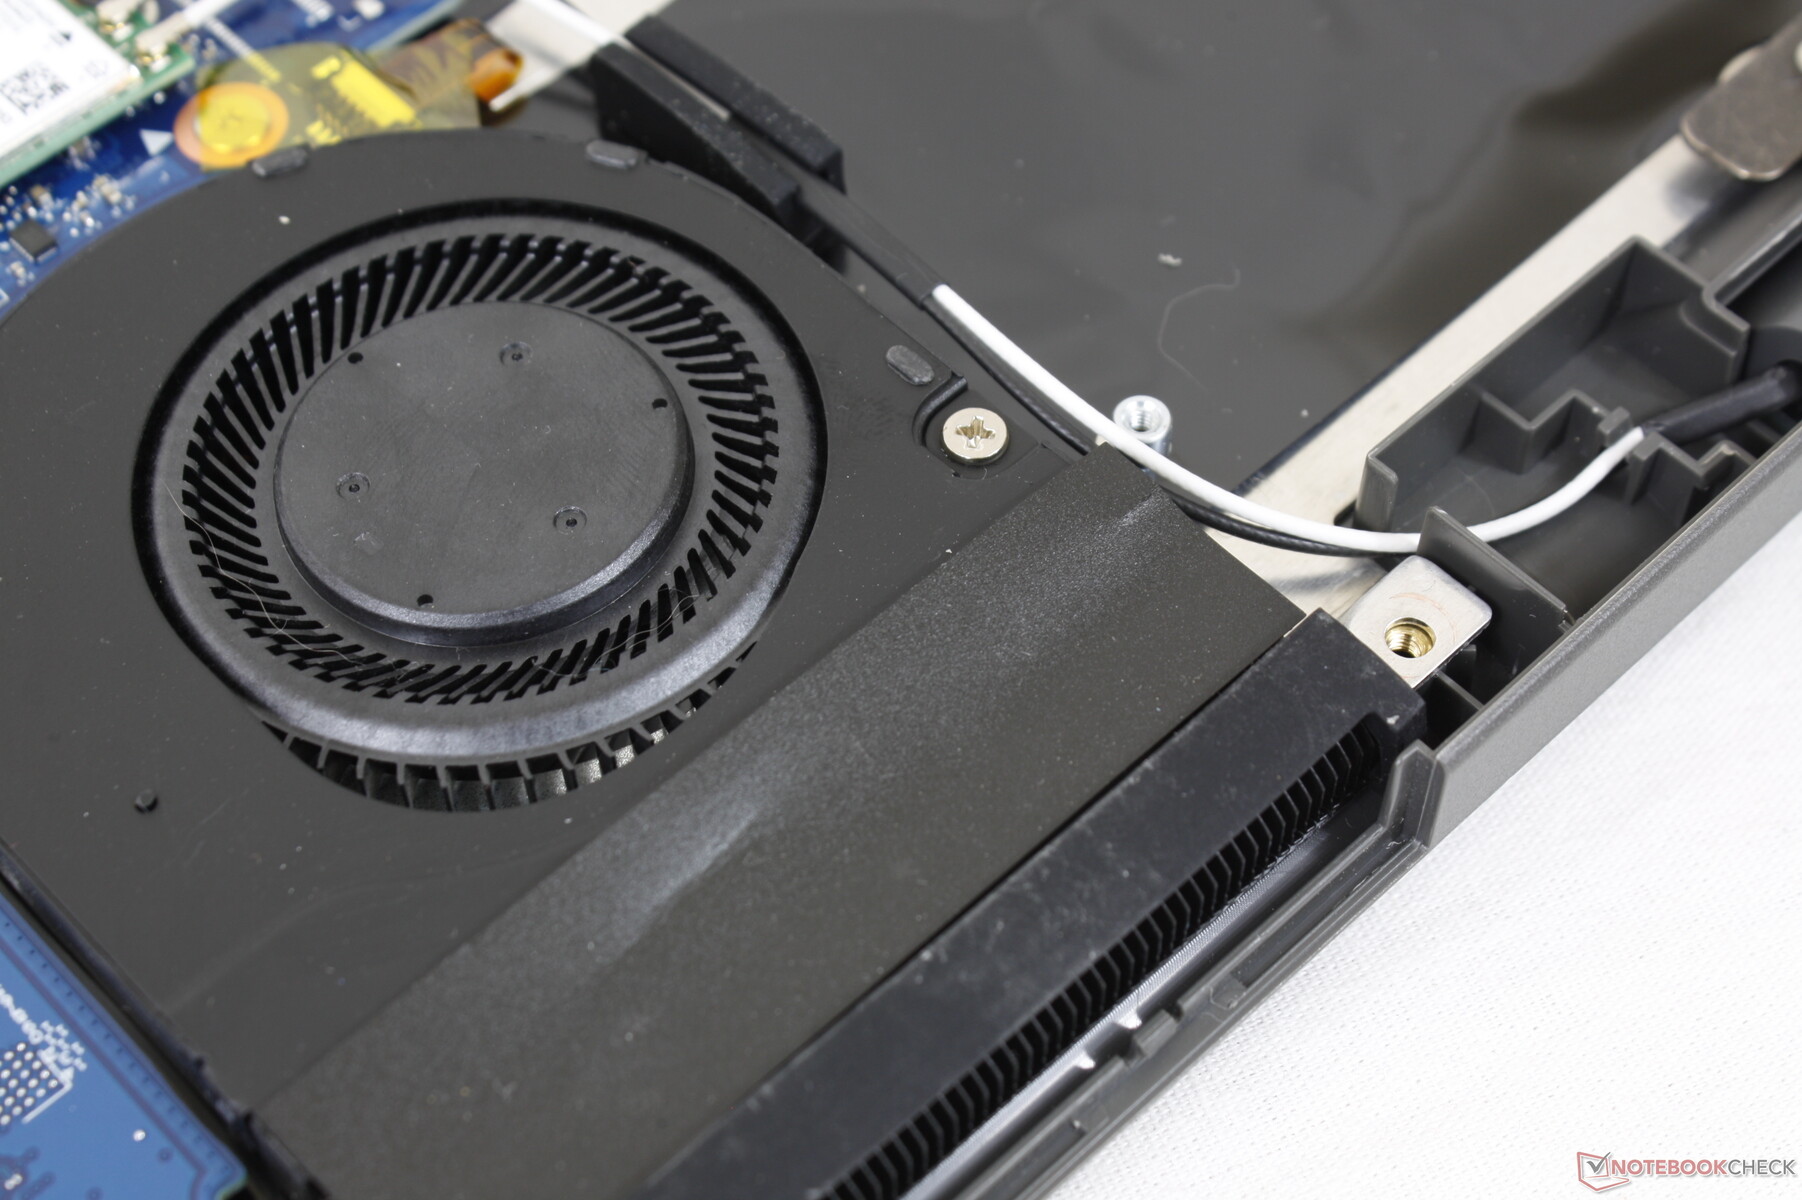
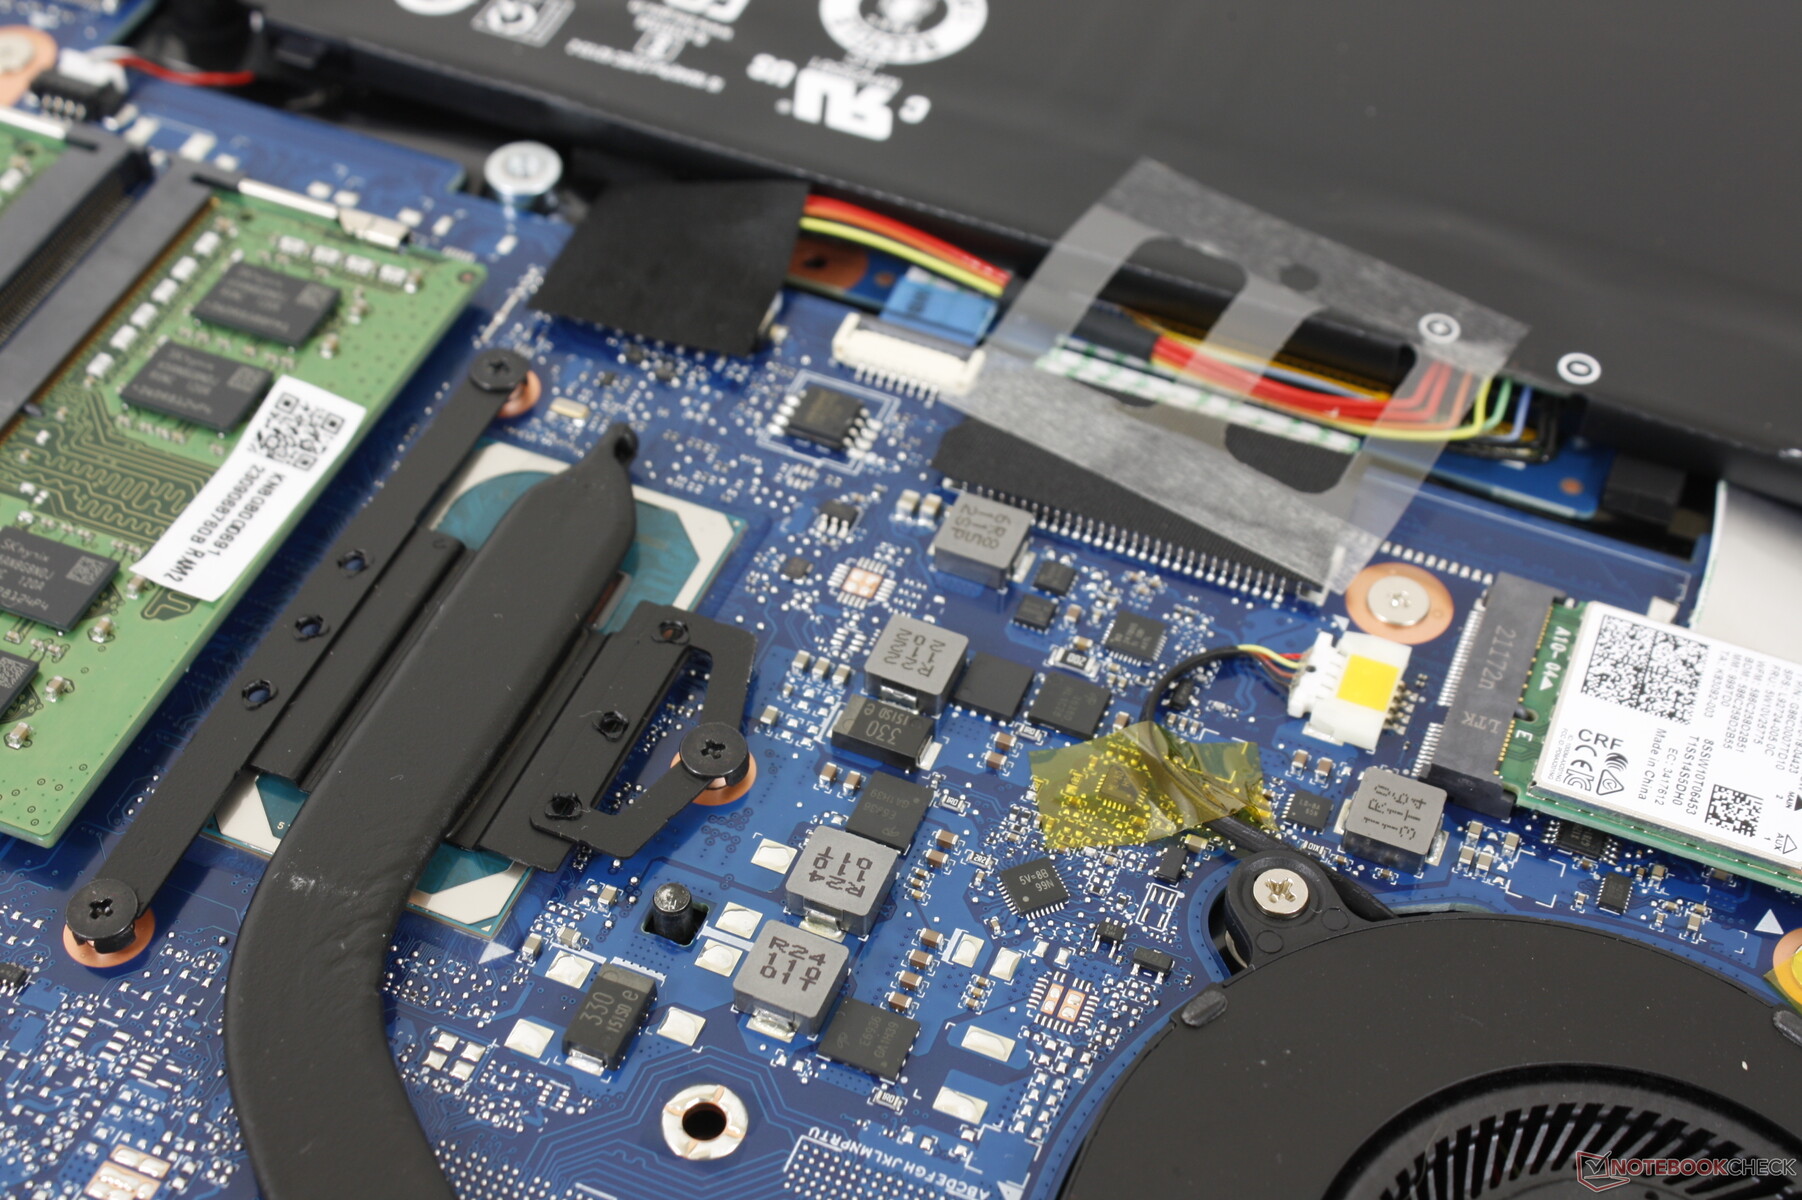
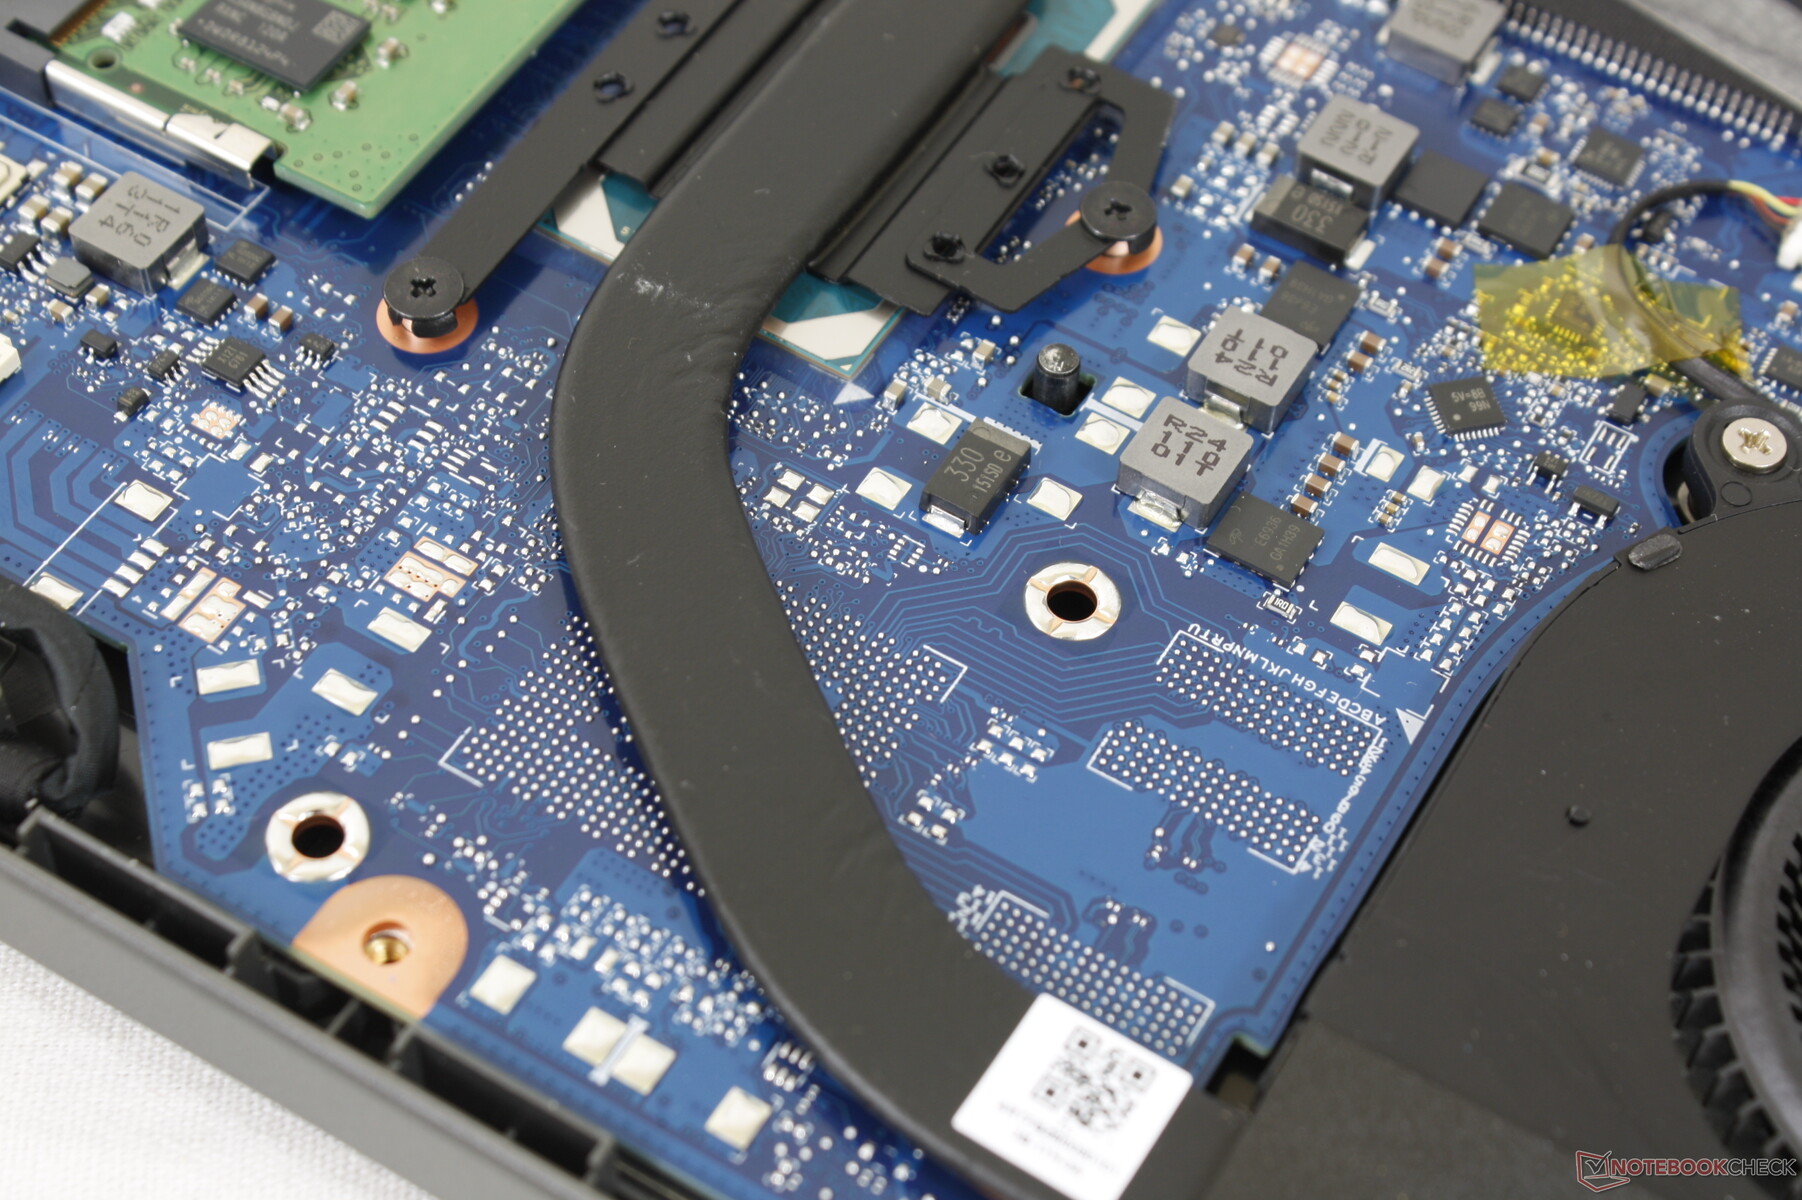
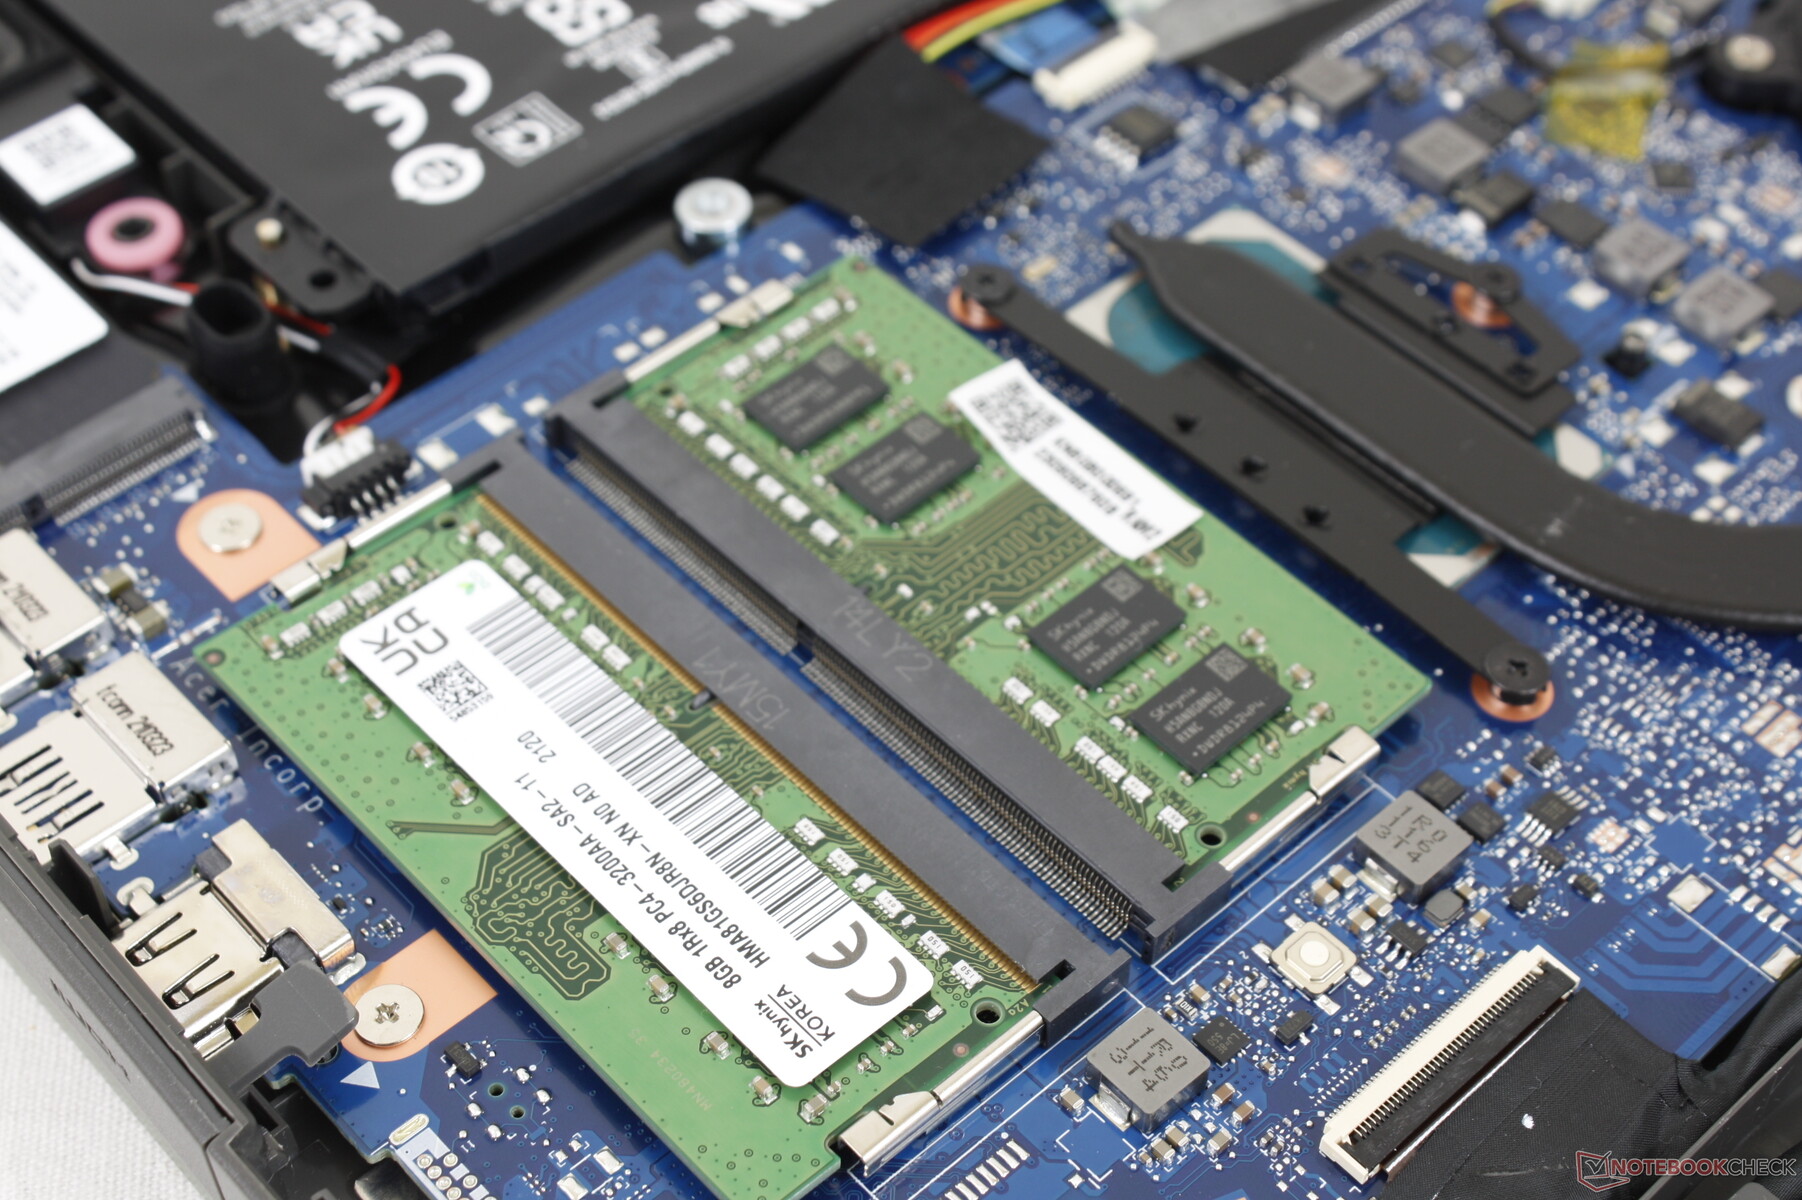
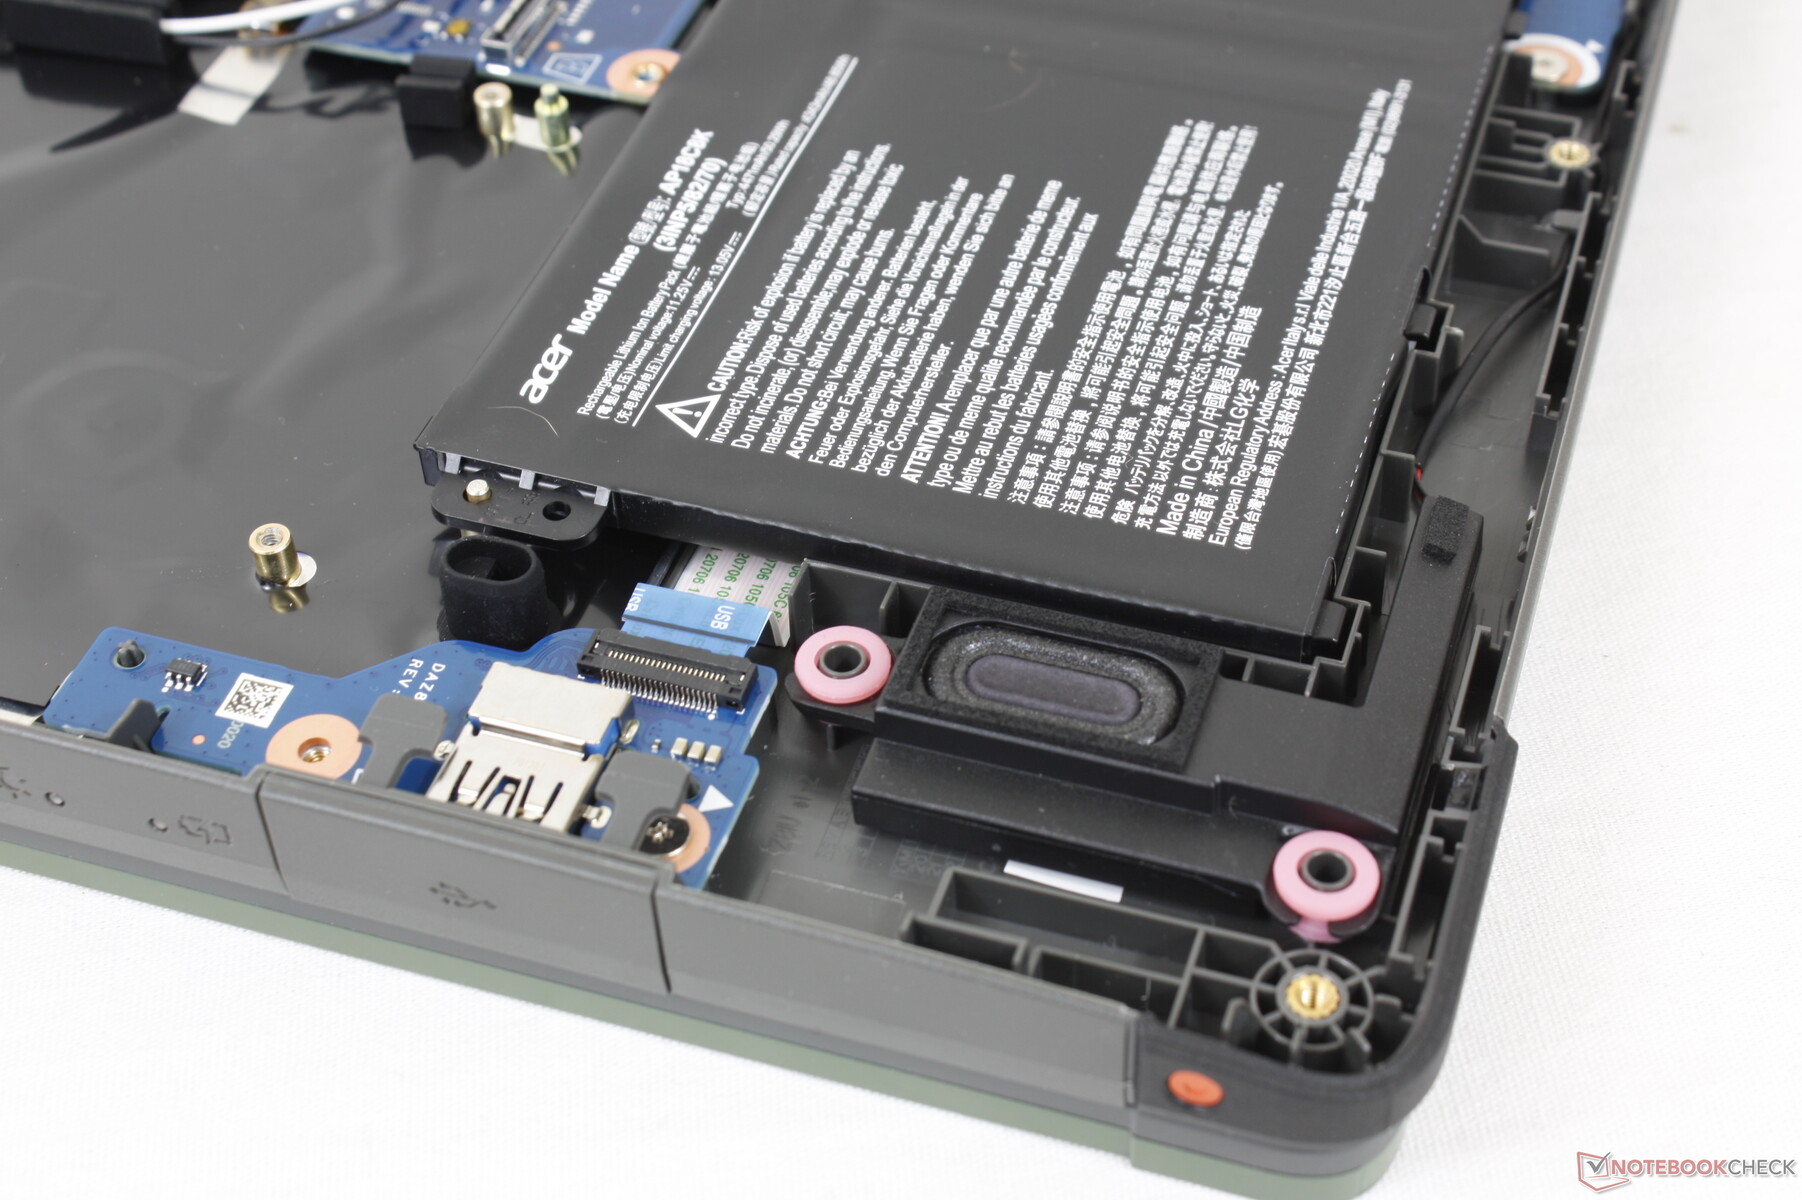
Maintenance
The bottom plastic panel pops off fairly easily after removing its 13 Philips screws. Users have direct access to the battery, both SODIMM slots, the WLAN module, and the M.2 PCIe3 x4 2280 slot.
Accessories and Warranty
There are no extras in the retail box beyond the AC adapter and paperwork. A one-year limited warranty applies whereas many professional laptops would typically come standard with two-year or three-year warranties instead.
Input Devices
Keyboard
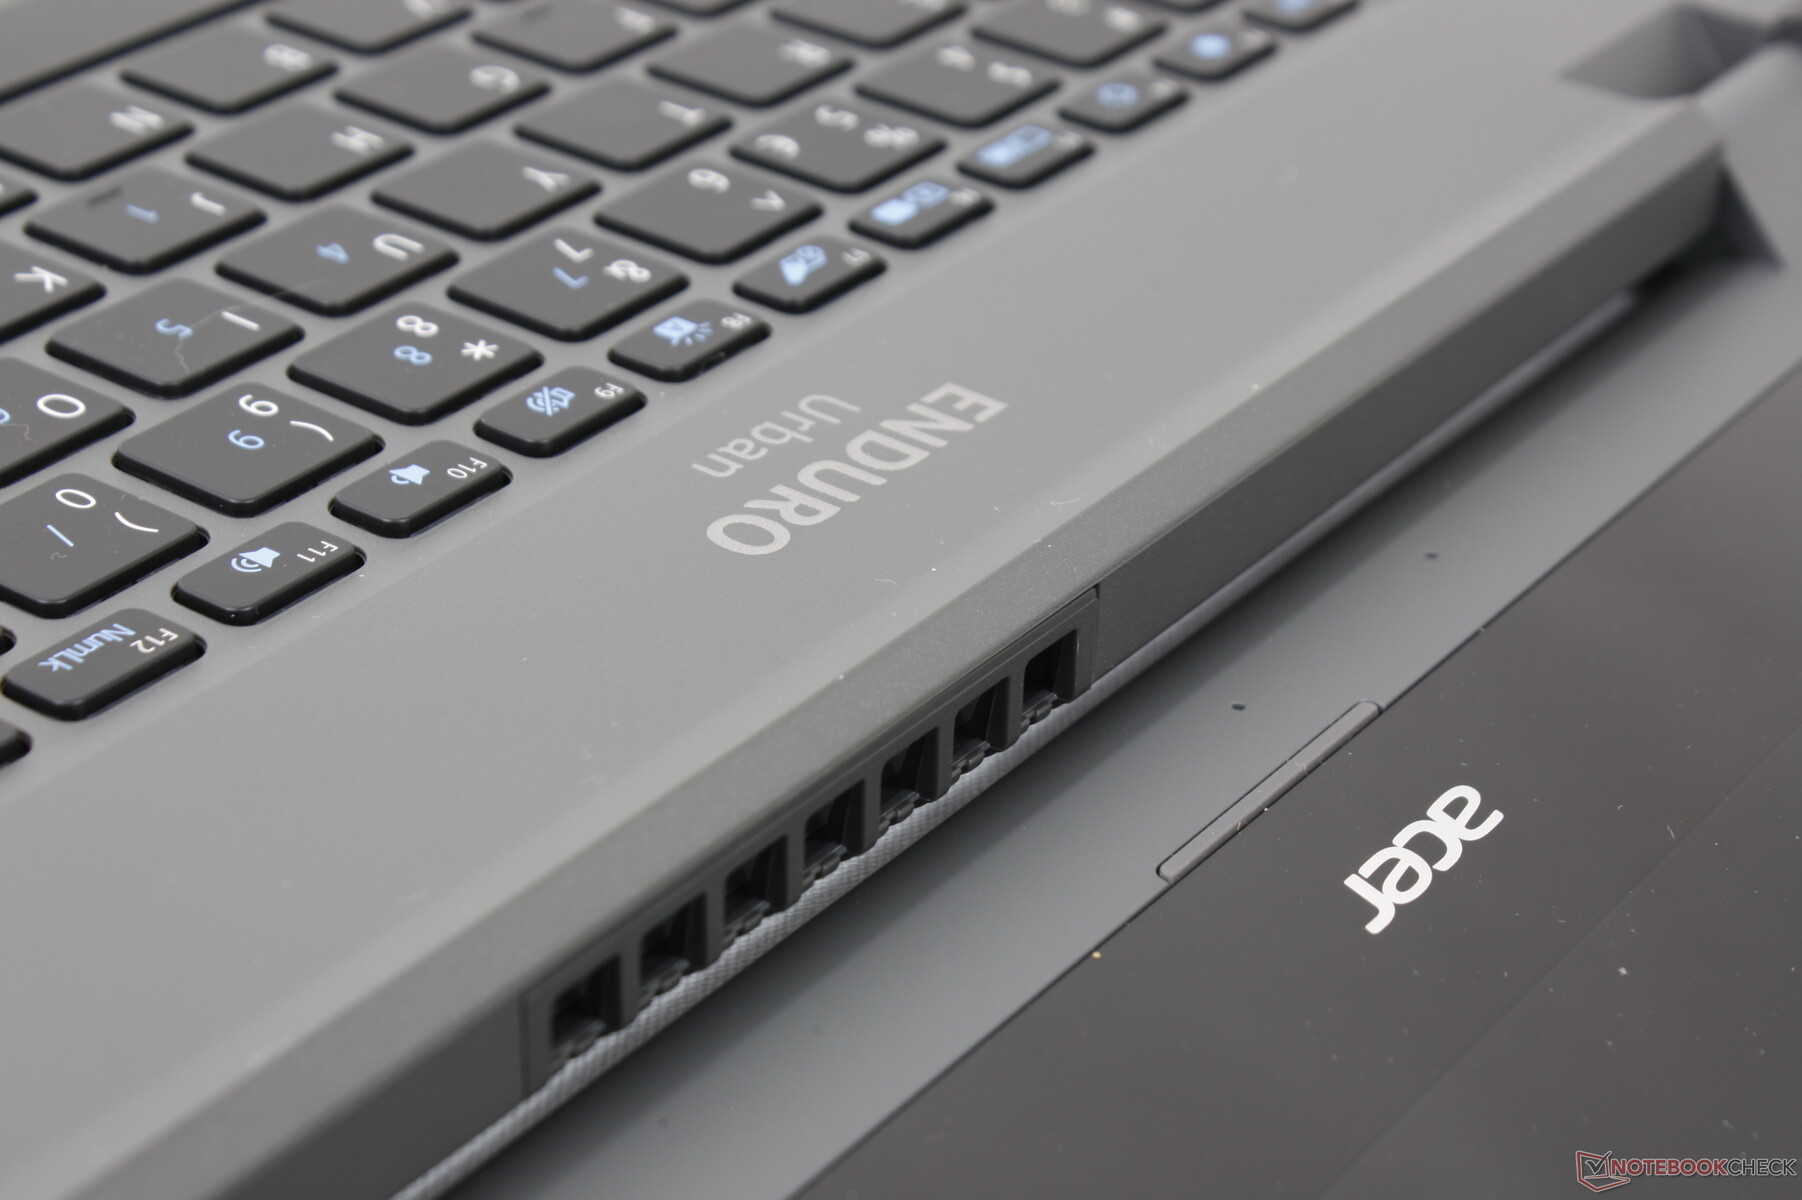
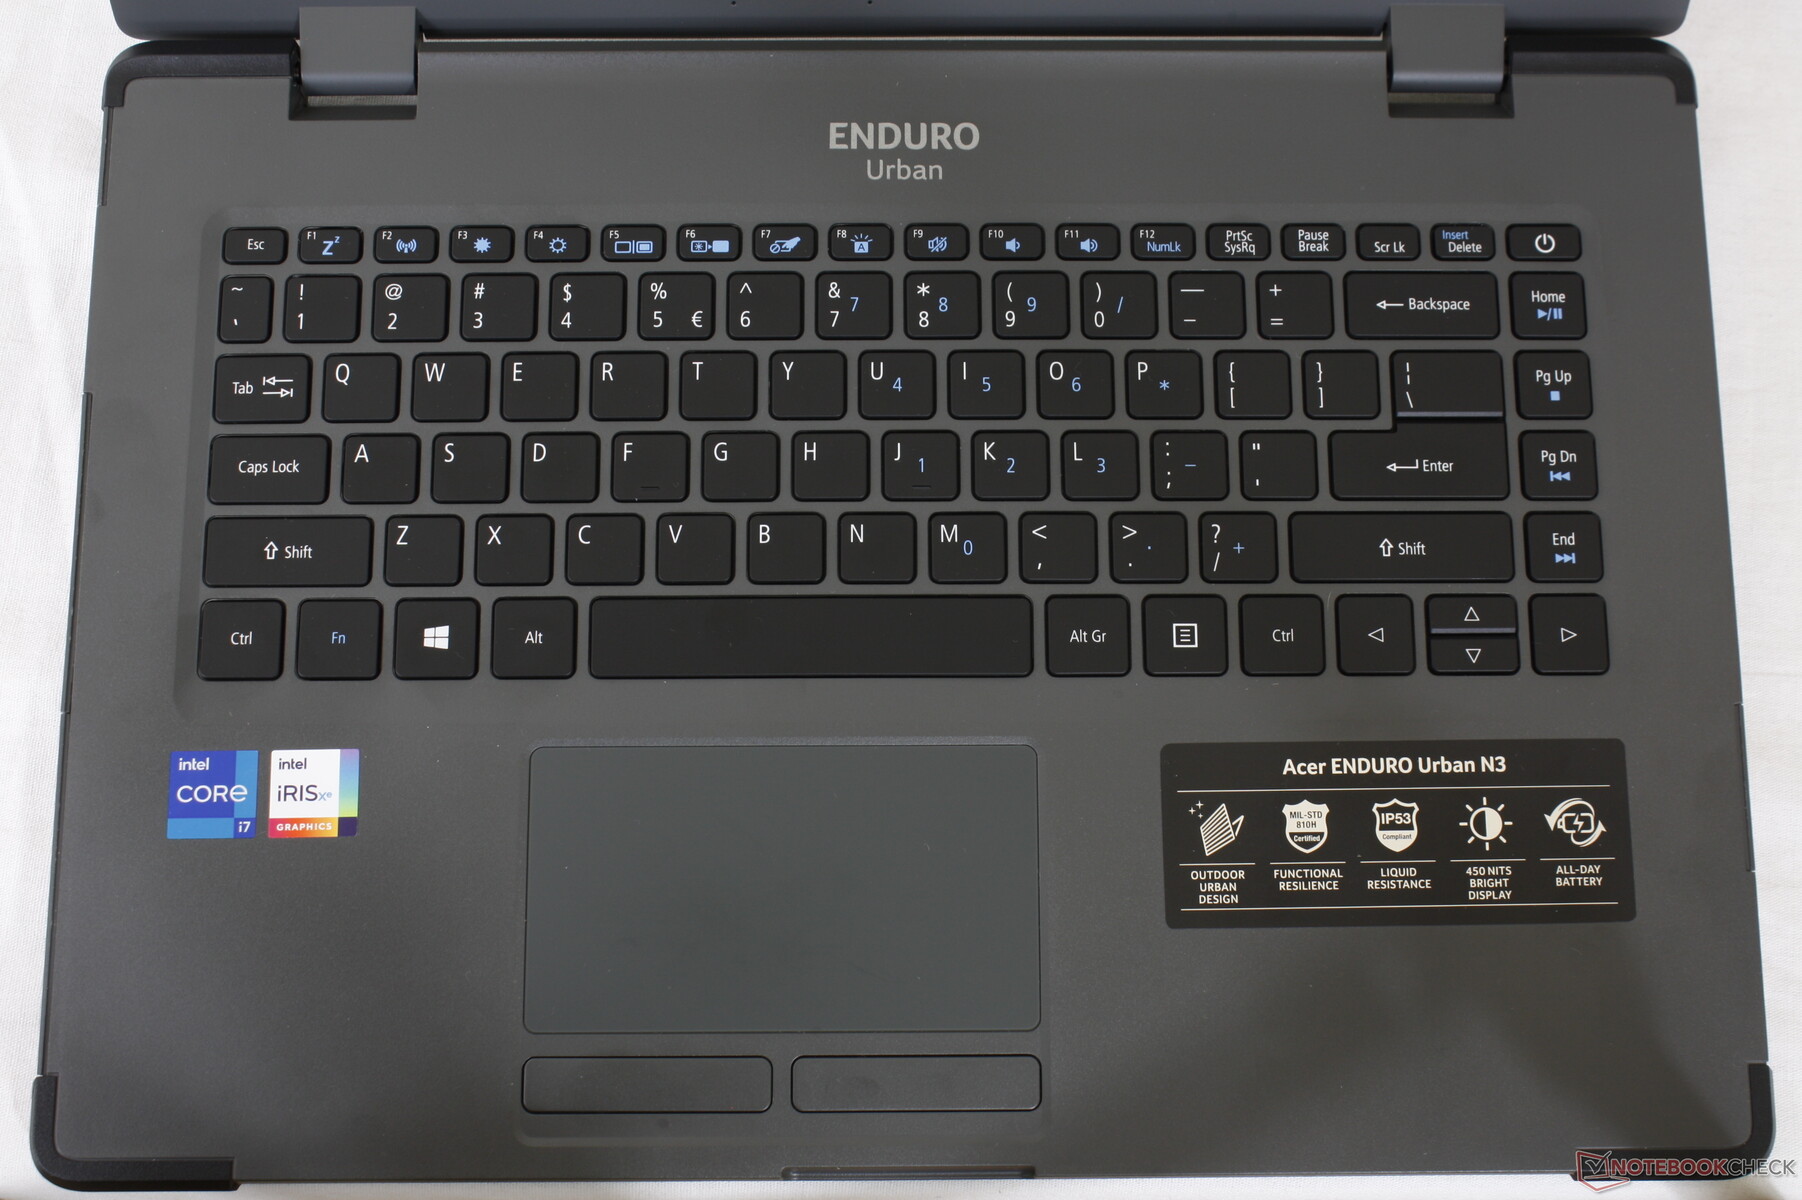
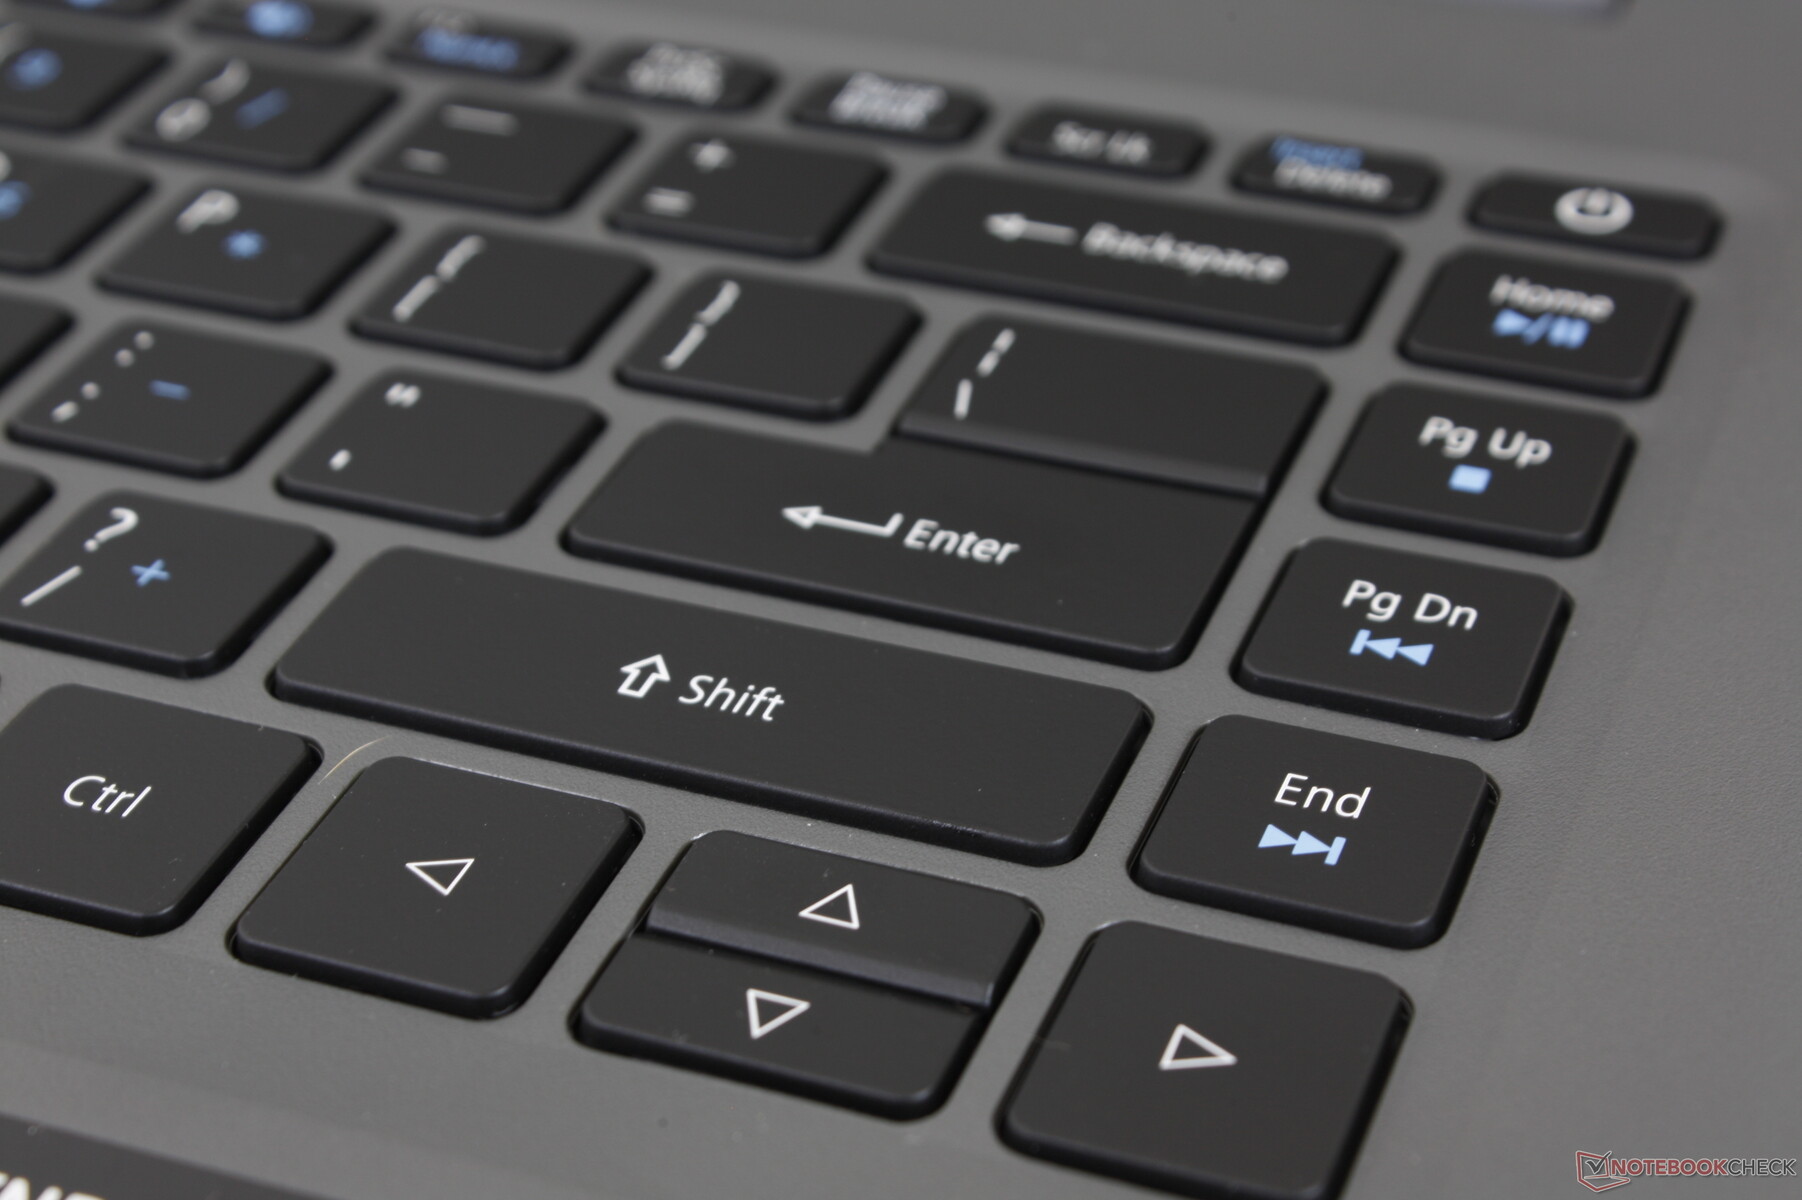
The typing experience is more akin to a standard Ultrabook like the Asus VivoBook or Dell Inspiron rather than on more professional laptops like the Durabook S14I or Lenovo ThinkPad which tend to have firmer and deeper keys. If you're accustomed to typing on consumer-grade laptops, then the keyboard on the Urban N3 won't feel all that different for better or worse. Key clatter is on the quiet side with soft but uniform feedback on all keys.
Touchpad
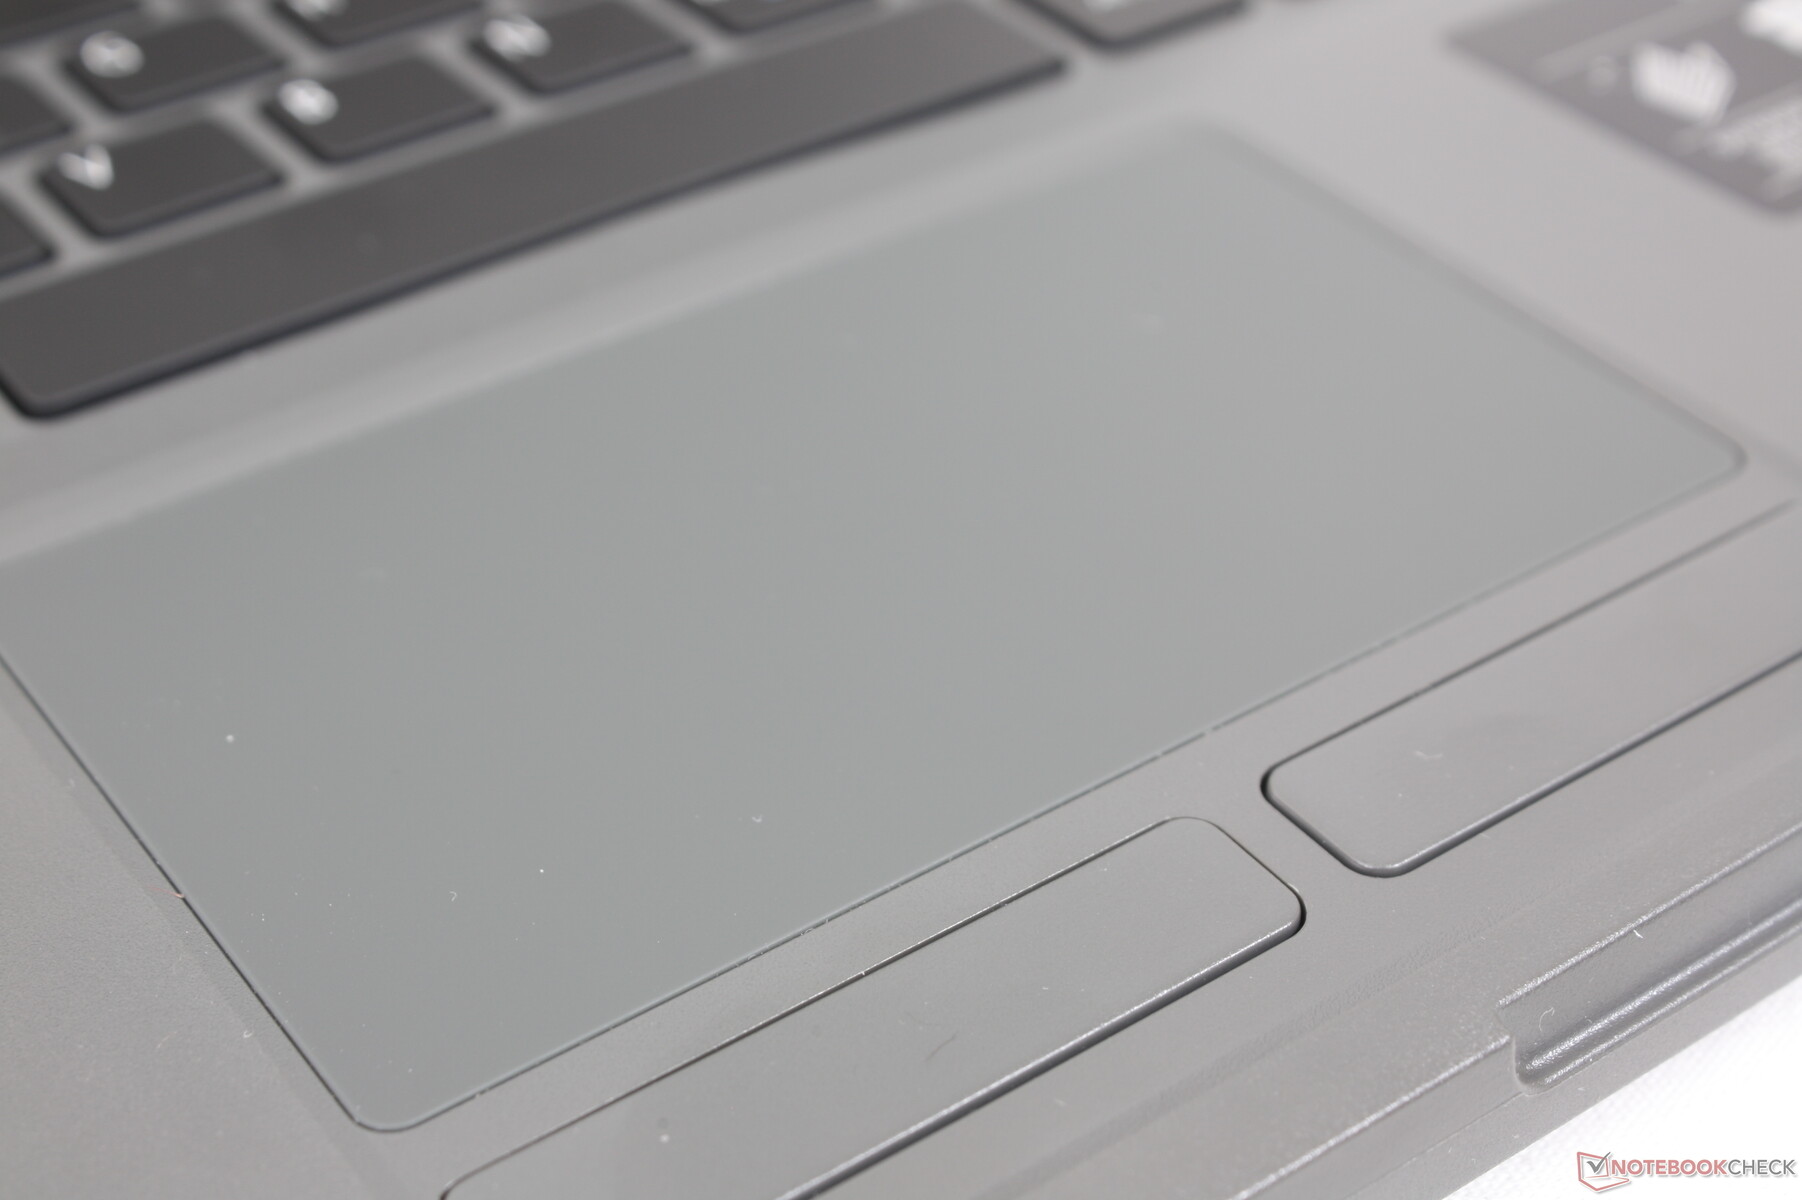
The touchpad is of decent size at 10.5 x 5.9 cm. Gliding at medium-to-fast speeds is smooth whereas slower speeds tend to stick for more dragging and dropping.

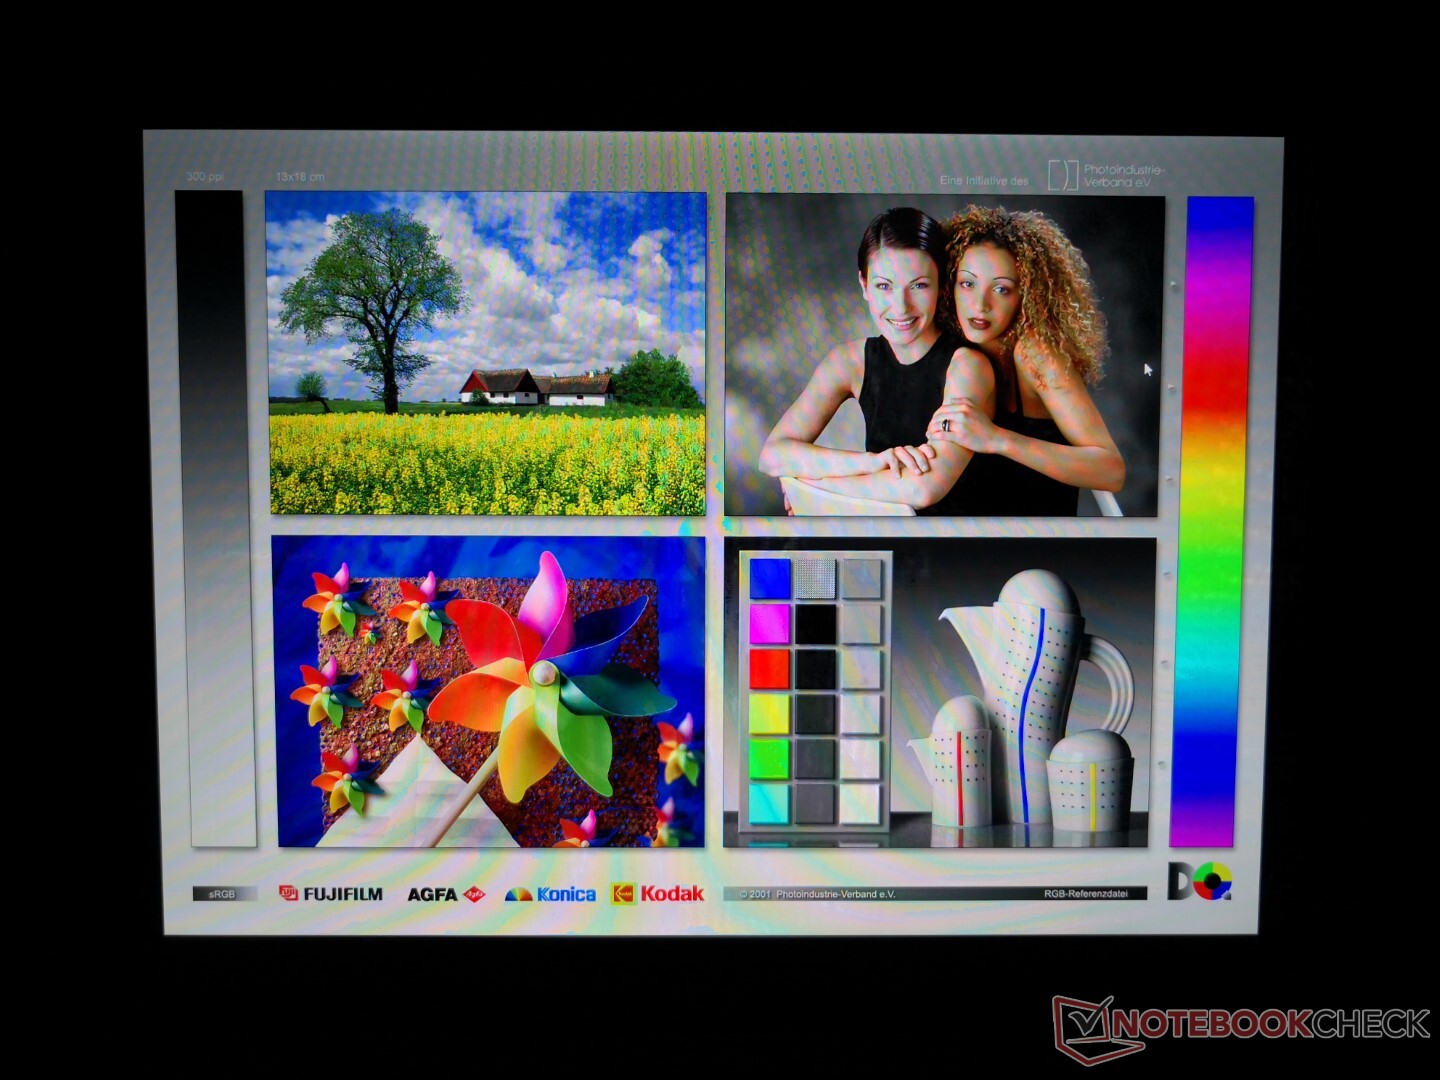
Display
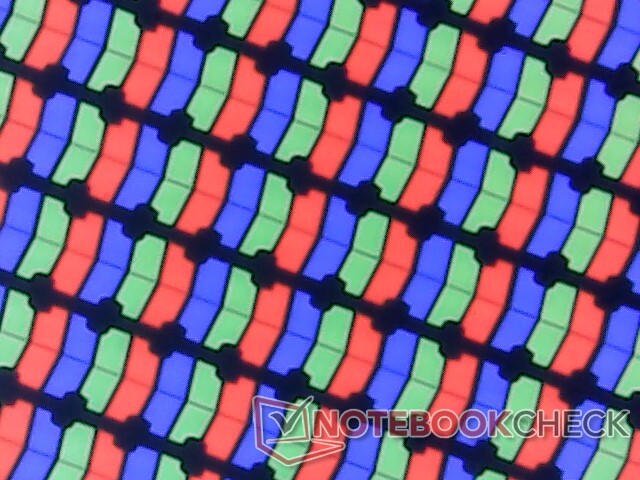
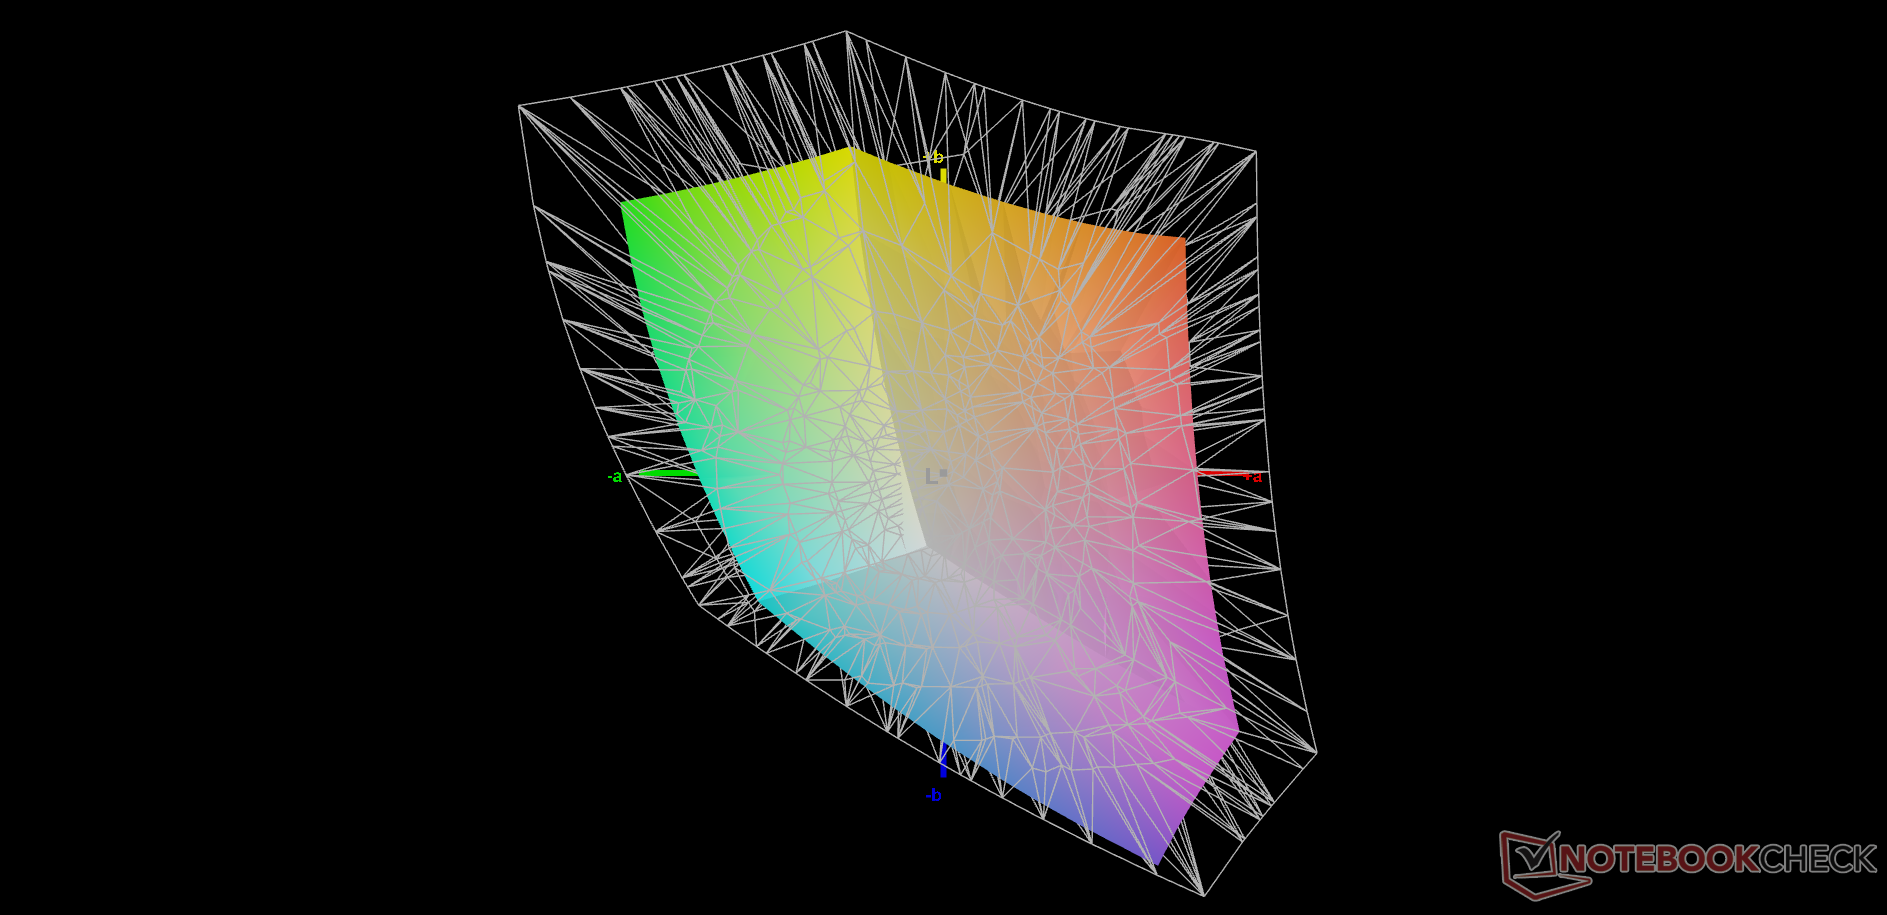
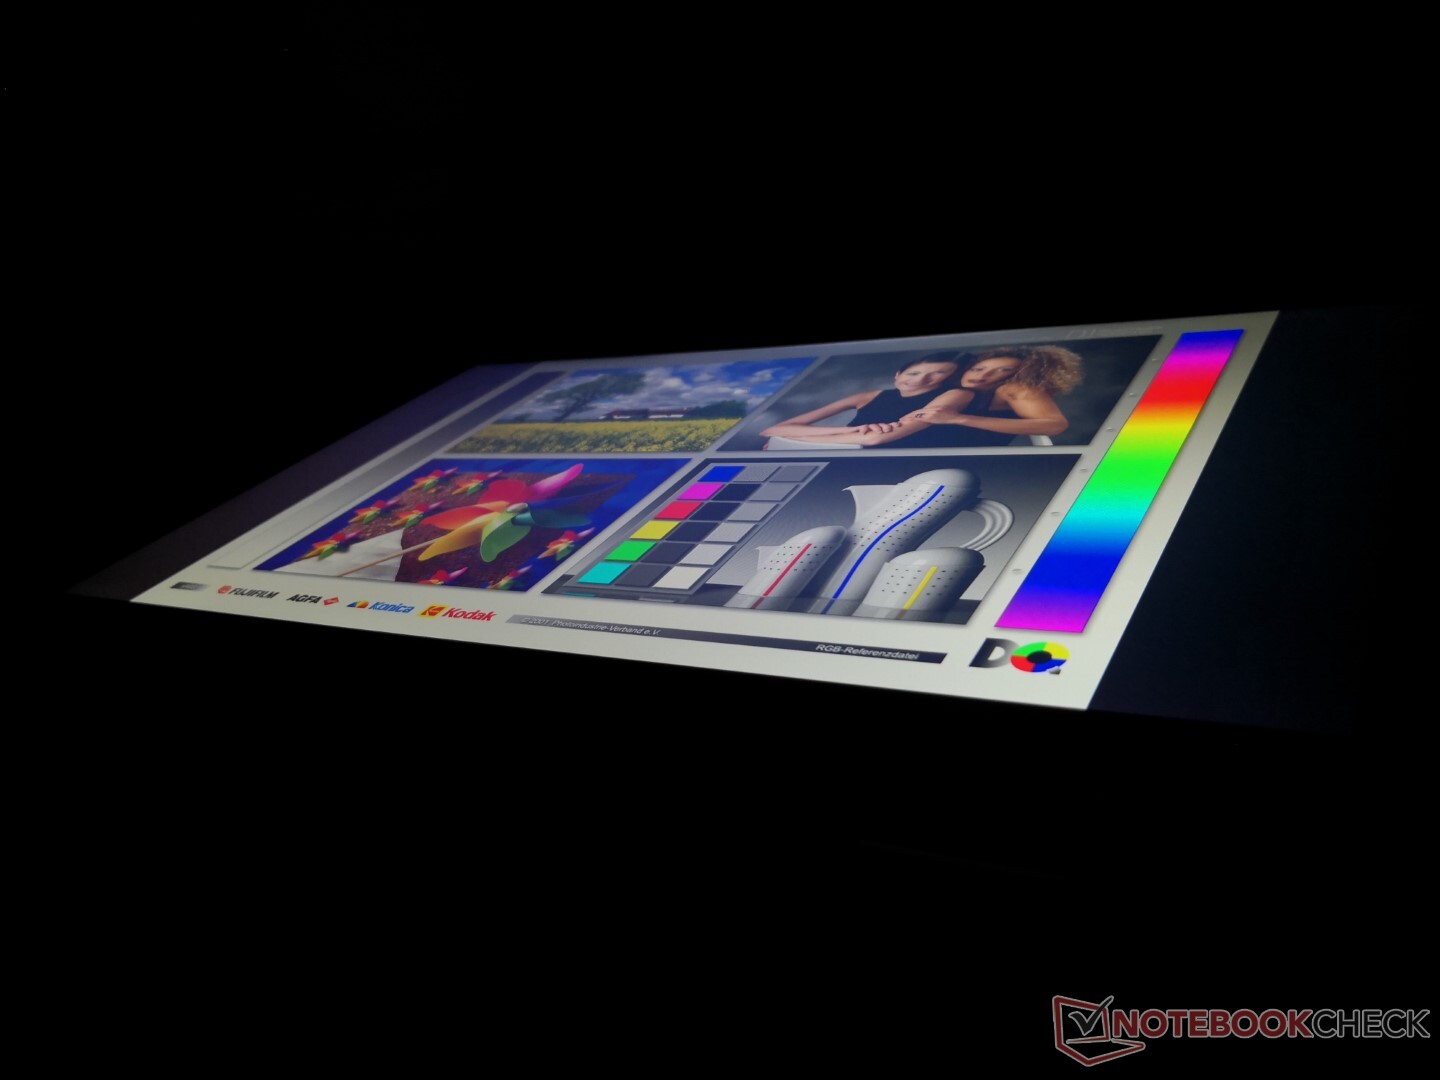
The XR140EA6T panel can be found on no other laptop in our database. Fortunately, its core attributes are excellent especially for a rugged laptop. Its backlight is bright at almost 500 nits with high contrast (>1000:1) and respectable color coverage.
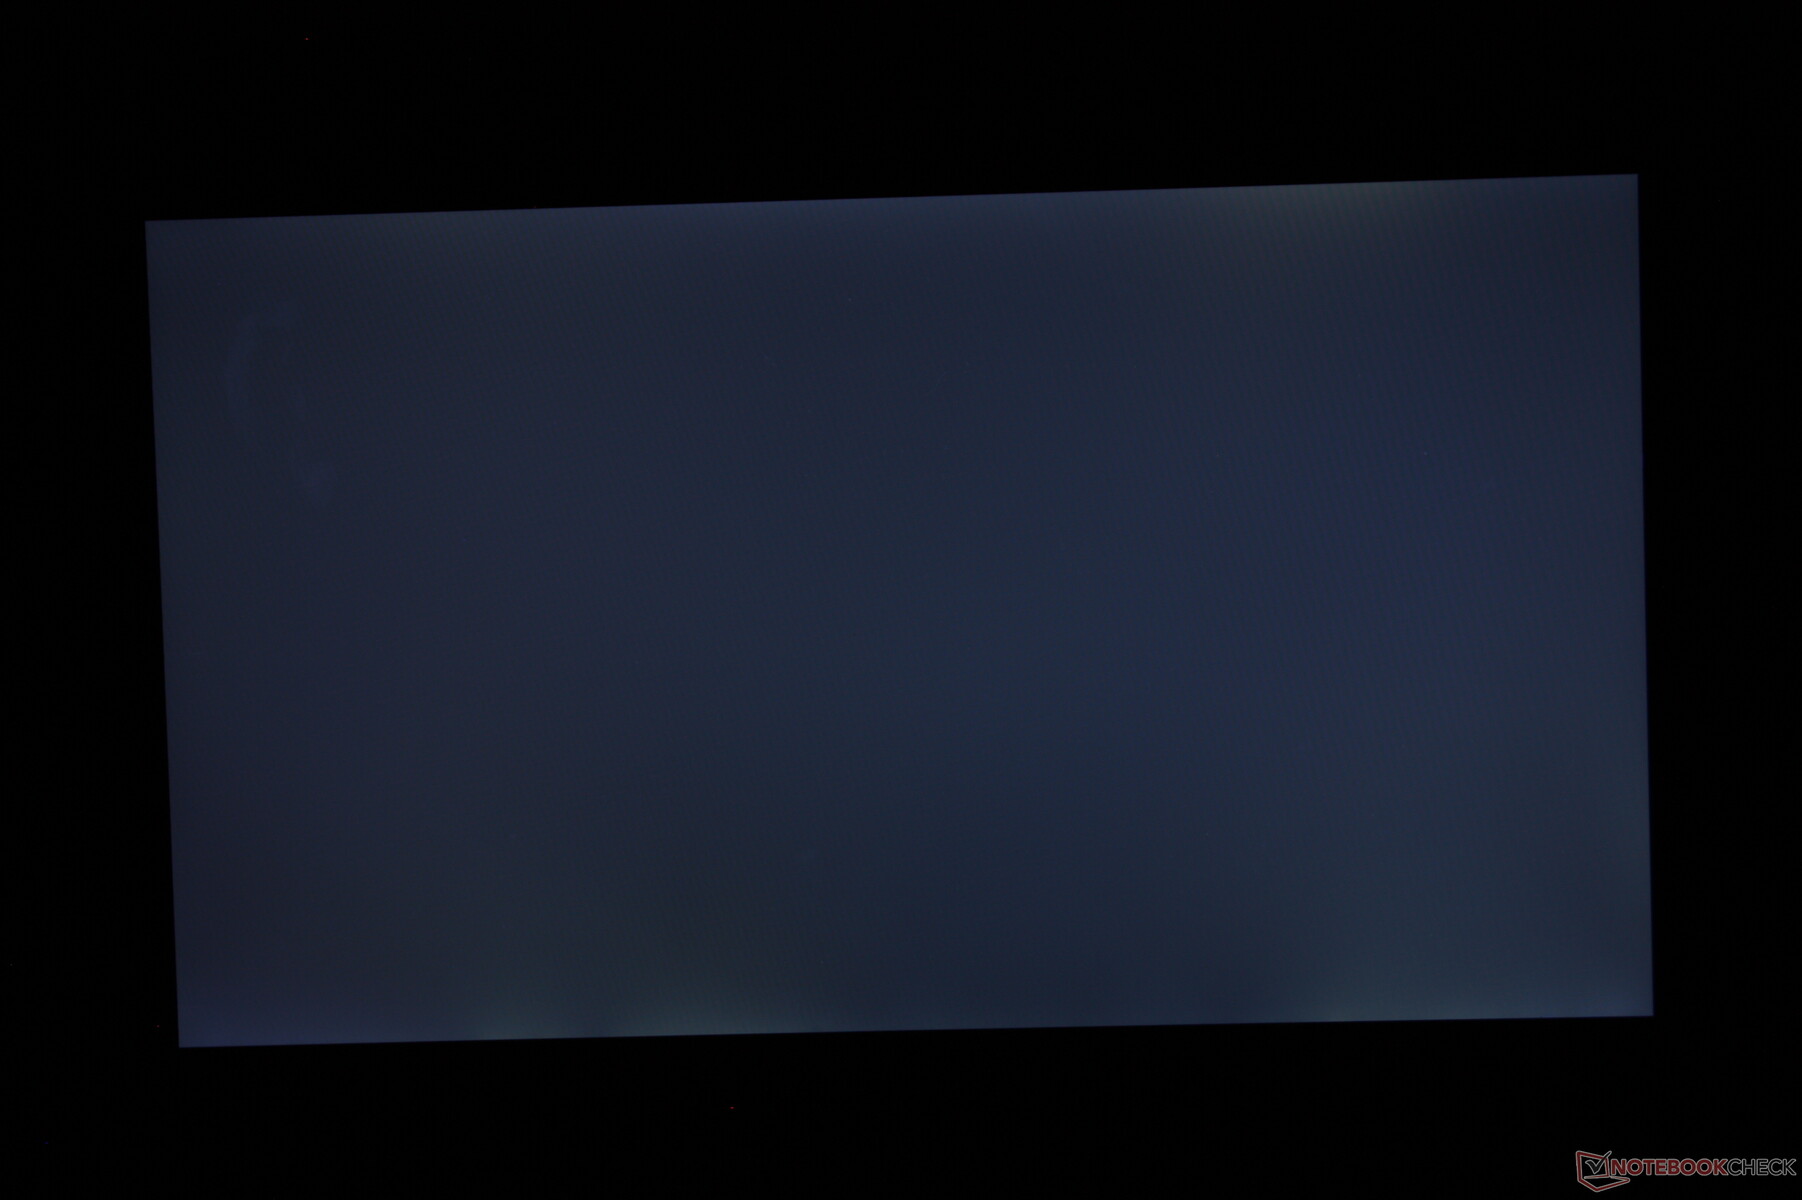
Drawbacks include the slow black-white response times for noticeable ghosting and presence of PWM at all brightness levels up to 99 percent. You may want to avoid this laptop if your eyes are sensitive to onscreen flickering. Other rugged laptops like the Durabook S14I can offer even brighter displays of over 1000 nits.
| |||||||||||||||||||||||||
Brightness Distribution: 89 %
Center on Battery: 487.8 cd/m²
Contrast: 1016:1 (Black: 0.48 cd/m²)
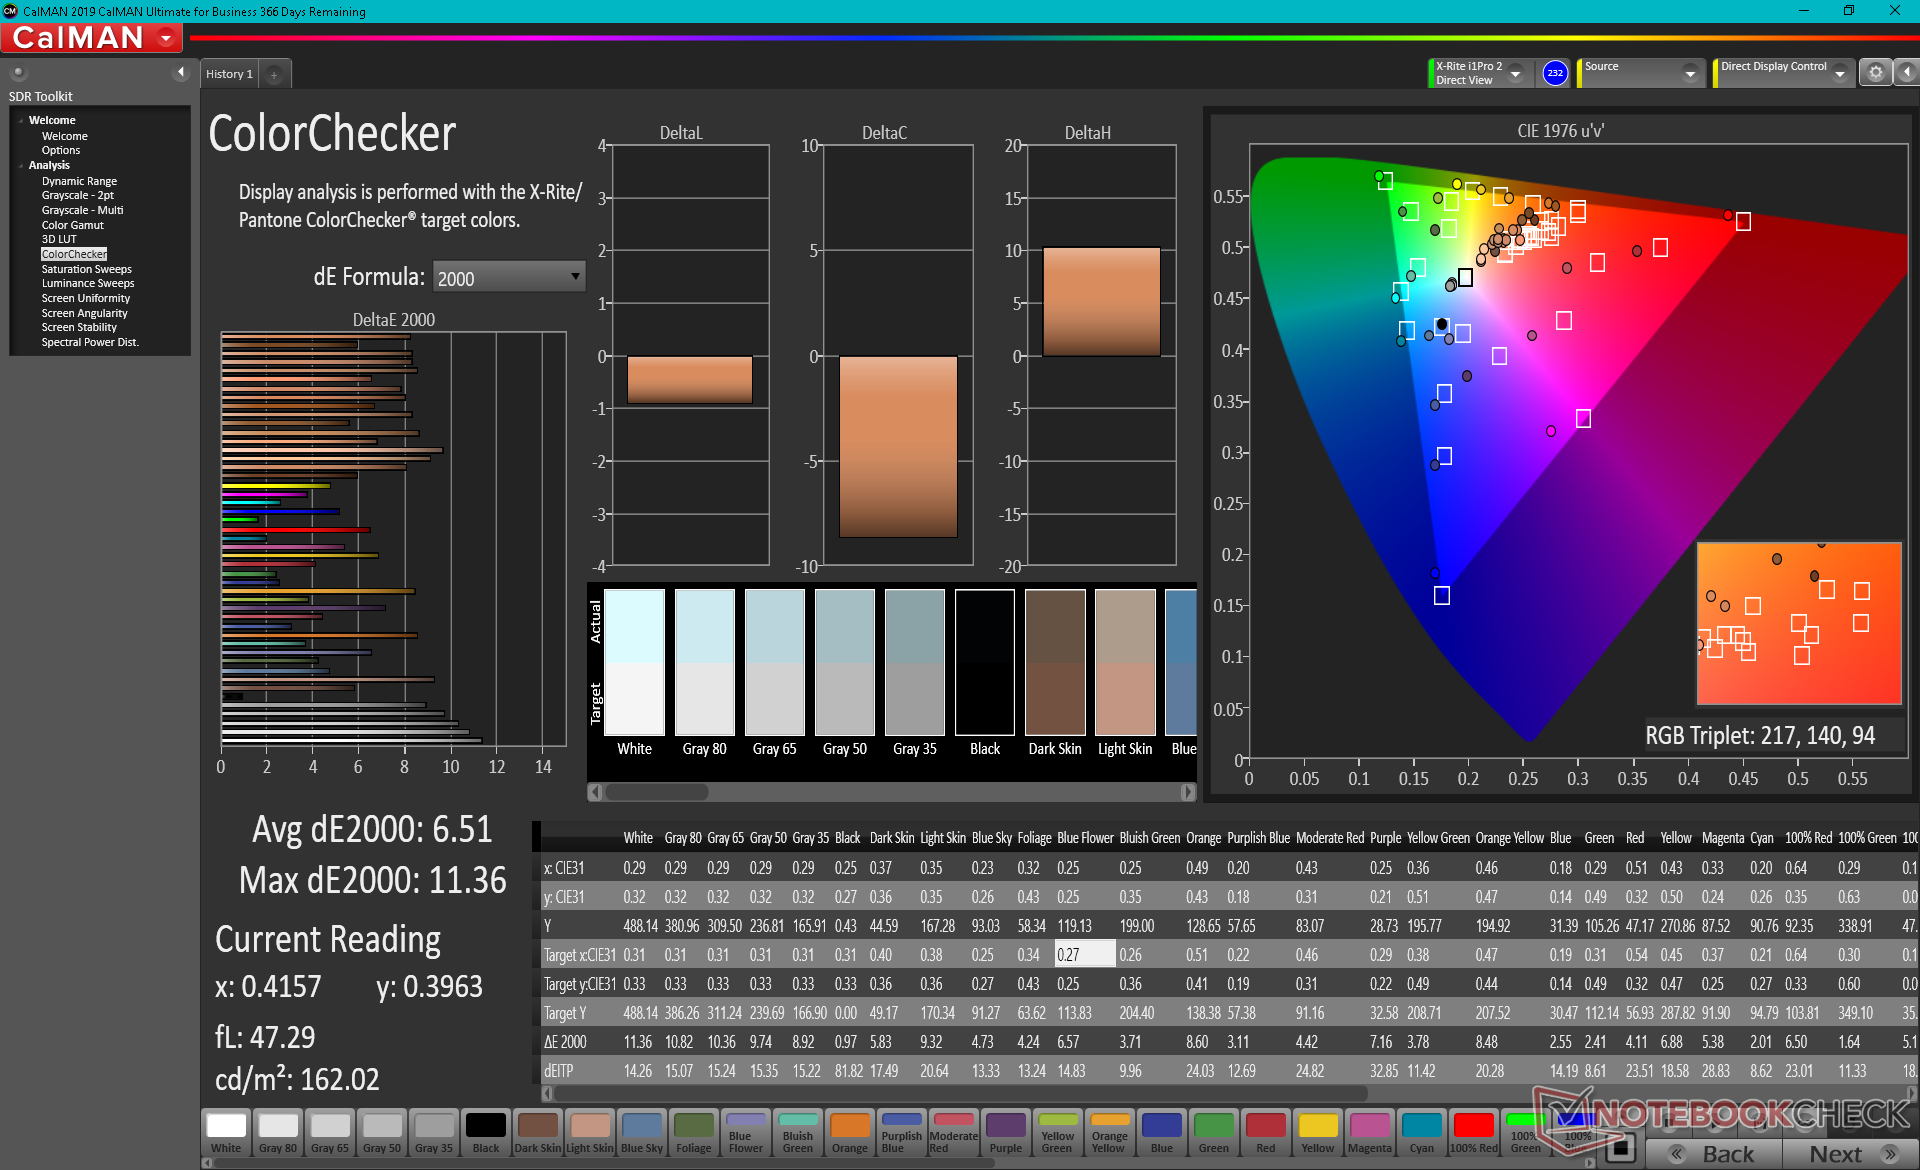
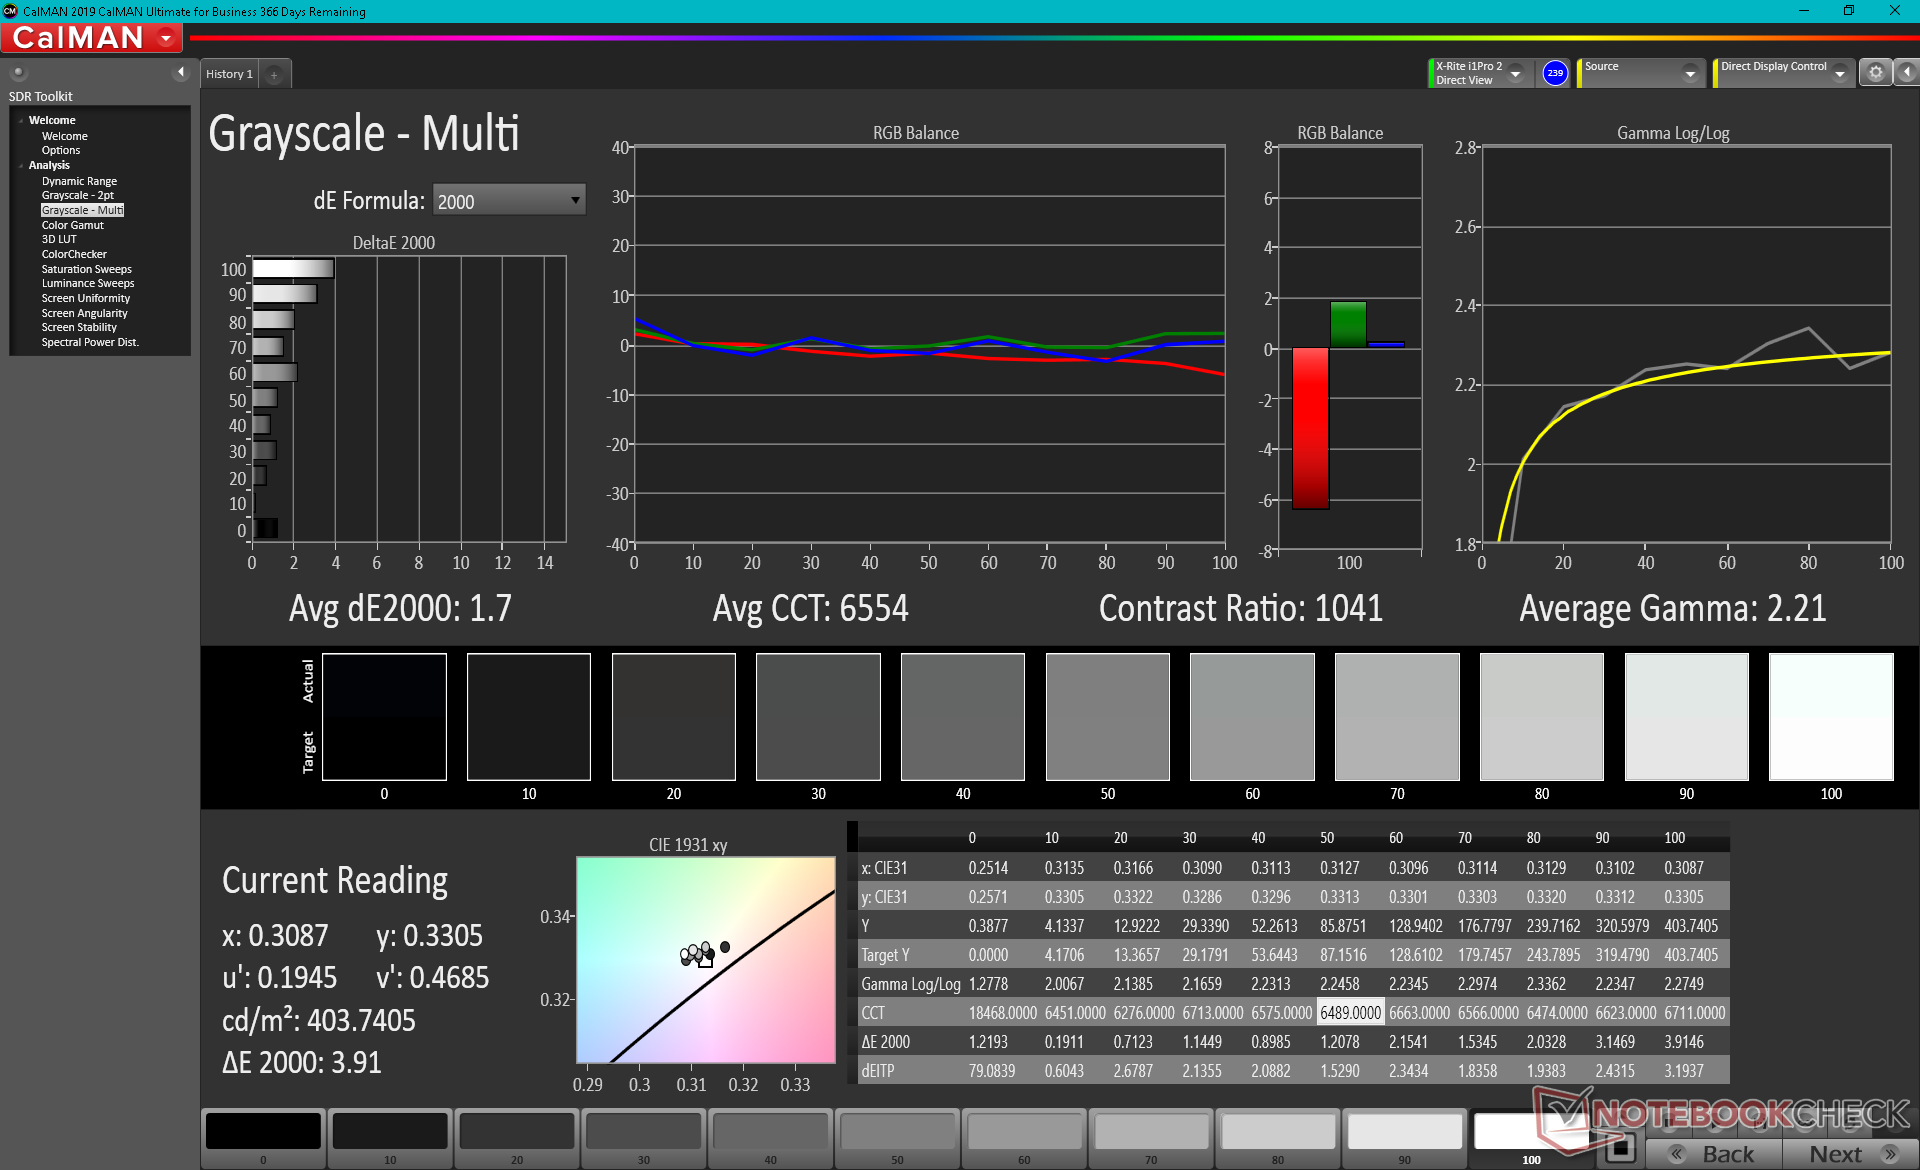
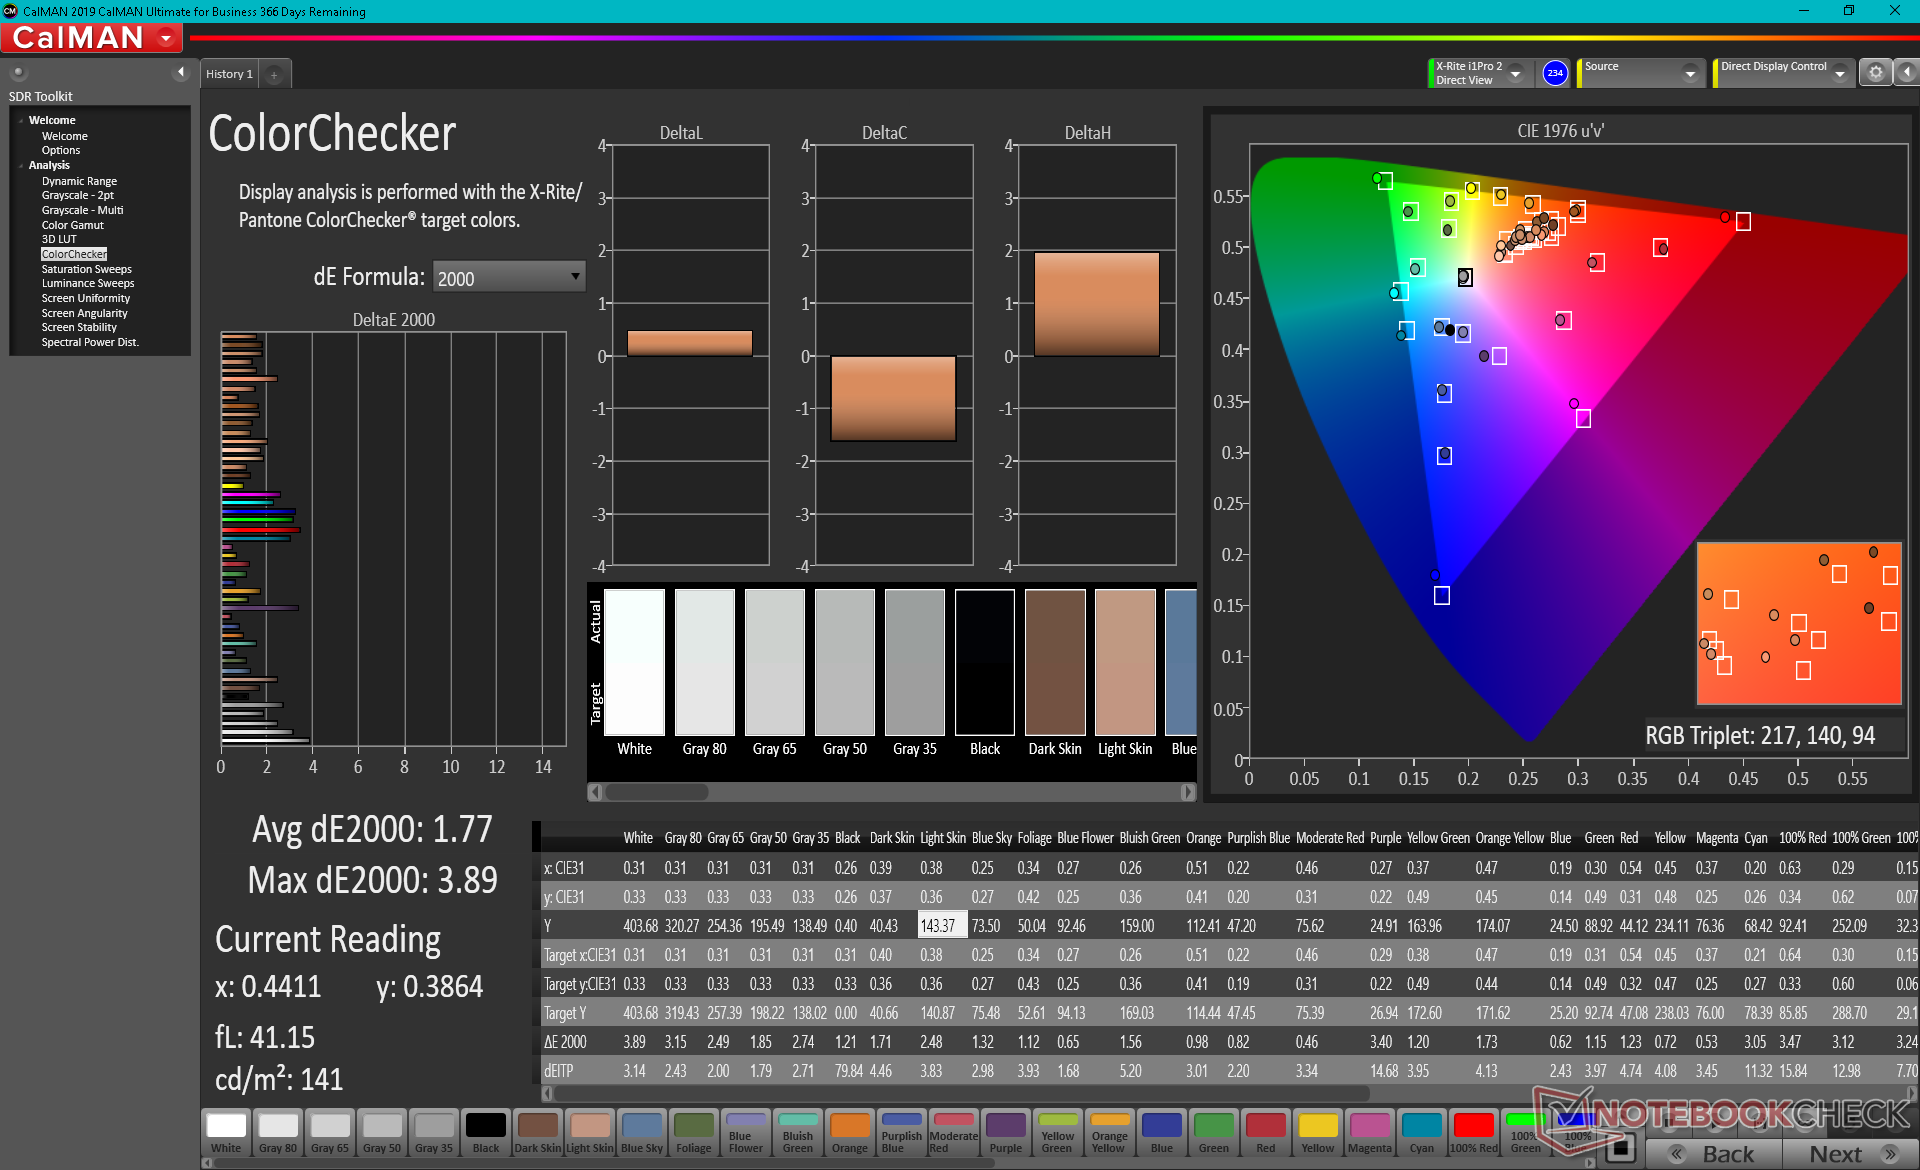
ΔE ColorChecker Calman: 6.51 | ∀{0.5-29.43 Ø4.75}
calibrated: 1.77
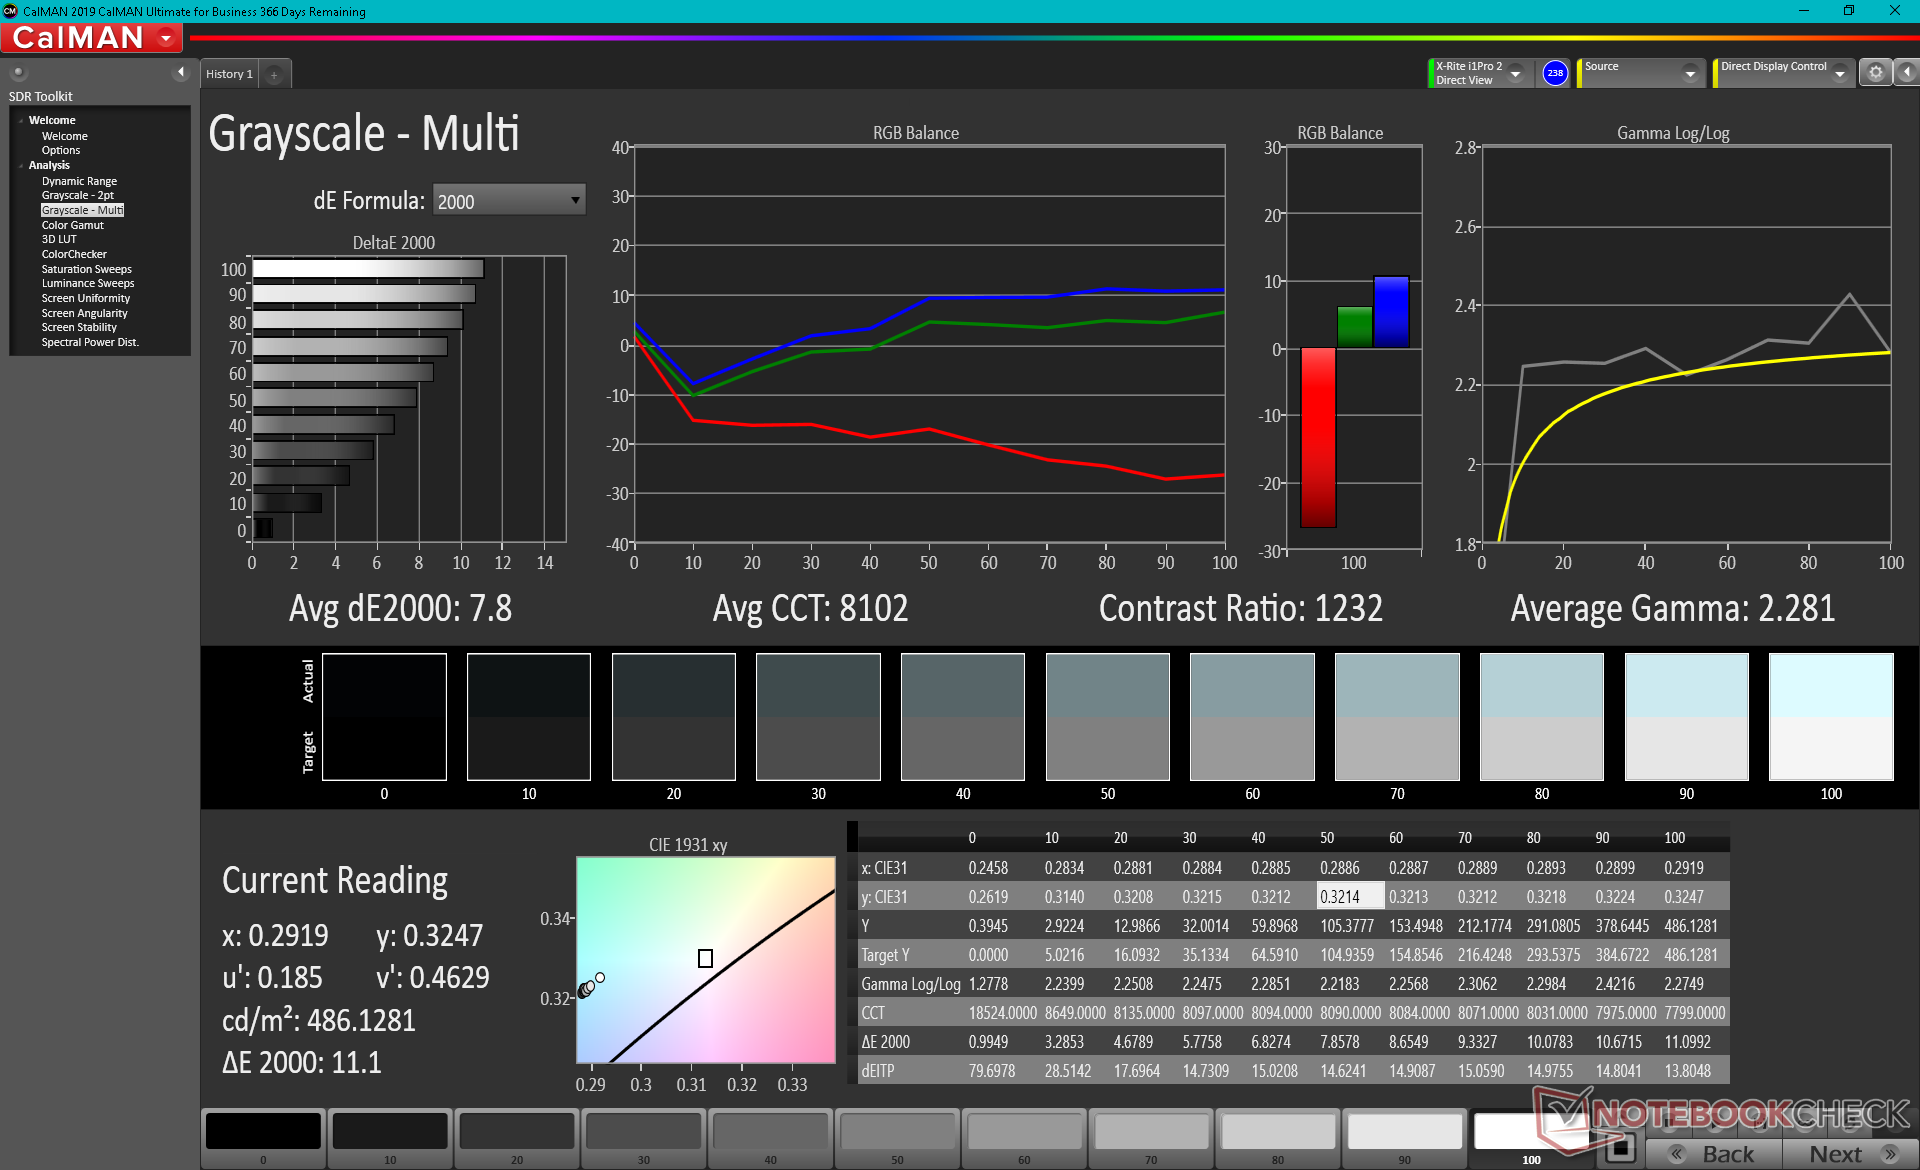
ΔE Greyscale Calman: 7.8 | ∀{0.09-98 Ø5}
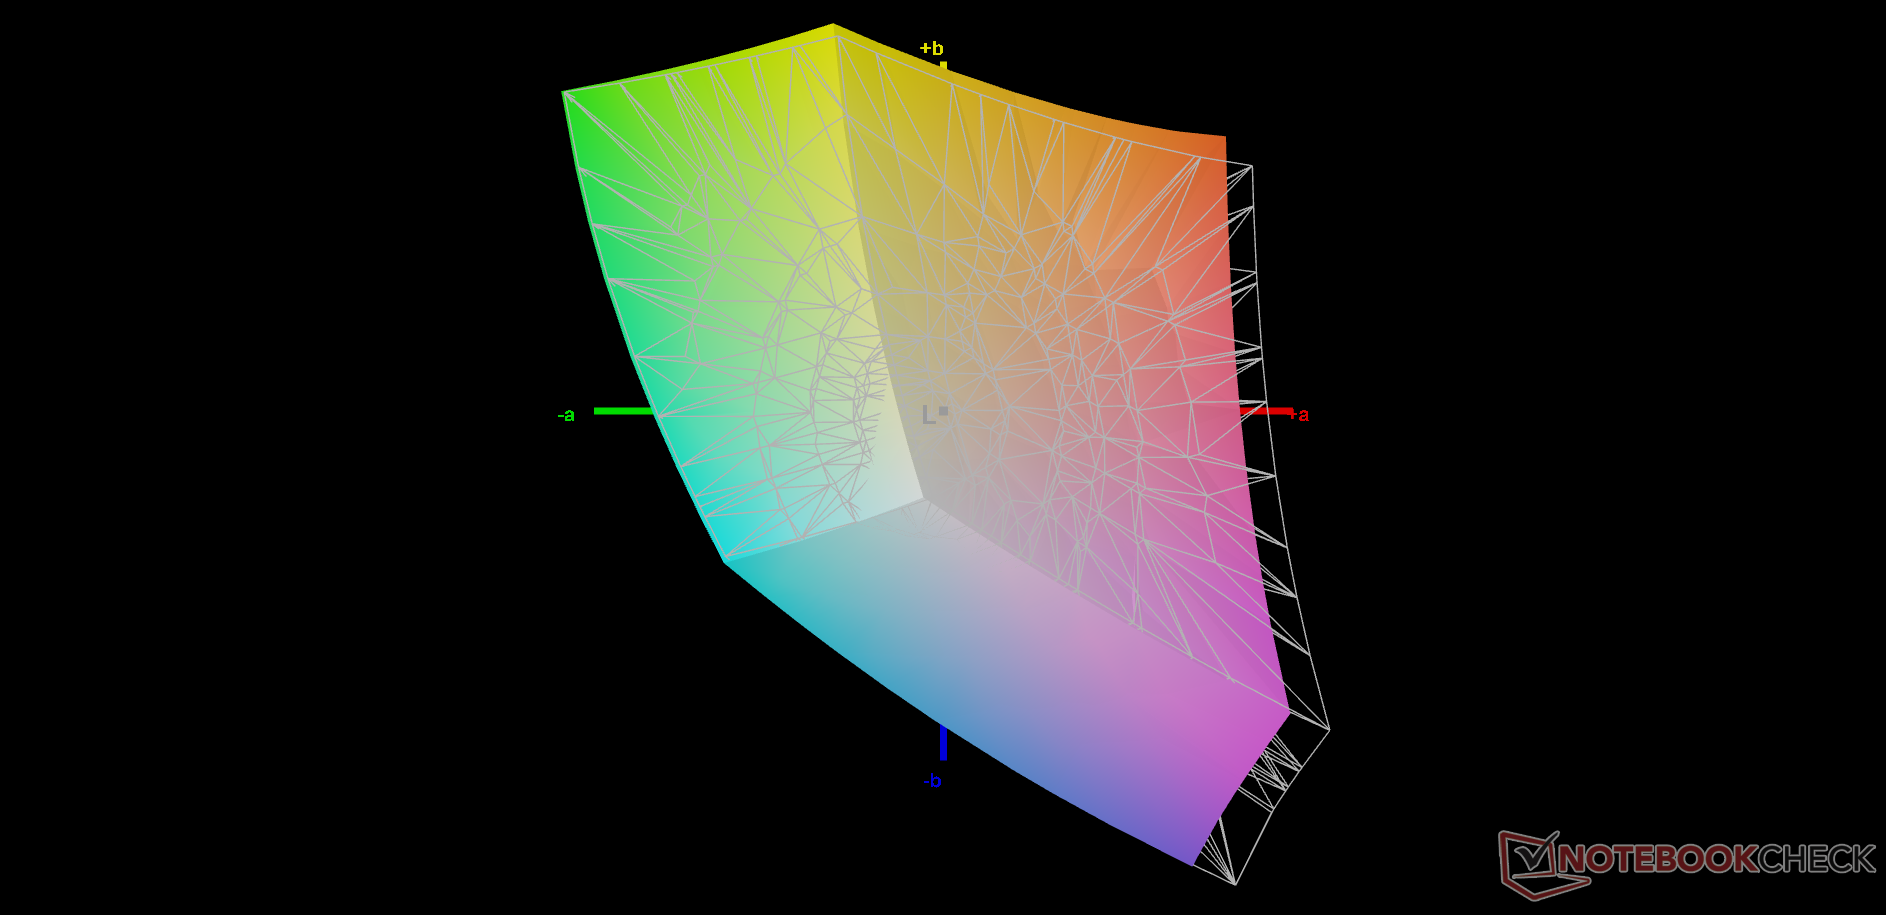
65.5% AdobeRGB 1998 (Argyll 3D)
91.9% sRGB (Argyll 3D)
63.5% Display P3 (Argyll 3D)
Gamma: 2.28
CCT: 8102 K
| Acer Enduro Urban N3 EUN314 XR140EA6T, IPS, 1920x1080, 14" | Dell Latitude 5420 Rugged-P85G AU Optronics AUO523D, IPS, 1920x1080, 14" | Panasonic Toughbook FZ-55 MK2 InfoVision M140NWF5 R3, IPS, 1920x1080, 14" | Durabook S14I KD140N0730A01, TN, 1920x1080, 14" | Getac S410 CMN N140BGE-E33, TN PED, 1366x768, 14" | |
|---|---|---|---|---|---|
| Display | -1% | -44% | -30% | -35% | |
| Display P3 Coverage (%) | 63.5 | 62.5 -2% | 34.8 -45% | 43.55 -31% | 40.46 -36% |
| sRGB Coverage (%) | 91.9 | 92.4 1% | 52.2 -43% | 65.4 -29% | 60.9 -34% |
| AdobeRGB 1998 Coverage (%) | 65.5 | 64.2 -2% | 36 -45% | 45 -31% | 41.8 -36% |
| Response Times | -8% | 32% | 56% | 43% | |
| Response Time Grey 50% / Grey 80% * (ms) | 56 ? | 68 ? -21% | 28.4 ? 49% | 30.4 ? 46% | 41.2 ? 26% |
| Response Time Black / White * (ms) | 35.2 ? | 33.6 ? 5% | 30 ? 15% | 11.8 ? 66% | 14 ? 60% |
| PWM Frequency (Hz) | 1000 ? | 735 ? | 685 ? | 304.9 ? | 877 ? |
| Screen | 26% | 21% | -49% | -71% | |
| Brightness middle (cd/m²) | 487.8 | 1111.7 128% | 1061.1 118% | 1180.7 142% | 265.1 -46% |
| Brightness (cd/m²) | 464 | 1026 121% | 997 115% | 1102 138% | 246 -47% |
| Brightness Distribution (%) | 89 | 80 -10% | 76 -15% | 89 0% | 81 -9% |
| Black Level * (cd/m²) | 0.48 | 0.81 -69% | 0.7 -46% | 1.91 -298% | 0.58 -21% |
| Contrast (:1) | 1016 | 1372 35% | 1516 49% | 618 -39% | 457 -55% |
| Colorchecker dE 2000 * | 6.51 | 3.83 41% | 4.64 29% | 13.45 -107% | 14.24 -119% |
| Colorchecker dE 2000 max. * | 11.36 | 7.85 31% | 20.92 -84% | 22.52 -98% | 26.66 -135% |
| Colorchecker dE 2000 calibrated * | 1.77 | 2.98 -68% | 2.52 -42% | 3.19 -80% | 3.94 -123% |
| Greyscale dE 2000 * | 7.8 | 5.6 28% | 2.8 64% | 15.4 -97% | 14.2 -82% |
| Gamma | 2.28 96% | 2.306 95% | 2.08 106% | 1.97 112% | 2.03 108% |
| CCT | 8102 80% | 7676 85% | 6364 102% | 21134 31% | 17152 38% |
| Color Space (Percent of AdobeRGB 1998) (%) | 59 | 41.6 | 38.7 | ||
| Color Space (Percent of sRGB) (%) | 93 | 65.5 | 61 | ||
| Total Average (Program / Settings) | 6% /
16% | 3% /
9% | -8% /
-30% | -21% /
-47% |
* ... smaller is better
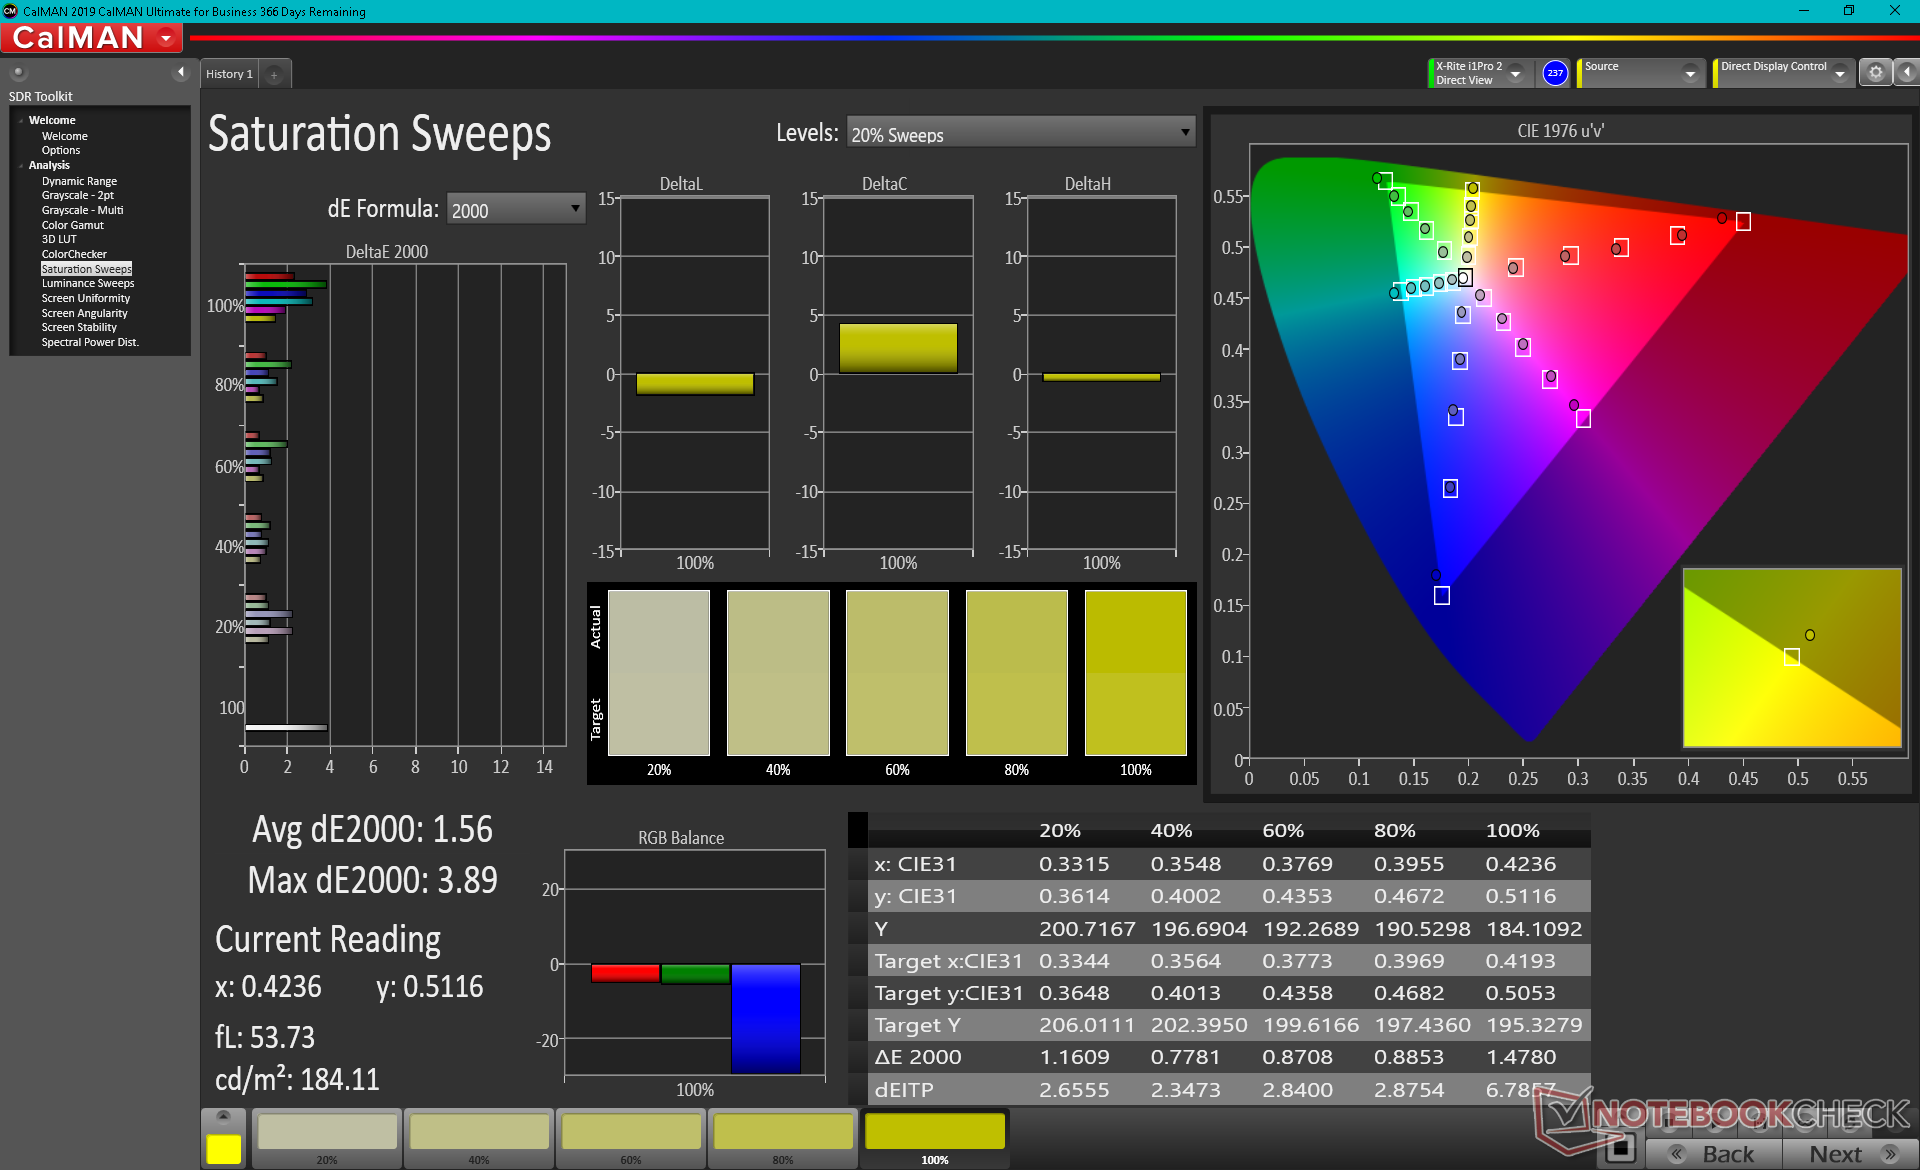
The panel offers >90 percent sRGB coverage which is much higher than on many other rugged or semi-rugged laptops where colors are not typically a priority.
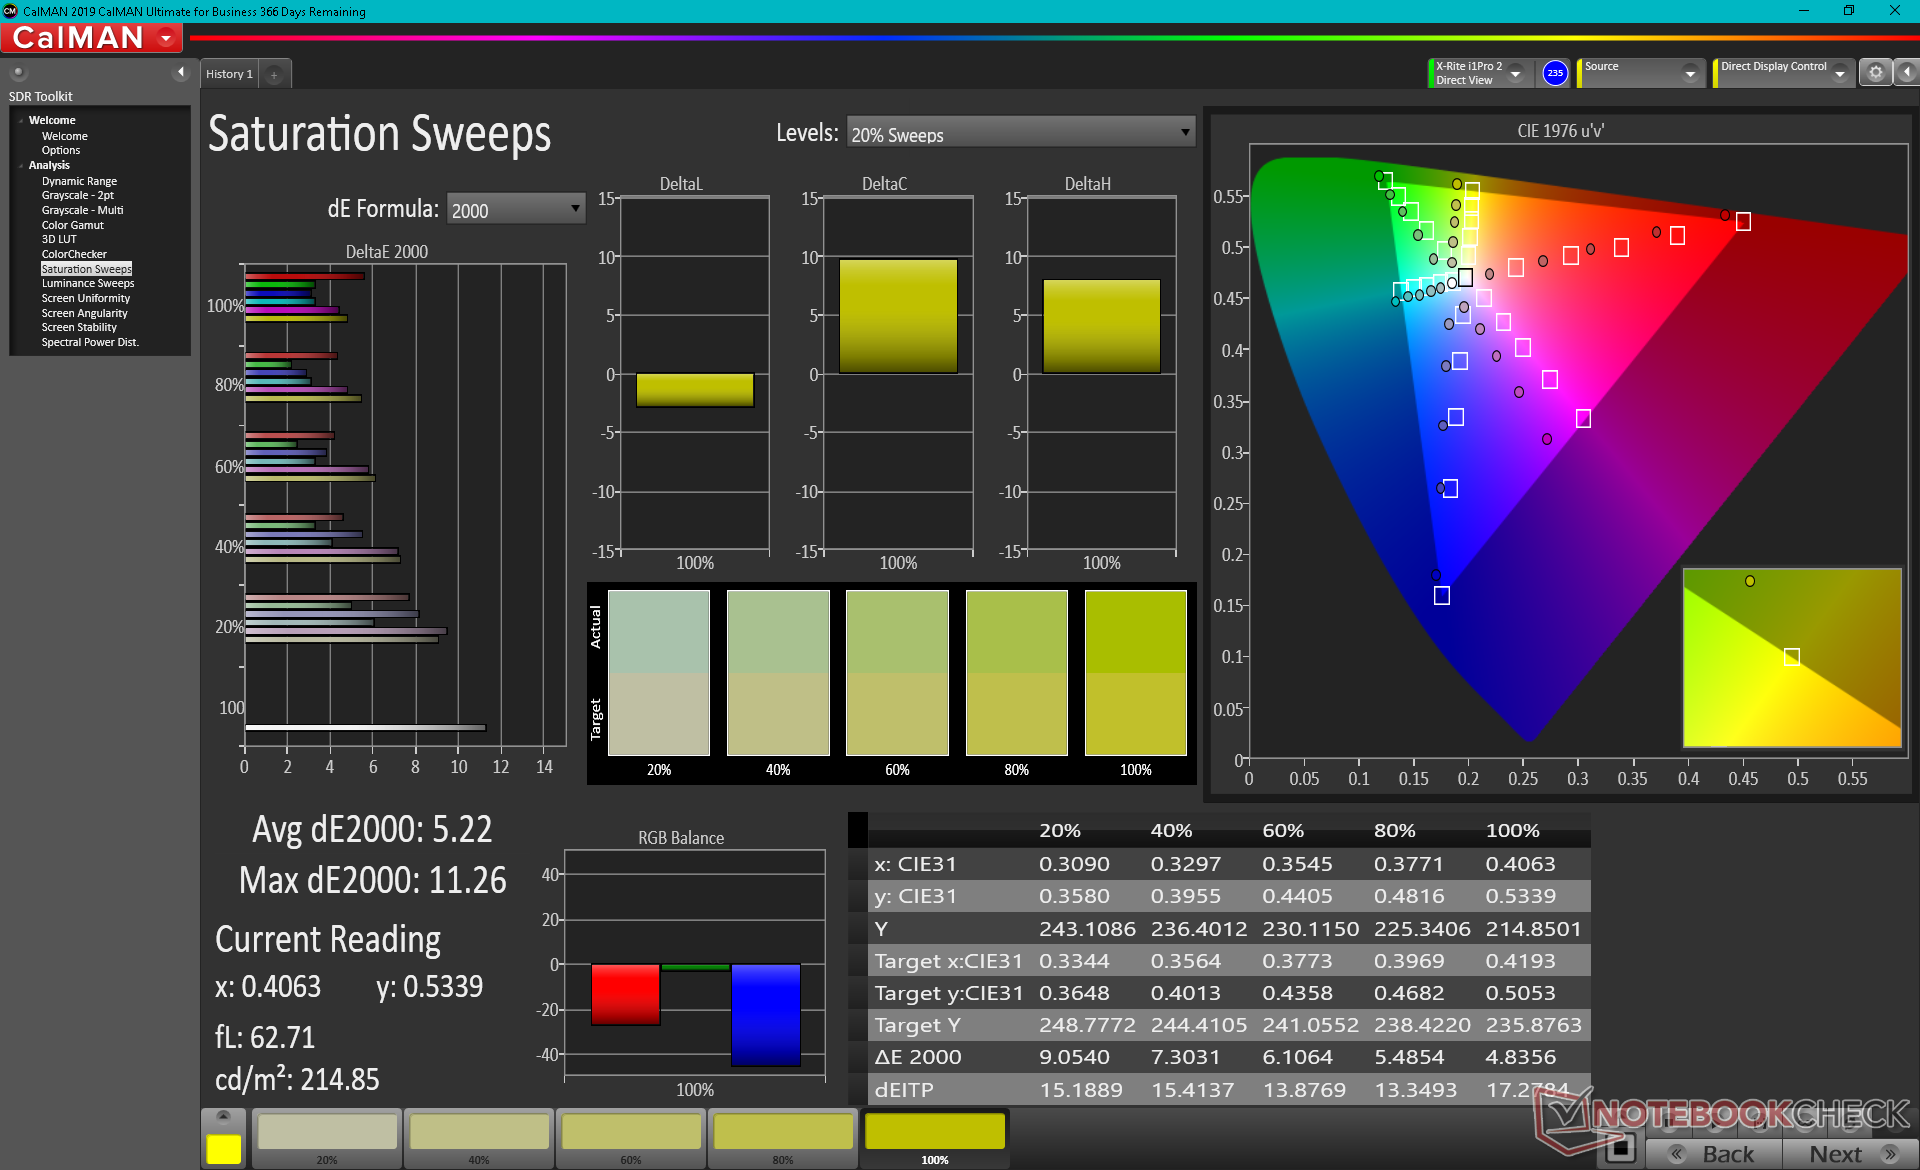
X-Rite colorimeter measurements show color temperature to be far too cool out of the box. Once properly calibrated, grayscale and colors would improve drastically as shown by our CalMAN results below. We recommend an end-user calibration to better exploit the relatively wide color space of the panel.
Display Response Times
| ↔ Response Time Black to White | ||
|---|---|---|
| 35.2 ms ... rise ↗ and fall ↘ combined | ↗ 16.4 ms rise | 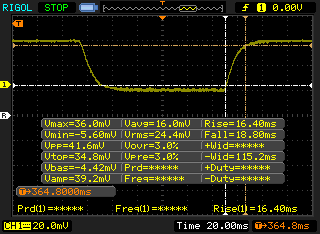 |
| ↘ 18.8 ms fall | ||
| The screen shows slow response rates in our tests and will be unsatisfactory for gamers. In comparison, all tested devices range from 0.1 (minimum) to 240 (maximum) ms. » 93 % of all devices are better. This means that the measured response time is worse than the average of all tested devices (20 ms). | ||
| ↔ Response Time 50% Grey to 80% Grey | ||
| 56 ms ... rise ↗ and fall ↘ combined | ↗ 25.2 ms rise | 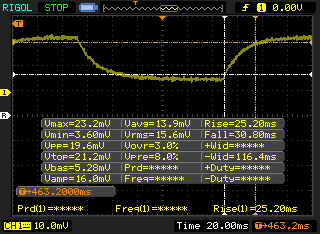 |
| ↘ 30.8 ms fall | ||
| The screen shows slow response rates in our tests and will be unsatisfactory for gamers. In comparison, all tested devices range from 0.165 (minimum) to 636 (maximum) ms. » 92 % of all devices are better. This means that the measured response time is worse than the average of all tested devices (31.4 ms). | ||
Screen Flickering / PWM (Pulse-Width Modulation)
| Screen flickering / PWM detected | 1000 Hz | ≤ 99 % brightness setting | 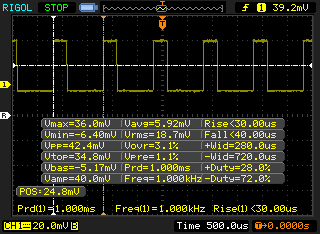 |
The display backlight flickers at 1000 Hz (worst case, e.g., utilizing PWM) Flickering detected at a brightness setting of 99 % and below. There should be no flickering or PWM above this brightness setting. The frequency of 1000 Hz is quite high, so most users sensitive to PWM should not notice any flickering. In comparison: 53 % of all tested devices do not use PWM to dim the display. If PWM was detected, an average of 7979 (minimum: 5 - maximum: 343500) Hz was measured. | |||
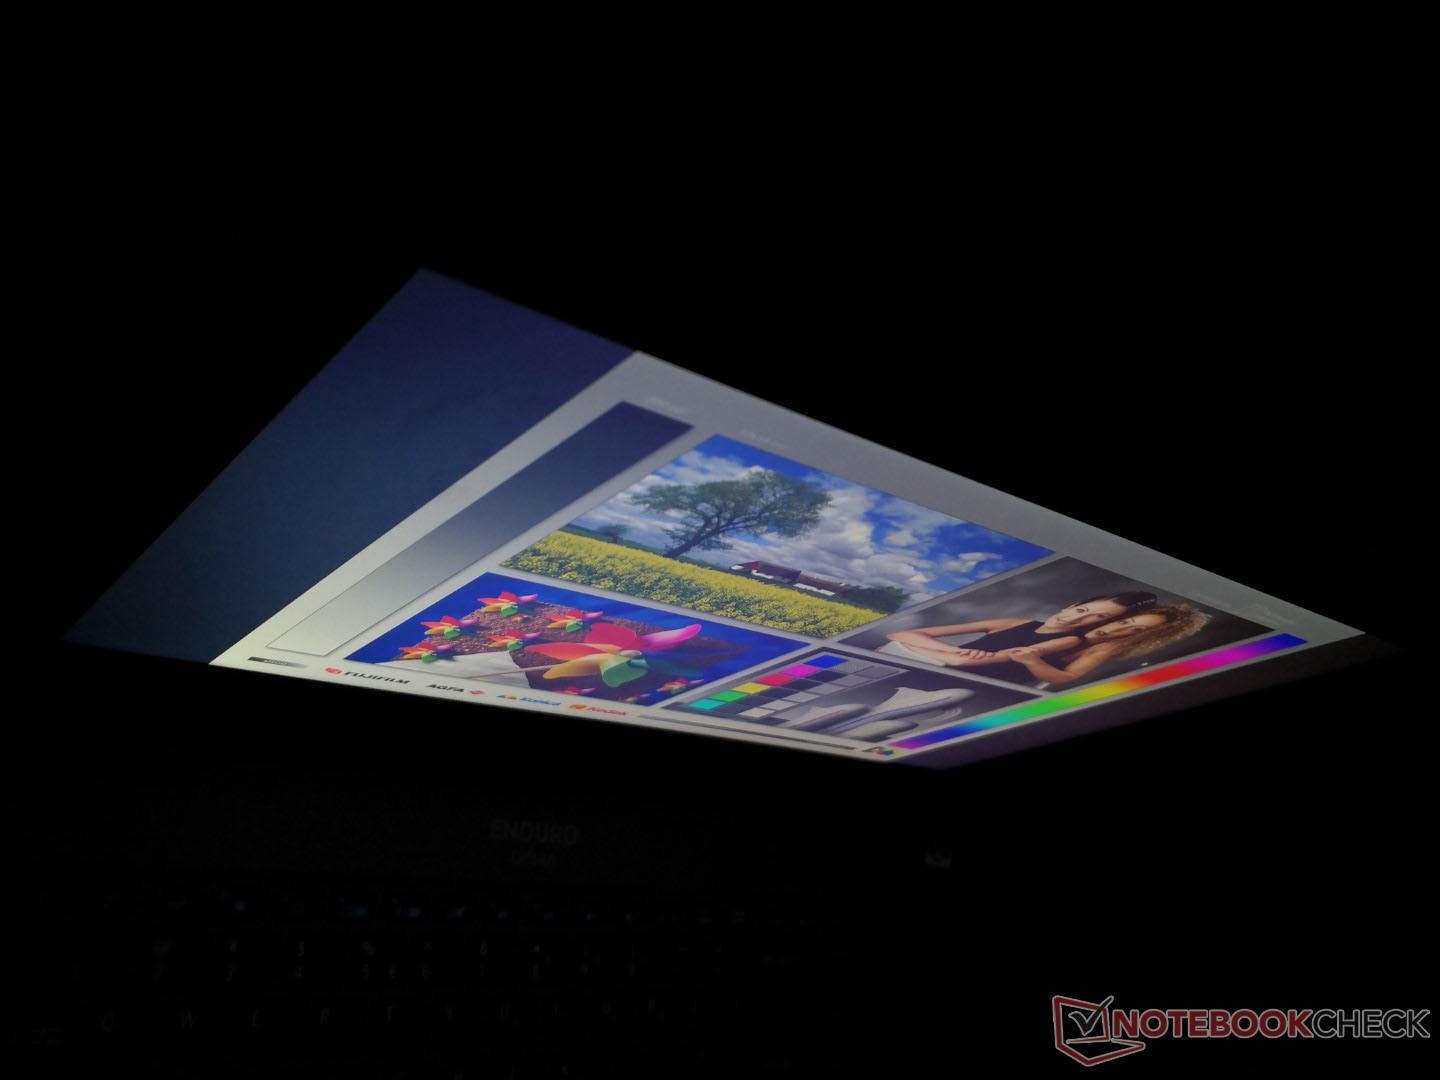
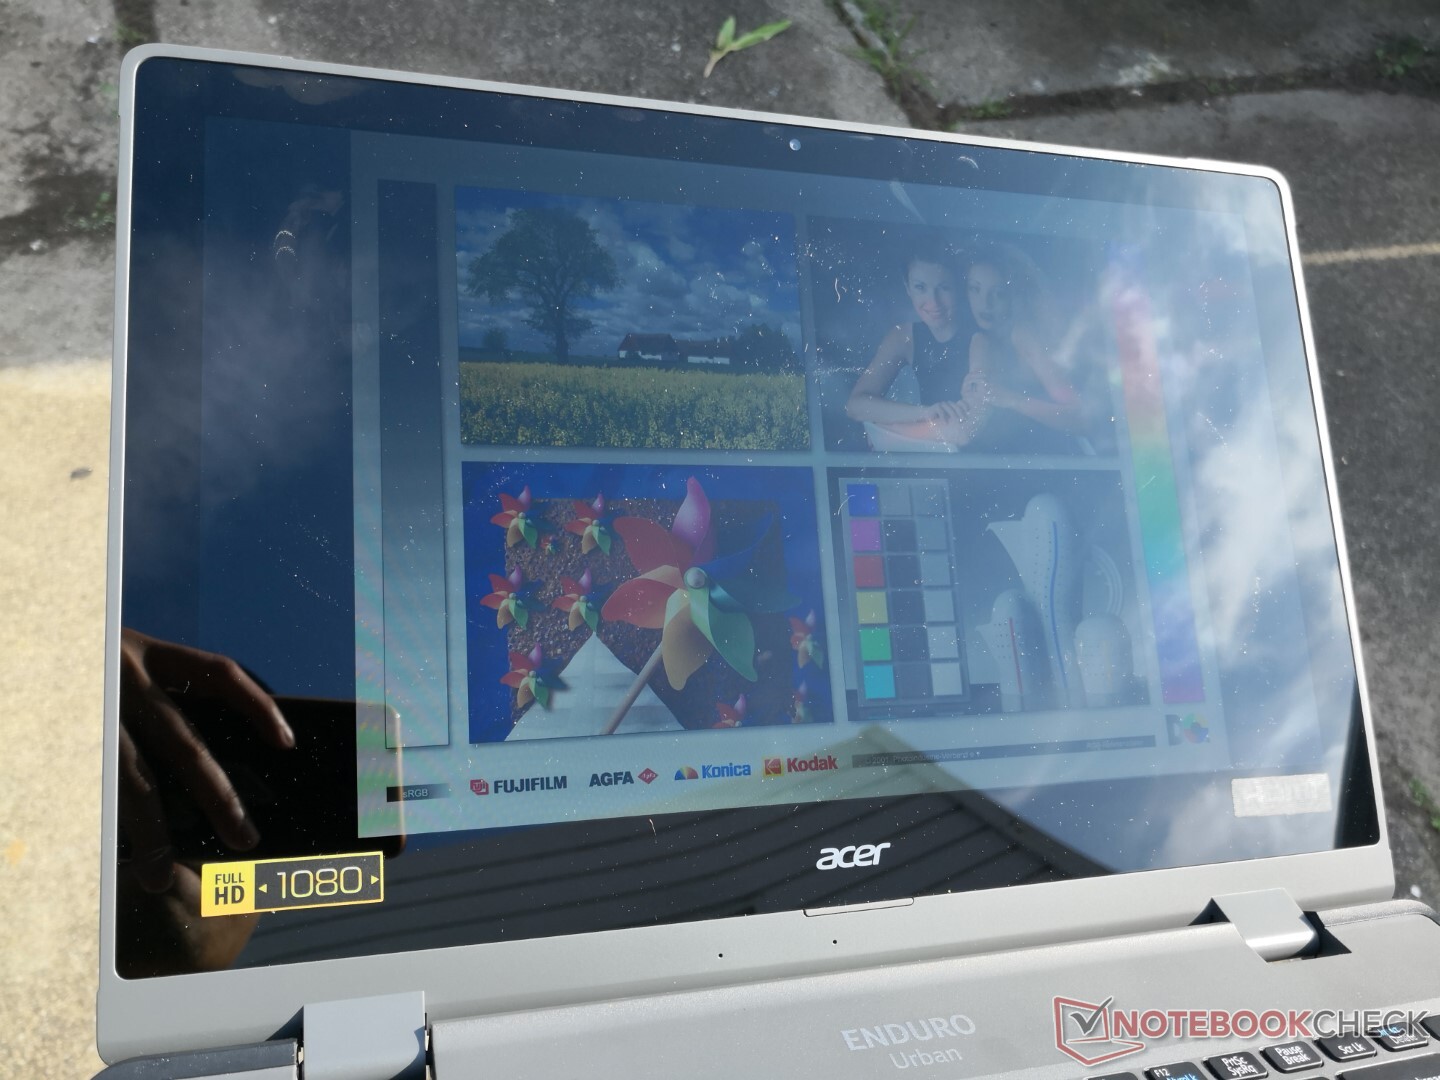
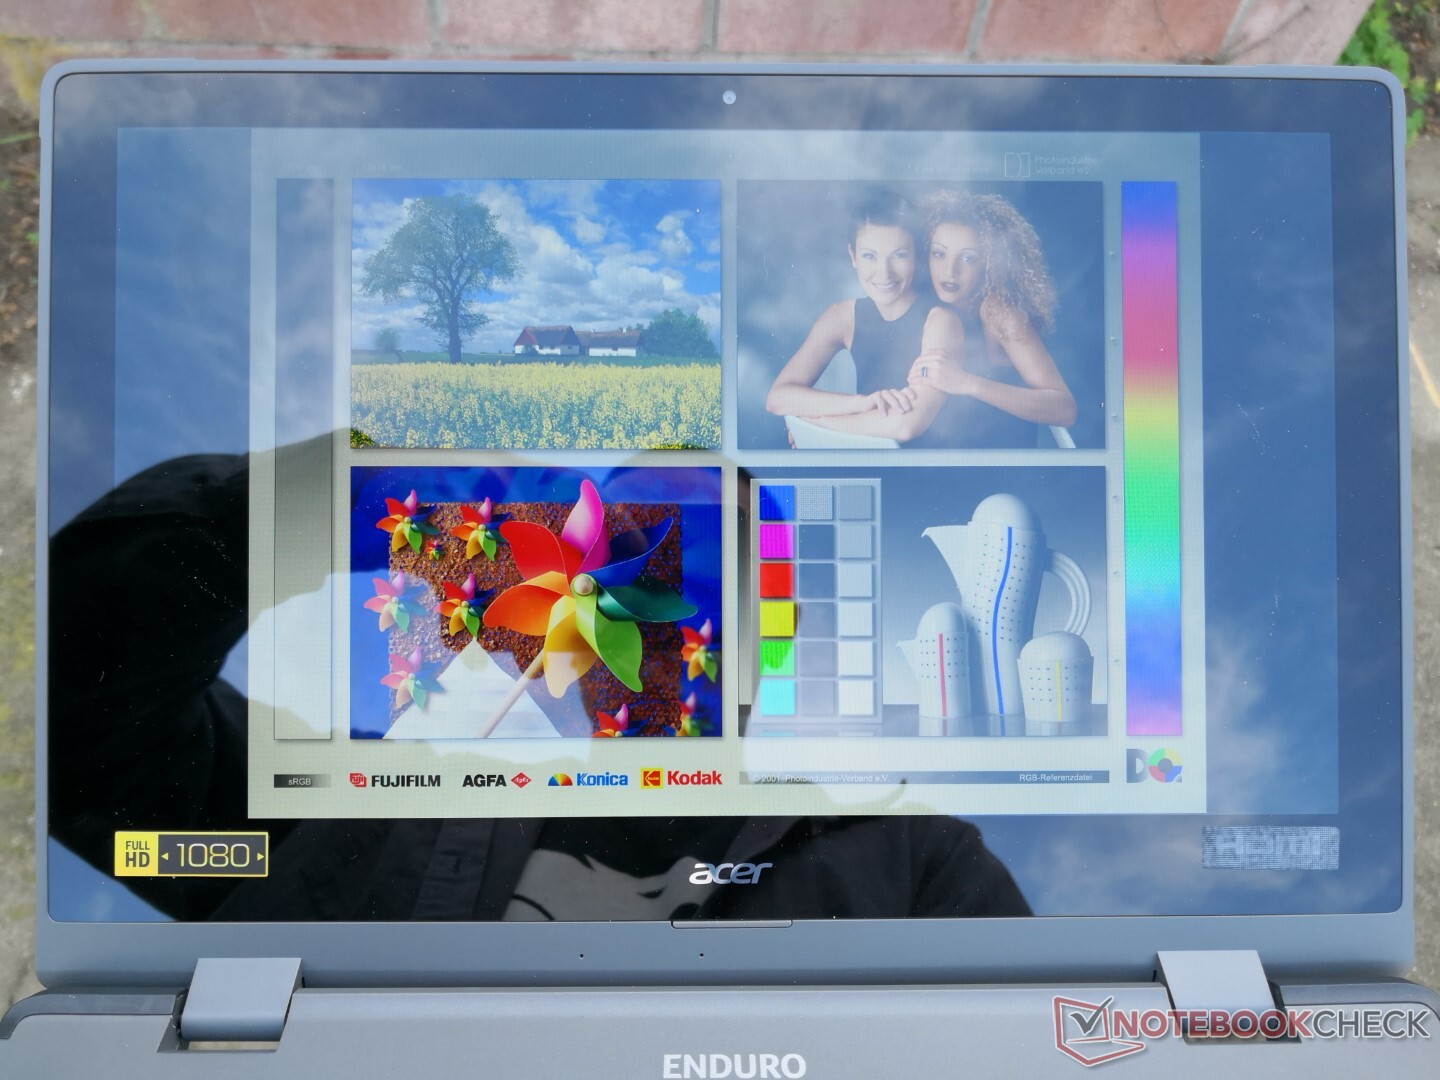
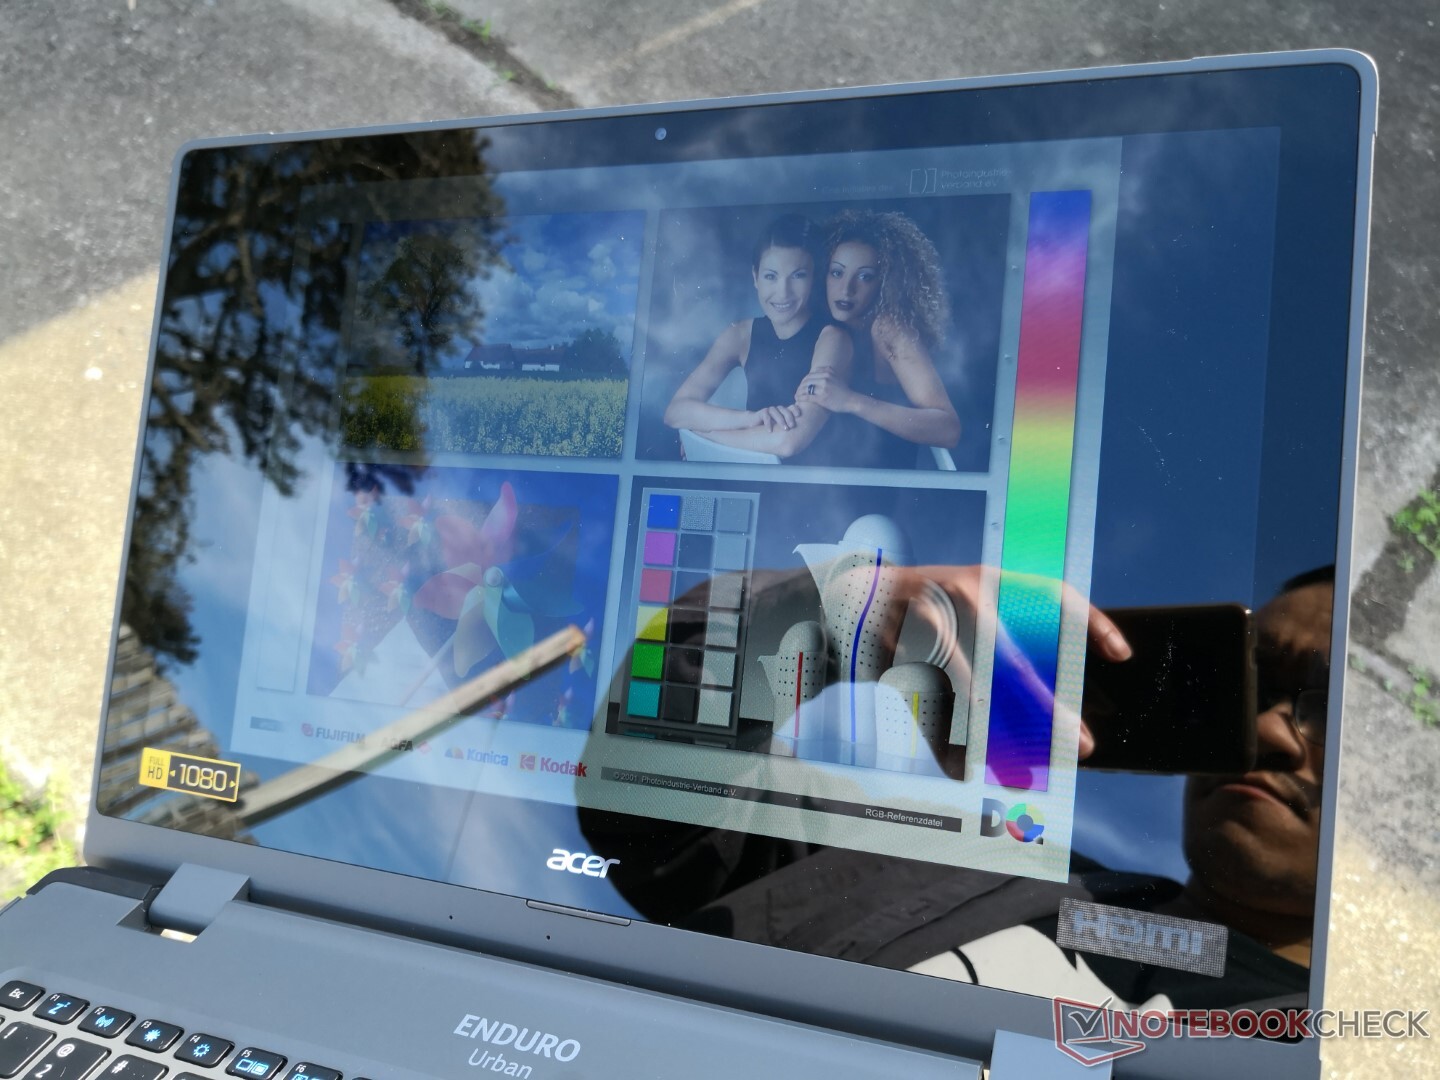
Outdoor visibility is generally better than most consumer-grade laptops like the Dell XPS since the Acer display is noticeably brighter. However, glare is still present and difficult to ignore due to the glossy overlay. A matte option would have been desirable instead of forcing glossy on all configurations.
Performance
Testing Conditions
Our unit was set to Best Performance mode via Windows prior to running any performance benchmarks below for the highest possible scores.
Processor
CPU performance is excellent and about 40 percent faster than the Durabook S14I even though they both carry the same Core i7-1165G7 CPU. Downgrading to the Core i5-1135G7 configuration is expected to entail only very slight performance losses based on our experience with other Core i5-1135G7 laptops.
Cinebench R15 Multi Loop
Cinebench R23: Multi Core | Single Core
Cinebench R20: CPU (Multi Core) | CPU (Single Core)
Cinebench R15: CPU Multi 64Bit | CPU Single 64Bit
Blender: v2.79 BMW27 CPU
7-Zip 18.03: 7z b 4 | 7z b 4 -mmt1
Geekbench 5.5: Multi-Core | Single-Core
HWBOT x265 Benchmark v2.2: 4k Preset
LibreOffice : 20 Documents To PDF
R Benchmark 2.5: Overall mean
* ... smaller is better
AIDA64: FP32 Ray-Trace | FPU Julia | CPU SHA3 | CPU Queen | FPU SinJulia | FPU Mandel | CPU AES | CPU ZLib | FP64 Ray-Trace | CPU PhotoWorxx
| Performance rating | |
| Acer Enduro Urban N3 EUN314 | |
| Average Intel Core i7-1165G7 | |
| Panasonic Toughbook FZ-55 MK2 | |
| Durabook S14I | |
| AIDA64 / FP32 Ray-Trace | |
| Acer Enduro Urban N3 EUN314 | |
| Average Intel Core i7-1165G7 (3933 - 8184, n=58) | |
| Panasonic Toughbook FZ-55 MK2 | |
| Durabook S14I | |
| AIDA64 / FPU Julia | |
| Acer Enduro Urban N3 EUN314 | |
| Panasonic Toughbook FZ-55 MK2 | |
| Average Intel Core i7-1165G7 (17720 - 34369, n=58) | |
| Durabook S14I | |
| AIDA64 / CPU SHA3 | |
| Acer Enduro Urban N3 EUN314 | |
| Average Intel Core i7-1165G7 (958 - 2338, n=58) | |
| Panasonic Toughbook FZ-55 MK2 | |
| Durabook S14I | |
| AIDA64 / CPU Queen | |
| Acer Enduro Urban N3 EUN314 | |
| Durabook S14I | |
| Panasonic Toughbook FZ-55 MK2 | |
| Average Intel Core i7-1165G7 (44161 - 50624, n=58) | |
| AIDA64 / FPU SinJulia | |
| Acer Enduro Urban N3 EUN314 | |
| Panasonic Toughbook FZ-55 MK2 | |
| Average Intel Core i7-1165G7 (3183 - 4796, n=58) | |
| Durabook S14I | |
| AIDA64 / FPU Mandel | |
| Acer Enduro Urban N3 EUN314 | |
| Panasonic Toughbook FZ-55 MK2 | |
| Average Intel Core i7-1165G7 (11876 - 20468, n=58) | |
| Durabook S14I | |
| AIDA64 / CPU AES | |
| Acer Enduro Urban N3 EUN314 | |
| Average Intel Core i7-1165G7 (29506 - 73387, n=58) | |
| Durabook S14I | |
| Panasonic Toughbook FZ-55 MK2 | |
| AIDA64 / CPU ZLib | |
| Acer Enduro Urban N3 EUN314 | |
| Average Intel Core i7-1165G7 (169 - 402, n=65) | |
| Panasonic Toughbook FZ-55 MK2 | |
| Durabook S14I | |
| AIDA64 / FP64 Ray-Trace | |
| Acer Enduro Urban N3 EUN314 | |
| Panasonic Toughbook FZ-55 MK2 | |
| Average Intel Core i7-1165G7 (2033 - 4461, n=58) | |
| Durabook S14I | |
| AIDA64 / CPU PhotoWorxx | |
| Average Intel Core i7-1165G7 (12392 - 45694, n=58) | |
| Acer Enduro Urban N3 EUN314 | |
| Panasonic Toughbook FZ-55 MK2 | |
| Durabook S14I | |
System Performance
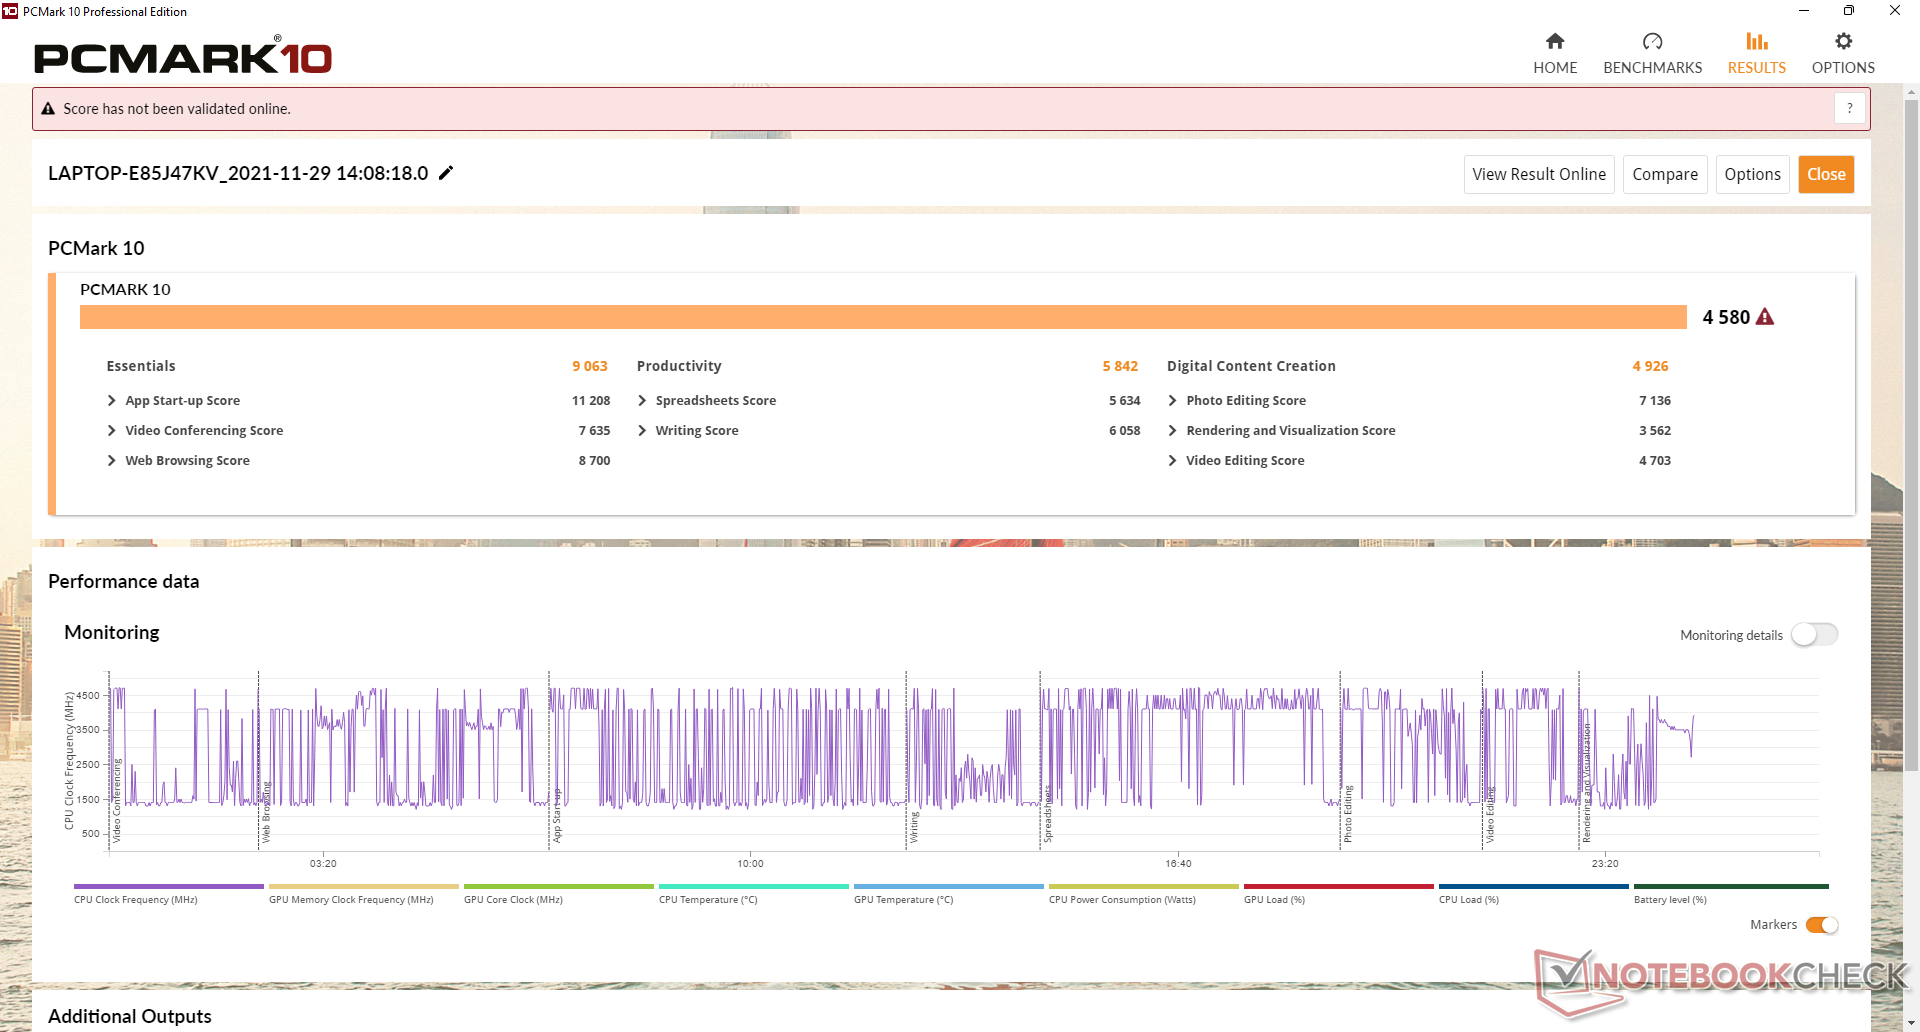
PCMark results are strangely behind the DuraBook S14I even though our Acer has the same CPU but with a higher PL1 target (28 W vs. 15 W).
| PCMark 10 / Score | |
| Panasonic Toughbook FZ-55 MK2 | |
| Average Intel Core i7-1165G7, Intel Iris Xe Graphics G7 96EUs (4531 - 5454, n=50) | |
| Durabook S14I | |
| Acer Enduro Urban N3 EUN314 | |
| Dell Latitude 5420 Rugged-P85G | |
| Getac S410 | |
| PCMark 10 / Essentials | |
| Panasonic Toughbook FZ-55 MK2 | |
| Durabook S14I | |
| Average Intel Core i7-1165G7, Intel Iris Xe Graphics G7 96EUs (8997 - 11505, n=50) | |
| Acer Enduro Urban N3 EUN314 | |
| Dell Latitude 5420 Rugged-P85G | |
| Getac S410 | |
| PCMark 10 / Productivity | |
| Dell Latitude 5420 Rugged-P85G | |
| Durabook S14I | |
| Getac S410 | |
| Average Intel Core i7-1165G7, Intel Iris Xe Graphics G7 96EUs (5570 - 7136, n=50) | |
| Panasonic Toughbook FZ-55 MK2 | |
| Acer Enduro Urban N3 EUN314 | |
| PCMark 10 / Digital Content Creation | |
| Panasonic Toughbook FZ-55 MK2 | |
| Average Intel Core i7-1165G7, Intel Iris Xe Graphics G7 96EUs (4083 - 5550, n=50) | |
| Acer Enduro Urban N3 EUN314 | |
| Durabook S14I | |
| Dell Latitude 5420 Rugged-P85G | |
| Getac S410 | |
| PCMark 10 Score | 4580 points | |
Help | ||
| AIDA64 / Memory Copy | |
| Average Intel Core i7-1165G7 (20032 - 65446, n=58) | |
| Acer Enduro Urban N3 EUN314 | |
| Panasonic Toughbook FZ-55 MK2 | |
| Durabook S14I | |
| AIDA64 / Memory Read | |
| Average Intel Core i7-1165G7 (23033 - 64524, n=58) | |
| Acer Enduro Urban N3 EUN314 | |
| Panasonic Toughbook FZ-55 MK2 | |
| Durabook S14I | |
| AIDA64 / Memory Write | |
| Average Intel Core i7-1165G7 (21736 - 66791, n=58) | |
| Acer Enduro Urban N3 EUN314 | |
| Panasonic Toughbook FZ-55 MK2 | |
| Durabook S14I | |
| AIDA64 / Memory Latency | |
| Acer Enduro Urban N3 EUN314 | |
| Panasonic Toughbook FZ-55 MK2 | |
| Average Intel Core i7-1165G7 (69 - 110, n=65) | |
| Durabook S14I | |
* ... smaller is better
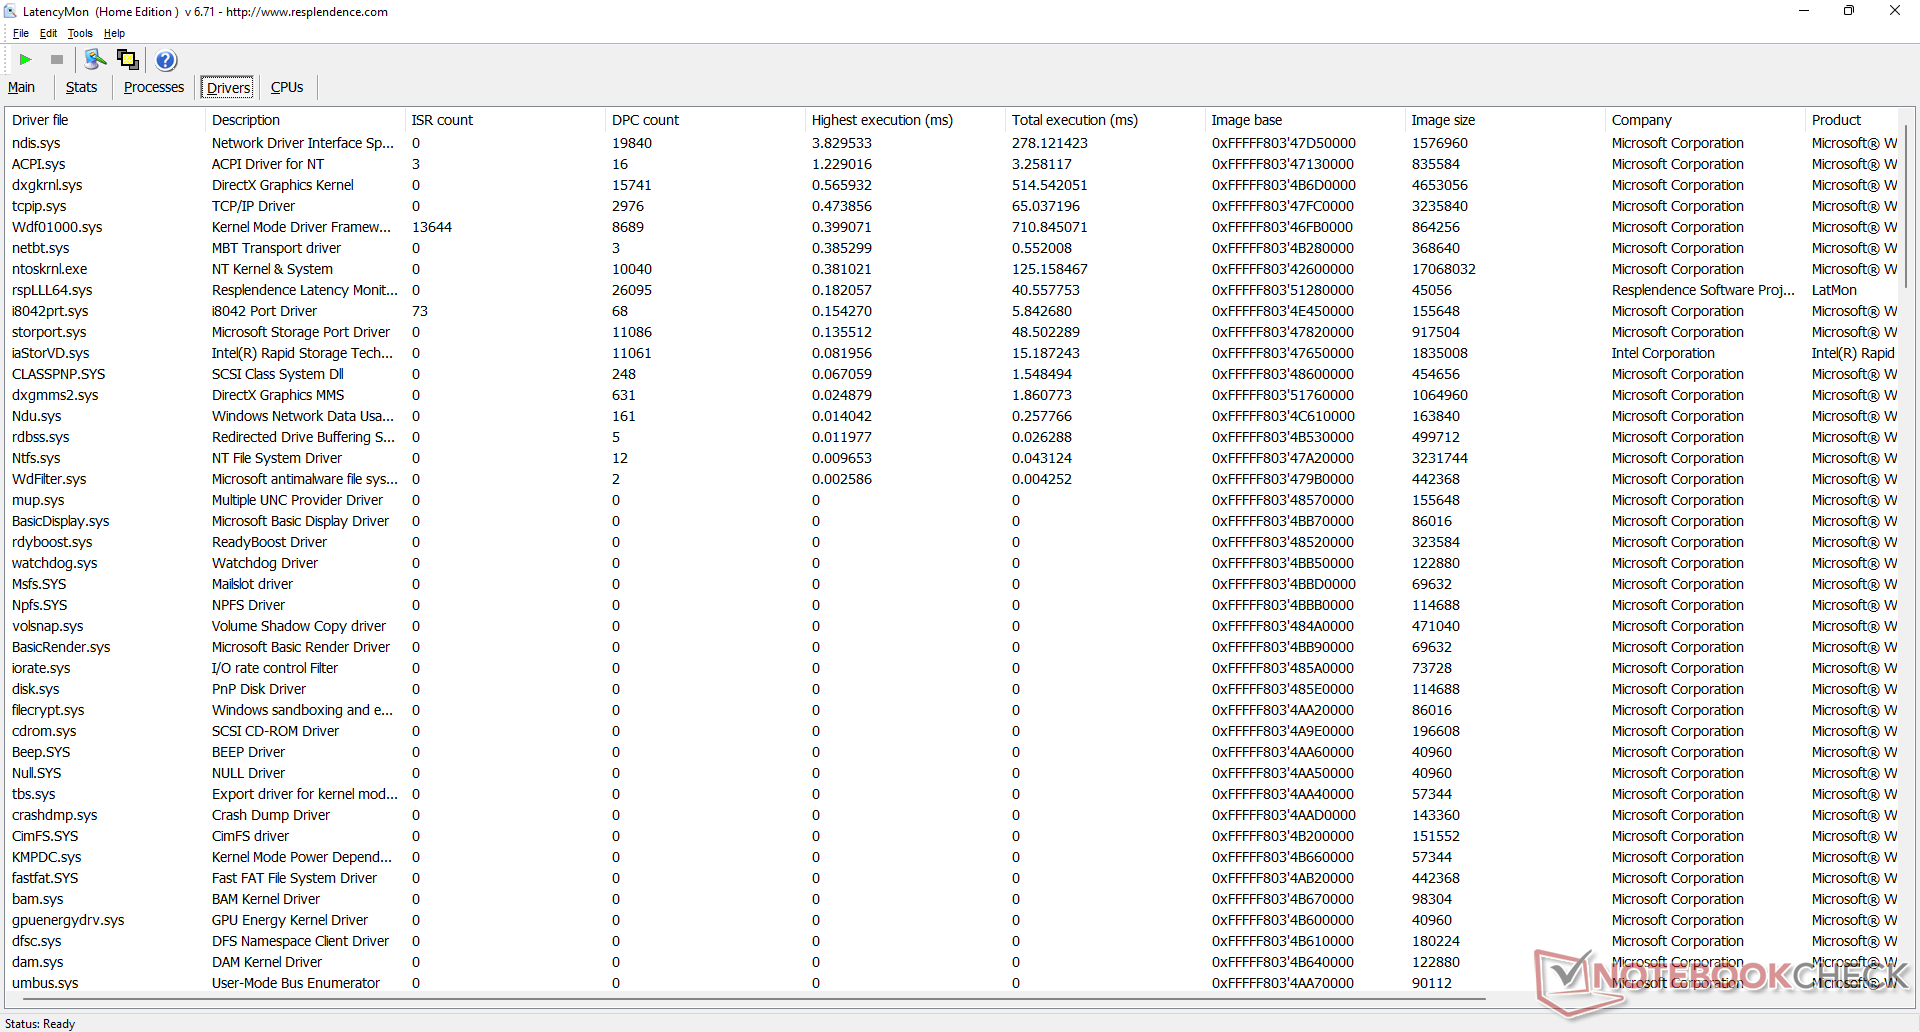
DPC Latency
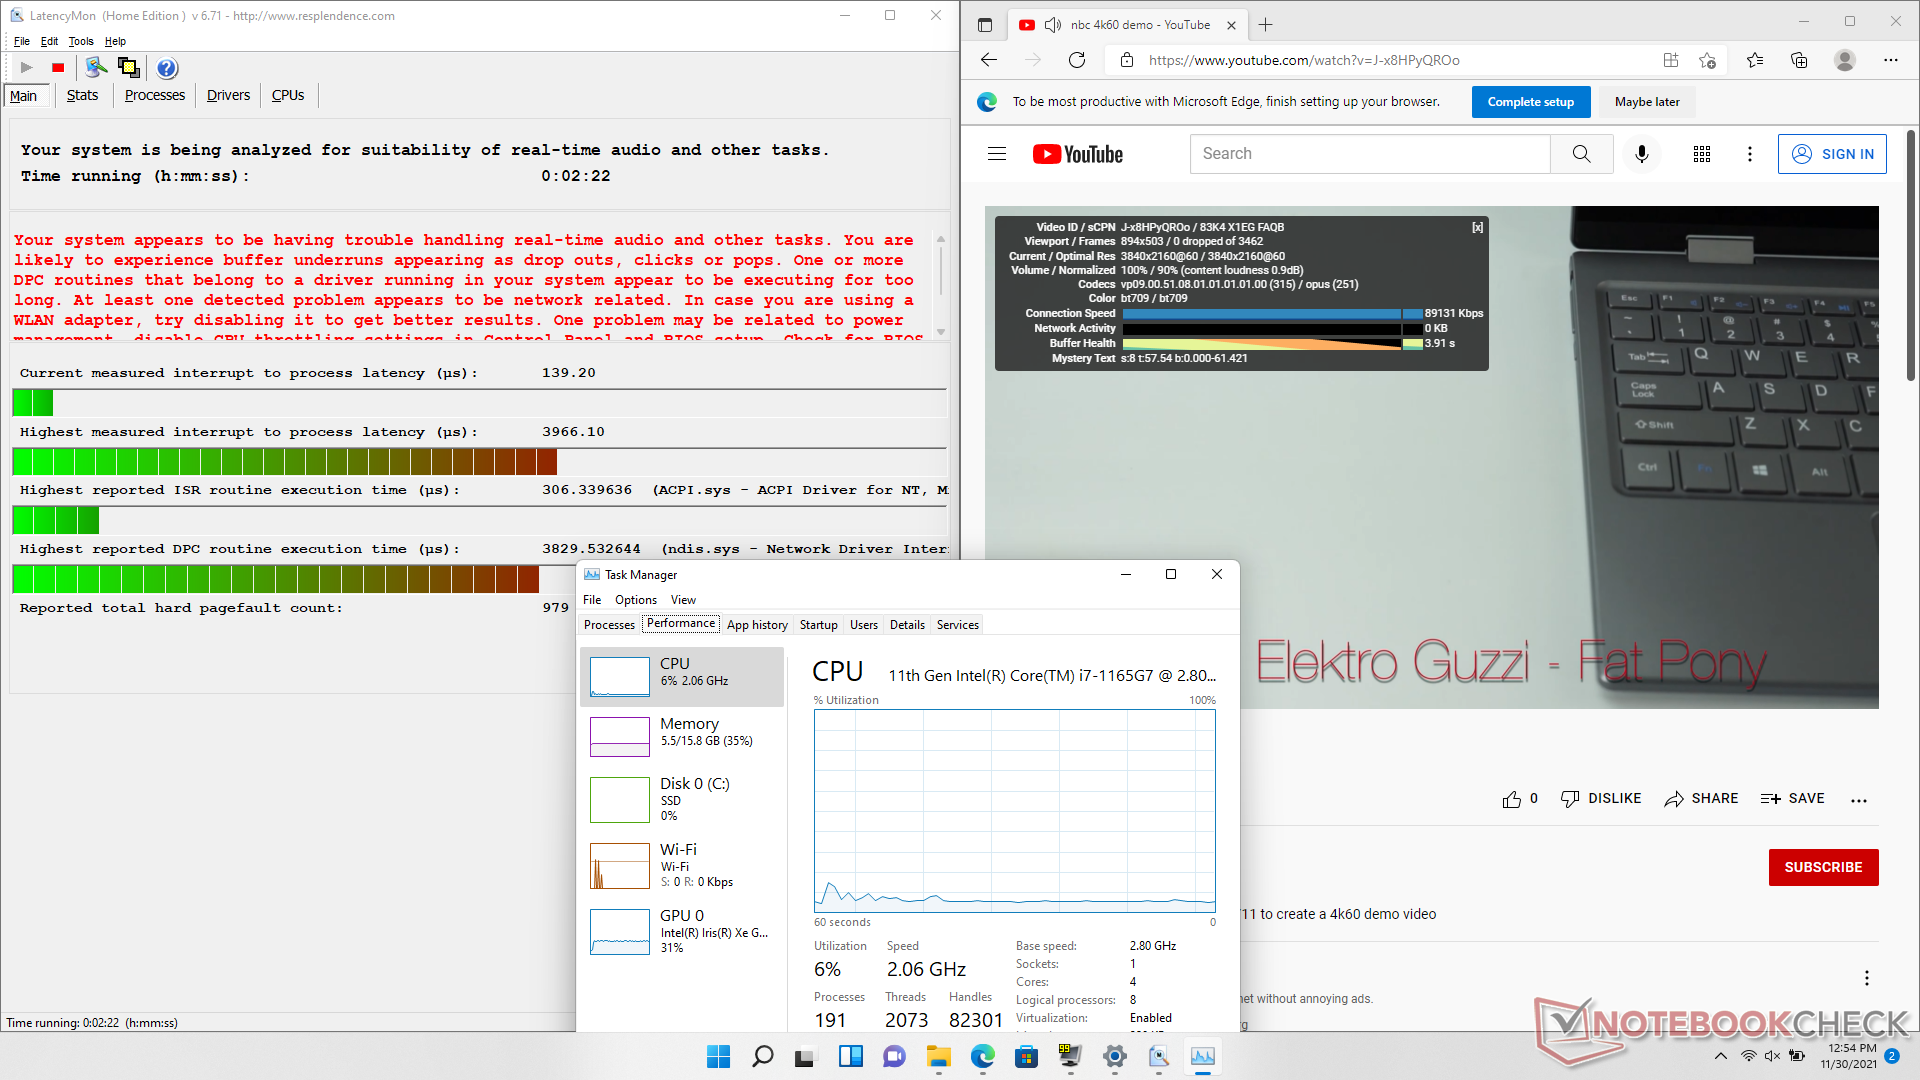
LatencyMon shows DPC issues when opening multiple browser tabs on our homepage. 4K video playback at 60 FPS is otherwise smooth and without any dropped frames.
| DPC Latencies / LatencyMon - interrupt to process latency (max), Web, Youtube, Prime95 | |
| Acer Enduro Urban N3 EUN314 | |
| Panasonic Toughbook FZ-55 MK2 | |
| Durabook S14I | |
* ... smaller is better
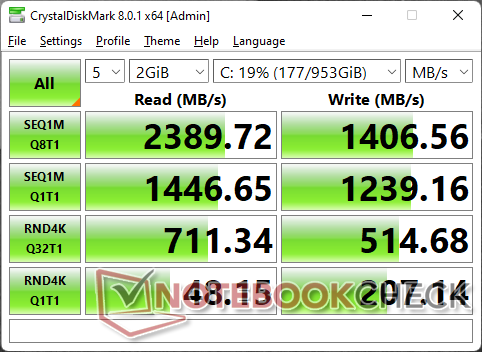
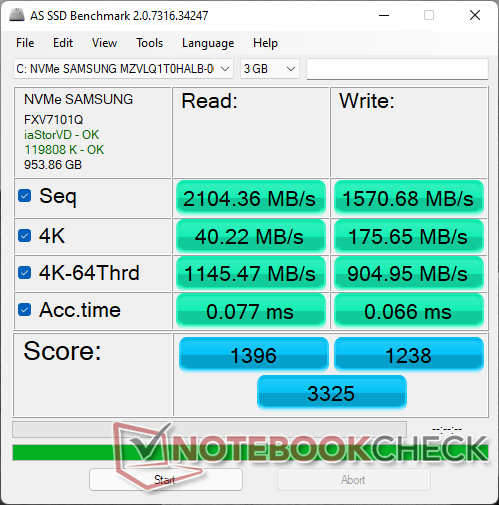
Storage Devices
Our unit comes with a 1 TB Samsung PM991 (not PM991a) which is a mid-range PCIe3 NVMe SSD. Sequential read rates top out at 2300 MB/s, but the lack of a heat spreader to aid in cooling means that performance will drop when stressed as shown by our DiskSpd Read Loop test results below. Annoyingly, users are only able to add a second storage drive on some SKUs and not all.

| Drive Performance rating - Percent | |
| Acer Enduro Urban N3 EUN314 | |
| Durabook S14I | |
| Dell Latitude 5420 Rugged-P85G -8! | |
| Panasonic Toughbook FZ-55 MK2 | |
| Getac S410 -8! | |
* ... smaller is better
Disk Throttling: DiskSpd Read Loop, Queue Depth 8
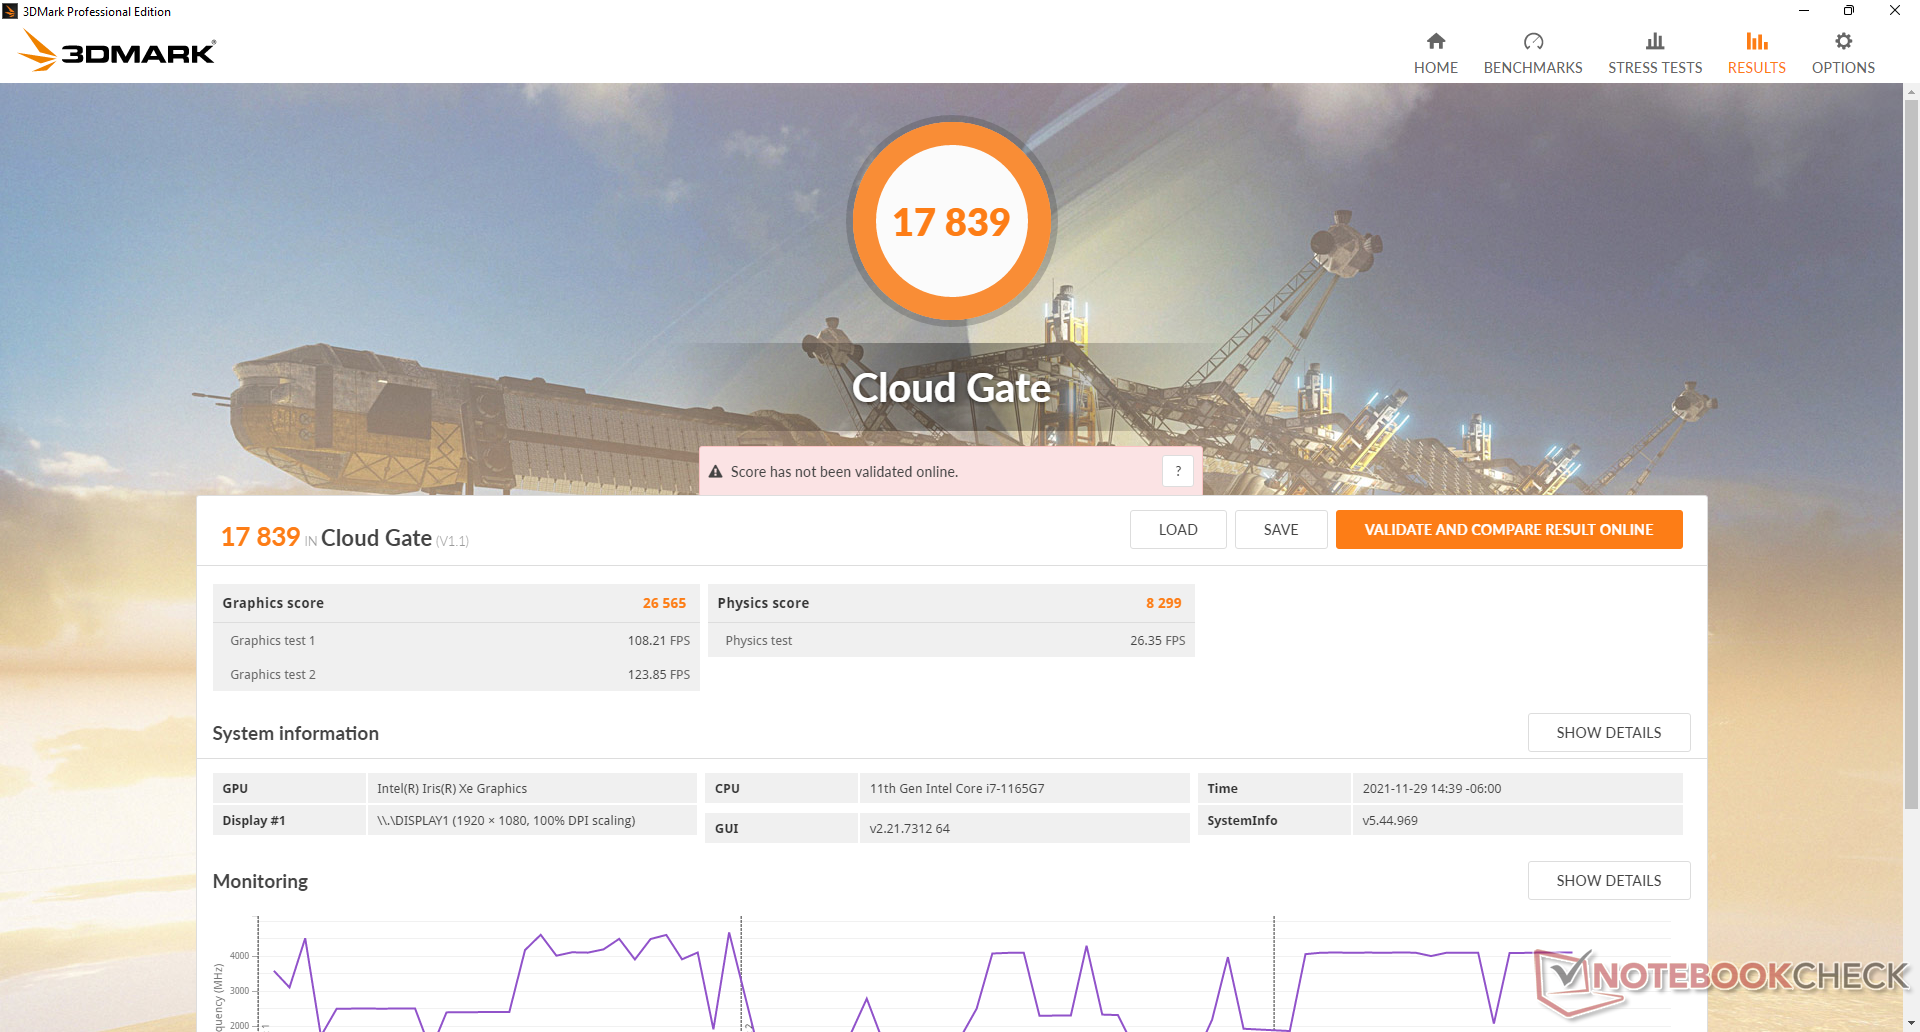
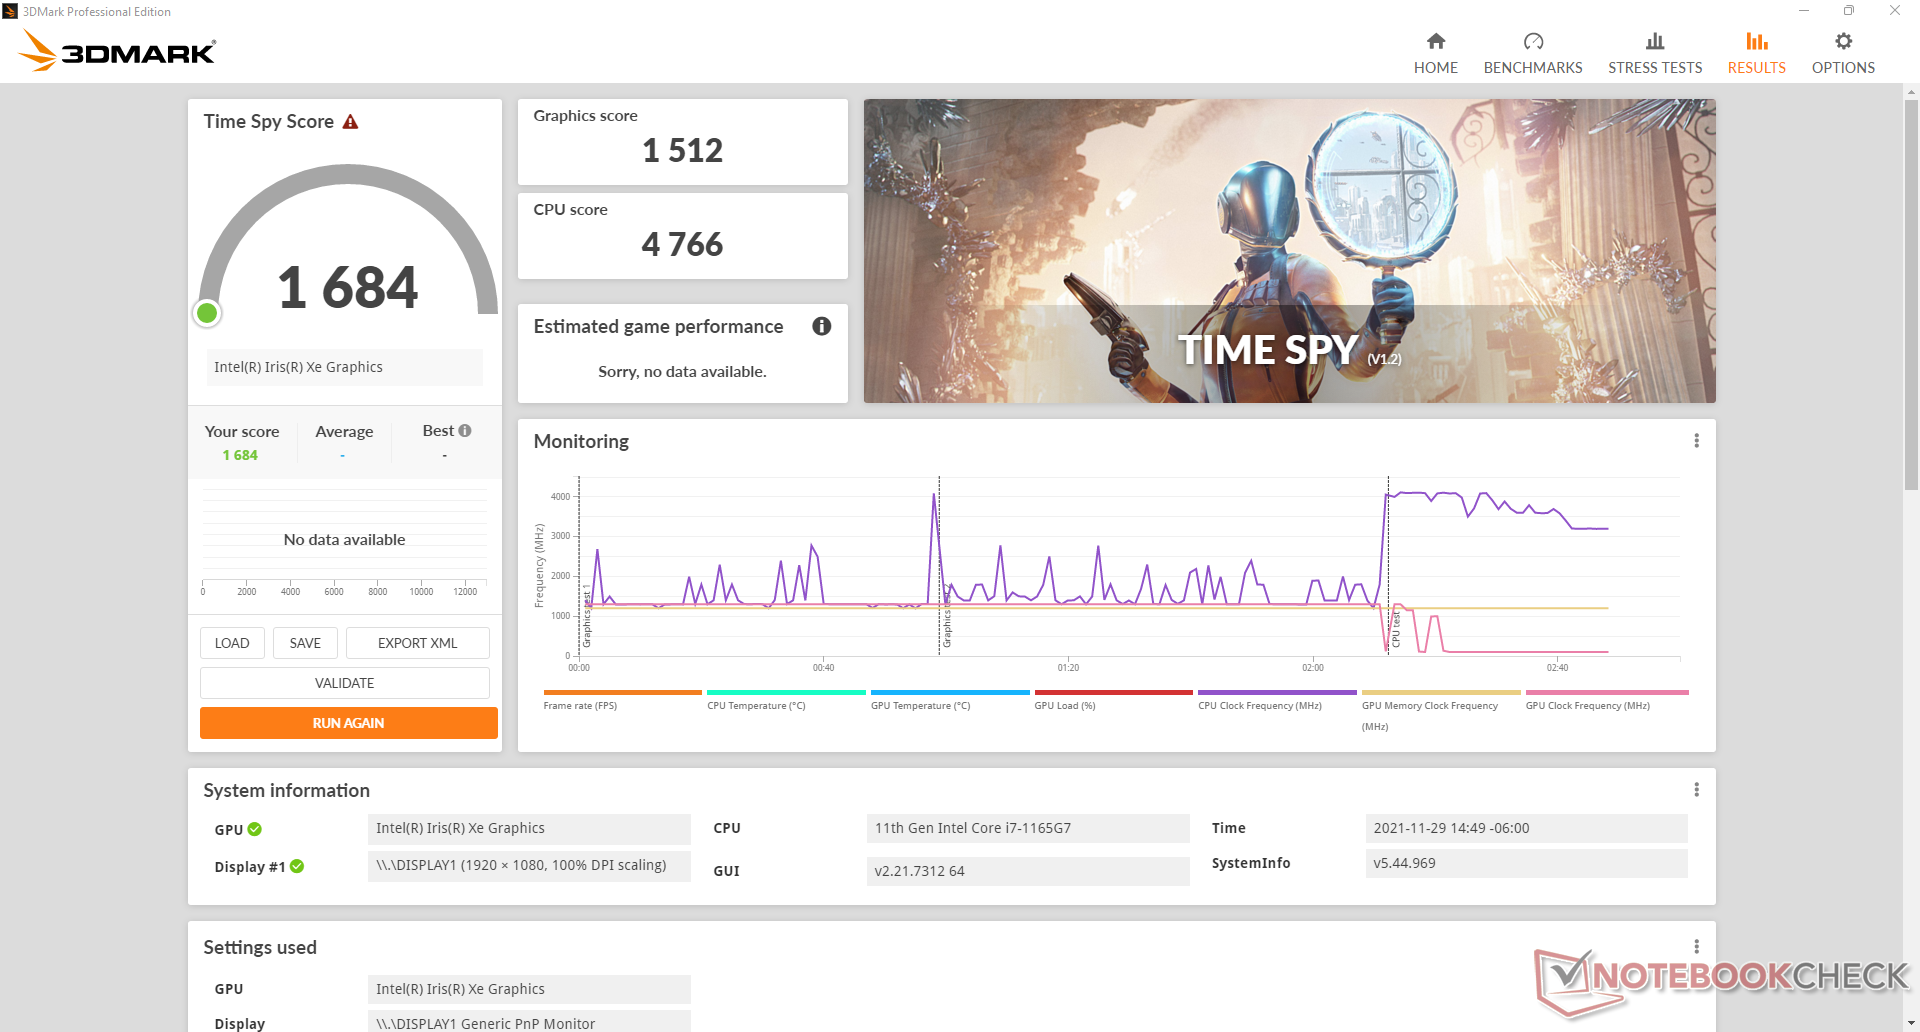
GPU Performance
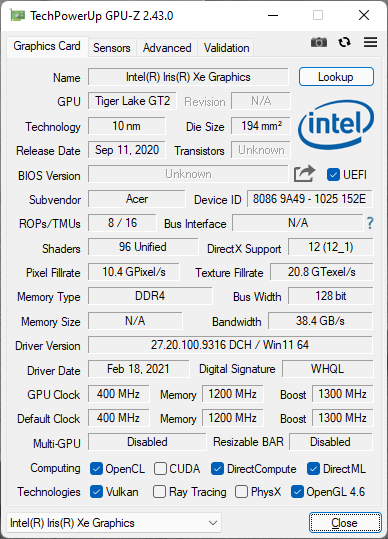
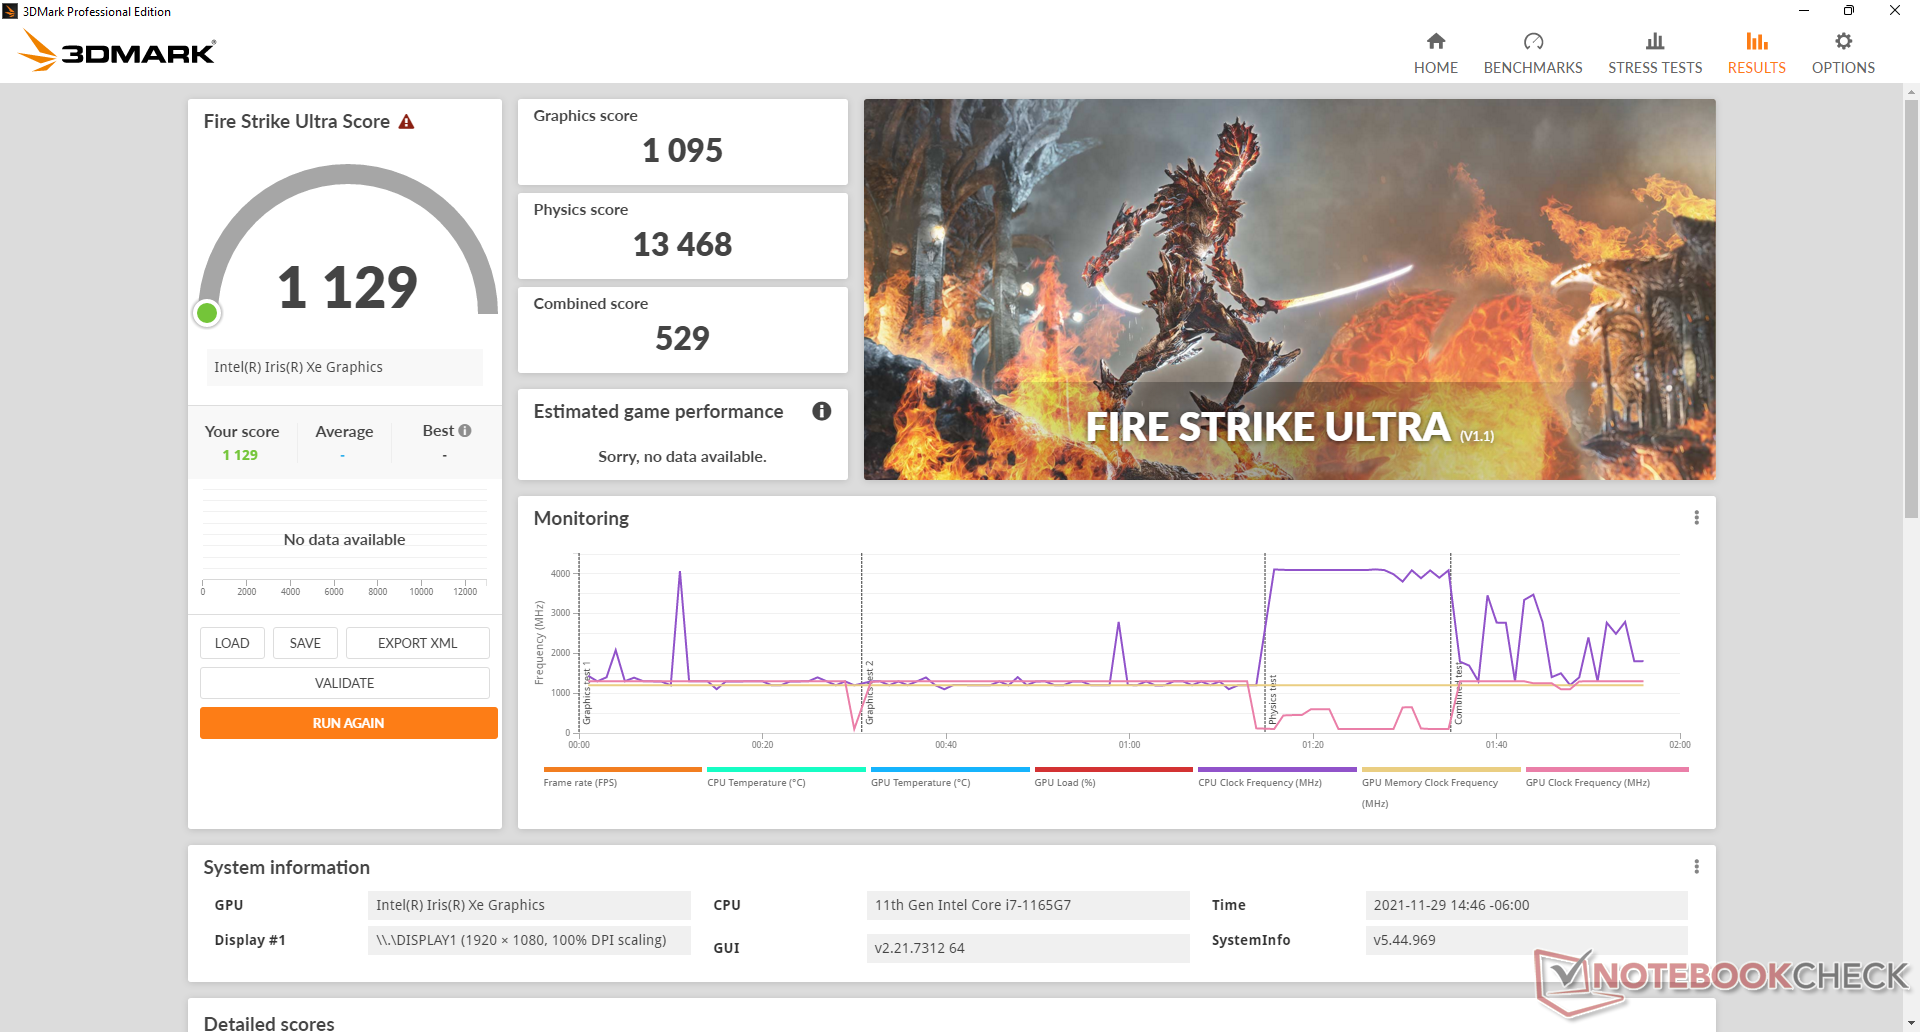
The integrated Iris Xe 96 EUs GPU is performing where we expect it to be relative to the average in our database. Downgrading to the Core i5 SKU with the lesser Iris Xe 80 EUs would entail a performance drop of about 30 to 40 percent.
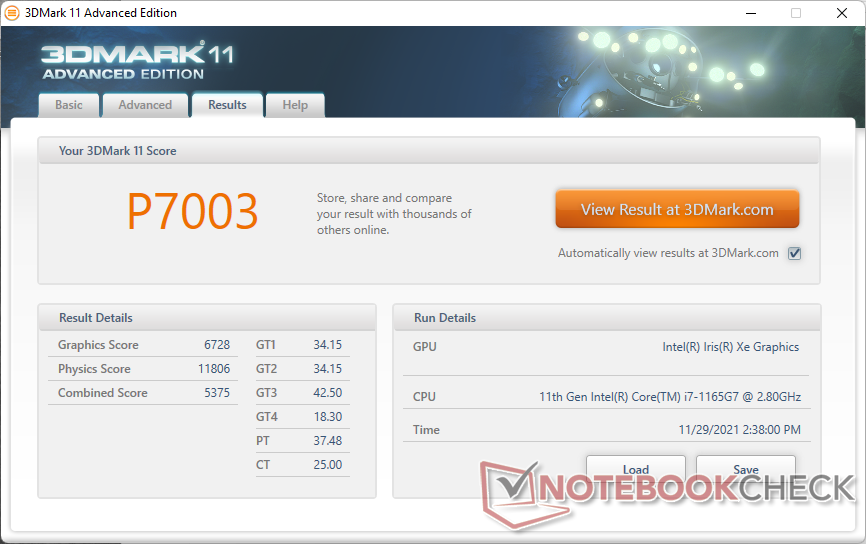
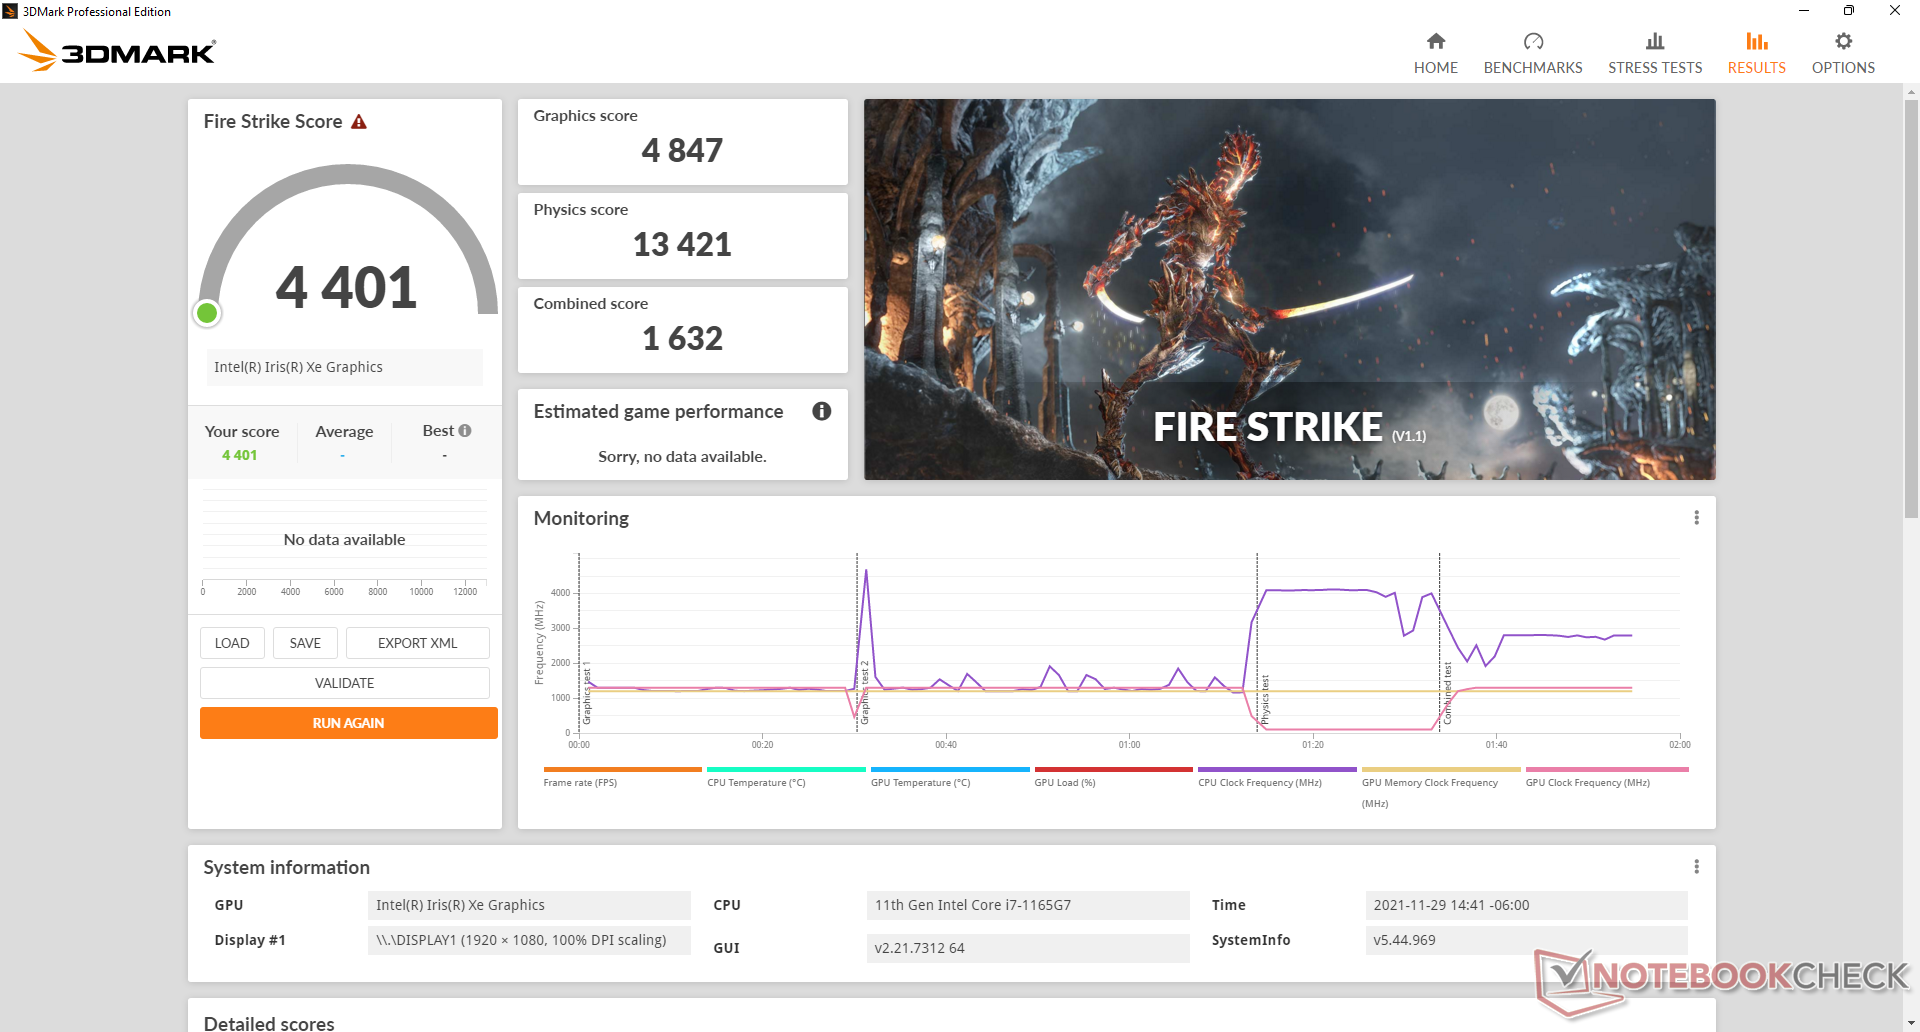
| 3DMark 11 Performance | 7003 points | |
| 3DMark Cloud Gate Standard Score | 17839 points | |
| 3DMark Fire Strike Score | 4401 points | |
| 3DMark Time Spy Score | 1684 points | |
Help | ||
Witcher 3 FPS Chart
| low | med. | high | ultra | |
|---|---|---|---|---|
| GTA V (2015) | 91.1 | 78.1 | 19.2 | 8.32 |
| The Witcher 3 (2015) | 89.5 | 57.3 | 29.2 | 13.4 |
| Dota 2 Reborn (2015) | 78.5 | 81.6 | 48.7 | 43.4 |
| Final Fantasy XV Benchmark (2018) | 39.9 | 22.1 | 15.9 | |
| X-Plane 11.11 (2018) | 22.1 | 41.4 | 36.5 | |
| Far Cry 5 (2018) | 49 | 22 | 21 | 20 |
| Strange Brigade (2018) | 82.9 | 34.1 | 28.2 | 22.7 |
Emissions
System Noise
Fan noise is silent when idling on desktop with no running applications. More often than not, however, users will be browsing or video streaming which will induce a fan noise of 27.9 dB(A) against a silent background of 23.8 dB(A). Both pitch and noise are low and easy to ignore when sitting at a normal distance from the laptop.
Higher loads like games will induce a fan noise of up to 39 dB(A).
Our test unit would exhibit minor coil whining which was thankfully only noticeable when placing an ear near the keyboard keys.
Noise level
| Idle |
| 24.1 / 24.1 / 24.1 dB(A) |
| Load |
| 27.9 / 38.6 dB(A) |
 | ||
30 dB silent 40 dB(A) audible 50 dB(A) loud |
||
min: | ||
| Acer Enduro Urban N3 EUN314 Iris Xe G7 96EUs, i7-1165G7, Samsung PM991 MZVLQ1T0HALB | Dell Latitude 5420 Rugged-P85G Radeon RX 540, i7-8650U, SK hynix PC401 NVMe 500 GB | Panasonic Toughbook FZ-55 MK2 Iris Xe G7 96EUs, i7-1185G7, Toshiba KIOXIA KBG4AZNV512G M.2 2280 OPAL | Durabook S14I Iris Xe G7 96EUs, i7-1165G7, UDinfo M2P M2P80DE512GBAEP | Getac S410 UHD Graphics 620, i5-8550U, CUKUSA 1 TB SATA SSD Q0526A | |
|---|---|---|---|---|---|
| Noise | -13% | -1% | -13% | -11% | |
| off / environment * (dB) | 23.8 | 28.3 -19% | 23.8 -0% | 25.2 -6% | 28.4 -19% |
| Idle Minimum * (dB) | 24.1 | 28.3 -17% | 24 -0% | 25.2 -5% | 28.4 -18% |
| Idle Average * (dB) | 24.1 | 28.3 -17% | 24 -0% | 25.2 -5% | 28.4 -18% |
| Idle Maximum * (dB) | 24.1 | 28.3 -17% | 24 -0% | 34.5 -43% | 28.4 -18% |
| Load Average * (dB) | 27.9 | 29.9 -7% | 26.7 4% | 34.5 -24% | 30.3 -9% |
| Witcher 3 ultra * (dB) | 35.7 | ||||
| Load Maximum * (dB) | 38.6 | 38 2% | 41.7 -8% | 36.2 6% | 33.3 14% |
* ... smaller is better
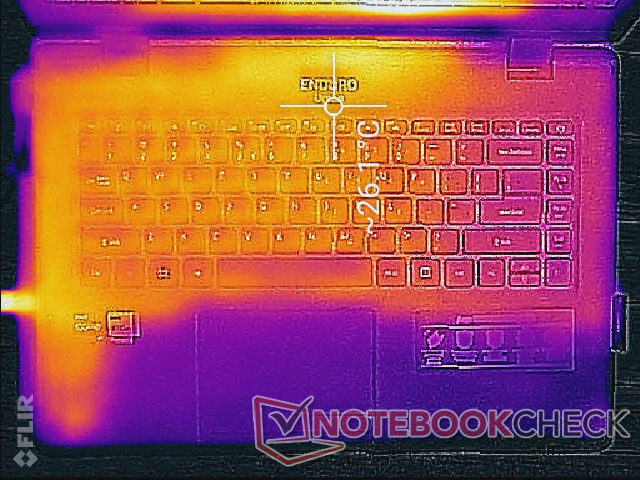
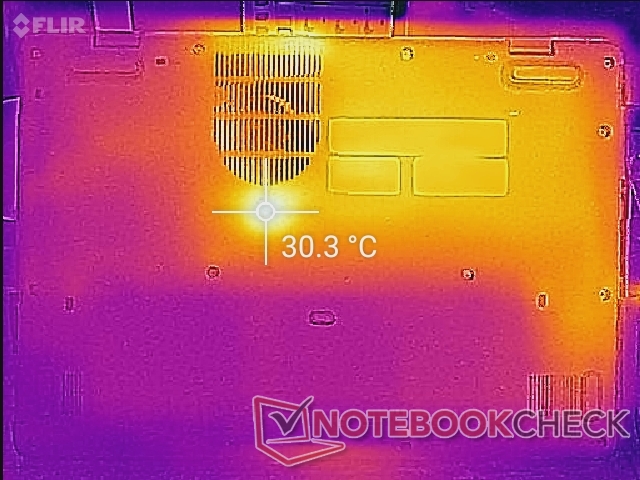
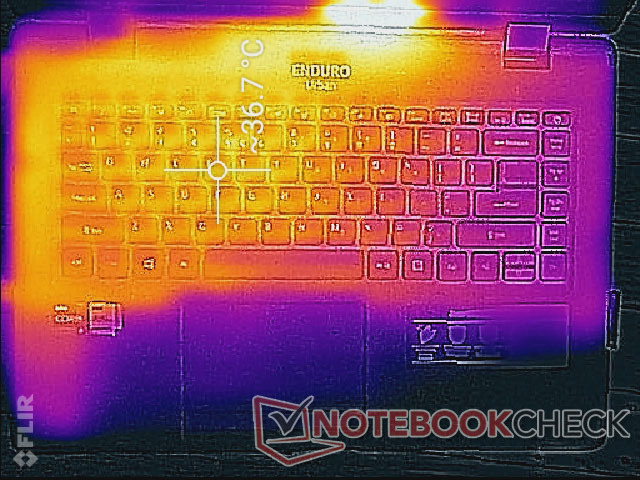
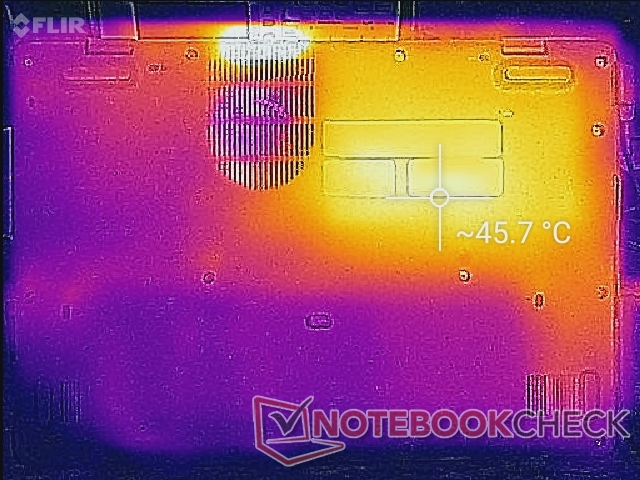
Temperature
Surface temperatures are warmer on the left half of the laptop when compared to the right half due to how the cooling solution is designed. Hot spots can reach up to 37 C and 46 C on the top and bottom, respectively, whereas the thicker Durabook S14I would top out at 39 C on both sides when subjected to similar conditions.
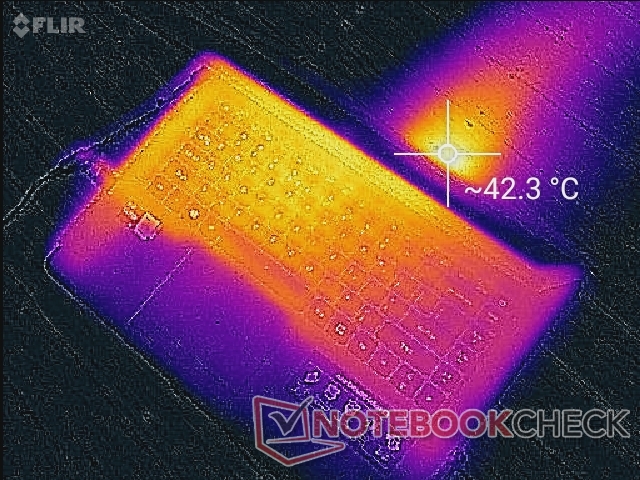
(+) The maximum temperature on the upper side is 37.8 °C / 100 F, compared to the average of 34.3 °C / 94 F, ranging from 21.2 to 62.5 °C for the class Office.
(-) The bottom heats up to a maximum of 45.8 °C / 114 F, compared to the average of 36.8 °C / 98 F
(+) In idle usage, the average temperature for the upper side is 24.7 °C / 76 F, compared to the device average of 29.5 °C / 85 F.
(+) The palmrests and touchpad are cooler than skin temperature with a maximum of 28.6 °C / 83.5 F and are therefore cool to the touch.
(±) The average temperature of the palmrest area of similar devices was 27.5 °C / 81.5 F (-1.1 °C / -2 F).
| Acer Enduro Urban N3 EUN314 Intel Core i7-1165G7, Intel Iris Xe Graphics G7 96EUs | Dell Latitude 5420 Rugged-P85G Intel Core i7-8650U, AMD Radeon RX 540 | Panasonic Toughbook FZ-55 MK2 Intel Core i7-1185G7, Intel Iris Xe Graphics G7 96EUs | Durabook S14I Intel Core i7-1165G7, Intel Iris Xe Graphics G7 96EUs | Getac S410 Intel Core i7-8550U, Intel UHD Graphics 620 | |
|---|---|---|---|---|---|
| Heat | -7% | -5% | -4% | -13% | |
| Maximum Upper Side * (°C) | 37.8 | 42.2 -12% | 36.2 4% | 36.4 4% | 42.6 -13% |
| Maximum Bottom * (°C) | 45.8 | 42 8% | 42.2 8% | 38.6 16% | 49 -7% |
| Idle Upper Side * (°C) | 26.4 | 31.6 -20% | 31 -17% | 32.6 -23% | 30.8 -17% |
| Idle Bottom * (°C) | 30.2 | 31.8 -5% | 34 -13% | 33.8 -12% | 34.4 -14% |
* ... smaller is better
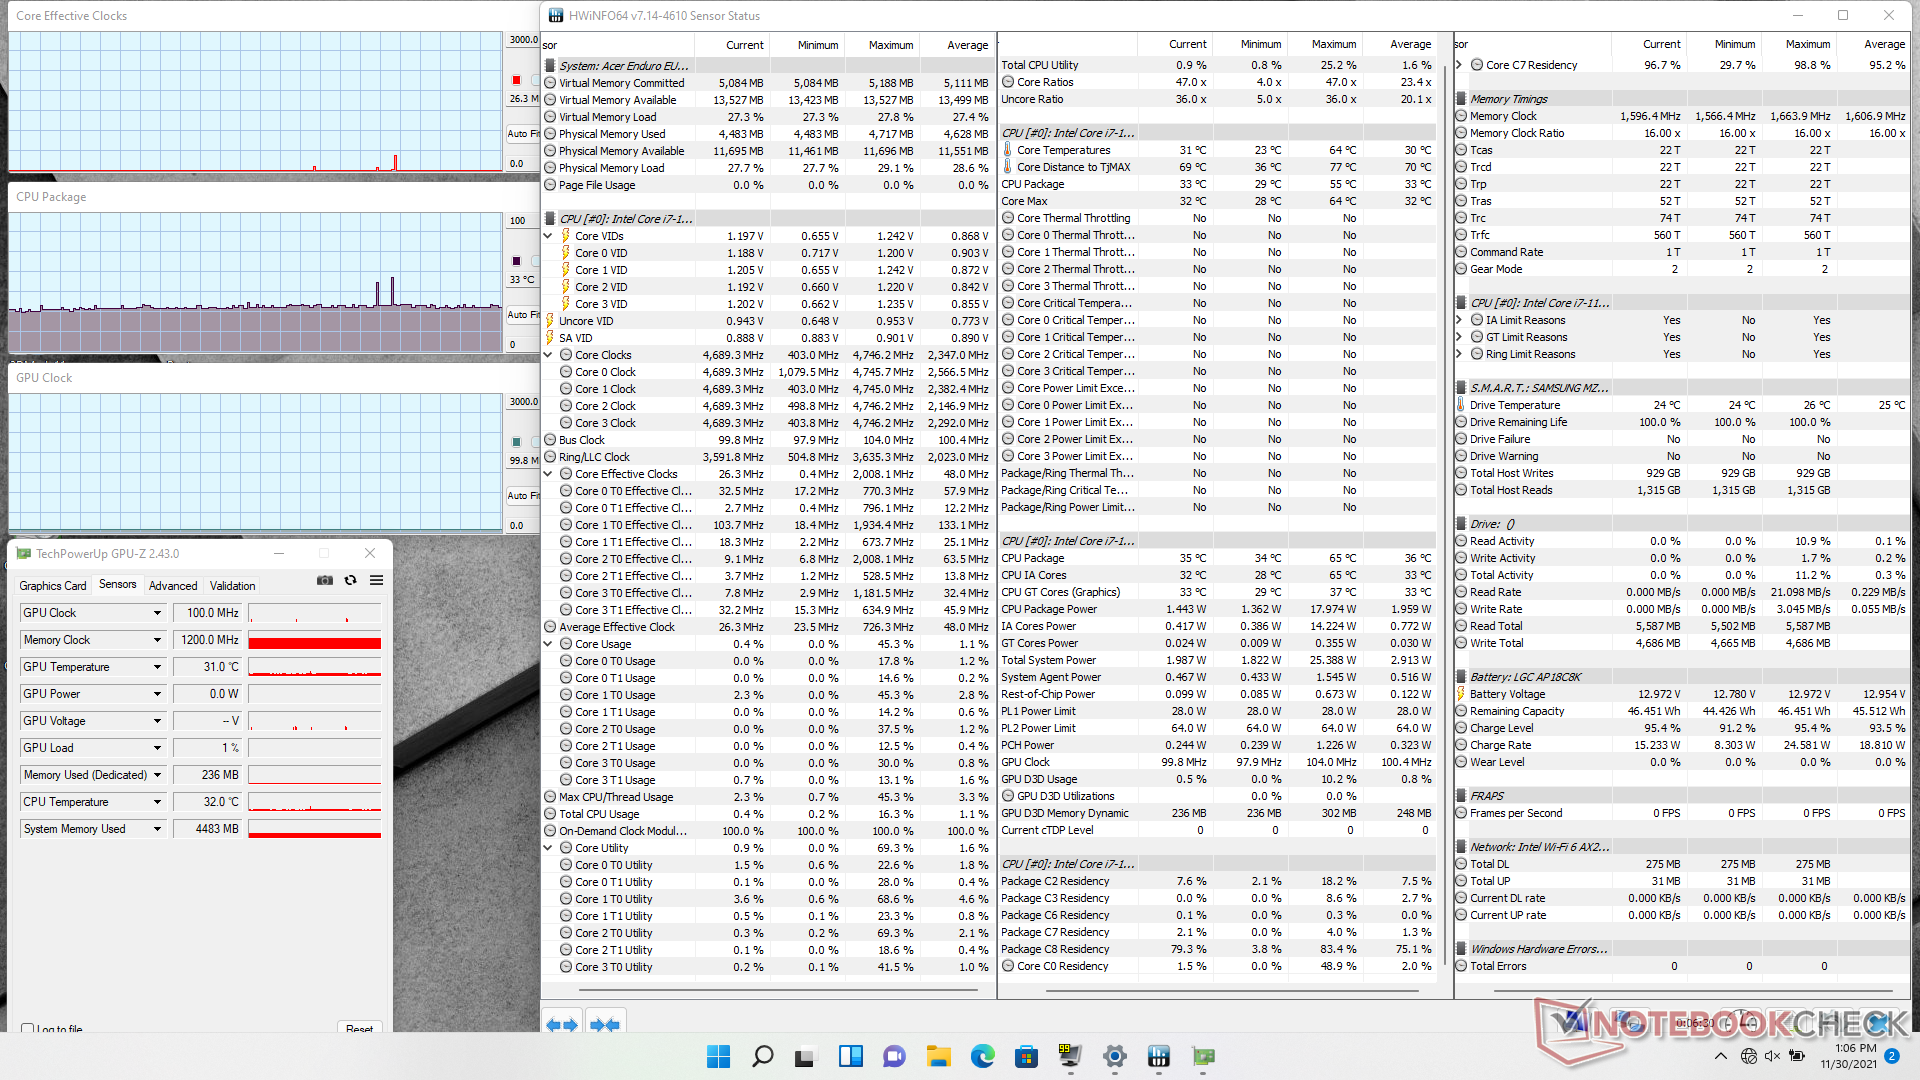
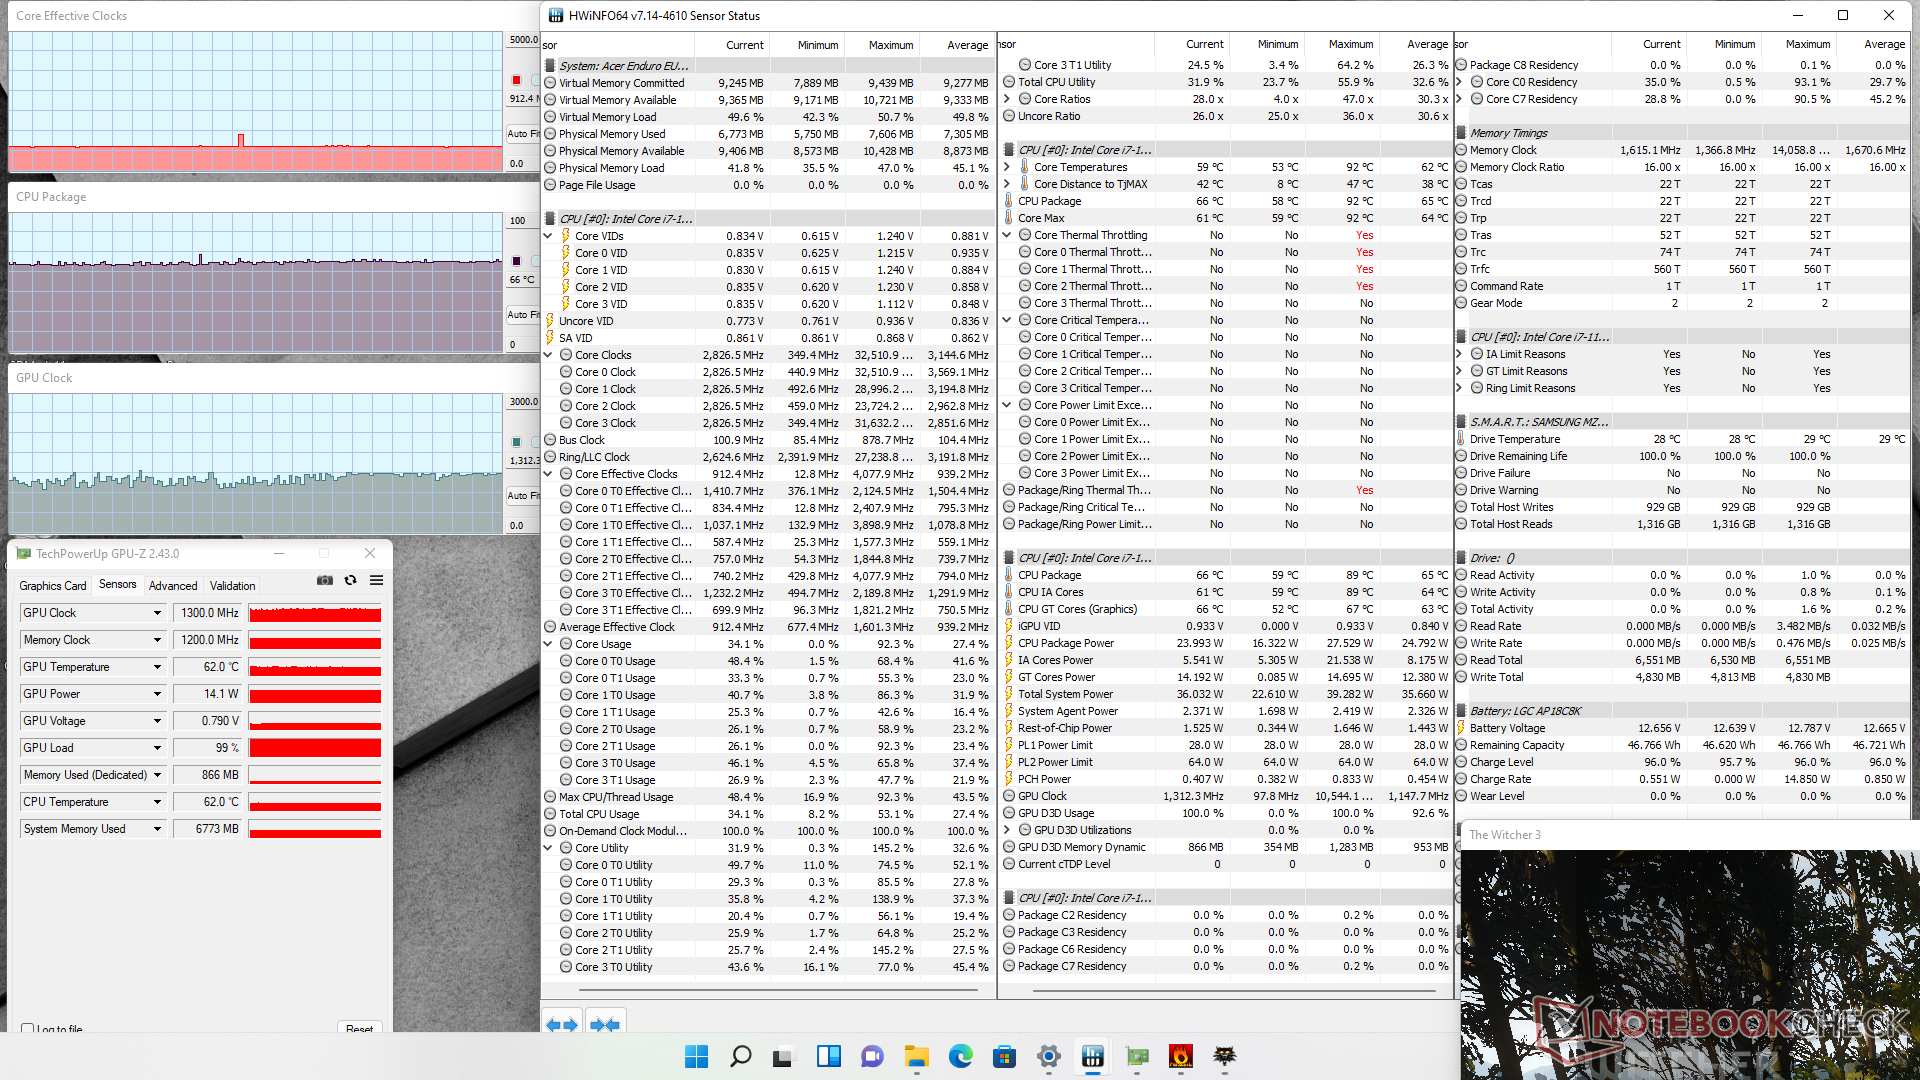
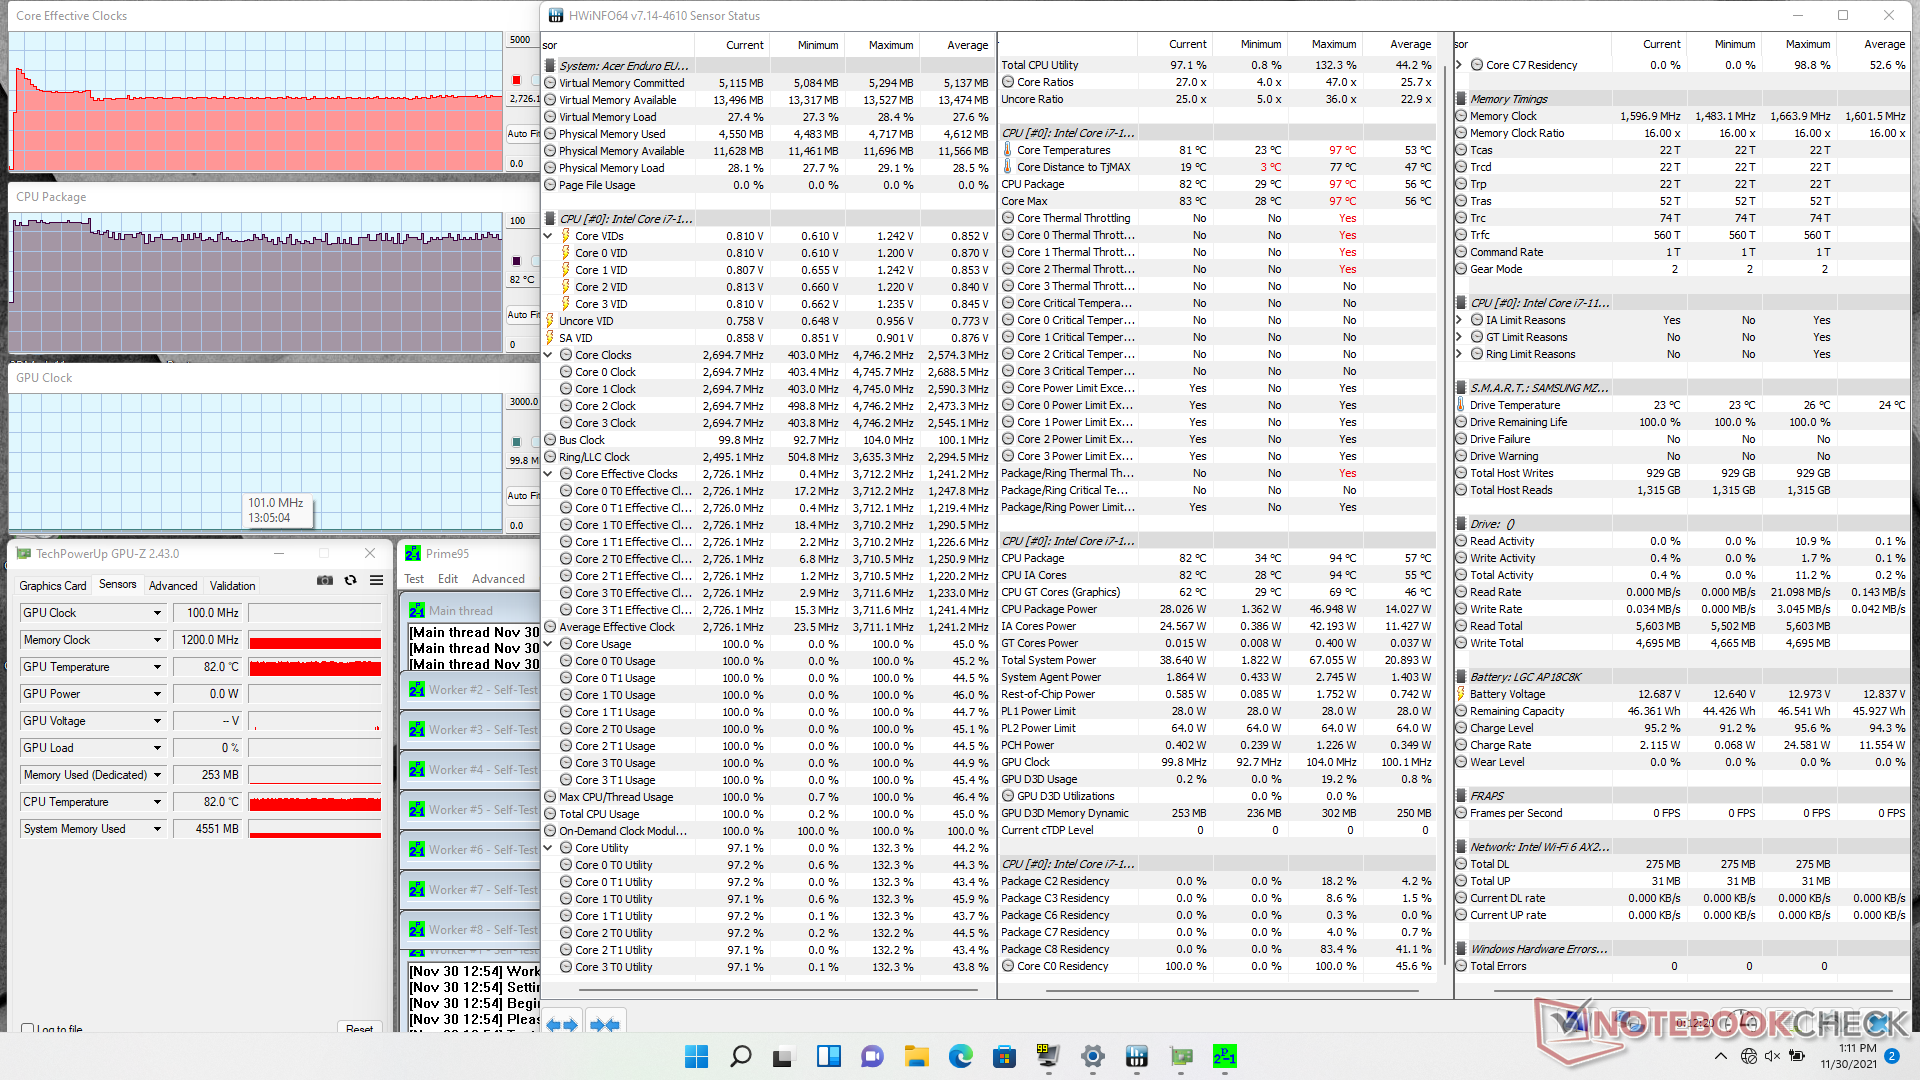
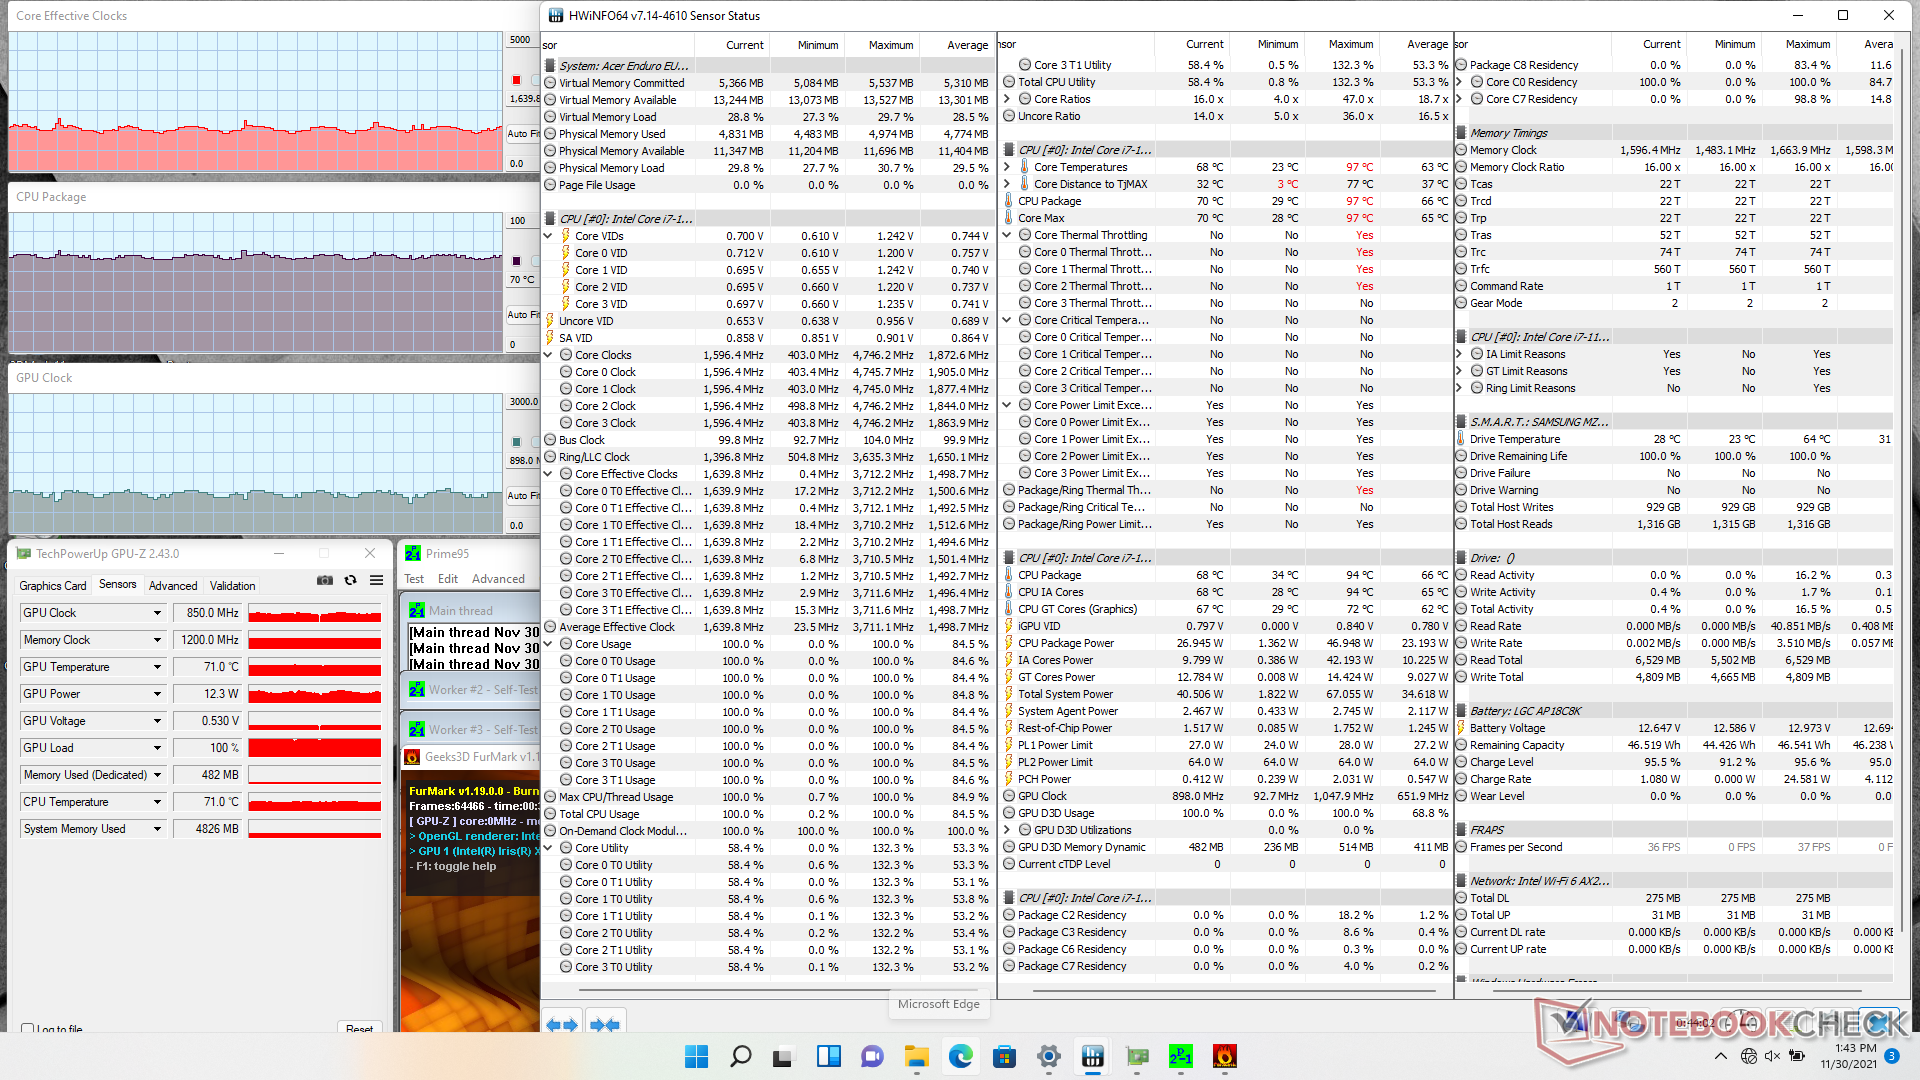
Stress Test
When running Prime95 to stress the CPU, clock rates would boost to 3.7 GHz for the first second or two before dropping to 2.9 GHz and then ultimately to 2.7 GHz. Core temperature and CPU package power would stabilize at 82 C and 28 W, respectively. The Durabook S14I would stabilize at slower clock rates in the 1.8 to 1.9 GHz range but also at a cooler core temperature of 63 C.
Running on batteries will limit performance. A 3DMark 11 test on battery power would return Physics and Graphics scores 10264 and 5615 points, respectively, compared to 11806 and 6728 points when on mains.
| CPU Clock (GHz) | GPU Clock (MHz) | Average CPU Temperature (°C) | |
| System Idle | -- | -- | 33 |
| Prime95 Stress | 2.7 | -- | 82 |
| Prime95 + FurMark Stress | 1.4 - 1.6 | 800 - 950 | 66 - 71 |
| Witcher 3 Stress | 0.9 | ~1300 | 66 |
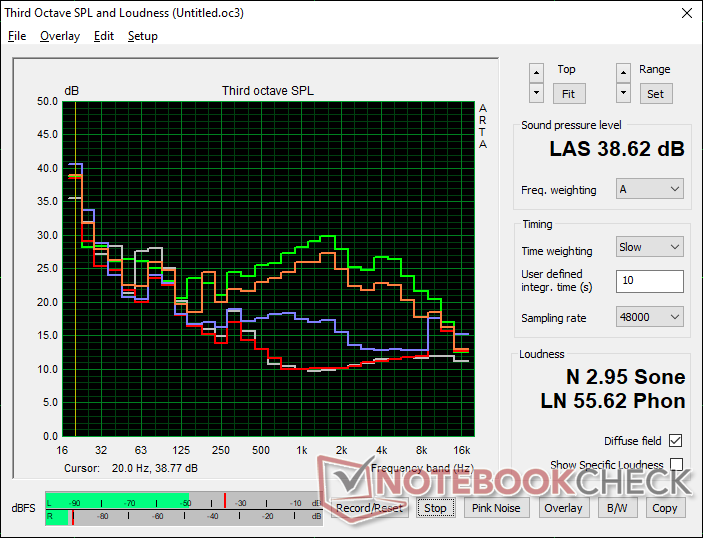
Speakers
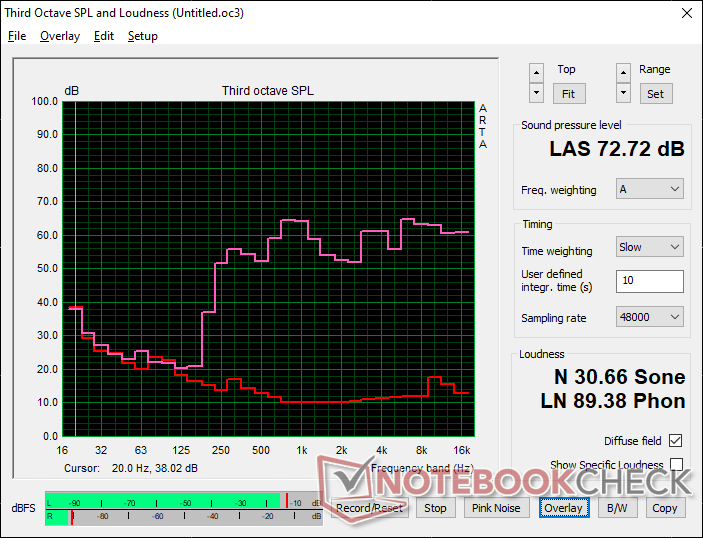
Acer Enduro Urban N3 EUN314 audio analysis
(±) | speaker loudness is average but good (72.7 dB)
Bass 100 - 315 Hz
(-) | nearly no bass - on average 21.2% lower than median
(±) | linearity of bass is average (14.2% delta to prev. frequency)
Mids 400 - 2000 Hz
(+) | balanced mids - only 4.2% away from median
(±) | linearity of mids is average (7.9% delta to prev. frequency)
Highs 2 - 16 kHz
(±) | higher highs - on average 5.5% higher than median
(±) | linearity of highs is average (8.6% delta to prev. frequency)
Overall 100 - 16.000 Hz
(±) | linearity of overall sound is average (23% difference to median)
Compared to same class
» 63% of all tested devices in this class were better, 7% similar, 29% worse
» The best had a delta of 7%, average was 21%, worst was 53%
Compared to all devices tested
» 68% of all tested devices were better, 6% similar, 26% worse
» The best had a delta of 4%, average was 24%, worst was 134%
Apple MacBook 12 (Early 2016) 1.1 GHz audio analysis
(+) | speakers can play relatively loud (83.6 dB)
Bass 100 - 315 Hz
(±) | reduced bass - on average 11.3% lower than median
(±) | linearity of bass is average (14.2% delta to prev. frequency)
Mids 400 - 2000 Hz
(+) | balanced mids - only 2.4% away from median
(+) | mids are linear (5.5% delta to prev. frequency)
Highs 2 - 16 kHz
(+) | balanced highs - only 2% away from median
(+) | highs are linear (4.5% delta to prev. frequency)
Overall 100 - 16.000 Hz
(+) | overall sound is linear (10.2% difference to median)
Compared to same class
» 7% of all tested devices in this class were better, 2% similar, 91% worse
» The best had a delta of 5%, average was 18%, worst was 53%
Compared to all devices tested
» 5% of all tested devices were better, 1% similar, 94% worse
» The best had a delta of 4%, average was 24%, worst was 134%
Energy Management
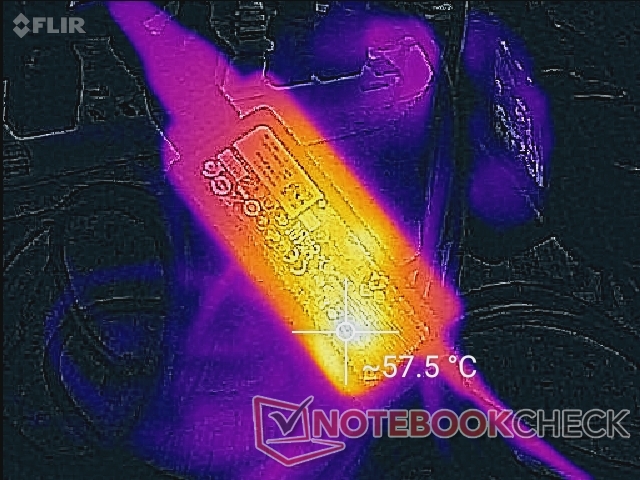
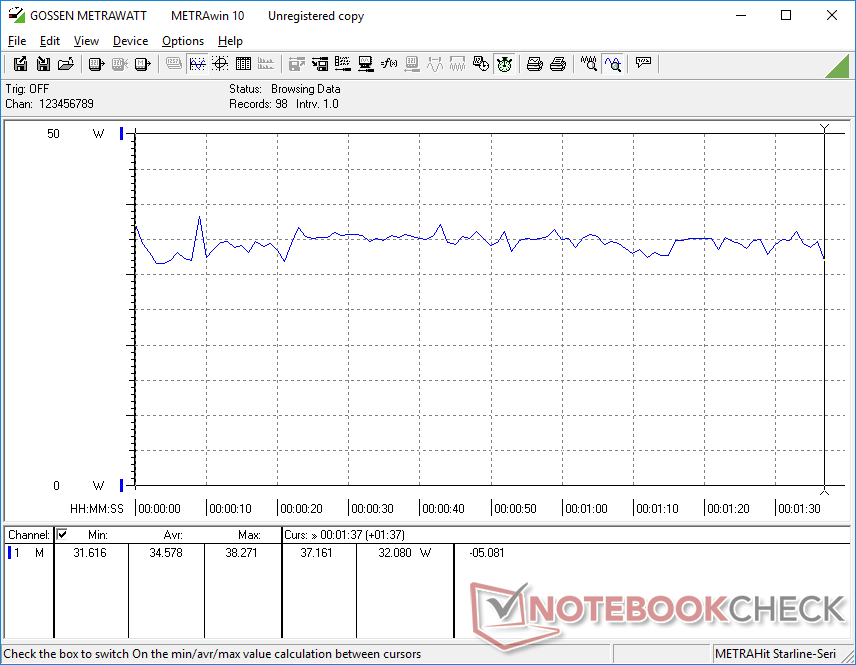
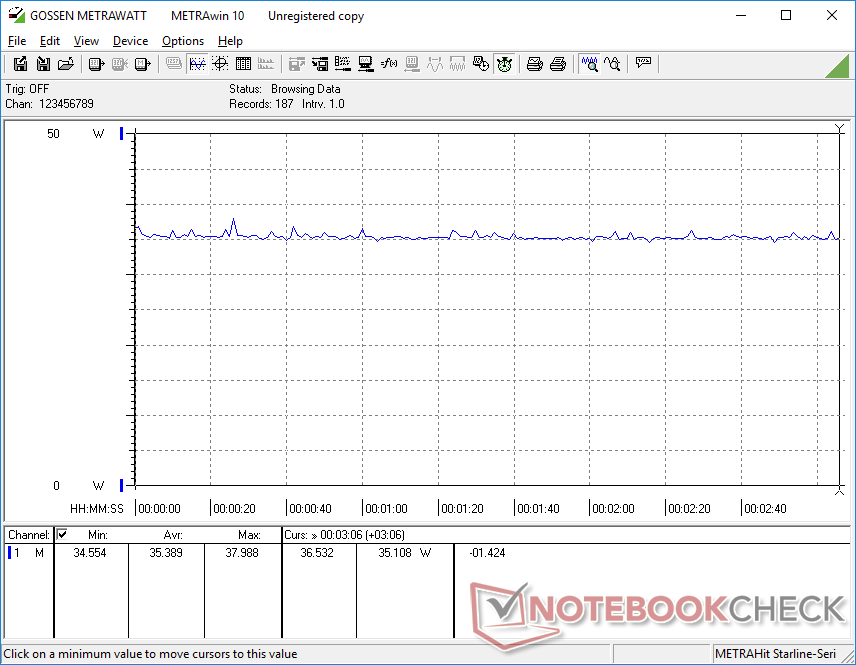
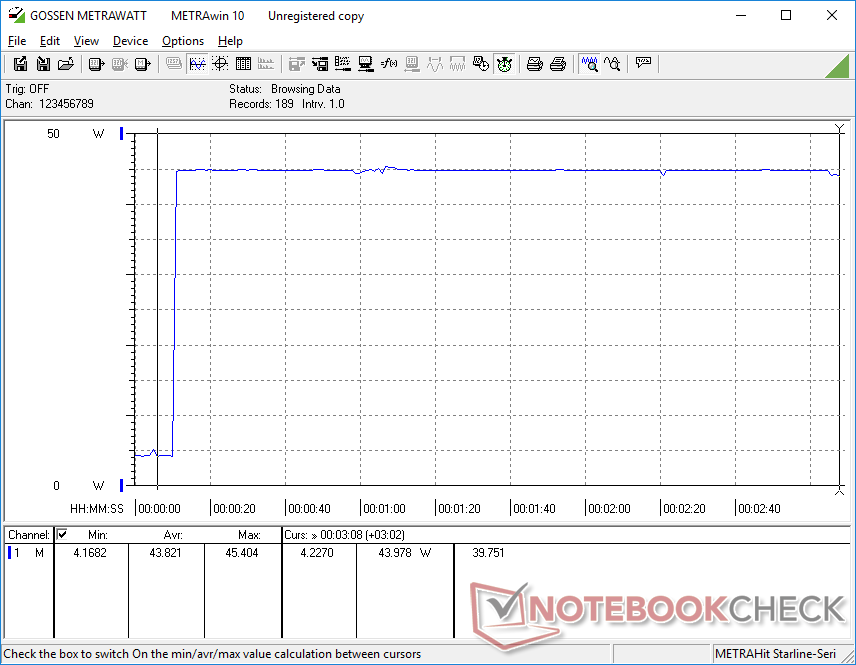
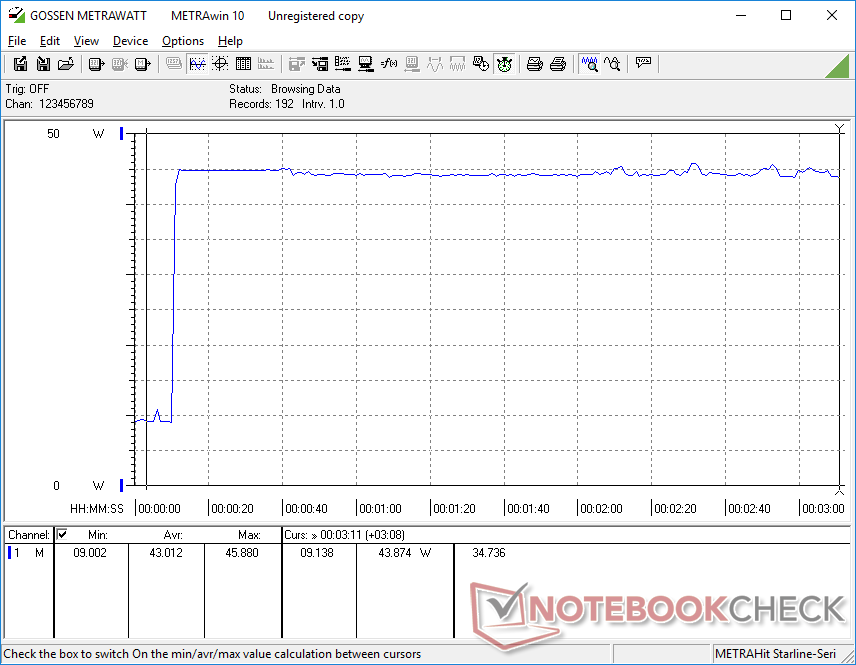
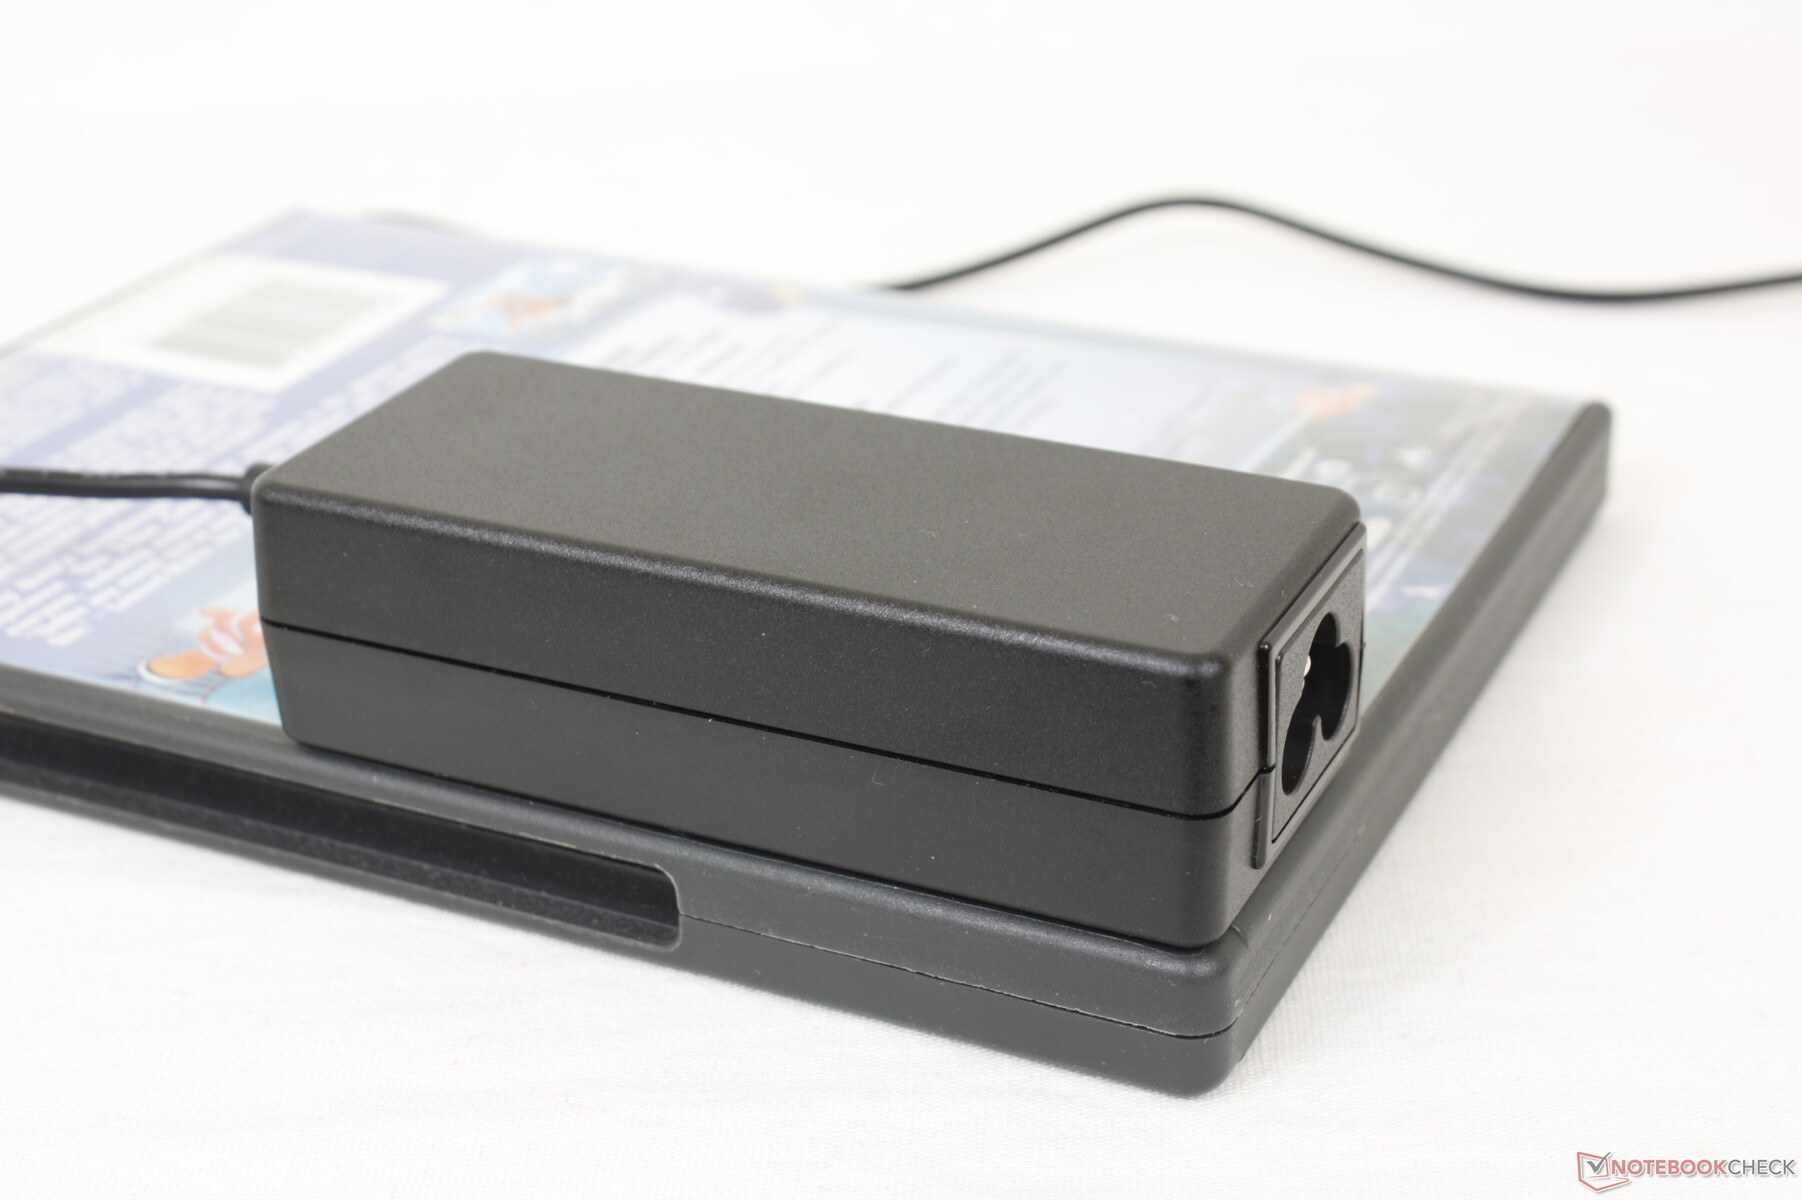
Power Consumption
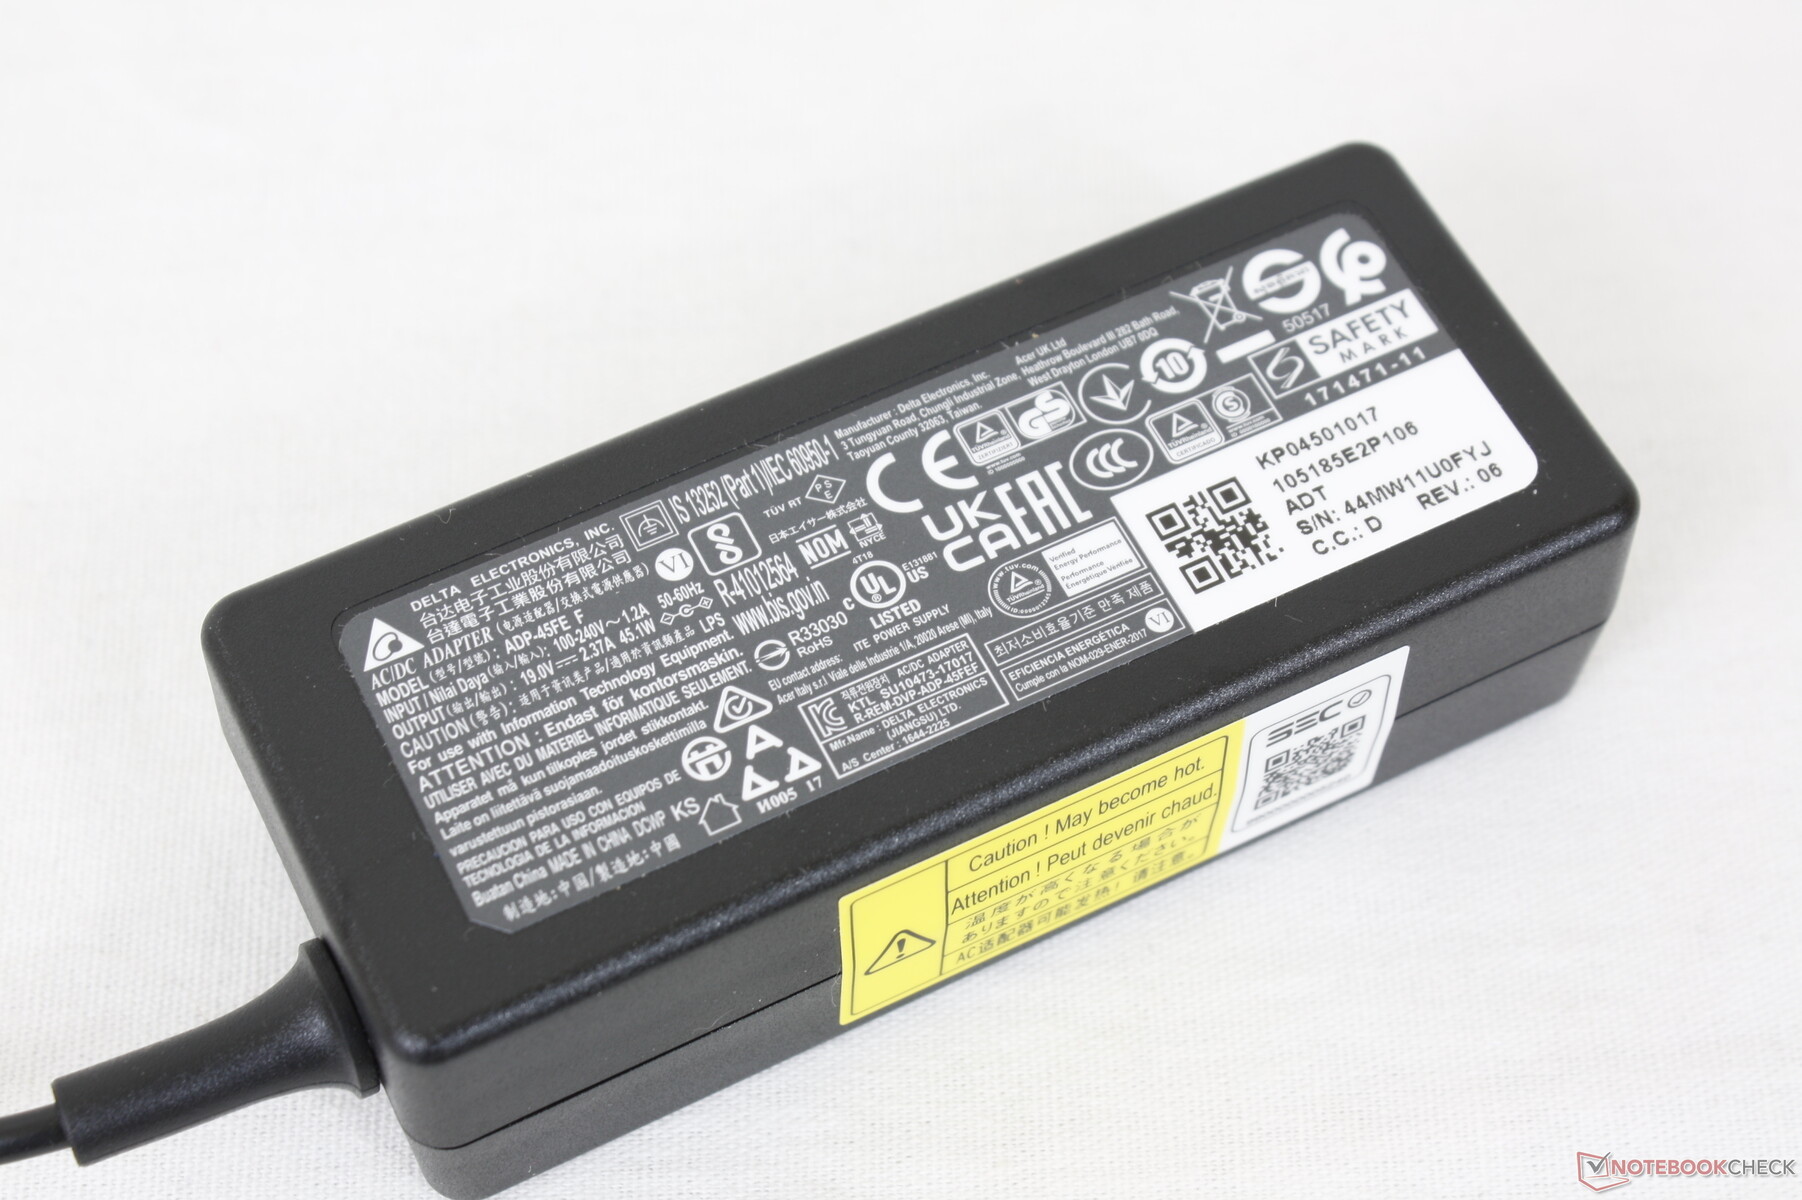
The Acer is more power efficient than the Durabook S14I running on the same Core i7 processor likely because the display on the Durabook is over 2x brighter than the display on our Acer. We're able to record a maximum draw of 45.4 W from the small (~9.3 x 3.8 x 2.7 cm) 45 W AC adapter when running extreme loads. The recharge rate of the Acer will therefore slow significantly if the processor is being stressed.
| Off / Standby | |
| Idle | |
| Load |
|
Key:
min: | |
| Acer Enduro Urban N3 EUN314 i7-1165G7, Iris Xe G7 96EUs, Samsung PM991 MZVLQ1T0HALB, IPS, 1920x1080, 14" | Dell Latitude 5420 Rugged-P85G i7-8650U, Radeon RX 540, SK hynix PC401 NVMe 500 GB, IPS, 1920x1080, 14" | Panasonic Toughbook FZ-55 MK2 i7-1185G7, Iris Xe G7 96EUs, Toshiba KIOXIA KBG4AZNV512G M.2 2280 OPAL, IPS, 1920x1080, 14" | Durabook S14I i7-1165G7, Iris Xe G7 96EUs, UDinfo M2P M2P80DE512GBAEP, TN, 1920x1080, 14" | Getac S410 i5-8550U, UHD Graphics 620, CUKUSA 1 TB SATA SSD Q0526A, TN PED, 1366x768, 14" | |
|---|---|---|---|---|---|
| Power Consumption | -75% | -36% | -70% | -3% | |
| Idle Minimum * (Watt) | 3.8 | 4.8 -26% | 3.5 8% | 6.8 -79% | 5.6 -47% |
| Idle Average * (Watt) | 8 | 13.6 -70% | 10.4 -30% | 16.4 -105% | 7.9 1% |
| Idle Maximum * (Watt) | 8.7 | 13.8 -59% | 10.5 -21% | 16.9 -94% | 8.4 3% |
| Load Average * (Watt) | 34.6 | 67.8 -96% | 45.4 -31% | 39.2 -13% | 32.8 5% |
| Witcher 3 ultra * (Watt) | 35.4 | 69.1 -95% | 43 -21% | ||
| Load Maximum * (Watt) | 45.4 | 93.5 -106% | 99.3 -119% | 73.1 -61% | 34.3 24% |
* ... smaller is better
Power Consumption Witcher 3 / Stresstest
Power Consumption external Monitor
Battery Life
We're able to record a real-world WLAN runtime of almost 6.5 hours on a full charge and on 150 nit display brightness. Charging the system from full to empty will take about 100 minutes. Users can also charge the system with generic USB-C AC adapters.
| Acer Enduro Urban N3 EUN314 i7-1165G7, Iris Xe G7 96EUs, 50.3 Wh | Dell Latitude 5420 Rugged-P85G i7-8650U, Radeon RX 540, 102 Wh | Panasonic Toughbook FZ-55 MK2 i7-1185G7, Iris Xe G7 96EUs, 71 Wh | Durabook S14I i7-1165G7, Iris Xe G7 96EUs, 50 Wh | Getac S410 i5-8550U, UHD Graphics 620, 46.6 Wh | |
|---|---|---|---|---|---|
| Battery runtime | 153% | 113% | -14% | -19% | |
| WiFi v1.3 (h) | 6.4 | 16.2 153% | 13.6 113% | 5.5 -14% | 5.2 -19% |
| Reader / Idle (h) | 31.4 | ||||
| Load (h) | 3.2 |
Pros
Cons
Verdict
The Enduro Urban N3 is a 14-inch laptop that feels like a 15.6-inch laptop. The extra girth and thickness when compared to traditional consumer-centric 14-inch laptops like the Asus VivoBook or Acer Swift 5 SF514 make the Urban N3 more resilient to the elements without costing nearly as much as "proper" rugged or semi-rugged laptops like the Durabook S14I or Panasonic Toughbook. if you find yourself using your laptop on the field or on piles of rocks more often than a neatly organized office desk, then the Urban N3 might be for you.
The Enduro Urban N3 is an affordable rugged laptop doesn't skimp on processor performance or display quality. Certain aspects like battery life, volume, and pulse-width modulation for brightness control could have been better.
The performance and display are notable highlights of the Acer. However, users will have to calibrate the panel themselves to fully exploit its relatively deep colors.
Many aspects can still be improved upon. Speaker volume, for example, is on the low side while the hinges could be stiffer at wider angles to prevent the lid from falling backwards. PWM is disappointing to see and battery life could have been better at just 6.5 hours. There is unused volume inside the chassis that could have been used to improve the features of the system. A matte option would have been appreciated as well to reduce glare.
Price and Availability
Acer Enduro Urban N3 EUN314
- 12/03/2021 v7 (old)
Allen Ngo
Price comparison
