Panasonic Toughbook FZ-55 MK2 rugged laptop review: Iris Xe makes all the difference
Whereas the FZ-55 MK1 would ship with Intel 8th gen CPUs, the latest FZ-55 MK2 comes with Intel 11th gen CPUs instead. The seemingly small upgrade is actually quite significant in terms of performance as our comparisons charts below will show.
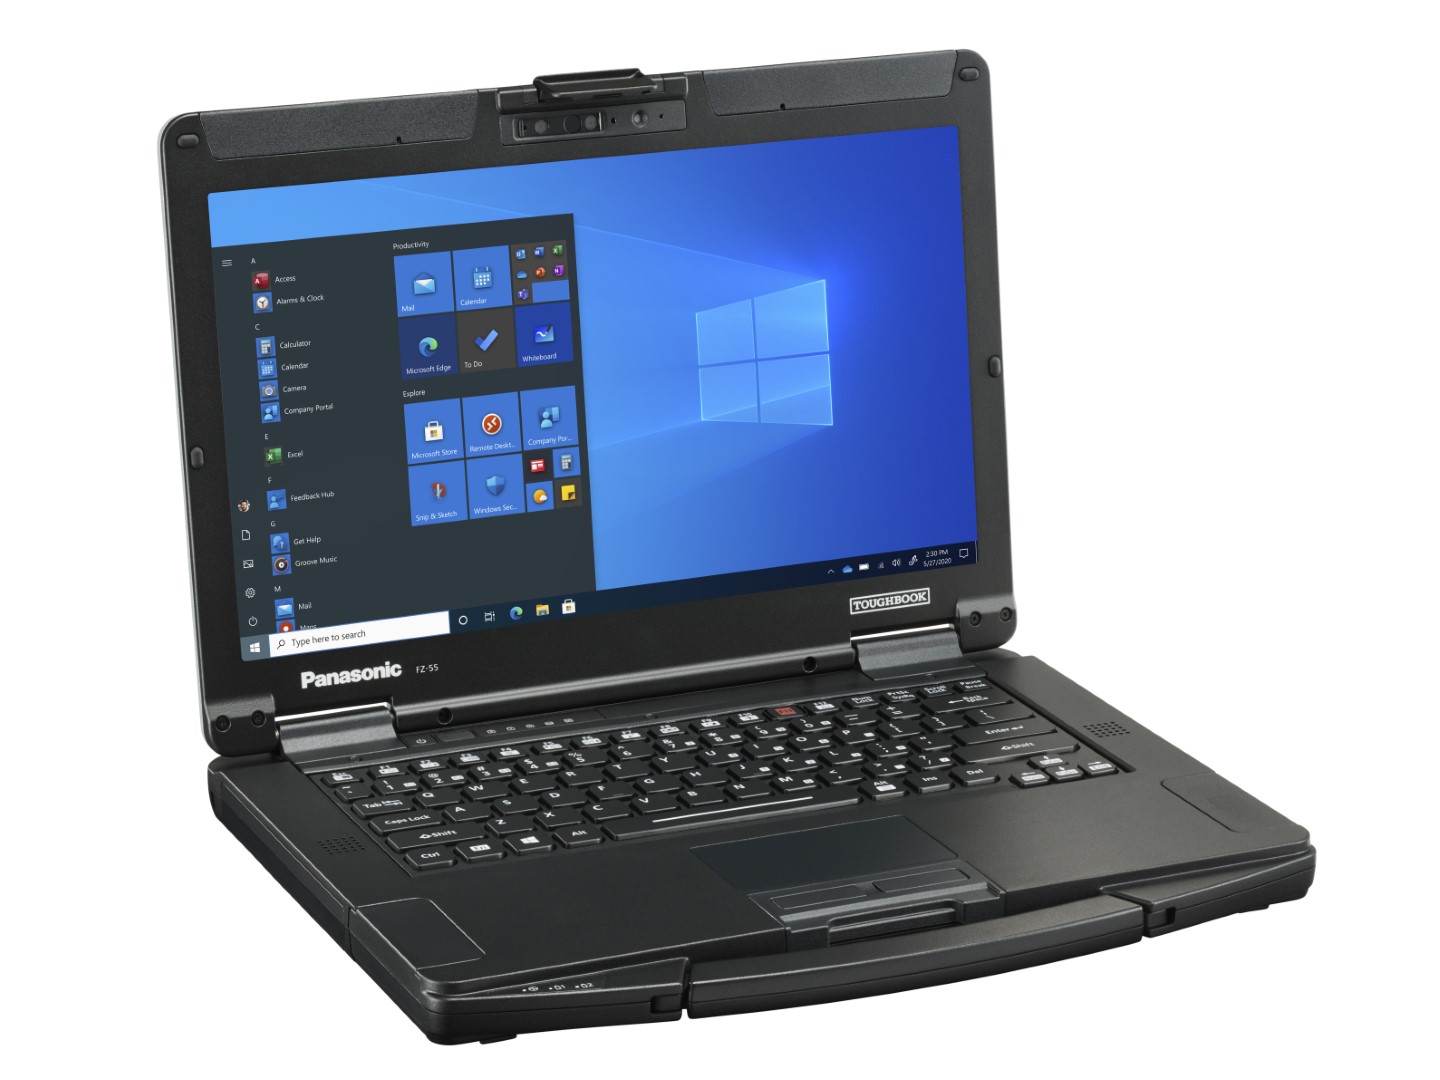
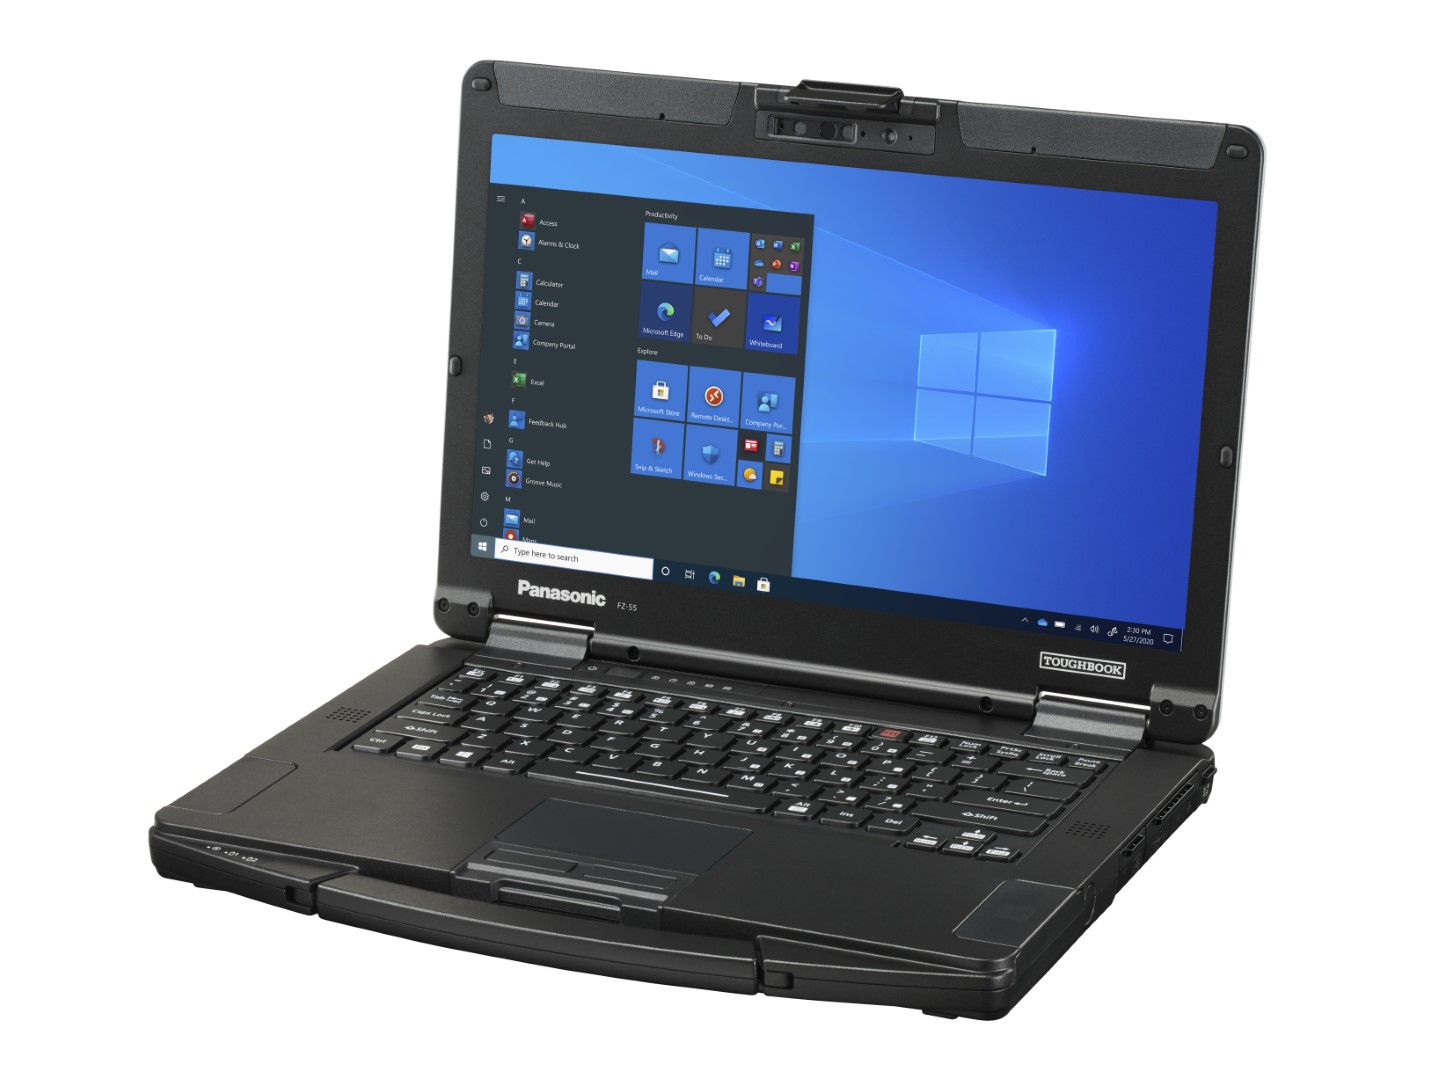
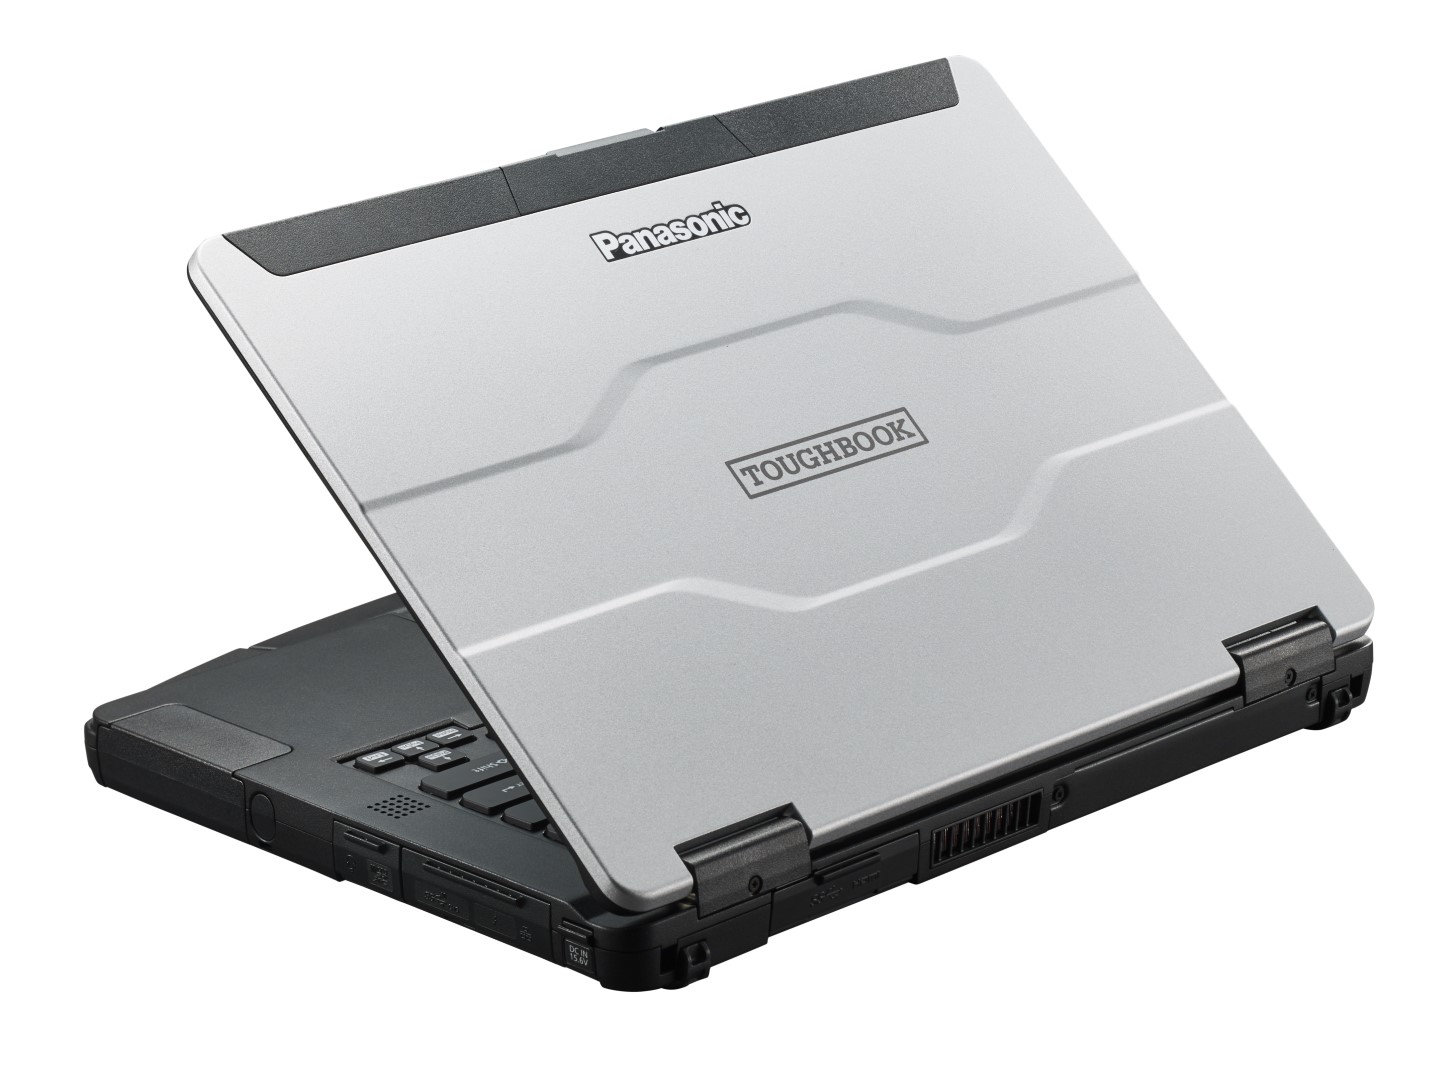
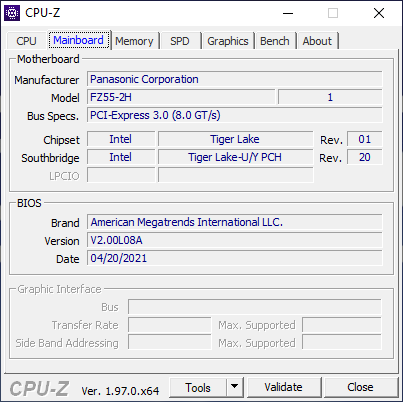
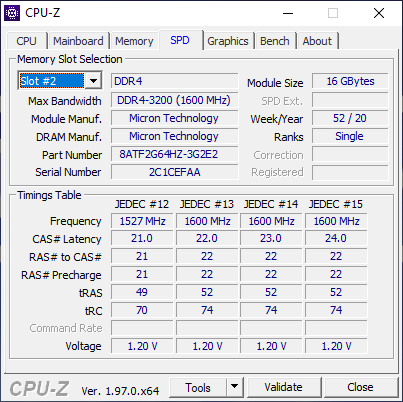
Aside from the processor swap, the FZ-55 MK2 comes with other auxiliary updates including support for NVMe/OPAL SSDs, faster 3200 MHz RAM, Wi-Fi 6, Thunderbolt 4, and band 48 CBRS WAN with dual SIM support. The physical chassis remains identical to the FZ-55 MK1 and so we recommend checking out our original review here to learn more about its features.
Competitors in this space include other rugged 14-inch laptops like the Dell Latitude 5420, Durabook S14, or Getac S410.
More Panasonic review:
potential competitors in comparison
Rating | Date | Model | Weight | Height | Size | Resolution | Price |
|---|---|---|---|---|---|---|---|
| 83.9 % v7 (old) | 09 / 2021 | Panasonic Toughbook FZ-55 MK2 i7-1185G7, Iris Xe G7 96EUs | 2.3 kg | 33 mm | 14.00" | 1920x1080 | |
| 80.9 % v7 (old) | 09 / 2019 | Panasonic Toughbook FZ-55 i5-8365U, UHD Graphics 620 | 2.2 kg | 33 mm | 14.00" | 1920x1080 | |
| 89.2 % v6 (old) | 03 / 2019 | Dell Latitude 5420 Rugged-P85G i7-8650U, Radeon RX 540 | 2.8 kg | 32.9 mm | 14.00" | 1920x1080 | |
v (old) | 04 / 2021 | Durabook S14I i7-1165G7, Iris Xe G7 96EUs | 3 kg | 38.1 mm | 14.00" | 1920x1080 | |
| 81.9 % v6 (old) | 10 / 2018 | Getac S410 i5-8550U, UHD Graphics 620 | 3.2 kg | 34.9 mm | 14.00" | 1366x768 |
Case
Connectivity
Ports are identical with the new addition of Thunderbolt 4 and a faster 10 Gbps USB-A port along the right edge. Users can recharge or connect external monitors and GPUs via USB-C which was otherwise impossible on the FZ-55 MK1.
SD Card Reader
No changes have been made to the MicroSD reader. Moving files from our UHS-II test card to desktop still takes 2x to 3x longer than the card reader on the Dell Latitude 5420 Rugged.
| SD Card Reader | |
| average JPG Copy Test (av. of 3 runs) | |
| Dell Latitude 5420 Rugged-P85G (Toshiba Exceria Pro SDXC 64 GB UHS-II) | |
| Getac S410 (Toshiba Exceria Pro SDXC 64 GB UHS-II) | |
| Panasonic Toughbook FZ-55 MK2 (AV Pro V60) | |
| Panasonic Toughbook FZ-55 (Toshiba Exceria Pro M501 64 GB UHS-II) | |
| Durabook S14I (Angelbird 128GB AV Pro UHS-II) | |
| maximum AS SSD Seq Read Test (1GB) | |
| Dell Latitude 5420 Rugged-P85G (Toshiba Exceria Pro SDXC 64 GB UHS-II) | |
| Panasonic Toughbook FZ-55 MK2 (AV Pro V60) | |
| Getac S410 (Toshiba Exceria Pro SDXC 64 GB UHS-II) | |
| Panasonic Toughbook FZ-55 (Toshiba Exceria Pro M501 64 GB UHS-II) | |
| Durabook S14I (Angelbird 128GB AV Pro UHS-II) | |
Communication
An Intel AX201 comes standard for Wi-Fi 6 compatibility to replace the older Wi-Fi 5 Intel 9560.
| Networking | |
| iperf3 transmit AX12 | |
| Panasonic Toughbook FZ-55 MK2 | |
| Durabook S14I | |
| Dell Latitude 5420 Rugged-P85G | |
| Getac S410 | |
| iperf3 receive AX12 | |
| Durabook S14I | |
| Panasonic Toughbook FZ-55 MK2 | |
| Dell Latitude 5420 Rugged-P85G | |
| Getac S410 | |
Webcam
A large lock that snaps the lid into place when closed hangs over the webcam which can unfortunately block a lot of ambient lighting. The webcam picture can therefore look darker than it would otherwise appear on most other laptops.


Accessories and Warranty
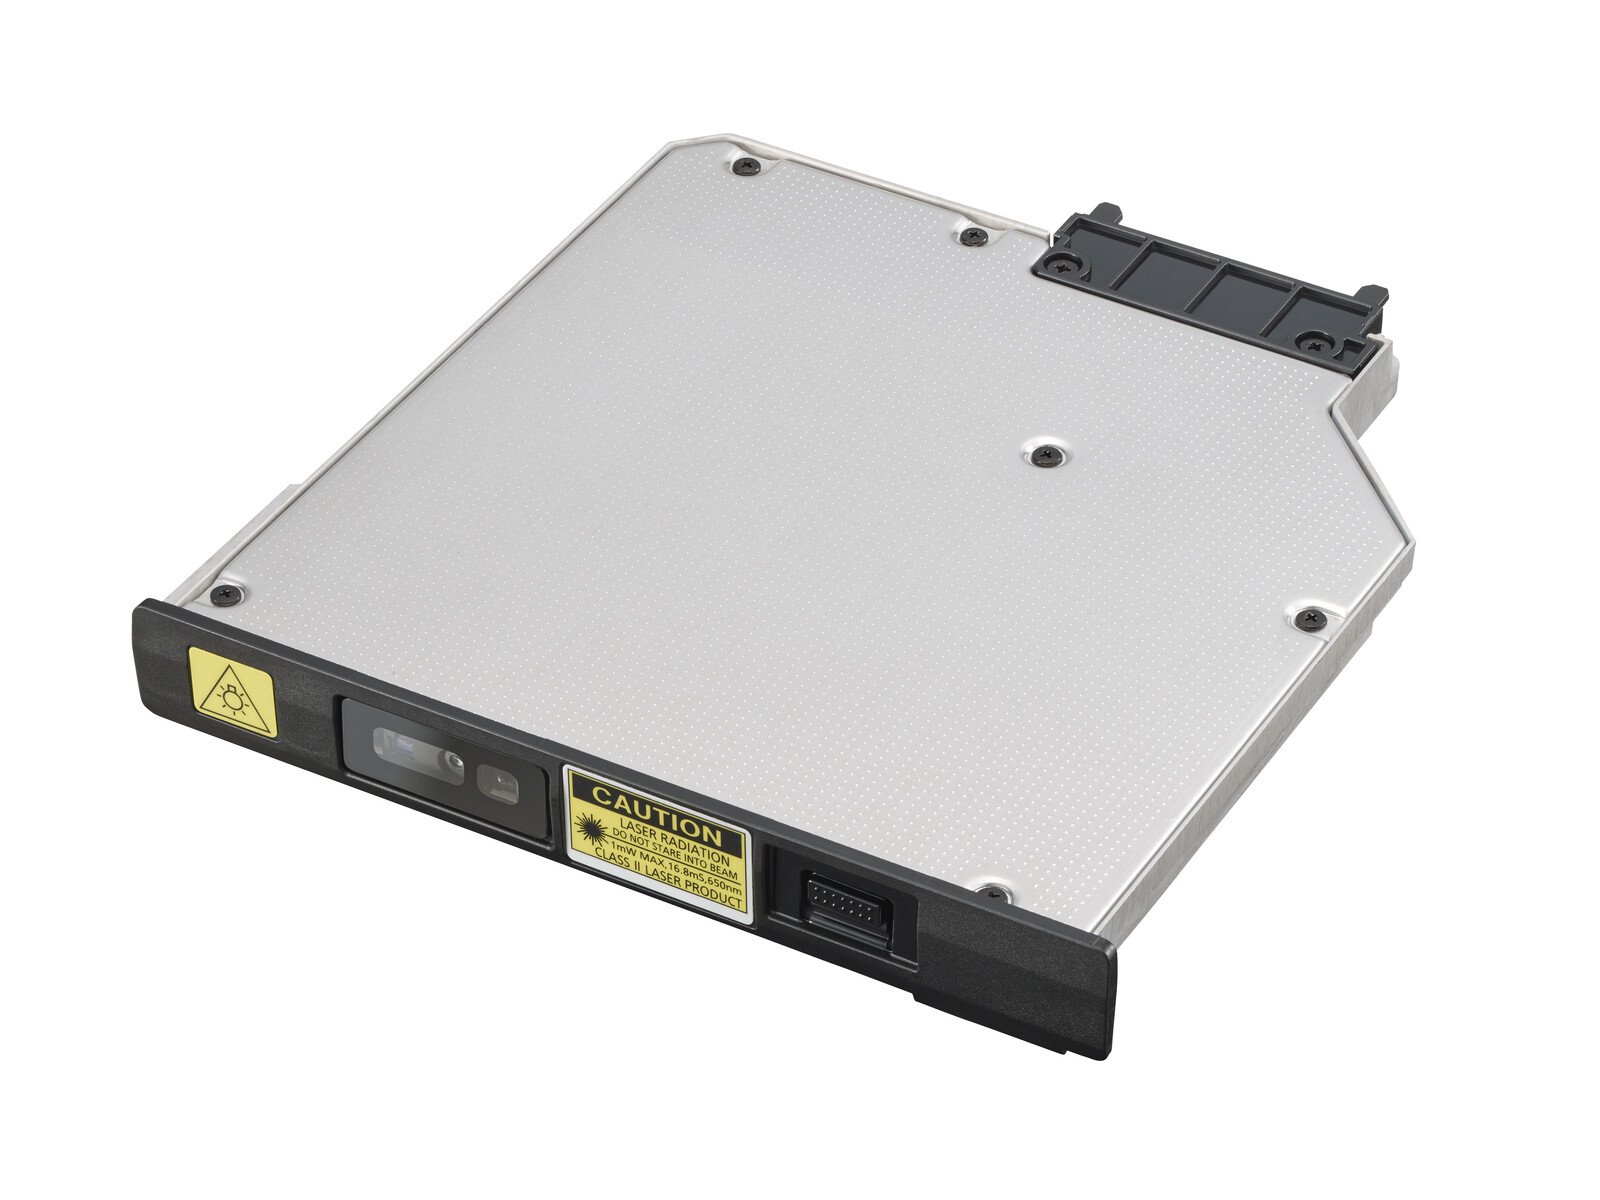
Though the removable xPAK expansion items remain backwards compatible, Panasonic has introduced new ones for additional functionality if desired. One of these will be a next-gen Radeon xPAK set to launch later next year for improved graphics performance that will be compatible with our FZ-55 MK2.
A standard 36-month warranty applies.
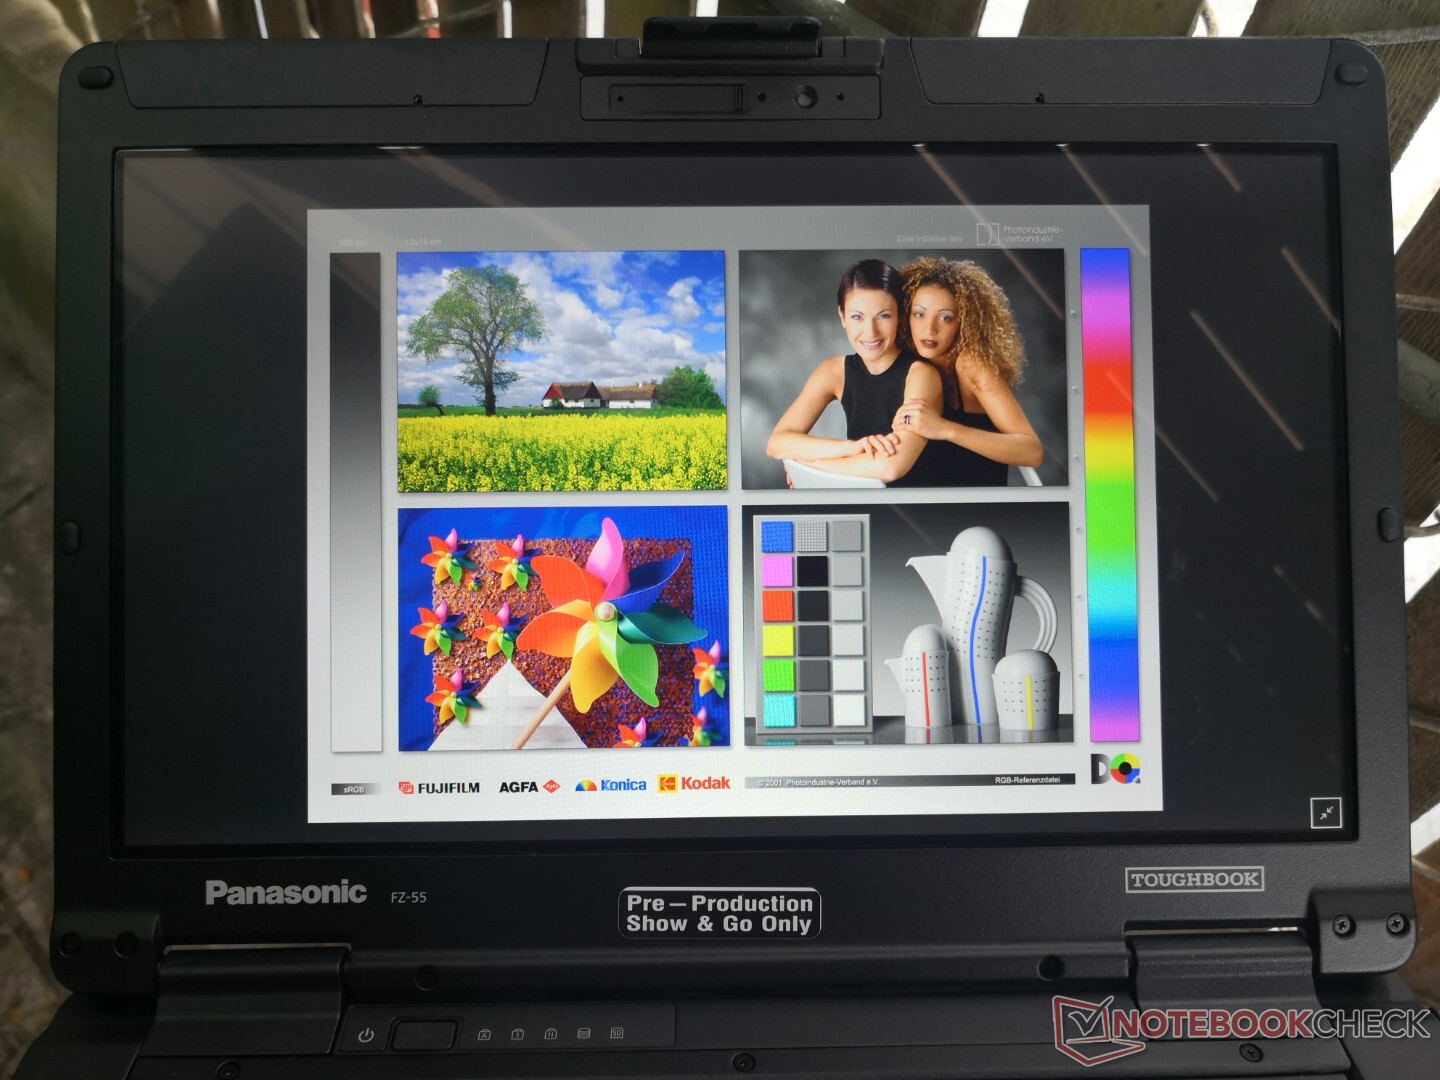
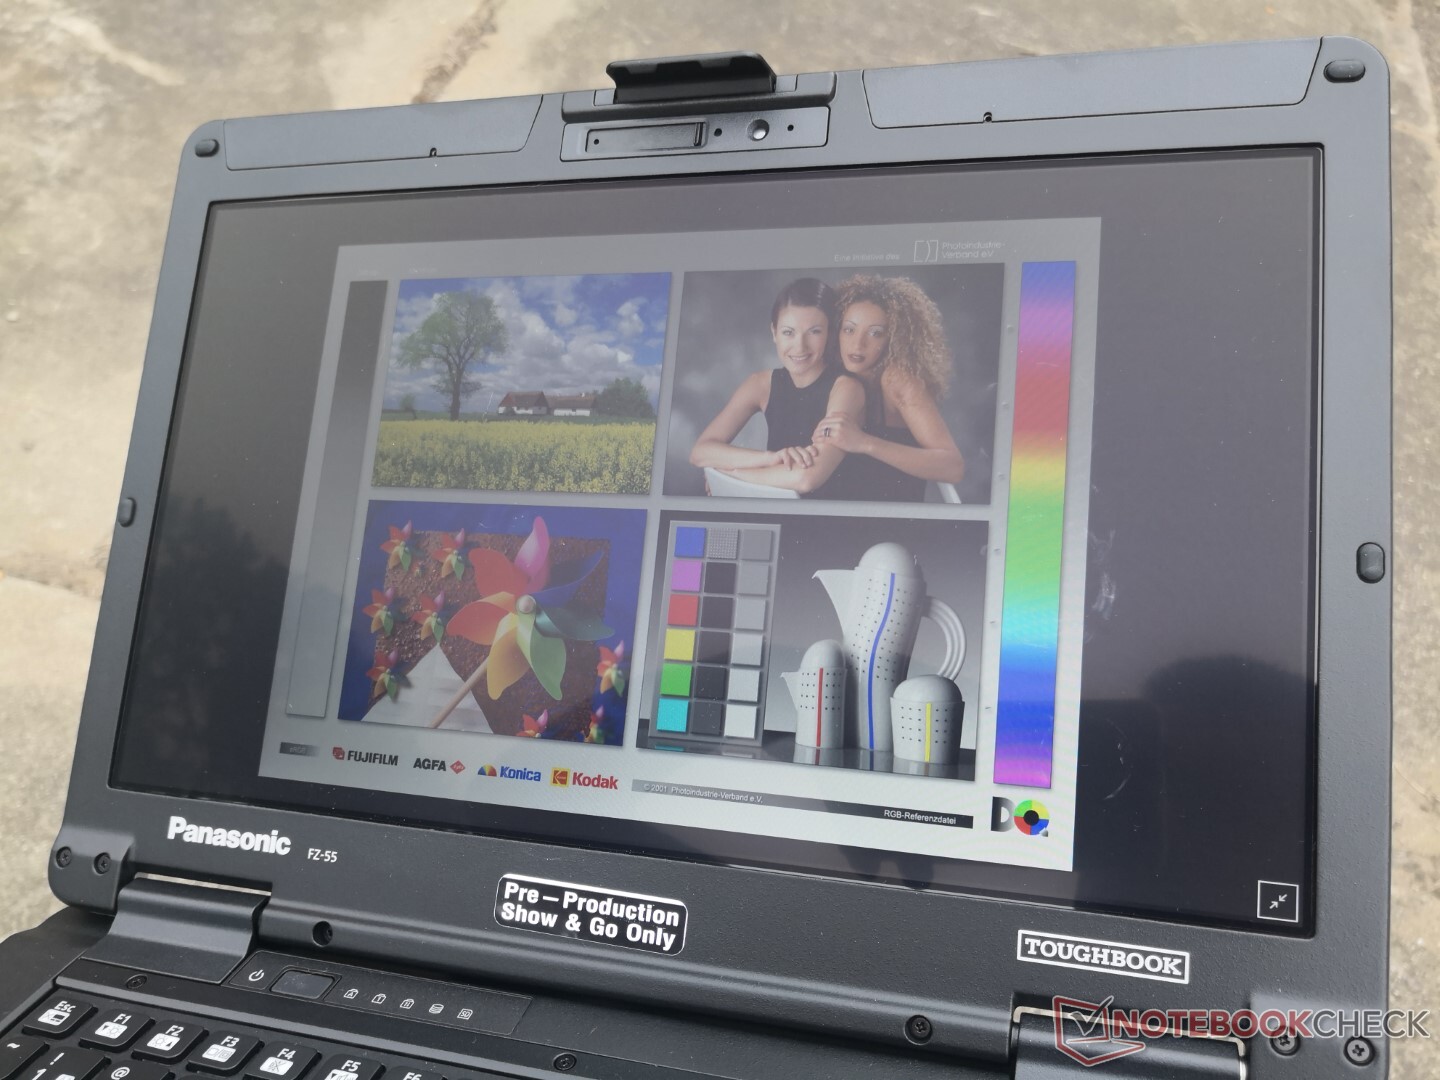
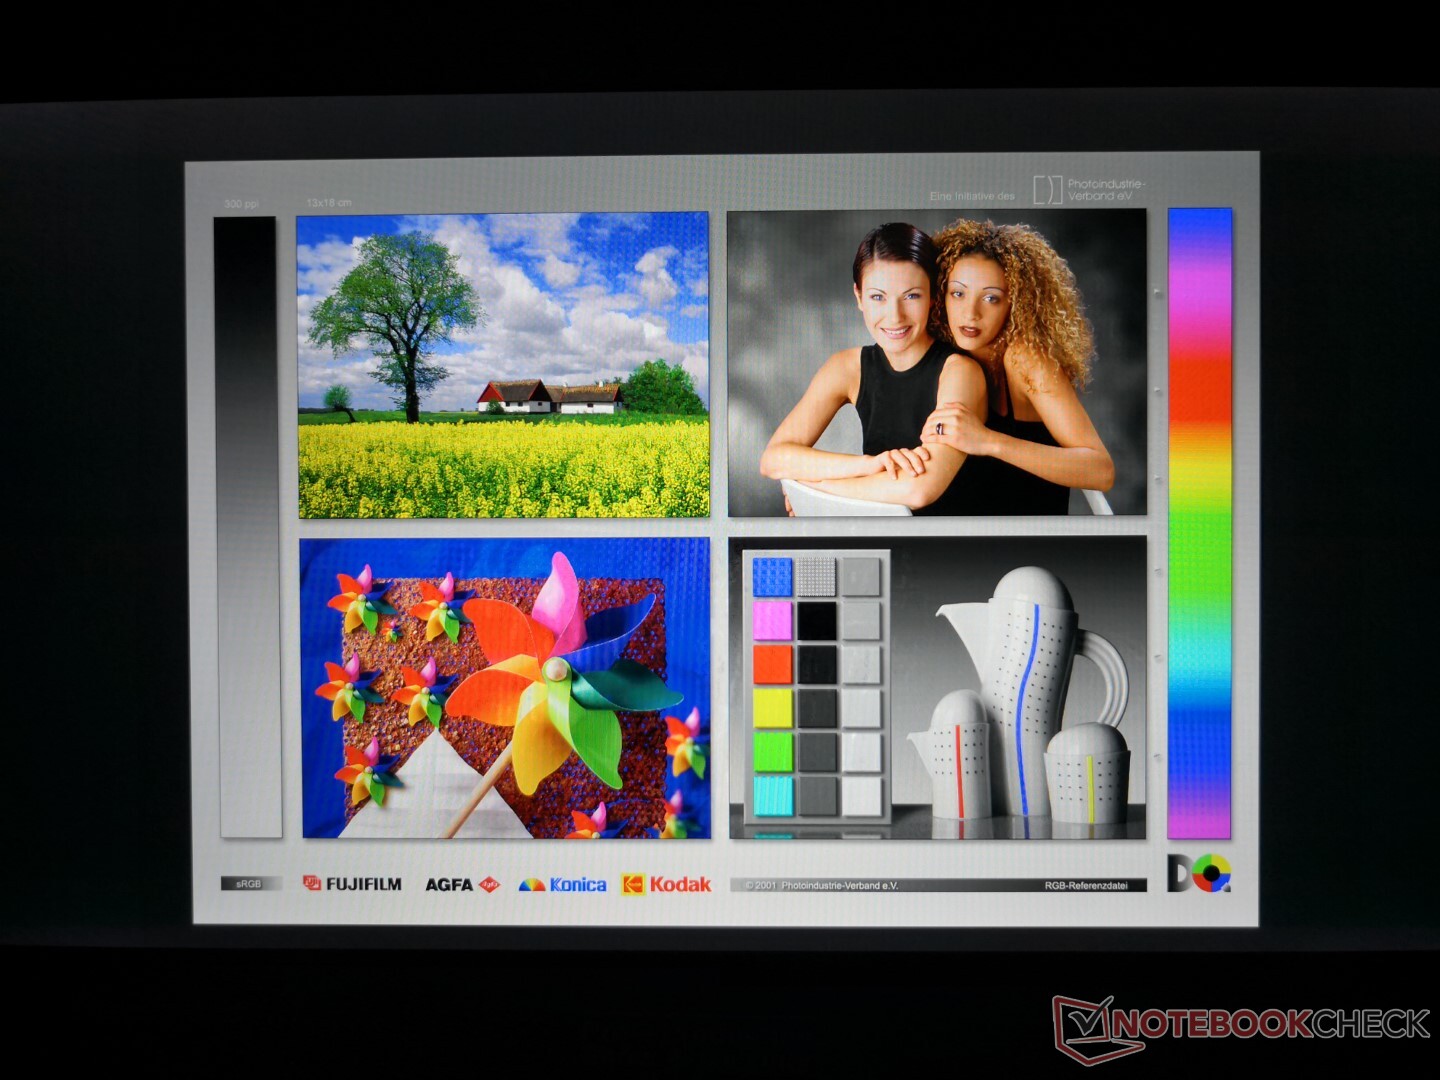
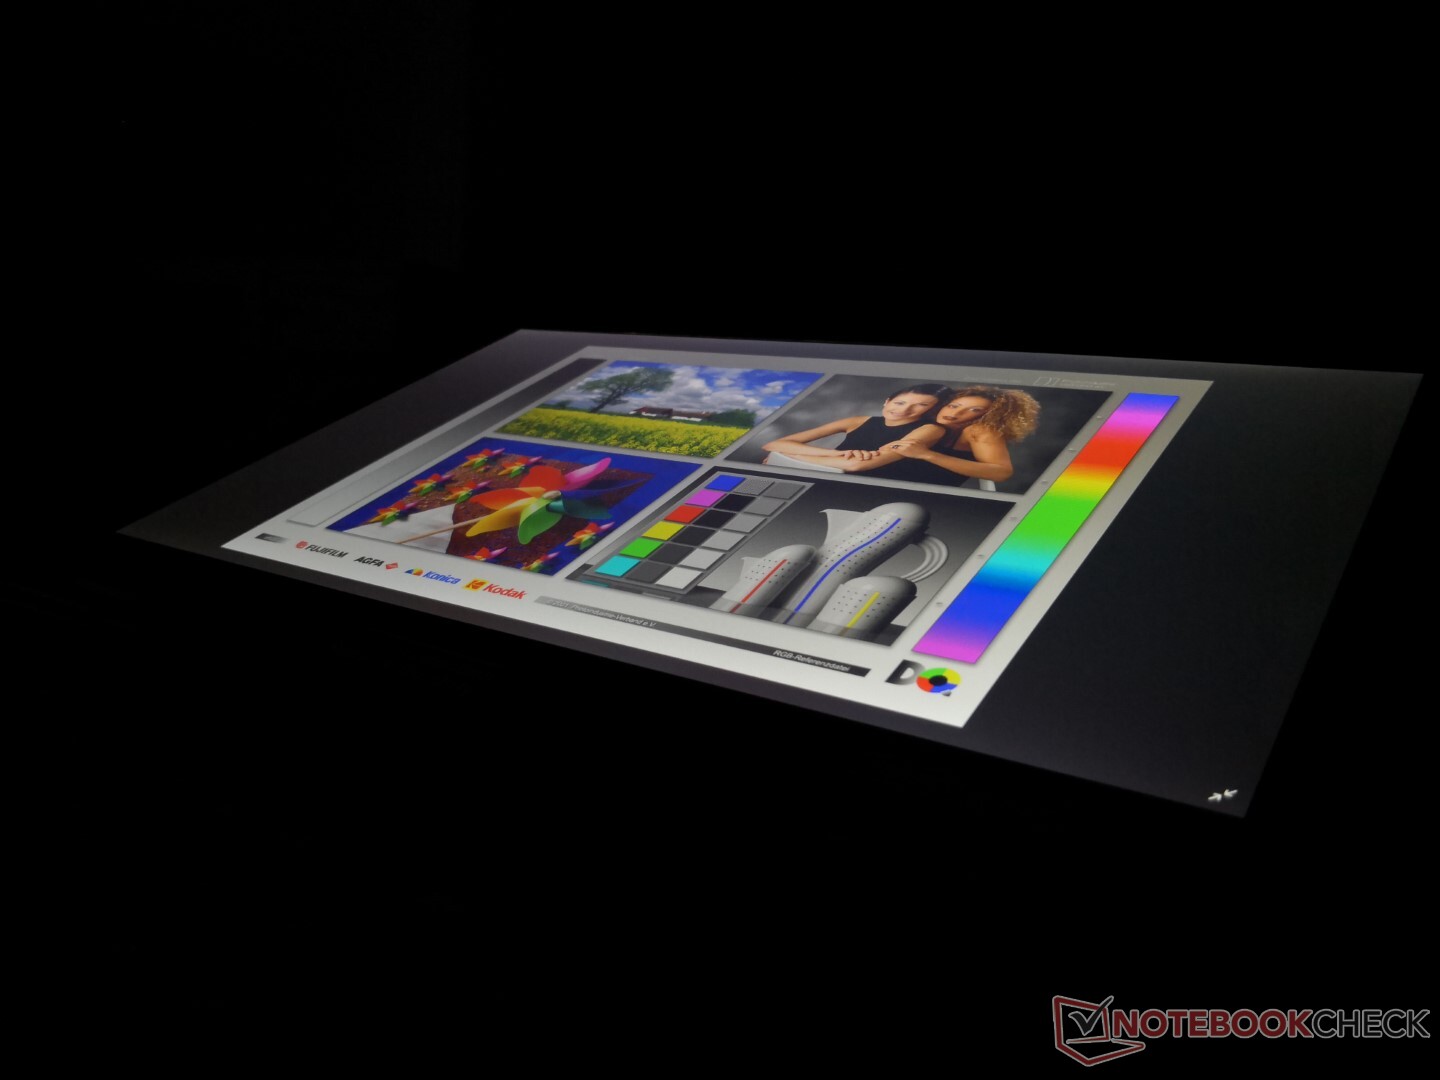
Display
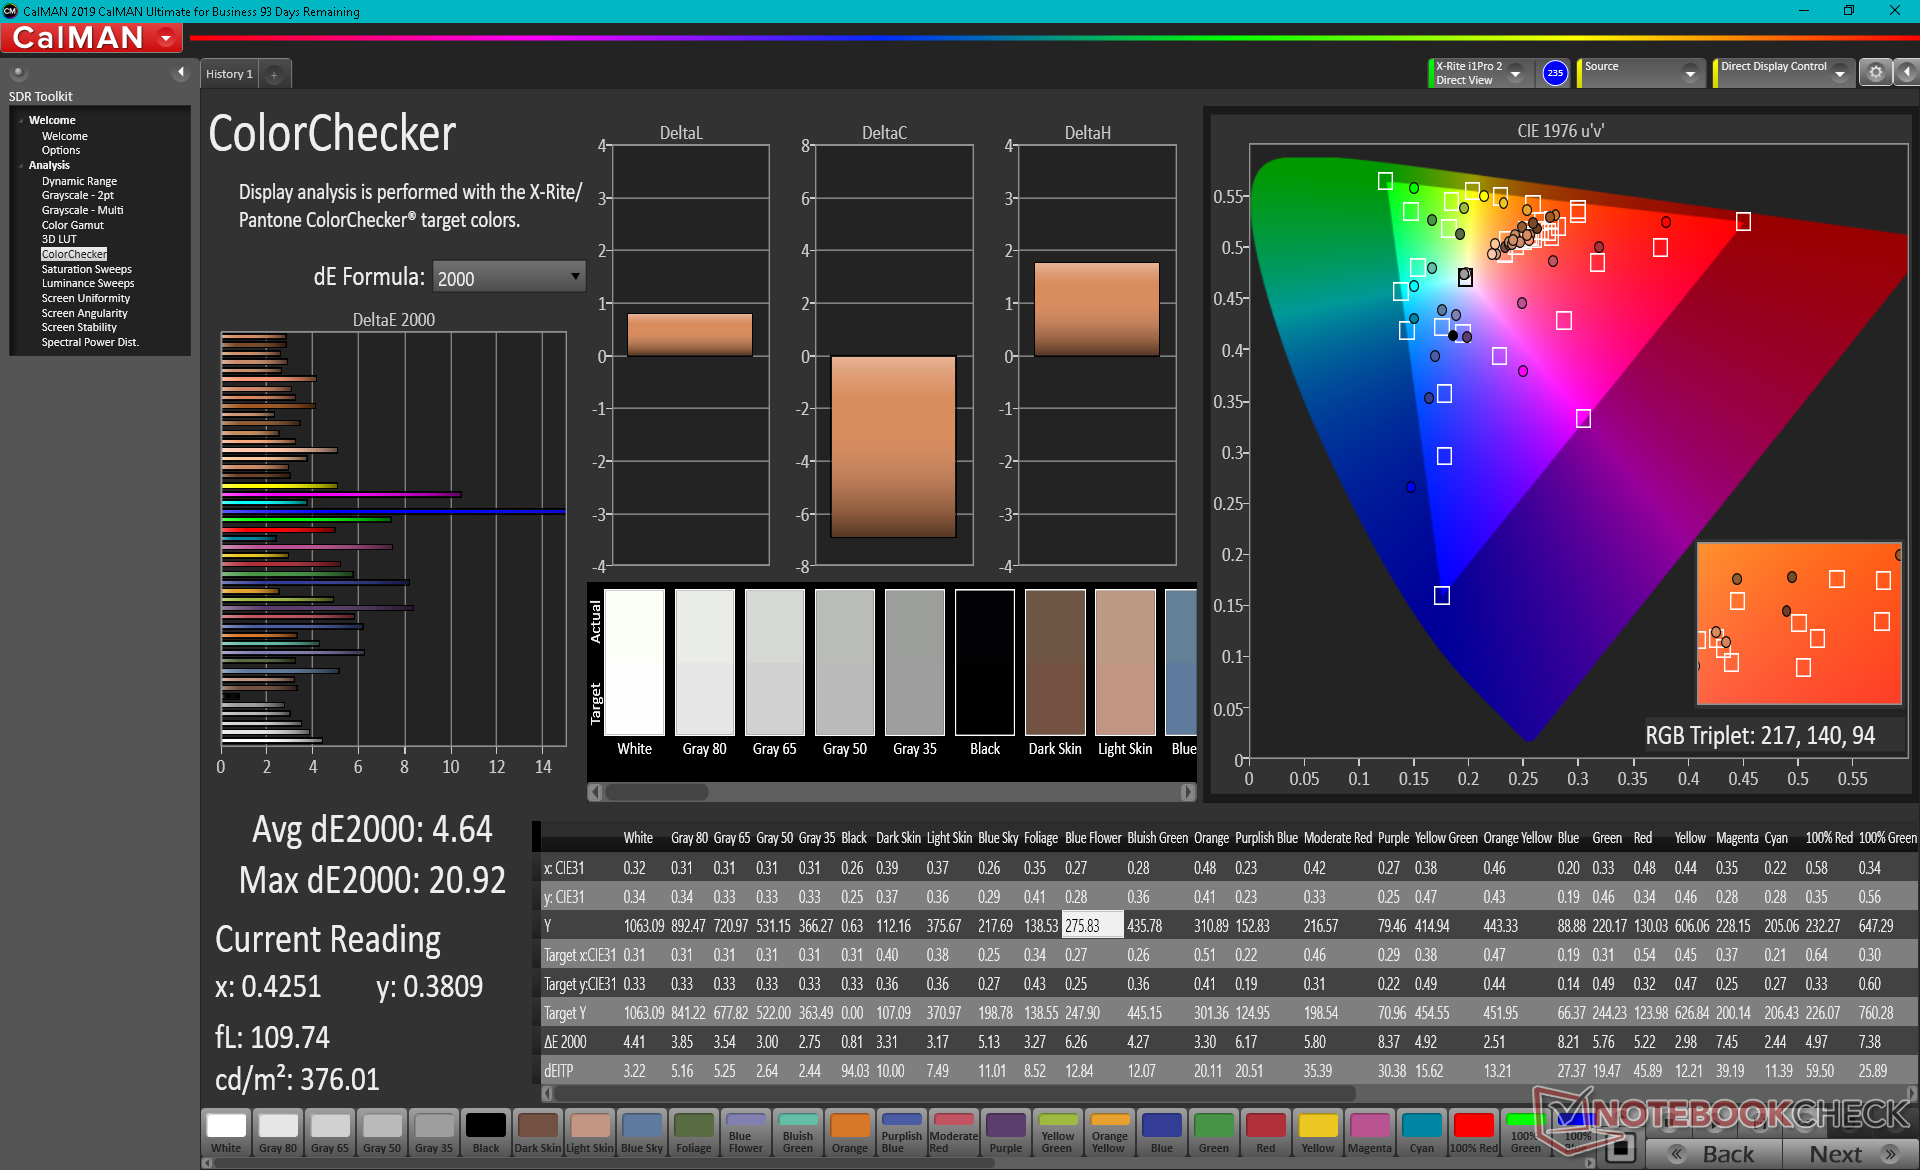
The Toughbook FZ-55 MK2 uses the same InfoVision M140NWF5 R3 IPS panel as found on the FZ-55 MK1 meaning the viewing experience remains essentially identical. Color space is very narrow at just 52 percent of sRGB compared to >95 percent on traditional Ultrabooks. Thus, don't expect colors to pop or be accurate enough for serious video editing.


| |||||||||||||||||||||||||
Brightness Distribution: 76 %
Center on Battery: 1061.1 cd/m²
Contrast: 1516:1 (Black: 0.7 cd/m²)
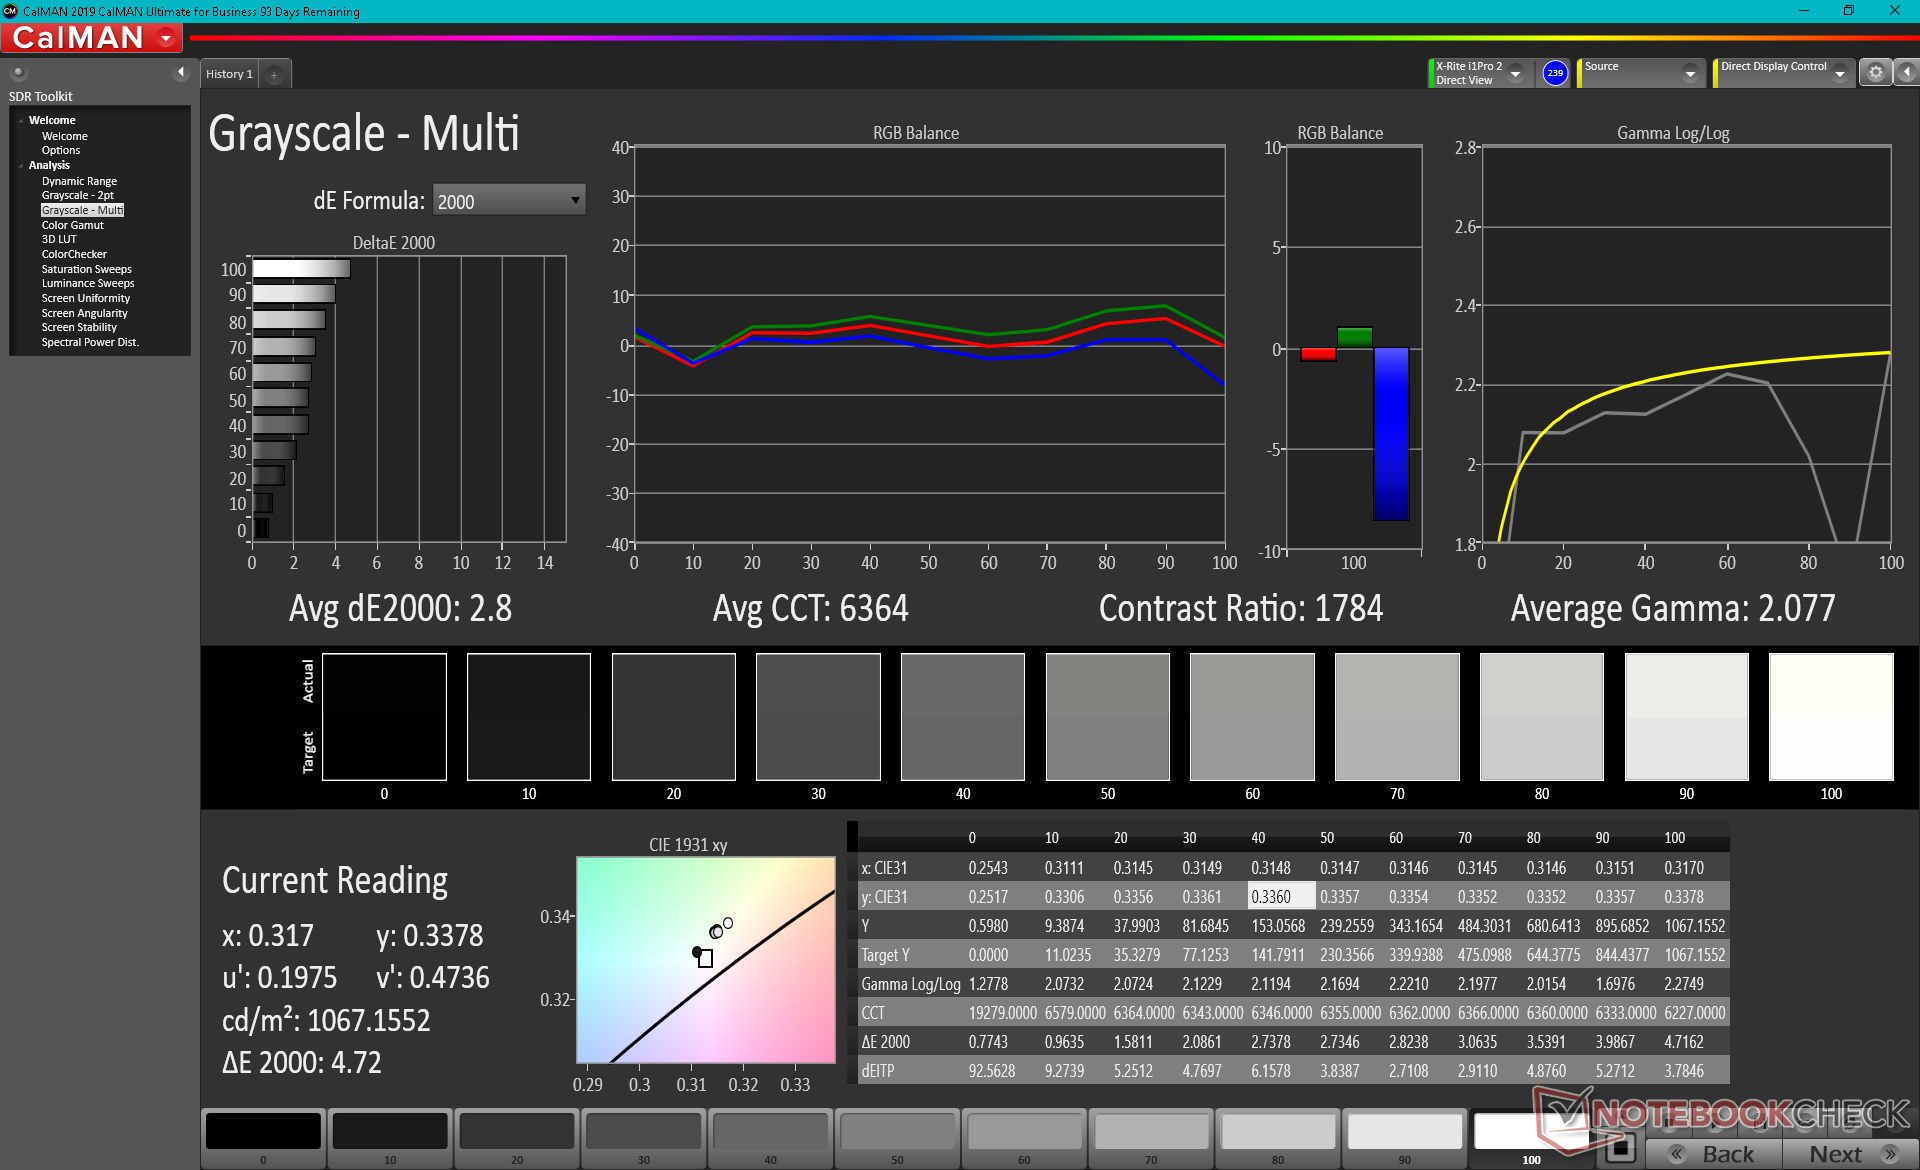
ΔE ColorChecker Calman: 4.64 | ∀{0.5-29.43 Ø4.73}
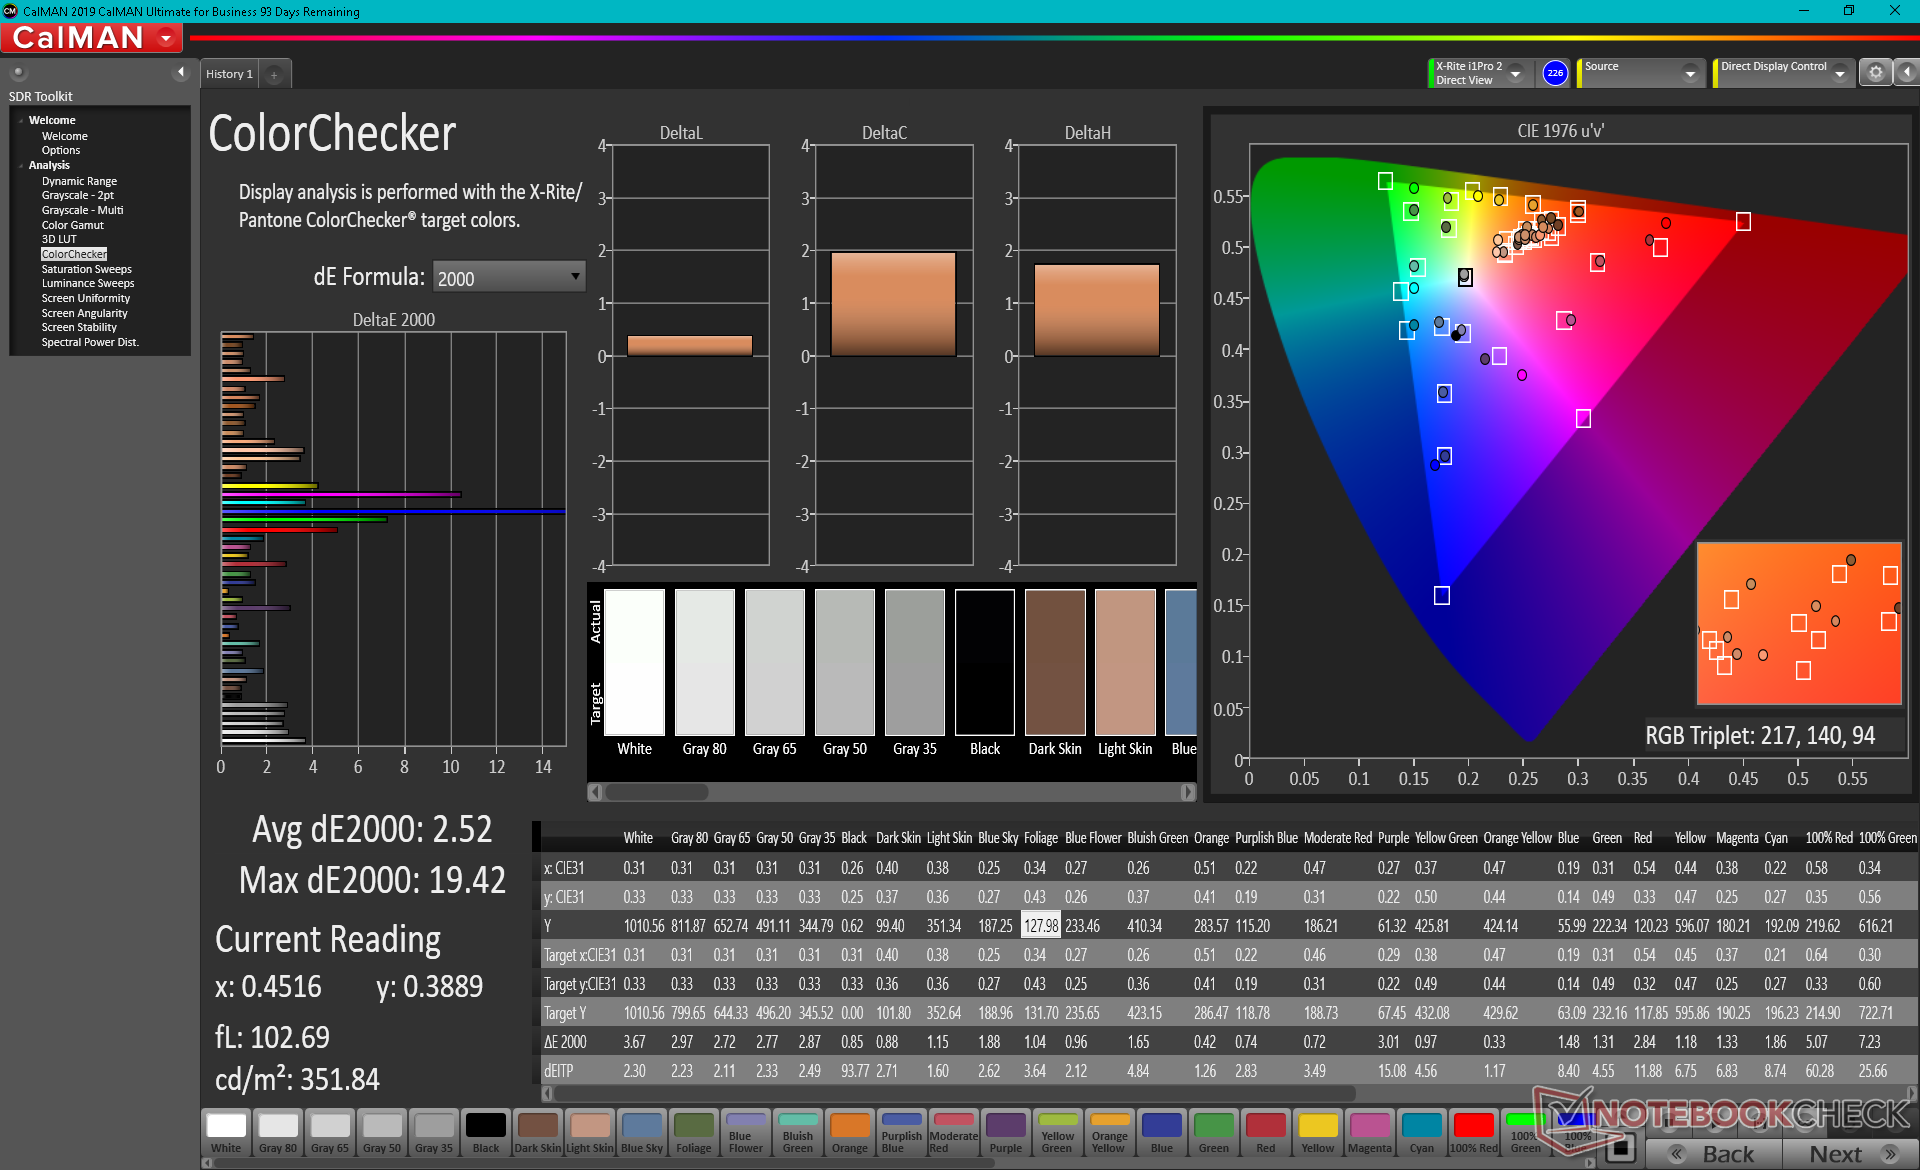
calibrated: 2.52
ΔE Greyscale Calman: 2.8 | ∀{0.09-98 Ø4.97}
36% AdobeRGB 1998 (Argyll 3D)
52.2% sRGB (Argyll 3D)
34.8% Display P3 (Argyll 3D)
Gamma: 2.08
CCT: 6364 K
| Panasonic Toughbook FZ-55 MK2 InfoVision M140NWF5 R3, IPS, 14", 1920x1080 | Panasonic Toughbook FZ-55 InfoVision M140NWF5 R3, IPS, 14", 1920x1080 | Dell Latitude 5420 Rugged-P85G AU Optronics AUO523D, IPS, 14", 1920x1080 | Durabook S14I KD140N0730A01, TN, 14", 1920x1080 | Getac S410 CMN N140BGE-E33, TN PED, 14", 1366x768 | |
|---|---|---|---|---|---|
| Display | 9% | 78% | 25% | 16% | |
| Display P3 Coverage (%) | 34.8 | 38.09 9% | 62.5 80% | 43.55 25% | 40.46 16% |
| sRGB Coverage (%) | 52.2 | 57 9% | 92.4 77% | 65.4 25% | 60.9 17% |
| AdobeRGB 1998 Coverage (%) | 36 | 39.38 9% | 64.2 78% | 45 25% | 41.8 16% |
| Response Times | -24% | -76% | 27% | 4% | |
| Response Time Grey 50% / Grey 80% * (ms) | 28.4 ? | 42 ? -48% | 68 ? -139% | 30.4 ? -7% | 41.2 ? -45% |
| Response Time Black / White * (ms) | 30 ? | 29.6 ? 1% | 33.6 ? -12% | 11.8 ? 61% | 14 ? 53% |
| PWM Frequency (Hz) | 685 ? | 694 ? | 735 ? | 304.9 ? | 877 ? |
| Screen | -22% | -6% | -96% | -99% | |
| Brightness middle (cd/m²) | 1061.1 | 1037 -2% | 1111.7 5% | 1180.7 11% | 265.1 -75% |
| Brightness (cd/m²) | 997 | 1015 2% | 1026 3% | 1102 11% | 246 -75% |
| Brightness Distribution (%) | 76 | 76 0% | 80 5% | 89 17% | 81 7% |
| Black Level * (cd/m²) | 0.7 | 0.6 14% | 0.81 -16% | 1.91 -173% | 0.58 17% |
| Contrast (:1) | 1516 | 1728 14% | 1372 -9% | 618 -59% | 457 -70% |
| Colorchecker dE 2000 * | 4.64 | 5.71 -23% | 3.83 17% | 13.45 -190% | 14.24 -207% |
| Colorchecker dE 2000 max. * | 20.92 | 26.27 -26% | 7.85 62% | 22.52 -8% | 26.66 -27% |
| Colorchecker dE 2000 calibrated * | 2.52 | 4.52 -79% | 2.98 -18% | 3.19 -27% | 3.94 -56% |
| Greyscale dE 2000 * | 2.8 | 5.5 -96% | 5.6 -100% | 15.4 -450% | 14.2 -407% |
| Gamma | 2.08 106% | 2.04 108% | 2.306 95% | 1.97 112% | 2.03 108% |
| CCT | 6364 102% | 5783 112% | 7676 85% | 21134 31% | 17152 38% |
| Color Space (Percent of AdobeRGB 1998) (%) | 36.4 | 59 | 41.6 | 38.7 | |
| Color Space (Percent of sRGB) (%) | 57 | 93 | 65.5 | 61 | |
| Total Average (Program / Settings) | -12% /
-15% | -1% /
2% | -15% /
-53% | -26% /
-60% |
* ... smaller is better
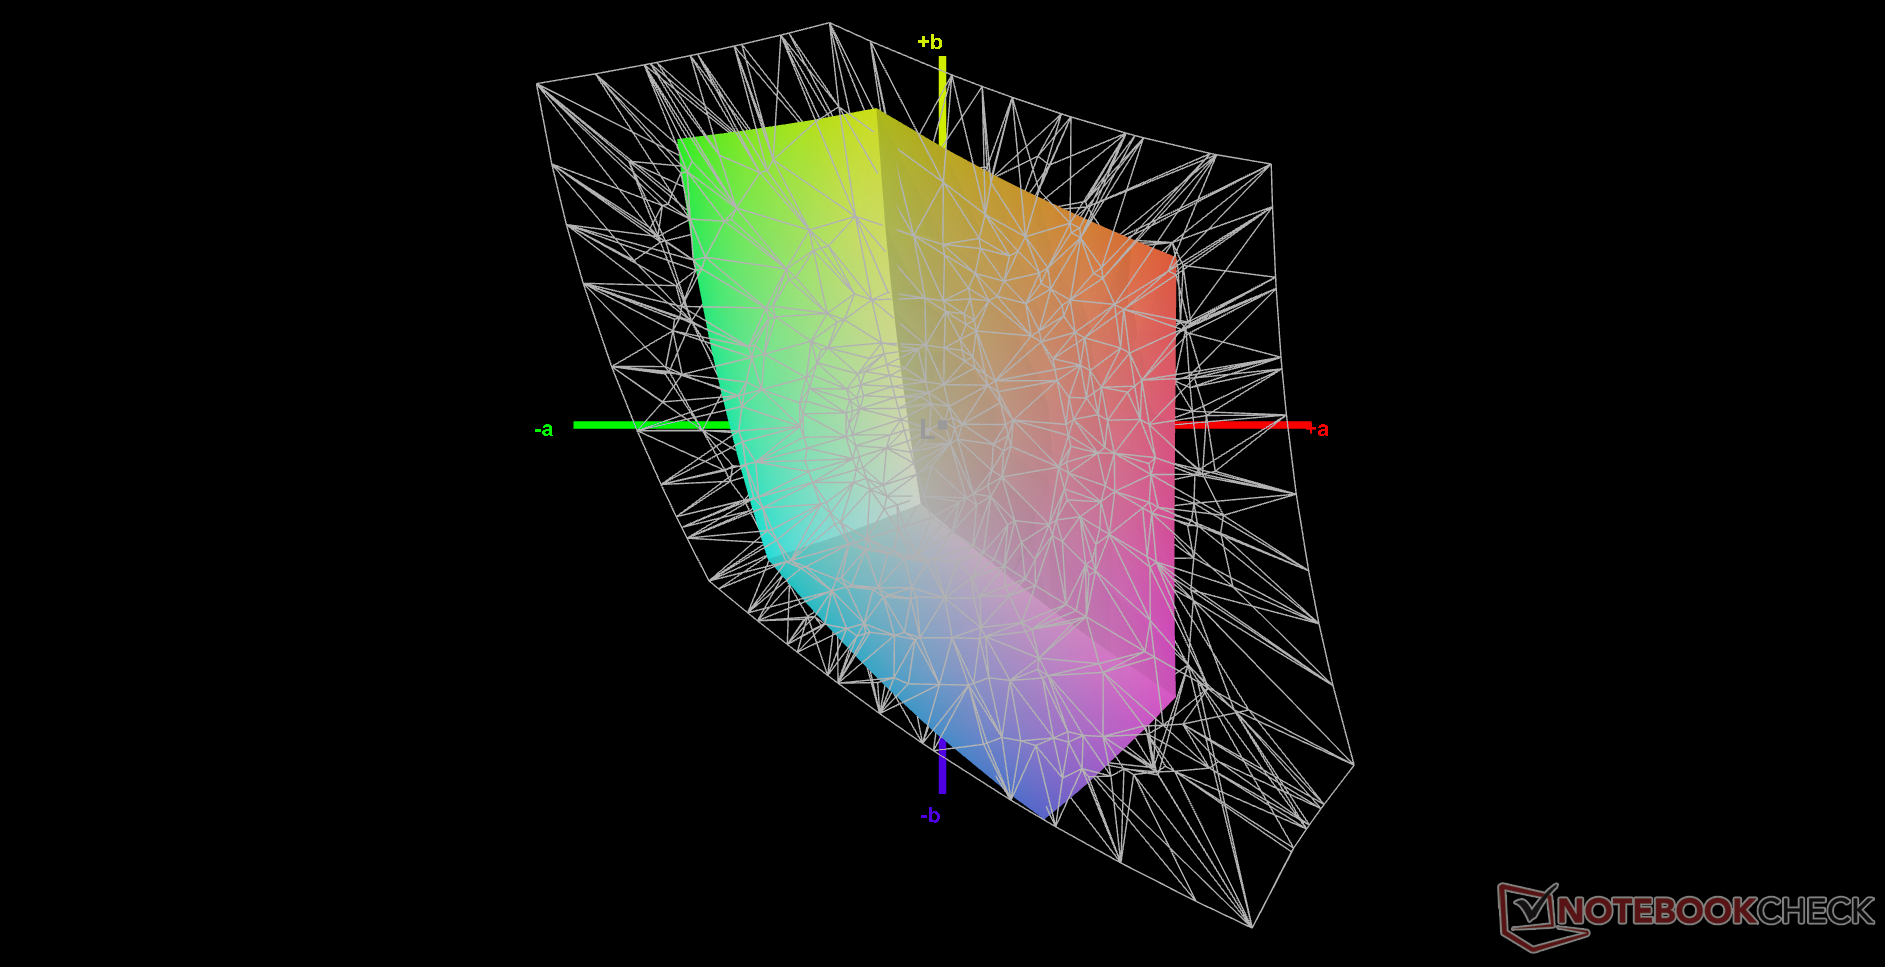
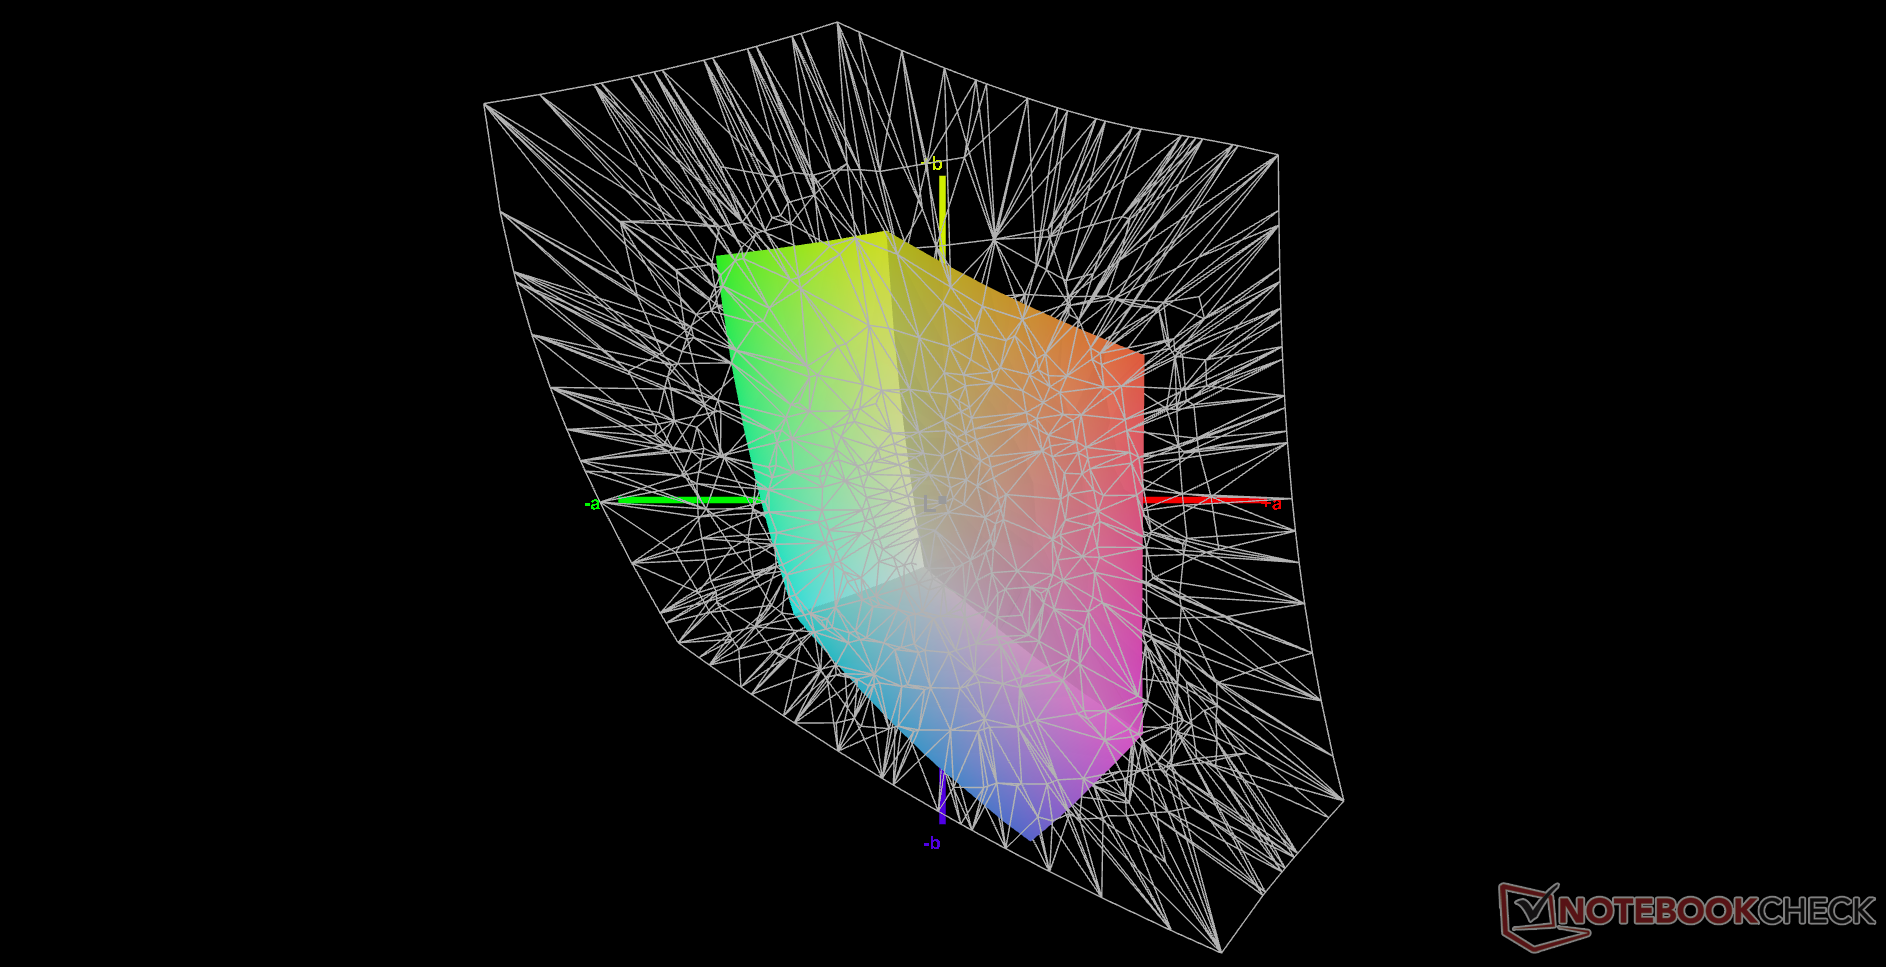
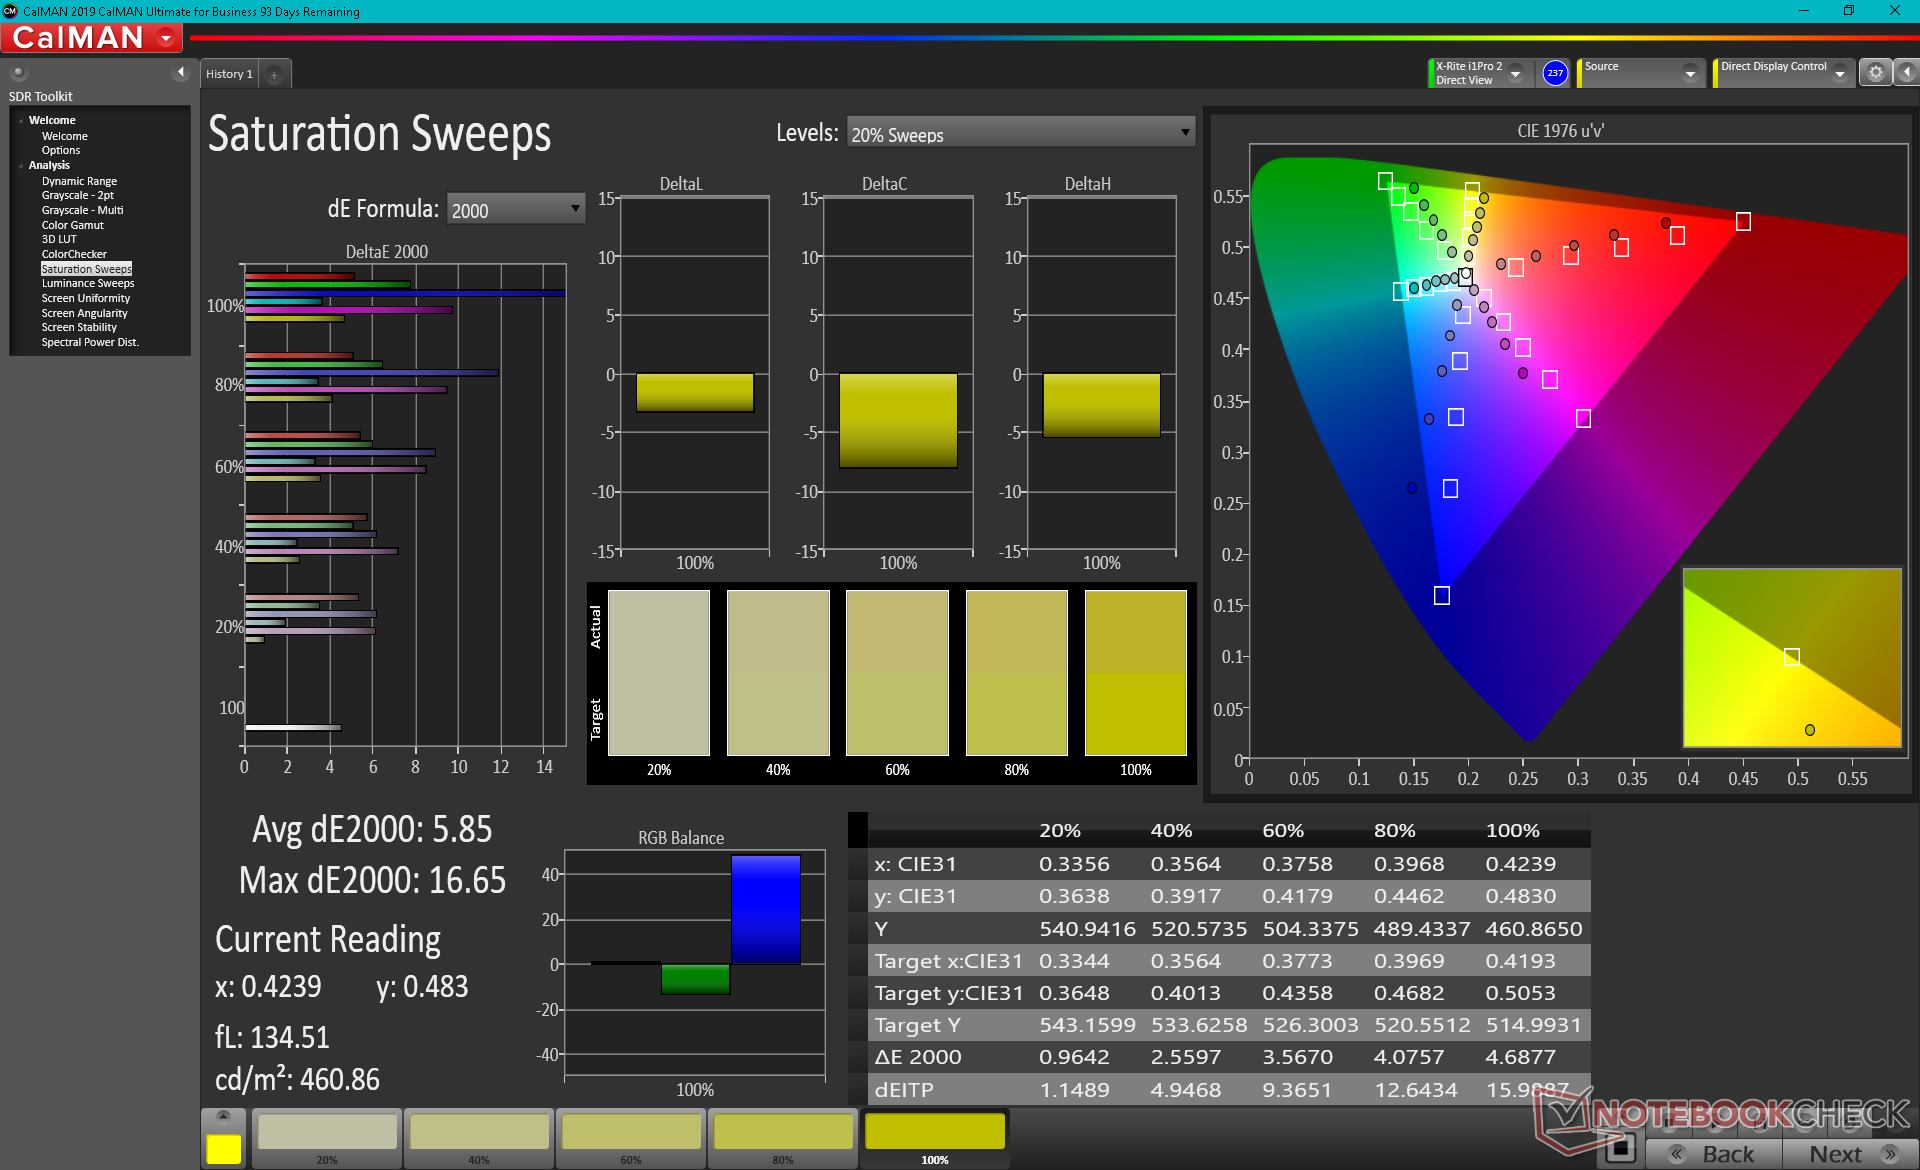
Calibrating the display will improve grayscale and colors at lower saturation levels, but the limited color space mentioned above means colors at higher saturation levels will always be relatively inaccurate against the sRGB standard.


Display Response Times
| ↔ Response Time Black to White | ||
|---|---|---|
| 30 ms ... rise ↗ and fall ↘ combined | ↗ 16 ms rise | 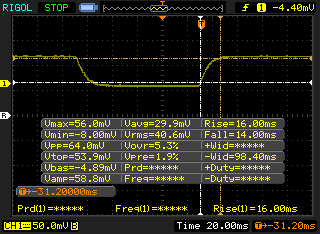 |
| ↘ 14 ms fall | ||
| The screen shows slow response rates in our tests and will be unsatisfactory for gamers. In comparison, all tested devices range from 0.1 (minimum) to 240 (maximum) ms. » 80 % of all devices are better. This means that the measured response time is worse than the average of all tested devices (19.9 ms). | ||
| ↔ Response Time 50% Grey to 80% Grey | ||
| 28.4 ms ... rise ↗ and fall ↘ combined | ↗ 14 ms rise |  |
| ↘ 14.4 ms fall | ||
| The screen shows relatively slow response rates in our tests and may be too slow for gamers. In comparison, all tested devices range from 0.165 (minimum) to 636 (maximum) ms. » 38 % of all devices are better. This means that the measured response time is similar to the average of all tested devices (31.1 ms). | ||
Screen Flickering / PWM (Pulse-Width Modulation)
| Screen flickering / PWM detected | 685 Hz | ≤ 99 % brightness setting | 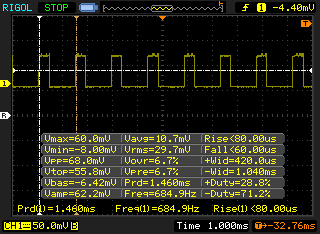 |
The display backlight flickers at 685 Hz (worst case, e.g., utilizing PWM) Flickering detected at a brightness setting of 99 % and below. There should be no flickering or PWM above this brightness setting. The frequency of 685 Hz is quite high, so most users sensitive to PWM should not notice any flickering. In comparison: 52 % of all tested devices do not use PWM to dim the display. If PWM was detected, an average of 7788 (minimum: 5 - maximum: 343500) Hz was measured. | |||
The display is viewable under most outdoor conditions due to the extra-bright 1000-nit backlight. However, direct sunlight should still be avoided or else colors will still become washed out. Glare is otherwise minimal and easier to control than on a typical Ultrabook.


Performance

Processor
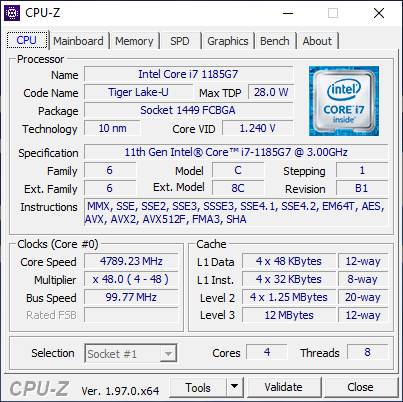
CPU performance is about 15 percent slower than the Core i7-1165G7 due to the performance overhead required to support vPro features. When compared to other i7-1185G7 laptops, however, performance is where we expect it to be. Upgrading from the Core i5-8365 in the original FZ-55 MK1 will net a 30 to 40 percent boost in both single- and multi-threaded workloads.
Cinebench R15 Multi Loop
Cinebench R23: Multi Core | Single Core
Cinebench R15: CPU Multi 64Bit | CPU Single 64Bit
Blender: v2.79 BMW27 CPU
7-Zip 18.03: 7z b 4 -mmt1 | 7z b 4
Geekbench 5.5: Single-Core | Multi-Core
HWBOT x265 Benchmark v2.2: 4k Preset
LibreOffice : 20 Documents To PDF
R Benchmark 2.5: Overall mean
| Cinebench R20 / CPU (Multi Core) | |
| Lenovo ThinkPad P14s Gen1-20Y10002GE | |
| Lenovo ThinkPad L14 G2 AMD | |
| ADATA XPG Xenia 14 | |
| Panasonic Toughbook FZ-55 MK2 | |
| Average Intel Core i7-1185G7 (1425 - 2493, n=28) | |
| Schenker VIA 14 Late 2020 | |
| Infinix INBook X1 Pro | |
| Acer Spin 3 SP314-54N-56S5 | |
| Asus ZenBook 14 UX434FL-DB77 | |
| Asus VivoBook 14 X403FA | |
| Cinebench R20 / CPU (Single Core) | |
| ADATA XPG Xenia 14 | |
| Average Intel Core i7-1185G7 (489 - 593, n=28) | |
| Lenovo ThinkPad L14 G2 AMD | |
| Panasonic Toughbook FZ-55 MK2 | |
| Schenker VIA 14 Late 2020 | |
| Lenovo ThinkPad P14s Gen1-20Y10002GE | |
| Infinix INBook X1 Pro | |
| Asus ZenBook 14 UX434FL-DB77 | |
| Acer Spin 3 SP314-54N-56S5 | |
| Asus VivoBook 14 X403FA | |
| Cinebench R23 / Multi Core | |
| Lenovo ThinkPad P14s Gen1-20Y10002GE | |
| Lenovo ThinkPad L14 G2 AMD | |
| ADATA XPG Xenia 14 | |
| Average Intel Core i7-1185G7 (3610 - 6383, n=24) | |
| Panasonic Toughbook FZ-55 MK2 | |
| Schenker VIA 14 Late 2020 | |
| Infinix INBook X1 Pro | |
| Acer Spin 3 SP314-54N-56S5 | |
| Cinebench R23 / Single Core | |
| ADATA XPG Xenia 14 | |
| Average Intel Core i7-1185G7 (1251 - 1532, n=24) | |
| Panasonic Toughbook FZ-55 MK2 | |
| Lenovo ThinkPad L14 G2 AMD | |
| Schenker VIA 14 Late 2020 | |
| Infinix INBook X1 Pro | |
| Lenovo ThinkPad P14s Gen1-20Y10002GE | |
| Acer Spin 3 SP314-54N-56S5 | |
| Geekbench 5.5 / Single-Core | |
| Average Intel Core i7-1185G7 (1398 - 1626, n=21) | |
| Schenker VIA 14 Late 2020 | |
| Lenovo ThinkPad L14 G2 AMD | |
| Acer Spin 3 SP314-54N-56S5 | |
| Asus ZenBook 14 UX434FL-DB77 | |
| Lenovo ThinkPad P14s Gen1-20Y10002GE | |
| Geekbench 5.5 / Multi-Core | |
| Lenovo ThinkPad P14s Gen1-20Y10002GE | |
| Average Intel Core i7-1185G7 (4620 - 5944, n=21) | |
| Lenovo ThinkPad L14 G2 AMD | |
| Schenker VIA 14 Late 2020 | |
| Acer Spin 3 SP314-54N-56S5 | |
| Asus ZenBook 14 UX434FL-DB77 | |
| HWBOT x265 Benchmark v2.2 / 4k Preset | |
| Lenovo ThinkPad L14 G2 AMD | |
| Lenovo ThinkPad P14s Gen1-20Y10002GE | |
| ADATA XPG Xenia 14 | |
| Panasonic Toughbook FZ-55 MK2 | |
| Average Intel Core i7-1185G7 (5.02 - 8.13, n=27) | |
| Infinix INBook X1 Pro | |
| Schenker VIA 14 Late 2020 | |
| Asus ZenBook 14 UX434FL-DB77 | |
| Asus VivoBook 14 X403FA | |
| Acer Spin 3 SP314-54N-56S5 | |
| LibreOffice / 20 Documents To PDF | |
| Asus ZenBook 14 UX434FL-DB77 | |
| Lenovo ThinkPad P14s Gen1-20Y10002GE | |
| Acer Spin 3 SP314-54N-56S5 | |
| Infinix INBook X1 Pro | |
| Lenovo ThinkPad L14 G2 AMD | |
| Average Intel Core i7-1185G7 (41.3 - 61.7, n=26) | |
| Schenker VIA 14 Late 2020 | |
| Panasonic Toughbook FZ-55 MK2 | |
| ADATA XPG Xenia 14 | |
| R Benchmark 2.5 / Overall mean | |
| Asus ZenBook 14 UX434FL-DB77 | |
| Acer Spin 3 SP314-54N-56S5 | |
| Infinix INBook X1 Pro | |
| Schenker VIA 14 Late 2020 | |
| Lenovo ThinkPad P14s Gen1-20Y10002GE | |
| Average Intel Core i7-1185G7 (0.55 - 0.615, n=27) | |
| Panasonic Toughbook FZ-55 MK2 | |
| ADATA XPG Xenia 14 | |
| Lenovo ThinkPad L14 G2 AMD | |
* ... smaller is better
System Performance
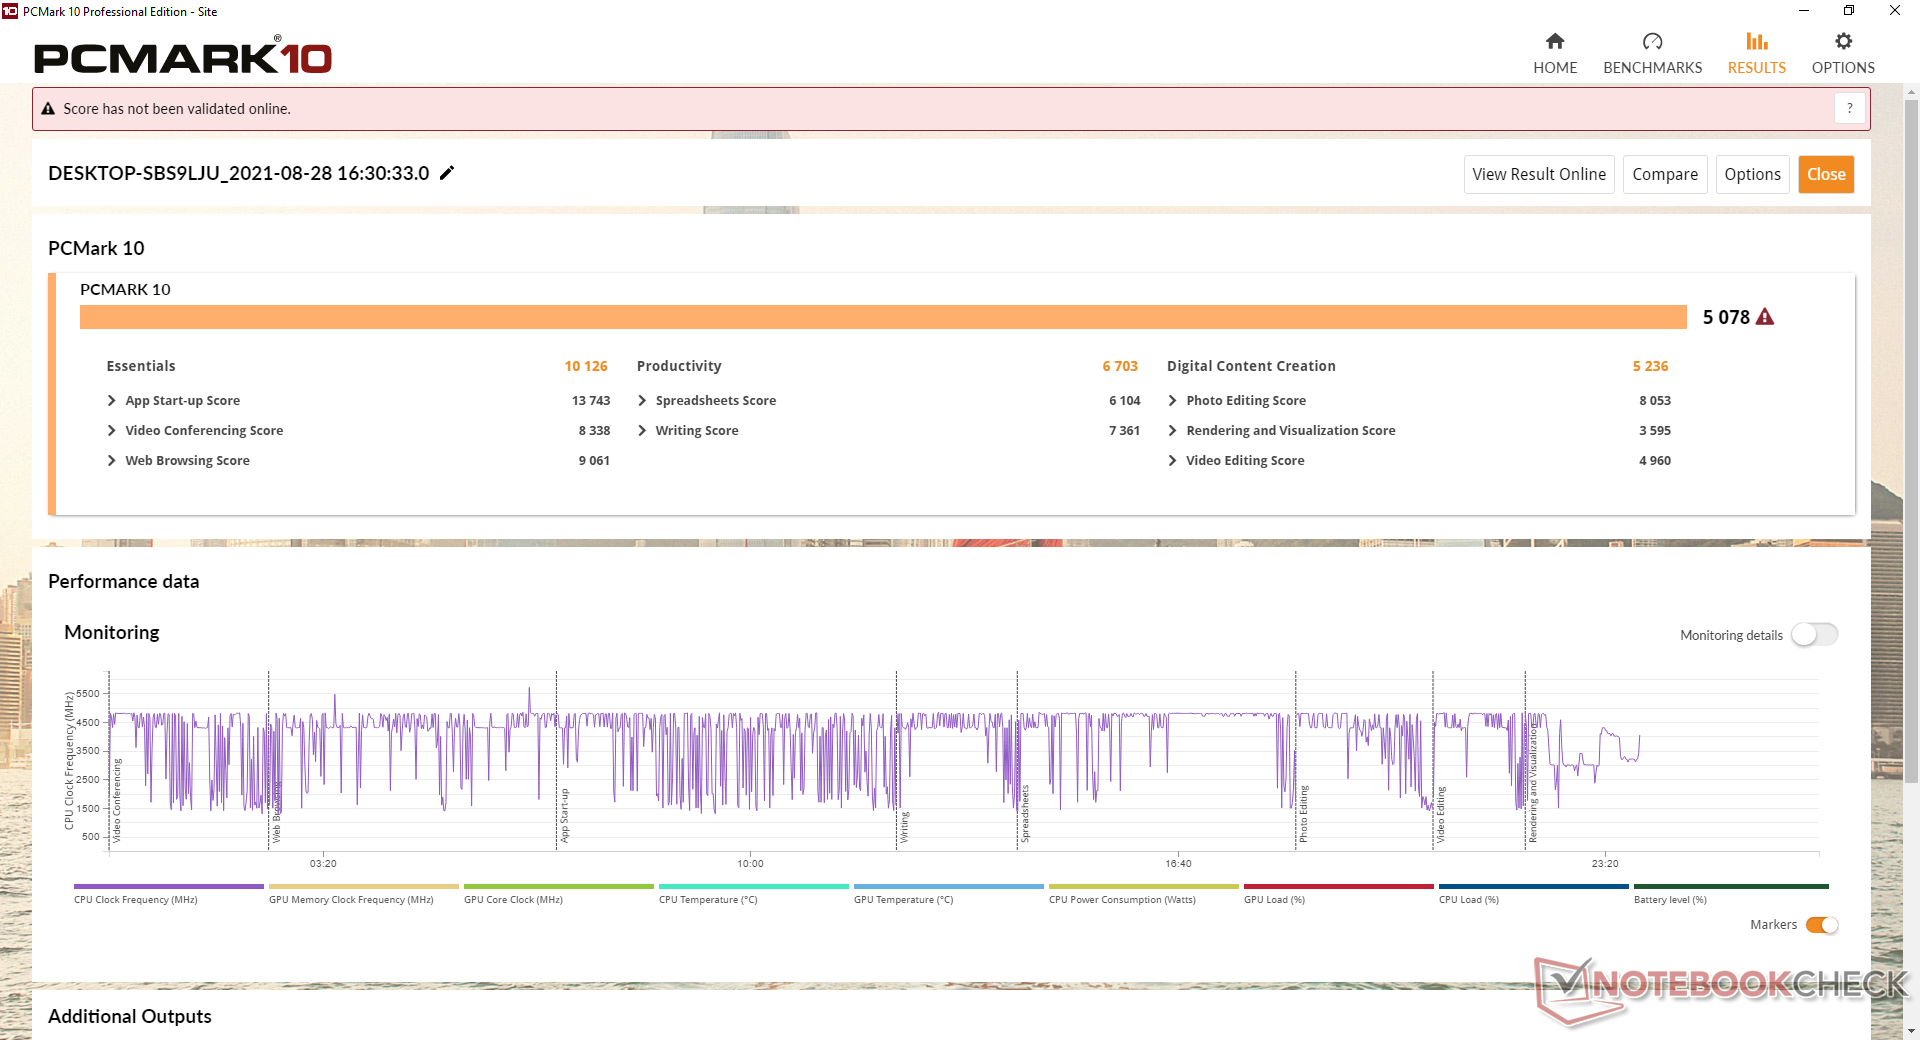
PCMark 10 scores are consistently higher than on the original MK1 especially in Digital Content Creation where graphics performance matters most.
| PCMark 10 / Score | |
| Panasonic Toughbook FZ-55 MK2 | |
| Average Intel Core i7-1185G7, Intel Iris Xe Graphics G7 96EUs (4746 - 5561, n=20) | |
| Durabook S14I | |
| Dell Latitude 5420 Rugged-P85G | |
| Getac S410 | |
| Panasonic Toughbook FZ-55 | |
| PCMark 10 / Essentials | |
| Panasonic Toughbook FZ-55 MK2 | |
| Durabook S14I | |
| Average Intel Core i7-1185G7, Intel Iris Xe Graphics G7 96EUs (8279 - 10664, n=20) | |
| Dell Latitude 5420 Rugged-P85G | |
| Getac S410 | |
| Panasonic Toughbook FZ-55 | |
| PCMark 10 / Productivity | |
| Dell Latitude 5420 Rugged-P85G | |
| Durabook S14I | |
| Getac S410 | |
| Average Intel Core i7-1185G7, Intel Iris Xe Graphics G7 96EUs (5799 - 8770, n=20) | |
| Panasonic Toughbook FZ-55 MK2 | |
| Panasonic Toughbook FZ-55 | |
| PCMark 10 / Digital Content Creation | |
| Panasonic Toughbook FZ-55 MK2 | |
| Average Intel Core i7-1185G7, Intel Iris Xe Graphics G7 96EUs (4424 - 5684, n=20) | |
| Durabook S14I | |
| Dell Latitude 5420 Rugged-P85G | |
| Panasonic Toughbook FZ-55 | |
| Getac S410 | |
| PCMark 10 Score | 5078 points | |
Help | ||
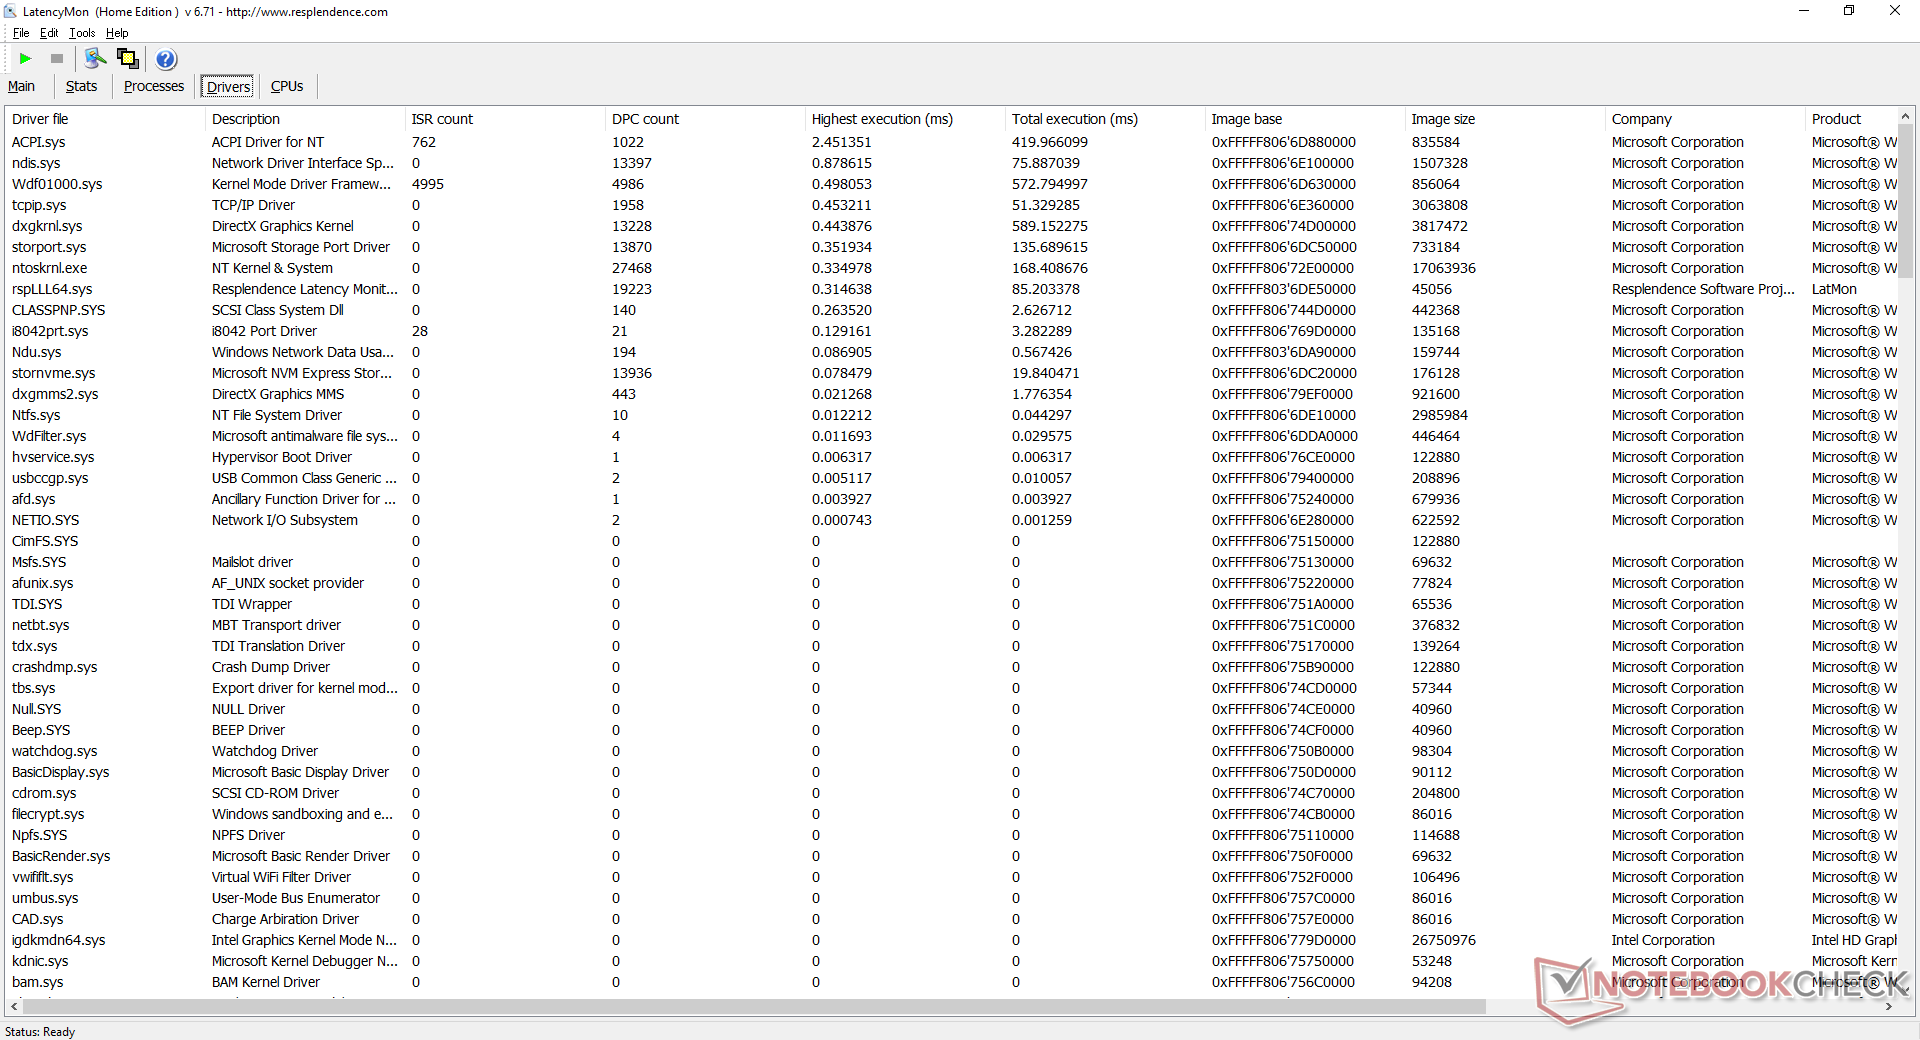
DPC Latency
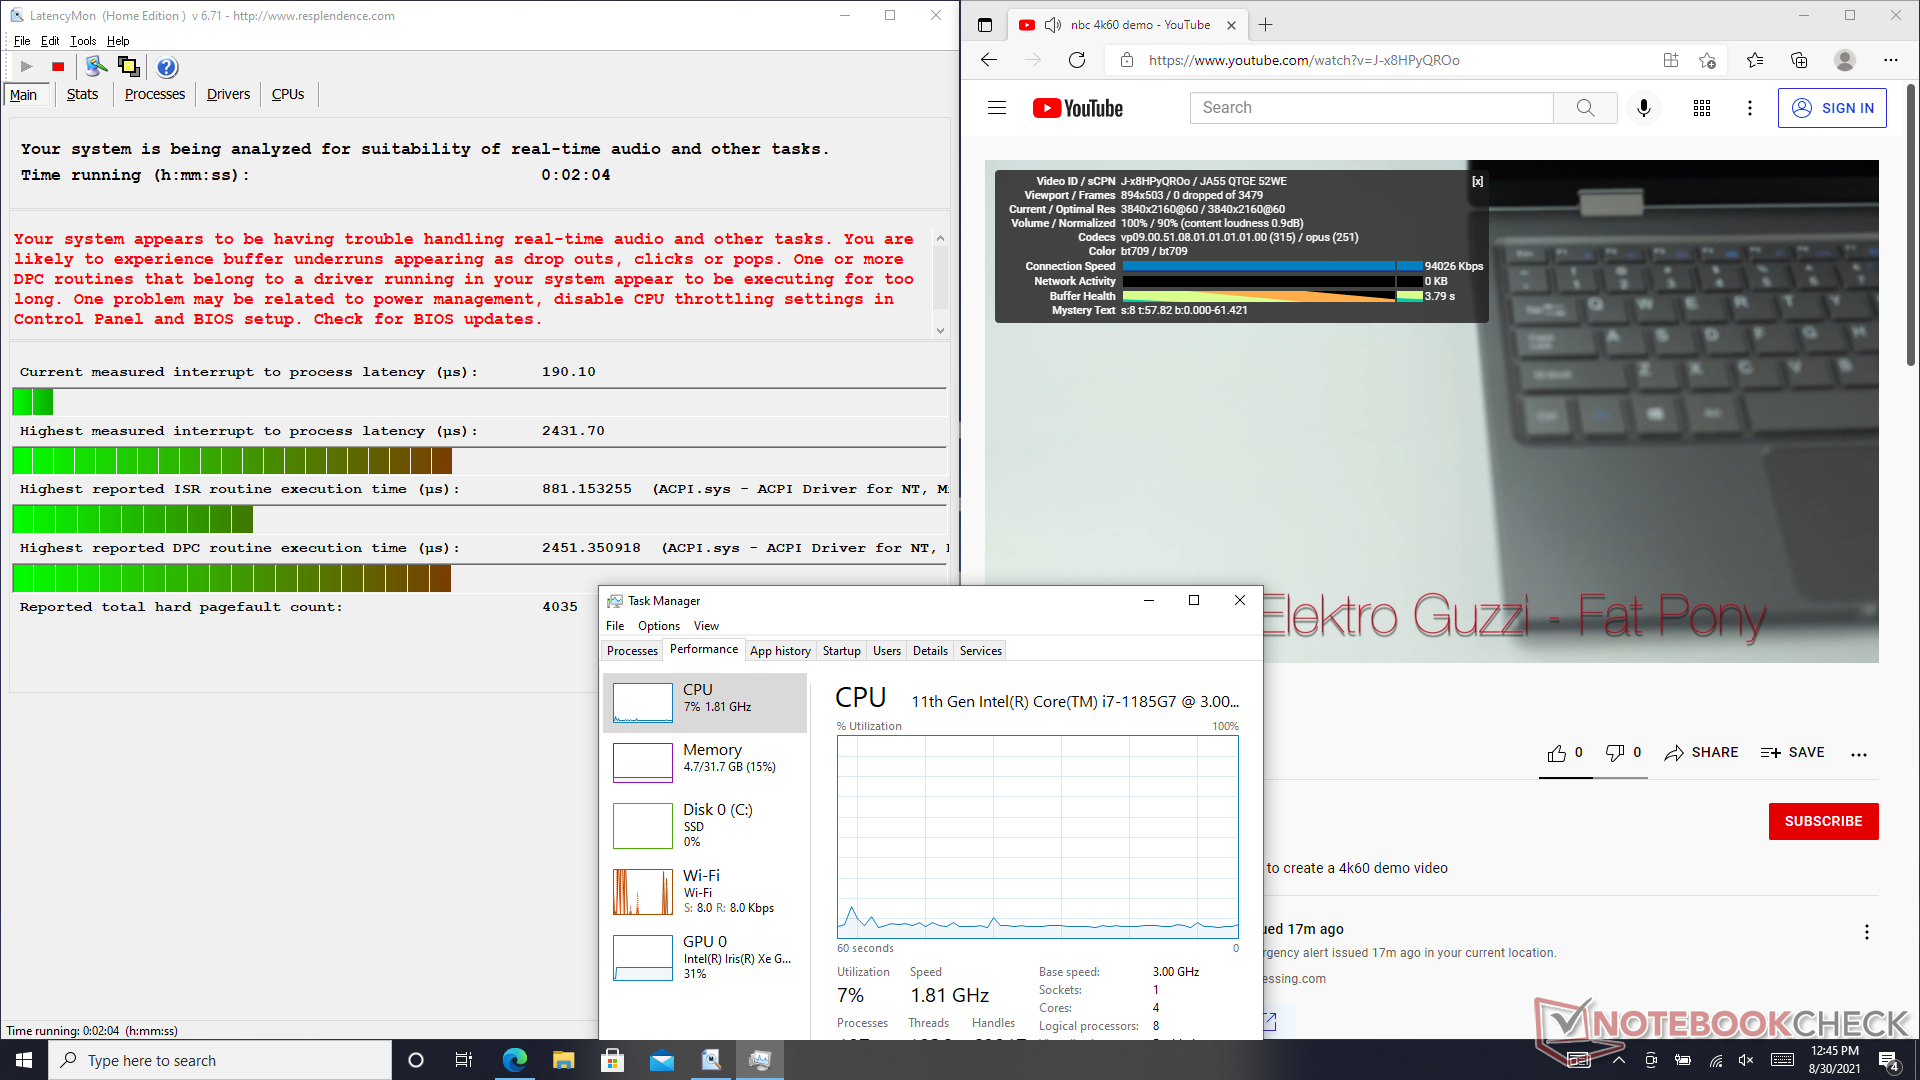
LatencyMon reveals latency issues when opening multiple browser tabs on our homepage. 4K video playback at 60 FPS is otherwise smooth and with no dropped frames.
| DPC Latencies / LatencyMon - interrupt to process latency (max), Web, Youtube, Prime95 | |
| HP EliteBook 840 Aero G8 3E4Q6AA | |
| MSI Prestige 14 Evo A11MO-026US | |
| Panasonic Toughbook FZ-55 MK2 | |
| Dell Latitude 9420 2-in-1 | |
| ADATA XPG Xenia 14 | |
* ... smaller is better
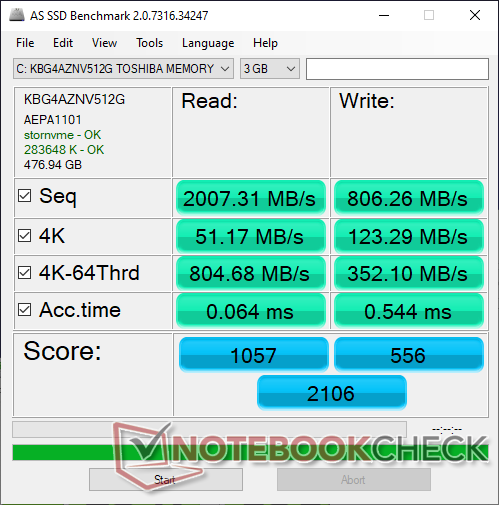
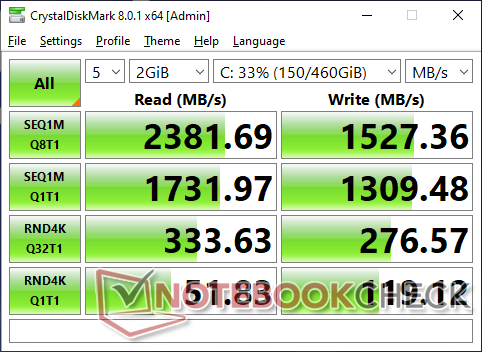
Storage Devices
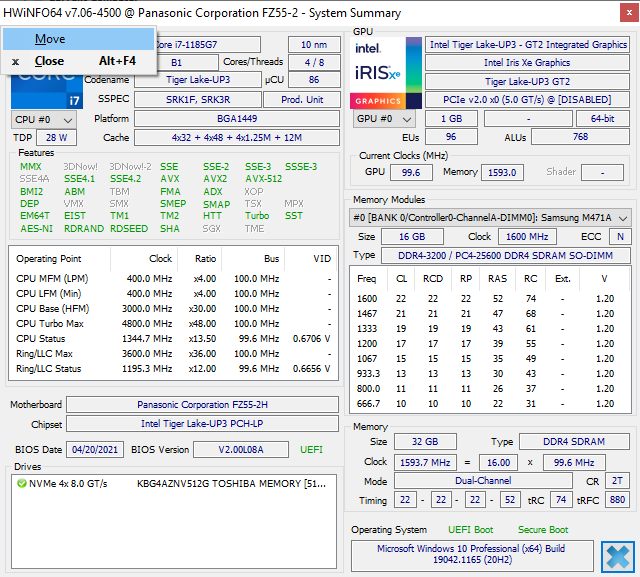
Our MK2 test unit comes with a Toshiba BG4 series SSD instead of the Samsung on our original MK1 unit. This particular Toshiba drive is a proper NVMe SSD unlike the SATA III-limited Samsung for significantly faster read and write rates.
Users can install up to two drives: one NVMe M.2 2280 SSD and a second SATA SSD each with support for OPAL and heaters.
| Panasonic Toughbook FZ-55 MK2 Toshiba KIOXIA KBG4AZNV512G M.2 2280 OPAL | Panasonic Toughbook FZ-55 Samsung SSD PM871b MZNLN256HAJQ | Dell Latitude 5420 Rugged-P85G SK hynix PC401 NVMe 500 GB | Durabook S14I UDinfo M2P M2P80DE512GBAEP | Getac S410 CUKUSA 1 TB SATA SSD Q0526A | |
|---|---|---|---|---|---|
| AS SSD | -41% | 22% | 37% | -16% | |
| Seq Read (MB/s) | 2007 | 437.7 -78% | 2054 2% | 2184 9% | 484.2 -76% |
| Seq Write (MB/s) | 806 | 387.3 -52% | 653 -19% | 1441 79% | 396.1 -51% |
| 4K Read (MB/s) | 51.2 | 26.18 -49% | 39.34 -23% | 35.98 -30% | 34.9 -32% |
| 4K Write (MB/s) | 123.3 | 60.3 -51% | 96.4 -22% | 260.1 111% | 74.1 -40% |
| 4K-64 Read (MB/s) | 805 | 369.8 -54% | 677 -16% | 396.5 -51% | 382.3 -53% |
| 4K-64 Write (MB/s) | 352.1 | 313.7 -11% | 982 179% | 1057 200% | 329 -7% |
| Access Time Read * (ms) | 0.064 | 0.089 -39% | 0.044 31% | 0.051 20% | 0.058 9% |
| Access Time Write * (ms) | 0.544 | 0.058 89% | 0.051 91% | 0.106 81% | 0.045 92% |
| Score Read (Points) | 1057 | 440 -58% | 921 -13% | 651 -38% | 466 -56% |
| Score Write (Points) | 556 | 413 -26% | 1143 106% | 1461 163% | 443 -20% |
| Score Total (Points) | 2106 | 1083 -49% | 2475 18% | 2418 15% | 1154 -45% |
| Copy ISO MB/s (MB/s) | 1045 | 553 -47% | 1622 55% | 1538 47% | 2151 106% |
| Copy Program MB/s (MB/s) | 854 | 204.7 -76% | 378.1 -56% | 570 -33% | 422.8 -50% |
| Copy Game MB/s (MB/s) | 1127 | 385.9 -66% | 793 -30% | 566 -50% | 1045 -7% |
| CrystalDiskMark 5.2 / 6 | -54% | -18% | 48% | -52% | |
| Write 4K (MB/s) | 117.1 | 55.4 -53% | 98.8 -16% | 260.4 122% | 74 -37% |
| Read 4K (MB/s) | 51.3 | 31.11 -39% | 38.51 -25% | 53 3% | 31.85 -38% |
| Write Seq (MB/s) | 1384 | 460.9 -67% | 843 -39% | 1665 20% | 460.6 -67% |
| Read Seq (MB/s) | 1716 | 481.9 -72% | 1282 -25% | 1541 -10% | 514 -70% |
| Write 4K Q32T1 (MB/s) | 282.6 | 234.6 -17% | 355.5 26% | 638 126% | 211.4 -25% |
| Read 4K Q32T1 (MB/s) | 332 | 181.7 -45% | 241.4 -27% | 683 106% | 203.5 -39% |
| Write Seq Q32T1 (MB/s) | 1519 | 528 -65% | 893 -41% | 1656 9% | 523 -66% |
| Read Seq Q32T1 (MB/s) | 2347 | 548 -77% | 2478 6% | 2490 6% | 554 -76% |
| Total Average (Program / Settings) | -48% /
-46% | 2% /
7% | 43% /
41% | -34% /
-29% |
* ... smaller is better

Disk Throttling: DiskSpd Read Loop, Queue Depth 8
GPU Performance
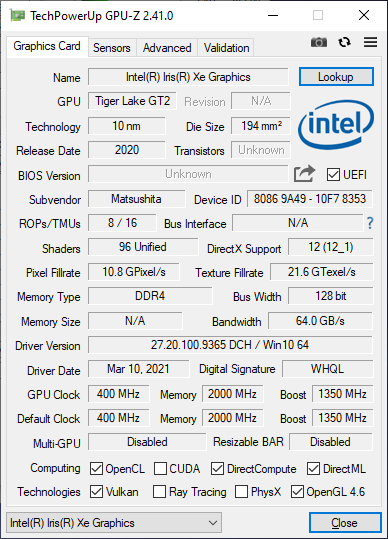
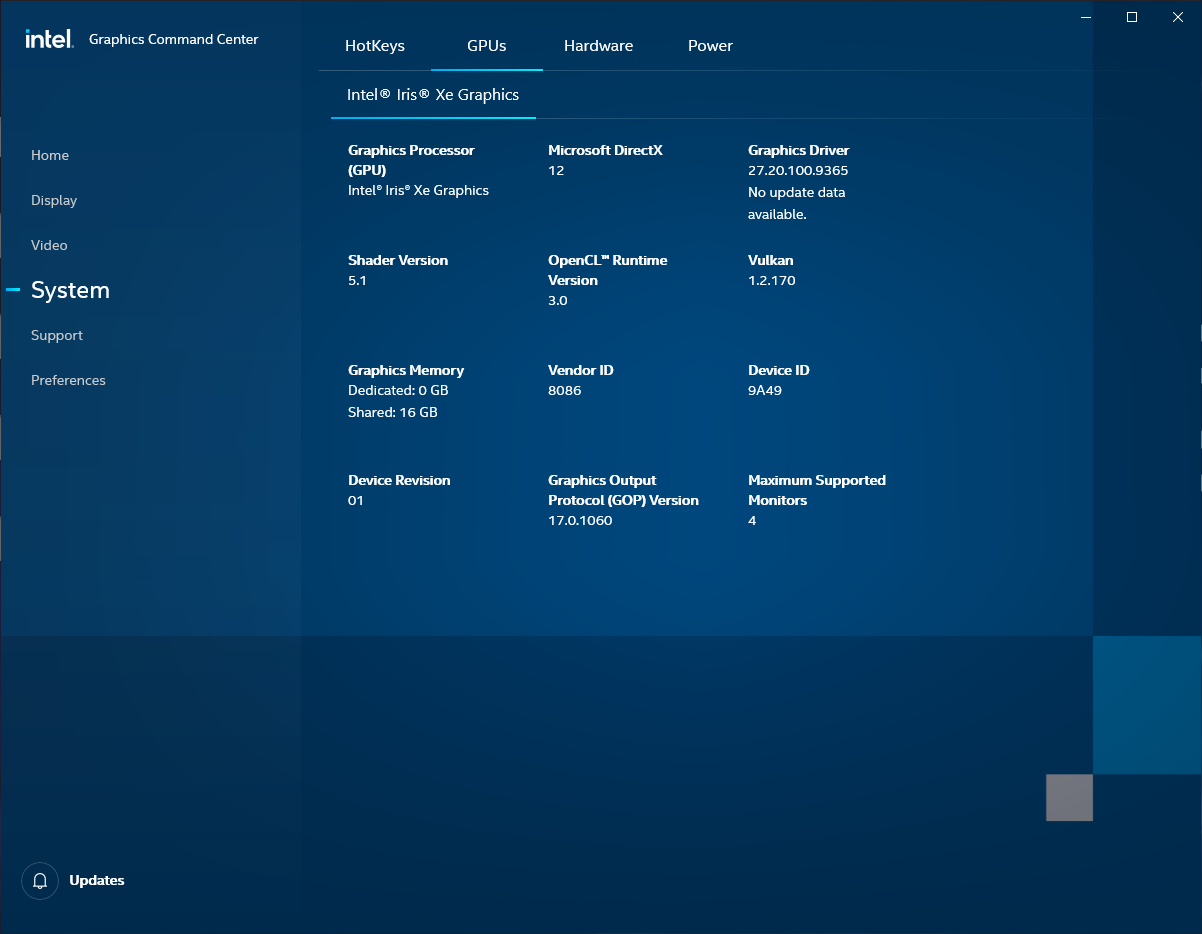
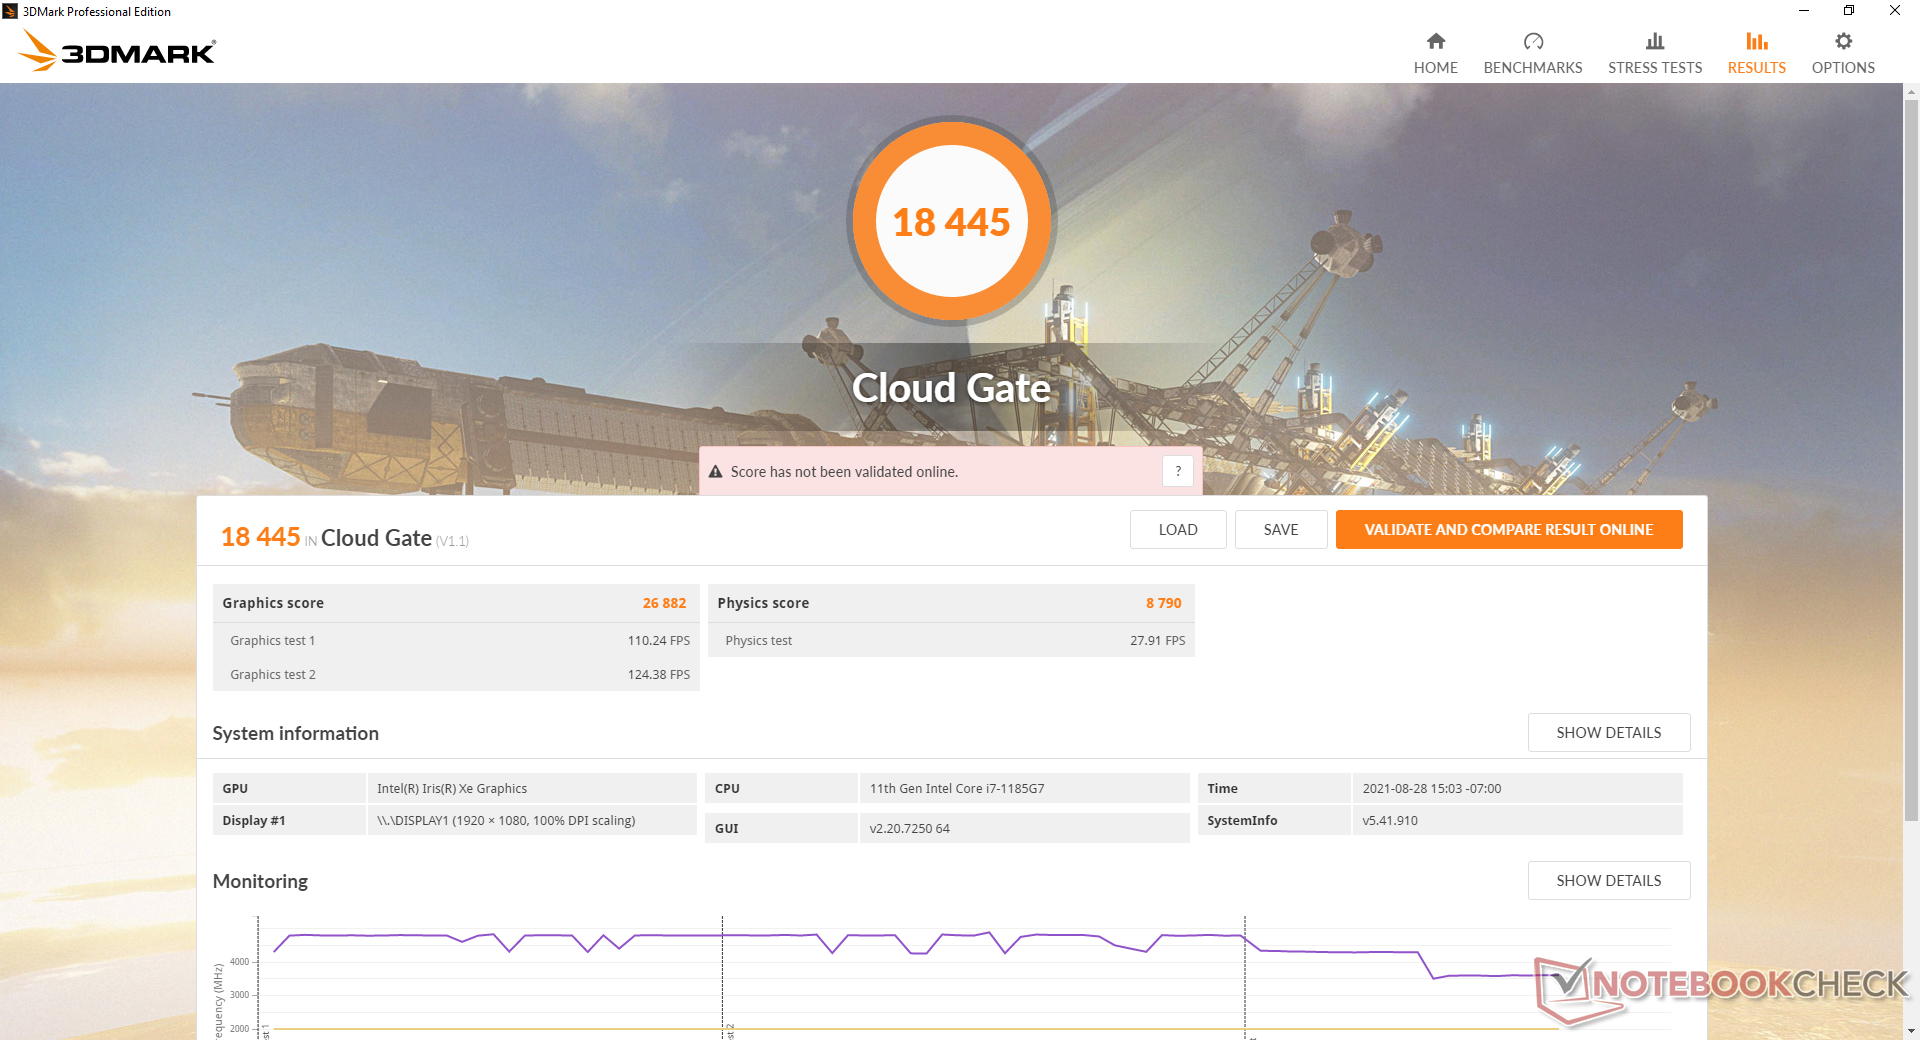
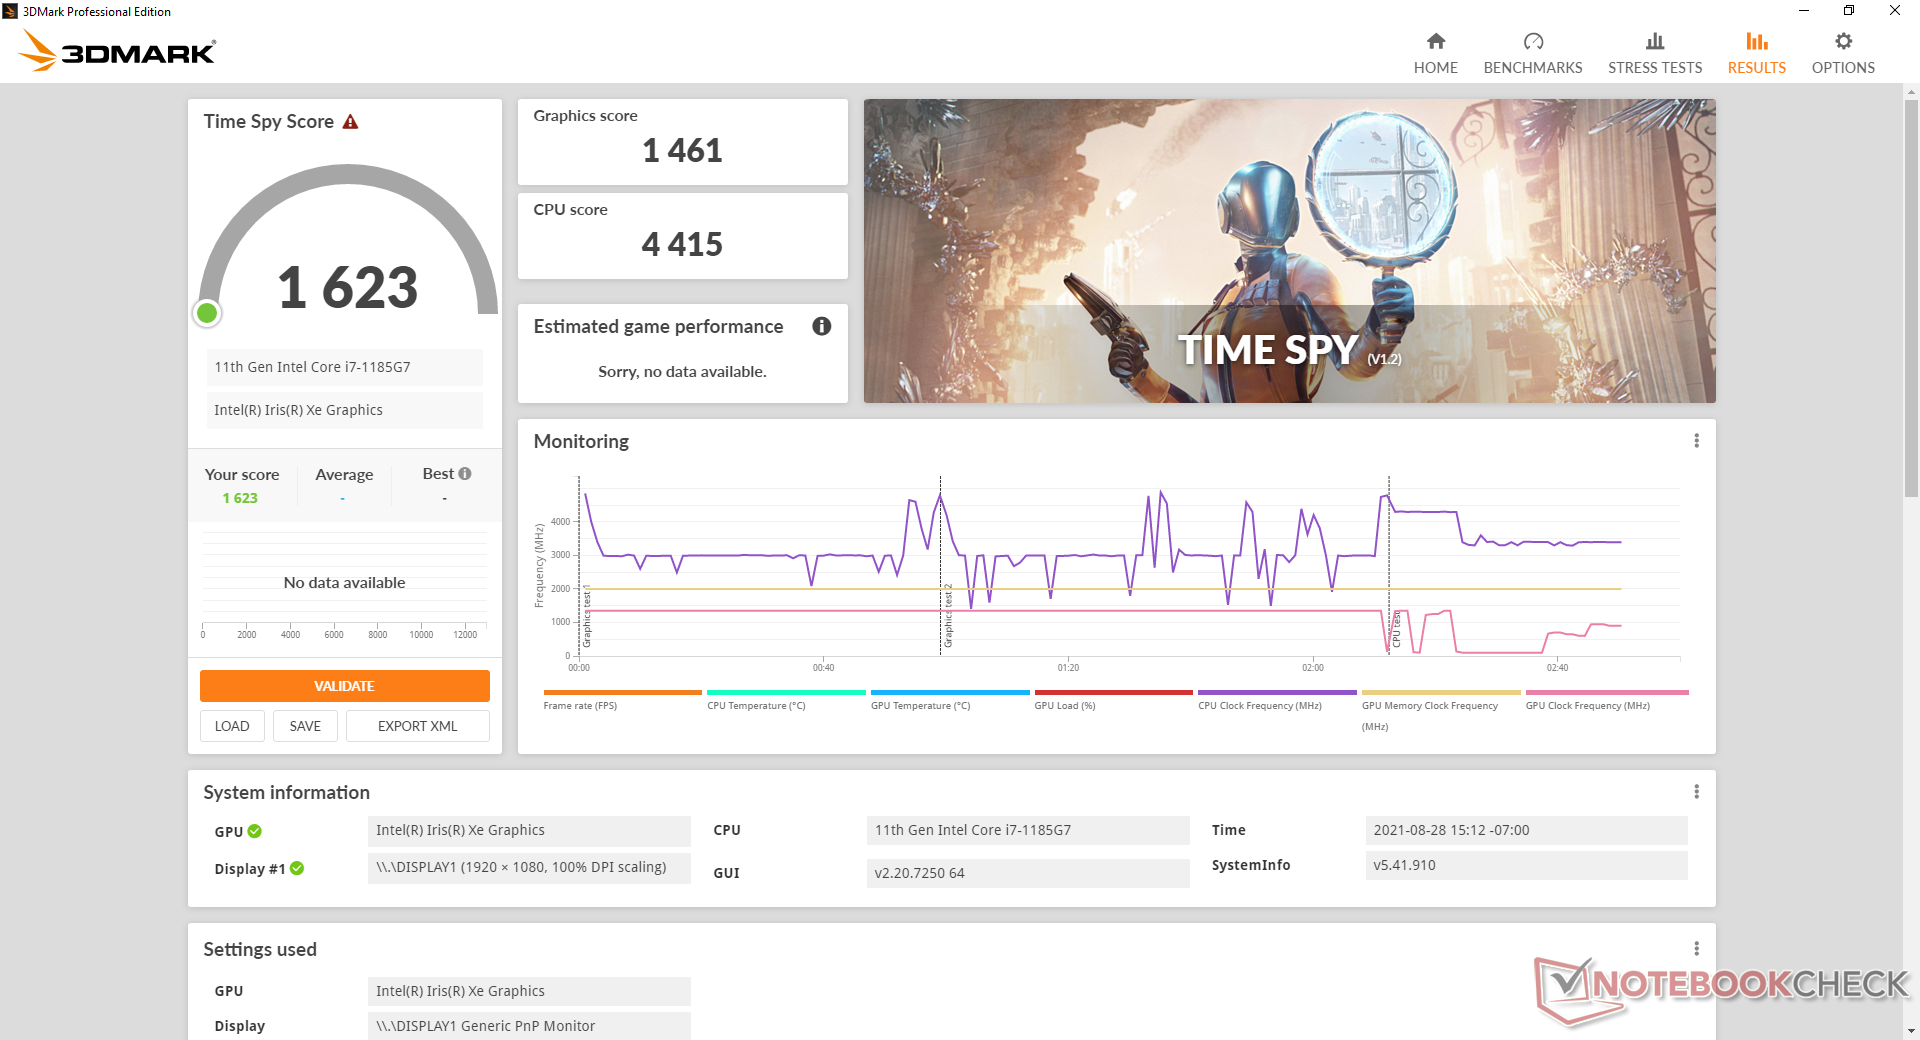
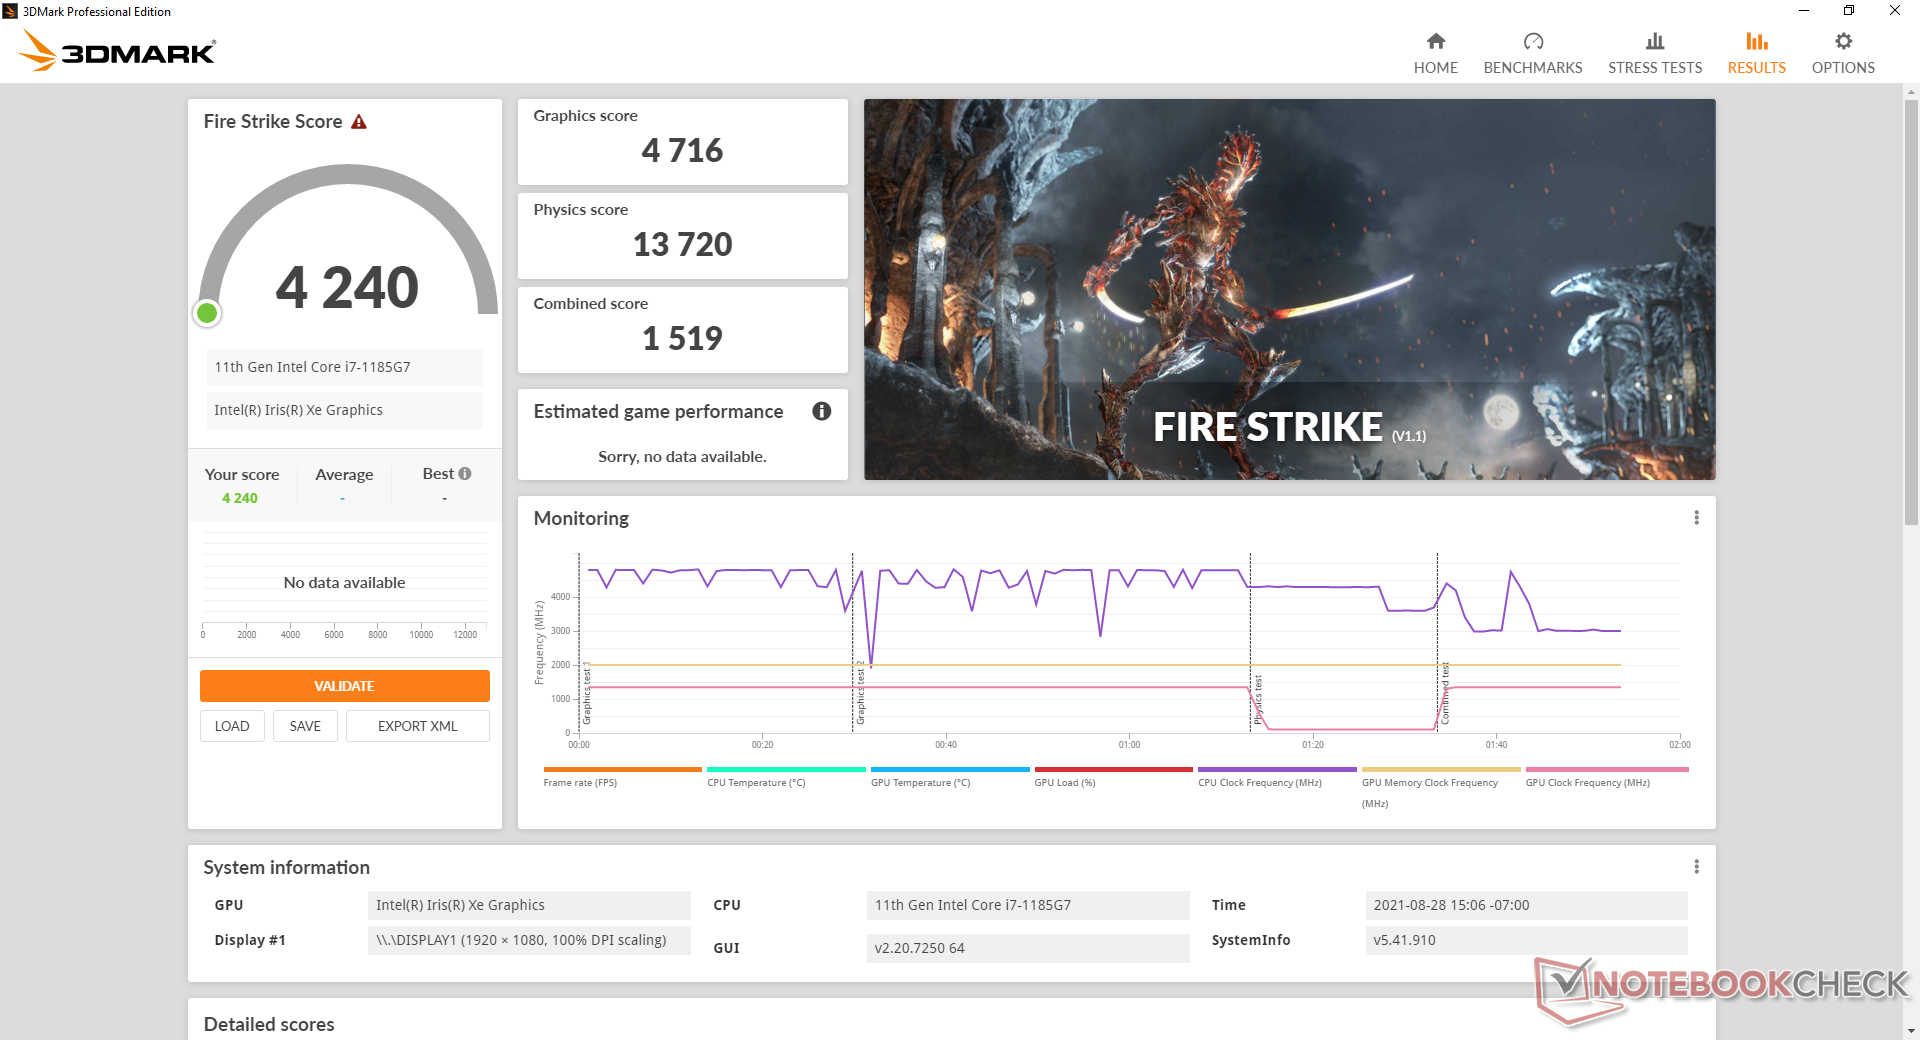
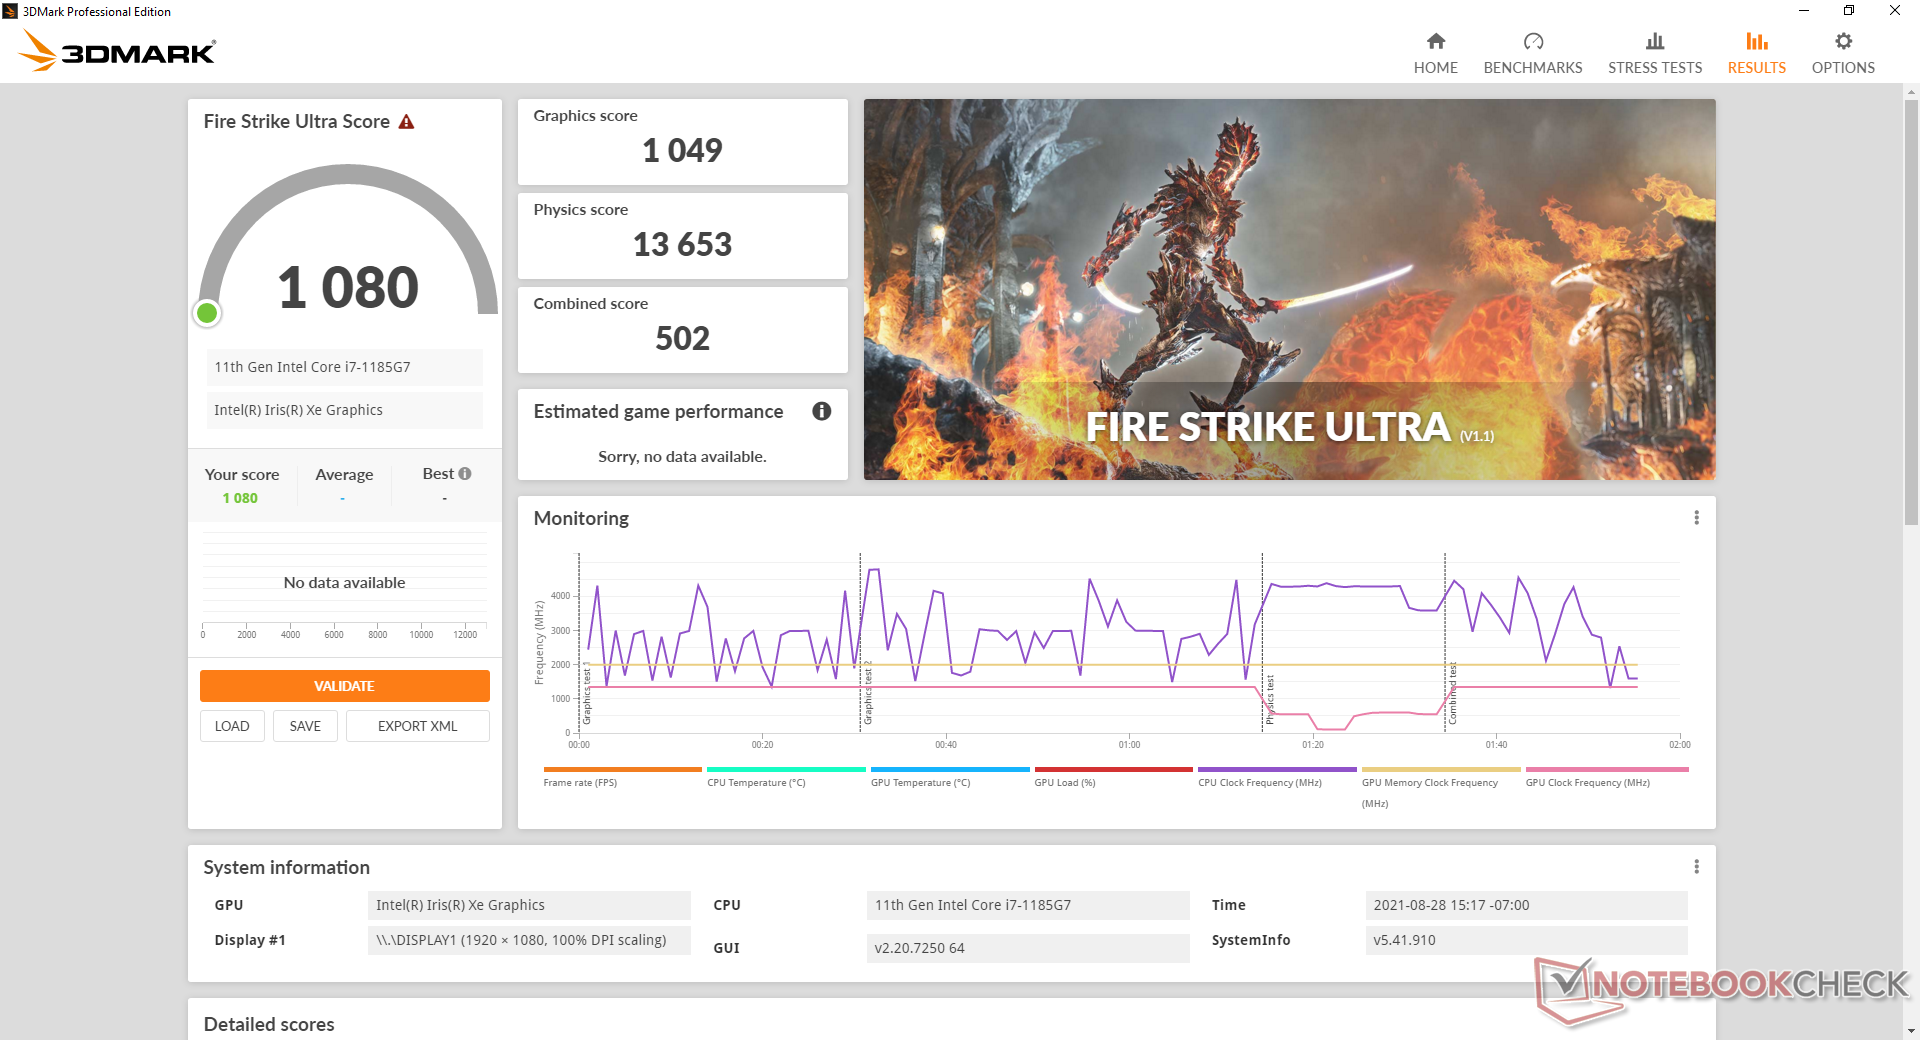
Graphics performance is excellent with results that are on par with the average Iris Xe 96 EUs in our database. Users are getting a 300 to 400 percent boost in graphics performance when compared to the older UHD Graphics 620 in the 2019 Toughbook FZ-55 MK1.
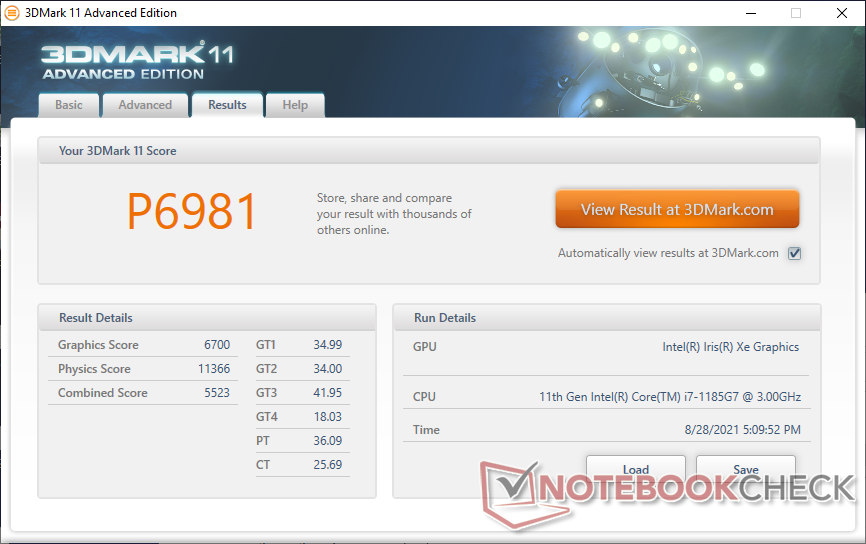
| 3DMark 11 Performance | 6981 points | |
| 3DMark Cloud Gate Standard Score | 18445 points | |
| 3DMark Fire Strike Score | 4240 points | |
| 3DMark Time Spy Score | 1623 points | |
Help | ||
Witcher 3 FPS Chart
| low | med. | high | ultra | |
|---|---|---|---|---|
| The Witcher 3 (2015) | 94.5 | 56.7 | 30.5 | 15.4 |
| Dota 2 Reborn (2015) | 84.2 | 86.7 | 53.9 | 48.6 |
| Final Fantasy XV Benchmark (2018) | 41.7 | 22 | 15.7 | |
| X-Plane 11.11 (2018) | 27 | 24.8 | 22.3 |
Emissions
System Noise
The system is silent under most day-to-day workloads like word processing, web browsing, or video streaming. However, expect infrequent pulsing to 28.7 dB(A) lasting for just a second or so before falling back to silence. When under extreme stress like Prime95, the fan can be as loud as 42 dB(A).
| Panasonic Toughbook FZ-55 MK2 Iris Xe G7 96EUs, i7-1185G7, Toshiba KIOXIA KBG4AZNV512G M.2 2280 OPAL | Panasonic Toughbook FZ-55 UHD Graphics 620, i5-8365U, Samsung SSD PM871b MZNLN256HAJQ | Dell Latitude 5420 Rugged-P85G Radeon RX 540, i7-8650U, SK hynix PC401 NVMe 500 GB | Durabook S14I Iris Xe G7 96EUs, i7-1165G7, UDinfo M2P M2P80DE512GBAEP | Getac S410 UHD Graphics 620, i5-8550U, CUKUSA 1 TB SATA SSD Q0526A | |
|---|---|---|---|---|---|
| Noise | -17% | -13% | -13% | -11% | |
| off / environment * (dB) | 23.8 | 29 -22% | 28.3 -19% | 25.2 -6% | 28.4 -19% |
| Idle Minimum * (dB) | 24 | 29 -21% | 28.3 -18% | 25.2 -5% | 28.4 -18% |
| Idle Average * (dB) | 24 | 29.6 -23% | 28.3 -18% | 25.2 -5% | 28.4 -18% |
| Idle Maximum * (dB) | 24 | 30.5 -27% | 28.3 -18% | 34.5 -44% | 28.4 -18% |
| Load Average * (dB) | 26.7 | 30.3 -13% | 29.9 -12% | 34.5 -29% | 30.3 -13% |
| Load Maximum * (dB) | 41.7 | 39 6% | 38 9% | 36.2 13% | 33.3 20% |
* ... smaller is better
Noise level
| Idle |
| 24 / 24 / 24 dB(A) |
| Load |
| 26.7 / 41.7 dB(A) |
 | ||
30 dB silent 40 dB(A) audible 50 dB(A) loud |
||
min: | ||
Temperature
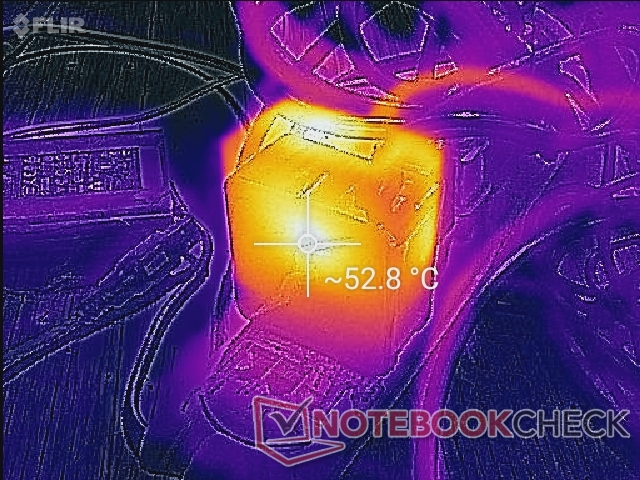
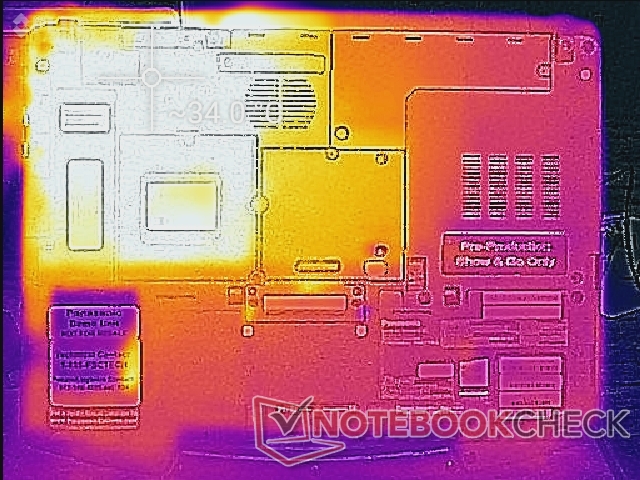
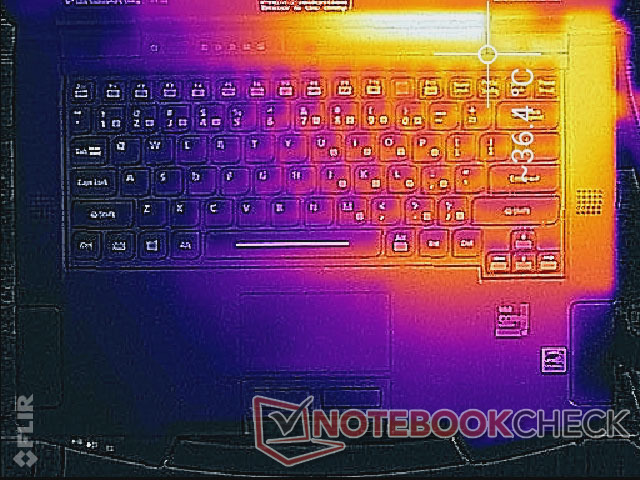
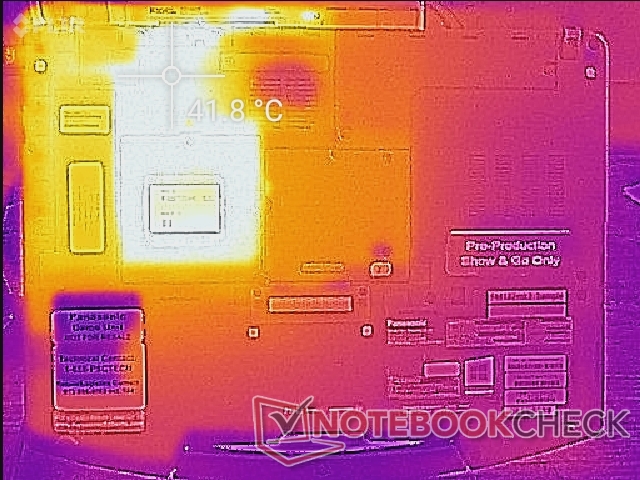
Surface temperatures will always be warmer on the right half of the laptop than on the left because of how the processor and cooling solution are positioned within. We're able to measure a maximum of around 42 C on the bottom hot spot.
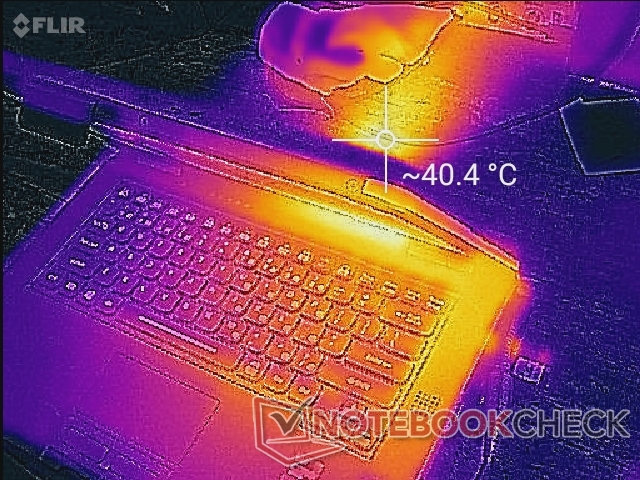
(+) The maximum temperature on the upper side is 36.2 °C / 97 F, compared to the average of 34.3 °C / 94 F, ranging from 21.2 to 62.5 °C for the class Office.
(±) The bottom heats up to a maximum of 42.2 °C / 108 F, compared to the average of 36.8 °C / 98 F
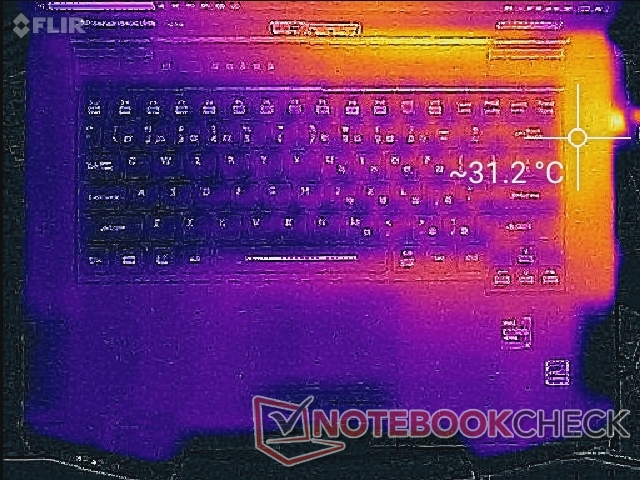
(+) In idle usage, the average temperature for the upper side is 29.2 °C / 85 F, compared to the device average of 29.5 °C / 85 F.
(+) The palmrests and touchpad are cooler than skin temperature with a maximum of 29.2 °C / 84.6 F and are therefore cool to the touch.
(±) The average temperature of the palmrest area of similar devices was 27.5 °C / 81.5 F (-1.7 °C / -3.1 F).
Stress Test
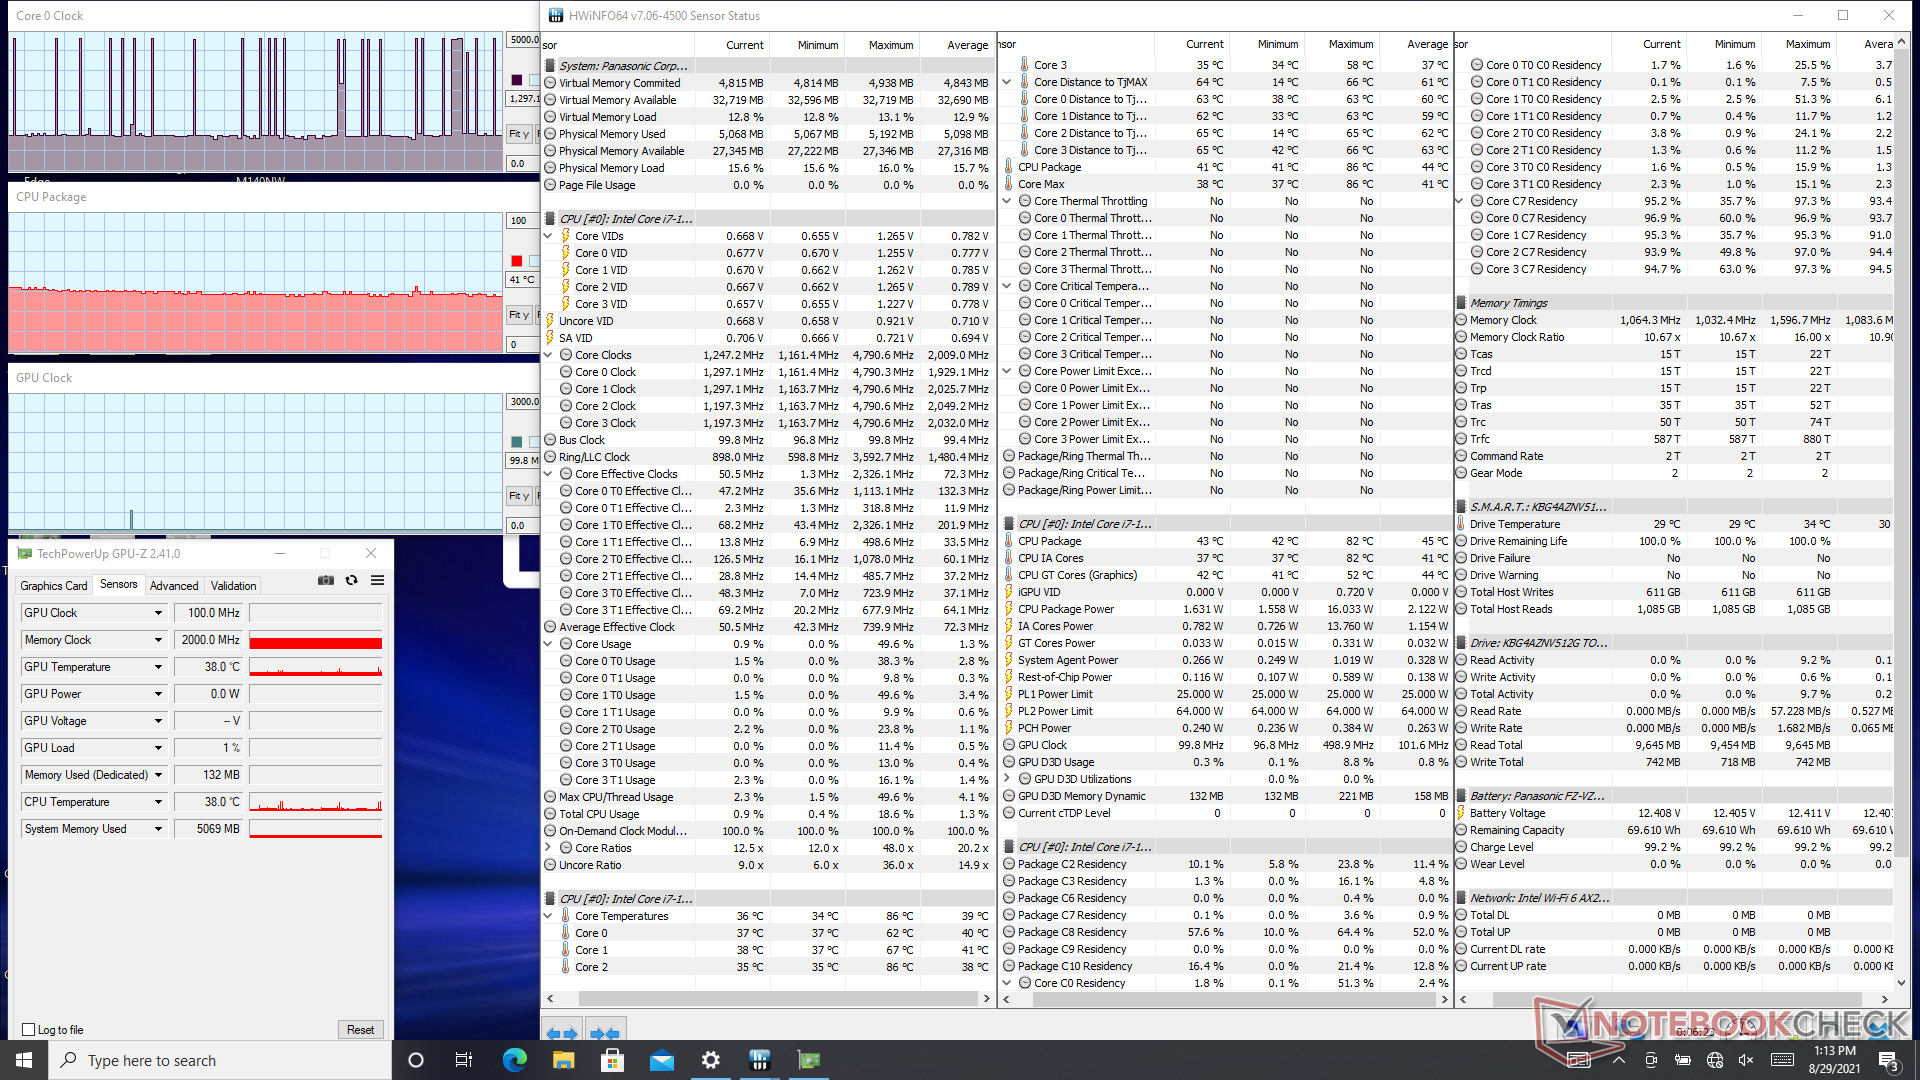
When running Prime95, the CPU would boost to 4 GHz and 100 C almost immediately lasting for just a few seconds at most. Clock rates eventually stabilize at around 2.8 and 81 C after about 18 seconds as shown by the screenshots below.
Running on battery power will not limit performance. A 3DMark 11 test on batteries would return Physics and Graphics scores of 11601 and 6450 points, respectively, compared to 11366 and 6700 points when on mains.
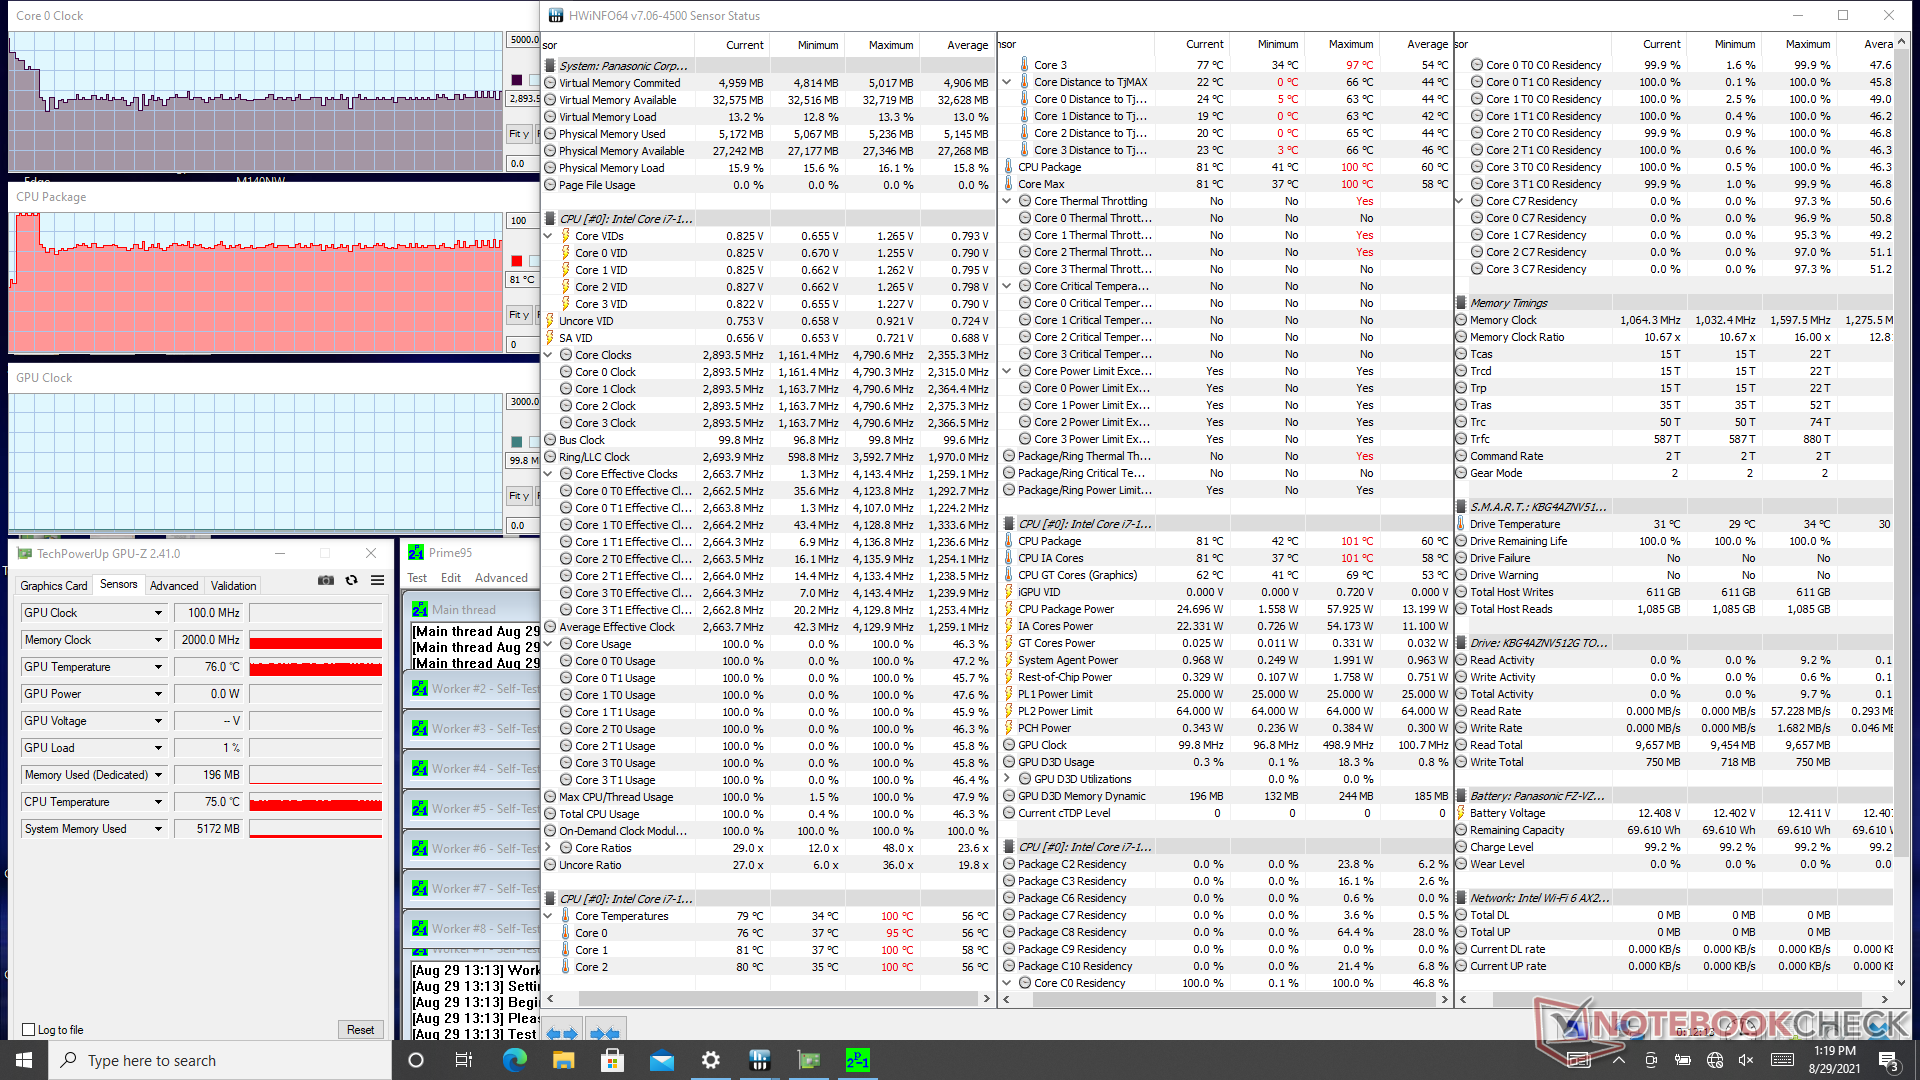
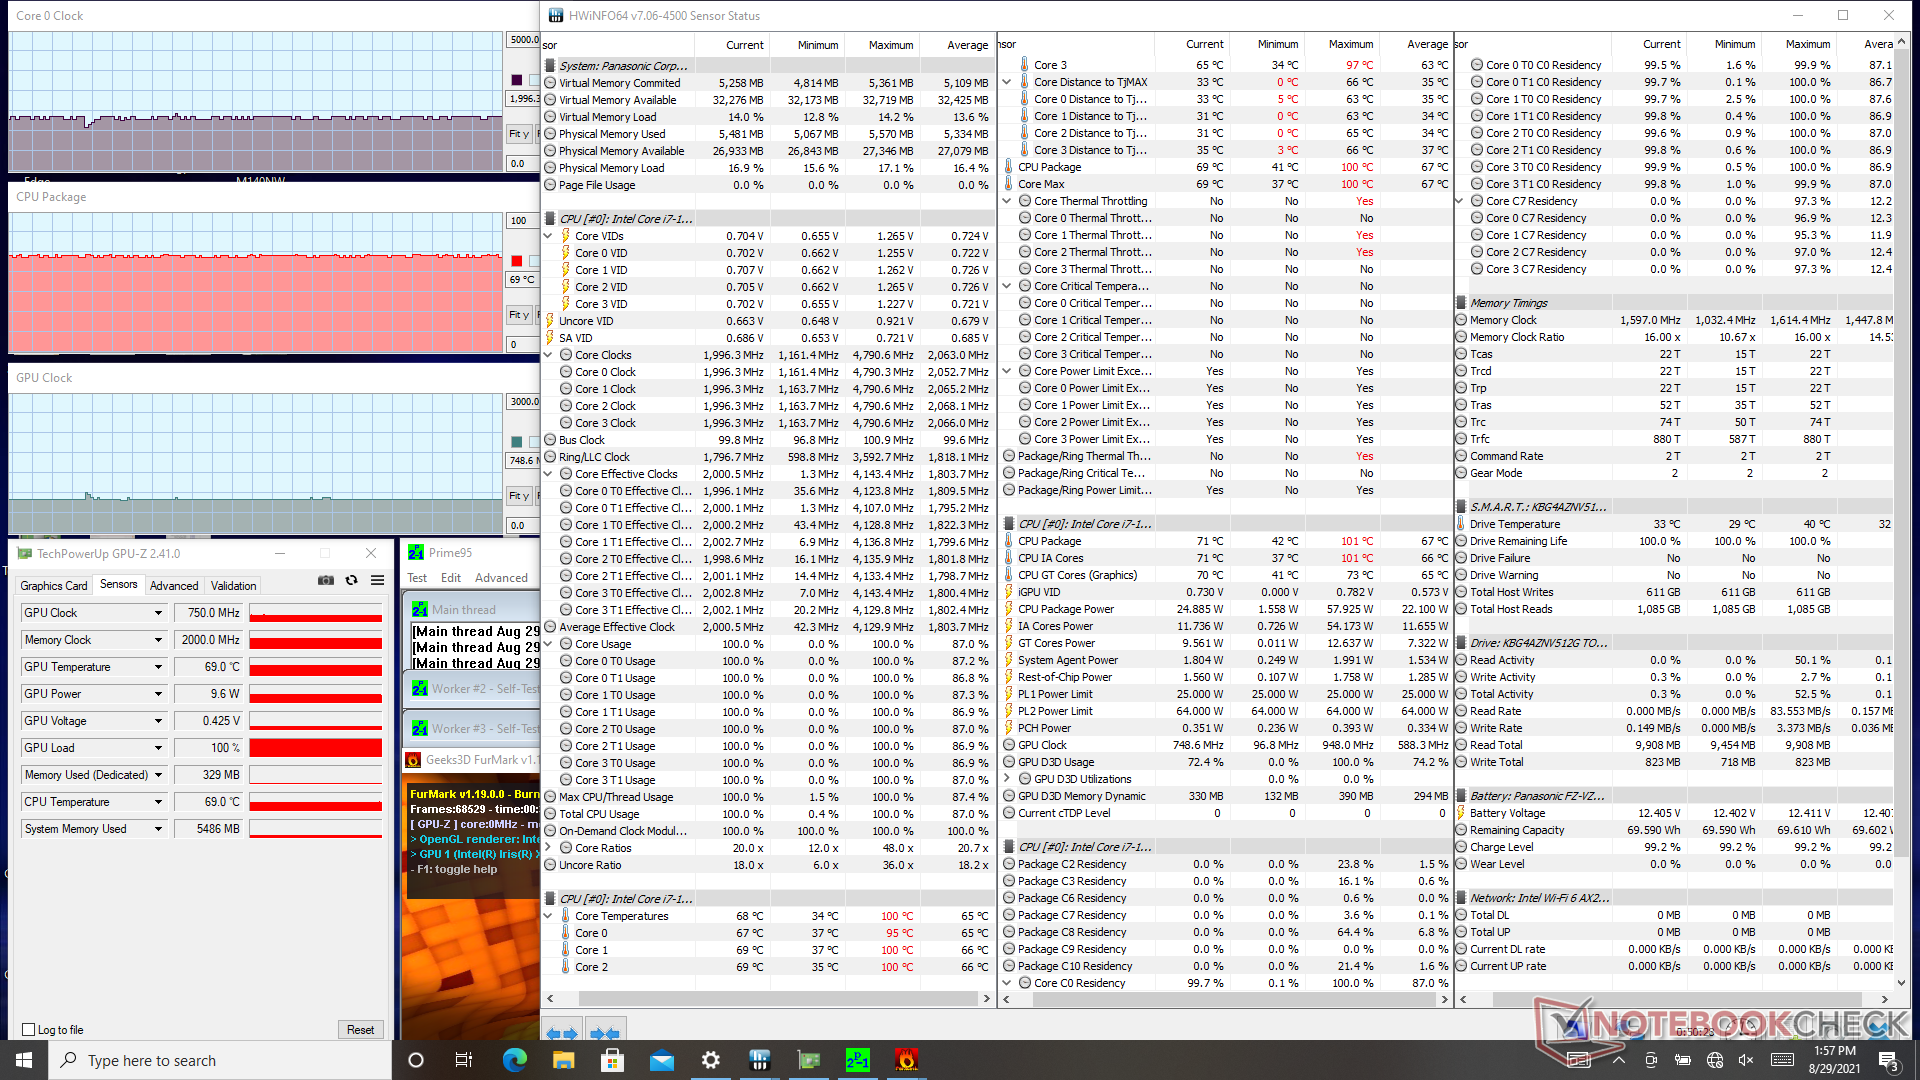
| CPU Clock (GHz) | GPU Clock (MHz) | Average CPU Temperature (°C) | |
| System Idle | -- | -- | 41 |
| Prime95 Stress | 2.8 - 2.9 | -- | 81 |
| Prime95 + FurMark Stress | 1.9 - 2.0 | 750 | 69 |
Speakers

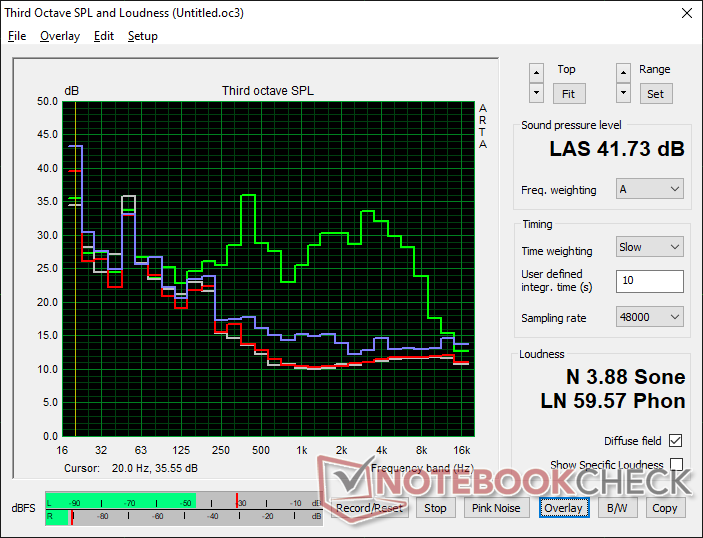
Panasonic Toughbook FZ-55 MK2 audio analysis
(+) | speakers can play relatively loud (86.2 dB)
Bass 100 - 315 Hz
(-) | nearly no bass - on average 41.6% lower than median
(+) | bass is linear (6.8% delta to prev. frequency)
Mids 400 - 2000 Hz
(±) | reduced mids - on average 9.5% lower than median
(±) | linearity of mids is average (8.9% delta to prev. frequency)
Highs 2 - 16 kHz
(+) | balanced highs - only 2.7% away from median
(+) | highs are linear (3% delta to prev. frequency)
Overall 100 - 16.000 Hz
(±) | linearity of overall sound is average (25.4% difference to median)
Compared to same class
» 77% of all tested devices in this class were better, 6% similar, 17% worse
» The best had a delta of 7%, average was 21%, worst was 53%
Compared to all devices tested
» 78% of all tested devices were better, 5% similar, 17% worse
» The best had a delta of 4%, average was 24%, worst was 134%
Apple MacBook 12 (Early 2016) 1.1 GHz audio analysis
(+) | speakers can play relatively loud (83.6 dB)
Bass 100 - 315 Hz
(±) | reduced bass - on average 11.3% lower than median
(±) | linearity of bass is average (14.2% delta to prev. frequency)
Mids 400 - 2000 Hz
(+) | balanced mids - only 2.4% away from median
(+) | mids are linear (5.5% delta to prev. frequency)
Highs 2 - 16 kHz
(+) | balanced highs - only 2% away from median
(+) | highs are linear (4.5% delta to prev. frequency)
Overall 100 - 16.000 Hz
(+) | overall sound is linear (10.2% difference to median)
Compared to same class
» 7% of all tested devices in this class were better, 2% similar, 91% worse
» The best had a delta of 5%, average was 18%, worst was 53%
Compared to all devices tested
» 5% of all tested devices were better, 1% similar, 94% worse
» The best had a delta of 4%, average was 24%, worst was 134%
Energy Management
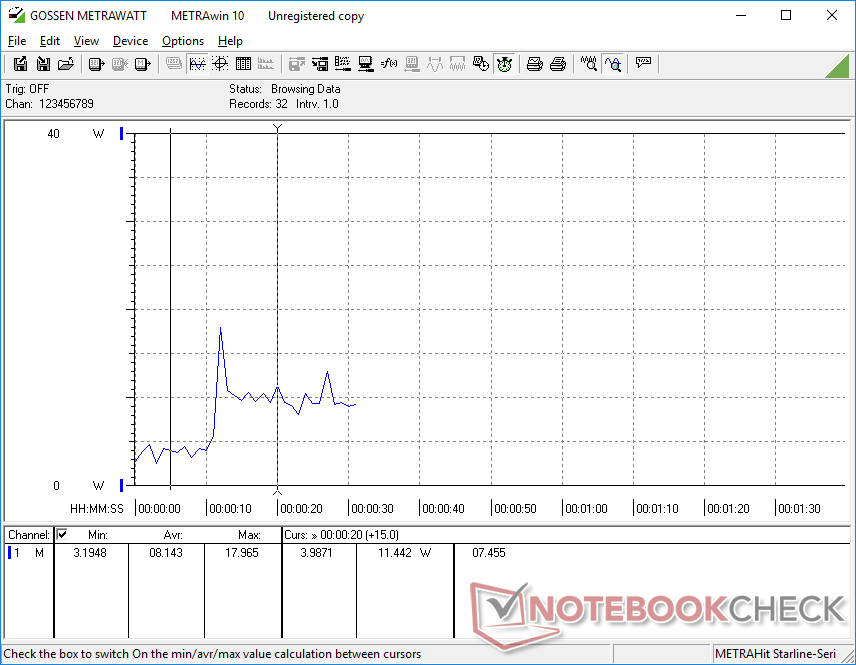
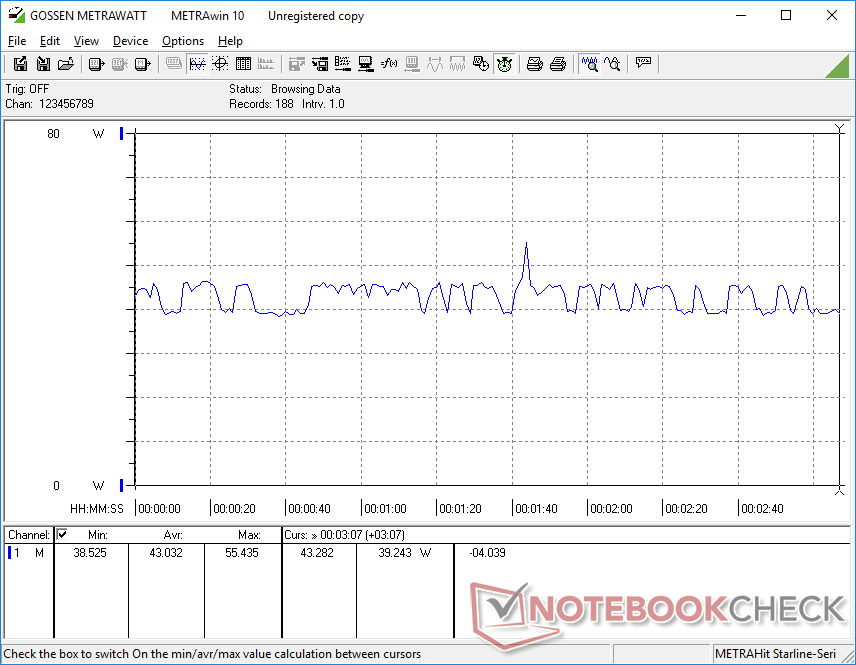
Power Consumption
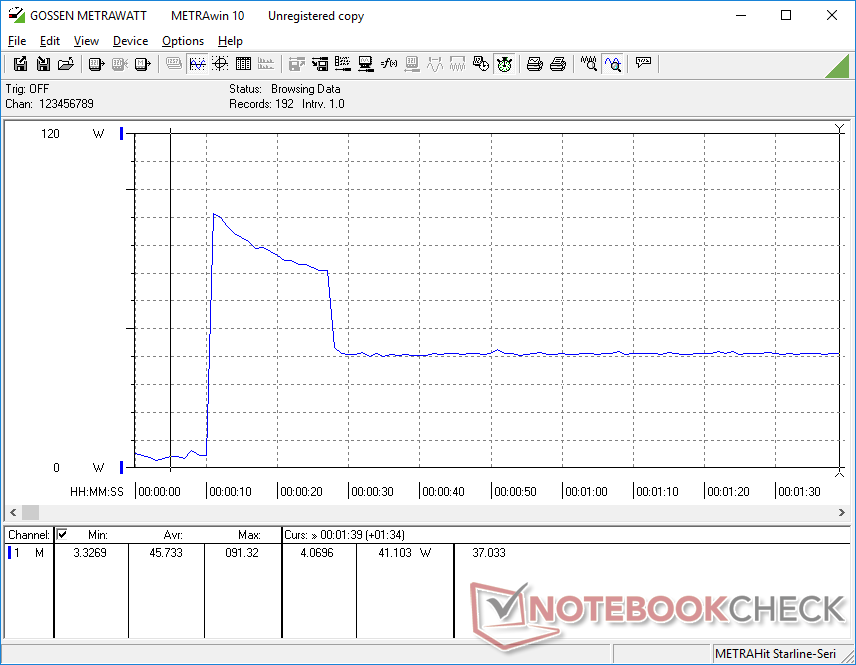
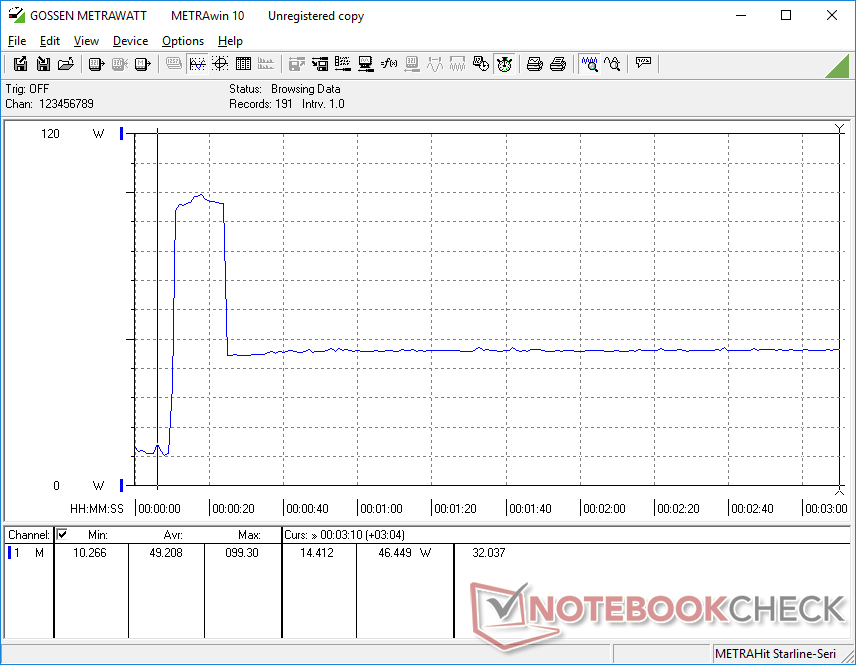
Power consumption can be higher than on the 2019 Whiskey Lake-U model since our Tiger Lake-U CPU is capable of higher Turbo Boost clock rates. In most cases, however, the system is only a few watts more demanding when under medium-high loads to show significant performance-per-watt improvements over older Intel CPUs especially in terms of graphics.
We're able to record a temporary maximum draw of just over 99 W from the small-medium 120 W AC adapter when running extreme loads as shown by the images below. The adapter can deliver more power than on most other ULV Ultrabooks where <100 W AC adapters are more common.
| Off / Standby | |
| Idle | |
| Load |
|
Key:
min: | |
| Panasonic Toughbook FZ-55 MK2 i7-1185G7, Iris Xe G7 96EUs, Toshiba KIOXIA KBG4AZNV512G M.2 2280 OPAL, IPS, 1920x1080, 14" | Panasonic Toughbook FZ-55 i5-8365U, UHD Graphics 620, Samsung SSD PM871b MZNLN256HAJQ, IPS, 1920x1080, 14" | Dell Latitude 5420 Rugged-P85G i7-8650U, Radeon RX 540, SK hynix PC401 NVMe 500 GB, IPS, 1920x1080, 14" | Durabook S14I i7-1165G7, Iris Xe G7 96EUs, UDinfo M2P M2P80DE512GBAEP, TN, 1920x1080, 14" | Getac S410 i5-8550U, UHD Graphics 620, CUKUSA 1 TB SATA SSD Q0526A, TN PED, 1366x768, 14" | |
|---|---|---|---|---|---|
| Power Consumption | 9% | -34% | -35% | 15% | |
| Idle Minimum * (Watt) | 3.5 | 3.7 -6% | 4.8 -37% | 6.8 -94% | 5.6 -60% |
| Idle Average * (Watt) | 10.4 | 9.6 8% | 13.6 -31% | 16.4 -58% | 7.9 24% |
| Idle Maximum * (Watt) | 10.5 | 10.4 1% | 13.8 -31% | 16.9 -61% | 8.4 20% |
| Load Average * (Watt) | 45.4 | 40 12% | 67.8 -49% | 39.2 14% | 32.8 28% |
| Witcher 3 ultra * (Watt) | 43 | 69.1 -61% | |||
| Load Maximum * (Watt) | 99.3 | 71.9 28% | 93.5 6% | 73.1 26% | 34.3 65% |
* ... smaller is better
Power Consumption Witcher 3 / Stresstest
Battery Life
We're able to squeeze over 13.5 hours of real-world WLAN use from the removable 68 Wh battery. Users can install up to two batteries to potentially double the already long runtime.
Charging from empty to full capacity takes about 2 hours.
| Panasonic Toughbook FZ-55 MK2 i7-1185G7, Iris Xe G7 96EUs, 71 Wh | Panasonic Toughbook FZ-55 i5-8365U, UHD Graphics 620, 71 Wh | Dell Latitude 5420 Rugged-P85G i7-8650U, Radeon RX 540, 102 Wh | Durabook S14I i7-1165G7, Iris Xe G7 96EUs, 50 Wh | Getac S410 i5-8550U, UHD Graphics 620, 46.6 Wh | |
|---|---|---|---|---|---|
| Battery runtime | 35% | 19% | -60% | -62% | |
| WiFi v1.3 (h) | 13.6 | 18.4 35% | 16.2 19% | 5.5 -60% | 5.2 -62% |
| Reader / Idle (h) | 31.4 | ||||
| Load (h) | 3.2 |
Pros
Cons
Verdict
The Intel 11th gen CPU series is easily one of the biggest upgrades yet for rugged laptops. Though externals remain the same, CPU and GPU performance are up 40 percent and 350 percent, respectively, all under the same ULV power envelope as the last generation model. Storage performance has also increased significantly. Consumer laptops have been enjoying these upgrades since late last year and so it's about time that rugged and field laptops can have the same benefits.
Is the original FZ-55 MK1 obsolete? Not necessarily. If you don't do much more than word or spreadsheet processing, then original model will be more than enough especially since it shares the exact same display options as the FZ-55 MK2. If your applications involve a bit of graphics rendering, then the FZ-55 MK2 and its notable performance upgrades will be worth investing.
Price and availability
Users can requests quotes and purchase directly from Panasonic here as the FZ-55 MK2 is not widely available through third-party channels.
Price comparison
