 Deutsch
 English
 Español
 Français
 Italiano
 Nederlands
 Polski
 Português
 Русский
 Türkçe
 Svenska
 Chinese
 Magyar
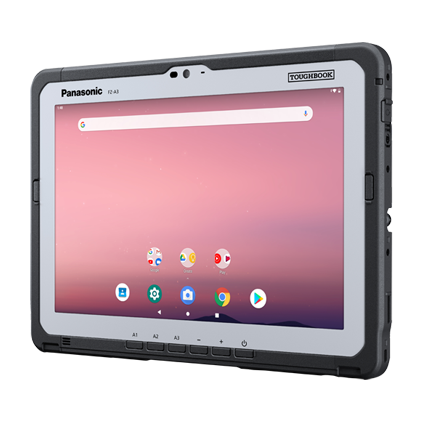
Panasonic Toughbook FZ-A3 Tablet Review: When Thin Meets Rugged
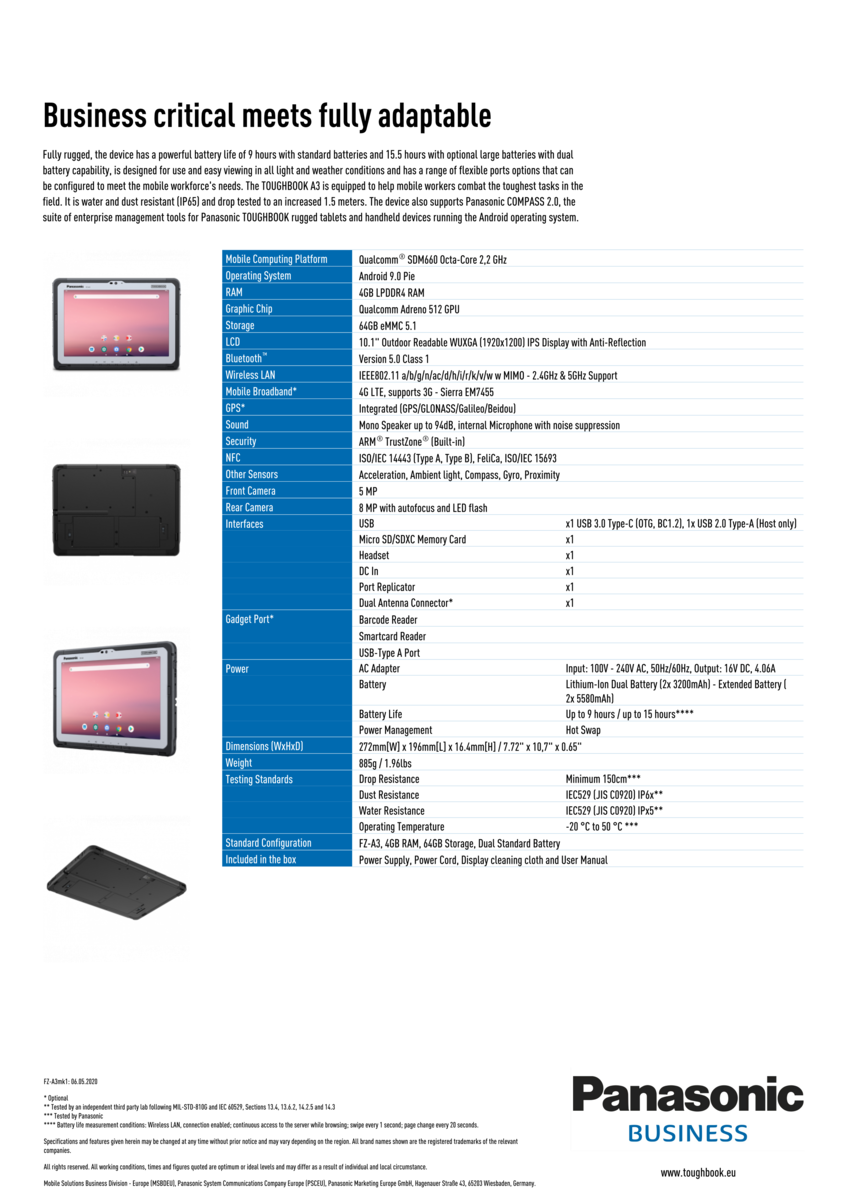
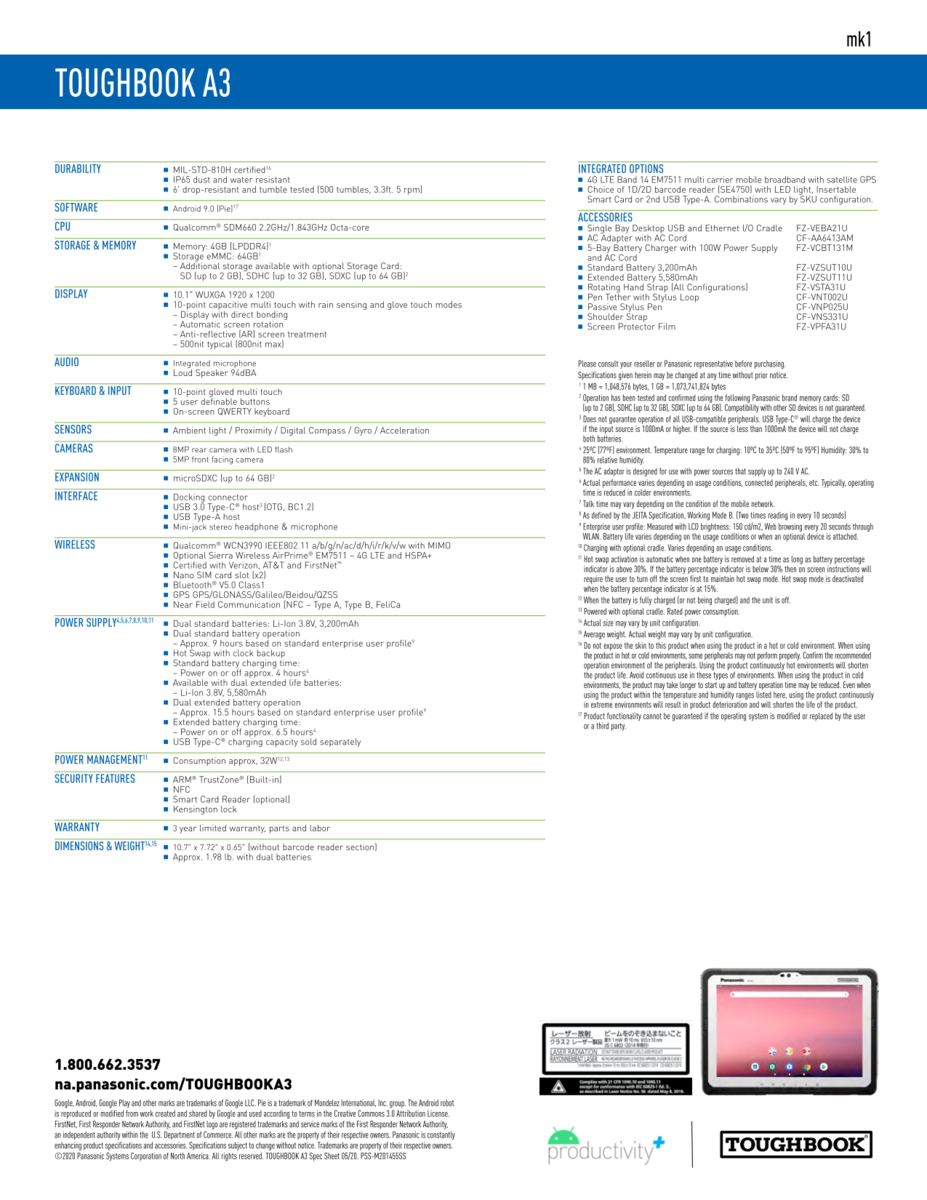
The Toughbook FZ-A3 is the latest fully-rugged tablet from Panasonic designed for professionals on the field. Perhaps its most notable feature is that it ships with Android 9.0 Pie whereas most other rugged tablets typically ship with older and more outdated Android versions.
Additional information on the ToughBook FZ-A3 can be found on its press release and official product page.
More Panasonic reviews:
Case
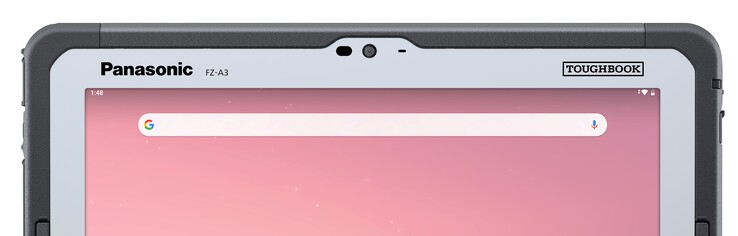
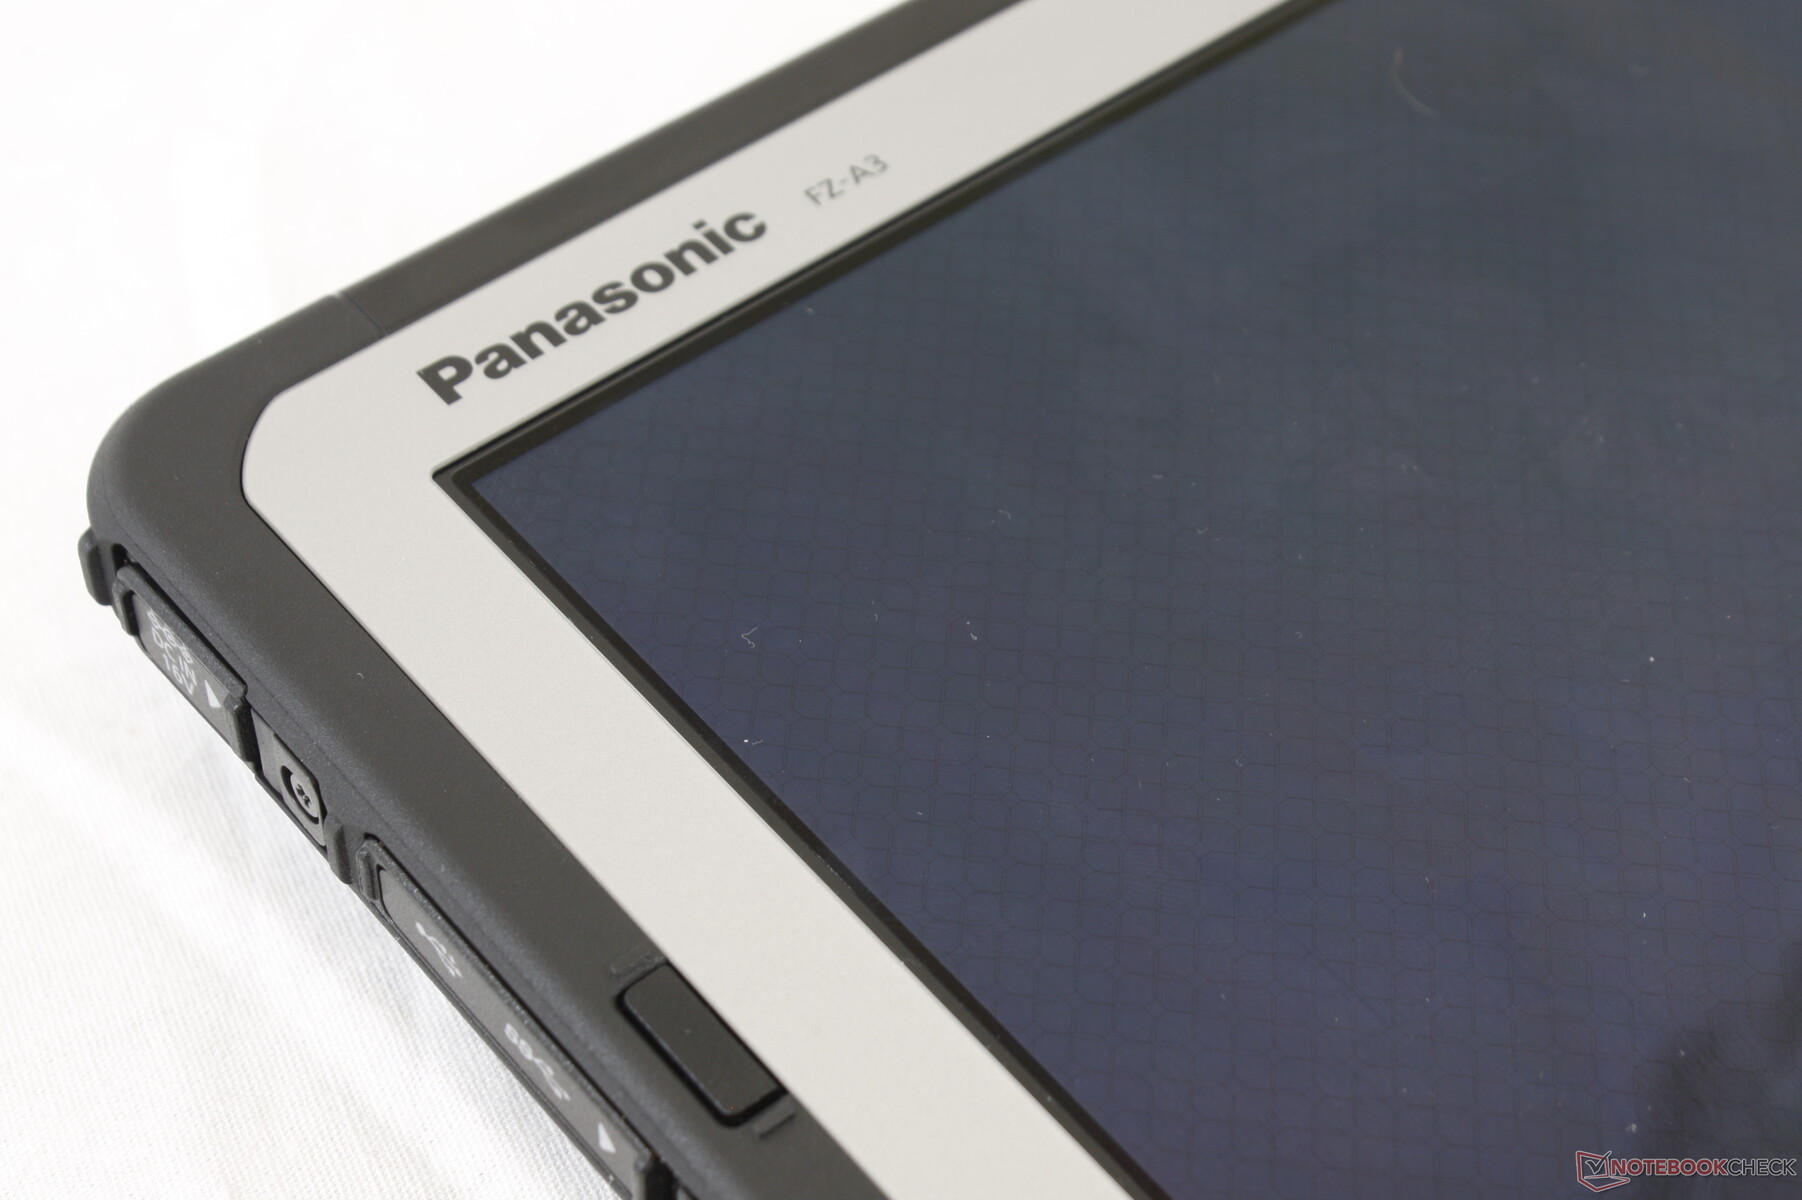
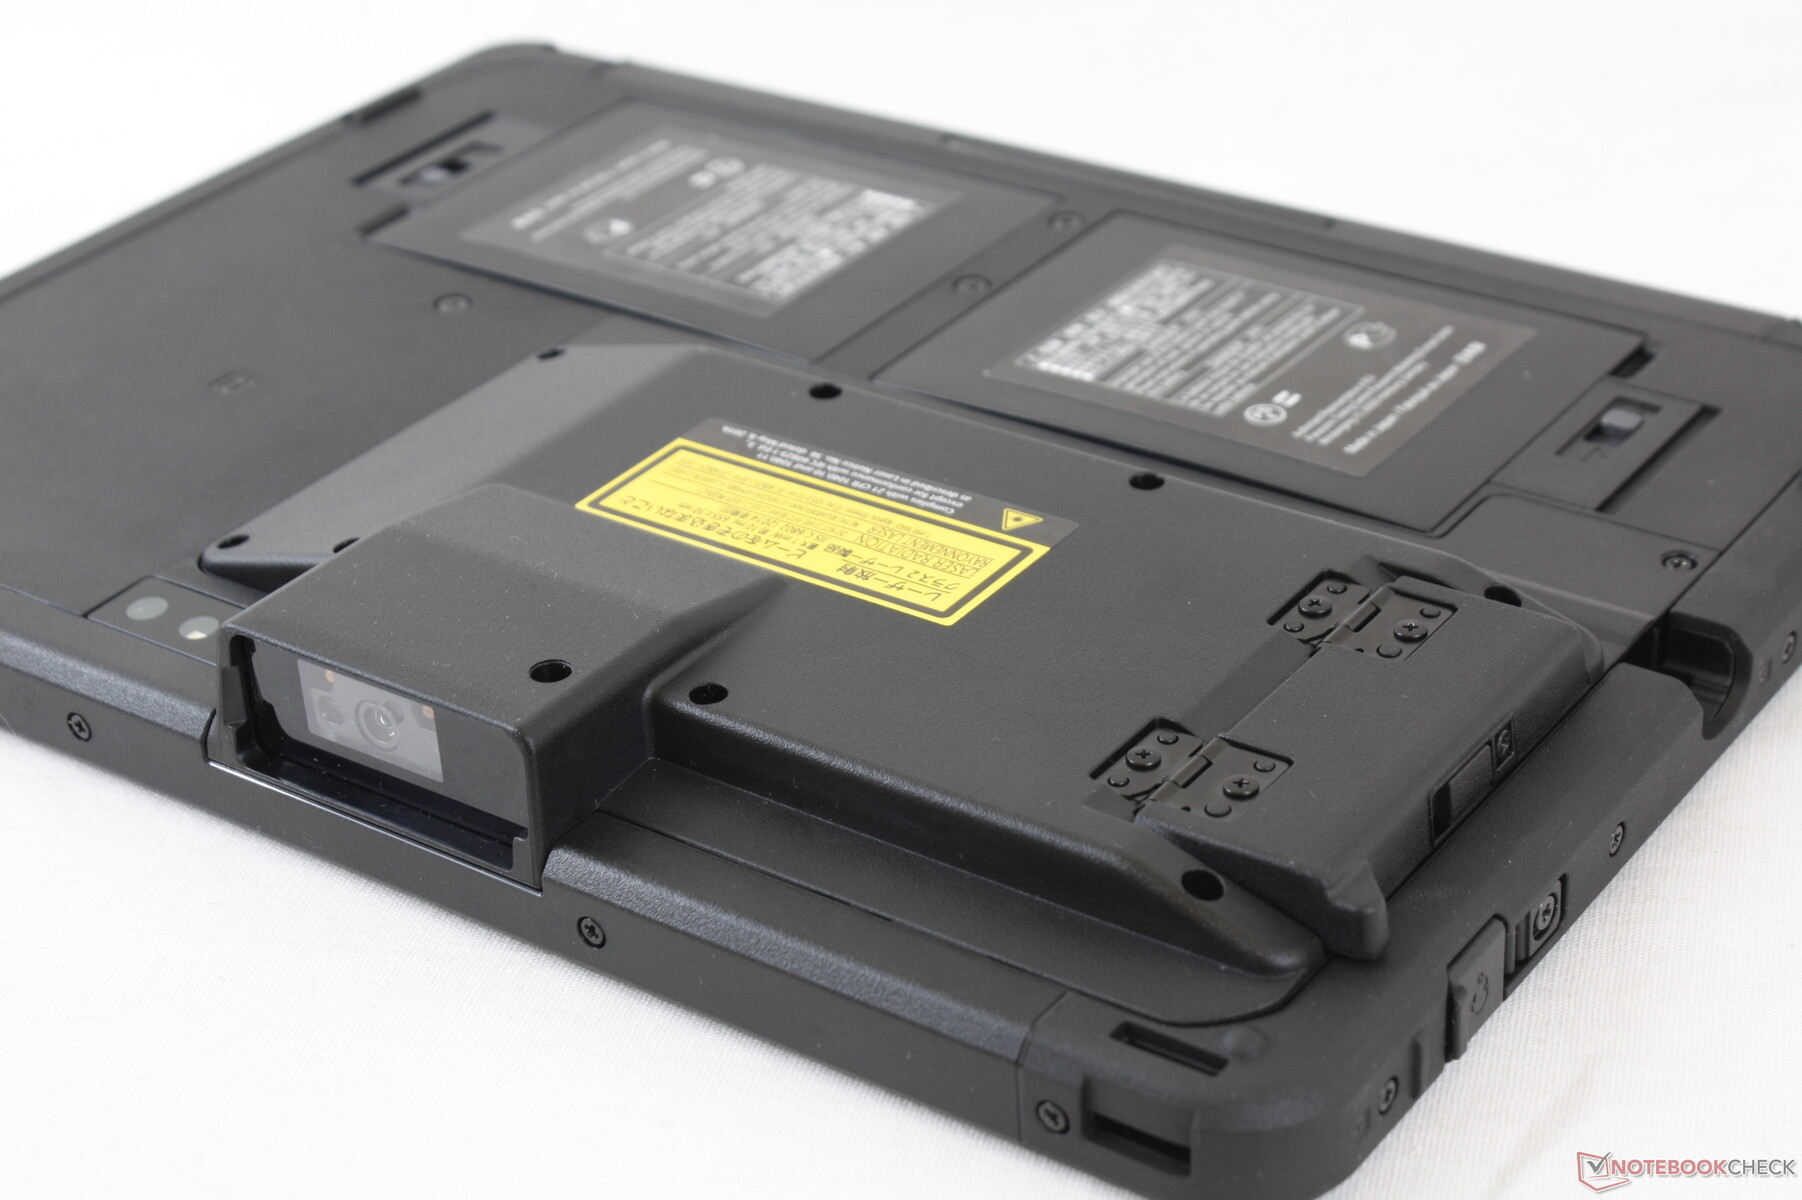
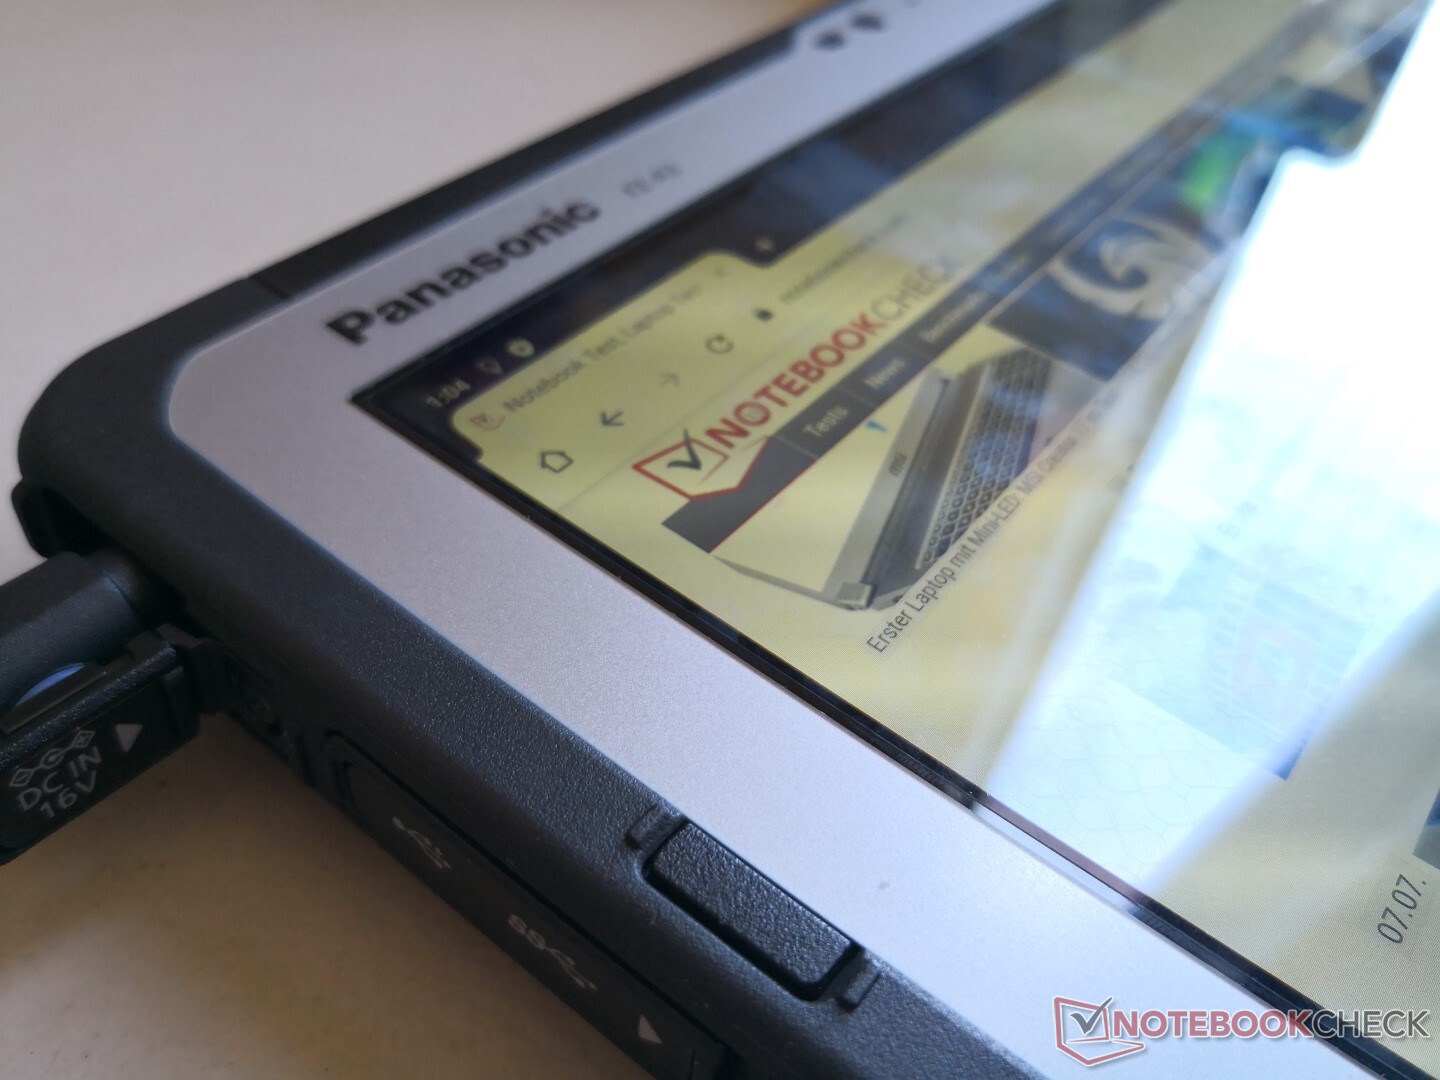
"Slim" and "rugged" don't usually go together, but the Toughbook FZ-A3 somehow manages to balance both roles without being exceedingly thick or bulky. The only exception is when a Panasonic Gadget accessory is attached which protrudes from the rear and adds thickness to an otherwise sleek design.
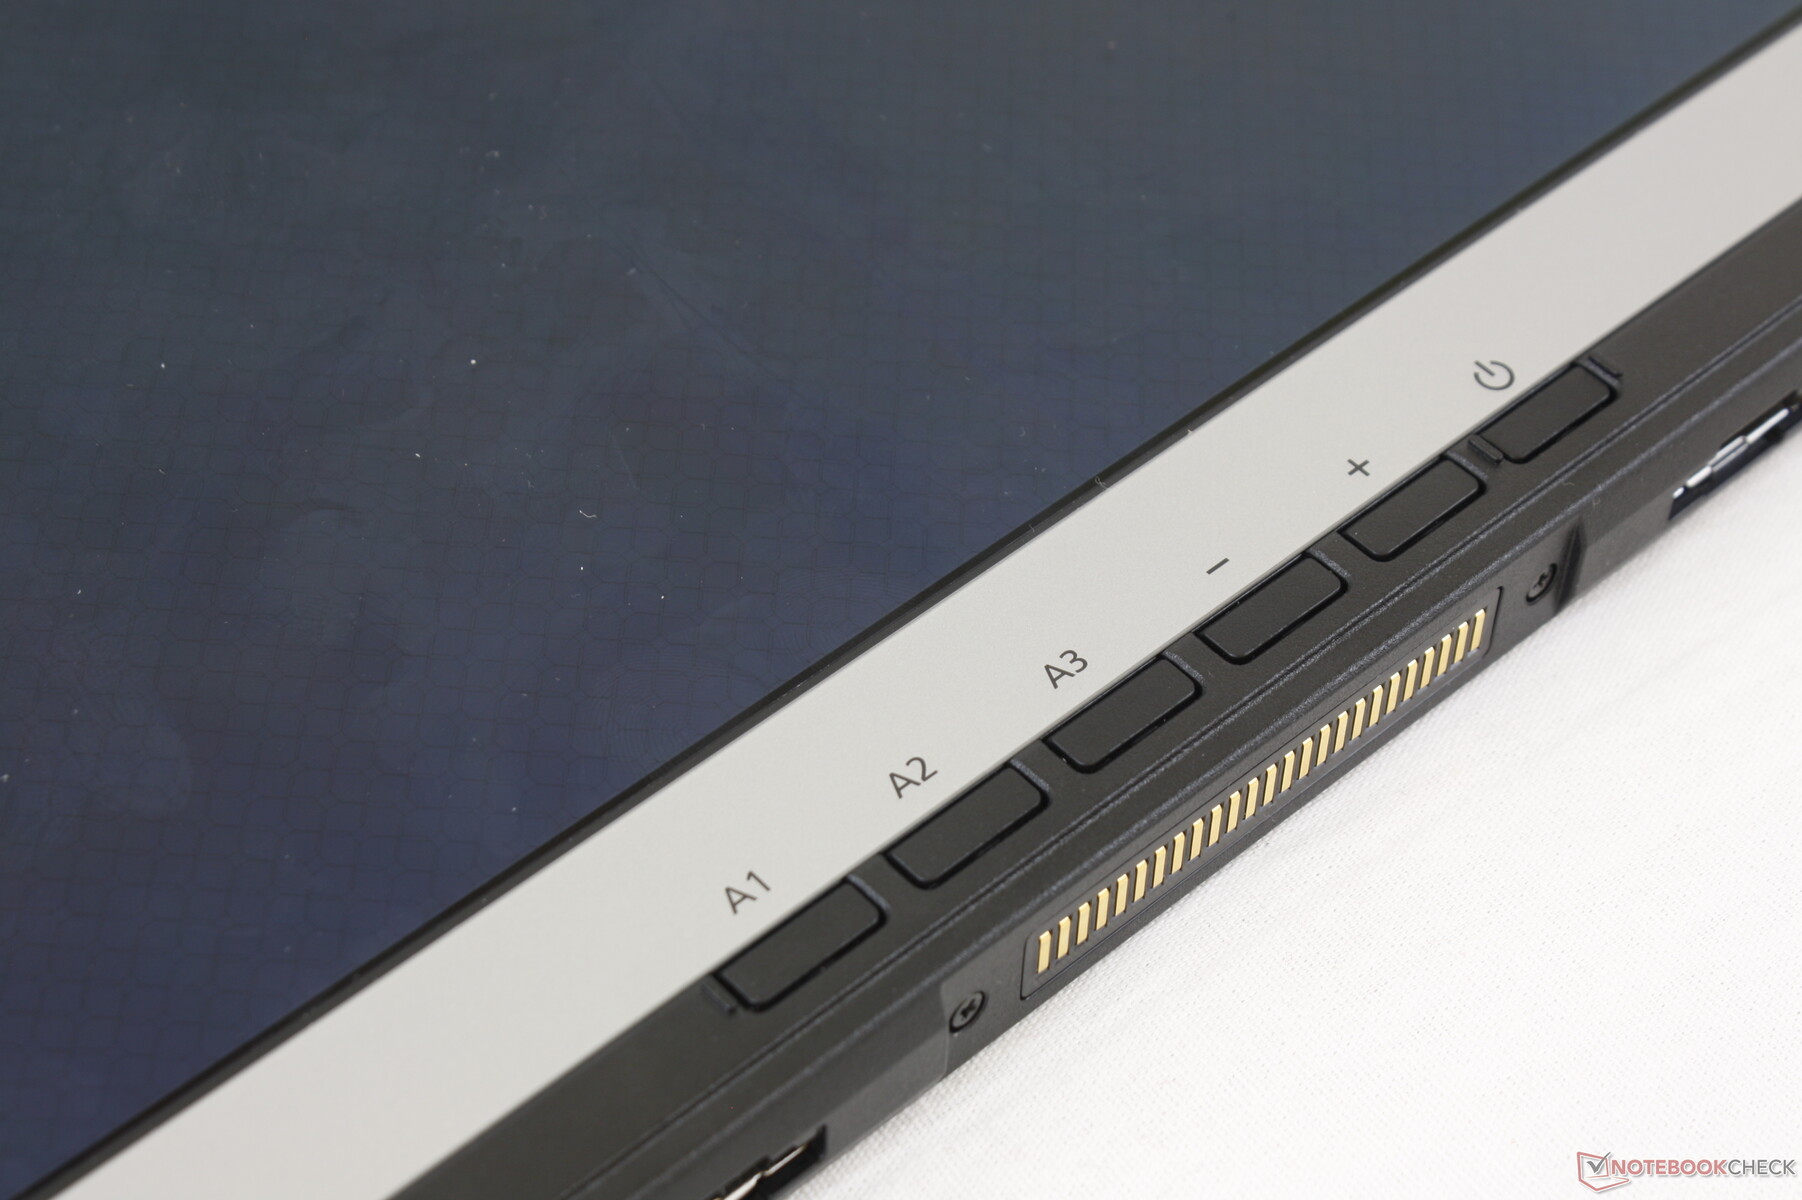
We like that the tablet integrates eight physical buttons on the front of the device instead of relying on fickle touchscreen buttons as found on the Durabook R11. Five of these buttons are programmable by developers for any enterprise-specific software or applications. However, swiping to unlock the screen can be annoyingly difficult because you have to swipe almost the entire height of the screen.
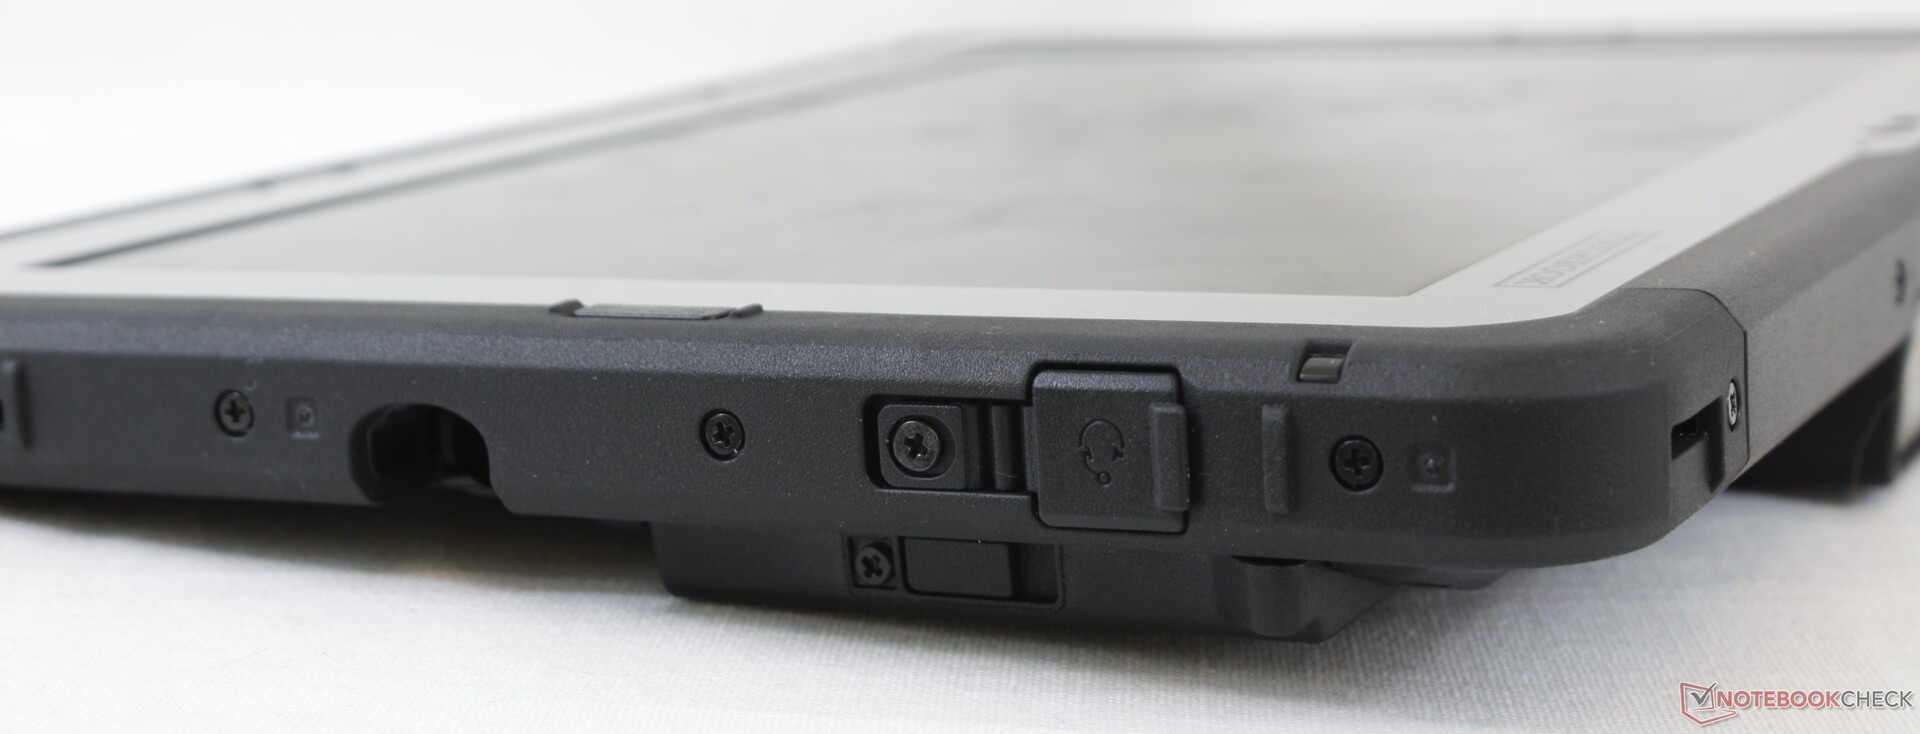
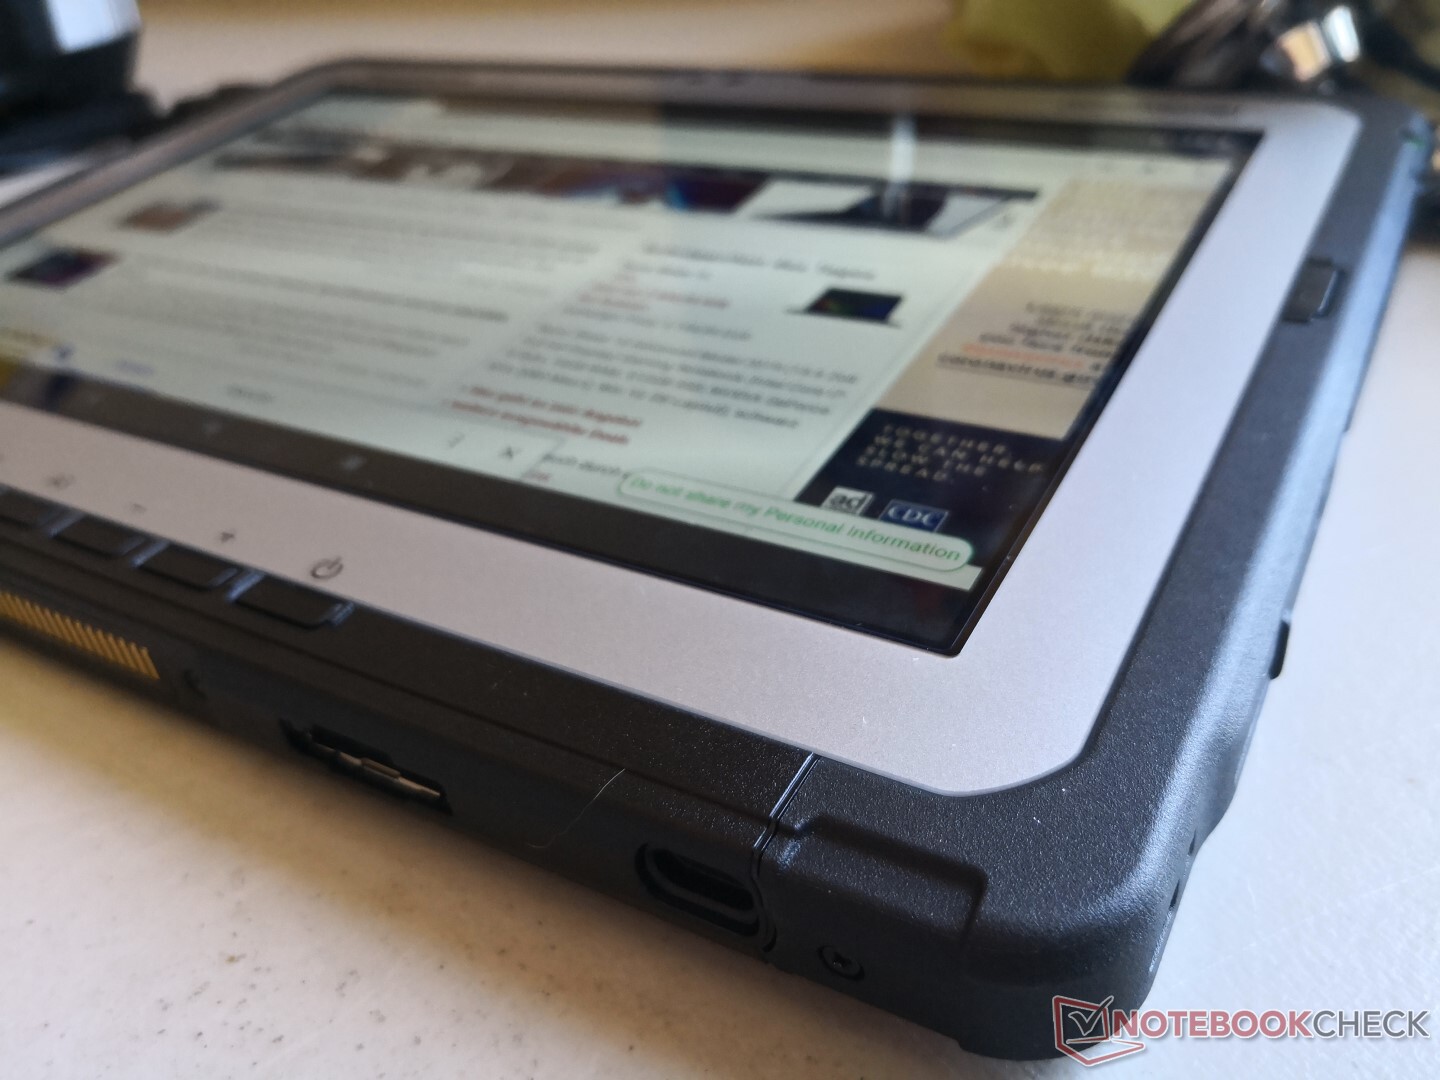
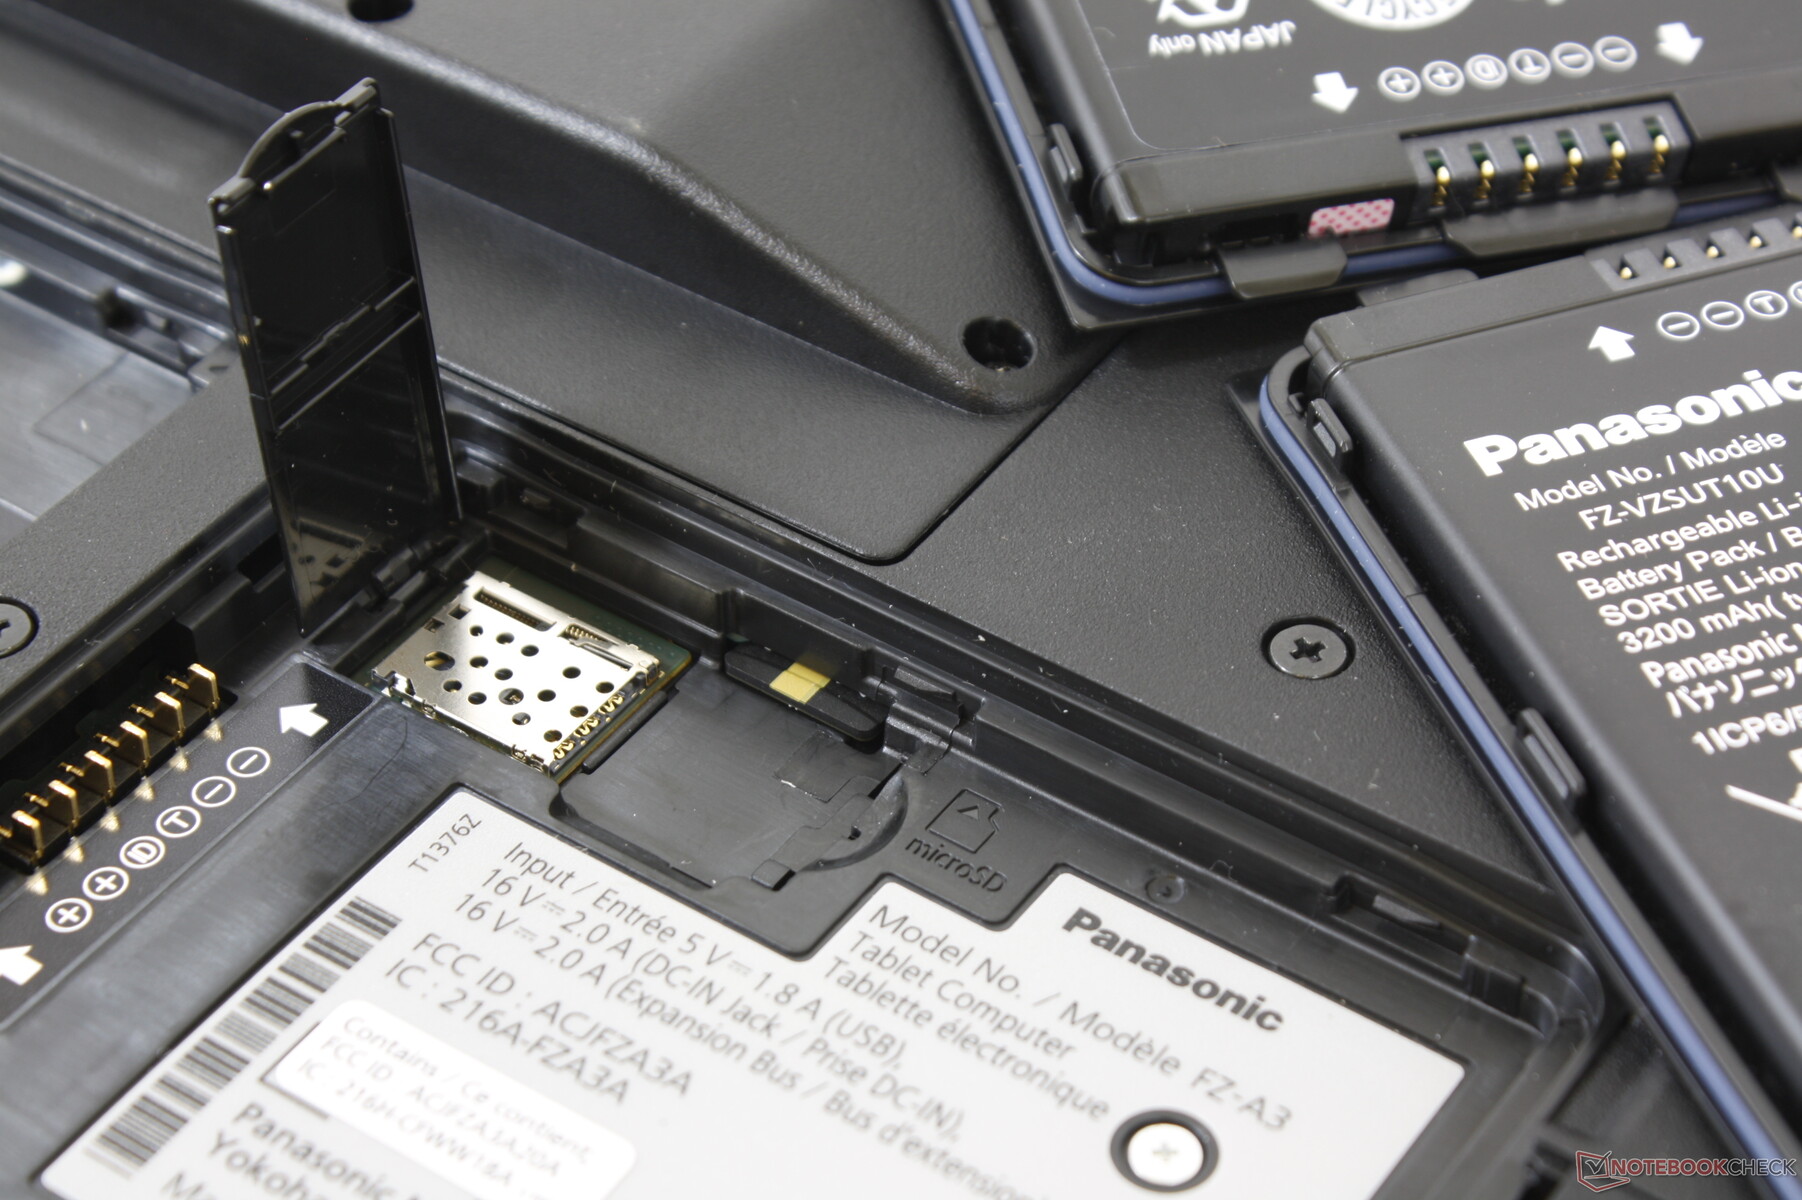
Connectivity
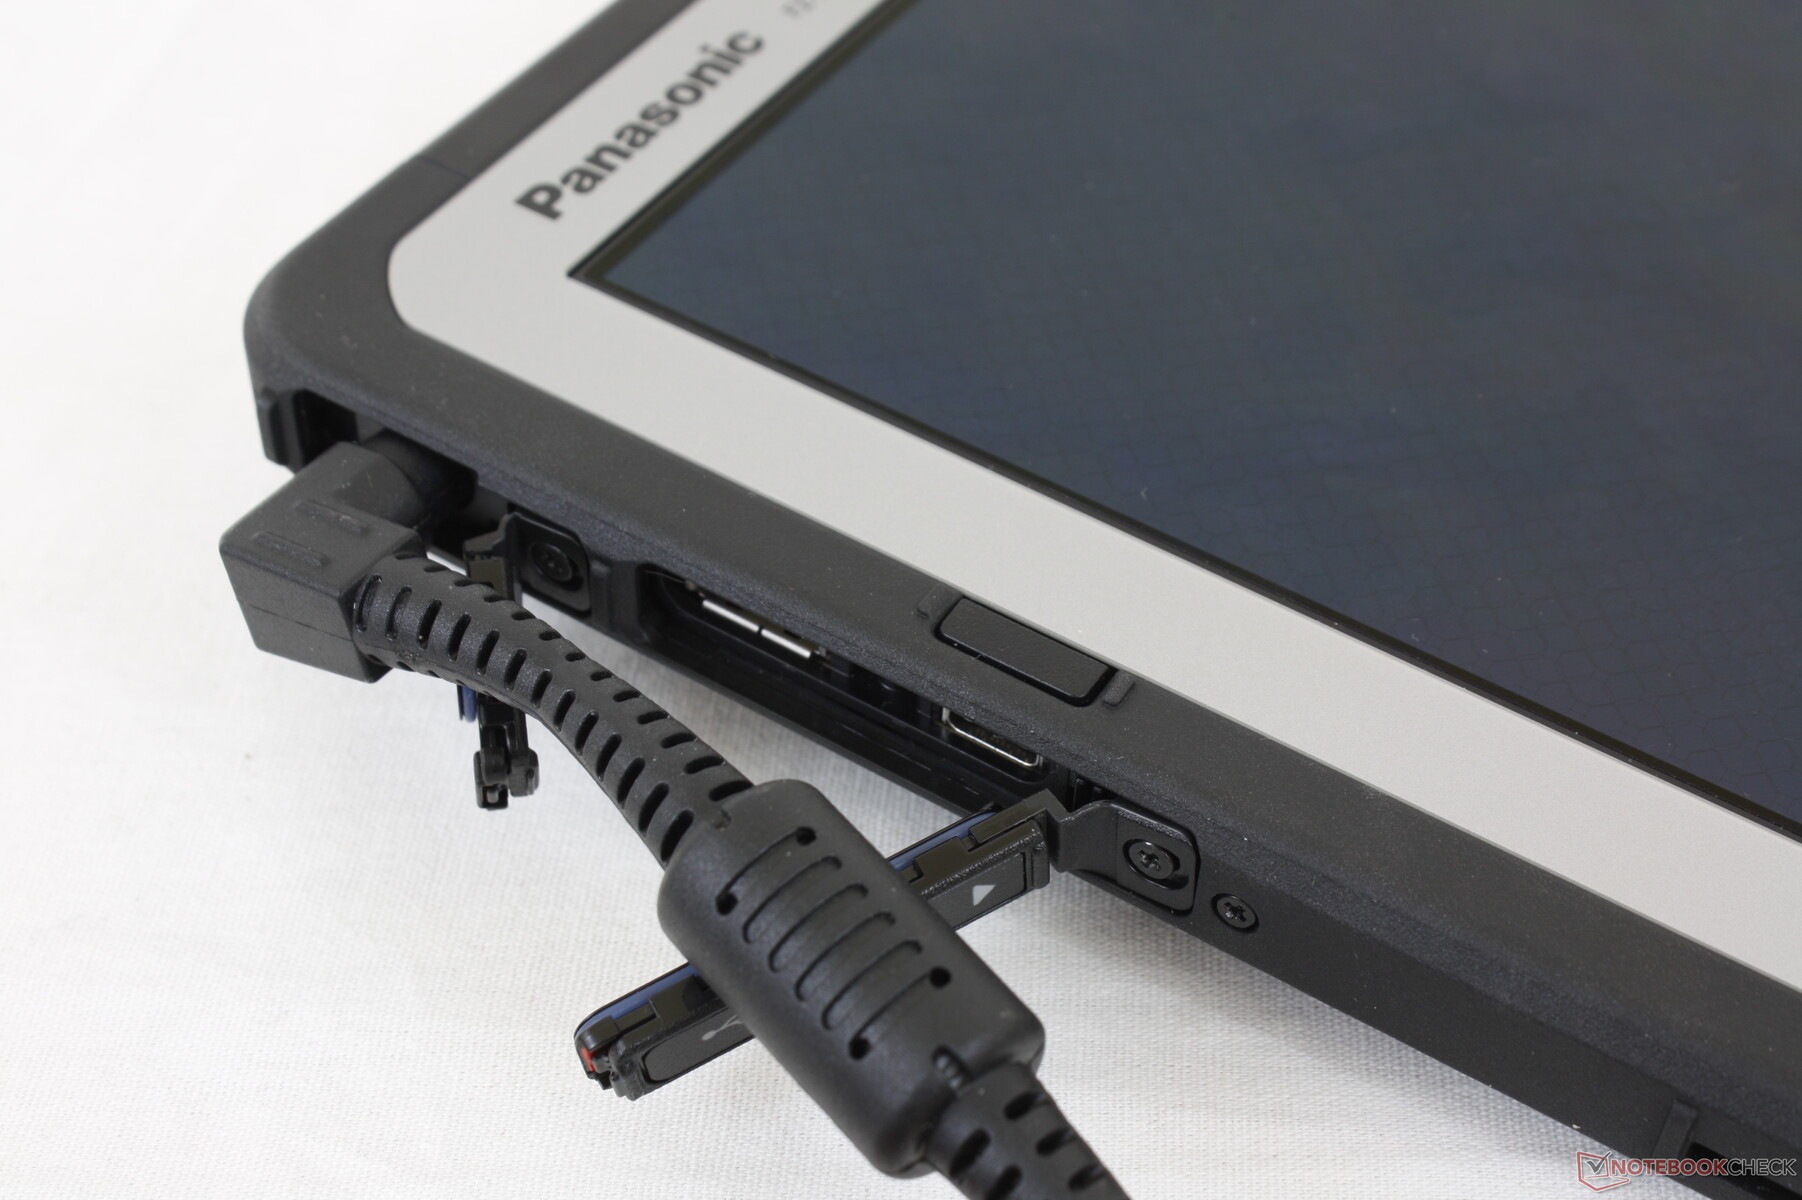
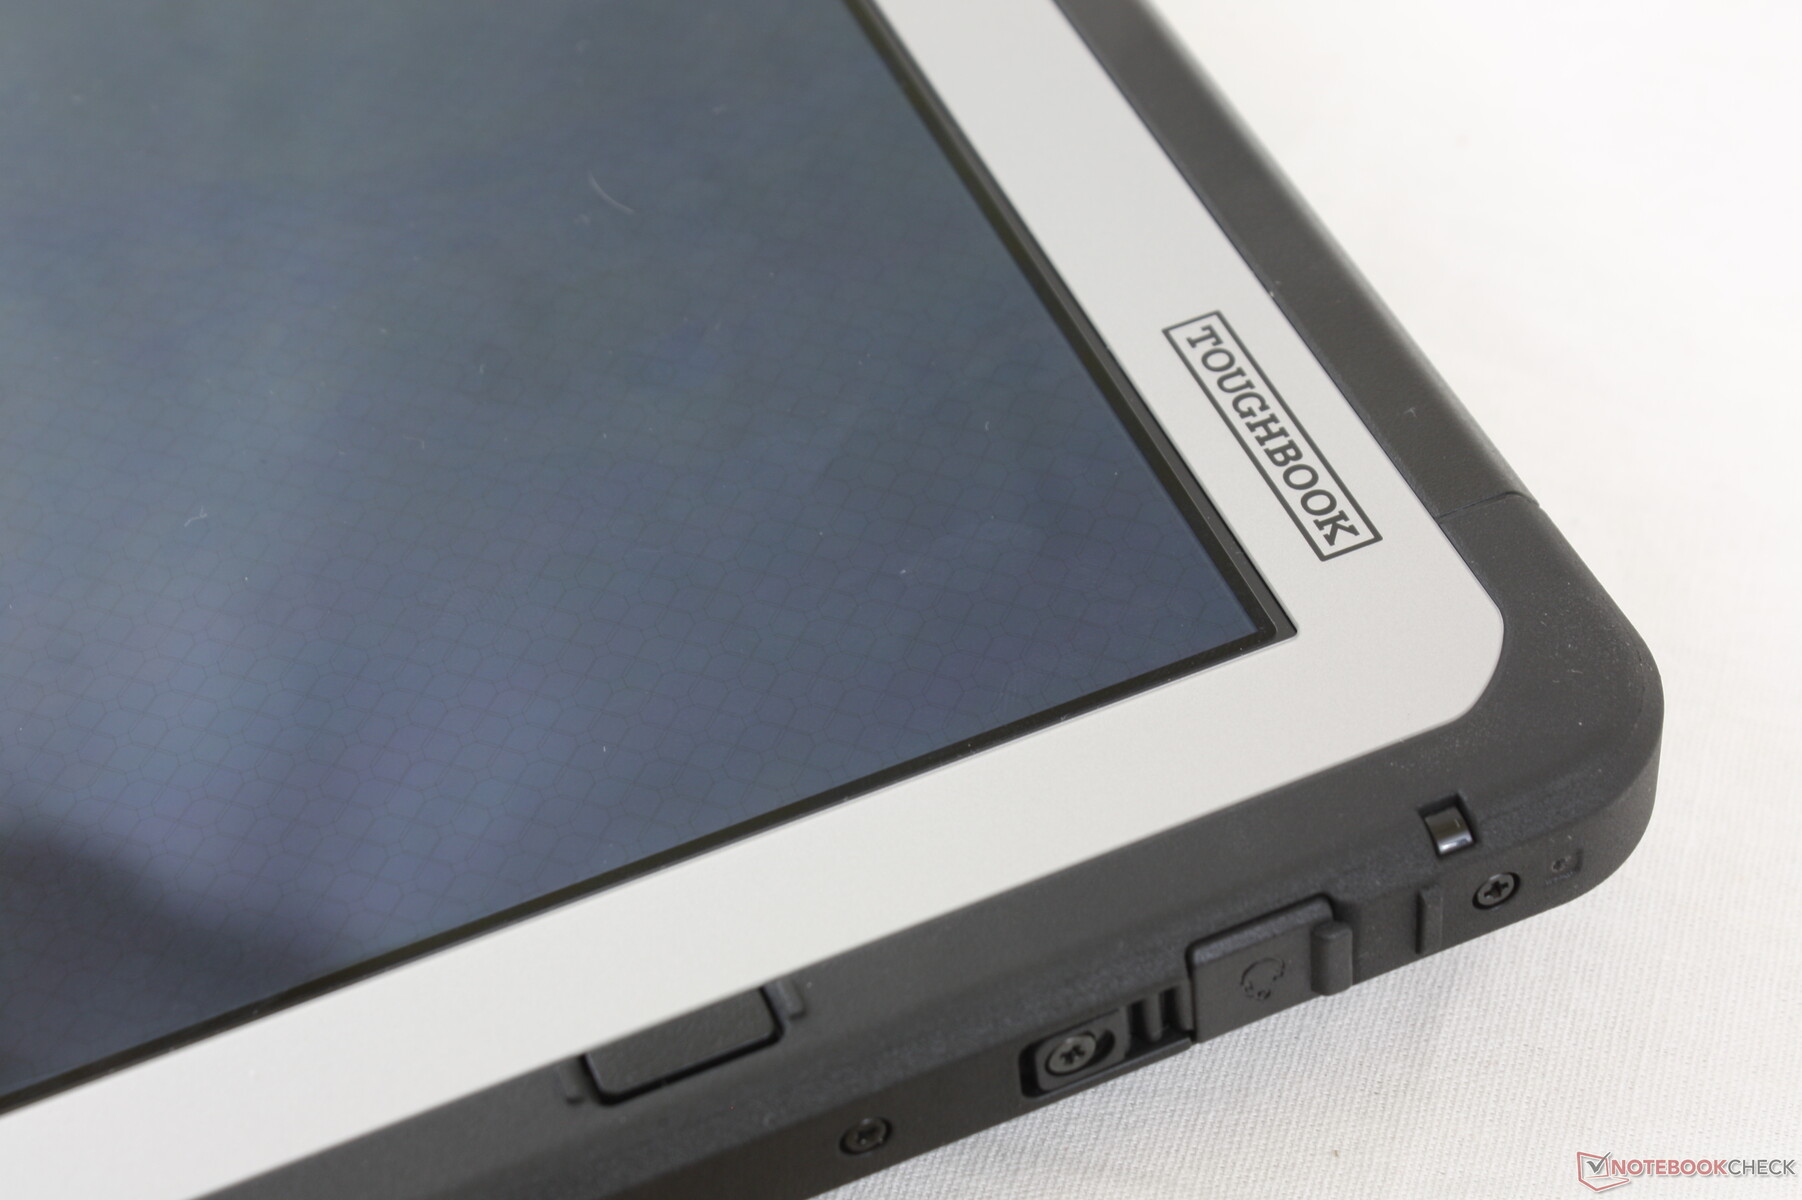
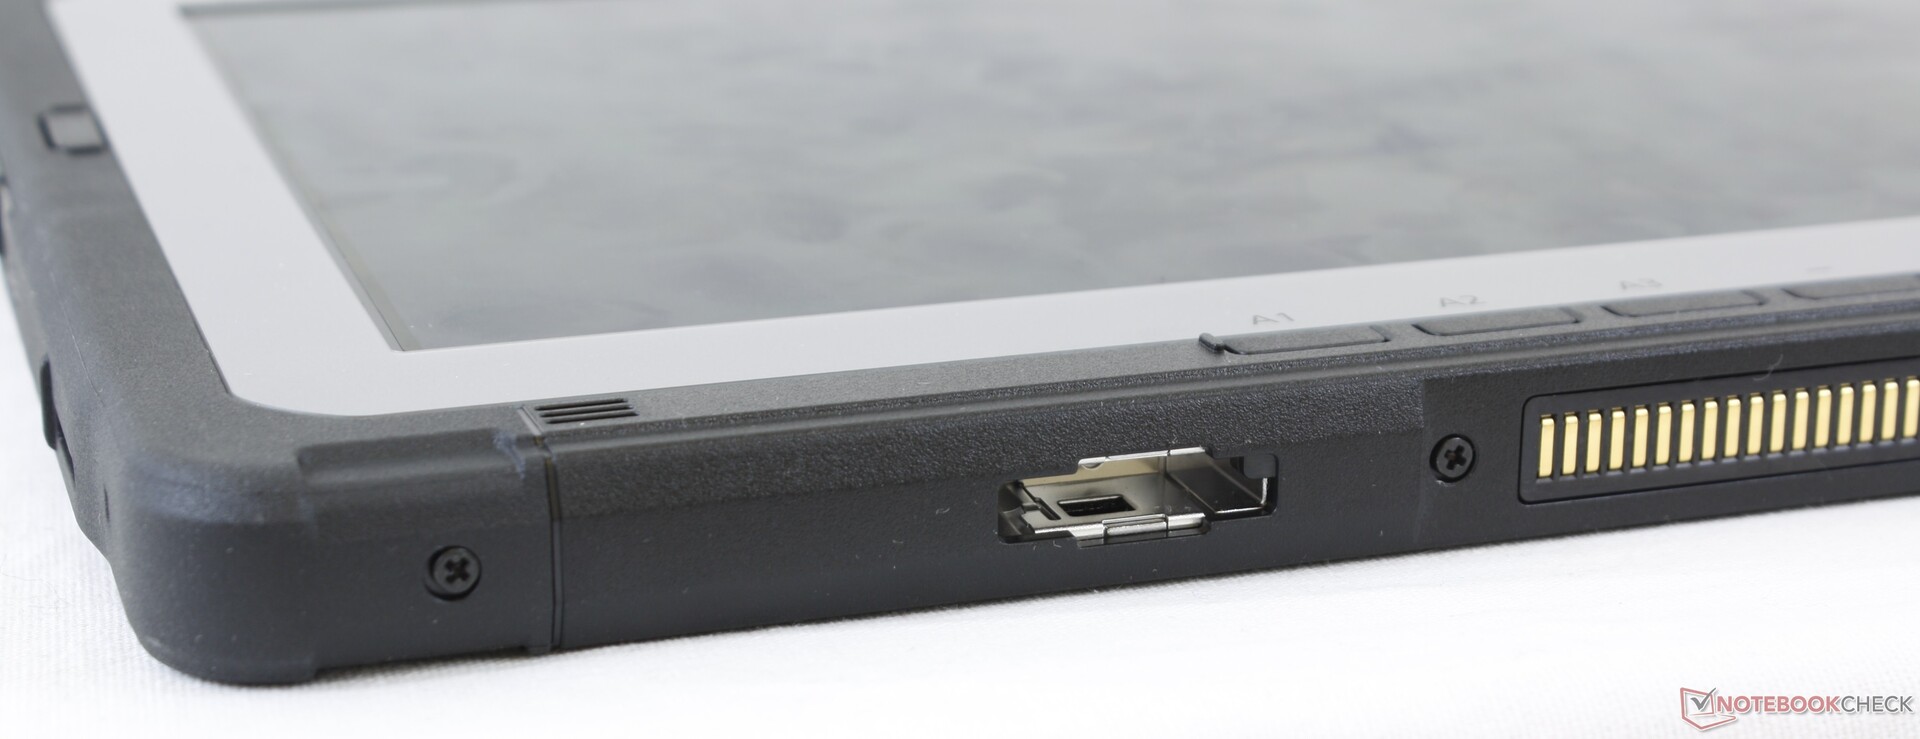
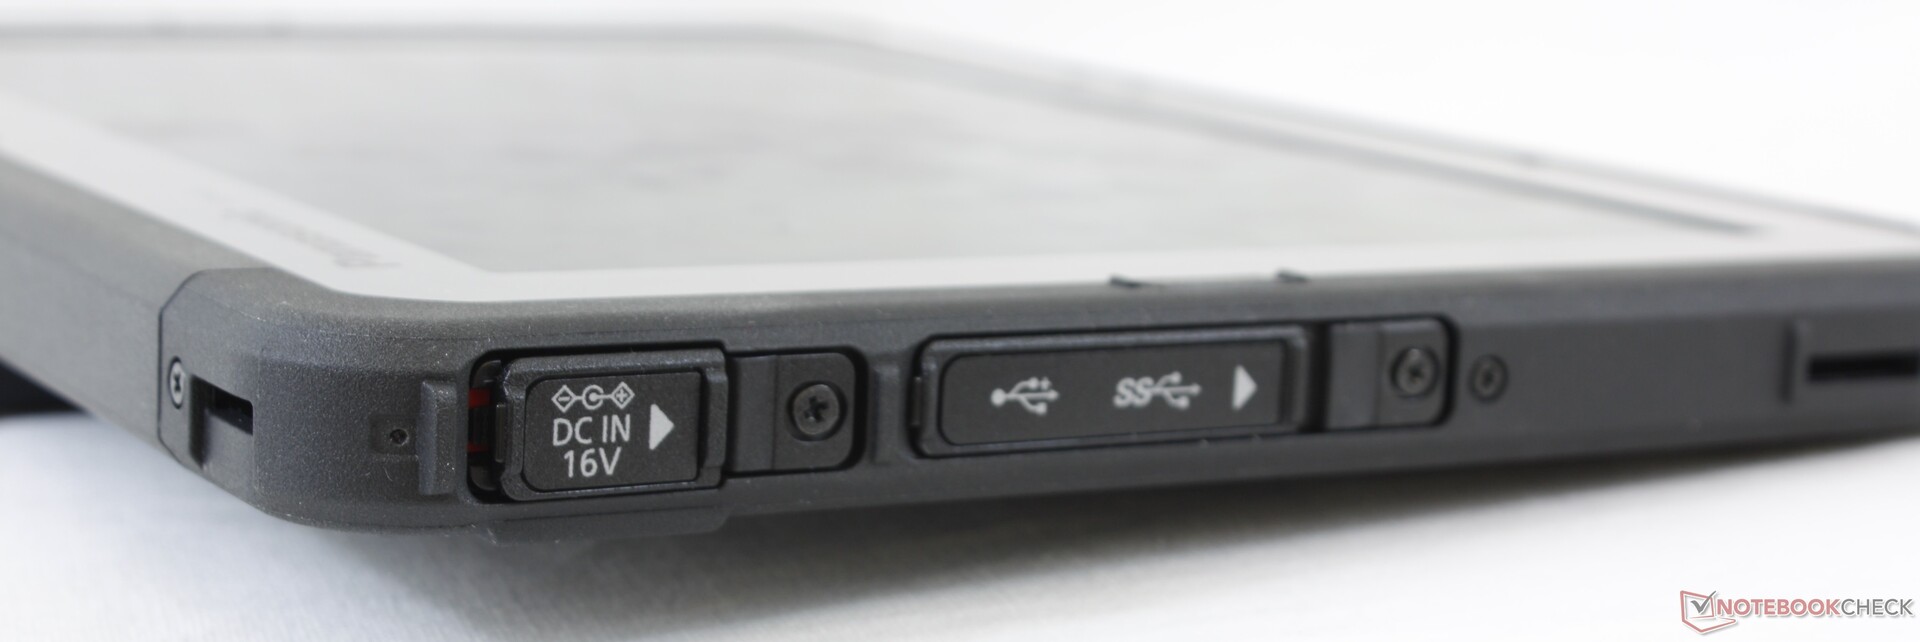
All ports along the edges are covered by flaps for additional protection. However, these rubber flaps can be bothersome as shown by the picture to the right.
The USB-C port can be used to recharge the tablet meaning that you don't have to carry the proprietary barrel AC adapter wherever you go. Furthermore, the USB-C port is capable of video-out as well.
Communication
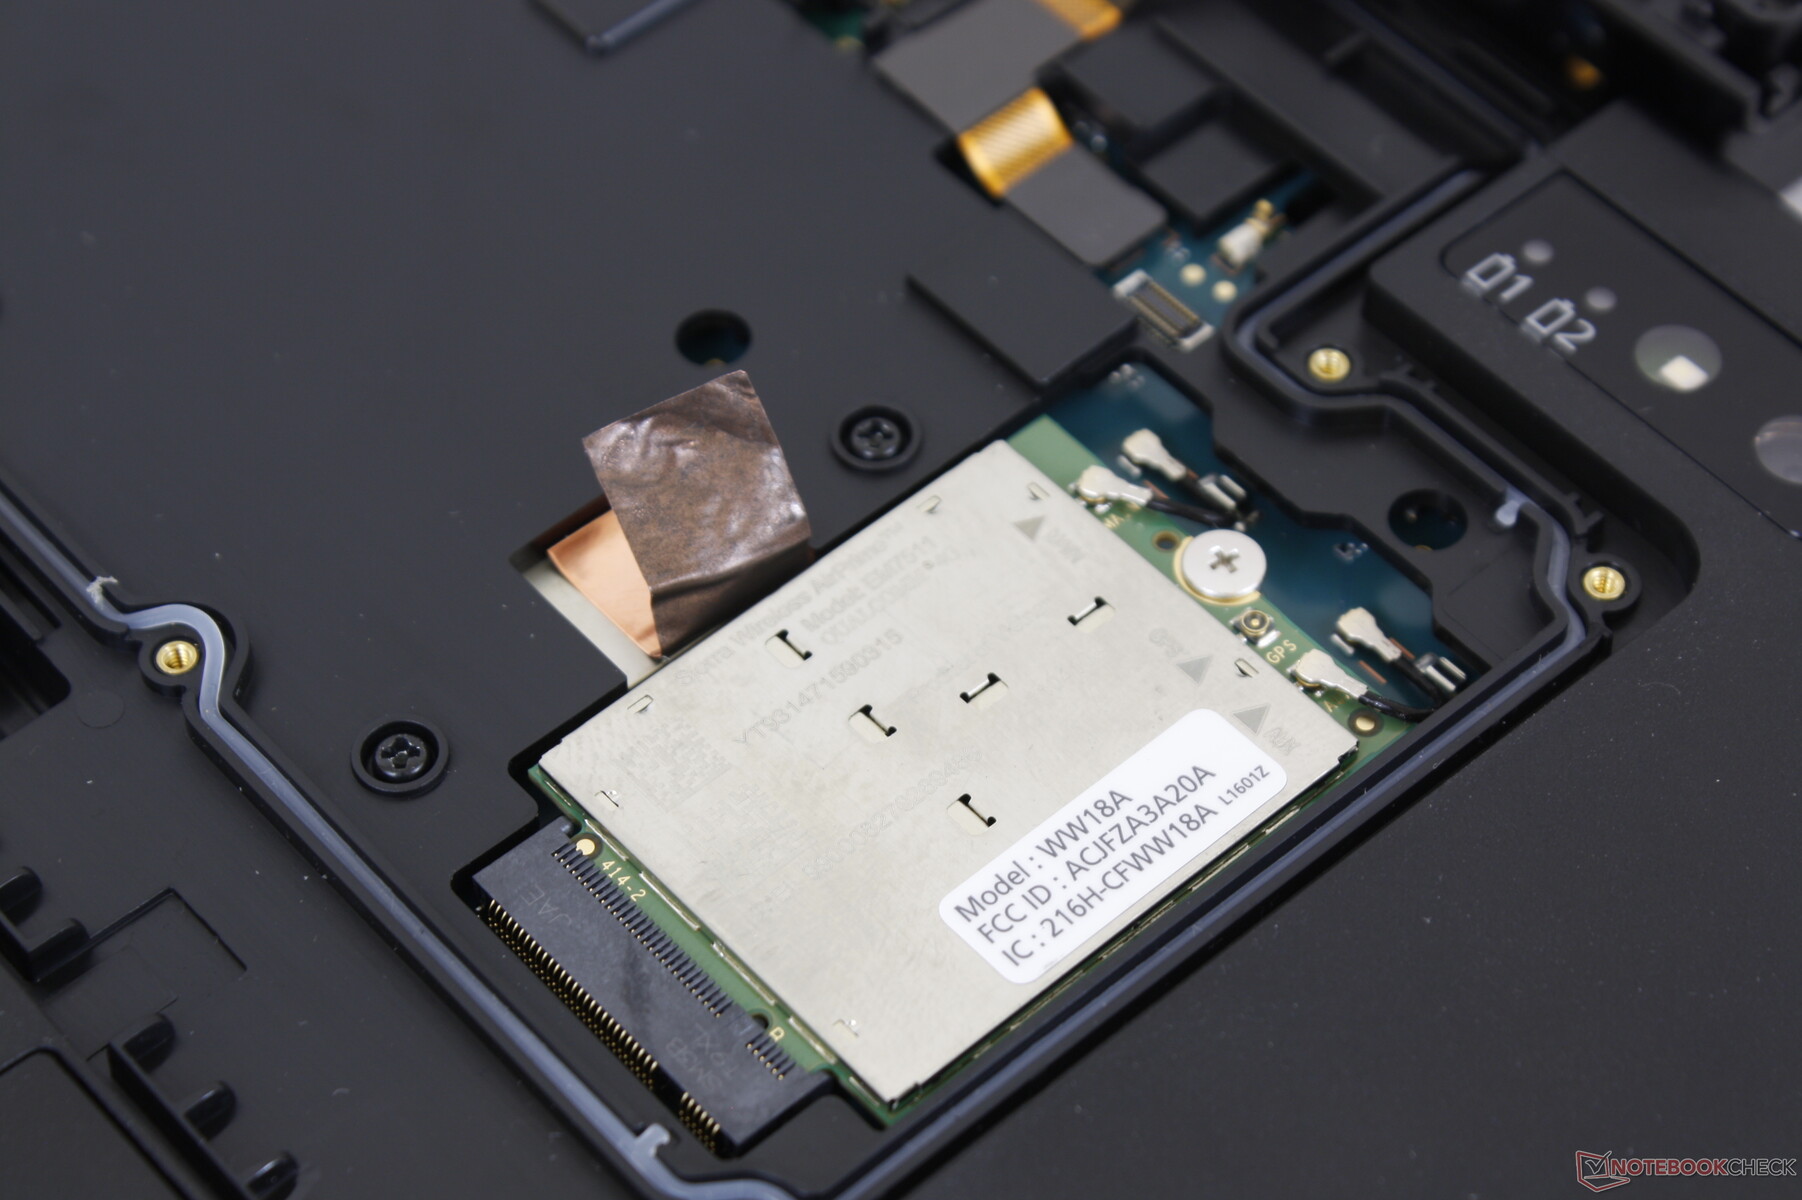
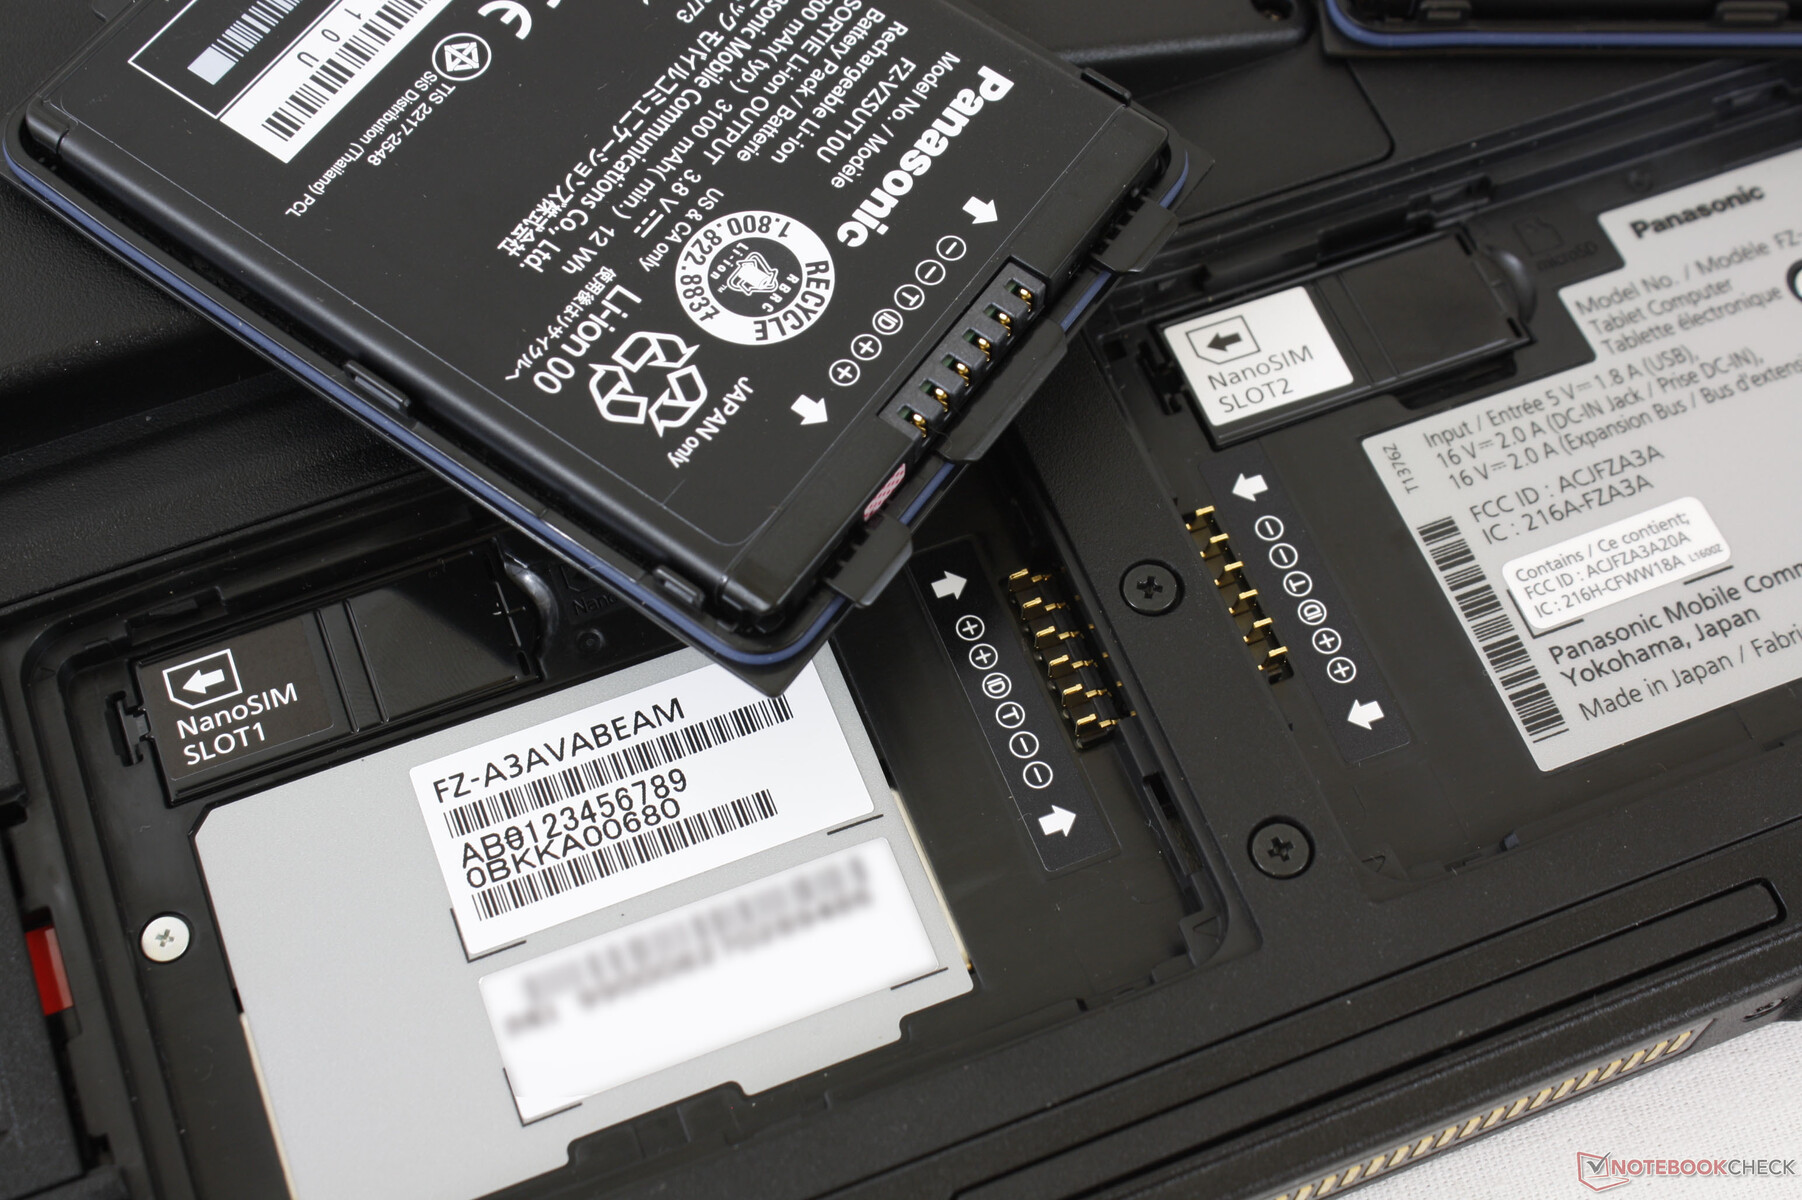
We're able to record an average WLAN transmit rate of 607 Mbps when connected to our Netgear RAX200 router while receive rates are slower at 388 Mbps. 3G and 4G are supported via the Sierra EM7511 module. NFC, GPS, and Bluetooth 5 are supported as well.
Webcam
The rear 8 MP and front 5 MP cameras are better than the typical laptop webcam especially in terms of raw megapixel count for increased clarity. Still, it's a shame that they suffer from all the usual drawbacks of a typical consumer webcam including poor quality in low-light conditions. The rear LED flash alleviates this somewhat for up-close pictures.


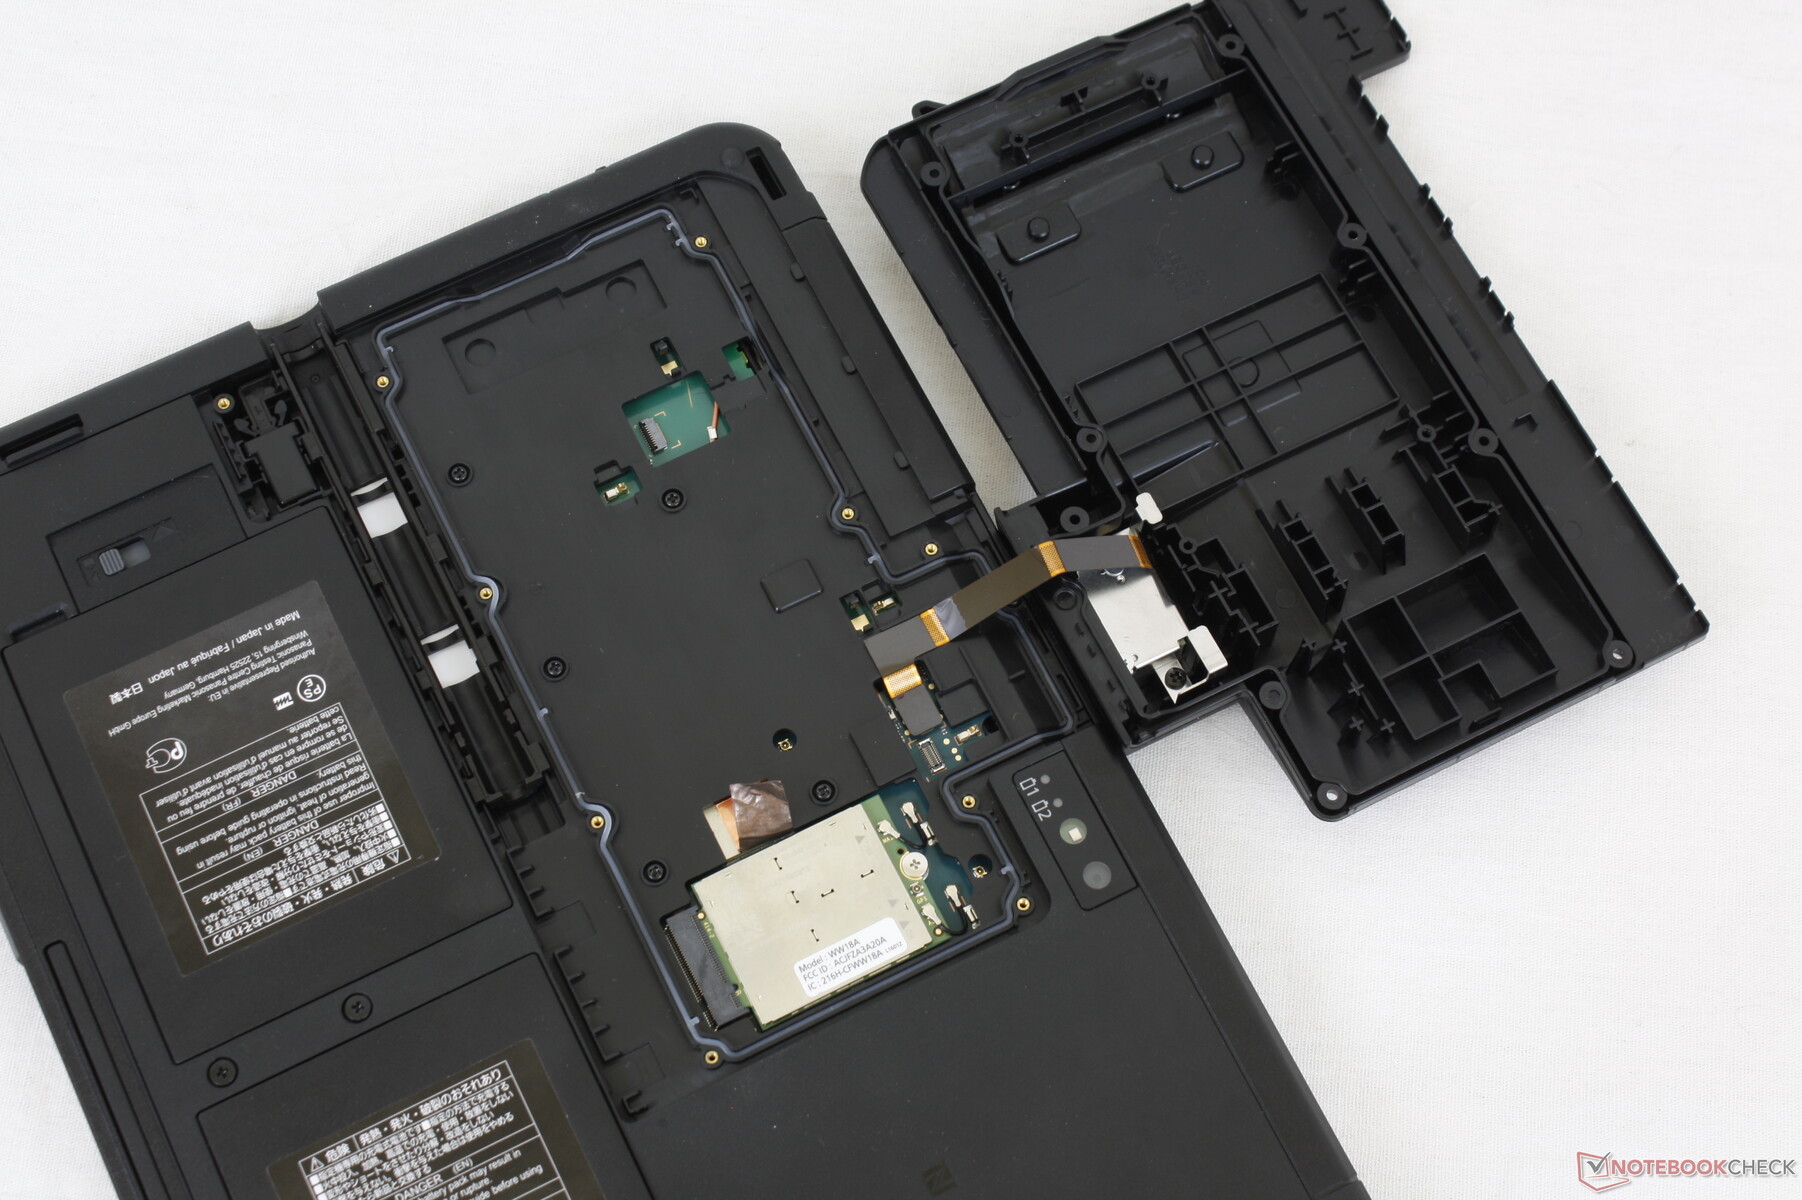
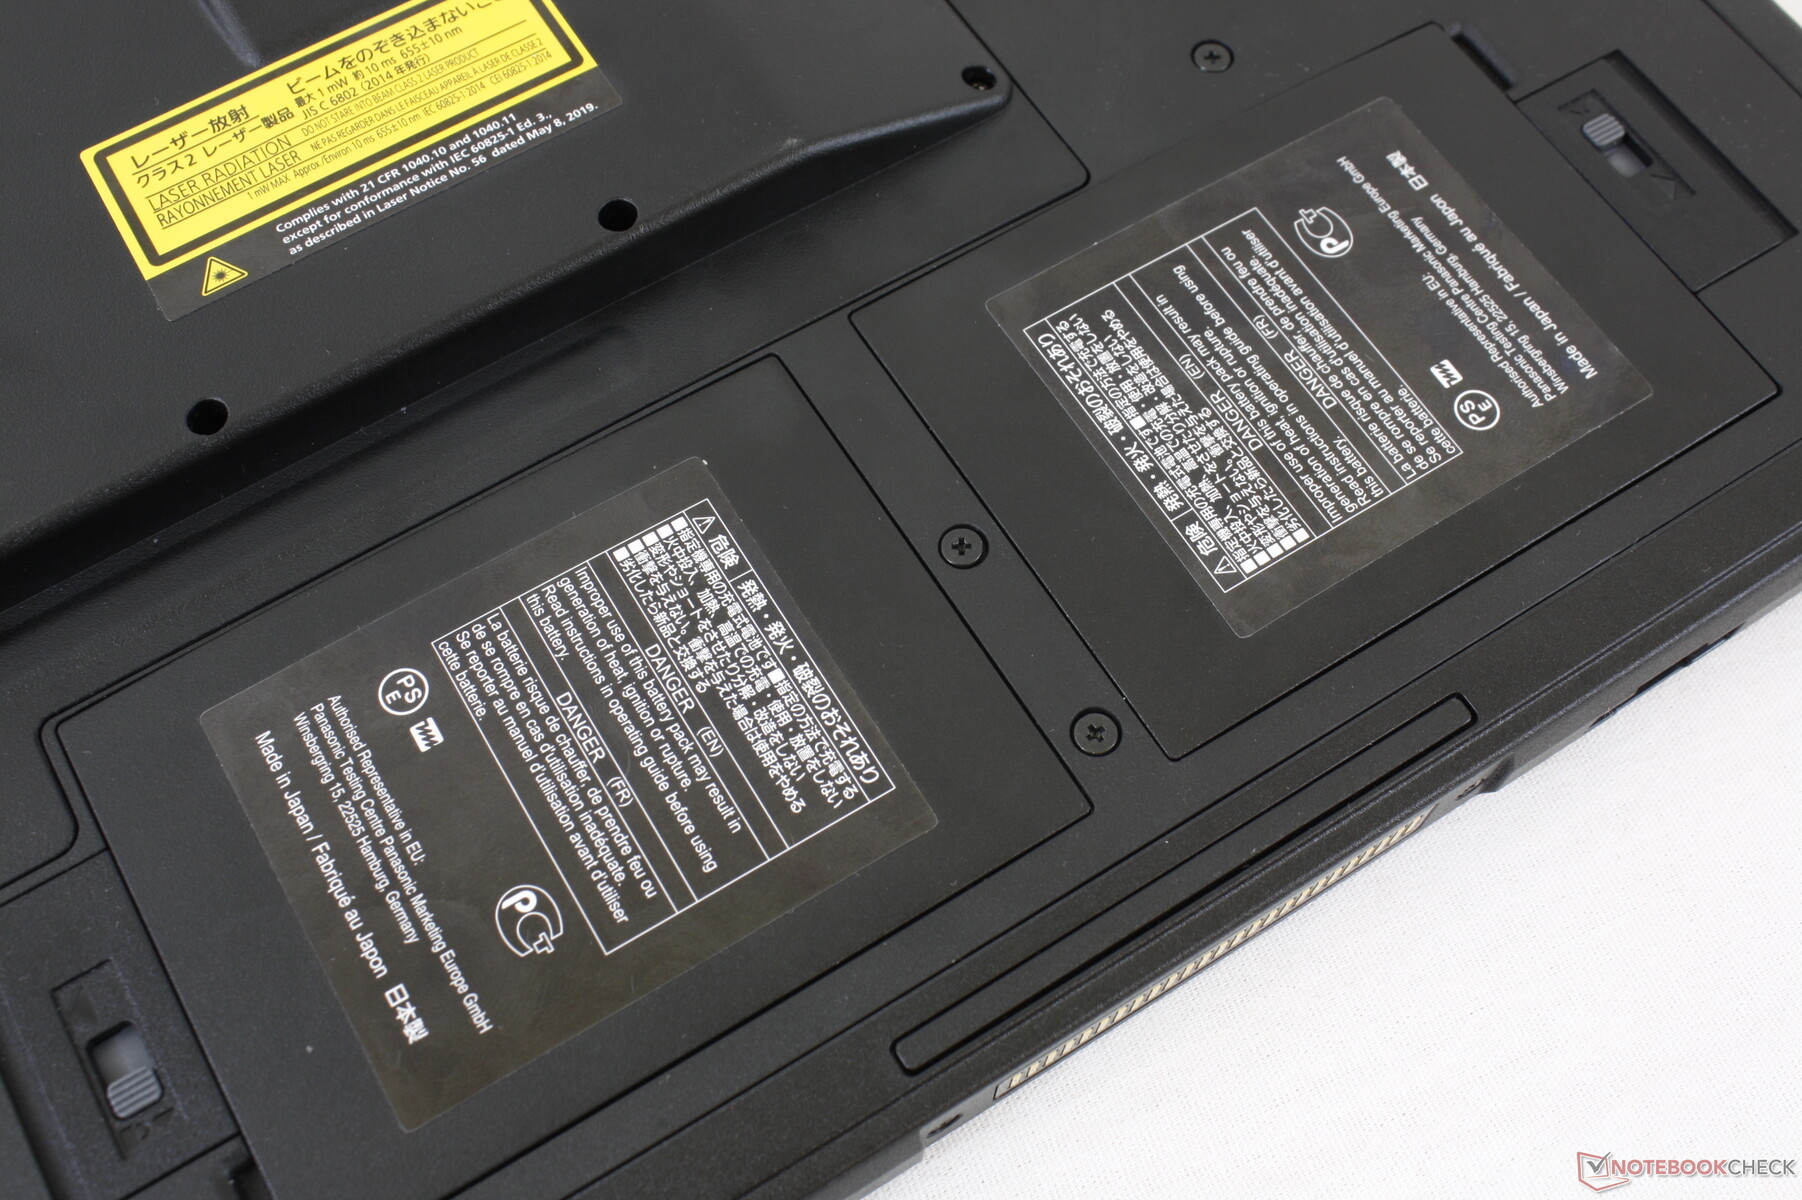
Maintenance
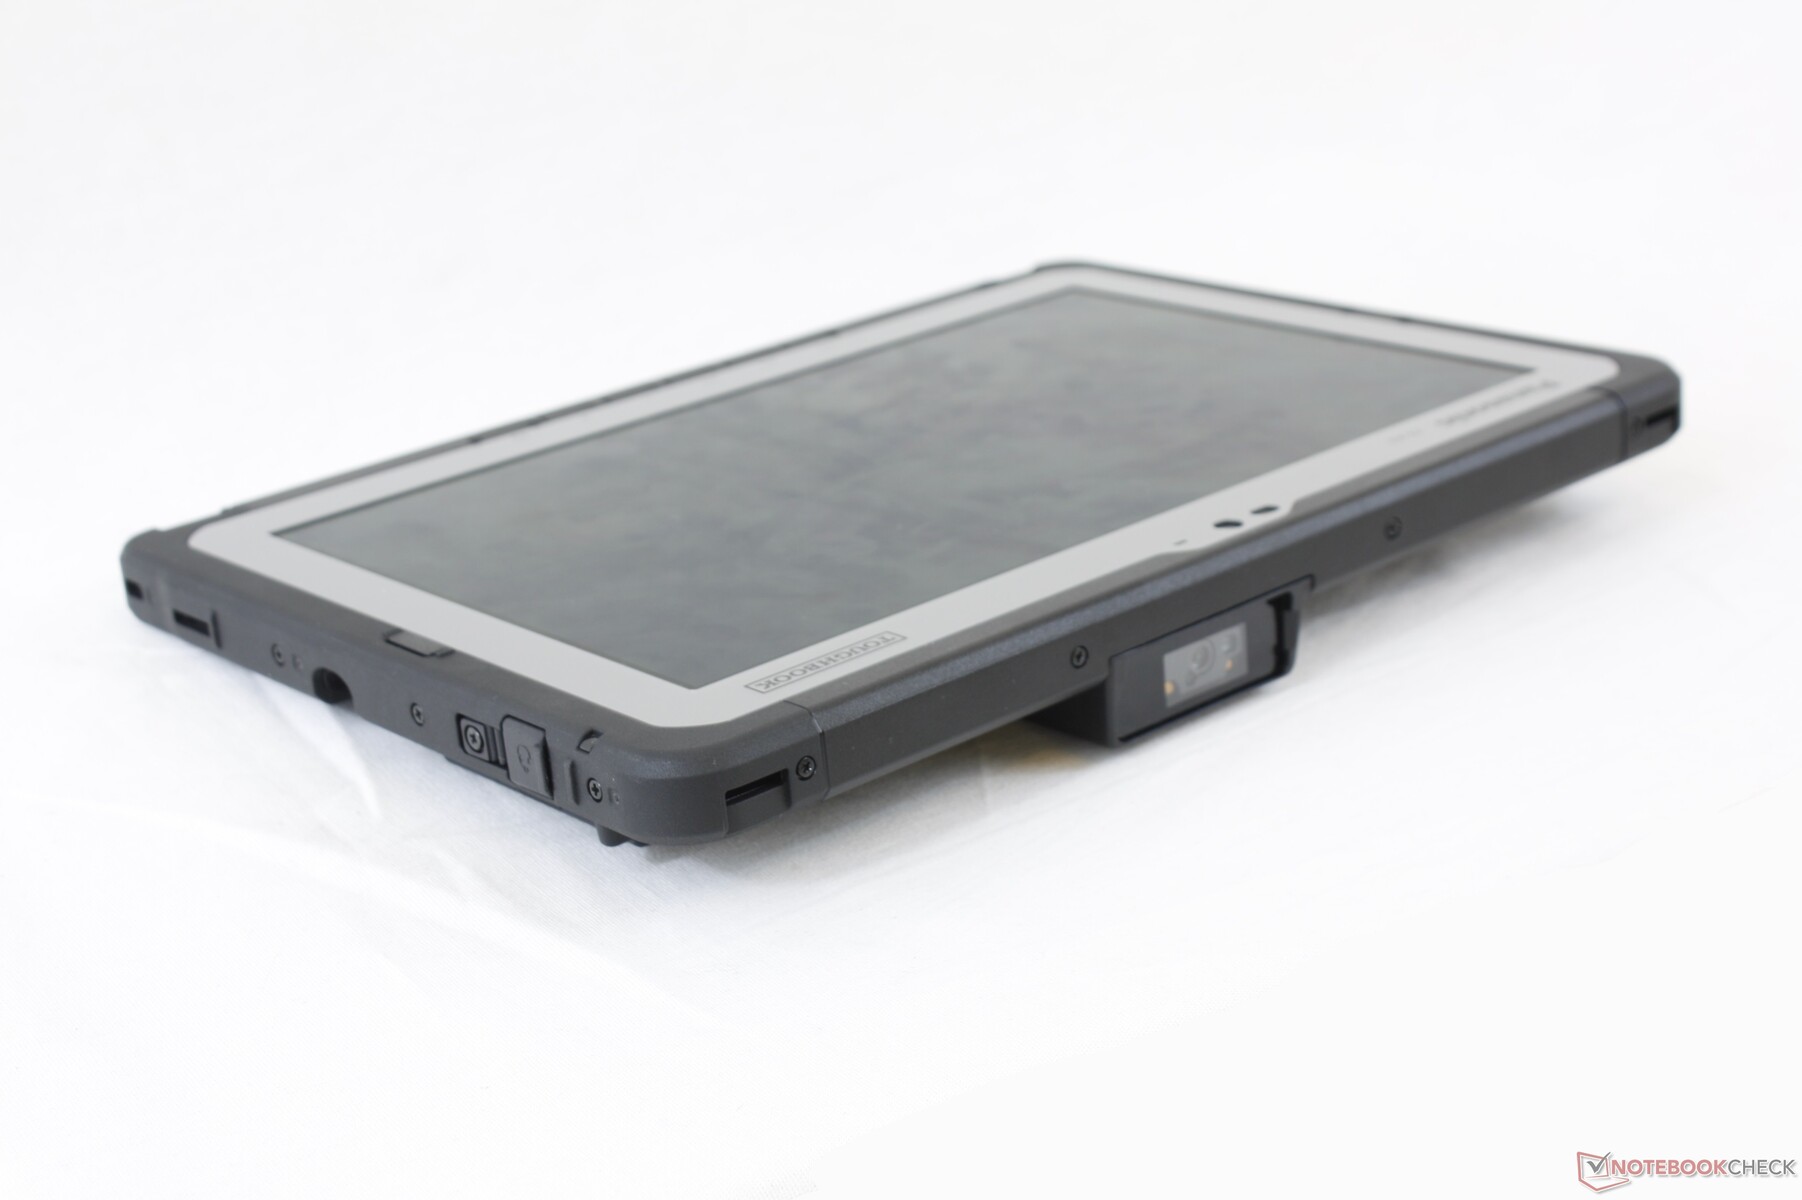
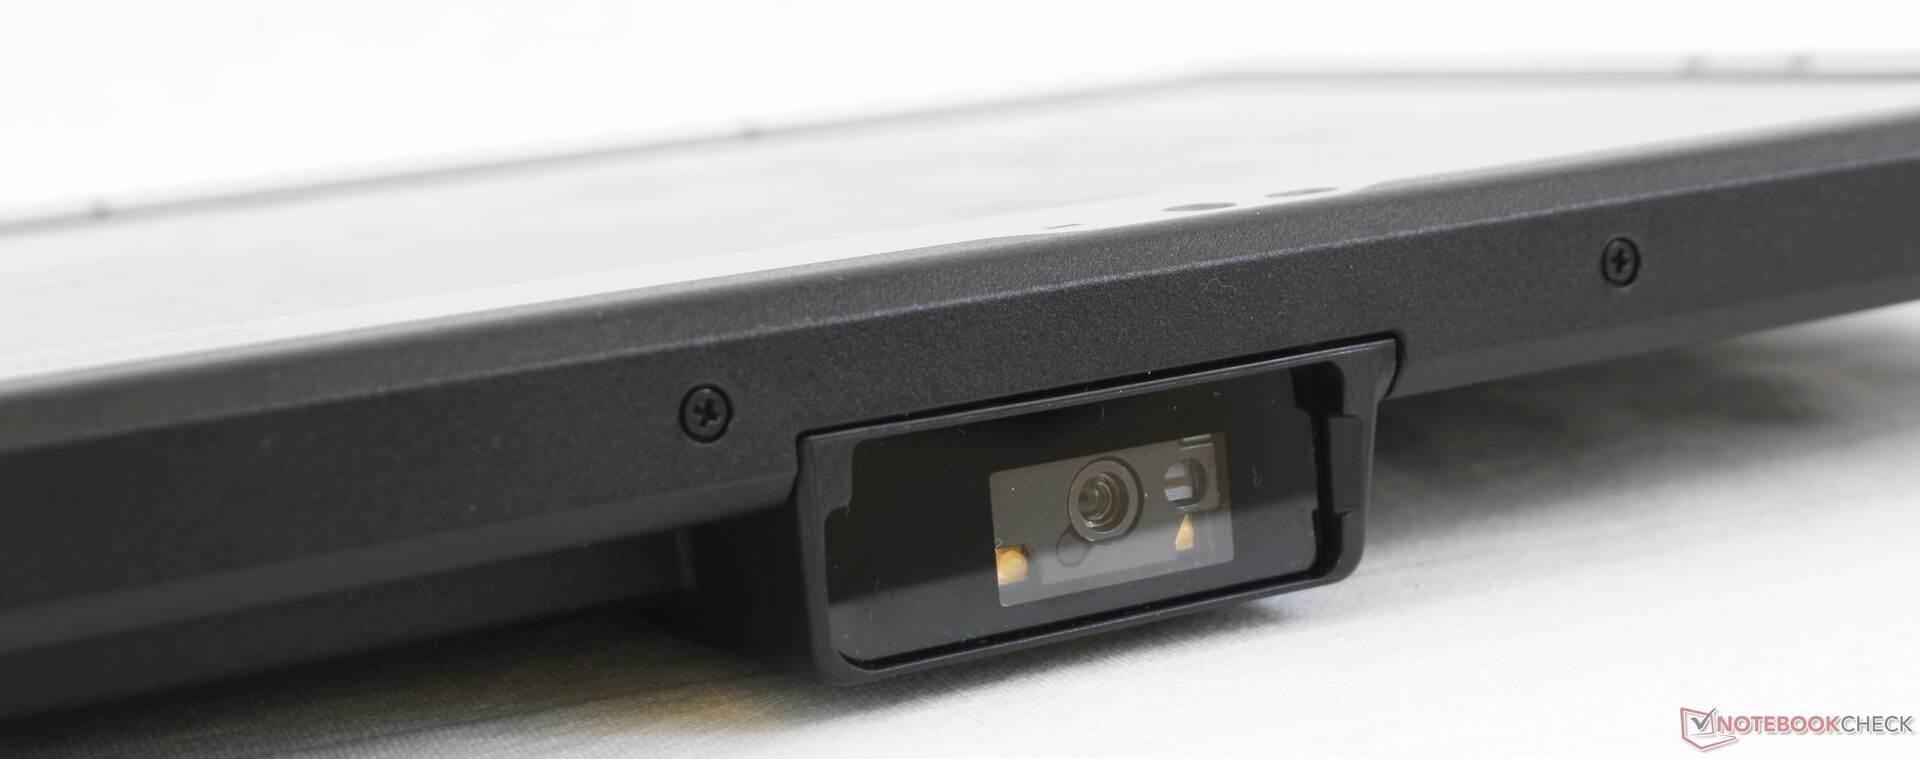
The Gadget port barcode scanner can be removed after unscrewing nine JIS screws, but doing so would expose the internals to the elements meaning a Gadget or flat shield should be attached at all times. A flat shield is not included in the box if the tablet is ordered with a Gadget meaning you'll have to order the tablet without any Gadget attachments at all if you want the flat shield.
Panasonic does not encourage removing the barcode scanner or any attached Gadget meaning that users will be stuck with whatever Gadget is attached at purchase. This is a bummer because it would have been much more versatile to be able to swap out different Gadgets as necessary for the job.
Accessories and Warranty
Included extras in the box are a passive stylus pen, small loop cable, user's manual, and an AC adapter. Optional accessories that connect to the proprietary Gadget port, like our barcode scanner, are also available from Panasonic. A three-year manufacturer warranty comes standard.
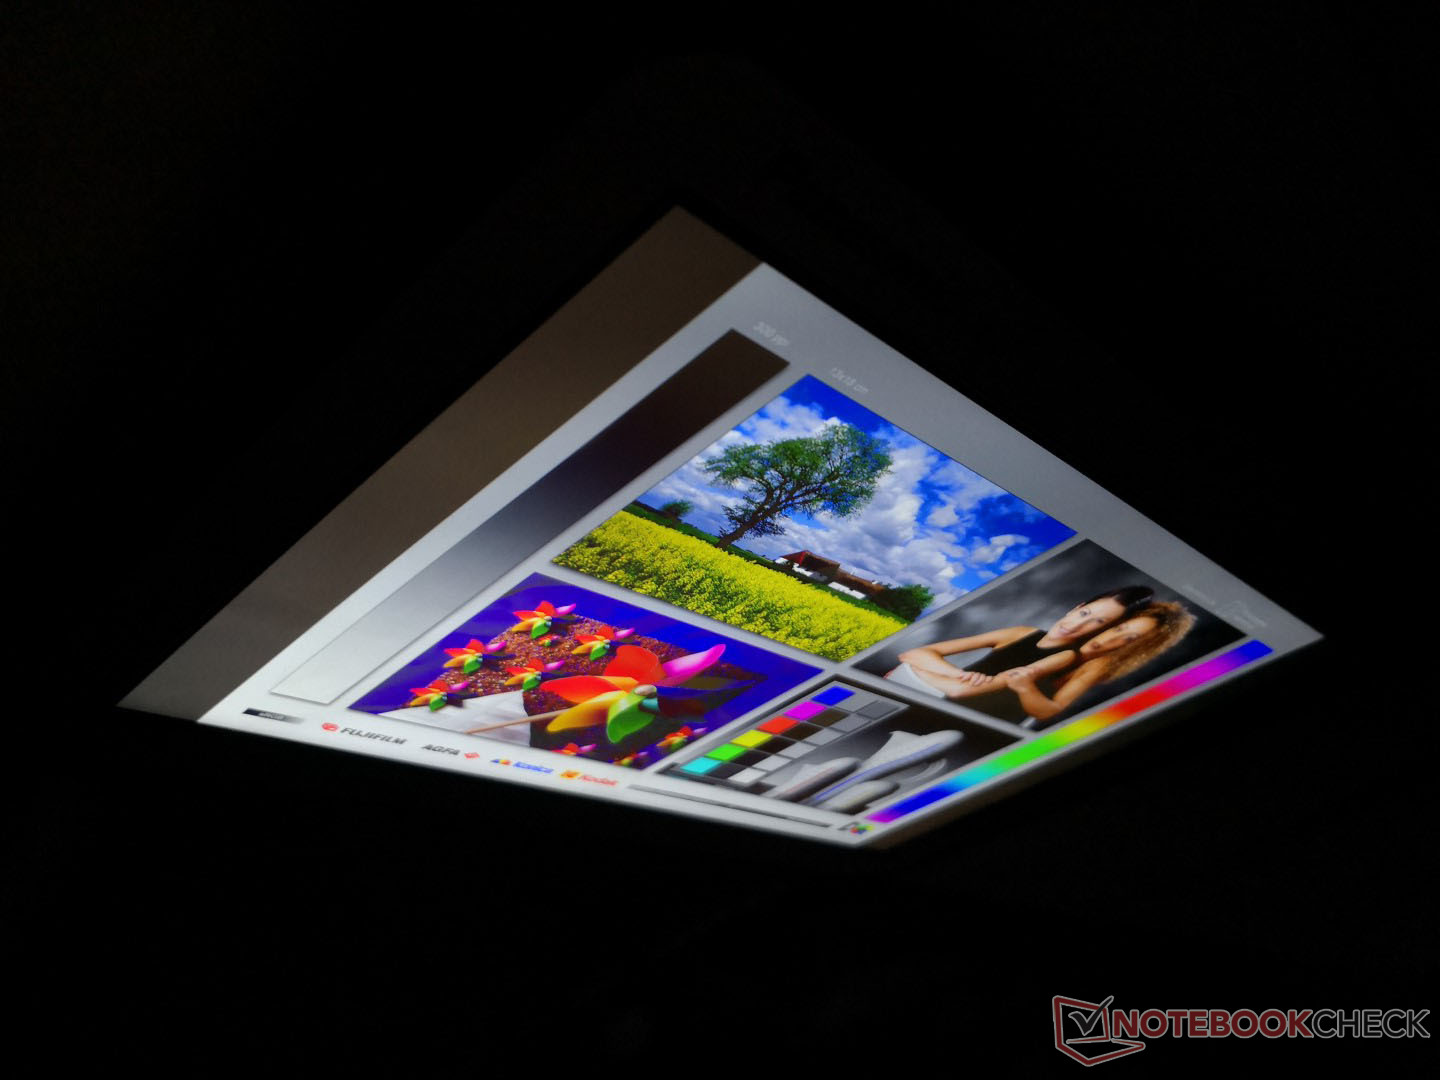
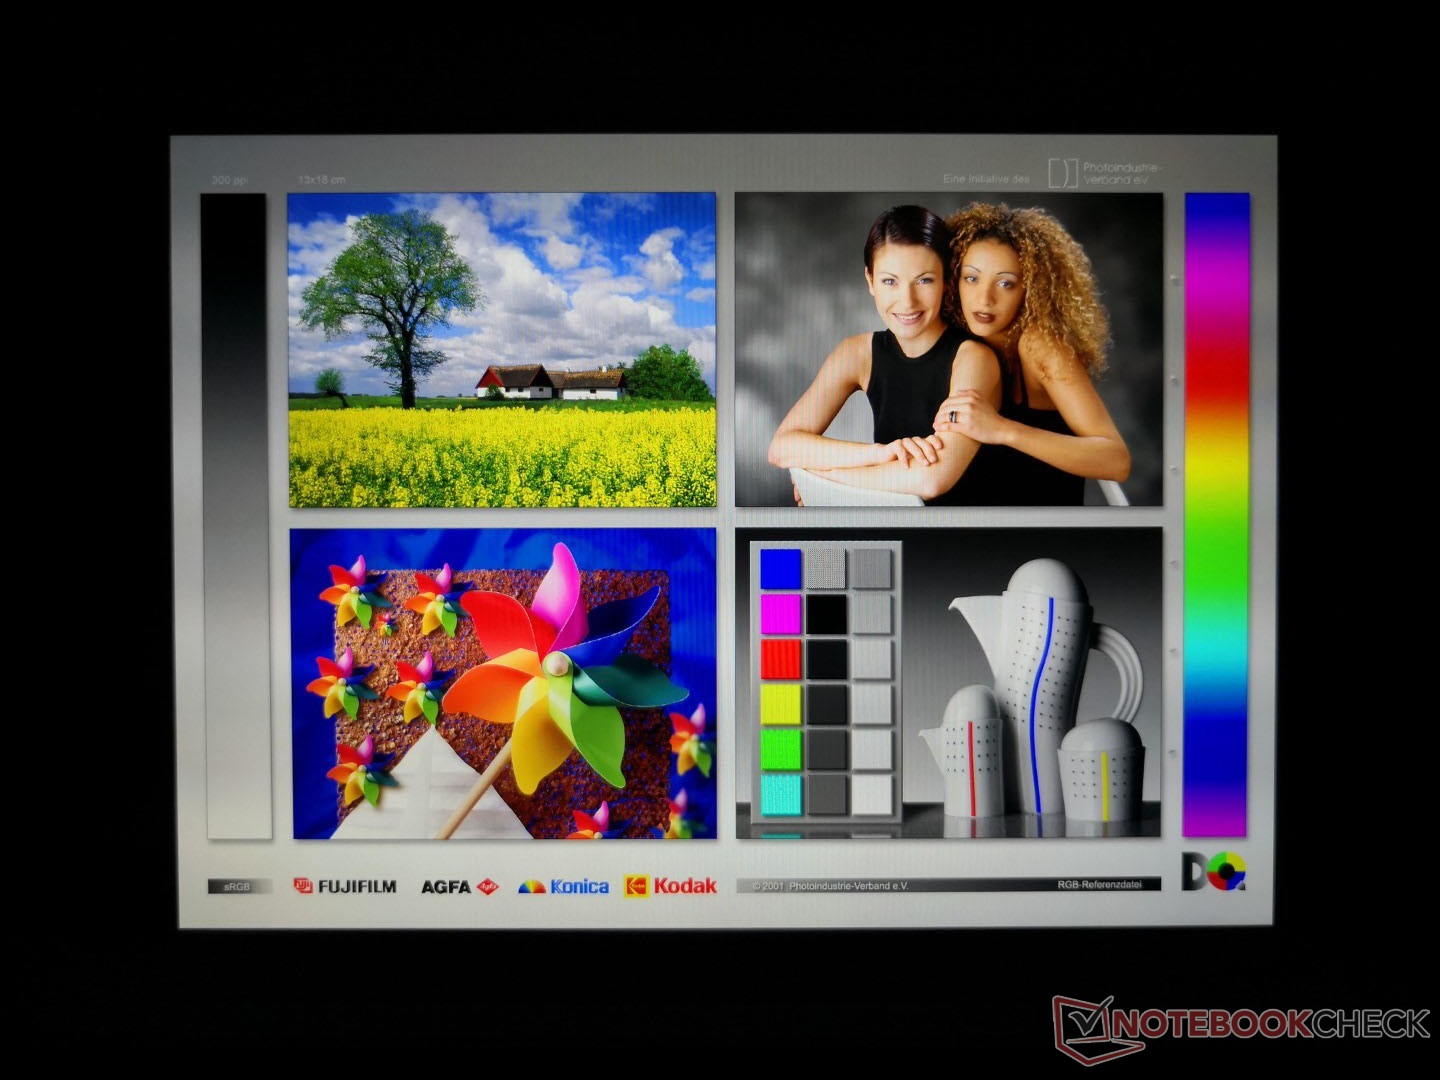
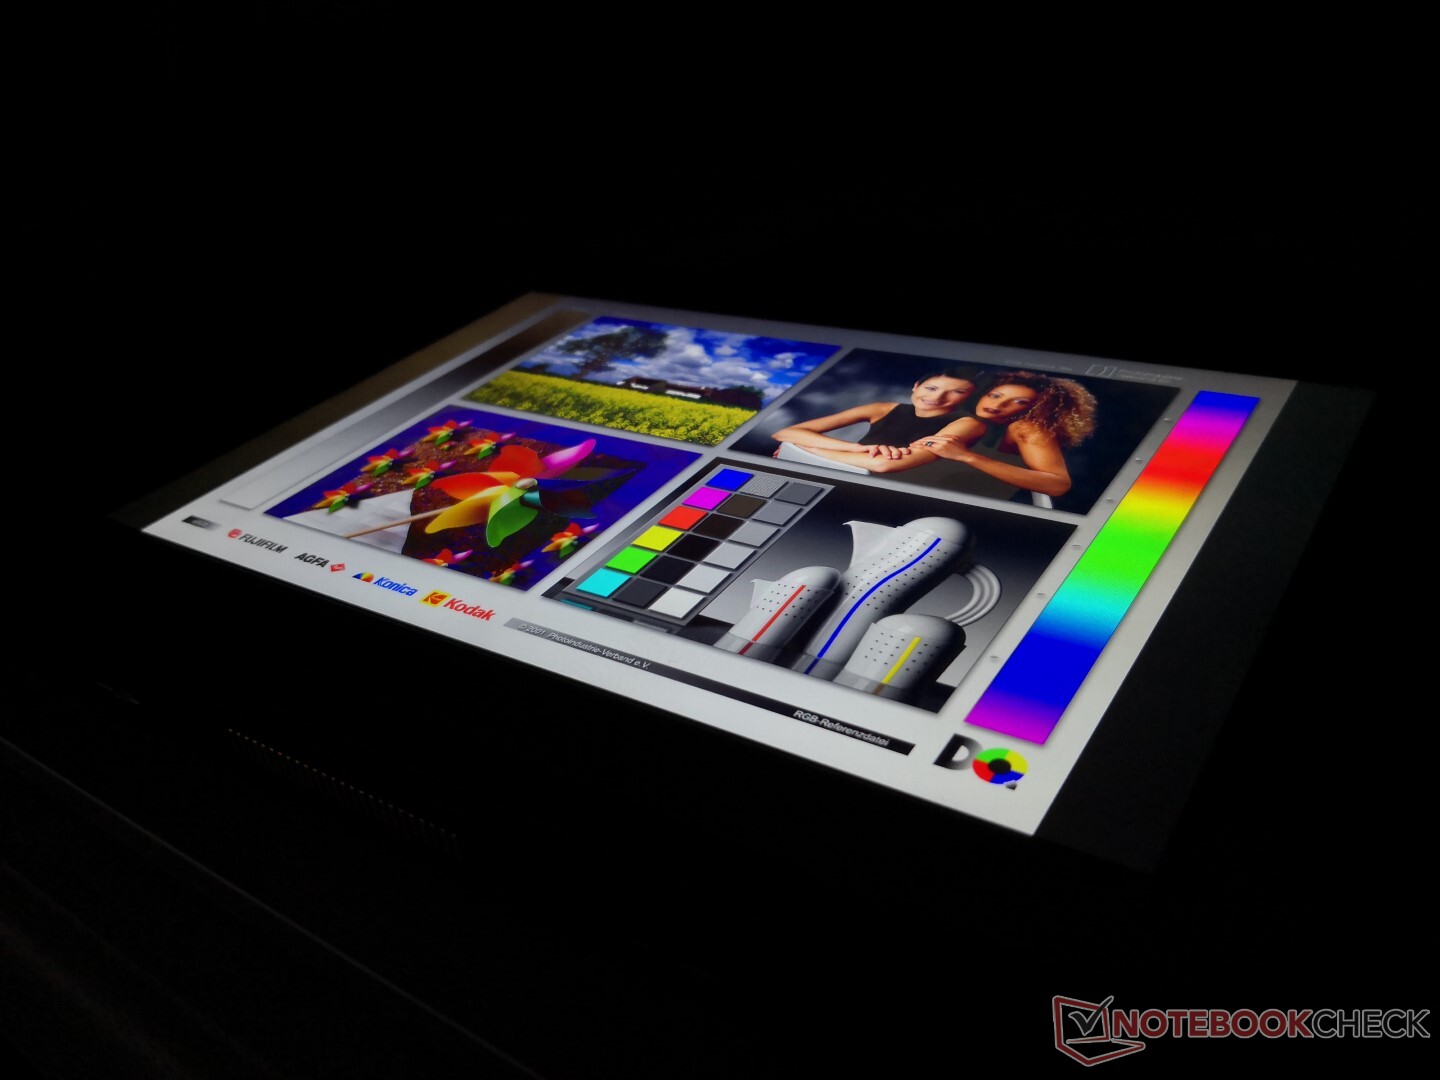
Display
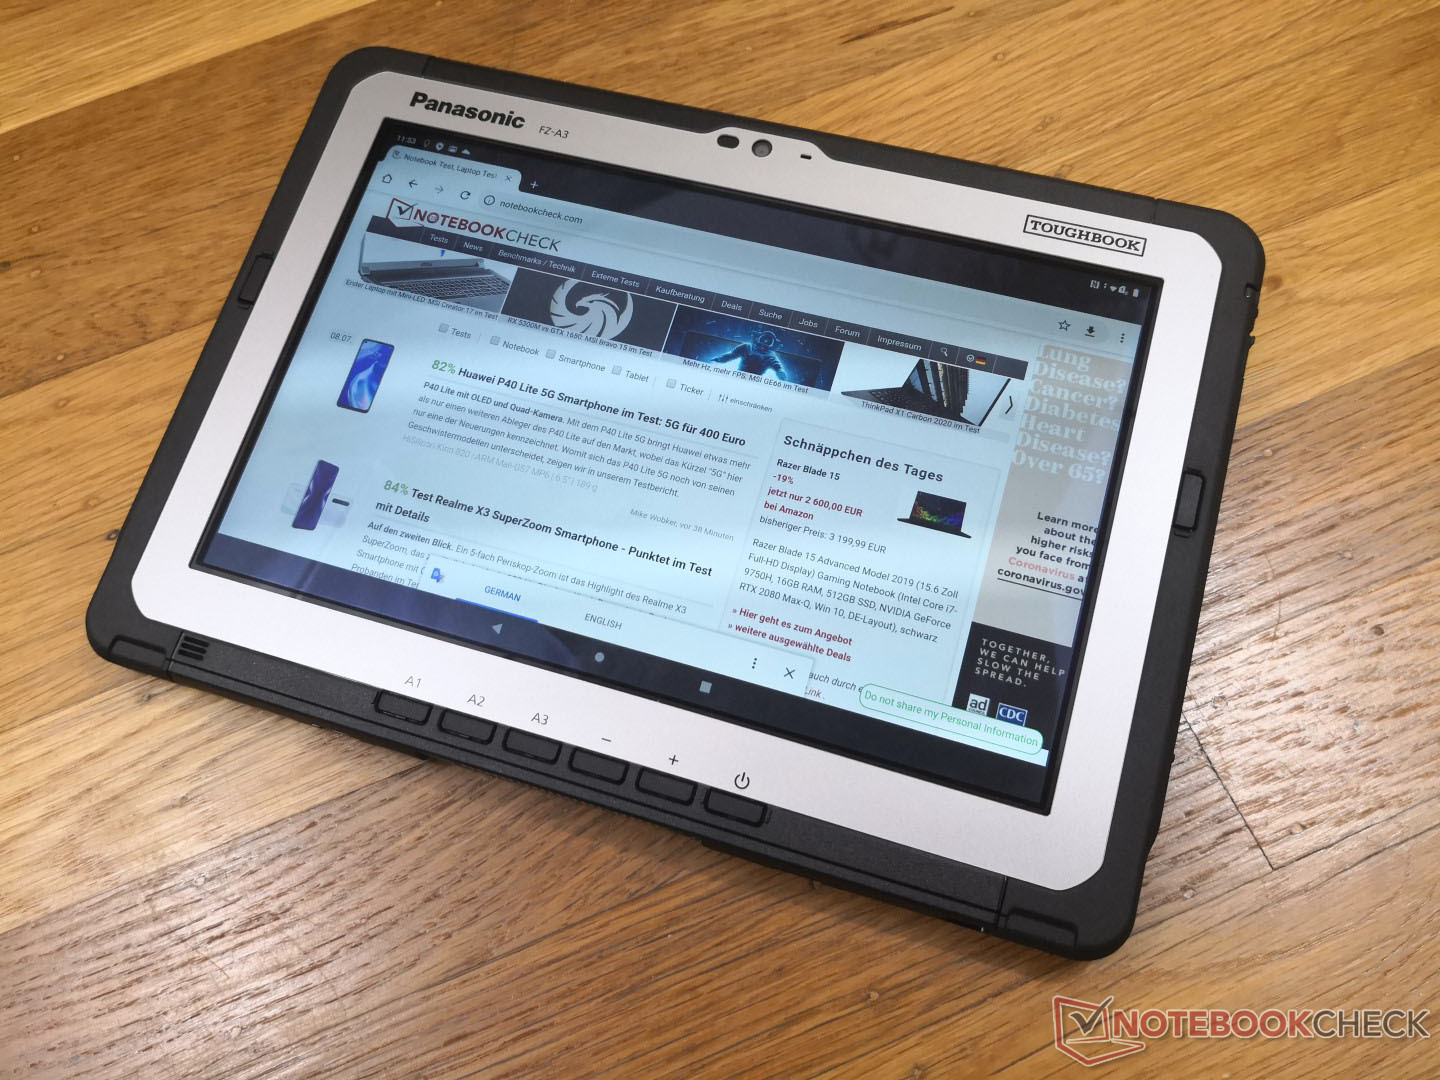
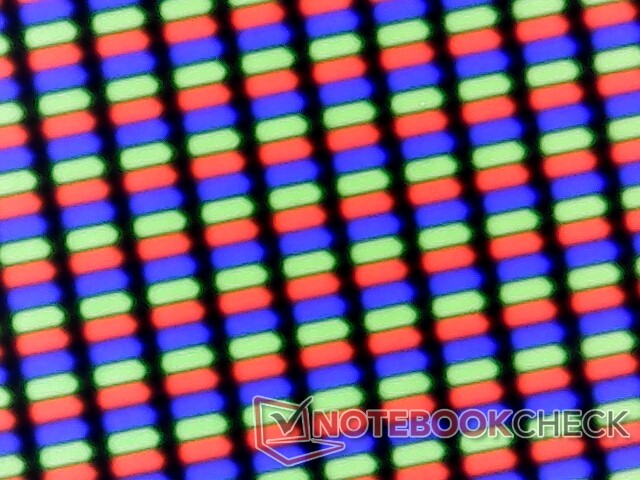
The display should be the highlight of any tablet and this remains true for the Toughbook FZ-A3. Unlike most other rugged tablets, the screen here is glossy for crisper texts and images that look much closer to what you'd see on an iPad or other consumer tablet. The bright 1000-nit backlight and high contrast ratio of about 1500:1 is an uncommon combination in this category.
Unfortunately, the display suffers from one major issue: pulse-width modulation. We're able to detect PWM on all brightness levels including the maximum setting. If your eyes are sensitive to flickering, then it may be best to avoid using this tablet regularly.
Officially, the specifications claim an 800-nit display although our colorimeter is measuring an average of 1060 nits. Results may vary between retail units.
| |||||||||||||||||||||||||
Brightness Distribution: 77 %
Center on Battery: 1078 cd/m²
Contrast: 1585:1 (Black: 0.68 cd/m²)
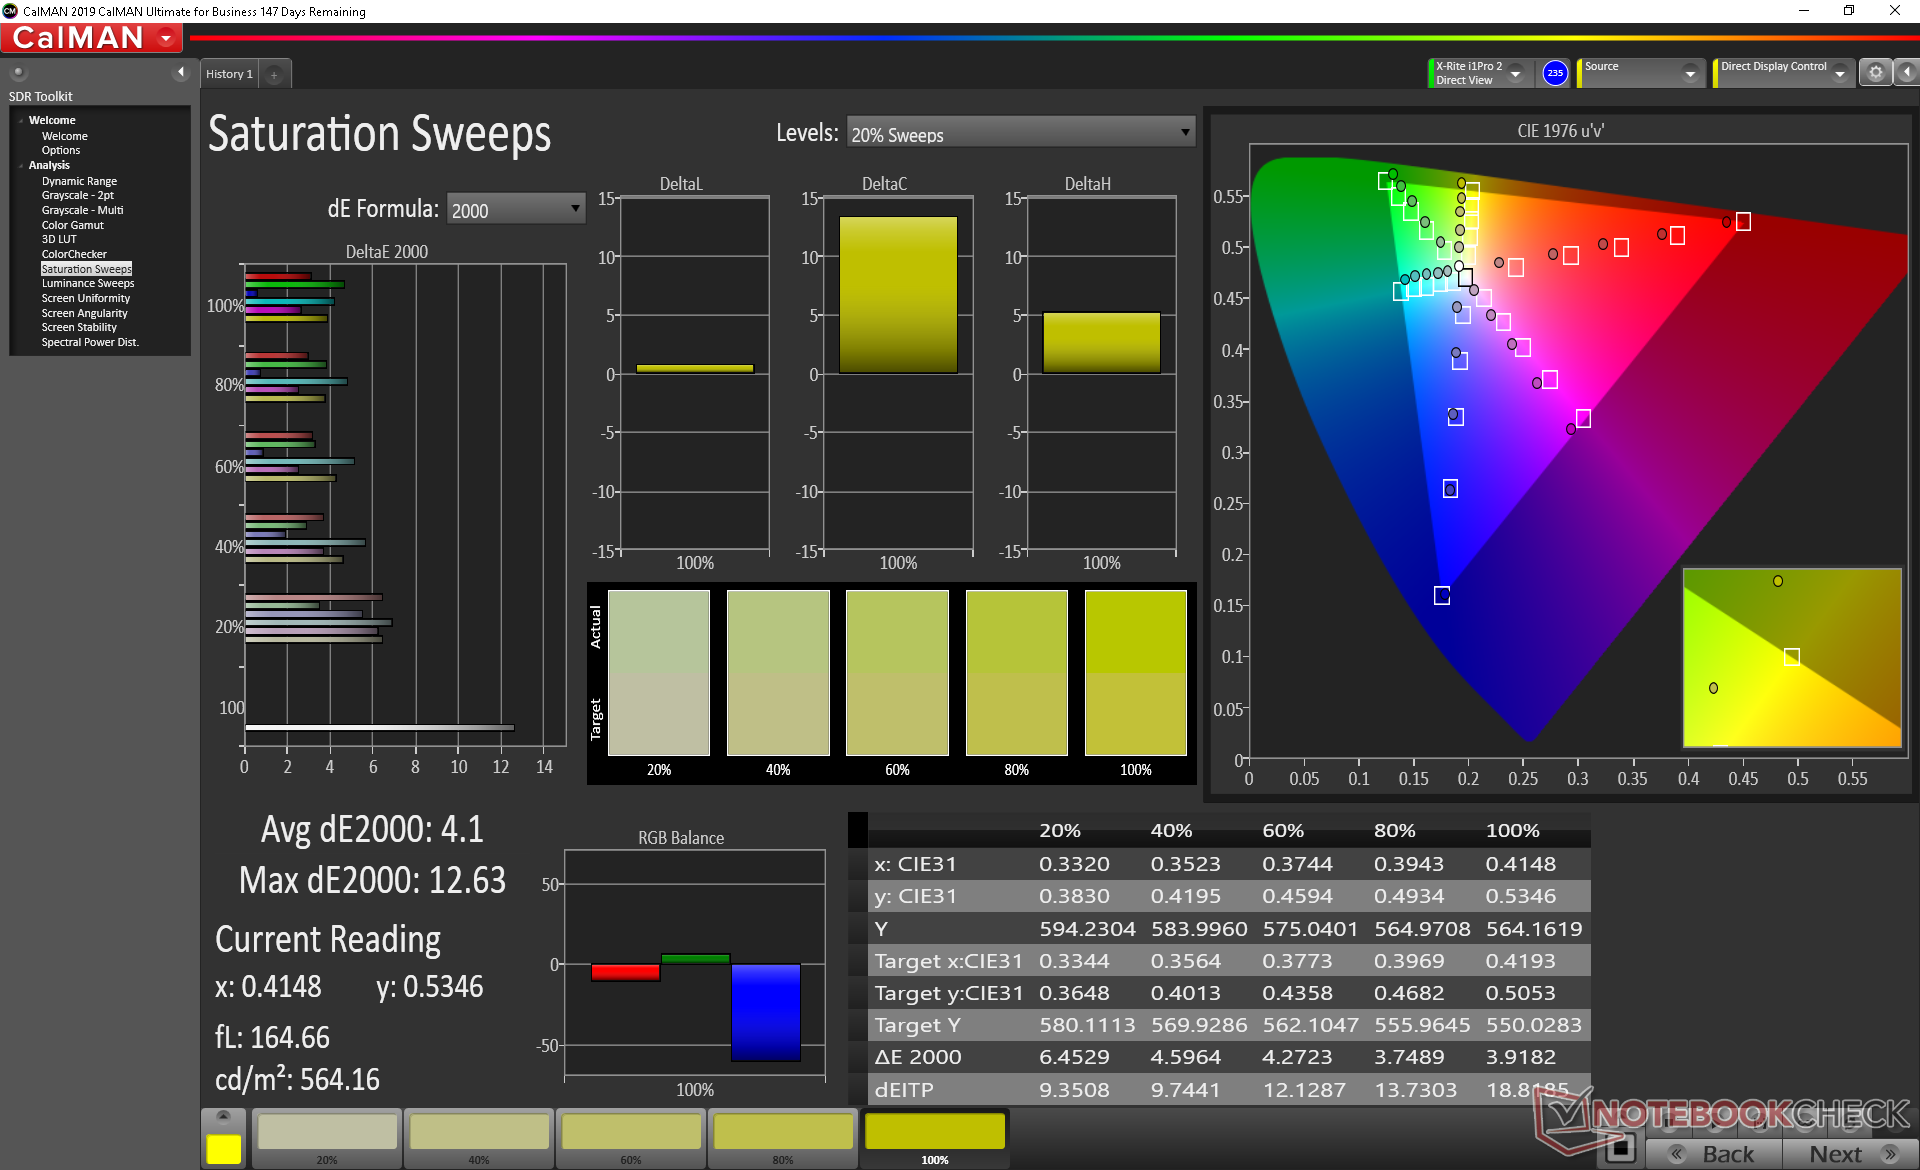
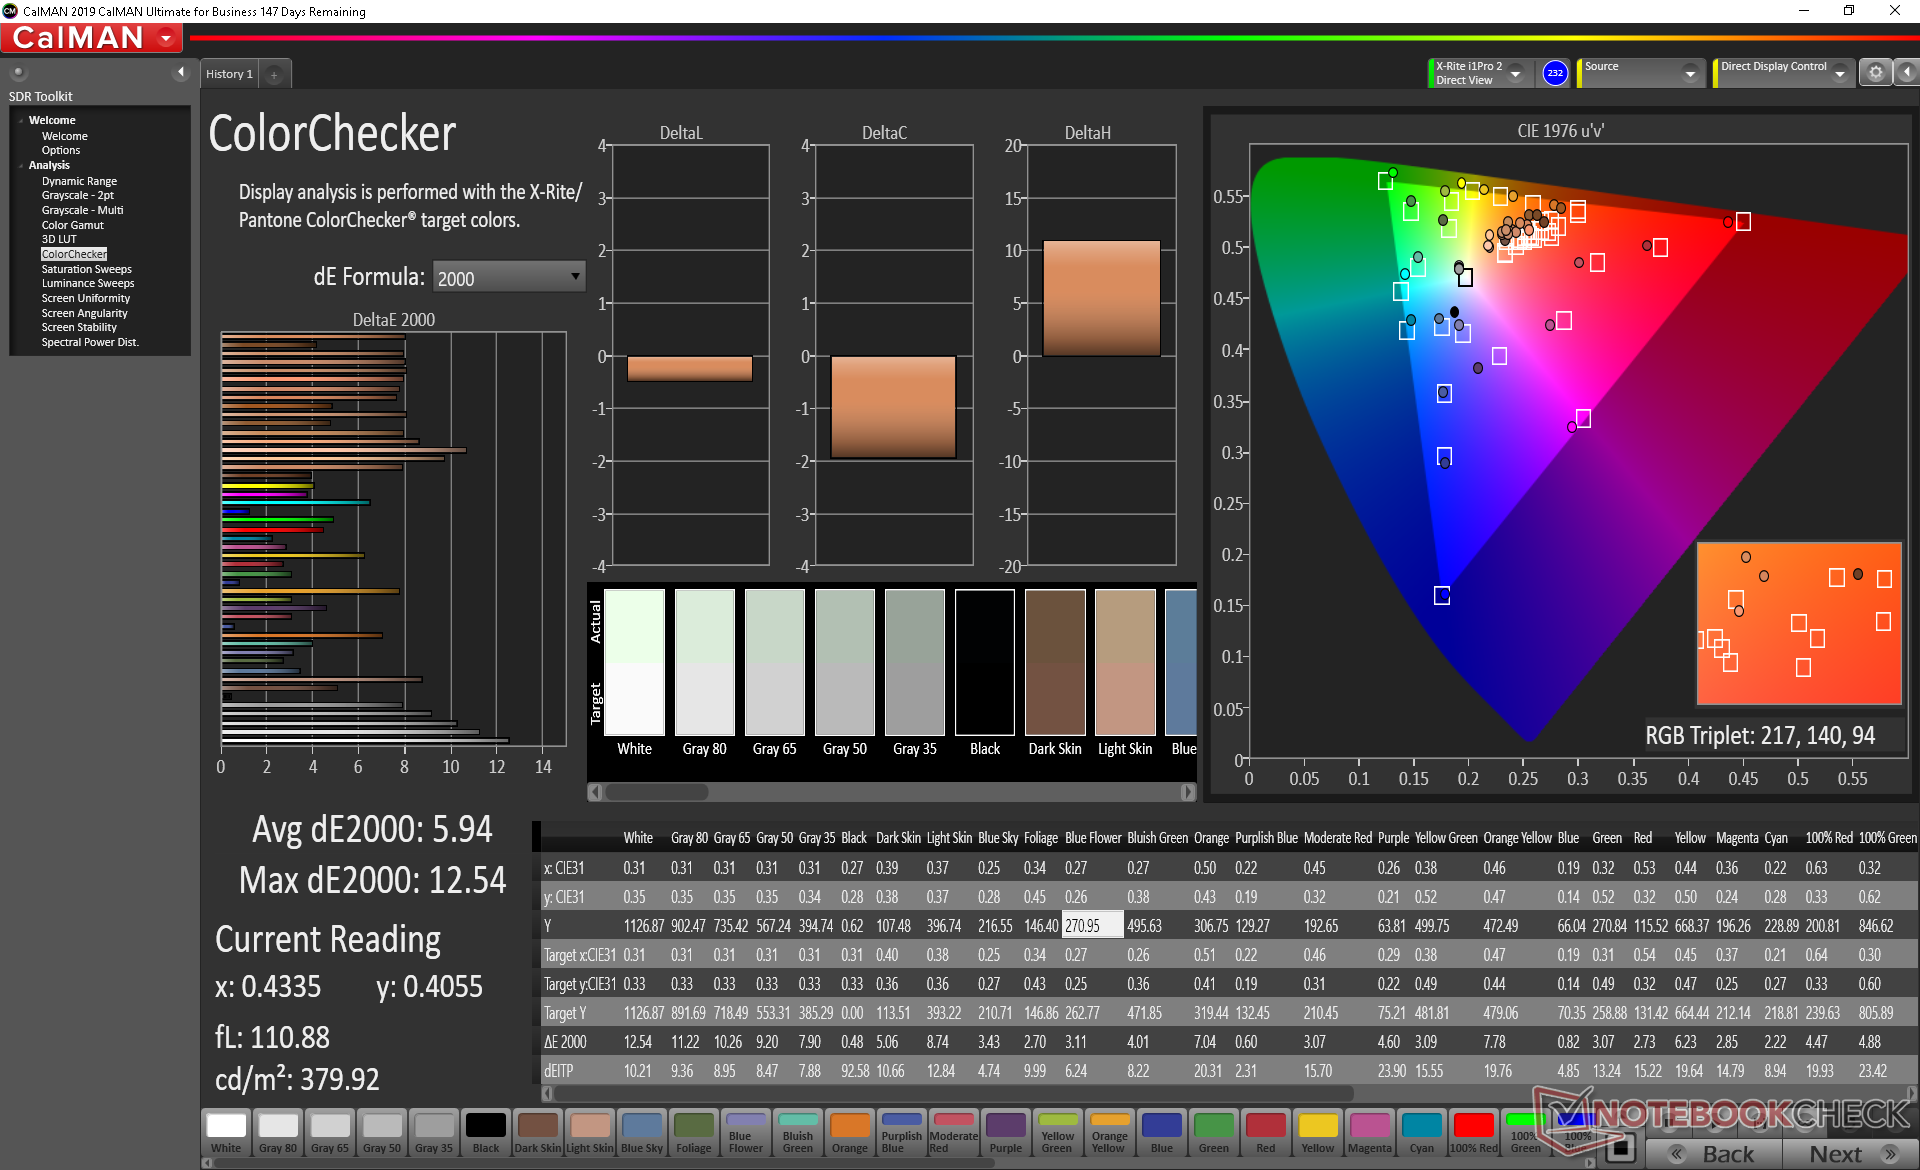
ΔE Color 5.94 | 0.5-29.43 Ø5
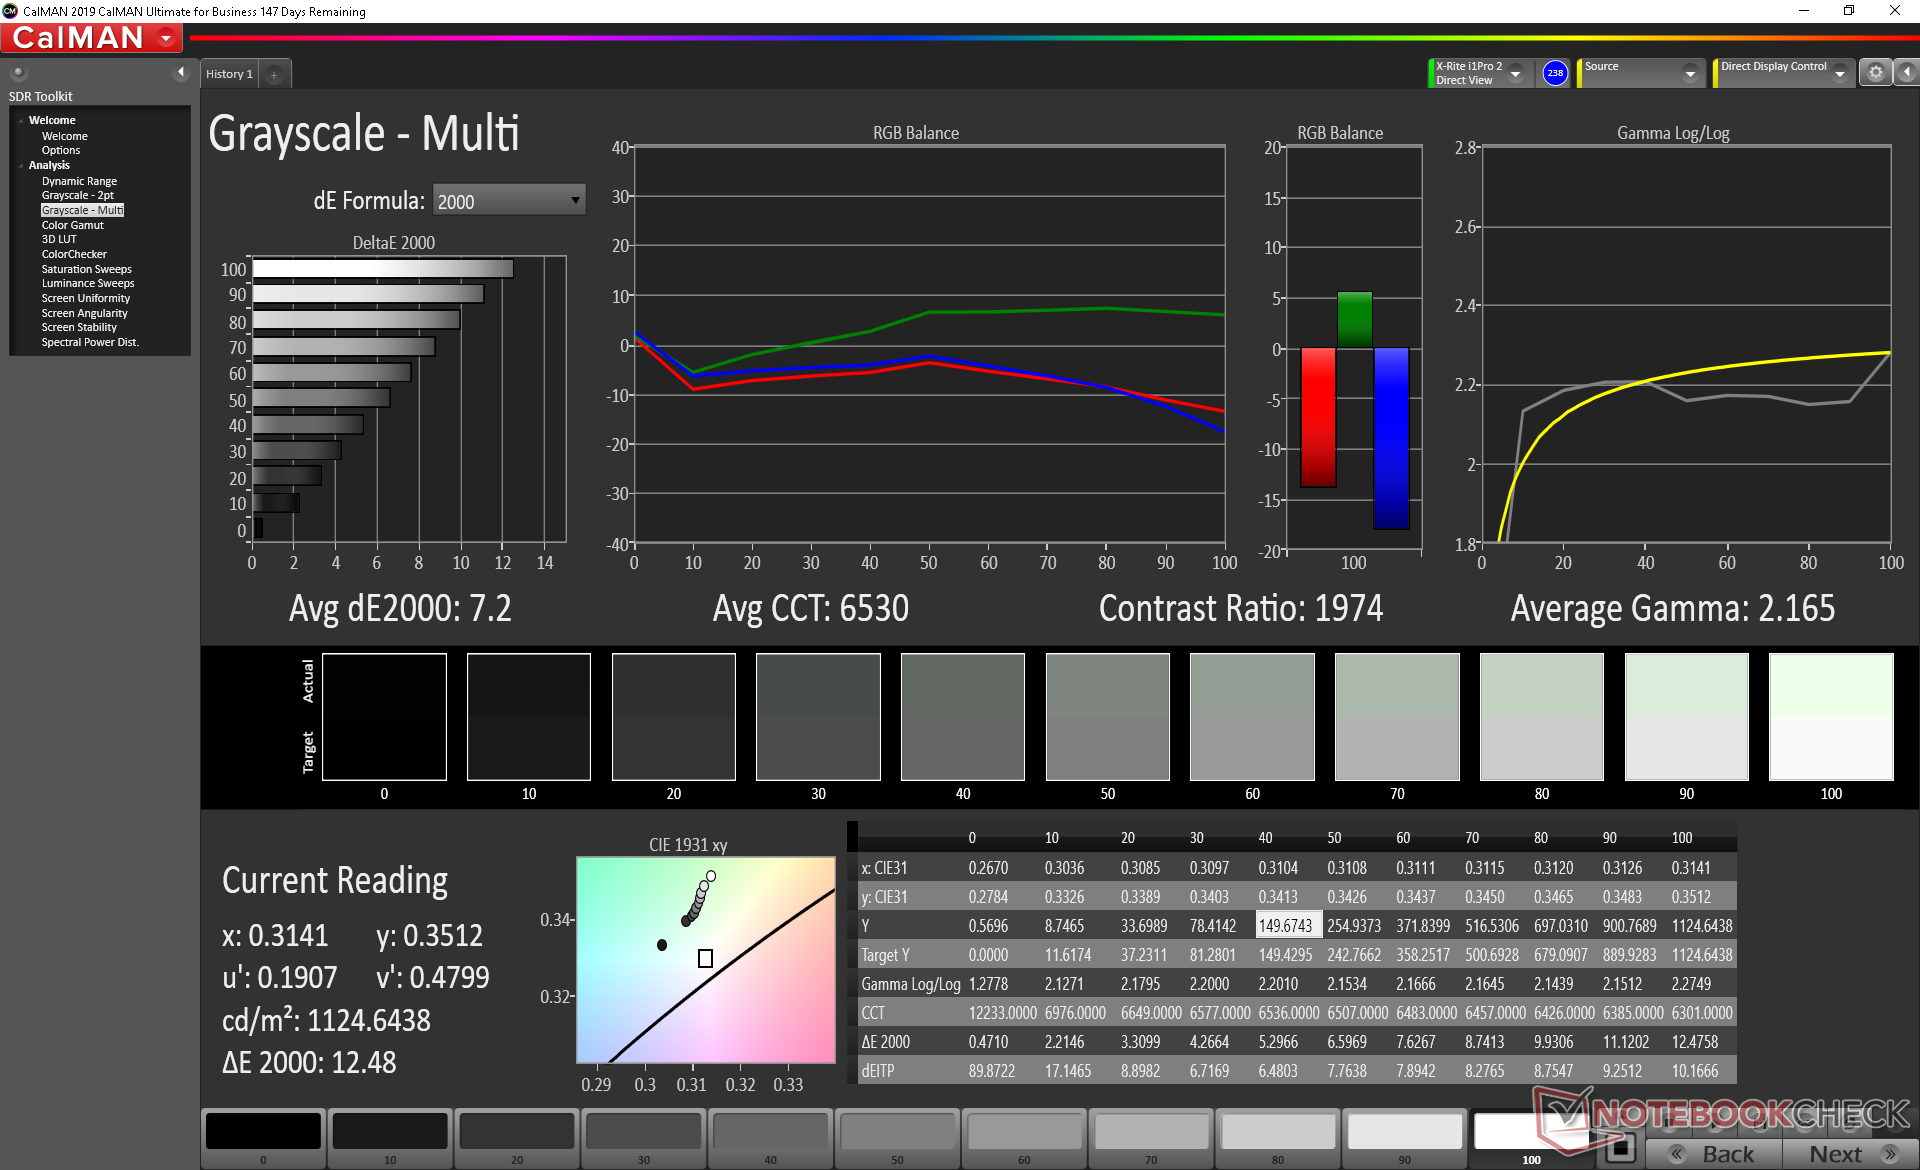
ΔE Greyscale 7.2 | 0.57-98 Ø5.3
Gamma: 2.17
| Panasonic Toughbook FZ-A3 IPS, 10.10, 1920x1200 | Samsung Galaxy Tab Active Pro T545 TFT, 10.10, 1920x1200 | Xploretech XSLATE L10 IPS, 10.10, 1920x1200 | Durabook R11 BOE5F9, IPS, 11.60, 1920x1080 | Dell Latitude 12 Rugged Tablet Sharp SHP1417 LQ116K1, TN, 11.60, 1366x768 | Apple iPad Pro 11 2020 Liquid Retina Display, IPS, 11.00, 2388x1668 | |
|---|---|---|---|---|---|---|
| Display | ||||||
| Display P3 Coverage | 45.72 | 59.3 | 36.06 | |||
| sRGB Coverage | 68.1 | 82.9 | 54 | |||
| AdobeRGB 1998 Coverage | 47.29 | 60 | 37.29 | |||
| Response Times | 10529% | 28% | 33% | 204% | ||
| Response Time Grey 50% / Grey 80% * | 54 ? | 55.2 ? -2% | 32.8 ? 39% | 26 ? 52% | 52 ? 4% | |
| Response Time Black / White * | 34 ? | 23.2 ? 32% | 20 ? 41% | 18.4 ? 46% | 24 ? 29% | |
| PWM Frequency | 193.8 ? | 61350 ? 31556% | 200 ? 3% | 198.4 ? 2% | 1316 579% | |
| Screen | 7% | -15% | -27% | -30% | 28% | |
| Brightness middle | 1078 | 601 -44% | 1145.9 6% | 584.2 -46% | 632 -41% | 617 -43% |
| Brightness | 1060 | 554 -48% | 1090 3% | 560 -47% | 613 -42% | 585 -45% |
| Brightness Distribution | 77 | 87 13% | 88 14% | 79 3% | 90 17% | 84 9% |
| Black Level * | 0.68 | 0.67 1% | 1.13 -66% | 0.52 24% | 0.47 31% | 0.36 47% |
| Contrast | 1585 | 897 -43% | 1014 -36% | 1123 -29% | 1345 -15% | 1714 8% |
| Colorchecker dE 2000 * | 5.94 | 2.2 63% | 5.14 13% | 9.29 -56% | 11.22 -89% | 0.94 84% |
| Colorchecker dE 2000 max. * | 12.54 | 5.5 56% | 23.66 -89% | 14.43 -15% | 1.87 85% | |
| Greyscale dE 2000 * | 7.2 | 3.2 56% | 4.4 39% | 10.6 -47% | 12.19 -69% | 1.4 81% |
| Gamma | 2.17 101% | 2.26 97% | 2.25 98% | 2.41 91% | 3.4 65% | 2.156 102% |
| CCT | 6530 100% | 7129 91% | 6847 95% | 6230 104% | 1256 518% | 6733 97% |
| Colorchecker dE 2000 calibrated * | 5.06 | 4.72 | ||||
| Color Space (Percent of AdobeRGB 1998) | 42.8 | 53.4 | 35 | |||
| Color Space (Percent of sRGB) | 67.2 | 82.2 | 54 | |||
| Total Average (Program / Settings) | 5268% /
2876% | 7% /
-3% | 3% /
-10% | -30% /
-30% | 116% /
76% |
* ... smaller is better
Color temperature is on the cool side for a high average grayscale DeltaE value of 7.2. Color accuracy is pretty good, but it could have been better had the color temperature been warmer.
Display Response Times
| ↔ Response Time Black to White | ||
|---|---|---|
| 34 ms ... rise ↗ and fall ↘ combined | ↗ 17 ms rise | 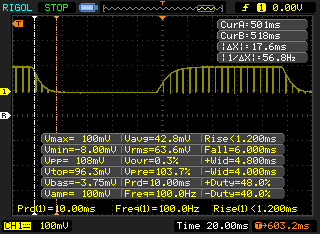 |
| ↘ 17 ms fall | ||
| The screen shows slow response rates in our tests and will be unsatisfactory for gamers. In comparison, all tested devices range from 0.1 (minimum) to 240 (maximum) ms. » 89 % of all devices are better. This means that the measured response time is worse than the average of all tested devices (21.5 ms). | ||
| ↔ Response Time 50% Grey to 80% Grey | ||
| 54 ms ... rise ↗ and fall ↘ combined | ↗ 27 ms rise | 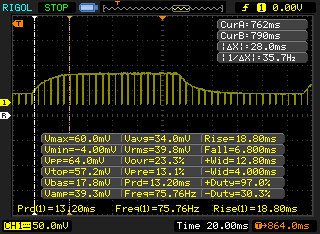 |
| ↘ 27 ms fall | ||
| The screen shows slow response rates in our tests and will be unsatisfactory for gamers. In comparison, all tested devices range from 0.2 (minimum) to 636 (maximum) ms. » 89 % of all devices are better. This means that the measured response time is worse than the average of all tested devices (33.7 ms). | ||
Screen Flickering / PWM (Pulse-Width Modulation)
| Screen flickering / PWM detected | 193.8 Hz | ≤ 100 % brightness setting | 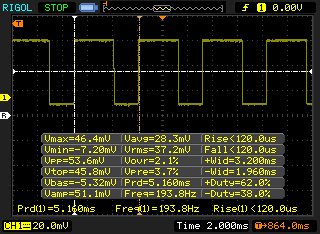 |
The display backlight flickers at 193.8 Hz (worst case, e.g., utilizing PWM) Flickering detected at a brightness setting of 100 % and below. There should be no flickering or PWM above this brightness setting. The frequency of 193.8 Hz is relatively low, so sensitive users will likely notice flickering and experience eyestrain at the stated brightness setting and below. In comparison: 53 % of all tested devices do not use PWM to dim the display. If PWM was detected, an average of 17900 (minimum: 5 - maximum: 3846000) Hz was measured. | |||
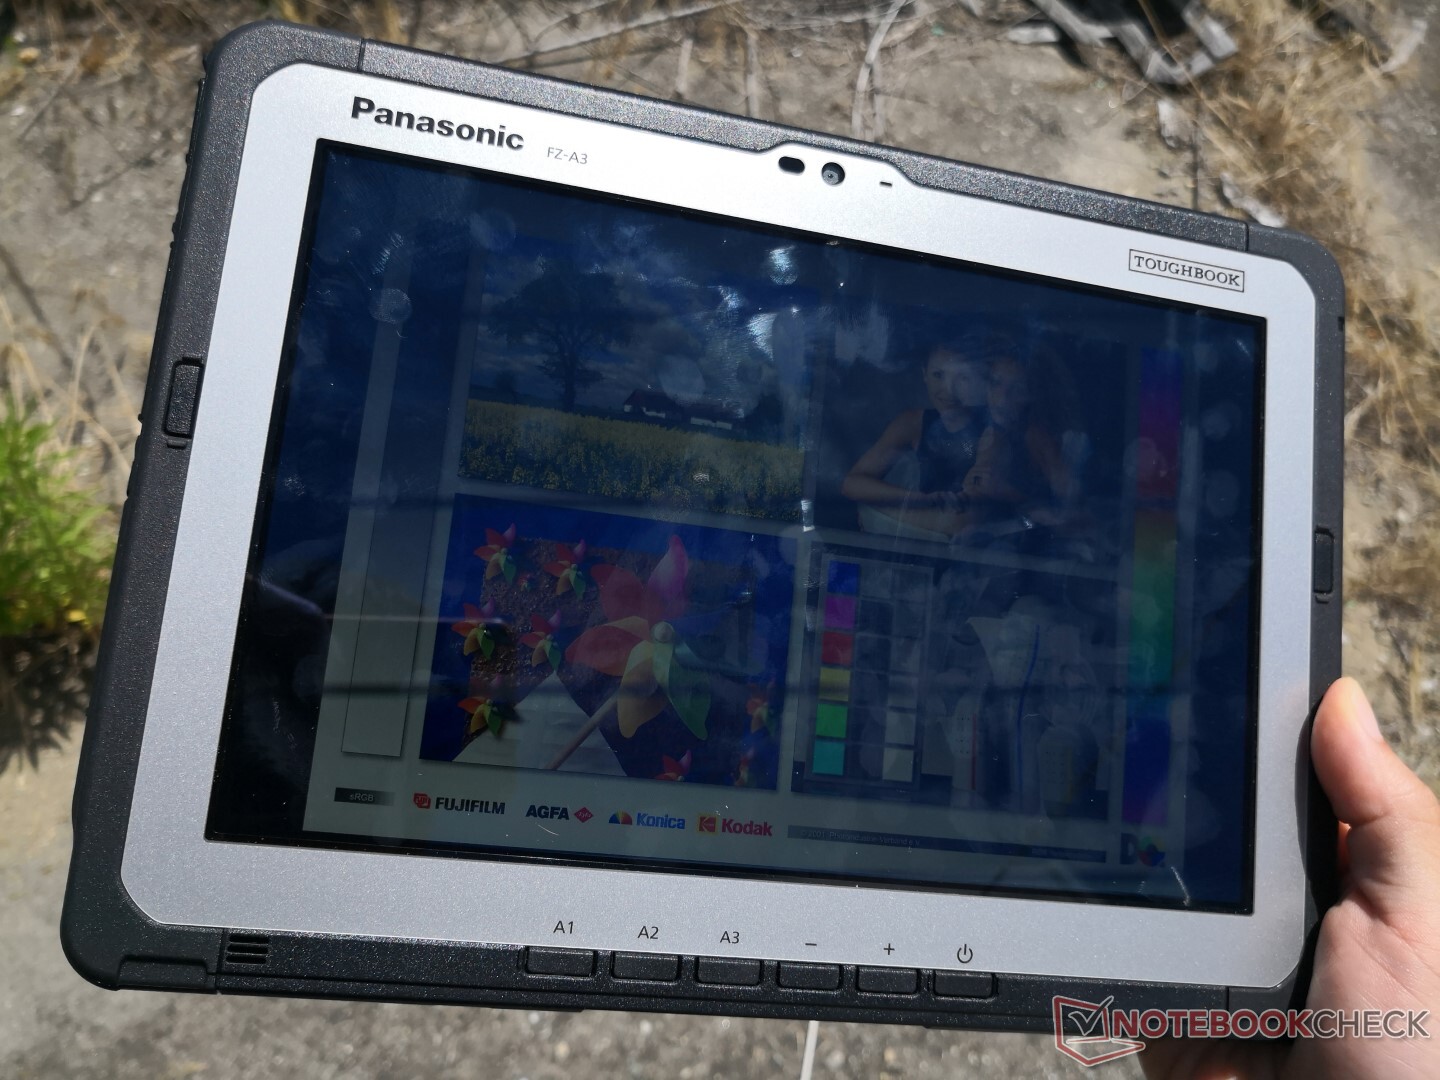
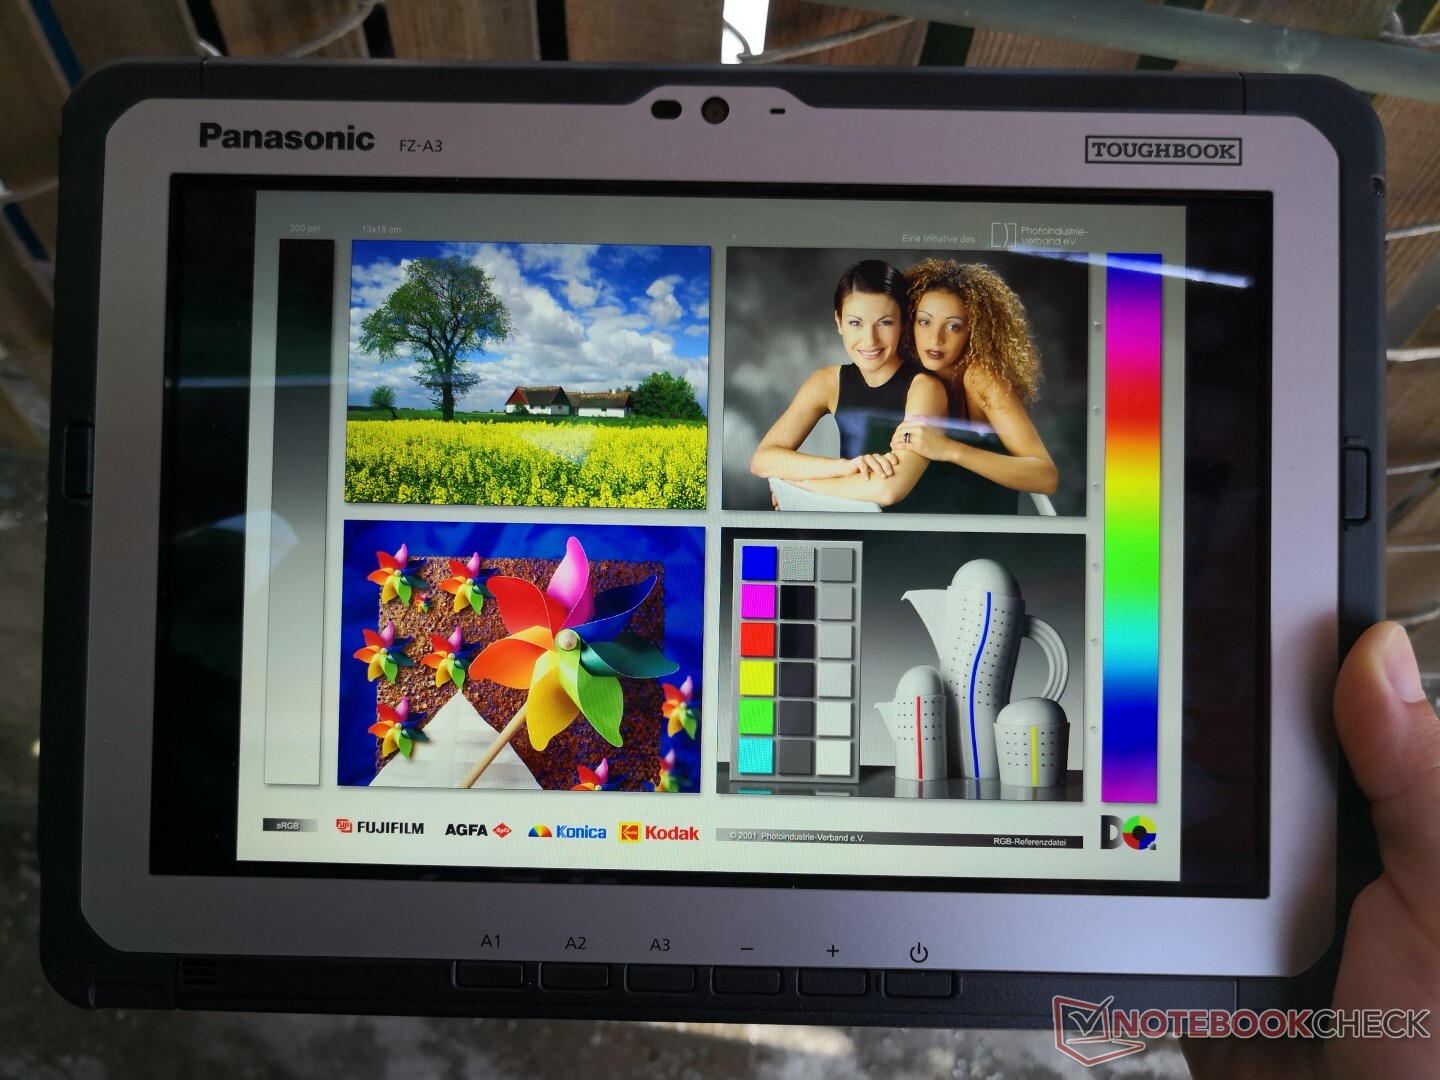
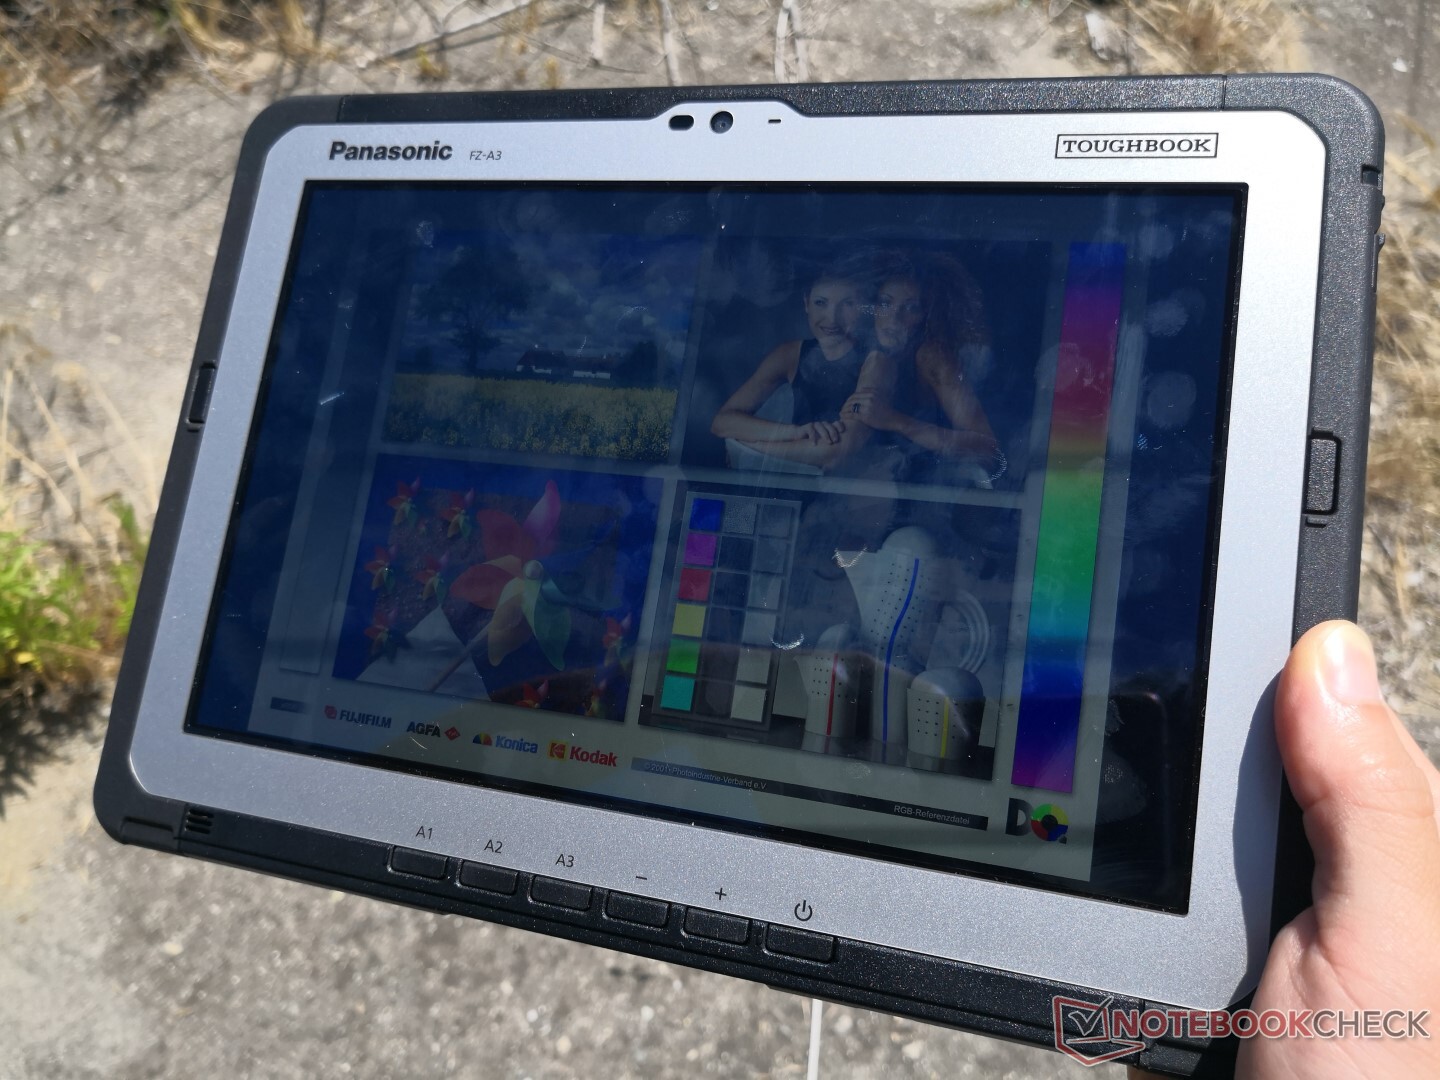
Outdoor visibility is good when under direct sunlight and even better when under shade. Set the screen to its maximum brightness to reduce the inevitable glare from the glossy screen and fingerprints.
Performance
Processor
Raw CPU performance according to synthetic benchmarks is roughly between that of the mid-range Snapdragon 665 and Snapdragon 670. However, such benchmarks have little significance to most users. Subjectively, system performance is smooth most of the time with some occasional frame skips when switching between applications or scrolling through web pages.
Storage Devices
64 GB of eMMC 5.1 storage comes standard with a MicroSD expansion slot. Transfer rates are comparable to the consumer-centric Samsung Galaxy and Lenovo Yoga tablets.
| Panasonic Toughbook FZ-A3 64 GB eMMC Flash | Samsung Galaxy Tab Active Pro T545 64 GB eMMC Flash | Lenovo Tab M8 HD 32 GB eMMC Flash | Huawei MatePad Pro 10.8 256 GB UFS 3.0 Flash | Lenovo Yoga Smart Tab YT-X705F 64 GB eMMC Flash | Trekstor Surftab Theatre S11 32 GB eMMC Flash | Alldocube M8 T801 32 GB eMMC Flash | |
|---|---|---|---|---|---|---|---|
| AndroBench 3-5 | -2% | -11% | 375% | 1% | -27% | -54% | |
| Sequential Write 256KB | 203.7 | 207.5 2% | 79.6 -61% | 399 96% | 238.9 17% | 107.6 -47% | 103 -49% |
| Sequential Read 256KB | 287.6 | 294.5 2% | 297.1 3% | 1789 522% | 295.6 3% | 158.8 -45% | 142.8 -50% |
| Random Write 4KB | 16.97 | 18.75 10% | 15.84 -7% | 262.4 1446% | 16.76 -1% | 15.98 -6% | 10.01 -41% |
| Random Read 4KB | 83.4 | 71.2 -15% | 77.4 -7% | 224.6 169% | 64.8 -22% | 28.93 -65% | 19.5 -77% |
| Sequential Write 256KB SDCard | 61.3 | 60.6 -1% | 64.3 5% | 71.7 17% | 65.4 7% | 61.9 1% | |
| Sequential Read 256KB SDCard | 84.6 | 75.9 -10% | 83.8 -1% | 82.4 -3% | 86.5 2% | 86.6 2% |
Emissions
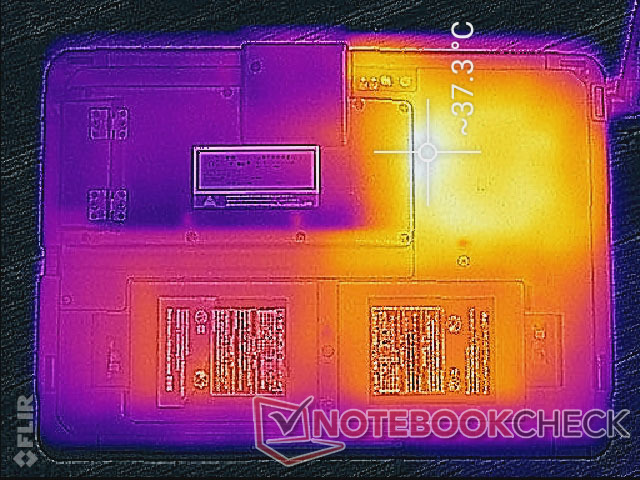
Temperature
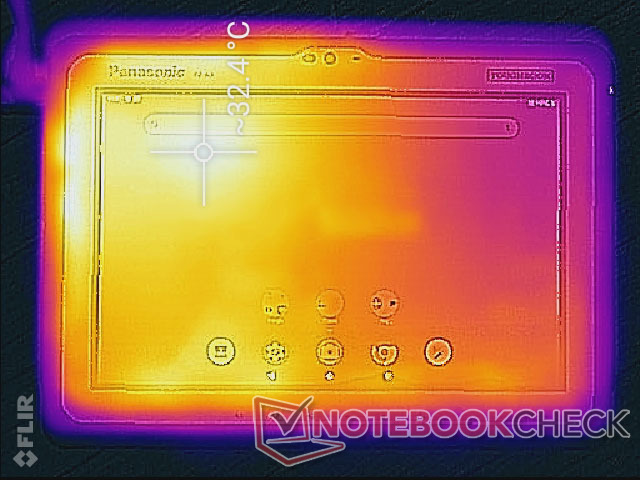
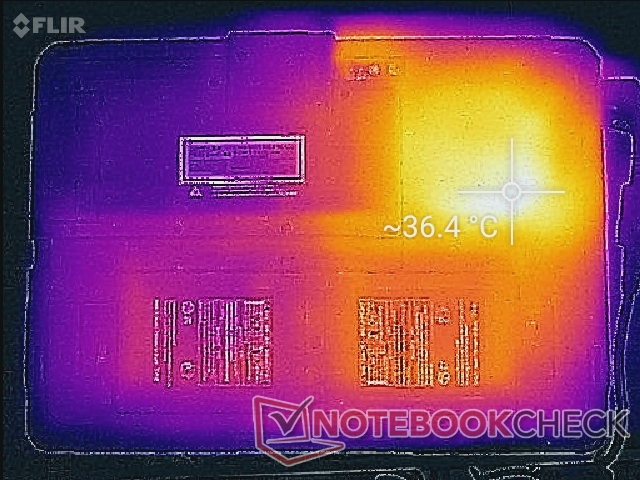
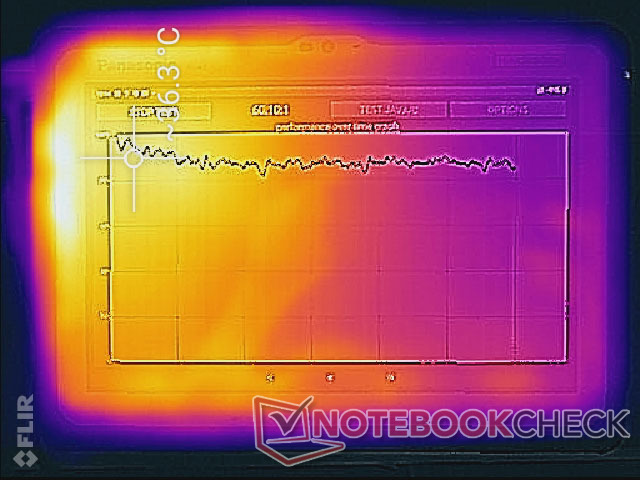
Hot spots are closer to the top left of the tablet as shown by the temperature maps below likely because the processor and circuitry are positioned here. At worst, this area can reach about 38 C when running extreme processing loads for over an hour. Surfaces never become uncomfortable warm.
(+) The maximum temperature on the upper side is 37.6 °C / 100 F, compared to the average of 33.8 °C / 93 F, ranging from 20.7 to 53.2 °C for the class Tablet.
(+) The bottom heats up to a maximum of 36.4 °C / 98 F, compared to the average of 33.3 °C / 92 F
(+) In idle usage, the average temperature for the upper side is 29.7 °C / 85 F, compared to the device average of 30 °C / 86 F.
Speakers
A speaker near the bottom left corner provides mono audio. Bass is lacking, of course, but maximum volume is sufficiently loud at about 90 dB(A).
Panasonic Toughbook FZ-A3 audio analysis
(+) | speakers can play relatively loud (90.2 dB)
Bass 100 - 315 Hz
(-) | nearly no bass - on average 26.8% lower than median
(±) | linearity of bass is average (7.5% delta to prev. frequency)
Mids 400 - 2000 Hz
(+) | balanced mids - only 2% away from median
(+) | mids are linear (5.2% delta to prev. frequency)
Highs 2 - 16 kHz
(±) | higher highs - on average 7.1% higher than median
(±) | linearity of highs is average (7.6% delta to prev. frequency)
Overall 100 - 16.000 Hz
(±) | linearity of overall sound is average (18.1% difference to median)
Compared to same class
» 36% of all tested devices in this class were better, 9% similar, 55% worse
» The best had a delta of 7%, average was 23%, worst was 129%
Compared to all devices tested
» 33% of all tested devices were better, 8% similar, 59% worse
» The best had a delta of 4%, average was 25%, worst was 134%
Apple MacBook 12 (Early 2016) 1.1 GHz audio analysis
(+) | speakers can play relatively loud (83.6 dB)
Bass 100 - 315 Hz
(±) | reduced bass - on average 11.3% lower than median
(±) | linearity of bass is average (14.2% delta to prev. frequency)
Mids 400 - 2000 Hz
(+) | balanced mids - only 2.4% away from median
(+) | mids are linear (5.5% delta to prev. frequency)
Highs 2 - 16 kHz
(+) | balanced highs - only 2% away from median
(+) | highs are linear (4.5% delta to prev. frequency)
Overall 100 - 16.000 Hz
(+) | overall sound is linear (10.2% difference to median)
Compared to same class
» 5% of all tested devices in this class were better, 2% similar, 93% worse
» The best had a delta of 5%, average was 19%, worst was 53%
Compared to all devices tested
» 3% of all tested devices were better, 1% similar, 96% worse
» The best had a delta of 4%, average was 25%, worst was 134%
Energy Management
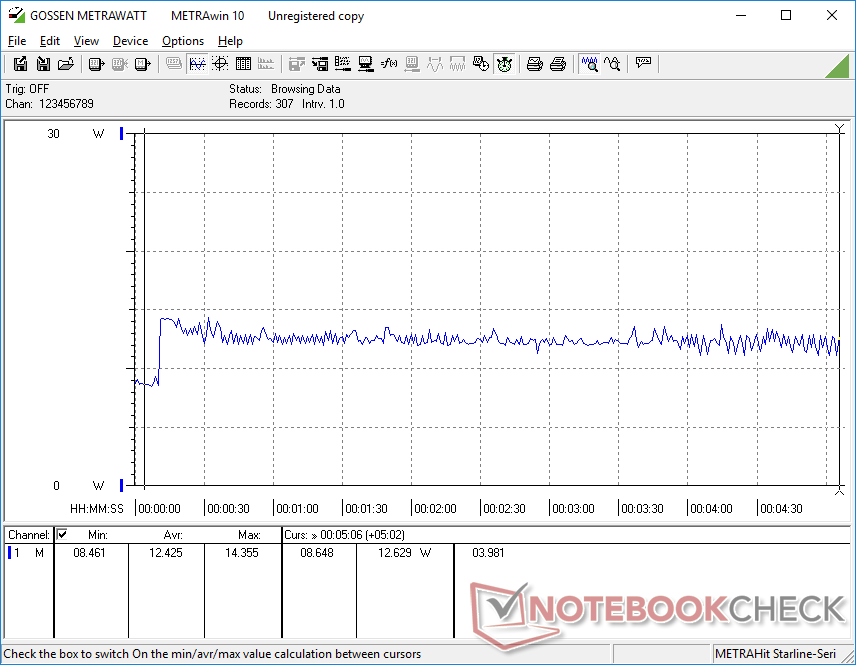
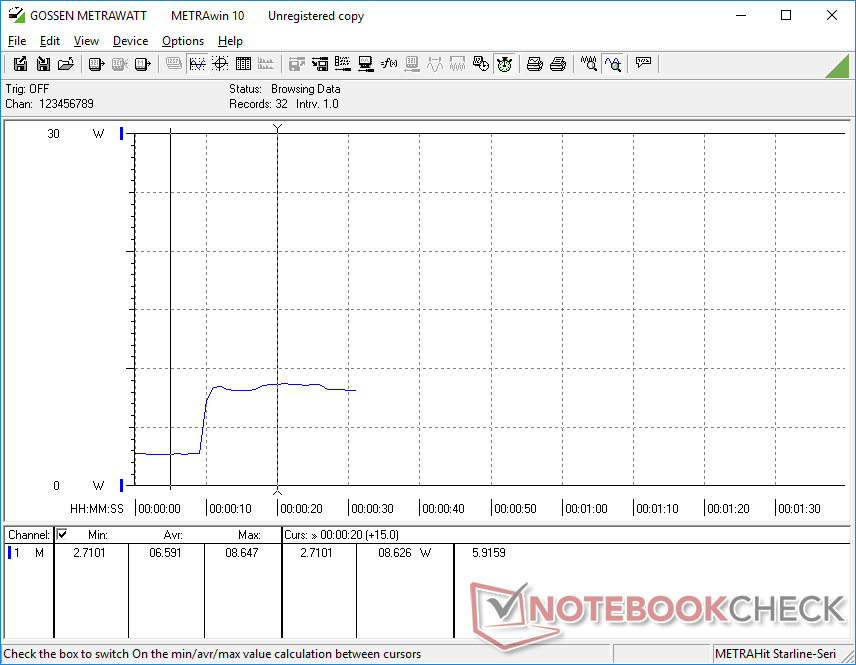
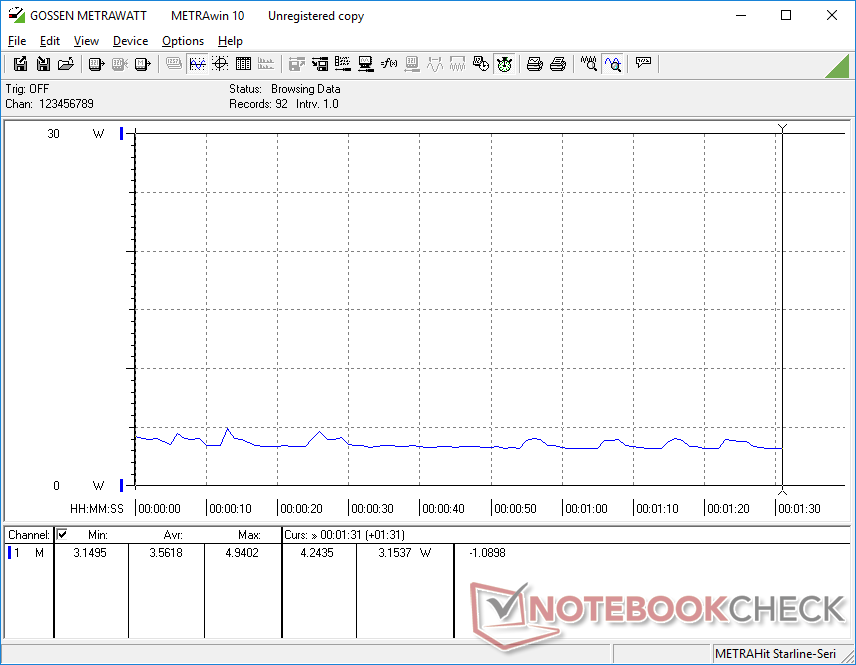
Power Consumption
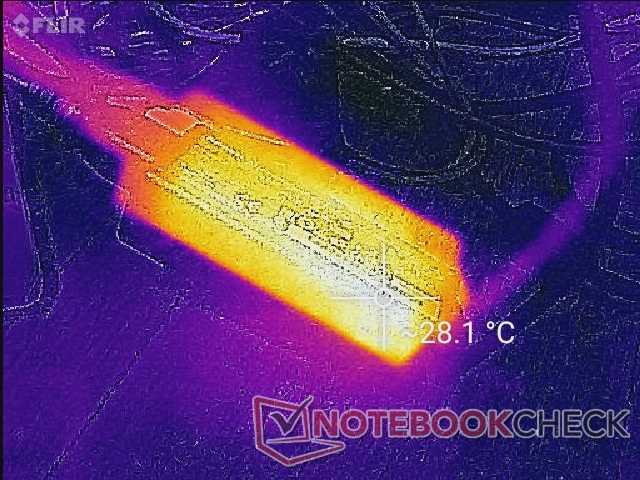
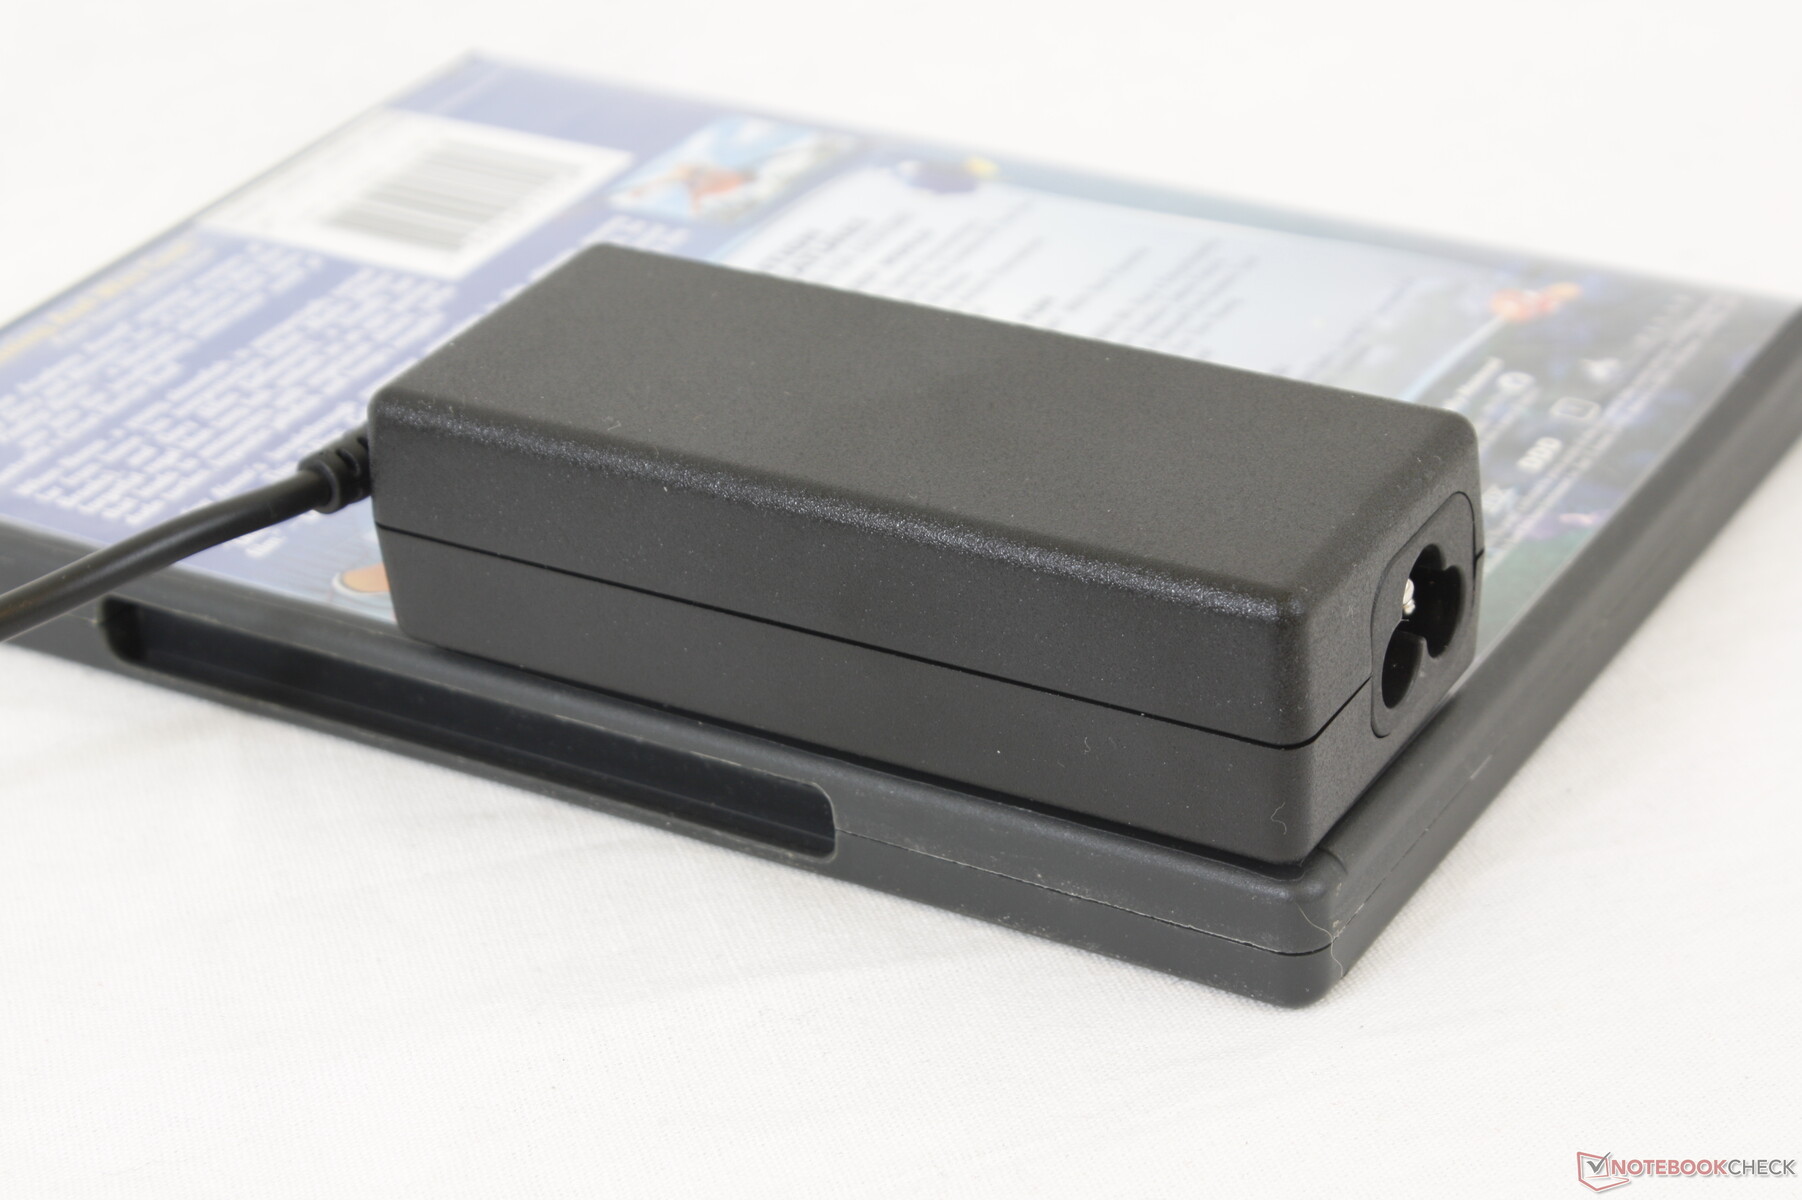
Idling on the home screen demands just 3 W when on the minimum brightness setting to as much as 9 W when brightness is set to its highest. We're able to measure a maximum draw of 18.5 W from the small (~10 x 4.2 x 2.8 cm) 65 W AC adapter during extreme processing loads or during a cold boot when the software is being loaded.
We noticed an undesirable behavior on our unit. When on standby mode, the tablet would consume about 3.6 W even when the batteries are fully charged. Most tablets and laptops would consume just 1 W to 2 W when on standby or Sleep mode.
| Off / Standby | |
| Idle | |
| Load |
|
| Panasonic Toughbook FZ-A3 SD 660, Adreno 512, 64 GB eMMC Flash, IPS, 1920x1200, 10.10 | Samsung Galaxy Tab Active Pro T545 SD 670, Adreno 616, 64 GB eMMC Flash, TFT, 1920x1200, 10.10 | Xploretech XSLATE L10 Pentium N4200, HD Graphics 505, SanDisk SD8SN8U256G1122, IPS, 1920x1200, 10.10 | Durabook R11 i5-8250U, UHD Graphics 620, Kingston RBUSNS4180S3128GJ, IPS, 1920x1080, 11.60 | Dell Latitude 12 Rugged Tablet 5Y71, HD Graphics 5300, Liteon L8H-128V2G M.2 2280, TN, 1366x768, 11.60 | |
|---|---|---|---|---|---|
| Power Consumption | 49% | -32% | -131% | -21% | |
| Idle Minimum * | 2.9 | 1.34 54% | 3.7 -28% | 6.1 -110% | 3.8 -31% |
| Idle Average * | 8.6 | 4.43 48% | 10.7 -24% | 11.7 -36% | 9.3 -8% |
| Idle Maximum * | 8.9 | 4.52 49% | 11 -24% | 11.9 -34% | 9.7 -9% |
| Load Average * | 9.4 | 5.91 37% | 17.8 -89% | 37.7 -301% | 16.3 -73% |
| Load Maximum * | 18.5 | 7.91 57% | 17.9 3% | 50.5 -173% | 15.9 14% |
* ... smaller is better
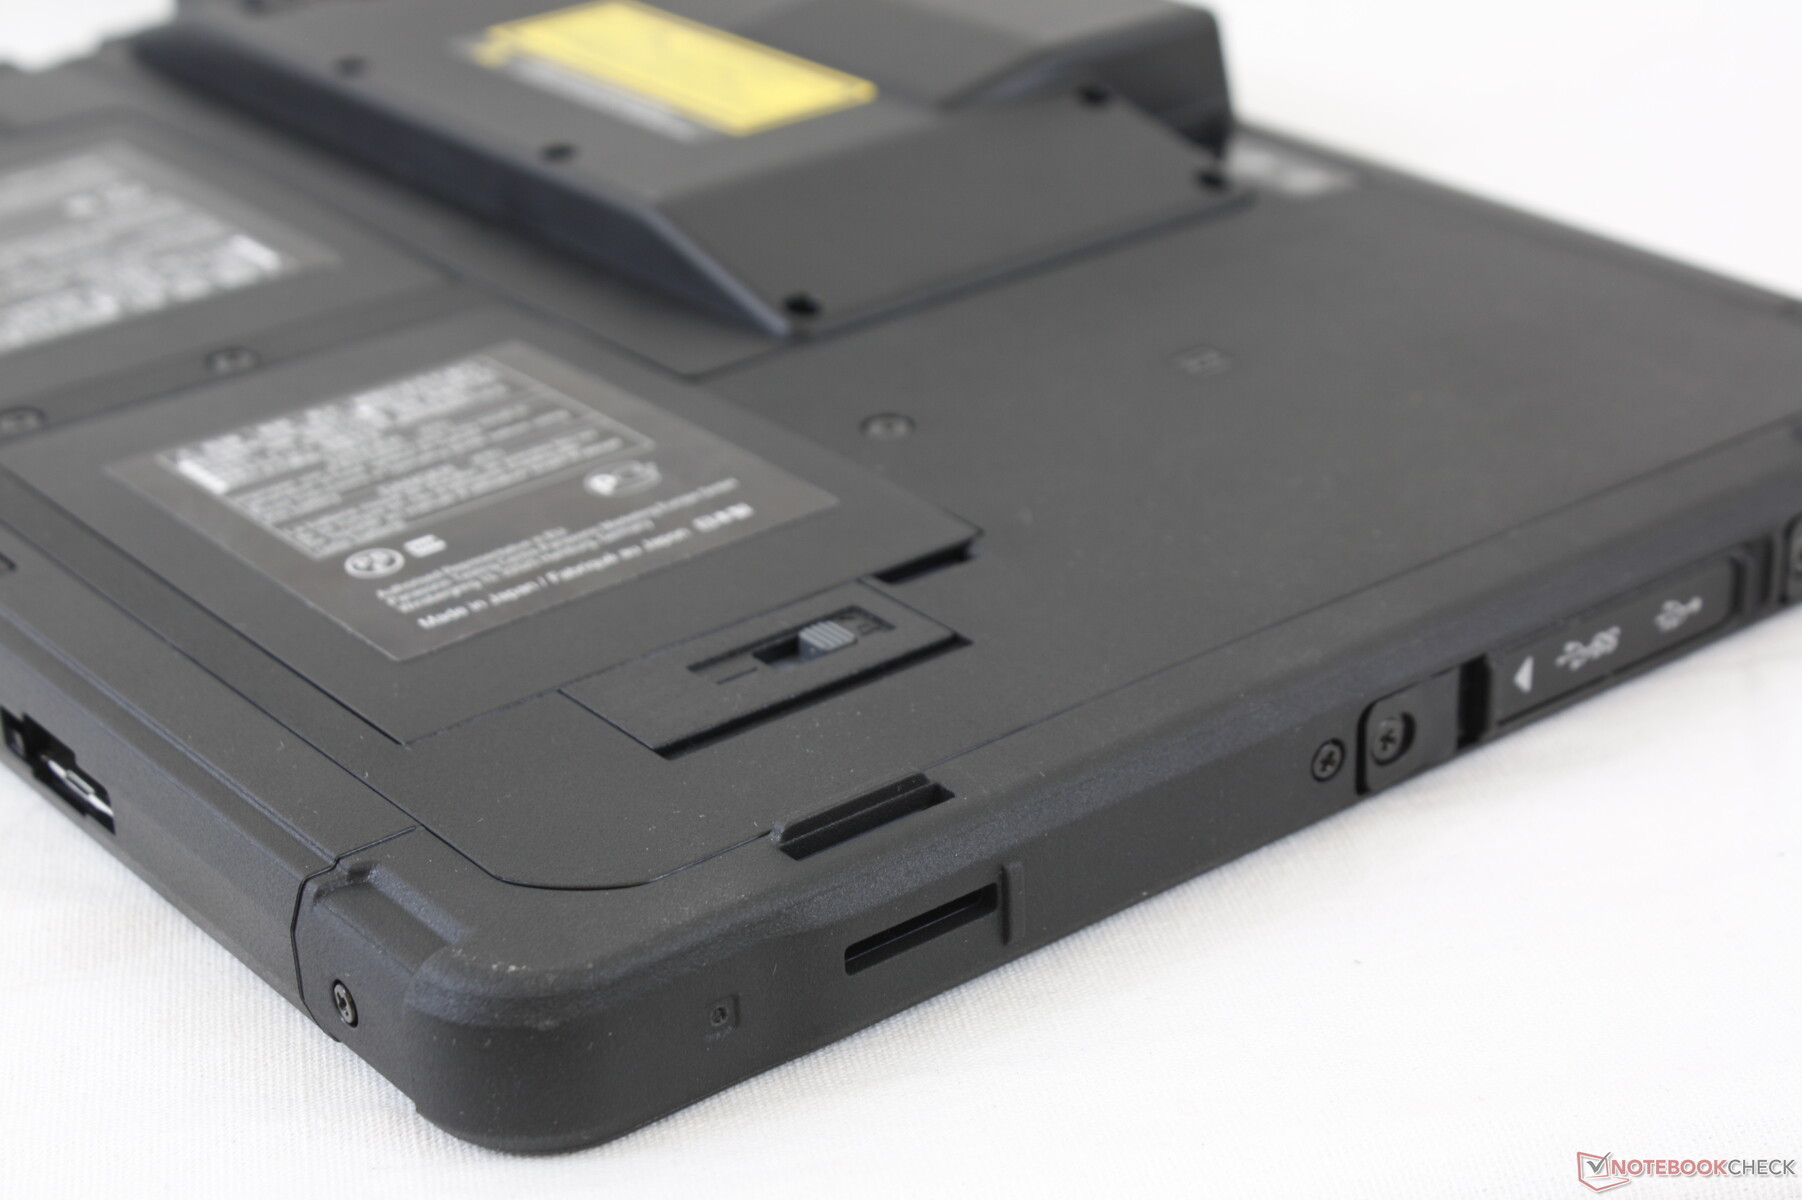
Battery Life
Two identical and removable Li-Ion battery packs are included at 12 Wh each. Both must be installed or else the tablet will not power back on, but it's safe to remove one at a tiime without losing any onscreen data. Expect about 7.5 hours of real-world WLAN use when at a brightness level of 150 nits. Of course, runtime will be shorter if Alleged list of devices eligible for the EMUI 11 update surfaces onlinebrightness is set higher.
The recharge rate is quite slow despite the small battery capacity. Charging from empty to full will take three full hours.
| Panasonic Toughbook FZ-A3 SD 660, Adreno 512, 24 Wh | Samsung Galaxy Tab Active Pro T545 SD 670, Adreno 616, 28.88 Wh | Xploretech XSLATE L10 Pentium N4200, HD Graphics 505, 36 Wh | Durabook R11 i5-8250U, UHD Graphics 620, 43 Wh | Dell Latitude 12 Rugged Tablet 5Y71, HD Graphics 5300, 56 Wh | Apple iPad Pro 11 2020 A12Z Bionic, A12Z Bionic GPU, 28.65 Wh | |
|---|---|---|---|---|---|---|
| Battery Runtime | 118% | -5% | -25% | 4% | 98% | |
| WiFi v1.3 | 455 | 990 118% | 431 -5% | 340 -25% | 471 4% | 902 98% |
| Reader / Idle | 2693 | 2001 | ||||
| Load | 388 | 156 | 197 |
Pros
Cons
Verdict
The Toughbook FZ-A3 has a few things going for it that help separate it from most other rugged tablets. Most notable is the glossy display which is much crisper and with deeper colors than the usual grainy matte displays like on the Durabook R11. It's close to the clarity of a Samsung Galaxy tablet or Apple iPad while being two times brighter for better outdoor visibility. If you need a lightweight rugged tablet with a colorful display running on modern Android 9.0 software, then the FZ-A3 should fit the bill.
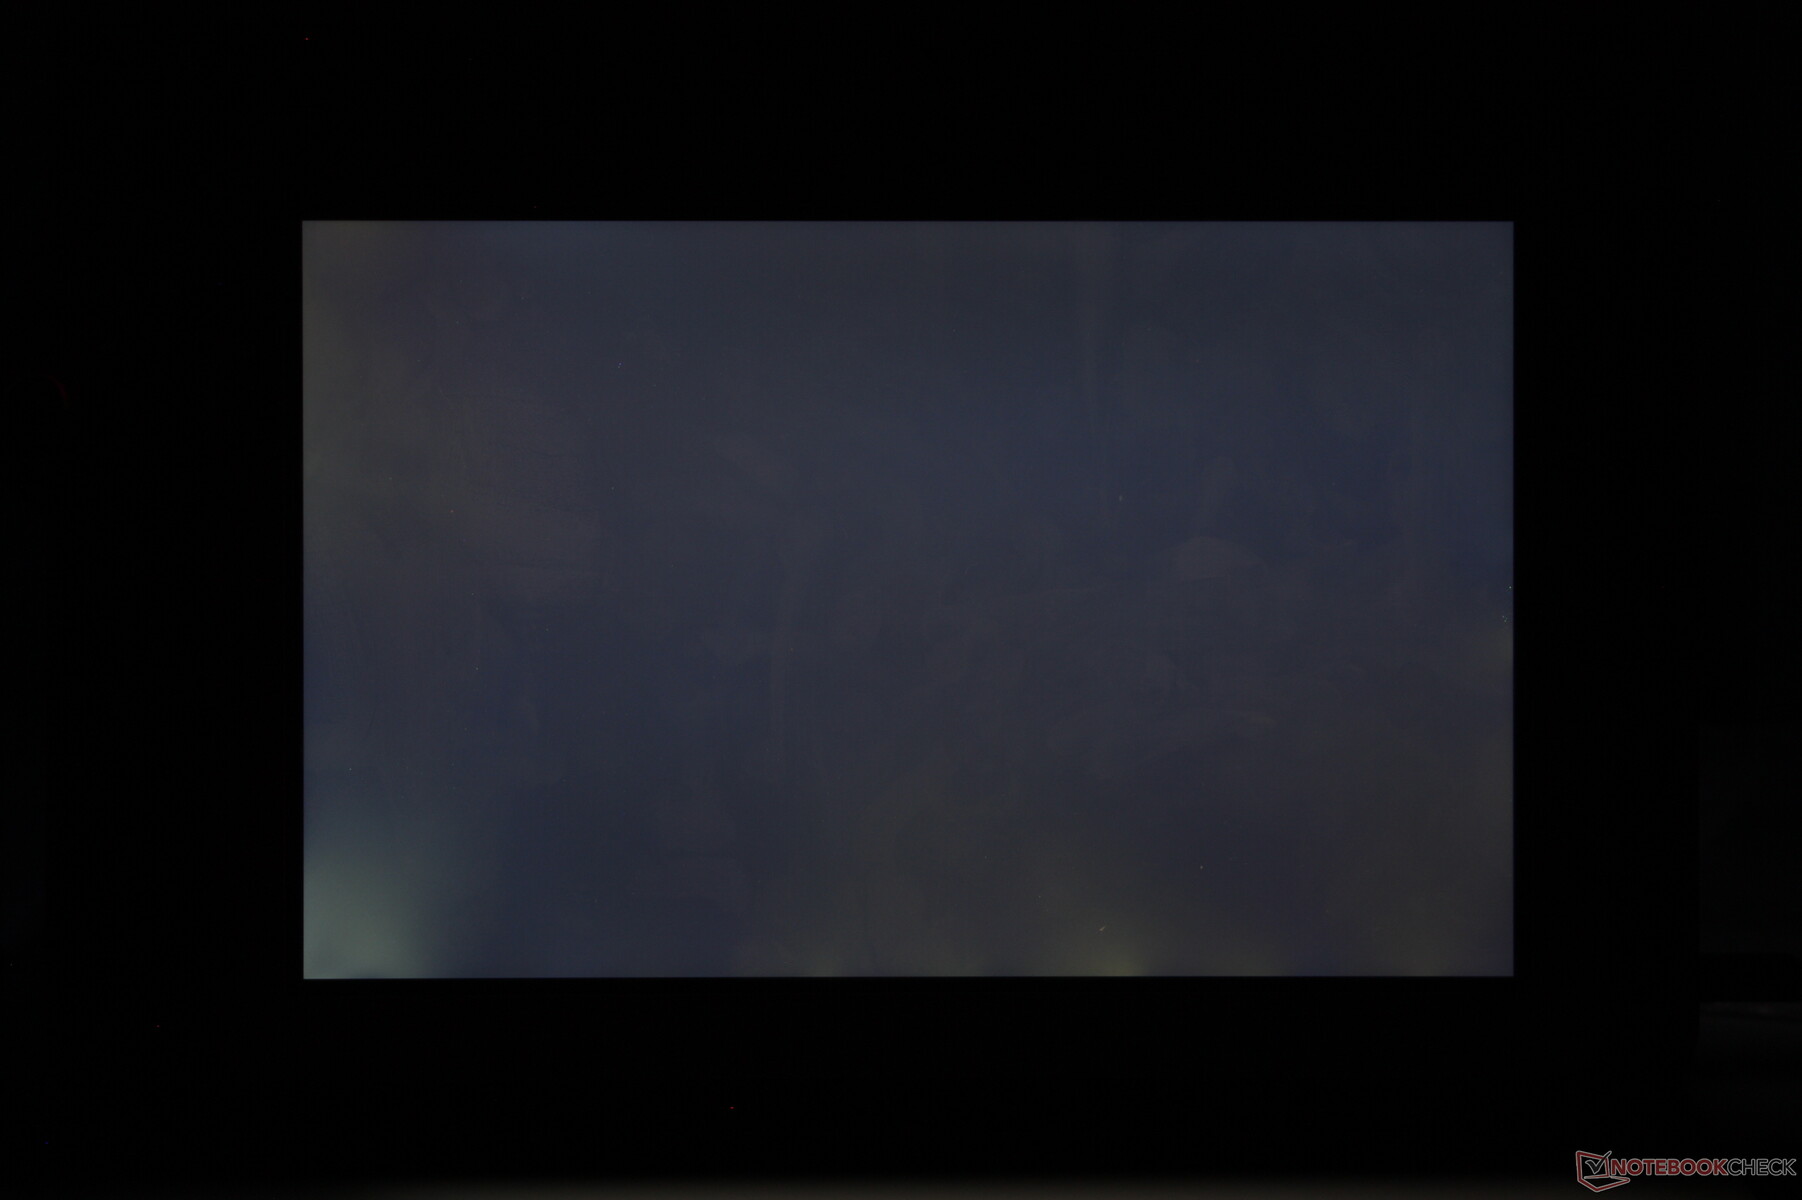
The main disadvantage to watch out for is that the display backlight utilizes pulse-width modulation for brightness control at all settings meaning that it will always flicker. This won't bother most users, but those who are sensitive to onscreen flickering may experience eyestrain if using the tablet for long periods. Additionally, glare is more prevalent than most other matte rugged tablets due to its glossy overlay and the moderate backlight bleeding could have been better.
High quality glossy touchscreen wrapped in a lightweight rugged chassis and powered by a mid-range Snapdragon 660 SoC. The Android 9.0 software and USB-C port give it more potential features and versatility than most others in the rugged tablet category.
More articles related to this device
Panasonic Toughbook FZ-A3 (Toughbook FZ Series)Related Articles


Pricecompare
