

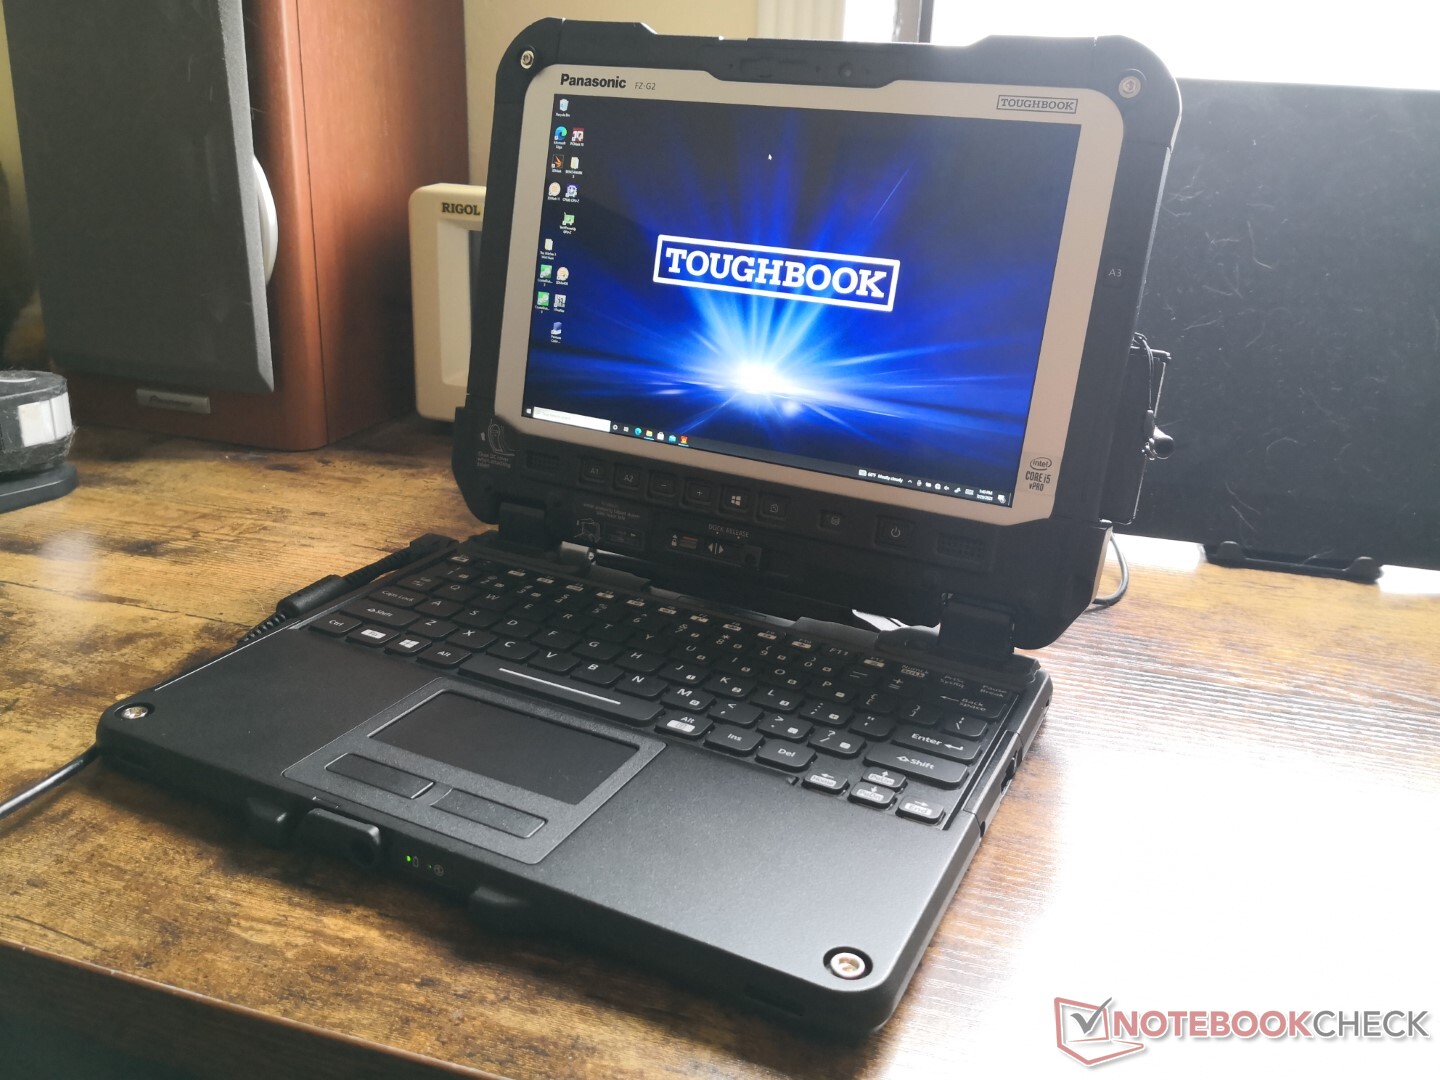
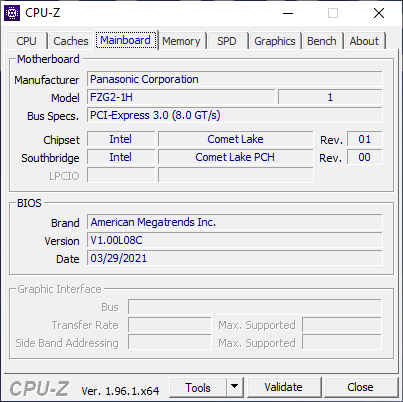
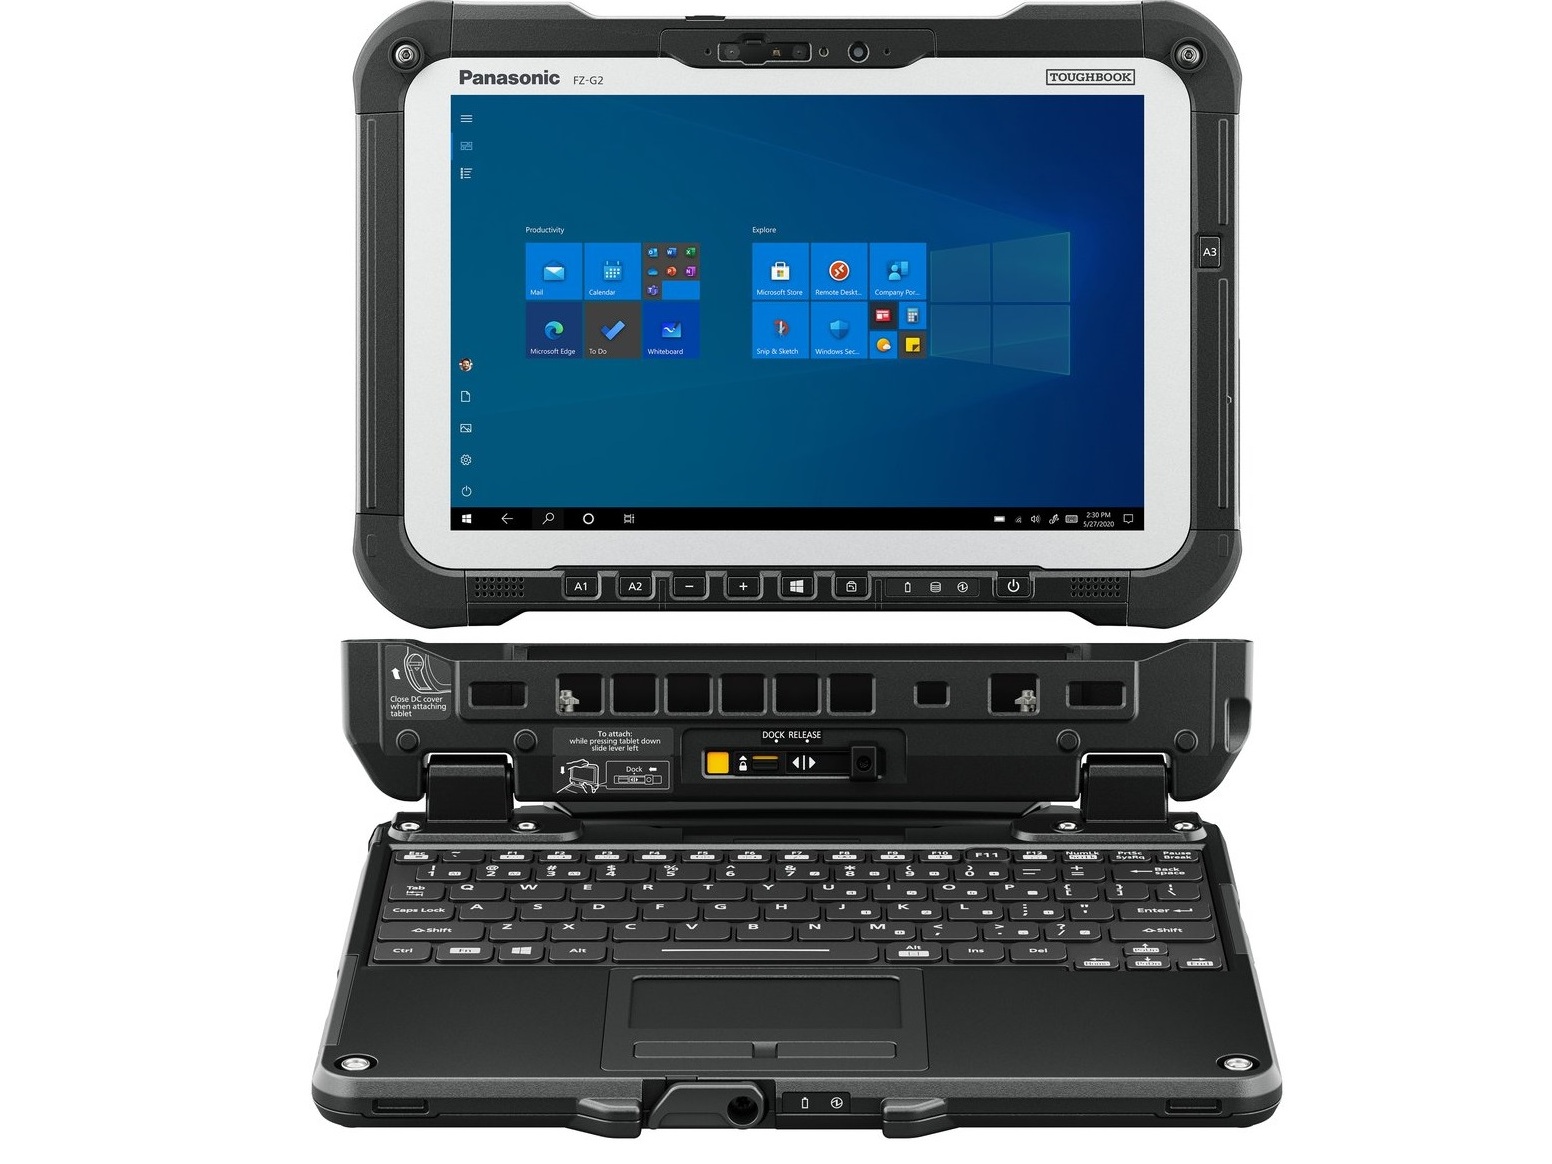
Panasonic Toughbook FZ-G2 rugged convertible review: Tablet with removable M.2 PCIe storage
Unlike the slimmer Android-based Toughbook FZ-A3, the Toughbook FZ-G2 is a full-fledged Windows 10 tablet with upgradeable storage, removable battery, 4G LTE, and a number of other characteristics designed to aid professionals and withstand the elements.
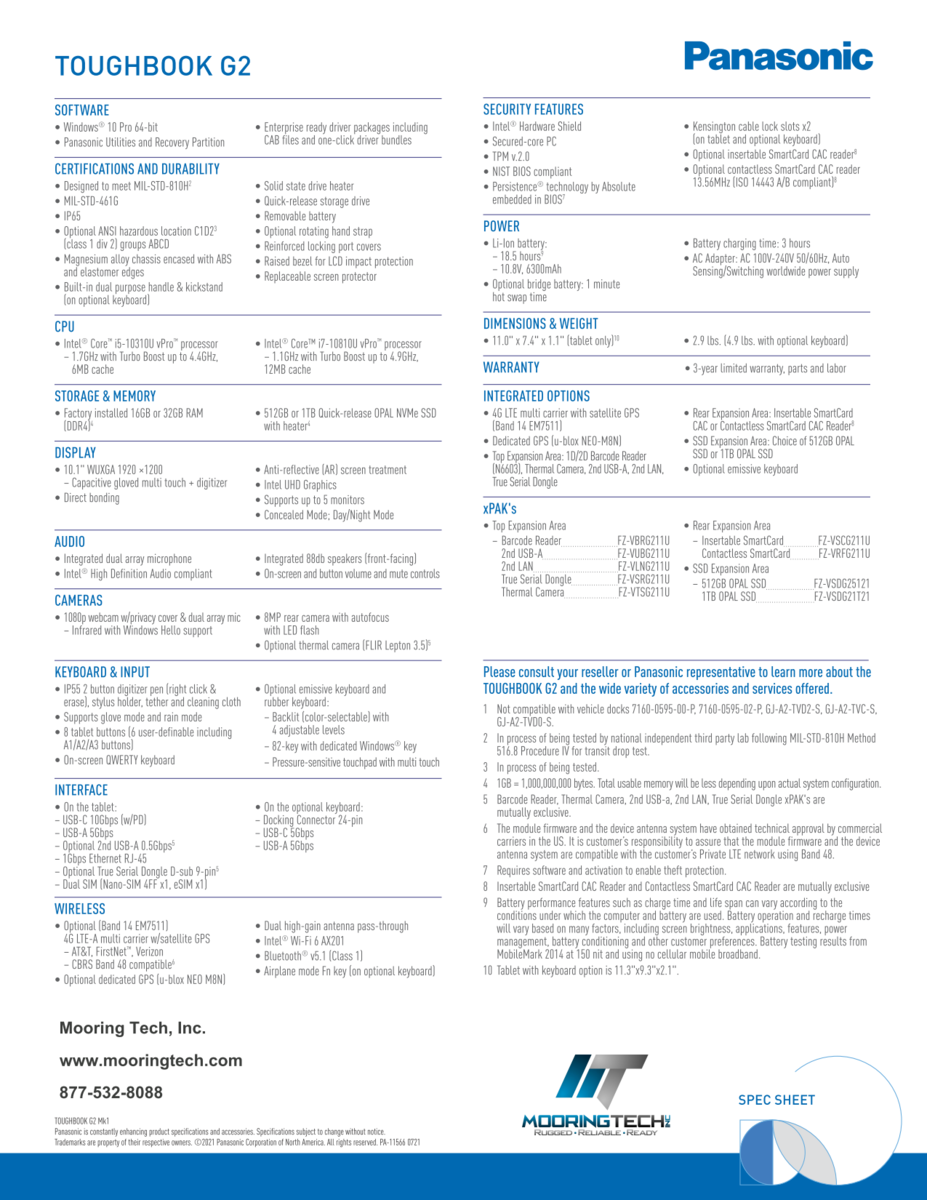
The full list of features can be found on Panasonic's official product page for the Toughbook FZ-G2.
More Panasonic reviews:
potential competitors in comparison
Rating | Date | Model | Weight | Height | Size | Resolution | Price |
|---|---|---|---|---|---|---|---|
v (old) | 08 / 2021 | Panasonic Toughbook FZ-G2 i5-10310U, UHD Graphics 620 | 1.5 kg | 28 mm | 10.10" | 1920x1200 | |
v (old) | 07 / 2021 | Panasonic Toughbook FZ-S1 SD 660, Adreno 512 | 503 g | 19.1 mm | 7.00" | 1280x800 | |
v (old) | 04 / 2021 | Durabook S14I i7-1165G7, Iris Xe G7 96EUs | 3 kg | 38.1 mm | 14.00" | 1920x1080 | |
| 78.1 % v7 (old) | 07 / 2020 | Panasonic Toughbook FZ-A3 SD 660, Adreno 512 | 930 g | 16.4 mm | 10.10" | 1920x1200 | |
v (old) | 07 / 2020 | Durabook R11 i5-8250U, UHD Graphics 620 | 1.2 kg | 20 mm | 11.60" | 1920x1080 | |
v (old) | 09 / 2020 | Acer Enduro T1 ET108-11A A9001 | 499 g | 10.9 mm | 8.00" | 1280x800 |
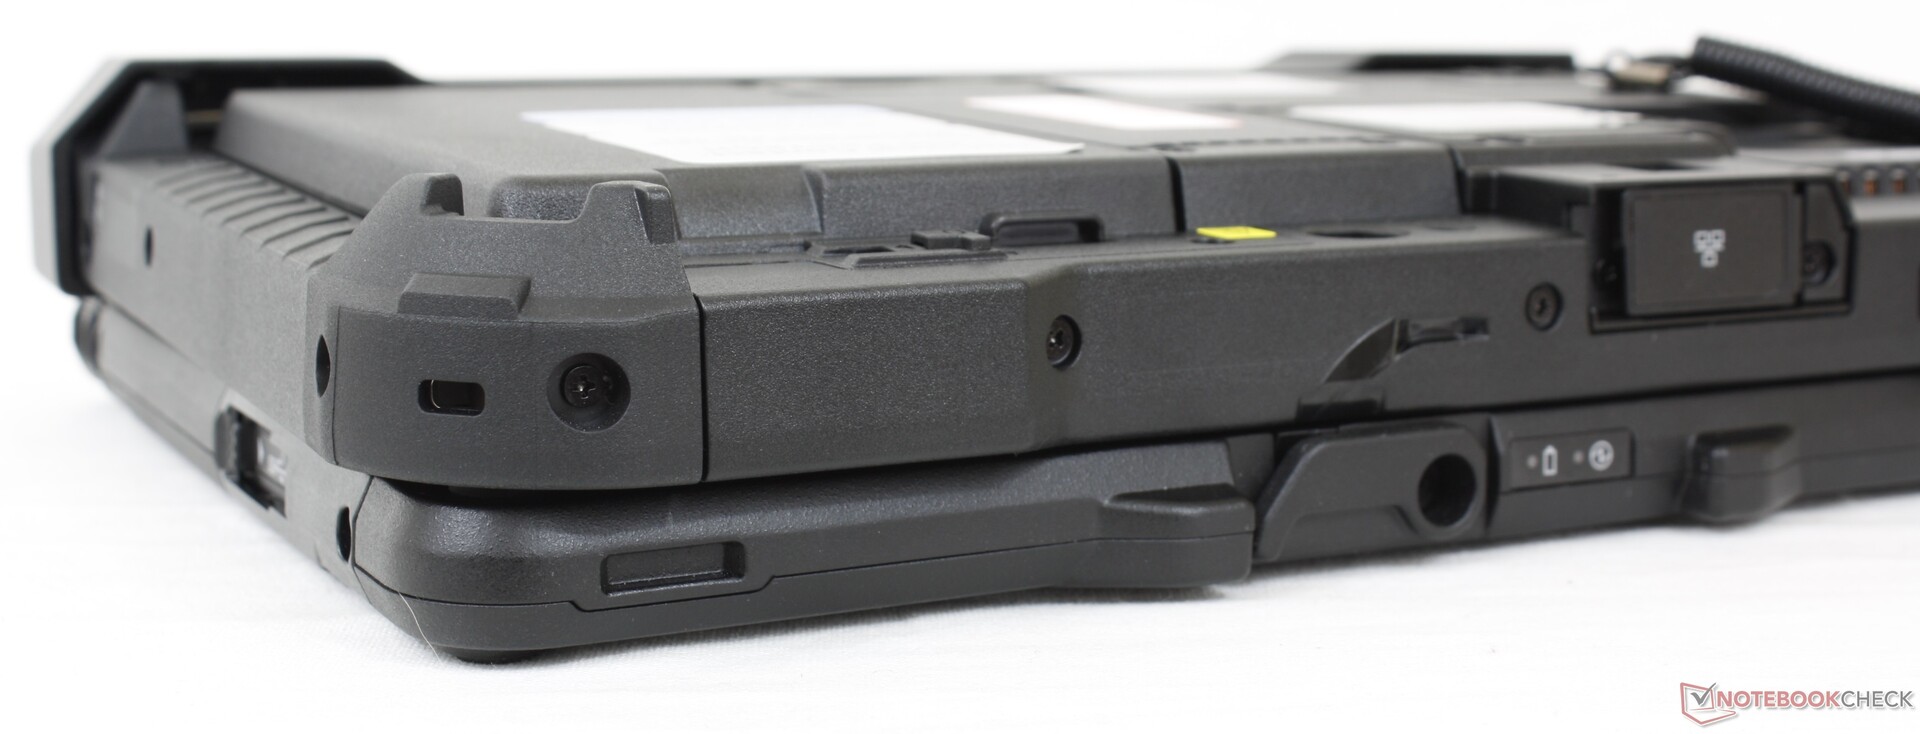
Case
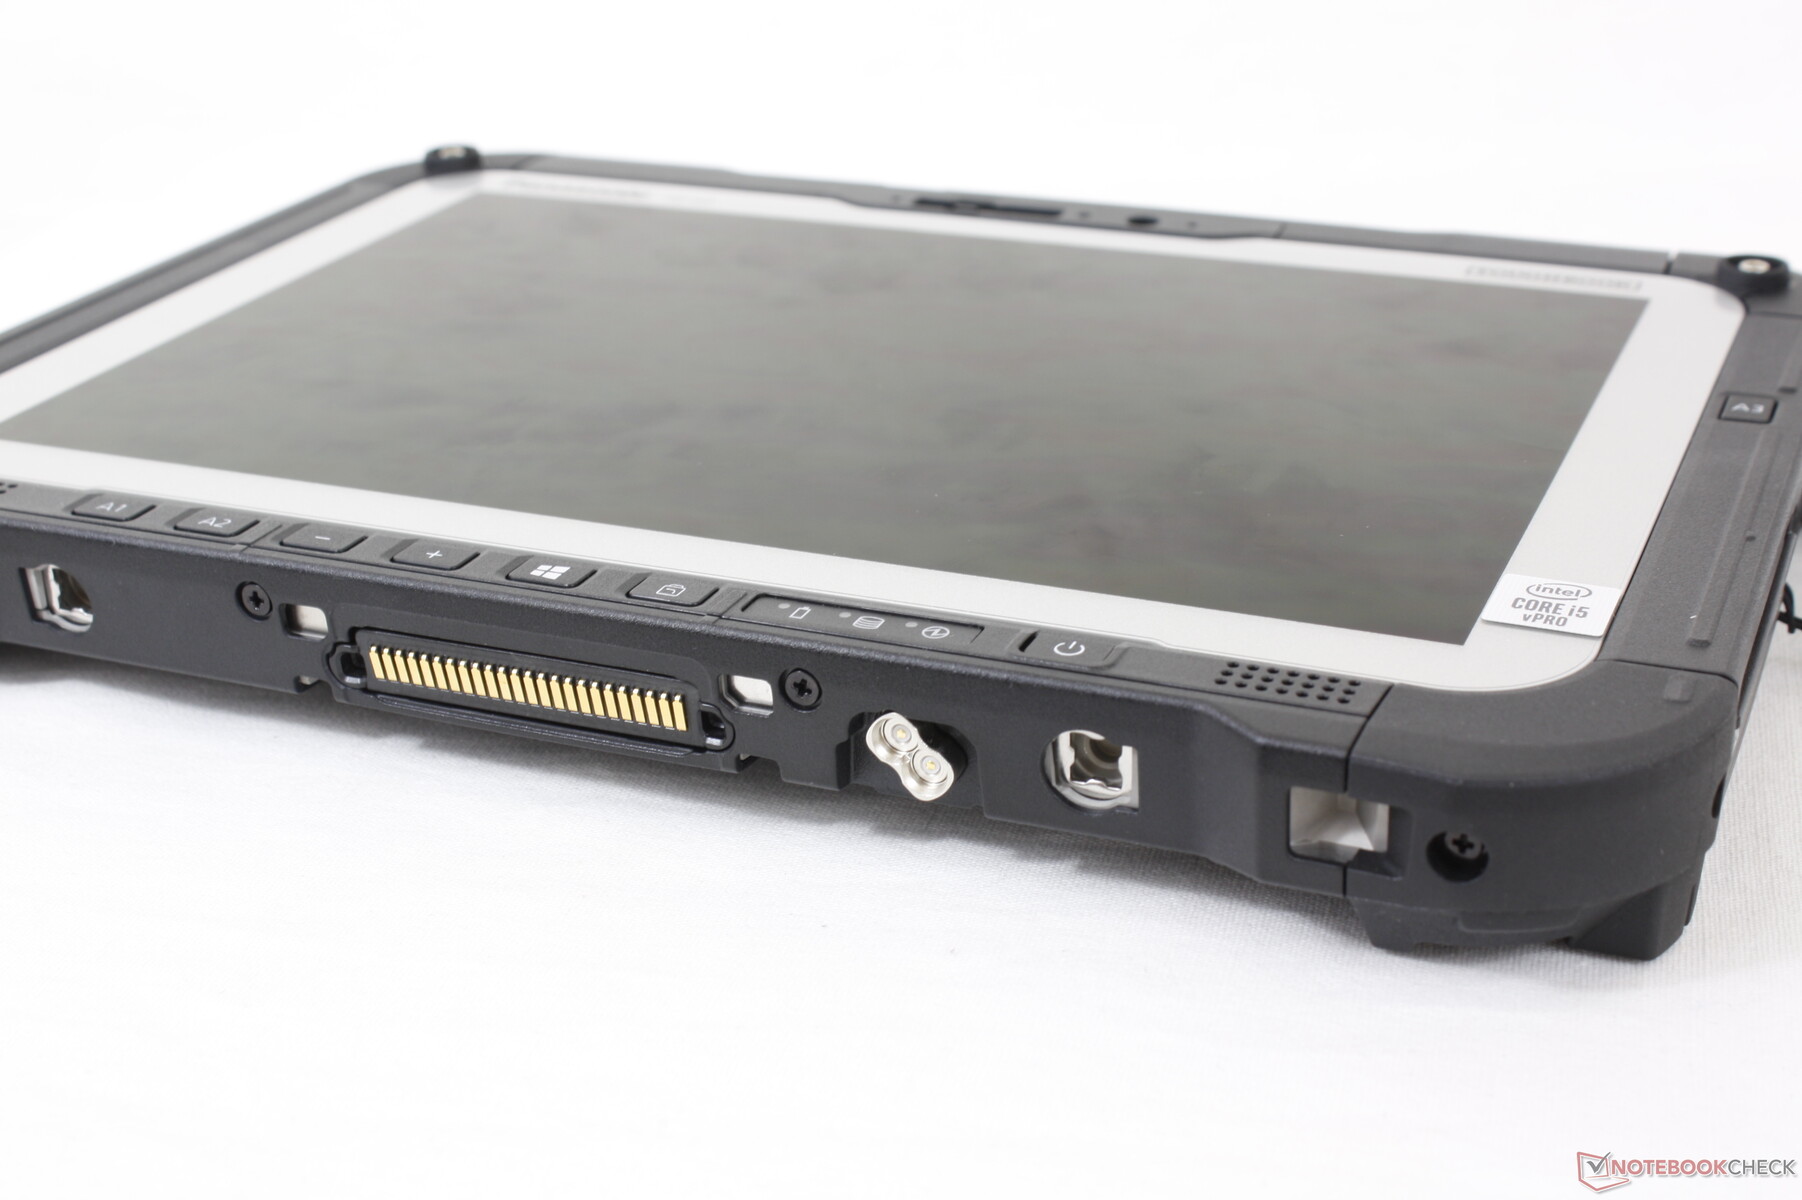
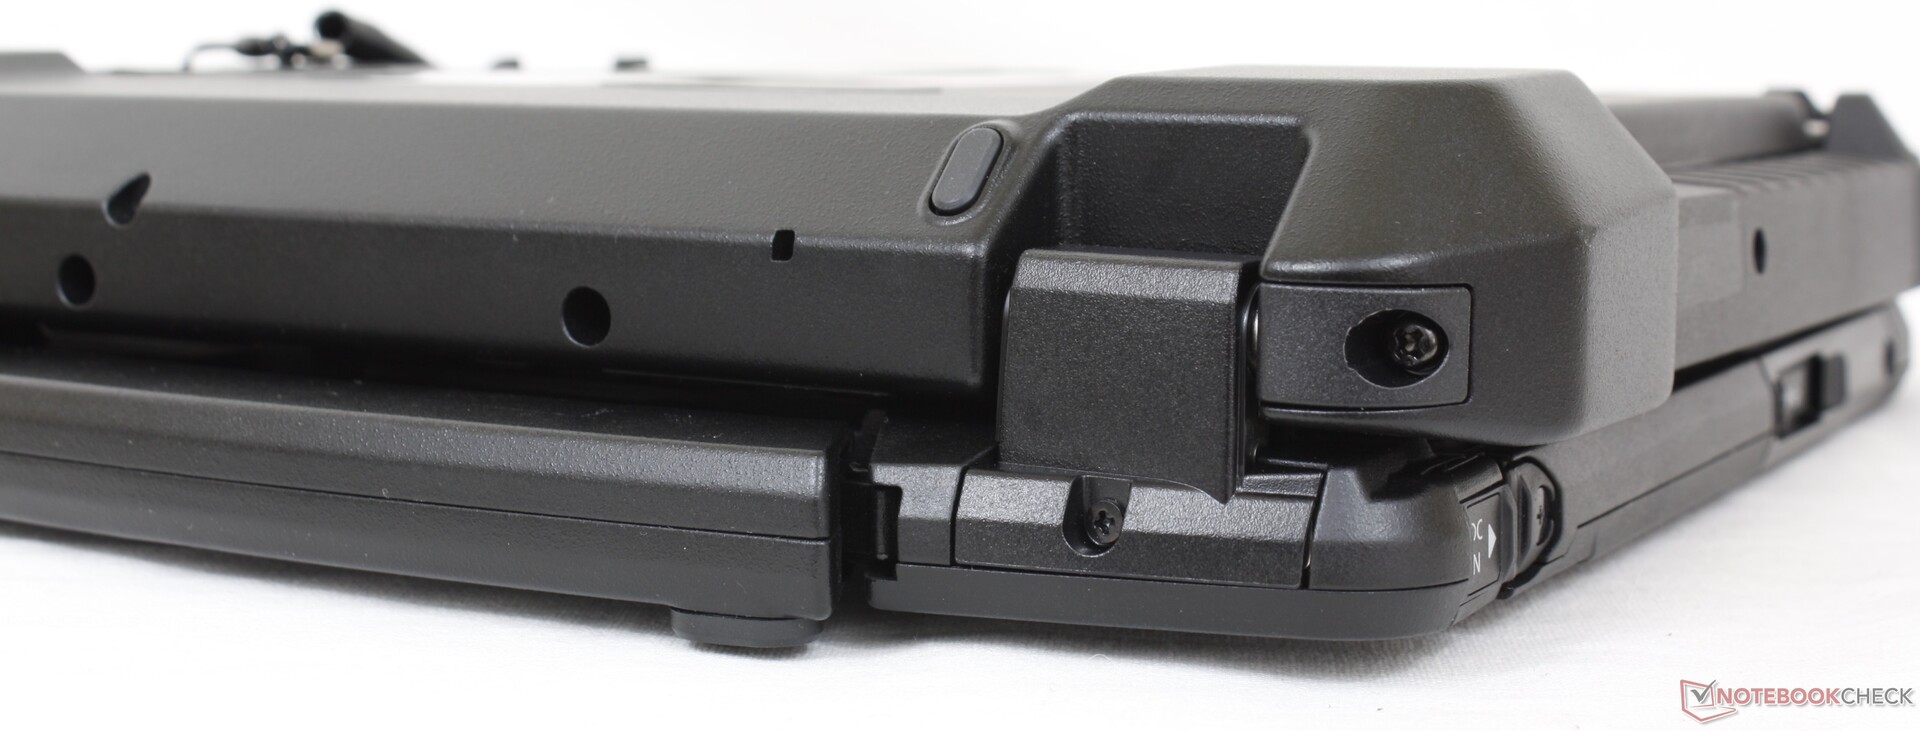
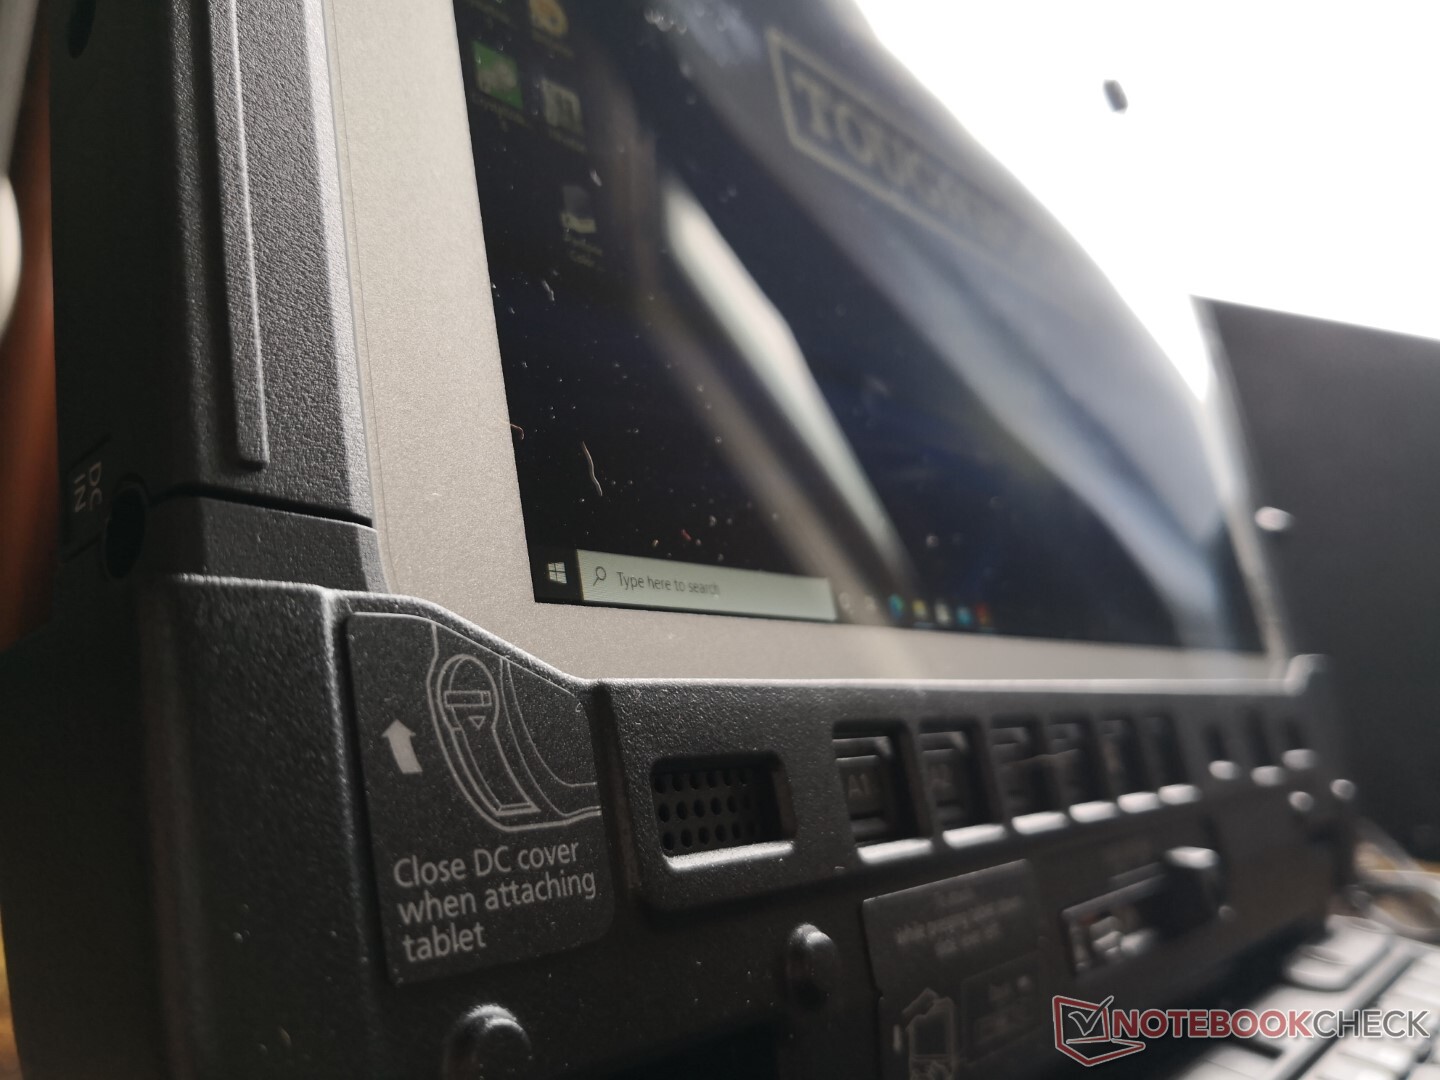
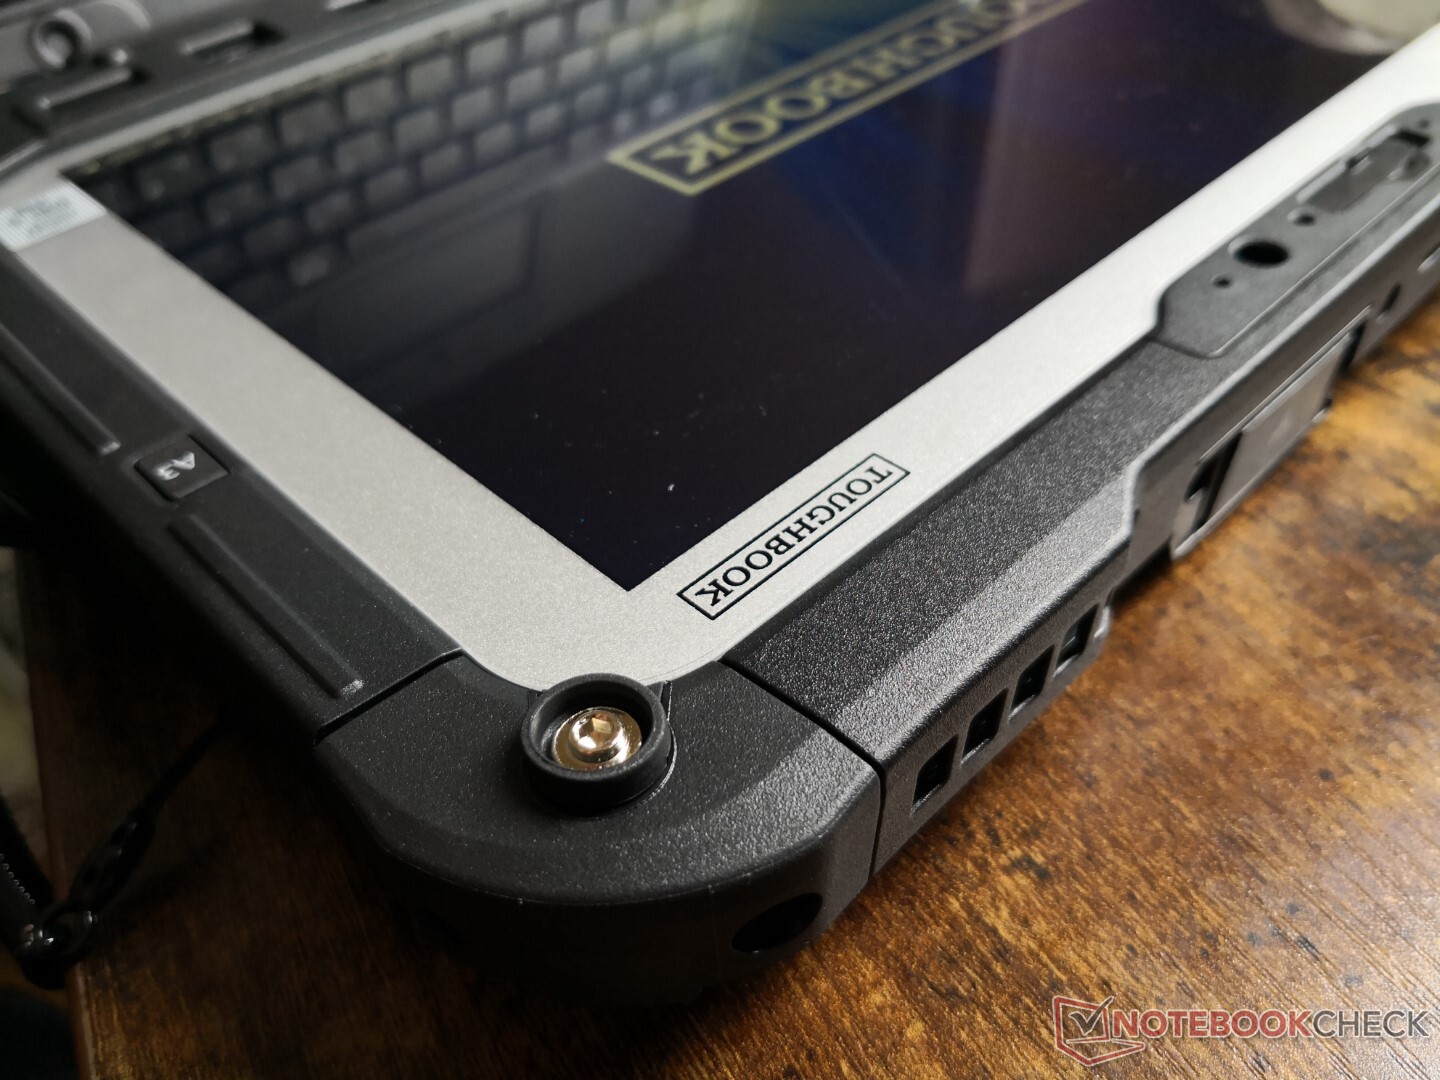
At 1.5 kg or 2.4 kg with the optional docking station, the tablet is heavier than its display size may suggest. The FZ-A3 is over 500 g lighter albeit without many of the expandable features of the FZ-G2. The chassis exhibits absolutely no warping or creaking when attempting to twist its corners.
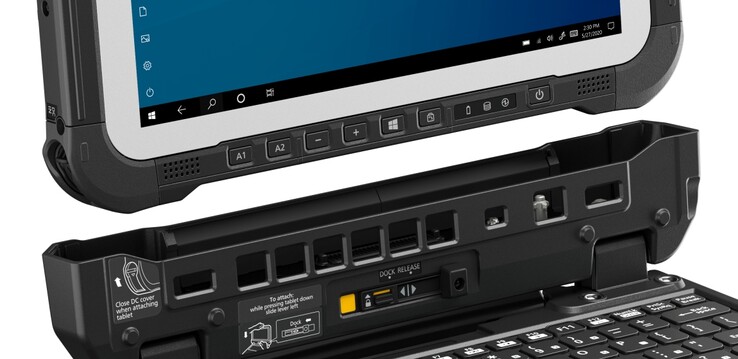
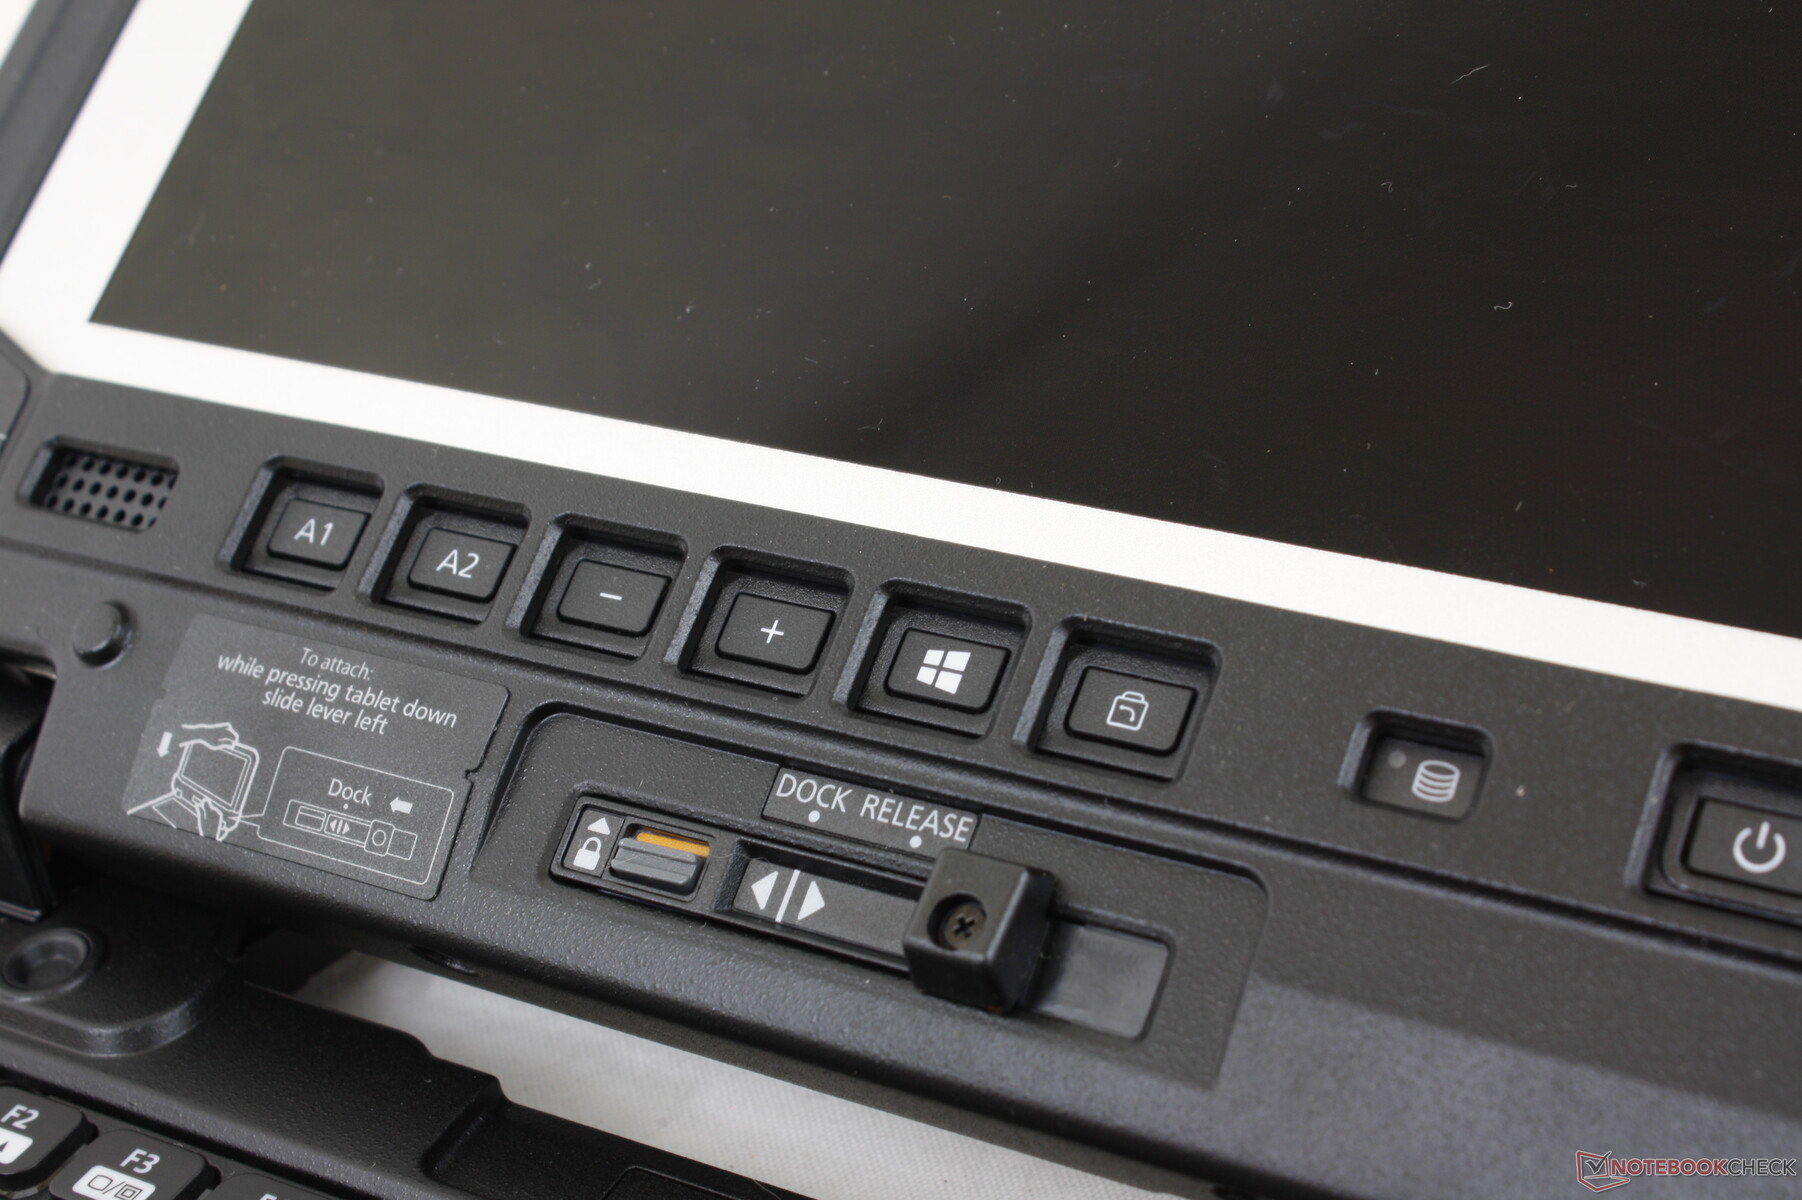
The tablet itself integrates user-programmable buttons which can be incredibly useful depending on the application.
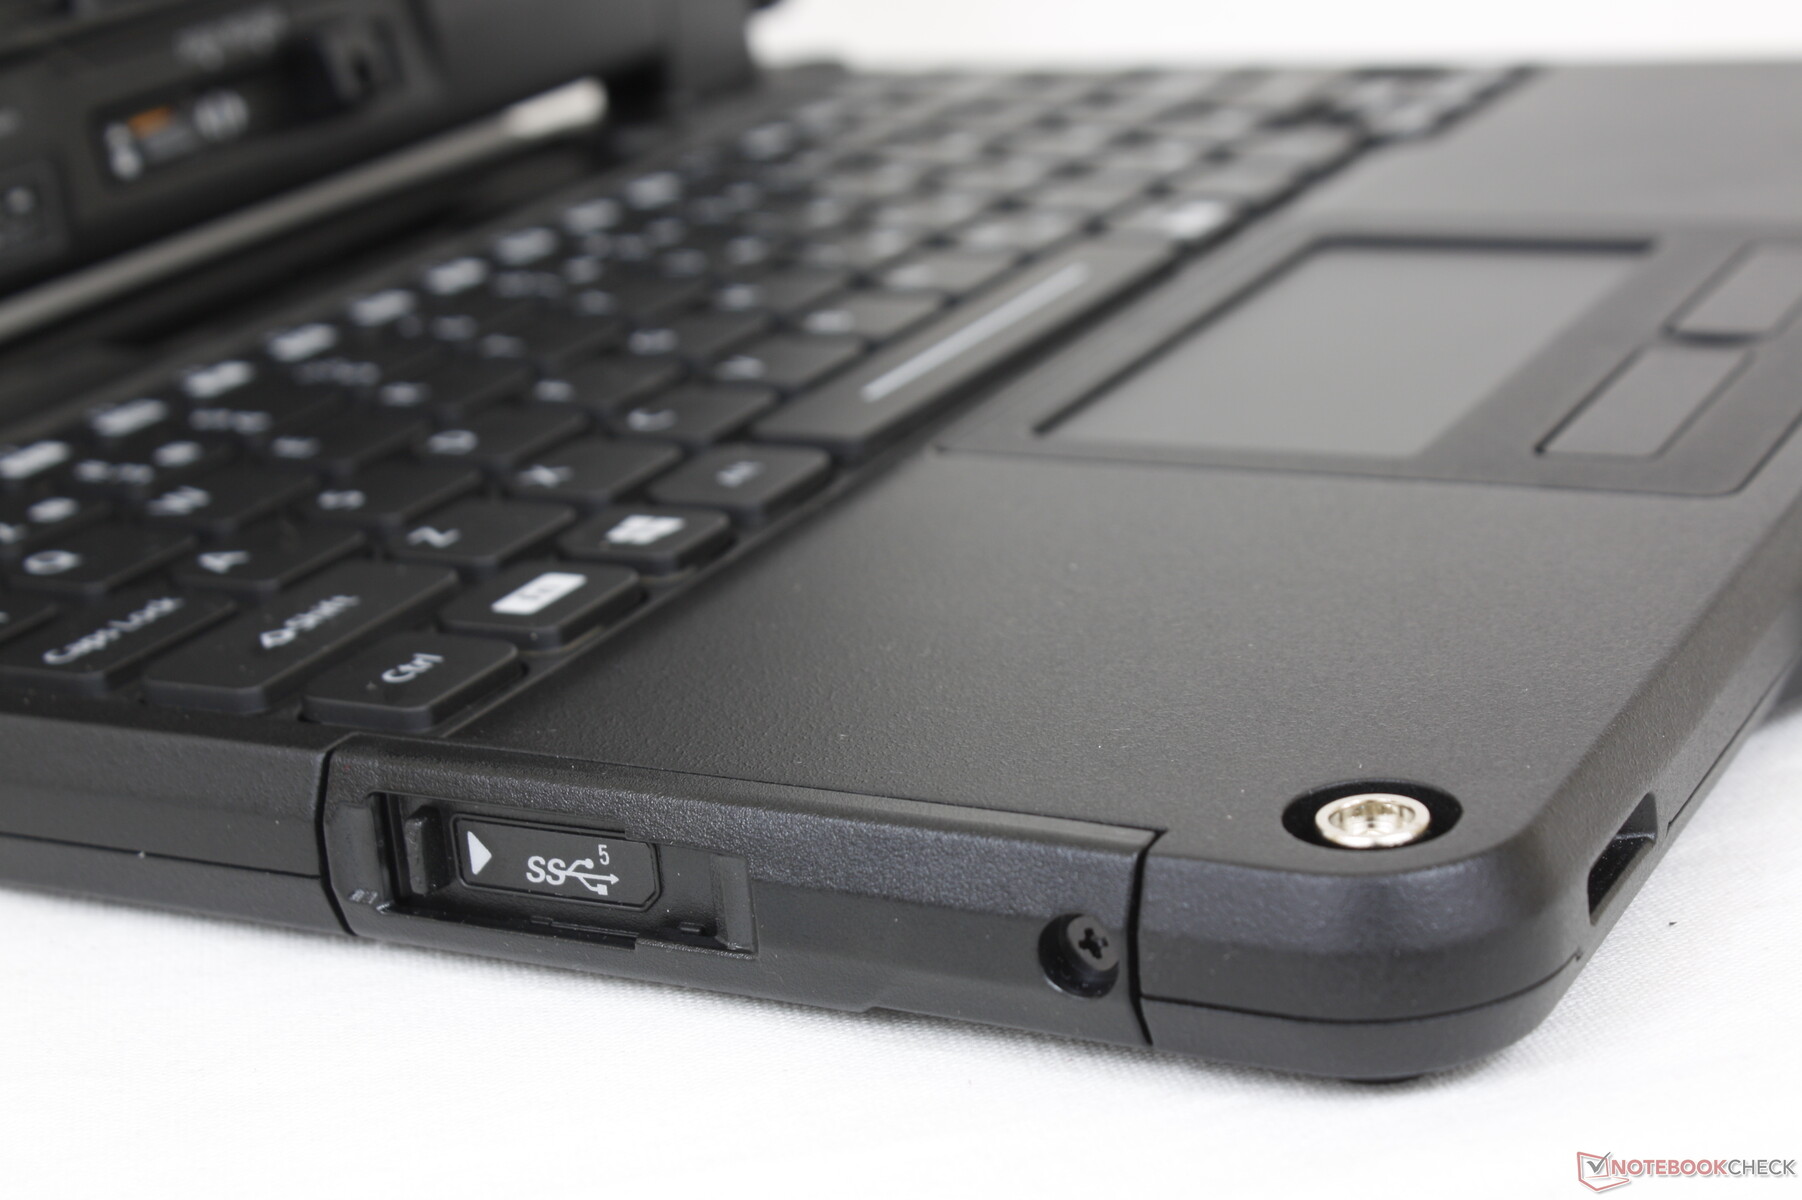
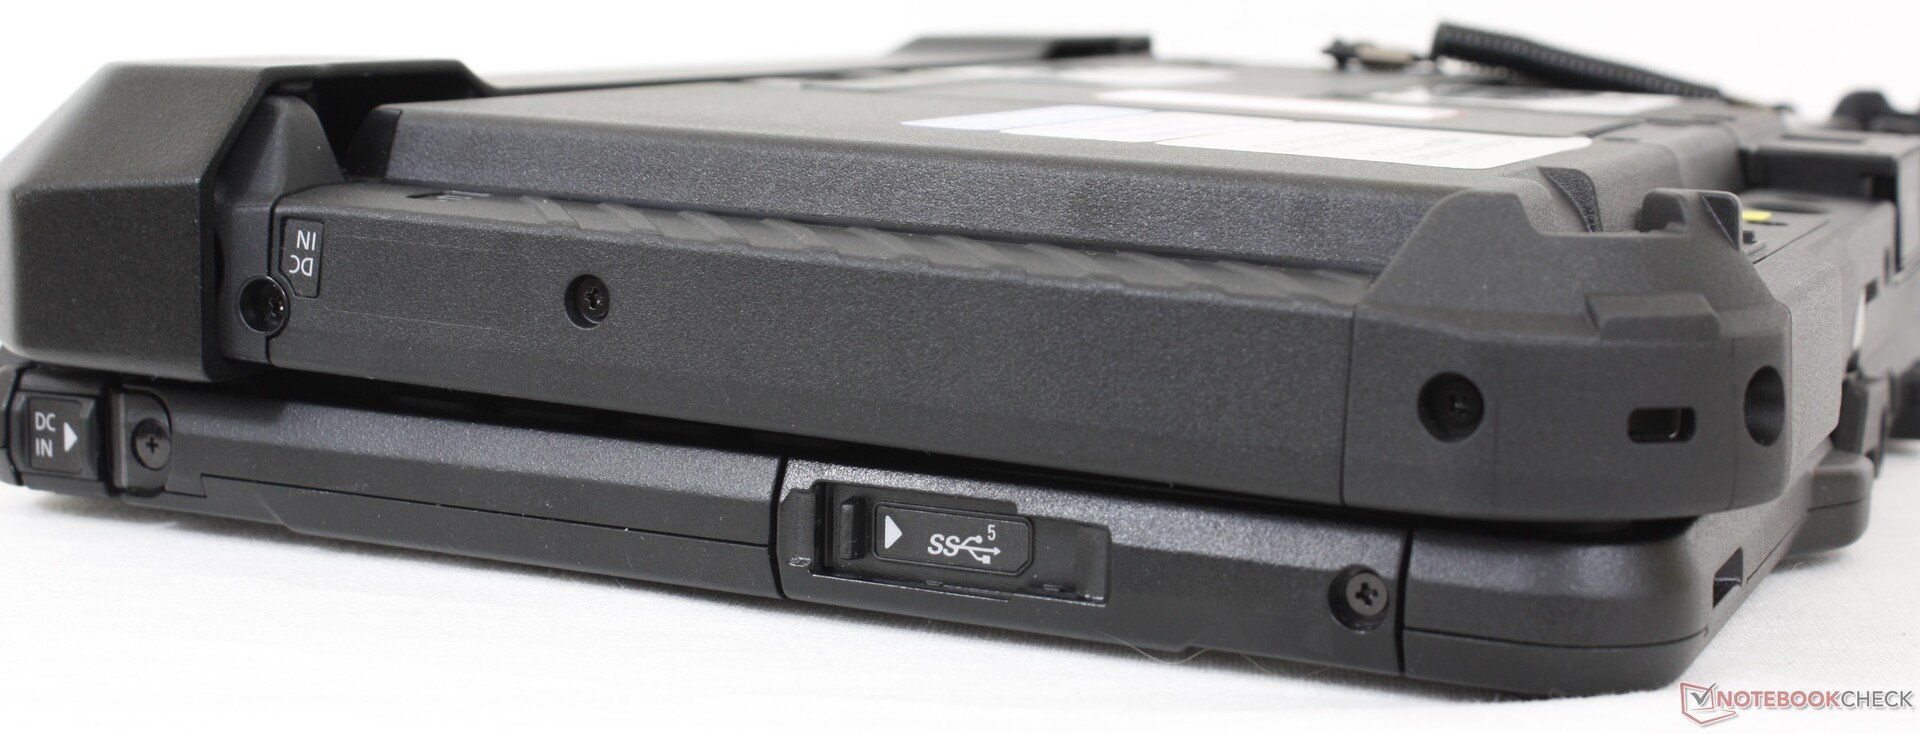
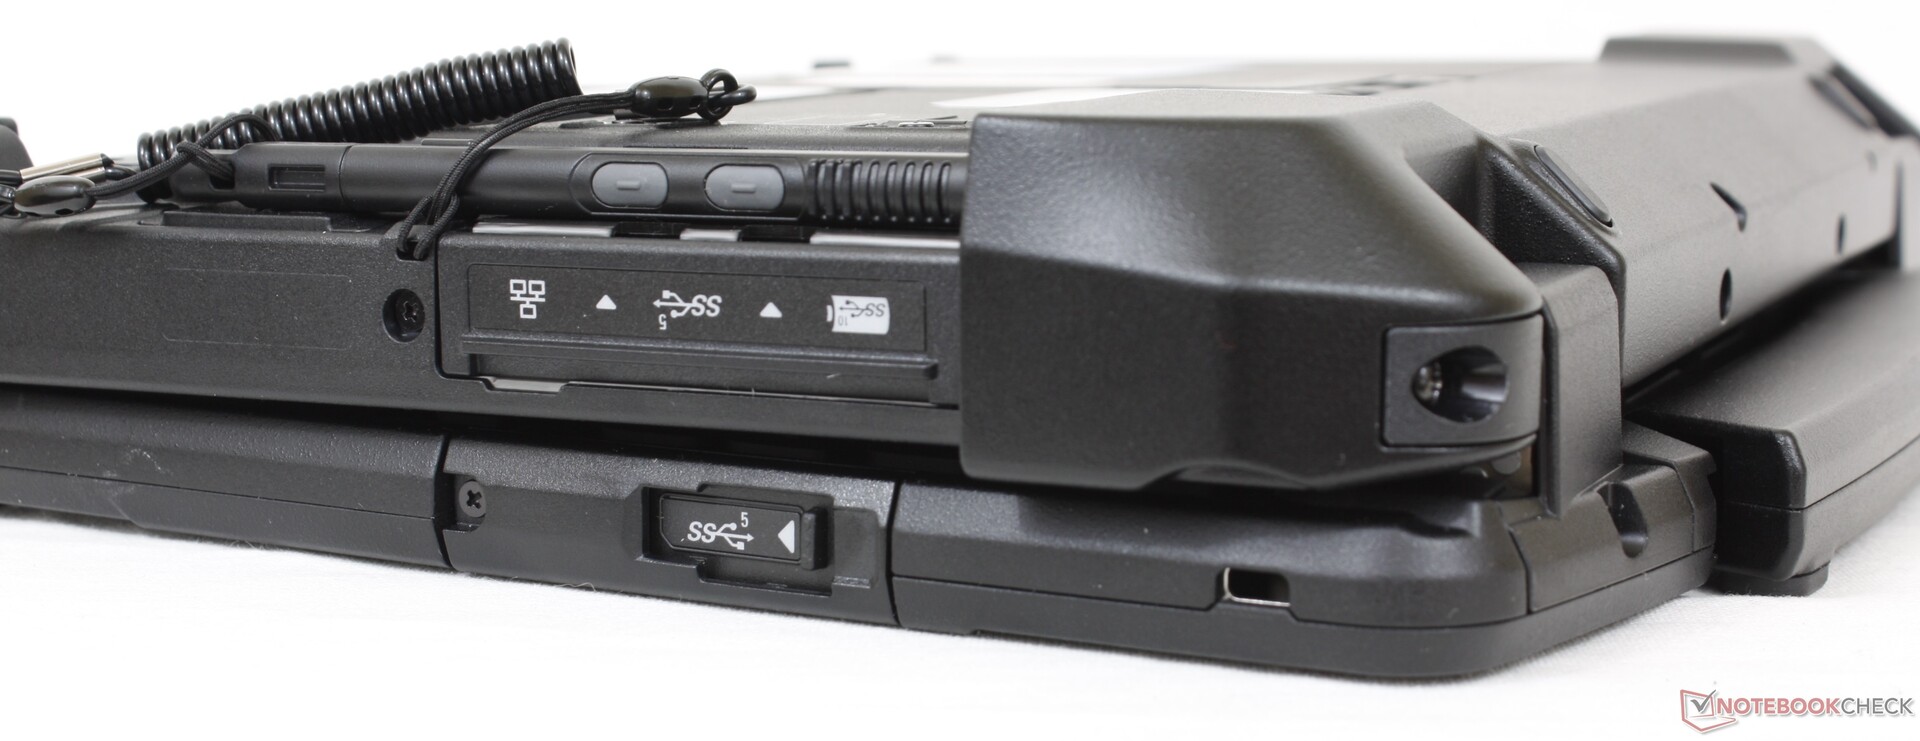
Connectivity
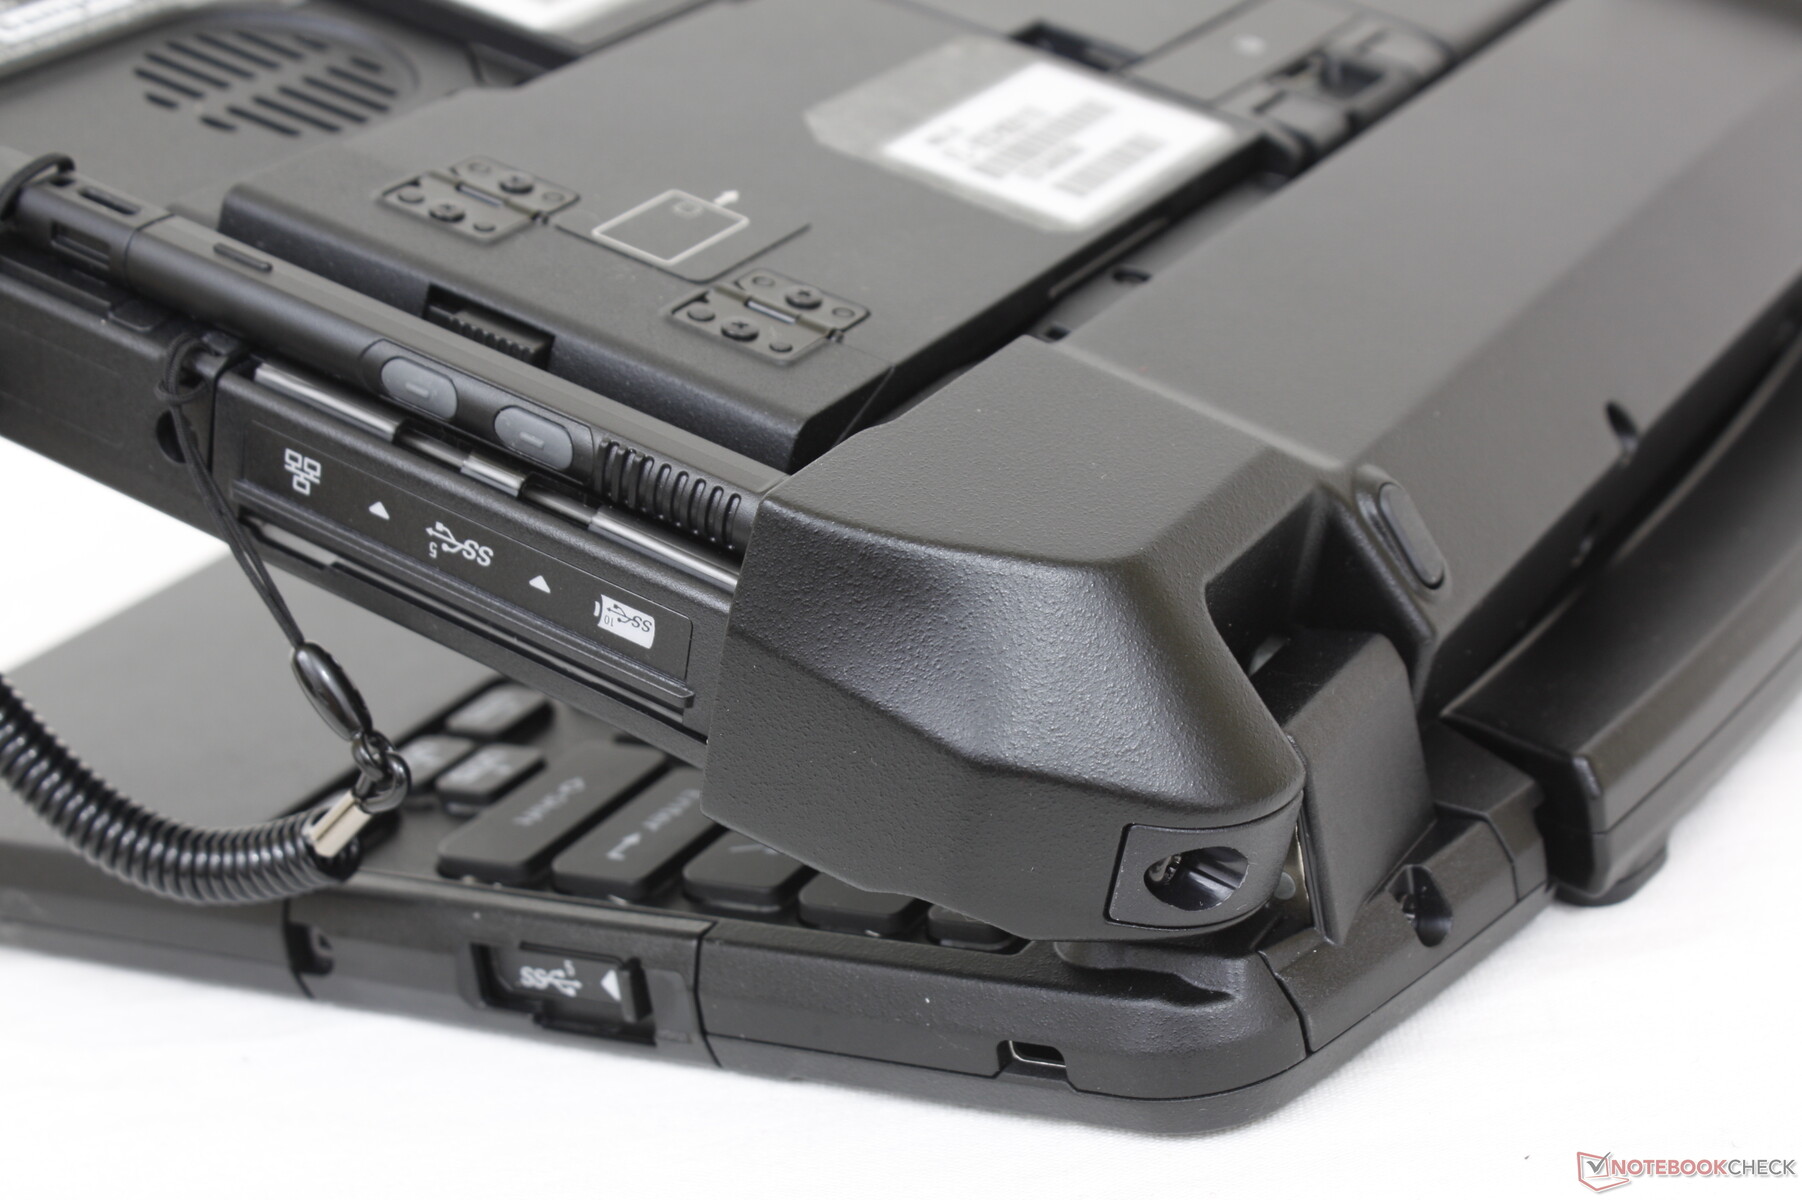
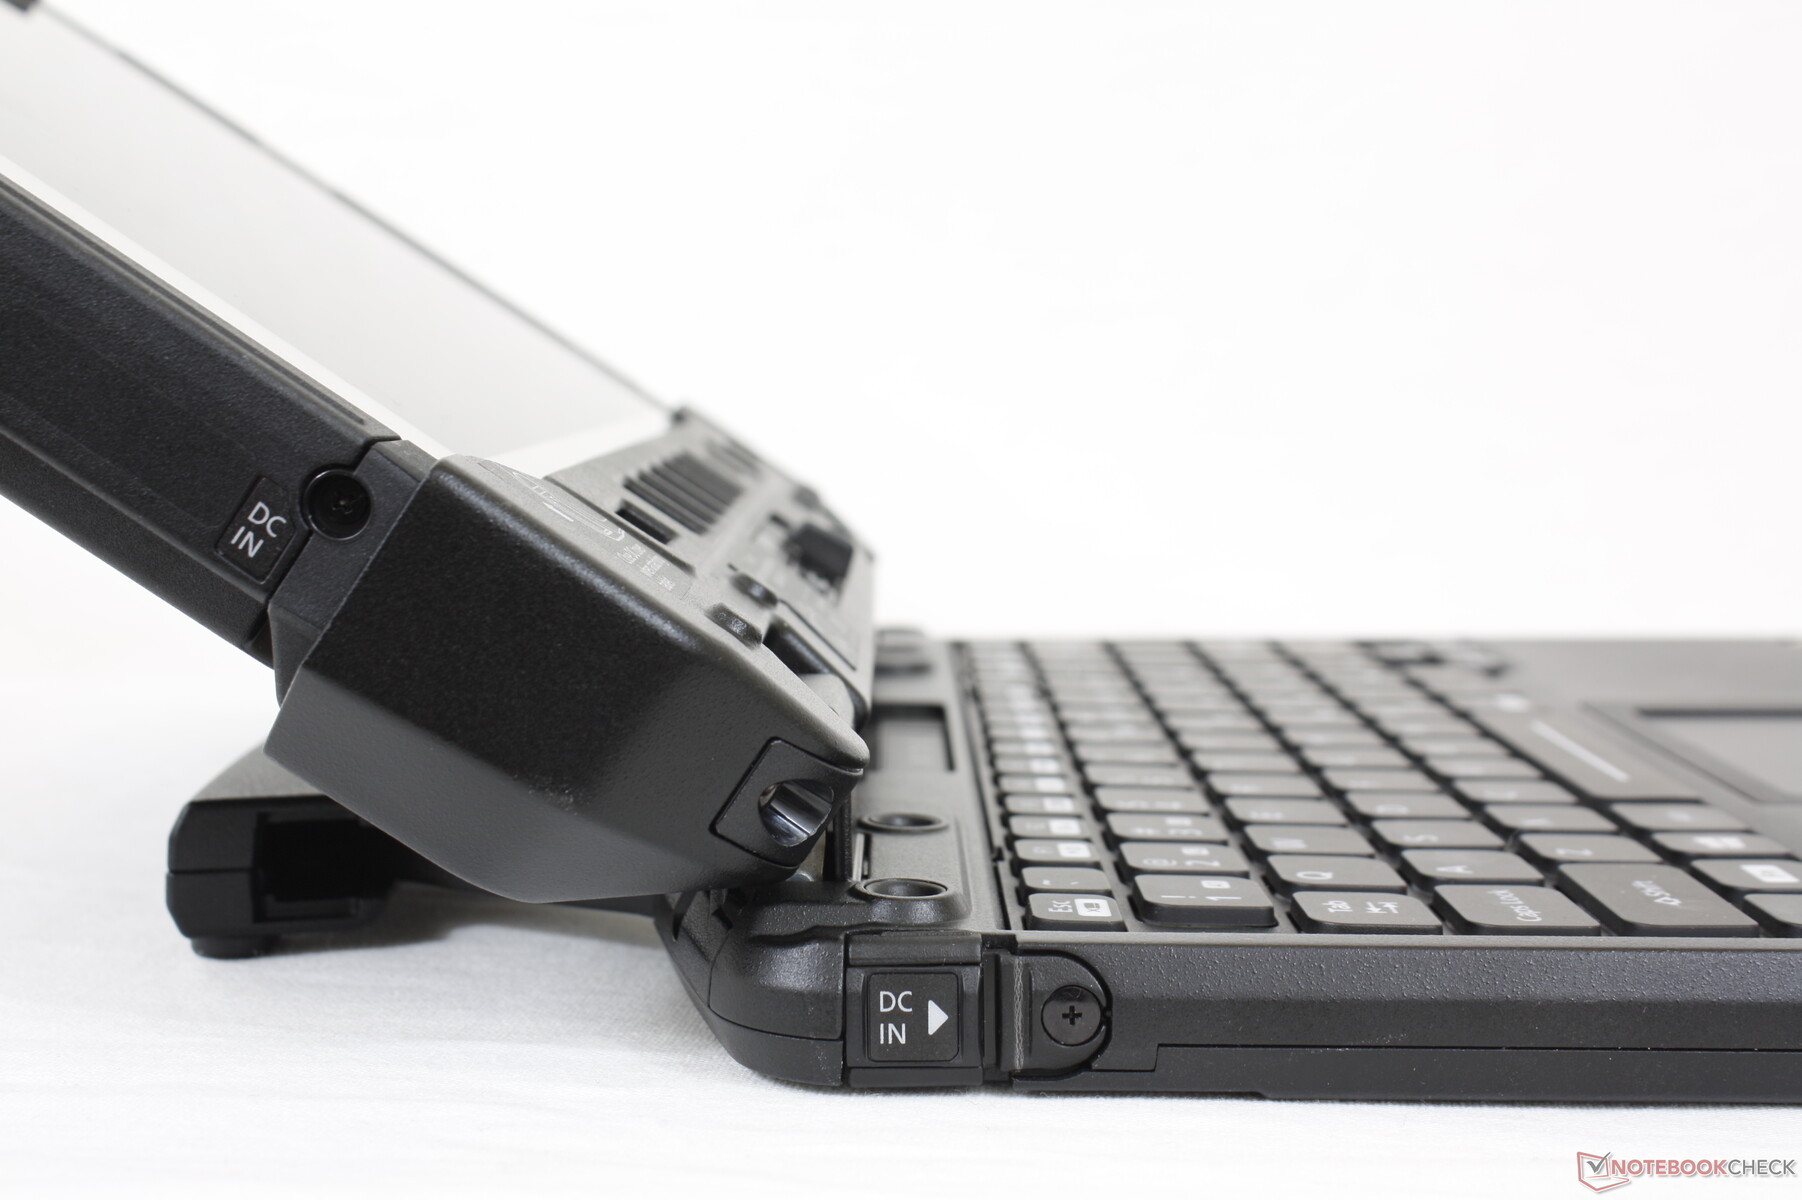
Port options are varied with two RJ-45 and both USB-A and USB-C. The dock itself adds additional USB ports, but it would have been great to see HDMI included as well.
The tablet cannot recharge via USB-C. Meanwhile, the USB-C port on the tablet supports DisplayPort-out while the USB-C port on the dock does not.
Communication
The unit comes with an Intel AX201 for modern Wi-Fi 6 and Bluetooth 5.1 connectivity. We experienced no issues when paired to our Netgear RAX200 test router.
Webcam


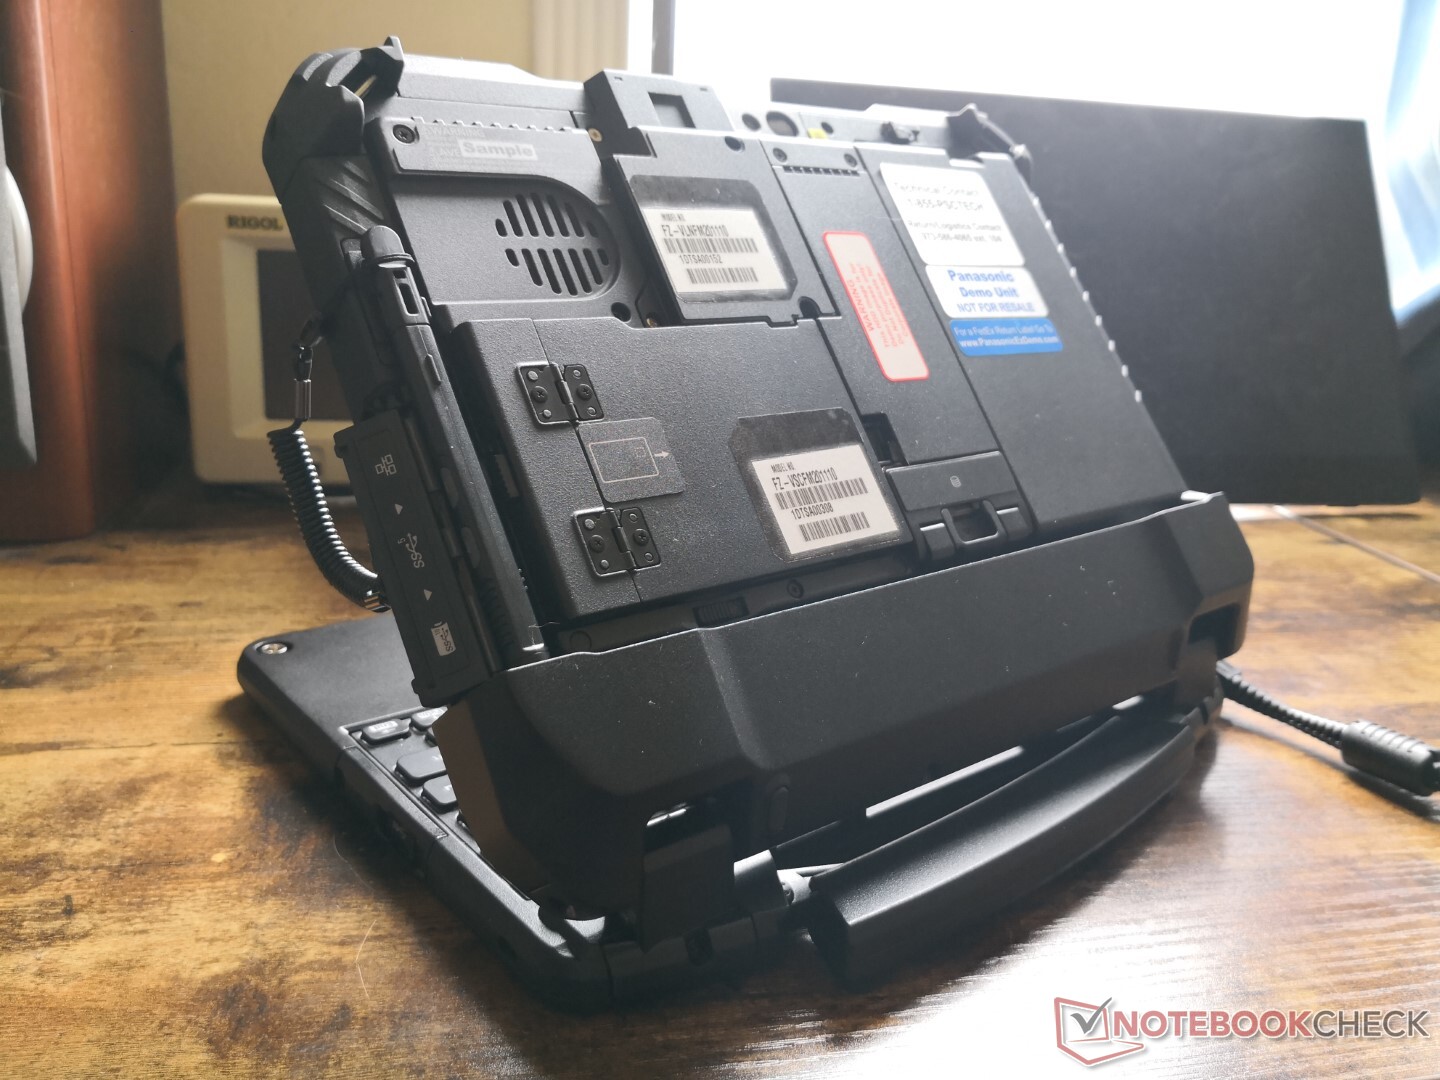
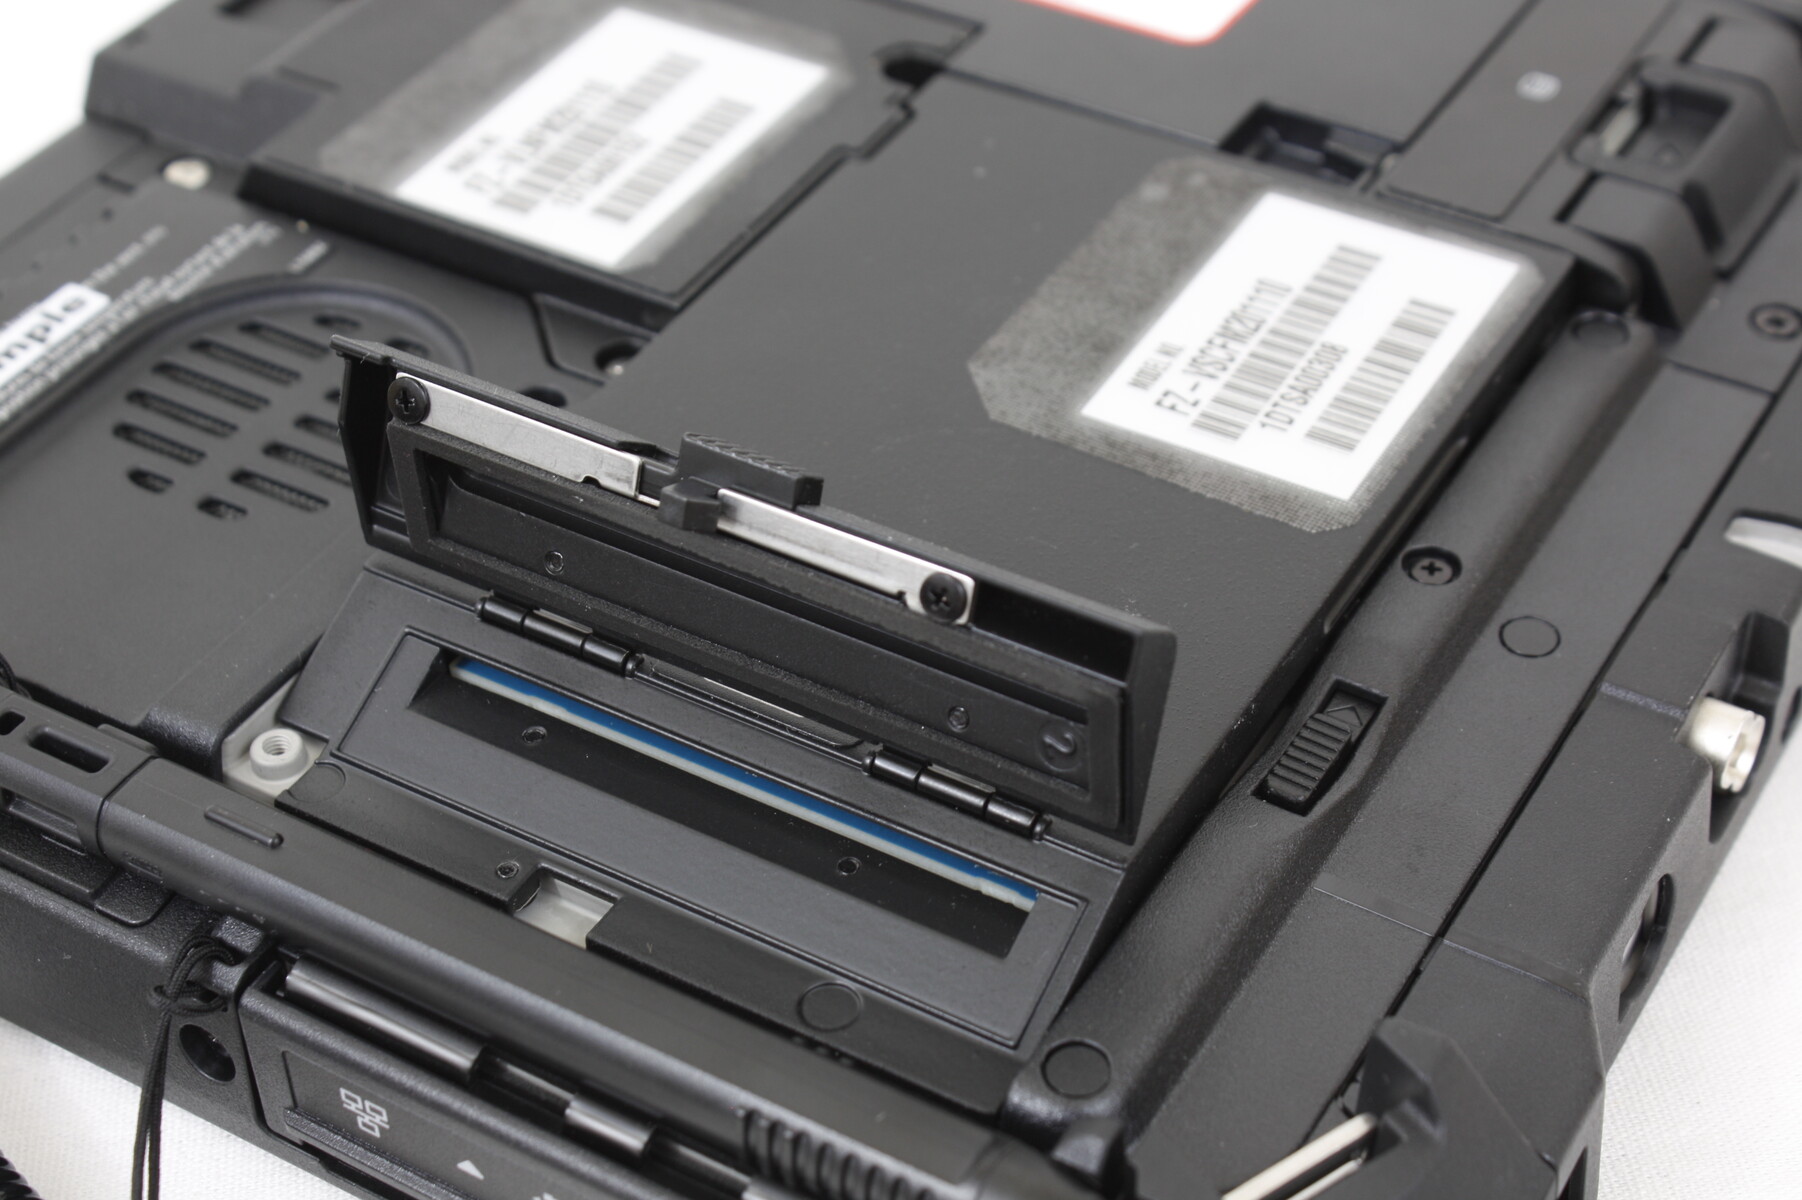
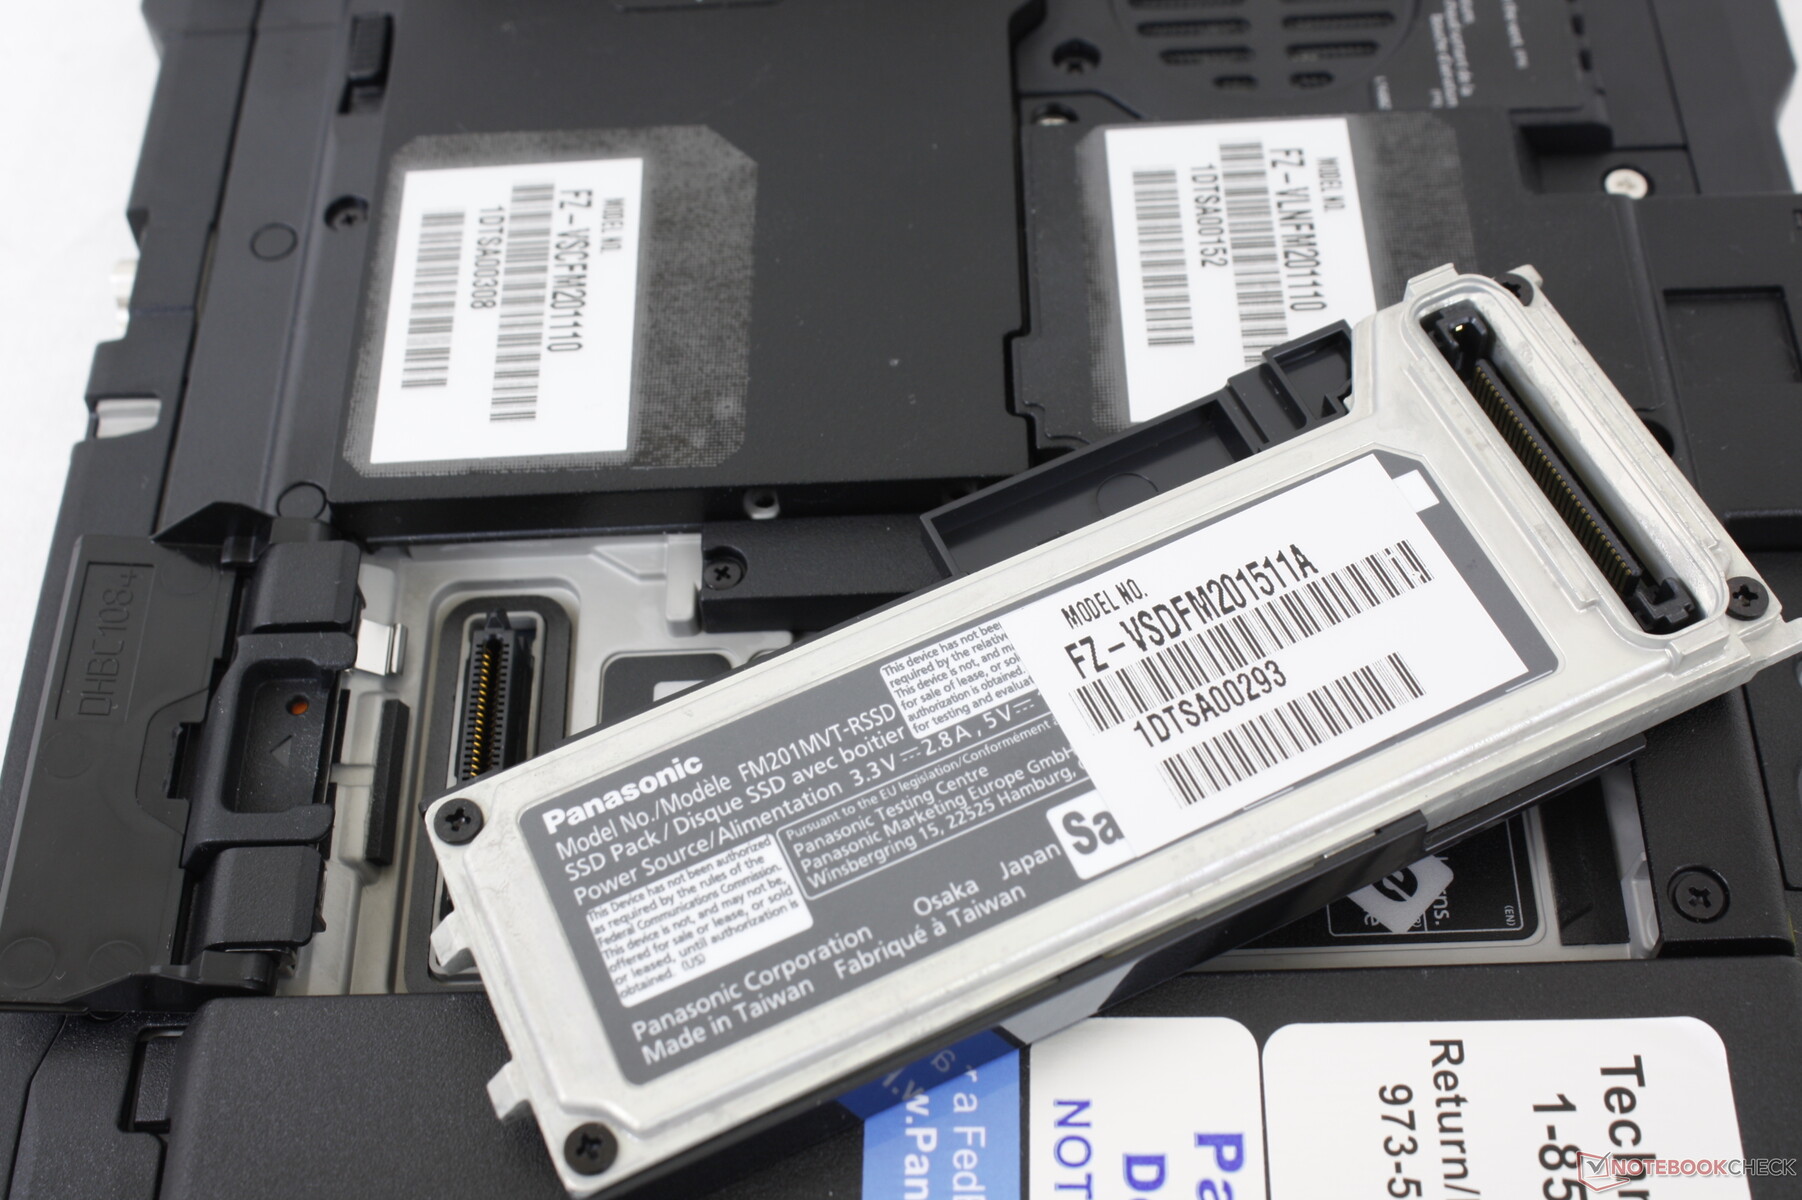
Maintenance
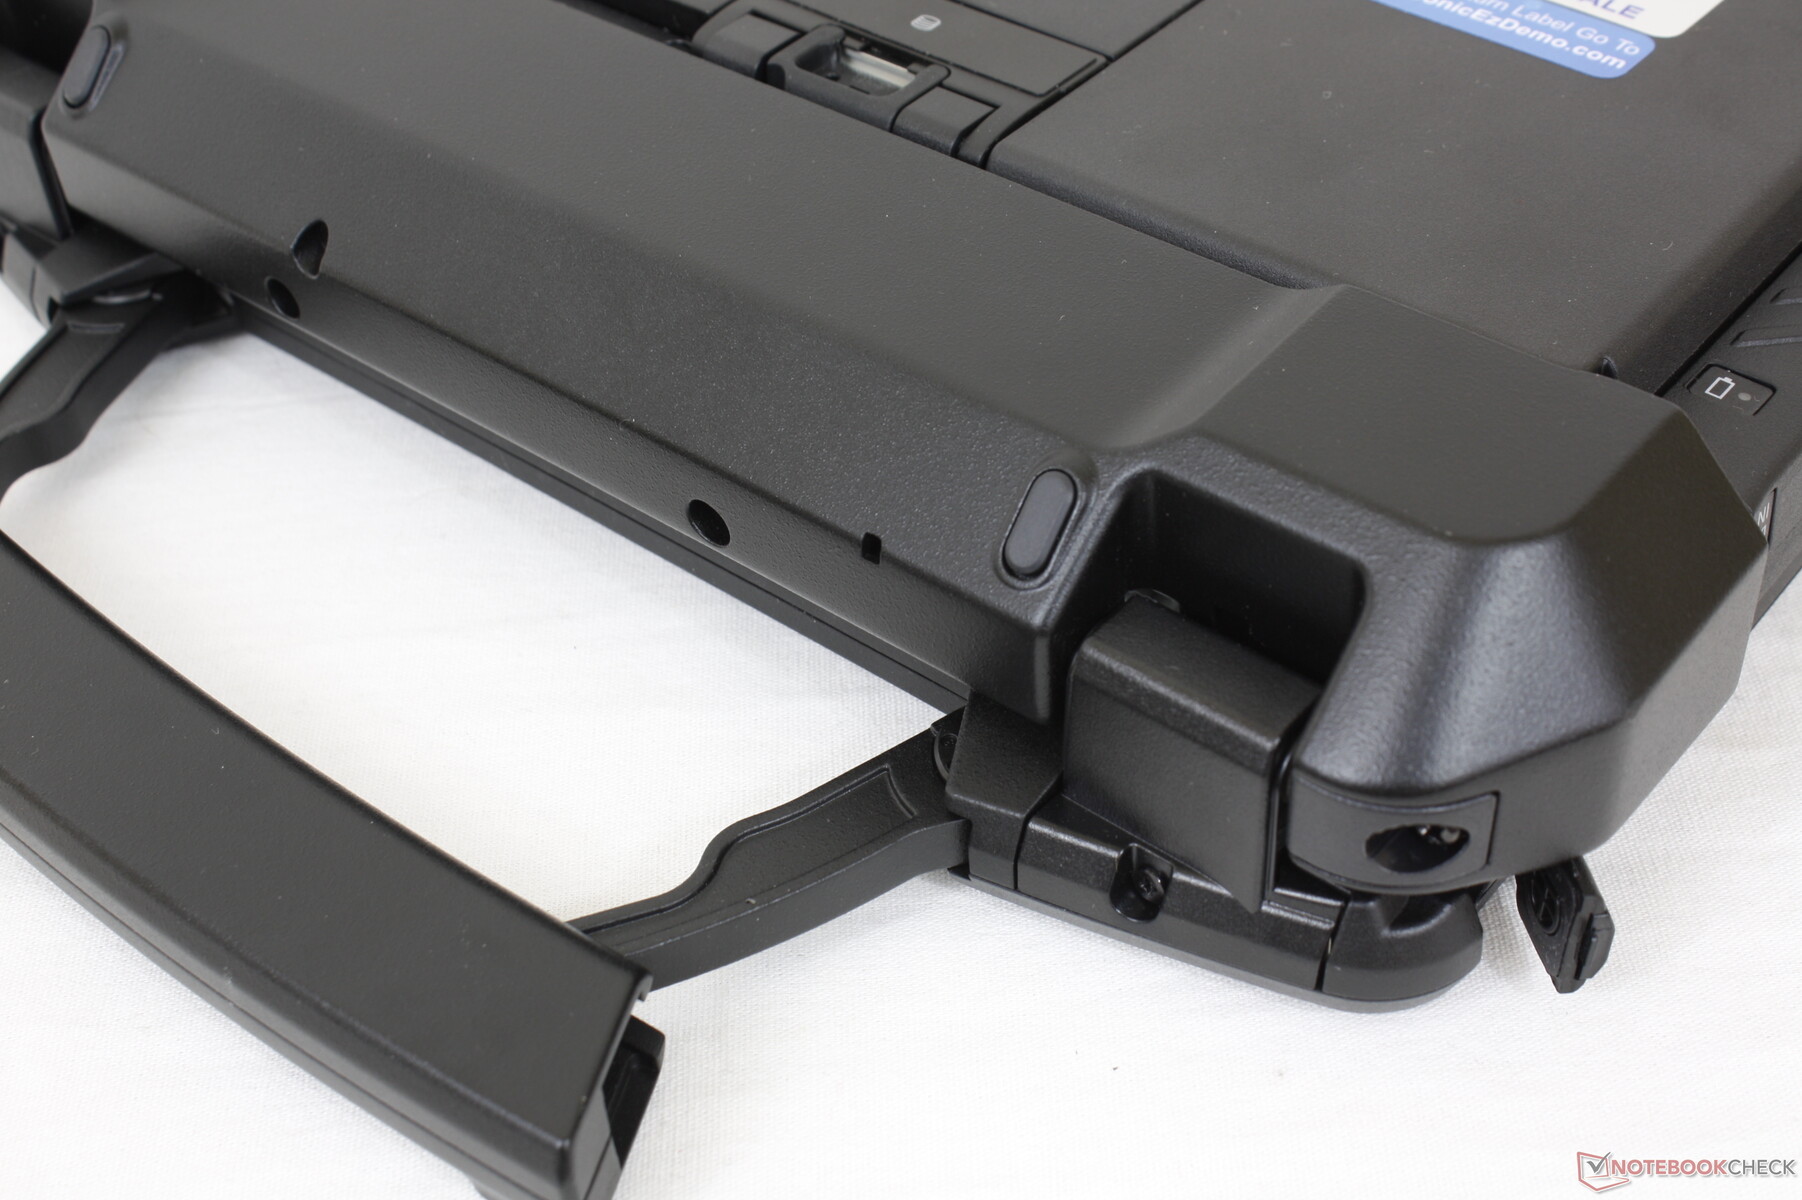
The back of the tablet includes four removable modules for the battery, storage, and two other accessories. The modules are not interchangeable meaning users must purchase their accessories from Panasonic carefully. The battery and storage modules are secured by latches while the other two will require a Philips screwdriver to install.
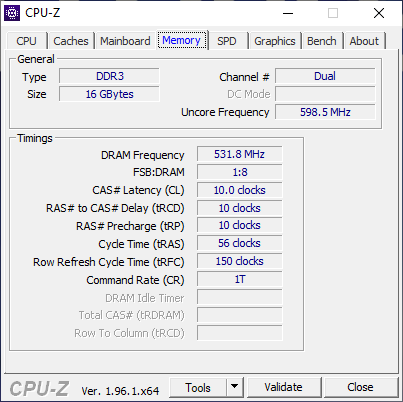
RAM is soldered and not user upgradeable.
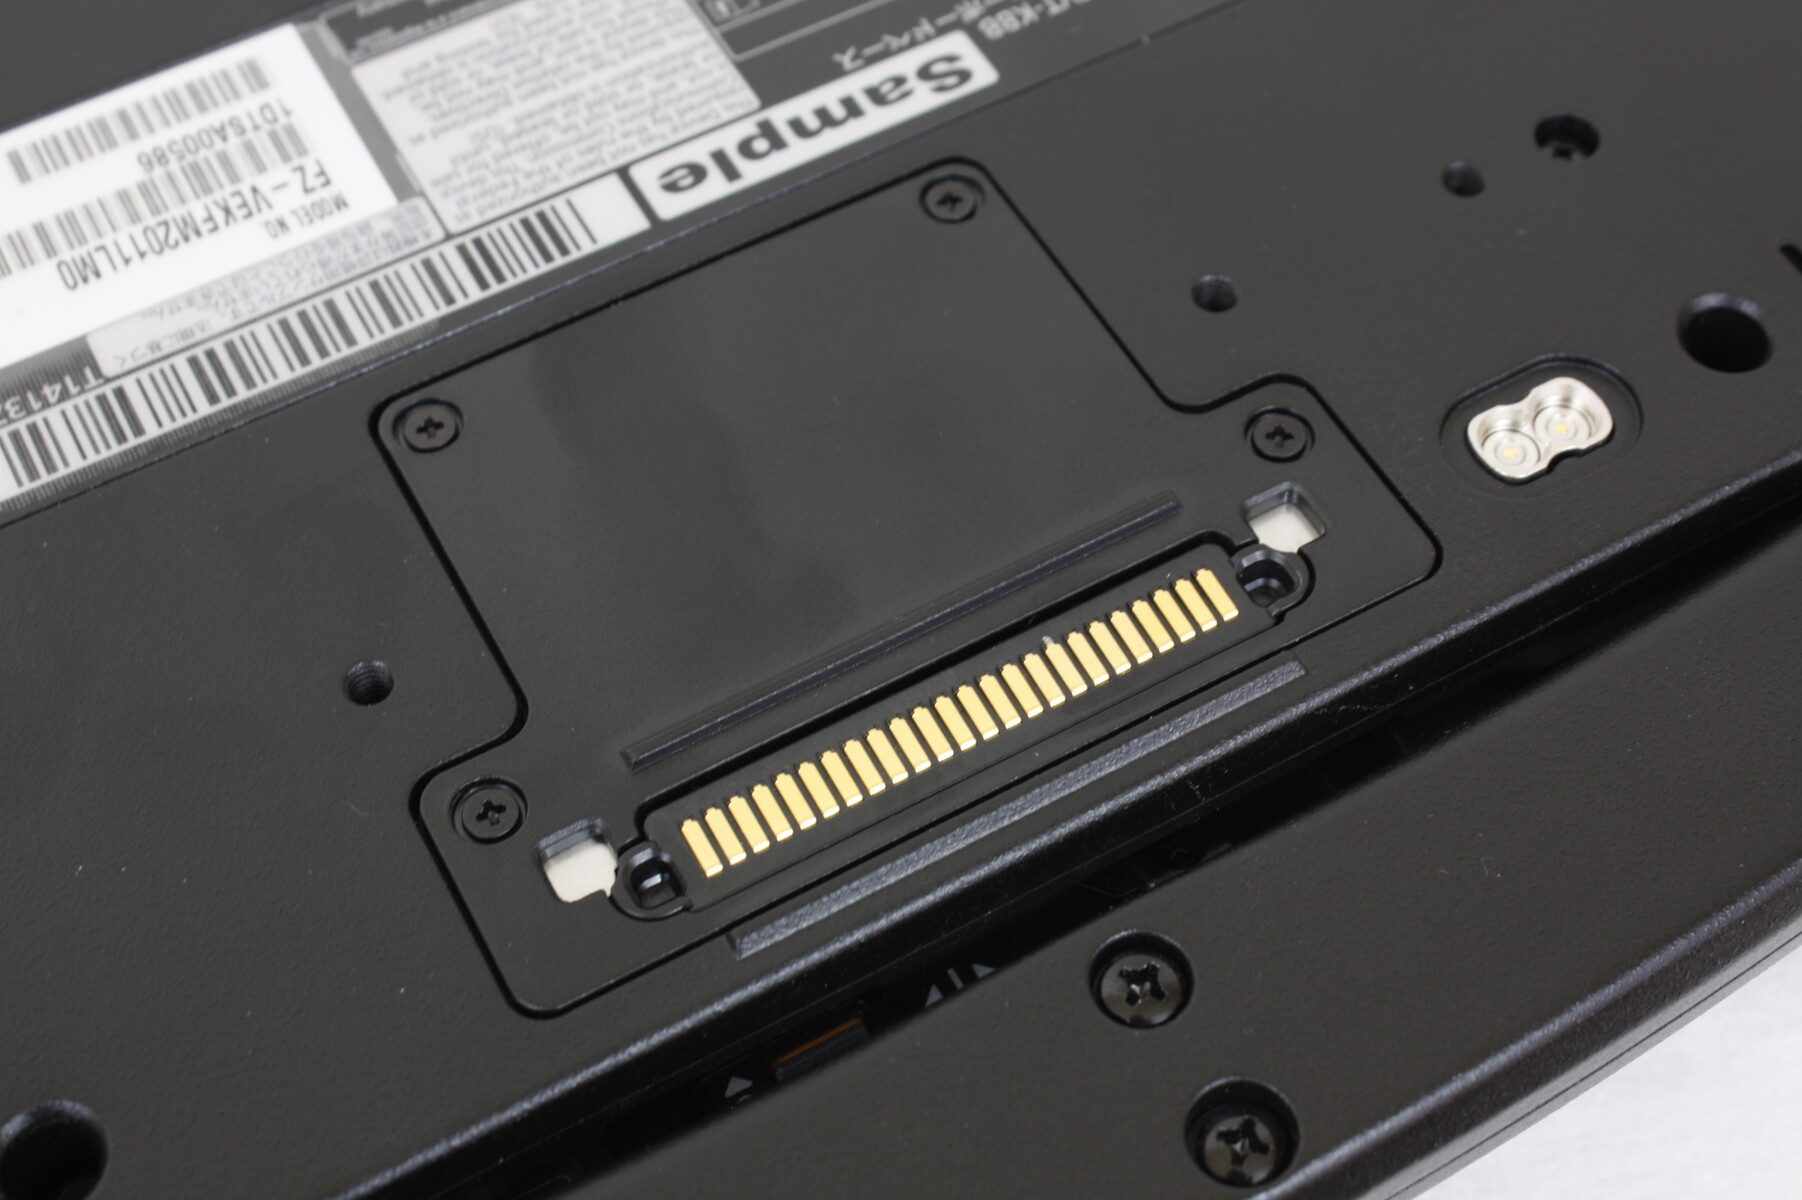
Accessories and Warranty
Panasonic offers a wide variety of accessories that connect to the rear of the tablet or bottom edge such as the optional keyboard dock. Examples include include a barcode reader, SmartCard reader, LAN adapter, OPAL SSD, and more.
A three-year manufacturer warranty comes standard.
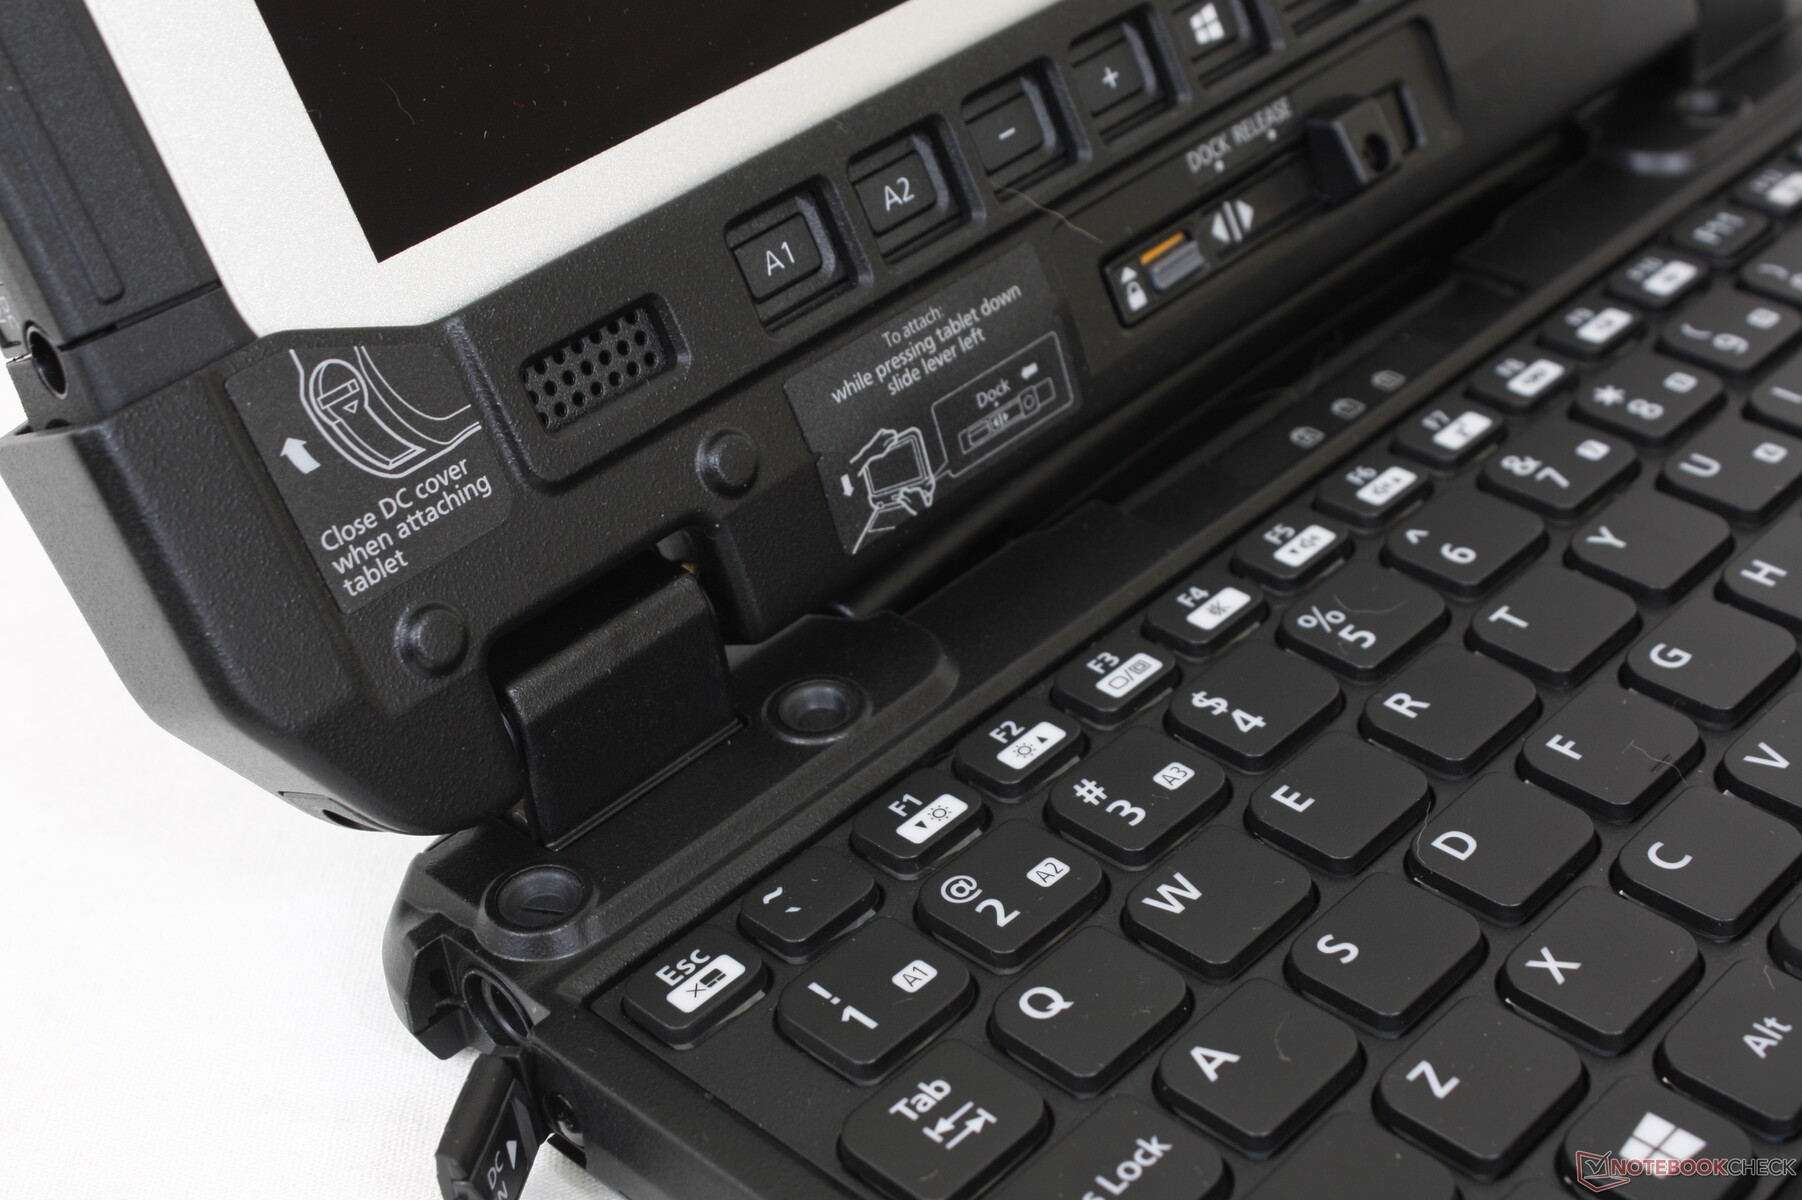
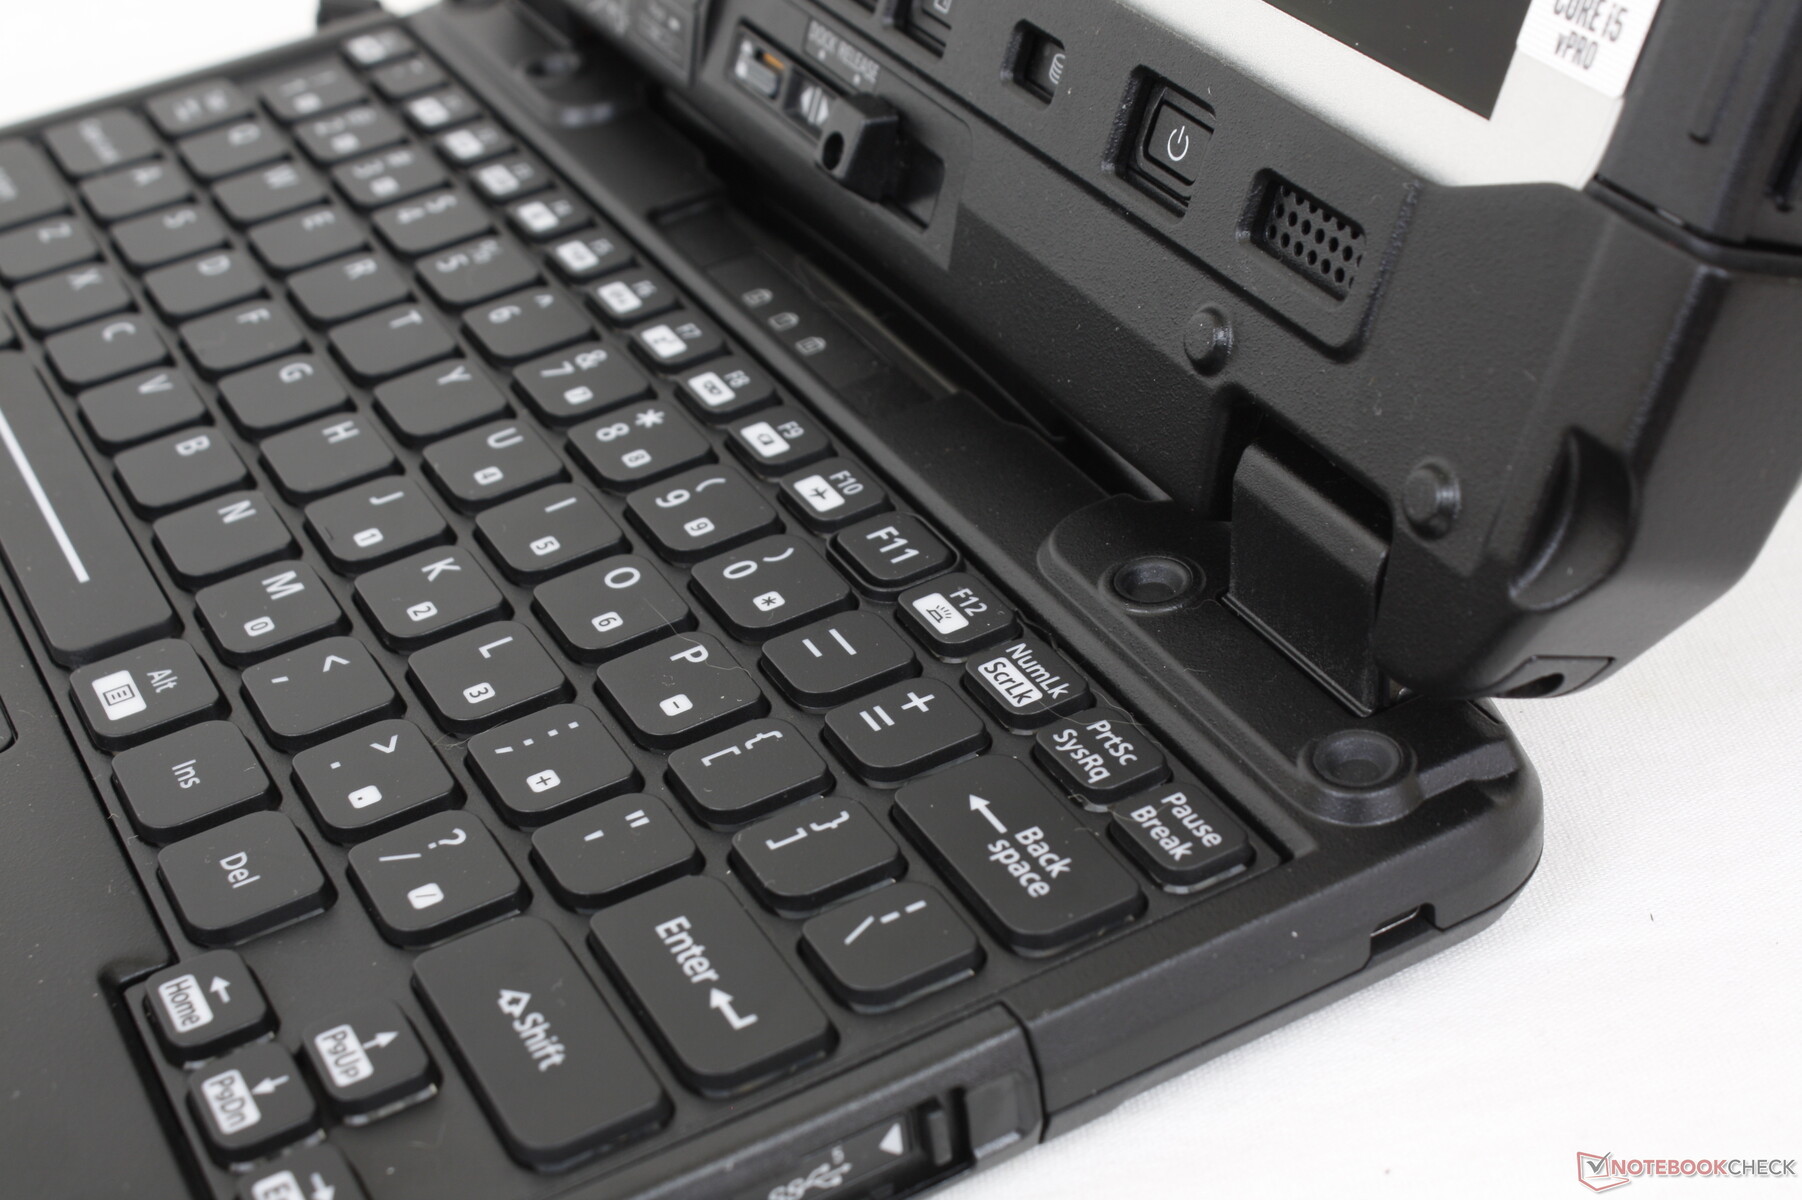
Input Devices
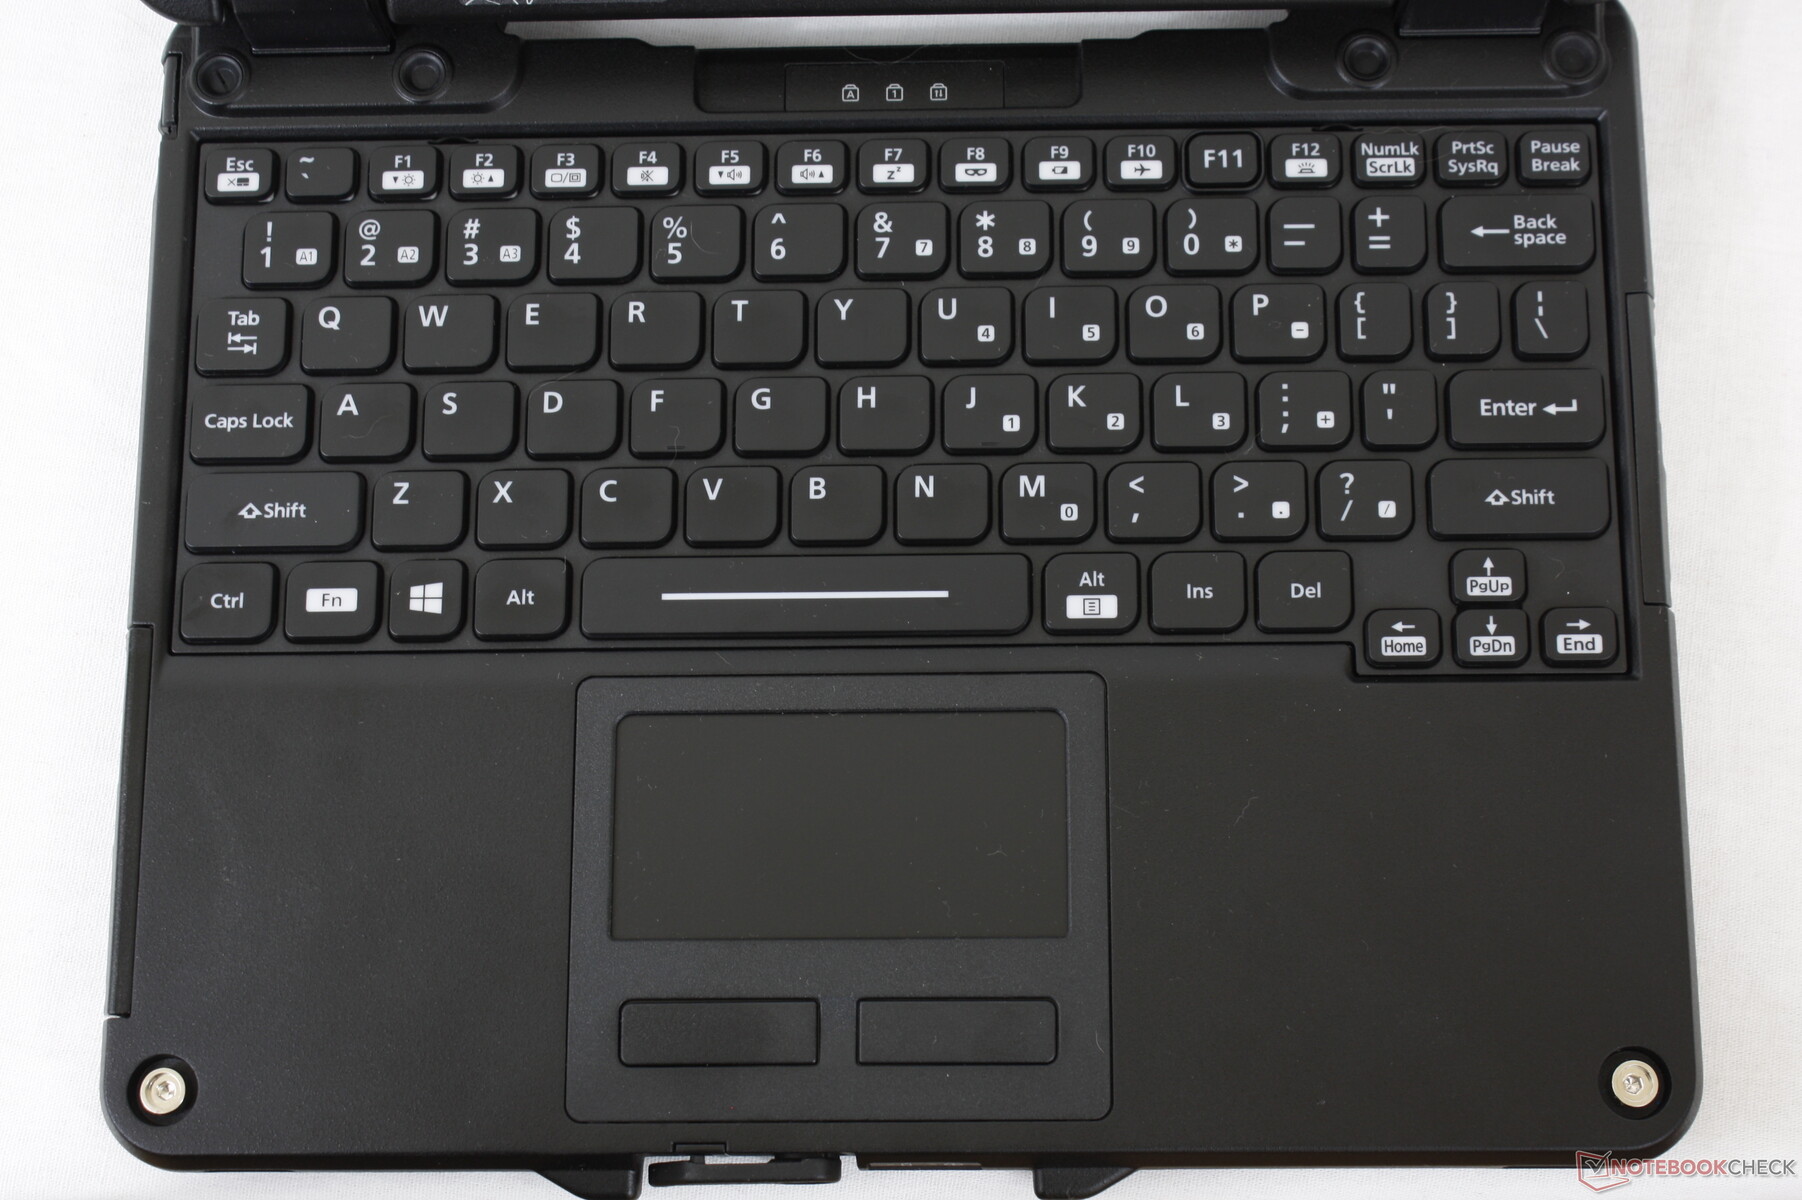
Keyboard
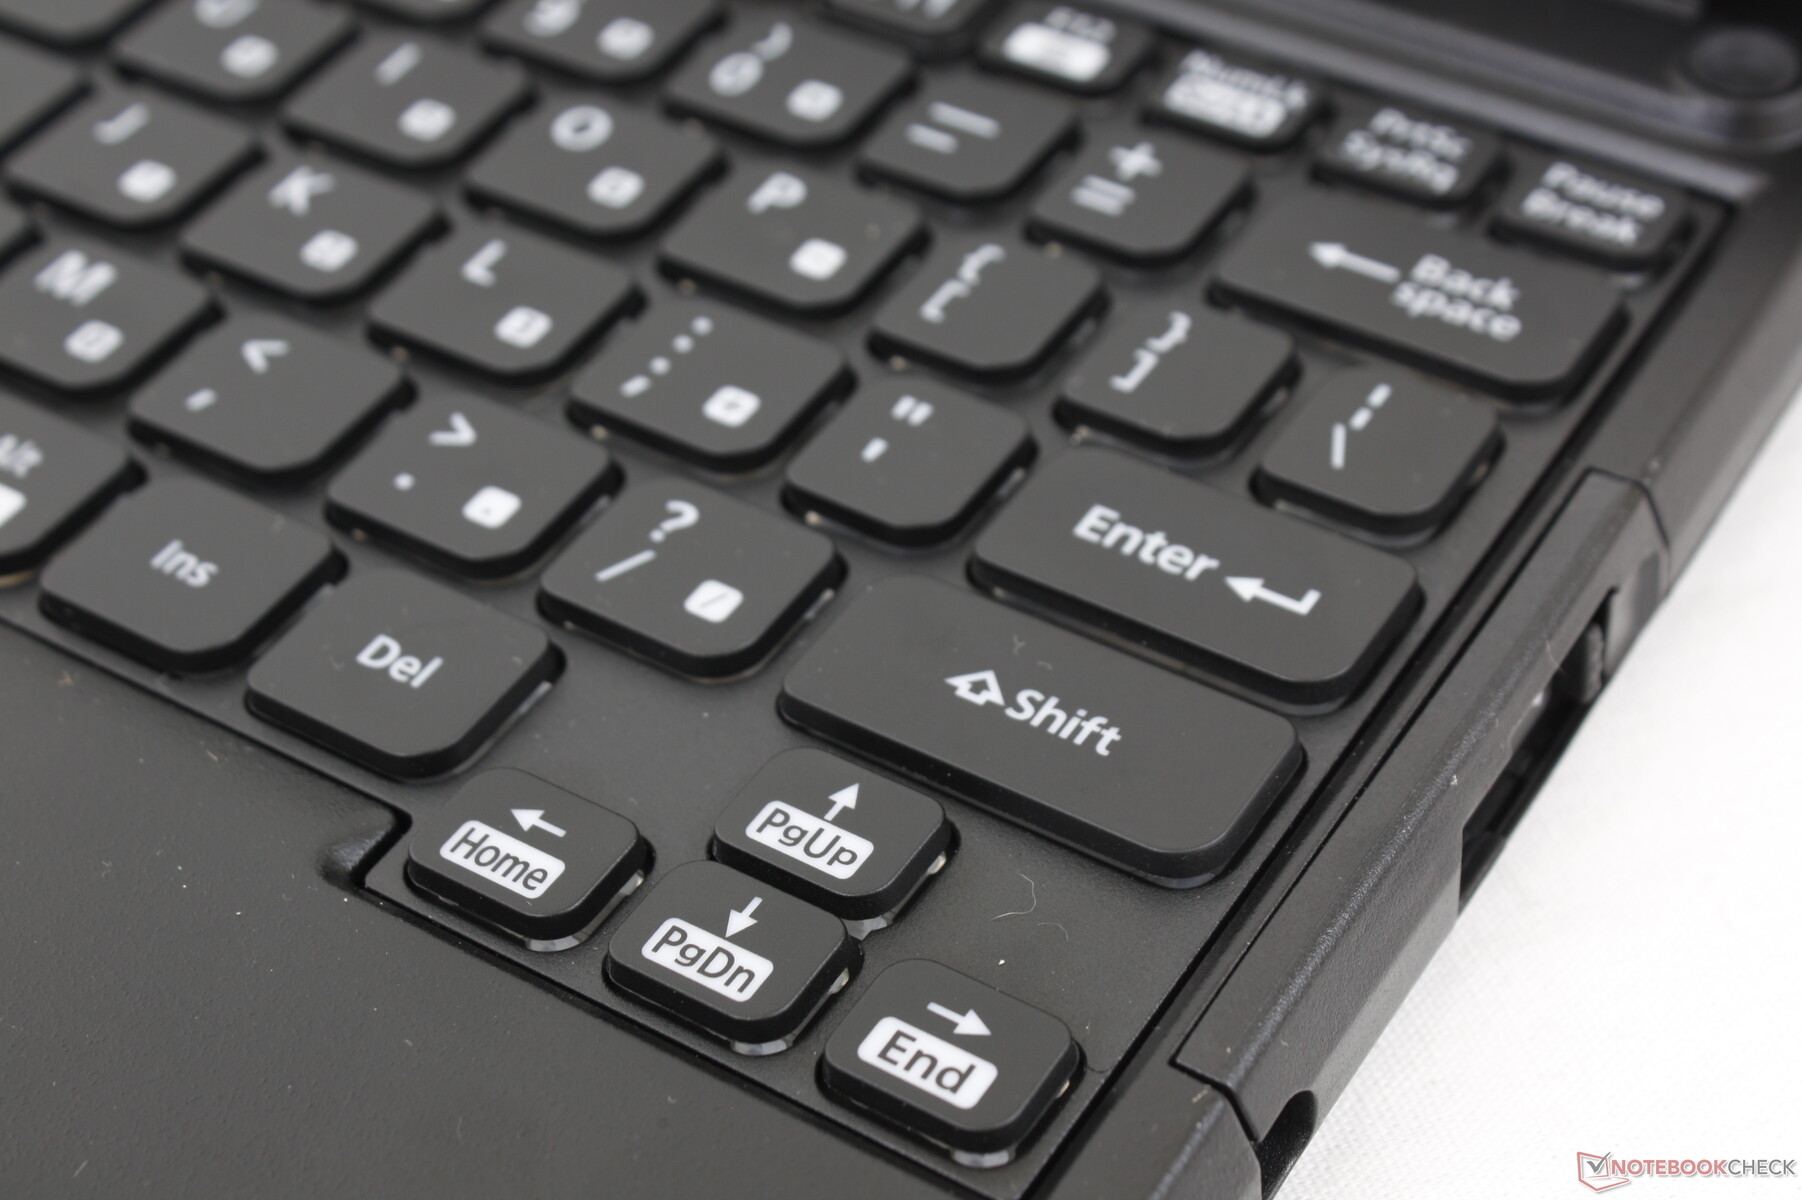
The keyboard is comfortable and even better than the keyboards on most consumer detachables in terms of tactility like the Microsoft Surface Pro or Dell Latitude 13 7320. Clearly, the heavier weight and thicker profile of the Panasonic dock help make the keys firmer and deeper for more satisfying feedback.
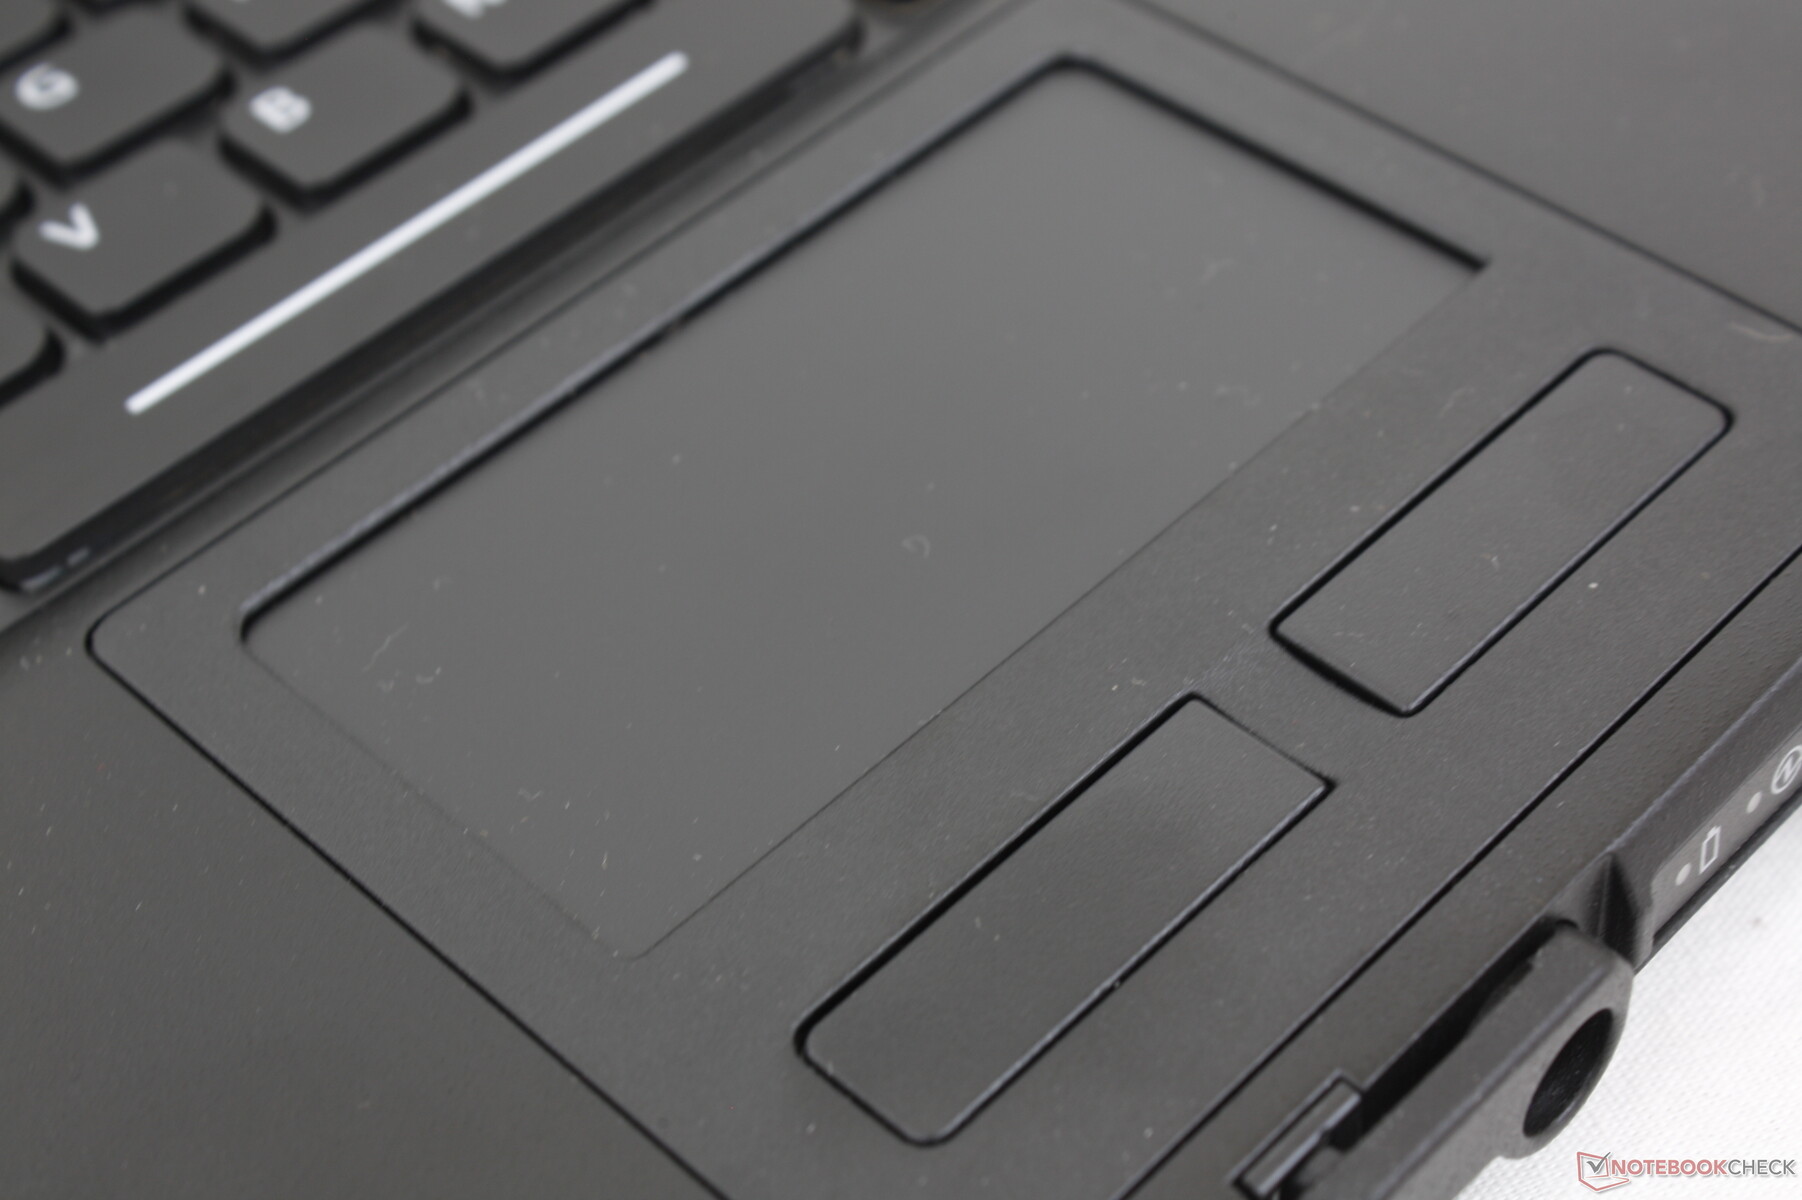
Touchpad
The small touchpad (7.9 x 4 cm) is smooth and compatible with gloves. Unfortunately, the cursor is jumpy even when gliding at constant speed with a bare finger. Regular cursor control is therefore more frustrating than it needs to be.
The dedicated buttons are very shallow in travel despite the thick base. Feedback is subsequently weak and unsatisfying.

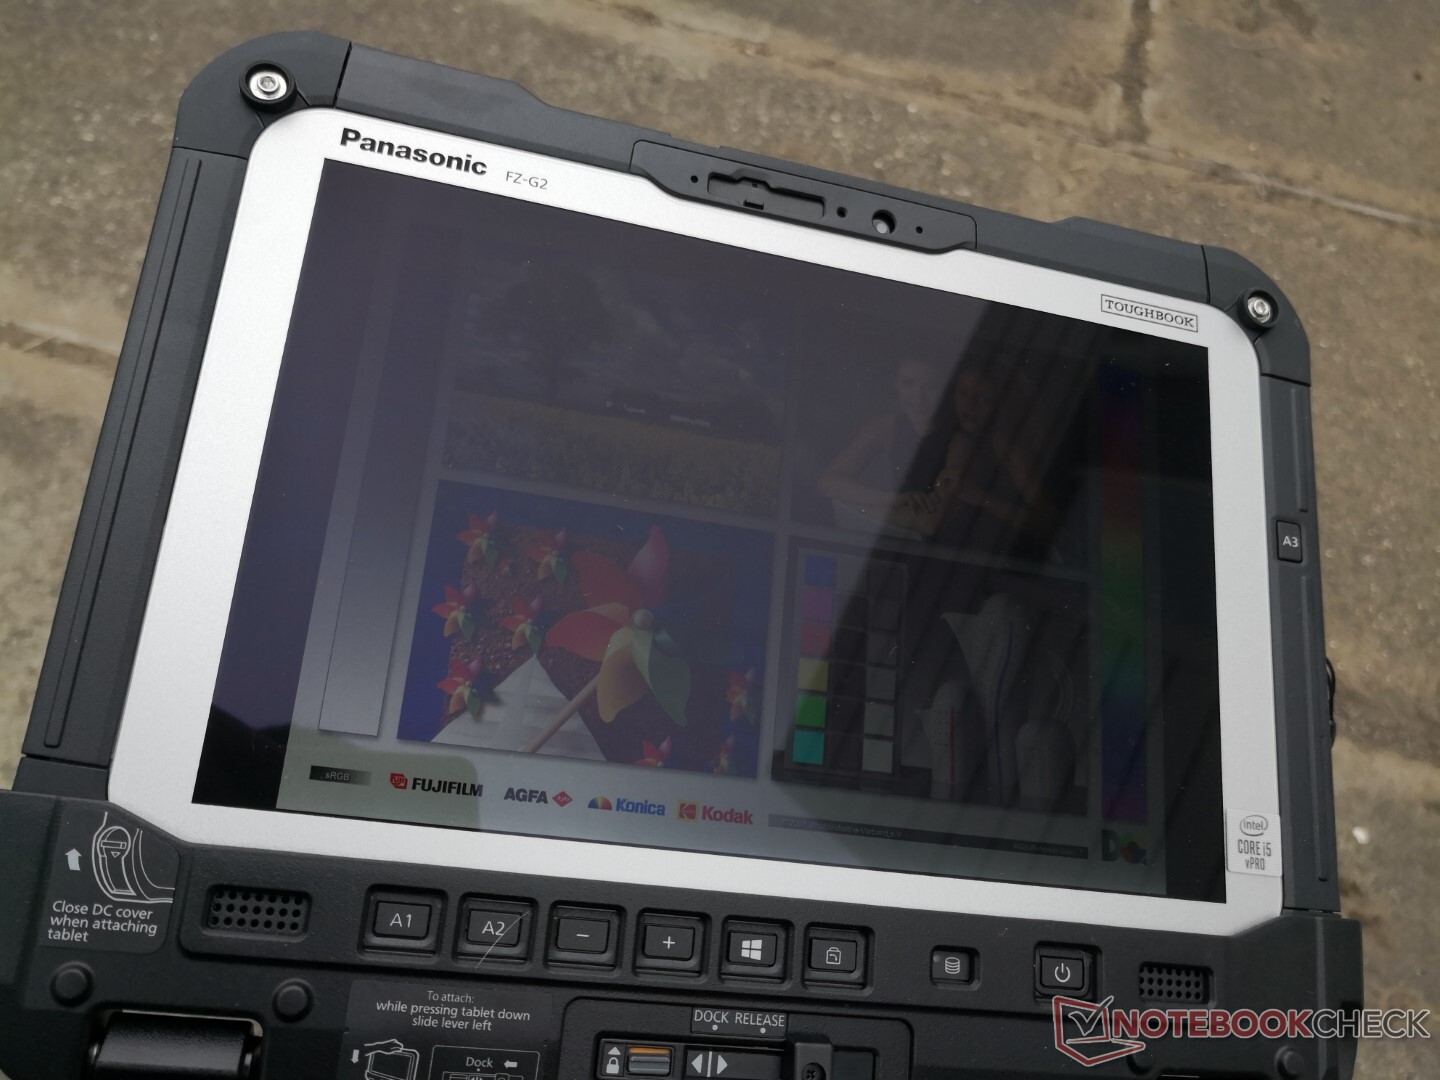
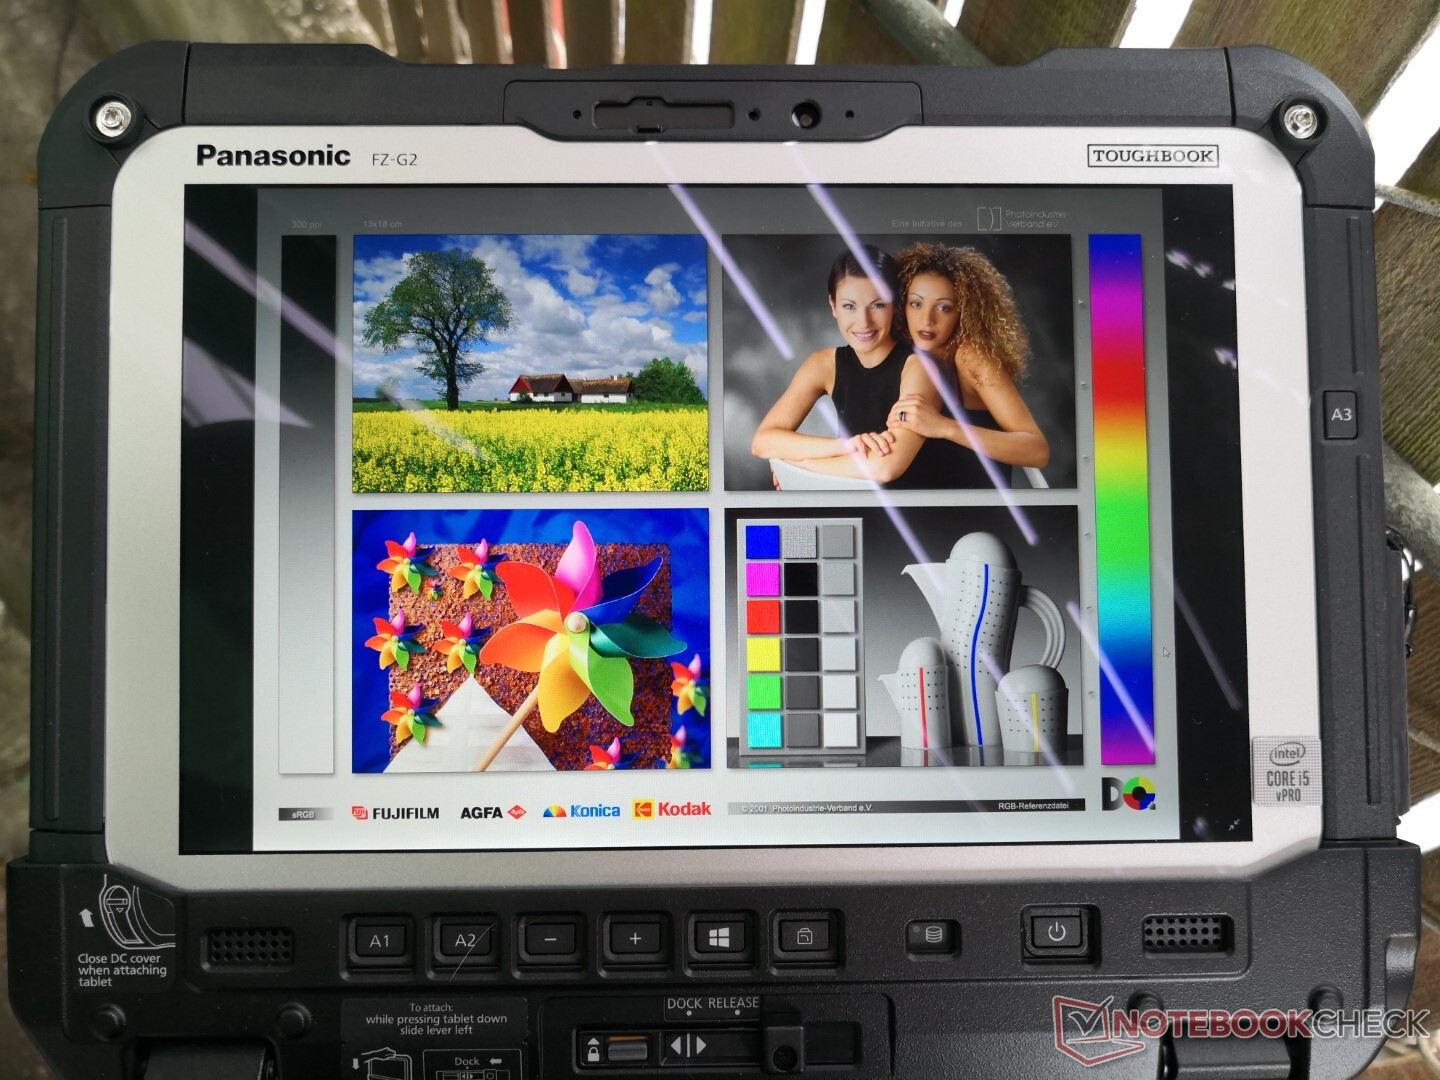
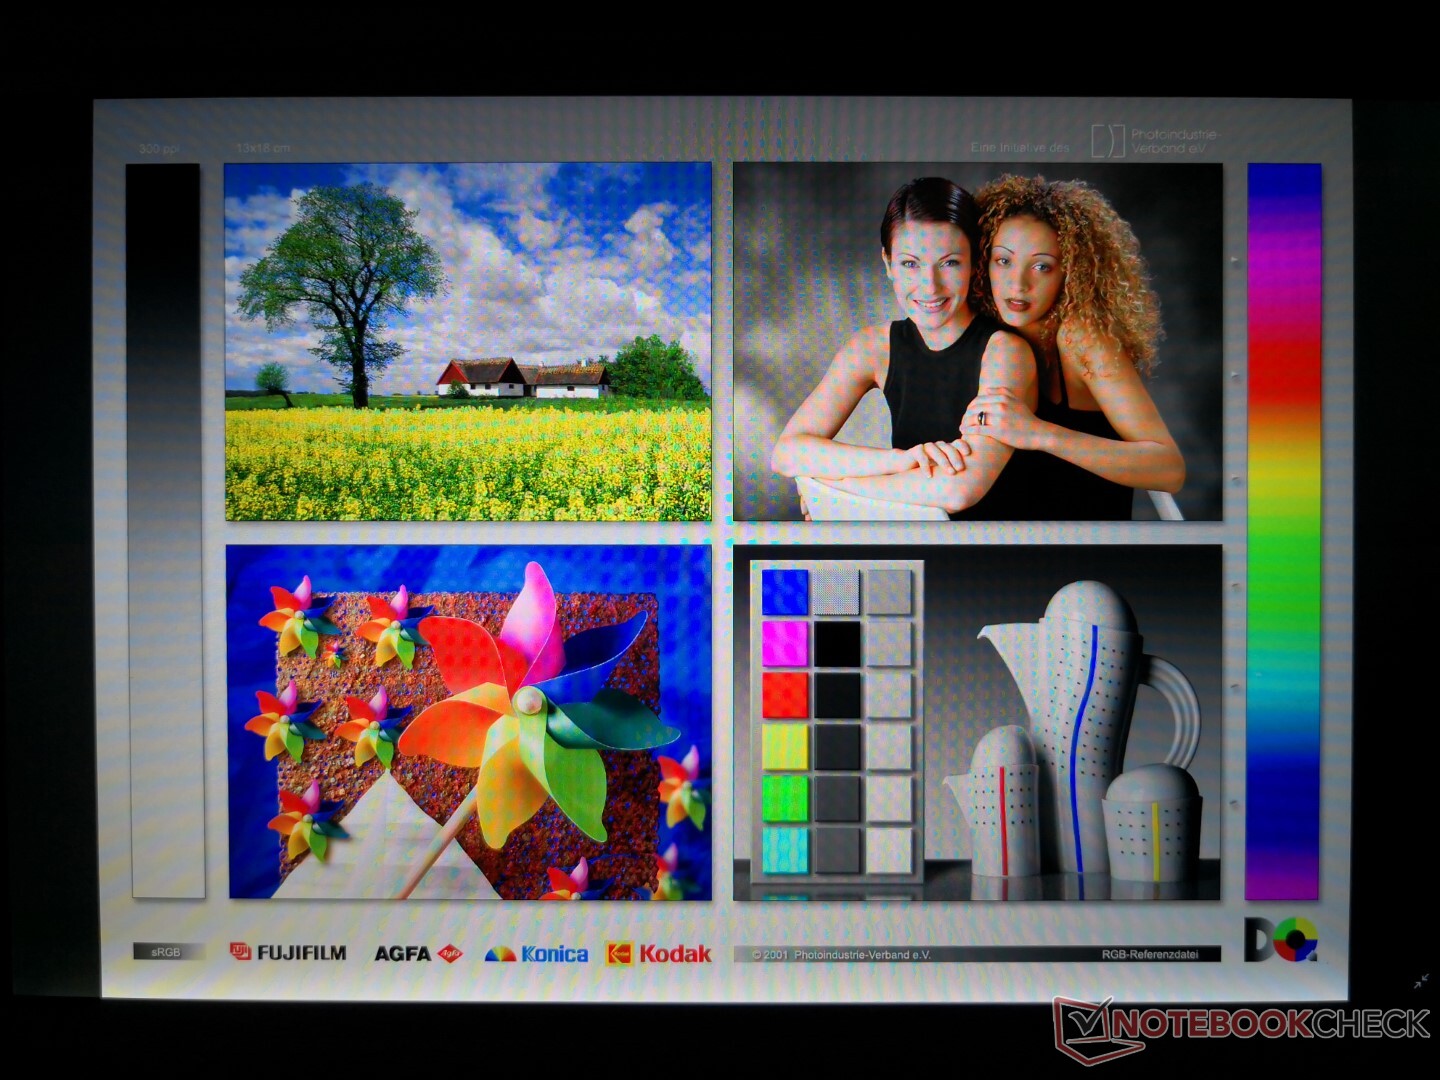
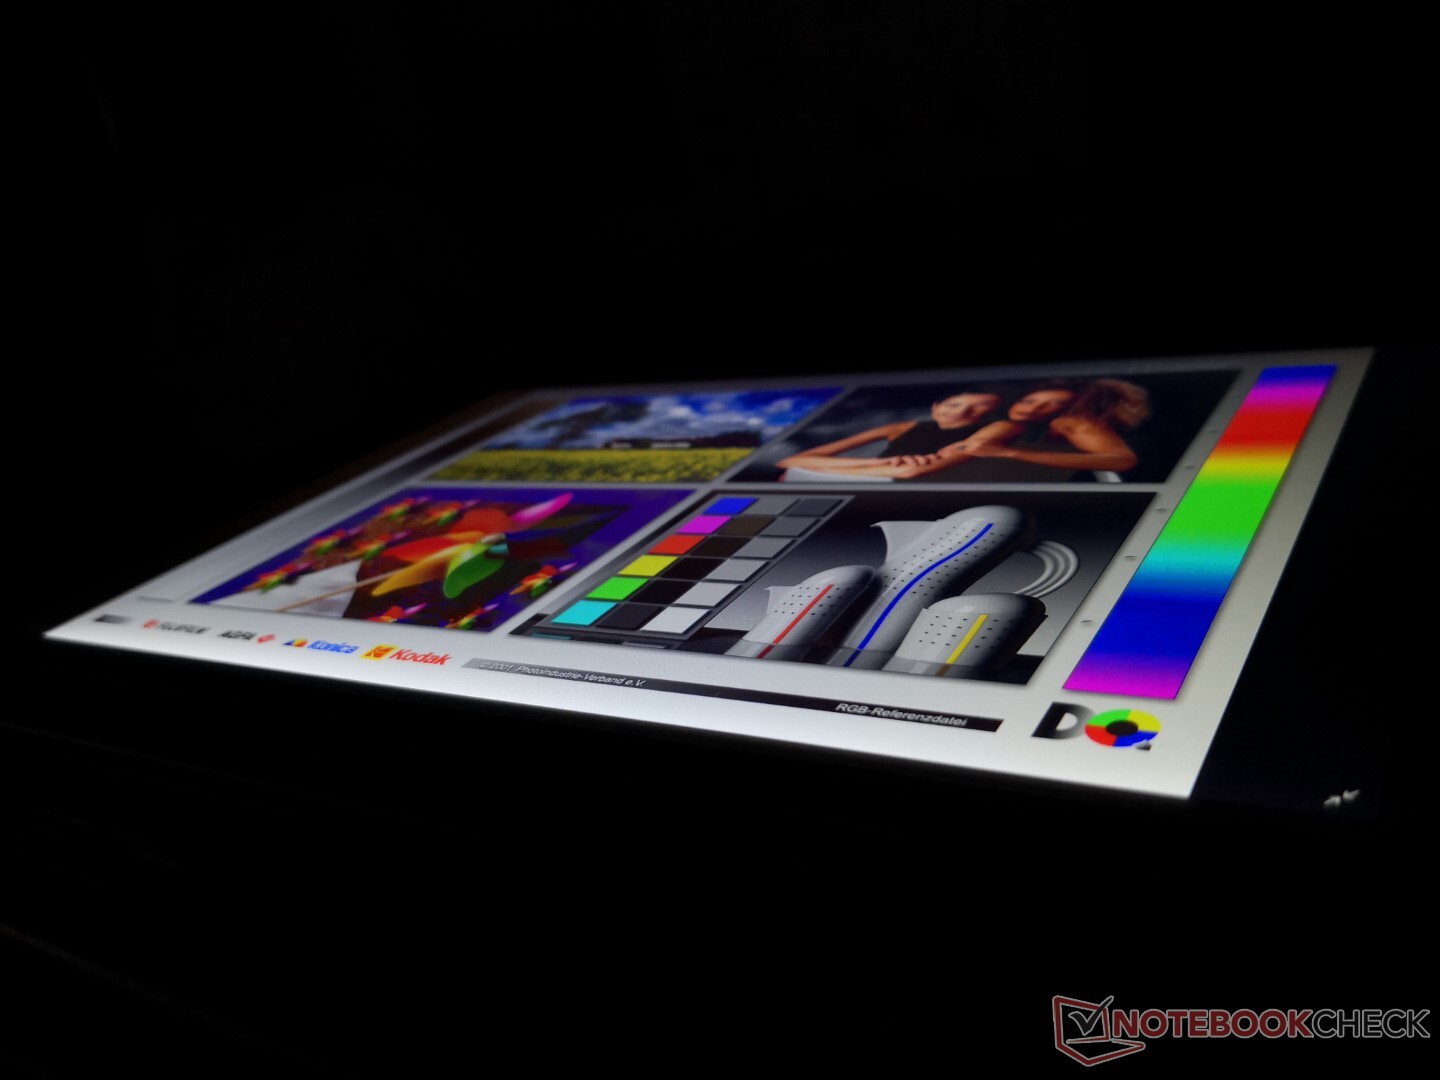
Display
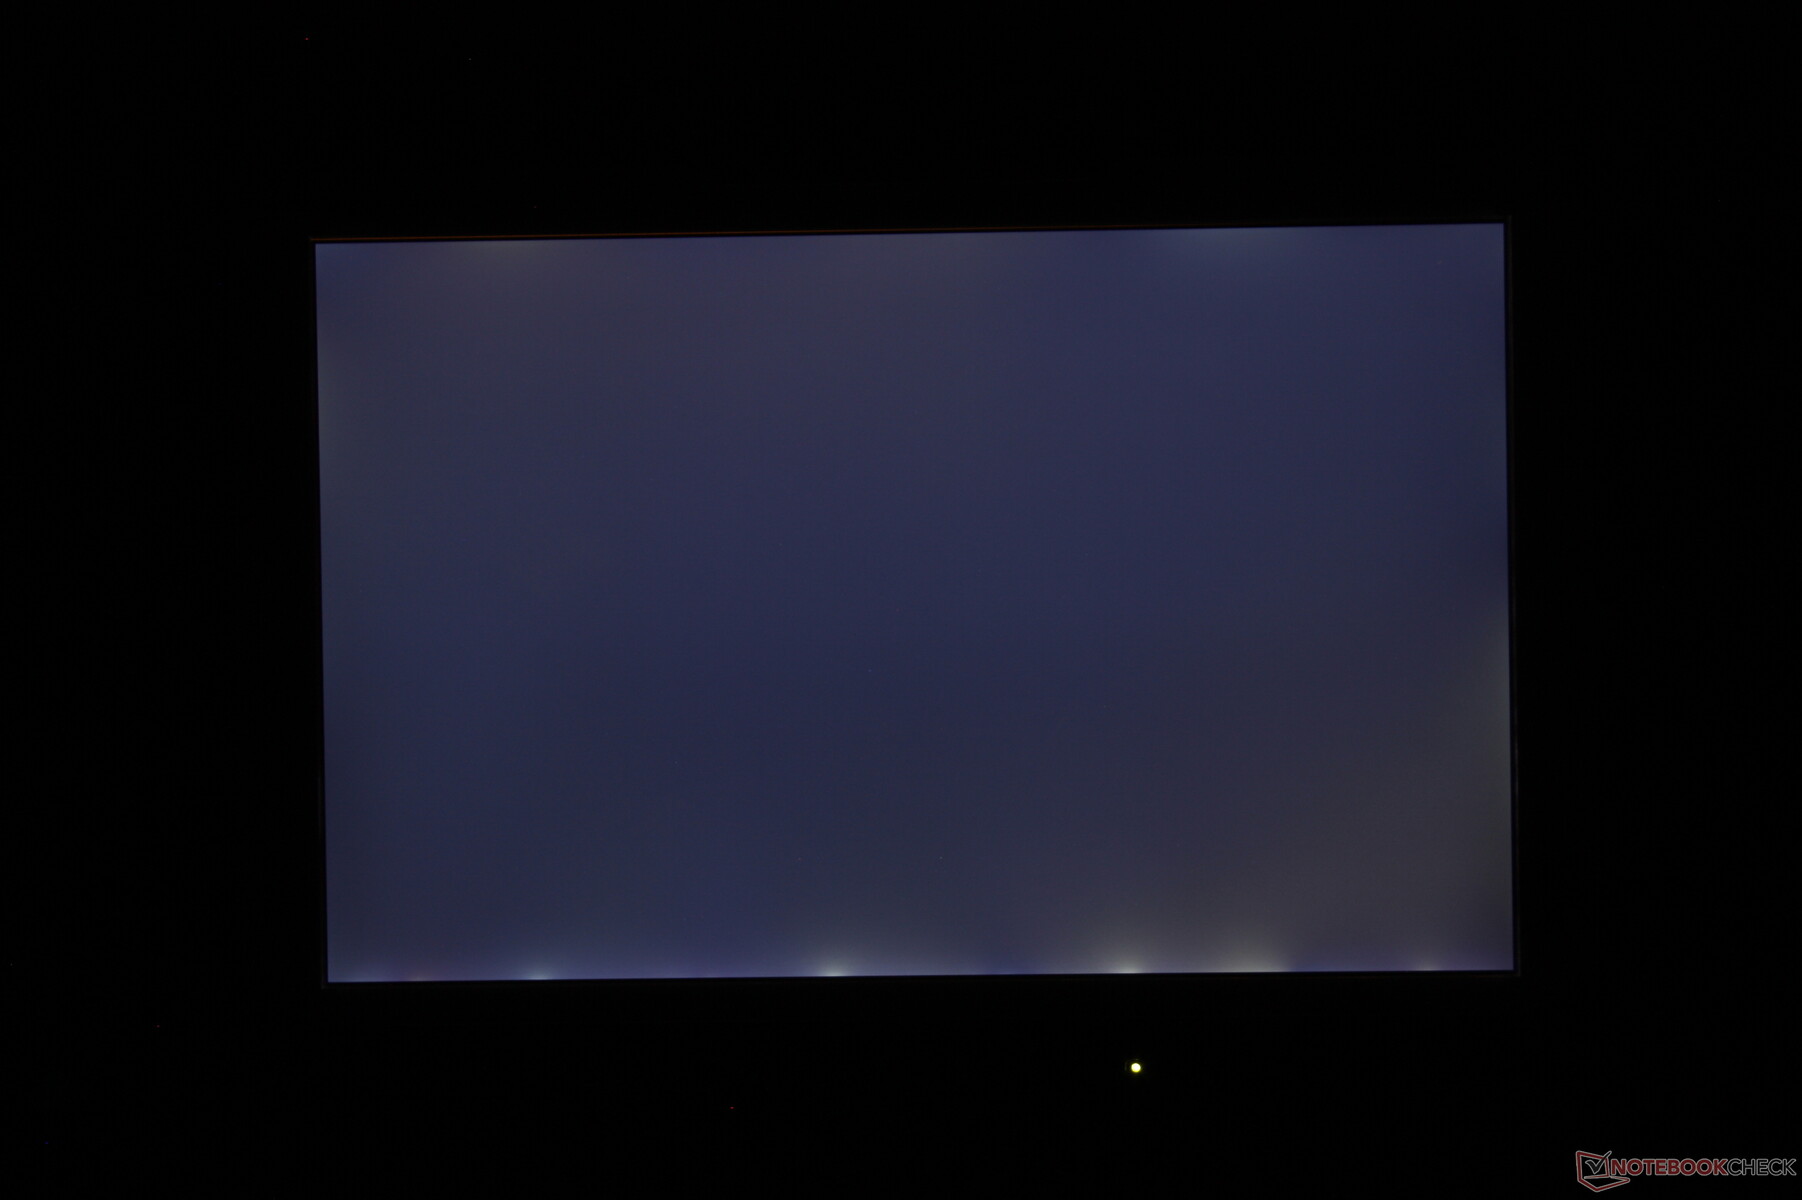
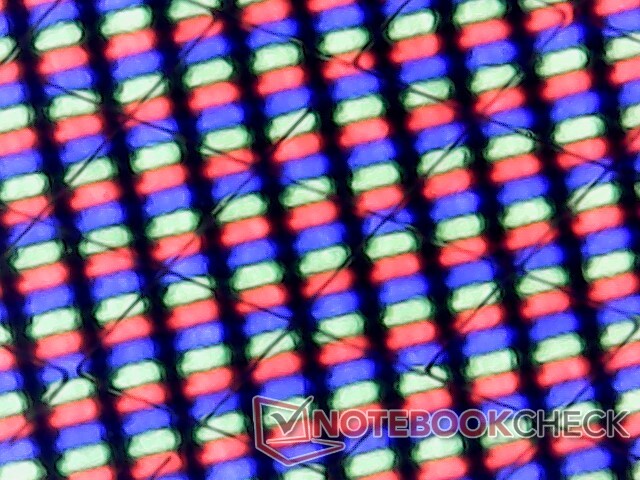
The displays on rugged tablets are traditionally high in brightness with poorer colors, grainier text, and lower native resolutions. The Toughbook FZ-G2 breaks this trend by integrating a glossy display that is closer to a consumer tablet in terms of visual quality without negatively impacting brightness or overall rigidity. Black-white and gray-gray response times are rather slow, however, meaning ghosting is noticeable.
Pulse-width modulation or screen flickering is present on brightness levels between 0 and 7 percent.
| |||||||||||||||||||||||||
Brightness Distribution: 90 %
Center on Battery: 1078.6 cd/m²
Contrast: 2247:1 (Black: 0.48 cd/m²)
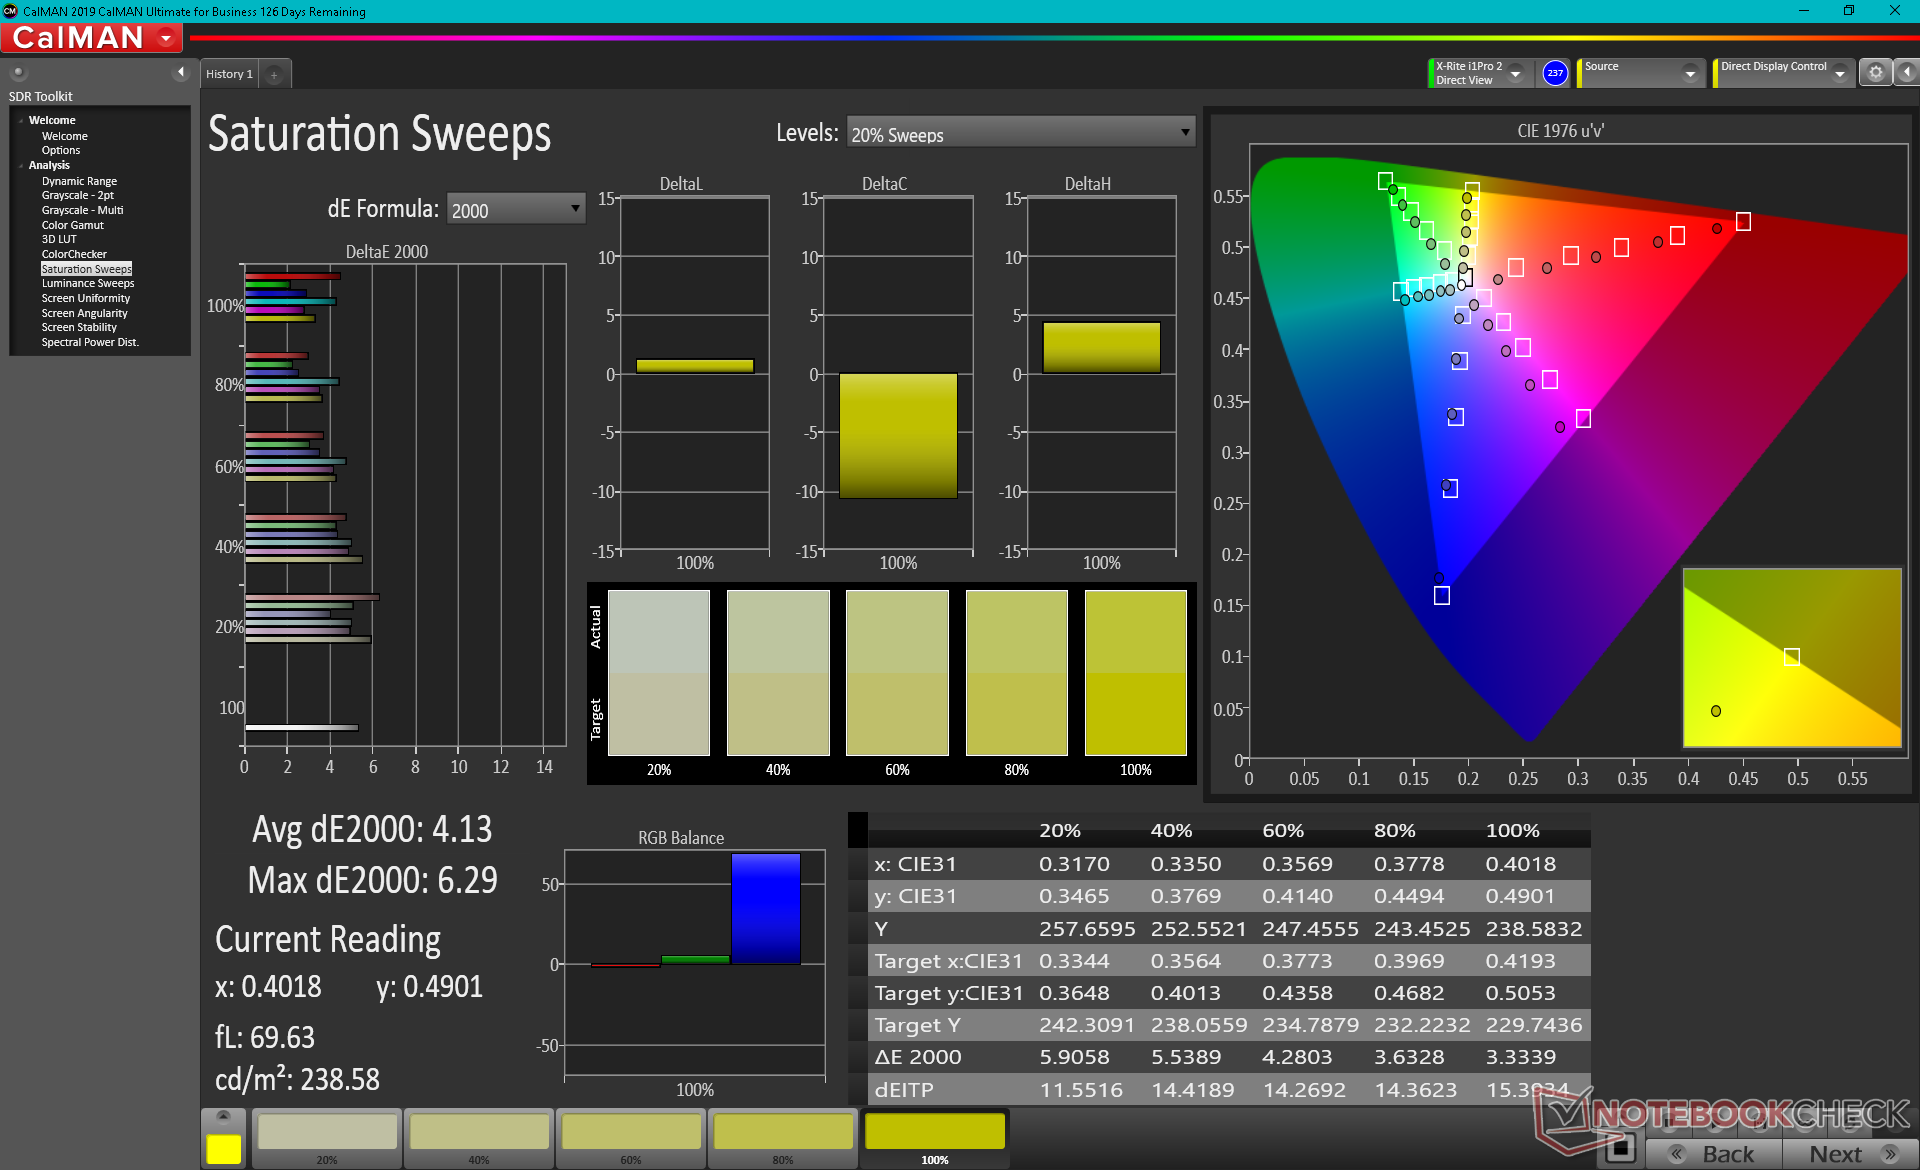
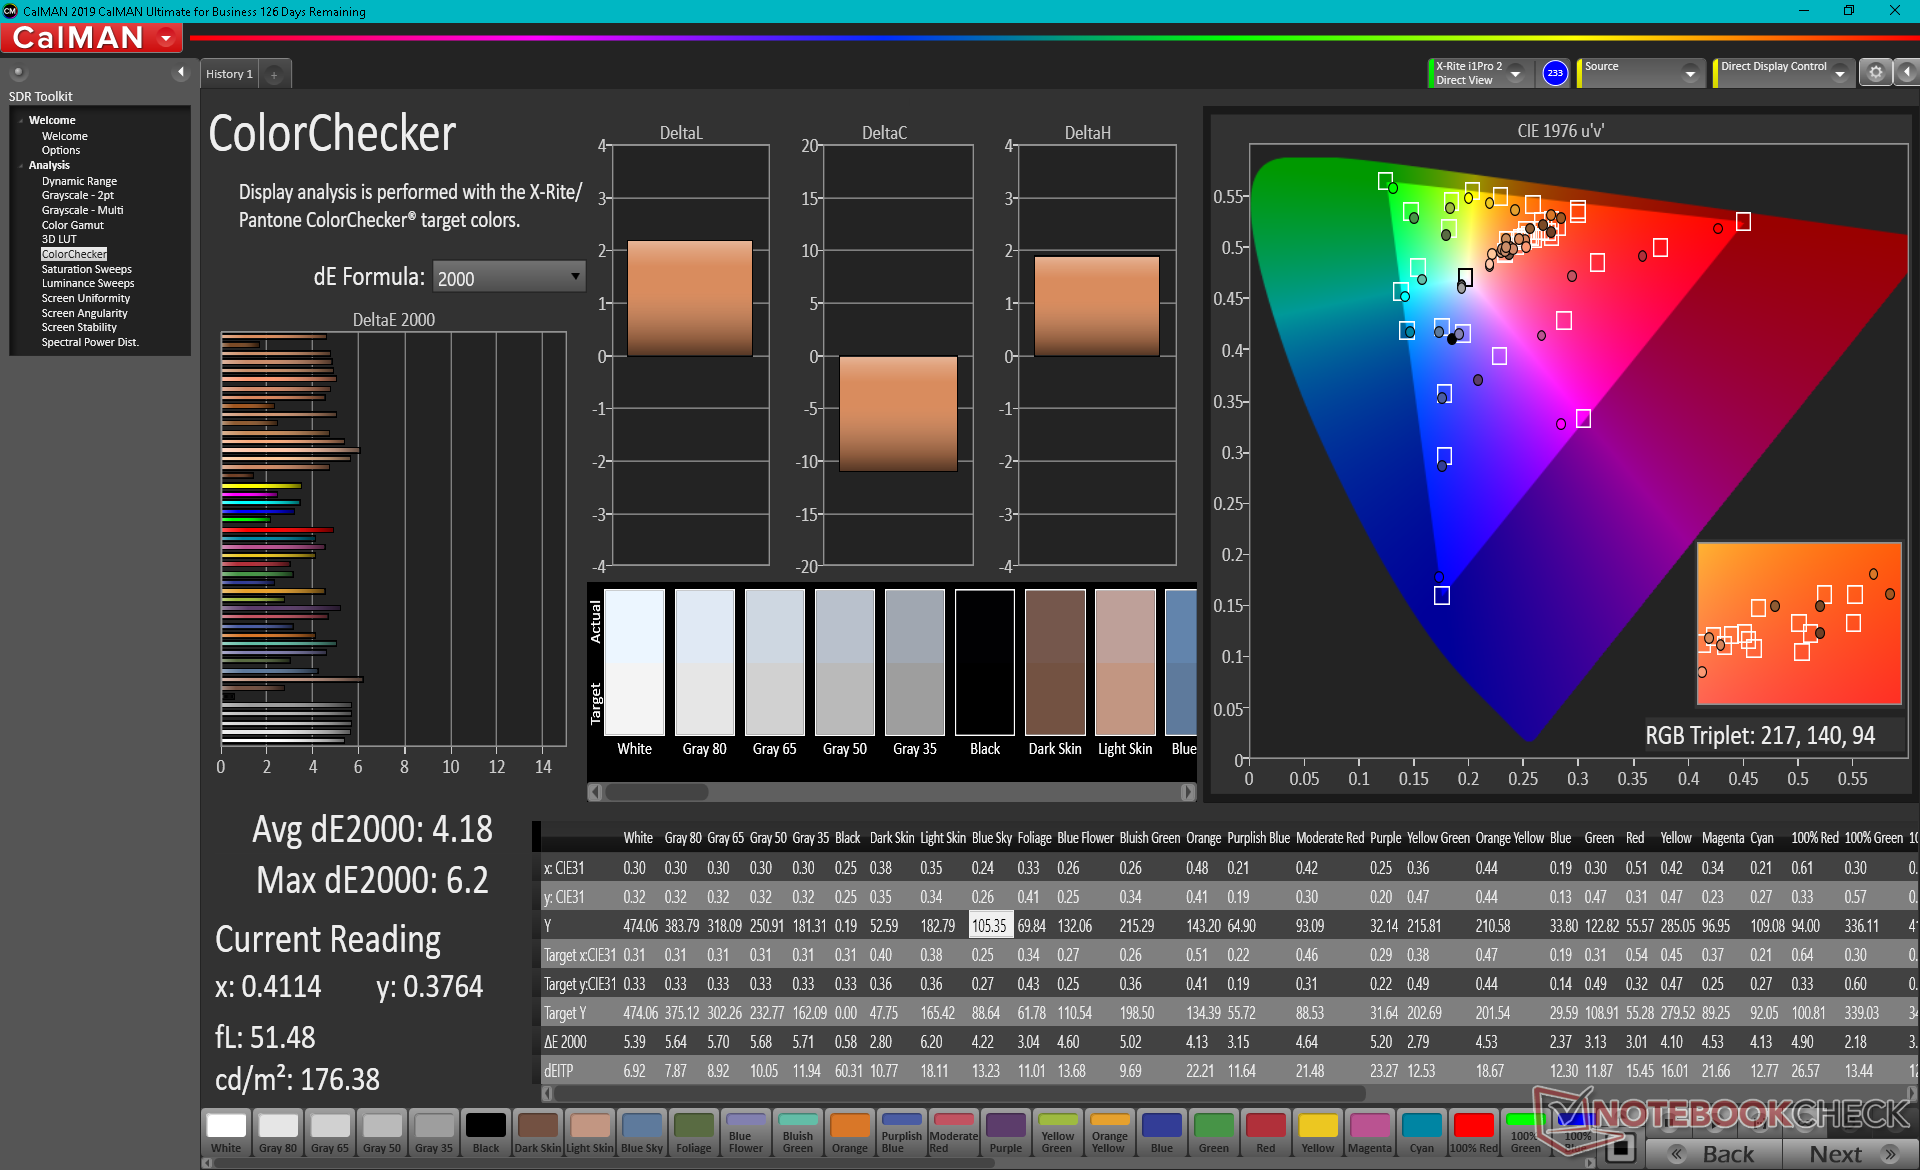
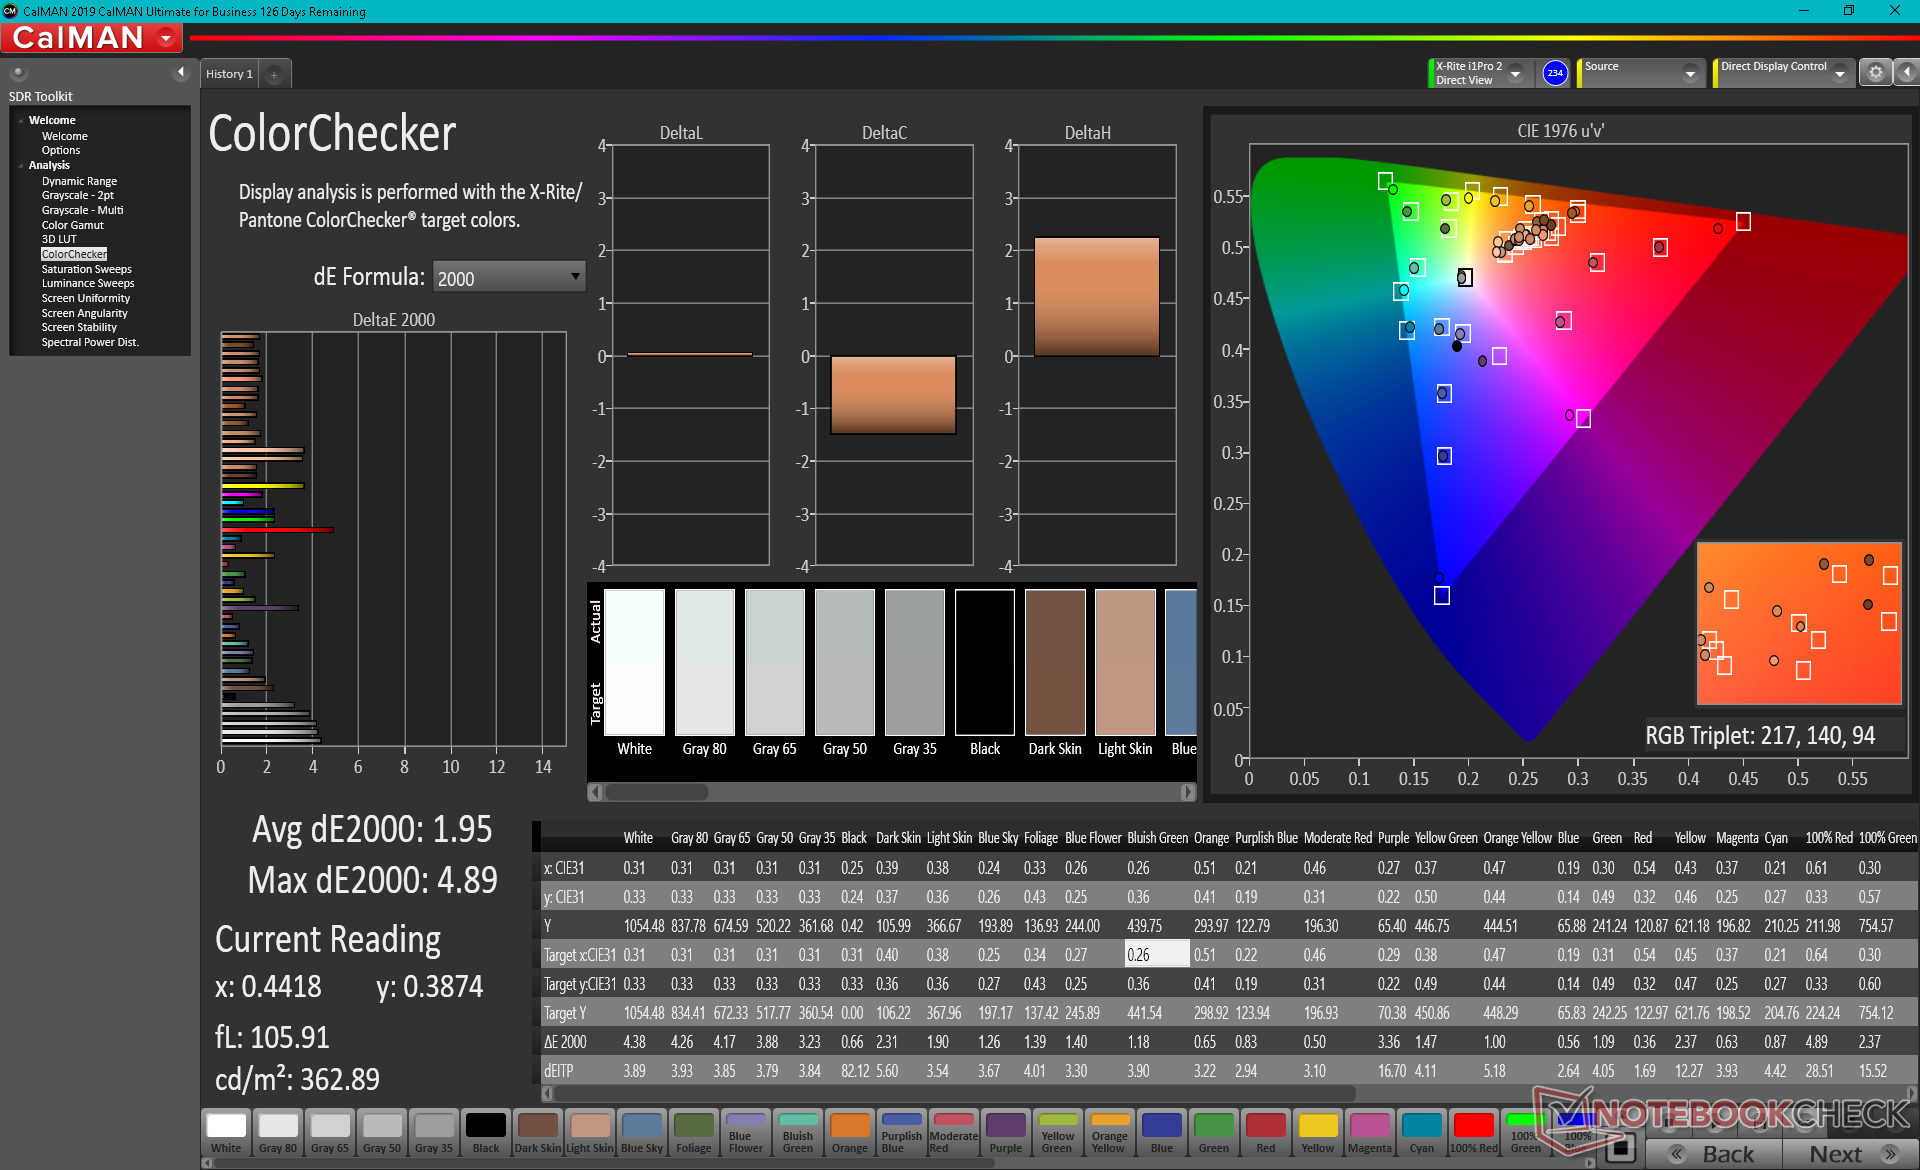
ΔE ColorChecker Calman: 4.18 | ∀{0.5-29.43 Ø4.79}
calibrated: 1.95
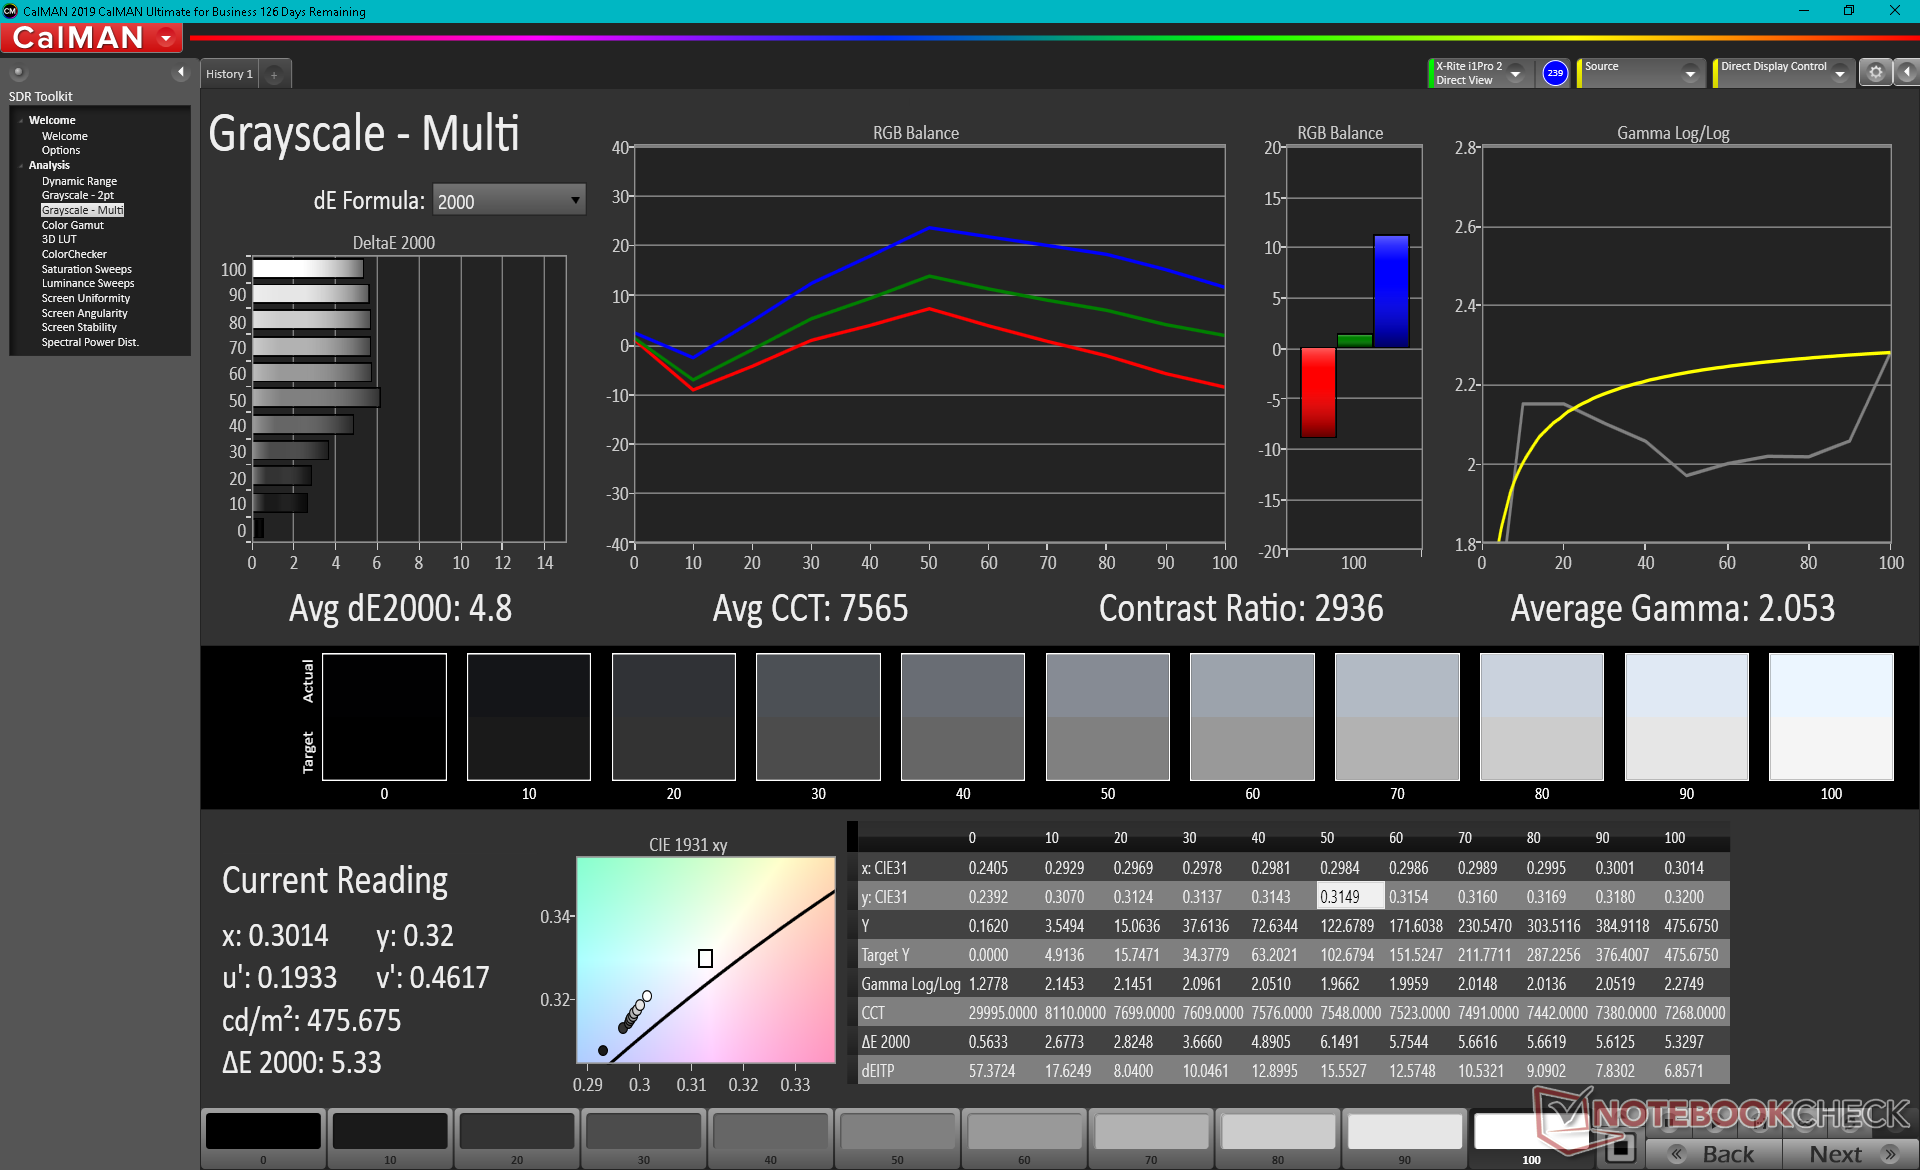
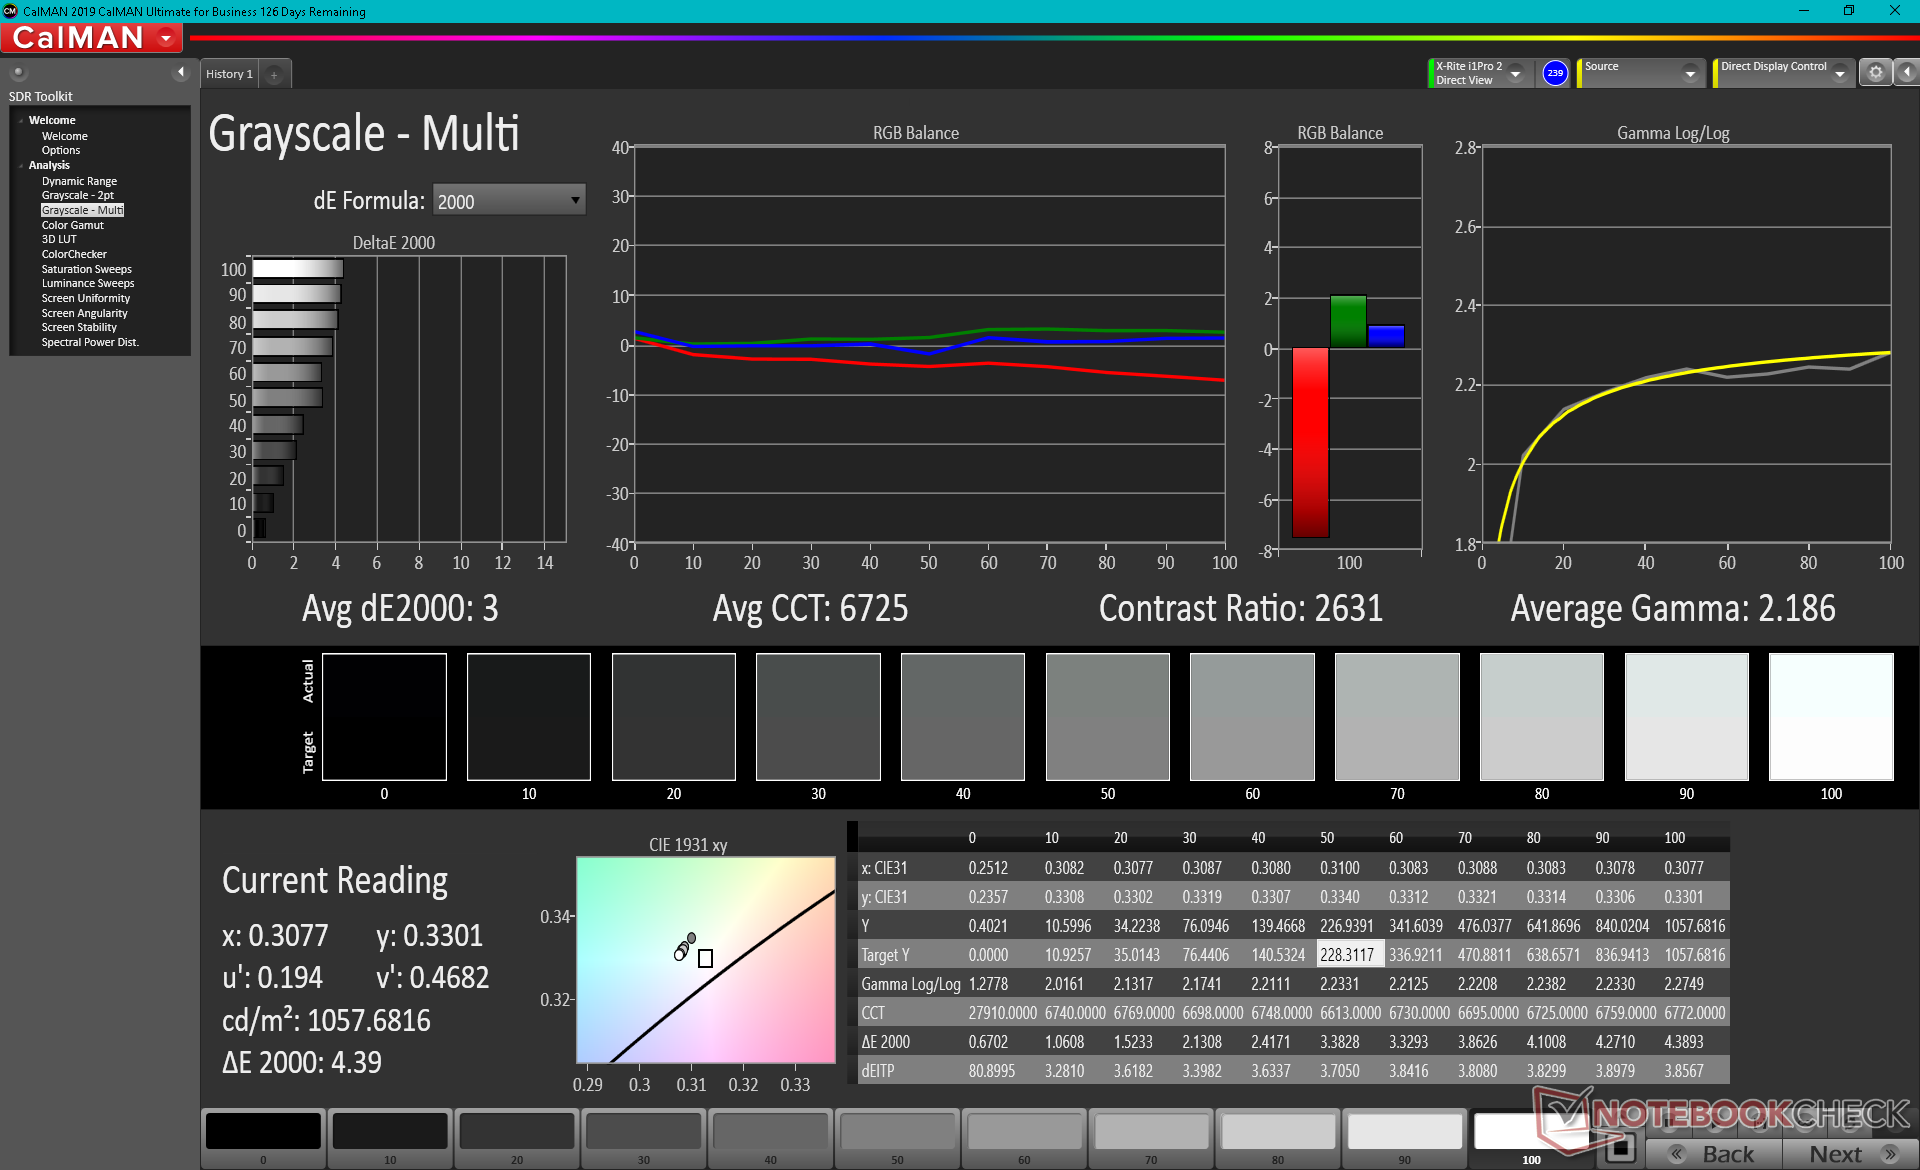
ΔE Greyscale Calman: 4.8 | ∀{0.09-98 Ø5}
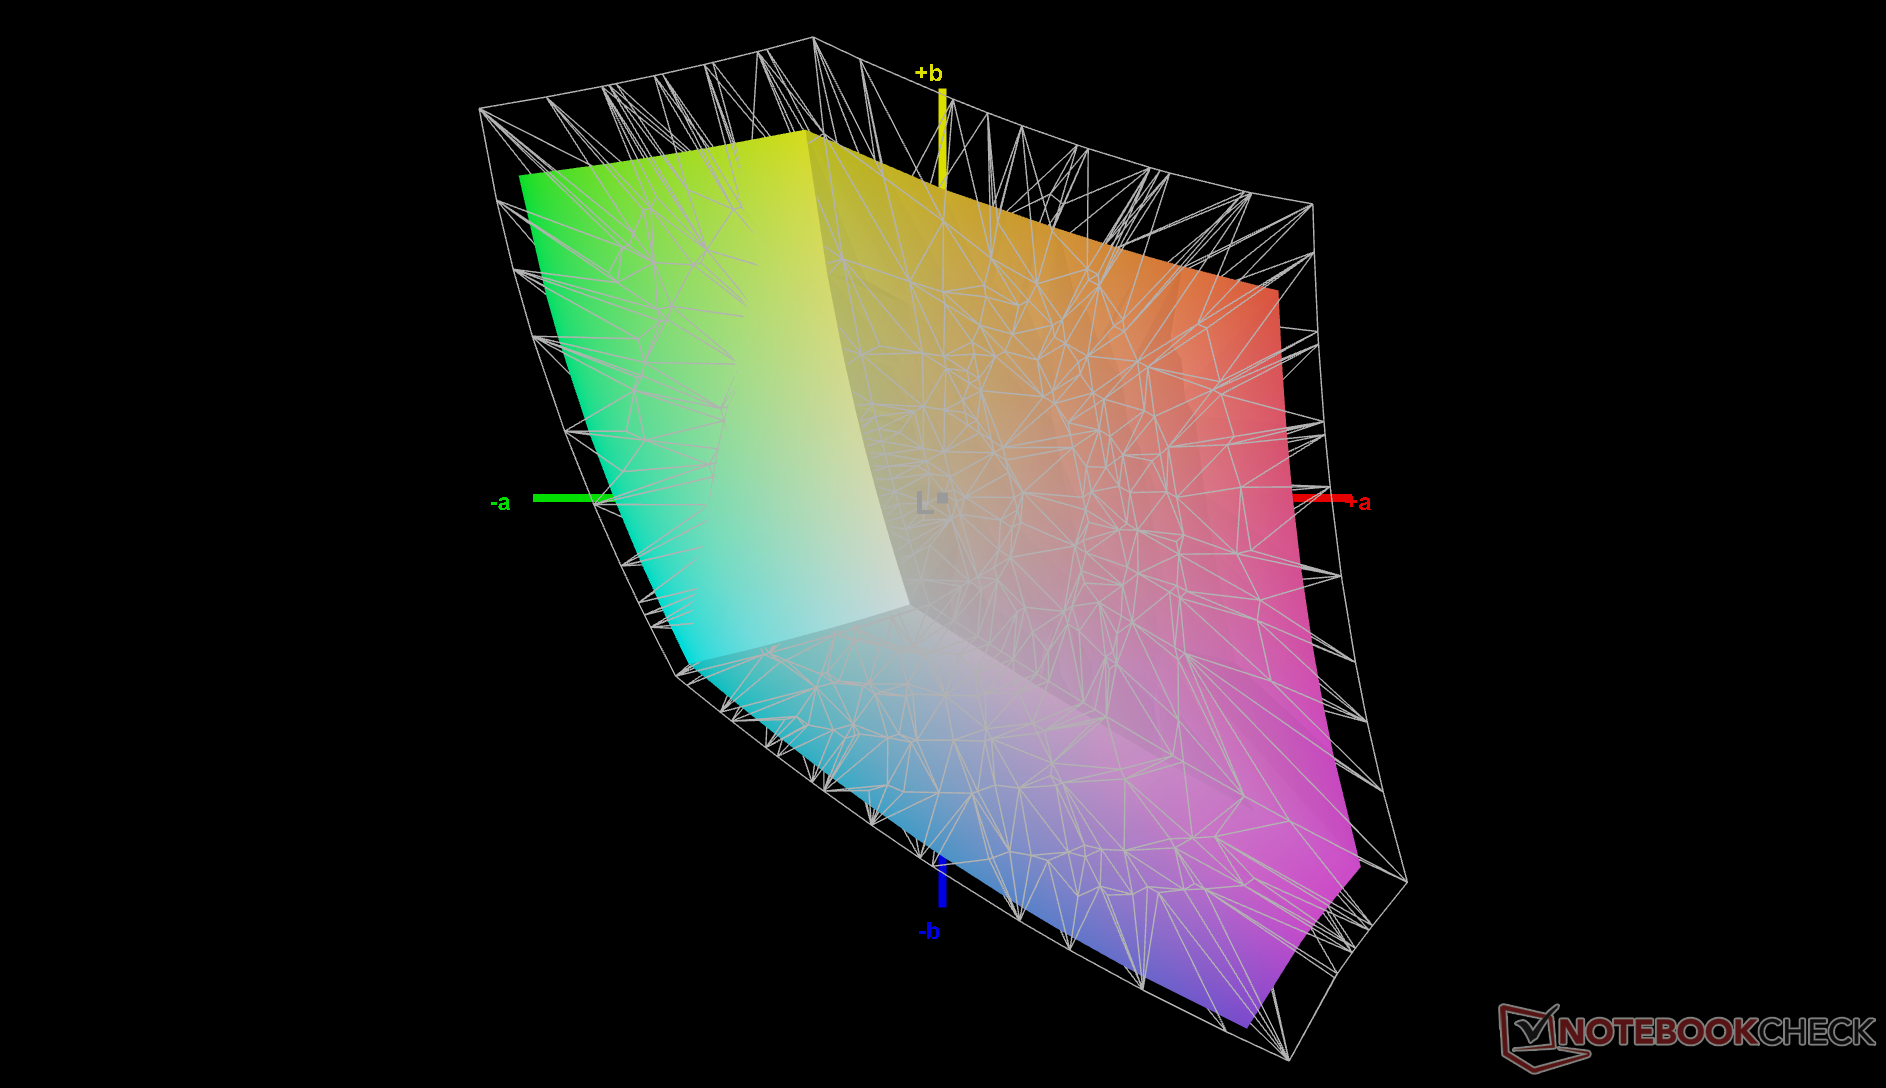
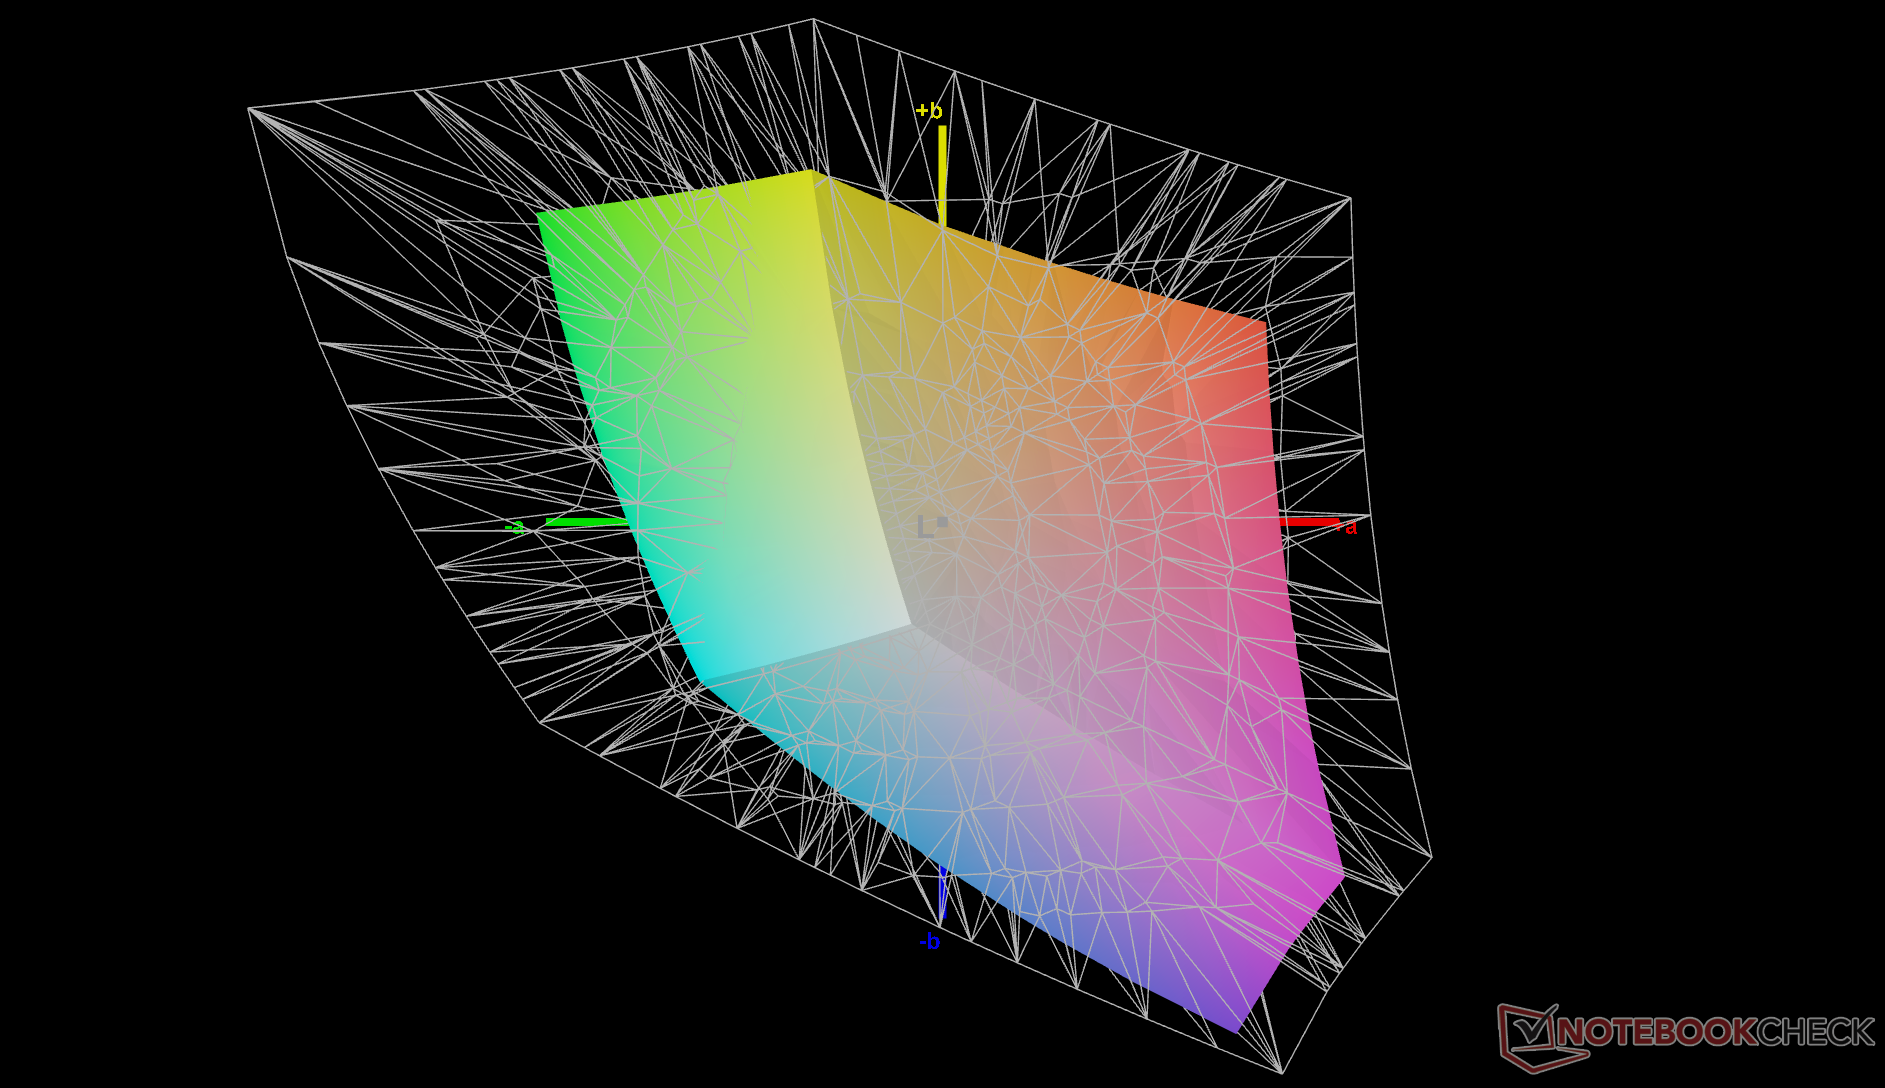
53.8% AdobeRGB 1998 (Argyll 3D)
78.5% sRGB (Argyll 3D)
52.1% Display P3 (Argyll 3D)
Gamma: 2.05
CCT: 7565 K
| Panasonic Toughbook FZ-G2 InfoVision M133NWFD R1, IPS, 10.1", 1920x1200 | Panasonic Toughbook FZ-S1 IPS, 7", 1280x800 | Durabook S14I KD140N0730A01, TN, 14", 1920x1080 | Panasonic Toughbook FZ-A3 IPS, 10.1", 1920x1200 | Durabook R11 BOE5F9, IPS, 11.6", 1920x1080 | Acer Enduro T1 ET108-11A A9001 IPS, 8", 1280x800 | |
|---|---|---|---|---|---|---|
| Display | -16% | 11% | ||||
| Display P3 Coverage (%) | 52.1 | 43.55 -16% | 59.3 14% | |||
| sRGB Coverage (%) | 78.5 | 65.4 -17% | 82.9 6% | |||
| AdobeRGB 1998 Coverage (%) | 53.8 | 45 -16% | 60 12% | |||
| Response Times | 27% | 55% | 1% | 50% | 26% | |
| Response Time Grey 50% / Grey 80% * (ms) | 54.4 ? | 33.2 ? 39% | 30.4 ? 44% | 54 ? 1% | 26 ? 52% | 33.6 ? 38% |
| Response Time Black / White * (ms) | 34.4 ? | 29.2 ? 15% | 11.8 ? 66% | 34 ? 1% | 18.4 ? 47% | 29.6 ? 14% |
| PWM Frequency (Hz) | 211.9 ? | 304.9 ? | 193.8 ? | 198.4 ? | ||
| Screen | -43% | -125% | -35% | -76% | -30% | |
| Brightness middle (cd/m²) | 1078.6 | 697.3 -35% | 1180.7 9% | 1078 0% | 584.2 -46% | 350 -68% |
| Brightness (cd/m²) | 1056 | 637 -40% | 1102 4% | 1060 0% | 560 -47% | 353 -67% |
| Brightness Distribution (%) | 90 | 85 -6% | 89 -1% | 77 -14% | 79 -12% | 92 2% |
| Black Level * (cd/m²) | 0.48 | 0.92 -92% | 1.91 -298% | 0.68 -42% | 0.52 -8% | 0.21 56% |
| Contrast (:1) | 2247 | 758 -66% | 618 -72% | 1585 -29% | 1123 -50% | 1667 -26% |
| Colorchecker dE 2000 * | 4.18 | 5.79 -39% | 13.45 -222% | 5.94 -42% | 9.29 -122% | 5.68 -36% |
| Colorchecker dE 2000 max. * | 6.2 | 9.29 -50% | 22.52 -263% | 12.54 -102% | 14.43 -133% | 10.51 -70% |
| Colorchecker dE 2000 calibrated * | 1.95 | 3.19 -64% | 4.72 -142% | |||
| Greyscale dE 2000 * | 4.8 | 5.4 -13% | 15.4 -221% | 7.2 -50% | 10.6 -121% | 6.3 -31% |
| Gamma | 2.05 107% | 2.18 101% | 1.97 112% | 2.17 101% | 2.41 91% | 2.12 104% |
| CCT | 7565 86% | 5736 113% | 21134 31% | 6530 100% | 6230 104% | 7390 88% |
| Color Space (Percent of AdobeRGB 1998) (%) | 41.6 | 53.4 | ||||
| Color Space (Percent of sRGB) (%) | 65.5 | 82.2 | ||||
| Total Average (Program / Settings) | -8% /
-29% | -29% /
-76% | -17% /
-28% | -5% /
-39% | -2% /
-19% |
* ... smaller is better
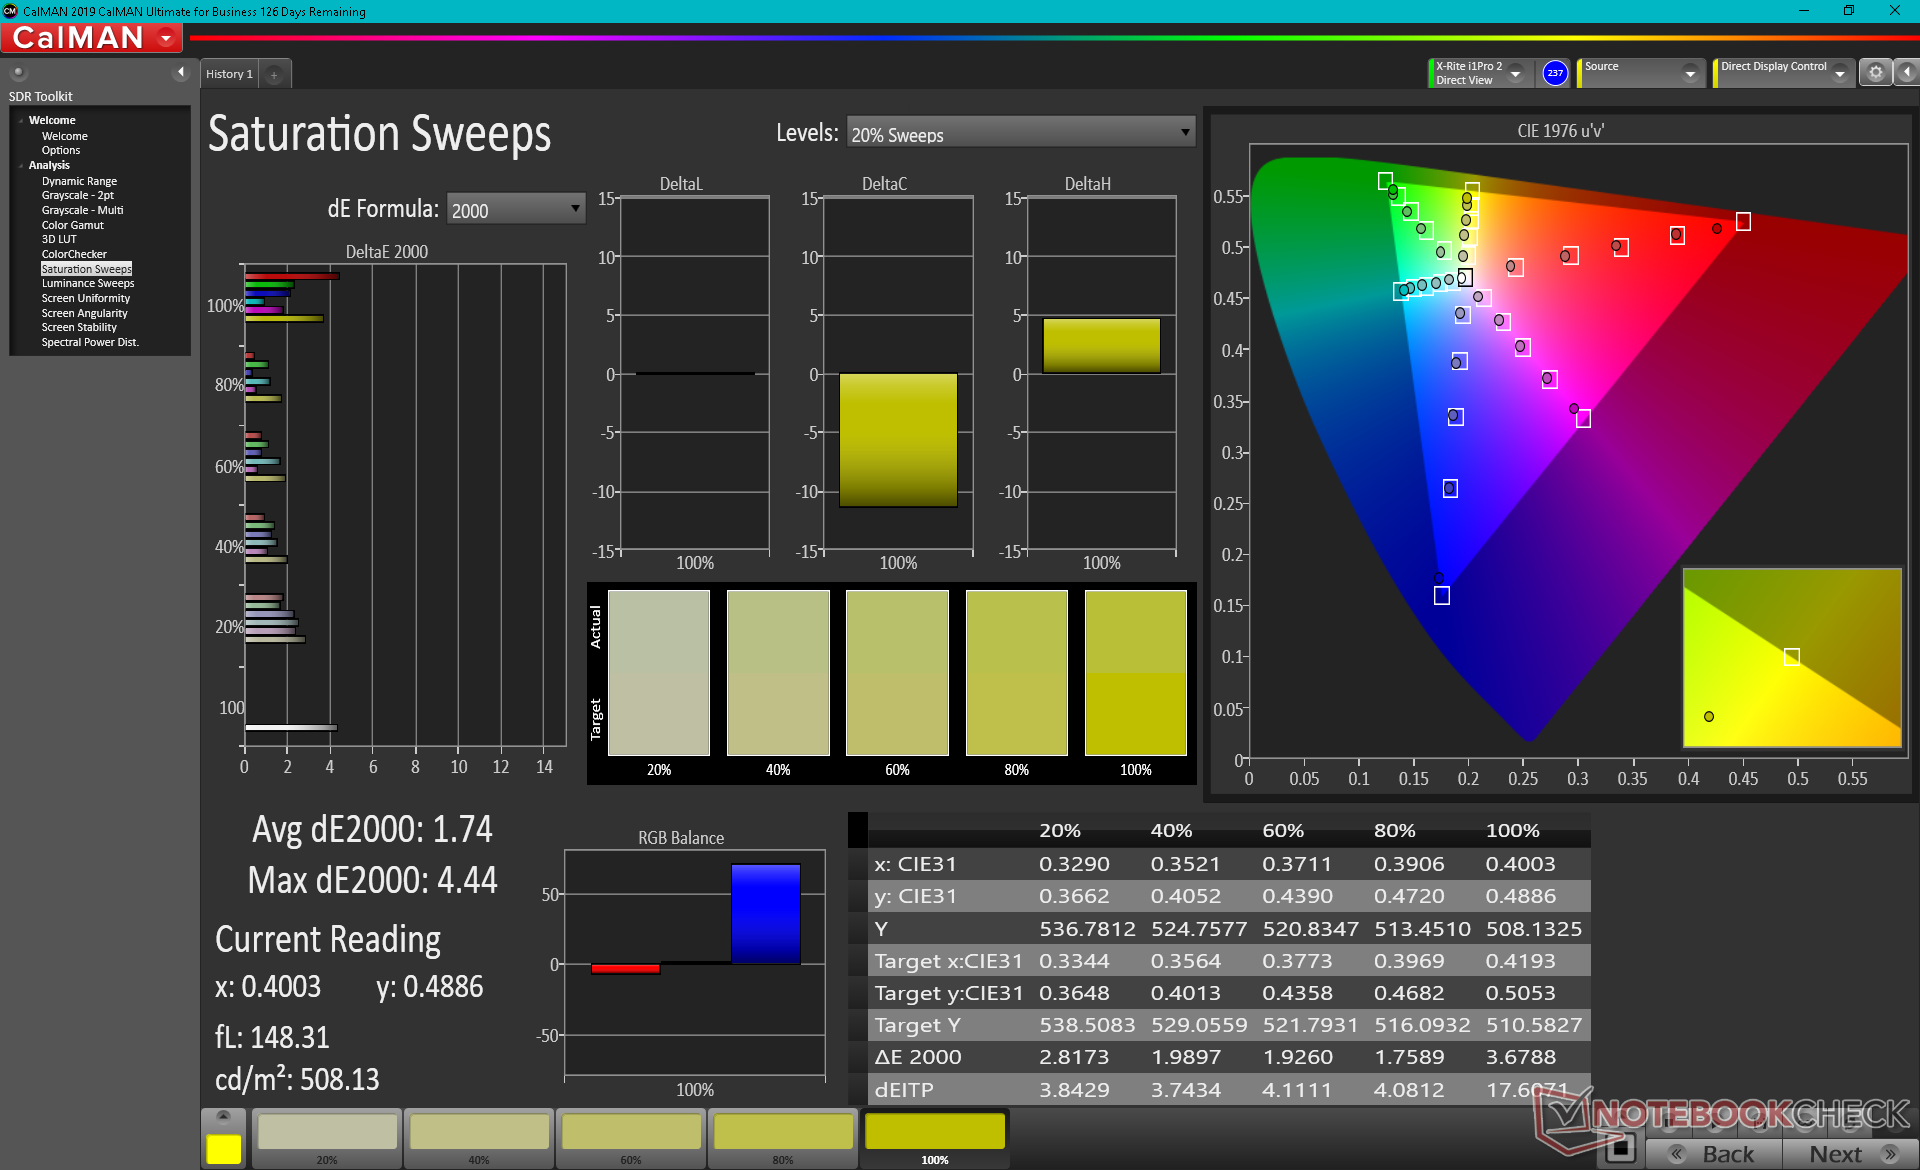
Color range encompasses only 79 percent of sRGB to be wider than the display on the Durabook S14I but narrower than most modern Ultrabooks where full sRGB is common.
Color temperature is slightly on the cool side. Once properly calibrated, both grayscale and color deltaE values would improve noticeably from 4.8 and 4.18 to 3 and 1.95, respectively.
Display Response Times
| ↔ Response Time Black to White | ||
|---|---|---|
| 34.4 ms ... rise ↗ and fall ↘ combined | ↗ 20 ms rise | 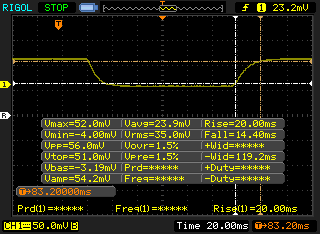 |
| ↘ 14.4 ms fall | ||
| The screen shows slow response rates in our tests and will be unsatisfactory for gamers. In comparison, all tested devices range from 0.1 (minimum) to 240 (maximum) ms. » 91 % of all devices are better. This means that the measured response time is worse than the average of all tested devices (20.3 ms). | ||
| ↔ Response Time 50% Grey to 80% Grey | ||
| 54.4 ms ... rise ↗ and fall ↘ combined | ↗ 26.8 ms rise | 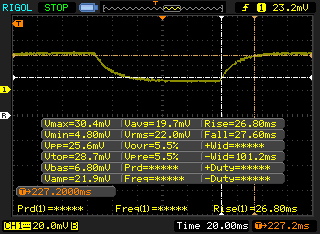 |
| ↘ 27.6 ms fall | ||
| The screen shows slow response rates in our tests and will be unsatisfactory for gamers. In comparison, all tested devices range from 0.165 (minimum) to 636 (maximum) ms. » 91 % of all devices are better. This means that the measured response time is worse than the average of all tested devices (31.7 ms). | ||
Screen Flickering / PWM (Pulse-Width Modulation)
| Screen flickering / PWM detected | 211.9 Hz | ≤ 7 % brightness setting | 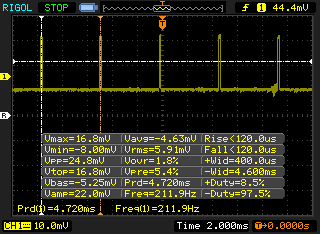 |
The display backlight flickers at 211.9 Hz (worst case, e.g., utilizing PWM) Flickering detected at a brightness setting of 7 % and below. There should be no flickering or PWM above this brightness setting. The frequency of 211.9 Hz is relatively low, so sensitive users will likely notice flickering and experience eyestrain at the stated brightness setting and below. In comparison: 53 % of all tested devices do not use PWM to dim the display. If PWM was detected, an average of 8163 (minimum: 5 - maximum: 343500) Hz was measured. | |||
Performance
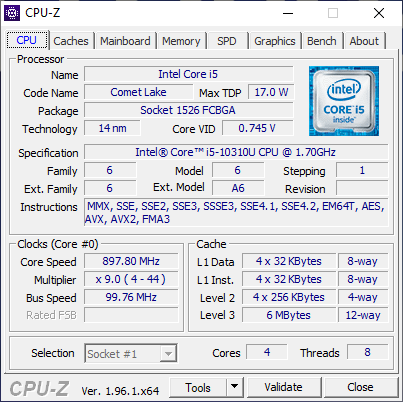
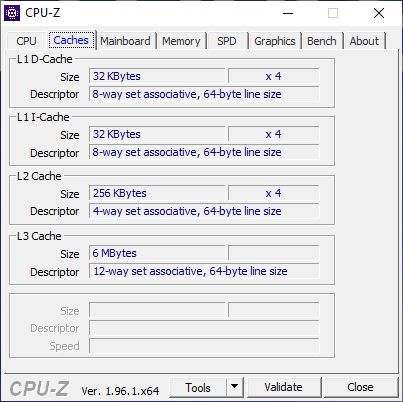
Processor
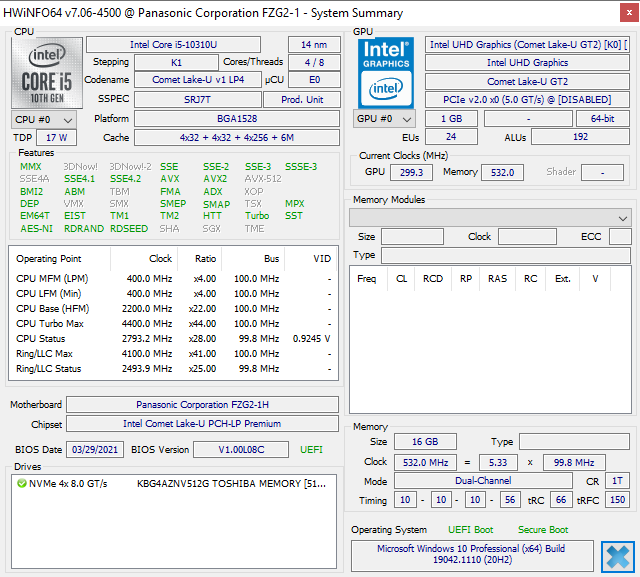
Panasonic is sticking with Intel 10th gen Comet Lake-U vPro CPUs even though newer 11th gen Tiger Lake-U vPro options are already available. Processor performance is slightly slower than the average Core i5-10310U in our database due to the limited Turbo Boost potential of the Panasonic tablet. The newer Core i5-1135G7 is able to offer up to 30 percent faster performance in both single- and multi-threaded applications.
Upgrading to the Core i7-10810U SKU is expected to increase multi-thread CPU performance by about 50 percent over our Core i5-10310U configuration.
Cinebench R15 Multi Loop
Cinebench R23: Multi Core | Single Core
Cinebench R15: CPU Multi 64Bit | CPU Single 64Bit
Blender: v2.79 BMW27 CPU
7-Zip 18.03: 7z b 4 -mmt1 | 7z b 4
Geekbench 5.5: Single-Core | Multi-Core
HWBOT x265 Benchmark v2.2: 4k Preset
LibreOffice : 20 Documents To PDF
R Benchmark 2.5: Overall mean
| Cinebench R23 / Multi Core | |
| ADATA XPG Xenia 14 | |
| Dell Latitude 9420 2-in-1 | |
| HP EliteBook x360 1040 G7, i7-10810U | |
| Microsoft Surface Pro 7 Plus | |
| Durabook S14I | |
| Panasonic Toughbook FZ-G2 | |
| Average Intel Core i5-10310U (n=1) | |
| Cinebench R23 / Single Core | |
| ADATA XPG Xenia 14 | |
| Dell Latitude 9420 2-in-1 | |
| Durabook S14I | |
| Microsoft Surface Pro 7 Plus | |
| HP EliteBook x360 1040 G7, i7-10810U | |
| Panasonic Toughbook FZ-G2 | |
| Average Intel Core i5-10310U (n=1) | |
| Geekbench 5.5 / Single-Core | |
| Durabook S14I | |
| Microsoft Surface Pro 7 Plus | |
| HP EliteBook x360 1040 G7, i7-10810U | |
| Lenovo ThinkPad E14-20RA001LGE | |
| Average Intel Core i5-10310U (1040 - 1128, n=6) | |
| Fujitsu LifeBook U9310X | |
| Durabook R11 | |
| Panasonic Toughbook FZ-A3 | |
| Panasonic Toughbook FZ-S1 | |
| Geekbench 5.5 / Multi-Core | |
| HP EliteBook x360 1040 G7, i7-10810U | |
| Microsoft Surface Pro 7 Plus | |
| Durabook S14I | |
| Fujitsu LifeBook U9310X | |
| Average Intel Core i5-10310U (2821 - 3854, n=6) | |
| Lenovo ThinkPad E14-20RA001LGE | |
| Durabook R11 | |
| Panasonic Toughbook FZ-S1 | |
| Panasonic Toughbook FZ-A3 | |
| HWBOT x265 Benchmark v2.2 / 4k Preset | |
| ADATA XPG Xenia 14 | |
| Dell Latitude 9420 2-in-1 | |
| HP EliteBook x360 1040 G7, i7-10810U | |
| Microsoft Surface Pro 7 Plus | |
| Durabook S14I | |
| Lenovo ThinkPad E14-20RA001LGE | |
| Average Intel Core i5-10310U (3.88 - 5.35, n=5) | |
| Fujitsu LifeBook U9310X | |
| Panasonic Toughbook FZ-G2 | |
| HP ZBook 14u G6 6TP71EA | |
| Durabook R11 | |
| LibreOffice / 20 Documents To PDF | |
| Durabook R11 | |
| Panasonic Toughbook FZ-G2 | |
| Average Intel Core i5-10310U (60 - 71.4, n=5) | |
| HP EliteBook x360 1040 G7, i7-10810U | |
| Microsoft Surface Pro 7 Plus | |
| Fujitsu LifeBook U9310X | |
| Lenovo ThinkPad E14-20RA001LGE | |
| Dell Latitude 9420 2-in-1 | |
| ADATA XPG Xenia 14 | |
| Durabook S14I | |
| R Benchmark 2.5 / Overall mean | |
| Durabook R11 | |
| Average Intel Core i5-10310U (0.703 - 0.806, n=5) | |
| Panasonic Toughbook FZ-G2 | |
| Fujitsu LifeBook U9310X | |
| Lenovo ThinkPad E14-20RA001LGE | |
| Microsoft Surface Pro 7 Plus | |
| HP EliteBook x360 1040 G7, i7-10810U | |
| Durabook S14I | |
| Dell Latitude 9420 2-in-1 | |
| ADATA XPG Xenia 14 | |
Cinebench R23: Multi Core | Single Core
Cinebench R15: CPU Multi 64Bit | CPU Single 64Bit
Blender: v2.79 BMW27 CPU
7-Zip 18.03: 7z b 4 -mmt1 | 7z b 4
Geekbench 5.5: Single-Core | Multi-Core
HWBOT x265 Benchmark v2.2: 4k Preset
LibreOffice : 20 Documents To PDF
R Benchmark 2.5: Overall mean
* ... smaller is better
System Performance
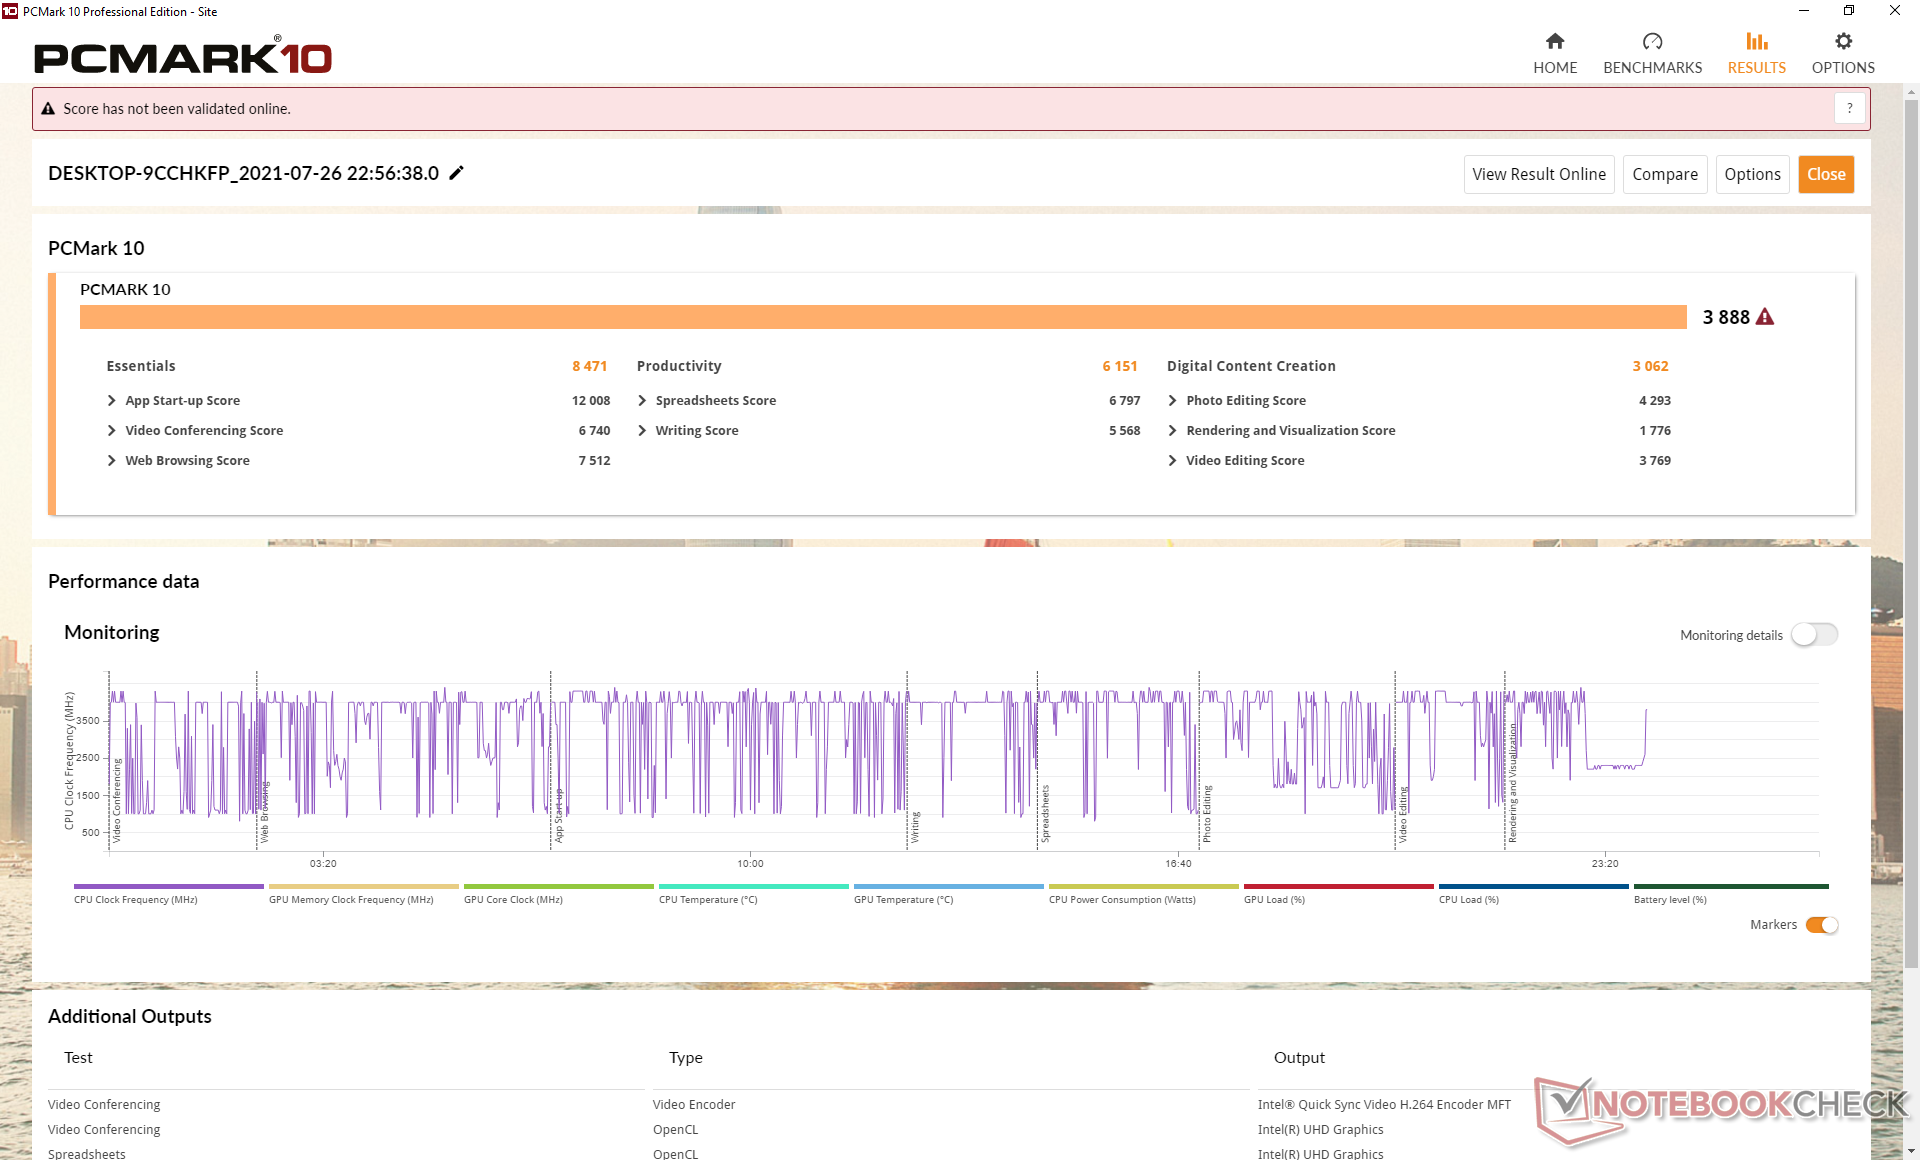
PCMark results are where we expect them to be relative to other devices with the same Core i5-10310U CPU. Tiger Lake systems like the Durabook S14I score consistently higher especially in graphics-heavy applications.
Users should become familiar with the various pre-installed Panasonic applications as many specific features cannot be toggled without them including Night Mode, RGB keyboard backlight settings, and the GPS viewer.
| PCMark 10 / Score | |
| Durabook S14I | |
| Average Intel Core i5-10310U, Intel UHD Graphics 620 (3888 - 4155, n=5) | |
| Panasonic Toughbook FZ-G2 | |
| Durabook R11 | |
| PCMark 10 / Essentials | |
| Durabook S14I | |
| Panasonic Toughbook FZ-G2 | |
| Average Intel Core i5-10310U, Intel UHD Graphics 620 (8289 - 8659, n=5) | |
| Durabook R11 | |
| PCMark 10 / Productivity | |
| Durabook S14I | |
| Average Intel Core i5-10310U, Intel UHD Graphics 620 (6151 - 6886, n=5) | |
| Panasonic Toughbook FZ-G2 | |
| Durabook R11 | |
| PCMark 10 / Digital Content Creation | |
| Durabook S14I | |
| Average Intel Core i5-10310U, Intel UHD Graphics 620 (3021 - 3265, n=5) | |
| Panasonic Toughbook FZ-G2 | |
| Durabook R11 | |
| PCMark 10 Score | 3888 points | |
Help | ||
DPC Latency
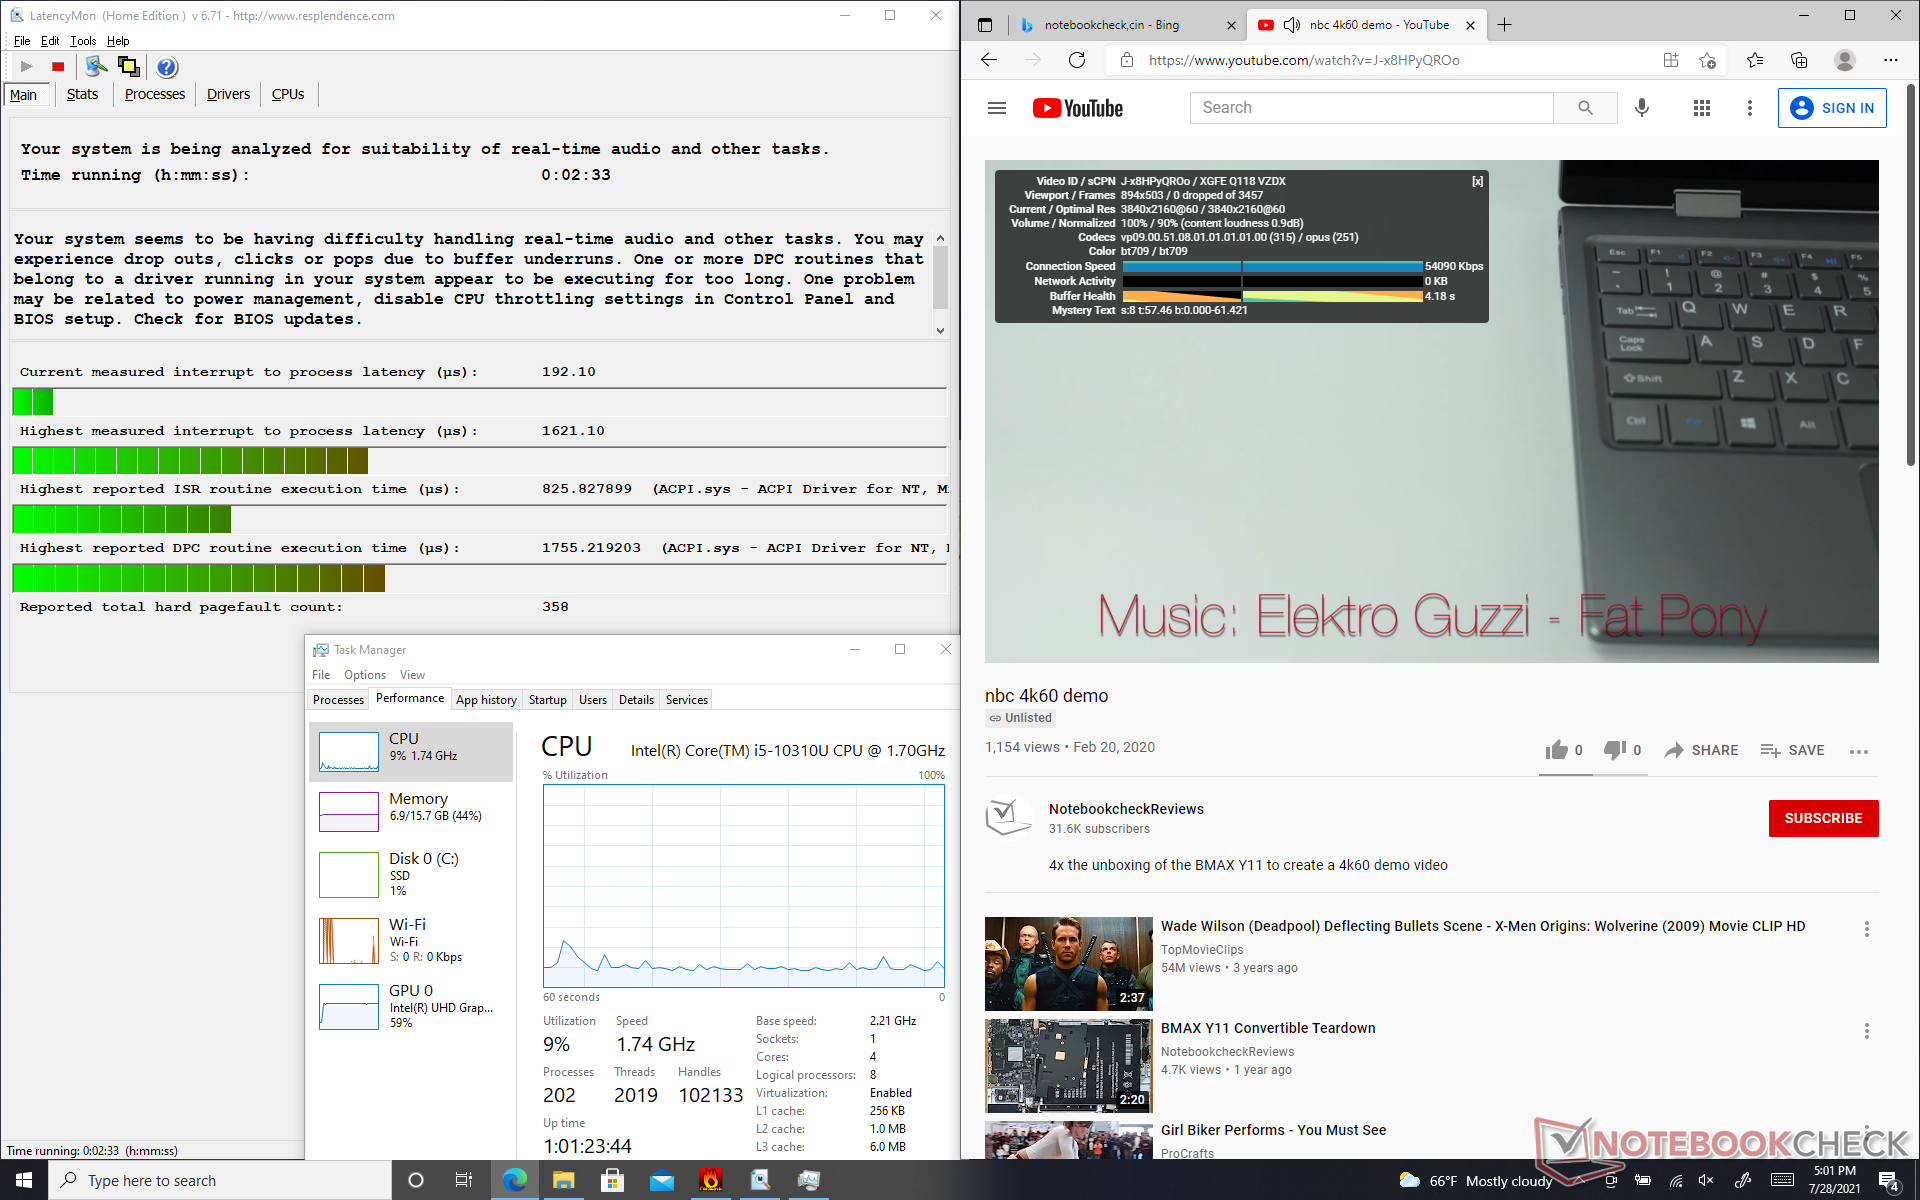
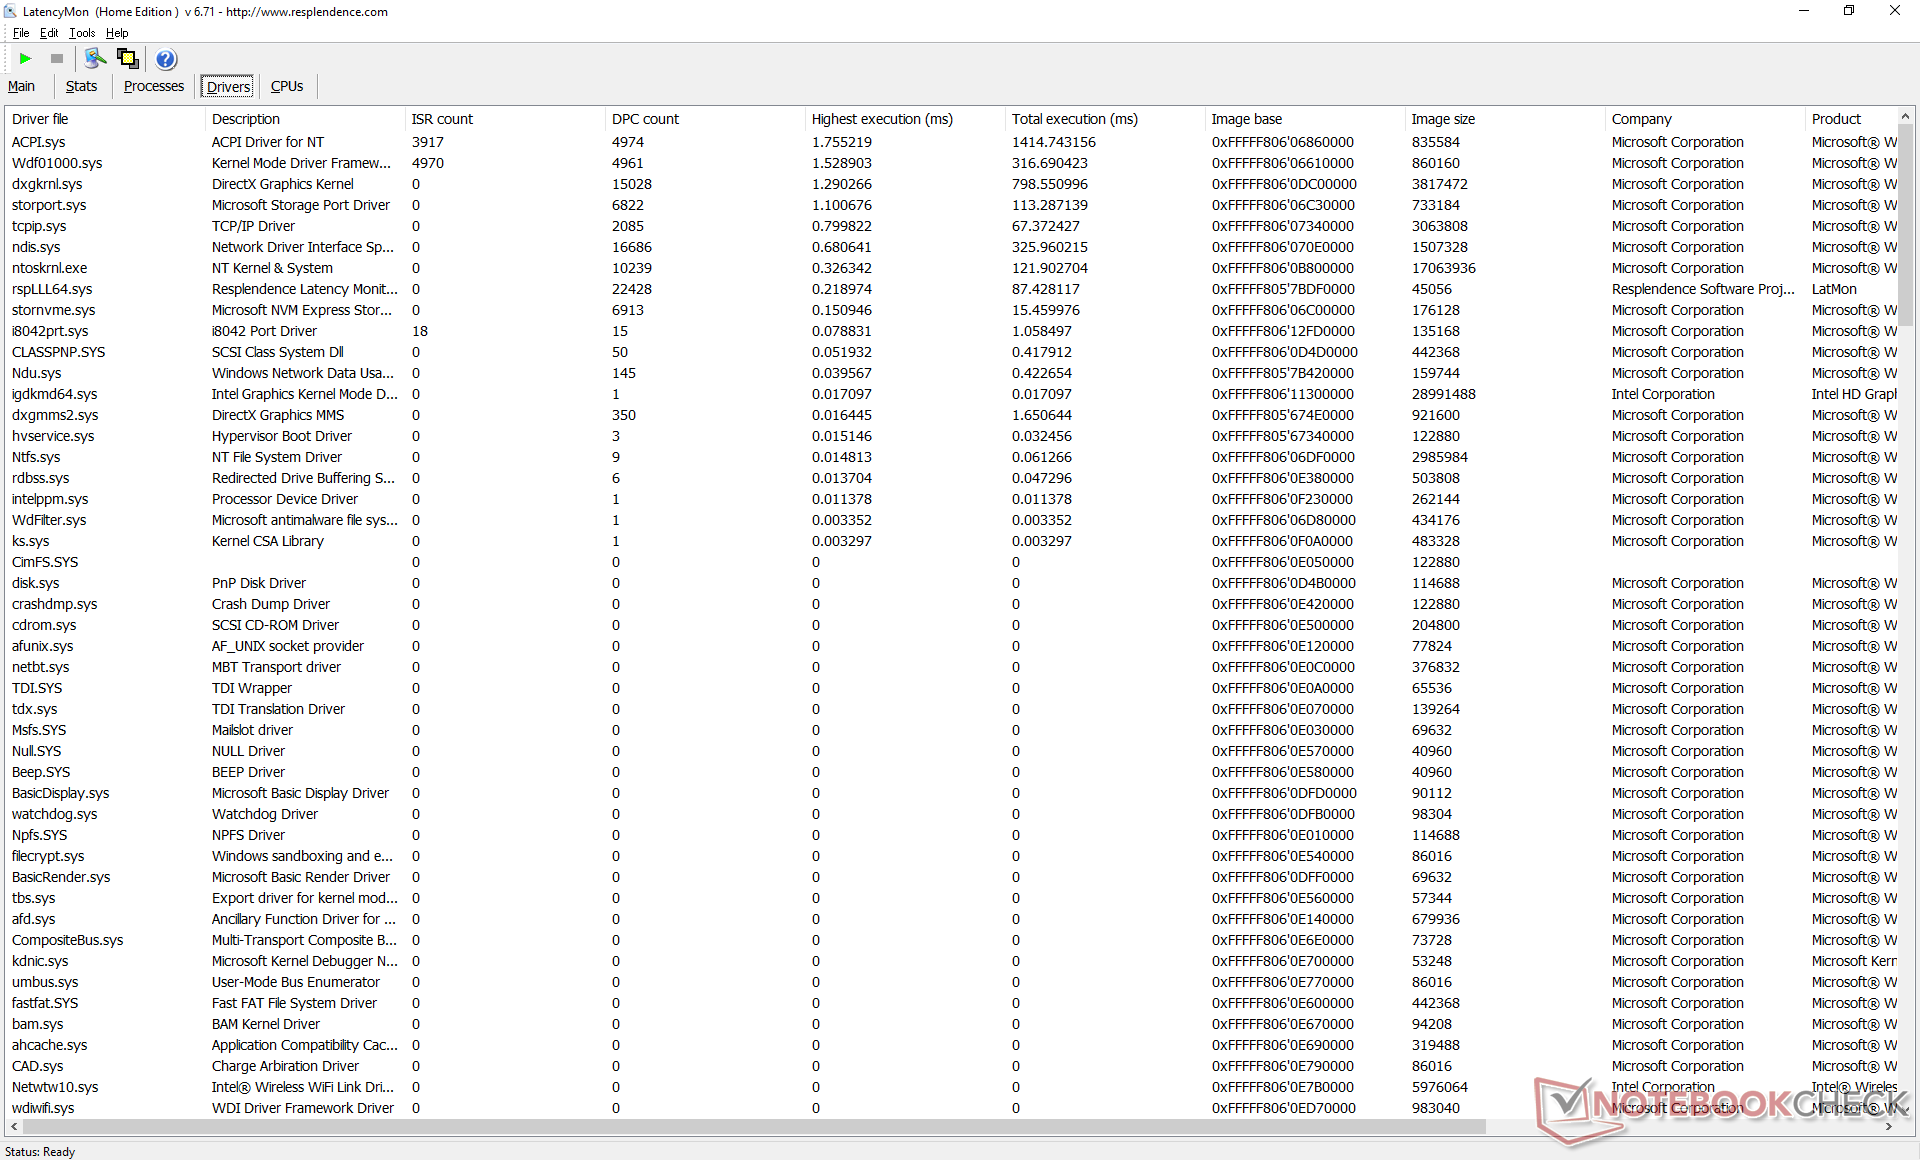
LatencyMon shows DPC latency issues when opening multiple browser tabs on our homepage. 4K video playback at 60 FPS is otherwise smooth and with no dropped frames.
| DPC Latencies / LatencyMon - interrupt to process latency (max), Web, Youtube, Prime95 | |
| Durabook R11 | |
| Durabook S14I | |
| Panasonic Toughbook FZ-G2 | |
* ... smaller is better
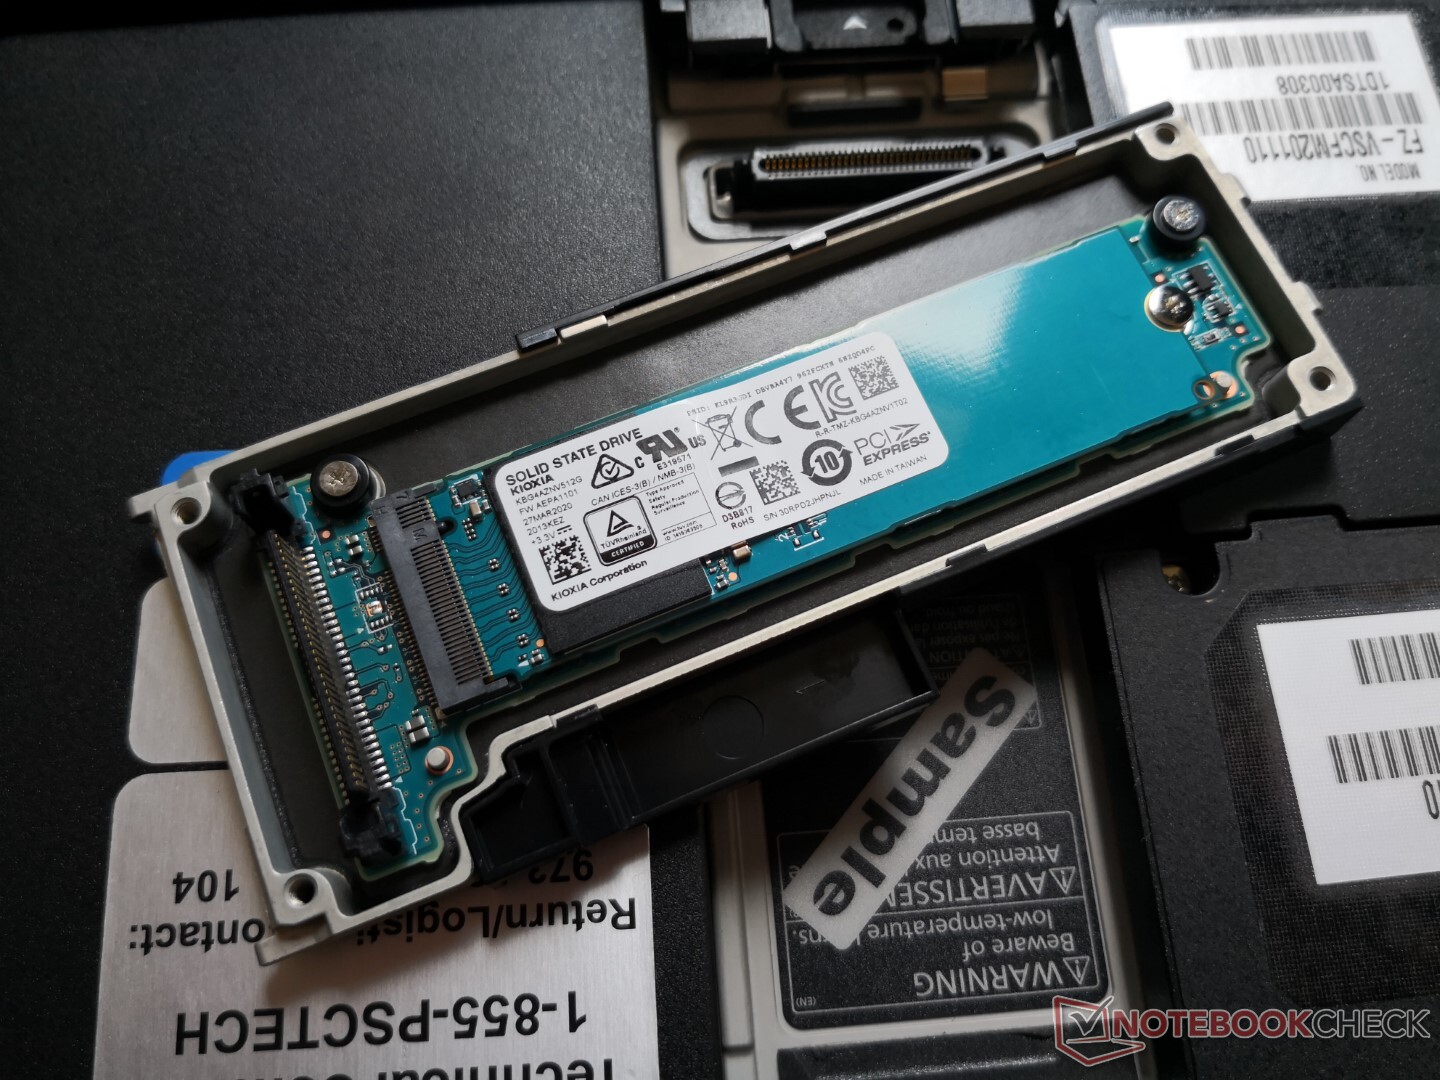
Storage Devices
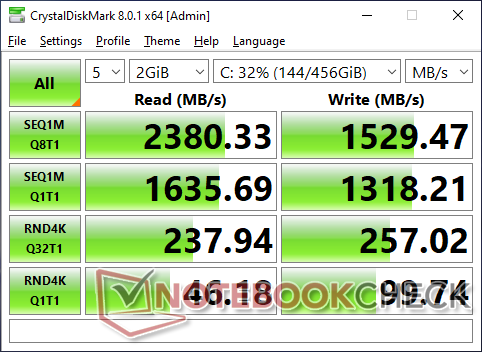
The system supports one M.2 NVMe OPAL SSD as the main and only storage option. Its sequential read and write rates of about 2300 MB/s and 1500 MB/s, respectively, are typical of a mid-range NVMe SSD.
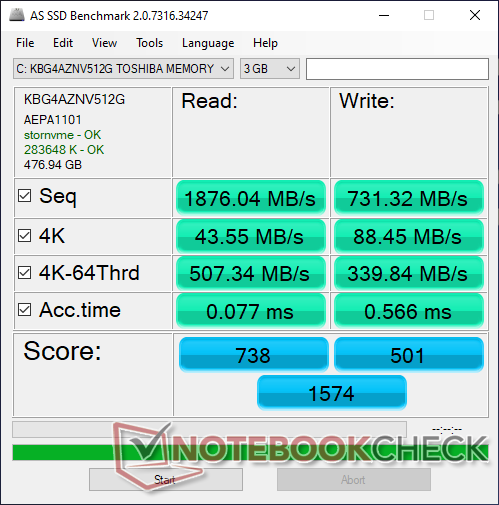
| Panasonic Toughbook FZ-G2 Toshiba KIOXIA KBG4AZNV512G M.2 2280 OPAL | Durabook S14I UDinfo M2P M2P80DE512GBAEP | Durabook R11 Kingston RBUSNS4180S3128GJ | Dell Latitude 5420 Rugged-P85G SK hynix PC401 NVMe 500 GB | |
|---|---|---|---|---|
| AS SSD | 60% | -28% | 40% | |
| Seq Read (MB/s) | 1876 | 2184 16% | 461.7 -75% | 2054 9% |
| Seq Write (MB/s) | 731 | 1441 97% | 409.3 -44% | 653 -11% |
| 4K Read (MB/s) | 43.55 | 35.98 -17% | 45.52 5% | 39.34 -10% |
| 4K Write (MB/s) | 88.4 | 260.1 194% | 76 -14% | 96.4 9% |
| 4K-64 Read (MB/s) | 507 | 396.5 -22% | 359.8 -29% | 677 34% |
| 4K-64 Write (MB/s) | 339.8 | 1057 211% | 623 83% | 982 189% |
| Access Time Read * (ms) | 0.077 | 0.051 34% | 0.203 -164% | 0.044 43% |
| Access Time Write * (ms) | 0.566 | 0.106 81% | 0.226 60% | 0.051 91% |
| Score Read (Points) | 738 | 651 -12% | 451 -39% | 921 25% |
| Score Write (Points) | 501 | 1461 192% | 740 48% | 1143 128% |
| Score Total (Points) | 1574 | 2418 54% | 1438 -9% | 2475 57% |
| Copy ISO MB/s (MB/s) | 1080 | 1538 42% | 454.8 -58% | 1622 50% |
| Copy Program MB/s (MB/s) | 525 | 570 9% | 114.7 -78% | 378.1 -28% |
| Copy Game MB/s (MB/s) | 1033 | 566 -45% | 188.1 -82% | 793 -23% |
| CrystalDiskMark 5.2 / 6 | 67% | -40% | -9% | |
| Write 4K (MB/s) | 96.4 | 260.4 170% | 102.6 6% | 98.8 2% |
| Read 4K (MB/s) | 47.38 | 53 12% | 38.82 -18% | 38.51 -19% |
| Write Seq (MB/s) | 1213 | 1665 37% | 408.8 -66% | 843 -31% |
| Read Seq (MB/s) | 1622 | 1541 -5% | 427 -74% | 1282 -21% |
| Write 4K Q32T1 (MB/s) | 251.8 | 638 153% | 259.1 3% | 355.5 41% |
| Read 4K Q32T1 (MB/s) | 264.8 | 683 158% | 232.1 -12% | 241.4 -9% |
| Write Seq Q32T1 (MB/s) | 1533 | 1656 8% | 286.9 -81% | 893 -42% |
| Read Seq Q32T1 (MB/s) | 2342 | 2490 6% | 503 -79% | 2478 6% |
| Total Average (Program / Settings) | 64% /
62% | -34% /
-33% | 16% /
22% |
* ... smaller is better

Disk Throttling: DiskSpd Read Loop, Queue Depth 8
GPU Performance
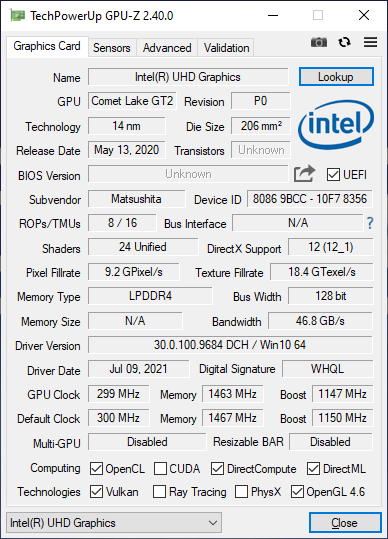
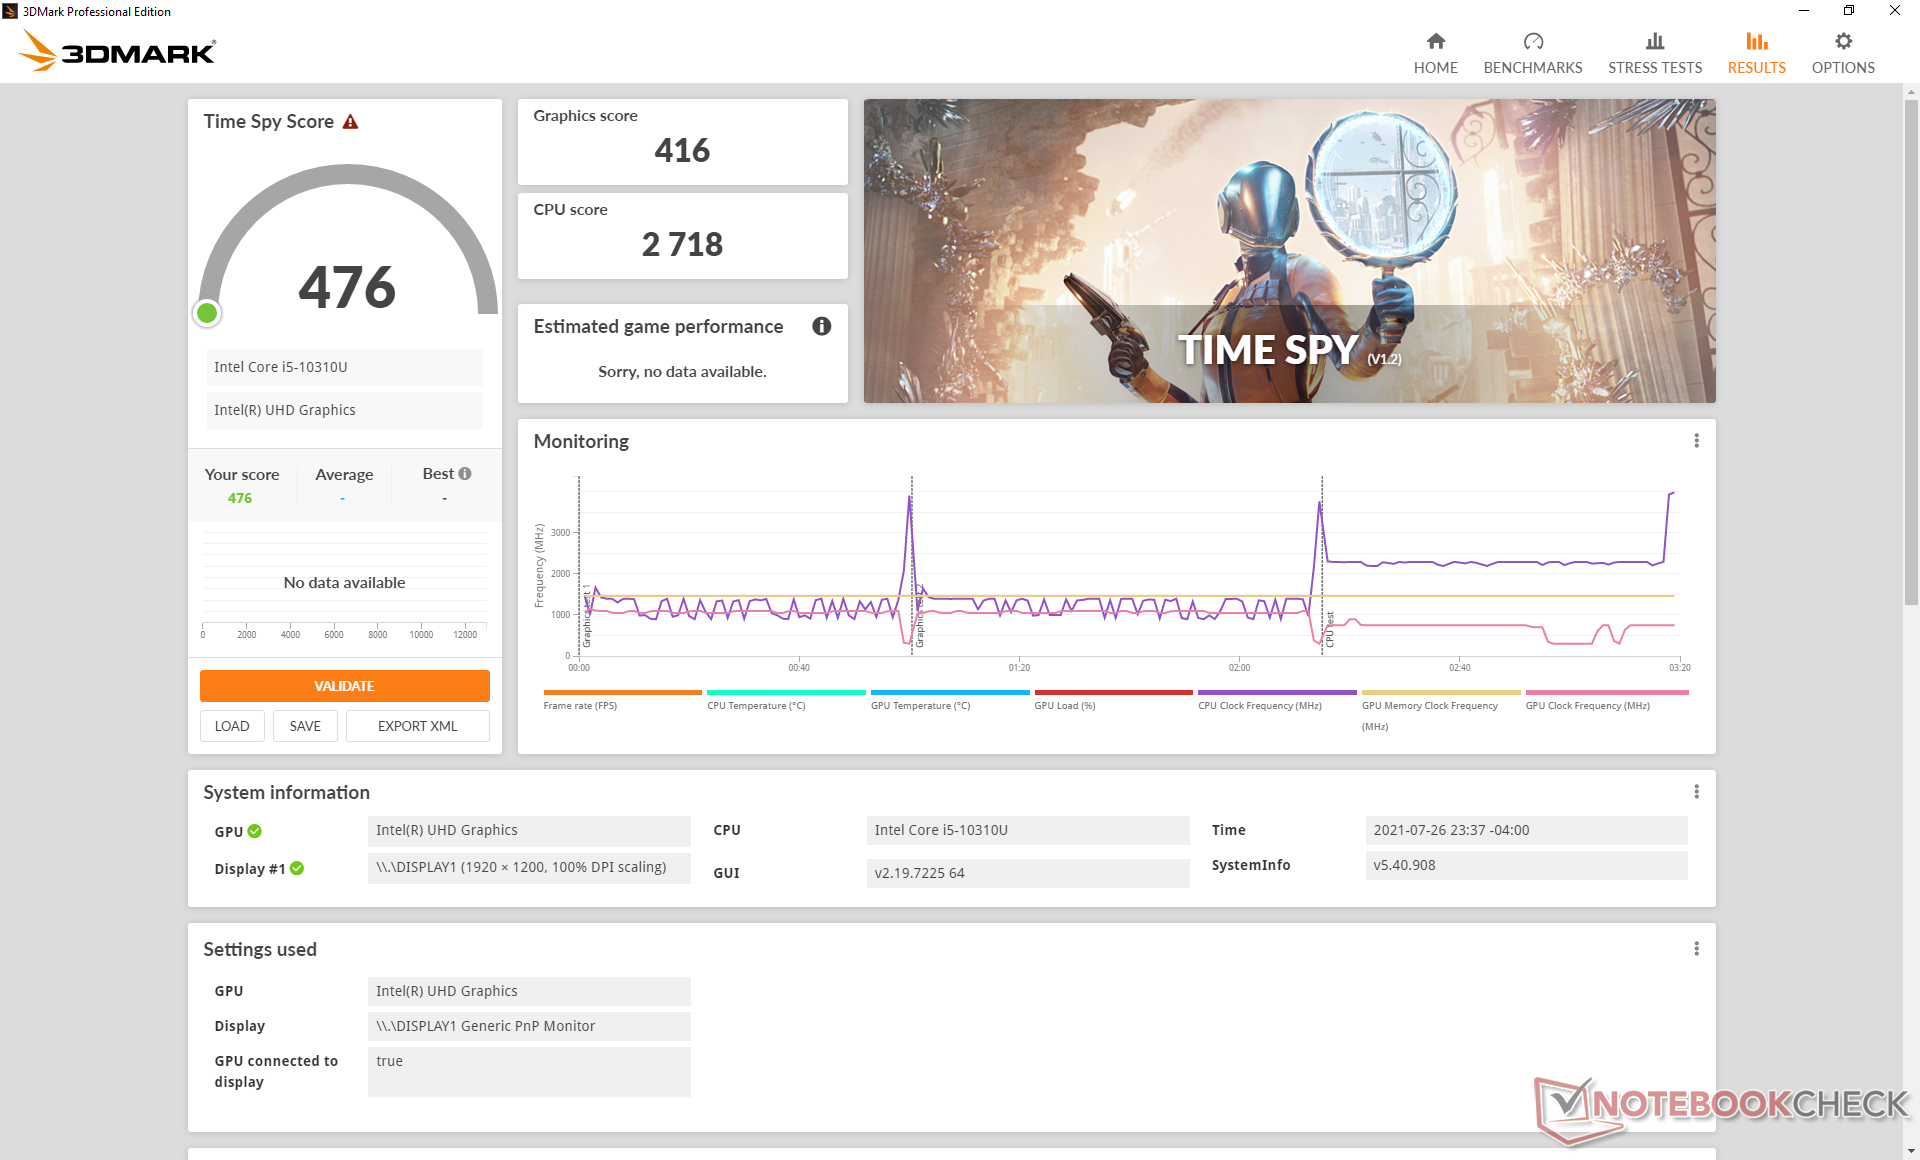
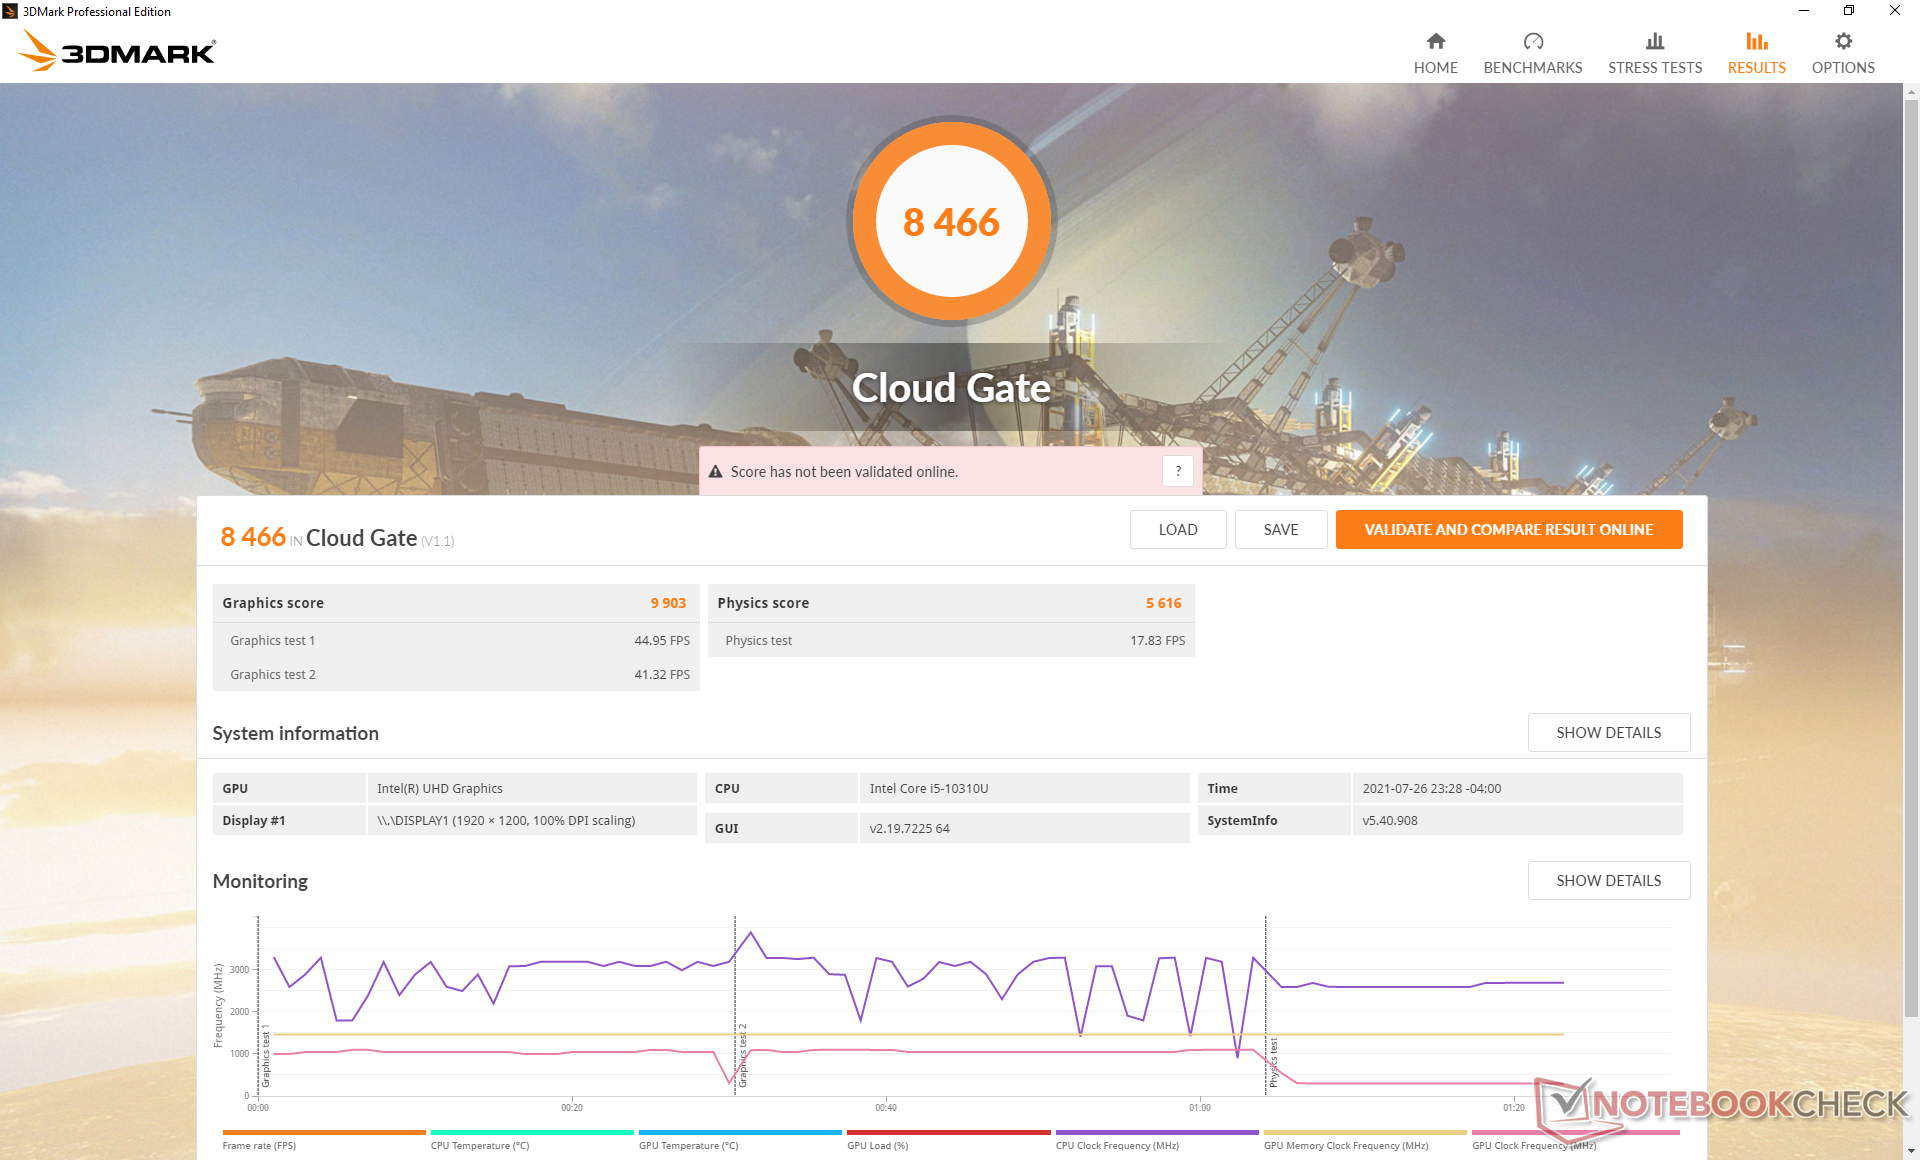
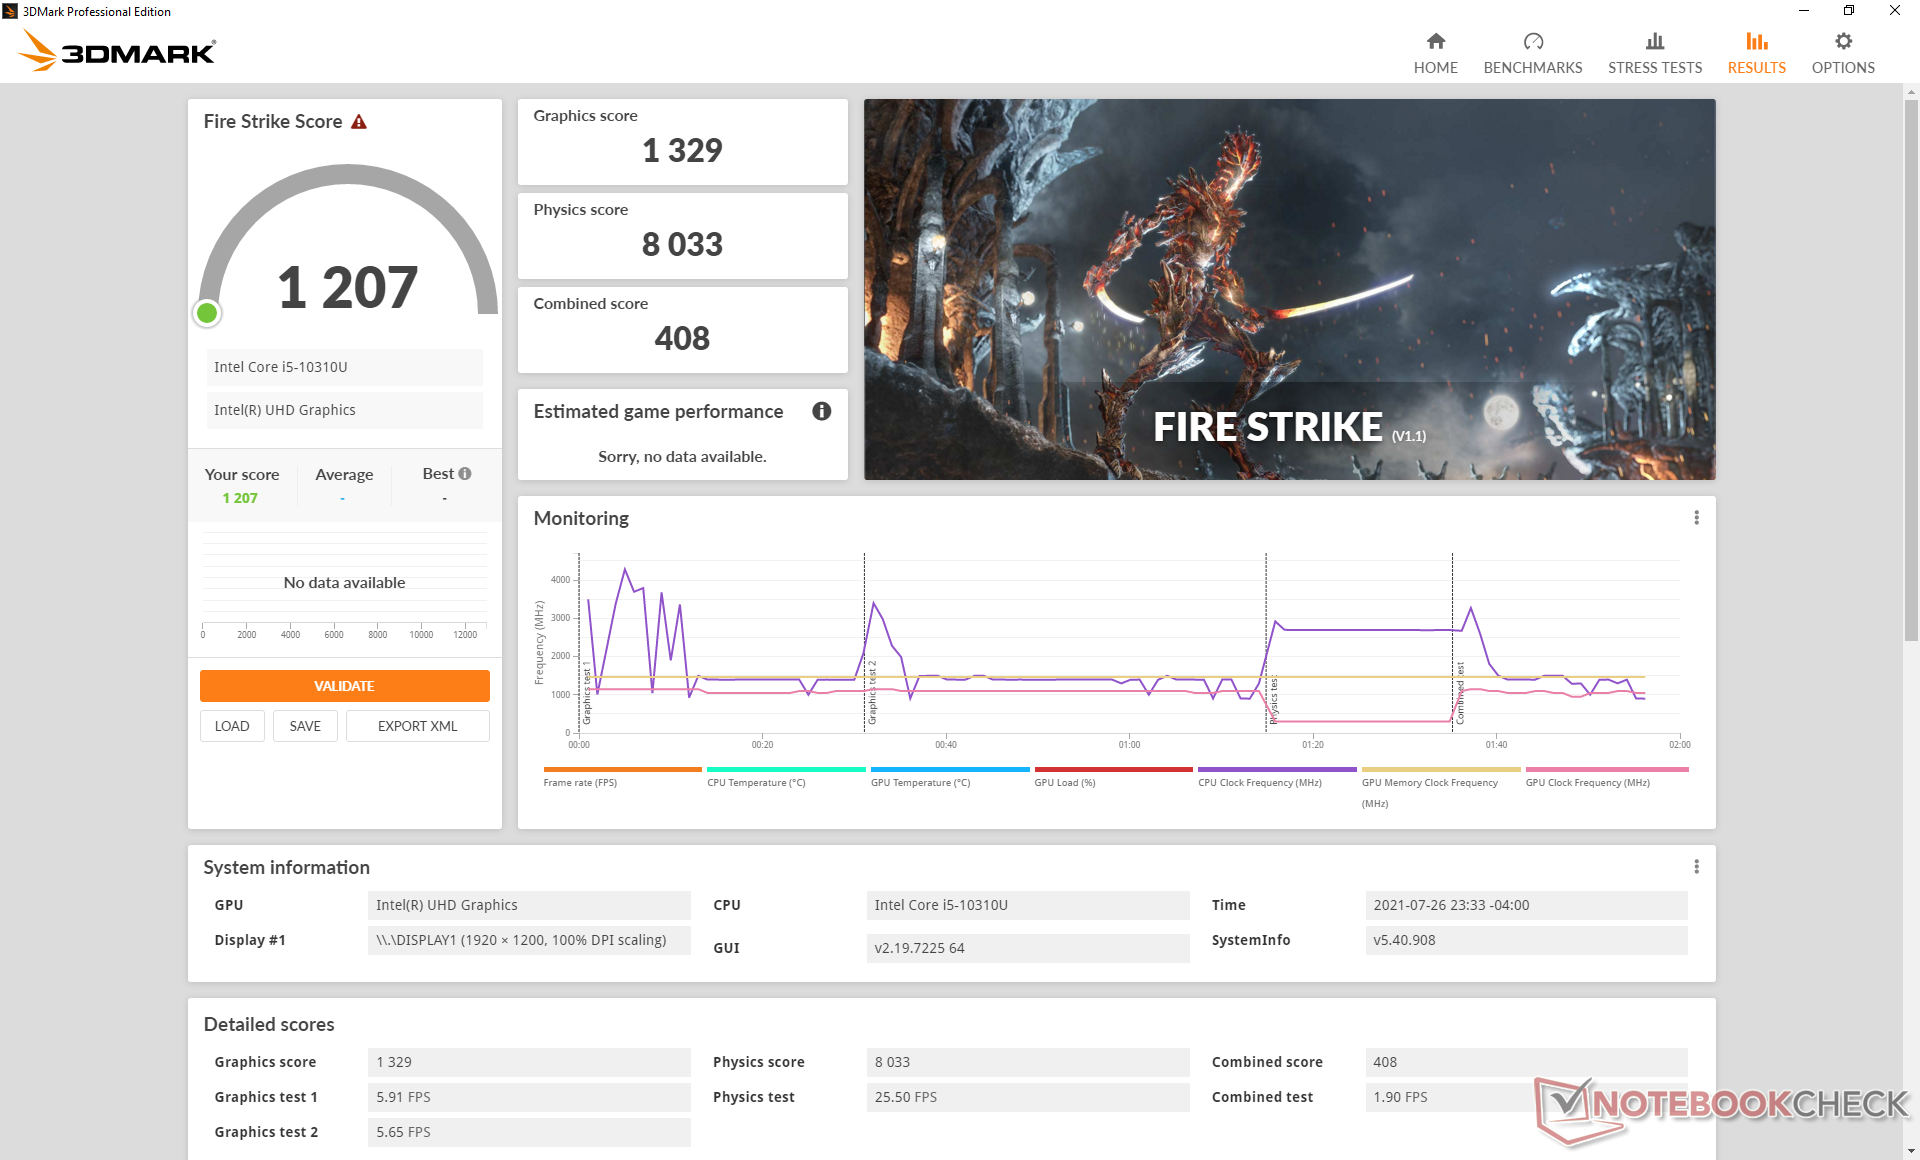
The integrated UHD Graphics 620 has aged poorly when compared to the latest Iris Xe or Radeon RX Vega. The Tiger Lake-powered Durabook S14I is able to offer 2.5x faster graphics performance than our Panasonic under similar TDP envelopes.
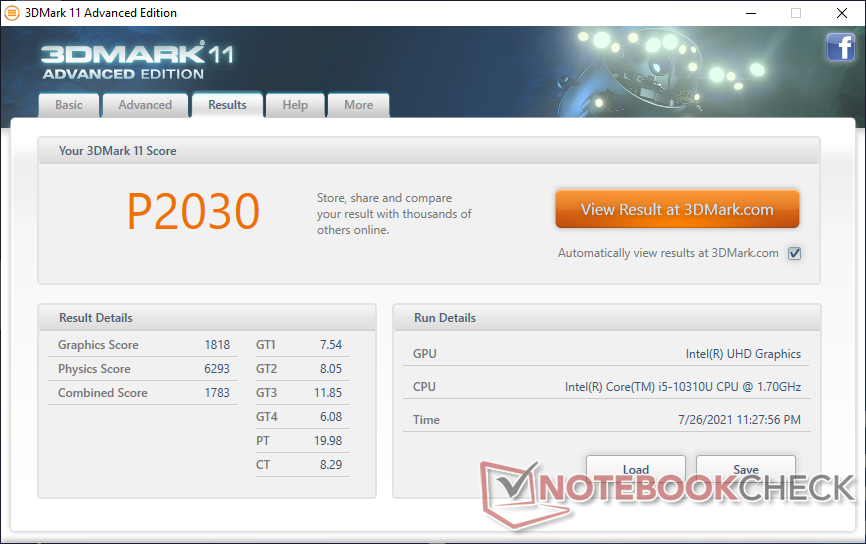
| 3DMark 11 Performance | 2030 points | |
| 3DMark Cloud Gate Standard Score | 8466 points | |
| 3DMark Fire Strike Score | 1207 points | |
| 3DMark Time Spy Score | 476 points | |
Help | ||
| low | med. | high | ultra | |
|---|---|---|---|---|
| Dota 2 Reborn (2015) | 78 | 46.1 | 21 | 19 |
| Final Fantasy XV Benchmark (2018) | 13.7 | 6.6 | 4.73 | |
| X-Plane 11.11 (2018) | 13.4 | 8.9 | 8.41 |
Emissions
System Noise
The tablet is generally quiet but never truly silent when in use. Watching YouTube videos, for example, would cause a constant fan noise of about 27 to 30 dB(A) against a silent background of 24 dB(A). Running higher loads like 3DMark 06 would boost fan noise to just over 35 dB(A). Expect the fan to pulse somewhat frequently especially when launching new applications.
Electronic noise or coil whine is noticeable only when placing an ear near the back of the tablet.
| Panasonic Toughbook FZ-G2 UHD Graphics 620, i5-10310U, Toshiba KIOXIA KBG4AZNV512G M.2 2280 OPAL | Durabook S14I Iris Xe G7 96EUs, i7-1165G7, UDinfo M2P M2P80DE512GBAEP | Durabook R11 UHD Graphics 620, i5-8250U, Kingston RBUSNS4180S3128GJ | Dell Latitude 5420 Rugged-P85G Radeon RX 540, i7-8650U, SK hynix PC401 NVMe 500 GB | |
|---|---|---|---|---|
| Noise | -9% | -15% | -10% | |
| off / environment * (dB) | 24 | 25.2 -5% | 28 -17% | 28.3 -18% |
| Idle Minimum * (dB) | 24.4 | 25.2 -3% | 28 -15% | 28.3 -16% |
| Idle Average * (dB) | 24.4 | 25.2 -3% | 28 -15% | 28.3 -16% |
| Idle Maximum * (dB) | 24.4 | 34.5 -41% | 28 -15% | 28.3 -16% |
| Load Average * (dB) | 33.5 | 34.5 -3% | 39.3 -17% | 29.9 11% |
| Load Maximum * (dB) | 36 | 36.2 -1% | 39.3 -9% | 38 -6% |
* ... smaller is better
Noise level
| Idle |
| 24.4 / 24.4 / 24.4 dB(A) |
| Load |
| 33.5 / 36 dB(A) |
 | ||
30 dB silent 40 dB(A) audible 50 dB(A) loud |
||
min: | ||
Temperature
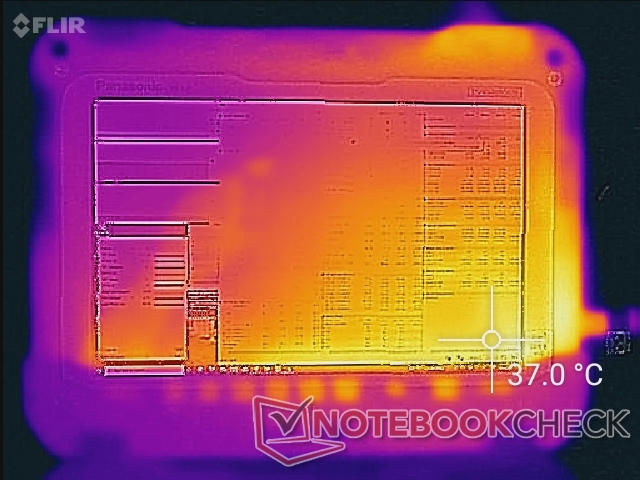
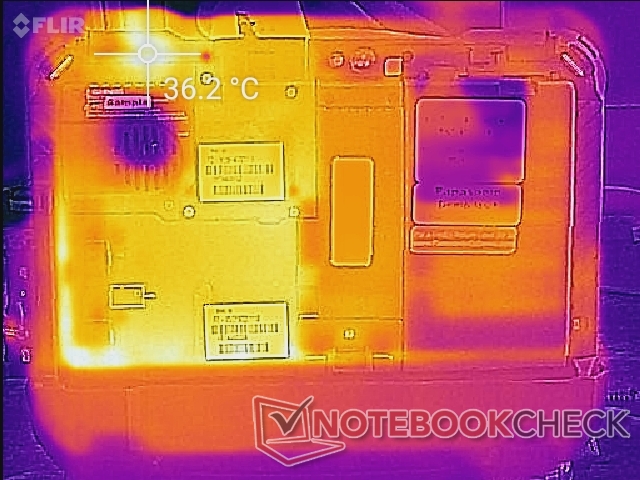
Surface temperature hot spots are nearest the bottom right corner. Since the tablet itself is rather thick, the hot spots are generally small and not that warm. We're able to measure a maximum of just 38 C when running high processing loads for long periods.
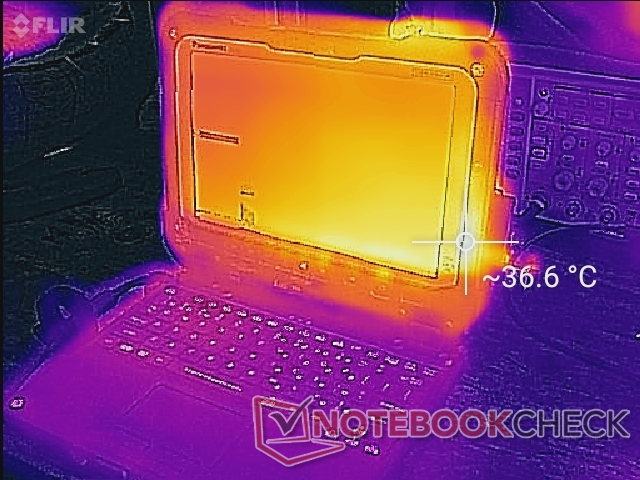
(+) The maximum temperature on the upper side is 37.4 °C / 99 F, compared to the average of 34.3 °C / 94 F, ranging from 21.2 to 62.5 °C for the class Office.
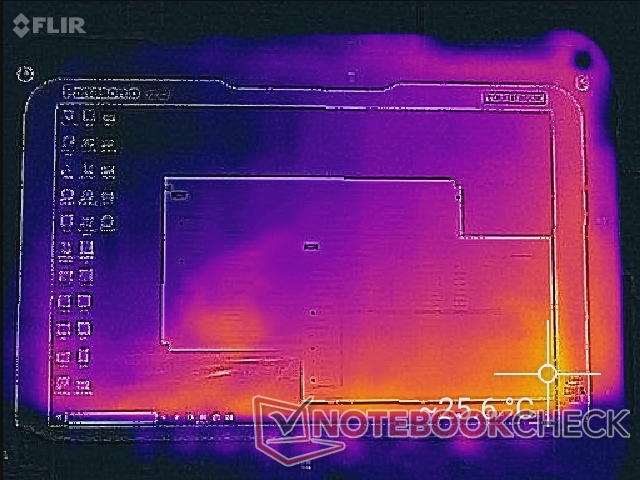
(+) The bottom heats up to a maximum of 36.6 °C / 98 F, compared to the average of 36.8 °C / 98 F
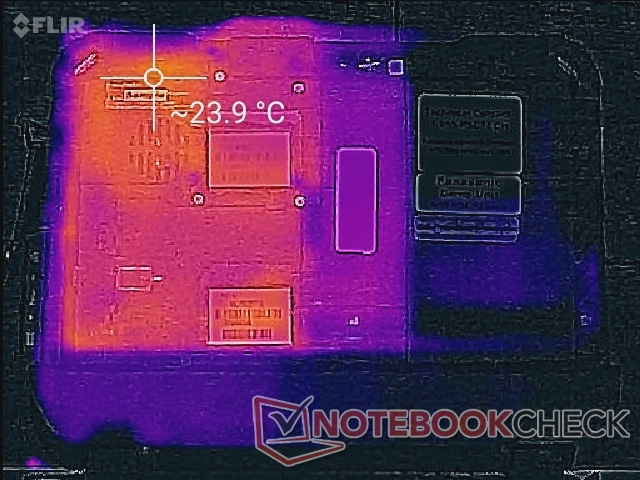
(+) In idle usage, the average temperature for the upper side is 24 °C / 75 F, compared to the device average of 29.5 °C / 85 F.
(±) The palmrests and touchpad can get very hot to the touch with a maximum of 37.4 °C / 99.3 F.
(-) The average temperature of the palmrest area of similar devices was 27.6 °C / 81.7 F (-9.8 °C / -17.6 F).
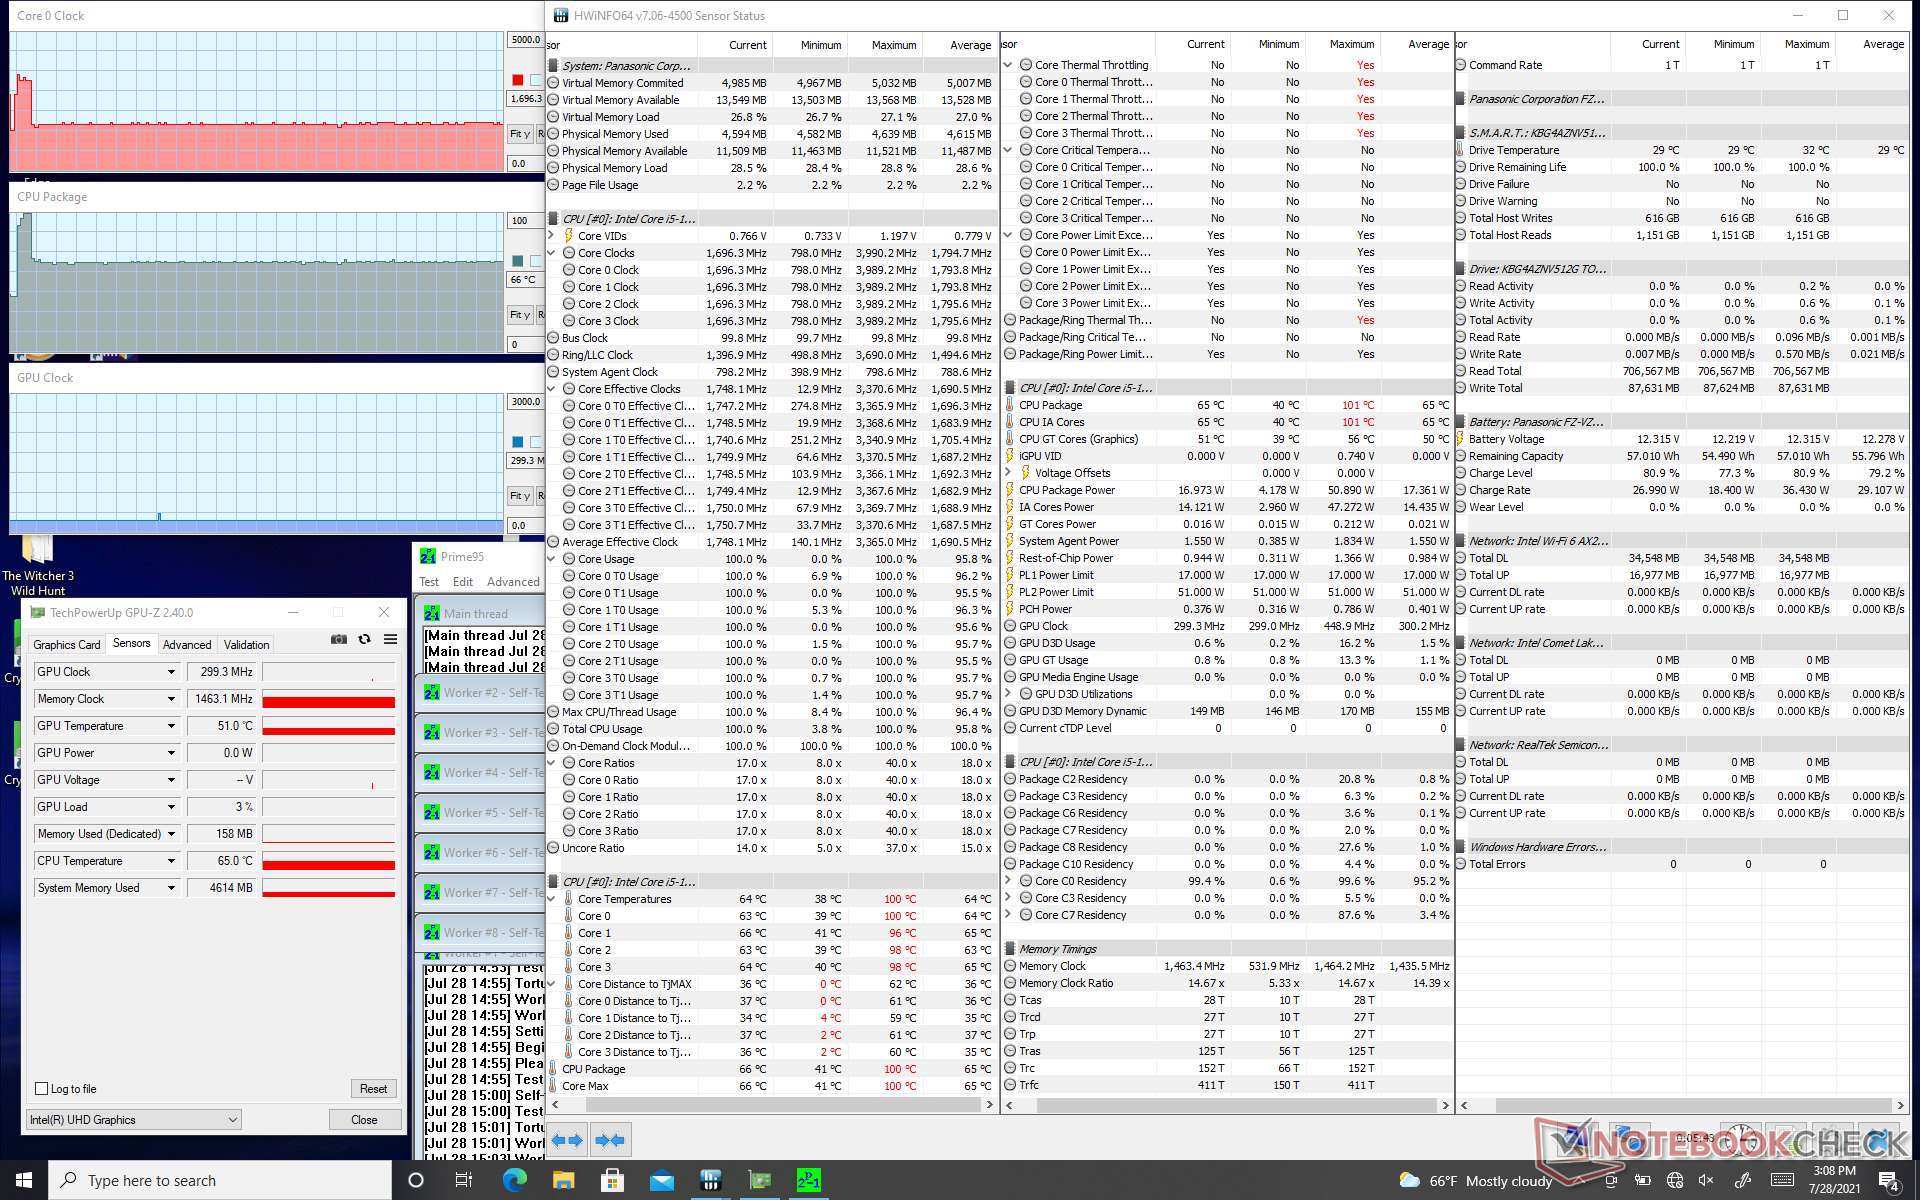
Stress Test
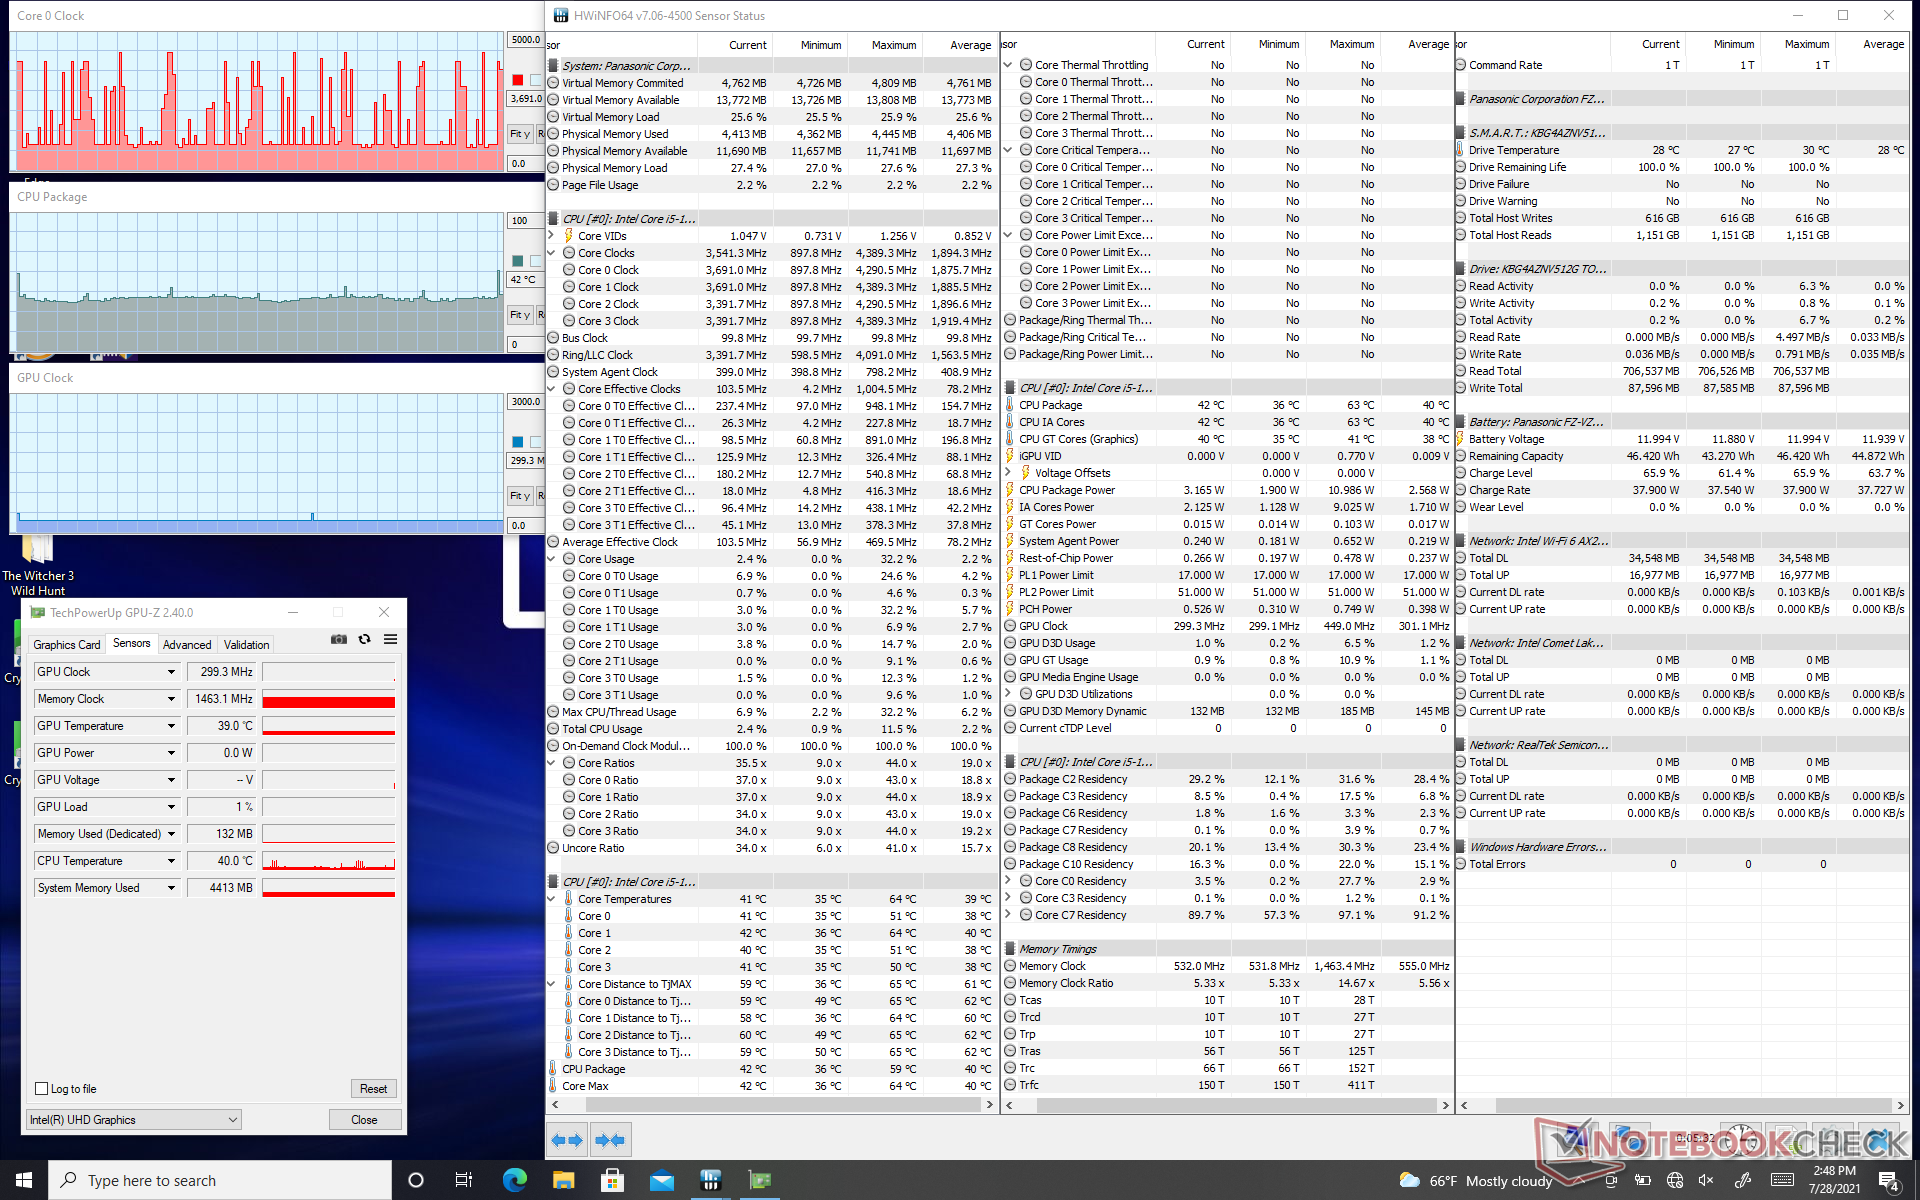
When running Prime95 to stress the CPU, clock rates would boost to 3.3 GHz for about 10 seconds until core temperature reaches 100 C. Thereafter, clock rates would drop to 1.7 GHz for a cooler and more stable 61 C.
Running on battery power will not impact performance.
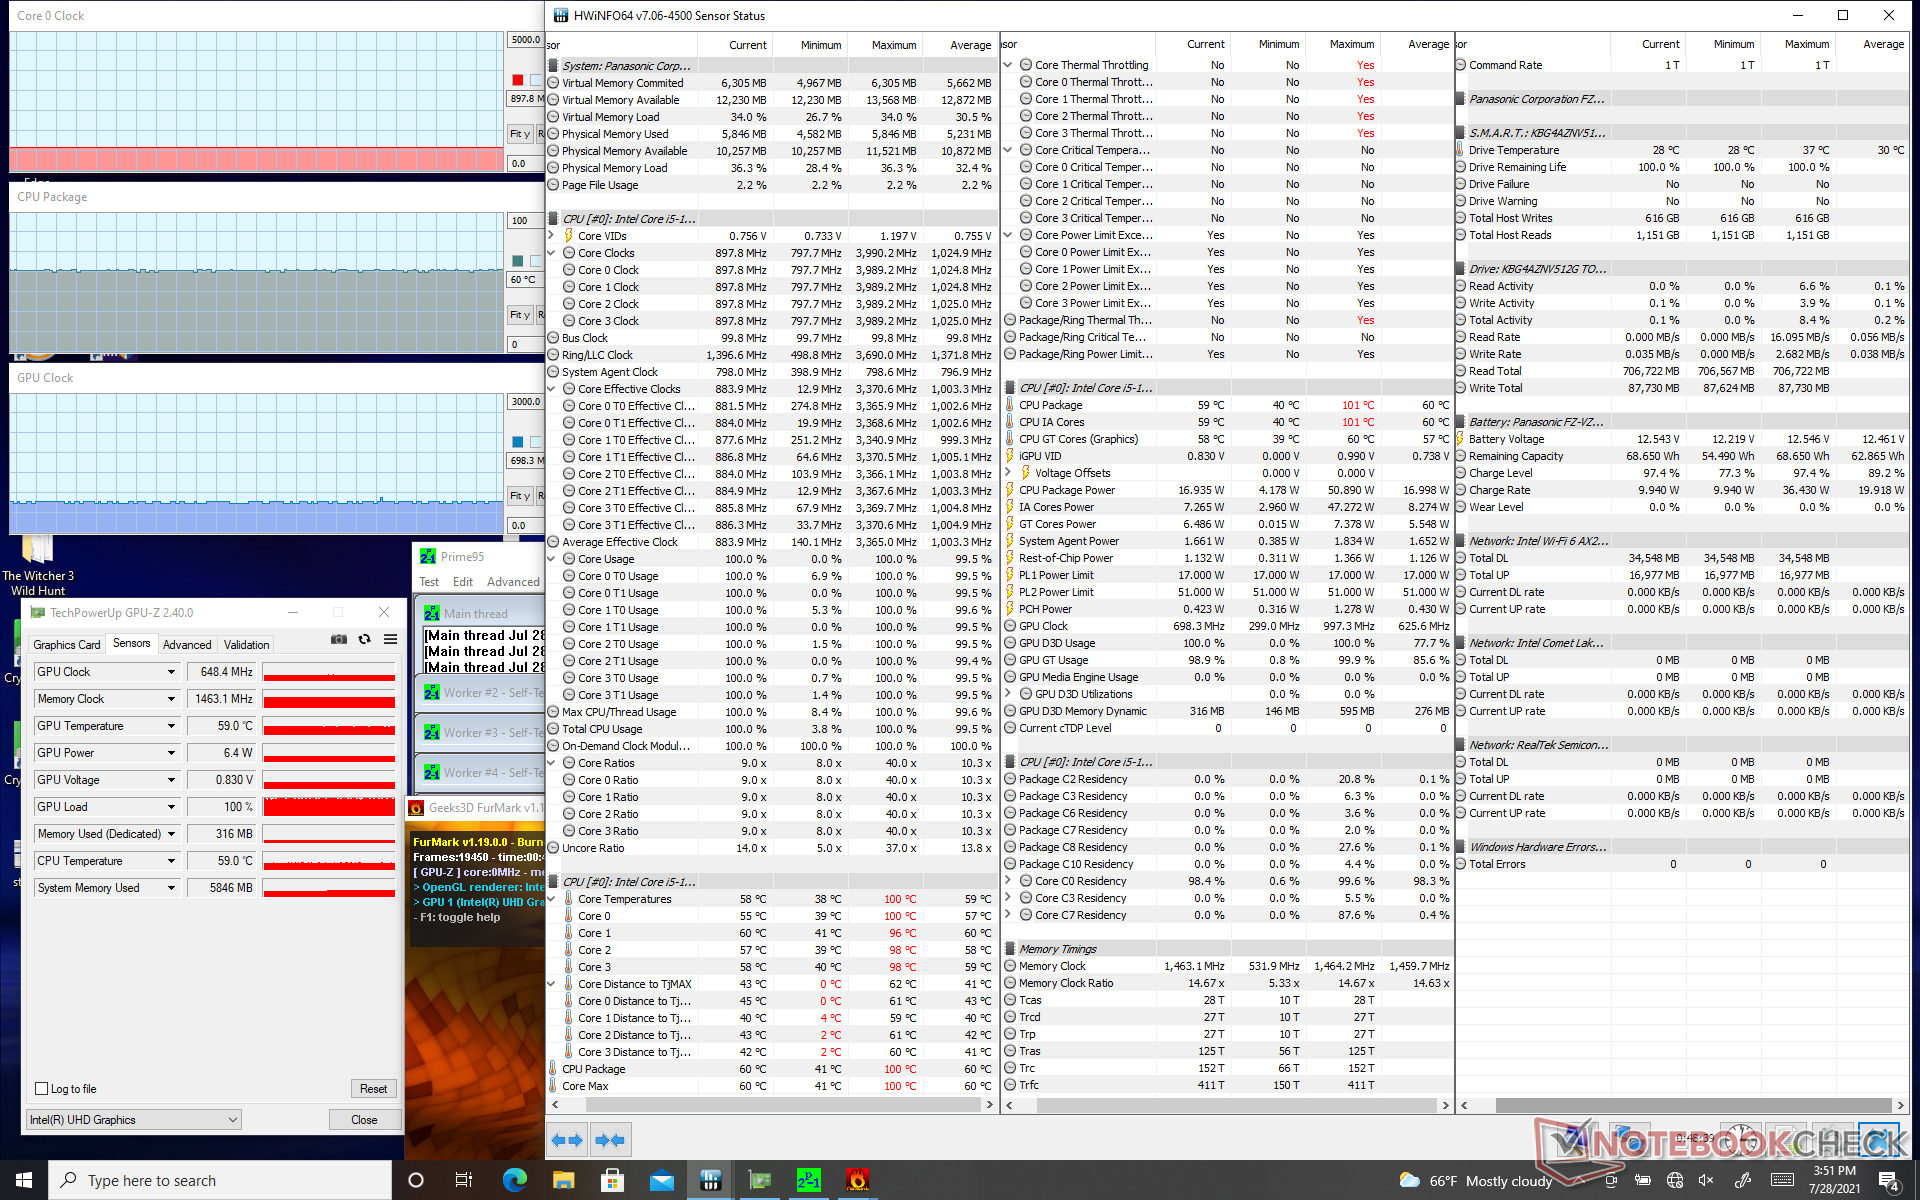
| CPU Clock (GHz) | GPU Clock (MHz) | Average CPU Temperature (°C) | |
| System Idle | -- | -- | 42 |
| Prime95 Stress | 1.7 | -- | 66 |
| Prime95 + FurMark Stress | -.9 | 648 - 698 | 60 |
Speakers
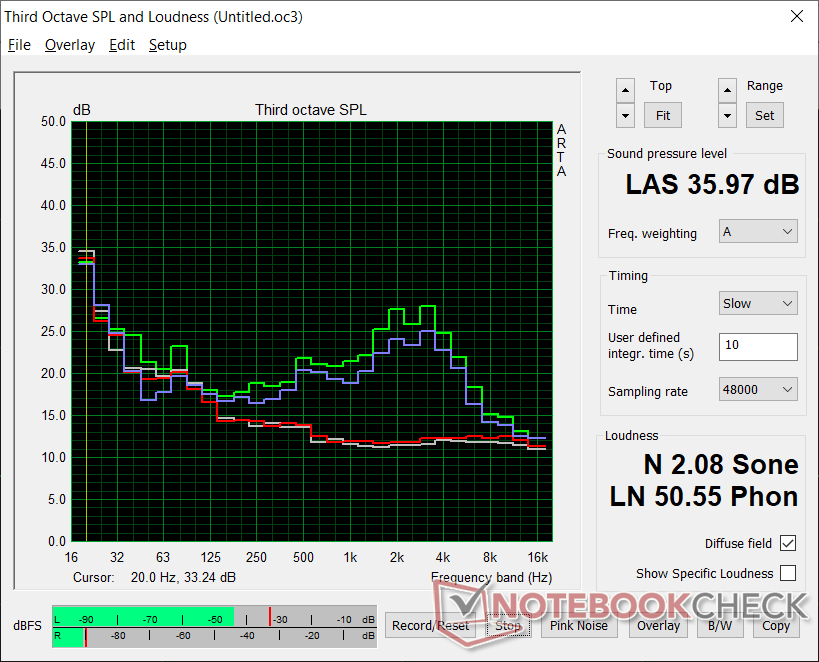
The front-facing stereo speakers have poor bass reproduction as exemplified by the narrow pink noise graph below. Maximum volume is thankfully still loud and crisp to be sufficient for voice calls.

Panasonic Toughbook FZ-G2 audio analysis
(+) | speakers can play relatively loud (85.4 dB)
Bass 100 - 315 Hz
(-) | nearly no bass - on average 31.8% lower than median
(±) | linearity of bass is average (9.5% delta to prev. frequency)
Mids 400 - 2000 Hz
(±) | higher mids - on average 7.5% higher than median
(±) | linearity of mids is average (7% delta to prev. frequency)
Highs 2 - 16 kHz
(±) | higher highs - on average 7.6% higher than median
(+) | highs are linear (6.6% delta to prev. frequency)
Overall 100 - 16.000 Hz
(±) | linearity of overall sound is average (26.3% difference to median)
Compared to same class
» 80% of all tested devices in this class were better, 7% similar, 13% worse
» The best had a delta of 7%, average was 21%, worst was 53%
Compared to all devices tested
» 80% of all tested devices were better, 4% similar, 16% worse
» The best had a delta of 4%, average was 24%, worst was 134%
Apple MacBook 12 (Early 2016) 1.1 GHz audio analysis
(+) | speakers can play relatively loud (83.6 dB)
Bass 100 - 315 Hz
(±) | reduced bass - on average 11.3% lower than median
(±) | linearity of bass is average (14.2% delta to prev. frequency)
Mids 400 - 2000 Hz
(+) | balanced mids - only 2.4% away from median
(+) | mids are linear (5.5% delta to prev. frequency)
Highs 2 - 16 kHz
(+) | balanced highs - only 2% away from median
(+) | highs are linear (4.5% delta to prev. frequency)
Overall 100 - 16.000 Hz
(+) | overall sound is linear (10.2% difference to median)
Compared to same class
» 7% of all tested devices in this class were better, 2% similar, 91% worse
» The best had a delta of 5%, average was 18%, worst was 53%
Compared to all devices tested
» 4% of all tested devices were better, 1% similar, 94% worse
» The best had a delta of 4%, average was 24%, worst was 134%
Energy Management
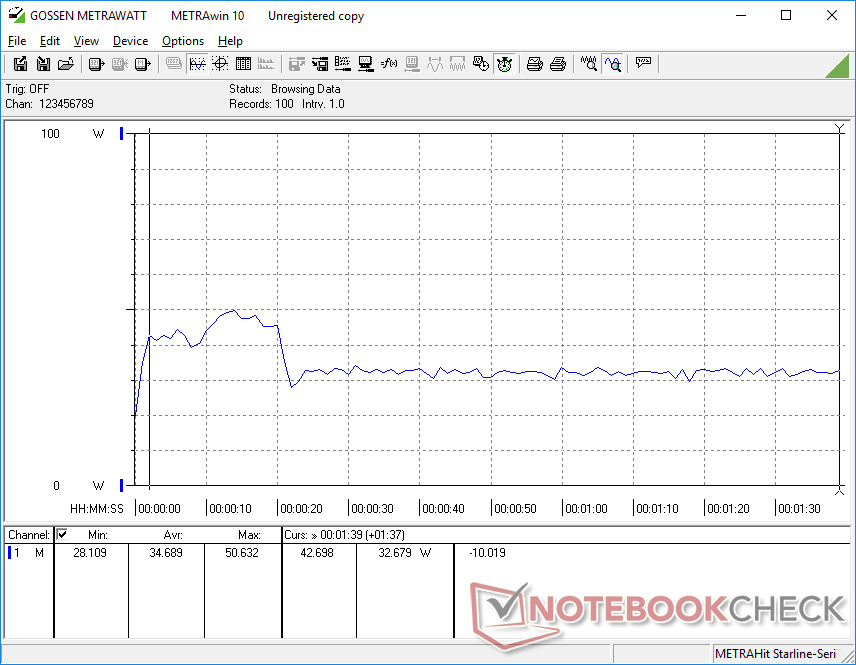
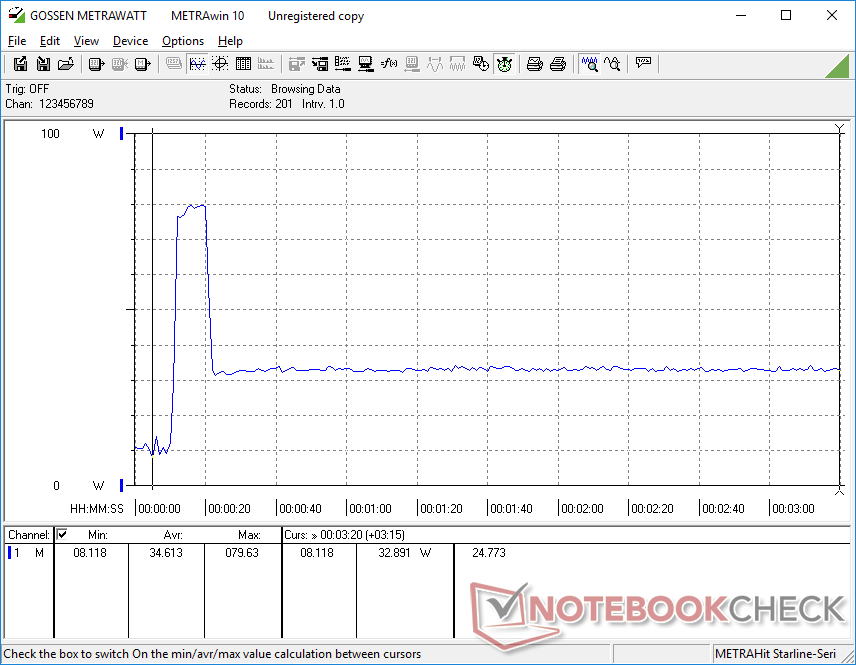
Power Consumption
The difference between minimum and maximum display brightness is about 5 W. Running higher loads will consume a few watts less than the Tiger Lake-powered Durabook S14I albeit with significantly slower graphics performance. Performance-per-watt is not as efficient and thus lower performance-per-watt on our Panasonic.
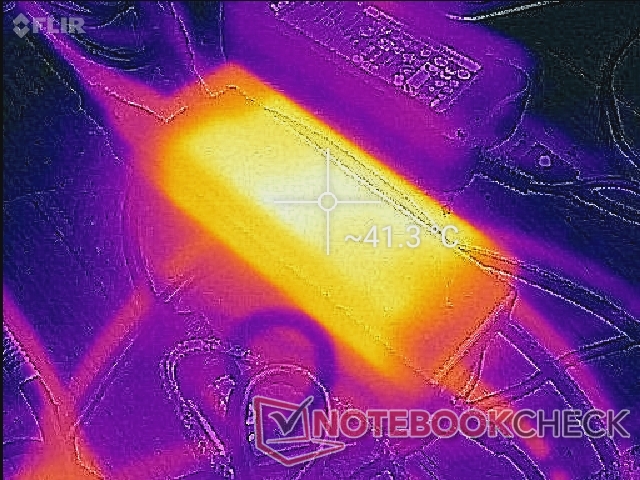
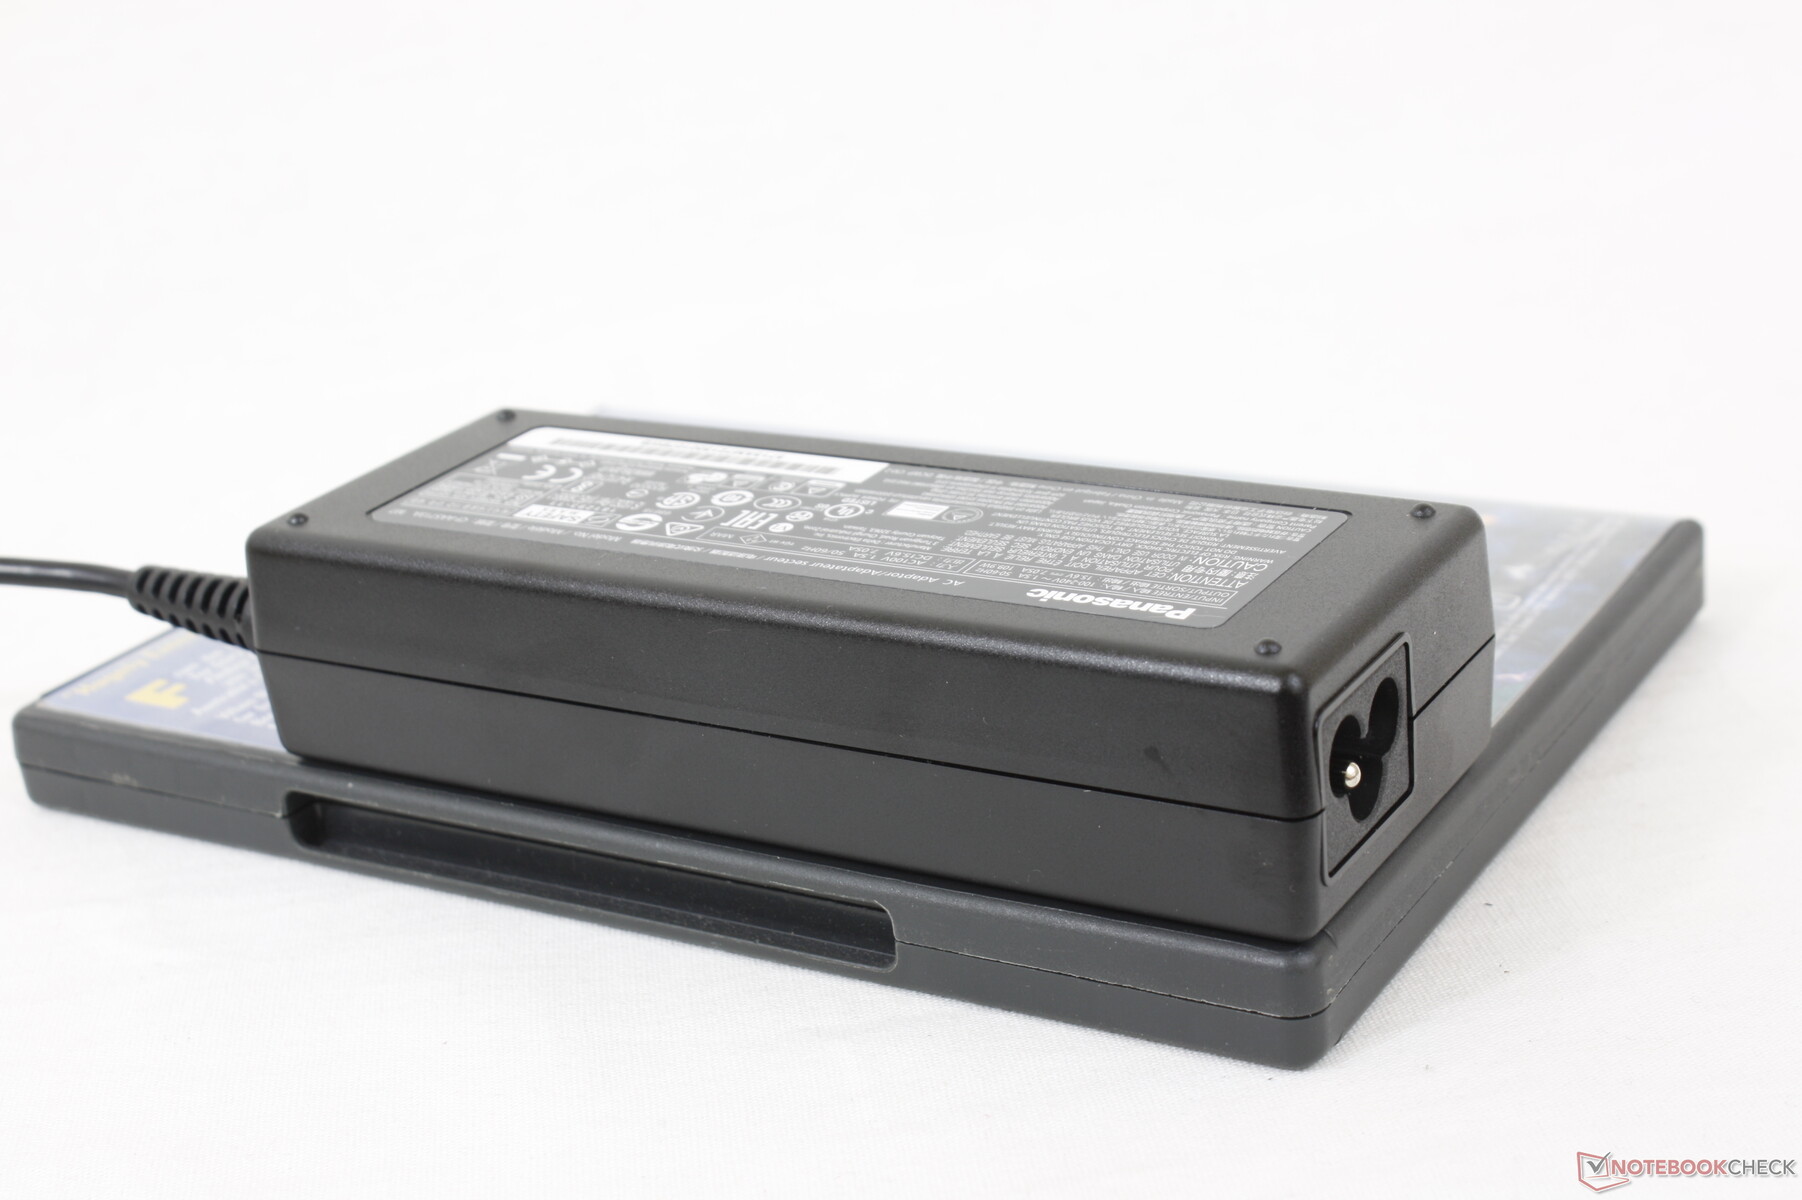
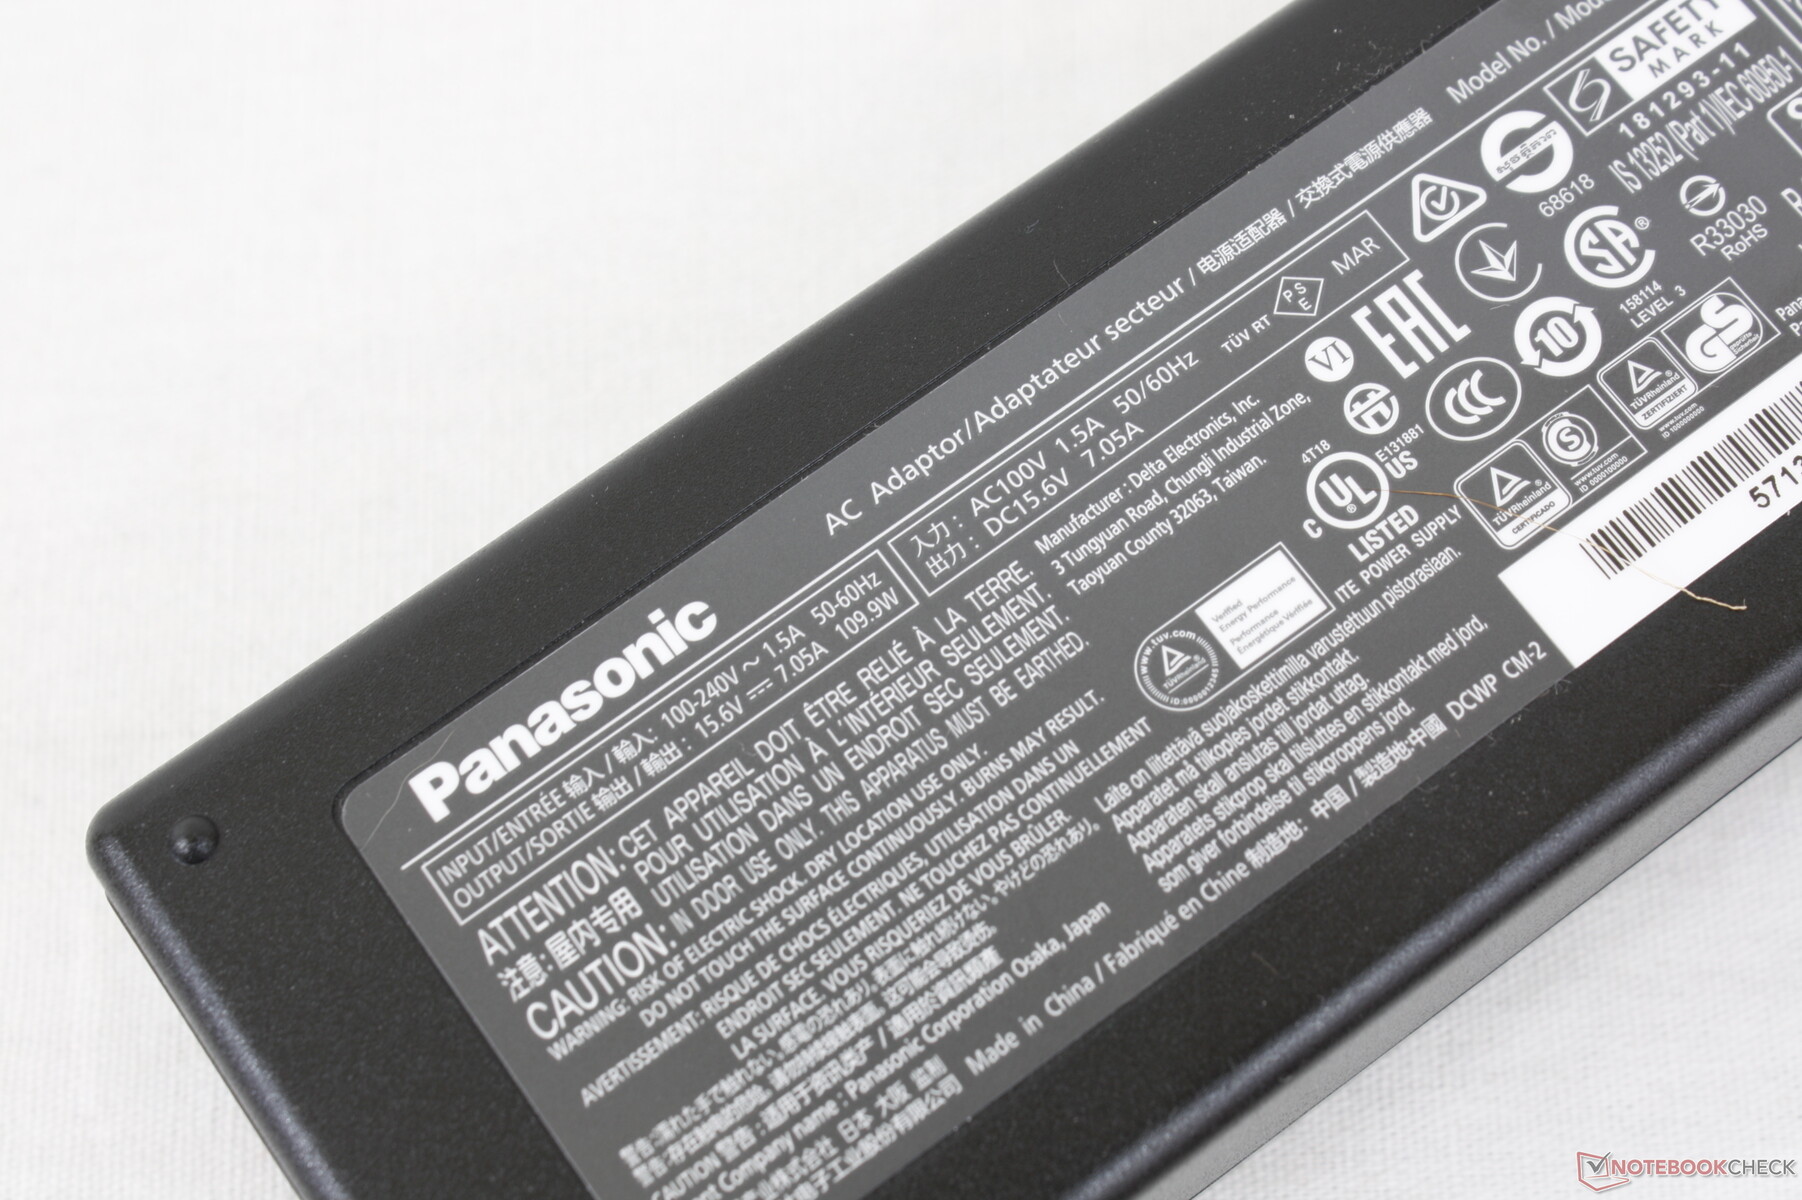
The small-medium AC adapter (~14.3 x 5.3 x 3.2 cm) is rated for a maximum output of 109.9 W.
| Off / Standby | |
| Idle | |
| Load |
|
Key:
min: | |
| Panasonic Toughbook FZ-G2 i5-10310U, UHD Graphics 620, Toshiba KIOXIA KBG4AZNV512G M.2 2280 OPAL, IPS, 1920x1200, 10.1" | Durabook S14I i7-1165G7, Iris Xe G7 96EUs, UDinfo M2P M2P80DE512GBAEP, TN, 1920x1080, 14" | Durabook R11 i5-8250U, UHD Graphics 620, Kingston RBUSNS4180S3128GJ, IPS, 1920x1080, 11.6" | Dell Latitude 5420 Rugged-P85G i7-8650U, Radeon RX 540, SK hynix PC401 NVMe 500 GB, IPS, 1920x1080, 14" | |
|---|---|---|---|---|
| Power Consumption | -61% | -27% | -67% | |
| Idle Minimum * (Watt) | 3.5 | 6.8 -94% | 6.1 -74% | 4.8 -37% |
| Idle Average * (Watt) | 8.1 | 16.4 -102% | 11.7 -44% | 13.6 -68% |
| Idle Maximum * (Watt) | 8.2 | 16.9 -106% | 11.9 -45% | 13.8 -68% |
| Load Average * (Watt) | 34.7 | 39.2 -13% | 37.7 -9% | 67.8 -95% |
| Witcher 3 ultra * (Watt) | 31.8 | 69.1 -117% | ||
| Load Maximum * (Watt) | 79.7 | 73.1 8% | 50.5 37% | 93.5 -17% |
* ... smaller is better
Power Consumption Witcher 3 / Stresstest
Battery Life
Runtimes are long at over 11 hours of real-world WLAN use when the display is set to 150 nits. Charging from empty to full capacity will take around 100 minutes.
| Panasonic Toughbook FZ-G2 i5-10310U, UHD Graphics 620, 68 Wh | Durabook S14I i7-1165G7, Iris Xe G7 96EUs, 50 Wh | Durabook R11 i5-8250U, UHD Graphics 620, 43 Wh | Dell Latitude 5420 Rugged-P85G i7-8650U, Radeon RX 540, 102 Wh | |
|---|---|---|---|---|
| Battery runtime | -51% | -49% | 45% | |
| WiFi v1.3 (h) | 11.2 | 5.5 -51% | 5.7 -49% | 16.2 45% |
| Reader / Idle (h) | 31.4 | |||
| Load (h) | 3.2 |
Pros
Cons
Verdict
The Toughbook G2 is a great option for those who need a versatile Windows tablet and not just a slim one with very few connectivity features. The modular accessories and excellent display quality in particular are the most attractive selling points of the G2 as users can more easily adapt it for any given environment or function.
Perhaps the biggest drawback to the G2 is its heavy weight even after accounting for its rugged classification. The Durabook R11 offers both a larger display and upgradeable components while weighing several hundred grams lighter than the Panasonic. To make the clunkier Toughbook G2 more worthwhile, you'll have to exploit its versatile modules.
The Toughbook G2 is one of the most modular and customizable rugged tablets out there. You'll have to deal with its larger girth and heavier weight, however.
For future revisions, we would love to see larger latches and the elimination of pulse-width modulation for brightness control. The small latches securing the ports and modules are difficult to grip while users sensitive to onscreen flickering may want to avoid using the G2 at very low brightness levels. An internal update to Intel Tiger Lake would also provide a significant boost to graphics performance.
Price and availability
Prices range wildly depending on the accessories and modules. Interested users can request quotes directly from Panasonic here.
More articles related to this device
Panasonic Toughbook FZ-G2 (Toughbook FZ Series)Related Articles


Price comparison
