Notebookcheck Logo

Intel Core i9-10910 vs AMD Ryzen 5 3500U

Intel Core i9-10910

► remove from comparison Intel i9-10910

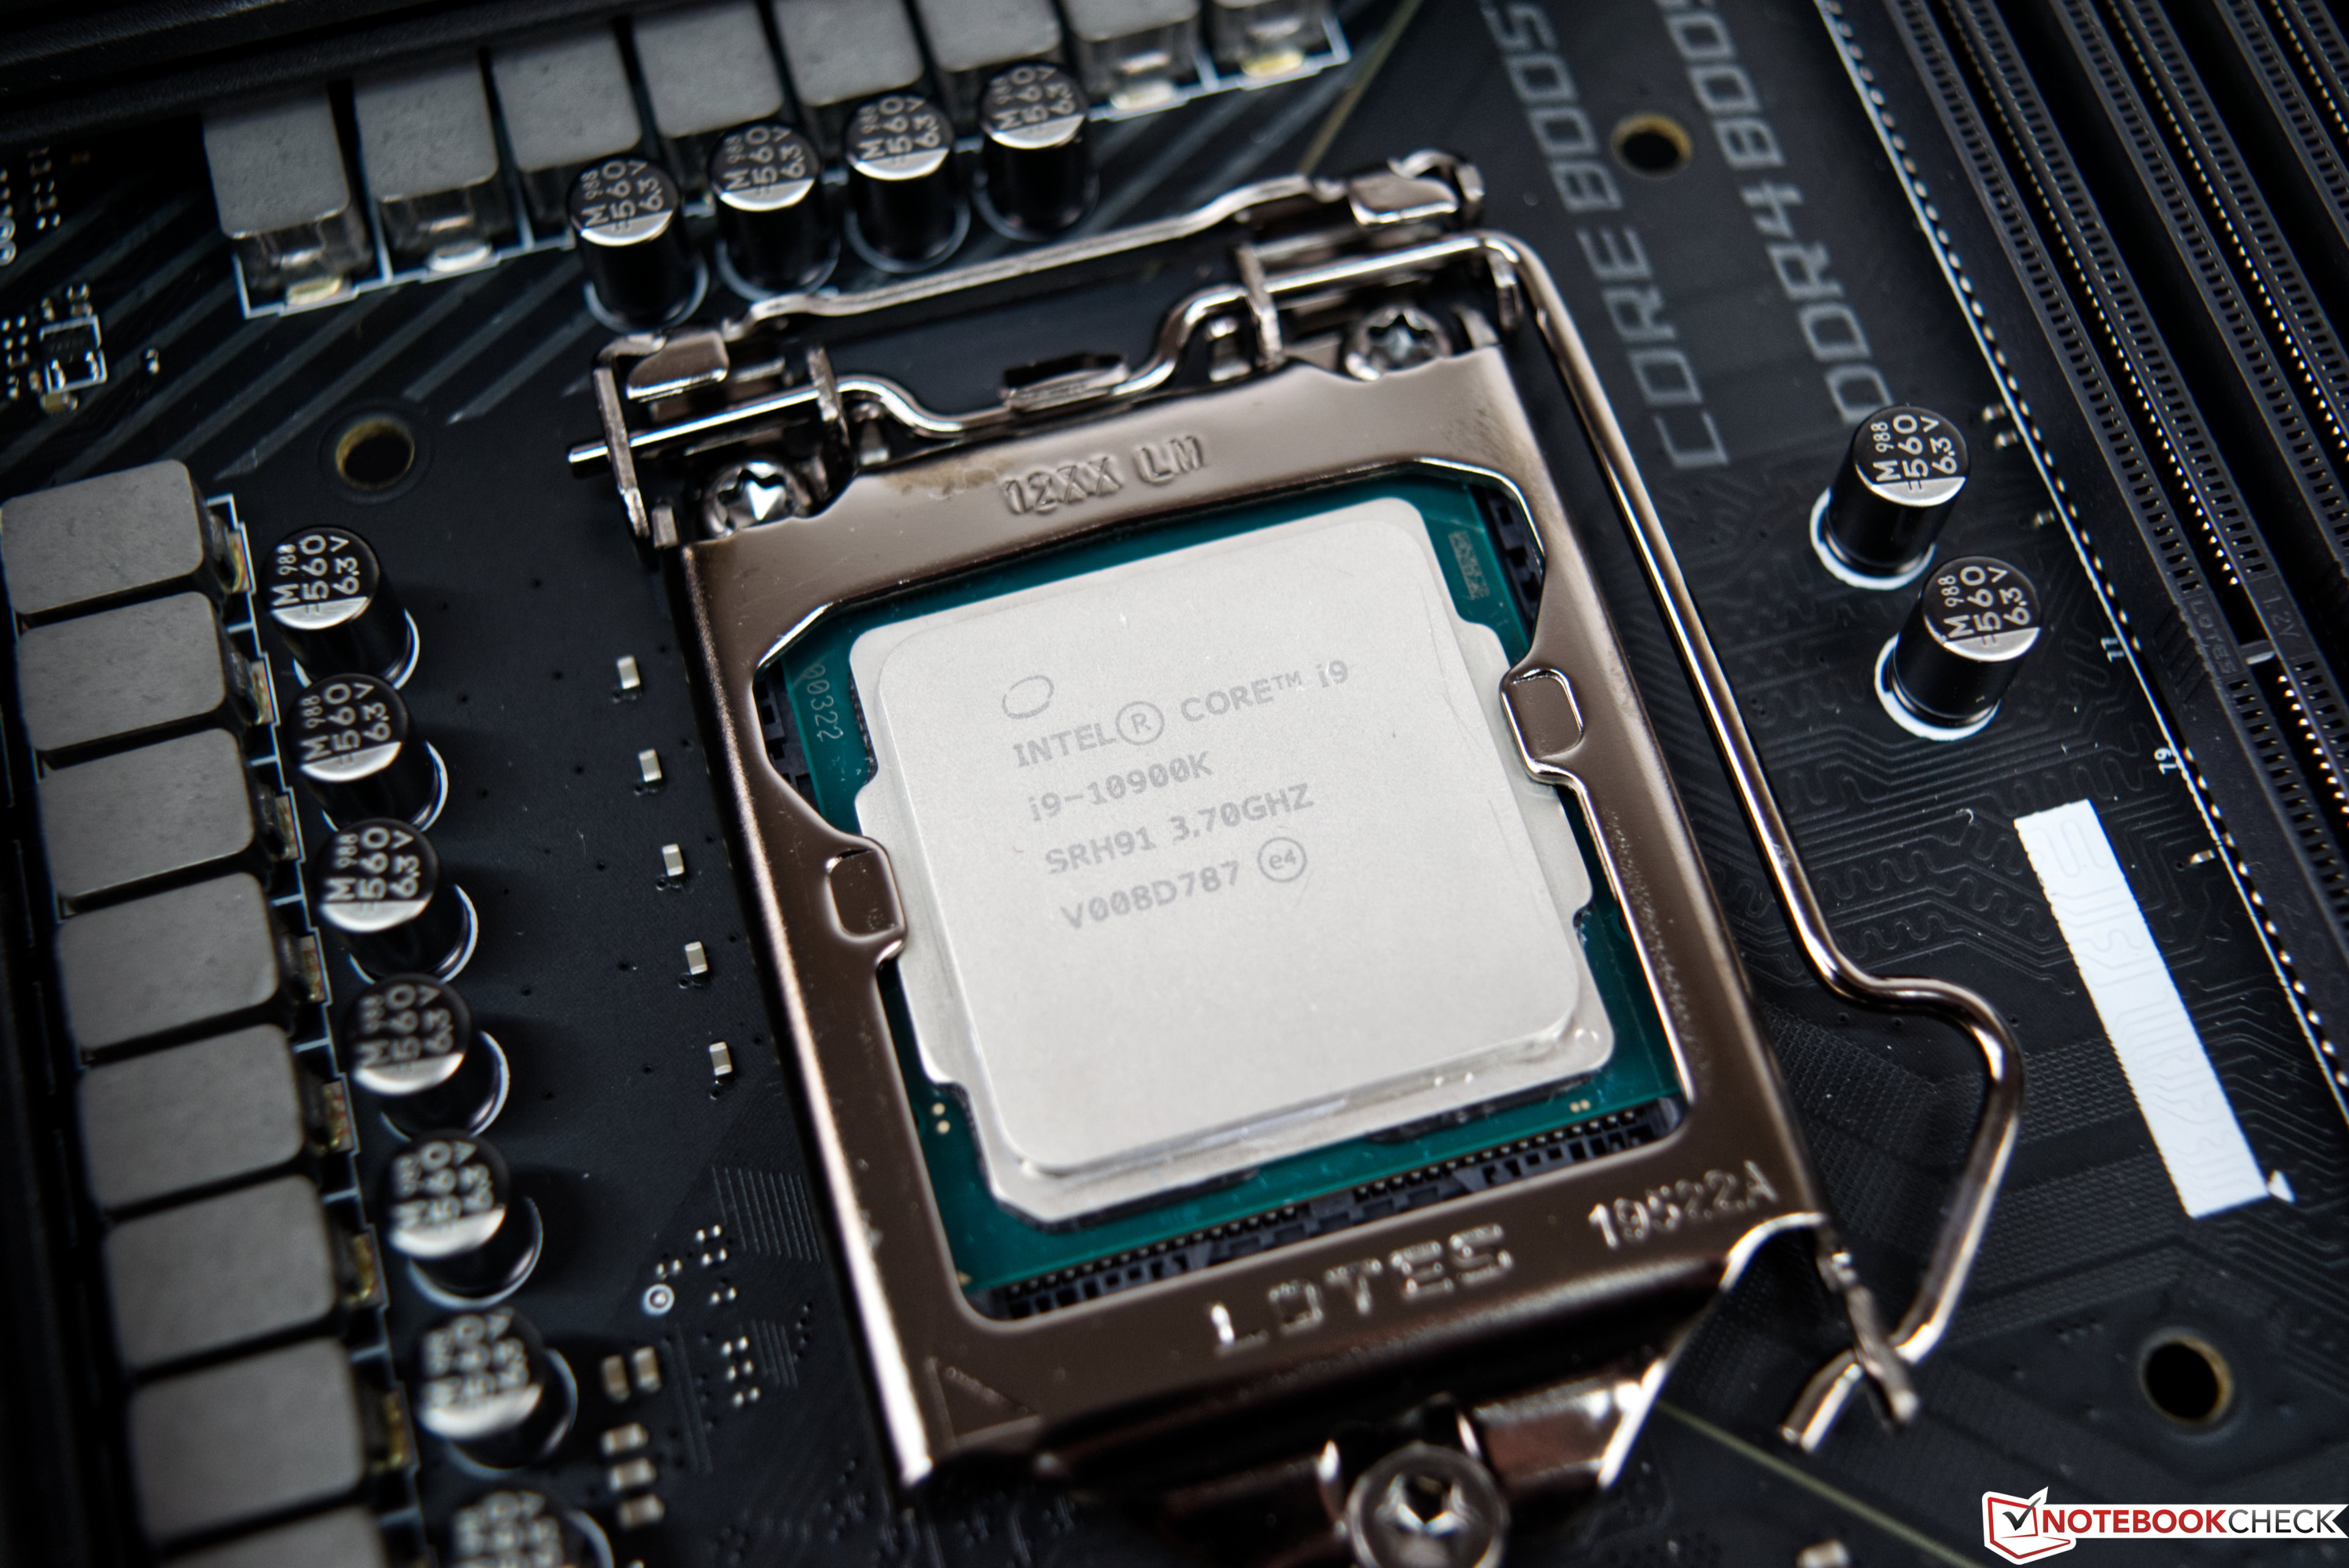
The Intel Core i9-10910 is a high-end processor for desktops with ten cores based on the Comet Lake architecture (CML-S, 4th generation of Skylake). The processor clocks at between 3.6 and 5.0 GHz (all 10 cores up to 4.6 GHz) and can execute up to twenty threads simultaneously thanks to Hyper-Threading. The 5.0 GHz can be only achieved below 70°C core temperature (Thermal Velocity Boost of 100 MHz).

The processor is still manufactured in the old 14nm (14nm++) process. Compared to the predecessor, the Core i9-9900K, the 10900K offers increased clock speeds and two more cores.

The Comet Lake architecture is similar to Coffee Lake and offers the same features and is produced in the same 14nm process. Other than the improved clock rates, the memory controller now also supports faster DDR4-2933 RAM. More information on Comet Lake and all the models and articles on it can be found here.

Performance

Thanks to the high Turbo Boost, the CPU is the fastest gaming CPU available at the time of announcement. Using all cores, the i9 however is slower than the top Ryzen CPUs (like the Ryzen 9 3950X) which offer more cores.

Graphics

The integrated Intel UHD Graphics 630 iGPU is supposed to offer a similar performance as the UHD630 in the Core i7-9900K. As a  low-end solution it will only run current games smoothly at reduced details - if at all.

Power Consumption

Intel specifies the TDP with 125 Watts (PL1) but under full load up to 250 Watt are consumed (PL2). In default mode these 250 Watt and therefore high clock speeds can be maintained for up to 56 seconds, however, all boards offer the option to alter these settings.

AMD Ryzen 5 3500U

► remove from comparison AMD R5 3500U

The AMD Ryzen 5 3500U is a mobile SoC that was announced in January 2019. It combines four Zen+ cores (8 threads) clocked at 2.1 GHz to 3.7 GHz with a Radeon RX Vega 8 iGPU with 8 CUs (512 Shaders) clocked at up to 1200 MHz. Specified at 15 Watt TDP, the SoC is intended for thin mid-range laptops. In Chromebooks, AMD calles the APU AMD Ryzen 5 3500C, but the specifications (and performance) are the same.

The Picasso SoC uses the Zen+ microarchitecture with slight improvements that should lead to a 3% IPS (performance per clock) improvements. Furthermore, the 12 nm process allows for higher clocks at similar power consumption.

The integrated dual-channel memory controller supports up to DDR4-2400 memory. As the features of the Picasso APUs are the same compared to the Raven Ridge predecessors, we point to our Raven Ridge launch article.

Performance

The average 3500U in our database matches the Intel Core i7-1065G7 in multi-thread performance to be an OK lower mid-range option, as of early 2021.

The Honor MagicBook 14 is among the fastest laptops powered by the 3500U that we know of. It can be up to 50% faster in CPU-bound workloads than the slowest system featuring the same chip in our database, as of August 2023.

Power consumption

This Ryzen 5 series chip has a default TDP (also known as the long-term power limit) of 15 W, a value that laptop makers are free to set to anything between 12 W and 35 W with clock speeds and performance changing accordingly as a result. Either way, this is a tad too high to allow for passively cooled designs.

The chip is manufactured on a 12 nm process for subpar, as of late 2022, energy efficiency.

ModelIntel Core i9-10910AMD Ryzen 5 3500U
CodenameComet Lake-SPicasso-U (Zen+)
SeriesIntel Comet LakeAMD Picasso (Ryzen 3000 APU)
Series: Picasso (Ryzen 3000 APU) Picasso-U (Zen+)
Intel Core i9-10850K compare3.6 - 5.2 GHz10 / 20 cores20 MB L3
Intel Core i9-10910 « 3.6 - 5 GHz10 / 20 cores20 MB L3
Intel Core i3-10320 compare3.8 - 4.6 GHz4 / 8 cores7.9 MB L3
Intel Core i3-10100 compare3.6 - 4.3 GHz4 / 8 cores6 MB L3
AMD Ryzen 7 3780U compare2.3 - 4 GHz4 / 8 cores4 MB L3
AMD Ryzen 7 3700U compare2.3 - 4 GHz4 / 8 cores4 MB L3
AMD Ryzen 5 3550H compare2.1 - 3.7 GHz4 / 8 cores4 MB L3
AMD Ryzen 5 3500U « 2.1 - 3.7 GHz4 / 8 cores4 MB L3
AMD Ryzen 5 3450U compare2.1 - 3.5 GHz4 / 8 cores4 MB L3
AMD Ryzen 5 3580U compare2.1 - 3.7 GHz4 / 8 cores4 MB L3
Clock3600 - 5000 MHz2100 - 3700 MHz
L1 Cache640 KB384 KB
L2 Cache2.5 MB2 MB
L3 Cache20 MB4 MB
Cores / Threads10 / 204 / 8
TDP125 Watt15 Watt
Technology14 nm12 nm
max. Temp.100 °C105 °C
SocketLGA 1200FP5
FeaturesTVB, HyperThreading, AVX, AVX2, FMA3, Quick Sync, VirtualizationDDR4-2400 RAM, PCIe 3, MMX, SSE, SSE2, SSE3, SSSE3, SSE4A, SSE4.1, SSE4.2, AVX, AVX2, BMI2, ABM, FMA, ADX, SMEP, SMAP, SMT, CPB, AES-NI, RDRAND, RDSEED, SHA, SME
iGPUIntel UHD Graphics 630AMD Radeon RX Vega 8 (Ryzen 2000/3000) ( - 1200 MHz)
Architecturex86x86
$488 U.S.
Announced
Transistors4500 Million
Manufacturerwww.amd.com

Benchmarks

Performance Rating - CB R15 + R20 + 7-Zip + X265 + Blender + 3DM11 CPU - i9-10910
34.3 pt (57%)
Restrict / Search: Model: Max. age: years
Performance Rating - CB R15 + R20 + 7-Zip + X265 + Blender + 3DM11 CPU - R5 3500U
25 pt (42%)
Restrict / Search: Model: Max. age: years
Cinebench 2024 - Cinebench 2024 CPU Single Core
55.5 Points (31%)
Cinebench 2024 - Cinebench 2024 CPU Multi Core
206 Points (4%)
Cinebench R20 - Cinebench R20 CPU (Single Core)
501 Points (55%)
min: 317     avg: 354.3     median: 364 (40%)     max: 372 Points
Cinebench R20 - Cinebench R20 CPU (Multi Core)
5196 Points (13%)
min: 1063     avg: 1436     median: 1477 (4%)     max: 1540 Points
Cinebench R15 - Cinebench R15 CPU Multi 64 Bit
2302 Points (15%)
min: 482     avg: 642     median: 650 (4%)     max: 682 Points
Cinebench R15 - Cinebench R15 CPU Single 64 Bit
215 Points (60%)
min: 131     avg: 142.4     median: 143 (40%)     max: 147 Points
Cinebench R11.5 - Cinebench R11.5 CPU Multi 64 Bit
25.6 Points (33%)
7.6 Points (10%)
Cinebench R11.5 - Cinebench R11.5 CPU Single 64 Bit
2.4 Points (58%)
1.7 Points (39%)
Cinebench R10 - Cinebench R10 Rend. Single (32bit)
8131 Points (49%)
min: 4542     avg: 4556     median: 4557.5 (28%)     max: 4565 Points
Cinebench R10 - Cinebench R10 Rend. Multi (32bit)
57842 Points (42%)
min: 13249     avg: 16322     median: 17230.5 (12%)     max: 17578 Points
wPrime 2.10 - wPrime 2.0 1024m *
368.2 s (4%)
wPrime 2.10 - wPrime 2.0 32m *
12.9 s (3%)
wPrime 1.55 - wPrime 1.55 1024m *
243.5 s (1%)
wPrime 1.55 - wPrime 1.55 32m *
7.8 s (4%)
WinRAR - WinRAR 4.0
8613 Points (14%)
2455 Points (4%)
7-Zip 18.03 - 7-Zip 18.03 Multi Thread 4 runs
60747 MIPS (35%)
min: 15825     avg: 16929     median: 17024.5 (10%)     max: 17508 MIPS
7-Zip 18.03 - 7-Zip 18.03 Single Thread 4 runs
5690 MIPS (67%)
min: 3502     avg: 3541     median: 3538 (42%)     max: 3580 MIPS
X264 HD Benchmark 4.0 - x264 Pass 2
39.2 fps (1%)
X264 HD Benchmark 4.0 - x264 Pass 1
134.8 fps (3%)
HWBOT x265 Benchmark v2.2 - HWBOT x265 4k Preset
16.8 fps (30%)
min: 3.35     avg: 3.9     median: 4 (7%)     max: 4.15 fps
TrueCrypt - TrueCrypt Serpent
0.4 GB/s (13%)
TrueCrypt - TrueCrypt Twofish
0.7 GB/s (12%)
TrueCrypt - TrueCrypt AES
4.4 GB/s (11%)
Blender - Blender 2.79 BMW27 CPU *
208 Seconds (1%)
min: 680     avg: 704     median: 694 (5%)     max: 796 Seconds
R Benchmark 2.5 - R Benchmark 2.5 *
0.5 sec (12%)
min: 0.734     avg: 0.7     median: 0.7 (16%)     max: 0.804 sec
3DMark 06 - CPU - 3DMark 06 - CPU
min: 5044     avg: 5951     median: 5950.5 (13%)     max: 6857 Points
Super Pi mod 1.5 XS 1M - Super Pi mod 1.5 XS 1M *
7.6 s (2%)
12 s (3%)
Super Pi mod 1.5 XS 2M - Super Pi mod 1.5 XS 2M *
16.8 s (1%)
27.8 s (1%)
Super Pi Mod 1.5 XS 32M - Super Pi mod 1.5 XS 32M *
432.5 s (2%)
697 s (3%)
3DMark Vantage - 3DM Vant. Perf. CPU no Physx
18229 Points (14%)
3DMark 11 - 3DM11 Performance Physics
18348 Points (45%)
min: 5213     avg: 6267     median: 6402.5 (16%)     max: 6967 Points
3DMark - 3DMark Ice Storm Physics
min: 29562     avg: 32942     median: 30254 (25%)     max: 48997 Points
3DMark - 3DMark Ice Storm Extreme Physics
min: 30656     avg: 34184     median: 31241.5 (25%)     max: 49067 Points
3DMark - 3DMark Ice Storm Unlimited Physics
min: 26201     avg: 36686     median: 32088 (26%)     max: 54995 Points
3DMark - 3DMark Cloud Gate Physics
min: 5217     avg: 6435     median: 6613 (17%)     max: 7132 Points
3DMark - 3DMark Fire Strike Standard Physics
25520 Points (46%)
min: 7496     avg: 9199     median: 9380 (17%)     max: 10054 Points
3DMark - 3DMark Time Spy CPU
11771 Points (50%)
min: 2450     avg: 2660     median: 2696 (11%)     max: 2880 Points
Geekbench 6.5 - Geekbench 6.5 Single-Core
1695 Points (41%)
1101 Points (27%)
Geekbench 6.5 - Geekbench 6.5 Multi-Core
8796 Points (34%)
3324 Points (13%)
Geekbench 5.5 - Geekbench 5.1 - 5.5 64 Bit Single-Core
1381 Points (52%)
min: 777     avg: 886     median: 902 (34%)     max: 909 Points
Geekbench 5.5 - Geekbench 5.1 - 5.5 64 Bit Multi-Core
10244 Points (18%)
min: 2543     avg: 3097     median: 3157 (6%)     max: 3269 Points
Geekbench 5.0 - Geekbench 5.0 64 Bit Single-Core
min: 772     avg: 880     median: 896 (4%)     max: 913 Points
Geekbench 5.0 - Geekbench 5.0 64 Bit Multi-Core
min: 2599     avg: 3035     median: 3118.5 (10%)     max: 3244 Points
Geekbench 4.4 - Geekbench 4.1 - 4.4 64 Bit Single-Core
min: 3400     avg: 3785     median: 3893 (39%)     max: 3924 Points
Geekbench 4.4 - Geekbench 4.1 - 4.4 64 Bit Multi-Core
min: 10099     avg: 11388     median: 11783 (12%)     max: 12171 Points
Geekbench 4.0 - Geekbench 4.0 64 Bit Single-Core
3669 Points (41%)
Geekbench 4.0 - Geekbench 4.0 64 Bit Multi-Core
10597 Points (14%)
Geekbench 3 - Geekbench 3 32 Bit Multi-Core
min: 9503     avg: 12182     median: 13040 (23%)     max: 13145 Points
Geekbench 3 - Geekbench 3 32 Bit Single-Core
min: 3258     avg: 3405     median: 3442.5 (45%)     max: 3478 Points
Geekbench 3 - Geekbench 3 64 Bit Multi-Core
13873 Points (22%)
Geekbench 3 - Geekbench 3 64 Bit Single-Core
3682 Points (55%)
Geekbench 2 - 32 Bit - Geekbench Stream
6193 Points (33%)
Geekbench 2 - 32 Bit - Geekbench Memory
6118 Points (42%)
Geekbench 2 - 32 Bit - Geekbench Floating Point
16467 Points (32%)
Geekbench 2 - 32 Bit - Geekbench Integer
12317 Points (25%)
Geekbench 2 - 32 Bit - Geekbench Total Score
11917 Points (31%)
Mozilla Kraken 1.1 - Kraken 1.1 Total Score *
737 ms (1%)
min: 1101     avg: 1272     median: 1274.5 (1%)     max: 1693 ms
Sunspider - Sunspider 1.0 Total Score *
128.8 ms (1%)
Octane V2 - Octane V2 Total Score
55976 Points (41%)
min: 19083     avg: 26794     median: 27809 (20%)     max: 32938 Points
WebXPRT 3 - WebXPRT 3 Score
236 Points (42%)
min: 145     avg: 154     median: 148 (27%)     max: 172 Points
Power Consumption - Prime95 Power Consumption - external Monitor *
min: 24     avg: 33.7     median: 34.7 (6%)     max: 42.5 Watt
Power Consumption - Cinebench R15 Multi Power Consumption - external Monitor *
min: 34.5     avg: 37     median: 38 (7%)     max: 38.5 Watt
Power Consumption - Power Efficiency - Cinebench R15 Multi external Monitor
min: 17.2     avg: 18.1     median: 18.1 (13%)     max: 18.9 Points per Watt

Average Benchmarks Intel Core i9-10910 → 100% n=27

Average Benchmarks AMD Ryzen 5 3500U → 47% n=27

- Range of benchmark values for this graphics card
red legend - Average benchmark values for this graphics card
* Smaller numbers mean a higher performance
1 This benchmark is not used for the average calculation

Add one or more devices and compare

In the following list you can select (and also search for) devices that should be added to the comparison. You can select more than one device.

restrict list:
v1.34
log 07. 16:31:58

#0 ran 0s before starting gpusingle class +0s ... 0s

#1 checking url part for id 12832 +0s ... 0s

#2 checking url part for id 11161 +0s ... 0s

#3 redirected to Ajax server, took 1759847518s time from redirect:0 +0s ... 0s

#4 did not recreate cache, as it is less than 5 days old! Created at Tue, 07 Oct 2025 05:18:31 +0200 +0s ... 0s

#5 composed specs +0.004s ... 0.004s

#6 did output specs +0s ... 0.004s

#7 getting avg benchmarks for device 12832 +0.003s ... 0.008s

#8 got single benchmarks 12832 +0s ... 0.008s

#9 getting avg benchmarks for device 11161 +0.004s ... 0.012s

#10 got single benchmarks 11161 +0.025s ... 0.037s

#11 got avg benchmarks for devices +0s ... 0.037s

#12 min, max, avg, median took s +0.039s ... 0.076s

#13 return log +0.007s ... 0.083s

Please share our article, every link counts!
Mail Logo
> Expert Reviews and News on Laptops, Smartphones and Tech Innovations > Benchmarks / Tech > Processor Comparison - Head 2 Head
Redaktion, 2017-09- 8 (Update: 2023-07- 1)