Notebookcheck Logo

Intel Core i7-11700K vs Intel Core i7-8086K vs Intel Core i5-11400T

Intel Core i7-11700K

► remove from comparison Intel i7-11700K

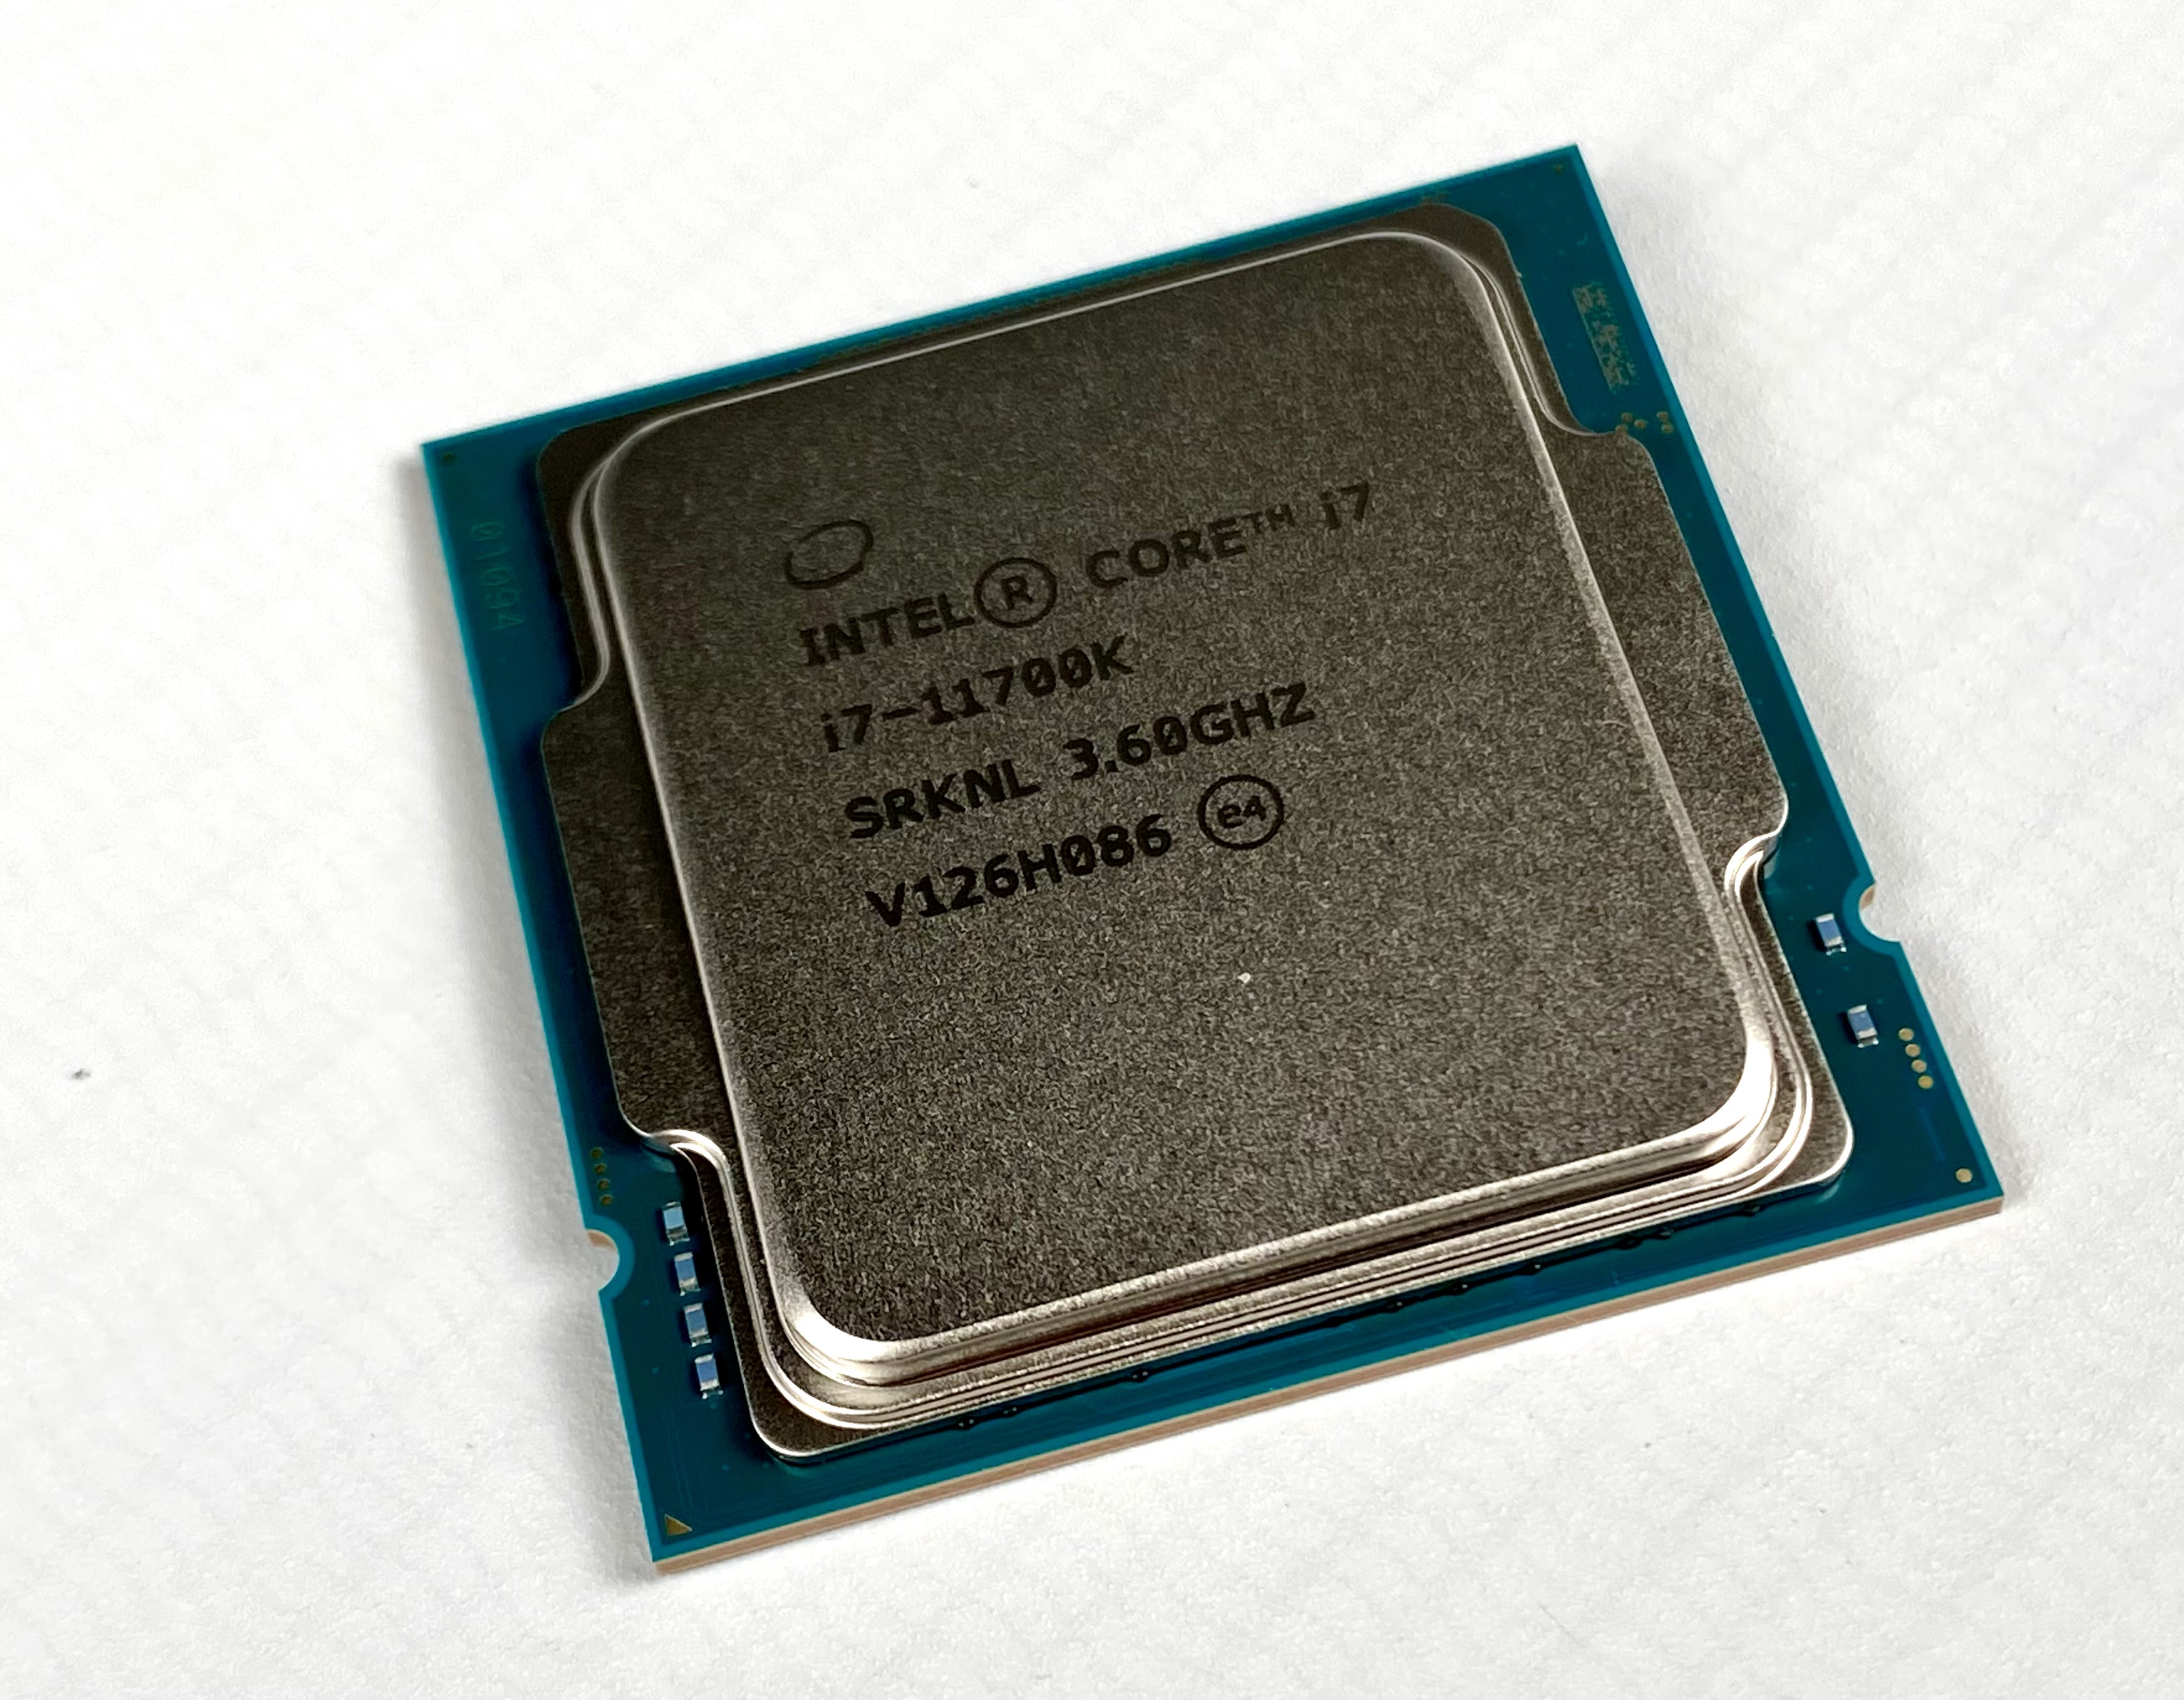
The Intel Core i7-11700K is a high-end desktop CPU based on the Rocket Lake architecture. The CPU offers 8 cores and 16 threads clocked at 3.6 - 4.9 GHz. The TDP is rated at 125 Watt (PL1, power limit sustained load) but the PL2 is set to around 250 Watt for short term boosts (up to 56 seconds). 

The Sunny Cove processor cores (known from the Ice Lake mobile CPUs) offer larger caches and an improved IPC (up to 19%). Furthermore, the chip also includes (partly) integrated WiFi 6E and Thunderbolt 4. The platform supports PCIe 4.0 and Intel DL Boost for AI acceleration.

The faster Rocket Lake-S CPUs also integrate a new Intel UHD Graphics 750 that is based on the current Intel Xe architecture (e.g. mobile Tiger Lake).

The CPU is manufactured on an old 14 nm process like the Comet Lake predecessors.

Intel Core i7-8086K

► remove from comparison Intel i7-8086K

The Intel Core i7-8086K is a high-end desktop processor with six cores based on the Coffee Lake architecture and was announced in mid 2018. It is a limited edition for the 40 year X86 anniversary and at the time of announcement the fastest Coffee-Lake CPU. The processor clocks at between 3.7 and 5 GHz and can execute up to twelve threads simultaneously thanks to Hyper-Threading. According to Intel, the CPU is manufactured in an improved 14nm (14nm++) process. The i7-8086K is comparatively easy to overclock thanks to the unlocked multiplier. Compared to the cheaper i7-8700K (-66 Dollars) only the single core Turbo clock speed is faster (5 GHz versus 4.7 GHz).

Performance

Due to the two additional cores, performance has increased by almost 50% compared to the Core i7-7700K when all cores are in use. Compared to the cheaper Core i7-8700K, the 8086K offers only a higher single core Turbo Boost and therefore in daily usage and gaming not faster. As a high-end model, the i7-8086K is suitable for the most demanding applications and games.

Graphics

The integrated Intel UHD Graphics 630 iGPU is supposed to offer higher performance as its clock rate has been increased by 50 MHz. The build is identical to that of the Intel HD Graphics 630. We do expect a performance improvement, but as a low-end solution it will probably only display current games smoothly at reduced details - if at all.

Power Consumption

Intel specifies the TDP with 95 watts. Therefore, well-dimensioned cooling systems should easily manage to deal with the created heat. We expect increased efficiency due to the higher performance.

Intel Core i5-11400T

► remove from comparison Intel i5-11400T

The Intel Core i5-11400T is a power-efficient six-core desktop processor based on the new Rocket Lake architecture, which was introduced in March 2021. The processor clocks with a base clock of only 1.3 GHz and reaches an all-core boost of 3.7 GHz under load. Intel also gives the Rocket Lake processors the Hyperthreading feature, which allows the i5-11400T to process up to 12 threads simultaneously. As known, the Intel Core i5-11400F is manufactured in the 14 nm process. Nevertheless, many changes have been made with the Rocket Lake architecture, which is also reflected in the performance compared to the Comet Lake. 

Performance

Compared to the Intel Core i5-10400T, the Core i5-11400T offers a significantly better IPC. This can be seen clearly in the single-core benchmarks. The multi-core performance also benefits from the better IPC compared to Comet-Lake. A performance increase of up to 20 percent can be expected.

Graphics

The processors integrates a Intel UHD Graphics 730 iGPU that features 24 EUs clocked at 350 - 1200 MHz.

Power consumption

The TDP turns out relatively low with 35 watts. This is the PL1 value. For Turbo, the Intel Core i5-11400T offers a higher TDP of up to 84 watts with PL2. However, this may only be applied for a maximum of 28 seconds (dew). 

ModelIntel Core i7-11700KIntel Core i7-8086KIntel Core i5-11400T
CodenameRocket LakeCoffee Lake-SRocket Lake
SeriesIntel Rocket LakeIntel Coffee LakeIntel Rocket Lake
Series: Rocket Lake Rocket Lake
Intel Core i9-11900K3.5 - 5.3 GHz8 / 16 cores16 MB L3
Intel Core i7-11700K « 3.6 - 5 GHz8 / 16 cores16 MB L3
Intel Core i7-117002.5 - 4.9 GHz8 / 16 cores16 MB L3
Intel Core i5-11600K3.9 - 4.9 GHz6 / 12 cores12 MB L3
Intel Core i5-11400F2.6 - 4.4 GHz6 / 12 cores12 MB L3
Intel Core i5-11400T1.3 - 3.7 GHz6 / 12 cores12 MB L3
Intel Core i7-8086K « 3.7 - 5 GHz6 / 12 cores12 MB L3
Intel Core i7-8700K3.7 - 4.7 GHz6 / 12 cores12 MB L3
Intel Core i7-87003.2 - 4.6 GHz6 / 12 cores12 MB L3
Intel Core i5-8600K3.6 - 4.3 GHz6 / 6 cores9 MB L3
Intel Core i5-85003 - 4.1 GHz6 / 6 cores9 MB L3
Intel Core i5-84002.8 - 4 GHz6 / 6 cores9 MB L3
Intel Core i5-8500T2.1 - 3.5 GHz6 / 6 cores9 MB L3
Intel Core i9-11900K3.5 - 5.3 GHz8 / 16 cores16 MB L3
Intel Core i7-11700K3.6 - 5 GHz8 / 16 cores16 MB L3
Intel Core i7-117002.5 - 4.9 GHz8 / 16 cores16 MB L3
Intel Core i5-11600K3.9 - 4.9 GHz6 / 12 cores12 MB L3
Intel Core i5-11400F2.6 - 4.4 GHz6 / 12 cores12 MB L3
Intel Core i5-11400T « 1.3 - 3.7 GHz6 / 12 cores12 MB L3
Clock3600 - 5000 MHz3700 - 5000 MHz1300 - 3700 MHz
L1 Cache640 KB384 KB480 KB
L2 Cache4 MB1.5 MB3 MB
L3 Cache16 MB12 MB12 MB
Cores / Threads8 / 166 / 126 / 12
TDP125 Watt95 Watt35 Watt
Technology14 nm14 nm14 nm
max. Temp.100 °C100 °C100 °C
SocketLGA1200FCLGA1151LGA1200
FeaturesDDR4-3200 RAM, PCIe 4, 8 GT/s bus, DL Boost, GNA, vPro, MMX, SSE, SSE2, SSE3, SSSE3, SSE4.1, SSE4.2, AVX, AVX2, AVX-512, BMI2, ABM, FMA, ADX, VMX, SMX, SMEP, SMAP, MPX, EIST, TM1, TM2, HT, Turbo, SST, AES-NI, RDRAND, RDSEED, SHADual-Channel DDR3(L)-1600/DDR4-2666 Memory Controller, HyperThreading, AVX, AVX2, AES-NI, TSX-NI, Quick Sync, Virtualization, vProDDR4-3200 RAM, PCIe 4, 8 GT/s bus, DL Boost, GNA, MMX, SSE, SSE2, SSE3, SSSE3, SSE4.1, SSE4.2, AES, AVX, AVX2, AVX512F, FMA3, SHA
iGPUIntel UHD Graphics Xe 750 32EUs (Rocket Lake) (350 - 1300 MHz)Intel UHD Graphics 630 (350 - 1200 MHz)Intel UHD Graphics 730 (Rocket Lake) (350 - 1200 MHz)
Architecturex86x86x86
Announced
Manufacturerark.intel.comark.intel.comark.intel.com
$425 U.S.$182 U.S.
Die Size276 mm2

Benchmarks

Performance Rating - CB R15 + R20 + 7-Zip + X265 + Blender + 3DM11 CPU - i7-11700K
36.8 pt (61%)
Restrict / Search: Model: Max. age: years
Performance Rating - CB R15 + R20 + 7-Zip + X265 + Blender + 3DM11 CPU - i7-8086K
32.3 pt (54%)
Restrict / Search: Model: Max. age: years
Performance Rating - CB R15 + R20 + 7-Zip + X265 + Blender + 3DM11 CPU - i5-11400T
26.3 pt (44%)
Restrict / Search: Model: Max. age: years
Cinebench R23 - Cinebench R23 Multi Core
14281 Points (13%)
8686 Points (8%)
3891 Points (4%)
Cinebench R23 - Cinebench R23 Single Core
1558 Points (66%)
1260 Points (53%)
972 Points (41%)
Cinebench R20 - Cinebench R20 CPU (Single Core)
min: 580     avg: 588     median: 588 (64%)     max: 596 Points
min: 488     avg: 495     median: 495 (54%)     max: 502 Points
378 Points (41%)
Cinebench R20 - Cinebench R20 CPU (Multi Core)
min: 5082     avg: 5361     median: 5361 (13%)     max: 5640 Points
min: 2998     avg: 3111     median: 3111 (8%)     max: 3224 Points
1500 Points (4%)
Cinebench R15 - Cinebench R15 CPU Multi 64 Bit
min: 2265     avg: 2299     median: 2299 (15%)     max: 2333 Points
min: 1340     avg: 1366     median: 1349 (9%)     max: 1408 Points
642 Points (4%)
Cinebench R15 - Cinebench R15 CPU Single 64 Bit
240 Points (66%)
min: 202     avg: 205     median: 206 (57%)     max: 207 Points
153 Points (42%)
Cinebench R11.5 - Cinebench R11.5 CPU Multi 64 Bit
25.6 Points (33%)
min: 14.67     avg: 15     median: 15 (19%)     max: 15.41 Points
7.3 Points (9%)
Cinebench R11.5 - Cinebench R11.5 CPU Single 64 Bit
2.9 Points (68%)
min: 2.2     avg: 2.3     median: 2.3 (54%)     max: 2.35 Points
1.8 Points (43%)
Cinebench R10 - Cinebench R10 Rend. Single (32bit)
9621 Points (58%)
min: 6541     avg: 7216     median: 7216 (44%)     max: 7891 Points
6122 Points (37%)
Cinebench R10 - Cinebench R10 Rend. Multi (32bit)
58342 Points (42%)
min: 33064     avg: 35896     median: 35896 (26%)     max: 38728 Points
20362 Points (15%)
Cinebench R10 - Cinebench R10 Rend. Multi (64bit)
25835 Points (16%)
Cinebench R10 - Cinebench R10 Rend. Single (64bit)
8290 Points (10%)
wPrime 2.10 - wPrime 2.0 32m *
4.8 s (1%)
min: 4.041     avg: 4.1     median: 4.1 (1%)     max: 4.21 s
7.8 s (2%)
wPrime 2.10 - wPrime 2.0 1024m *
min: 119.7     avg: 119.8     median: 119.8 (1%)     max: 119.9 s
261.3 s (3%)
WinRAR - WinRAR 4.0
min: 6637     avg: 6752     median: 6751.5 (11%)     max: 6866 Points
4409 Points (7%)
7-Zip 18.03 - 7-Zip 18.03 Multi Thread 4 runs
57129 MIPS (33%)
min: 35473     avg: 36060     median: 36059.5 (21%)     max: 36646 MIPS
19699 MIPS (11%)
7-Zip 18.03 - 7-Zip 18.03 Single Thread 4 runs
6157 MIPS (73%)
min: 5325     avg: 5417     median: 5416.5 (64%)     max: 5508 MIPS
4157 MIPS (49%)
X264 HD Benchmark 4.0 - x264 Pass 2
128 fps (43%)
min: 85.1     avg: 85.5     median: 85.5 (29%)     max: 85.8 fps
40 fps (13%)
X264 HD Benchmark 4.0 - x264 Pass 1
292.5 fps (67%)
min: 227.5     avg: 230.6     median: 230.6 (53%)     max: 233.6 fps
154.5 fps (36%)
HWBOT x265 Benchmark v2.2 - HWBOT x265 4k Preset
16.3 fps (29%)
min: 11.2     avg: 11.3     median: 11.3 (20%)     max: 11.4 fps
5.2 fps (9%)
TrueCrypt - TrueCrypt Serpent
1.2 GB/s (35%)
min: 0.792     avg: 0.8     median: 0.8 (23%)     max: 0.795 GB/s
0.4 GB/s (12%)
TrueCrypt - TrueCrypt Twofish
1.9 GB/s (33%)
1.4 GB/s (24%)
0.6 GB/s (11%)
TrueCrypt - TrueCrypt AES
12.7 GB/s (33%)
min: 7.8     avg: 7.9     median: 7.9 (20%)     max: 7.9 GB/s
4.2 GB/s (11%)
Blender - Blender 2.79 BMW27 CPU *
221 Seconds (2%)
min: 315     avg: 383.7     median: 316 (2%)     max: 520 Seconds
704 Seconds (5%)
R Benchmark 2.5 - R Benchmark 2.5 *
0.5 sec (11%)
min: 0.567     avg: 0.6     median: 0.6 (13%)     max: 0.5974 sec
0.8 sec (17%)
3DMark 06 - CPU - 3DMark 06 - CPU
16388 Points (35%)
min: 10397     avg: 11218     median: 11218 (24%)     max: 12039 Points
7263 Points (15%)
Super Pi mod 1.5 XS 1M - Super Pi mod 1.5 XS 1M *
20.2 s (4%)
min: 7.74     avg: 8.5     median: 8.5 (2%)     max: 9.261 s
10.1 s (2%)
Super Pi mod 1.5 XS 2M - Super Pi mod 1.5 XS 2M *
min: 17.06     avg: 18.8     median: 18.8 (1%)     max: 20.59 s
22.2 s (1%)
Super Pi Mod 1.5 XS 32M - Super Pi mod 1.5 XS 32M *
685 s (3%)
min: 429.9     avg: 467     median: 467 (2%)     max: 504 s
543 s (2%)
3DMark Vantage - 3DM Vant. Perf. CPU no Physx
25621 Points (20%)
3DMark 11 - 3DM11 Performance Physics
17324 Points (43%)
min: 11434     avg: 12861     median: 11554 (28%)     max: 15596 Points
7319 Points (18%)
3DMark - 3DMark Ice Storm Physics
70388 Points (57%)
50228 Points (41%)
3DMark - 3DMark Ice Storm Extreme Physics
50210 Points (41%)
3DMark - 3DMark Ice Storm Unlimited Physics
53123 Points (44%)
3DMark - 3DMark Cloud Gate Physics
18593 Points (47%)
6654 Points (17%)
3DMark - 3DMark Fire Strike Standard Physics
25557 Points (46%)
10064 Points (18%)
3DMark - 3DMark Time Spy CPU
6745 Points (28%)
Geekbench 5.5 - Geekbench 5.1 - 5.5 64 Bit Single-Core
min: 1721     avg: 1766     median: 1765.5 (69%)     max: 1810 Points
1240 Points (48%)
1146 Points (45%)
Geekbench 5.5 - Geekbench 5.1 - 5.5 64 Bit Multi-Core
min: 10269     avg: 10787     median: 10786.5 (19%)     max: 11304 Points
5485 Points (10%)
3510 Points (6%)
Geekbench 5.0 - Geekbench 5.0 64 Bit Single-Core
min: 1234     avg: 1276     median: 1276 (6%)     max: 1318 Points
1130 Points (5%)
Geekbench 5.0 - Geekbench 5.0 64 Bit Multi-Core
min: 5618     avg: 5644     median: 5644 (18%)     max: 5670 Points
3495 Points (11%)
Geekbench 4.4 - Geekbench 4.1 - 4.4 64 Bit Single-Core
min: 5768     avg: 5821     median: 5792 (58%)     max: 5904 Points
4855 Points (48%)
Geekbench 4.4 - Geekbench 4.1 - 4.4 64 Bit Multi-Core
min: 22817     avg: 24618     median: 24527 (24%)     max: 26509 Points
17082 Points (17%)
Mozilla Kraken 1.1 - Kraken 1.1 Total Score *
603 ms (1%)
min: 861     avg: 862     median: 862 (1%)     max: 863 ms
887 ms (1%)
Sunspider - Sunspider 1.0 Total Score *
124.2 ms (1%)
Octane V2 - Octane V2 Total Score
71212 Points (54%)
WebXPRT 3 - WebXPRT 3 Score
254 Points (46%)
min: 216     avg: 217     median: 217 (39%)     max: 218 Points
208 Points (37%)
CrossMark - CrossMark Overall
1775 Points (66%)
1125 Points (42%)
Power Consumption - Prime95 Power Consumption - external Monitor *
210 Watt (36%)
59.3 Watt (10%)
Power Consumption - Cinebench R15 Multi Power Consumption - external Monitor *
244 Watt (45%)
57.8 Watt (11%)
Power Consumption - Idle Power Consumption - external Monitor *
40.9 Watt (27%)
Power Consumption - Power Efficiency - Cinebench R15 Multi external Monitor
9.6 Points per Watt (7%)
11.1 Points per Watt (8%)

Average Benchmarks Intel Core i7-11700K → 100% n=29

Average Benchmarks Intel Core i7-8086K → 81% n=29

Average Benchmarks Intel Core i5-11400T → 55% n=29

- Range of benchmark values for this graphics card
red legend - Average benchmark values for this graphics card
* Smaller numbers mean a higher performance
1 This benchmark is not used for the average calculation

v1.33
log 07. 06:19:47

#0 ran 0s before starting gpusingle class +0s ... 0s

#1 checking url part for id 12999 +0s ... 0s

#2 checking url part for id 10106 +0s ... 0s

#3 checking url part for id 14535 +0s ... 0s

#4 redirected to Ajax server, took 1751861987s time from redirect:0 +0s ... 0s

#5 did not recreate cache, as it is less than 5 days old! Created at Mon, 07 Jul 2025 05:21:36 +0200 +0s ... 0s

#6 composed specs +0.006s ... 0.006s

#7 did output specs +0s ... 0.006s

#8 getting avg benchmarks for device 12999 +0.004s ... 0.01s

#9 got single benchmarks 12999 +0.005s ... 0.015s

#10 getting avg benchmarks for device 10106 +0.004s ... 0.019s

#11 got single benchmarks 10106 +0.008s ... 0.027s

#12 getting avg benchmarks for device 14535 +0.004s ... 0.031s

#13 got single benchmarks 14535 +0.004s ... 0.035s

#14 got avg benchmarks for devices +0s ... 0.035s

#15 min, max, avg, median took s +0.062s ... 0.098s

#16 return log +0s ... 0.098s

Please share our article, every link counts!
Mail Logo
> Expert Reviews and News on Laptops, Smartphones and Tech Innovations > Benchmarks / Tech > Processor Comparison - Head 2 Head
Redaktion, 2017-09- 8 (Update: 2023-07- 1)