

Intel Core i5-11600K vs AMD Ryzen 9 7950X3D vs AMD Ryzen 7 7700
Intel Core i5-11600K
► remove from comparison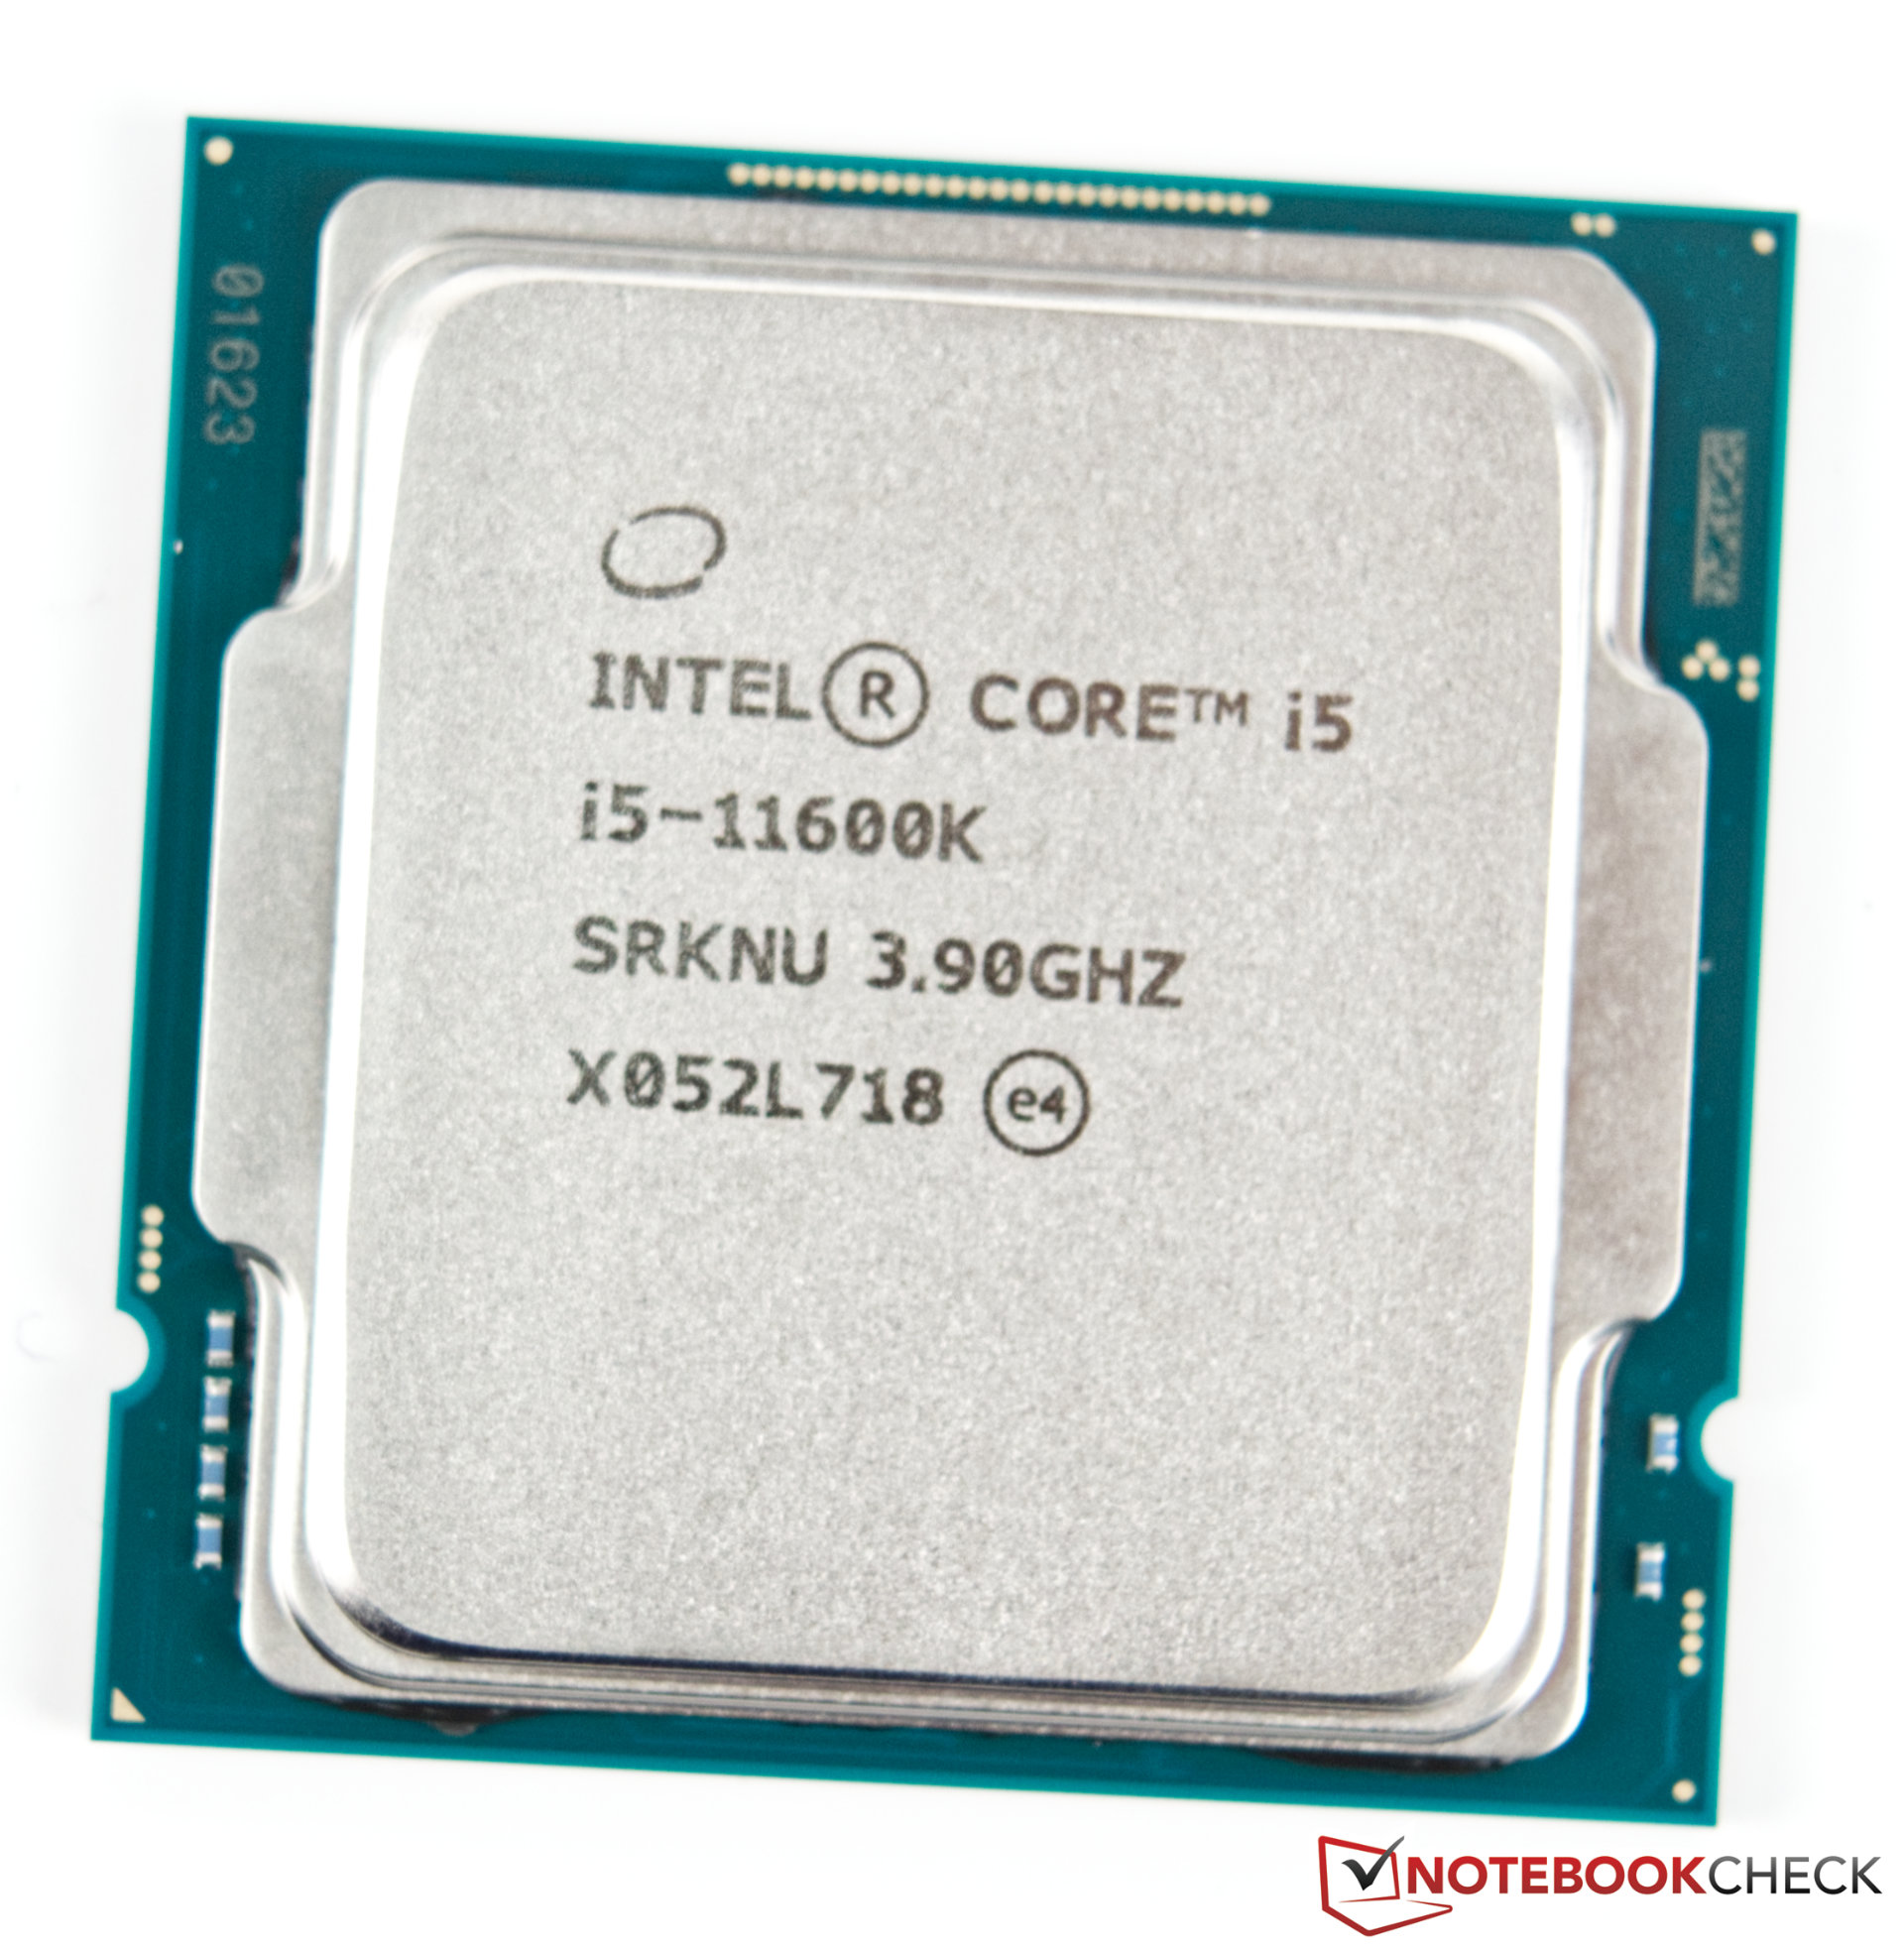
The Intel Core i5-11600K is a high-end desktop CPU based on the Rocket Lake architecture. The CPU offers 6 cores and 12 threads clocked at 3.9 - 4.9 GHz (Turbo Boost 2.0 only). Using all cores, the CPU can clock up to 4.6 GHz.
The TDP is rated at 125 Watt (PL1, power limit sustained load) but the PL2 is set to around 250 Watt for short term boosts (up to 56 seconds).
The Sunny Cove processor cores (known from the Ice Lake mobile CPUs) offer larger caches and an improved IPC (up to 19%). Furthermore, the chip also includes (partly) integrated WiFi 6E and Thunderbolt 4. The platform supports PCIe 4.0 and Intel DL Boost for AI acceleration.
Thanks to the faster core architecture, the 11600K can beat the old i5-10600K by around 20 percent. Therefore, the i5-11600K is a good mid range choice for gaming.
The faster Rocket Lake-S CPUs also integrate a new Intel UHD Graphics 750 that is based on the current Intel Xe architecture (e.g. mobile Tiger Lake) and offers 32 EUs. In the 11600K, the GPU is clocked from 350 - 1300 MHz.
The CPU is manufactured on the old 14nm process like the Comet Lake predecessors. The power consumption is not as high, as the Core i9-11900K, but can't come close to the power efficient Ryzen 5 5600X.
AMD Ryzen 9 7950X3D
► remove from comparison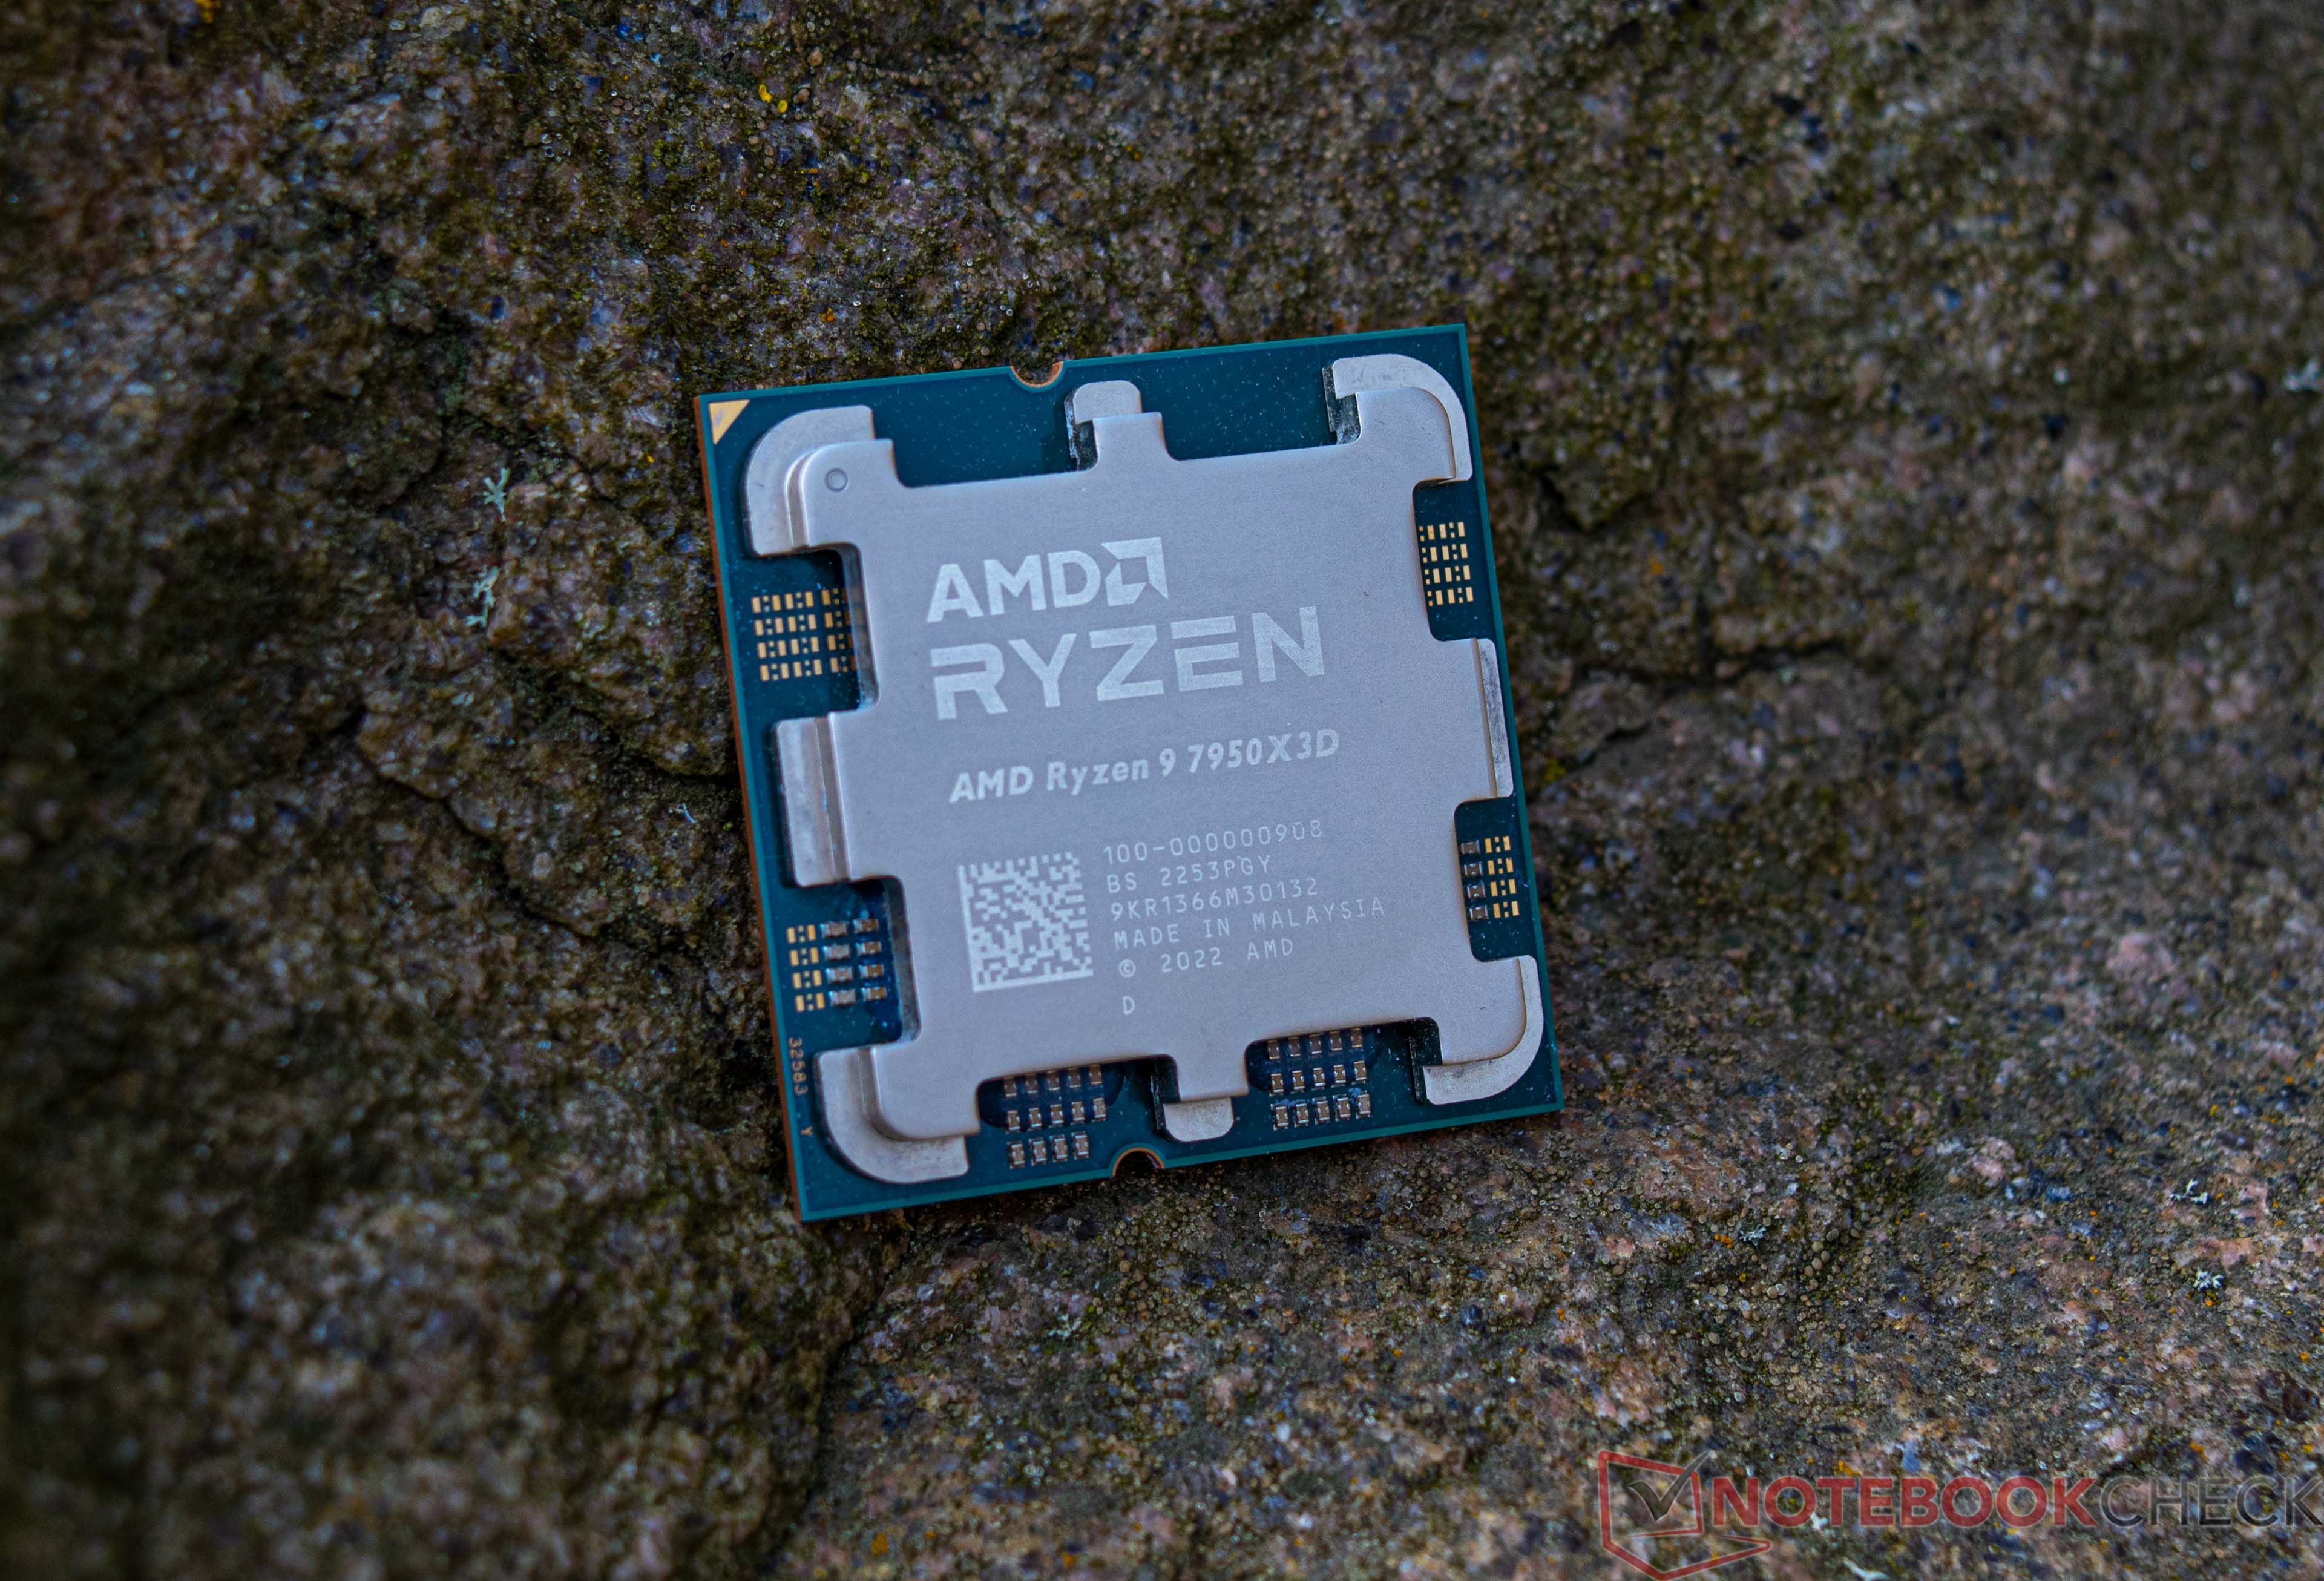
The AMD Ryzen 9 7950X3D is a high-end desktop processor of the Raphael series with 16 cores and SMT (Simultaneous Multithreading), which means it can process up to 32 threads simultaneously. With the release in February 2023, the Ryzen 9 7950X3D is AMD's fastest consumer processor and the new top model of the 7000 series. The CPU cores clock from 4.2 GHz (base clock) up to 5.7 GHz (single core Turbo). In addition, the AMD Ryzen 9 7950X3D has a CCD with 8 cores that can access the fast 3D V-cache, which offers considerably more gaming performance.
The performance of the AMD Ryzen 9 7950X3D is consistently excellent in all applications tested. In addition, AMD was again able to increase the single-thread performance compared to the non-X3D models. Nevertheless, the lower base clock compared to the AMD Ryzen 9 7950X means that a small drop in multi-thread performance has to be accepted.
The internal structure of the processor is comparable to the previous AMD Ryzen 9 7950X. The AMD Ryzen 9 7950X3D is also still based on the chiplet design consisting of two CCD clusters with 8 cores each. However, the two CCDs differ significantly from each other because one offers the fast 3D V-Cache, which primarily improves gaming performance. In testing, the AMD Ryzen 9 7950X3D was able to put the Intel Core i9-13900K in second place and is the fastest gaming CPU on the market at the time of testing.
The AMD Ryzen 9 7950X3D is an extremely energy-efficient CPU with up to 162 watts (PPT) and is significantly more frugal under load than an AMD Ryzen 9 7950X (max. 230 watts).
AMD Ryzen 7 7700
► remove from comparison
The AMD Ryzen 7 7700 is a fast high-end desktop processor of the Raphael series. It offers 8 cores based on the Zen 4 architecture that supports hyperthreading (16 threads). The cores clock from 3.8 (base) up to 5.3 GHz (single core boost). Compared to the faster Ryzen 9 CPUs (like the 7900X), the R7 offers less cores and slightly lower clock speeds.
The performance of the R7 7700 is slightly below the higher clocked AMD R7 7700X (that also features a higher TDP).
The Raphael series still uses a chiplet design with two CCD-clusters (each with 8 possible cores, so only one used for the 7700X) in 5nm and an IO-die (including the memory controller and the Radeon Graphics iGPU) in 6nm.
The Ryzen 7 7700 is rated at a TDP of only 65 Watt and therefore suited for smaller desktops (and cooling solutions).
| Model | Intel Core i5-11600K | AMD Ryzen 9 7950X3D | AMD Ryzen 7 7700 | ||||||||||||||||||||||||||||||||||||||||||||||||||||||||||||||||||||||||||||||||||||||||
| Codename | Rocket Lake | Raphael (Zen4) | Raphael (Zen4) | ||||||||||||||||||||||||||||||||||||||||||||||||||||||||||||||||||||||||||||||||||||||||
| Series | Intel Rocket Lake | AMD Raphael (Zen 4, Ryzen 7000) | AMD Raphael (Zen 4, Ryzen 7000) | ||||||||||||||||||||||||||||||||||||||||||||||||||||||||||||||||||||||||||||||||||||||||
| Series: Raphael (Zen 4, Ryzen 7000) Raphael (Zen4) |
|
|
| ||||||||||||||||||||||||||||||||||||||||||||||||||||||||||||||||||||||||||||||||||||||||
| Clock | 3900 - 4900 MHz | 4200 - 5700 MHz | 3800 - 5300 MHz | ||||||||||||||||||||||||||||||||||||||||||||||||||||||||||||||||||||||||||||||||||||||||
| L1 Cache | 480 KB | 1 MB | 512 KB | ||||||||||||||||||||||||||||||||||||||||||||||||||||||||||||||||||||||||||||||||||||||||
| L2 Cache | 3 MB | 16 MB | 8 MB | ||||||||||||||||||||||||||||||||||||||||||||||||||||||||||||||||||||||||||||||||||||||||
| L3 Cache | 12 MB | 128 MB | 32 MB | ||||||||||||||||||||||||||||||||||||||||||||||||||||||||||||||||||||||||||||||||||||||||
| Cores / Threads | 6 / 12 | 16 / 32 16 x 5.7 GHz AMD Zen 4 | 8 / 16 | ||||||||||||||||||||||||||||||||||||||||||||||||||||||||||||||||||||||||||||||||||||||||
| TDP | 125 Watt | 120 Watt | 65 Watt | ||||||||||||||||||||||||||||||||||||||||||||||||||||||||||||||||||||||||||||||||||||||||
| Technology | 14 nm | 5 nm | 5 nm | ||||||||||||||||||||||||||||||||||||||||||||||||||||||||||||||||||||||||||||||||||||||||
| max. Temp. | 100 °C | 89 °C | 95 °C | ||||||||||||||||||||||||||||||||||||||||||||||||||||||||||||||||||||||||||||||||||||||||
| Socket | LGA1200 | AM5 (LGA 1718) | AM5 (LGA 1718) | ||||||||||||||||||||||||||||||||||||||||||||||||||||||||||||||||||||||||||||||||||||||||
| Features | DDR4-3200 RAM, PCIe 4, 8 GT/s bus, DL Boost, GNA, vPro, MMX, SSE, SSE2, SSE3, SSSE3, SSE4.1, SSE4.2, AVX, AVX2, AVX-512, BMI2, ABM, FMA, ADX, VMX, SMEP, SMAP, MPX, EIST, TM1, TM2, HT, Turbo, SST, AES-NI, RDRAND, RDSEED, SHA | MMX(+), SSE, SSE2, SSE3, SSSE3, SSE4.1, SSE4.2, SSE4A, x86-64, AMD-V, AES, AVX, AVX2, AVX512F, FMA3, SHA, XFR2, Precision Boost 2 | MMX(+), SSE, SSE2, SSE3, SSSE3, SSE4.1, SSE4.2, SSE4A, x86-64, AMD-V, AES, AVX, AVX2, AVX512F, FMA3, SHA, Precision Boost 2 | ||||||||||||||||||||||||||||||||||||||||||||||||||||||||||||||||||||||||||||||||||||||||
| iGPU | Intel UHD Graphics Xe 750 32EUs (Rocket Lake) (350 - 1300 MHz) | AMD Radeon Graphics (Ryzen 7000) (400 - 2200 MHz) | AMD Radeon Graphics (Ryzen 7000) (400 - 2200 MHz) | ||||||||||||||||||||||||||||||||||||||||||||||||||||||||||||||||||||||||||||||||||||||||
| Architecture | x86 | x86 | x86 | ||||||||||||||||||||||||||||||||||||||||||||||||||||||||||||||||||||||||||||||||||||||||
| Announced | |||||||||||||||||||||||||||||||||||||||||||||||||||||||||||||||||||||||||||||||||||||||||||
| Manufacturer | ark.intel.com | www.amd.com | www.amd.com | ||||||||||||||||||||||||||||||||||||||||||||||||||||||||||||||||||||||||||||||||||||||||
| Transistors | 13140 Million | 9900 Million | |||||||||||||||||||||||||||||||||||||||||||||||||||||||||||||||||||||||||||||||||||||||||
| Die Size | 263 mm2 | 2x 70 (CCD) mm2 + 122 (I/O) mm2 | |||||||||||||||||||||||||||||||||||||||||||||||||||||||||||||||||||||||||||||||||||||||||
| $699 U.S. | |||||||||||||||||||||||||||||||||||||||||||||||||||||||||||||||||||||||||||||||||||||||||||
| Voltage | 0.650 - 1.475V V |

Benchmarks

Average Benchmarks Intel Core i5-11600K → 100% n=40
Average Benchmarks AMD Ryzen 9 7950X3D → 211% n=40
Average Benchmarks AMD Ryzen 7 7700 → 146% n=40
* Smaller numbers mean a higher performance
1 This benchmark is not used for the average calculation