Notebookcheck Logo

Intel Core i5-11500B vs Intel Core i5-1335U vs Intel Core i5-11400H

Intel Core i5-11500B

► remove from comparison Intel i5-11500B

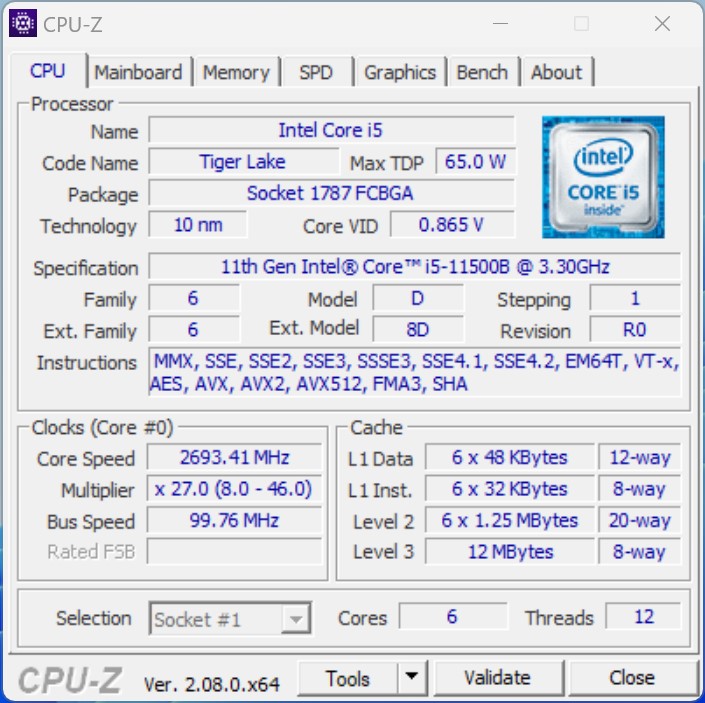
The Intel Core i5-11500B is a hexa-core processor for desktops and mini PCs. It is based on the Tiger Lake architecture (H45) and was presented in Q2 2021. The chip offers a TDP of 65 watts (configurable). The six processor cores can clock from 3.3 to 4.6 GHz (single-core turbo). The processor offers 12 MB level 3 cache and supports DDR4 RAM with up to 3,200 MT/s. The integrated graphics are based on the Xe architecture and are named UHD Graphics (32 EUs). In the 11500B it clocks from 350 to 1,450 MHz. The chip is manufactured using the 10 nm SuperFin process.

Performance

The performance of the Intel Core i5-11500B depends primarily on the performance of the installed cooling unit. The TDP of the SoC can also be lowered. In principle, however, the Intel Core i5-11500B should offer slightly more performance than an Intel Core i5-11400H (6 cores 2.7 - 4.5 GHz).

Features

As with the smaller Tiger Lake chips, Wi-Fi (Wi-Fi 6E) and Thunderbolt 4 / USB 4 are (partially) integrated into the chip for faster, cheaper and space-saving implementations in desktops and mini-PCs. The i5-11500B also offers 20 PCIe 4.0 lanes.

Intel Core i5-1335U

► remove from comparison Intel i5-1335U

The Intel Core i5-1335U is a mid-range mobile CPU for thin and light laptops based on the Alder Lake architecture (Raptor Lake-U / RPL-U series). It was announced in early 2023 and offers 2  performance cores (P-cores, Golden Cove architecture) and 8 efficient cores (E-cores, Gracemont architecture). The P-cores support Hyper-Threading leading to 12 supported threads when combined with the E-cores. The clock rate ranges from 1.3 to 4.6 GHz on the performance cluster and 0.9 to 3.4 GHz on the efficient cluster. The performance of the E-cores should be similar to old Skylake cores (compare to the Core i7-6700HQ). All cores can use up to 12 MB L3 cache. The CPU supports only "Essentials" vPro management features. Compared to the P-series (28W) or H-series (45W), the 15W TDP may limit the sustained performance.

Performance

Thanks to the similar clock speed, the Core i5-1335U is very similar to the older Core i7-1250U (+100 MHz P-Cores base clock rate). The faster i7 like the i7-1365U models offer only higher clock rates (and a faster iGPU).

Architecture

The integrated memory controller supports various memory types up to LPDDR5-6400. The Thread Director (in hardware) can support the operating system to decide which thread to use on the performance or efficient cores for the best performance. For AI tasks, the CPU also integrates GNA 3.0 and DL Boost (via AVX2). Quick Sync in version 8 is the same as in the Rocket Lake CPUs and supports MPEG-2, AVC, VC-1 decode, JPEG, VP8 decode, VP9, HEVC, and AV1 decode in hardware. The CPU still only supports PCIe 4.0 x8 for a GPU and two PCIe 4.0 x4 for SSDs.

The integrated graphics card is based on the Xe-architecture and offers 80 of the 96 EUs (Execution Units) operating at up to 1.25 GHz.

Power consumption

This Core i5 CPU is rated at a TDP of 15W (base power, PL1) and a maximum turbo power of 55W (PL2). The RPL-U processors are built in a further improved Intel 7 process (10nm SuperFin) that allows higher clock rates.

Intel Core i5-11400H

► remove from comparison Intel i5-11400H

The Intel Core i5-11400H is a high-end hexa-core SoC for gaming laptops and mobile workstations. It is based on the Tiger Lake H45 generation and was announced in mid 2021. It integrates six Willow Cove processor cores (12 threads thanks to HyperThreading). The base clock speed depends on the TDP setting and at 45 Watt is at 2.7 GHz. The single core boost speed can reach up to 4.5 GHz, all cores can reach up to 4.1 GHz. The CPU geatures 12 MB L3 cache and supports DDR4-3200 memory.

Furthermore, Tiger Lake SoCs add PCIe 4 support (20 lanes in the H45 series), AI hardware acceleration, and the partial integration of Thunderbolt 4/USB 4 and Wi-Fi 6E in the chip.

The SoC features an improved Gen 12 graphics adapter called UHD Graphics with 16 EUs.

All articles on Tiger Lake can be found on our Tiger Lake architecture hub.

Performance

The average 11400H in our database matches the Ryzen 5 5600U and the Core i7-10750H in multi-thread performance, rendering the Core i5 a decent mid-range option as of mid 2022. It isn't as fast as the mighty Ryzen 9 5900HS, yet it will let you run most games in High or even Ultra settings at 1080p if mated to a fast graphics card.

Thanks to its decent cooling solution and a long-term CPU power limit of 45 W, the Gigabyte G5 GD (2021) is among the fastest laptops built around the 11400H that we know of. It can be around 20% faster in CPU-bound workloads than the slowest system featuring the same chip in our database, as of August 2023.

Power consumption

This Core i5 series chip has a default TDP of 35 W to 45 W, the expectation being that laptop makers will go for a higher value in exchange for higher performance. Either way, an active cooling solution is a must for a CPU like this.

The i5-11400H is manufactured on Intel's 3rd generation 10 nm process marketed as SuperFin for below average, as of early 2023, energy efficiency.

ModelIntel Core i5-11500BIntel Core i5-1335UIntel Core i5-11400H
CodenameTiger Lake-HRaptor Lake-UTiger Lake-H
SeriesIntel Tiger LakeIntel Raptor Lake-UIntel Tiger Lake
Series: Tiger Lake Tiger Lake-H
Intel Core i9-11900KB3.3 - 5.3 GHz8 / 16 cores24 MB L3
Intel Core i9-11900H2.5 - 4.9 GHz8 / 16 cores24 MB L3
Intel Core i9-11950H2.6 - 5 GHz8 / 16 cores24 MB L3
Intel Xeon W-11955M2.6 - 5 GHz8 / 16 cores24 MB L3
Intel Core i7-11850H2.5 - 4.8 GHz8 / 16 cores24 MB L3
Intel Core i7-11800H2.3 - 4.6 GHz8 / 16 cores24 MB L3
Intel Xeon W-11855M3.2 - 4.9 GHz6 / 12 cores18 MB L3
Intel Core i5-11500B « 3.3 - 4.6 GHz6 / 12 cores12 MB L3
Intel Core i5-11400H2.7 - 4.5 GHz6 / 12 cores12 MB L3
Intel Core i5-11260H2.6 - 4.4 GHz6 / 12 cores12 MB L3
Intel Core i7-1365U1.3 - 5.2 GHz10 / 12 cores12 MB L3
Intel Core i7-1355U1.2 - 5 GHz10 / 12 cores12 MB L3
Intel Core i5-1345U1.2 - 4.7 GHz10 / 12 cores12 MB L3
Intel Core i5-1335U « 0.9 - 4.6 GHz10 / 12 cores12 MB L3
Intel Core i5-1334U0.9 - 4.6 GHz10 / 12 cores12 MB L3
Intel Core i3-1315U0.9 - 4.5 GHz6 / 8 cores10 MB L3
Intel Core i3-1305U1.2 - 4.5 GHz5 / 6 cores10 MB L3
Intel Processor U3000.9 - 4.4 GHz5 / 6 cores8 MB L3
Intel Core i9-11900KB3.3 - 5.3 GHz8 / 16 cores24 MB L3
Intel Core i9-11900H2.5 - 4.9 GHz8 / 16 cores24 MB L3
Intel Core i9-11950H2.6 - 5 GHz8 / 16 cores24 MB L3
Intel Xeon W-11955M2.6 - 5 GHz8 / 16 cores24 MB L3
Intel Core i7-11850H2.5 - 4.8 GHz8 / 16 cores24 MB L3
Intel Core i7-11800H2.3 - 4.6 GHz8 / 16 cores24 MB L3
Intel Xeon W-11855M3.2 - 4.9 GHz6 / 12 cores18 MB L3
Intel Core i5-11500B3.3 - 4.6 GHz6 / 12 cores12 MB L3
Intel Core i5-11400H « 2.7 - 4.5 GHz6 / 12 cores12 MB L3
Intel Core i5-11260H2.6 - 4.4 GHz6 / 12 cores12 MB L3
Clock3300 - 4600 MHz900 - 4600 MHz2700 - 4500 MHz
L1 Cache480 KB928 KB480 KB
L2 Cache7.5 MB9.5 MB7.5 MB
L3 Cache12 MB12 MB12 MB
Cores / Threads6 / 1210 / 126 / 12
TDP65 Watt15 Watt45 Watt
Technology10 nm10 nm10 nm
max. Temp.100 °C100 °C100 °C
SocketBGA1787BGA1700BGA1787
FeaturesDDR4-3200 RAM, PCIe 4, 8 GT/s bus, DL Boost, GNA, MMX, SSE, SSE2, SSE3, SSSE3, SSE4.1, SSE4.2, AVX, AVX2, AVX-512, BMI2, ABM, FMA, ADX, VMX, SMEP, SMAP, EIST, TM1, TM2, HT, Turbo, SST, AES-NI, RDRAND, RDSEED, SHAThread DirectorDDR4-3200 RAM, PCIe 4, 8 GT/s bus, DL Boost, GNA, MMX, SSE, SSE2, SSE3, SSSE3, SSE4.1, SSE4.2, AVX, AVX2, AVX-512, BMI2, ABM, FMA, ADX, VMX, SMEP, SMAP, EIST, TM1, TM2, HT, Turbo, SST, AES-NI, RDRAND, RDSEED, SHA
iGPUIntel UHD Graphics Xe 32EUs (Tiger Lake-H) (350 - 1450 MHz)Intel Iris Xe Graphics G7 80EUs ( - 1250 MHz)Intel UHD Graphics Xe 16EUs (Tiger Lake-H) (350 - 1450 MHz)
Architecturex86x86x86
Announced
Manufacturerwww.intel.comark.intel.com

Benchmarks

Performance Rating - CB R15 + R20 + 7-Zip + X265 + Blender + 3DM11 CPU - i5-11500B
33.7 pt (56%)
Restrict / Search: Model: Max. age: years
Performance Rating - CB R15 + R20 + 7-Zip + X265 + Blender + 3DM11 CPU - i5-1335U
34.8 pt (58%)
Restrict / Search: Model: Max. age: years
Performance Rating - CB R15 + R20 + 7-Zip + X265 + Blender + 3DM11 CPU - i5-11400H
33 pt (55%)
Restrict / Search: Model: Max. age: years
Cinebench 2024 - Cinebench 2024 CPU Single Core
88 Points (49%)
86 Points (48%)
Cinebench 2024 - Cinebench 2024 CPU Multi Core
451 Points (8%)
414 Points (8%)
Cinebench R23 - Cinebench R23 Multi Core
8318 Points (8%)
min: 6957     avg: 8383     median: 8889.5 (8%)     max: 9438 Points
min: 6674     avg: 8150     median: 8451 (8%)     max: 9406 Points
Cinebench R23 - Cinebench R23 Single Core
1484 Points (62%)
min: 1532     avg: 1669     median: 1684.5 (71%)     max: 1733 Points
min: 1349     avg: 1428     median: 1460.5 (61%)     max: 1472 Points
Cinebench R20 - Cinebench R20 CPU (Single Core)
566 Points (62%)
min: 593     avg: 636     median: 643 (70%)     max: 663 Points
min: 522     avg: 557     median: 561 (61%)     max: 569 Points
Cinebench R20 - Cinebench R20 CPU (Multi Core)
3236 Points (8%)
min: 2602     avg: 3257     median: 3343 (8%)     max: 3849 Points
min: 2550     avg: 3142     median: 3283 (8%)     max: 3740 Points
Cinebench R15 - Cinebench R15 CPU Multi 64 Bit
1322 Points (8%)
min: 1109     avg: 1411     median: 1464 (9%)     max: 1547 Points
min: 1014     avg: 1297     median: 1277 (8%)     max: 1532 Points
Cinebench R15 - Cinebench R15 CPU Single 64 Bit
223 Points (62%)
min: 222     avg: 236.5     median: 238 (66%)     max: 248 Points
min: 202     avg: 214.3     median: 218 (60%)     max: 219 Points
Cinebench R11.5 - Cinebench R11.5 CPU Multi 64 Bit
15 Points (19%)
18.9 Points (25%)
min: 13.31     avg: 14.6     median: 14.6 (19%)     max: 15.97 Points
Cinebench R11.5 - Cinebench R11.5 CPU Single 64 Bit
2.6 Points (62%)
3 Points (71%)
min: 2.45     avg: 2.5     median: 2.5 (59%)     max: 2.55 Points
Cinebench R10 - Cinebench R10 Rend. Single (32bit)
9000 Points (54%)
9351 Points (56%)
min: 8611     avg: 8712     median: 8712 (53%)     max: 8813 Points
Cinebench R10 - Cinebench R10 Rend. Multi (32bit)
41001 Points (30%)
40266 Points (29%)
min: 36972     avg: 39096     median: 39095.5 (28%)     max: 41219 Points
Cinebench R10 - Cinebench R10 Rend. Multi (64bit)
54928 Points (35%)
62930 Points (40%)
54687 Points (35%)
Cinebench R10 - Cinebench R10 Rend. Single (64bit)
11802 Points (14%)
13680 Points (17%)
11530 Points (14%)
wPrime 2.10 - wPrime 2.0 1024m *
152 s (2%)
508 s (6%)
min: 140.674     avg: 231.8     median: 231.8 (3%)     max: 323 s
wPrime 2.10 - wPrime 2.0 32m *
4.6 s (1%)
8 s (2%)
min: 4.498     avg: 6.8     median: 6.8 (1%)     max: 9.1 s
WinRAR - WinRAR 4.0
6789 Points (11%)
5178 Points (8%)
min: 5477     avg: 5571     median: 5571 (9%)     max: 5665 Points
7-Zip 18.03 - 7-Zip 18.03 Multi Thread 4 runs
36194 MIPS (21%)
min: 25012     avg: 33576     median: 34186 (20%)     max: 38513 MIPS
min: 27615     avg: 33927     median: 33444 (19%)     max: 40268 MIPS
7-Zip 18.03 - 7-Zip 18.03 Single Thread 4 runs
5498 MIPS (65%)
min: 4872     avg: 5202     median: 5171 (61%)     max: 5545 MIPS
min: 4802     avg: 5104     median: 5116 (60%)     max: 5343 MIPS
X264 HD Benchmark 4.0 - x264 Pass 2
68.7 fps (2%)
81.8 fps (2%)
min: 62     avg: 69.9     median: 69.9 (2%)     max: 77.85 fps
X264 HD Benchmark 4.0 - x264 Pass 1
234.5 fps (6%)
257 fps (7%)
min: 138     avg: 182.3     median: 182.3 (5%)     max: 226.5 fps
HWBOT x265 Benchmark v2.2 - HWBOT x265 4k Preset
10.3 fps (18%)
min: 6.55     avg: 9     median: 9.2 (16%)     max: 10.7 fps
min: 8.19     avg: 9.6     median: 9.6 (17%)     max: 11.3 fps
TrueCrypt - TrueCrypt Serpent
0.8 GB/s (24%)
0.9 GB/s (26%)
min: 0.78     avg: 0.8     median: 0.8 (23%)     max: 0.815 GB/s
TrueCrypt - TrueCrypt Twofish
1.3 GB/s (22%)
1.7 GB/s (29%)
min: 1.2     avg: 1.3     median: 1.3 (22%)     max: 1.3 GB/s
TrueCrypt - TrueCrypt AES
8.3 GB/s (22%)
9.5 GB/s (25%)
min: 7.9     avg: 8.2     median: 8.2 (21%)     max: 8.4 GB/s
Blender - Blender 3.3 Classroom CPU *
673 Seconds (9%)
min: 646     avg: 807     median: 804 (10%)     max: 1100 Seconds
662 Seconds (8%)
Blender - Blender 2.79 BMW27 CPU *
379 Seconds (3%)
min: 340     avg: 460.4     median: 409 (3%)     max: 786 Seconds
min: 340     avg: 399.5     median: 396 (3%)     max: 483 Seconds
R Benchmark 2.5 - R Benchmark 2.5 *
0.6 sec (12%)
min: 0.4892     avg: 0.5     median: 0.5 (11%)     max: 0.524 sec
min: 0.581     avg: 0.6     median: 0.6 (13%)     max: 0.644 sec
3DMark 06 - CPU - 3DMark 06 - CPU
12580 Points (27%)
12286 Points (26%)
min: 12039     avg: 12170     median: 12043 (26%)     max: 12429 Points
Super Pi mod 1.5 XS 1M - Super Pi mod 1.5 XS 1M *
7.3 s (2%)
7.4 s (2%)
min: 7.5     avg: 7.5     median: 7.5 (2%)     max: 7.549 s
Super Pi mod 1.5 XS 2M - Super Pi mod 1.5 XS 2M *
16 s (1%)
16.3 s (1%)
min: 16.3     avg: 16.3     median: 16.3 (1%)     max: 16.303 s
Super Pi Mod 1.5 XS 32M - Super Pi mod 1.5 XS 32M *
373 s (2%)
423.1 s (2%)
min: 338.041     avg: 487.5     median: 487.5 (2%)     max: 637 s
3DMark Vantage - 3DM Vant. Perf. CPU no Physx
47824 Points (37%)
min: 43773     avg: 47410     median: 47410 (36%)     max: 51047 Points
3DMark 11 - 3DM11 Performance Physics
13784 Points (34%)
min: 8341     avg: 12167     median: 12727 (31%)     max: 15080 Points
min: 8859     avg: 12046     median: 11488.5 (28%)     max: 15086 Points
3DMark - 3DMark Ice Storm Physics
70795 Points (58%)
min: 35428     avg: 52471     median: 52470.5 (43%)     max: 69513 Points
3DMark - 3DMark Ice Storm Extreme Physics
70878 Points (58%)
35070 Points (28%)
3DMark - 3DMark Ice Storm Unlimited Physics
74085 Points (59%)
min: 69034     avg: 70364     median: 70347 (56%)     max: 71711 Points
3DMark - 3DMark Cloud Gate Physics
12557 Points (32%)
min: 6734     avg: 10580     median: 11760 (30%)     max: 12730 Points
min: 9771     avg: 10834     median: 10594 (27%)     max: 12377 Points
3DMark - 3DMark Fire Strike Standard Physics
19930 Points (36%)
min: 9926     avg: 16238     median: 17566 (31%)     max: 19968 Points
min: 9406     avg: 16286     median: 16949 (30%)     max: 19795 Points
3DMark - 3DMark Time Spy CPU
7021 Points (30%)
min: 4040     avg: 5523     median: 5589 (24%)     max: 6757 Points
min: 4618     avg: 6094     median: 5827 (25%)     max: 7707 Points
Geekbench 6.4 - Geekbench 6.4 Single-Core
2173 Points (54%)
min: 2236     avg: 2295     median: 2260 (56%)     max: 2379 Points
2090 Points (52%)
Geekbench 6.4 - Geekbench 6.4 Multi-Core
8148 Points (32%)
min: 6604     avg: 8168     median: 8597 (33%)     max: 9282 Points
6317 Points (25%)
Geekbench 6.0 - Geekbench 6.0 Single-Core
2058 Points (65%)
min: 2166     avg: 2203     median: 2203 (70%)     max: 2240 Points
1980 Points (63%)
Geekbench 6.0 - Geekbench 6.0 Multi-Core
7760 Points (32%)
min: 8419     avg: 8429     median: 8428.5 (35%)     max: 8438 Points
6124 Points (25%)
Geekbench 5.5 - Geekbench 5.1 - 5.5 64 Bit Single-Core
1566 Points (61%)
min: 1506     avg: 1639     median: 1669 (65%)     max: 1700 Points
min: 1396     avg: 1478     median: 1500 (59%)     max: 1528 Points
Geekbench 5.5 - Geekbench 5.1 - 5.5 64 Bit Multi-Core
7132 Points (13%)
min: 5459     avg: 7429     median: 7856 (14%)     max: 8618 Points
min: 4679     avg: 6131     median: 6006 (11%)     max: 7018 Points
Geekbench 5.0 - Geekbench 5.0 64 Bit Single-Core
1535 Points (7%)
min: 1637     avg: 1642     median: 1641.5 (7%)     max: 1646 Points
1461 Points (6%)
Geekbench 5.0 - Geekbench 5.0 64 Bit Multi-Core
7012 Points (22%)
min: 7984     avg: 8225     median: 8225 (26%)     max: 8466 Points
5961 Points (19%)
Geekbench 4.4 - Geekbench 4.1 - 4.4 64 Bit Single-Core
6663 Points (67%)
7007 Points (70%)
6110 Points (61%)
Geekbench 4.4 - Geekbench 4.1 - 4.4 64 Bit Multi-Core
28454 Points (28%)
30532 Points (30%)
24947 Points (25%)
Mozilla Kraken 1.1 - Kraken 1.1 Total Score *
649 ms (1%)
min: 545     avg: 671     median: 558 (1%)     max: 1914 ms
min: 655     avg: 669     median: 661 (1%)     max: 702 ms
Sunspider - Sunspider 1.0 Total Score *
64.5 ms (1%)
min: 135.9     avg: 156.2     median: 156.2 (2%)     max: 176.4 ms
Octane V2 - Octane V2 Total Score
min: 71882     avg: 81575     median: 84497 (62%)     max: 85424 Points
min: 60869     avg: 63575     median: 63574.5 (47%)     max: 66280 Points
WebXPRT 4 - WebXPRT 4 Score
min: 195.6     avg: 227.5     median: 231 (63%)     max: 238 Points
204 Points (56%)
WebXPRT 3 - WebXPRT 3 Score
271 Points (49%)
min: 212     avg: 255.3     median: 260 (47%)     max: 270 Points
min: 243     avg: 250.5     median: 250 (45%)     max: 259 Points
CrossMark - CrossMark Overall
1416 Points (53%)
min: 1339     avg: 1442     median: 1450 (54%)     max: 1599 Points
1285 Points (48%)
Power Consumption - Prime95 Power Consumption - external Monitor *
75.7 Watt (13%)
min: 26.2     avg: 36.7     median: 36 (6%)     max: 56.7 Watt
min: 51.3     avg: 64.7     median: 65.8 (11%)     max: 75.7 Watt
Power Consumption - Cinebench R15 Multi Power Consumption - external Monitor *
95 Watt (17%)
min: 29.6     avg: 44     median: 41.7 (8%)     max: 62.8 Watt
min: 66.4     avg: 81.5     median: 81.9 (15%)     max: 95.9 Watt
Power Consumption - Idle Power Consumption - external Monitor *
14.5 Watt (10%)
min: 3.03     avg: 6.6     median: 5.9 (4%)     max: 12.7 Watt
20 Watt (13%)
Power Consumption - Idle Power Consumption 150cd 1min *
min: 4.5     avg: 6.3     median: 6 (7%)     max: 9.71 Watt
Power Consumption - Power Efficiency - Cinebench R15 Multi external Monitor
13.9 Points per Watt (10%)
min: 24.3     avg: 41.6     median: 43.1 (32%)     max: 57.5 Points per Watt
min: 15.8     avg: 17.3     median: 16.9 (13%)     max: 19.2 Points per Watt

Average Benchmarks Intel Core i5-11500B → 100% n=47

Average Benchmarks Intel Core i5-1335U → 101% n=47

Average Benchmarks Intel Core i5-11400H → 92% n=47

- Range of benchmark values for this graphics card
red legend - Average benchmark values for this graphics card
* Smaller numbers mean a higher performance
1 This benchmark is not used for the average calculation

v1.33
log 10. 12:27:56

#0 ran 0s before starting gpusingle class +0s ... 0s

#1 checking url part for id 17400 +0s ... 0s

#2 checking url part for id 14916 +0s ... 0s

#3 checking url part for id 13147 +0s ... 0s

#4 redirected to Ajax server, took 1757500076s time from redirect:0 +0s ... 0s

#5 did not recreate cache, as it is less than 5 days old! Created at Wed, 10 Sep 2025 11:38:25 +0200 +0s ... 0s

#6 composed specs +0.007s ... 0.007s

#7 did output specs +0s ... 0.007s

#8 getting avg benchmarks for device 17400 +0.004s ... 0.011s

#9 got single benchmarks 17400 +0.006s ... 0.016s

#10 getting avg benchmarks for device 14916 +0.004s ... 0.02s

#11 got single benchmarks 14916 +0.02s ... 0.04s

#12 getting avg benchmarks for device 13147 +0.005s ... 0.045s

#13 got single benchmarks 13147 +0.015s ... 0.06s

#14 got avg benchmarks for devices +0s ... 0.06s

#15 min, max, avg, median took s +0.089s ... 0.149s

#16 return log +0s ... 0.149s

Please share our article, every link counts!
Mail Logo
> Expert Reviews and News on Laptops, Smartphones and Tech Innovations > Benchmarks / Tech > Processor Comparison - Head 2 Head
Redaktion, 2017-09- 8 (Update: 2023-07- 1)