Notebookcheck Logo

AMD Ryzen 9 7950X3D vs AMD Ryzen 5 PRO 7640HS vs AMD Ryzen 7 7700X

AMD Ryzen 9 7950X3D

► remove from comparison AMD R9 7950X3D

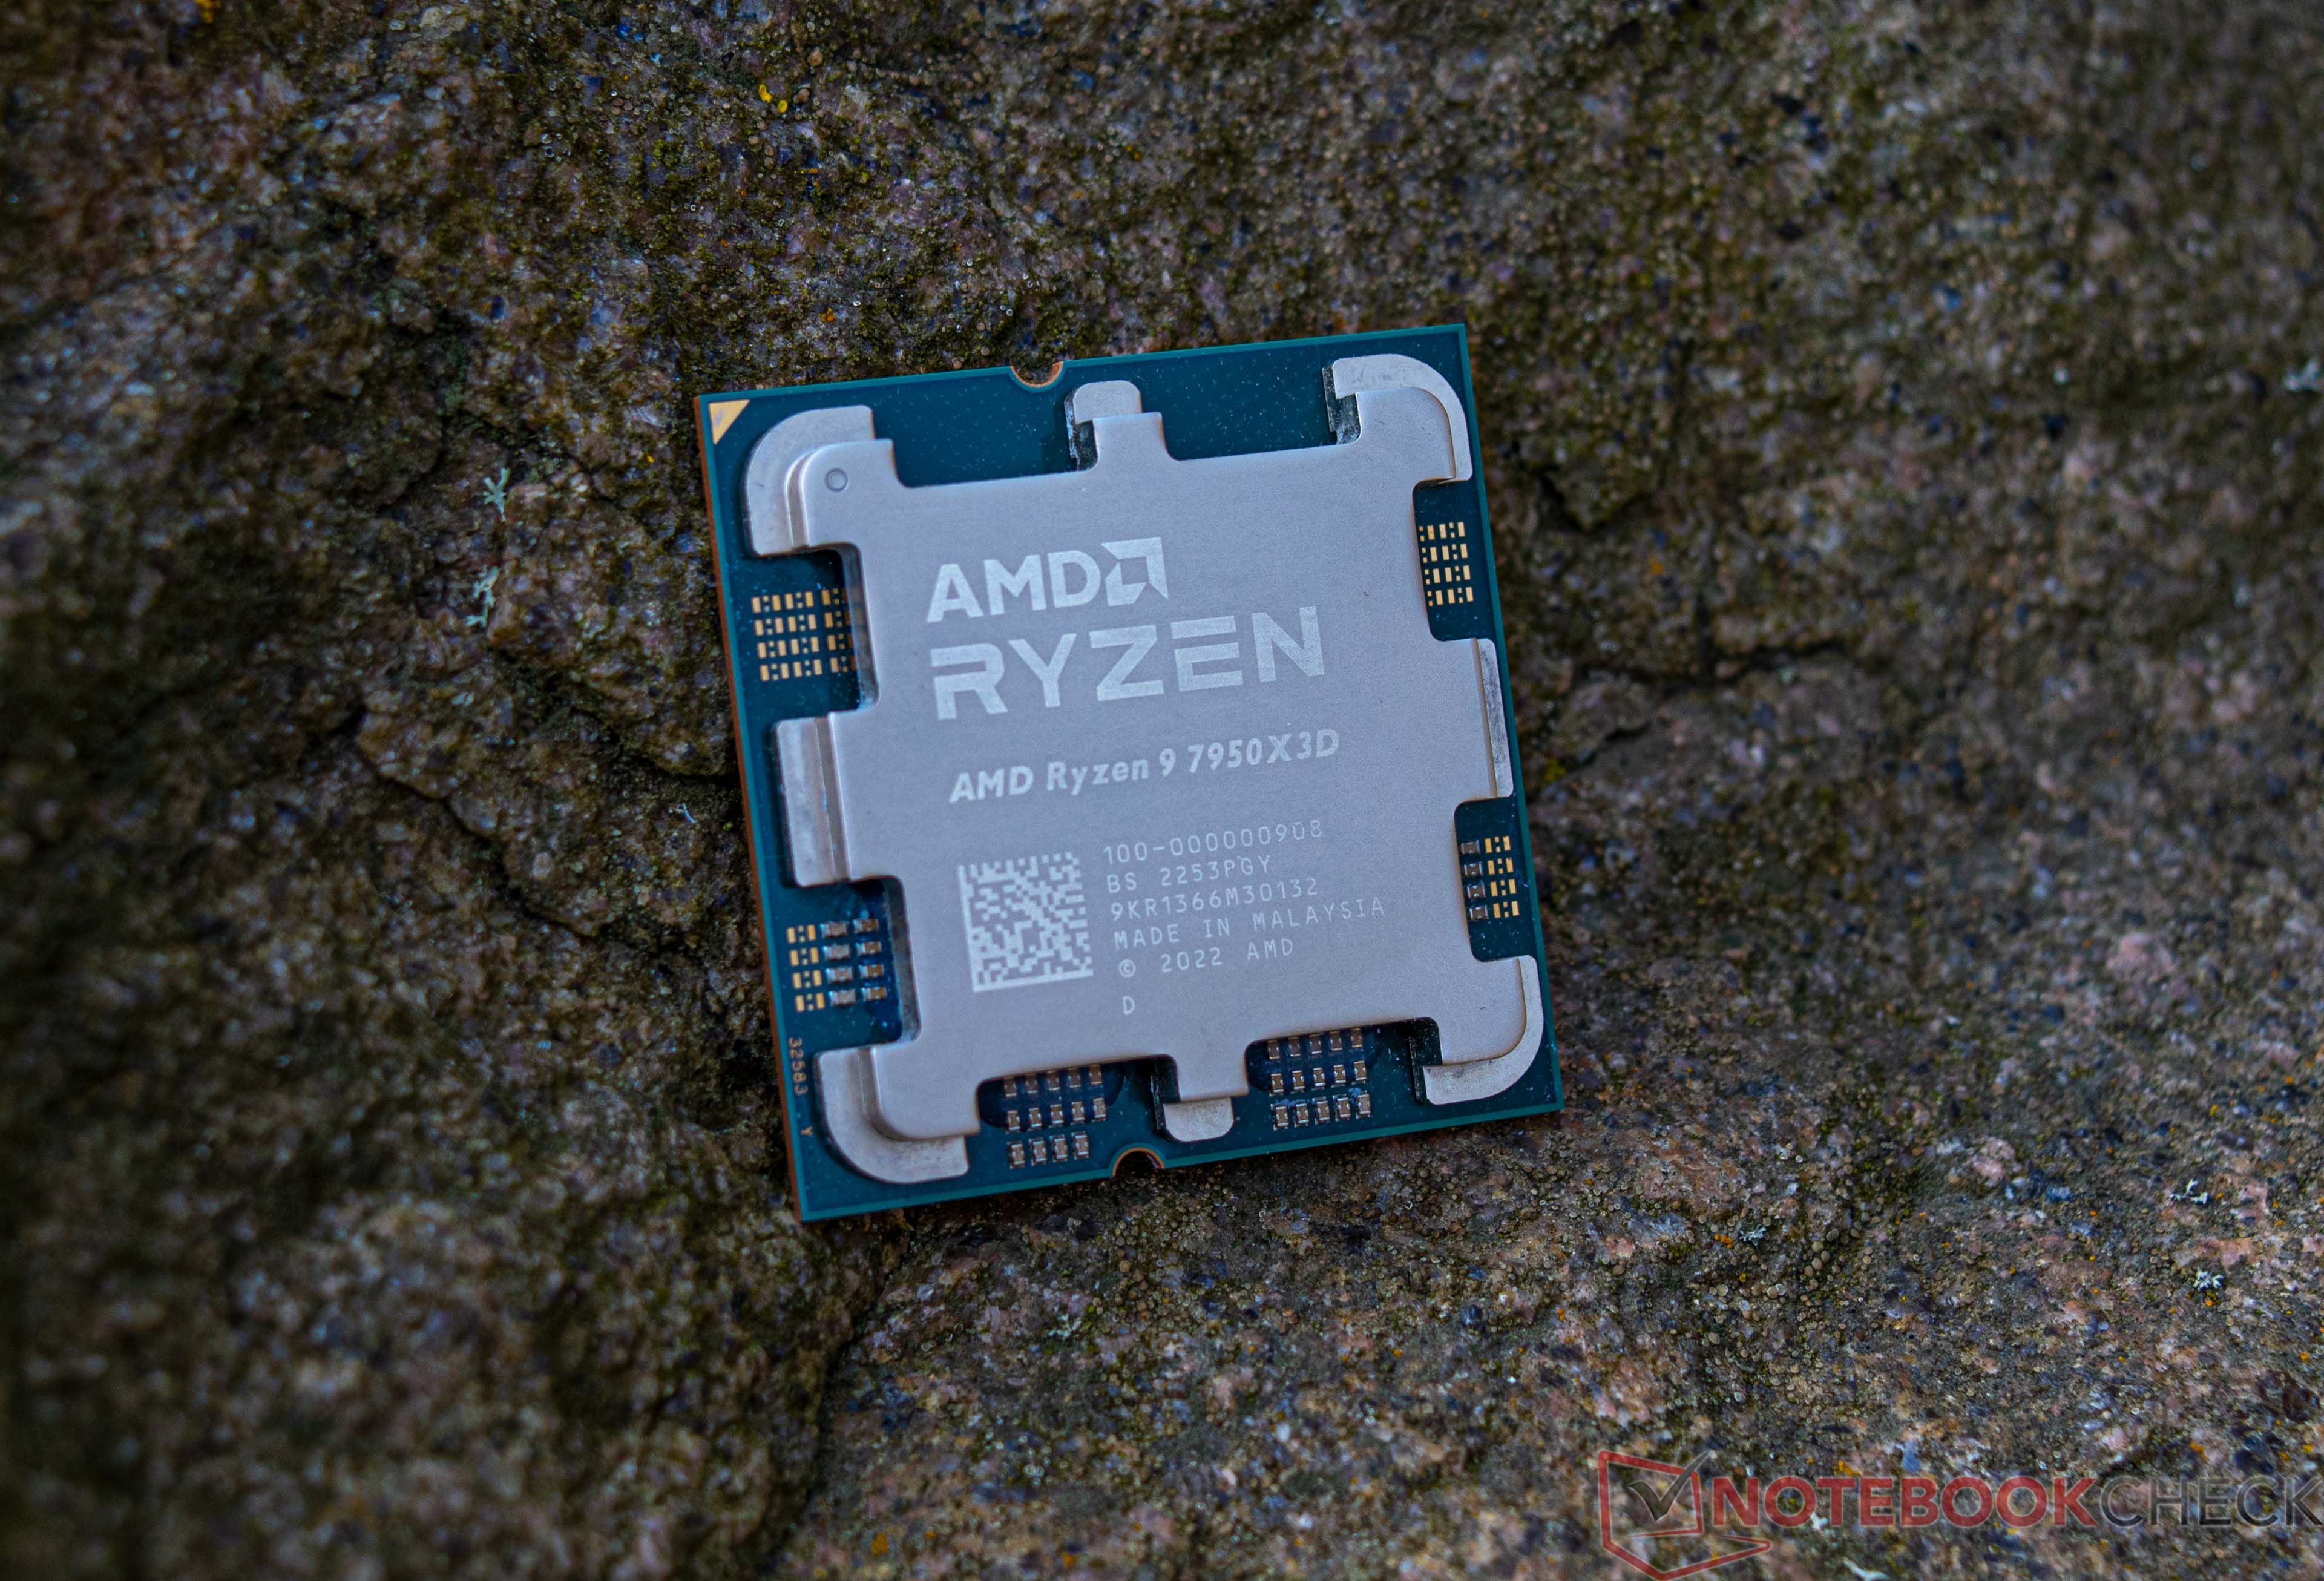
The AMD Ryzen 9 7950X3D is a high-end desktop processor of the Raphael series with 16 cores and SMT (Simultaneous Multithreading), which means it can process up to 32 threads simultaneously. With the release in February 2023, the Ryzen 9 7950X3D is AMD's fastest consumer processor and the new top model of the 7000 series. The CPU cores clock from 4.2 GHz (base clock) up to 5.7 GHz (single core Turbo). In addition, the AMD Ryzen 9 7950X3D has a CCD with 8 cores that can access the fast 3D V-cache, which offers considerably more gaming performance.

The performance of the AMD Ryzen 9 7950X3D is consistently excellent in all applications tested. In addition, AMD was again able to increase the single-thread performance compared to the non-X3D models. Nevertheless, the lower base clock compared to the AMD Ryzen 9 7950X means that a small drop in multi-thread performance has to be accepted.

The internal structure of the processor is comparable to the previous AMD Ryzen 9 7950X. The AMD Ryzen 9 7950X3D is also still based on the chiplet design consisting of two CCD clusters with 8 cores each. However, the two CCDs differ significantly from each other because one offers the fast 3D V-Cache, which primarily improves gaming performance. In testing, the AMD Ryzen 9 7950X3D was able to put the Intel Core i9-13900K in second place and is the fastest gaming CPU on the market at the time of testing. 

The AMD Ryzen 9 7950X3D is an extremely energy-efficient CPU with up to 162 watts (PPT) and is significantly more frugal under load than an AMD Ryzen 9 7950X (max. 230 watts).

AMD Ryzen 5 PRO 7640HS

► remove from comparison AMD R5 PRO 7640HS

The AMD Ryzen 5 PRO 7640HS is a fast mid-range laptop processor of the Phoenix series. It offers 6 cores (hexa core) based on the Zen 4 architecture that supports hyperthreading (12 threads). The cores clock from 4.3 (base) up to 5 GHz (single core boost). The processor includes 6 MB L2 cache and 16 MB L3 cache.

Compared to the consumer Ryzen 5 7640HS, the PRO models offer additional security, manageability, and reliability features designed for professional users and workstation environments.

The performance of the R5 PRO 7640HS is clearly lower (multi-threaded) than the higher end Ryzen 7 7840HS and Ryzen 9 7940HS models due to the two missing CPU cores. Compared to the faster HX series, the 7640HS at 54W TDP should be only slightly slower than the Ryzen 5 7645HX (also 6 Zen 4 cores, up to 5 GHz, 55W). The old Ryzen 5 6600H should be easily bested thanks to the improved architecture and higher clock speeds.

The chip integrates a modern and fasts RDNA 3 graphics card (iGPU) called Radeon 760M with 8 of the 12 CUs and 2.6 GHz clock speed. Furthermore, the Phoenix series include a video engine with AV1 de- and encoding, a new Xilinx FPGA based XDNA AI accelerator (Ryzen AI) that should be faster than the AI engine in the Apple M2 SOC and a dual-channel DDR5-5600 / LPDDR5x-7500 memory controller (with ECC support). The connectivity features includes 2 possible USB 4 (40 Gbps) ports and 20 PCIe 4.0 lanes for a GPU and SSDs.

The Phoenix series uses a single monolithic design (unlike the chiplet design of the 7045HX series) and is manufactured in the modern 4nm process at TSMC. The TDP can be configured between 35 and 45 Watt.

AMD Ryzen 7 7700X

► remove from comparison AMD R7 7700X

The AMD Ryzen 7 7700X is a fast high-end desktop processor of the Raphael series. It offers 8 cores based on the Zen 4 architecture that supports hyperthreading (16 threads). The cores clock from 4.5 (base) up to 5.4 GHz (single core boost). Compared to the faster Ryzen 9 CPUs (like the 7900X), the R7 offers less cores and slightly lower clock speeds.

The performance of the R7 7700X is clearly better than the old Ryzen 7 of the 5000 generation thanks to the improved architecture and modern 5nm process. Compared to Intels Alder Lake Core i7-12900K the performance is quite similar but stays behind the newer Rocket Lake i5-13600K (multi-threaded).

The Raphael series still uses a chiplet design with two CCD-clusters (each with 8 possible cores, so only one used for the 7700X) in 5nm and an IO-die (including the memory controller and the Radeon Graphics iGPU) in 6nm.

ModelAMD Ryzen 9 7950X3DAMD Ryzen 5 PRO 7640HSAMD Ryzen 7 7700X
CodenameRaphael (Zen4)Phoenix (Zen4)Raphael (Zen4)
SeriesAMD Raphael (Zen 4, Ryzen 7000)AMD Phoenix (Zen 4)AMD Raphael (Zen 4, Ryzen 7000)
Series: Raphael (Zen 4, Ryzen 7000) Raphael (Zen4)
AMD Ryzen 9 7950X3D « 4.2 - 5.7 GHz16 / 32 cores128 MB L3
AMD Ryzen 9 7900X4.7 - 5.6 GHz12 / 24 cores64 MB L3
AMD Ryzen 9 79003.7 - 5.4 GHz12 / 24 cores64 MB L3
AMD Ryzen 7 7700X4.5 - 5.4 GHz8 / 16 cores32 MB L3
AMD Ryzen 7 77003.8 - 5.3 GHz8 / 16 cores32 MB L3
AMD Ryzen 7 7800X3D4.2 - 5 GHz8 / 16 cores96 MB L3
AMD Ryzen 5 7600X4.7 - 5.3 GHz6 / 12 cores32 MB L3
AMD Ryzen 5 76003.8 - 5.1 GHz6 / 12 cores32 MB L3
AMD Ryzen 5 PRO 7640HS « 4.3 - 5 GHz6 / 12 cores16 MB L3
AMD Ryzen Z13.2 - 4.9 GHz6 / 12 cores16 MB L3
AMD Ryzen 5 PRO 7640U3.5 - 4.9 GHz6 / 12 cores16 MB L3
AMD Ryzen 5 7545U3.2 - 4.9 GHz6 / 12 cores16 MB L3
AMD Ryzen 5 PRO 7545U3.2 - 4.9 GHz6 / 12 cores16 MB L3
AMD Ryzen 5 7540U3.2 - 4.9 GHz6 / 12 cores16 MB L3
AMD Ryzen 5 PRO 7540U3.2 - 4.9 GHz6 / 12 cores16 MB L3
AMD Ryzen 9 7950X3D4.2 - 5.7 GHz16 / 32 cores128 MB L3
AMD Ryzen 9 7900X4.7 - 5.6 GHz12 / 24 cores64 MB L3
AMD Ryzen 9 79003.7 - 5.4 GHz12 / 24 cores64 MB L3
AMD Ryzen 7 7700X « 4.5 - 5.4 GHz8 / 16 cores32 MB L3
AMD Ryzen 7 77003.8 - 5.3 GHz8 / 16 cores32 MB L3
AMD Ryzen 7 7800X3D4.2 - 5 GHz8 / 16 cores96 MB L3
AMD Ryzen 5 7600X4.7 - 5.3 GHz6 / 12 cores32 MB L3
AMD Ryzen 5 76003.8 - 5.1 GHz6 / 12 cores32 MB L3
Clock4200 - 5700 MHz4300 - 5000 MHz4500 - 5400 MHz
L1 Cache1 MB384 KB512 KB
L2 Cache16 MB6 MB8 MB
L3 Cache128 MB16 MB32 MB
Cores / Threads16 / 32
16 x 5.7 GHz AMD Zen 4
6 / 128 / 16
TDP120 Watt54 Watt170 Watt
Transistors13140 Million9.9 Million
Technology5 nm4 nm5 nm
Die Size263 mm2178 mm22x 70 (CCD) mm2 + 122 (I/O) mm2
max. Temp.89 °C100 °C95 °C
SocketAM5 (LGA 1718)AM5 (LGA 1718)
FeaturesMMX(+), SSE, SSE2, SSE3, SSSE3, SSE4.1, SSE4.2, SSE4A, x86-64, AMD-V, AES, AVX, AVX2, AVX512F, FMA3, SHA, XFR2, Precision Boost 2MMX(+), SSE, SSE2, SSE3, SSSE3, SSE4.1, SSE4.2, SSE4A, x86-64, AMD-V, AES, AVX, AVX2, AVX512F, FMA3, SHA, Precision Boost 2
iGPUAMD Radeon Graphics (Ryzen 7000) (400 - 2200 MHz)AMD Radeon 760M ( - 2600 MHz)AMD Radeon Graphics (Ryzen 7000) (400 - 2200 MHz)
Architecturex86x86x86
$699 U.S.
Announced
Manufacturerwww.amd.comwww.amd.comwww.amd.com
Voltage0.650 - 1.475V V

Benchmarks

Performance Rating - CB R15 + R20 + 7-Zip + X265 + Blender + 3DM11 CPU - R9 7950X3D
49.9 pt (83%)
Restrict / Search: Model: Max. age: years
Performance Rating - CB R15 + R20 + 7-Zip + X265 + Blender + 3DM11 CPU - R5 PRO 7640HS
36.5 pt (61%)
Restrict / Search: Model: Max. age: years
Performance Rating - CB R15 + R20 + 7-Zip + X265 + Blender + 3DM11 CPU - R7 7700X
45.1 pt (75%)
Restrict / Search: Model: Max. age: years
Cinebench R23 - Cinebench R23 Multi Core
36291 Points (34%)
11507 Points (11%)
min: 18667     avg: 19088     median: 19088 (18%)     max: 19509 Points
Cinebench R23 - Cinebench R23 Single Core
2053 Points (86%)
1581 Points (67%)
min: 1986     avg: 1987     median: 1987 (84%)     max: 1988 Points
Cinebench R20 - Cinebench R20 CPU (Single Core)
795 Points (87%)
612 Points (67%)
min: 772     avg: 773     median: 772.5 (84%)     max: 773 Points
Cinebench R20 - Cinebench R20 CPU (Multi Core)
14188 Points (35%)
4530 Points (11%)
min: 7308     avg: 7463     median: 7462.5 (18%)     max: 7617 Points
Cinebench R15 - Cinebench R15 CPU Multi 64 Bit
5974 Points (38%)
1863 Points (12%)
min: 3036     avg: 3114     median: 3113.5 (20%)     max: 3191 Points
Cinebench R15 - Cinebench R15 CPU Single 64 Bit
326 Points (90%)
249 Points (69%)
min: 314     avg: 315     median: 315 (87%)     max: 316 Points
Cinebench R11.5 - Cinebench R11.5 CPU Multi 64 Bit
64.6 Points (84%)
21.6 Points (28%)
36.1 Points (47%)
Cinebench R11.5 - Cinebench R11.5 CPU Single 64 Bit
3.9 Points (92%)
3 Points (71%)
3.7 Points (88%)
Cinebench R10 - Cinebench R10 Rend. Single (32bit)
16551 Points (100%)
6888 Points (42%)
8633 Points (52%)
Cinebench R10 - Cinebench R10 Rend. Multi (32bit)
138015 Points (100%)
39399 Points (29%)
56024 Points (41%)
Cinebench R10 - Cinebench R10 Rend. Multi (64bit)
72361 Points (46%)
Cinebench R10 - Cinebench R10 Rend. Single (64bit)
8853 Points (11%)
wPrime 2.10 - wPrime 2.0 1024m *
33.9 s (0%)
61.1 s (1%)
wPrime 2.10 - wPrime 2.0 32m *
2 s (0%)
2.2 s (0%)
WinRAR - WinRAR 4.0
15779 Points (25%)
6717 Points (11%)
14879 Points (24%)
7-Zip 18.03 - 7-Zip 18.03 Multi Thread 4 runs
159341 MIPS (91%)
51096 MIPS (29%)
min: 85624     avg: 85707     median: 85706.5 (49%)     max: 85789 MIPS
7-Zip 18.03 - 7-Zip 18.03 Single Thread 4 runs
8321 MIPS (98%)
5892 MIPS (69%)
min: 8052     avg: 8074     median: 8074 (95%)     max: 8096 MIPS
X264 HD Benchmark 4.0 - x264 Pass 2
265.5 fps (89%)
109.5 fps (37%)
181.2 fps (61%)
X264 HD Benchmark 4.0 - x264 Pass 1
392.5 fps (91%)
264 fps (61%)
373.5 fps (86%)
HWBOT x265 Benchmark v2.2 - HWBOT x265 4k Preset
42.4 fps (75%)
14.7 fps (26%)
min: 24.8     avg: 25.5     median: 25.5 (45%)     max: 26.1 fps
TrueCrypt - TrueCrypt Serpent
2.8 GB/s (82%)
0.9 GB/s (27%)
1.4 GB/s (41%)
TrueCrypt - TrueCrypt Twofish
4.2 GB/s (72%)
1.5 GB/s (26%)
2.3 GB/s (40%)
TrueCrypt - TrueCrypt AES
26.9 GB/s (70%)
10.4 GB/s (27%)
17.5 GB/s (46%)
Blender - Blender 3.3 Classroom CPU *
133 Seconds (2%)
444 Seconds (6%)
min: 255     avg: 261     median: 261 (3%)     max: 267 Seconds
Blender - Blender 2.79 BMW27 CPU *
86 Seconds (1%)
270 Seconds (2%)
min: 160     avg: 163     median: 163 (1%)     max: 166 Seconds
R Benchmark 2.5 - R Benchmark 2.5 *
0.4 sec (8%)
0.5 sec (11%)
min: 0.3758     avg: 0.4     median: 0.4 (8%)     max: 0.383 sec
3DMark 06 - CPU - 3DMark 06 - CPU
20279 Points (43%)
12948 Points (28%)
18115 Points (39%)
Super Pi mod 1.5 XS 1M - Super Pi mod 1.5 XS 1M *
6.1 s (1%)
7.9 s (2%)
6.3 s (1%)
Super Pi mod 1.5 XS 2M - Super Pi mod 1.5 XS 2M *
13.2 s (1%)
19.7 s (1%)
13.6 s (1%)
Super Pi Mod 1.5 XS 32M - Super Pi mod 1.5 XS 32M *
305.1 s (1%)
741 s (3%)
322.8 s (1%)
3DMark Vantage - 3DM Vant. Perf. CPU no Physx
99321 Points (76%)
59830 Points (46%)
3DMark 11 - 3DM11 Performance Physics
36991 Points (91%)
17057 Points (42%)
31467 Points (77%)
3DMark - 3DMark Ice Storm Physics
86389 Points (70%)
75086 Points (61%)
3DMark - 3DMark Ice Storm Extreme Physics
86306 Points (70%)
3DMark - 3DMark Ice Storm Unlimited Physics
87725 Points (73%)
3DMark - 3DMark Cloud Gate Physics
26168 Points (66%)
13018 Points (33%)
3DMark - 3DMark Fire Strike Standard Physics
44787 Points (80%)
19687 Points (35%)
35357 Points (63%)
3DMark - 3DMark Time Spy CPU
17206 Points (73%)
7567 Points (32%)
14182 Points (60%)
Geekbench 6.4 - Geekbench 6.4 Single-Core
2990 Points (75%)
2352 Points (59%)
Geekbench 6.4 - Geekbench 6.4 Multi-Core
19960 Points (77%)
10200 Points (40%)
Geekbench 5.5 - Geekbench 5.1 - 5.5 64 Bit Single-Core
2311 Points (90%)
1748 Points (68%)
2218 Points (87%)
Geekbench 5.5 - Geekbench 5.1 - 5.5 64 Bit Multi-Core
24343 Points (44%)
8863 Points (16%)
min: 13889     avg: 14131     median: 14131 (25%)     max: 14373 Points
Geekbench 5.0 - Geekbench 5.0 64 Bit Single-Core
2183 Points (9%)
2123 Points (9%)
Geekbench 5.0 - Geekbench 5.0 64 Bit Multi-Core
23720 Points (75%)
14215 Points (45%)
Geekbench 4.4 - Geekbench 4.1 - 4.4 64 Bit Single-Core
9240 Points (92%)
7042 Points (70%)
8991 Points (90%)
Geekbench 4.4 - Geekbench 4.1 - 4.4 64 Bit Multi-Core
87922 Points (88%)
34588 Points (34%)
56909 Points (57%)
Mozilla Kraken 1.1 - Kraken 1.1 Total Score *
437 ms (1%)
591 ms (1%)
440 ms (1%)
WebXPRT 4 - WebXPRT 4 Score
313 Points (86%)
301 Points (83%)
WebXPRT 3 - WebXPRT 3 Score
383 Points (69%)
262 Points (47%)
355 Points (64%)
CrossMark - CrossMark Overall
2193 Points (82%)
min: 2297     avg: 2313     median: 2312.5 (86%)     max: 2328 Points
Power Consumption - Prime95 Power Consumption - external Monitor *
276 Watt (48%)
53 Watt (9%)
min: 189.8     avg: 209.9     median: 209.9 (36%)     max: 230 Watt
Power Consumption - Cinebench R15 Multi Power Consumption - external Monitor *
273 Watt (50%)
min: 196.1     avg: 218.1     median: 218.1 (40%)     max: 240 Watt
Power Consumption - Idle Power Consumption - external Monitor *
118.4 Watt (78%)
3.4 Watt (2%)
min: 89.8     avg: 94     median: 94 (62%)     max: 98.2 Watt
Power Consumption - Idle Power Consumption 150cd 1min *
4.3 Watt (5%)
Power Consumption - Power Efficiency - Cinebench R15 Multi external Monitor
21.9 Points per Watt (16%)
min: 13.3     avg: 14.4     median: 14.4 (11%)     max: 15.5 Points per Watt

Average Benchmarks AMD Ryzen 9 7950X3D → 100% n=35

Average Benchmarks AMD Ryzen 5 PRO 7640HS → 51% n=35

Average Benchmarks AMD Ryzen 7 7700X → 76% n=35

- Range of benchmark values for this graphics card
red legend - Average benchmark values for this graphics card
* Smaller numbers mean a higher performance
1 This benchmark is not used for the average calculation

v1.33
log 16. 03:36:00

#0 ran 0s before starting gpusingle class +0s ... 0s

#1 checking url part for id 15000 +0s ... 0s

#2 checking url part for id 15056 +0s ... 0s

#3 checking url part for id 14655 +0s ... 0s

#4 redirected to Ajax server, took 1752629760s time from redirect:0 +0s ... 0s

#5 did not recreate cache, as it is less than 5 days old! Created at Sun, 13 Jul 2025 05:20:07 +0200 +0s ... 0s

#6 composed specs +0.008s ... 0.008s

#7 did output specs +0s ... 0.008s

#8 getting avg benchmarks for device 15000 +0.004s ... 0.012s

#9 got single benchmarks 15000 +0.005s ... 0.017s

#10 getting avg benchmarks for device 15056 +0.004s ... 0.021s

#11 got single benchmarks 15056 +0.004s ... 0.025s

#12 getting avg benchmarks for device 14655 +0.002s ... 0.027s

#13 got single benchmarks 14655 +0s ... 0.027s

#14 got avg benchmarks for devices +0s ... 0.027s

#15 min, max, avg, median took s +0.058s ... 0.085s

#16 return log +0s ... 0.085s

Please share our article, every link counts!
Mail Logo
> Expert Reviews and News on Laptops, Smartphones and Tech Innovations > Benchmarks / Tech > Processor Comparison - Head 2 Head
Redaktion, 2017-09- 8 (Update: 2023-07- 1)