




Our first Intel Core 5 320 Wildcat Lake benchmarks are in and they're.. okay
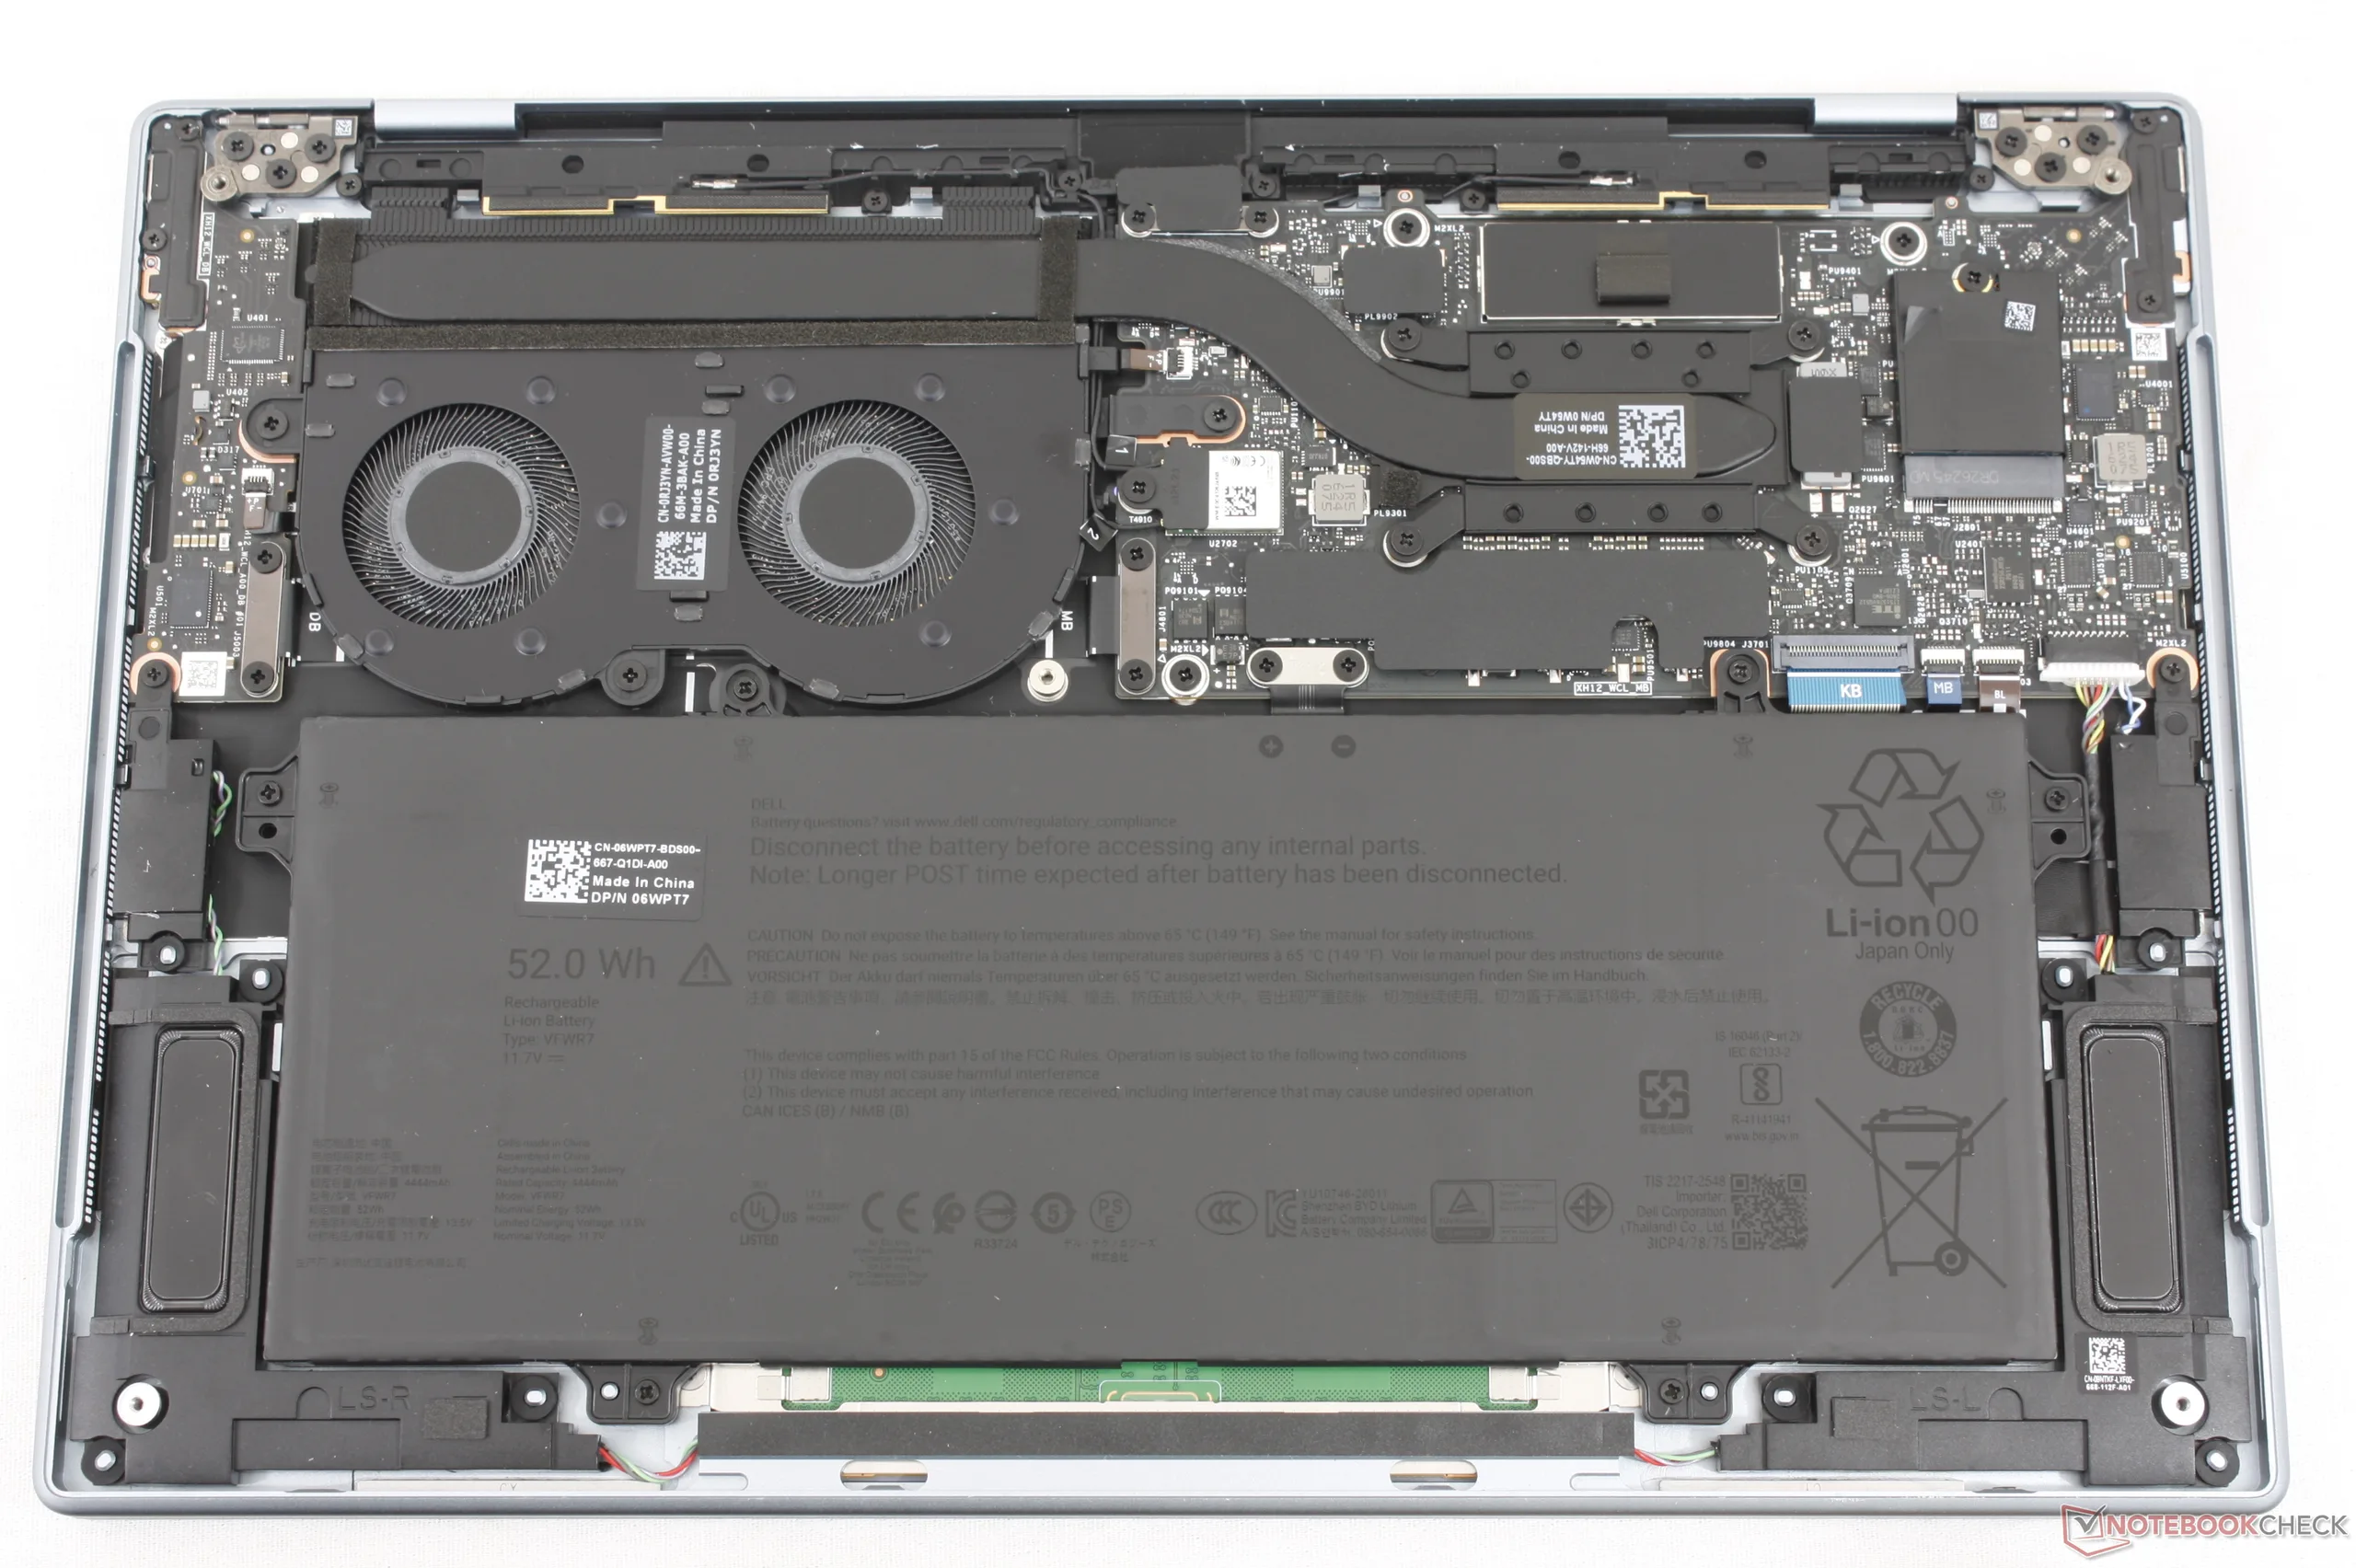
The Core 5 320 Wildcat Lake represents one of the least expensive processors in Intel's current lineup designed for wallet-friendly laptops like the recent Dell XPS 13. Thus, expectations should be kept in check as performance will invariably be pared back when compared to the latest Core Ultra options. How much of a deficit does the Core 5 320 actually carry?
According to our time with the new XPS 13, raw multi-thread performance with the Core 5 320 is on par with the years-old Ice Lake Core i7-1185G7 while single-thread performance is most similar to the newer Lunar Lake Core Ultra 7 256V. The relatively slow multi-thread performance can be a concern for heavy multi-taskers and editors, but we nonetheless found the CPU sufficient for typical browsing, 4K video streaming, or word processing tasks.
On the GPU side, the integrated Graphics 2 Xe3 is slower than even the Iris Xe 96 EUs commonly found on Ultrabooks over 5 years ago. Needless to say, you won't be playing many games or editing many pictures on Wildcat Lake laptops aside from older or undemanding 2D titles like Celeste.
Power efficiency is good but could have been better. For example, the Core Ultra X7 358H offers 3x and 5x the multi-thread and graphics performance, respectively, while consuming just 1.5x to 2.5x more power for better performance-per-watt than our Core 5 320. The Wildcat CPU was instead designed to be more efficient when idling or running less demanding loads as shown by our 18+ hour battery life test. Idling on desktop, for example, would draw less than 2 W total on the aforementioned Dell.
Check out our full review on the XPS 13 Wildcat for more benchmark comparisons.
Cinebench R23: Multi Core | Single Core
Cinebench R20: CPU (Multi Core) | CPU (Single Core)
Cinebench R15: CPU Multi 64Bit | CPU Single 64Bit
Blender: v2.79 BMW27 CPU
7-Zip 18.03: 7z b 4 | 7z b 4 -mmt1
Geekbench 6.7: Multi-Core | Single-Core
Geekbench 5.5: Multi-Core | Single-Core
HWBOT x265 Benchmark v2.2: 4k Preset
LibreOffice : 20 Documents To PDF
R Benchmark 2.5: Overall mean
Cinebench R23: Multi Core | Single Core
Cinebench R20: CPU (Multi Core) | CPU (Single Core)
Cinebench R15: CPU Multi 64Bit | CPU Single 64Bit
Blender: v2.79 BMW27 CPU
7-Zip 18.03: 7z b 4 | 7z b 4 -mmt1
Geekbench 6.7: Multi-Core | Single-Core
Geekbench 5.5: Multi-Core | Single-Core
HWBOT x265 Benchmark v2.2: 4k Preset
LibreOffice : 20 Documents To PDF
R Benchmark 2.5: Overall mean
* ... smaller is better
Power Consumption Cyberpunk / Stress Test
 Add as a preferred source on Google


