




Why skipping the XPS 13 Wildcat for the upcoming Panther Lake SKU may be worthwhile
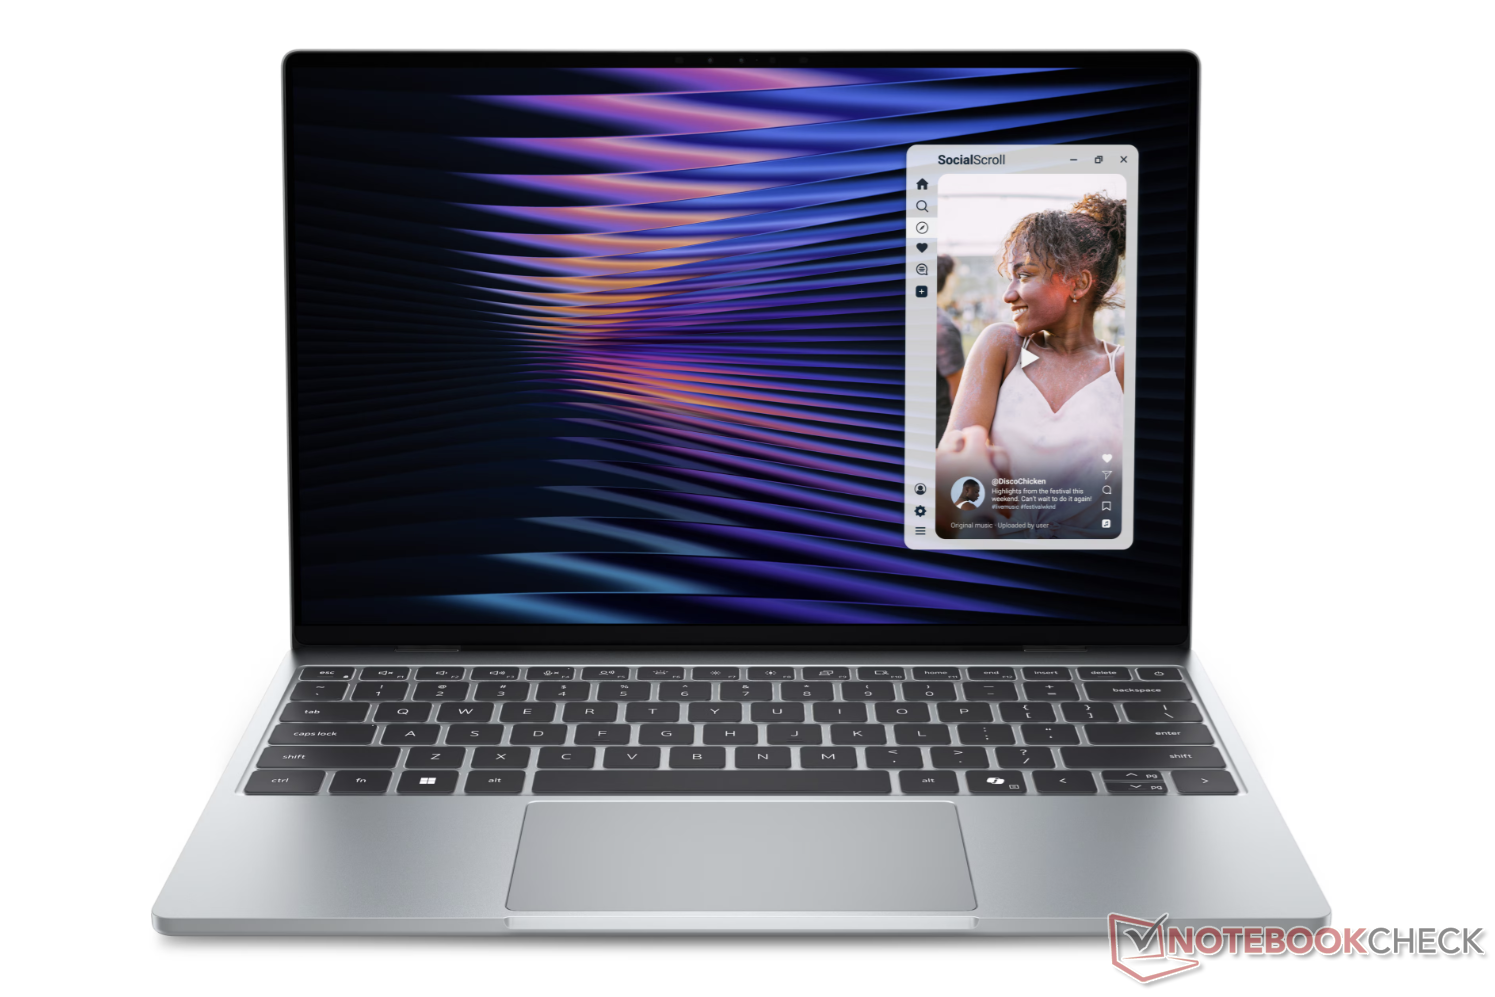
The Dell XPS 13 with Intel Wildcat Lake is currently shipping starting at $700 or even $600 for those who qualify for the education discount. As detailed in our review of the model, the system is one of the most impressive we've seen in terms of design and display quality for the price, but overall CPU performance can fall a bit short for most tasks outside of browsing and word processing. However, a solution may be of the way.
While all configurations at the moment ship with the same Wildcat Lake Core 5 320 CPU, Dell is planning on SKUs with the much faster Panther Lake Core Ultra 7 355 in the coming months. The latter CPU is significantly faster than the Wildcat option by almost 2x in terms of raw CPU and GPU performance based on our time with the XPS 14. Additionally, as a Core Ultra-class processor, the faster CPU also natively supports Copilot+ for improved local AI. The additional horsepower makes the upcoming Panther Lake XPS 13 much more versatile for scenarios beyond web browsing such as the occasional picture editing or heavy multitasking.
Of course, the Panther Lake XPS 13 will indubitably launch for higher prices than the Wildcat Lake XPS 13. The latter currently retails for $700 and $900 for the 8 GB and 16 GB SKUs, respectively. Based on the usual SKU patterns from Dell, it is unlikely that the Panther Lake XPS 13 will be offered with 8 GB of RAM meaning that a starting price of at least $1000 or $1100 should be expected. Even so, the much more capable processor may justify the elevated price points especially when considering that most other laptops with the Core Ultra 7 355 CPU generally start at $1500 or more.
Cinebench R23: Multi Core | Single Core
Cinebench R20: CPU (Multi Core) | CPU (Single Core)
Cinebench R15: CPU Multi 64Bit | CPU Single 64Bit
Blender: v2.79 BMW27 CPU
7-Zip 18.03: 7z b 4 | 7z b 4 -mmt1
Geekbench 6.7: Multi-Core | Single-Core
Geekbench 5.5: Multi-Core | Single-Core
HWBOT x265 Benchmark v2.2: 4k Preset
LibreOffice : 20 Documents To PDF
R Benchmark 2.5: Overall mean
| CPU Performance rating | |
| Dell XPS 14 Core Ultra 7 355 | |
| Average Intel Core 5 320 | |
| Dell XPS 13 DX13260 | |
| Cinebench R23 / Multi Core | |
| Dell XPS 14 Core Ultra 7 355 | |
| Dell XPS 13 DX13260 | |
| Average Intel Core 5 320 (n=1) | |
| Cinebench R23 / Single Core | |
| Dell XPS 14 Core Ultra 7 355 | |
| Dell XPS 13 DX13260 | |
| Average Intel Core 5 320 (n=1) | |
| Cinebench R20 / CPU (Multi Core) | |
| Dell XPS 14 Core Ultra 7 355 | |
| Dell XPS 13 DX13260 | |
| Average Intel Core 5 320 (n=1) | |
| Cinebench R20 / CPU (Single Core) | |
| Dell XPS 14 Core Ultra 7 355 | |
| Dell XPS 13 DX13260 | |
| Average Intel Core 5 320 (n=1) | |
| Cinebench R15 / CPU Multi 64Bit | |
| Dell XPS 14 Core Ultra 7 355 | |
| Dell XPS 13 DX13260 | |
| Average Intel Core 5 320 (n=1) | |
| Cinebench R15 / CPU Single 64Bit | |
| Dell XPS 14 Core Ultra 7 355 | |
| Dell XPS 13 DX13260 | |
| Average Intel Core 5 320 (n=1) | |
| Blender / v2.79 BMW27 CPU | |
| Dell XPS 13 DX13260 | |
| Average Intel Core 5 320 (n=1) | |
| Dell XPS 14 Core Ultra 7 355 | |
| 7-Zip 18.03 / 7z b 4 | |
| Dell XPS 14 Core Ultra 7 355 | |
| Dell XPS 13 DX13260 | |
| Average Intel Core 5 320 (n=1) | |
| 7-Zip 18.03 / 7z b 4 -mmt1 | |
| Dell XPS 14 Core Ultra 7 355 | |
| Dell XPS 13 DX13260 | |
| Average Intel Core 5 320 (n=1) | |
| Geekbench 6.7 / Multi-Core | |
| Dell XPS 14 Core Ultra 7 355 | |
| Average Intel Core 5 320 (7888 - 8122, n=3) | |
| Dell XPS 13 DX13260 | |
| Geekbench 6.7 / Single-Core | |
| Dell XPS 14 Core Ultra 7 355 | |
| Average Intel Core 5 320 (2564 - 2600, n=3) | |
| Dell XPS 13 DX13260 | |
| Geekbench 5.5 / Multi-Core | |
| Dell XPS 14 Core Ultra 7 355 | |
| Dell XPS 13 DX13260 | |
| Average Intel Core 5 320 (n=1) | |
| Geekbench 5.5 / Single-Core | |
| Dell XPS 14 Core Ultra 7 355 | |
| Dell XPS 13 DX13260 | |
| Average Intel Core 5 320 (n=1) | |
| HWBOT x265 Benchmark v2.2 / 4k Preset | |
| Dell XPS 14 Core Ultra 7 355 | |
| Dell XPS 13 DX13260 | |
| Average Intel Core 5 320 (n=1) | |
| LibreOffice / 20 Documents To PDF | |
| Dell XPS 13 DX13260 | |
| Average Intel Core 5 320 (n=1) | |
| Dell XPS 14 Core Ultra 7 355 | |
| R Benchmark 2.5 / Overall mean | |
| Dell XPS 13 DX13260 | |
| Average Intel Core 5 320 (n=1) | |
| Dell XPS 14 Core Ultra 7 355 | |
* ... smaller is better
| 3DMark Performance rating - Percent | |
| Dell XPS 14 Core Ultra 7 355 | |
| Average Intel Graphics 2 Xe3 Wildcat Lake iGPU | |
| Dell XPS 13 DX13260 | |
| 3DMark 11 - 1280x720 Performance GPU | |
| Dell XPS 14 Core Ultra 7 355 | |
| Dell XPS 13 DX13260 | |
| Average Intel Graphics 2 Xe3 Wildcat Lake iGPU (3749 - 3822, n=2) | |
| 3DMark | |
| 1920x1080 Fire Strike Graphics | |
| Dell XPS 14 Core Ultra 7 355 | |
| Average Intel Graphics 2 Xe3 Wildcat Lake iGPU (3485 - 3642, n=2) | |
| Dell XPS 13 DX13260 | |
| 2560x1440 Time Spy Graphics | |
| Dell XPS 14 Core Ultra 7 355 | |
| Average Intel Graphics 2 Xe3 Wildcat Lake iGPU (1343 - 1401, n=2) | |
| Dell XPS 13 DX13260 | |
| 2560x1440 Time Spy Score | |
| Dell XPS 14 Core Ultra 7 355 | |
| Average Intel Graphics 2 Xe3 Wildcat Lake iGPU (1513 - 1576, n=2) | |
| Dell XPS 13 DX13260 | |
 Add as a preferred source on Google


