

Intel Celeron N3050 vs Intel Core i7-7920HQ vs Intel Core i5-7300U
Intel Celeron N3050
► remove from comparison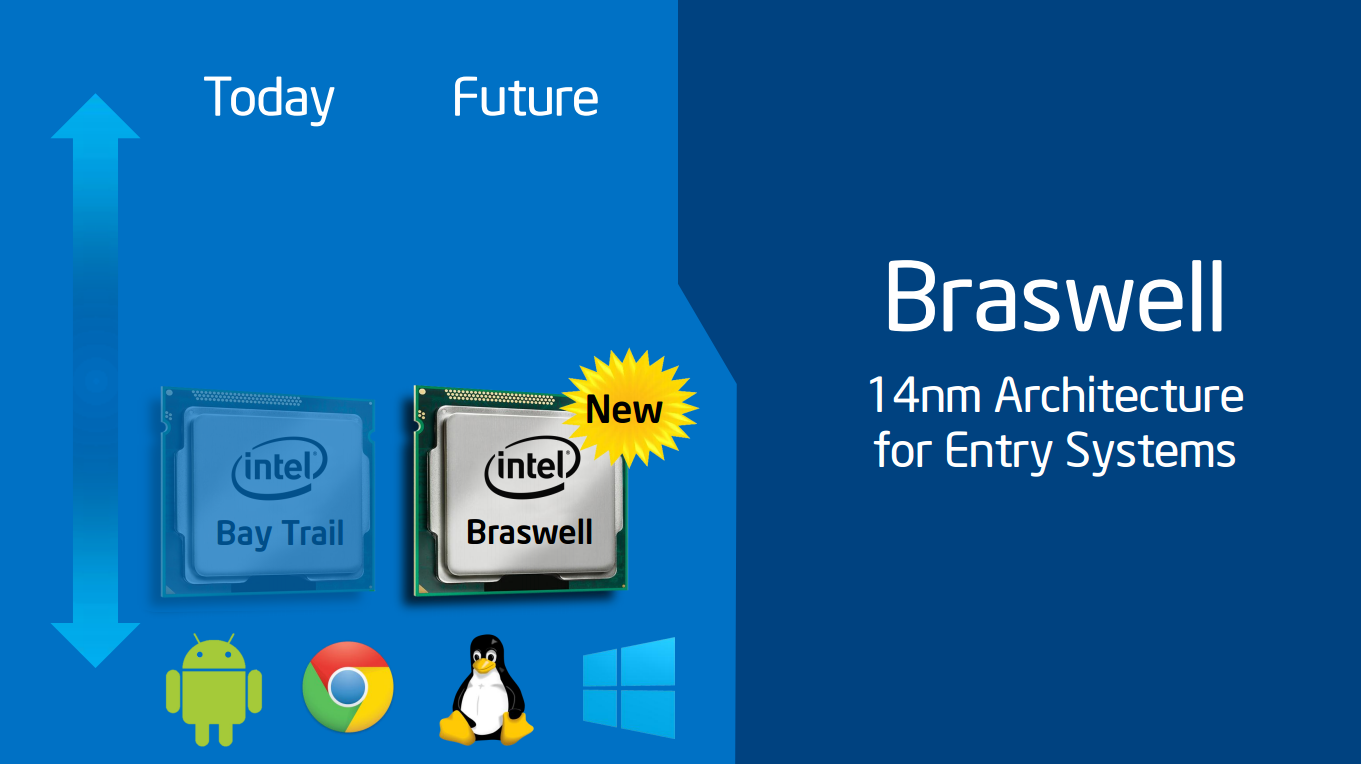
The Intel Celeron N3050 is a low-end dual-core SoC for notebooks, which has been presented in April 2015. It is clocked at 1.6 - 2.16 GHz and part of the Braswell platform. Thanks to its new 14 nanometer low-power process (P1273) with tri-gate transistors, energy efficiency has been significantly improved compared to its predecessor Bay Trail (e.g. Celeron N2840). In addition to the CPU cores, the SoC offers a DirectX 11.2-capable GPU as well as a DDR3L Memory Controller (2x 64 bit, 25.6 GB/s).
Architecture
The processor cores are based on the Airmont architecture, which is basically a slightly modified shrink of the previous Silvermont core. While performance per clock has not been improved, the more efficient 14 nm process leads to a better utilization of the CPU Burst (alias Turbo Boost) and a therefore somewhat higher overall performance.
Performance
Compared to its predecessor Celeron N2815 (1.86 - 2.13 GHz), the N3050 offers an almost identical performance. Using Windows, the CPU is adequate for simple everyday tasks such as light Internet browsing or office applications, but not for complex software or modern games.
Graphics
The HD Graphics (Braswell) is based on the Intel Gen8 architecture, which supports DirectX 11.2 and is also found in the Broadwell series (e.g. HD Graphics 5300). With 12 EUs (Execution Units) and a clock speed of up to 600 MHz, the GPU is almost twice as fast as the HD Graphics (Bay Trail), but still not powerful enough to handle modern 3D games. The GPU also supports 4K/H.265 video acceleration.
Power Consumption
The entire SoC is rated at an TDP of 6 watts (SDP 4 watts). Thus, the chip can be cooled passively.
Intel Core i7-7920HQ
► remove from comparison
The Intel Core i7-7920HQ is a fast quad-core processor for notebooks based on the Kaby Lake architecture and was announced in January 2017. It is the top model of the consumer series at the time of the announcement. Only the Xeon E3-1535M v6 is faster (100 - 200 MHz higher Turbo clocks). Besides four cores including Hyper-Threading support running at 3.1-4.1 GHz (4 cores up to 3.7 GHz, 2 cores up to 3.9 GHz), the processor is also equipped with the HD Graphics 630 GPU as well as a dual-channel memory controller (DDR3L-1600/DDR4-2400). It is manufactured in a 14nm process with FinFET transistors.
Architecture
Intel basically uses the same micro architecture compared to Skylake, so the per-MHz performance does not differ. The manufacturer only reworked the Speed Shift technology for faster dynamic adjustments of voltages and clocks, and the improved 14nm process allows much higher frequencies combined with better efficiency than before.
Performance
The performance is a bit higher compared to the Skylake predecessor Core i7-6920HQ (2.9-3.8 GHz) thanks to slightly higher clocks (up to 7.9%), so it is the fastest mobile consumer processor in the beginning of 2017 (mobile Xeon E5-1535M v6 has even higher Turbo clocks). The performance is sufficient even for very demanding tasks and on par with powerful desktop quad-core processors.
Graphics
The integrated Intel HD Graphics 630 has 24 Execution Units (similar to previous HD Graphics 530) running at 350 - 1100 MHz. The performance depends a lot on the memory configuration; it should be comparable to a dedicated Nvidia GeForce 920M in combination with fast DDR4-2133 dual-channel memory.
Contrary to Skylake, Kaby Lake now supports hardware decoding for H.265/HEVC Main 10 with a 10-bit color depth as well as Google's VP9 codec. The dual-core Kaby Lake processors, which were announced in January, should also support HDCP 2.2.
Power Consumption
The chip is manufactured in an improved 14nm process with FinFET transistors, which improves the efficiency even further. Intel still specifies the TDP with 45 Watts, but it can also be reduced to 35 Watts by the notebook manufacturers (cTDP down). This will obviously affect the performance, because the Turbo Boost cannot be maintained for longer periods.
Intel Core i5-7300U
► remove from comparison
The Intel Core i5-7300U is a fast dual-core processor for notebooks based on the Kaby Lake architecture and was announced in January 2017. It integrates 2 CPU cores with Hyper-Threading support clocked at 2.6 - 3.5 GHz (2 core Turbo also 3.5 GHz). Besides two cores, the processor is also equipped with the HD Graphics 620 GPU as well as a dual-channel memory controller (DDR3L-1600/DDR4-2400). It is manufactured in a 14nm process with FinFET transistors.
Architecture
Intel basically uses the same micro architecture compared to Skylake, so the per-MHz performance does not differ. The manufacturer only reworked the Speed Shift technology for faster dynamic adjustments of voltages and clocks, and the improved 14nm process allows much higher frequencies combined with better efficiency than before.
Performance
With 2.5 to 3.5 GHz, the Core i5-7300U clocks significantly higher than the old Core i5-7200U (2.5 - 3.1) and Core i5-6200U (2.3 - 2.8 GHz). Thanks to the fast Turbo frequency, the performance should be slightly below to the Core i7-7500U (2.7 - 3.5 GHz, but 4 MB L3 cache). Therfore, the performance is sufficient for demanding tasks.
Graphics
The integrated Intel HD Graphics 620 has 24 Execution Units (similar to previous HD Graphics 520) running at 300 - 1100 MHz. The performance depends a lot on the memory configuration; it should be comparable to a dedicated Nvidia GeForce 920M in combination with fast DDR4-2133 dual-channel memory.
Contrary to Skylake, Kaby Lake now supports hardware decoding for H.265/HEVC Main 10 with a 10-bit color depth as well as Google's VP9 codec. The dual-core Kaby Lake processors, which were announced in January, should also support HDCP 2.2.
Power Consumption
The chip is manufactured in an improved 14nm process with FinFET transistors, which improves the efficiency even further. Intel still specifies the TDP with 15 Watts, but it can also be reduced to 7.5 Watts by the notebook manufacturers (cTDP down). This will obviously affect the performance, because the Turbo Boost cannot be maintained for longer periods.
| Model | Intel Celeron N3050 | Intel Core i7-7920HQ | Intel Core i5-7300U | ||||||||||||||||||||||||||||||||||||||||||||||||||||||||||||||||||||||||||||||||||||||||||||||||||||||||||||||||||||||||||||||||||||||||||||||||||||||||||||||||||||||||||||||||||||||||||||||||||||||||||||||||||||||||||||||||||||||||||||||||||||||||||||||||||||||||||||||||||||||||||||||||||||||||||||||||||||||||||||||||||||||||||||||||||||||||||||||||||||
| Codename | Braswell | Kaby Lake | Kaby Lake | ||||||||||||||||||||||||||||||||||||||||||||||||||||||||||||||||||||||||||||||||||||||||||||||||||||||||||||||||||||||||||||||||||||||||||||||||||||||||||||||||||||||||||||||||||||||||||||||||||||||||||||||||||||||||||||||||||||||||||||||||||||||||||||||||||||||||||||||||||||||||||||||||||||||||||||||||||||||||||||||||||||||||||||||||||||||||||||||||||||
| Series | Intel Celeron | Intel Kaby Lake | Intel Kaby Lake | ||||||||||||||||||||||||||||||||||||||||||||||||||||||||||||||||||||||||||||||||||||||||||||||||||||||||||||||||||||||||||||||||||||||||||||||||||||||||||||||||||||||||||||||||||||||||||||||||||||||||||||||||||||||||||||||||||||||||||||||||||||||||||||||||||||||||||||||||||||||||||||||||||||||||||||||||||||||||||||||||||||||||||||||||||||||||||||||||||||
| Series: Kaby Lake Kaby Lake |
|
|
| ||||||||||||||||||||||||||||||||||||||||||||||||||||||||||||||||||||||||||||||||||||||||||||||||||||||||||||||||||||||||||||||||||||||||||||||||||||||||||||||||||||||||||||||||||||||||||||||||||||||||||||||||||||||||||||||||||||||||||||||||||||||||||||||||||||||||||||||||||||||||||||||||||||||||||||||||||||||||||||||||||||||||||||||||||||||||||||||||||||
| Clock | 1600 - 2160 MHz | 3100 - 4100 MHz | 2600 - 3500 MHz | ||||||||||||||||||||||||||||||||||||||||||||||||||||||||||||||||||||||||||||||||||||||||||||||||||||||||||||||||||||||||||||||||||||||||||||||||||||||||||||||||||||||||||||||||||||||||||||||||||||||||||||||||||||||||||||||||||||||||||||||||||||||||||||||||||||||||||||||||||||||||||||||||||||||||||||||||||||||||||||||||||||||||||||||||||||||||||||||||||||
| L2 Cache | 2 MB | 1 MB | 512 KB | ||||||||||||||||||||||||||||||||||||||||||||||||||||||||||||||||||||||||||||||||||||||||||||||||||||||||||||||||||||||||||||||||||||||||||||||||||||||||||||||||||||||||||||||||||||||||||||||||||||||||||||||||||||||||||||||||||||||||||||||||||||||||||||||||||||||||||||||||||||||||||||||||||||||||||||||||||||||||||||||||||||||||||||||||||||||||||||||||||||
| Cores / Threads | 2 / 2 | 4 / 8 | 2 / 4 | ||||||||||||||||||||||||||||||||||||||||||||||||||||||||||||||||||||||||||||||||||||||||||||||||||||||||||||||||||||||||||||||||||||||||||||||||||||||||||||||||||||||||||||||||||||||||||||||||||||||||||||||||||||||||||||||||||||||||||||||||||||||||||||||||||||||||||||||||||||||||||||||||||||||||||||||||||||||||||||||||||||||||||||||||||||||||||||||||||||
| TDP | 6 Watt | 45 Watt | 15 Watt | ||||||||||||||||||||||||||||||||||||||||||||||||||||||||||||||||||||||||||||||||||||||||||||||||||||||||||||||||||||||||||||||||||||||||||||||||||||||||||||||||||||||||||||||||||||||||||||||||||||||||||||||||||||||||||||||||||||||||||||||||||||||||||||||||||||||||||||||||||||||||||||||||||||||||||||||||||||||||||||||||||||||||||||||||||||||||||||||||||||
| Technology | 14 nm | 14 nm | 14 nm | ||||||||||||||||||||||||||||||||||||||||||||||||||||||||||||||||||||||||||||||||||||||||||||||||||||||||||||||||||||||||||||||||||||||||||||||||||||||||||||||||||||||||||||||||||||||||||||||||||||||||||||||||||||||||||||||||||||||||||||||||||||||||||||||||||||||||||||||||||||||||||||||||||||||||||||||||||||||||||||||||||||||||||||||||||||||||||||||||||||
| max. Temp. | 90 °C | 100 °C | 100 °C | ||||||||||||||||||||||||||||||||||||||||||||||||||||||||||||||||||||||||||||||||||||||||||||||||||||||||||||||||||||||||||||||||||||||||||||||||||||||||||||||||||||||||||||||||||||||||||||||||||||||||||||||||||||||||||||||||||||||||||||||||||||||||||||||||||||||||||||||||||||||||||||||||||||||||||||||||||||||||||||||||||||||||||||||||||||||||||||||||||||
| Socket | FCBGA1170 | BGA1356 | |||||||||||||||||||||||||||||||||||||||||||||||||||||||||||||||||||||||||||||||||||||||||||||||||||||||||||||||||||||||||||||||||||||||||||||||||||||||||||||||||||||||||||||||||||||||||||||||||||||||||||||||||||||||||||||||||||||||||||||||||||||||||||||||||||||||||||||||||||||||||||||||||||||||||||||||||||||||||||||||||||||||||||||||||||||||||||||||||||||
| Features | Intel HD Graphics (Braswell, 12 EUs, 320 - 600 MHz), Wireless Display, Quick Sync, AES-NI, max. 8 GB Dual-Channel DDR3L-1600 (25,6 GB/s), 5x USB 3.0, 4x PCIe 2.0, 2x SATA 6.0 Gbit/s | Dual-Channel DDR4 Memory Controller, HyperThreading, AVX, AVX2, Quick Sync, Virtualization, AES-NI | Dual-Channel DDR4 Memory Controller, HyperThreading, AVX, AVX2, Quick Sync, Virtualization, AES-NI | ||||||||||||||||||||||||||||||||||||||||||||||||||||||||||||||||||||||||||||||||||||||||||||||||||||||||||||||||||||||||||||||||||||||||||||||||||||||||||||||||||||||||||||||||||||||||||||||||||||||||||||||||||||||||||||||||||||||||||||||||||||||||||||||||||||||||||||||||||||||||||||||||||||||||||||||||||||||||||||||||||||||||||||||||||||||||||||||||||||
| iGPU | Intel HD Graphics (Braswell) (320 - 600 MHz) | Intel HD Graphics 630 (300 - 1150 MHz) | Intel HD Graphics 620 (300 - 1100 MHz) | ||||||||||||||||||||||||||||||||||||||||||||||||||||||||||||||||||||||||||||||||||||||||||||||||||||||||||||||||||||||||||||||||||||||||||||||||||||||||||||||||||||||||||||||||||||||||||||||||||||||||||||||||||||||||||||||||||||||||||||||||||||||||||||||||||||||||||||||||||||||||||||||||||||||||||||||||||||||||||||||||||||||||||||||||||||||||||||||||||||
| Architecture | x86 | x86 | x86 | ||||||||||||||||||||||||||||||||||||||||||||||||||||||||||||||||||||||||||||||||||||||||||||||||||||||||||||||||||||||||||||||||||||||||||||||||||||||||||||||||||||||||||||||||||||||||||||||||||||||||||||||||||||||||||||||||||||||||||||||||||||||||||||||||||||||||||||||||||||||||||||||||||||||||||||||||||||||||||||||||||||||||||||||||||||||||||||||||||||
| $107 U.S. | $378 U.S. | $281 U.S. | |||||||||||||||||||||||||||||||||||||||||||||||||||||||||||||||||||||||||||||||||||||||||||||||||||||||||||||||||||||||||||||||||||||||||||||||||||||||||||||||||||||||||||||||||||||||||||||||||||||||||||||||||||||||||||||||||||||||||||||||||||||||||||||||||||||||||||||||||||||||||||||||||||||||||||||||||||||||||||||||||||||||||||||||||||||||||||||||||||||
| Announced | |||||||||||||||||||||||||||||||||||||||||||||||||||||||||||||||||||||||||||||||||||||||||||||||||||||||||||||||||||||||||||||||||||||||||||||||||||||||||||||||||||||||||||||||||||||||||||||||||||||||||||||||||||||||||||||||||||||||||||||||||||||||||||||||||||||||||||||||||||||||||||||||||||||||||||||||||||||||||||||||||||||||||||||||||||||||||||||||||||||||
| Manufacturer | ark.intel.com | ||||||||||||||||||||||||||||||||||||||||||||||||||||||||||||||||||||||||||||||||||||||||||||||||||||||||||||||||||||||||||||||||||||||||||||||||||||||||||||||||||||||||||||||||||||||||||||||||||||||||||||||||||||||||||||||||||||||||||||||||||||||||||||||||||||||||||||||||||||||||||||||||||||||||||||||||||||||||||||||||||||||||||||||||||||||||||||||||||||||
| L1 Cache | 256 KB | 128 KB | |||||||||||||||||||||||||||||||||||||||||||||||||||||||||||||||||||||||||||||||||||||||||||||||||||||||||||||||||||||||||||||||||||||||||||||||||||||||||||||||||||||||||||||||||||||||||||||||||||||||||||||||||||||||||||||||||||||||||||||||||||||||||||||||||||||||||||||||||||||||||||||||||||||||||||||||||||||||||||||||||||||||||||||||||||||||||||||||||||||
| L3 Cache | 8 MB | 3 MB |

Benchmarks
Average Benchmarks Intel Celeron N3050 → 100% n=22
Average Benchmarks Intel Core i7-7920HQ → 808% n=22
Average Benchmarks Intel Core i5-7300U → 455% n=22
* Smaller numbers mean a higher performance
1 This benchmark is not used for the average calculation