MSI PS63 vs. Dell XPS 15: MSI still has some ways to go
MSI has been sitting comfortably in its gaming laptop space for years. The MSI PS63, however, represents the company's first move into the traditional 15.6-inch Ultrabook space dominated by the likes of the Dell XPS 15, Asus ZenBook UX580, and HP Spectre x360 15. How does MSI's Ultrabook compare to the most popular 15.6-inch Ultrabook available?
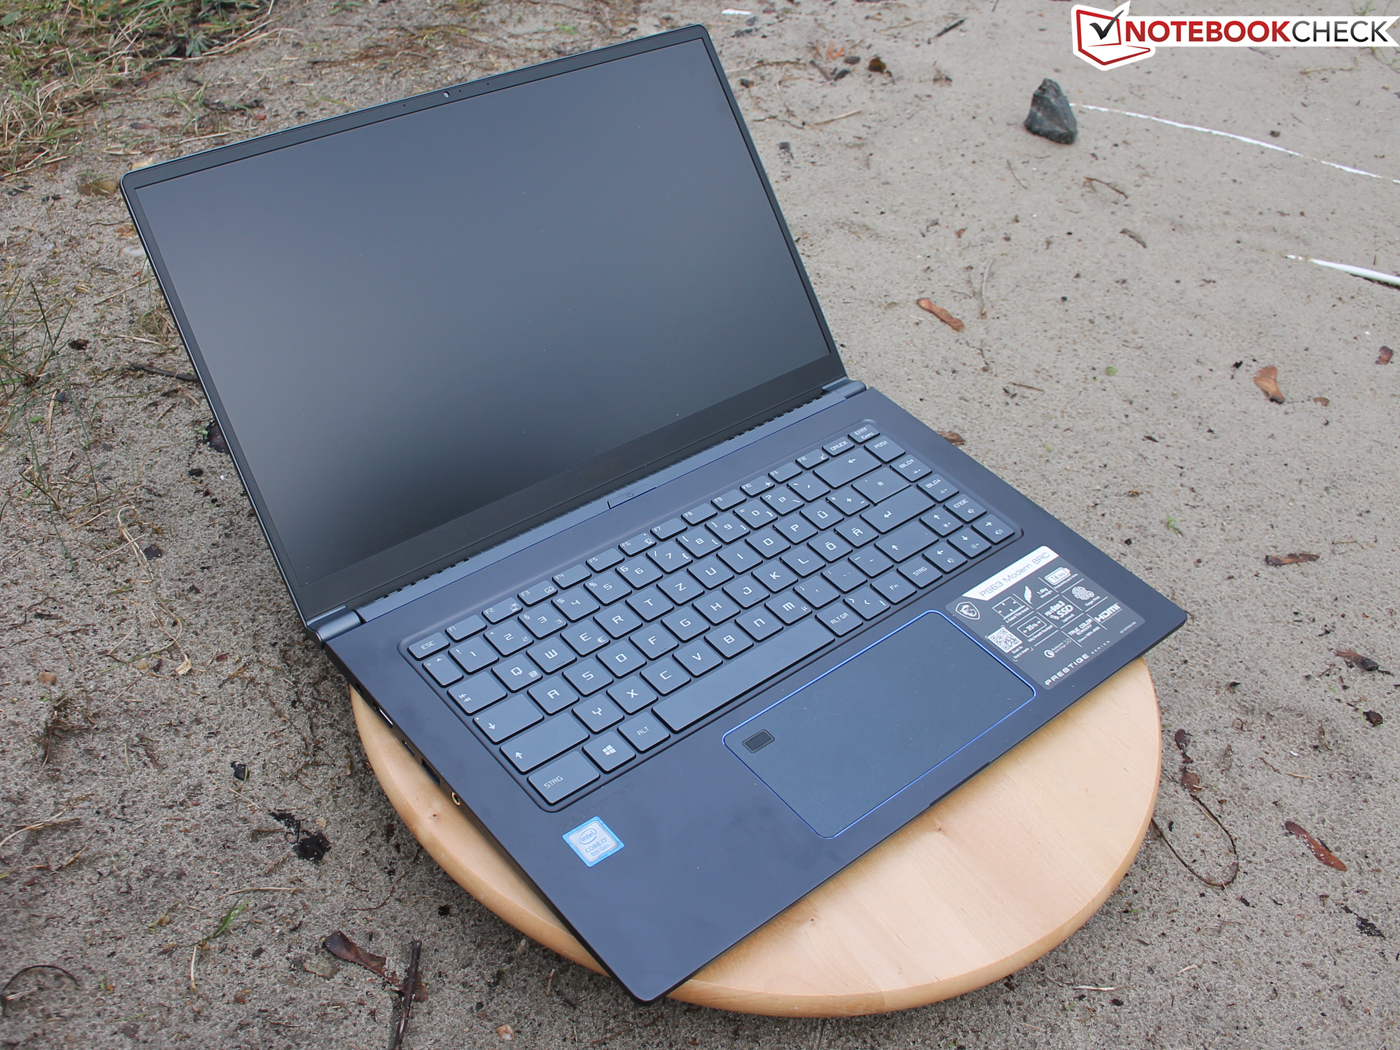
Chassis Quality
Consequential or not, the dimensions of the MSI PS63 are nearly identical to the XPS 15 but just over 1 mm thinner. MSI's major advantage lies in weight as the laptop is 300 g lighter than the Dell equivalent.
Dell still has the upper hand in chassis rigidity. Its lid is especially stronger than the more flexible lid of the MSI laptop.
CPU Performance
MSI utilizes a 15 W CPU compared to the 45 W CPUs on the Dell XPS 15 9560/9570. Thus, even the last generation Core i7-7700HQ in the XPS 15 9560 is faster than what the newer i7-8565U in the PS63 is capable of. CineBench R15 Multi-Thread shows a performance boost of 30 percent and 110 percent when moving from the MSI to the i7-7700HQ and i7-8750H in the XPS 15 9560 and 9570, respectively.
GPU Performance
The GeForce GTX 1050 Max-Q in the PS63 is the lowest-end Max-Q GPU in Nvidia's GTX lineup. Fire Strike ranks it about 5 to 10 percent slower than the standard GTX 1050 and about 20 percent slower than the GTX 1050 Ti Max-Q in the fastest XPS 15 9570 configuration.
Fan Noise
Fan noise is significantly quieter on the MSI than on the Dell. This becomes especially apparent when running higher loads like gaming or heavy video editing and encoding.
Display
Both brightness and sRGB color coverage are lower on the MSI laptop when compared to the Dell. If outdoor visibility and color accuracy are top concerns, then the Dell would be a better option.
Battery Life
Runtimes are generally longer than the XPS 15 by an hour or more depending on the battery size of the Dell laptop (56 Wh or 97 Wh). In fact, WLAN battery life can be nearly twice as long as the XPS 15 56 Wh version (11 hours vs. 5.6 hours).
Ports
The biggest difference between the two laptops in terms of ports is the lack of Thunderbolt 3 on the MSI. Additionally, the MSI laptop relies on a MicroSD reader whereas the Dell has a faster full-size SD reader.
Conclusion
MSI's decision to use a U-class ULV CPU compared to the H-class series on the Dell has resulted in some interesting advantages and disadvantages. CPU performance is certainly slower, but the overall package is noticeably lighter, quieter, and longer lasting.
Outside of performance, there are a handful of aspects where MSI still falls short. The lid is weaker and more flexible, the system lacks Thunderbolt 3, SD reader transfer rates are slower, the display is dimmer, and color coverage is narrower. Even so, we're not expecting a first-generation MSI Ultrabook to instantly outperform the venerable XPS 15 series and we're hopeful that a future second-generation model can address all of these pitfalls and more.
We recommend checking out our full reviews on the MSI PS63 and Dell XPS 15 9560/9570 below for more detailed information on each.
| 3DMark 11 - 1280x720 Performance GPU | |
| Dell XPS 15 9575 i7-8705G | |
| Dell XPS 15 9575 i5-8305G | |
| Dell XPS 15 9570 i7 UHD | |
| Dell XPS 15 2017 9560 (7300HQ, Full-HD) | |
| Dell XPS 15 2018 i5 FHD 97Wh | |
| MSI PS63 Modern 8RC | |
| MSI PS63 Modern 8RC i7-8565U, GeForce GTX 1050 Max-Q, WDC PC SN520 SDAPNUW-512G, IPS, 1920x1080, 15.6" | Dell XPS 15 2018 i5 FHD 97Wh i5-8300H, GeForce GTX 1050 Mobile, Lite-On CA3-8D256-Q11, LED IGZO IPS InfinityEdge, 1920x1080, 15.6" | Dell XPS 15 9575 i7-8705G i7-8705G, Vega M GL / 870, SK hynix PC401 NVMe 500 GB, IPS, 3840x2160, 15.6" | Dell XPS 15 9560 (i7-7700HQ, UHD) i7-7700HQ, GeForce GTX 1050 Mobile, Lite-On CX2-8B512-Q11, IGZO IPS, 3840x2160, 15.6" | Dell XPS 15 2017 9560 (7300HQ, Full-HD) i5-7300HQ, GeForce GTX 1050 Mobile, WDC WD10SPCX-75KHST0 + SanDisk Z400s M.2 2242 32 GB Cache, LED IGZO IPS InfinityEdge, 1920x1080, 15.6" | Dell XPS 15 9570 i7 UHD i7-8750H, GeForce GTX 1050 Ti Max-Q, Toshiba XG5 KXG50ZNV512G, IPS, 3840x2160, 15.6" | |
|---|---|---|---|---|---|---|
| Power Consumption | ||||||
| Idle Minimum * (Watt) | 6.8 | 2.9 | 6.2 | 11.9 | 6.6 | 9.48 |
| Idle Average * (Watt) | 9.8 | 5.8 | 12.9 | 17.1 | 9 | 16.1 |
| Idle Maximum * (Watt) | 11.4 | 7.5 | 13.6 | 17.3 | 10.7 | 16.9 |
| Load Average * (Watt) | 76 | 77.5 | 76.1 | 94.7 | 77.5 | 90.8 |
| Load Maximum * (Watt) | 93 | 107 | 99.4 | 122 | 130 | 134.4 |
| Witcher 3 ultra * (Watt) | 84 | 84.3 | 104.8 |
* ... smaller is better
| MSI PS63 Modern 8RC i7-8565U, GeForce GTX 1050 Max-Q, 82 Wh | Dell XPS 15 2018 i5 FHD 97Wh i5-8300H, GeForce GTX 1050 Mobile, 97 Wh | Dell XPS 15 9575 i7-8705G i7-8705G, Vega M GL / 870, 75 Wh | Dell XPS 15 9560 (i7-7700HQ, UHD) i7-7700HQ, GeForce GTX 1050 Mobile, 97 Wh | Dell XPS 15 2017 9560 (7300HQ, Full-HD) i5-7300HQ, GeForce GTX 1050 Mobile, 56 Wh | Dell XPS 15 9570 i7 UHD i7-8750H, GeForce GTX 1050 Ti Max-Q, 97 Wh | |
|---|---|---|---|---|---|---|
| Battery runtime | ||||||
| Reader / Idle (h) | 14 | 11.2 | 13.9 | 9.4 | ||
| WiFi v1.3 (h) | 11.4 | 15.7 | 7 | 7.2 | 5.6 | 9.6 |
| Load (h) | 2.8 | 1.9 | 1.1 | 1.7 | 1.4 | 1.3 |
| Witcher 3 ultra (h) | 1 | 1 | ||||
| H.264 (h) | 12.3 |
| MSI PS63 Modern 8RC Chi Mei CMN15E8 N156HCE/EN1, , 1920x1080, 15.6" | Dell XPS 15 2018 i5 FHD 97Wh Sharp SHP149A LQ156M1, , 1920x1080, 15.6" | Dell XPS 15 9575 i7-8705G Sharp SHP148D, , 3840x2160, 15.6" | Dell XPS 15 9560 (i7-7700HQ, UHD) 3840x2160, 15.6" | Dell XPS 15 2017 9560 (7300HQ, Full-HD) Sharp SHP1453 LQ156M1, , 1920x1080, 15.6" | Dell XPS 15 9570 i7 UHD LQ156D1, , 3840x2160, 15.6" | |
|---|---|---|---|---|---|---|
| Display | ||||||
| Display P3 Coverage (%) | 63.5 | 66 | 78.7 | 89.7 | 68.9 | 79.1 |
| sRGB Coverage (%) | 87.9 | 96.5 | 97.9 | 100 | 98.9 | 98.8 |
| AdobeRGB 1998 Coverage (%) | 63.9 | 66.7 | 79.2 | 100 | 70.9 | 79.2 |
| Response Times | ||||||
| Response Time Grey 50% / Grey 80% * (ms) | 42 ? | 49 ? | 48.4 ? | 57.2 ? | 54 ? | 46.4 ? |
| Response Time Black / White * (ms) | 32 ? | 30 ? | 34.8 ? | 39.2 ? | 52.4 ? | 32 ? |
| PWM Frequency (Hz) | 25000 ? | 961 ? | 1000 ? | 962 | 980 ? | |
| Screen | ||||||
| Brightness middle (cd/m²) | 289 | 413 | 488 | 370.1 | 400 | 494 |
| Brightness (cd/m²) | 262 | 378 | 440 | 356 | 392 | 457 |
| Brightness Distribution (%) | 75 | 86 | 81 | 87 | 89 | 88 |
| Black Level * (cd/m²) | 0.26 | 0.29 | 0.3 | 0.37 | 0.26 | 0.34 |
| Contrast (:1) | 1112 | 1424 | 1627 | 1000 | 1538 | 1453 |
| Colorchecker dE 2000 * | 2.9 | 2.44 | 3.16 | 5.3 | 4.9 | 5.2 |
| Colorchecker dE 2000 max. * | 5.71 | 4.46 | 8.8 | 9.9 | 11 | 17.5 |
| Colorchecker dE 2000 calibrated * | 2.88 | 2.48 | ||||
| Greyscale dE 2000 * | 1.42 | 2.48 | 3.3 | 4.6 | 7.2 | 2.7 |
| Gamma | 2.39 92% | 2.43 91% | 2.178 101% | 2.31 95% | 2.11 104% | 2.1 105% |
| CCT | 6705 97% | 7006 93% | 6811 95% | 6284 103% | 6911 94% | 7038 92% |
| Color Space (Percent of AdobeRGB 1998) (%) | 57 | 62 | 71.7 | 88.3 | 64.2 | 71.2 |
| Color Space (Percent of sRGB) (%) | 87 | 96 | 97.9 | 100 | 98.9 | 98.8 |
| Total Average (Program / Settings) |
* ... smaller is better
| MSI PS63 Modern 8RC GeForce GTX 1050 Max-Q, i7-8565U, WDC PC SN520 SDAPNUW-512G | Dell XPS 15 2018 i5 FHD 97Wh GeForce GTX 1050 Mobile, i5-8300H, Lite-On CA3-8D256-Q11 | Dell XPS 15 9575 i7-8705G Vega M GL / 870, i7-8705G, SK hynix PC401 NVMe 500 GB | Dell XPS 15 9560 (i7-7700HQ, UHD) GeForce GTX 1050 Mobile, i7-7700HQ, Lite-On CX2-8B512-Q11 | Dell XPS 15 2017 9560 (7300HQ, Full-HD) GeForce GTX 1050 Mobile, i5-7300HQ, WDC WD10SPCX-75KHST0 + SanDisk Z400s M.2 2242 32 GB Cache | Dell XPS 15 9570 i7 UHD GeForce GTX 1050 Ti Max-Q, i7-8750H, Toshiba XG5 KXG50ZNV512G | |
|---|---|---|---|---|---|---|
| Noise | ||||||
| off / environment * (dB) | 30.4 | 30.3 | 28.2 | 28.4 | 30.3 | 29.9 |
| Idle Minimum * (dB) | 30.7 | 30.3 | 28.2 | 29 | 31.6 | 29.9 |
| Idle Average * (dB) | 30.7 | 30.3 | 28.2 | 29 | 31.6 | 29.9 |
| Idle Maximum * (dB) | 30.7 | 30.3 | 28.2 | 32.2 | 33.4 | 30.3 |
| Load Average * (dB) | 34 | 37.1 | 29 | 47.1 | 47.8 | 36.5 |
| Load Maximum * (dB) | 33.7 | 43 | 47.4 | 47.1 | 47.8 | 40.4 |
| Witcher 3 ultra * (dB) | 43.3 | 44.7 | 52 | 40.4 |
* ... smaller is better
Source(s)
