MSI GS75 vs. Asus Zephyrus S GX701: 10 percent performance difference from the same RTX 2080 Max-Q GPU
MSI and Asus are the two biggest OEMs to beat when it comes to gaming laptops. Last we checked, the two Taiwanese manufacturers account for roughly half of all gaming laptops sold worldwide.
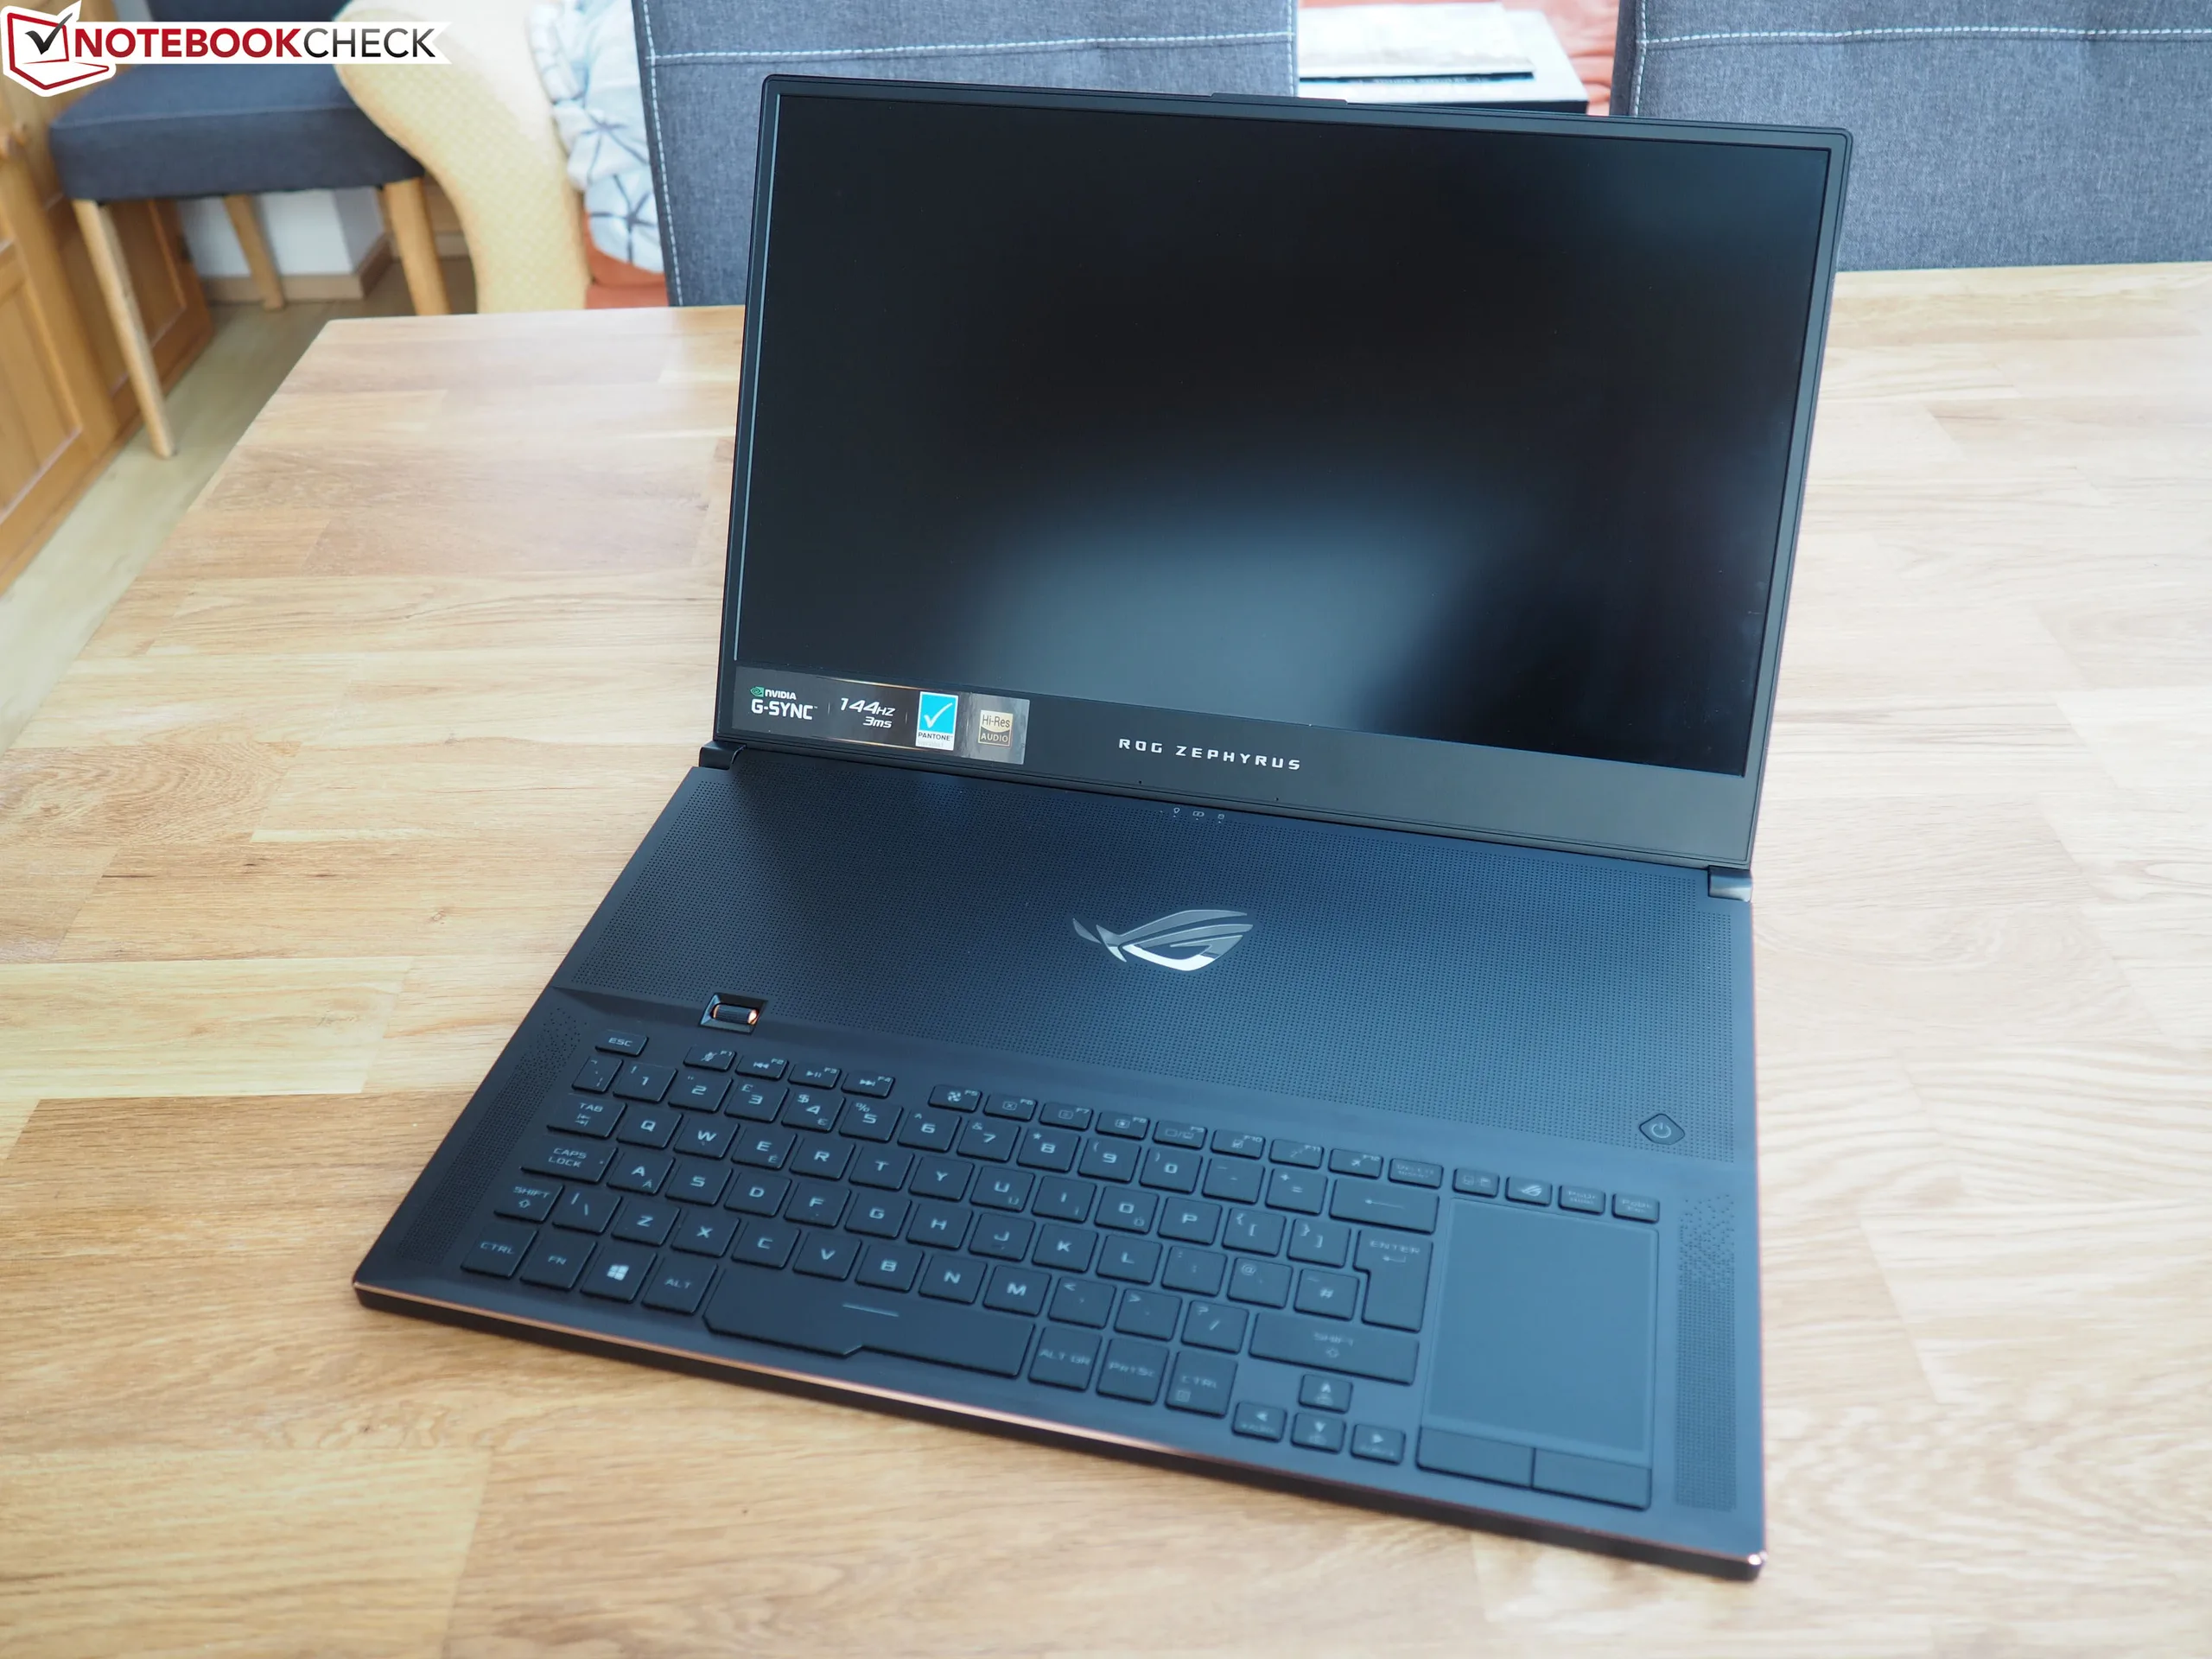
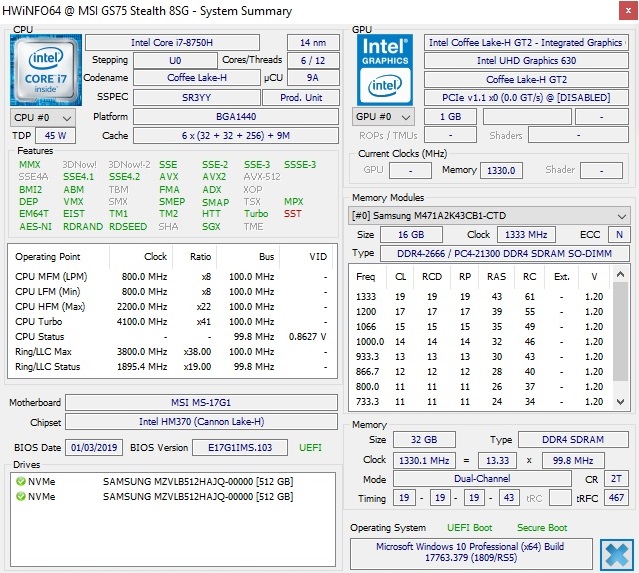
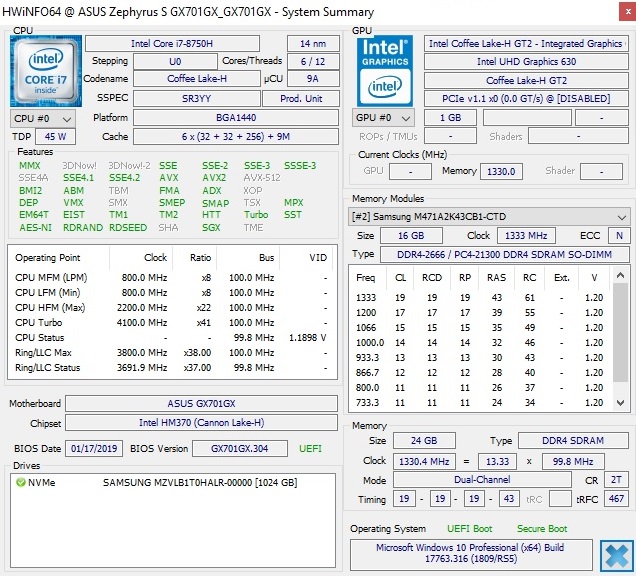
The two laptops we're comparing here today are the 17.3-inch MSI GS75 and Asus Zephyrus S GX701GX. Both systems carry the same Core i7-8750H CPU and RTX 2080 Max-Q GPU but they are otherwise very different in almost every other aspect. We describe the major performance differences below to help those who may be on the fence between these superthin models.
| MSI GS75 8SG | Asus Zephyrus S GX701GX | |
|---|---|---|
| CPU | Core i7-8750H | Core i7-8750H |
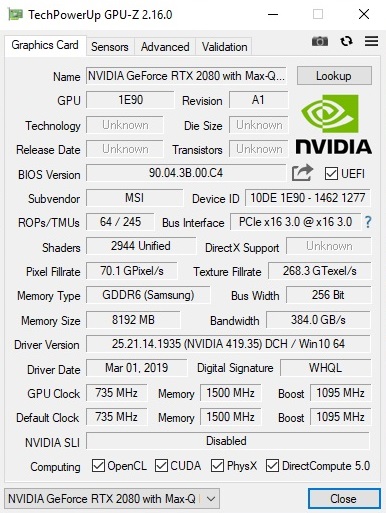
| GPU | GeForce RTX 2080 Max-Q (735 MHz) | GeForce RTX 2080 Max-Q (990 MHz) |
| Display | 17.3-inch, 144 Hz, 1080p, CMN175C, Optimus, no G-Sync | 17.3-inch, 144 Hz, 1080p, AUO409D, G-Sync, Optimus |
| RAM | 32 GB DDR4-2666 (2x SODIMM) | 24 GB DDR4-2666 (8 GB soldered, 1x SODIMM) |
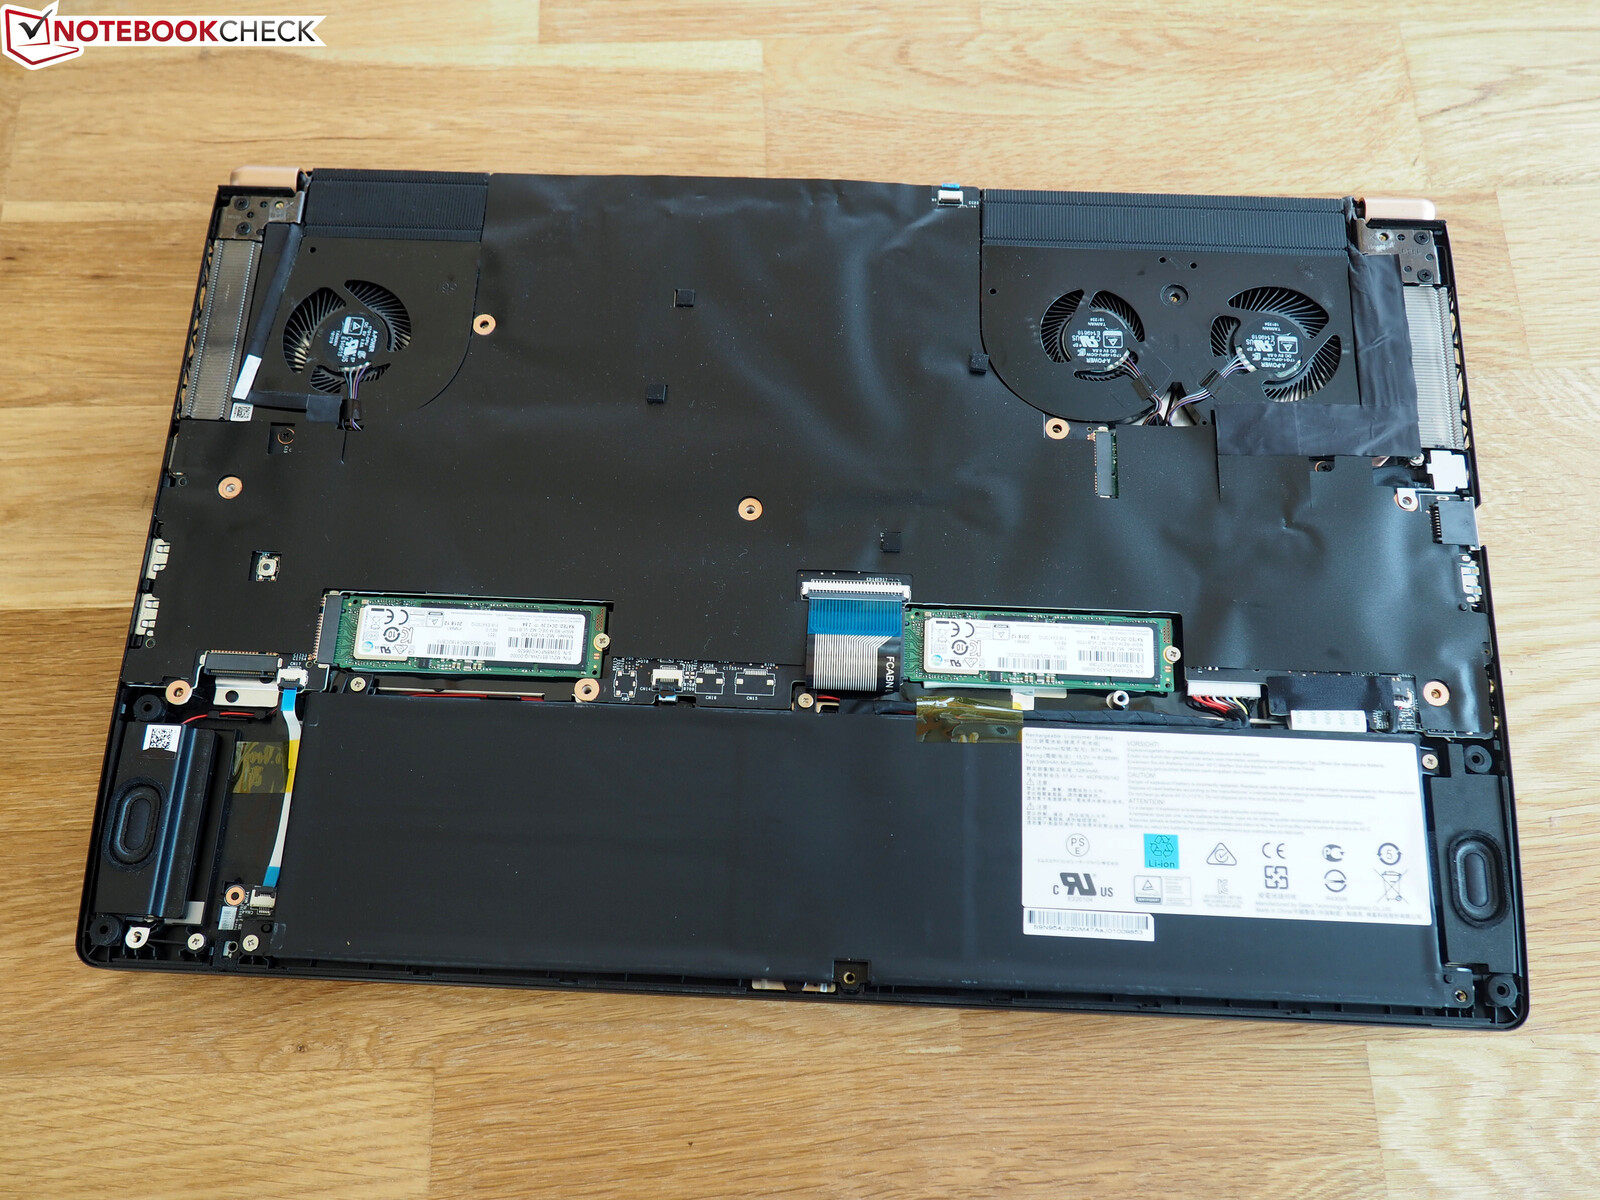
| Storage | 3x M.2 2280 | 2x M.2 2280 |
| Battery | 80.25 Wh | 76 Wh |
| Ports | 3x USB Type-A, 2x USB Type-C Gen. 2 (1x Thunderbolt 3), HDMI 2.0, RJ-45, 3.5 microphone, 3.5 mm earphones | 3x USB Type-A, 2x USB Type-C (1x Gen. 2), HDMI 2.0, 3.5 mm combo audio |
| Dimensions | 19 x 396 x 259 mm | 19 x 399 x 272 mm |
| Weight | 2.28 kg | 2.64 kg |
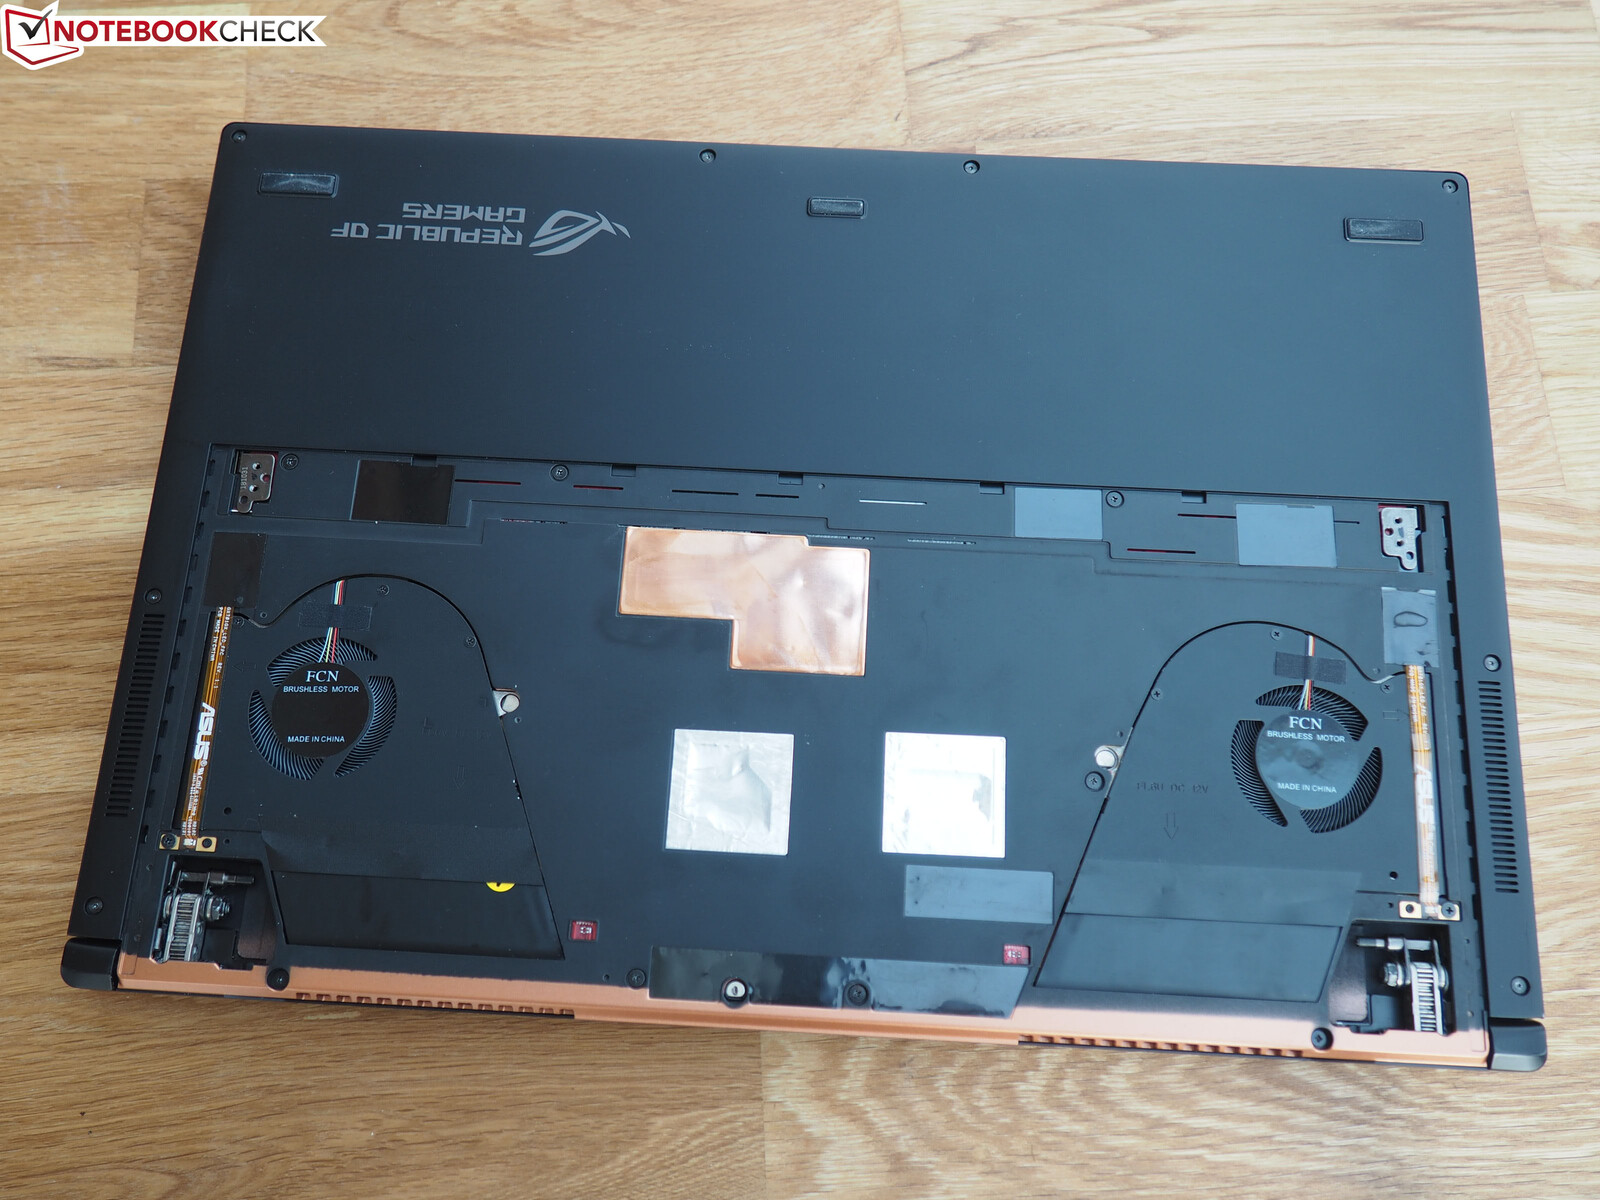
Case
The MSI system is both lighter (2.3 kg vs. 2.6 kg) and with a slightly smaller footprint (1025 cm2 vs. 1085 cm2). Both models, however, are the same thickness at 19 mm. We find the base of the Asus to be less flexible than on the MSI.
CPU Performance
The CPU in the Asus performs about 11 percent faster than the same CPU in the MSI according to CineBench R15 Multi-Thread. In other words, the Asus is able to maintain faster core clock rates than the MSI. Asus holds the performance lead even after accounting for throttling as shown by our CineBench R15 loop test below.
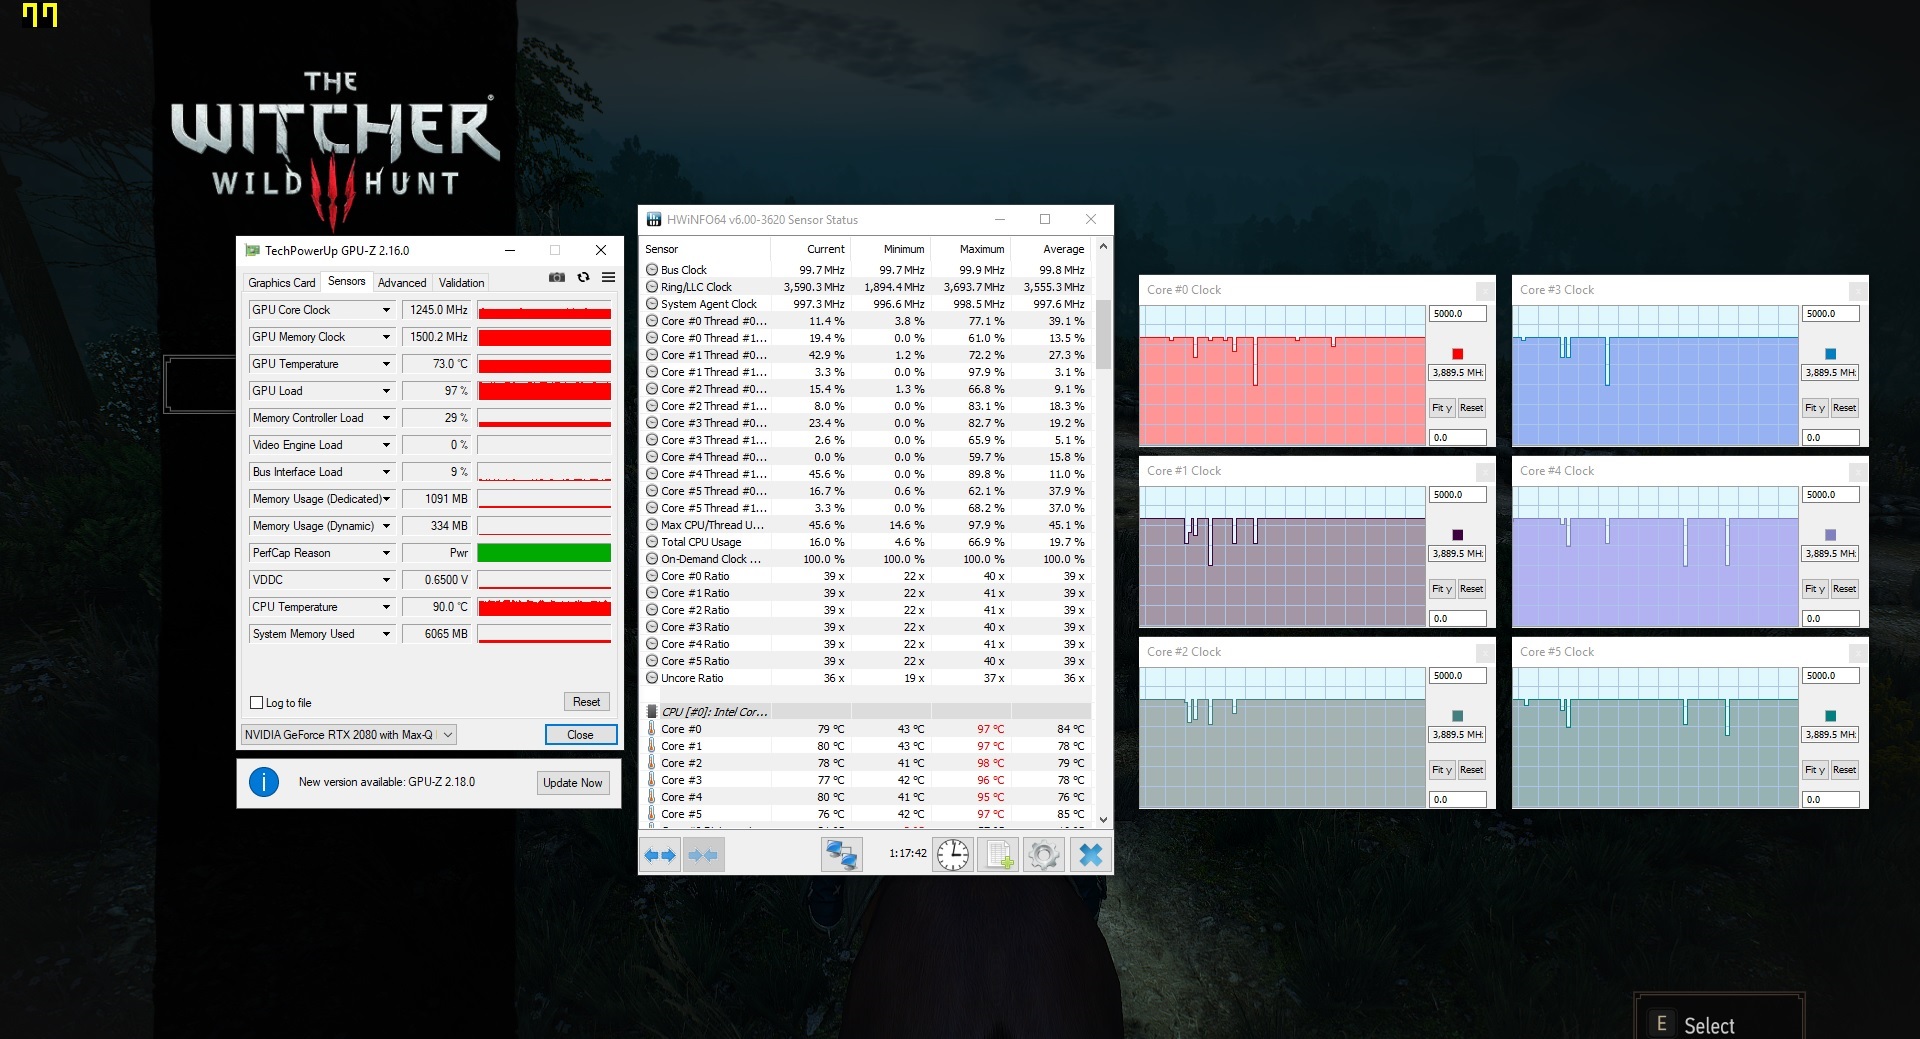
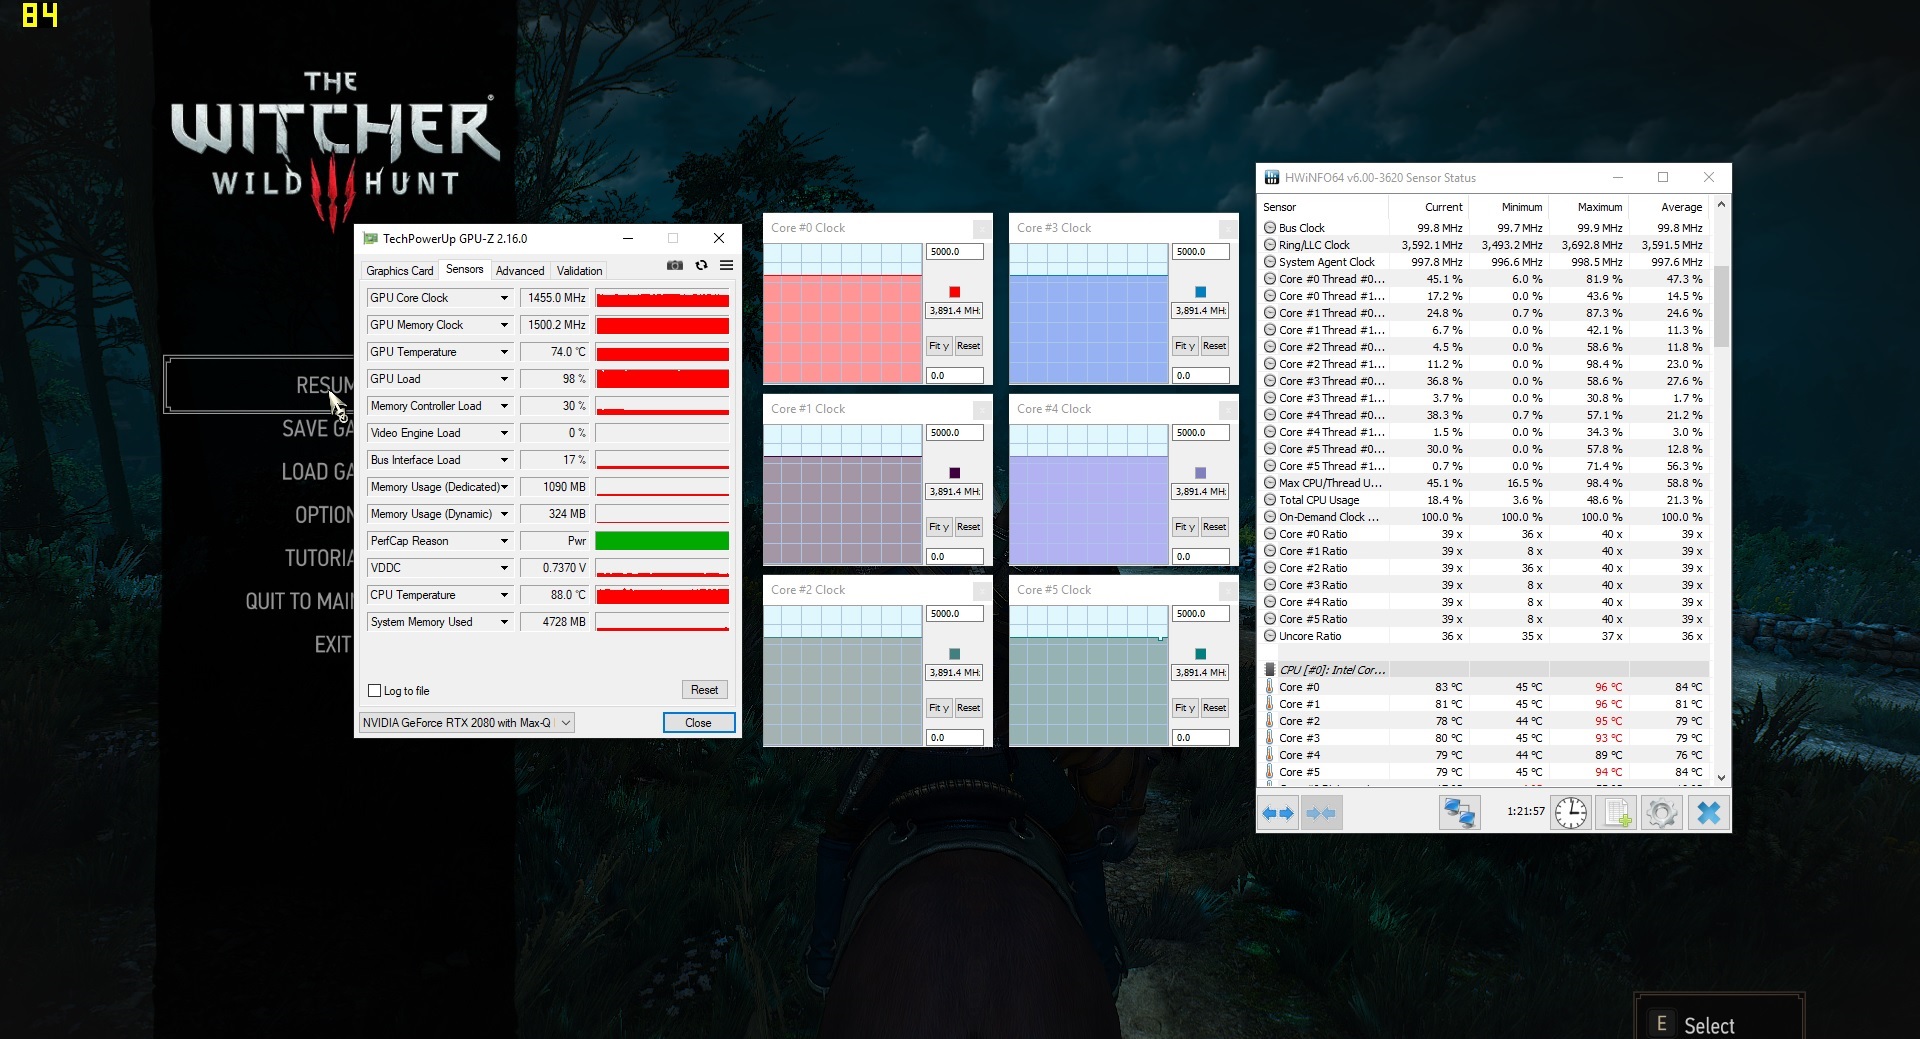
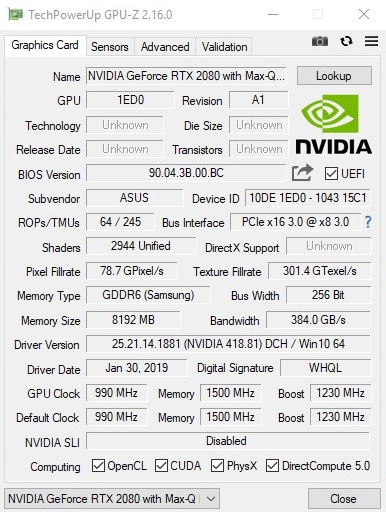
GPU Performance
Asus scores yet another point in terms of GPU performance. 3DMark benchmarks show the Asus outperforming the MSI by 8 to 12 percent despite both systems having the same GPU. A peek at their GPU-Z data shows the MSI GPU running slower than on the Asus (1095 MHz vs. 1230 MHz).
Display
While the two systems share fast response times, a native 1080p resolution, 144 Hz refresh rate, and high contrast ratio, the MSI display is brighter and with more accurate colors out of the box.
Asus supports G-Sync with no Optimus while the MSI supports Optimus with no G-Sync.
(April 9, 2019 correction: The GX701 includes both Optimus and G-Sync. Since both cannot be active together, however, one must be toggled off in order to use the other.)
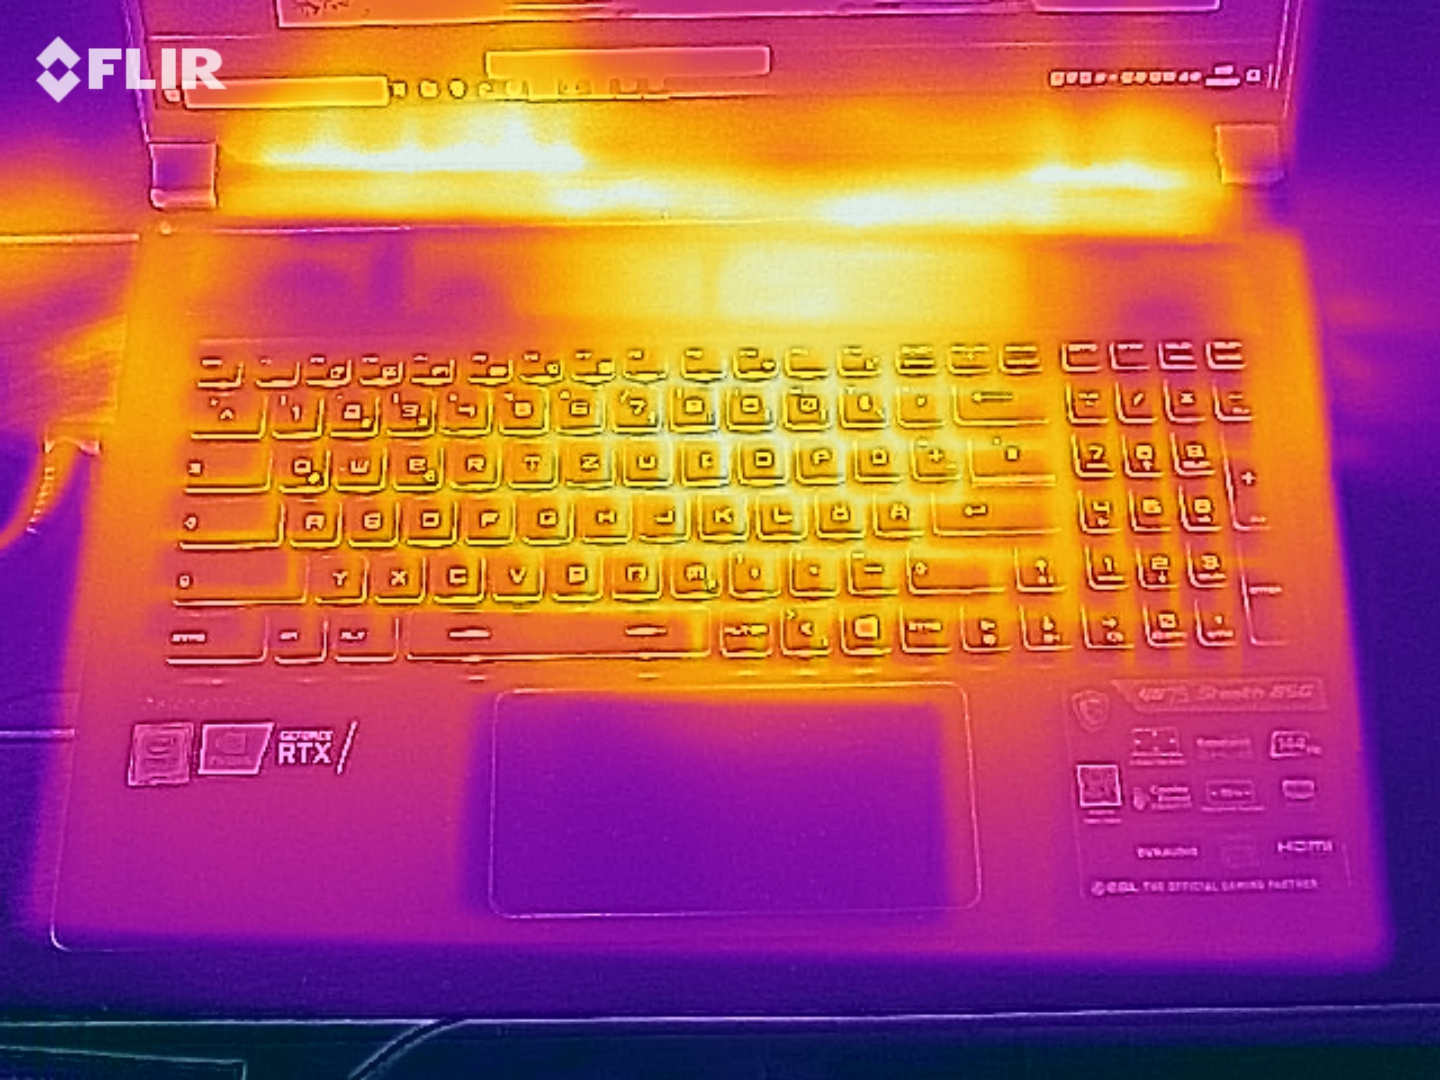
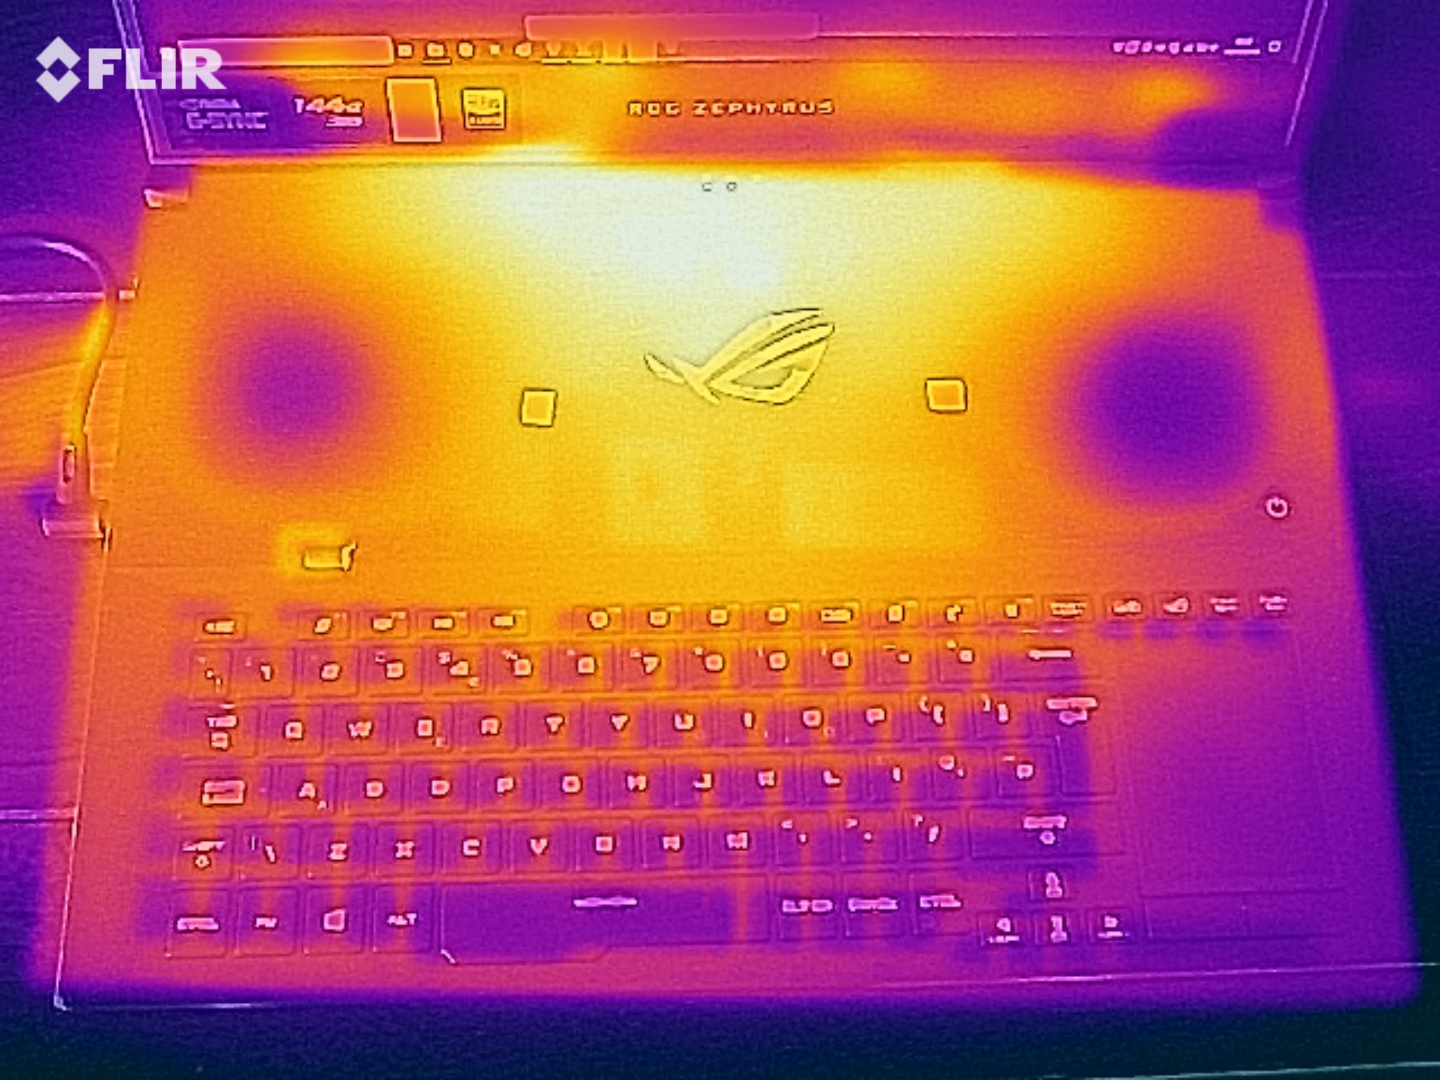
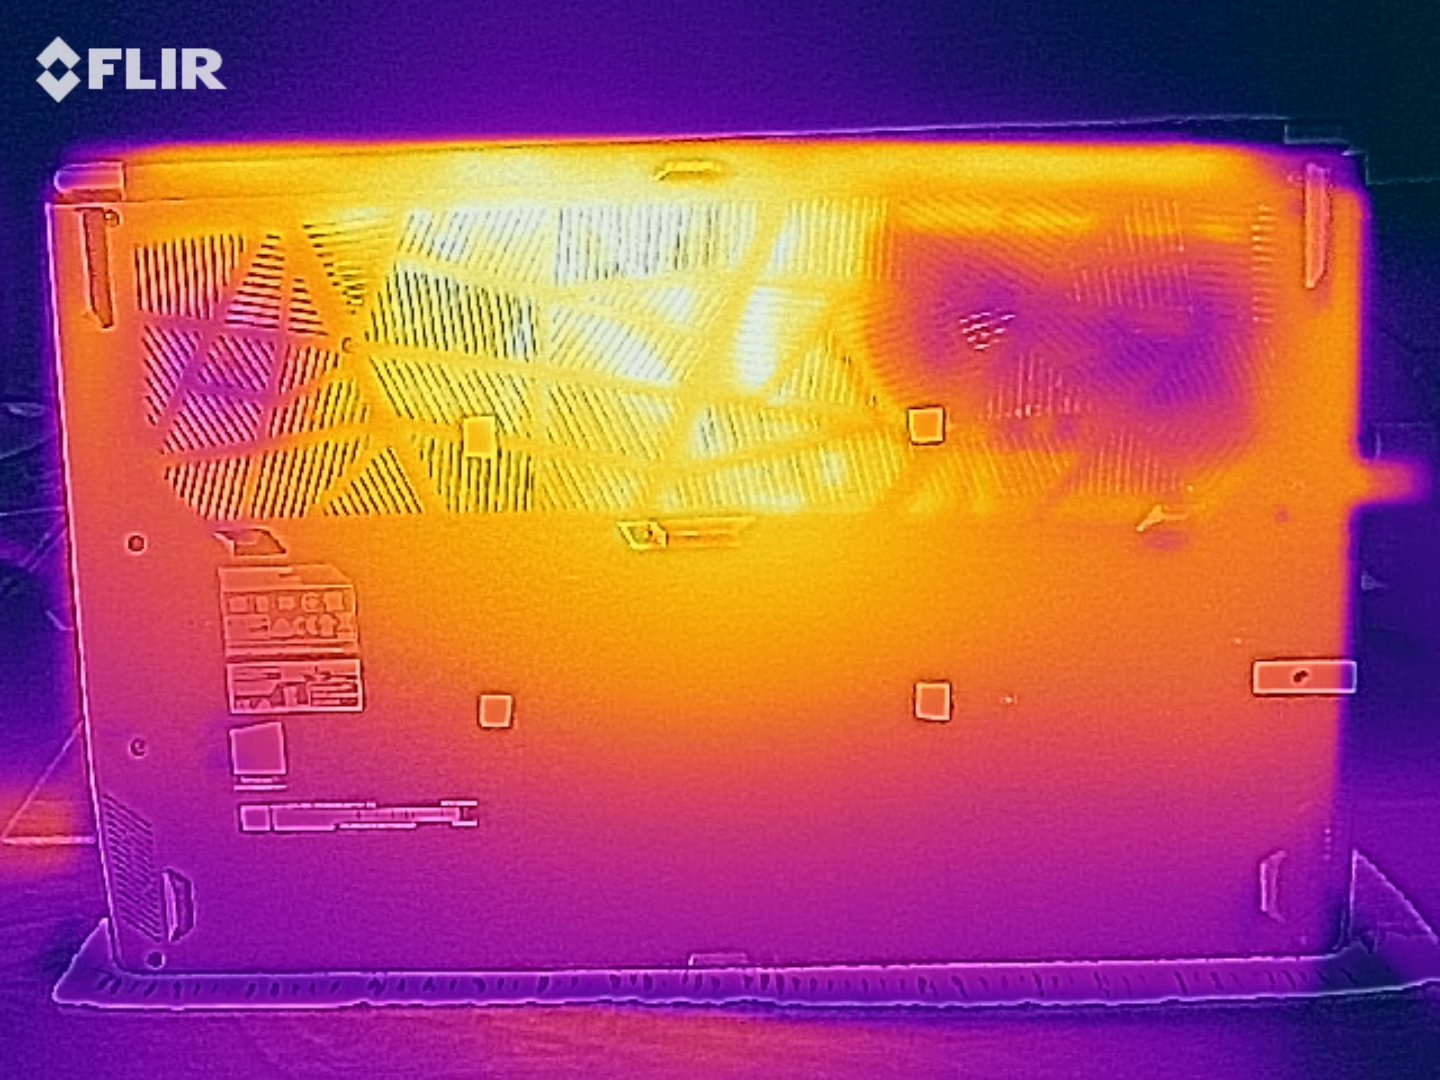
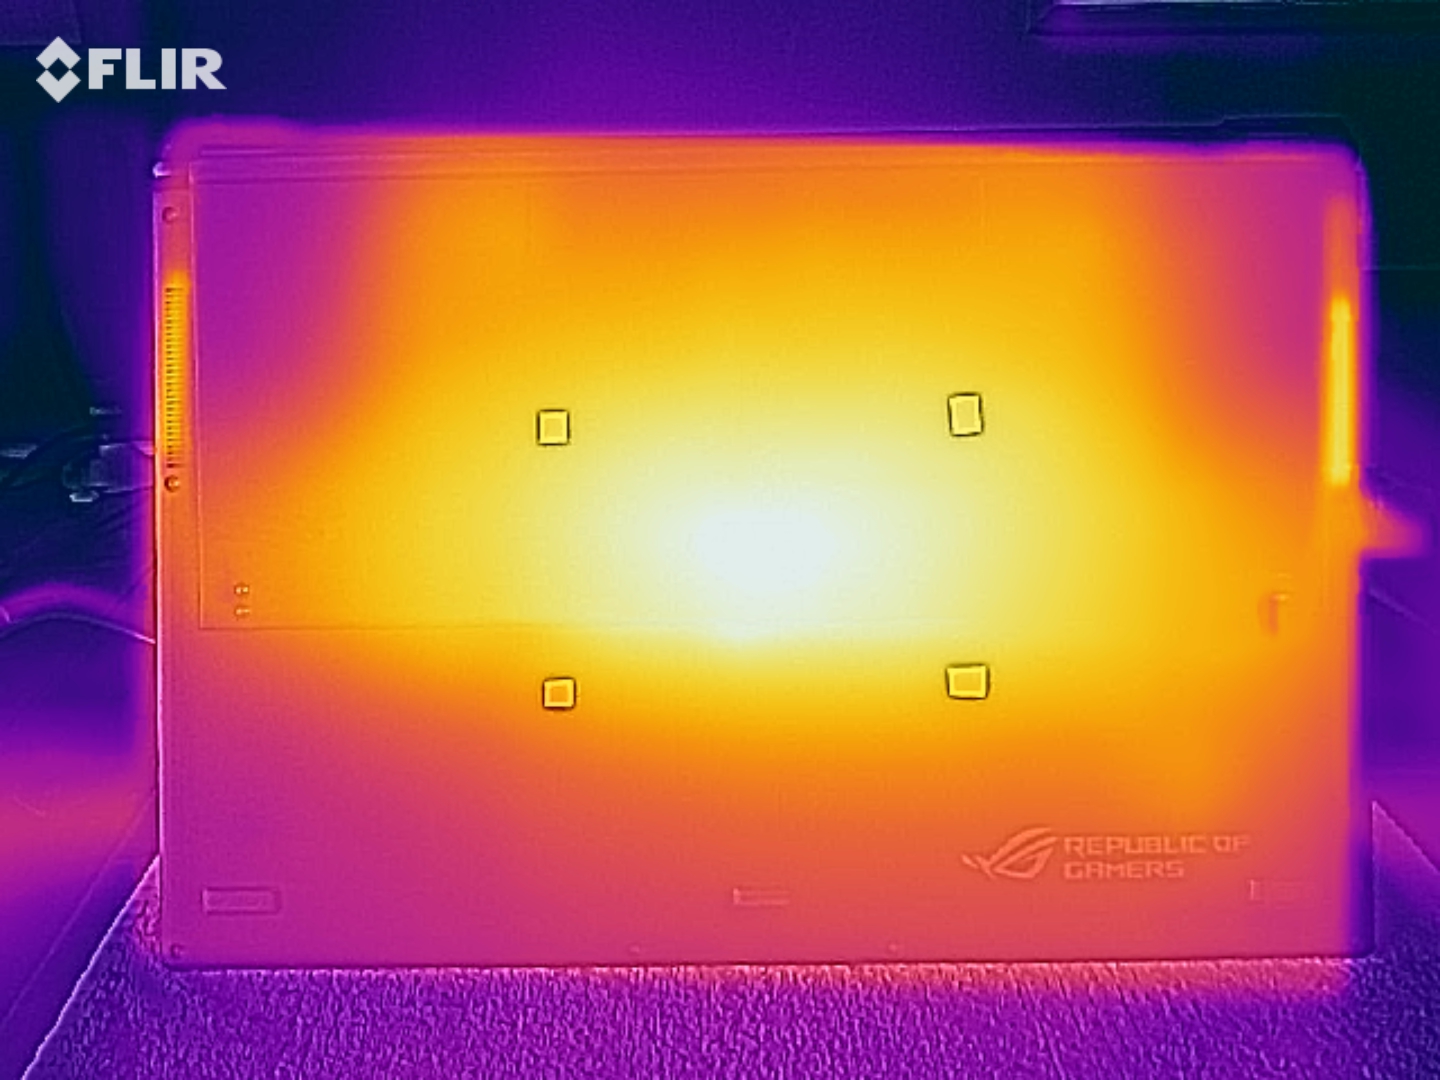
Fan Noise
Both systems are very close when it comes to system noise. We find that the MSI is more susceptible to fan pulsing depending on the power profile while the Asus is able to remain quieter for longer when running low-medium loads. When gaming, however, the Asus runs slightly louder at the 49 to 51 dB(A) range compared to 47 to 48 dB(A) on the MSI. CPU and GPU temperatures are otherwise nearly the same between them at 79 C and 73 C, respectively, when gaming.
Power Consumption
This is definitely something Asus should improve upon in the future. Simply idling on desktop draws anywhere between 19 W to 30 W on the Asus compared to 13 W to 23 W on the MSI. Power consumption is slightly higher on the Asus when gaming as well, but this is at least partly attributed to the faster CPU and GPU performance.
Battery Life
The larger battery and generally lower power consumption give MSI the edge in runtime. We're able to record almost 5.5 hours of real-world WLAN use compared to under 4 hours on the Asus.
Verdict
It's a tough call between the MSI GS75 and Asus GX701. While the latter provides the better gaming experience because of its faster performance and G-Sync-enabled display, the former includes many more "jack of all trades" advantages that owners will appreciate. The GS75 is brighter, lighter, and longer-lasting with more connectivity features including Thunderbolt 3. As a result, the Asus GX701GX can feel rather barebones in this direct comparison. You'll be giving up a lot of features for that extra ounce of gaming power.
The MSI GS75 and Asus Zephyrus S GX701 can be found online for $2800 USD and $3300 USD, respectively, each with GeForce RTX 2080 Max-Q graphics. See our dedicated reviews on the MSI and Asus laptops for more detailed information on each.
| MSI GS75 8SG | Asus Zephyrus S GX701GX | |
|---|---|---|
| Advantages | + Brighter and more color accurate display | + Roughly 10 percent faster CPU and GPU performance |
| Cinebench R15 | |
| CPU Single 64Bit | |
| MSI GS75 8SG Stealth | |
| Asus Zephyrus S GX701GX | |
| CPU Multi 64Bit | |
| Asus Zephyrus S GX701GX | |
| MSI GS75 8SG Stealth | |
| PCMark 10 | |
| Score | |
| MSI GS75 8SG Stealth | |
| Asus Zephyrus S GX701GX | |
| Digital Content Creation | |
| Asus Zephyrus S GX701GX | |
| MSI GS75 8SG Stealth | |
| Productivity | |
| MSI GS75 8SG Stealth | |
| Asus Zephyrus S GX701GX | |
| Essentials | |
| MSI GS75 8SG Stealth | |
| Asus Zephyrus S GX701GX | |
| 3DMark | |
| 1920x1080 Fire Strike Graphics | |
| Asus Zephyrus S GX701GX | |
| Average NVIDIA GeForce RTX 2080 Max-Q (18048 - 23032, n=19) | |
| MSI GS75 8SG Stealth | |
| 2560x1440 Time Spy Graphics | |
| Asus Zephyrus S GX701GX | |
| Average NVIDIA GeForce RTX 2080 Max-Q (6464 - 8844, n=19) | |
| MSI GS75 8SG Stealth | |
| 3DMark 11 - 1280x720 Performance GPU | |
| Asus Zephyrus S GX701GX | |
| Average NVIDIA GeForce RTX 2080 Max-Q (23386 - 30910, n=20) | |
| MSI GS75 8SG Stealth | |
| MSI GS75 8SG Stealth N173HCE-G33 (CMN175C), IPS, 1920x1080 | Asus Zephyrus S GX701GX B173HAN04.0 (AUO409D), IPS, 1920x1080 | |
|---|---|---|
| Display | ||
| Display P3 Coverage (%) | 63.6 | 62.9 |
| sRGB Coverage (%) | 95.4 | 87.8 |
| AdobeRGB 1998 Coverage (%) | 65.5 | 63.9 |
| Response Times | ||
| Response Time Grey 50% / Grey 80% * (ms) | 7.6 ? | 7.2 ? |
| Response Time Black / White * (ms) | 9.6 ? | 9.6 ? |
| PWM Frequency (Hz) | 25510 ? | |
| Screen | ||
| Brightness middle (cd/m²) | 355 | 288 |
| Brightness (cd/m²) | 327 | 287 |
| Brightness Distribution (%) | 85 | 91 |
| Black Level * (cd/m²) | 0.26 | 0.2 |
| Contrast (:1) | 1365 | 1440 |
| Colorchecker dE 2000 * | 1.54 | 2.33 |
| Colorchecker dE 2000 max. * | 3 | 5.34 |
| Colorchecker dE 2000 calibrated * | 0.77 | 2.47 |
| Greyscale dE 2000 * | 2.19 | 1.19 |
| Gamma | 2.42 91% | 2.41 91% |
| CCT | 6893 94% | 6710 97% |
| Color Space (Percent of AdobeRGB 1998) (%) | 61 | 57 |
| Color Space (Percent of sRGB) (%) | 95 | 88 |
| Total Average (Program / Settings) |
* ... smaller is better
| MSI GS75 8SG Stealth 2x Samsung SSD PM981 MZVLB512HAJQ (RAID 0) | Asus Zephyrus S GX701GX Samsung SSD PM981 MZVLB1T0HALR | |
|---|---|---|
| CrystalDiskMark 5.2 / 6 | ||
| Write 4K (MB/s) | 86.3 | 92.4 |
| Read 4K (MB/s) | 39.45 | 39.59 |
| Write Seq (MB/s) | 2862 | 1221 |
| Read Seq (MB/s) | 2896 | 1005 |
| Write 4K Q32T1 (MB/s) | 304.6 | 292.5 |
| Read 4K Q32T1 (MB/s) | 350.2 | 330.8 |
| Write Seq Q32T1 (MB/s) | 3440 | 2385 |
| Read Seq Q32T1 (MB/s) | 3537 | 3339 |
| MSI GS75 8SG Stealth i7-8750H, GeForce RTX 2080 Max-Q | Asus Zephyrus S GX701GX i7-8750H, GeForce RTX 2080 Max-Q | |
|---|---|---|
| Noise | ||
| off / environment * (dB) | 30 | 29 |
| Idle Minimum * (dB) | 31 | 29 |
| Idle Average * (dB) | 32 | 32 |
| Idle Maximum * (dB) | 41 | 33 |
| Load Average * (dB) | 47 | 47 |
| Witcher 3 ultra * (dB) | 47 | 49 |
| Load Maximum * (dB) | 48 | 51 |
* ... smaller is better
| MSI GS75 8SG Stealth i7-8750H, GeForce RTX 2080 Max-Q, 80.25 Wh | Asus Zephyrus S GX701GX i7-8750H, GeForce RTX 2080 Max-Q, 76 Wh | |
|---|---|---|
| Battery runtime | ||
| Reader / Idle (h) | 7.7 | 5 |
| WiFi v1.3 (h) | 5.3 | 3.8 |
| Load (h) | 0.9 | 0.9 |
| MSI GS75 8SG Stealth i7-8750H, GeForce RTX 2080 Max-Q | Asus Zephyrus S GX701GX i7-8750H, GeForce RTX 2080 Max-Q | |
|---|---|---|
| Power Consumption | ||
| Idle Minimum * (Watt) | 13 | 19 |
| Idle Average * (Watt) | 17 | 22 |
| Idle Maximum * (Watt) | 23 | 30 |
| Load Average * (Watt) | 90 | 104 |
| Witcher 3 ultra * (Watt) | 147 | 167 |
| Load Maximum * (Watt) | 215 | 203 |
* ... smaller is better
Source(s)
