Gigabyte Aero 15-X9 vs. Aero 15-Y9: you may want to reconsider the RTX 2080 Max-Q SKU
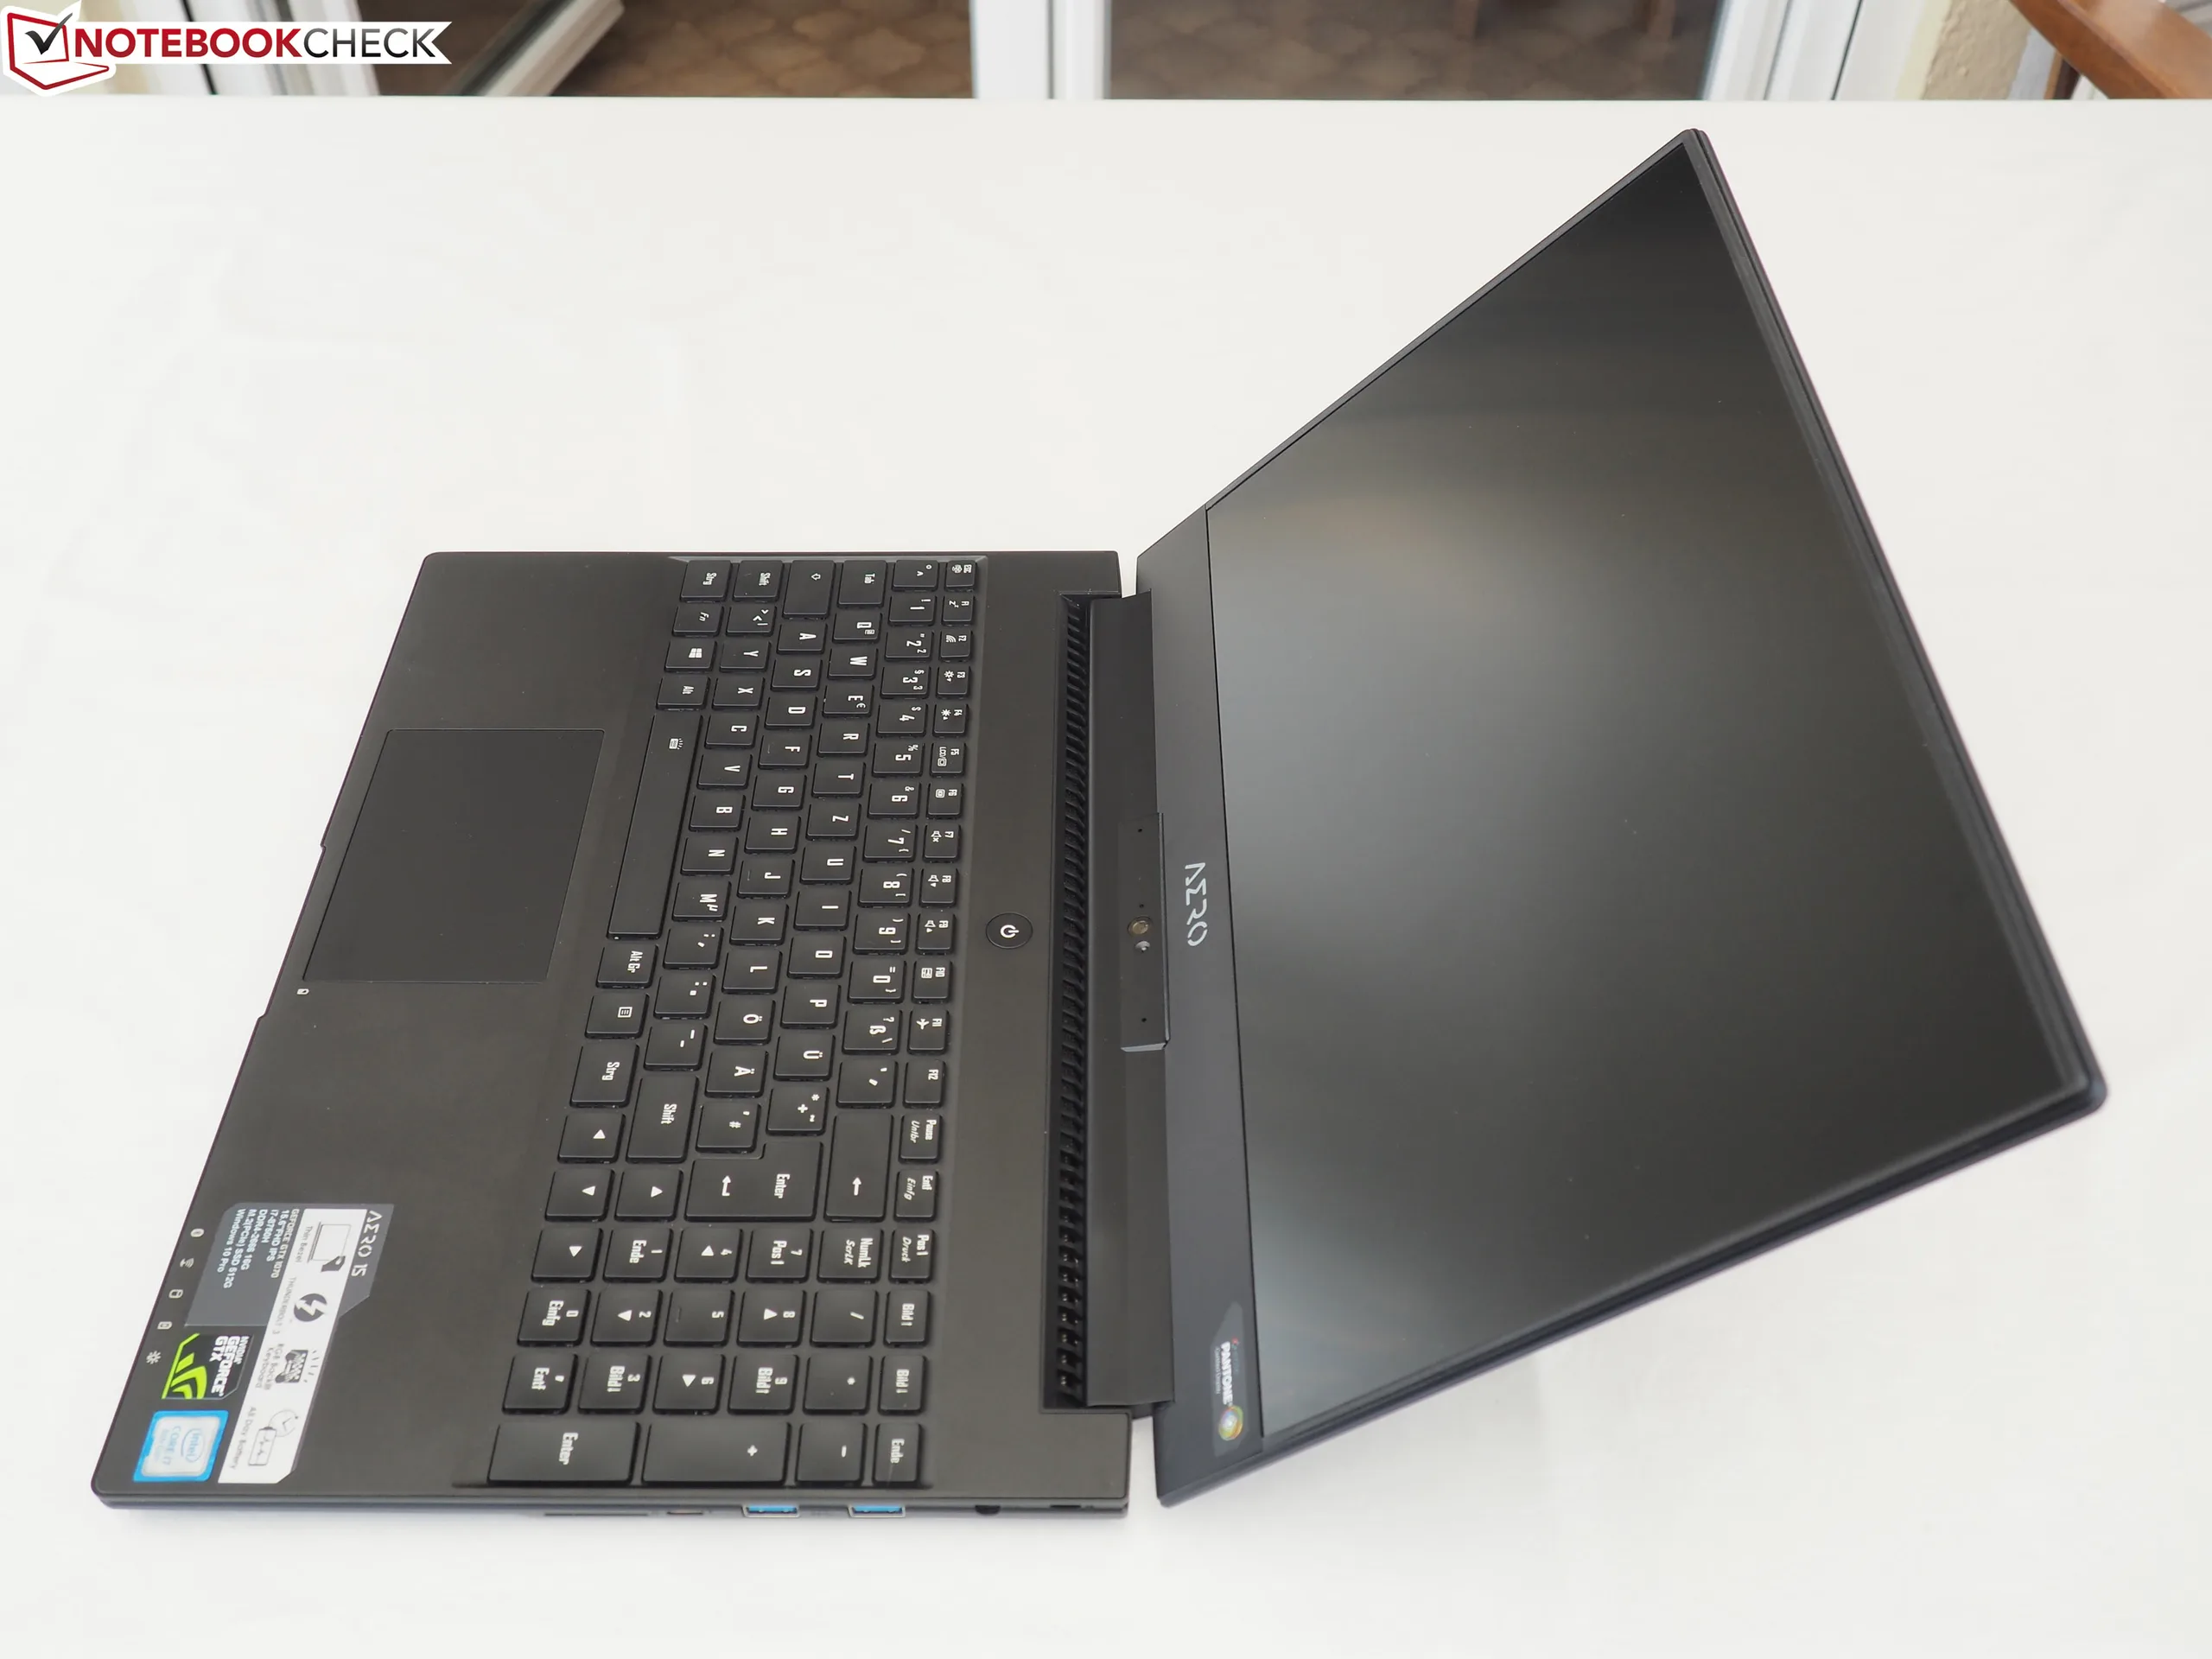
Gigabyte unveiled its refreshed Aero 15 lineup at CES 2019 with two SKUs at launch: the Aero 15-X9 and Aero 15-Y9. The major differences between the two configurations are detailed in the table below.
The Aero 15-Y9 configuration should be noticeably better than the Aero 15-X9 since it carries the faster processors on paper. Now that we've had the chance to check out both, we're ready to compare the two laptops directly.
| Gigabyte Aero 15-X9 | Gigabyte Aero 15-Y9 | |
|---|---|---|
| CPU | Core i7-8750H | Core i9-8950HK |
| GPU | GeForce RTX 2070 Max-Q | GeForce RTX 2080 Max-Q |
| RAM | 16 GB DDR4-2666, Single-channel | 64 GB DDR4-2666, Dual-channel |
| Display | 1920 x 1080, 144 Hz, LGD05C0 | 3840 x 2160, 60 Hz, AUO31EB |
| Storage | 1 TB Intel SSD 760p | 2 TB Intel SSD 760p |
CPU Performance
The Core i9 CPU in the Aero 15-Y9 is only about 7 to 16 percent faster than the Core i7 in the Aero 15-X9 according to CineBench benchmarks. When accounting for throttling, the gap between them closes even more at just 6 percent.
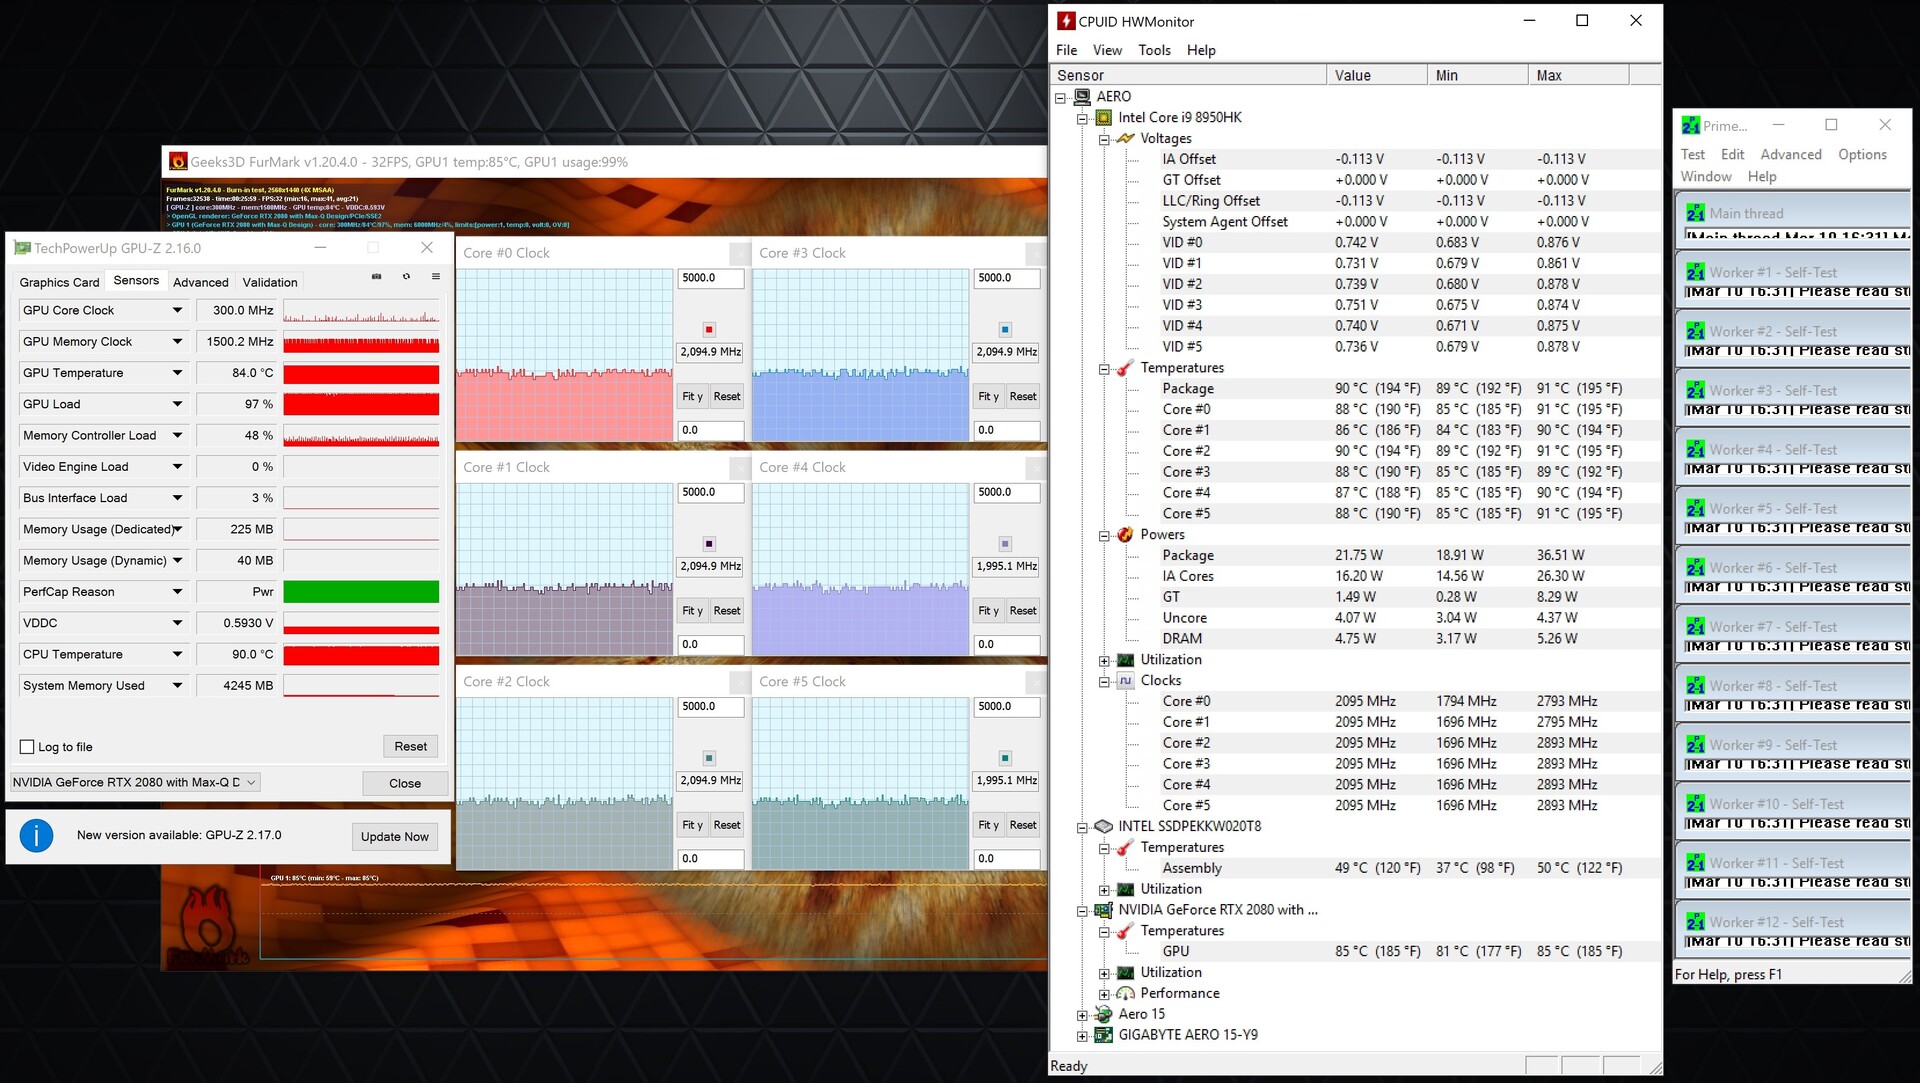
GPU Performance
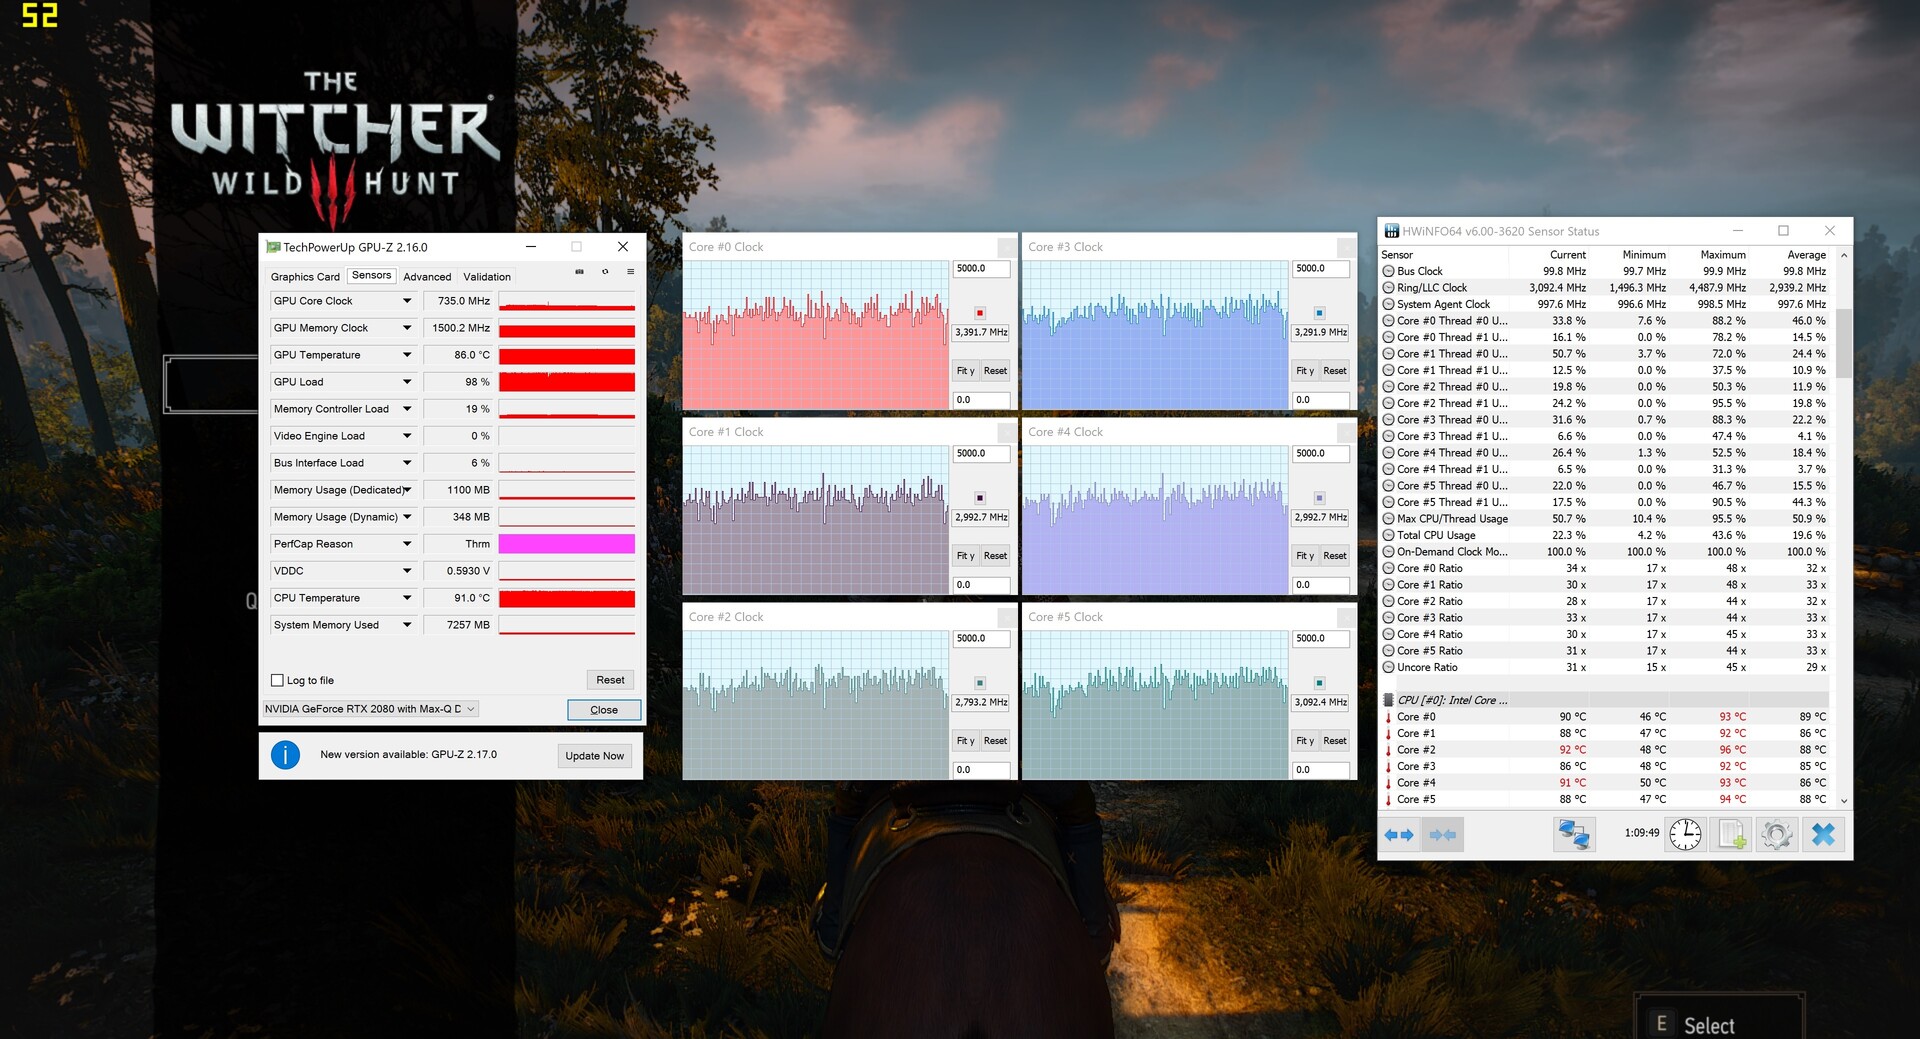
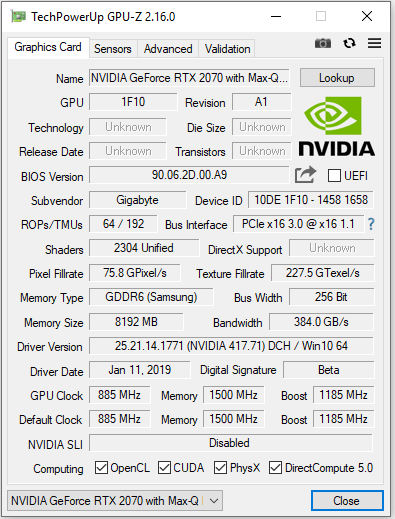
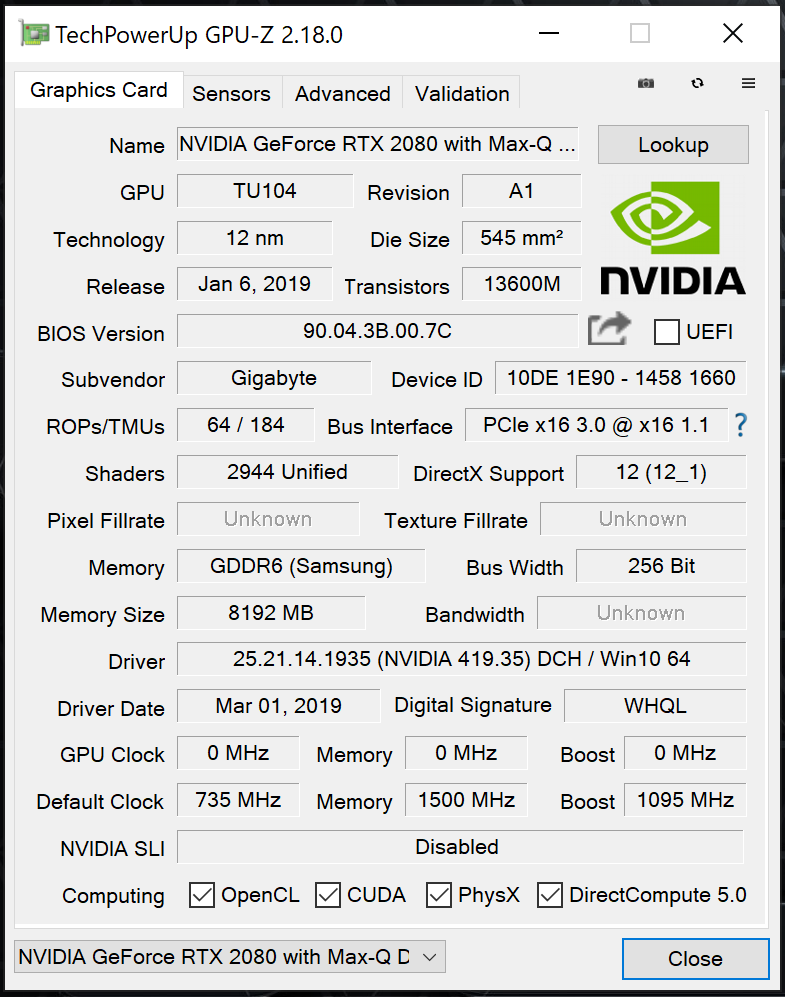
This is perhaps where the Aero 15 disappoints the most. 3DMark results between the two laptops are nearly identical even though the RTX 2080 Max-Q should be faster than the RTX 2070 Max-Q. When comparing the GPU-Z data between the Aero 15-Y9 and Asus Zephyrus S GX701GX equipped with the same GPU, we can see that Gigabyte has reduced both the clock rates and number of TMUs for its version of the RTX 2080 Max-Q.
Display
Gigabyte sources LG and AU Optronics for the FHD and 4K UHD IPS panels, respectively. The 4K UHD option is brighter (350 nits vs. 250 nits) with both deeper contrast (1207:1 vs. 862:1) and wider gamut (88 percent vs. 60 percent AdobeRGB) than the FHD panel. Meanwhile, the FHD panel has faster black-white response times for reduced ghosting and a higher native refresh rate (144 Hz vs. 60 Hz).
Storage
Gigabyte advertises "All Intel Inside" for its latest Aero and Aorus laptops. The 1 TB Intel 760p NVMe SSD has slower sequential read rates than the 2 TB version (2020 MB/s vs. 2426 MB/s).
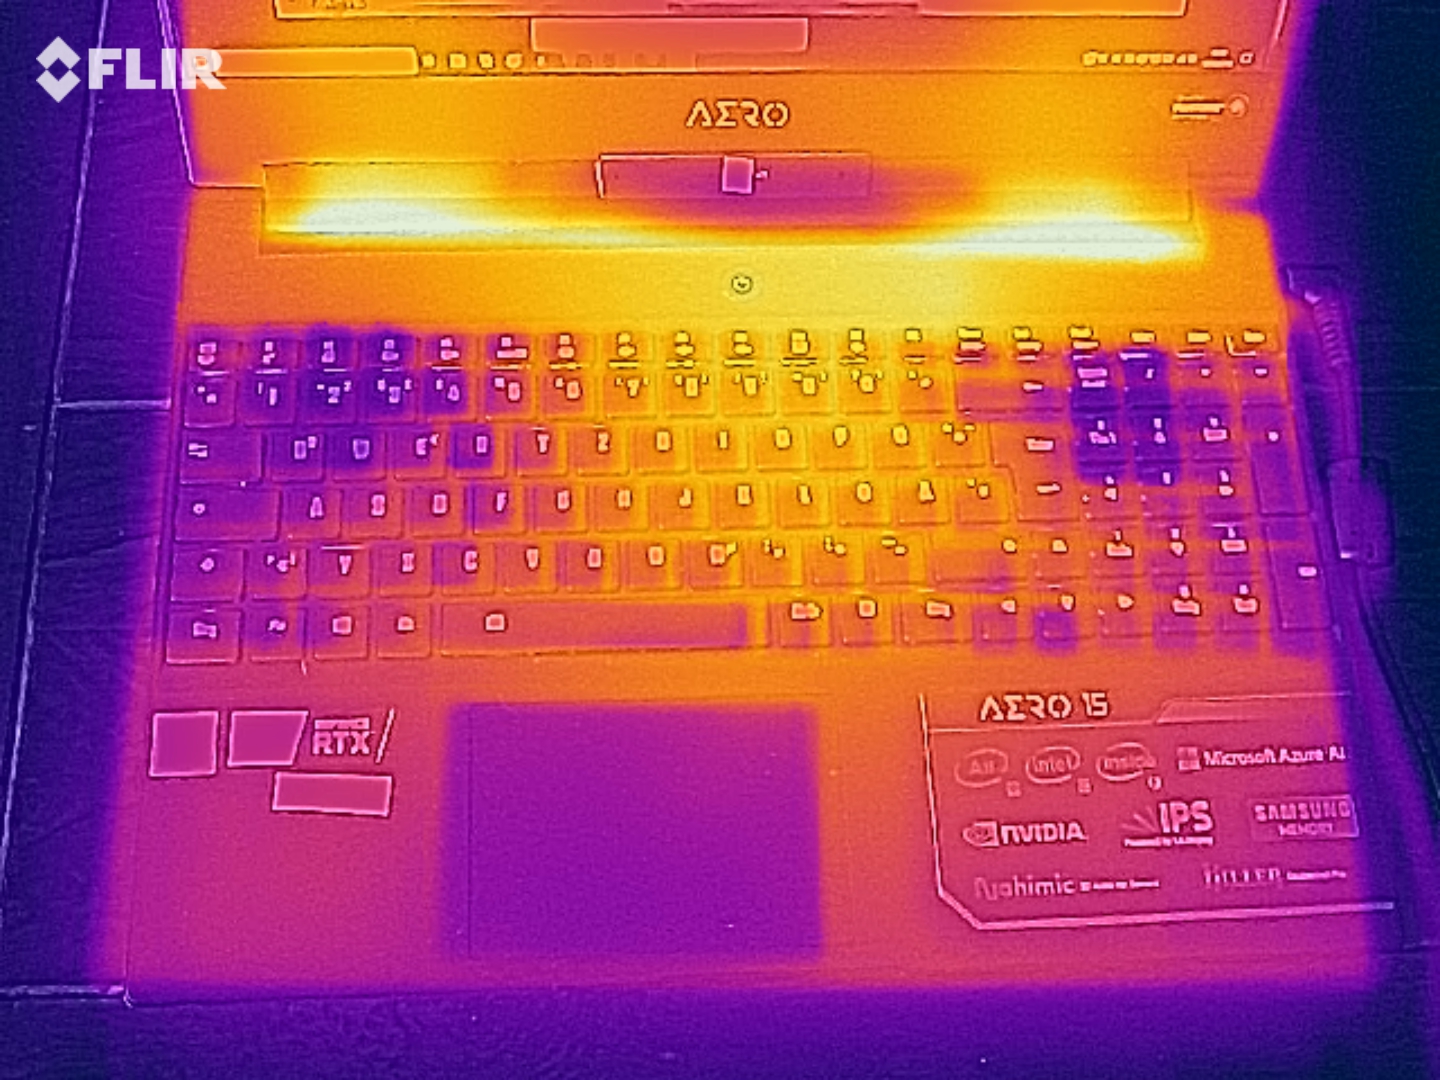
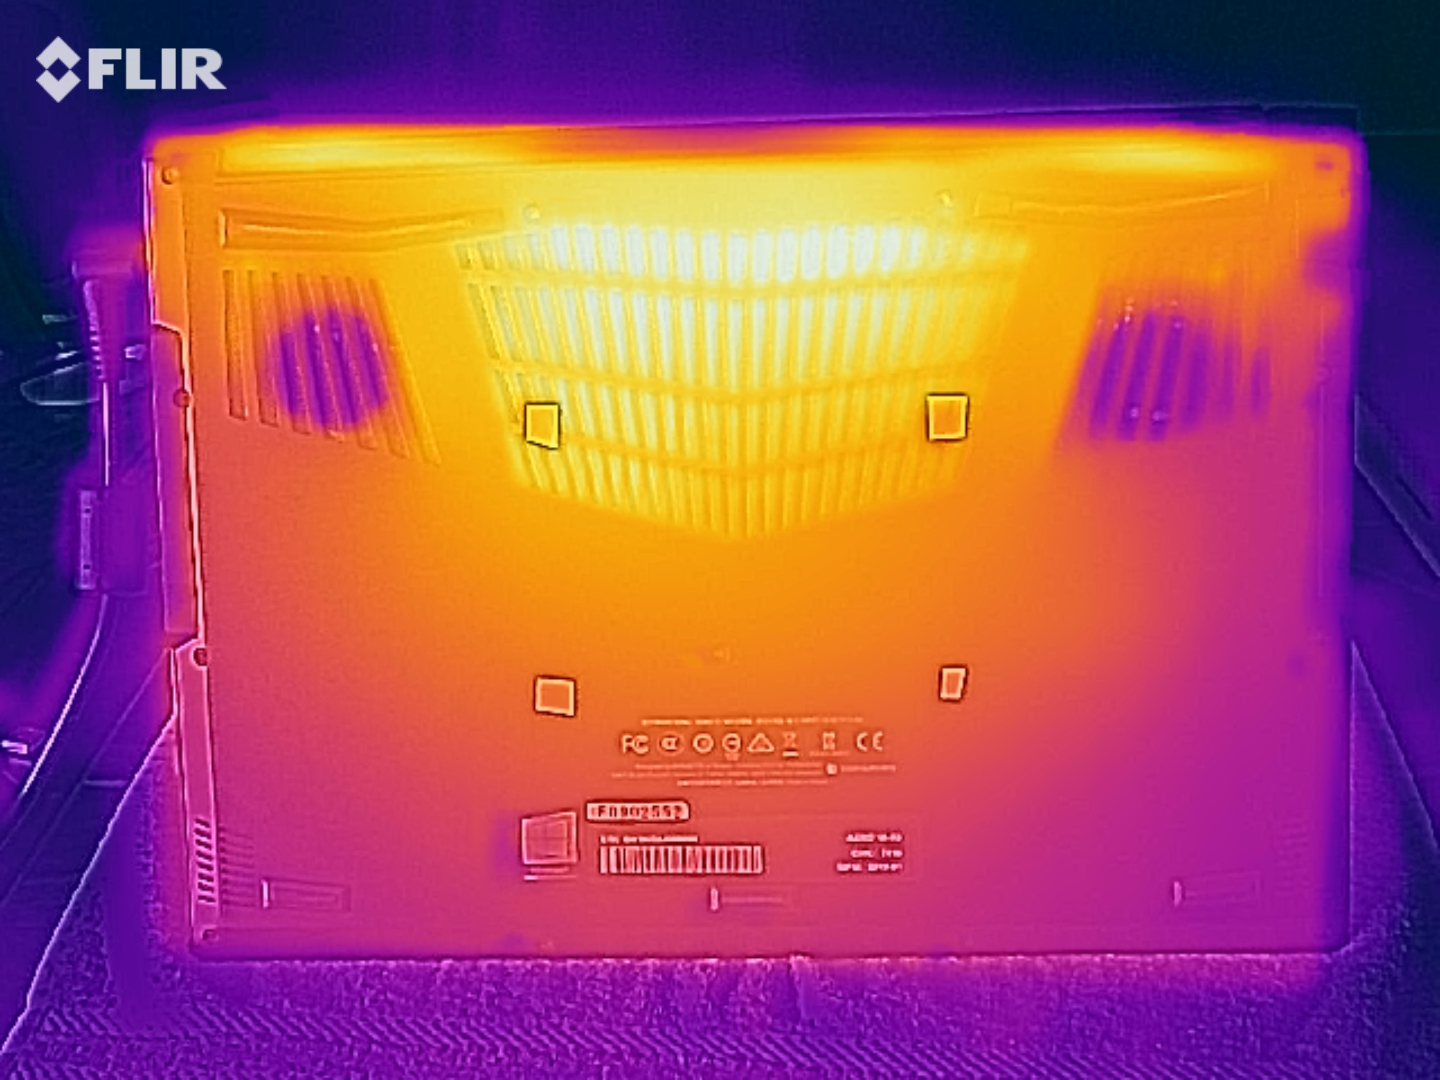
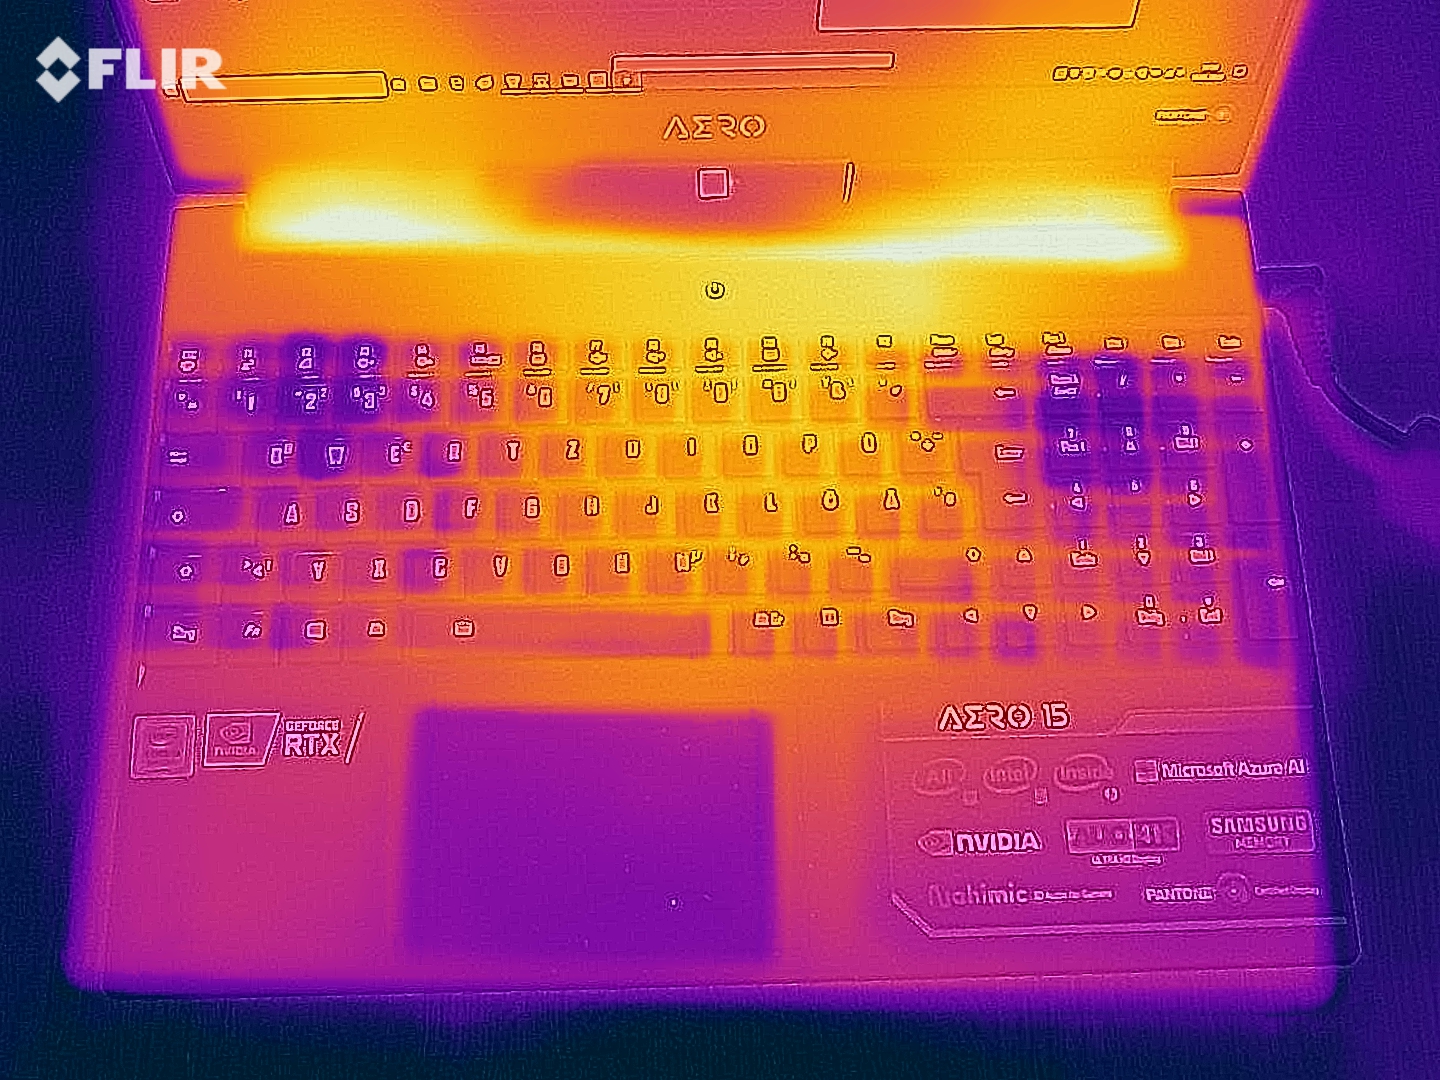
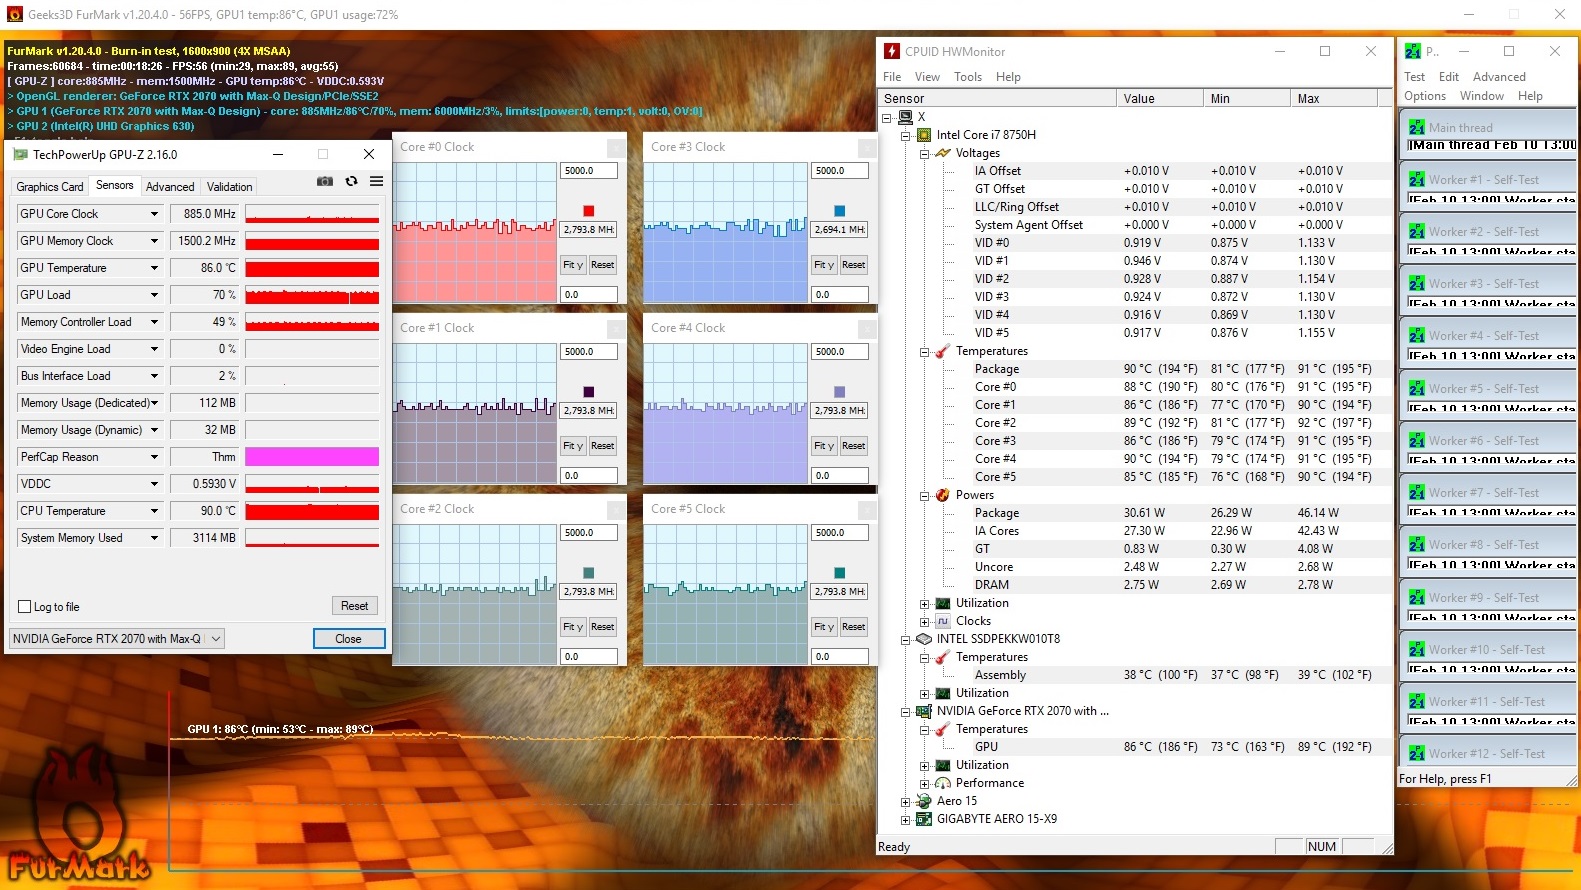
Fan Noise
Fan noise appears to be identical between the two SKUs despite the processor differences. Core temperatures are also nearly the same with the Core i9 SKU being slightly warmer by just a few degrees C (~88 C vs. 83 C).
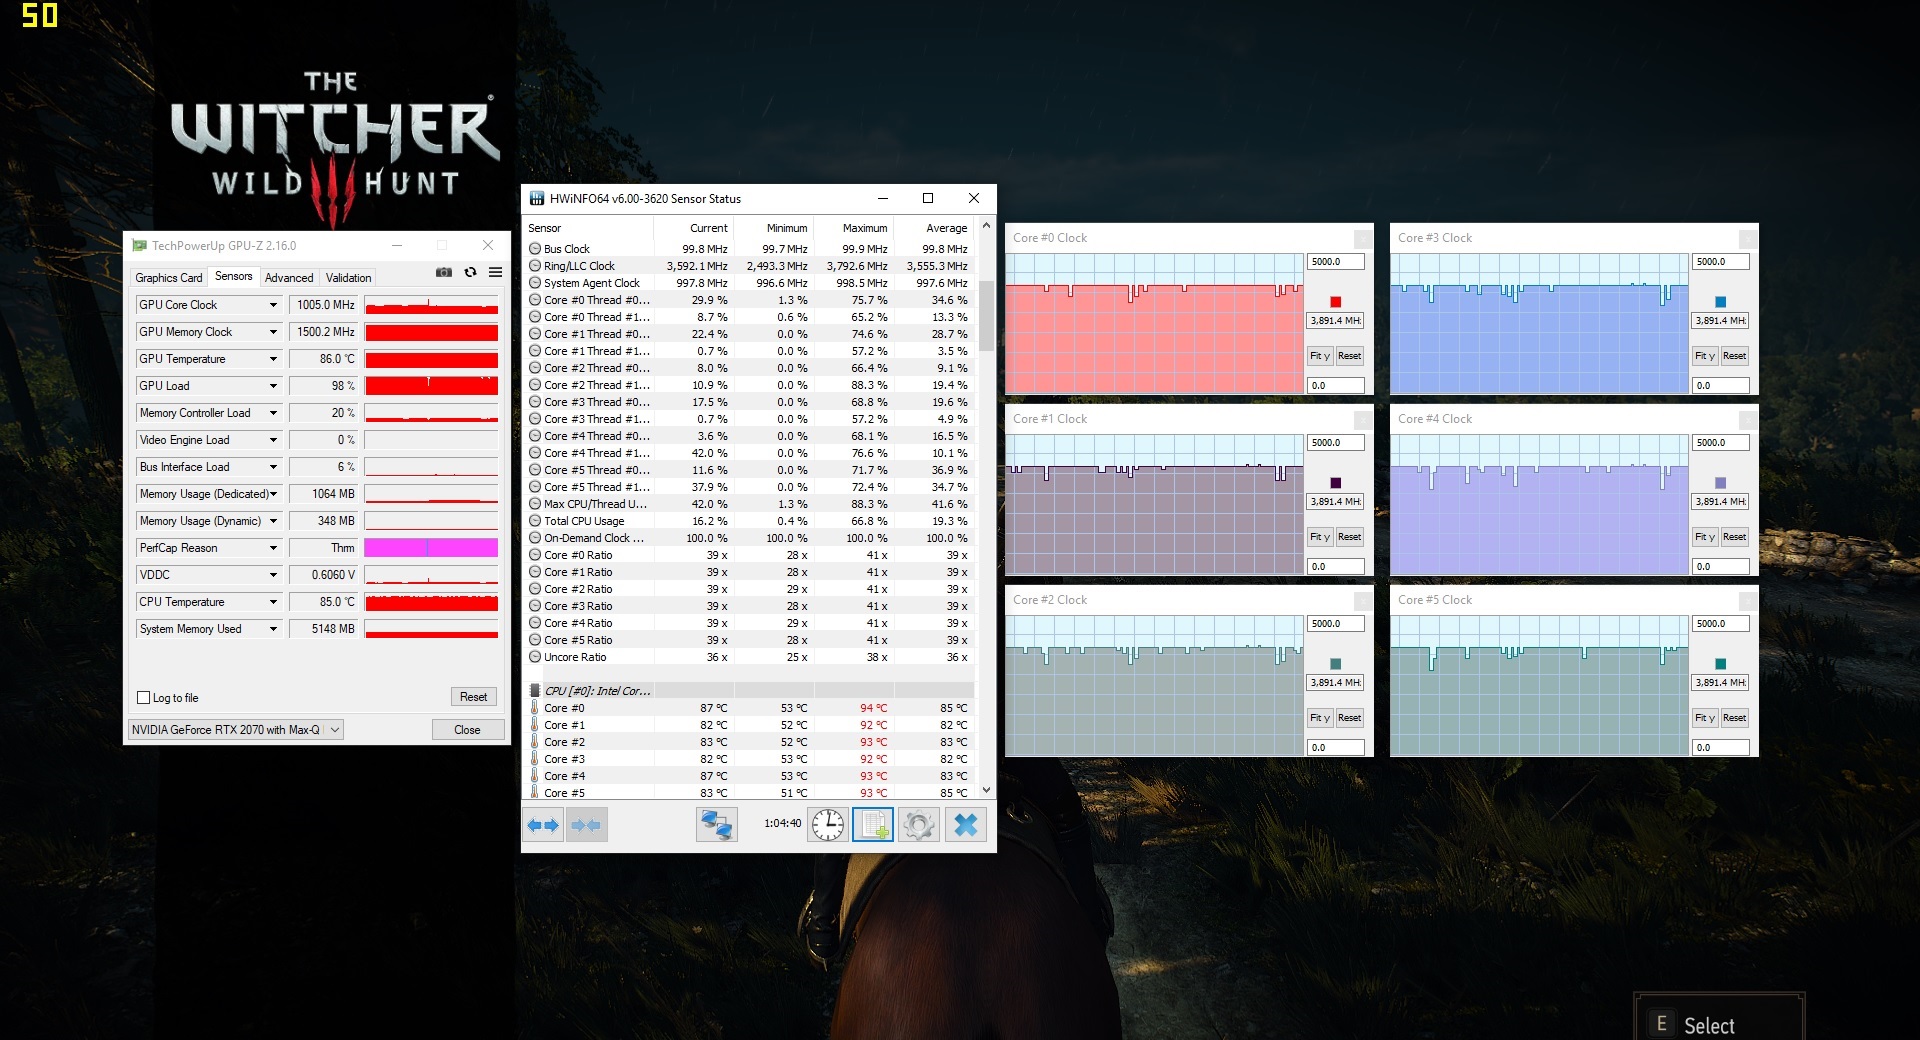
Power Consumption
The Core i9 configuration is measurably more demanding. Idling on desktop and running Witcher 3 draws 27 W and 130 W, respectively, compared to 23 W and 120 W on the Core i7 configuration.
Battery Life
Runtimes are subsequently longer on the Core i7 configuration albeit by just half an hour. Expect around 6 and 6.5 hours of real-world WLAN use from the Aero 15-X9 and Aero 15-Y9, respectively.
Verdict
As of this writing, the Aero 15-X9 and Aero 15-Y9 can be found on NewEgg for $2200 and $4000 USD, respectively. The price premium for the the higher-end RTX 2080 Max-Q GPU, Core i9 CPU, 4K UHD panel, additional storage, and additional RAM is significant to say the least.
Based on our experience with both configurations, however, the pricier Aero 15-Y9 performs essentially the same as the Aero 15-X9. GPU performance in particular is nearly identical between them as the RTX 2080 Max-Q in the Aero 15-Y9 SKU is below average. Meanwhile, the Core i9-8950HK is only marginally faster than the Core i7-8750H by just a few percentage points. There is more RAM and storage on the Aero 15-Y9, but these are easily upgradeable on the less expensive 15-X9.
Thus, the biggest reason to own the Aero 15-Y9 over the Aero 15-X9 is for its 4K UHD panel. This may be useful for professionals who work with large Excel files or want the denser PPI for better multi-tasking. Otherwise, most users will be better off with the Aero 15-X9.
| Cinebench R15 | |
| CPU Single 64Bit | |
| Gigabyte Aero 15-Y9 | |
| Gigabyte Aero 15-X9 | |
| CPU Multi 64Bit | |
| Gigabyte Aero 15-Y9 | |
| Gigabyte Aero 15-X9 | |
| Cinebench R10 | |
| Rendering Single 32Bit | |
| Gigabyte Aero 15-Y9 | |
| Gigabyte Aero 15-X9 | |
| Rendering Multiple CPUs 32Bit | |
| Gigabyte Aero 15-Y9 | |
| Gigabyte Aero 15-X9 | |
| Cinebench R20 | |
| CPU (Single Core) | |
| Gigabyte Aero 15-Y9 | |
| CPU (Multi Core) | |
| Gigabyte Aero 15-Y9 | |
| Geekbench 3 | |
| 32 Bit Multi-Core Score | |
| Gigabyte Aero 15-Y9 | |
| Gigabyte Aero 15-X9 | |
| 32 Bit Single-Core Score | |
| Gigabyte Aero 15-Y9 | |
| Gigabyte Aero 15-X9 | |
| Geekbench 4.4 | |
| 64 Bit Multi-Core Score | |
| Gigabyte Aero 15-Y9 | |
| Gigabyte Aero 15-X9 | |
| 64 Bit Single-Core Score | |
| Gigabyte Aero 15-Y9 | |
| Gigabyte Aero 15-X9 | |
| Mozilla Kraken 1.1 - Total | |
| Gigabyte Aero 15-X9 (Edge 44) | |
| Gigabyte Aero 15-Y9 (Edge 44) | |
| Octane V2 - Total Score | |
| Gigabyte Aero 15-Y9 (Edge 44) | |
| Gigabyte Aero 15-X9 (Edge 44) | |
| JetStream 1.1 - 1.1 Total | |
| Gigabyte Aero 15-Y9 (Edge 44) | |
| Gigabyte Aero 15-X9 (Edge 44) | |
* ... smaller is better
| PCMark 10 | |
| Score | |
| Gigabyte Aero 15-Y9 | |
| Gigabyte Aero 15-X9 | |
| Digital Content Creation | |
| Gigabyte Aero 15-Y9 | |
| Gigabyte Aero 15-X9 | |
| Productivity | |
| Gigabyte Aero 15-Y9 | |
| Gigabyte Aero 15-X9 | |
| Essentials | |
| Gigabyte Aero 15-Y9 | |
| Gigabyte Aero 15-X9 | |
| PCMark 8 | |
| Home Score Accelerated v2 | |
| Gigabyte Aero 15-X9 | |
| Gigabyte Aero 15-Y9 | |
| Work Score Accelerated v2 | |
| Gigabyte Aero 15-X9 | |
| Gigabyte Aero 15-Y9 | |
| Gigabyte Aero 15-Y9 AU Optronics B156ZAN03.1 (AUO31EB), IPS, 3840x2160 | Gigabyte Aero 15-X9 LGD05C0, IPS, 1920x1080 | |
|---|---|---|
| Display | ||
| Display P3 Coverage (%) | 86.8 | 63.5 |
| sRGB Coverage (%) | 100 | 93.1 |
| AdobeRGB 1998 Coverage (%) | 99.7 | 64.5 |
| Response Times | ||
| Response Time Grey 50% / Grey 80% * (ms) | 60 ? | 16.4 ? |
| Response Time Black / White * (ms) | 28.8 ? | 13.6 ? |
| PWM Frequency (Hz) | ||
| Screen | ||
| Brightness middle (cd/m²) | 350 | 250 |
| Brightness (cd/m²) | 337 | 235 |
| Brightness Distribution (%) | 92 | 85 |
| Black Level * (cd/m²) | 0.29 | 0.29 |
| Contrast (:1) | 1207 | 862 |
| Colorchecker dE 2000 * | 0.93 | 1.46 |
| Colorchecker dE 2000 max. * | 1.43 | 2.47 |
| Colorchecker dE 2000 calibrated * | 0.62 | |
| Greyscale dE 2000 * | 1.21 | 1.27 |
| Gamma | 2.2 100% | 2.4 92% |
| CCT | 6672 97% | 6749 96% |
| Color Space (Percent of AdobeRGB 1998) (%) | 88 | 60 |
| Color Space (Percent of sRGB) (%) | 100 | 93 |
| Total Average (Program / Settings) |
* ... smaller is better
| Gigabyte Aero 15-Y9 Intel SSD 760p SSDPEKKW020T8 | Gigabyte Aero 15-X9 Intel SSD 760p SSDPEKKW010T8 | |
|---|---|---|
| CrystalDiskMark 5.2 / 6 | ||
| Write 4K (MB/s) | 109.4 | 97.1 |
| Read 4K (MB/s) | 56.6 | 53.7 |
| Write Seq (MB/s) | 1508 | 1526 |
| Read Seq (MB/s) | 2427 | 2020 |
| Write 4K Q32T1 (MB/s) | 307 | 285.6 |
| Read 4K Q32T1 (MB/s) | 351.3 | 321.8 |
| Write Seq Q32T1 (MB/s) | 1523 | 1533 |
| Read Seq Q32T1 (MB/s) | 2825 | 2351 |
| 3DMark | |
| 1920x1080 Fire Strike Graphics | |
| Asus Zephyrus S GX701GX | |
| Average NVIDIA GeForce RTX 2080 Max-Q (18048 - 23032, n=19) | |
| Gigabyte Aero 15-Y9 | |
| Gigabyte Aero 15-X9 | |
| 2560x1440 Time Spy Graphics | |
| Asus Zephyrus S GX701GX | |
| Average NVIDIA GeForce RTX 2080 Max-Q (6464 - 8844, n=19) | |
| Gigabyte Aero 15-X9 | |
| Gigabyte Aero 15-Y9 | |
| 3DMark 11 - 1280x720 Performance GPU | |
| Asus Zephyrus S GX701GX | |
| Average NVIDIA GeForce RTX 2080 Max-Q (23386 - 30910, n=20) | |
| Gigabyte Aero 15-Y9 | |
| Gigabyte Aero 15-X9 | |
| Gigabyte Aero 15-Y9 i9-8950HK, GeForce RTX 2080 Max-Q | Gigabyte Aero 15-X9 i7-8750H, GeForce RTX 2070 Max-Q | |
|---|---|---|
| Noise | ||
| off / environment * (dB) | 29 | 30 |
| Idle Minimum * (dB) | 31 | 32 |
| Idle Average * (dB) | 33 | 34 |
| Idle Maximum * (dB) | 36 | 36 |
| Load Average * (dB) | 44 | 42 |
| Witcher 3 ultra * (dB) | 43 | 44 |
| Load Maximum * (dB) | 45 | 48 |
* ... smaller is better
| Gigabyte Aero 15-Y9 i9-8950HK, GeForce RTX 2080 Max-Q | Gigabyte Aero 15-X9 i7-8750H, GeForce RTX 2070 Max-Q | |
|---|---|---|
| Power Consumption | ||
| Idle Minimum * (Watt) | 17 | 16 |
| Idle Average * (Watt) | 21 | 18 |
| Idle Maximum * (Watt) | 27 | 23 |
| Load Average * (Watt) | 111 | 88 |
| Witcher 3 ultra * (Watt) | 130 | 120 |
| Load Maximum * (Watt) | 183 | 167 |
* ... smaller is better
| Gigabyte Aero 15-Y9 i9-8950HK, GeForce RTX 2080 Max-Q, 94.24 Wh | Gigabyte Aero 15-X9 i7-8750H, GeForce RTX 2070 Max-Q, 94.24 Wh | |
|---|---|---|
| Battery runtime | ||
| Reader / Idle (h) | 9.4 | 9.2 |
| H.264 (h) | 5.5 | 6.1 |
| WiFi v1.3 (h) | 5.9 | 6.4 |
| Load (h) | 2.5 | 2.9 |
Source(s)
