MSI GE75 Raider vs. Asus Strix Scar II GL704GW: Asus has the CPU performance advantage
Once upon a time, 17-inch gaming laptops were all massive and heavy systems. While these builds still exist today, the trend towards thinner chassis designs and narrower bezels have led to surprisingly portable options without sacrificing the core gaming experience. The MSI GE75 and Asus ROG GL704 are the two best examples of 17-inch gaming laptops that balance narrow bezels with thin profiles.
For this comparison, we want to see how well an MSI GE75 Raider 8SF can compete against a similarly equipped (i7-8750H, RTX 2070, 16 GB RAM) Asus ROG GL704GW. Each model retails for about $2200 USD with 144 Hz IPS displays and a combination of SSDs and HDDs.
Chassis Quality
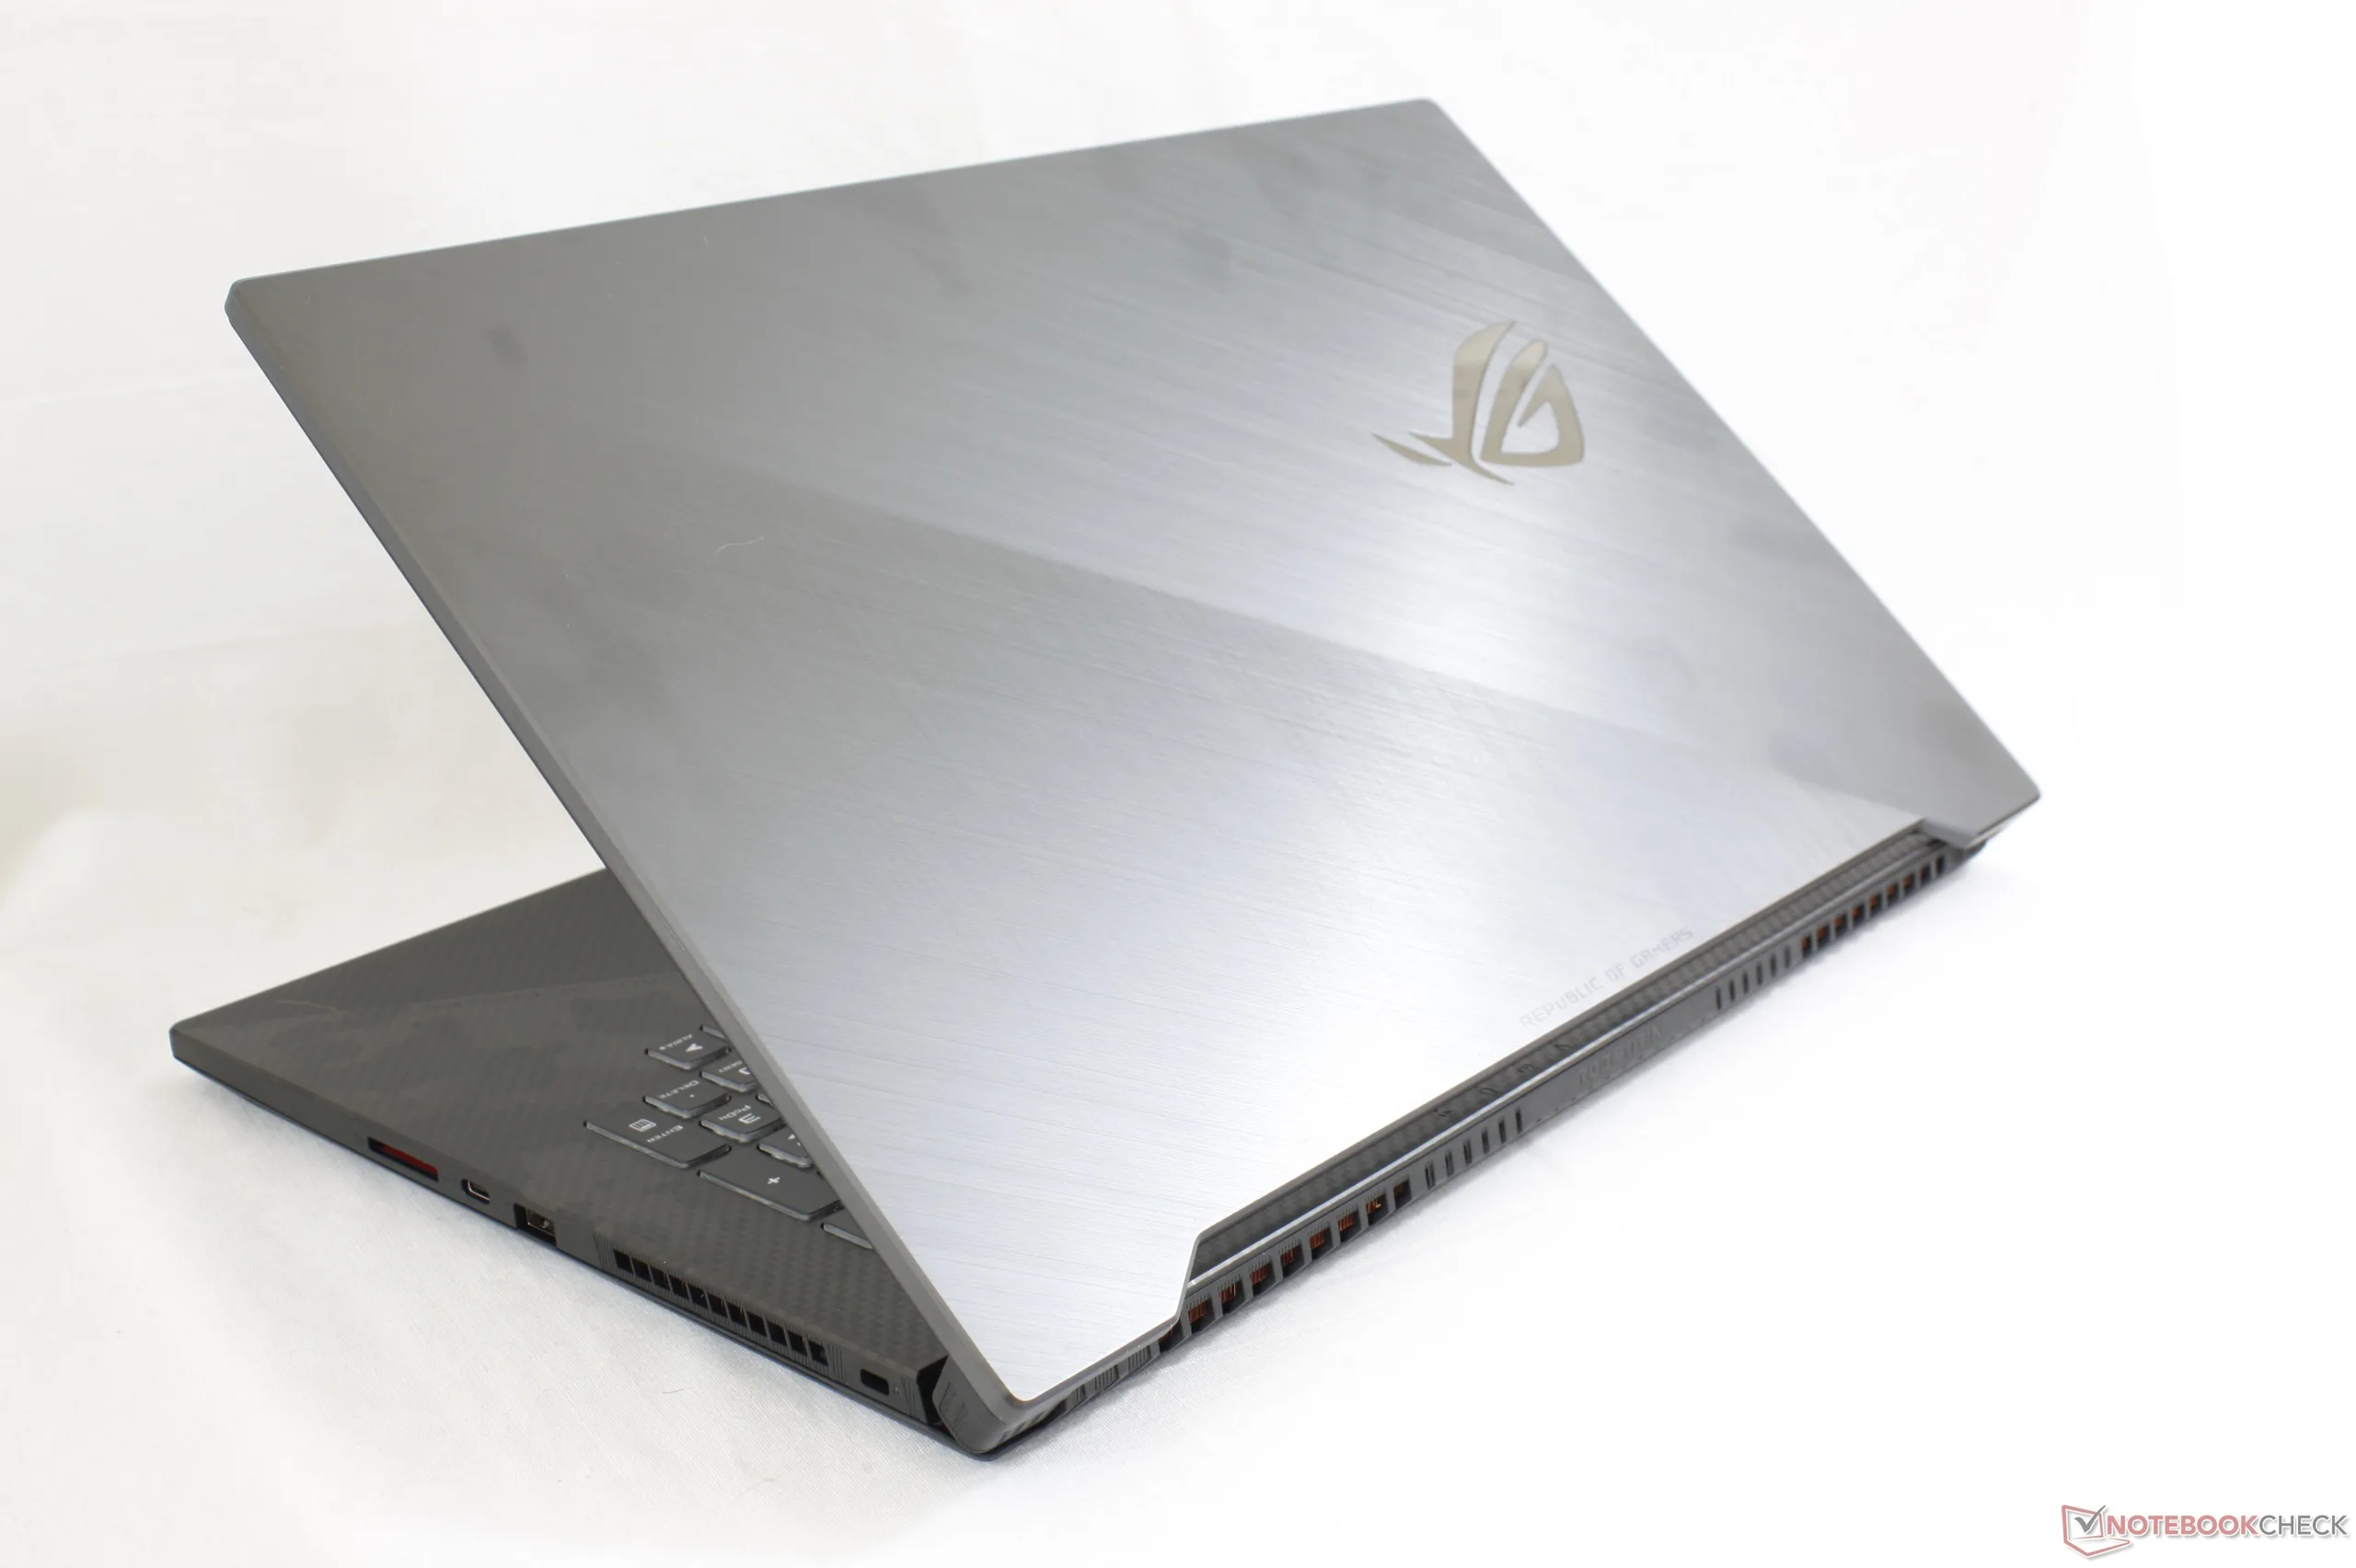
Both the MSI and Asus are nearly identical in dimensions. While the Asus is ever-so-slightly thinner, the MSI has a slightly smaller footprint in return. The MSI unit still wins in terms of portability as it is roughly 300 g lighter than its rival.
Chassis rigidity, however, favors Asus. Its lid, base, and hinges feel firmer and less flexible than on the MSI possibly because the overall unit is heavier and denser.
Display
It's Chi Mei vs. AU Optronics. Both are narrow-bezel 144 Hz IPS panels that advertise 3 ms response times to minimize ghosting when gaming. Contrast levels are excellent on both and nearly identical between them. The Chi Mei on the MSI, however, edges out the Asus display as it has the slightly wider color gamut, brighter backlight, and more accurate colors out of the box.
CPU Performance
Asus handily outperforms the MSI in this regard despite having the same Core i7-8750H CPU. Processor throttling is more apparent on the MSI when running CineBench R15 Multi-Thread in a loop as shown by our graph below. After accounting for throttling, the Asus CPU runs about 30 percent faster than the MSI. Asus attributes this to its Hypercool technology that specifically allows the CPU to run at faster clock rates. The extra CPU horsepower here can come in handy when aiming for frame rates above 60 FPS.
GPU Performance
Both laptops are within 5 percent of one another in 3DMark benchmarks. Indeed, their GPU-Z data show identical clock rates between their GeForce RTX 2070 GPUs unlike what we discovered on the RTX 2070 Max-Q GPUs in the Razer Blade 15 and Gigabyte Aero 15.
Note that our MSI configuration is equipped with 16 GB of single-channel RAM while our Asus houses 16 GB of dual-channel RAM. Unless if you plan on upgrading to 32 GB soon, we recommend opting for the dual-channel solution whenever possible.
Core Temperature
The Asus system runs noticeably warmer than the MSI. When running Witcher 3, the CPU and GPU in the GE75 stabilize at 70 C and 71 C, respectively, compared to 86 C and 85 C in the Asus. A quick look at their cooling solutions reveals that the MSI system has more heat pipes than the Asus (5 vs. 7). While this doesn't imply that the MSI has a more capable cooling solution, it certainly highlights a major difference between the two models.
Note that the MSI laptop can be configured with up to the RTX 2080 whereas the Asus is limited to the RTX 2070. This may explain why our MSI RTX 2070 system runs cooler because it is also capable of housing the more powerful RTX 2080.
Fan Noise
When gaming, fan noise is very nearly the same between both systems (50 dB(A) vs. 51 dB(A)). The fans of the MSI, however, remain silent for longer and are less likely to pulse during low-medium loads.
Battery Life
Battery capacity is nearly identical between both systems (65 Wh vs. 66 Wh). Subsequently, battery life is also nearly the same at about 3.6 hours on each model. Asus has the slight edge during our test by only about 20 to 25 minutes.
Ports
Port selection is excellent on both systems. The MSI unit has everything on the Asus minus one USB Type-A port in favor of two 3.5 mm audio jacks. SD card reader performance is faster on the Asus (85 MB/s vs. 33 MB/s).
Note that Thunderbolt 3 is not available on either system.
Conclusion
It's a back-and-forth brawl between the MSI GE75 and Asus ROG GL704GW. While the former is lighter, cooler, and generally quieter, the latter is built tougher, more easily serviceable, and with faster CPU performance. They're solid options with no one choice being objectively better than the other.
As always, we recommend checking out our individual reviews on the MSI GE75 Raider 8SF and Asus ROG GL704GW for more pictures, comparisons, and details on each.
| MSI GE75 Raider 8SF | Asus ROG Strix Scar II GL704GW | |
|---|---|---|
| Advantages | + Brighter display + More accurate colors + Per-key RGB lighting + Quieter fans during low-medium loads + Cooler CPU and GPU temperatures + Dedicated S/PDIF port + More internal storage bays + Louder speakers + Lighter | + More rigid chassis |
| Cinebench R15 | |
| CPU Single 64Bit | |
| Asus ROG Strix Scar II GL704GW | |
| Average Intel Core i7-8750H (163 - 177, n=86) | |
| MSI GE75 8SF | |
| CPU Multi 64Bit | |
| Asus ROG Strix Scar II GL704GW | |
| Average Intel Core i7-8750H (863 - 1251, n=93) | |
| MSI GE75 8SF | |
CineBench R15 Multi-Thread Loop Stress Test
| 3DMark | |
| 1920x1080 Fire Strike Graphics | |
| MSI GE75 8SF | |
| Average NVIDIA GeForce RTX 2070 Mobile (18169 - 21138, n=19) | |
| Asus ROG Strix Scar II GL704GW | |
| 2560x1440 Time Spy Graphics | |
| MSI GE75 8SF | |
| Average NVIDIA GeForce RTX 2070 Mobile (7006 - 8028, n=18) | |
| Asus ROG Strix Scar II GL704GW | |
| 2560x1440 Port Royal Graphics | |
| Average NVIDIA GeForce RTX 2070 Mobile (3958 - 4627, n=13) | |
| MSI GE75 8SF | |
| 3DMark 11 - 1280x720 Performance GPU | |
| MSI GE75 8SF | |
| Average NVIDIA GeForce RTX 2070 Mobile (23335 - 27298, n=21) | |
| Asus ROG Strix Scar II GL704GW | |
| PCMark 10 | |
| Score | |
| Asus ROG Strix Scar II GL704GW | |
| MSI GE75 8SF | |
| Essentials | |
| Asus ROG Strix Scar II GL704GW | |
| MSI GE75 8SF | |
| Productivity | |
| Asus ROG Strix Scar II GL704GW | |
| MSI GE75 8SF | |
| Digital Content Creation | |
| Asus ROG Strix Scar II GL704GW | |
| MSI GE75 8SF | |
| PCMark 8 | |
| Home Score Accelerated v2 | |
| Asus ROG Strix Scar II GL704GW | |
| MSI GE75 8SF | |
| Work Score Accelerated v2 | |
| Asus ROG Strix Scar II GL704GW | |
| MSI GE75 8SF | |
| MSI GE75 8SF i7-8750H, GeForce RTX 2070 Mobile, Kingston RBUSNS8154P3256GJ1, IPS, 1920x1080, 17.3" | Asus ROG Strix Scar II GL704GW i7-8750H, GeForce RTX 2070 Mobile, Intel SSD 660p SSDPEKNW512G8, AHVA, 1920x1080, 17.3" | |
|---|---|---|
| Power Consumption | ||
| Idle Minimum * (Watt) | 16.4 | 19 |
| Idle Average * (Watt) | 21.9 | 22 |
| Idle Maximum * (Watt) | 25.4 | 29 |
| Load Average * (Watt) | 90.7 | 102 |
| Witcher 3 ultra * (Watt) | 203.3 | 190 |
| Load Maximum * (Watt) | 222.9 | 231 |
* ... smaller is better
| MSI GE75 8SF i7-8750H, GeForce RTX 2070 Mobile, 65 Wh | Asus ROG Strix Scar II GL704GW i7-8750H, GeForce RTX 2070 Mobile, 66 Wh | |
|---|---|---|
| Battery runtime | ||
| WiFi v1.3 (h) | 3.5 | 3.9 |
| Reader / Idle (h) | 6.2 | |
| Witcher 3 ultra (h) | 0.9 | |
| Load (h) | 1.1 |
| MSI GE75 8SF Chi Mei N173HCE-G33, , 1920x1080, 17.3" | Asus ROG Strix Scar II GL704GW B173HAN04.0 (AUO409D), , 1920x1080, 17.3" | |
|---|---|---|
| Display | ||
| Display P3 Coverage (%) | 63.1 | 62.9 |
| sRGB Coverage (%) | 94.4 | 87.1 |
| AdobeRGB 1998 Coverage (%) | 65.2 | 63.7 |
| Response Times | ||
| Response Time Grey 50% / Grey 80% * (ms) | 9.6 ? | 17.6 ? |
| Response Time Black / White * (ms) | 10.4 ? | 11.2 ? |
| PWM Frequency (Hz) | 25770 ? | |
| Screen | ||
| Brightness middle (cd/m²) | 370.4 | 295 |
| Brightness (cd/m²) | 348 | 291 |
| Brightness Distribution (%) | 89 | 96 |
| Black Level * (cd/m²) | 0.29 | 0.24 |
| Contrast (:1) | 1277 | 1229 |
| Colorchecker dE 2000 * | 1.26 | 3.2 |
| Colorchecker dE 2000 max. * | 3.02 | 6.64 |
| Colorchecker dE 2000 calibrated * | 1.21 | 2.52 |
| Greyscale dE 2000 * | 1.4 | 2.16 |
| Gamma | 2.2 100% | 2.46 89% |
| CCT | 6747 96% | 6872 95% |
| Color Space (Percent of AdobeRGB 1998) (%) | 59.7 | 57 |
| Color Space (Percent of sRGB) (%) | 94.4 | 87 |
| Total Average (Program / Settings) |
* ... smaller is better
| MSI GE75 8SF GeForce RTX 2070 Mobile, i7-8750H, Kingston RBUSNS8154P3256GJ1 | Asus ROG Strix Scar II GL704GW GeForce RTX 2070 Mobile, i7-8750H, Intel SSD 660p SSDPEKNW512G8 | |
|---|---|---|
| Noise | ||
| off / environment * (dB) | 28.3 | 29 |
| Idle Minimum * (dB) | 33.5 | 29 |
| Idle Average * (dB) | 33.6 | 32 |
| Idle Maximum * (dB) | 35 | 40 |
| Load Average * (dB) | 38 | 46 |
| Witcher 3 ultra * (dB) | 50 | 51 |
| Load Maximum * (dB) | 56.9 | 52 |
* ... smaller is better
Source(s)
