Notebookcheck Logo

Apple M3 Pro 12-Core vs Intel Core i5-8350U vs Intel Core i7-8650U

Apple M3 Pro 12-Core

► remove from comparison Apple Apple M3 Pro 12-Core

The Apple M3 Pro (12 Core) is a system on a chip (SoC) from Apple for notebooks that was launched in late 2023. It integrates a new 12-core CPU with 6 performance cores with up to 4.06 GHz and 6 efficiency cores with 2.8 GHz. There is also a slimmed-down 11-core variant with a 14-core GPU.

Compared to the M2 Pro the M3 Pro has been slimmed down somewhat and swaps two performance cores for efficiency cores. This is due to the changed core configuration, as 6 cores are now used per cluster (the M2 Pro and M3 still have 4 cores per cluster). Furthermore, the memory bus has been reduced from 256 bits to 192 bits (150 GB/s vs. 200 GB/s). However, thanks to the new architecture and higher clock rates, the new M3 Pro is still slightly faster.

The M3 Pro also integrates a new graphics card with dynamic caching, mesh shading and ray tracing acceleration via hardware. In the top model, all 18 cores of the chip are used and support up to 3 displays simultaneously (internal and 2 external).

GPU and CPU can jointly access the shared memory on the package (unified memory). This is available in 18 or 36 GB variants and offers 150 GB/s maximum bandwidth (192 bit bus).

The integrated 16-core Neural Engine has also been revised and now offers 18 TOPS peak performance (compared to 15.8 TOPS in the M2 but 35 TOPS in the new A17 Pro). The video engine now also supports AV1 decoding in hardware. H.264, HEVC and ProRes (RAW) can still be decoded and encoded.

Unfortunately, the integrated WLAN only continues to support WiFi 6E (no WiFi 7), unlike the small M3 SoC thunderbolt 4 is also supported (max 40 Gbit/s).

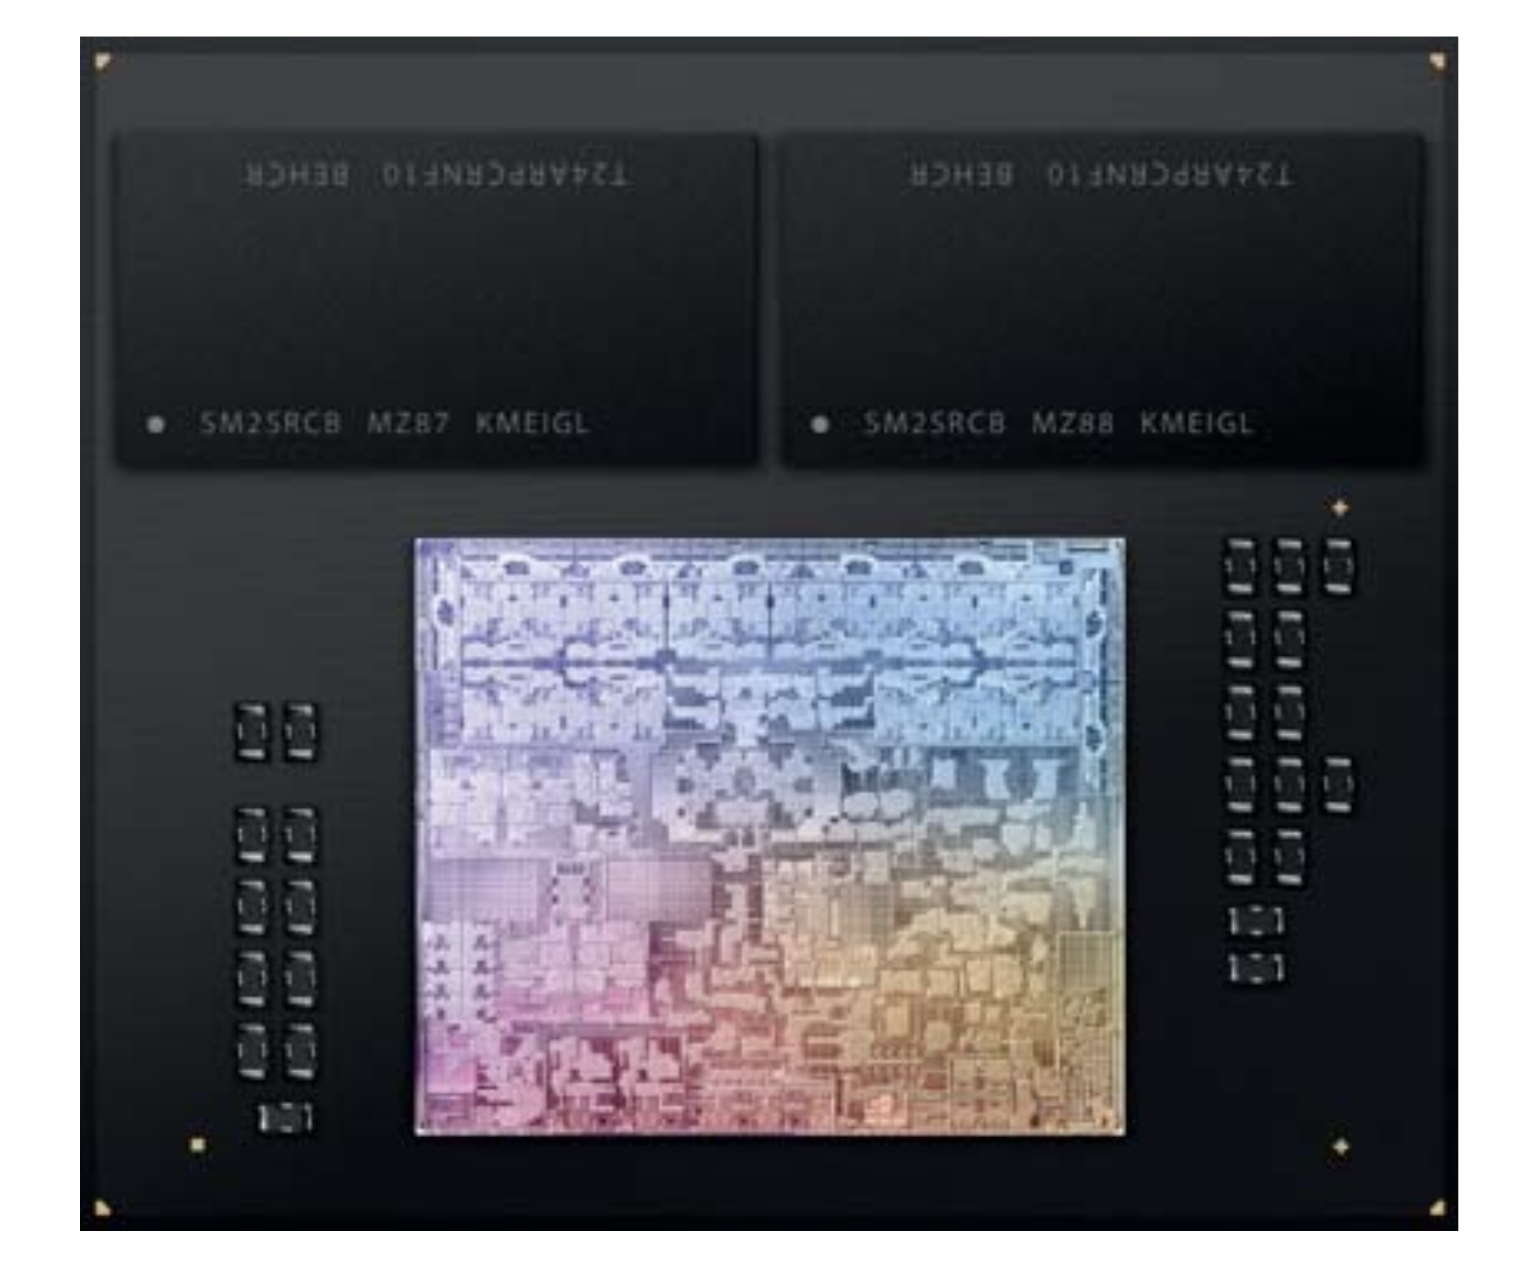
The chip is manufactured in the current 3nm process (N3B) at TSMC and contains 37 billion transistors (-7.5% vs. Apple M2 Pro).

Intel Core i5-8350U

► remove from comparison Intel i5-8350U

The Intel Core i5-8350U is a power efficient quad-core SoC for notebooks and Ultrabooks based on the Kaby Lake Refresh generation and was announced in August 2017. Contrary to its direct predecessor the Core i5-7300U, which were still dual-cores, the i7-8350U is equipped with four cores but at a lower base frequency of 1.7 GHz. The Turbo Boost can go up to 3,6 GHz and therefore also offer good short term single core speeds. The GPU is now named Intel UHD Graphics 620 but otherwise identical to the Intel HD Graphics 620. The integrated memory controller supports DDR4-2400 / LPDDR3-2133 and dual channel memory.

Architecture

Intel basically uses the same micro architecture compared to Skylake, so the per-MHz performance does not differ. The manufacturer only reworked the Speed Shift technology for faster dynamic adjustments of voltages and clocks, and the improved 14nm process allows much higher frequencies combined with better efficiency than before.

Performance

According to Intel, the new quad core models are up to 40% faster than their dual core predecessors. Due to the reduced TDP and the same 14nm+ process, the long term performance and throttling behaviour will be interesting and depending on the laptop design. Therefore, the older 35 Watt quad-core models should be faster in applications that demand longer CPU loads.

Graphics

The integrated Intel UHD Graphics 620 (Intel Gen 9.5) is untouched from the 8th Gen Kaby Lake chips. With fast dual-channel memory it can reach the performance of a dedicated GeForce 920M.

Contrary to Skylake, Kaby lake now also supports H.265/HEVC Main 10 with a 10-bit color depth as well as Google's VP9 codec. The dual-core Kaby Lake processors announced in January should also support HDCP 2.2.

Power Consumption

The chip is manufactured in an improved 14nm process with FinFET transistors (14nm+), the same as the 7th Gen Kaby Lake processors. Intel still specifies the TDP with 15 Watts, which is typical for ULV chips. Depending on the usage scenario, the TDP can vary between 7.5 (cTDP Down) and 25 Watts.

Intel Core i7-8650U

► remove from comparison Intel i7-8650U

The Intel Core i7-8650U is a power efficient quad-core SoC for notebooks and Ultrabooks based on the Kaby Lake Refresh generation and was announced in August 2017. Contrary to its direct predecessor the Core i7-7600U, which were still dual-cores, the i7-8650U is equipped with four cores but at a lower base frequency of 1.9 GHz. The Turbo Boost can go up to 4,2 GHz and therefore also offer good short term single core speeds. The GPU is now named Intel UHD Graphics 620 but otherwise identical to the Intel HD Graphics 620. The integrated memory controller supports DDR4-2400 / LPDDR3-2133 and dual channel memory.

Architecture

Intel basically uses the same micro architecture compared to Skylake, so the per-MHz performance does not differ. The manufacturer only reworked the Speed Shift technology for faster dynamic adjustments of voltages and clocks, and the improved 14nm process allows much higher frequencies combined with better efficiency than before.

Performance

According to Intel, the new quad core models are up to 40% faster than their dual core predecessors. Due to the reduced TDP and the same 14nm+ process, the long term performance and throttling behaviour will be interesting and depending on the laptop design. Therefore, the older 35 Watt quad-core models should be faster in applications that demand longer CPU loads. The performance however is highly depending on the TDP settings and cooling solution of the laptop. Especially, longer loads will show varying results in different laptops.

Graphics

The integrated Intel UHD Graphics 620 (Intel Gen 9.5) is untouched from the 8th Gen Kaby Lake chips. With fast dual-channel memory it can reach the performance of a dedicated GeForce 920M.

Contrary to Skylake, Kaby lake now also supports H.265/HEVC Main 10 with a 10-bit color depth as well as Google's VP9 codec. The dual-core Kaby Lake processors announced in January should also support HDCP 2.2.

Power Consumption

The chip is manufactured in an improved 14nm process with FinFET transistors (14nm+), the same as the 7th Gen Kaby Lake processors. Intel still specifies the TDP with 15 Watts, which is typical for ULV chips. Depending on the usage scenario, the TDP can vary between 7.5 (cTDP Down) and 25 Watts.

ModelApple M3 Pro 12-CoreIntel Core i5-8350UIntel Core i7-8650U
SeriesApple Apple M3Intel Kaby Lake RefreshIntel Kaby Lake Refresh
Series: Kaby Lake Refresh Kaby Lake Refresh
Apple M3 Max 16-Core2.75 - 4.06 GHz16 / 16 cores
Apple M3 Max 14-Core2.75 - 4.06 GHz14 / 14 cores
Apple M3 Pro 12-Core « 2.75 - 4.06 GHz12 / 12 cores
Apple M3 Pro 11-Core2.75 - 4.06 GHz11 / 11 cores
Apple M32.75 - 4.06 GHz8 / 8 cores
Intel Core i7-8650U1.9 - 4.2 GHz4 / 8 cores8 MB L3
Intel Core i7-8550U1.8 - 4 GHz4 / 8 cores8 MB L3
Intel Core i5-8350U « 1.7 - 3.6 GHz4 / 8 cores6 MB L3
Intel Core i5-8250U1.6 - 3.4 GHz4 / 8 cores6 MB L3
Intel Core i3-8130U2.2 - 3.4 GHz2 / 4 cores4 MB L3
Intel Pentium Gold 4417U2.3 GHz2 / 4 cores2 MB L3
Intel Core i7-8650U « 1.9 - 4.2 GHz4 / 8 cores8 MB L3
Intel Core i7-8550U1.8 - 4 GHz4 / 8 cores8 MB L3
Intel Core i5-8350U1.7 - 3.6 GHz4 / 8 cores6 MB L3
Intel Core i5-8250U1.6 - 3.4 GHz4 / 8 cores6 MB L3
Intel Core i3-8130U2.2 - 3.4 GHz2 / 4 cores4 MB L3
Intel Pentium Gold 4417U2.3 GHz2 / 4 cores2 MB L3
Clock2748 - 4056 MHz1700 - 3600 MHz1900 - 4200 MHz
Cores / Threads12 / 12
6 x 4.1 GHz Apple M3 P-Core
6 x 2.7 GHz Apple M3 E-Core
4 / 84 / 8
TDP27 Watt15 Watt15 Watt
Transistors37000 Million
Technology3 nm14 nm14 nm
FeaturesARMv8 Instruction SetDual-Channel DDR4 Memory Controller, HyperThreading, AVX, AVX2, Quick Sync, Virtualization, AES-NIDual-Channel DDR4 Memory Controller, HyperThreading, AVX, AVX2, Quick Sync, Virtualization, AES-NI
iGPUApple M3 Pro 18-Core GPUIntel UHD Graphics 620 (300 - 1100 MHz)Intel UHD Graphics 620 (300 - 1150 MHz)
ArchitectureARMx86x86
Announced
Manufacturerwww.apple.comark.intel.com
CodenameKaby Lake RefreshKaby Lake Refresh
L1 Cache256 KB256 KB
L2 Cache1 MB1 MB
L3 Cache6 MB8 MB
SocketBGA1356BGA1356
$297 U.S.$409 U.S.

Benchmarks

Cinebench 2024 - CB24 CPU Single Core
143 Points (99%)
Cinebench 2024 - CB24 CPU Multi Core
1059 Points (20%)
Cinebench R23 - Cinebench R23 Multi Core
15106 Points (14%)
Cinebench R23 - Cinebench R23 Single Core
1977 Points (84%)
Cinebench R15 - Cinebench R15 CPU Multi 64 Bit
2163 Points (14%)
min: 346     avg: 548     median: 569 (4%)     max: 631 Points
min: 451     avg: 589     median: 605 (4%)     max: 675 Points
Cinebench R15 - Cinebench R15 CPU Single 64 Bit
min: 128     avg: 146.8     median: 150.5 (45%)     max: 153 Points
min: 128     avg: 165     median: 169 (51%)     max: 178 Points
Cinebench R11.5 - Cinebench R11.5 CPU Multi 64 Bit
min: 5.48     avg: 6.3     median: 6 (8%)     max: 7.33 Points
min: 5.04     avg: 6.4     median: 6.8 (9%)     max: 7.24 Points
Cinebench R11.5 - Cinebench R11.5 CPU Single 64 Bit
min: 1.62     avg: 1.7     median: 1.7 (42%)     max: 1.71 Points
min: 1.67     avg: 1.9     median: 1.9 (48%)     max: 2.04 Points
Cinebench R10 - Cinebench R10 Rend. Single (32bit)
min: 5152     avg: 5461     median: 5460.5 (33%)     max: 5769 Points
min: 5307     avg: 6337     median: 6629 (40%)     max: 6782 Points
Cinebench R10 - Cinebench R10 Rend. Multi (32bit)
min: 16222     avg: 17931     median: 17931 (13%)     max: 19640 Points
min: 16227     avg: 18738     median: 18635 (14%)     max: 21455 Points
Cinebench R10 - Cinebench R10 Rend. Multi (64bit)
28684 Points (20%)
21677 Points (15%)
Cinebench R10 - Cinebench R10 Rend. Single (64bit)
7593 Points (9%)
6864 Points (8%)
wPrime 2.10 - wPrime 2.0 1024m *
min: 305.7     avg: 330.5     median: 330.5 (4%)     max: 355.2 s
min: 268.3     avg: 301.9     median: 302.8 (4%)     max: 334.6 s
wPrime 2.10 - wPrime 2.0 32m *
min: 7.517     avg: 9.7     median: 9.7 (2%)     max: 11.89 s
min: 8.636     avg: 9.6     median: 9.9 (2%)     max: 10.28 s
wPrime 1.55 - wPrime 1.55 1024m *
413.8 s (2%)
wPrime 1.55 - wPrime 1.55 32m *
10.3 s (5%)
WinRAR - WinRAR 4.0
min: 1960     avg: 2961     median: 2961 (5%)     max: 3962 Points
min: 4140     avg: 4423     median: 4319 (7%)     max: 4915 Points
X264 HD Benchmark 4.0 - x264 Pass 2
min: 34     avg: 37.3     median: 37.3 (13%)     max: 40.55 fps
min: 35     avg: 39.1     median: 39.8 (14%)     max: 41.98 fps
X264 HD Benchmark 4.0 - x264 Pass 1
min: 145     avg: 152.9     median: 152.9 (35%)     max: 160.7 fps
min: 149     avg: 165.4     median: 169.6 (39%)     max: 173.2 fps
TrueCrypt - TrueCrypt Serpent
min: 0.363     avg: 0.4     median: 0.4 (0%)     max: 0.456 GB/s
min: 0.393     avg: 0.4     median: 0.4 (0%)     max: 0.444 GB/s
TrueCrypt - TrueCrypt Twofish
min: 0.623     avg: 0.7     median: 0.7 (12%)     max: 0.754 GB/s
min: 0.662     avg: 0.7     median: 0.7 (12%)     max: 0.733 GB/s
TrueCrypt - TrueCrypt AES
min: 3.7     avg: 4.1     median: 4.1 (11%)     max: 4.4 GB/s
min: 3.9     avg: 4.2     median: 4.3 (11%)     max: 4.4 GB/s
Blender - Blender 3.3 Classroom CPU *
314 Seconds (4%)
Blender - Blender 2.79 BMW27 CPU *
327 Seconds (2%)
705 Seconds (5%)
3DMark 06 - CPU - 3DMark 06 - CPU
min: 5852     avg: 6131     median: 5925 (13%)     max: 6617 Points
min: 4487     avg: 6716     median: 6936 (15%)     max: 7939 Points
Super Pi mod 1.5 XS 1M - Super Pi mod 1.5 XS 1M *
min: 10     avg: 10.9     median: 10.9 (2%)     max: 11.88 s
min: 8     avg: 8.6     median: 8.8 (2%)     max: 9 s
Super Pi mod 1.5 XS 2M - Super Pi mod 1.5 XS 2M *
min: 23     avg: 25.3     median: 25.3 (1%)     max: 27.62 s
min: 19     avg: 19.7     median: 20 (1%)     max: 20.1 s
Super Pi Mod 1.5 XS 32M - Super Pi mod 1.5 XS 32M *
min: 580     avg: 637     median: 637 (3%)     max: 694 s
min: 501     avg: 513     median: 508 (2%)     max: 542 s
3DMark Vantage - 3DM Vant. Perf. CPU no Physx
19125 Points (17%)
3DMark 11 - 3DM11 Performance Physics
min: 4349     avg: 5995     median: 6092 (16%)     max: 7023 Points
min: 5168     avg: 7106     median: 6863 (19%)     max: 8887 Points
3DMark - 3DMark Ice Storm Physics
min: 39950     avg: 43226     median: 43226 (35%)     max: 46502 Points
min: 39040     avg: 42198     median: 41275 (34%)     max: 47797 Points
3DMark - 3DMark Ice Storm Extreme Physics
min: 38261     avg: 42913     median: 42913 (35%)     max: 47565 Points
min: 41011     avg: 43029     median: 41405.5 (34%)     max: 48293 Points
3DMark - 3DMark Ice Storm Unlimited Physics
min: 51828     avg: 52962     median: 53024 (45%)     max: 54034 Points
min: 44090     avg: 52920     median: 56455 (48%)     max: 58675 Points
3DMark - 3DMark Cloud Gate Physics
min: 5408     avg: 6288     median: 6155 (16%)     max: 7190 Points
min: 4442     avg: 5935     median: 6089 (15%)     max: 7416 Points
3DMark - 3DMark Fire Strike Standard Physics
min: 7603     avg: 8941     median: 8945.5 (16%)     max: 10362 Points
min: 6823     avg: 8895     median: 9167 (16%)     max: 10541 Points
3DMark - 3DMark Time Spy CPU
min: 2484     avg: 2537     median: 2537 (11%)     max: 2590 Points
min: 2685     avg: 3010     median: 2876 (12%)     max: 3569 Points
Geekbench 6.2 - Geekbench 6.2 Single-Core
3138 Points (84%)
Geekbench 6.2 - Geekbench 6.2 Multi-Core
15480 Points (61%)
Geekbench 5.5 - Geekbench 5.1 - 5.4 64 Bit Single-Core
2327 Points (98%)
Geekbench 5.5 - Geekbench 5.1 - 5.4 64 Bit Multi-Core
15298 Points (27%)
Geekbench 4.4 - Geekbench 4.1 - 4.4 64 Bit Single-Core
min: 3646     avg: 4185     median: 4225 (42%)     max: 4685 Points
Geekbench 4.4 - Geekbench 4.1 - 4.4 64 Bit Multi-Core
min: 11004     avg: 13358     median: 13605 (15%)     max: 15464 Points
Geekbench 4.0 - Geekbench 4.0 64 Bit Single-Core
min: 4160     avg: 4210     median: 4210 (57%)     max: 4260 Points
Geekbench 4.0 - Geekbench 4.0 64 Bit Multi-Core
min: 12679     avg: 12800     median: 12799.5 (31%)     max: 12920 Points
Geekbench 3 - Geekbench 3 32 Bit Multi-Core
12270 Points (22%)
Geekbench 3 - Geekbench 3 32 Bit Single-Core
3439 Points (67%)
Mozilla Kraken 1.1 - Kraken 1.1 Total Score *
376.2 ms (0%)
min: 1017     avg: 1193     median: 1216 (1%)     max: 1289 ms
min: 809     avg: 1126     median: 1076.5 (1%)     max: 1912 ms
Sunspider - Sunspider 1.0 Total Score *
min: 78.9     avg: 161.1     median: 156.5 (2%)     max: 252.7 ms
min: 63.8     avg: 74.2     median: 74.4 (1%)     max: 83.1 ms
Octane V2 - Octane V2 Total Score
96501 Points (87%)
min: 28223     avg: 32497     median: 31171 (28%)     max: 38722 Points
min: 11491     avg: 31341     median: 33906 (30%)     max: 42822 Points
WebXPRT 3 - WebXPRT 3 Score
427 Points (89%)
min: 164     avg: 183.5     median: 183.5 (38%)     max: 203 Points
227 Points (47%)
PCMark for Android - PCM f. Android Computer Vision
9887 Points (52%)
PCMark for Android - PCM f. Android Storage
15717 Points (34%)
PCMark for Android - PCM f. Android Work Score 2.0
11958 Points (78%)
PCMark for Android - PCM f. Android Work Score
19602 Points (98%)
CrossMark - CrossMark Overall
1977 Points (76%)
Power Consumption - Cinebench R15 Multi Power Consumption - external Monitor *
47.9 Watt (9%)
Power Consumption - Idle Power Consumption - external Monitor *
5.8 Watt (4%)
Power Consumption - Idle Power Consumption 150cd 1min *
7.5 Watt (8%)
Power Consumption - Cinebench R15 Multi Power Efficiency - external Monitor
45.2 Points per Watt (34%)

Average Benchmarks Apple M3 Pro 12-Core → 100% n=4

Average Benchmarks Intel Core i5-8350U → 50% n=4

Average Benchmarks Intel Core i7-8650U → 54% n=4

- Range of benchmark values for this graphics card
- Average benchmark values for this graphics card
* Smaller numbers mean a higher performance
1 This benchmark is not used for the average calculation

v1.27
log 04. 07:43:07

#0 checking url part for id 15115 +0s ... 0s

#1 checking url part for id 9214 +0s ... 0s

#2 checking url part for id 9212 +0s ... 0s

#3 not redirecting to Ajax server +0s ... 0s

#4 did not recreate cache, as it is less than 5 days old! Created at Tue, 04 Jun 2024 05:34:21 +0200 +0.001s ... 0.001s

#5 composed specs +0.04s ... 0.041s

#6 did output specs +0s ... 0.041s

#7 getting avg benchmarks for device 15115 +0.004s ... 0.045s

#8 got single benchmarks 15115 +0.01s ... 0.055s

#9 getting avg benchmarks for device 9214 +0.004s ... 0.059s

#10 got single benchmarks 9214 +0.032s ... 0.092s

#11 getting avg benchmarks for device 9212 +0.005s ... 0.096s

#12 got single benchmarks 9212 +0.057s ... 0.153s

#13 got avg benchmarks for devices +0s ... 0.153s

#14 min, max, avg, median took s +0.47s ... 0.623s

#15 return log +0s ... 0.623s

Please share our article, every link counts!
> Expert Reviews and News on Laptops, Smartphones and Tech Innovations > Benchmarks / Tech > Processor Comparison - Head 2 Head
Redaktion, 2017-09- 8 (Update: 2023-07- 1)