

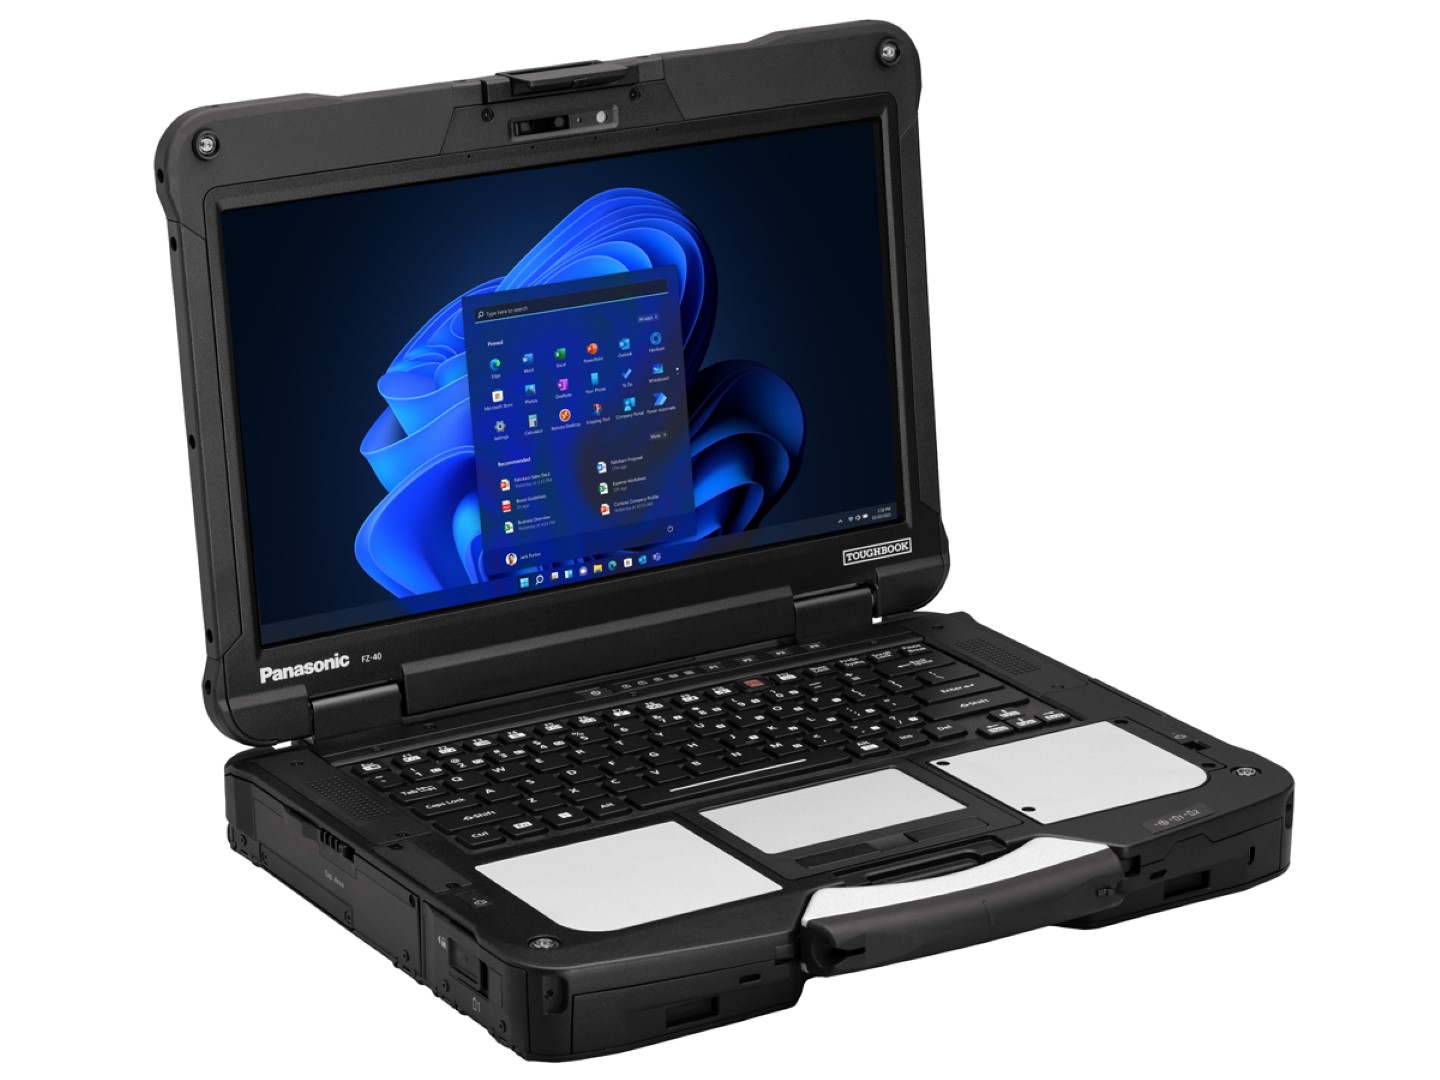
Panasonic Toughbook 40 laptop review: Highly adaptive and modular
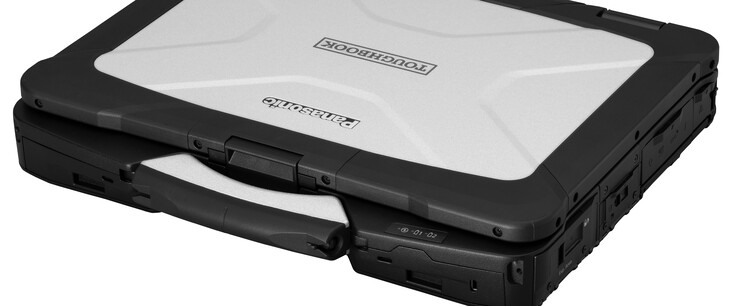
Not to be confused with the smaller 14-inch Toughbook 55, the 14-inch Toughbook 40 is a fully-rugged laptop designed with the ability to support up to four modular xPAK expansion cards to adapt to the needs of the user. These optional cards help separate the Toughbook 40 from competing models such as the Getac S410, Dell Latitude 7400 Rugged series, or the Durabook S14I.
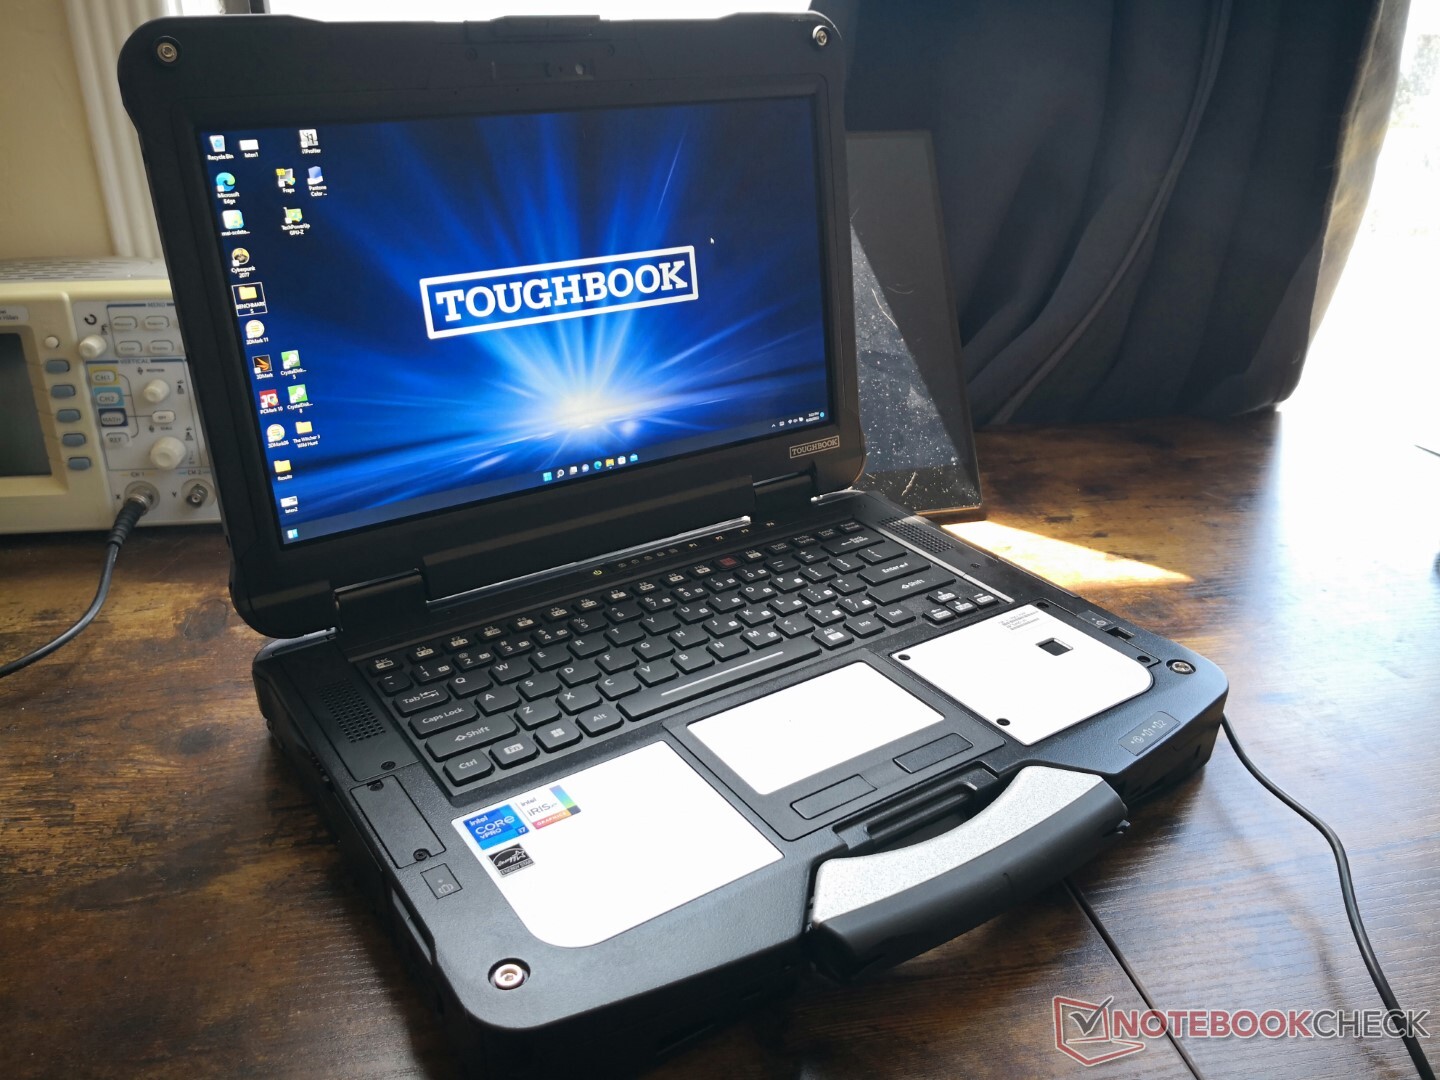
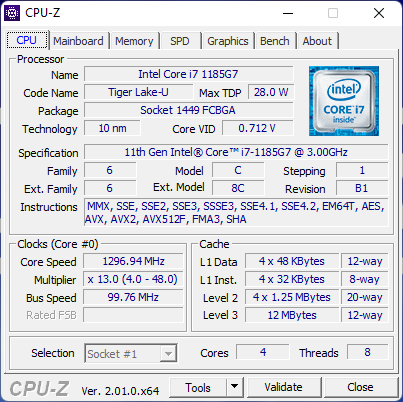
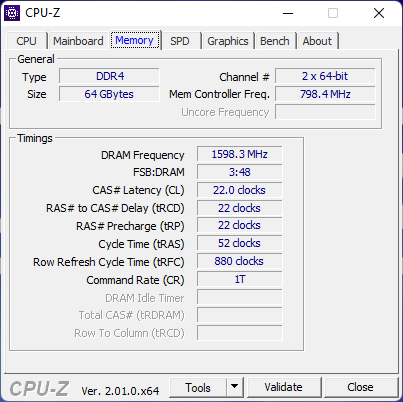
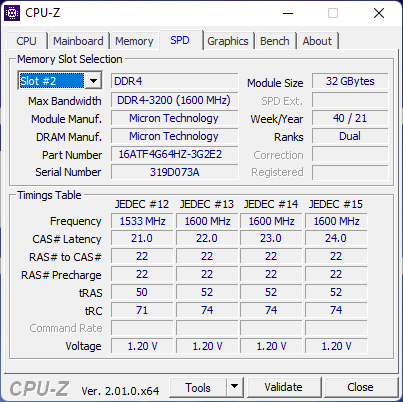
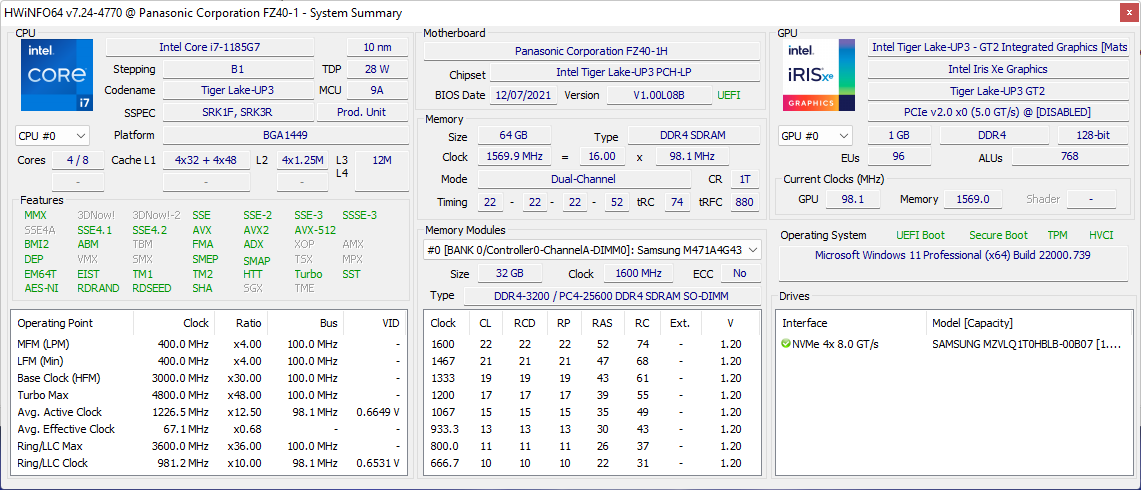
Internally, our test unit comes with equipped with the 11th gen Tiger Lake-U Core i7-1185G7 CPU, 64 GB of RAM, and an ultrabright 1080p IPS display. Additional configurations can be found on the official product page here.
More Panasonic reviews:
- Panasonic FZ-55 MK2
- Panasonic FZ-G2
- Panasonic FZ-S1
- Panasonic FZ-A3
Potential Competitors in Comparison
Rating | Date | Model | Weight | Height | Size | Resolution | Price |
|---|---|---|---|---|---|---|---|
v (old) | 07 / 2022 | Panasonic Toughbook 40 i7-1185G7, Iris Xe G7 96EUs | 3.9 kg | 53.4 mm | 14.00" | 1920x1080 | |
| 83.9 % v7 (old) | 09 / 2021 | Panasonic Toughbook FZ-55 MK2 i7-1185G7, Iris Xe G7 96EUs | 2.3 kg | 33 mm | 14.00" | 1920x1080 | |
| 81.7 % v7 (old) | 05 / 2022 | Getac S410 Gen 4 i7-1185G7, Iris Xe G7 96EUs | 3.2 kg | 34.9 mm | 14.00" | 1920x1080 | |
| 89.2 % v6 (old) | 03 / 2019 | Dell Latitude 5420 Rugged-P85G i7-8650U, Radeon RX 540 | 2.8 kg | 32.9 mm | 14.00" | 1920x1080 | |
| 82.4 % v7 (old) | 12 / 2021 | Acer Enduro Urban N3 EUN314 i7-1165G7, Iris Xe G7 96EUs | 1.8 kg | 21.95 mm | 14.00" | 1920x1080 | |
v (old) | 04 / 2021 | Durabook S14I i7-1165G7, Iris Xe G7 96EUs | 3 kg | 38.1 mm | 14.00" | 1920x1080 |
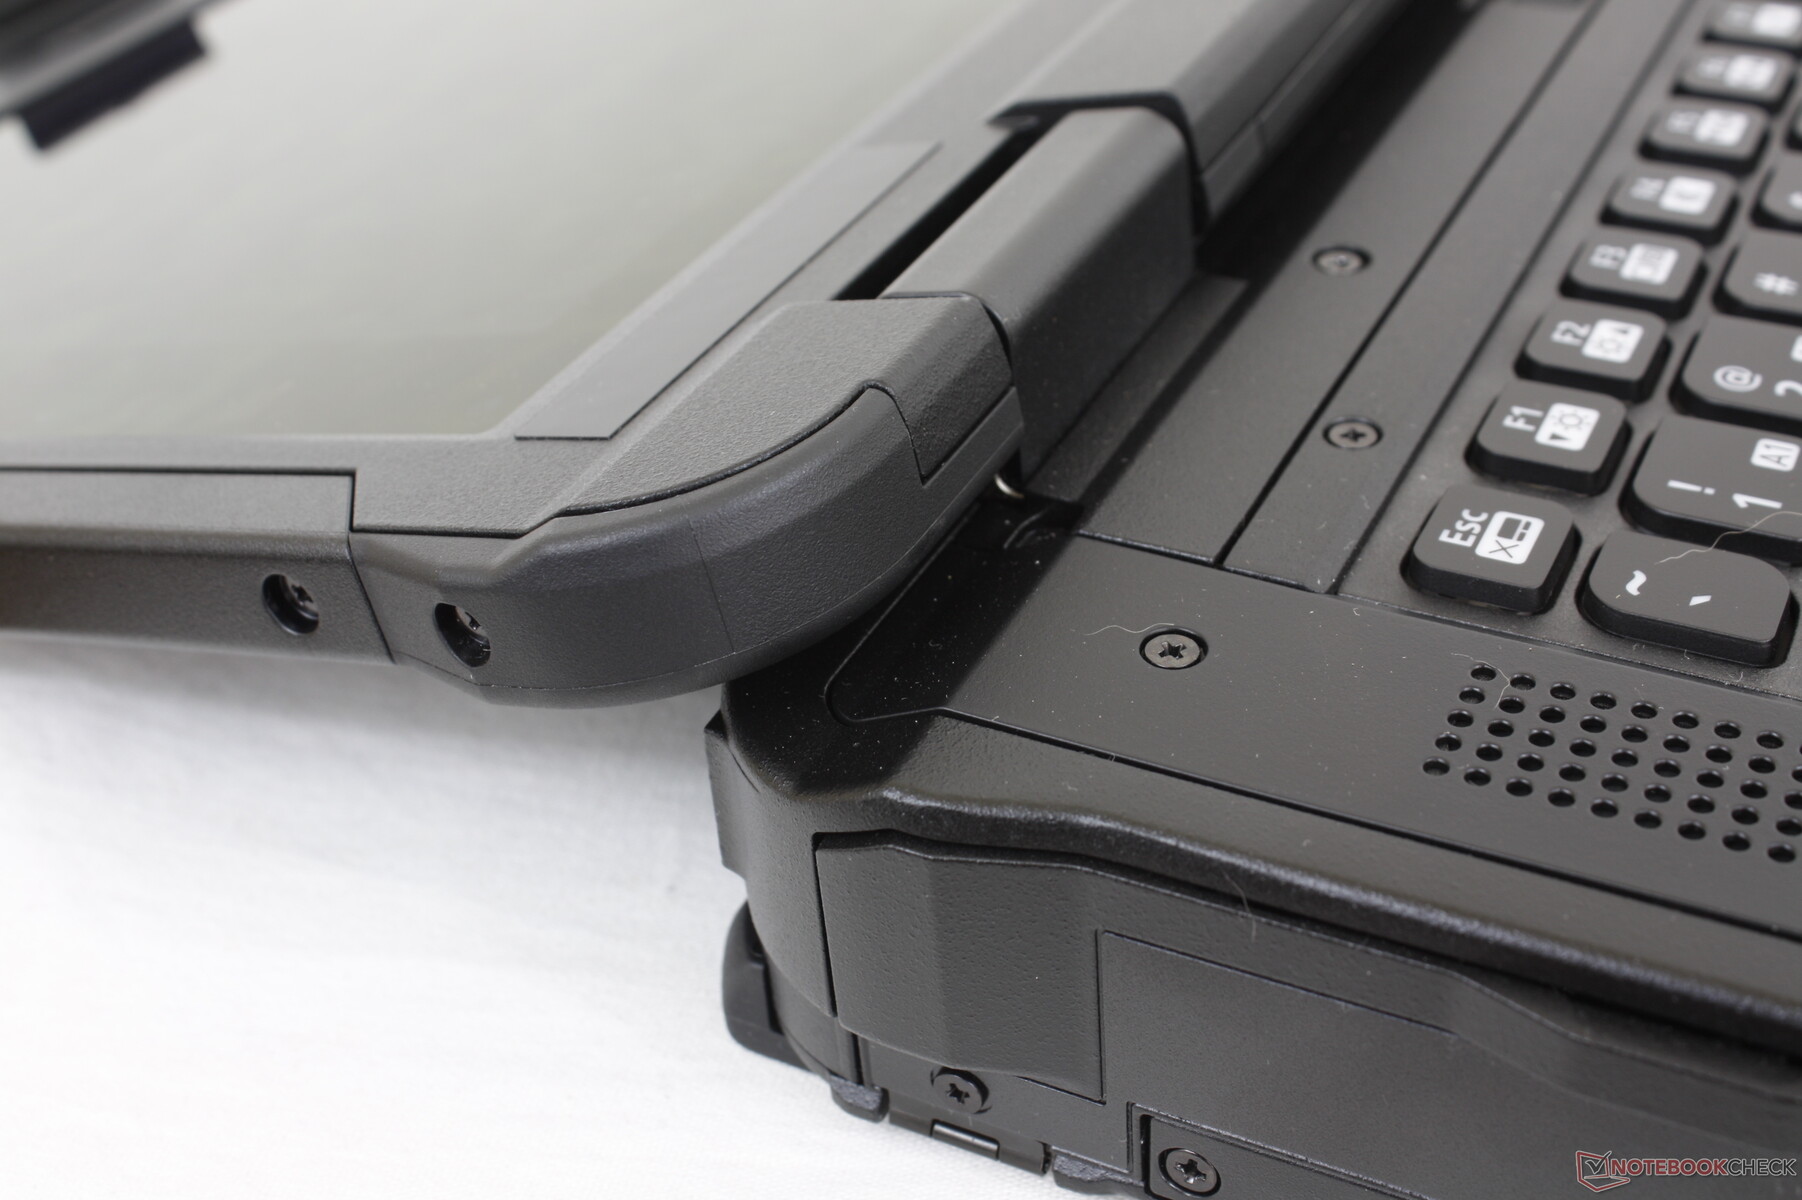
Case
The model is large and heavy as it is a fully-rugged design. The semi-rugged Durabook S14I, for example, offers the same screen size and yet it is almost 1 kg lighter while being smaller in all three dimensions.
Connectivity And xPAK Expansion
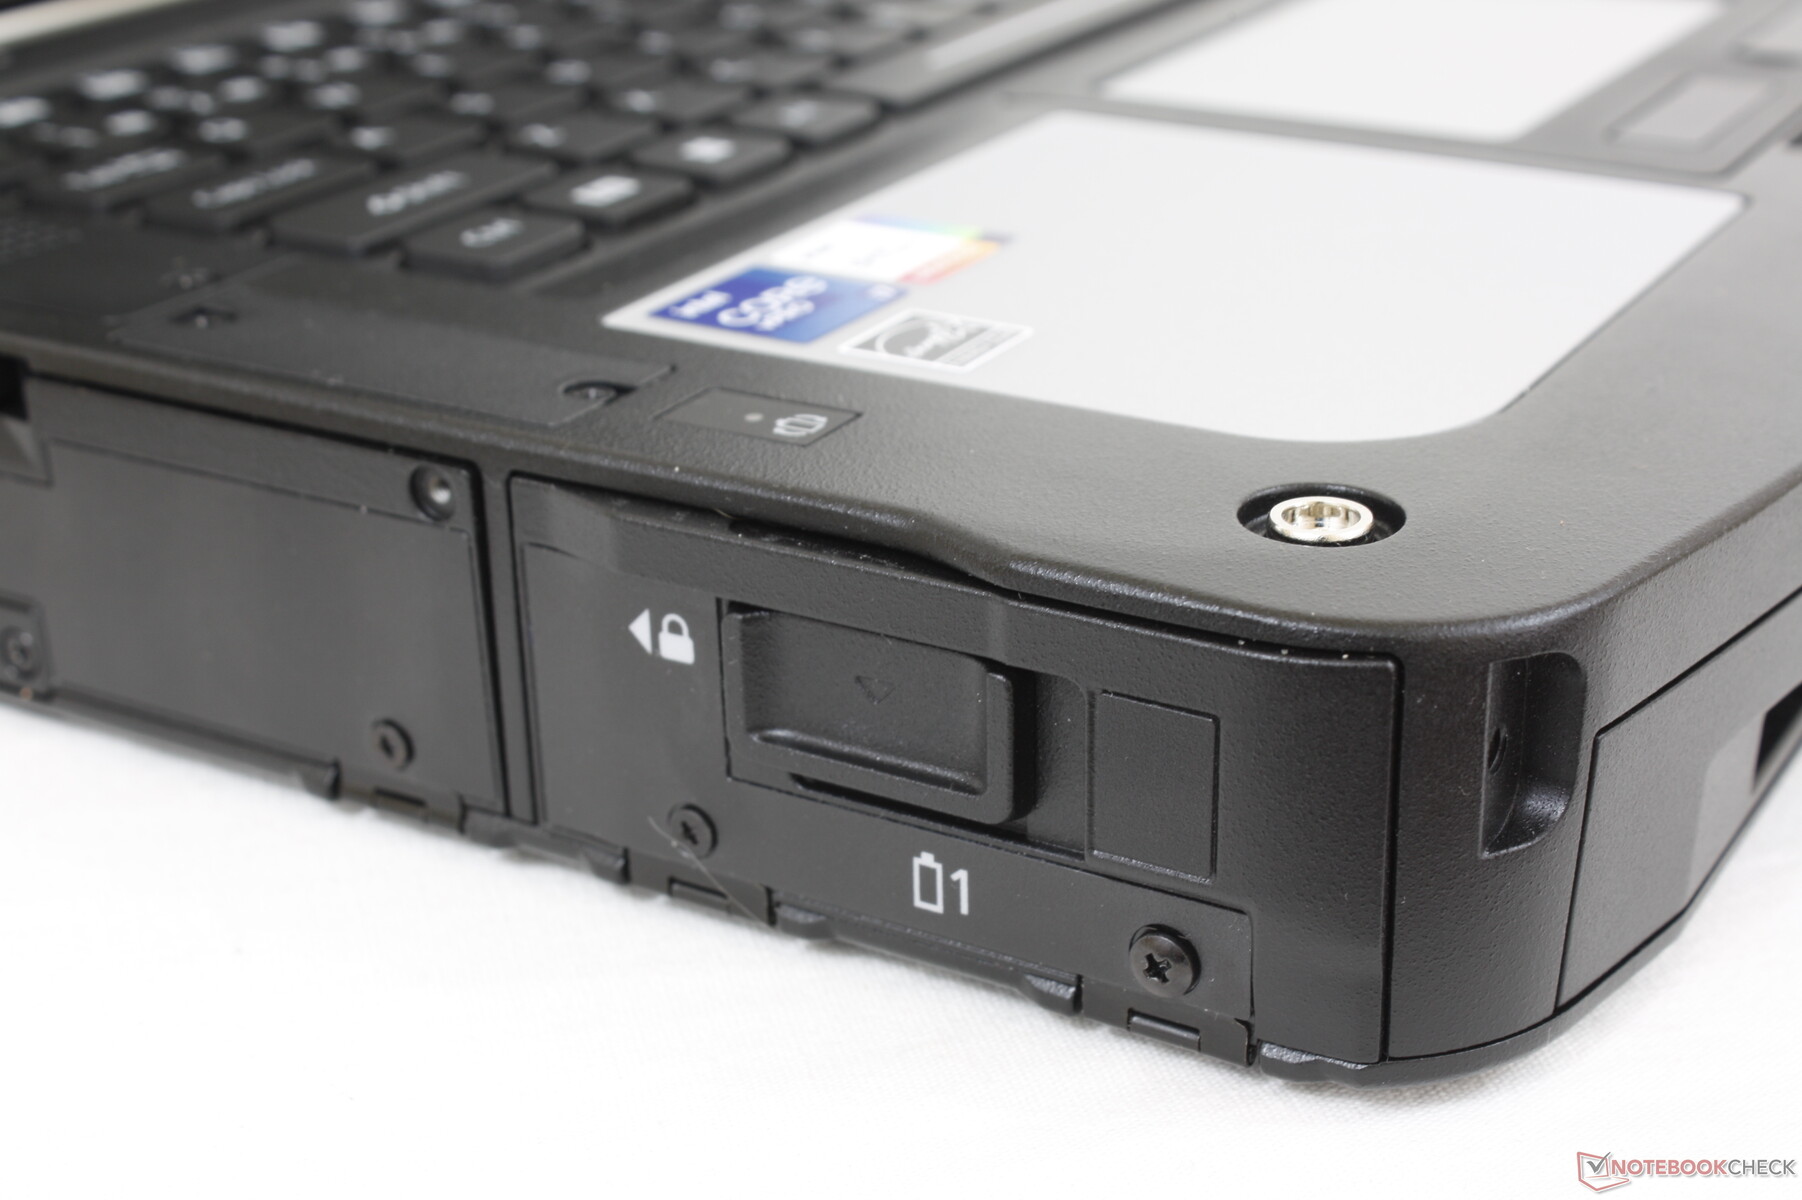
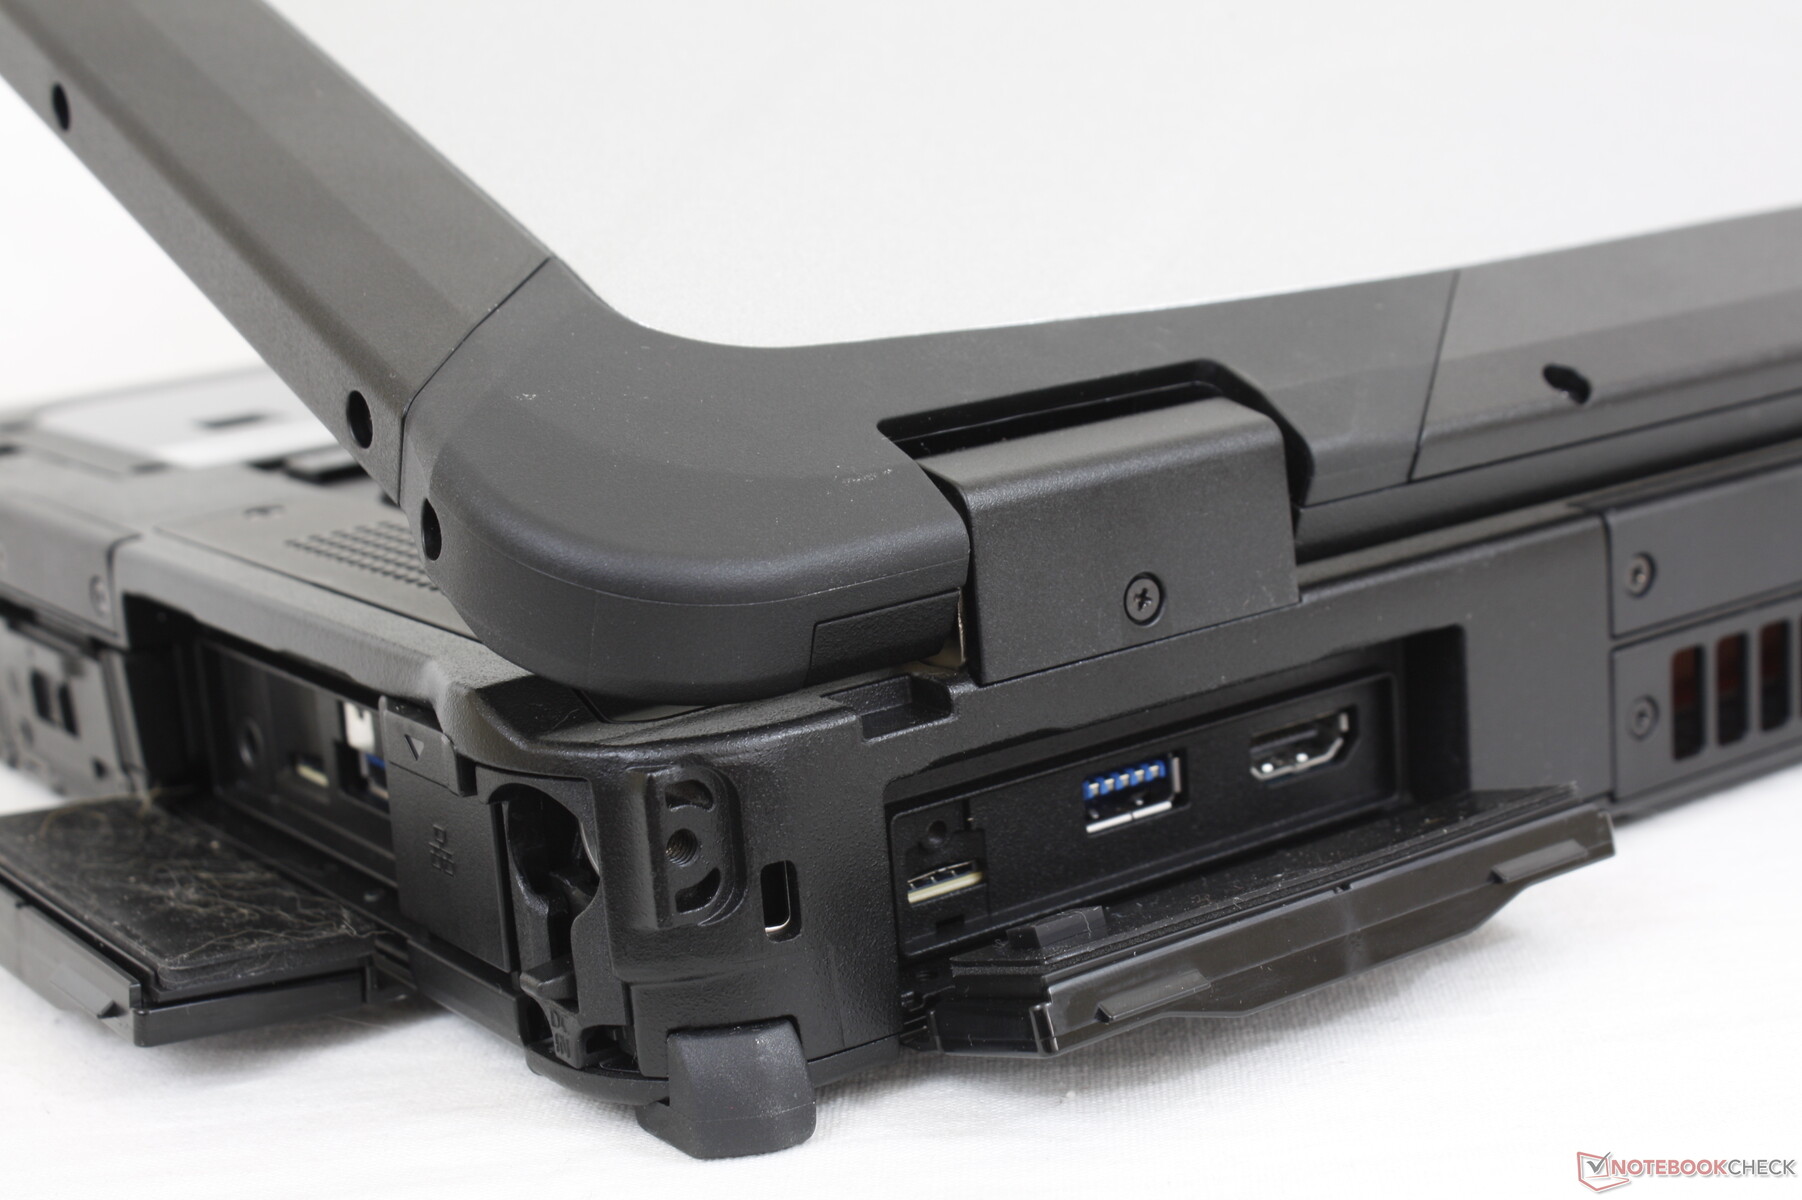
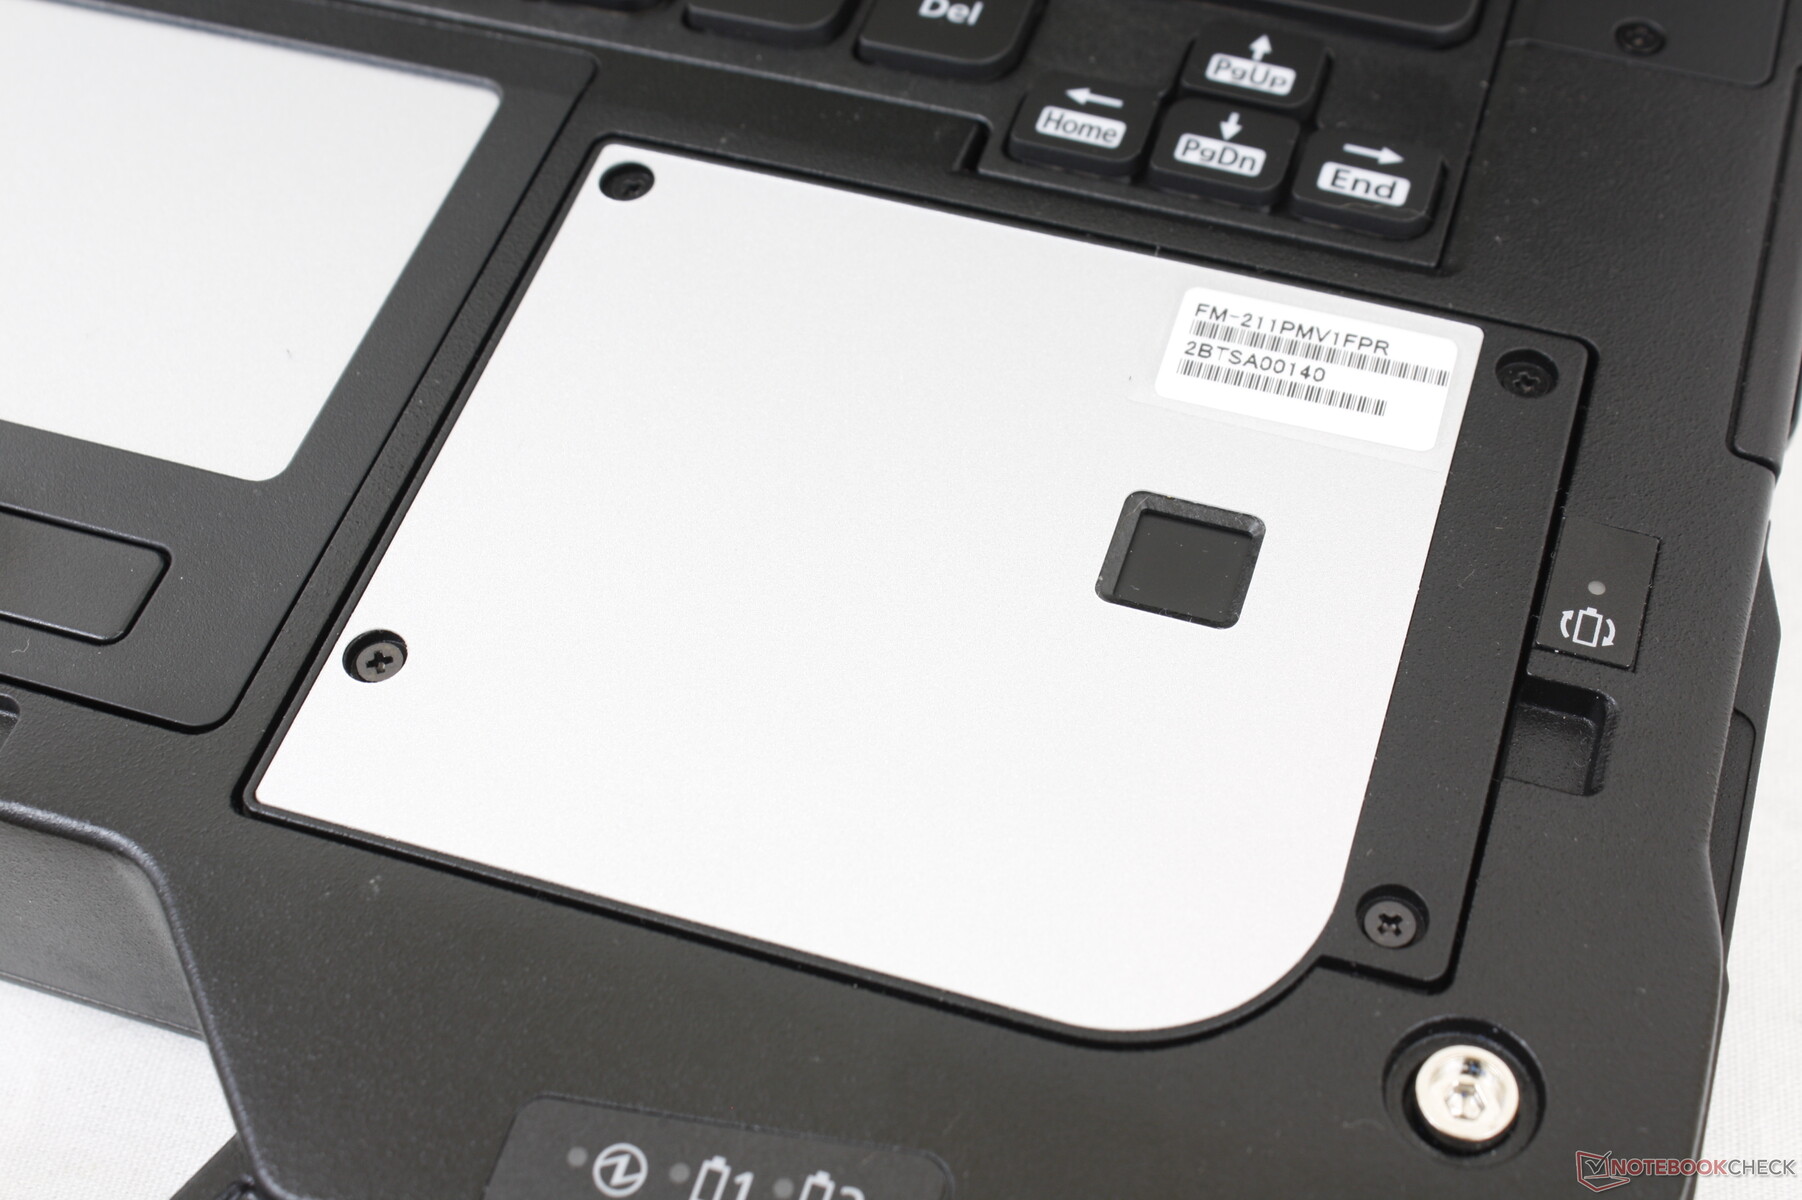
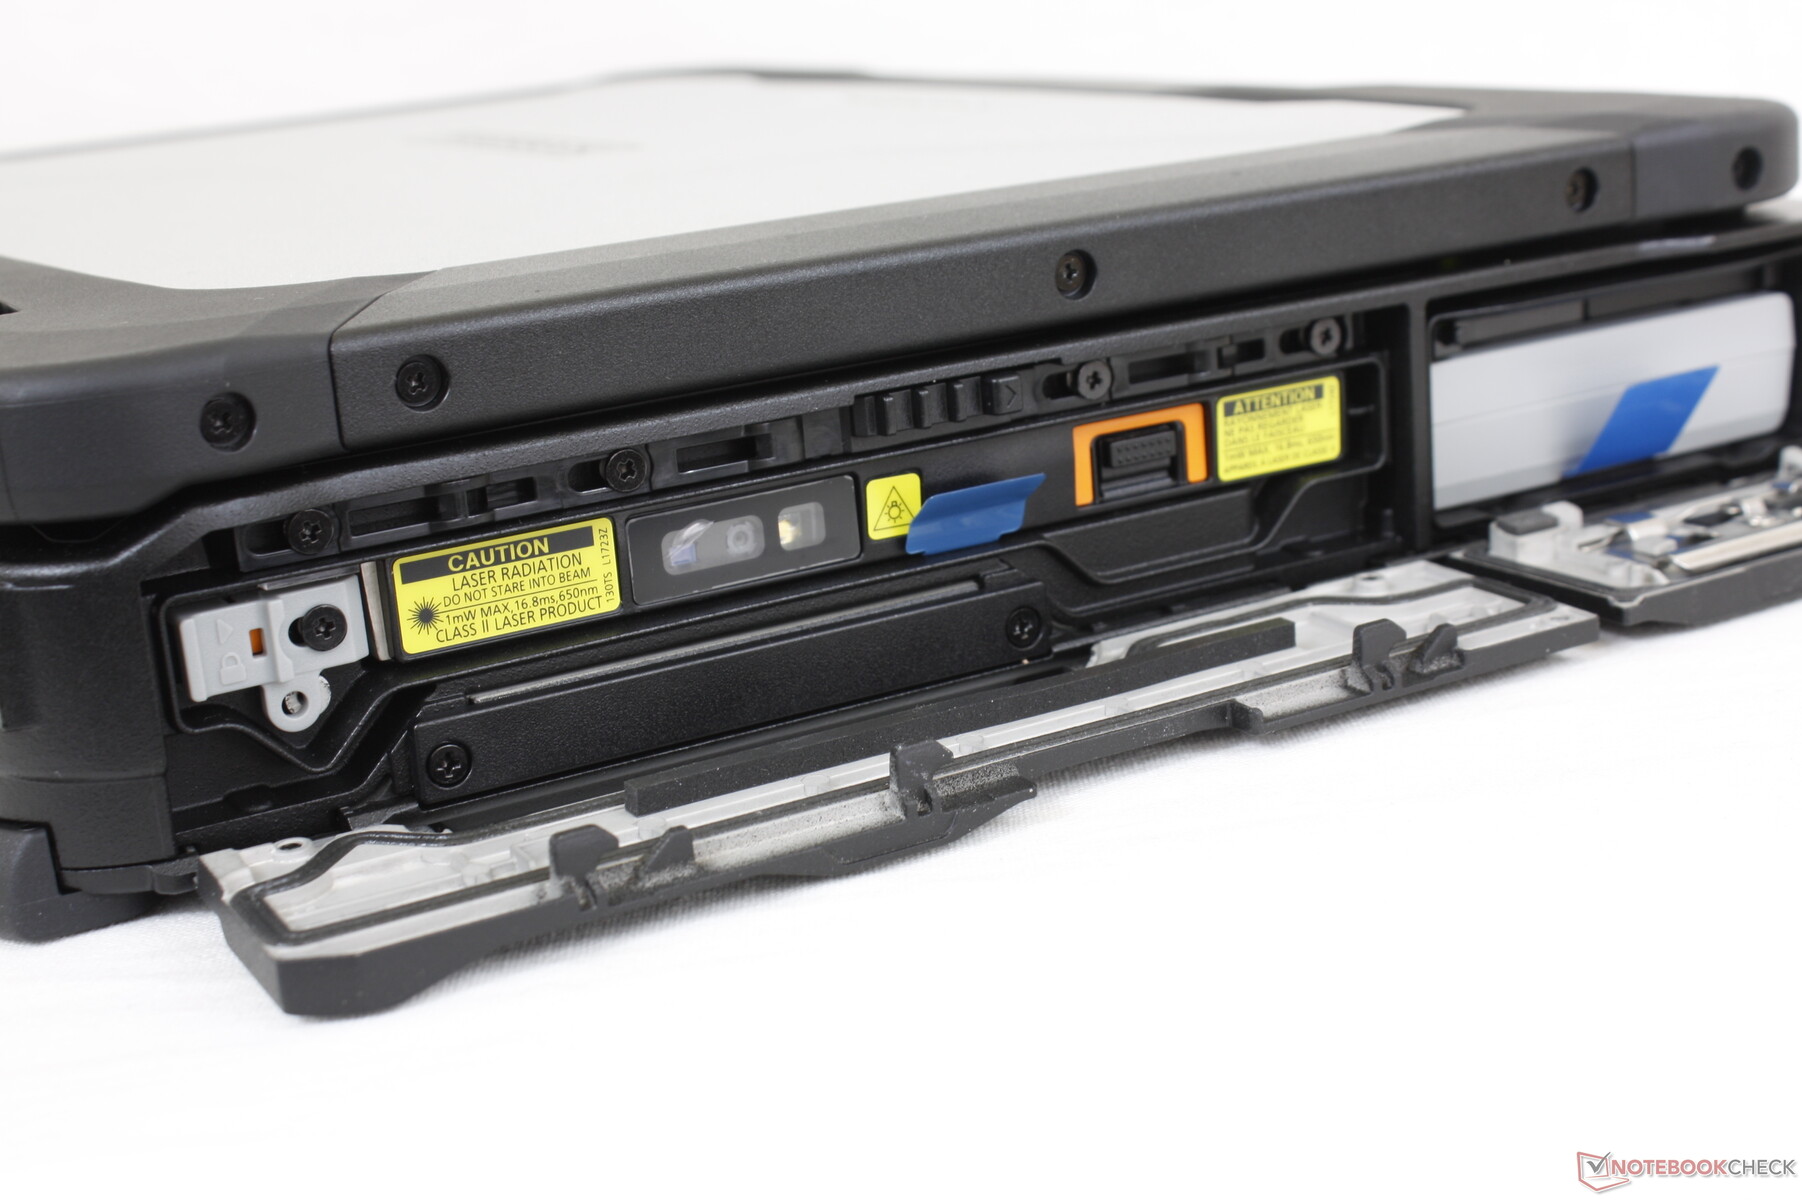
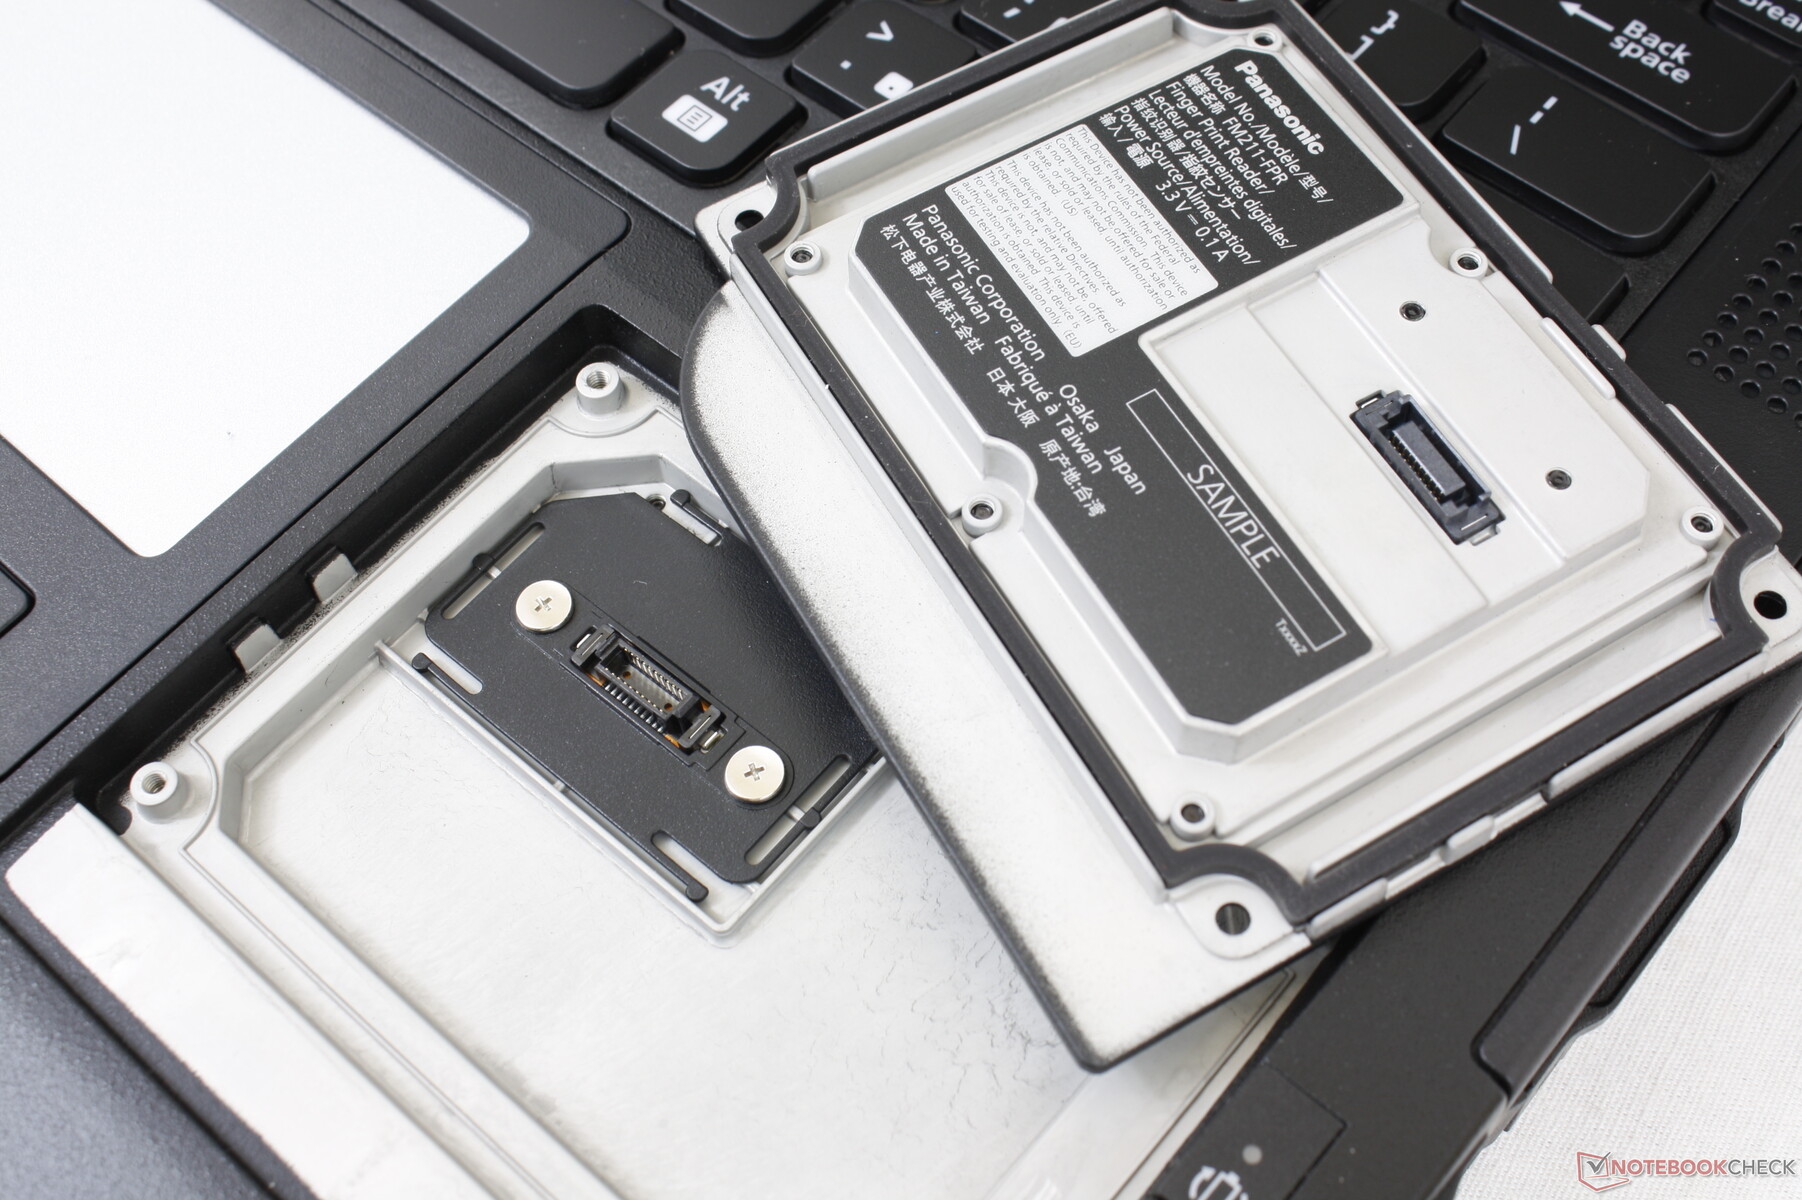
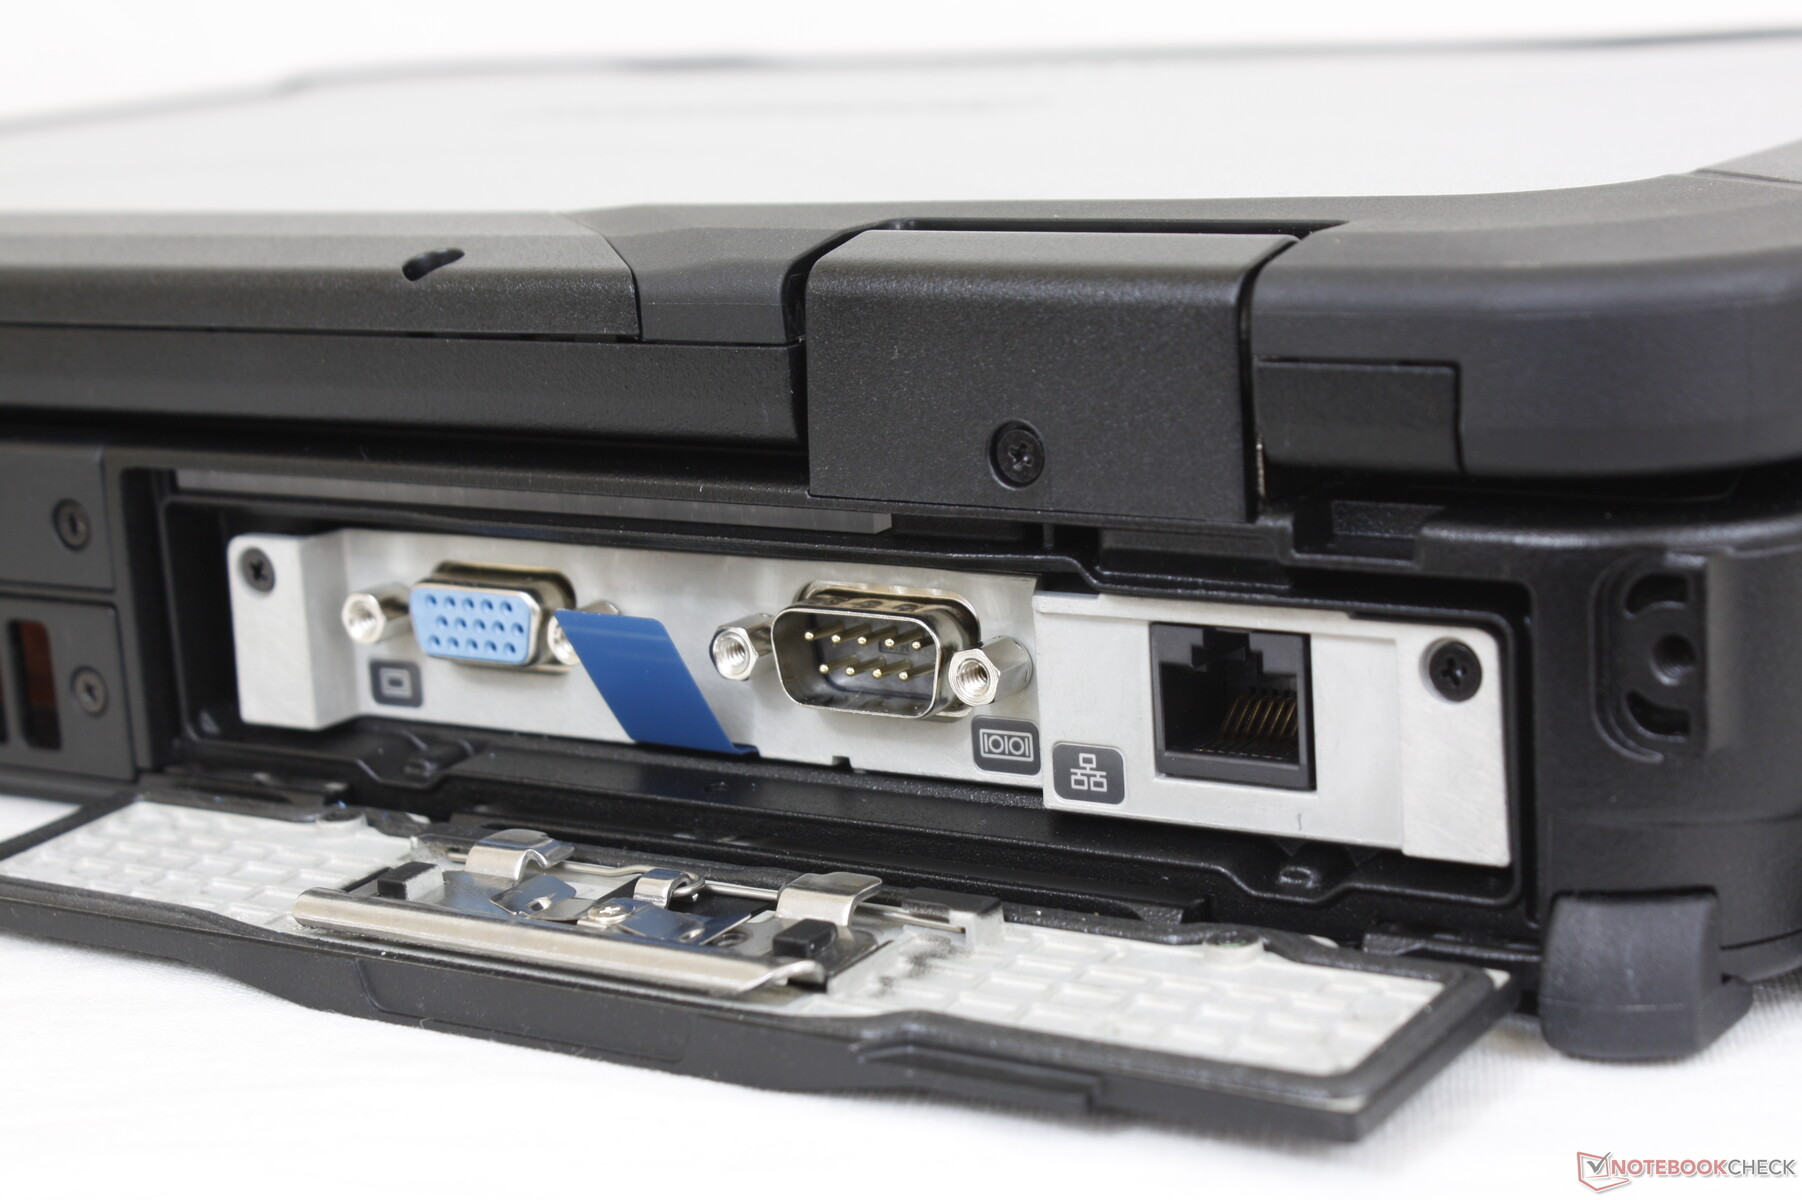
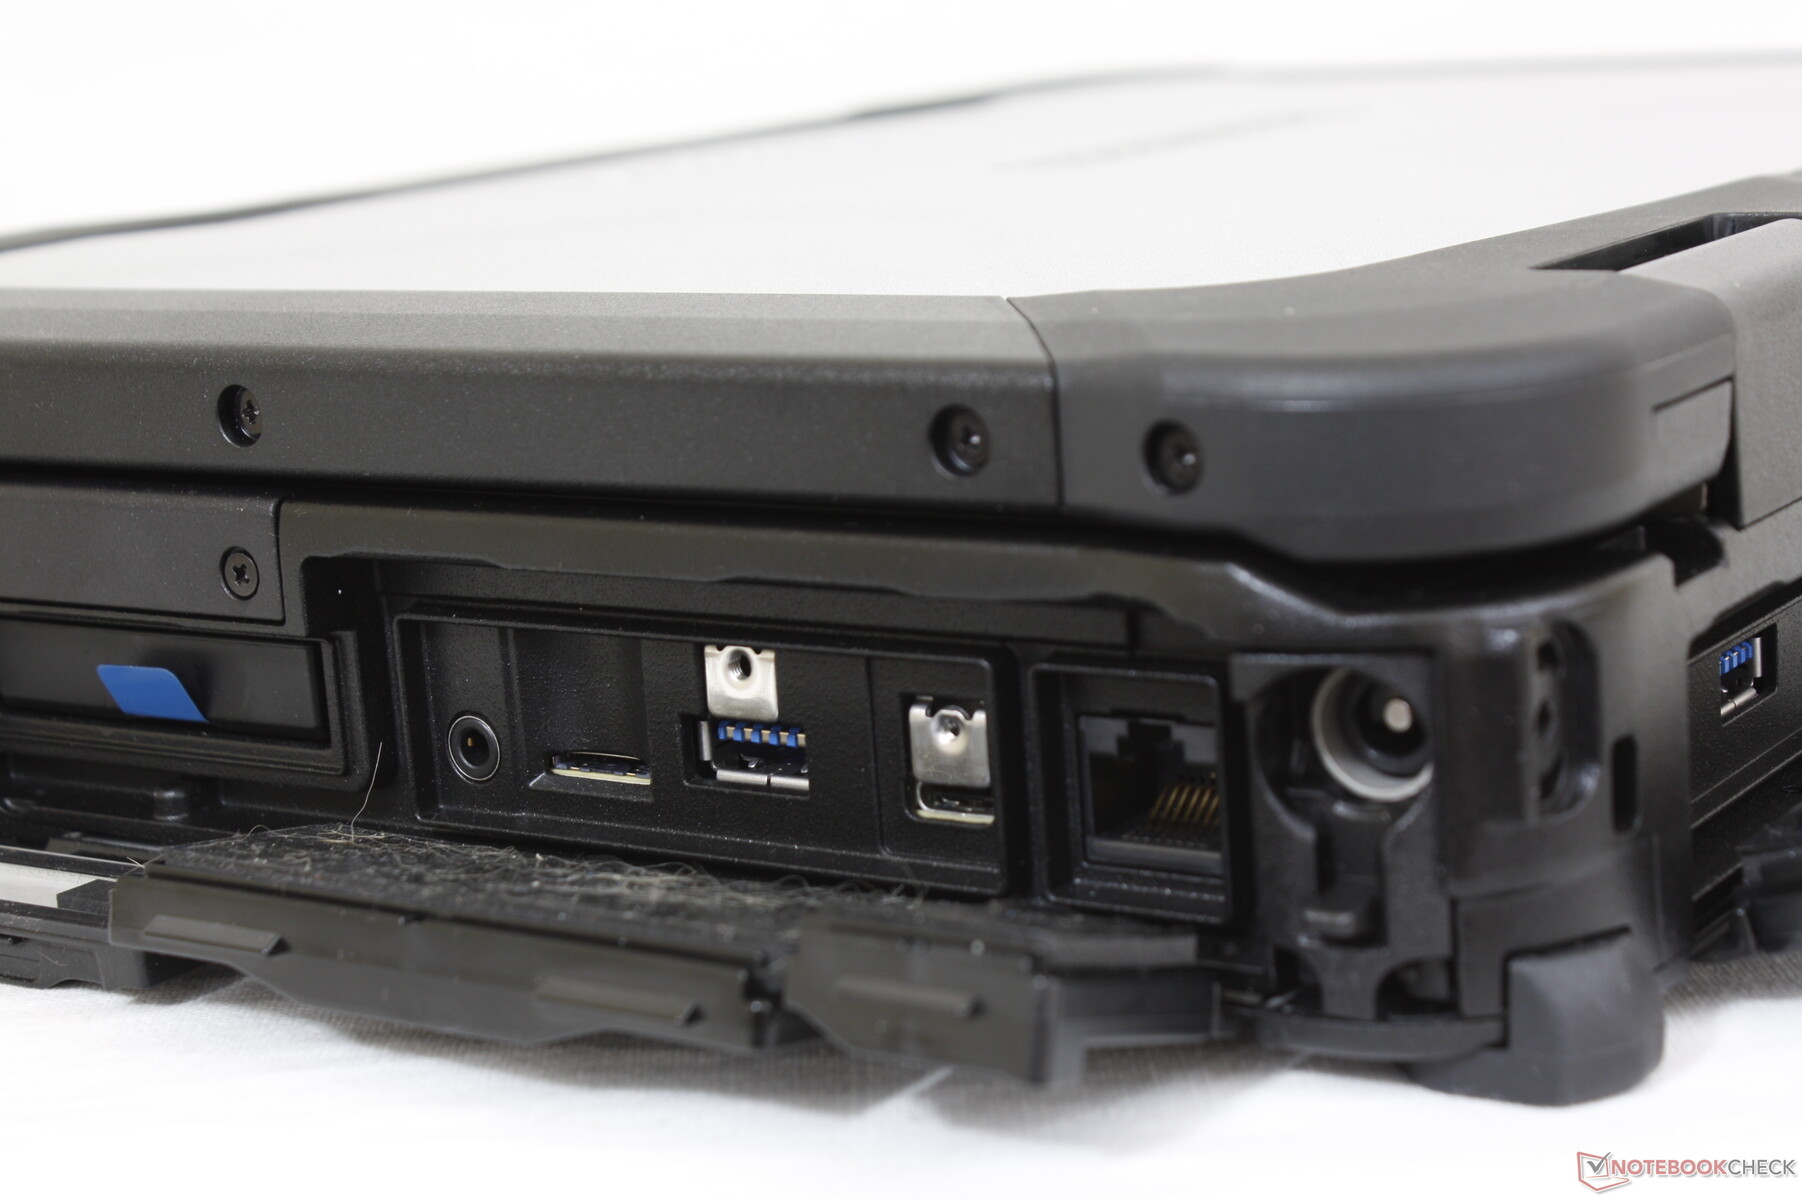
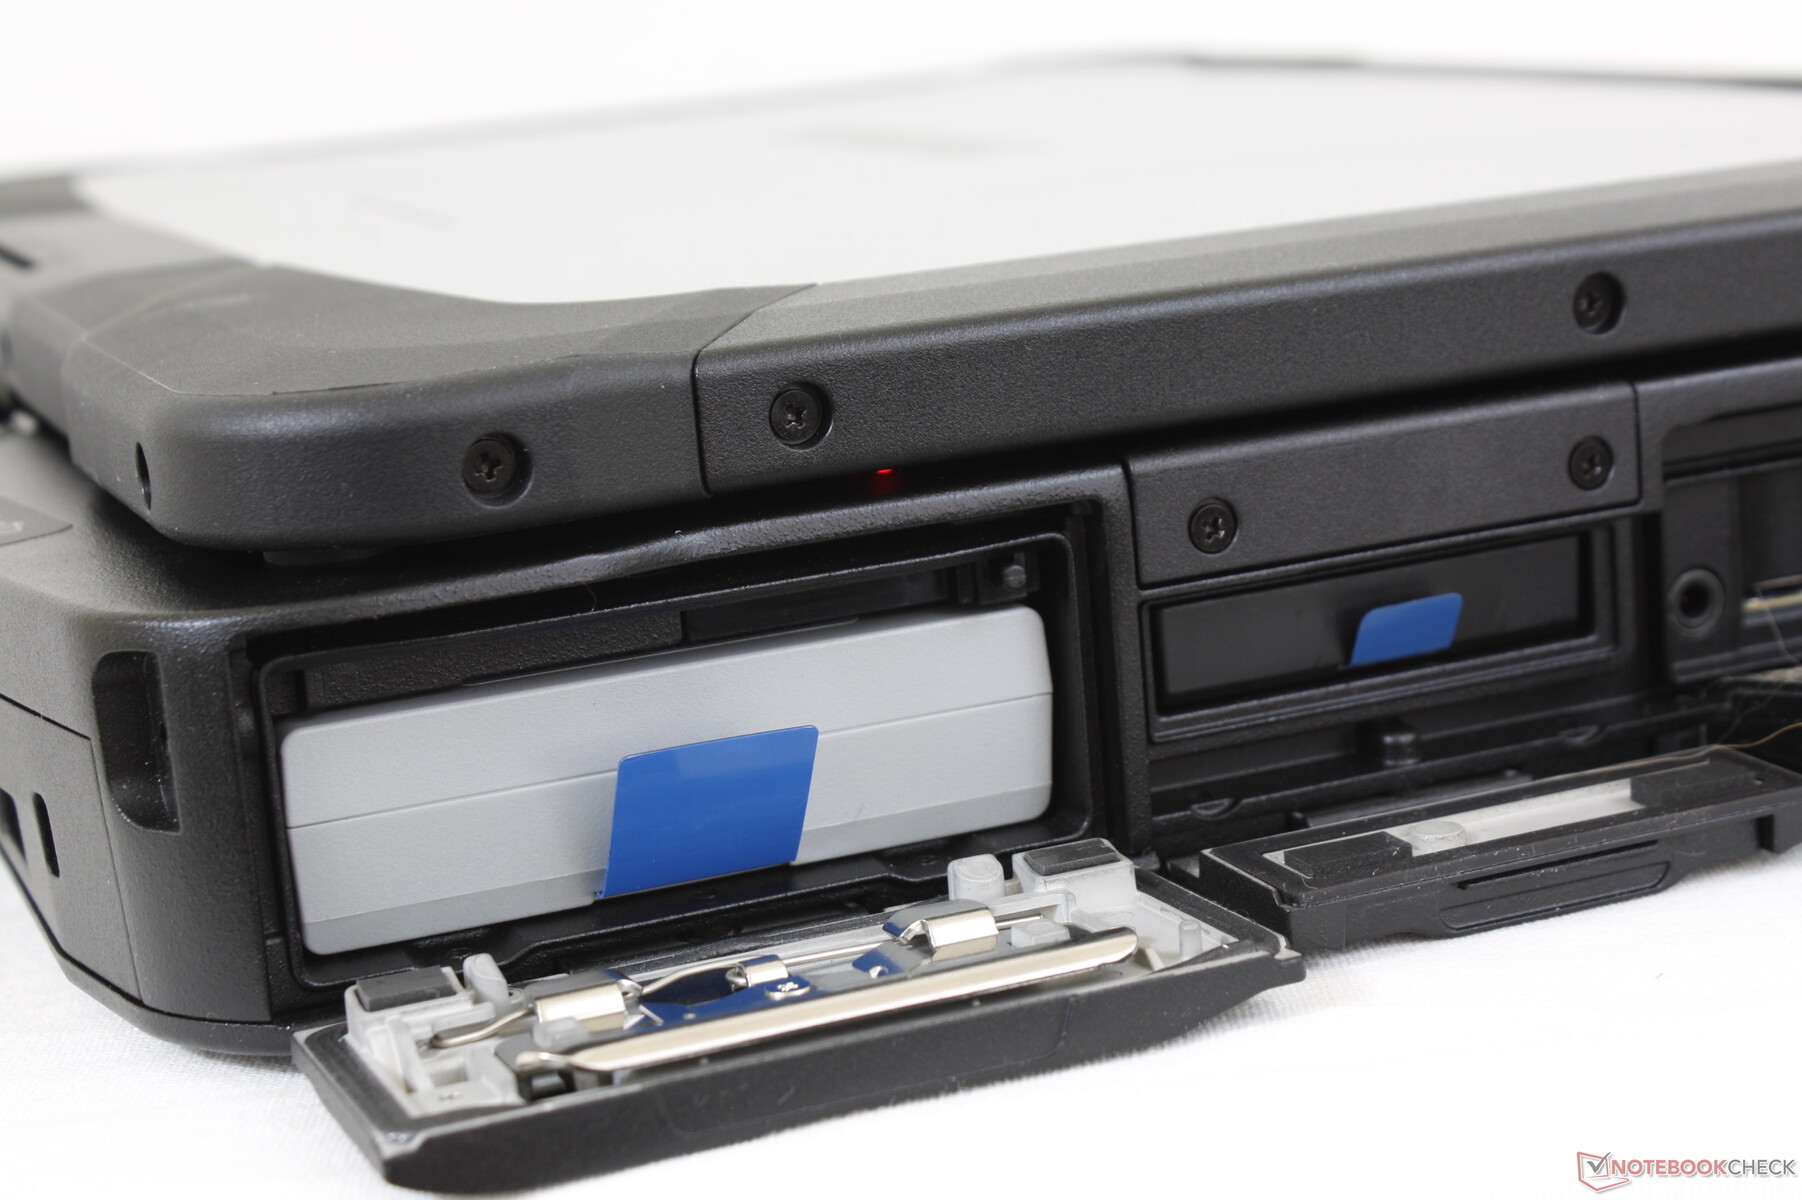
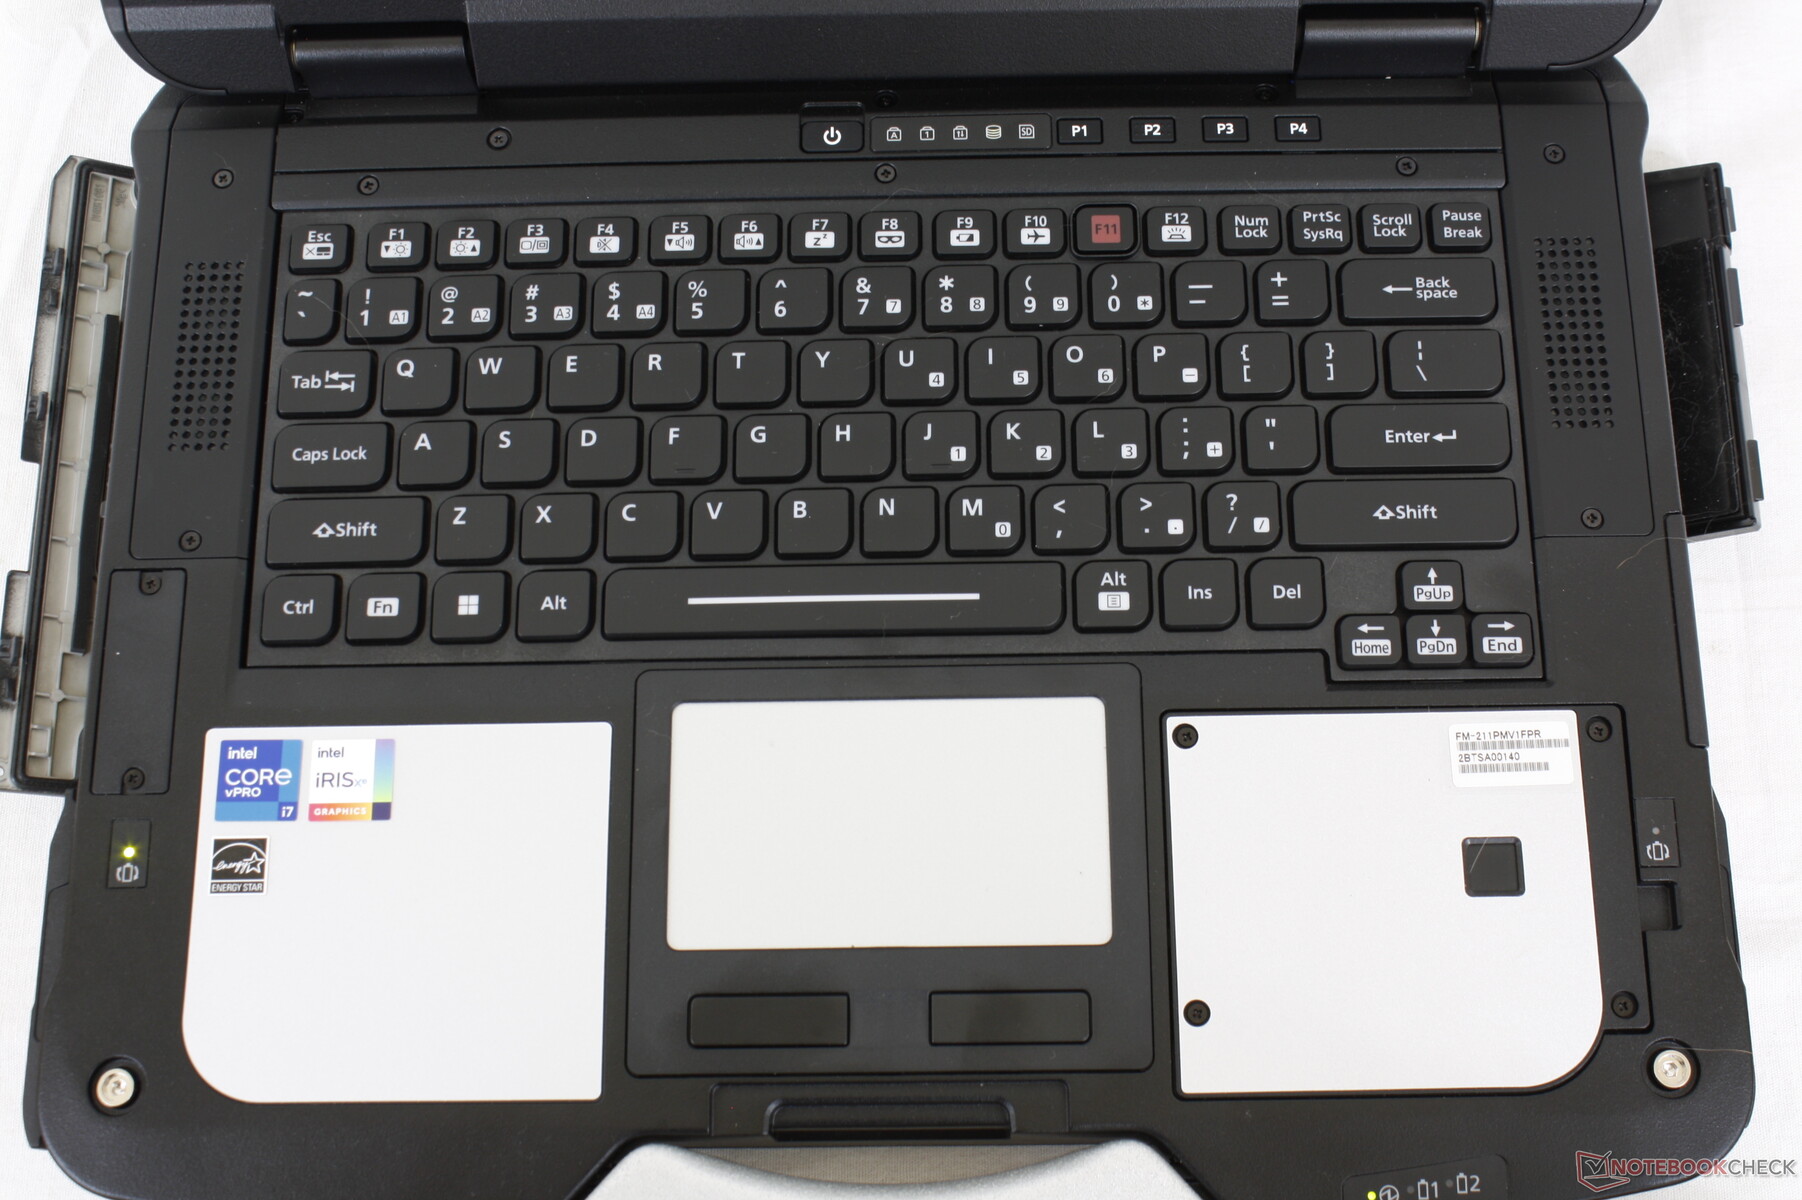
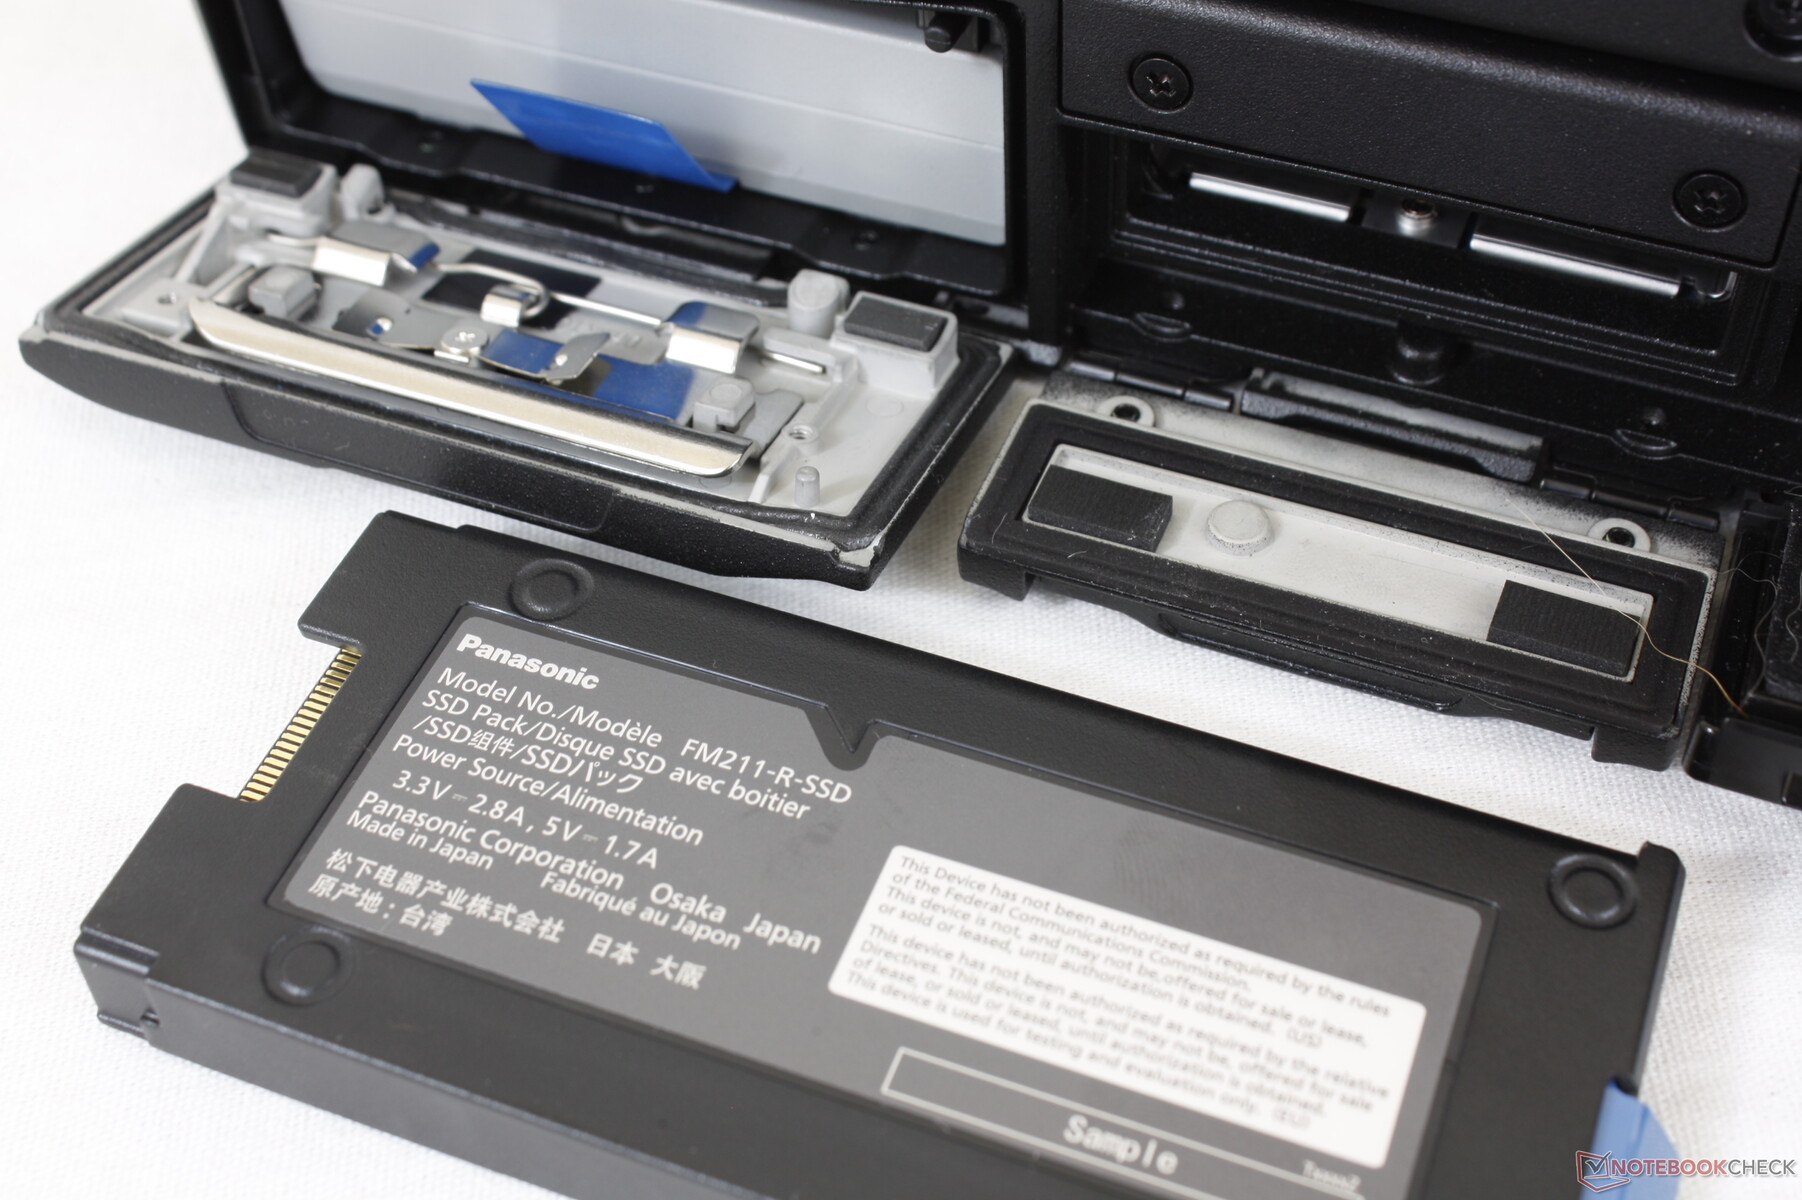
The swappable ports and connectivity features of the Toughbook 40 are some of the most versatile we've seen on any laptop. The model supports up to four removable xPAK cards simultaneously: One along the rear, one along left edge, one along the right edge, and one underneath the right palm rest as shown by the images below. If your usage scenario requires no HDMI, for example, then the port deck can be swapped with another one that includes a different set of ports. The primary battery and SSD each have their own slots as well along the left edge and right edge, respectively, but they are not included as part of the four xPAK slots. Keep in mind that each of the four xPAK slots are of different sizes and shape; a card designed to fit into one slot will not fit into any of the other slots.
The first slot is the rear expansion slot designed for ports like VGA, serial, LAN, USB-A, and HDMI. The second slot along the left edge supports optical drives, barcode scanners, Smart Card readers, and secondary SSDs. The third slot along the right edge supports secondary batteries or Smart Card readers. And finally, the palm rest slot supports fingerprint readers and other security features. The manufacturer plans to produce additional expansion cards for various purposes in the near future.
A vexing issue with all these slots is that the flaps covering them are very finicky and difficult to open and lock especially if you have smaller hands or oily fingers. There is just not enough grip on these flaps to make them comfortable to use. The covers along the edges of the Dell Latitude 7330 Rugged are much easier to grip and handle in comparison.

SD Card Reader
| SD Card Reader | |
| average JPG Copy Test (av. of 3 runs) | |
| Dell Latitude 5420 Rugged-P85G (Toshiba Exceria Pro SDXC 64 GB UHS-II) | |
| Panasonic Toughbook FZ-55 MK2 (AV Pro V60) | |
| Panasonic Toughbook 40 (AV Pro V60) | |
| Acer Enduro Urban N3 EUN314 (AV Pro V60) | |
| Durabook S14I (Angelbird 128GB AV Pro UHS-II) | |
| maximum AS SSD Seq Read Test (1GB) | |
| Dell Latitude 5420 Rugged-P85G (Toshiba Exceria Pro SDXC 64 GB UHS-II) | |
| Panasonic Toughbook FZ-55 MK2 (AV Pro V60) | |
| Panasonic Toughbook 40 (AV Pro V60) | |
| Durabook S14I (Angelbird 128GB AV Pro UHS-II) | |
| Acer Enduro Urban N3 EUN314 (AV Pro V60) | |
Communication
An Intel AX201 comes standard for Wi-Fi 6 connectivity. There are no Wi-Fi 6E options as of this writing.
Optional 4G LTE and even 5G are available options.
| Networking | |
| iperf3 transmit AX12 | |
| Acer Enduro Urban N3 EUN314 | |
| Panasonic Toughbook FZ-55 MK2 | |
| Durabook S14I | |
| Getac S410 Gen 4 | |
| Dell Latitude 5420 Rugged-P85G | |
| iperf3 receive AX12 | |
| Durabook S14I | |
| Acer Enduro Urban N3 EUN314 | |
| Panasonic Toughbook FZ-55 MK2 | |
| Getac S410 Gen 4 | |
| Dell Latitude 5420 Rugged-P85G | |
| iperf3 receive AXE11000 | |
| Panasonic Toughbook 40 | |
| iperf3 transmit AXE11000 | |
| Panasonic Toughbook 40 | |
Webcam
The 5 MP camera is sharper than on most other laptops where 2 MP or lower are common. IR is present for Windows Hello support.


Maintenance
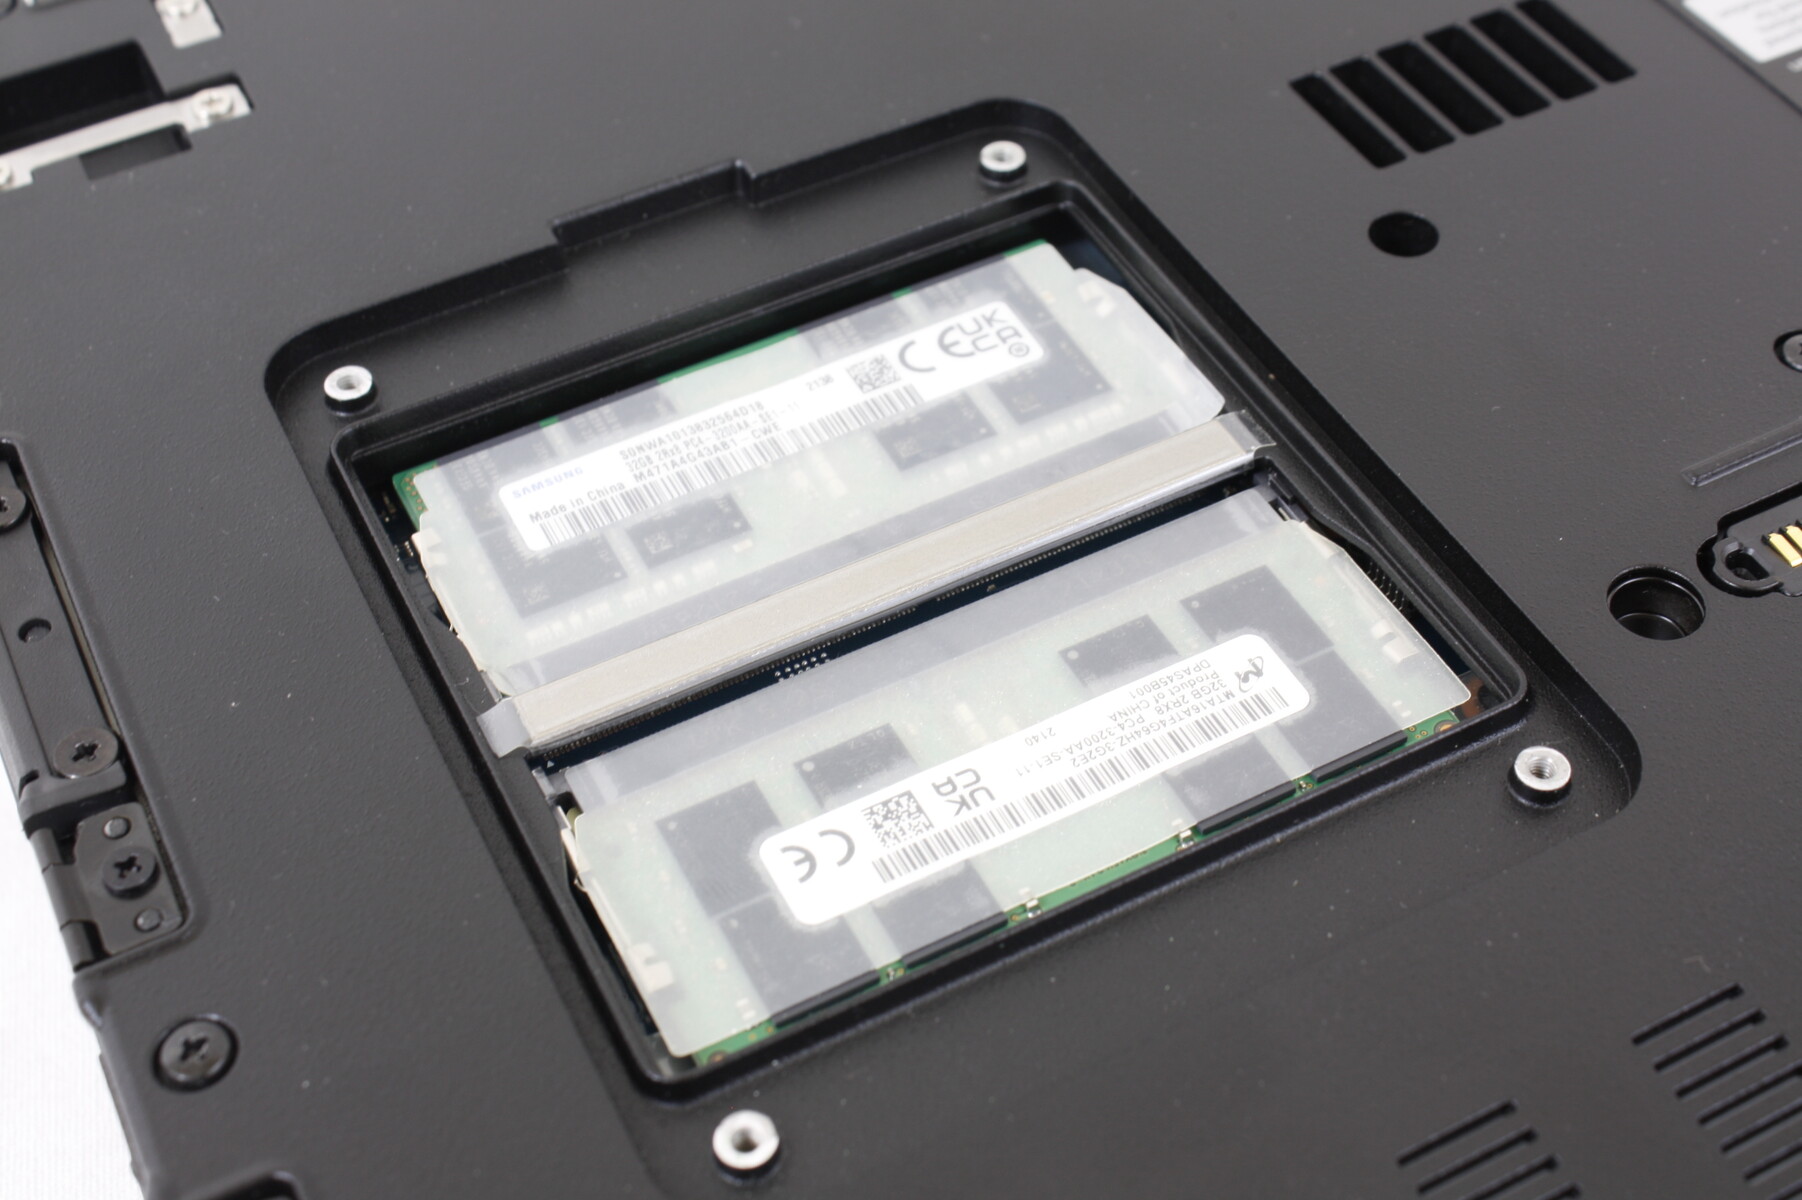
The bottom panel was not designed to be easily removed by the user. Instead, a small hatch is built-in to access the 2x DDR4 SODIMM slots.
Accessories and Warranty
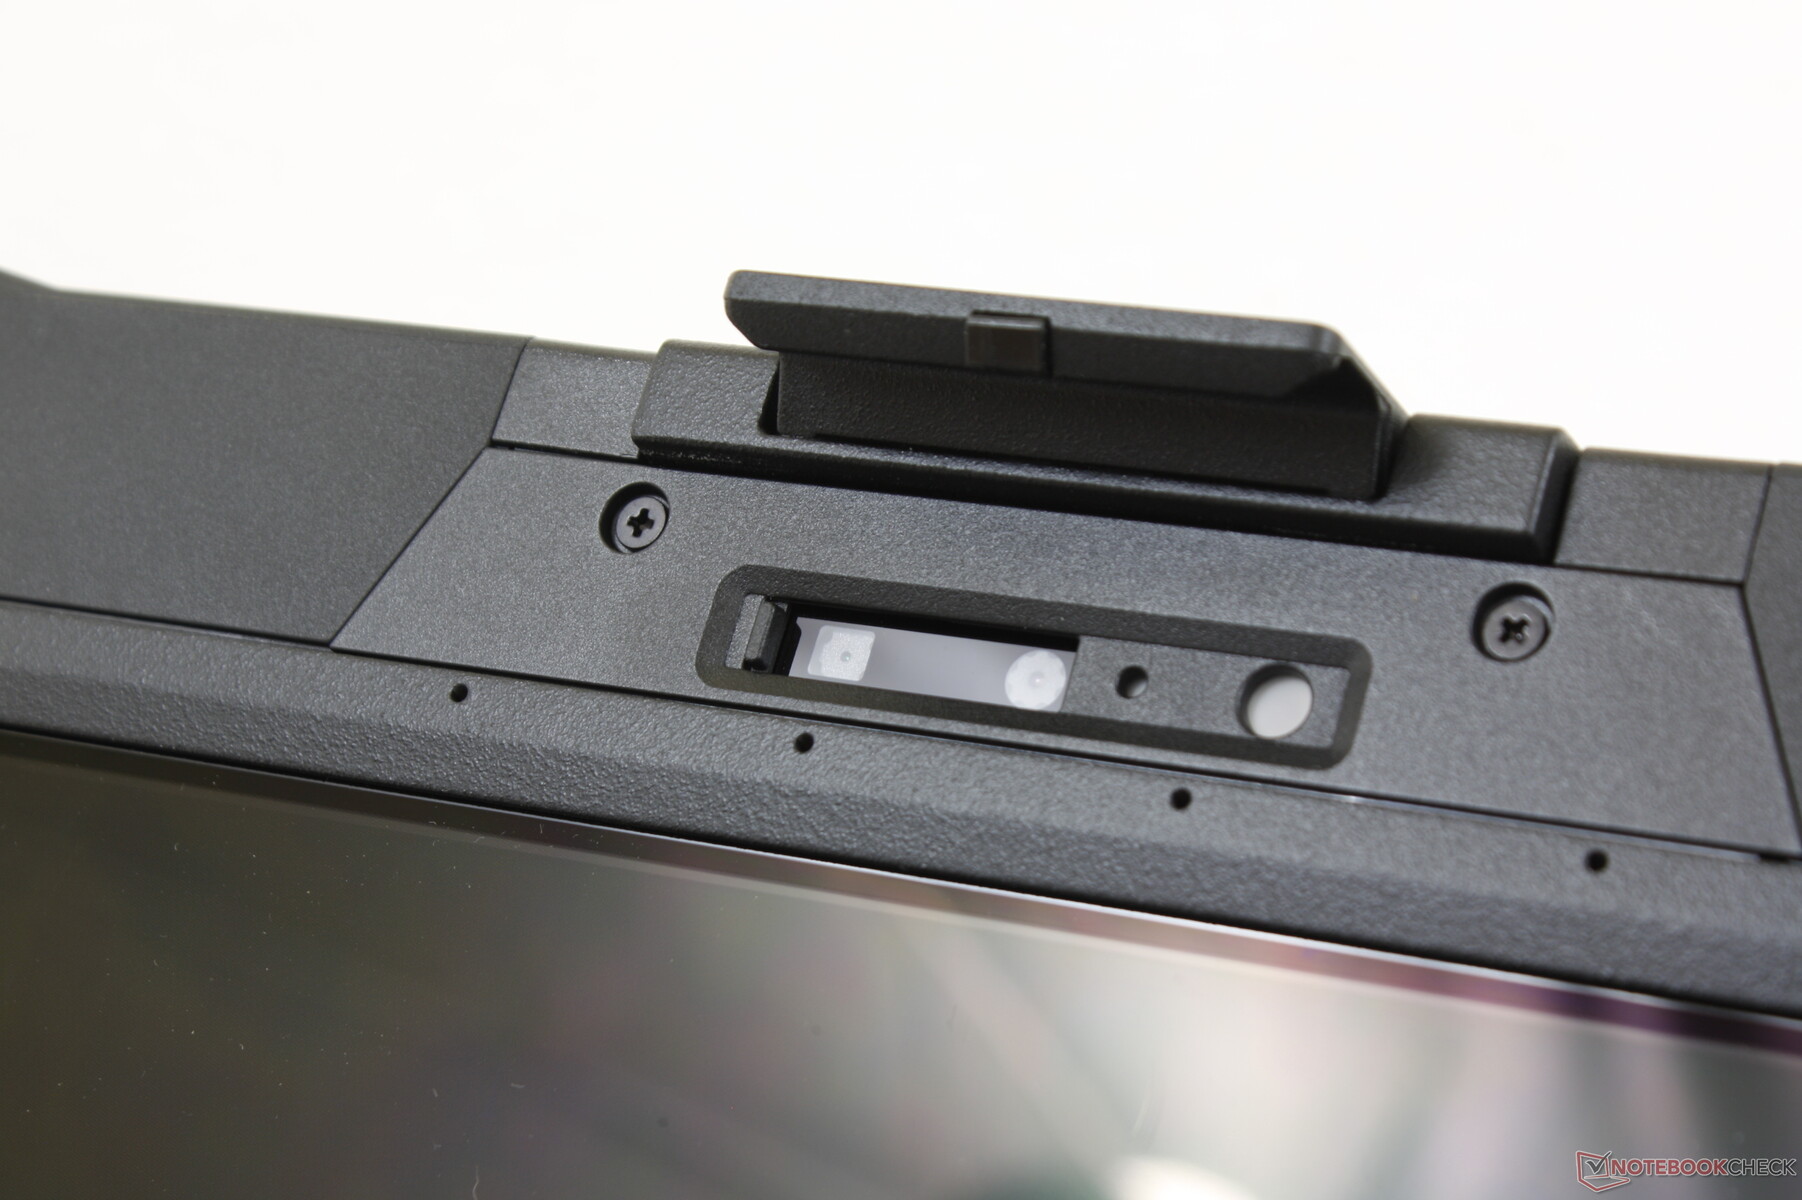
A passive stylus sits inside the handle along the front of the unit. Panasonic offers a wide range of accessories for its laptop models as detailed here.
A standard three-year limited manufacturer warranty applies.
Input Devices


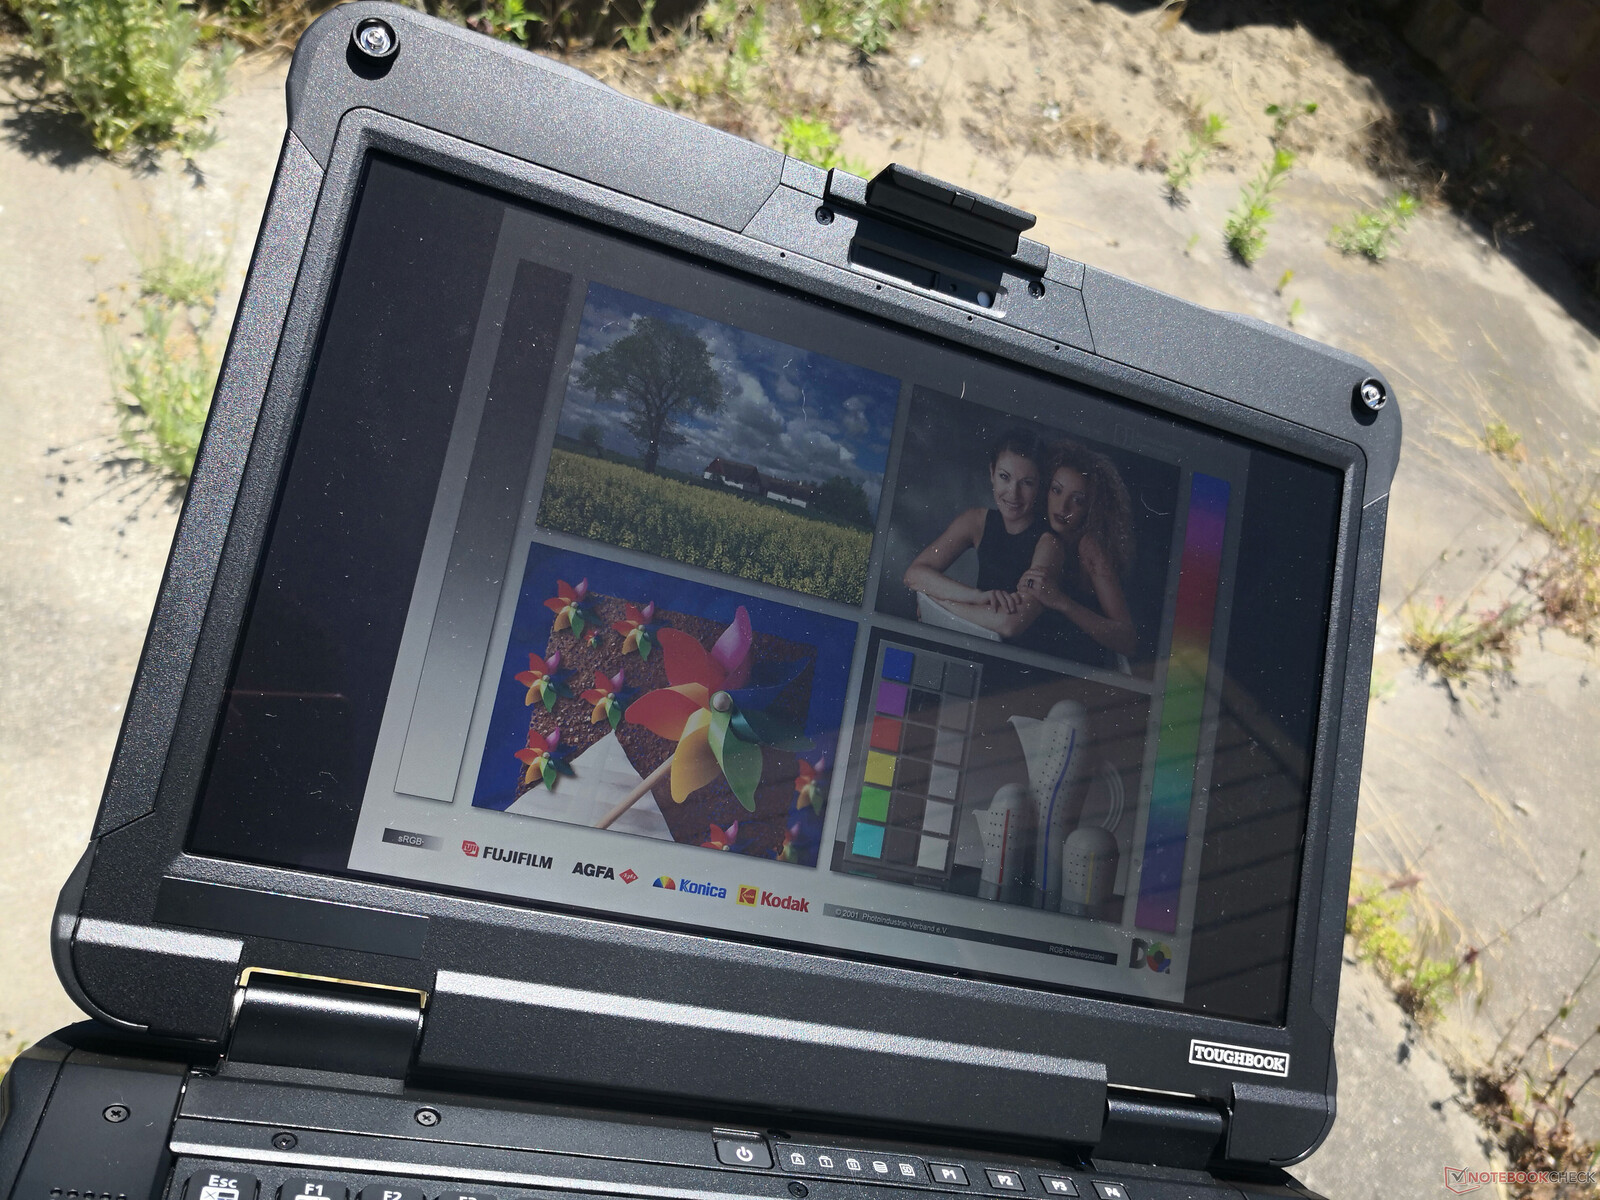
Display
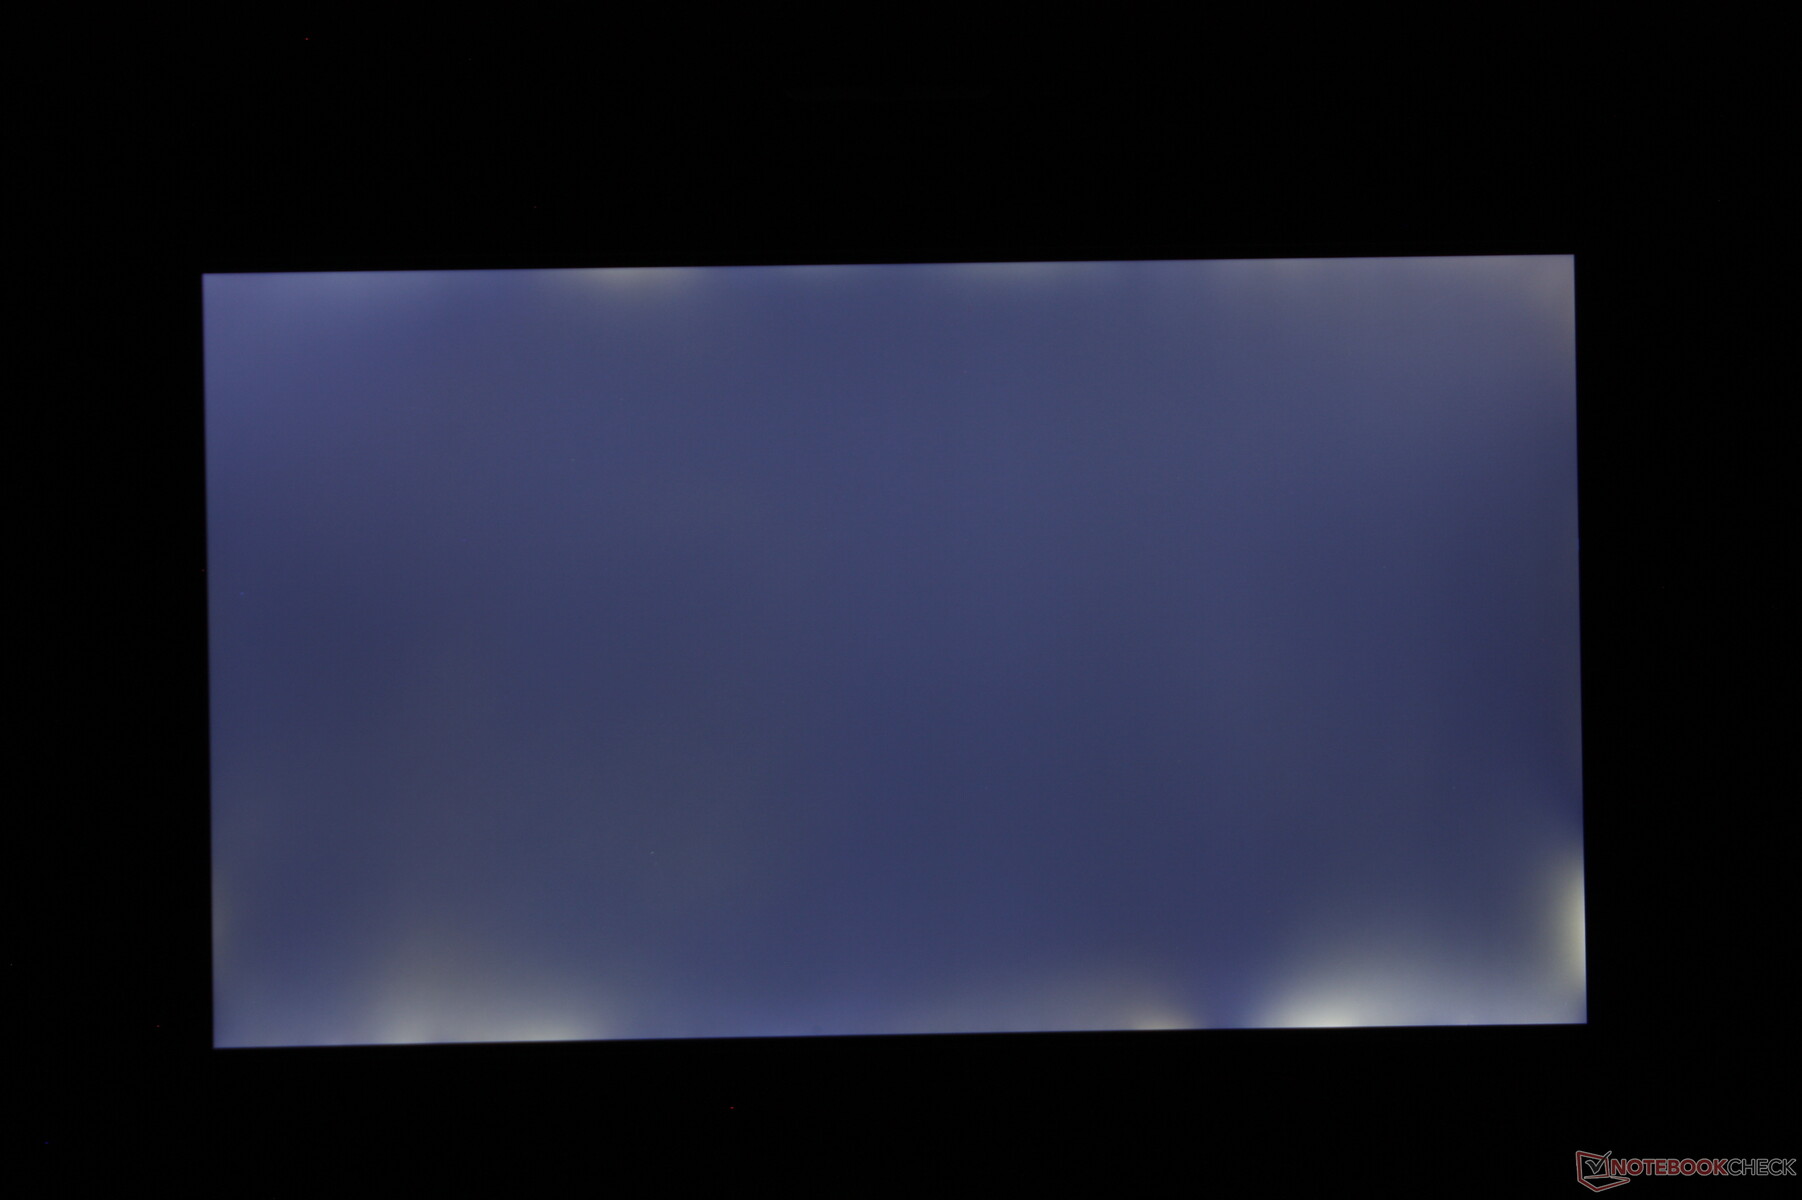
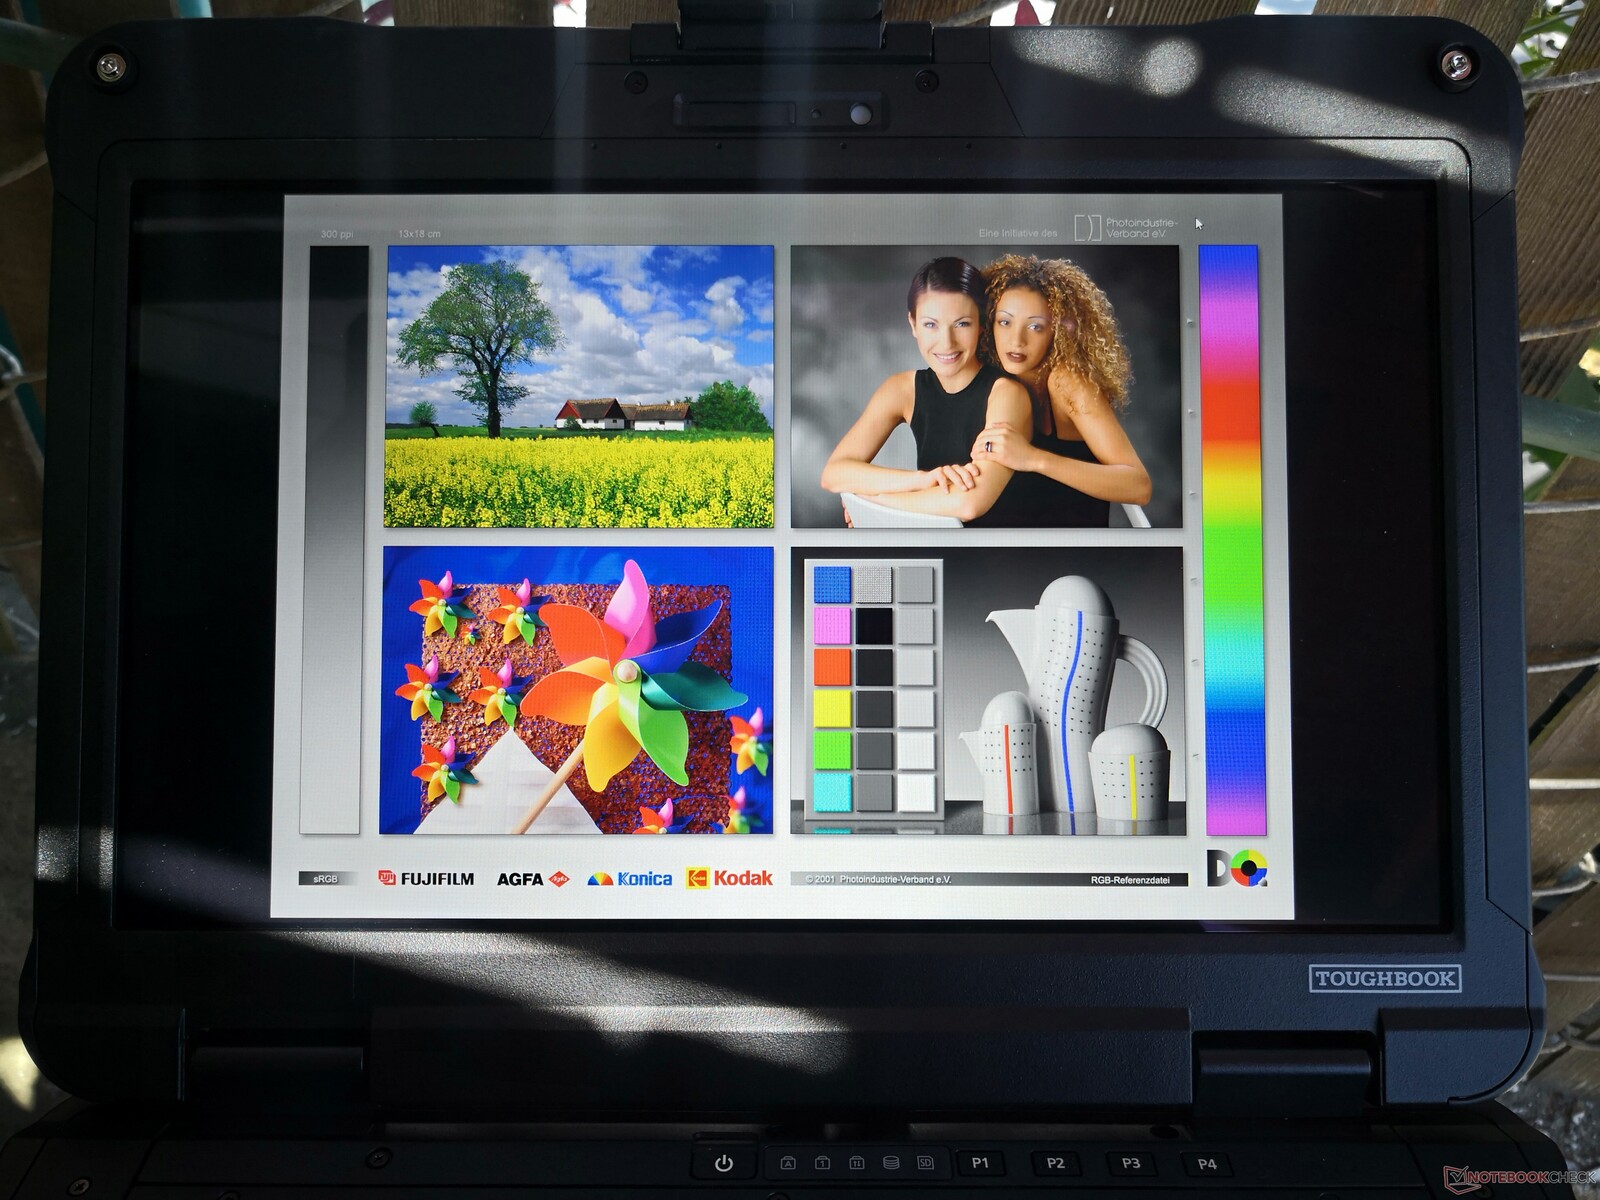
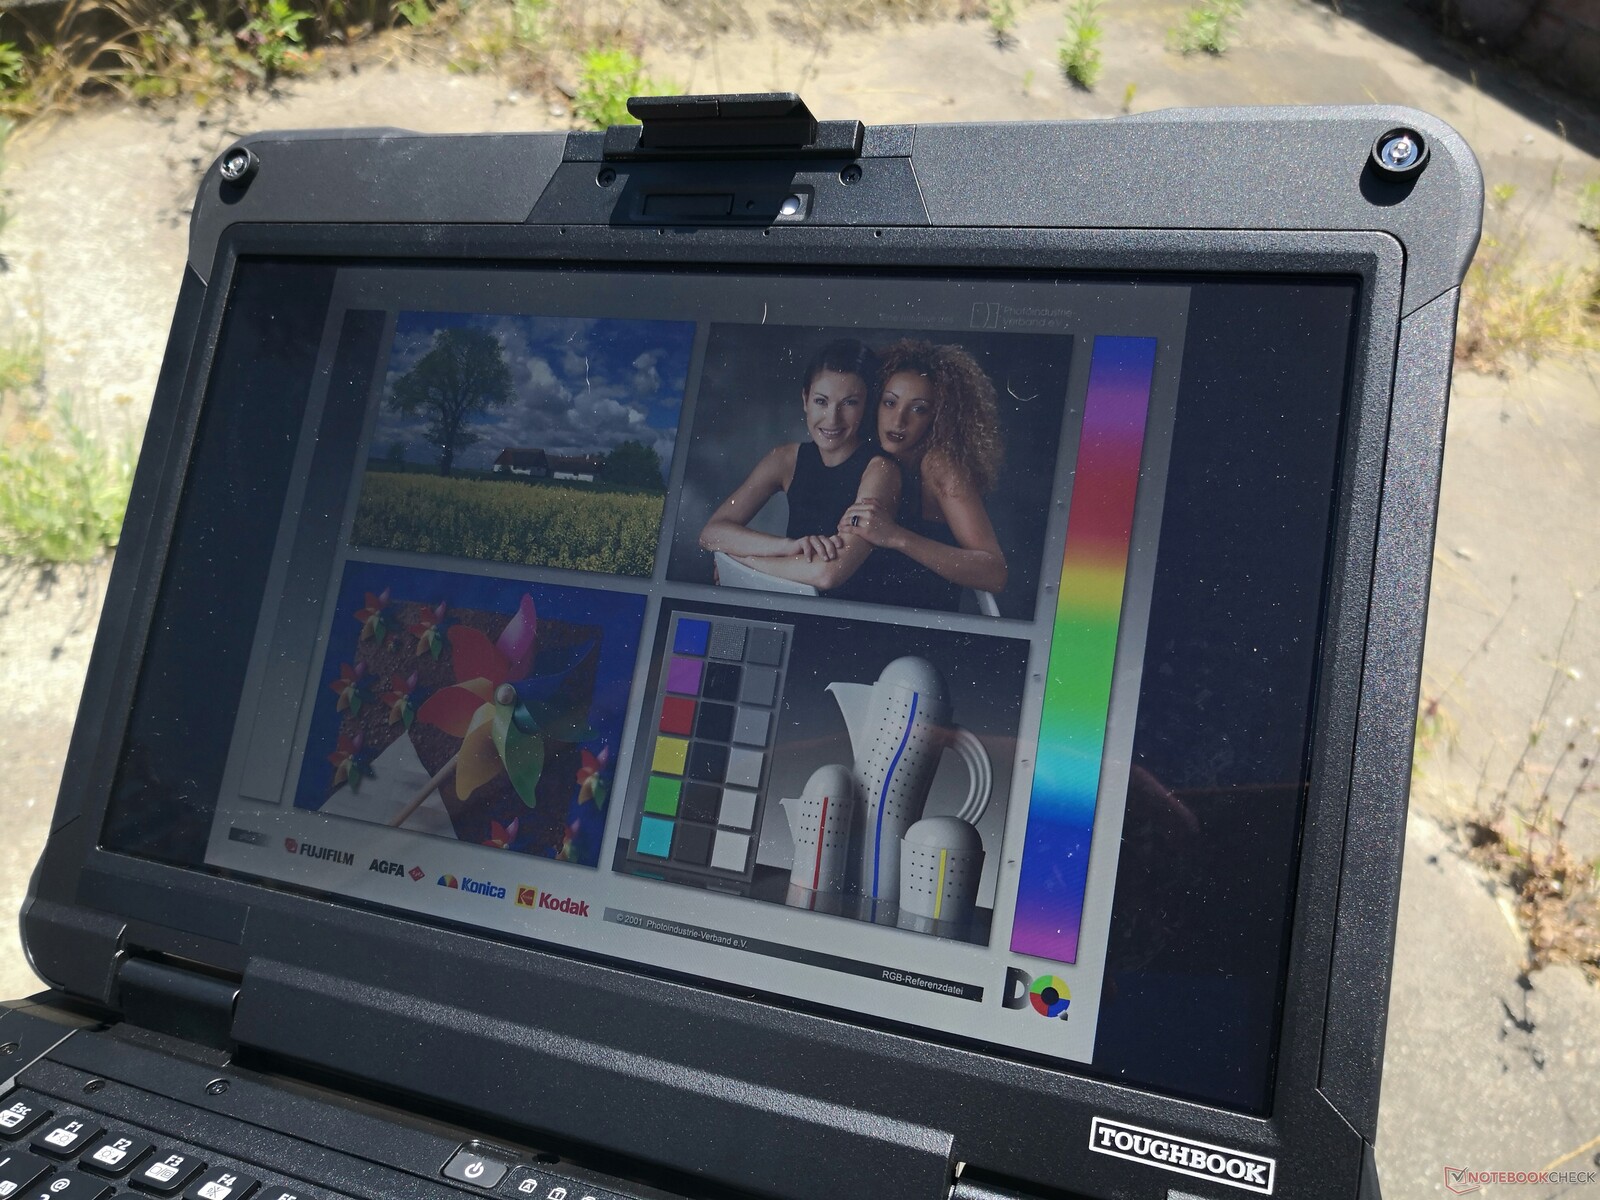
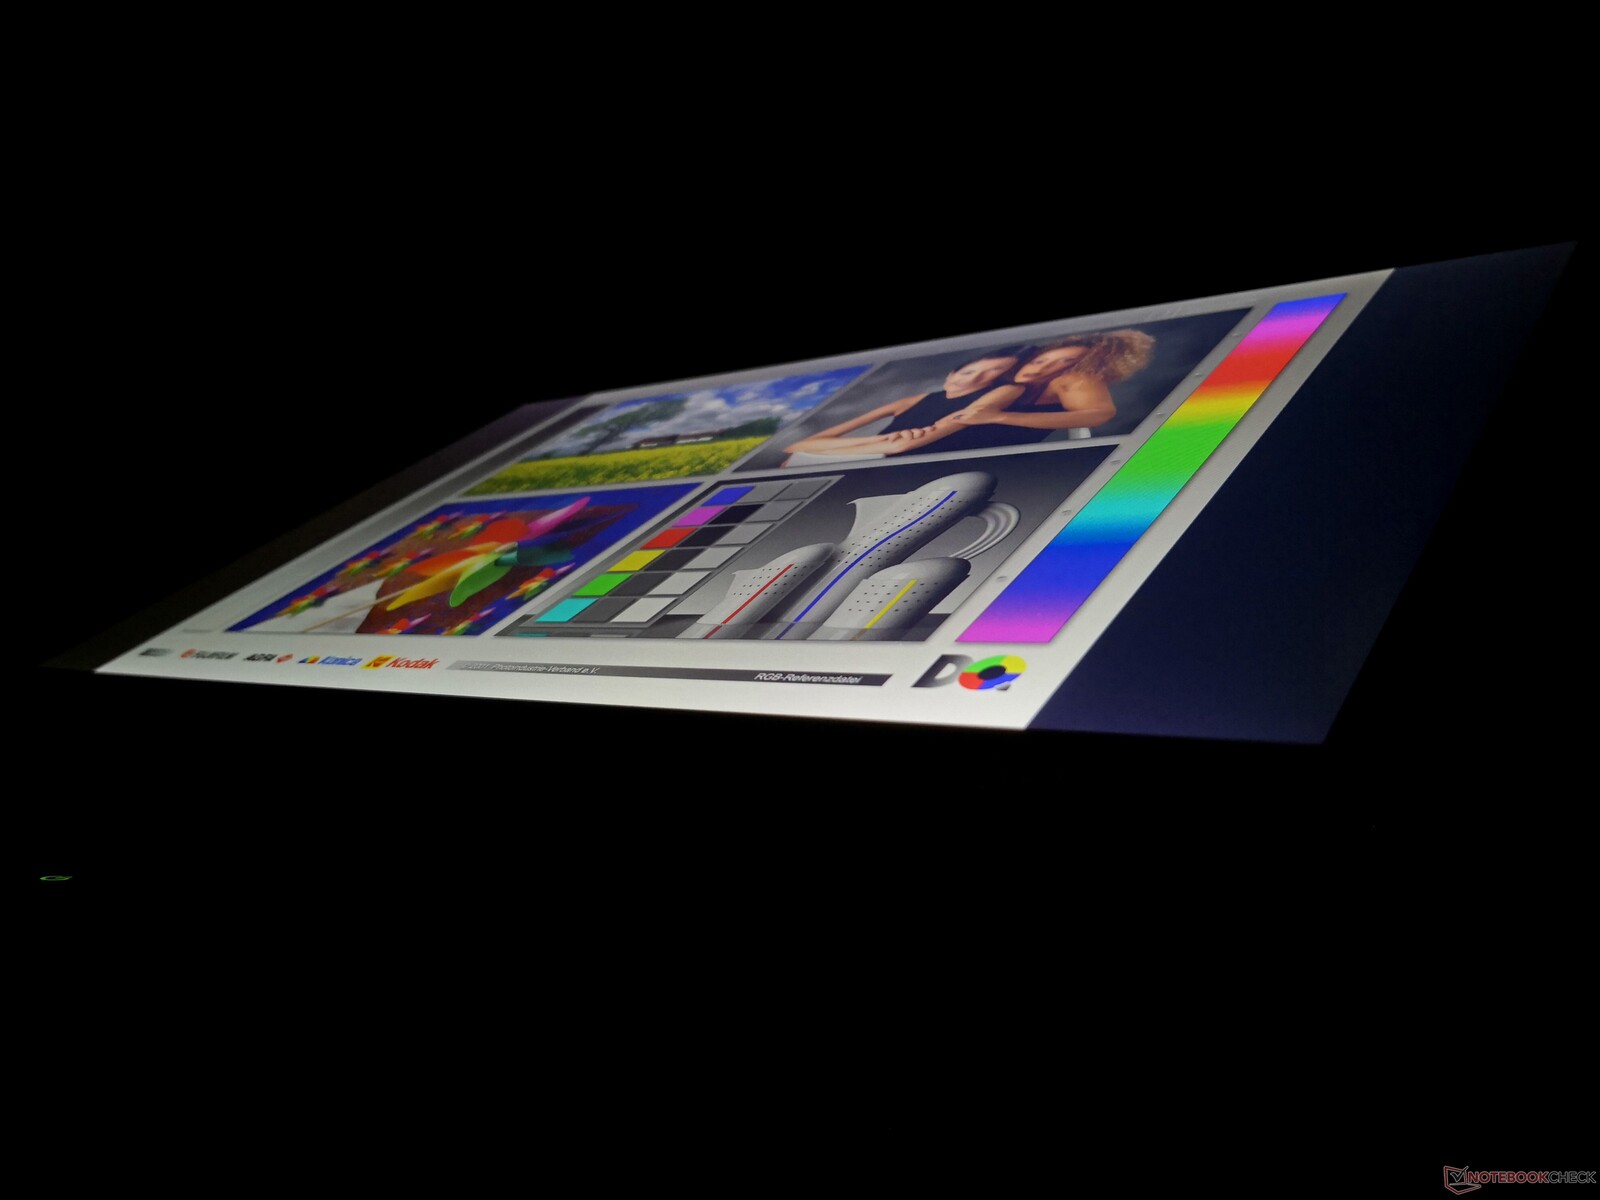
The IPS display is very good as far as rugged laptops go though. It doesn't suffer from major graininess issues that many other rugged models exhibit for crisper texts and images. It's also very bright at almost 1200 nits while maintaining a good contrast ratio of over 1000:1 to be better than the 1400-nit TN display on the Durabook S14I.
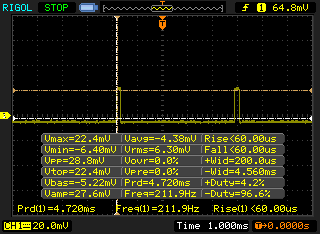
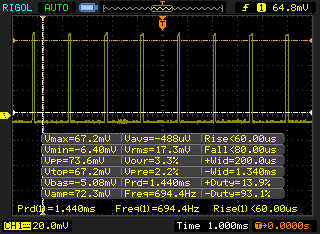
Pulse-width modulation is unfortunately present at all brightness levels except maximum. If your eyes are sensitive to flickering, then you may want to avoid using the Panasonic on high brightness settings for long periods.

| |||||||||||||||||||||||||
Brightness Distribution: 82 %
Center on Battery: 1284.3 cd/m²
Contrast: 1443:1 (Black: 0.89 cd/m²)
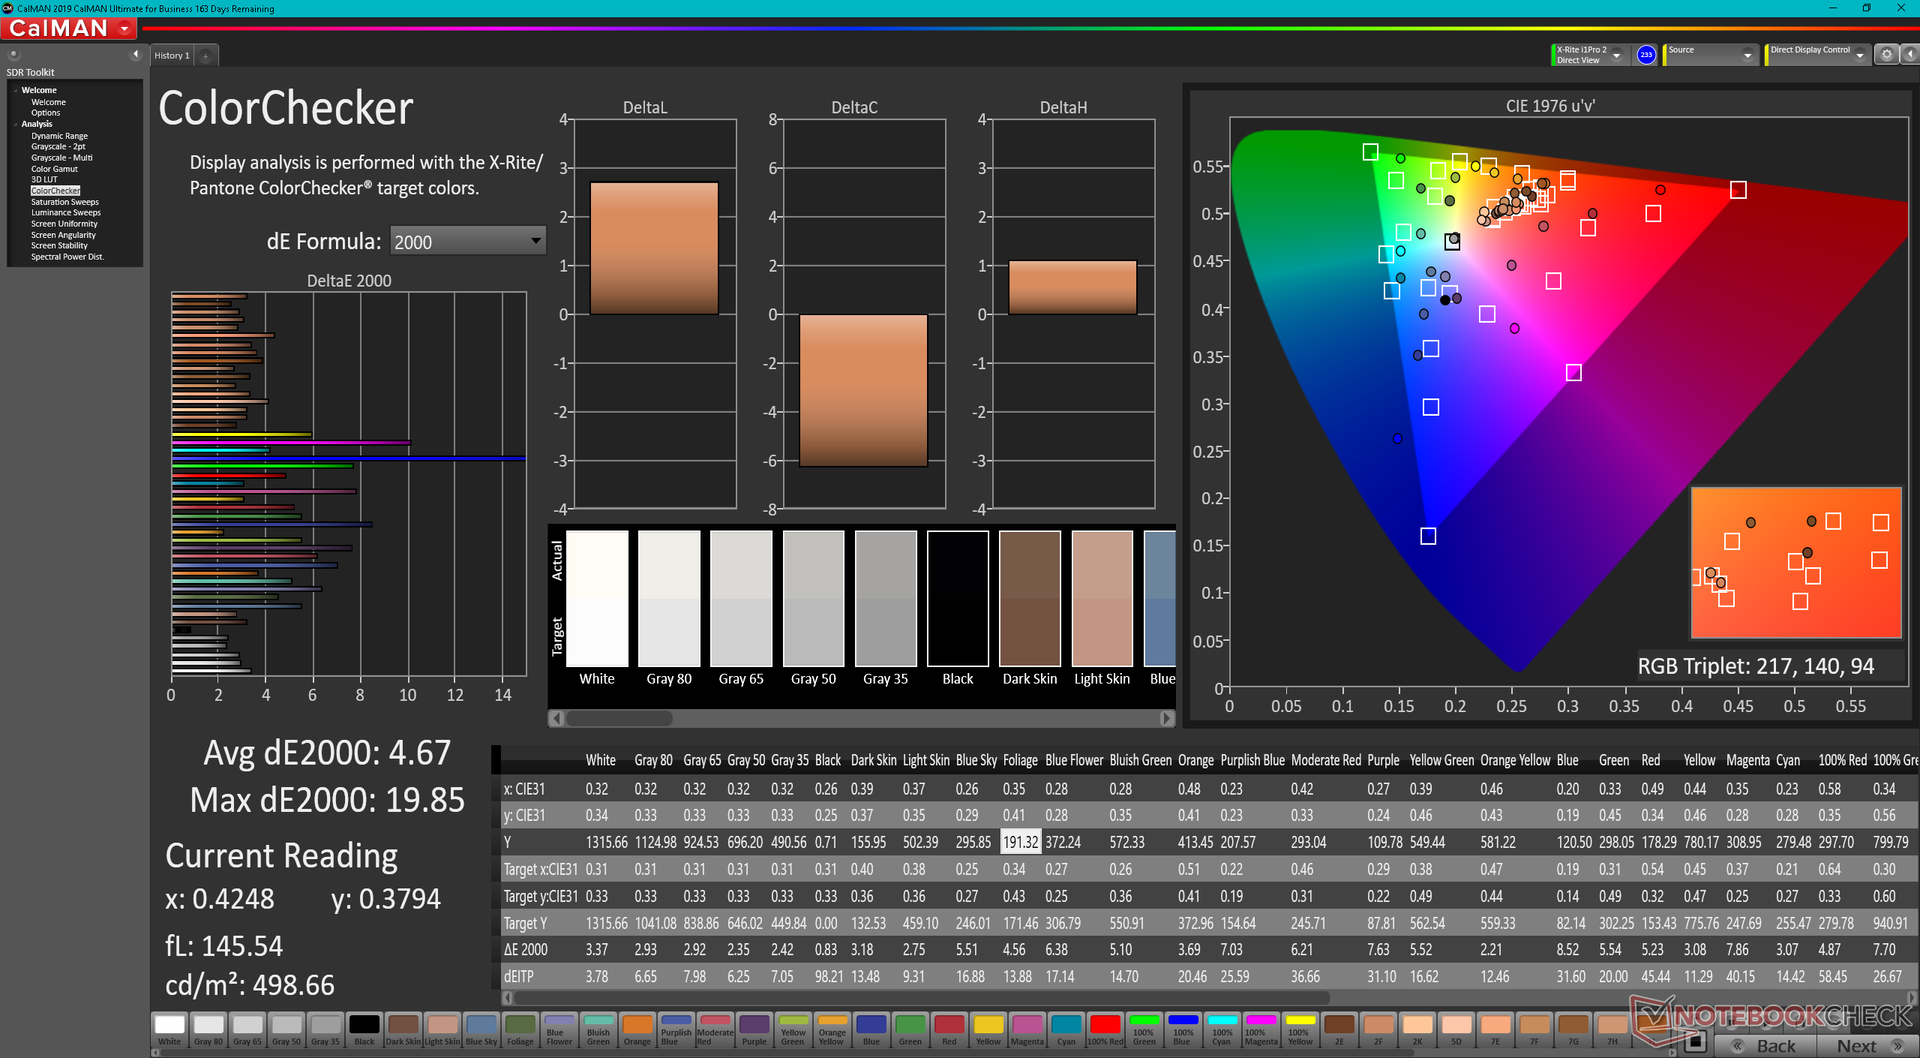
ΔE ColorChecker Calman: 4.67 | ∀{0.5-29.43 Ø4.78}
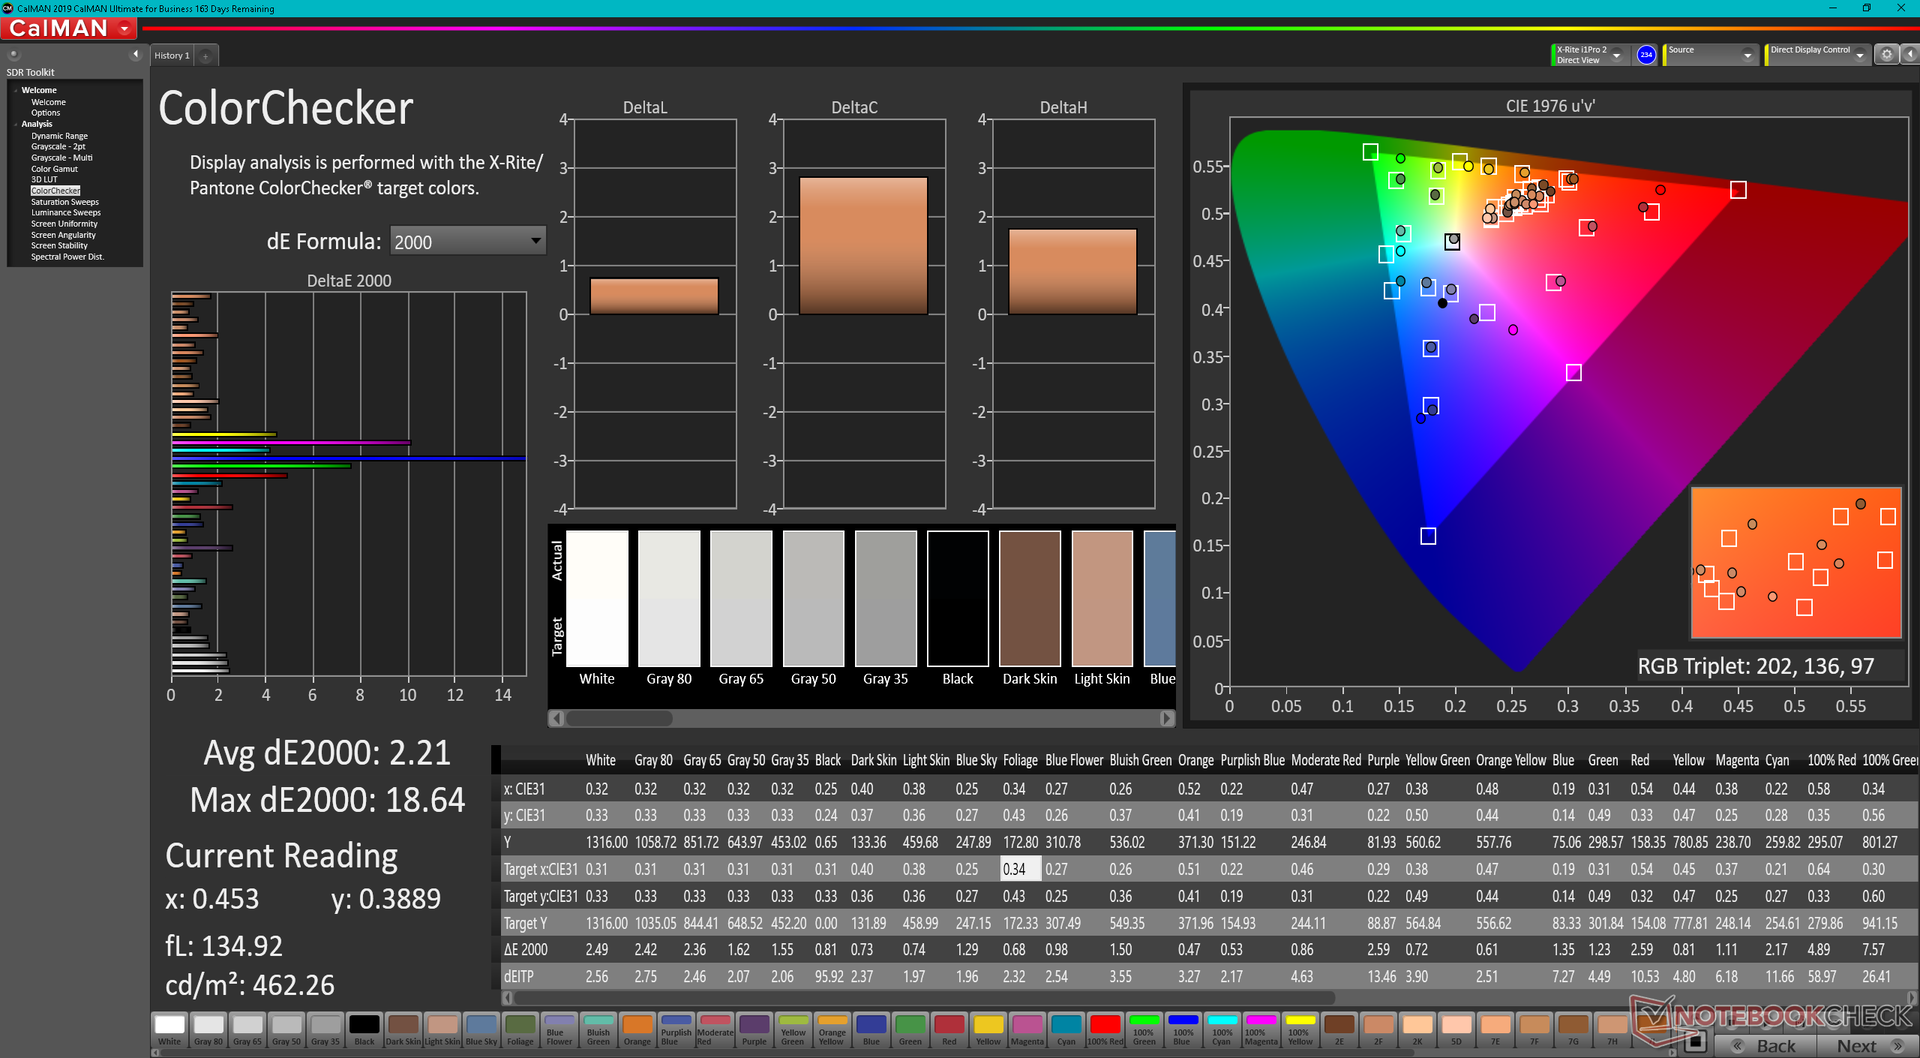
calibrated: 2.21
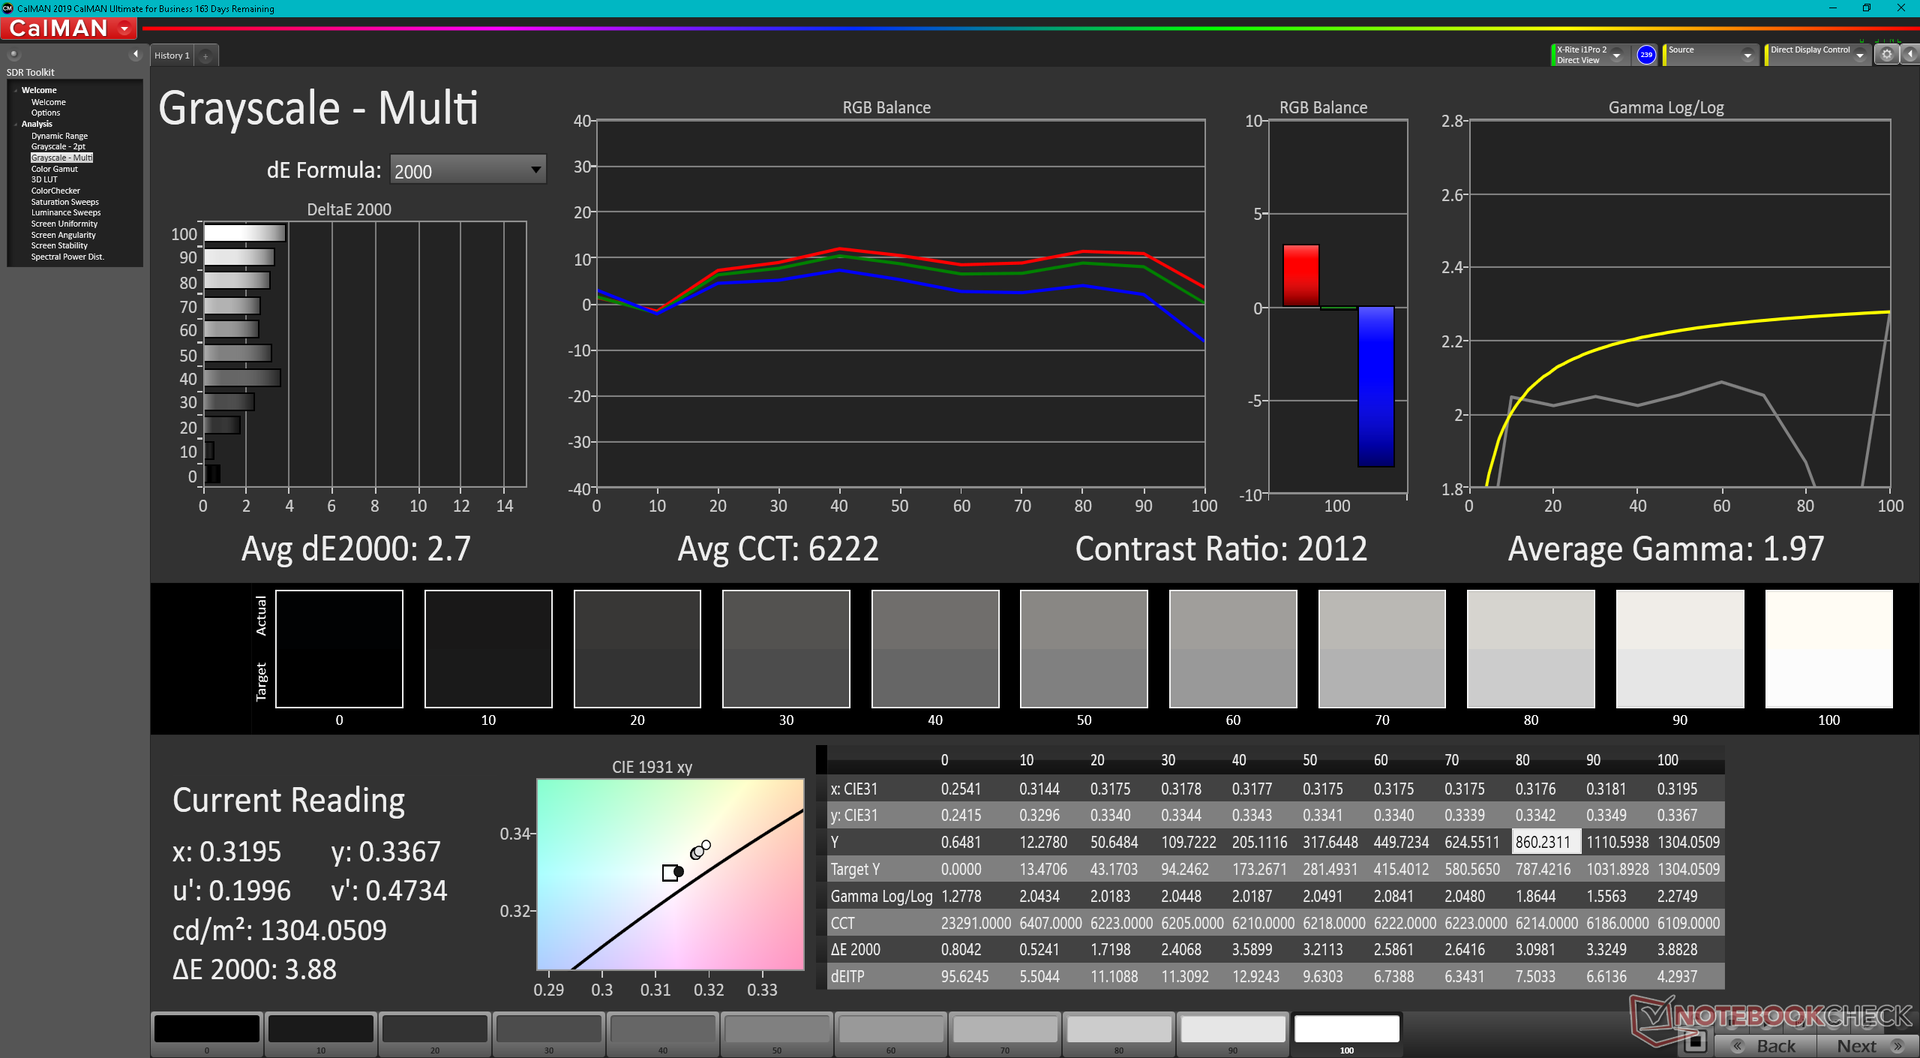
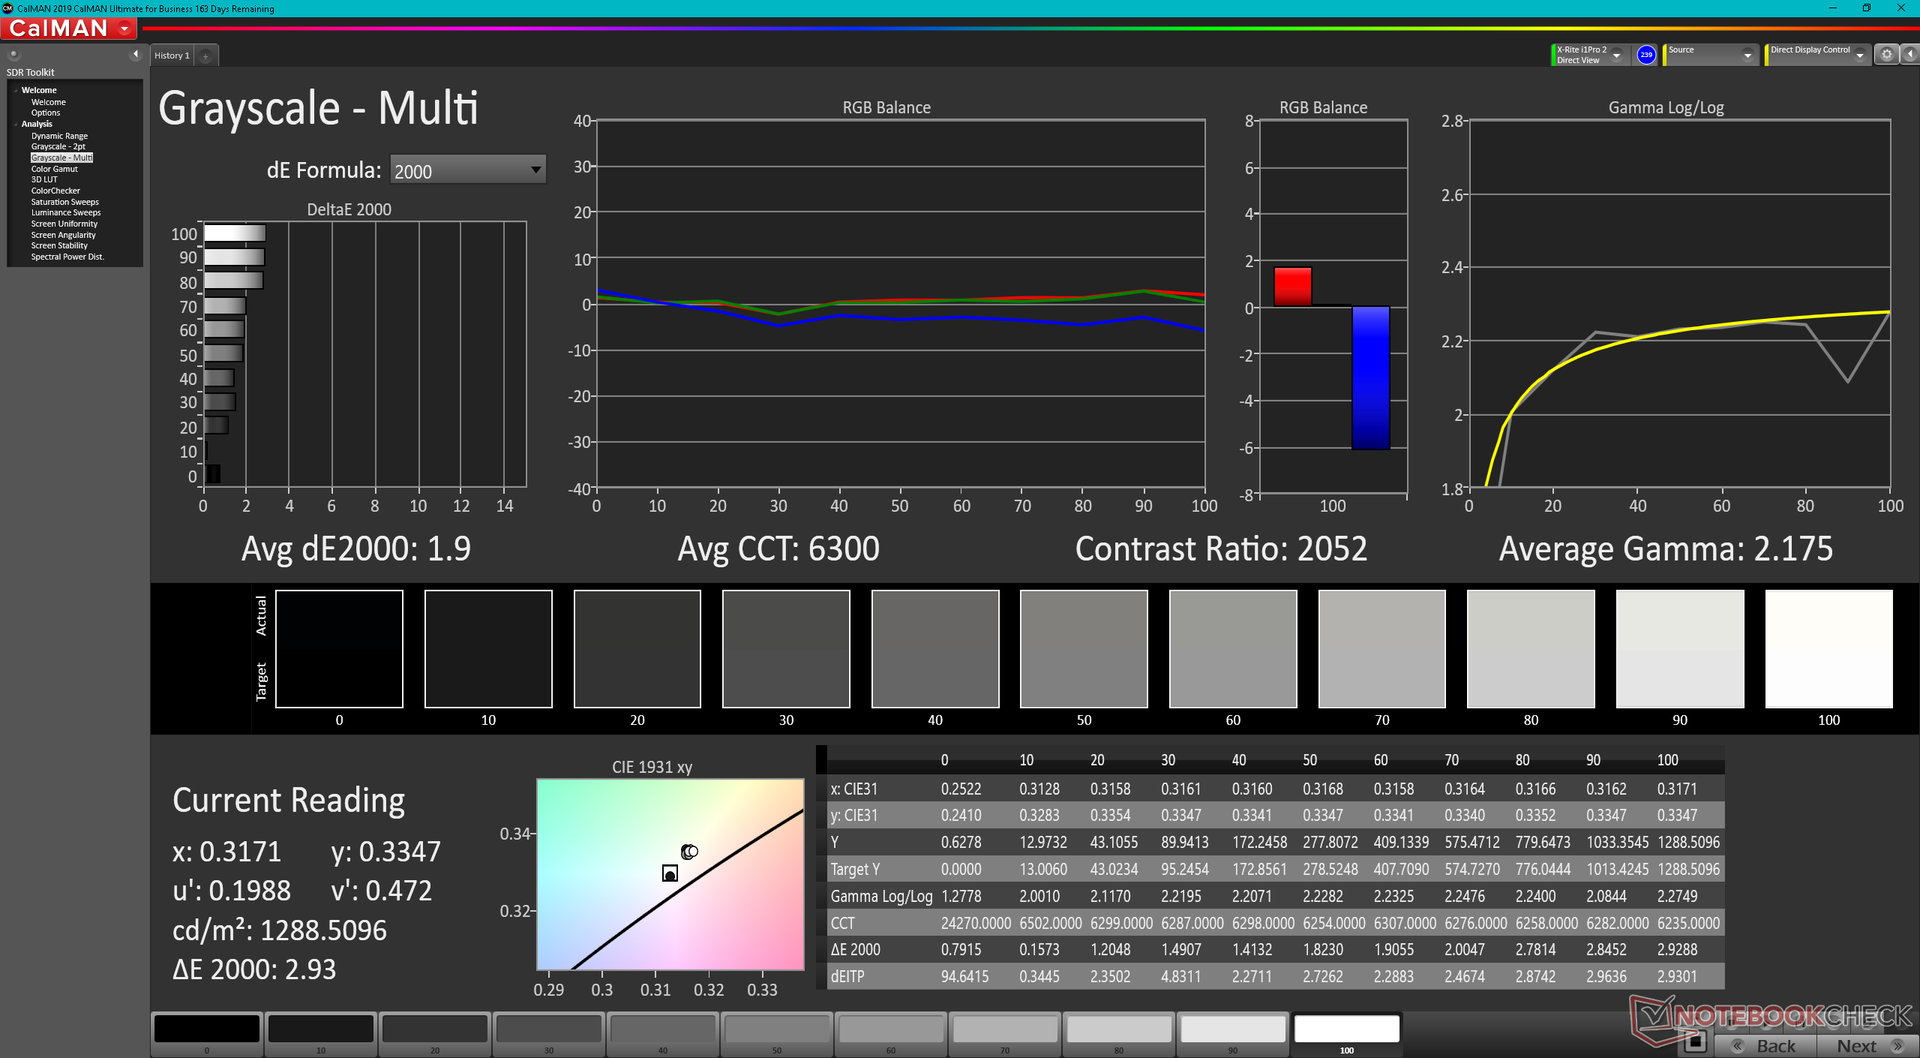
ΔE Greyscale Calman: 2.7 | ∀{0.09-98 Ø5}
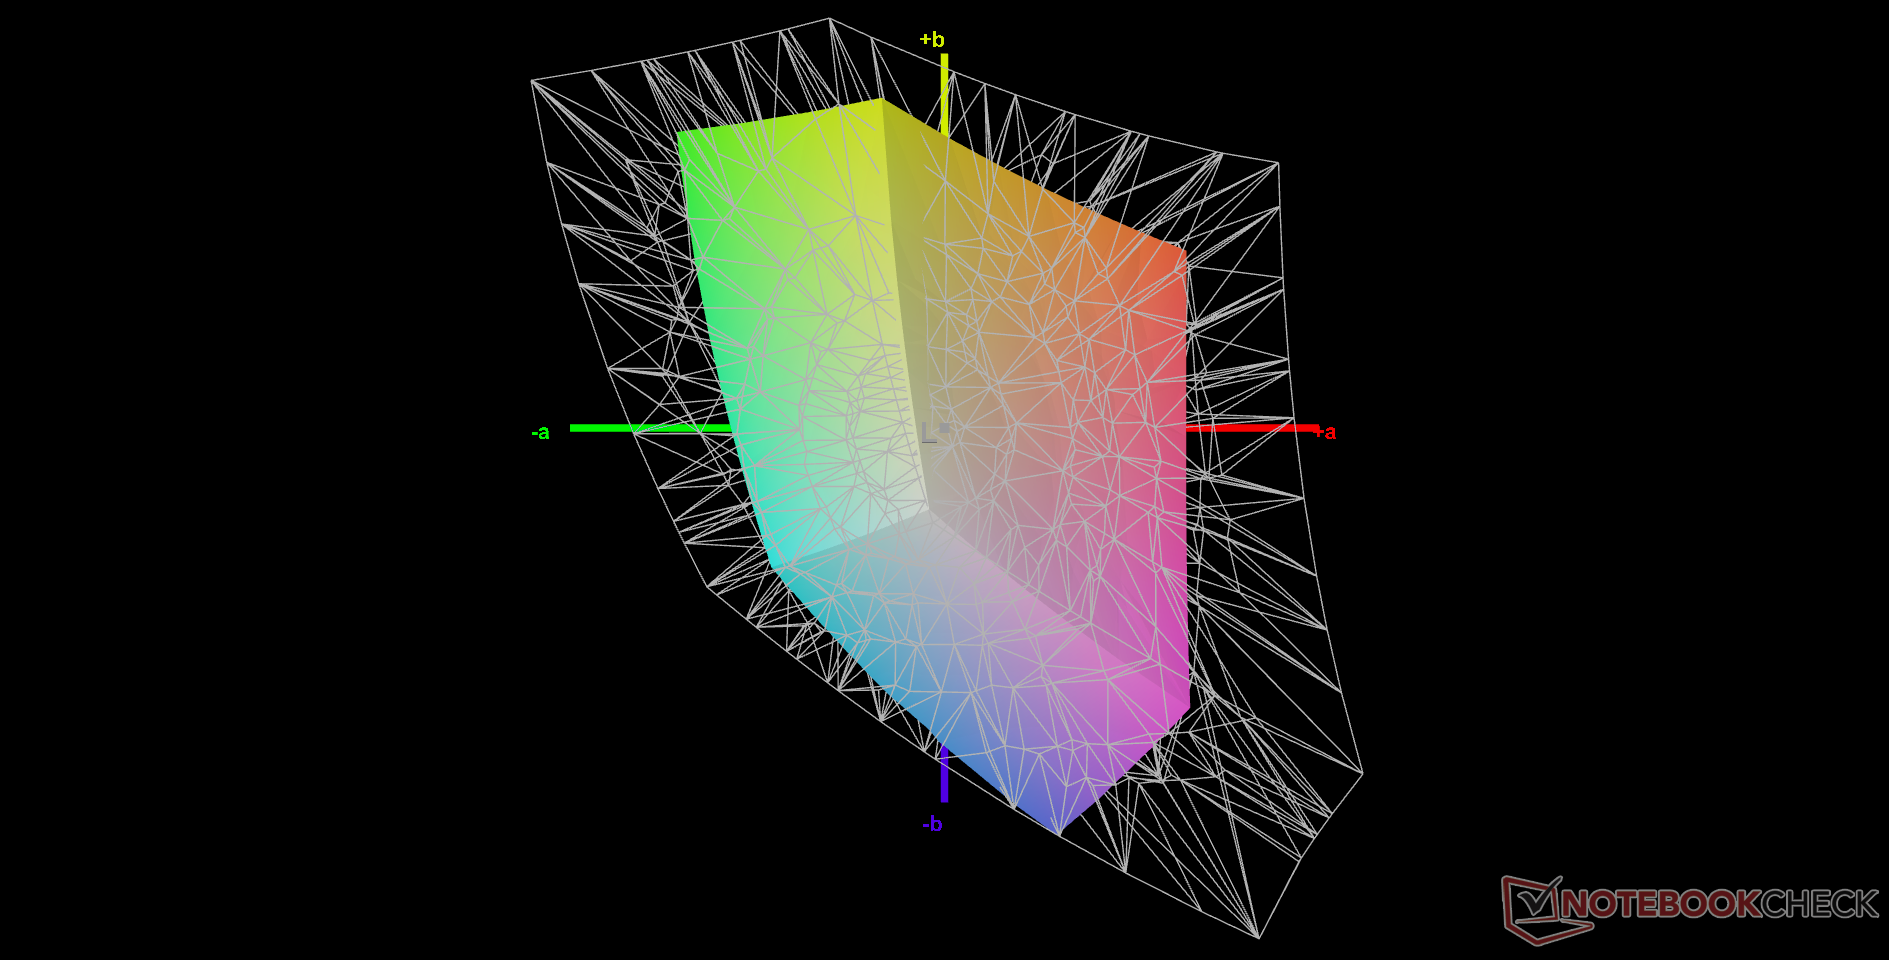
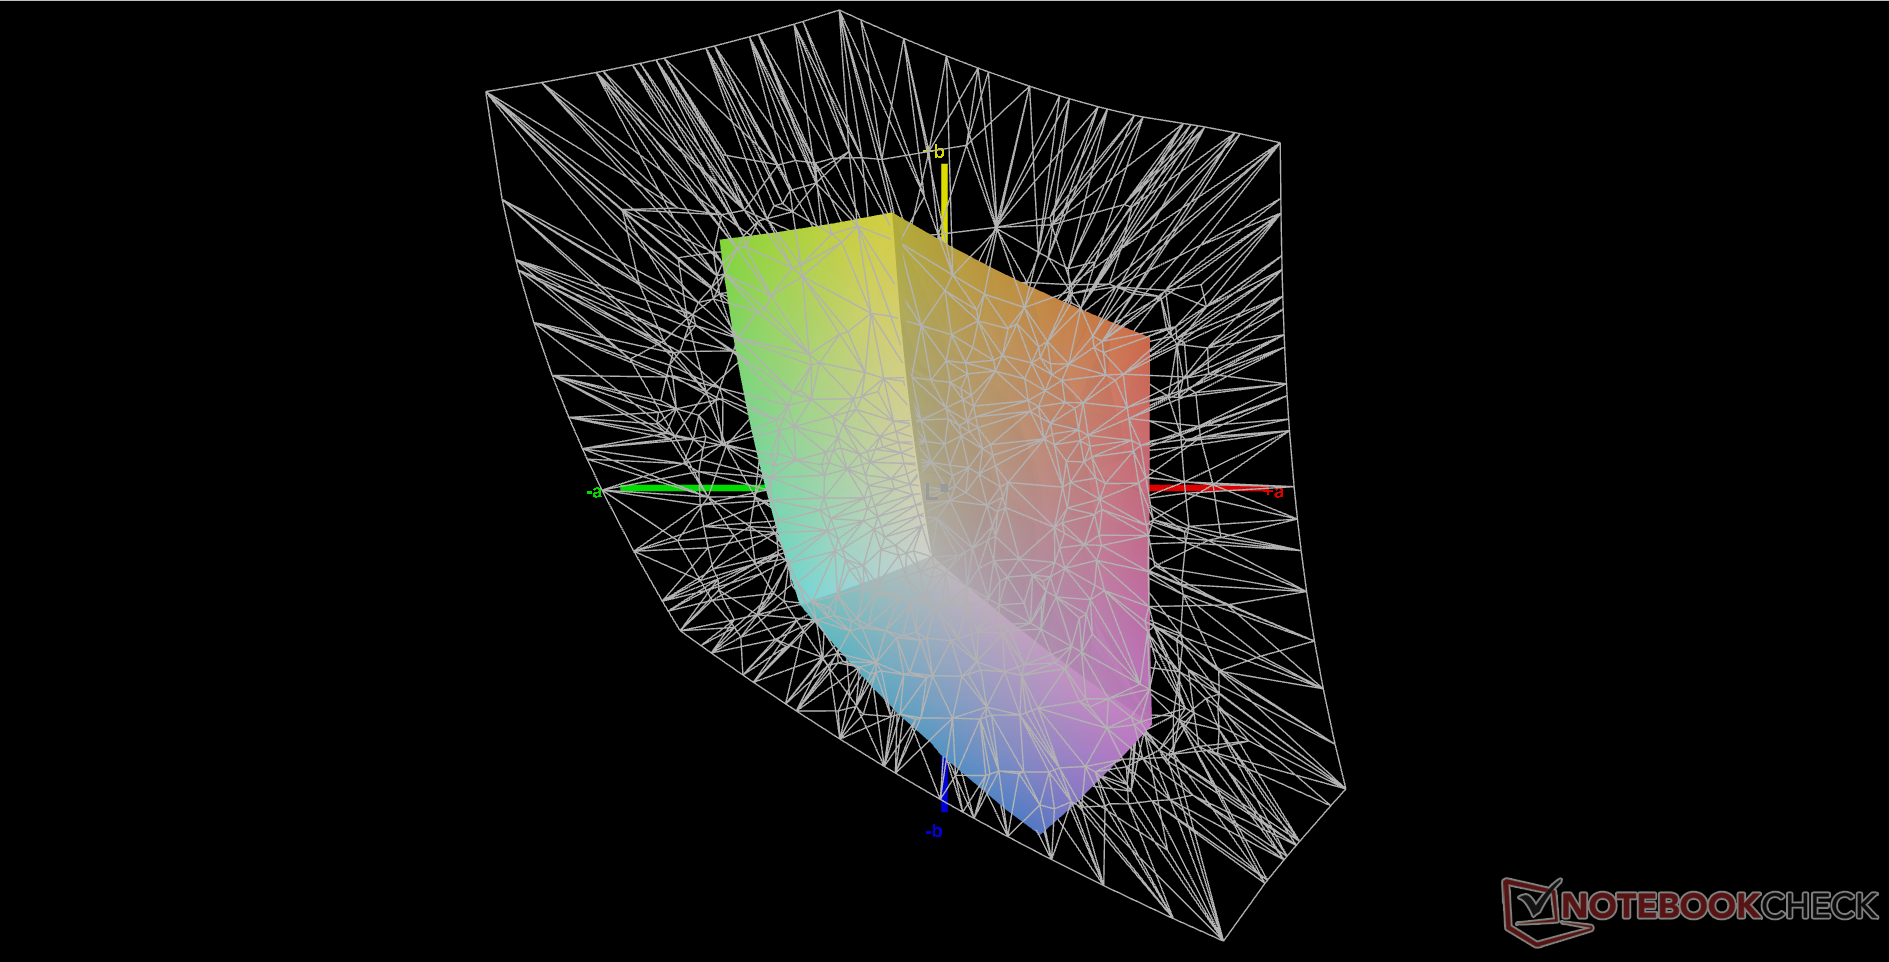
37% AdobeRGB 1998 (Argyll 3D)
53.8% sRGB (Argyll 3D)
35.8% Display P3 (Argyll 3D)
Gamma: 1.97
CCT: 6222 K
| Panasonic Toughbook 40 InfoVision M140NWF5 R3, IPS, 1920x1080, 14" | Panasonic Toughbook FZ-55 MK2 InfoVision M140NWF5 R3, IPS, 1920x1080, 14" | Getac S410 Gen 4 AU Optronics AUO413D, IPS, 1920x1080, 14" | Dell Latitude 5420 Rugged-P85G AU Optronics AUO523D, IPS, 1920x1080, 14" | Acer Enduro Urban N3 EUN314 XR140EA6T, IPS, 1920x1080, 14" | Durabook S14I KD140N0730A01, TN, 1920x1080, 14" | |
|---|---|---|---|---|---|---|
| Display | -3% | 7% | 74% | 75% | 22% | |
| Display P3 Coverage (%) | 35.8 | 34.8 -3% | 38.3 7% | 62.5 75% | 63.5 77% | 43.55 22% |
| sRGB Coverage (%) | 53.8 | 52.2 -3% | 57.2 6% | 92.4 72% | 91.9 71% | 65.4 22% |
| AdobeRGB 1998 Coverage (%) | 37 | 36 -3% | 39.5 7% | 64.2 74% | 65.5 77% | 45 22% |
| Response Times | 18% | 9% | -29% | -20% | 49% | |
| Response Time Grey 50% / Grey 80% * (ms) | 50.4 ? | 28.4 ? 44% | 35.2 ? 30% | 68 ? -35% | 56 ? -11% | 30.4 ? 40% |
| Response Time Black / White * (ms) | 27.6 ? | 30 ? -9% | 31.2 ? -13% | 33.6 ? -22% | 35.2 ? -28% | 11.8 ? 57% |
| PWM Frequency (Hz) | 694.4 ? | 685 ? | 870 ? | 735 ? | 1000 ? | 304.9 ? |
| Screen | -5% | -35% | -11% | -30% | -100% | |
| Brightness middle (cd/m²) | 1284.3 | 1061.1 -17% | 956.9 -25% | 1111.7 -13% | 487.8 -62% | 1180.7 -8% |
| Brightness (cd/m²) | 1289 | 997 -23% | 984 -24% | 1026 -20% | 464 -64% | 1102 -15% |
| Brightness Distribution (%) | 82 | 76 -7% | 84 2% | 80 -2% | 89 9% | 89 9% |
| Black Level * (cd/m²) | 0.89 | 0.7 21% | 0.81 9% | 0.81 9% | 0.48 46% | 1.91 -115% |
| Contrast (:1) | 1443 | 1516 5% | 1181 -18% | 1372 -5% | 1016 -30% | 618 -57% |
| Colorchecker dE 2000 * | 4.67 | 4.64 1% | 6.6 -41% | 3.83 18% | 6.51 -39% | 13.45 -188% |
| Colorchecker dE 2000 max. * | 19.85 | 20.92 -5% | 22.94 -16% | 7.85 60% | 11.36 43% | 22.52 -13% |
| Colorchecker dE 2000 calibrated * | 2.21 | 2.52 -14% | 4.05 -83% | 2.98 -35% | 1.77 20% | 3.19 -44% |
| Greyscale dE 2000 * | 2.7 | 2.8 -4% | 6 -122% | 5.6 -107% | 7.8 -189% | 15.4 -470% |
| Gamma | 1.97 112% | 2.08 106% | 2.19 100% | 2.306 95% | 2.28 96% | 1.97 112% |
| CCT | 6222 104% | 6364 102% | 7276 89% | 7676 85% | 8102 80% | 21134 31% |
| Color Space (Percent of AdobeRGB 1998) (%) | 59 | 41.6 | ||||
| Color Space (Percent of sRGB) (%) | 93 | 65.5 | ||||
| Total Average (Program / Settings) | 3% /
-1% | -6% /
-20% | 11% /
5% | 8% /
-6% | -10% /
-53% |
* ... smaller is better
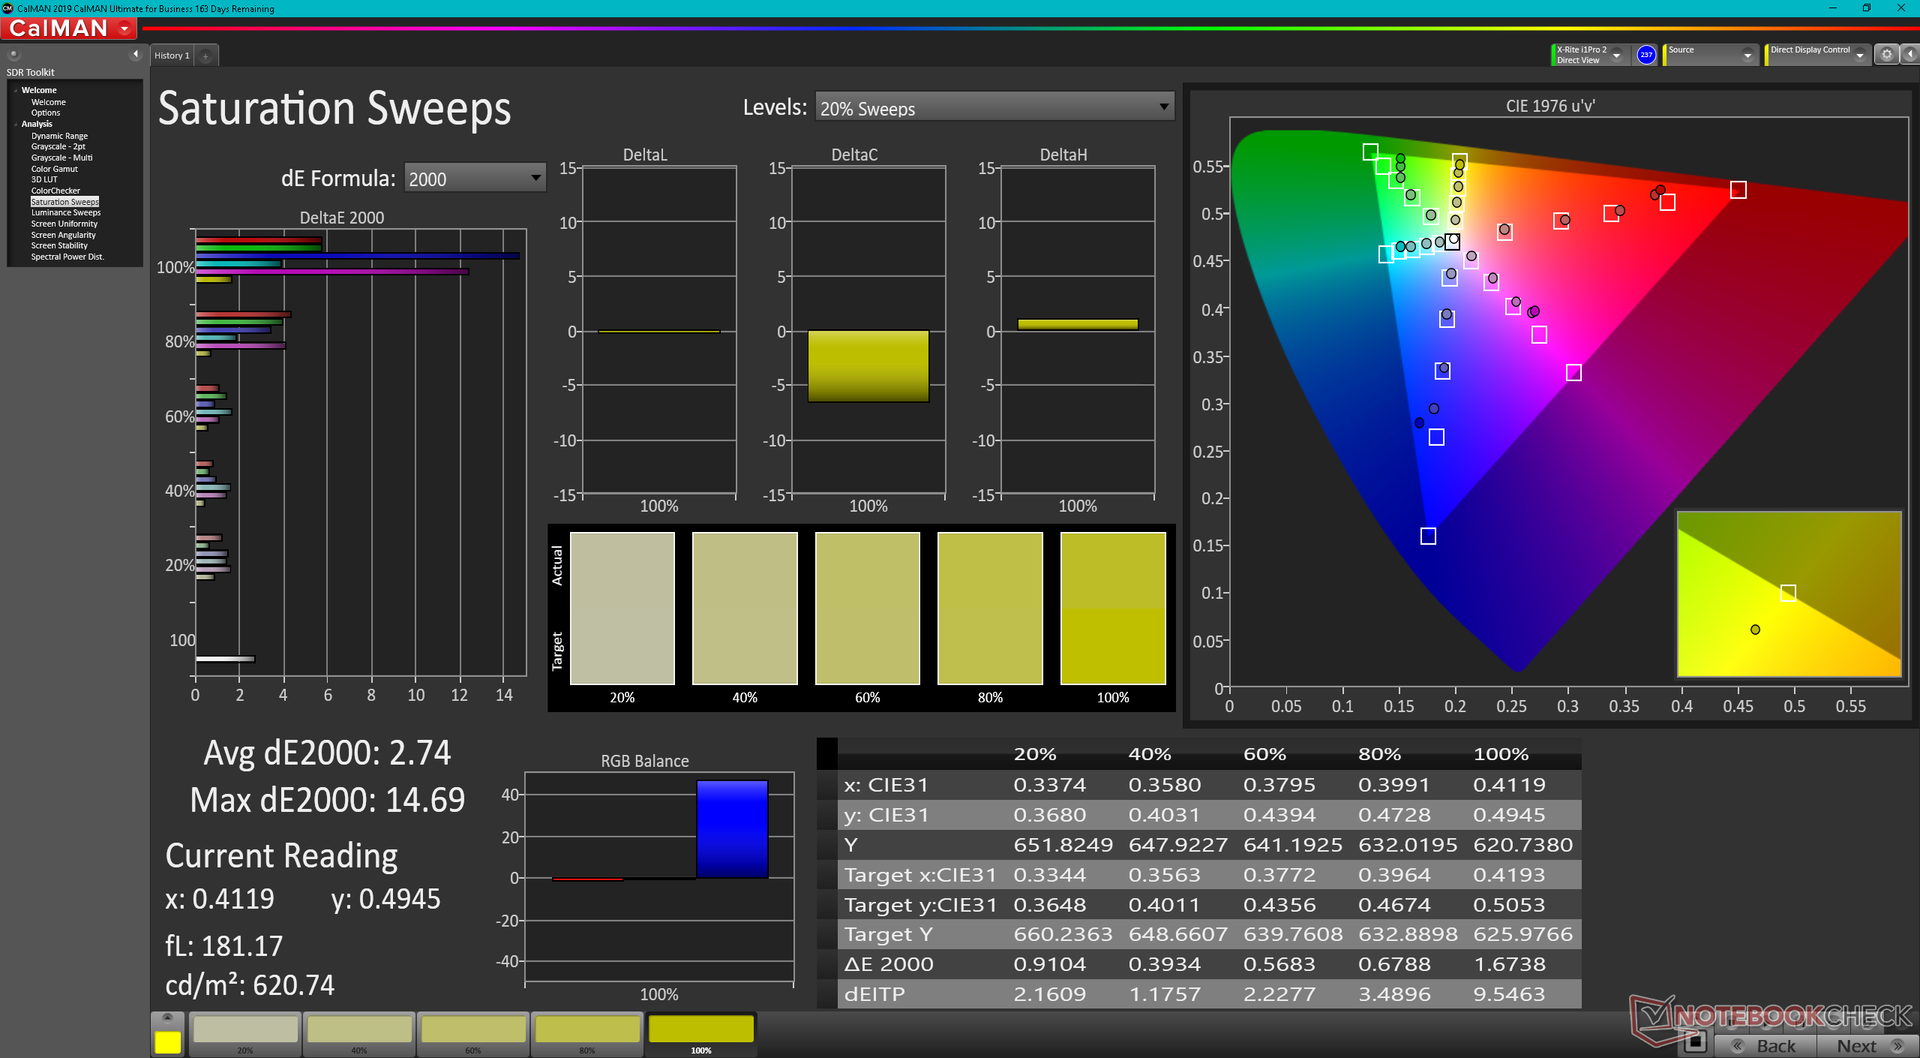
Gamut is narrow at just 54 percent of sRGB compared to >90 percent on the Acer Enduro Urban N3, Dell Latitude 5420 Rugged, and most midrange or higher consumer laptops. This generally shouldn't be a concern unless if color accuracy is essential for your applications.
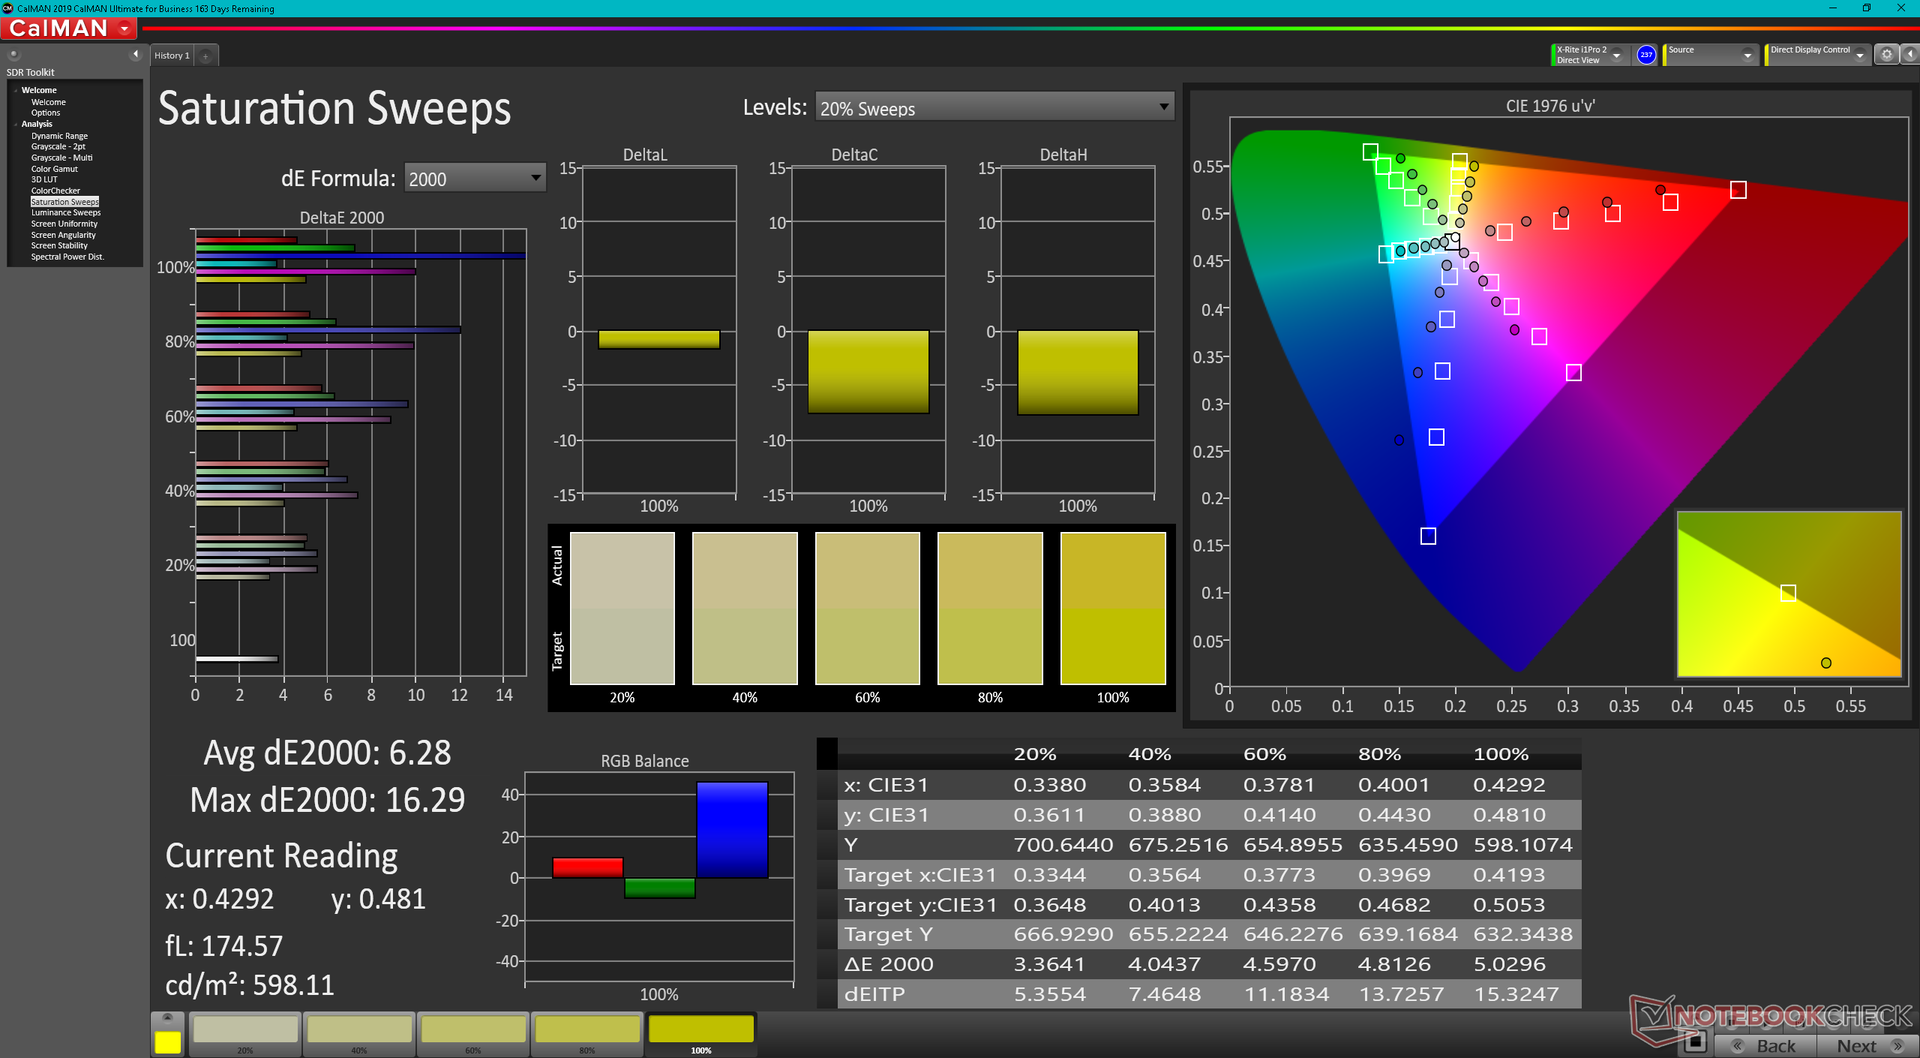
The display is not calibrated at factory. Calibrating it ourselves would improve average deltaE values across the board, but saturated colors will always be inaccurate due to the limited sRGB coverage mentioned above. Even so, users can still apply our calibrated ICM profile above to get the most out of the display.
Display Response Times
| ↔ Response Time Black to White | ||
|---|---|---|
| 27.6 ms ... rise ↗ and fall ↘ combined | ↗ 14.4 ms rise | 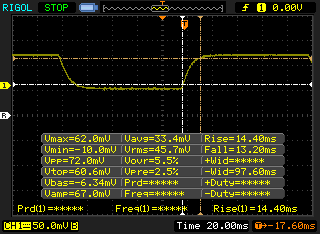 |
| ↘ 13.2 ms fall | ||
| The screen shows relatively slow response rates in our tests and may be too slow for gamers. In comparison, all tested devices range from 0.1 (minimum) to 240 (maximum) ms. » 69 % of all devices are better. This means that the measured response time is worse than the average of all tested devices (20.2 ms). | ||
| ↔ Response Time 50% Grey to 80% Grey | ||
| 50.4 ms ... rise ↗ and fall ↘ combined | ↗ 24.4 ms rise | 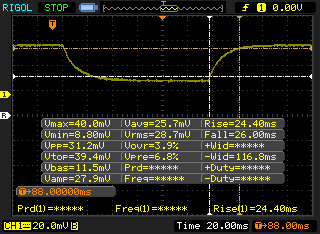 |
| ↘ 26 ms fall | ||
| The screen shows slow response rates in our tests and will be unsatisfactory for gamers. In comparison, all tested devices range from 0.165 (minimum) to 636 (maximum) ms. » 86 % of all devices are better. This means that the measured response time is worse than the average of all tested devices (31.6 ms). | ||
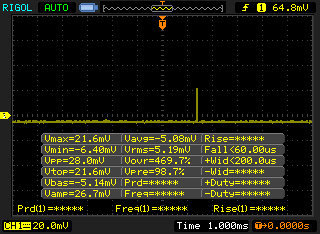
Screen Flickering / PWM (Pulse-Width Modulation)
| Screen flickering / PWM detected | 694.4 Hz | ≤ 99 % brightness setting | 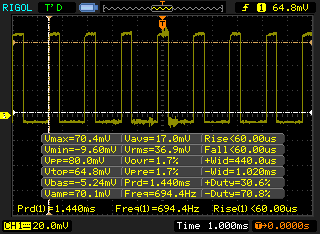 |
The display backlight flickers at 694.4 Hz (worst case, e.g., utilizing PWM) Flickering detected at a brightness setting of 99 % and below. There should be no flickering or PWM above this brightness setting. The frequency of 694.4 Hz is quite high, so most users sensitive to PWM should not notice any flickering. In comparison: 53 % of all tested devices do not use PWM to dim the display. If PWM was detected, an average of 8111 (minimum: 5 - maximum: 343500) Hz was measured. | |||

Performance
Testing Conditions
We set our unit to Performance mode via Windows prior to running any benchmarks below.
Processor
CPU performance is about 5 to 10 percent slower in both single- and multi-threaded workloads than the average laptop in our database equipped with the same Core i7-1185G7 CPU. This isn't unusual as many rugged laptops tend to aim for lower clock rates for increased stability and reliability. Overall performance is still much faster than any 10th gen or older Core U-series solution.
Cinebench R15 Multi Loop
Cinebench R23: Multi Core | Single Core
Cinebench R15: CPU Multi 64Bit | CPU Single 64Bit
Blender: v2.79 BMW27 CPU
7-Zip 18.03: 7z b 4 | 7z b 4 -mmt1
Geekbench 5.5: Multi-Core | Single-Core
HWBOT x265 Benchmark v2.2: 4k Preset
LibreOffice : 20 Documents To PDF
R Benchmark 2.5: Overall mean
* ... smaller is better
AIDA64: FP32 Ray-Trace | FPU Julia | CPU SHA3 | CPU Queen | FPU SinJulia | FPU Mandel | CPU AES | CPU ZLib | FP64 Ray-Trace | CPU PhotoWorxx
| Performance rating | |
| Acer Enduro Urban N3 EUN314 | |
| Average Intel Core i7-1185G7 | |
| Panasonic Toughbook FZ-55 MK2 | |
| Getac S410 Gen 4 | |
| Panasonic Toughbook 40 | |
| Durabook S14I | |
| AIDA64 / FP32 Ray-Trace | |
| Acer Enduro Urban N3 EUN314 | |
| Average Intel Core i7-1185G7 (5621 - 7453, n=20) | |
| Panasonic Toughbook FZ-55 MK2 | |
| Getac S410 Gen 4 | |
| Panasonic Toughbook 40 | |
| Durabook S14I | |
| AIDA64 / FPU Julia | |
| Acer Enduro Urban N3 EUN314 | |
| Panasonic Toughbook FZ-55 MK2 | |
| Average Intel Core i7-1185G7 (23248 - 32614, n=20) | |
| Getac S410 Gen 4 | |
| Panasonic Toughbook 40 | |
| Durabook S14I | |
| AIDA64 / CPU SHA3 | |
| Acer Enduro Urban N3 EUN314 | |
| Average Intel Core i7-1185G7 (1530 - 2209, n=20) | |
| Panasonic Toughbook FZ-55 MK2 | |
| Getac S410 Gen 4 | |
| Panasonic Toughbook 40 | |
| Durabook S14I | |
| AIDA64 / CPU Queen | |
| Acer Enduro Urban N3 EUN314 | |
| Durabook S14I | |
| Panasonic Toughbook FZ-55 MK2 | |
| Average Intel Core i7-1185G7 (44677 - 52815, n=20) | |
| Getac S410 Gen 4 | |
| Panasonic Toughbook 40 | |
| AIDA64 / FPU SinJulia | |
| Acer Enduro Urban N3 EUN314 | |
| Panasonic Toughbook FZ-55 MK2 | |
| Average Intel Core i7-1185G7 (3870 - 5027, n=20) | |
| Getac S410 Gen 4 | |
| Panasonic Toughbook 40 | |
| Durabook S14I | |
| AIDA64 / FPU Mandel | |
| Acer Enduro Urban N3 EUN314 | |
| Panasonic Toughbook FZ-55 MK2 | |
| Average Intel Core i7-1185G7 (14584 - 19594, n=20) | |
| Getac S410 Gen 4 | |
| Panasonic Toughbook 40 | |
| Durabook S14I | |
| AIDA64 / CPU AES | |
| Acer Enduro Urban N3 EUN314 | |
| Durabook S14I | |
| Average Intel Core i7-1185G7 (33002 - 76826, n=20) | |
| Getac S410 Gen 4 | |
| Panasonic Toughbook FZ-55 MK2 | |
| Panasonic Toughbook 40 | |
| AIDA64 / CPU ZLib | |
| Acer Enduro Urban N3 EUN314 | |
| Panasonic Toughbook 40 | |
| Getac S410 Gen 4 | |
| Average Intel Core i7-1185G7 (258 - 412, n=22) | |
| Panasonic Toughbook FZ-55 MK2 | |
| Durabook S14I | |
| AIDA64 / FP64 Ray-Trace | |
| Acer Enduro Urban N3 EUN314 | |
| Panasonic Toughbook FZ-55 MK2 | |
| Average Intel Core i7-1185G7 (2821 - 4094, n=20) | |
| Getac S410 Gen 4 | |
| Panasonic Toughbook 40 | |
| Durabook S14I | |
| AIDA64 / CPU PhotoWorxx | |
| Average Intel Core i7-1185G7 (22349 - 43701, n=20) | |
| Getac S410 Gen 4 | |
| Acer Enduro Urban N3 EUN314 | |
| Panasonic Toughbook FZ-55 MK2 | |
| Panasonic Toughbook 40 | |
| Durabook S14I | |
System Performance
CrossMark: Overall | Productivity | Creativity | Responsiveness
| PCMark 10 / Score | |
| Panasonic Toughbook FZ-55 MK2 | |
| Average Intel Core i7-1185G7, Intel Iris Xe Graphics G7 96EUs (4746 - 5561, n=20) | |
| Panasonic Toughbook 40 | |
| Durabook S14I | |
| Getac S410 Gen 4 | |
| Acer Enduro Urban N3 EUN314 | |
| Dell Latitude 5420 Rugged-P85G | |
| PCMark 10 / Essentials | |
| Panasonic Toughbook FZ-55 MK2 | |
| Durabook S14I | |
| Getac S410 Gen 4 | |
| Average Intel Core i7-1185G7, Intel Iris Xe Graphics G7 96EUs (8279 - 10664, n=20) | |
| Panasonic Toughbook 40 | |
| Acer Enduro Urban N3 EUN314 | |
| Dell Latitude 5420 Rugged-P85G | |
| PCMark 10 / Productivity | |
| Dell Latitude 5420 Rugged-P85G | |
| Durabook S14I | |
| Average Intel Core i7-1185G7, Intel Iris Xe Graphics G7 96EUs (5799 - 8770, n=20) | |
| Panasonic Toughbook FZ-55 MK2 | |
| Panasonic Toughbook 40 | |
| Acer Enduro Urban N3 EUN314 | |
| Getac S410 Gen 4 | |
| PCMark 10 / Digital Content Creation | |
| Panasonic Toughbook 40 | |
| Panasonic Toughbook FZ-55 MK2 | |
| Average Intel Core i7-1185G7, Intel Iris Xe Graphics G7 96EUs (4424 - 5684, n=20) | |
| Getac S410 Gen 4 | |
| Acer Enduro Urban N3 EUN314 | |
| Durabook S14I | |
| Dell Latitude 5420 Rugged-P85G | |
| CrossMark / Overall | |
| Average Intel Core i7-1185G7, Intel Iris Xe Graphics G7 96EUs (1233 - 1474, n=5) | |
| Panasonic Toughbook 40 | |
| Getac S410 Gen 4 | |
| CrossMark / Productivity | |
| Average Intel Core i7-1185G7, Intel Iris Xe Graphics G7 96EUs (1277 - 1506, n=5) | |
| Panasonic Toughbook 40 | |
| Getac S410 Gen 4 | |
| CrossMark / Creativity | |
| Average Intel Core i7-1185G7, Intel Iris Xe Graphics G7 96EUs (1291 - 1513, n=5) | |
| Panasonic Toughbook 40 | |
| Getac S410 Gen 4 | |
| CrossMark / Responsiveness | |
| Average Intel Core i7-1185G7, Intel Iris Xe Graphics G7 96EUs (969 - 1411, n=5) | |
| Panasonic Toughbook 40 | |
| Getac S410 Gen 4 | |
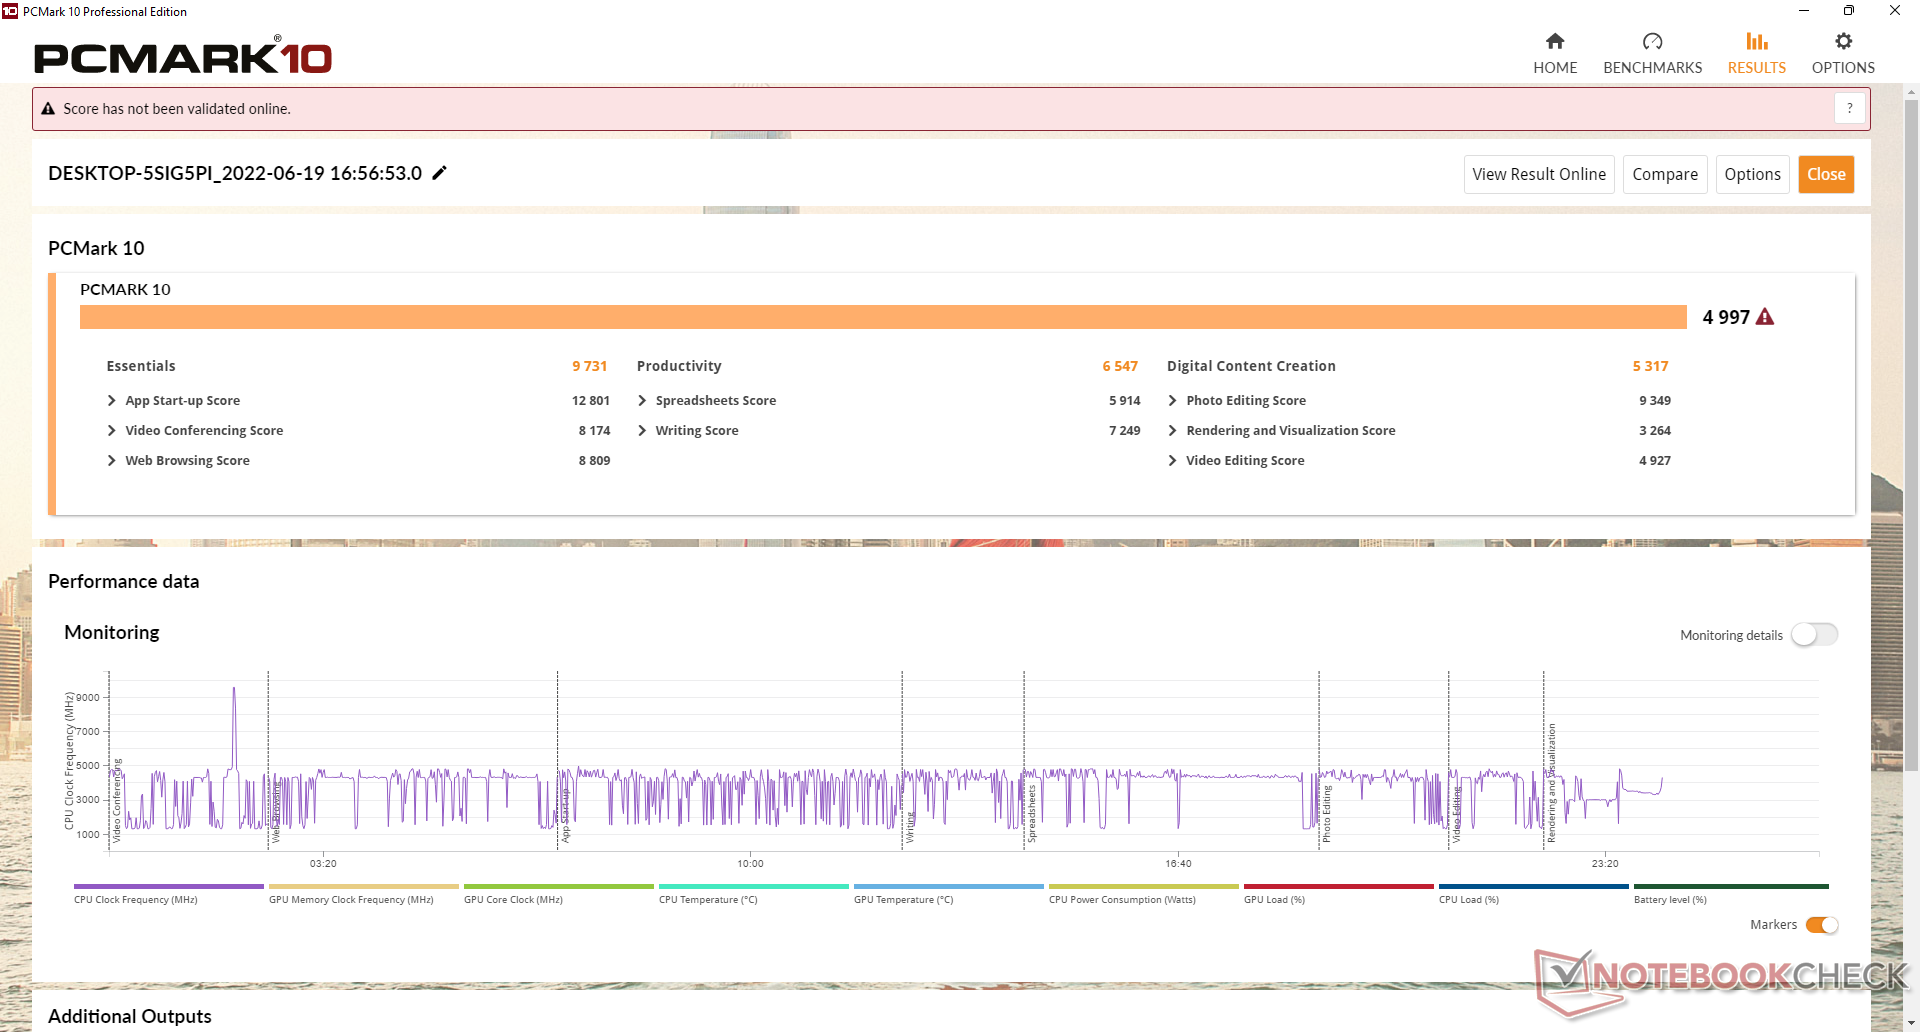
| PCMark 10 Score | 4997 points | |
Help | ||
| AIDA64 / Memory Copy | |
| Average Intel Core i7-1185G7 (36515 - 68450, n=20) | |
| Acer Enduro Urban N3 EUN314 | |
| Panasonic Toughbook FZ-55 MK2 | |
| Getac S410 Gen 4 | |
| Panasonic Toughbook 40 | |
| Durabook S14I | |
| AIDA64 / Memory Read | |
| Average Intel Core i7-1185G7 (38394 - 64291, n=20) | |
| Acer Enduro Urban N3 EUN314 | |
| Panasonic Toughbook FZ-55 MK2 | |
| Getac S410 Gen 4 | |
| Panasonic Toughbook 40 | |
| Durabook S14I | |
| AIDA64 / Memory Write | |
| Average Intel Core i7-1185G7 (37684 - 66873, n=20) | |
| Acer Enduro Urban N3 EUN314 | |
| Panasonic Toughbook FZ-55 MK2 | |
| Getac S410 Gen 4 | |
| Panasonic Toughbook 40 | |
| Durabook S14I | |
| AIDA64 / Memory Latency | |
| Panasonic Toughbook 40 | |
| Average Intel Core i7-1185G7 (78.3 - 117, n=22) | |
| Acer Enduro Urban N3 EUN314 | |
| Getac S410 Gen 4 | |
| Panasonic Toughbook FZ-55 MK2 | |
| Durabook S14I | |
* ... smaller is better
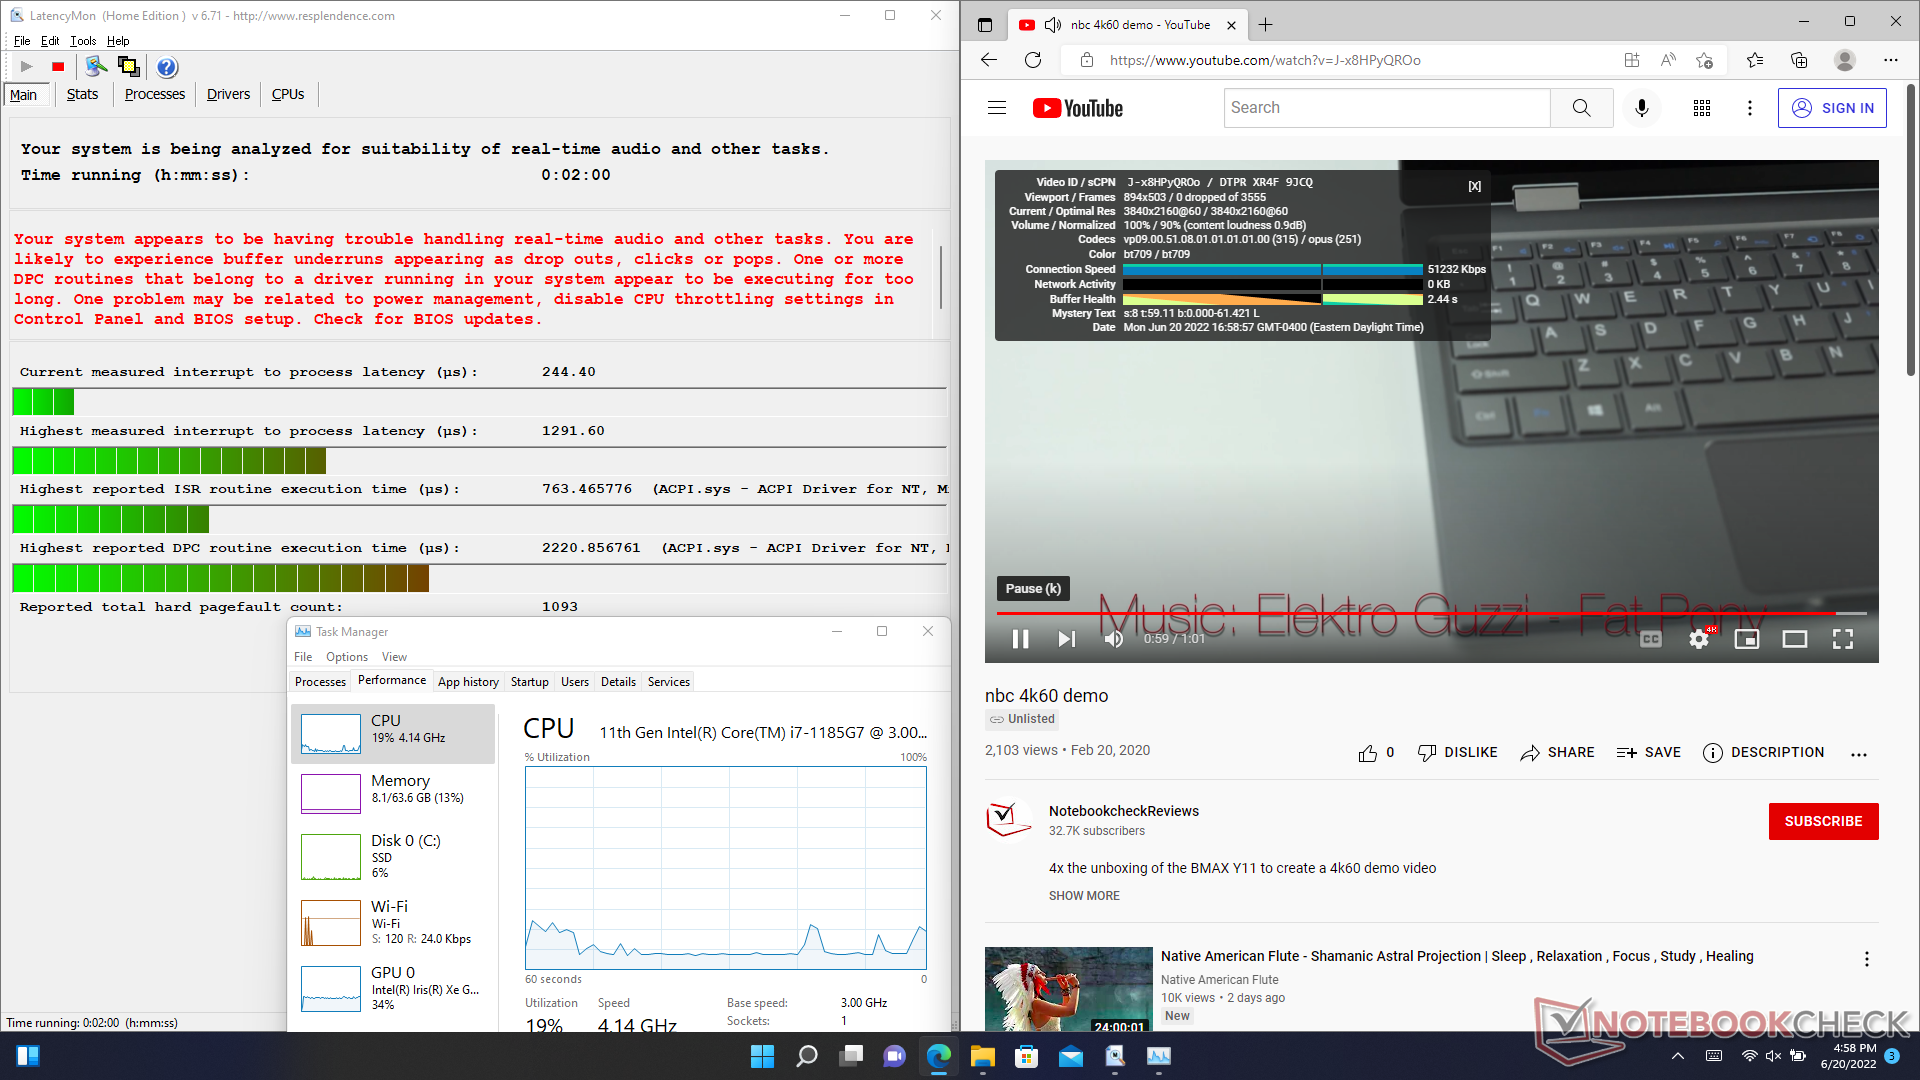
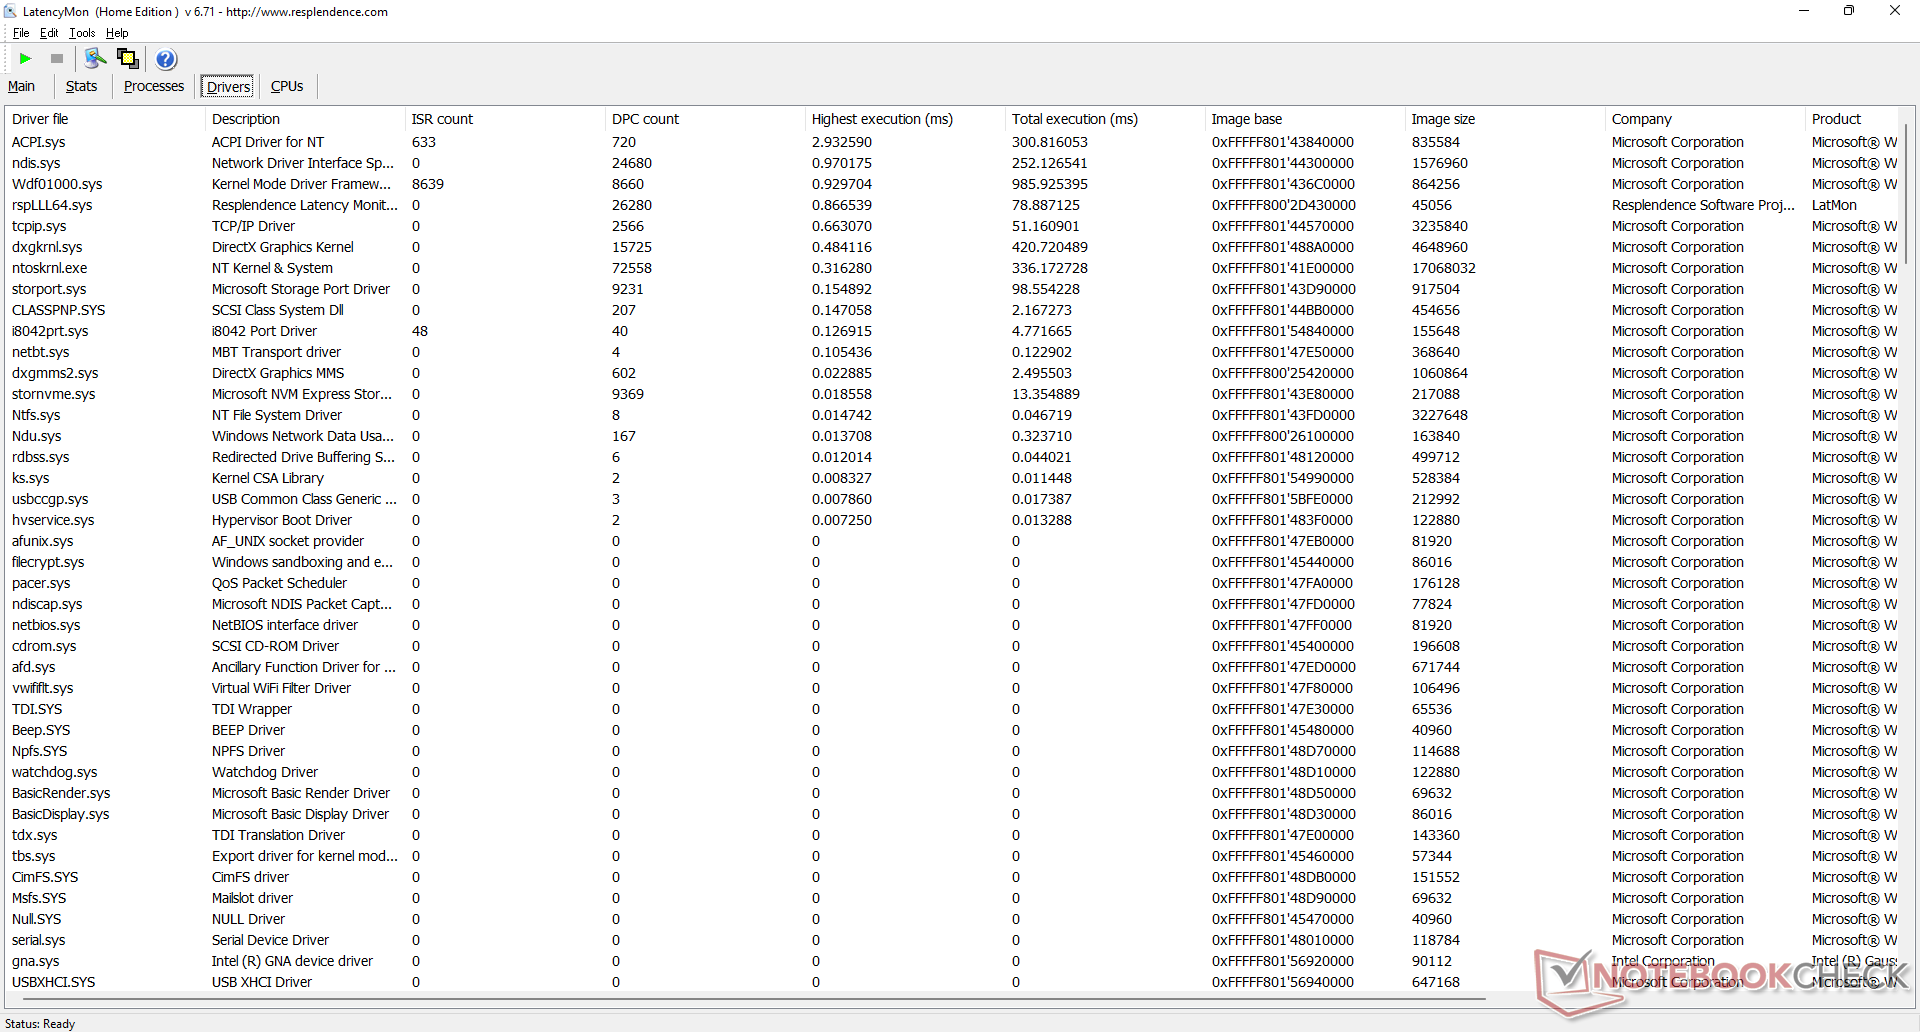
DPC Latency
LatencyMon reveals DPC issues when opening multiple browser tabs of our homepage. 4K video playback at 60 FPS is otherwise smooth and without any dropped frames.
| DPC Latencies / LatencyMon - interrupt to process latency (max), Web, Youtube, Prime95 | |
| Acer Enduro Urban N3 EUN314 | |
| Panasonic Toughbook FZ-55 MK2 | |
| Durabook S14I | |
| Getac S410 Gen 4 | |
| Panasonic Toughbook 40 | |
* ... smaller is better
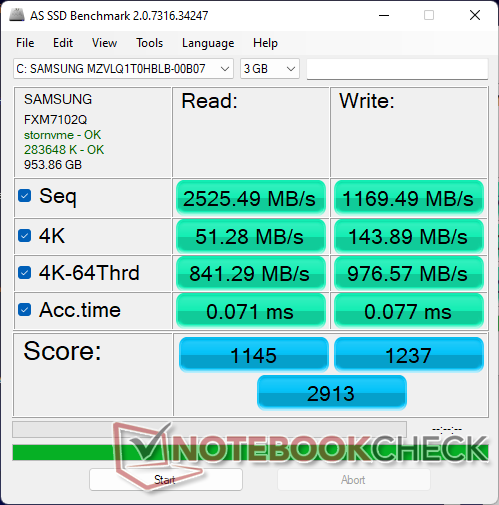
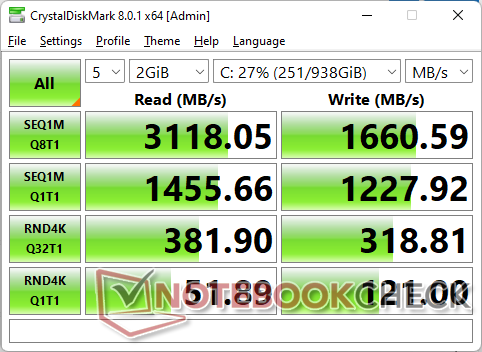
Storage Devices
Our test unit comes with a primary Samsung PM991 PCIe3 x4 NVMe SSD. An optional secondary SATA drive can be installed as well by utilizing one of the xPAK slots. Both drives attach to the laptop via quick-release slots.
The SSD in our unit is unable to maintain its maximum transfer rates for extended periods likely due to poor heat dissipation. When running DiskSpd in a loop, transfer rates would start out high at 3000 MB/s before steadily falling and eventually stabilizing at just ~1700 MB/s.

| Drive Performance rating - Percent | |
| Acer Enduro Urban N3 EUN314 | |
| Durabook S14I | |
| Panasonic Toughbook 40 | |
| Dell Latitude 5420 Rugged-P85G -8! | |
| Panasonic Toughbook FZ-55 MK2 | |
| Getac S410 Gen 4 | |
* ... smaller is better
Disk Throttling: DiskSpd Read Loop, Queue Depth 8
GPU Performance
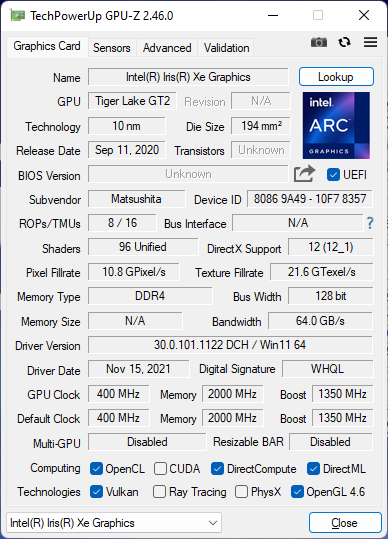
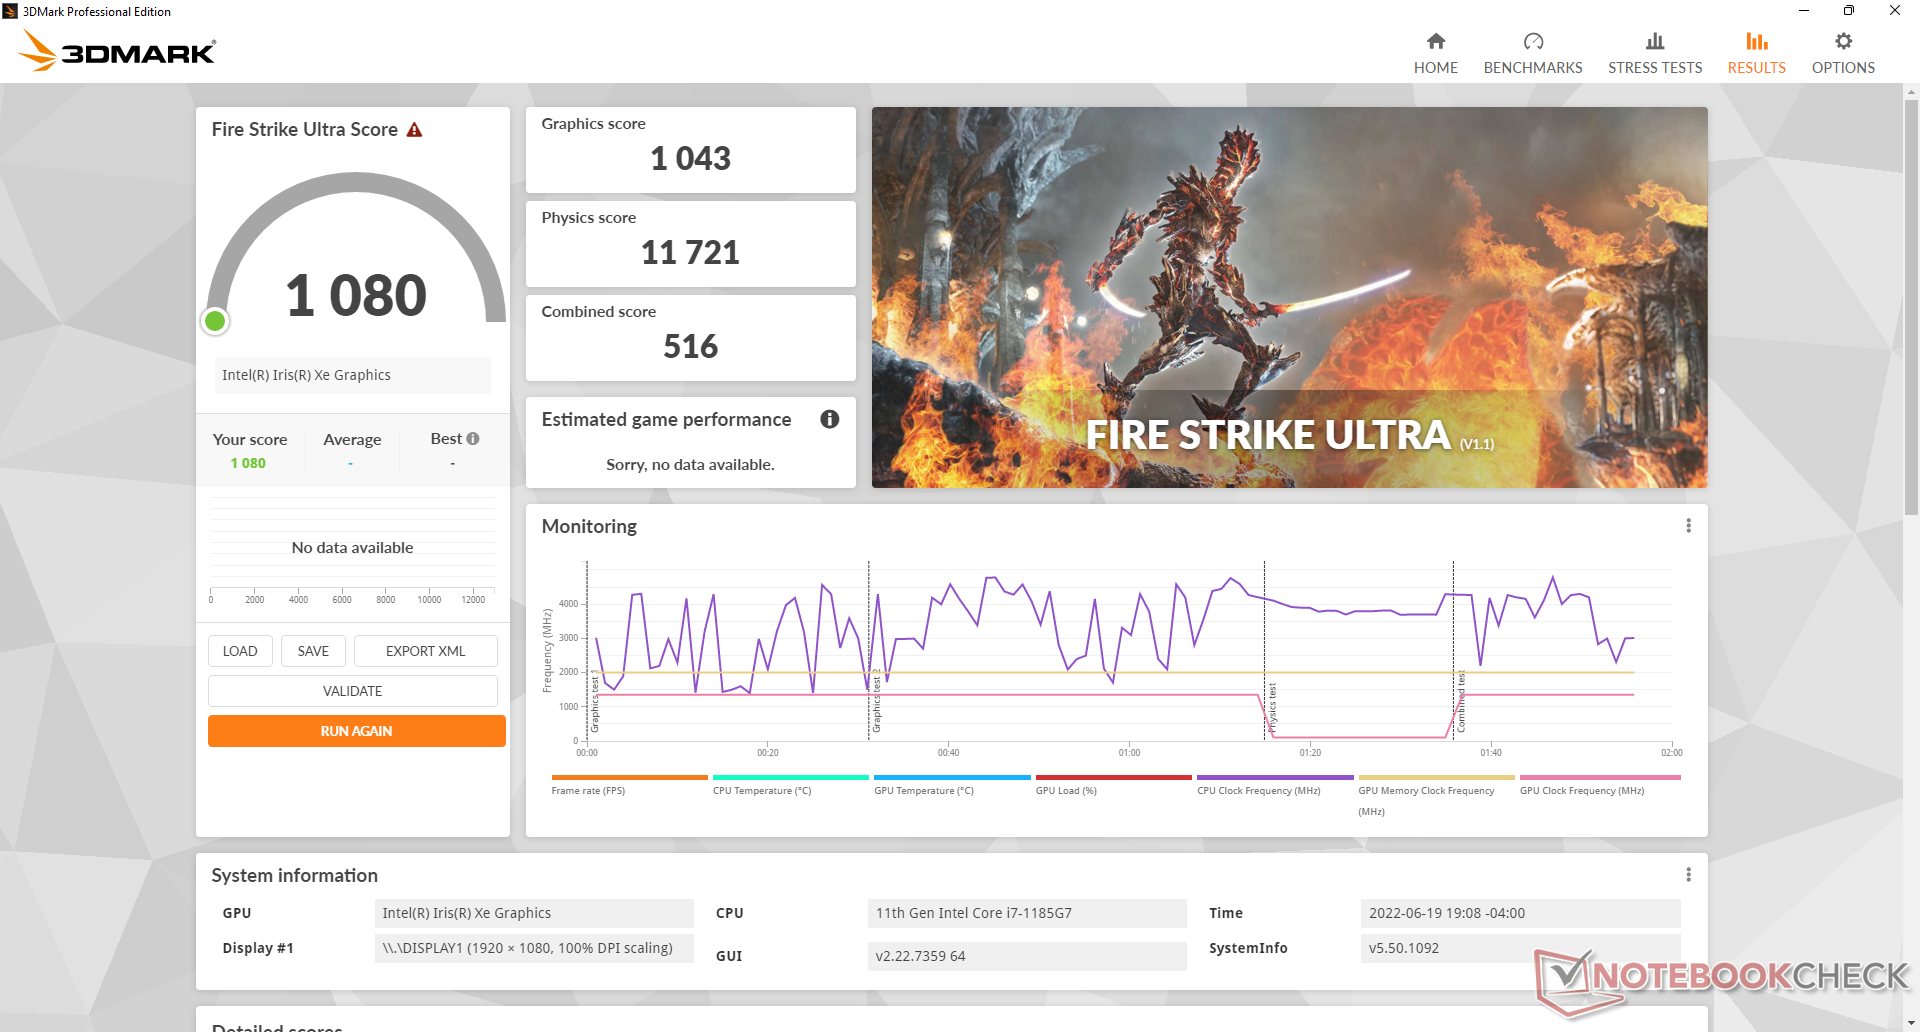
The integrated Iris Xe 96 EUs is performing where we expect it to be relative to other laptops with the same GPU. Both performance and performance-per-watt are significantly greater than any rugged laptop still running on older UHD 620 Graphics.
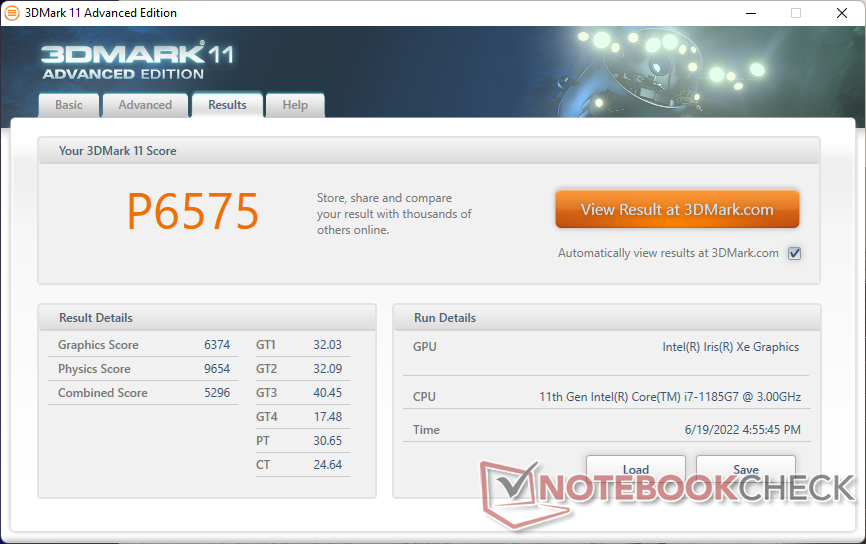
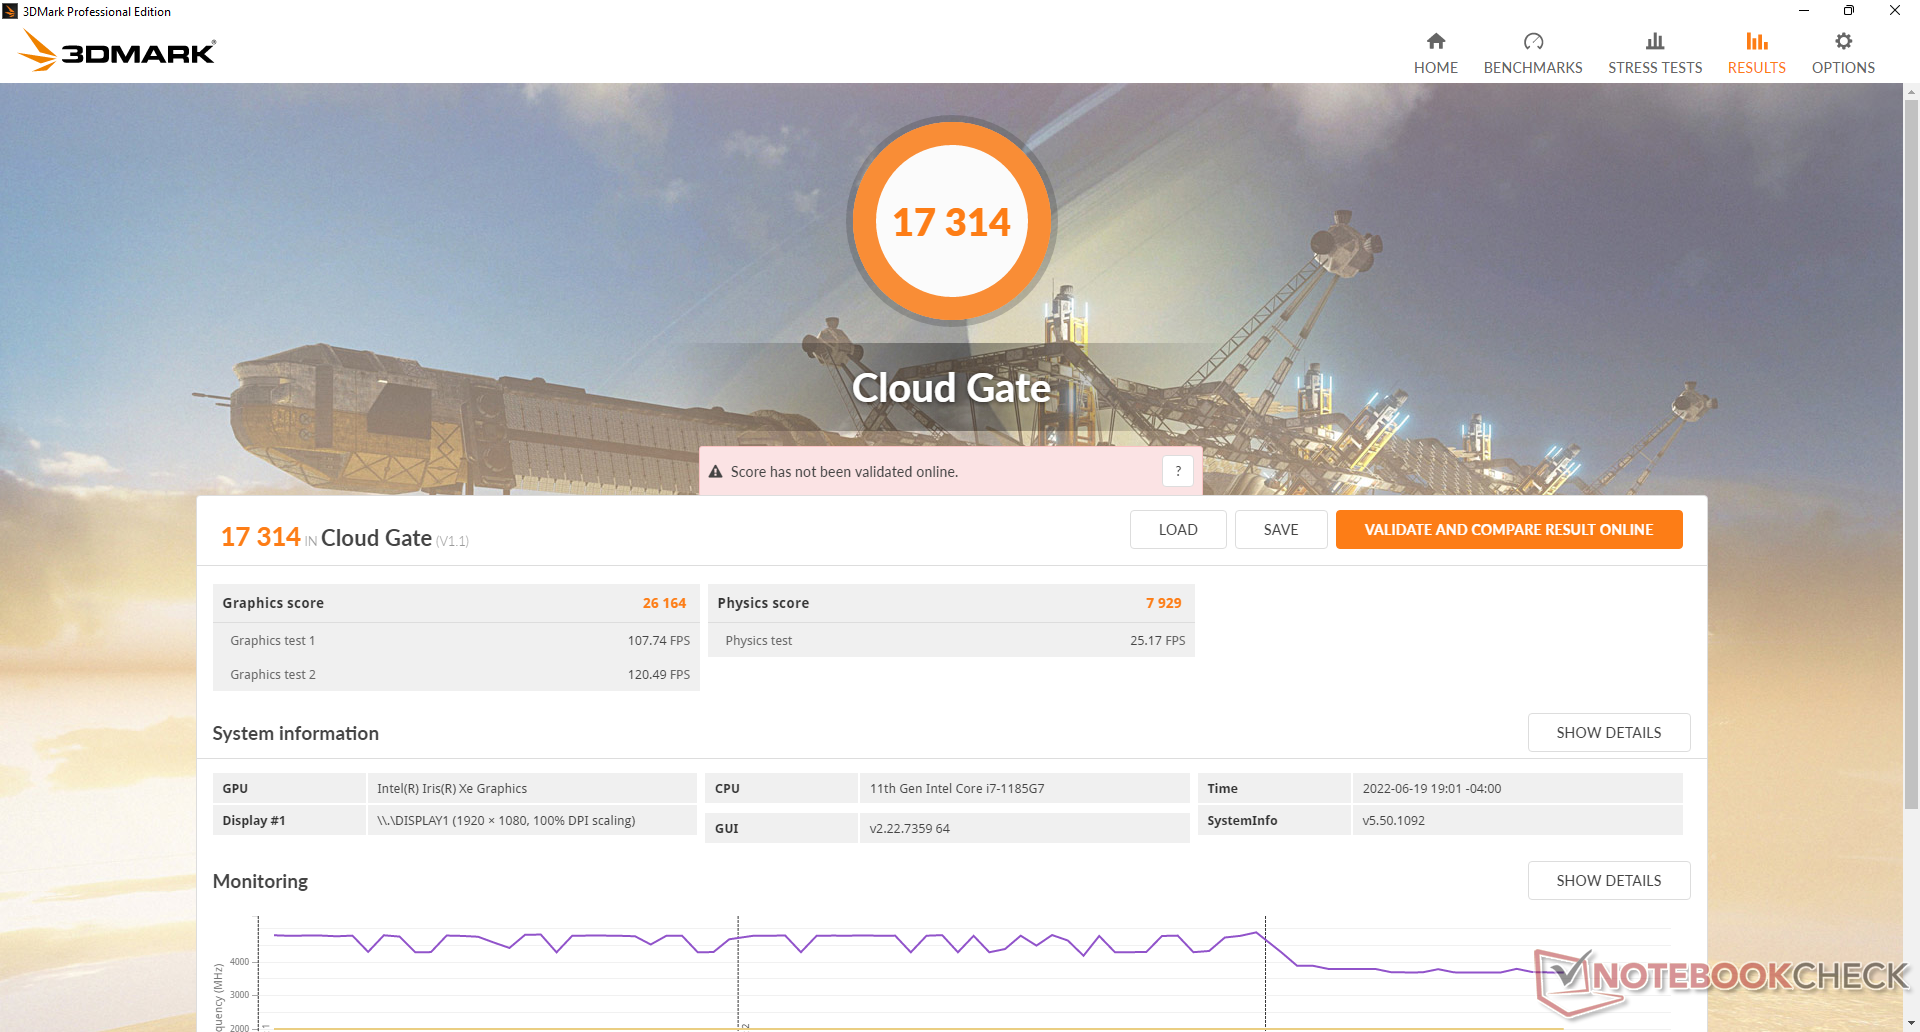
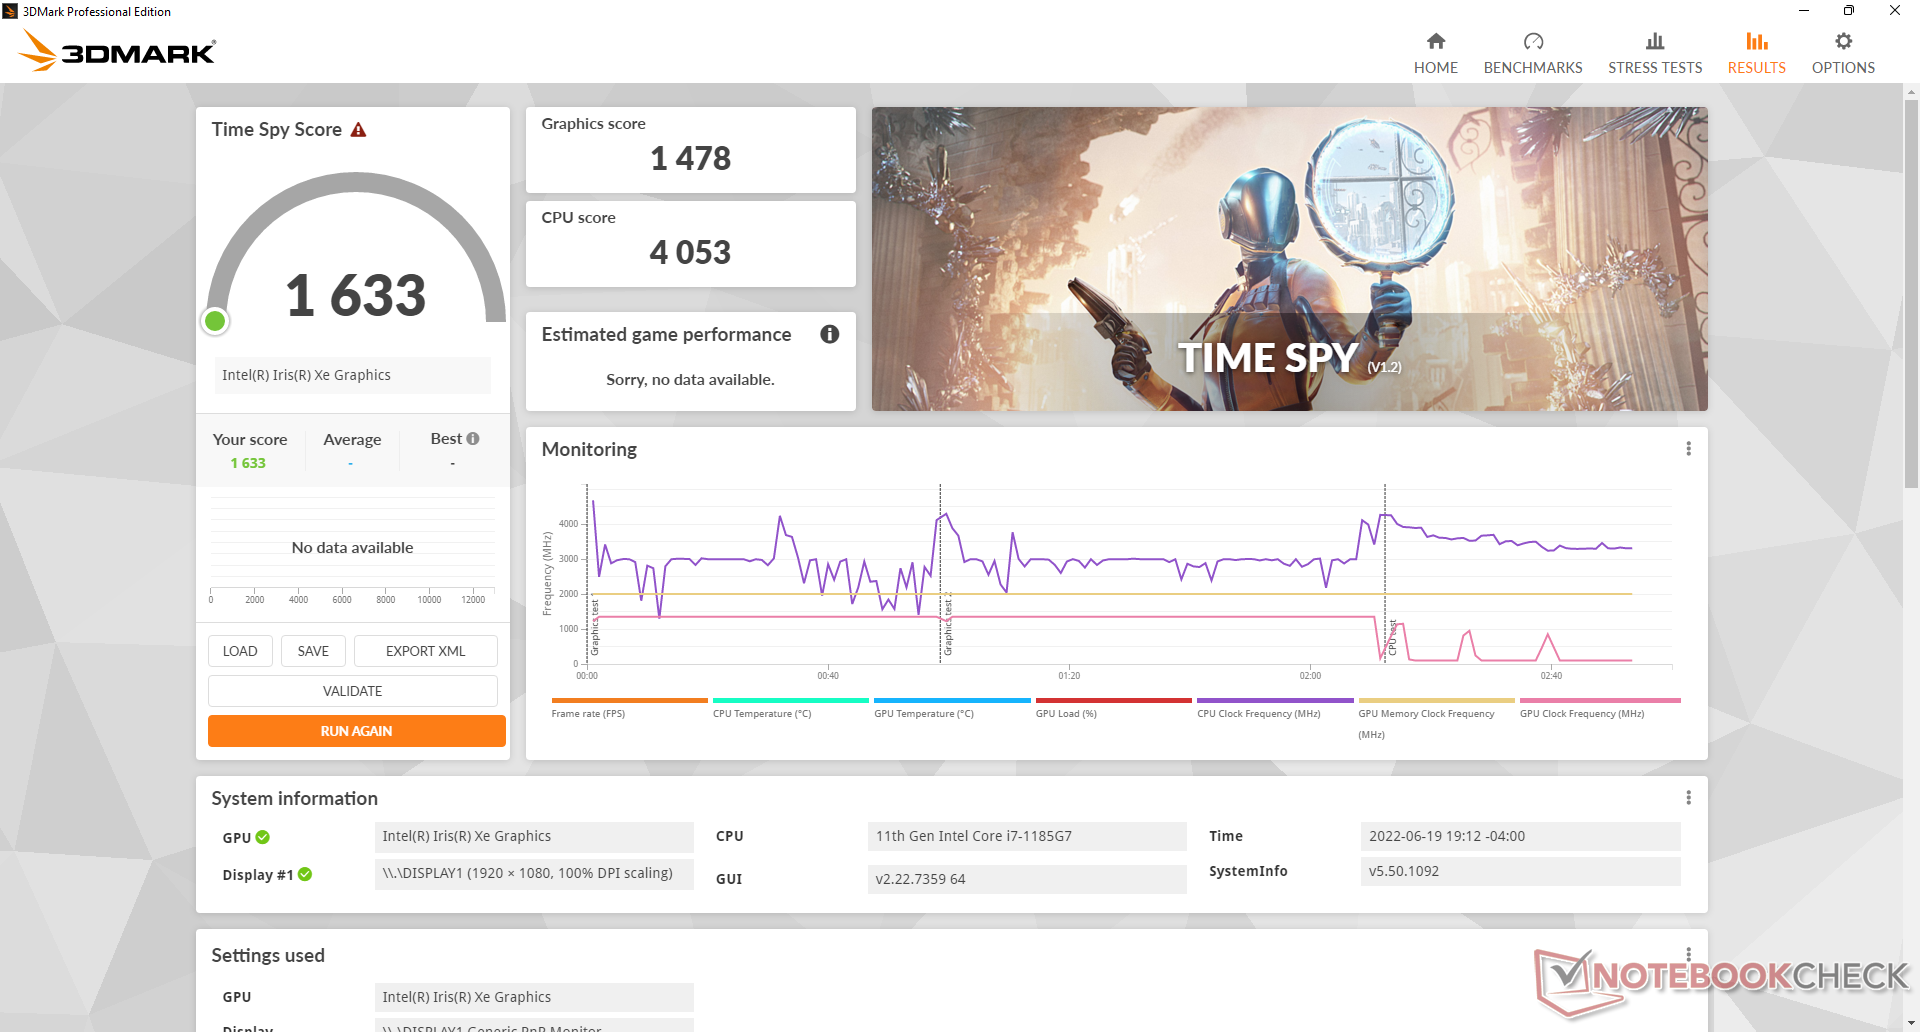
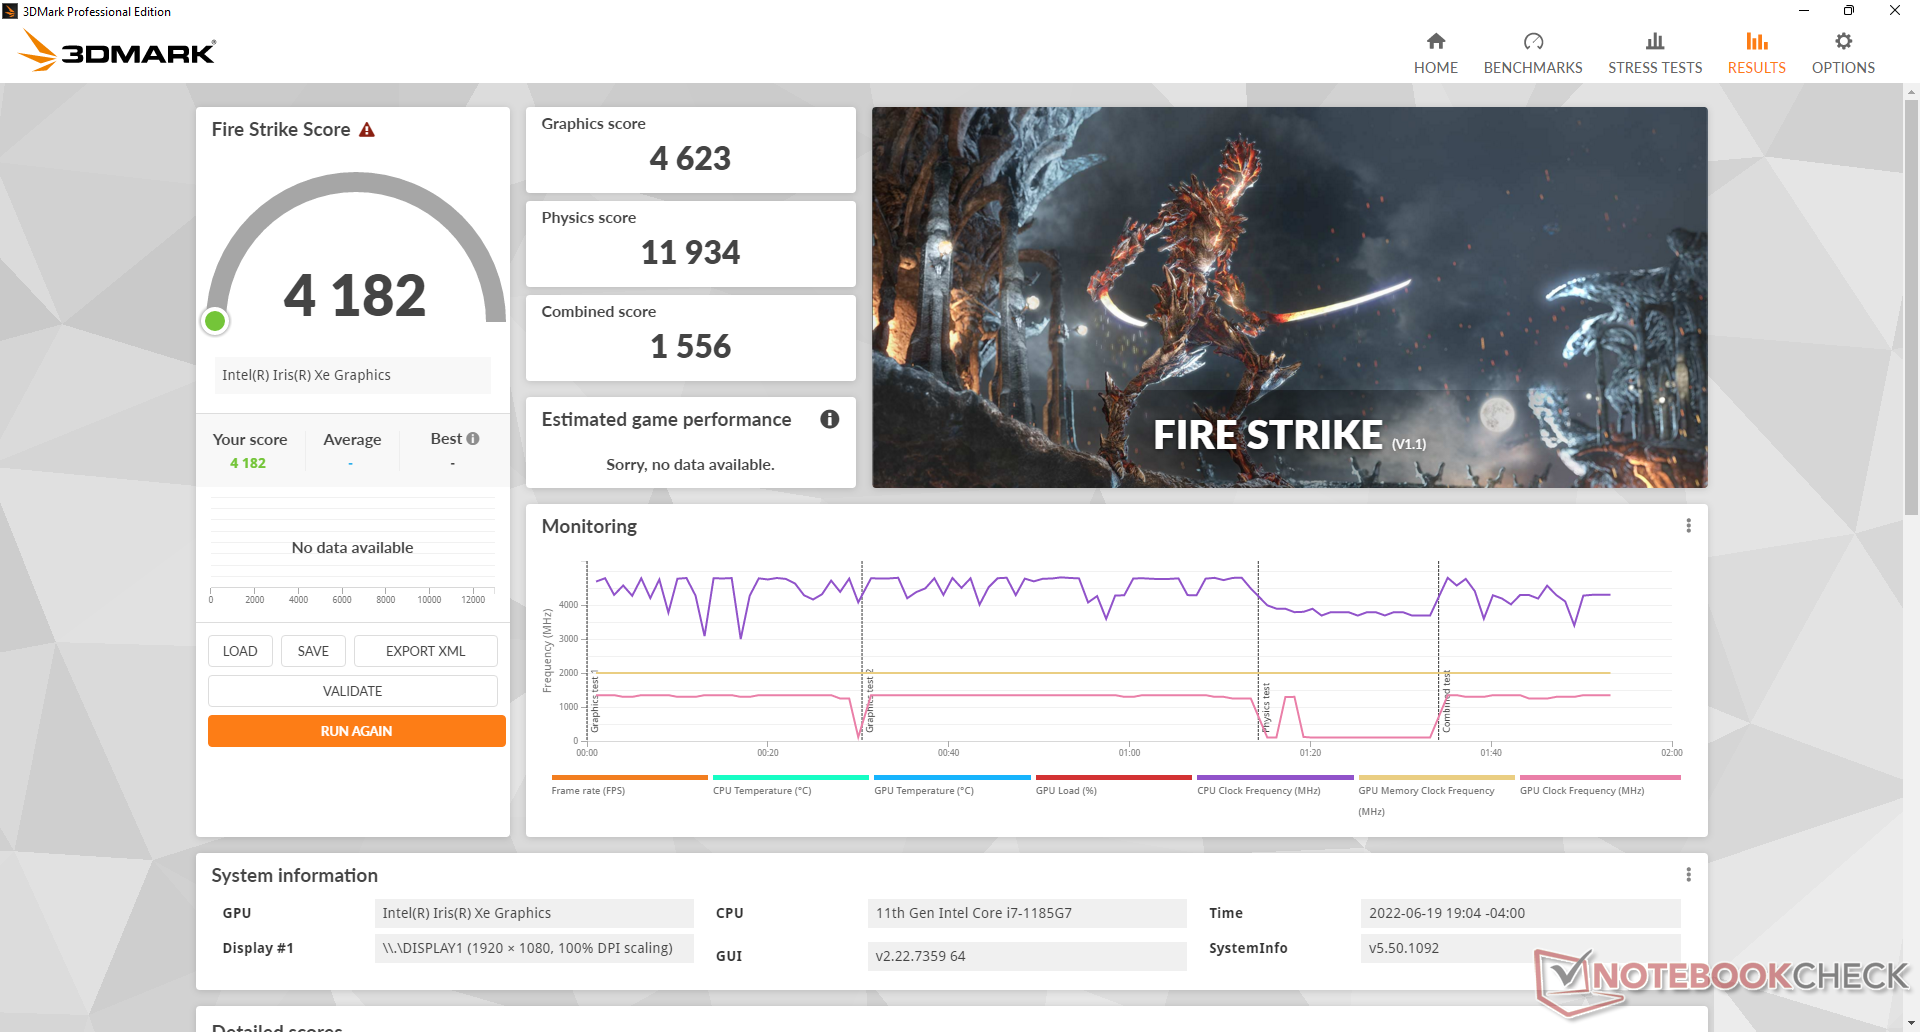
| 3DMark 11 Performance | 6575 points | |
| 3DMark Cloud Gate Standard Score | 17314 points | |
| 3DMark Fire Strike Score | 4182 points | |
| 3DMark Time Spy Score | 1633 points | |
Help | ||
Witcher 3 FPS Chart
| low | med. | high | ultra | |
|---|---|---|---|---|
| The Witcher 3 (2015) | 85.9 | 54.2 | 29.5 | 14.8 |
| Dota 2 Reborn (2015) | 112.9 | 104.6 | 62.4 | 55.5 |
| Final Fantasy XV Benchmark (2018) | 40.1 | 21.3 | 15.5 | |
| X-Plane 11.11 (2018) | 24.8 | 23.3 | 25.9 | |
| Cyberpunk 2077 1.6 (2022) | 21.1 | 17.2 | 13 | 10.5 |
Emissions
System Noise
The fan is always active in our experience at 26 dB(A) against a silent background of 22.8 dB(A) even when idling on desktop. We can notice some electronic noise or coil whine when placing an ear near the keyboard keys as well. These passive noises are thankfully not loud enough to be of any concern during most real-world scenarios.
Running the first benchmark scene of 3DMark 06 would induce a fan noise of 37.6 dB(A) to be louder and softer than what we observed on the Toughbook FZ-55 MK2 and Getac S410 Gen 4, respectively. Expect this level of noise when running demanding loads.
Noise level
| Idle |
| 26 / 26 / 26 dB(A) |
| Load |
| 37.6 / 40.3 dB(A) |
 | ||
30 dB silent 40 dB(A) audible 50 dB(A) loud |
||
min: | ||
| Panasonic Toughbook 40 Iris Xe G7 96EUs, i7-1185G7, Samsung PM991 MZVLQ1T0HALB | Panasonic Toughbook FZ-55 MK2 Iris Xe G7 96EUs, i7-1185G7, Toshiba KIOXIA KBG4AZNV512G M.2 2280 OPAL | Getac S410 Gen 4 Iris Xe G7 96EUs, i7-1185G7, SSSTC CA5-8D256 | Dell Latitude 5420 Rugged-P85G Radeon RX 540, i7-8650U, SK hynix PC401 NVMe 500 GB | Acer Enduro Urban N3 EUN314 Iris Xe G7 96EUs, i7-1165G7, Samsung PM991 MZVLQ1T0HALB | Durabook S14I Iris Xe G7 96EUs, i7-1165G7, UDinfo M2P M2P80DE512GBAEP | |
|---|---|---|---|---|---|---|
| Noise | 8% | -3% | -4% | 8% | -3% | |
| off / environment * (dB) | 22.8 | 23.8 -4% | 23.3 -2% | 28.3 -24% | 23.8 -4% | 25.2 -11% |
| Idle Minimum * (dB) | 26 | 24 8% | 23.5 10% | 28.3 -9% | 24.1 7% | 25.2 3% |
| Idle Average * (dB) | 26 | 24 8% | 23.5 10% | 28.3 -9% | 24.1 7% | 25.2 3% |
| Idle Maximum * (dB) | 26 | 24 8% | 28 -8% | 28.3 -9% | 24.1 7% | 34.5 -33% |
| Load Average * (dB) | 37.6 | 26.7 29% | 42.8 -14% | 29.9 20% | 27.9 26% | 34.5 8% |
| Witcher 3 ultra * (dB) | 37.8 | 42.3 -12% | 35.7 6% | |||
| Load Maximum * (dB) | 40.3 | 41.7 -3% | 42.6 -6% | 38 6% | 38.6 4% | 36.2 10% |
* ... smaller is better
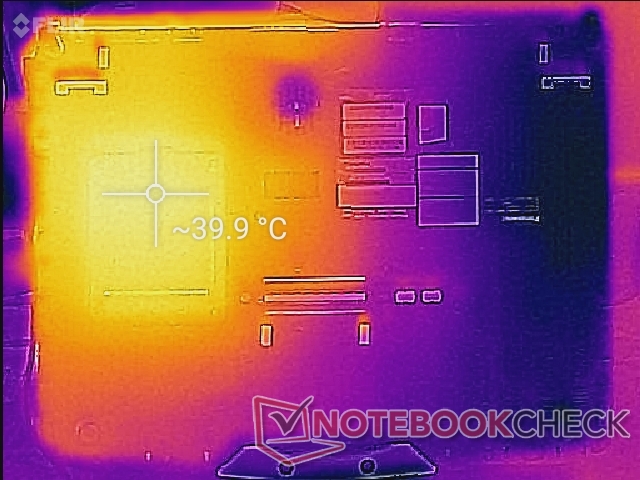
Temperature
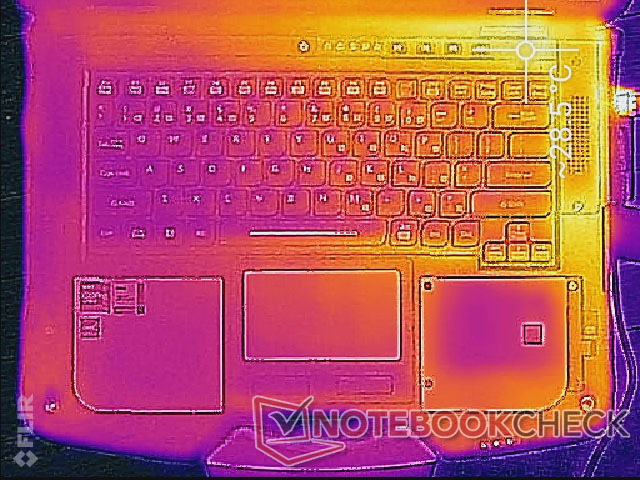
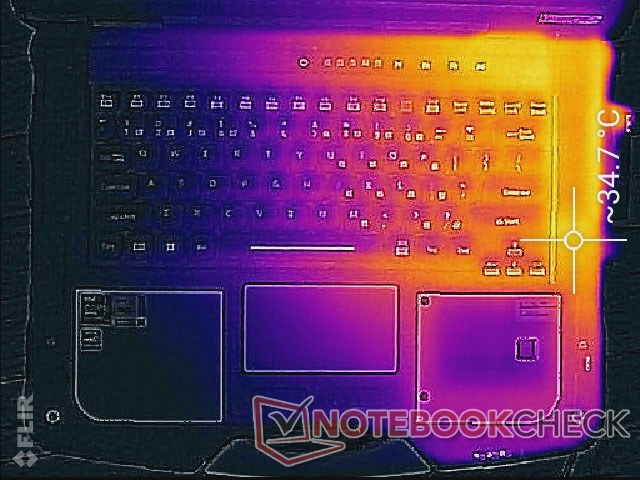
Surface temperatures are generally cool due to the Core U-series CPU and thick chassis design. After all, this is the same CPU as found on many thinner consumer laptops. Hot spots can reach 29 C and 40 C on the top and bottom sides, respectively, after running heavy loads for long periods.
The right half of the Toughbook model will always be warmer than the left half due to how the CPU and cooling solution are positioned inside.
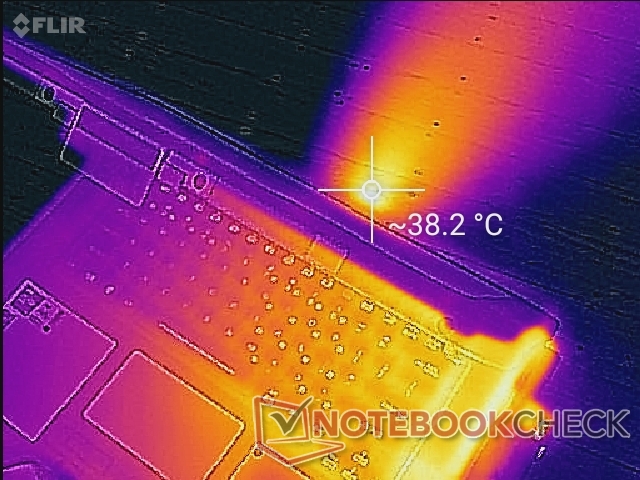
(+) The maximum temperature on the upper side is 35.6 °C / 96 F, compared to the average of 34.3 °C / 94 F, ranging from 21.2 to 62.5 °C for the class Office.
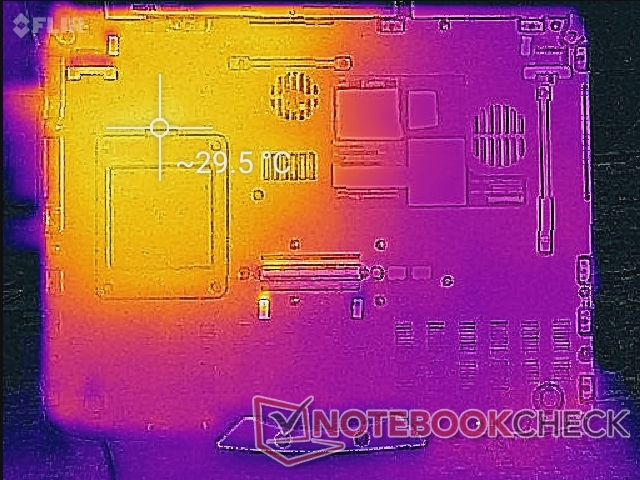
(±) The bottom heats up to a maximum of 40 °C / 104 F, compared to the average of 36.8 °C / 98 F
(+) In idle usage, the average temperature for the upper side is 27.1 °C / 81 F, compared to the device average of 29.5 °C / 85 F.
(+) The palmrests and touchpad are cooler than skin temperature with a maximum of 29 °C / 84.2 F and are therefore cool to the touch.
(±) The average temperature of the palmrest area of similar devices was 27.6 °C / 81.7 F (-1.4 °C / -2.5 F).
| Panasonic Toughbook 40 Intel Core i7-1185G7, Intel Iris Xe Graphics G7 96EUs | Panasonic Toughbook FZ-55 MK2 Intel Core i7-1185G7, Intel Iris Xe Graphics G7 96EUs | Getac S410 Gen 4 Intel Core i7-1185G7, Intel Iris Xe Graphics G7 96EUs | Dell Latitude 5420 Rugged-P85G Intel Core i7-8650U, AMD Radeon RX 540 | Acer Enduro Urban N3 EUN314 Intel Core i7-1165G7, Intel Iris Xe Graphics G7 96EUs | Durabook S14I Intel Core i7-1165G7, Intel Iris Xe Graphics G7 96EUs | |
|---|---|---|---|---|---|---|
| Heat | -8% | -13% | -11% | -4% | -7% | |
| Maximum Upper Side * (°C) | 35.6 | 36.2 -2% | 36 -1% | 42.2 -19% | 37.8 -6% | 36.4 -2% |
| Maximum Bottom * (°C) | 40 | 42.2 -6% | 46.8 -17% | 42 -5% | 45.8 -15% | 38.6 3% |
| Idle Upper Side * (°C) | 28.6 | 31 -8% | 30 -5% | 31.6 -10% | 26.4 8% | 32.6 -14% |
| Idle Bottom * (°C) | 29.4 | 34 -16% | 38.2 -30% | 31.8 -8% | 30.2 -3% | 33.8 -15% |
* ... smaller is better
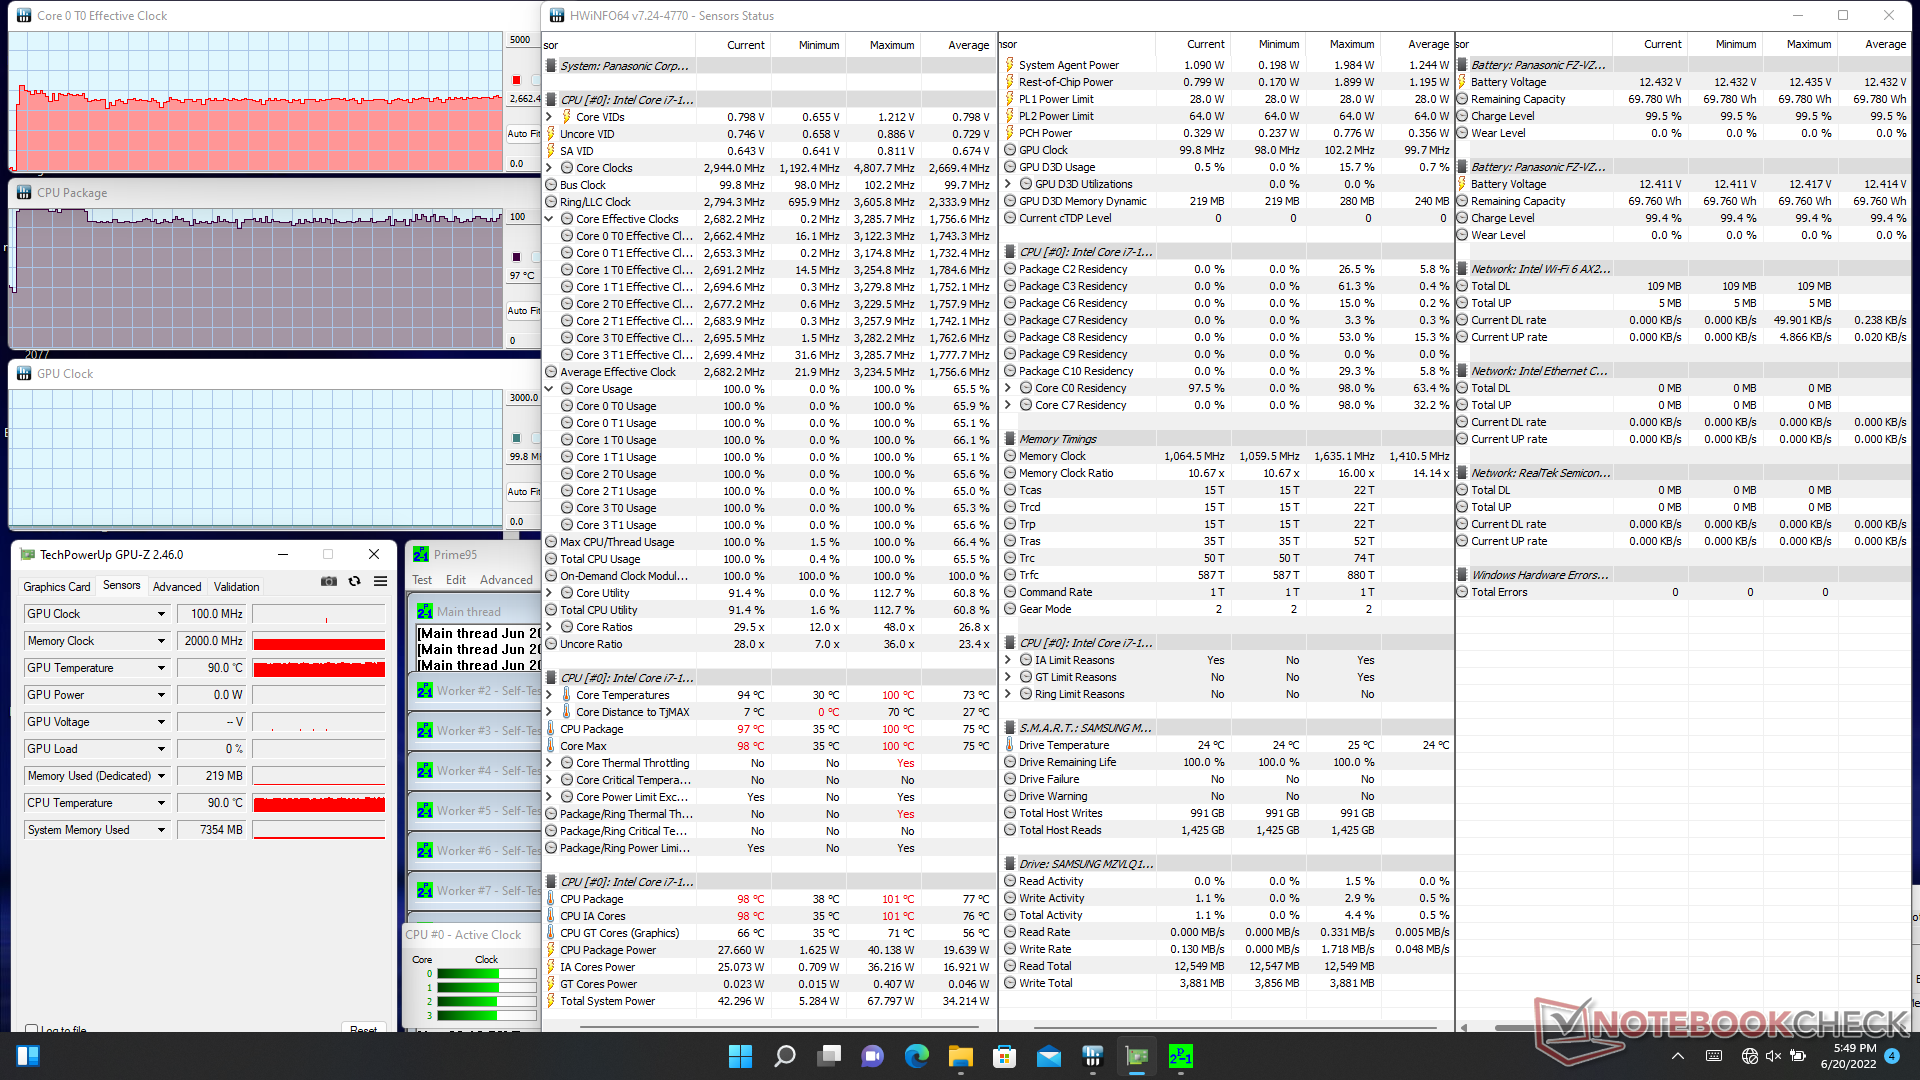
Stress Test
When running Prime95 to stress the CPU, clock rates and core temperature would spike to 3.1 GHz and 100 C for just a split second, respectively, before steadily falling to 2.6 and ~95 C. CPU package power would be as high as 40 W during the start of the test before stabilizing at 28 W. Running this same test on the Durabook S14I with a Core i7-1165G7 CPU would result in a much cooler stable core temperature of 63 C albeit at a slower clock rate of 1.8 GHz. It's clear that our Panasonic model is favoring CPU performance even if it means a much warmer processor in the process.
When running Witcher 3 to represent demanding loads, processor temperature would stabilize at 83 C which is warmer than on the aforementioned Durabook (68 C) but cooler than on the Getac S410 Gen 4 (95 C).
Running on battery power will not limit performance. A 3DMark 11 test on batteries would return similar scores to running on mains.
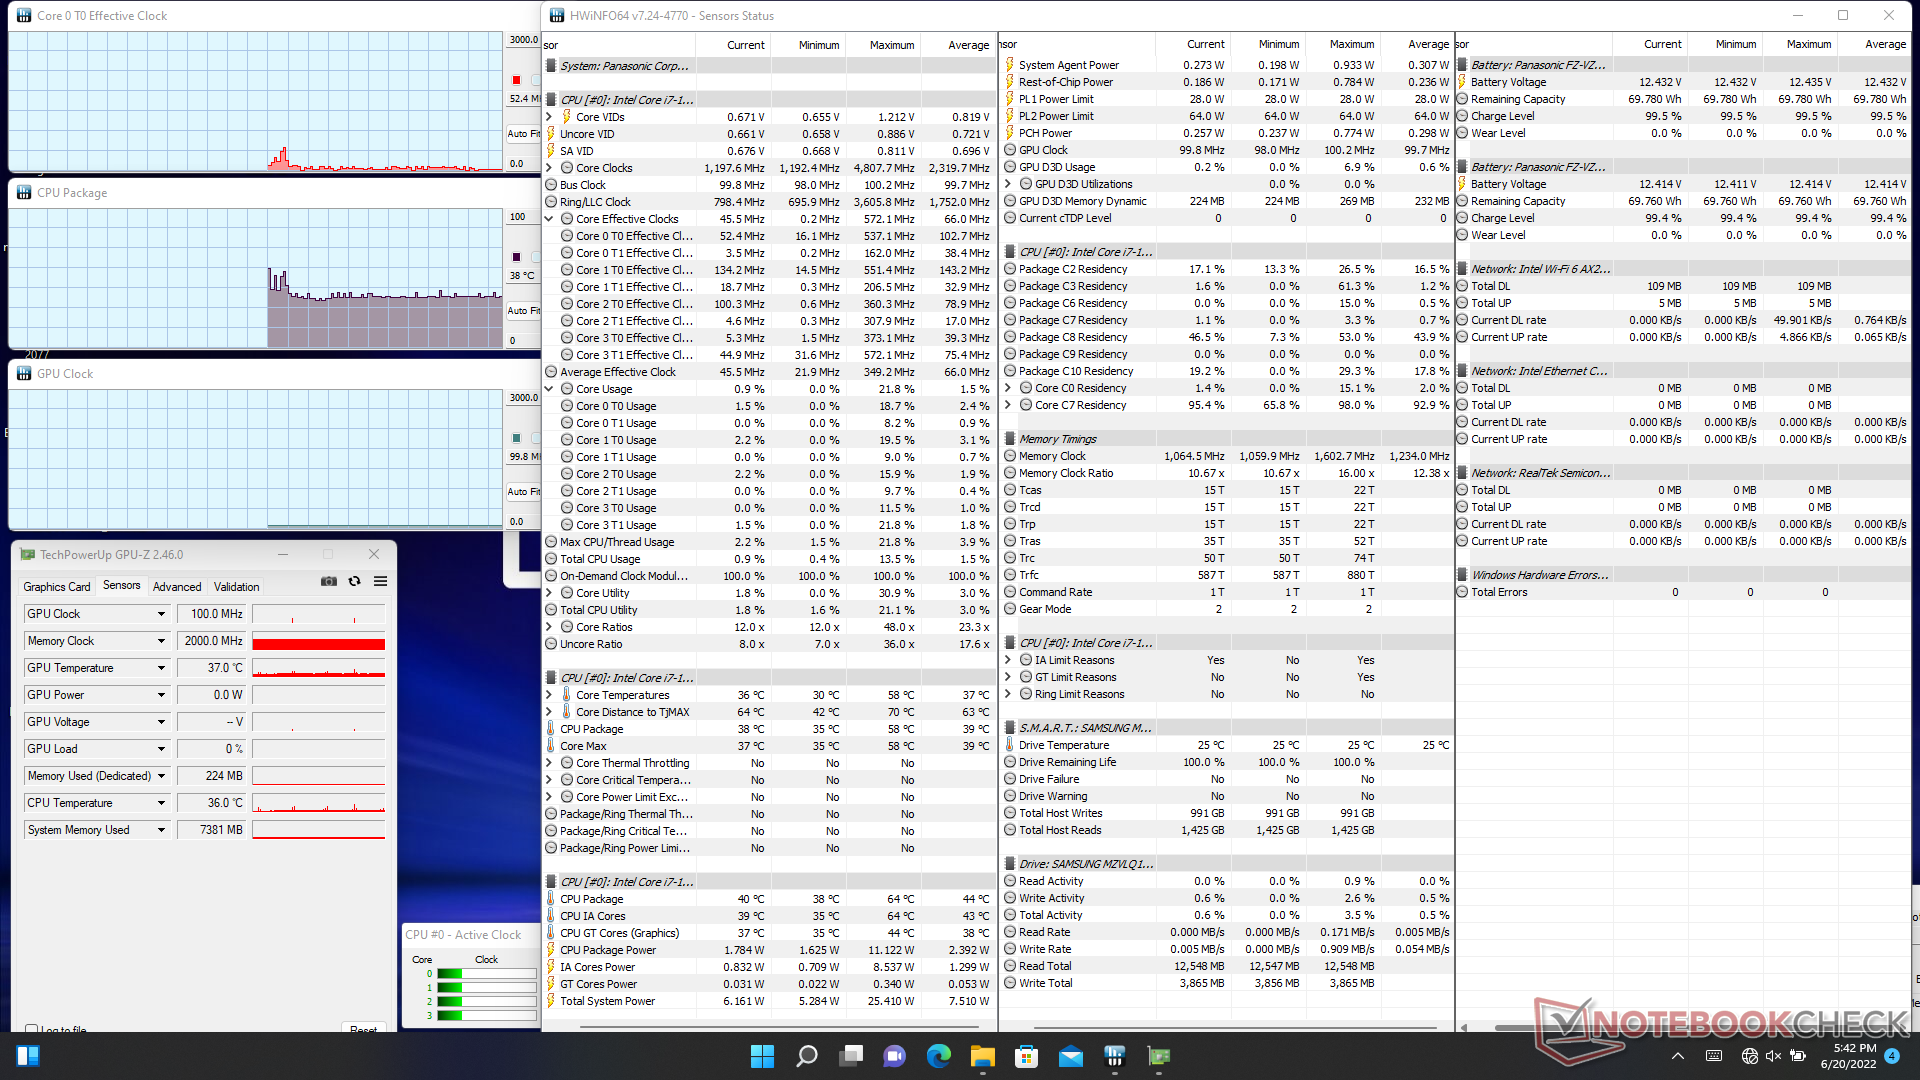
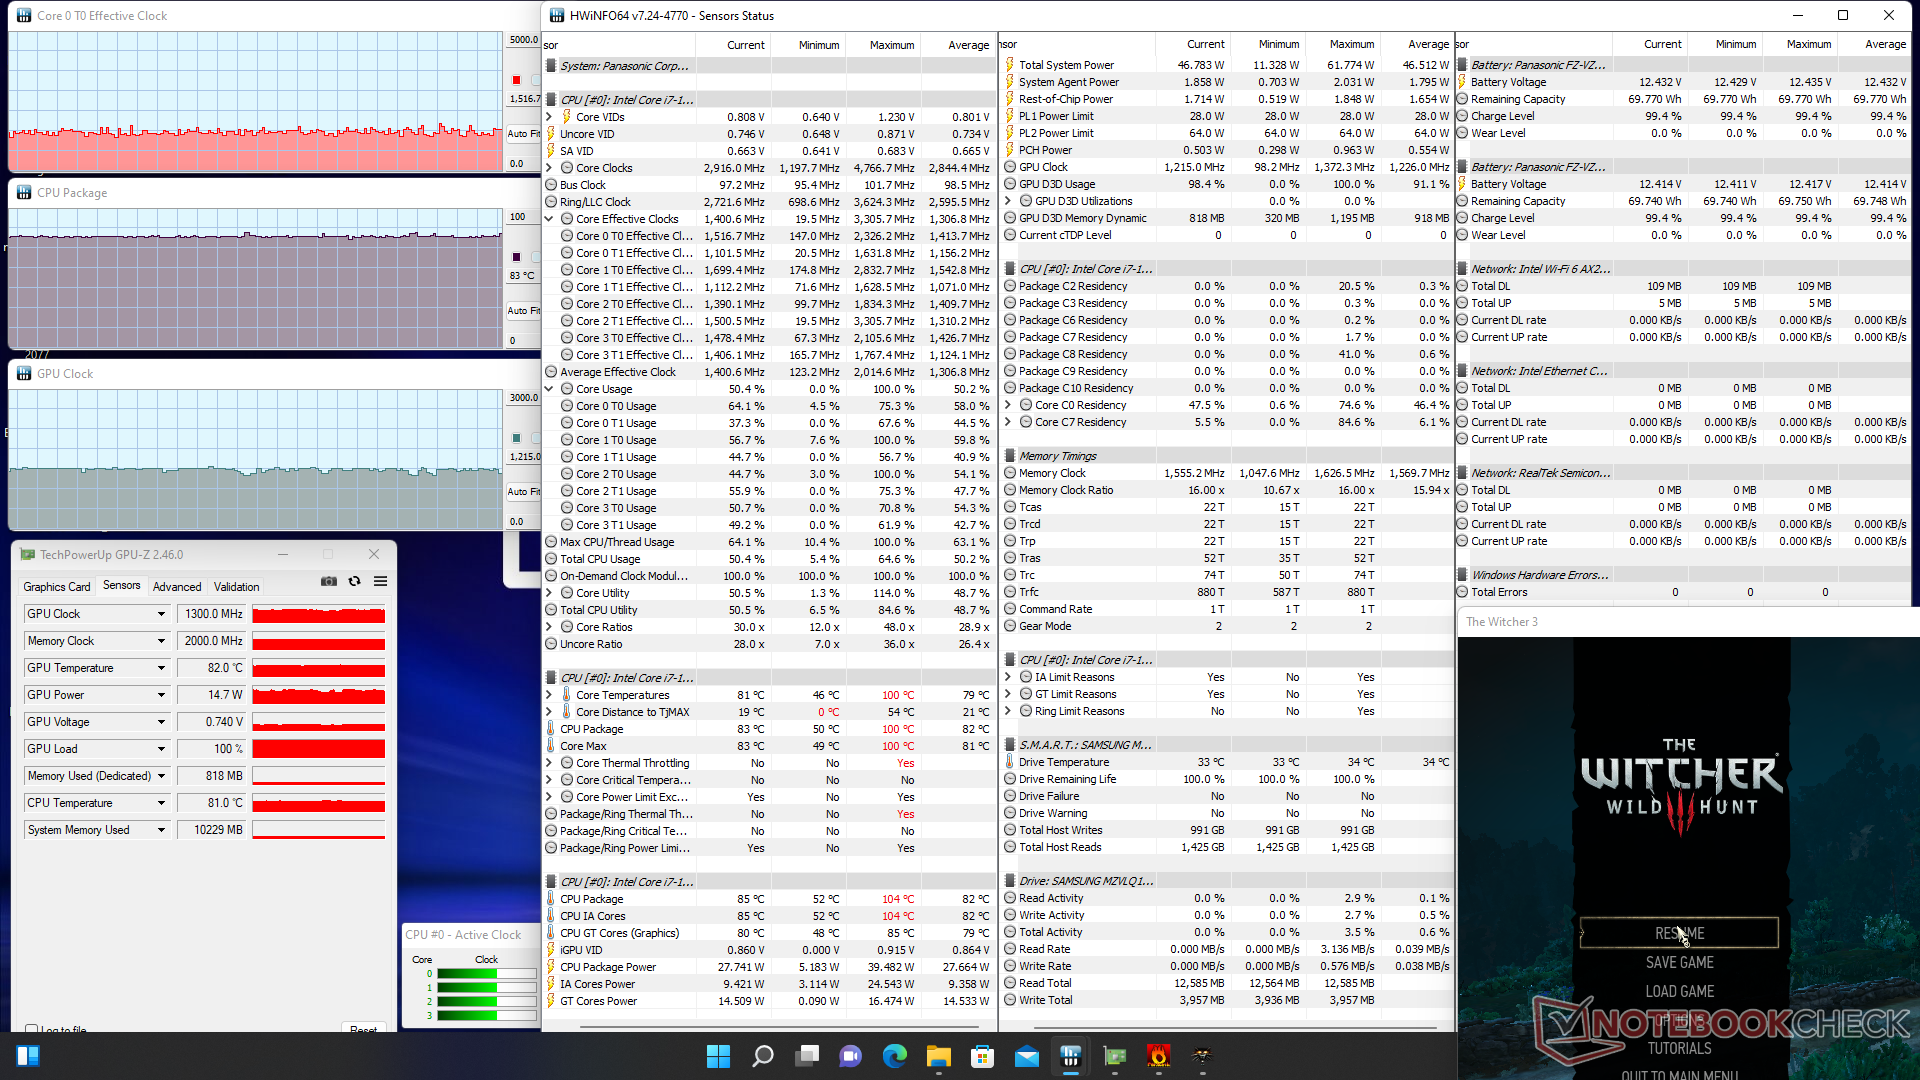
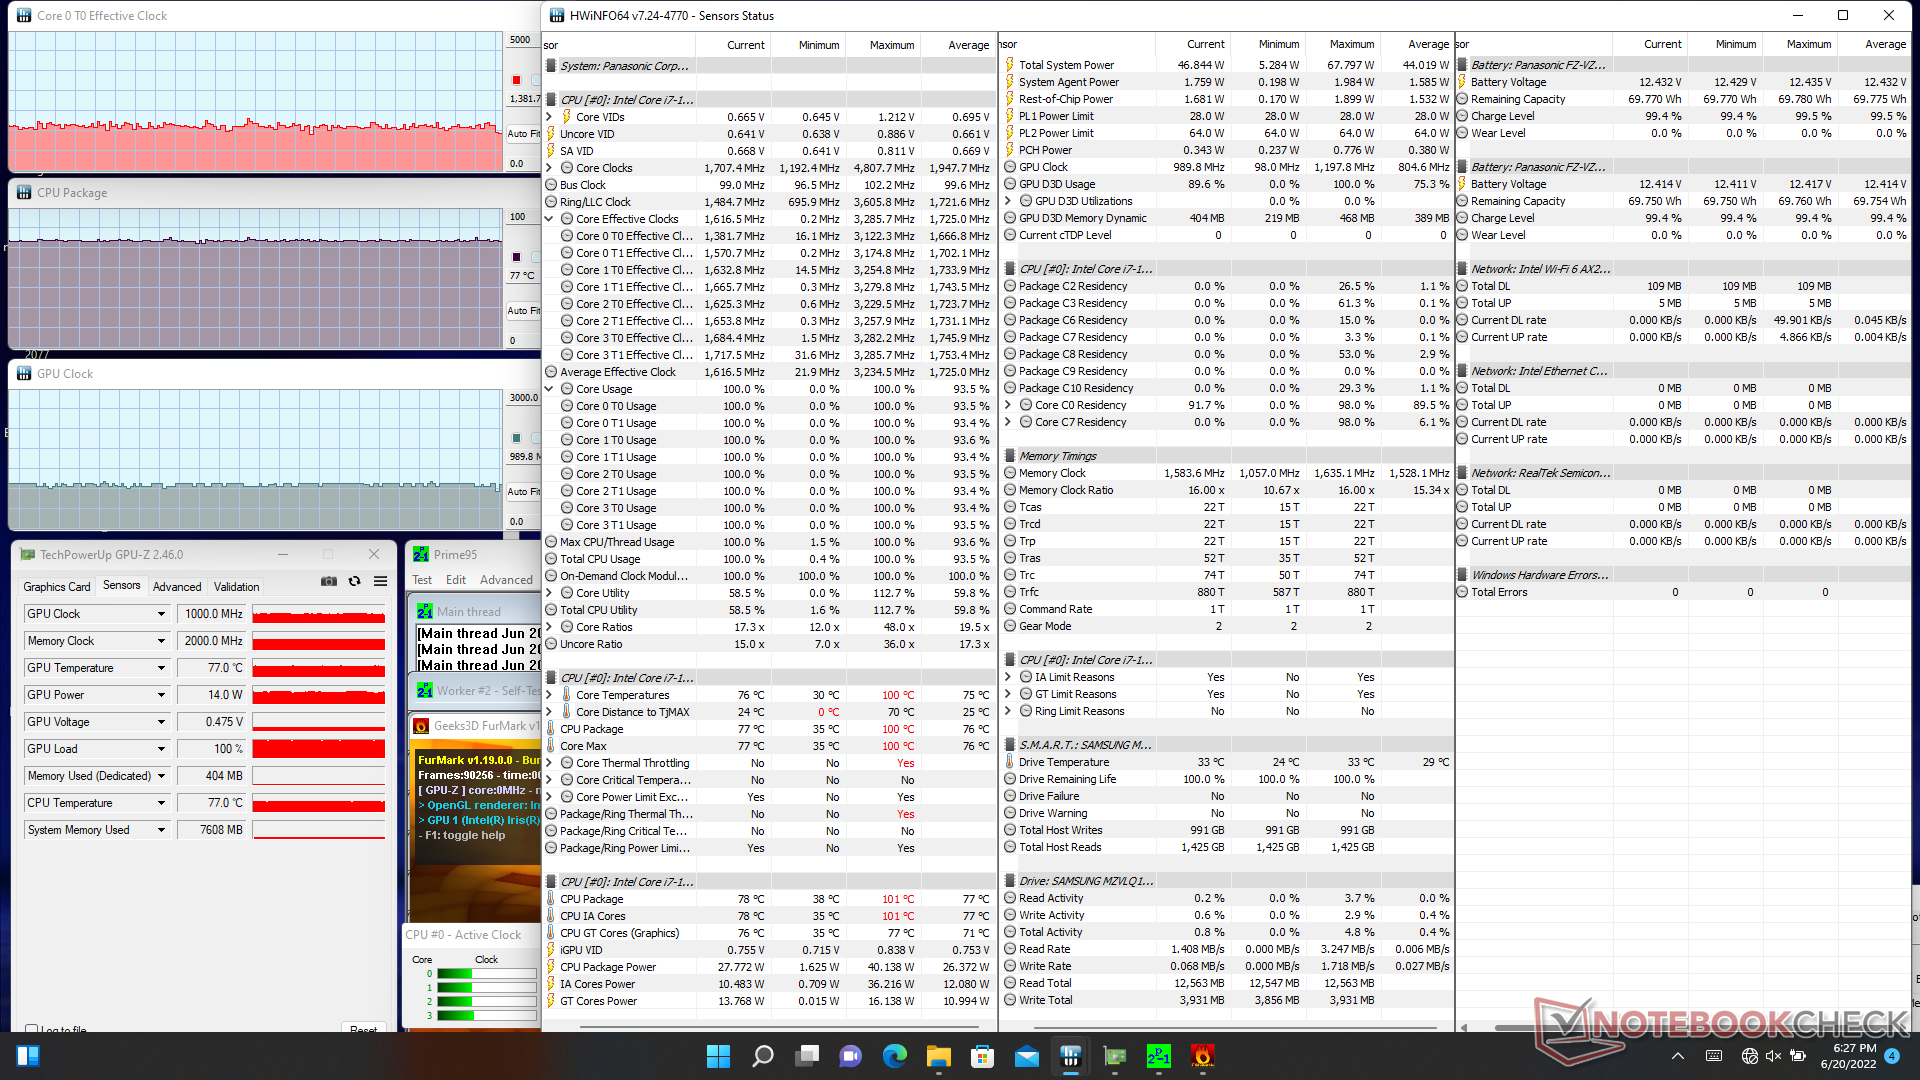
| CPU Clock (GHz) | GPU Clock (MHz) | Average CPU Temperature (°C) | |
| System Idle | -- | -- | 38 |
| Prime95 Stress | 2.7 | -- | 97 |
| Prime95 + FurMark Stress | 1.4 - 1.6 | 1000 | 77 |
| Witcher 3 Stress | 1.4 - 1.6 | 1300 | 83 |
Speakers
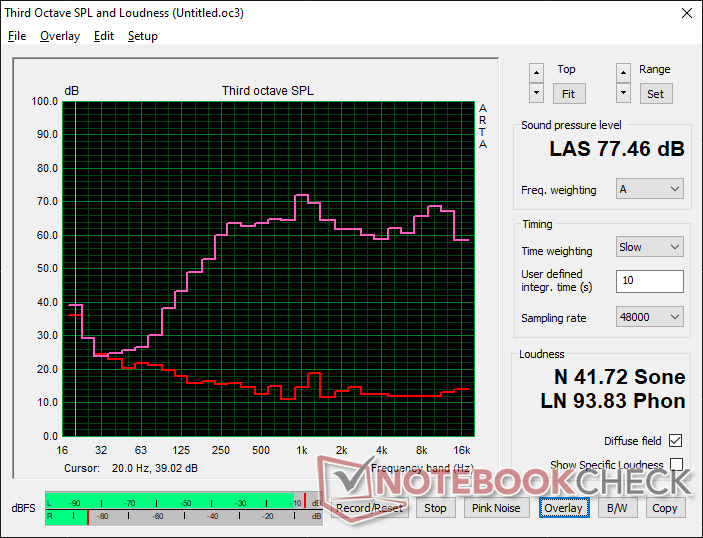
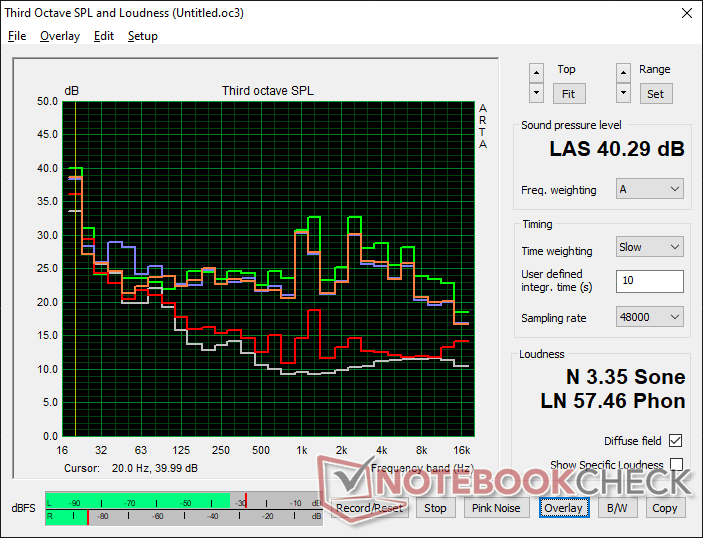
Panasonic Toughbook 40 audio analysis
(±) | speaker loudness is average but good (77.5 dB)
Bass 100 - 315 Hz
(±) | reduced bass - on average 11.5% lower than median
(±) | linearity of bass is average (11.6% delta to prev. frequency)
Mids 400 - 2000 Hz
(+) | balanced mids - only 3.3% away from median
(+) | mids are linear (5.5% delta to prev. frequency)
Highs 2 - 16 kHz
(+) | balanced highs - only 2.5% away from median
(+) | highs are linear (4.8% delta to prev. frequency)
Overall 100 - 16.000 Hz
(+) | overall sound is linear (13.1% difference to median)
Compared to same class
» 6% of all tested devices in this class were better, 2% similar, 92% worse
» The best had a delta of 7%, average was 21%, worst was 53%
Compared to all devices tested
» 12% of all tested devices were better, 3% similar, 85% worse
» The best had a delta of 4%, average was 24%, worst was 134%
Apple MacBook Pro 16 2021 M1 Pro audio analysis
(+) | speakers can play relatively loud (84.7 dB)
Bass 100 - 315 Hz
(+) | good bass - only 3.8% away from median
(+) | bass is linear (5.2% delta to prev. frequency)
Mids 400 - 2000 Hz
(+) | balanced mids - only 1.3% away from median
(+) | mids are linear (2.1% delta to prev. frequency)
Highs 2 - 16 kHz
(+) | balanced highs - only 1.9% away from median
(+) | highs are linear (2.7% delta to prev. frequency)
Overall 100 - 16.000 Hz
(+) | overall sound is linear (4.6% difference to median)
Compared to same class
» 0% of all tested devices in this class were better, 0% similar, 100% worse
» The best had a delta of 5%, average was 17%, worst was 45%
Compared to all devices tested
» 0% of all tested devices were better, 0% similar, 100% worse
» The best had a delta of 4%, average was 24%, worst was 134%
Energy Management
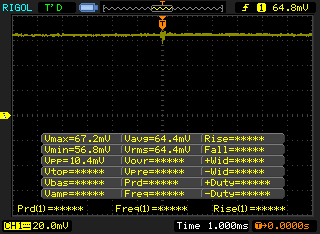
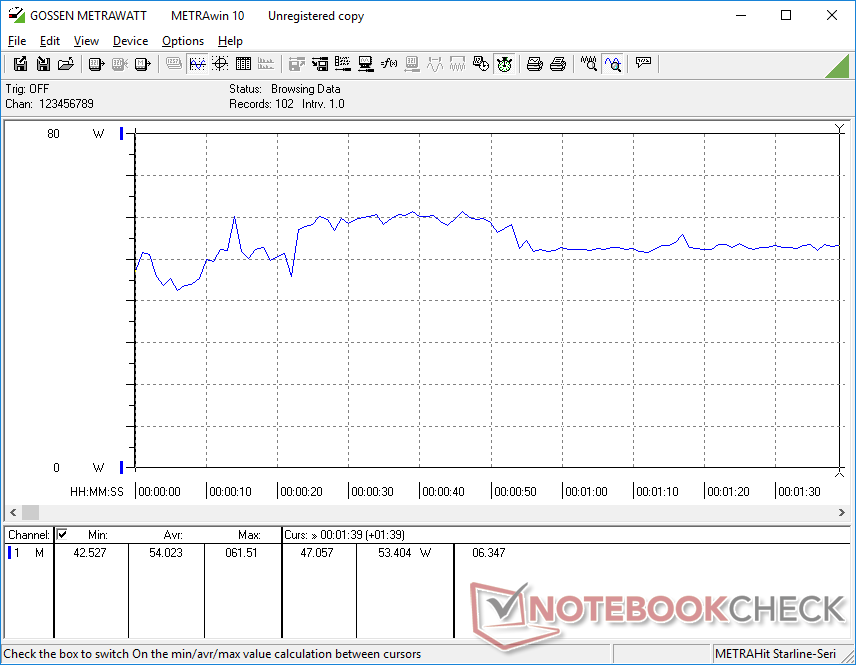
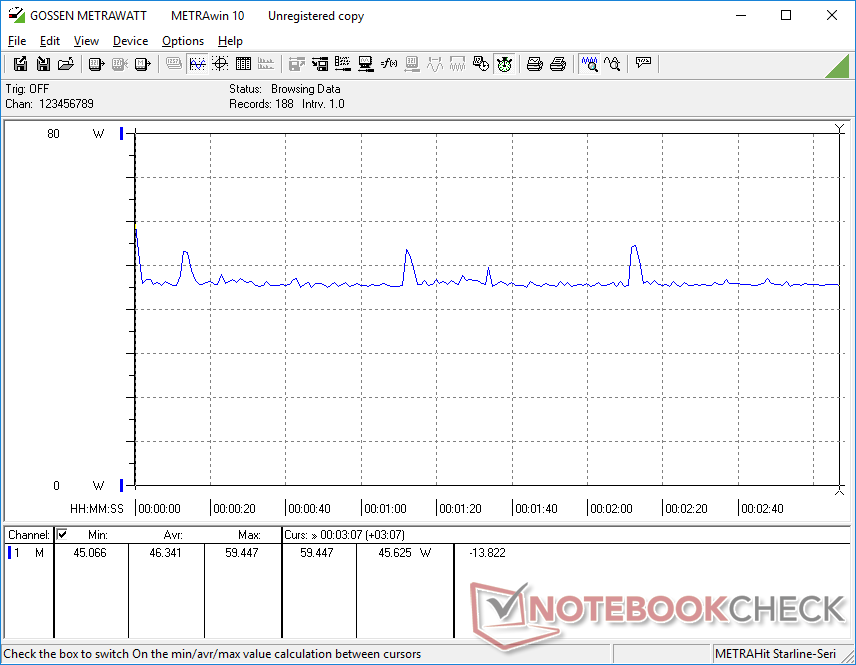
Power Consumption
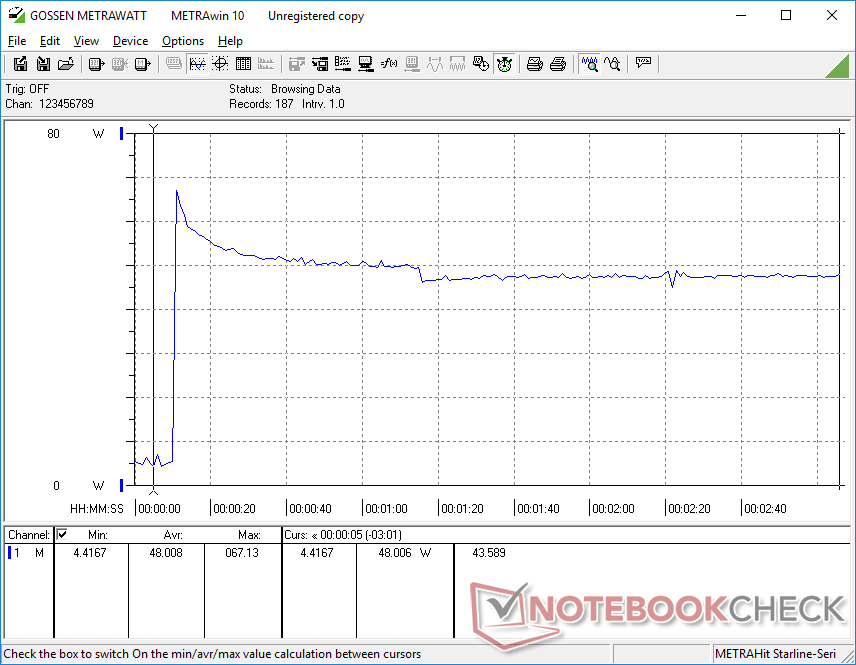
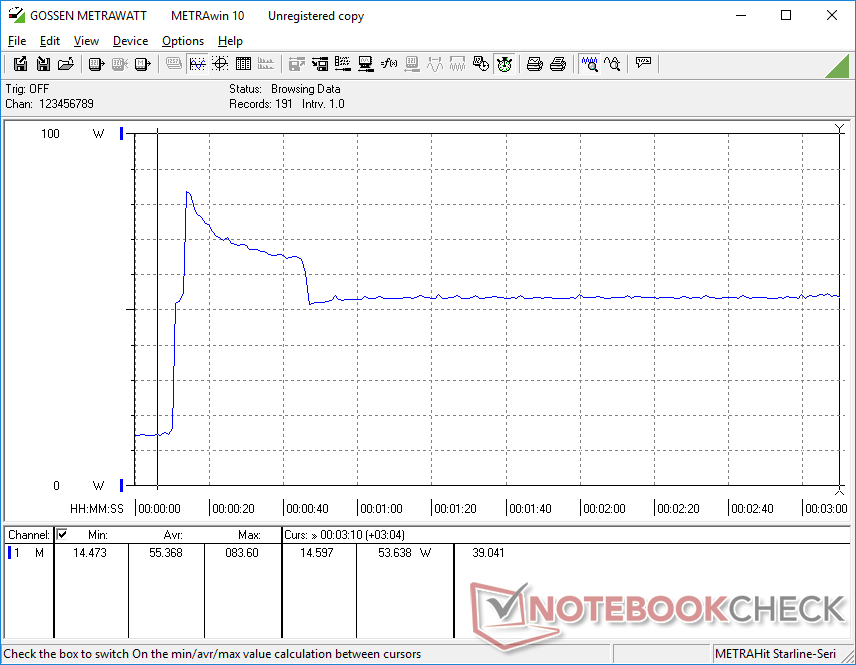
Idling on desktop consumes between 4 W and 14 W depending on the brightness level and power profile. Simply increasing the brightness from 0 percent to 100 percent demands about 8 W more due to the bright 1200-nit backlight.
Power consumption under load is similar to other rugged models powered by 11th gen Core U-series CPUs including Panasonic's own Toughbook FZ-55 MK2. Tiger Lake-U offers immense gains in performance-per-watt over older generation rugged models such as the Latitude 5420 with Kaby Lake-R and Radeon RX 540 graphics.
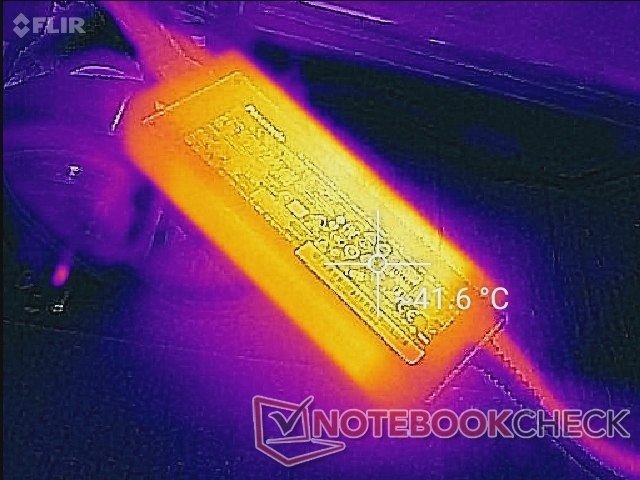
We're able to record a maximum draw of 83.6 W from the small (~14 x 5.4 x 3.1 cm) 110 W AC adapter when running Prime95 and FurMark stress. This peak is short-lived as shown by our screenshots below due to thermal limitations.
| Off / Standby | |
| Idle | |
| Load |
|
Key:
min: | |
| Panasonic Toughbook 40 i7-1185G7, Iris Xe G7 96EUs, Samsung PM991 MZVLQ1T0HALB, IPS, 1920x1080, 14" | Panasonic Toughbook FZ-55 MK2 i7-1185G7, Iris Xe G7 96EUs, Toshiba KIOXIA KBG4AZNV512G M.2 2280 OPAL, IPS, 1920x1080, 14" | Getac S410 Gen 4 i7-1185G7, Iris Xe G7 96EUs, SSSTC CA5-8D256, IPS, 1920x1080, 14" | Dell Latitude 5420 Rugged-P85G i7-8650U, Radeon RX 540, SK hynix PC401 NVMe 500 GB, IPS, 1920x1080, 14" | Acer Enduro Urban N3 EUN314 i7-1165G7, Iris Xe G7 96EUs, Samsung PM991 MZVLQ1T0HALB, IPS, 1920x1080, 14" | Durabook S14I i7-1165G7, Iris Xe G7 96EUs, UDinfo M2P M2P80DE512GBAEP, TN, 1920x1080, 14" | |
|---|---|---|---|---|---|---|
| Power Consumption | 12% | -11% | -16% | 34% | -11% | |
| Idle Minimum * (Watt) | 4.9 | 3.5 29% | 8.3 -69% | 4.8 2% | 3.8 22% | 6.8 -39% |
| Idle Average * (Watt) | 12.3 | 10.4 15% | 10.5 15% | 13.6 -11% | 8 35% | 16.4 -33% |
| Idle Maximum * (Watt) | 14 | 10.5 25% | 14.9 -6% | 13.8 1% | 8.7 38% | 16.9 -21% |
| Load Average * (Watt) | 54 | 45.4 16% | 48.6 10% | 67.8 -26% | 34.6 36% | 39.2 27% |
| Witcher 3 ultra * (Watt) | 46.3 | 43 7% | 50.9 -10% | 69.1 -49% | 35.4 24% | |
| Load Maximum * (Watt) | 83.6 | 99.3 -19% | 90.1 -8% | 93.5 -12% | 45.4 46% | 73.1 13% |
* ... smaller is better
Power Consumption Witcher 3 / Stresstest
Power Consumption external Monitor
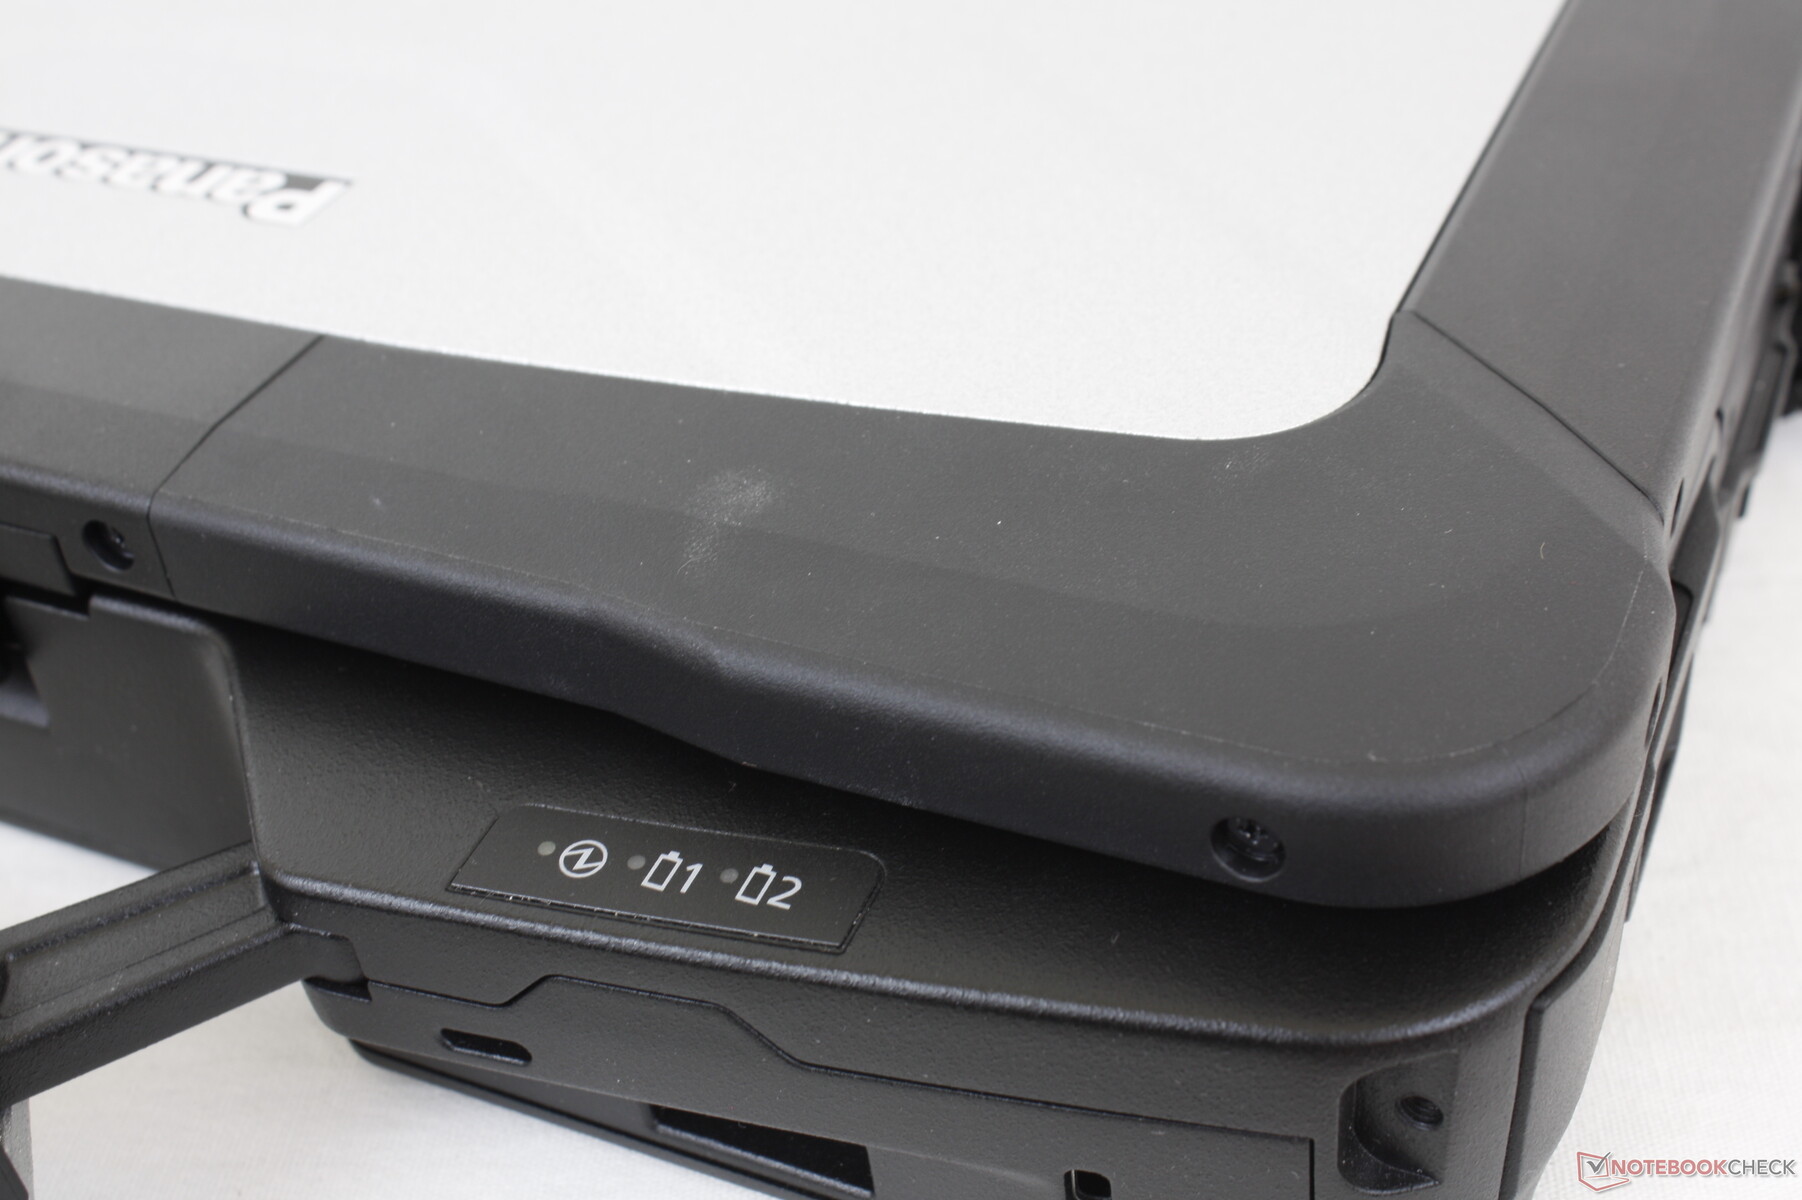
Battery Life
Our test unit shipped with two 68 Wh removable batteries each occupying an expansion slot along the sides of the chassis. Additional batteries can be attached on the bottom as well for even longer runtimes. We're able to record nearly 19 hours of real-world WLAN browsing at 150-nit brightness with our two batteries attached before needing to recharge.
Speaking of charging, the recharge rate is unfortunately extremely slow. The system only charges one battery at a time even if two are attached and each battery takes about 2.5 to 3 hours to fully charge. In comparison, most regular laptops can fully recharge in just 1.5 to 2 hours.
USB-C charging is supported and so certain third-party USB-C adapters can be used in lieu of the proprietary AC adapter.
| Panasonic Toughbook 40 i7-1185G7, Iris Xe G7 96EUs, 136 Wh | Panasonic Toughbook FZ-55 MK2 i7-1185G7, Iris Xe G7 96EUs, 71 Wh | Getac S410 Gen 4 i7-1185G7, Iris Xe G7 96EUs, 194 Wh | Dell Latitude 5420 Rugged-P85G i7-8650U, Radeon RX 540, 102 Wh | Acer Enduro Urban N3 EUN314 i7-1165G7, Iris Xe G7 96EUs, 50.3 Wh | Durabook S14I i7-1165G7, Iris Xe G7 96EUs, 50 Wh | |
|---|---|---|---|---|---|---|
| Battery runtime | -28% | 51% | -15% | -66% | -71% | |
| WiFi v1.3 (h) | 19 | 13.6 -28% | 28.6 51% | 16.2 -15% | 6.4 -66% | 5.5 -71% |
| Reader / Idle (h) | 31.4 | |||||
| Load (h) | 3.2 |
Pros
Cons
Verdict
the ability to support not just one or two but four different specialized expansion slots gives the Toughbook 40 longer legs and more versatility in its category. If the removable xPAK modules aren't practical to your usage scenarios, then the appeal of the Toughbook 40 drops significantly. Alternatives like the Latitude 7424 Rugged Extreme are fully-rugged and smaller albeit without the expansion capabilities of the Panasonic.
There are a few annoying aspects we'd like to see improved. The flaps covering the ports, for example, are difficult to grip and open or close. Screen flickering is present and there are no wider gamut options available for deeper colors. SSD performance could be better as well while battery charging is far too slow. Such drawbacks may not matter depending on the use case.
Price and Availability
Users can request a quote from Panasonic via the official product page here.
Price comparison
