 Deutsch
 English
 Español
 Français
 Italiano
 Nederlands
 Polski
 Português
 Русский
 Türkçe
 Svenska
 Chinese
 Magyar
Dell Latitude 7424 Rugged Extreme (i7-8650U, RX540) Laptop Review

Rugged laptops are in a transition period. Key players in this market have released slimmer machines that bear many of the features typical of a ruggedized laptop. We recently reviewed one such design with the Dell Latitude 5420 Rugged. However, today's device holds onto tradition.
The Dell Latitude 7424 Rugged Extreme feels more like a ruggedized device. The machine is thick, heavy, and has a massive footprint for a 14-inch laptop. However, the benefits of its large size include both IP65 and MIL-SPEC-810G ratings. This means the machine is dust-tight, resistant to pressurized water, and can survive drops at waist-height while operational. But how does the Latitude 7424 Rugged Extreme function as a computer?
Competitors for the Latitude 7424 Rugged Extreme include the Panasonic Toughbook CF-54, Getac S410, and Dell's own Latitude 5420 Rugged. We will also compare the Lenovo ThinkPad T480 and ThinkPad P52 as comparisons for general performance.
Case
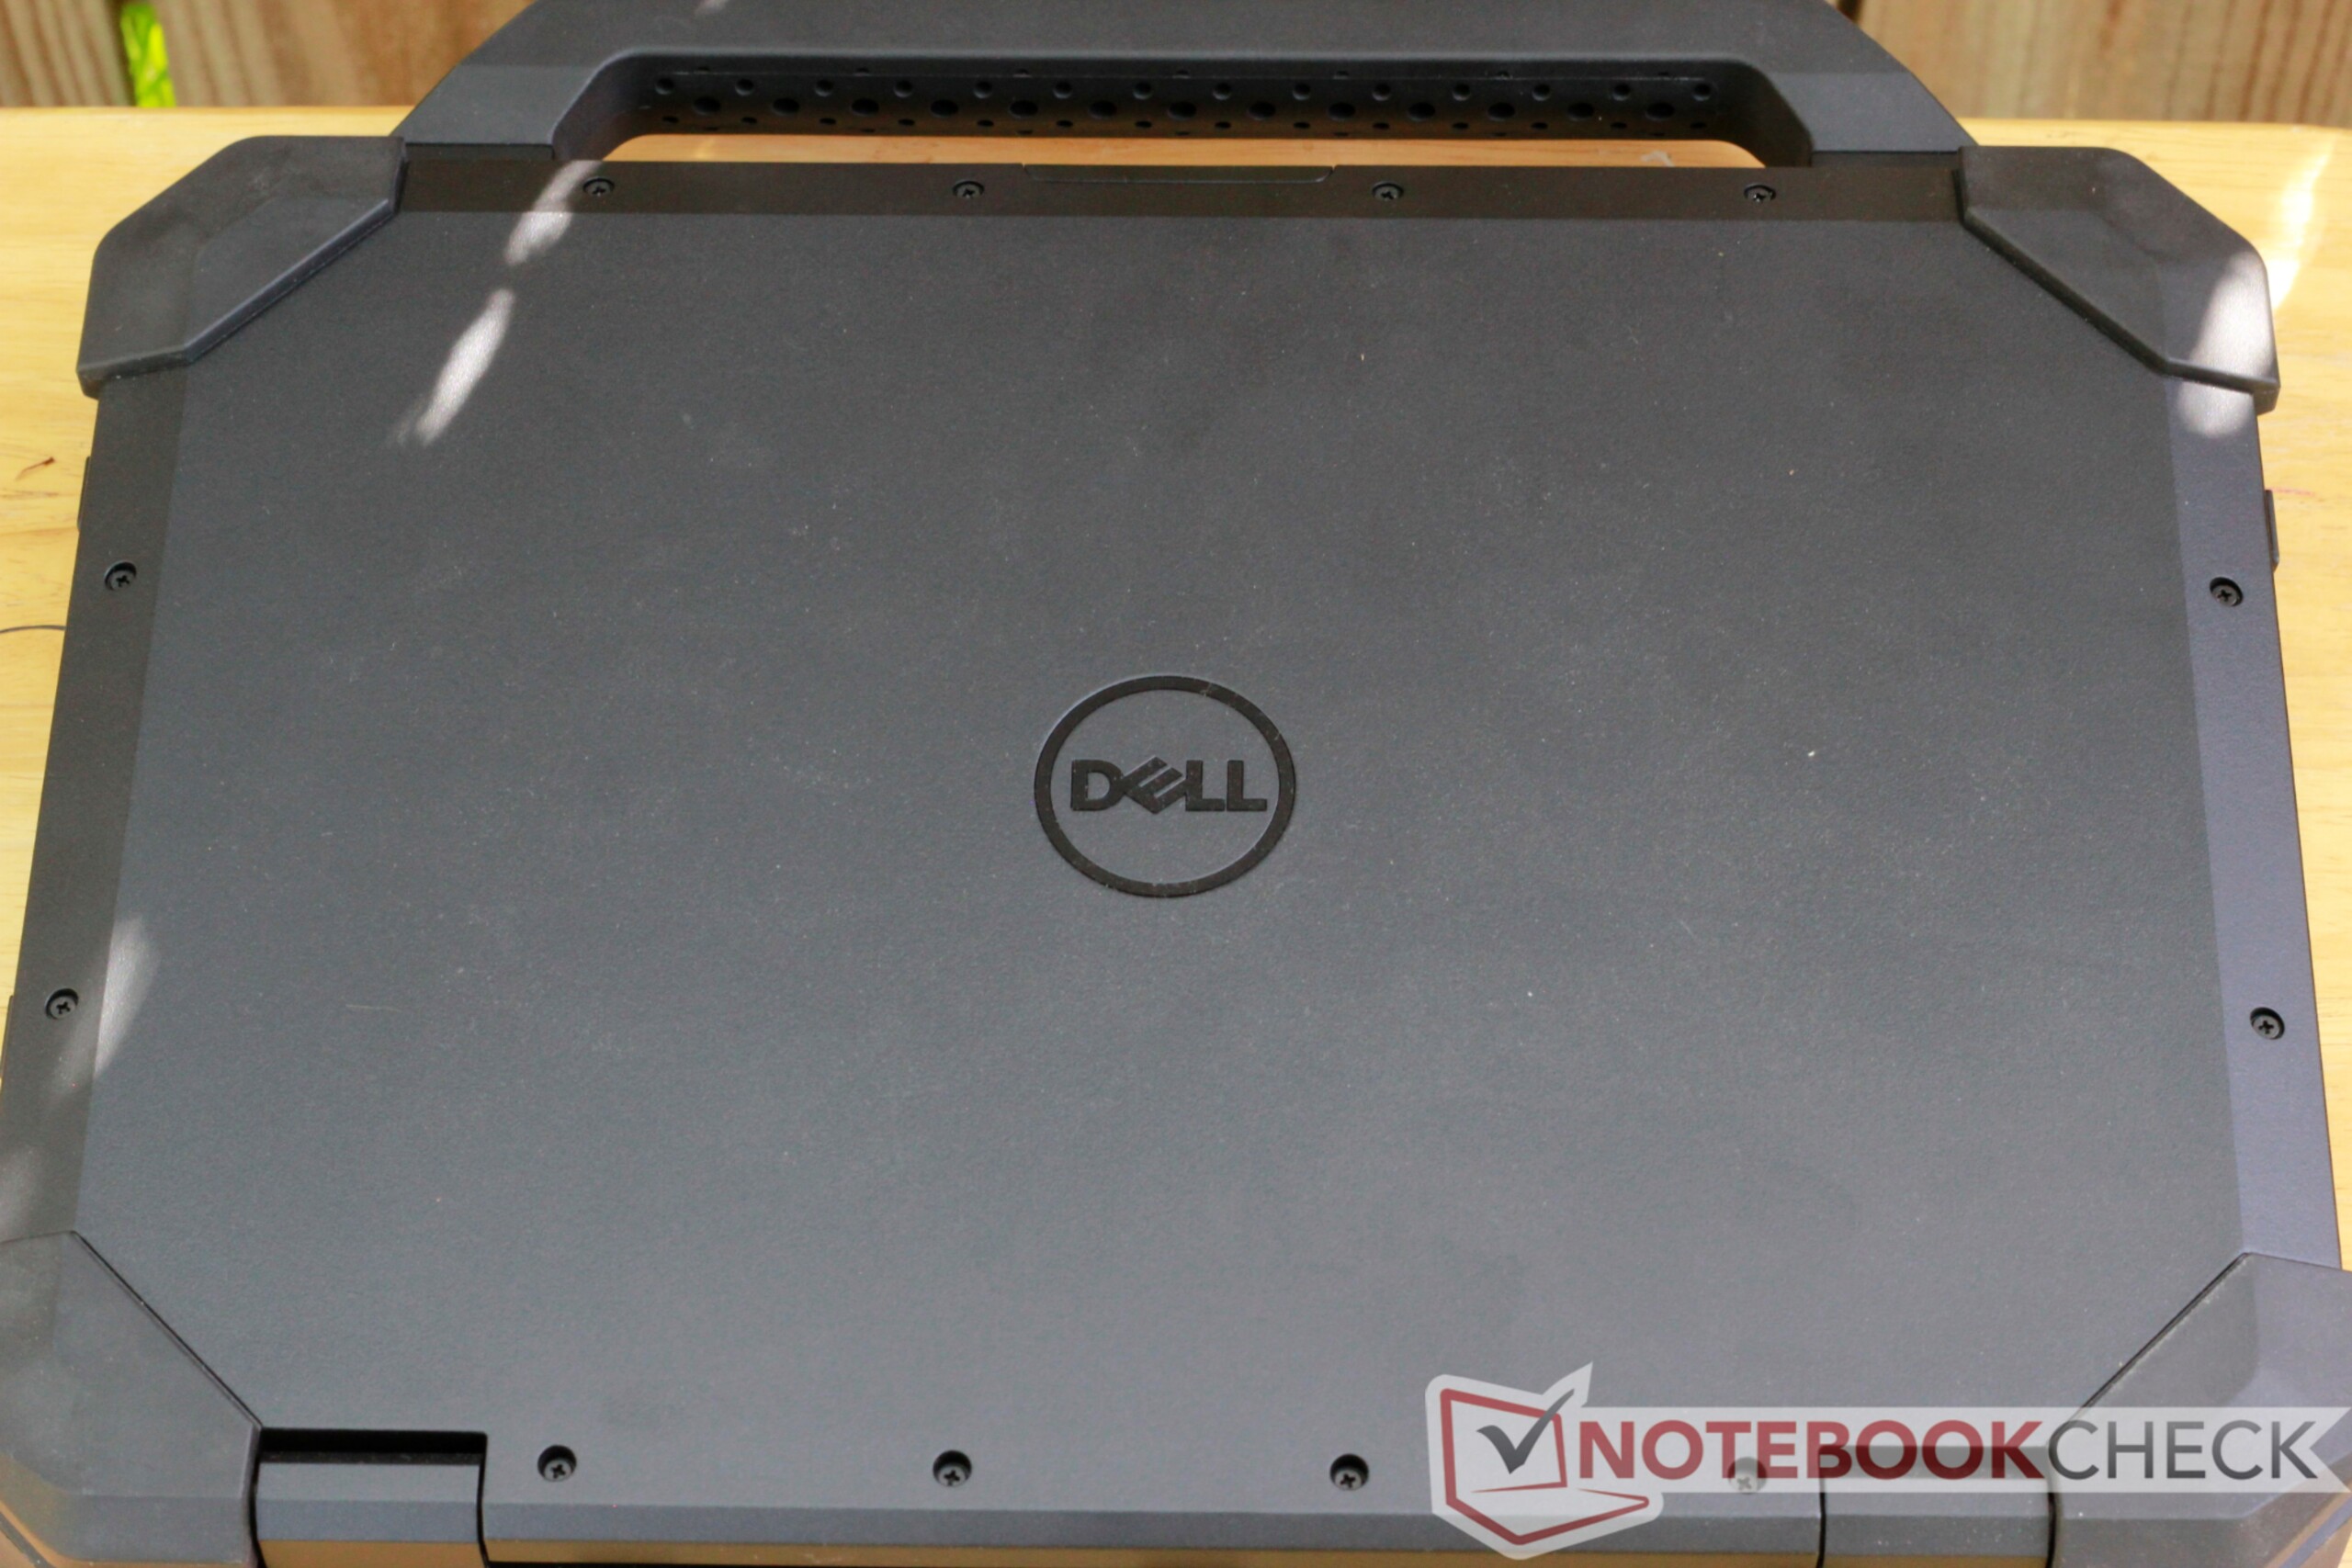
The case is fitting for a proper ruggedized laptop. The case is made almost entirely from plastic with a few touches of metal. The corners of the bottom panel and lid are covered in rubberized polycarbonate to absorb the impact of drops. The machine is not pretty, but that's not the point. The Latitude 7424 should be able to take a beating without breaking a sweat.
The keyboard deck, bottom panel, and lid are completely void of flex. The lid can be twisted very slightly with intentional pressure but otherwise is immovable. The hinges feel stiff but hold the display in place. The lid does not wobble unless touch input is used. The matte textured plastic shows fingerprints and smudges, but these can easily be wiped away.
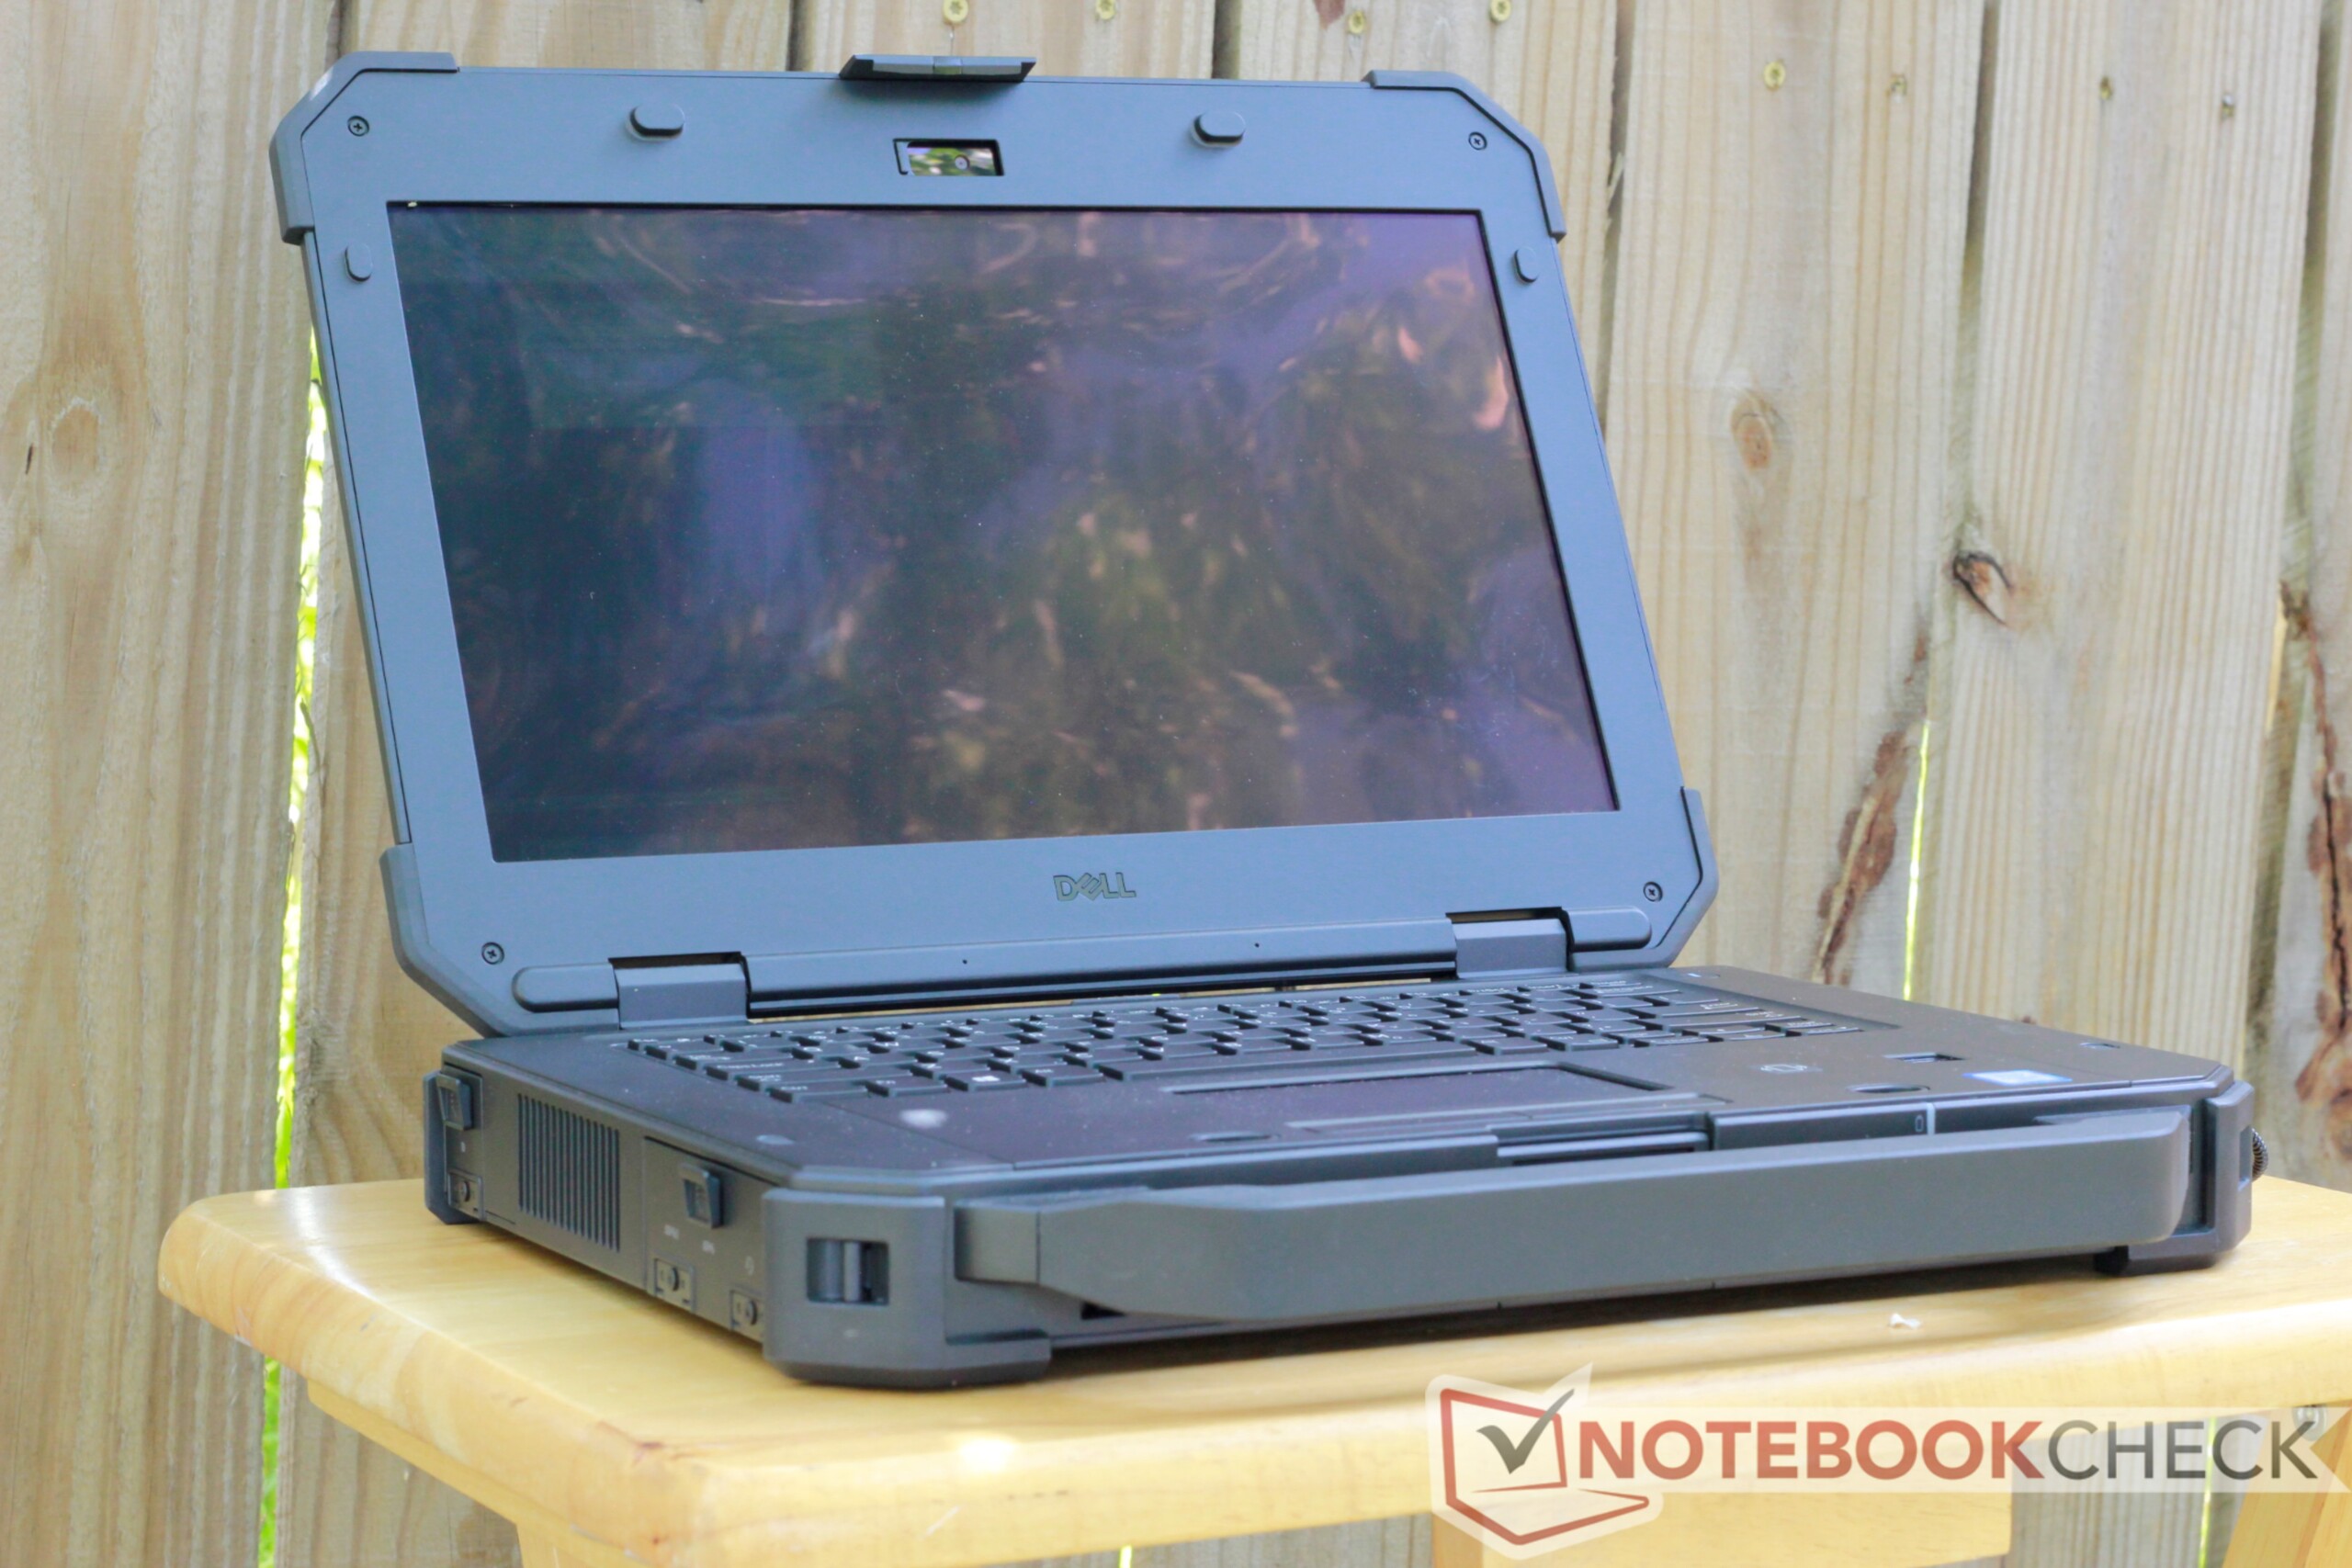


"Large" doesn't quite capture the size of the Latitude 7424 Rugged Extreme. At almost 6 cm, the Latitude 7424 is one of the thickest machines we've reviewed in recent memory. The machine is almost twice as thick as other rugged laptops and about 3 times thicker than the Lenovo ThinkPad T480.
The machine's footprint is more reasonable. The device is still large, and the rubberized front handle makes the device feel longer than it really is. This handle can be removed. The Latitude 7424 is difficult to fit into a bag or backpack. Users will need to carry the machine like a briefcase from job site to job site.
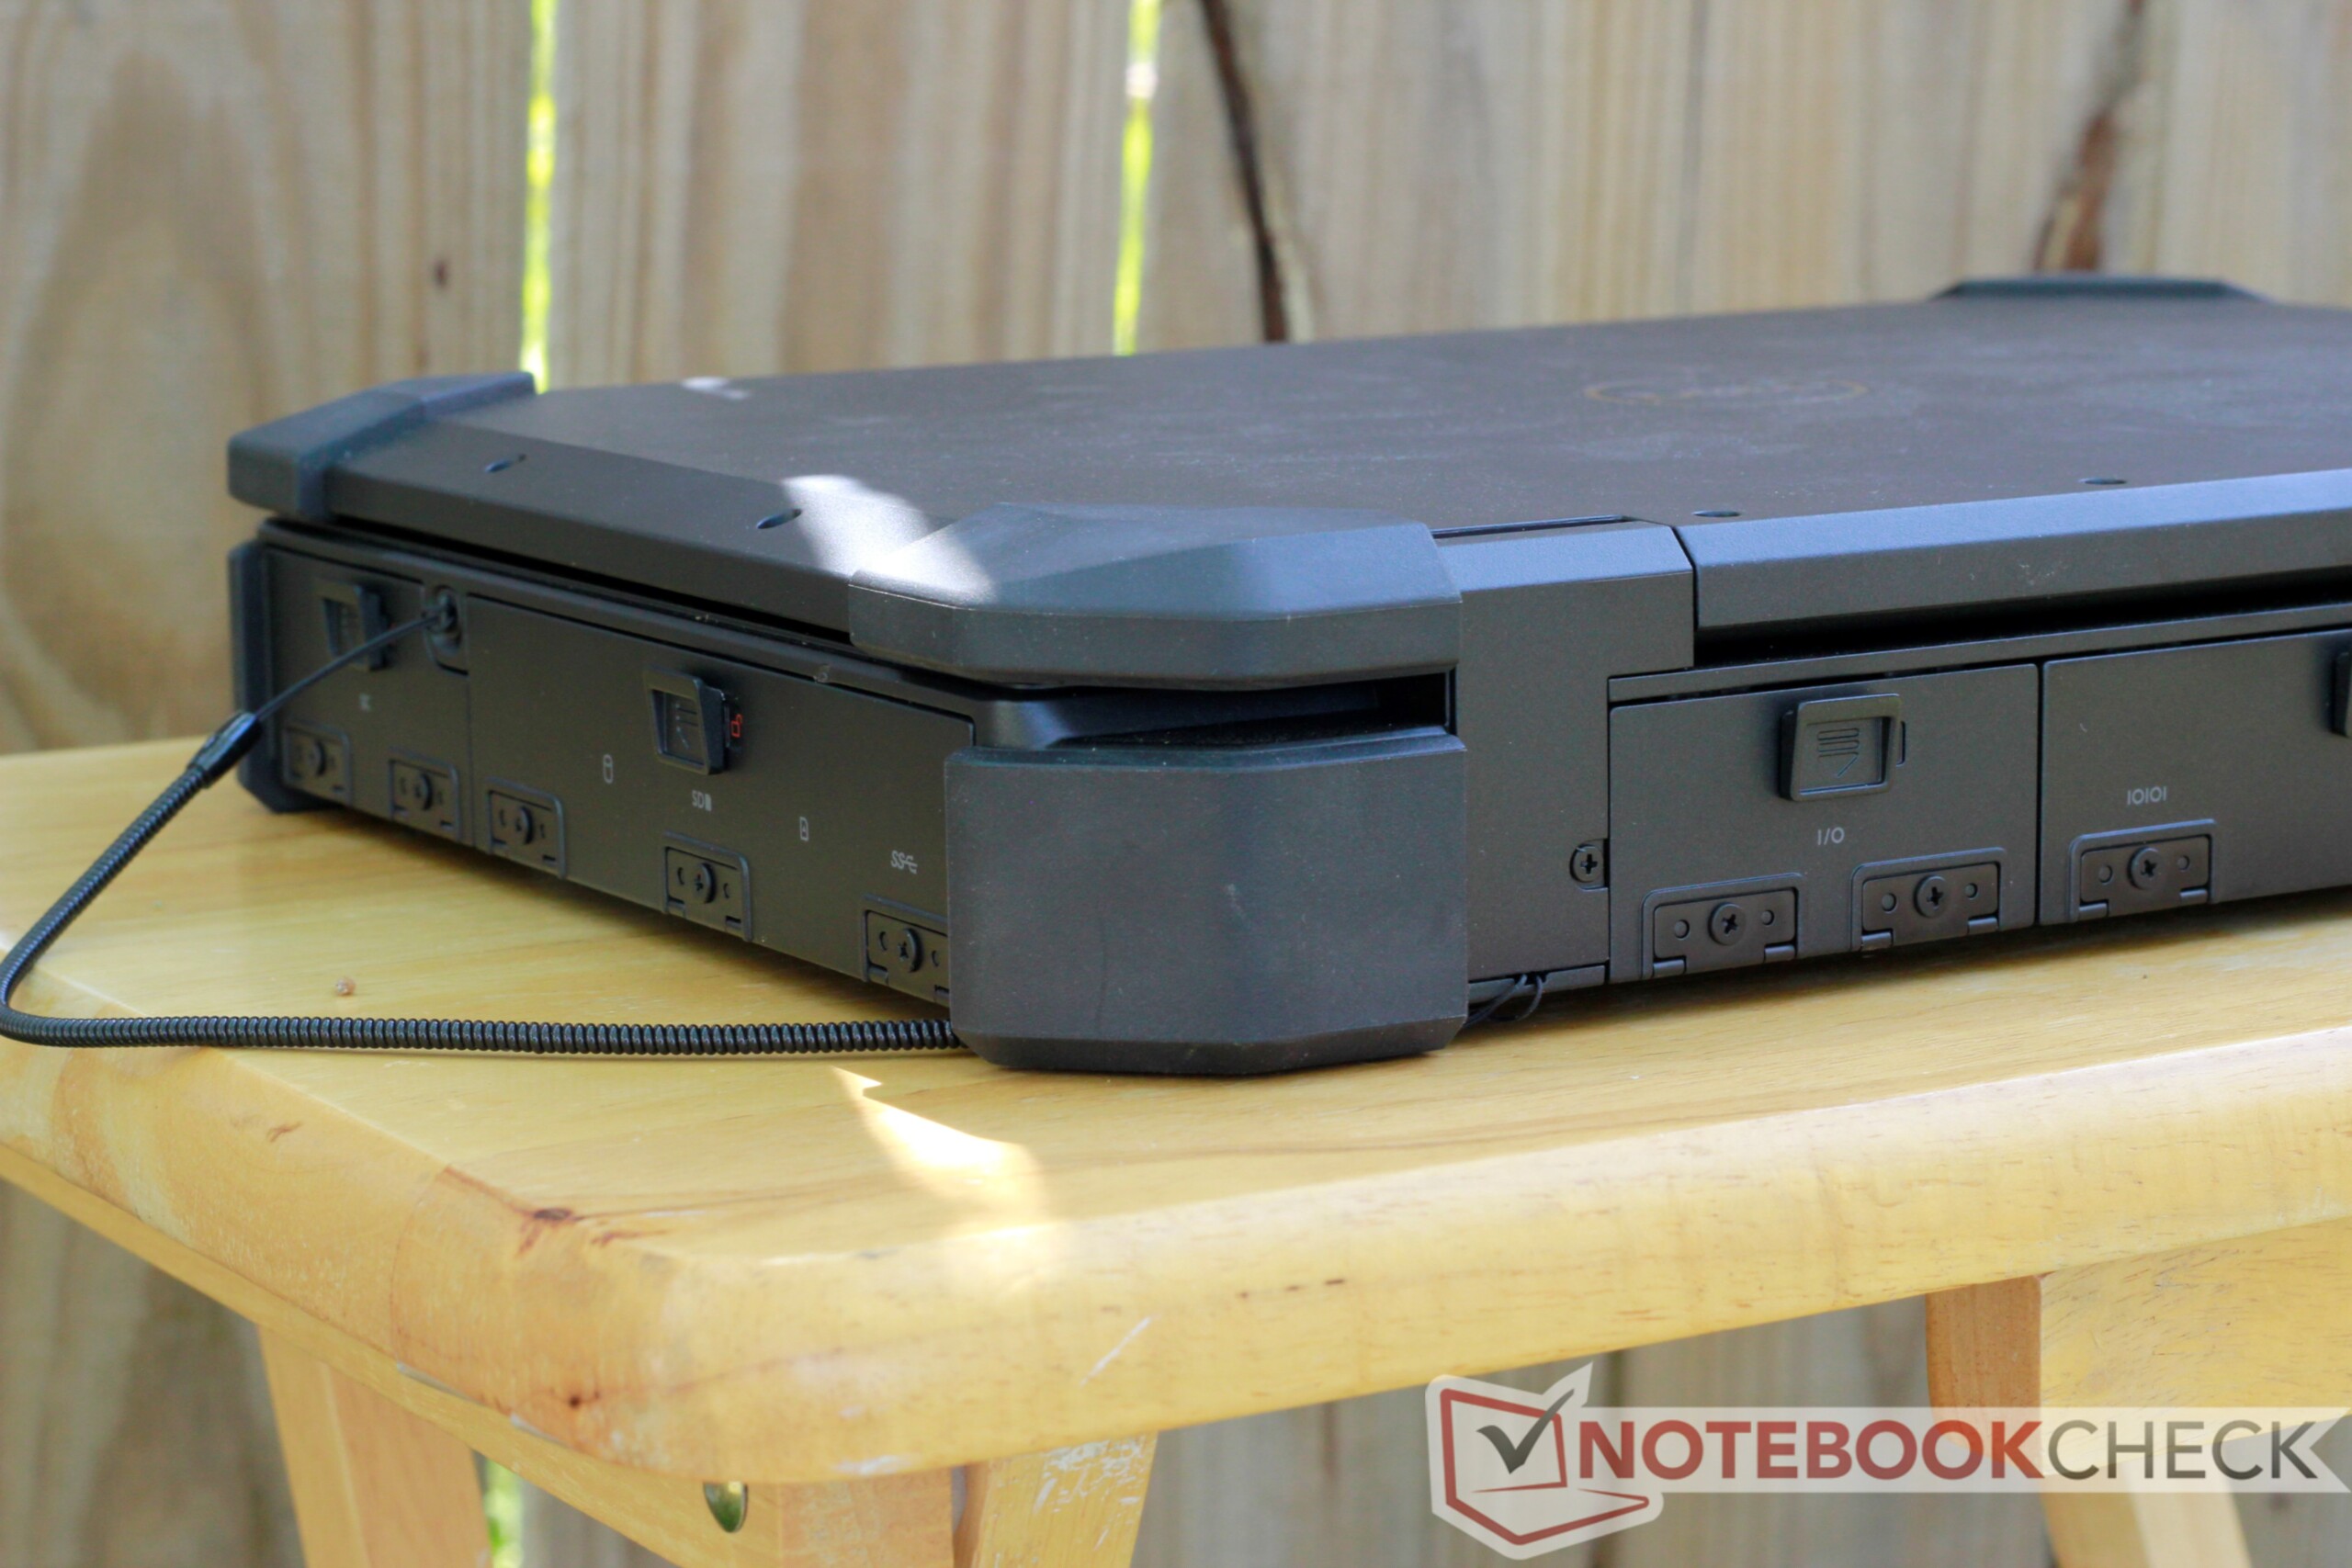
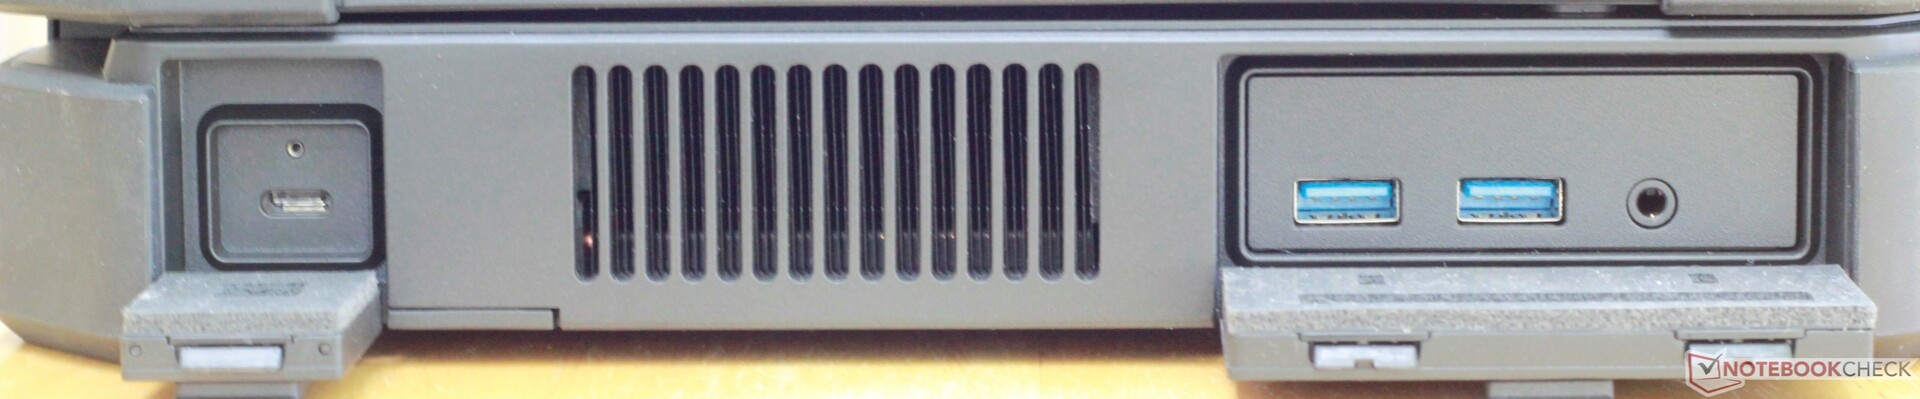
Connectivity
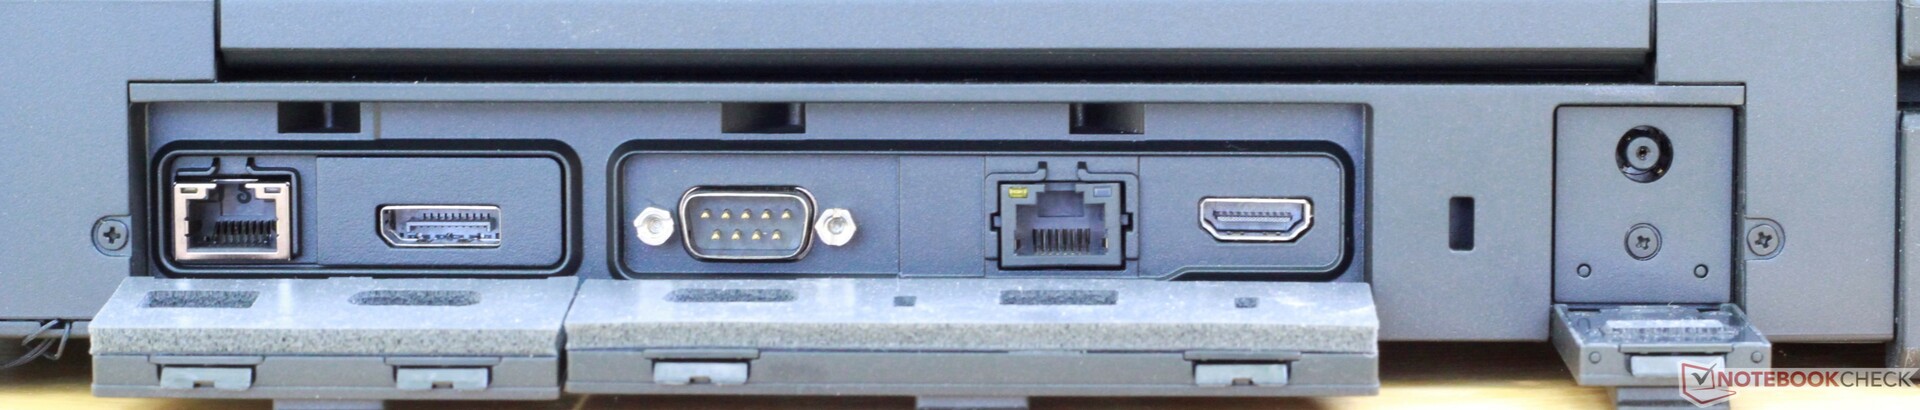
Port selection is excellent. In addition to several modern mainstays (three USB 3.0 Type-A ports, a USB 3.1 Gen 1 Type-C port, HDMI, DisplayPort, Gigabit Ethernet), the Latitude 7424 brings some legacy connections like a Smart Card Reader and a Serial port. There is also a removable PCIe storage bay and a Blu-Ray drive. Every port is kept behind dust-tight and water-resistant doors.

SD Card Reader
The SD Card reader pushes our Toshiba Exceria Pro reference card to its limits; transfer rates average between 170-220 MB/s, making this one of the fastest card readers we have reviewed.
| SD Card Reader | |
| average JPG Copy Test (av. of 3 runs) | |
| Dell Latitude 5420 Rugged-P85G (Toshiba Exceria Pro SDXC 64 GB UHS-II) | |
| Dell Latitude 7424 Rugged Extreme (Toshiba Exceria Pro SDXC 64 GB UHS-II) | |
| Lenovo ThinkPad P52 20MAS03N00 (Toshiba Exceria Pro SDXC 64 GB UHS-II) | |
| Panasonic Toughbook CF-54G2999VM (Toshiba Exceria Pro SDXC 64 GB UHS-II) | |
| Panasonic Toughbook CF-XZ6 (Toshiba Exceria Pro SDXC 64 GB UHS-II) | |
| Average of class Workstation (54.8 - 200, n=16, last 2 years) | |
| Getac S410 (Toshiba Exceria Pro SDXC 64 GB UHS-II) | |
| Lenovo ThinkPad T480-20L50010US (Toshiba Exceria Pro SDXC 64 GB UHS-II) | |
| maximum AS SSD Seq Read Test (1GB) | |
| Panasonic Toughbook CF-XZ6 (Toshiba Exceria Pro SDXC 64 GB UHS-II) | |
| Dell Latitude 5420 Rugged-P85G (Toshiba Exceria Pro SDXC 64 GB UHS-II) | |
| Dell Latitude 7424 Rugged Extreme (Toshiba Exceria Pro SDXC 64 GB UHS-II) | |
| Lenovo ThinkPad P52 20MAS03N00 (Toshiba Exceria Pro SDXC 64 GB UHS-II) | |
| Panasonic Toughbook CF-54G2999VM (Toshiba Exceria Pro SDXC 64 GB UHS-II) | |
| Average of class Workstation (78.6 - 226, n=16, last 2 years) | |
| Lenovo ThinkPad T480-20L50010US (Toshiba Exceria Pro SDXC 64 GB UHS-II) | |
| Getac S410 (Toshiba Exceria Pro SDXC 64 GB UHS-II) | |
Communication
Wireless connection speeds and strength leave no complaints. Send and receive rates are speedy, and connections are rock steady. We experienced no dropped signals up to about 35 meters through two interior walls and an exterior brick wall.
Security
The Latitude 7424 Rugged Extreme offers several security features, including multiple user authentication tools. Logins can be accomplished via an NFC pad, a Smart Card reader, an infrared facial scanner, or a touch fingerprint reader. All methods work consistently and reliably. The facial scanner, in particular, is fast and rarely failed. The scanner can also read faces in low light environments due to its use of infrared. The laptop can also be configured with other options, including Intel's vPro management engine and TPM.
Accessories
The Latitude 7424 Rugged Extreme includes a stylus for use with the resistive touchscreen. The stylus is attached to the machine via a lanyard loop along the back of the case and can be stowed in a well on the right side.
Maintenance
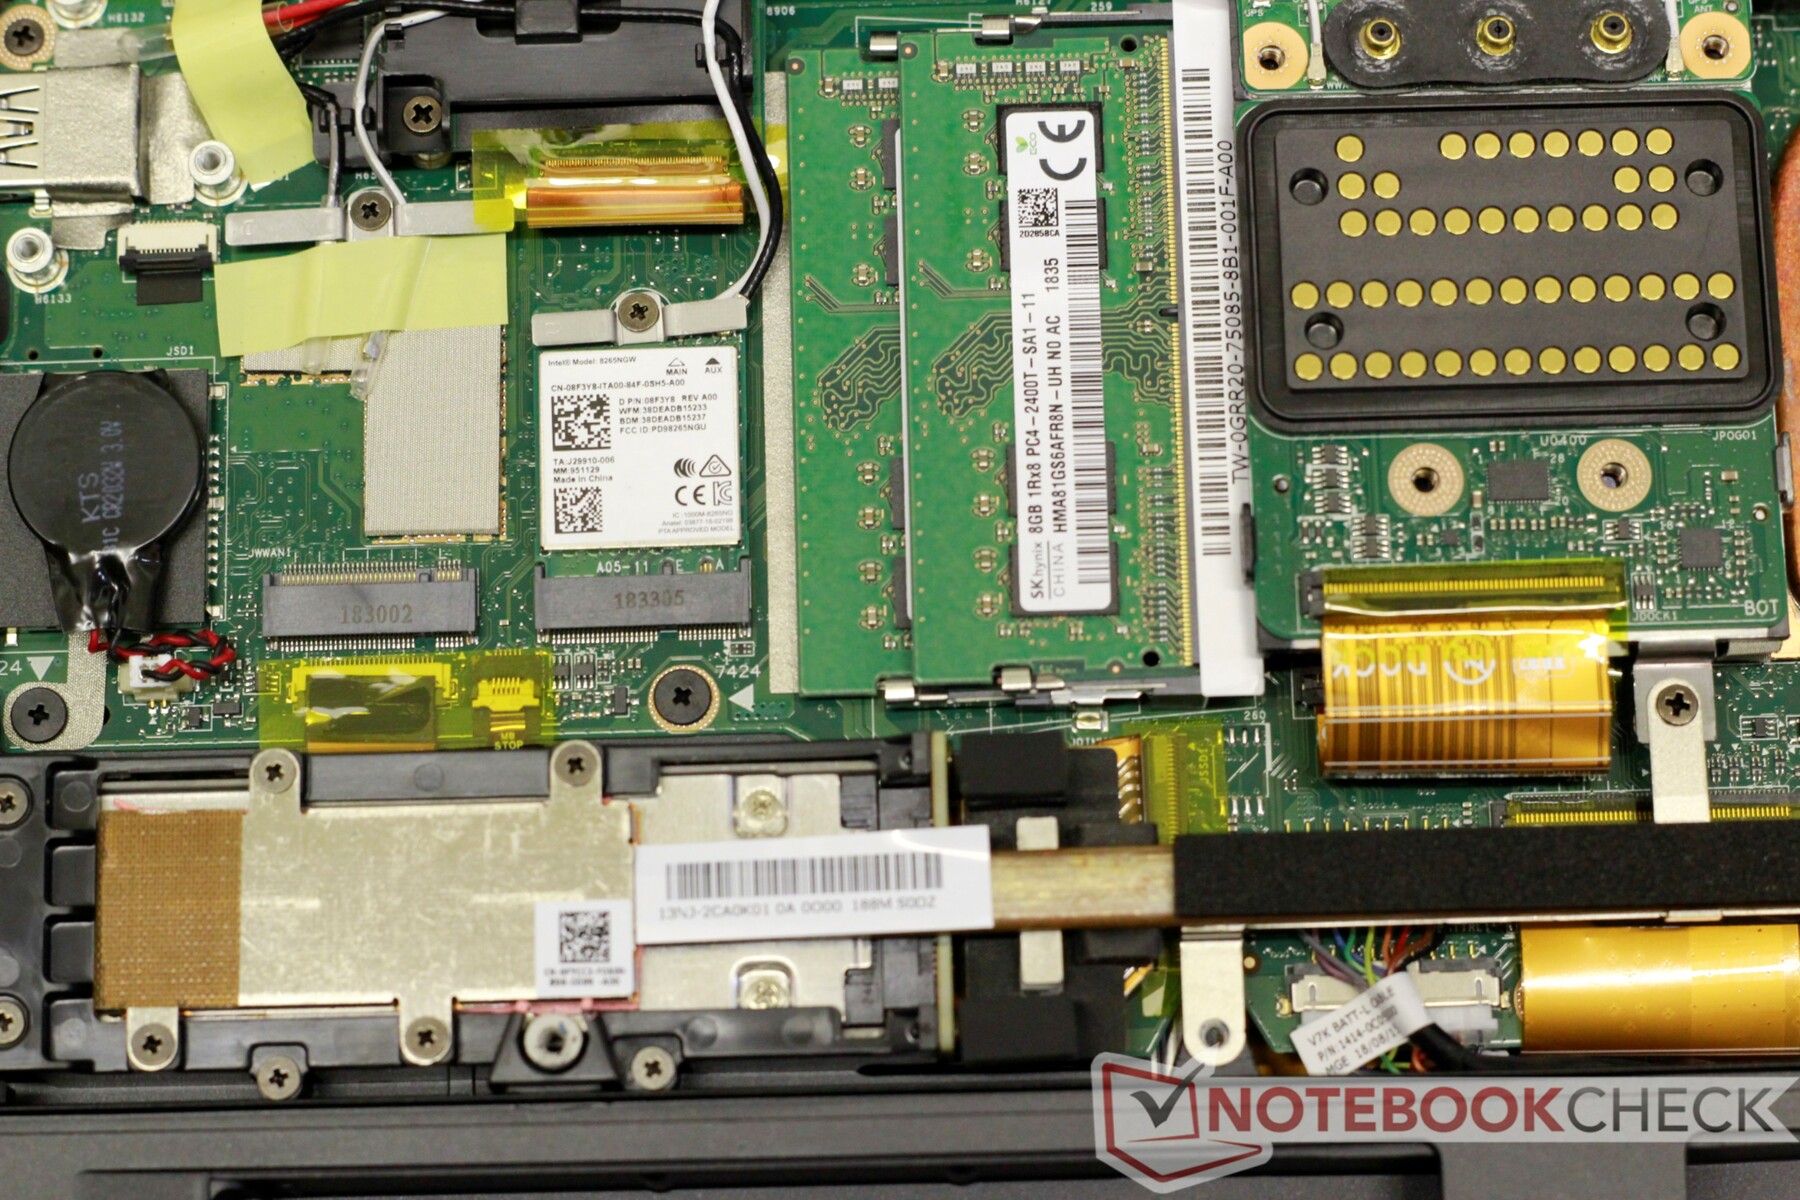
Service is possible but is a chore. Twenty-one Phillips Heads screws hold the bottom panel to the case. The screws are all uniform, so sorting them isn't necessary (thankfully). One the screws are removed, the back panel pops off without much fuss. Once inside, users can swap out the RAM and the wireless card. Further disassembly is needed to reach the soldered CPU and GPU.
The keyboard is attached via six screws and some stubborn plastic clips. Replacing the keyboard requires effort but is relatively straightforward.

Warranty
Dell offers a three years standard warranty on the Latitude 7424 Rugged Extreme. Buyers can also extend the warranty up to 5 years and add Dell's ProSupport or ProSupport Plus services. ProSupport subscribers have access to onsite service by certified technicians as well as points-of-contact for specific hardware and software problems. ProSupport even provides support for third-party applications like internet browsers, financial software (e.g., Quicken), video/photo editing programs, and more.
Input Devices
Keyboard
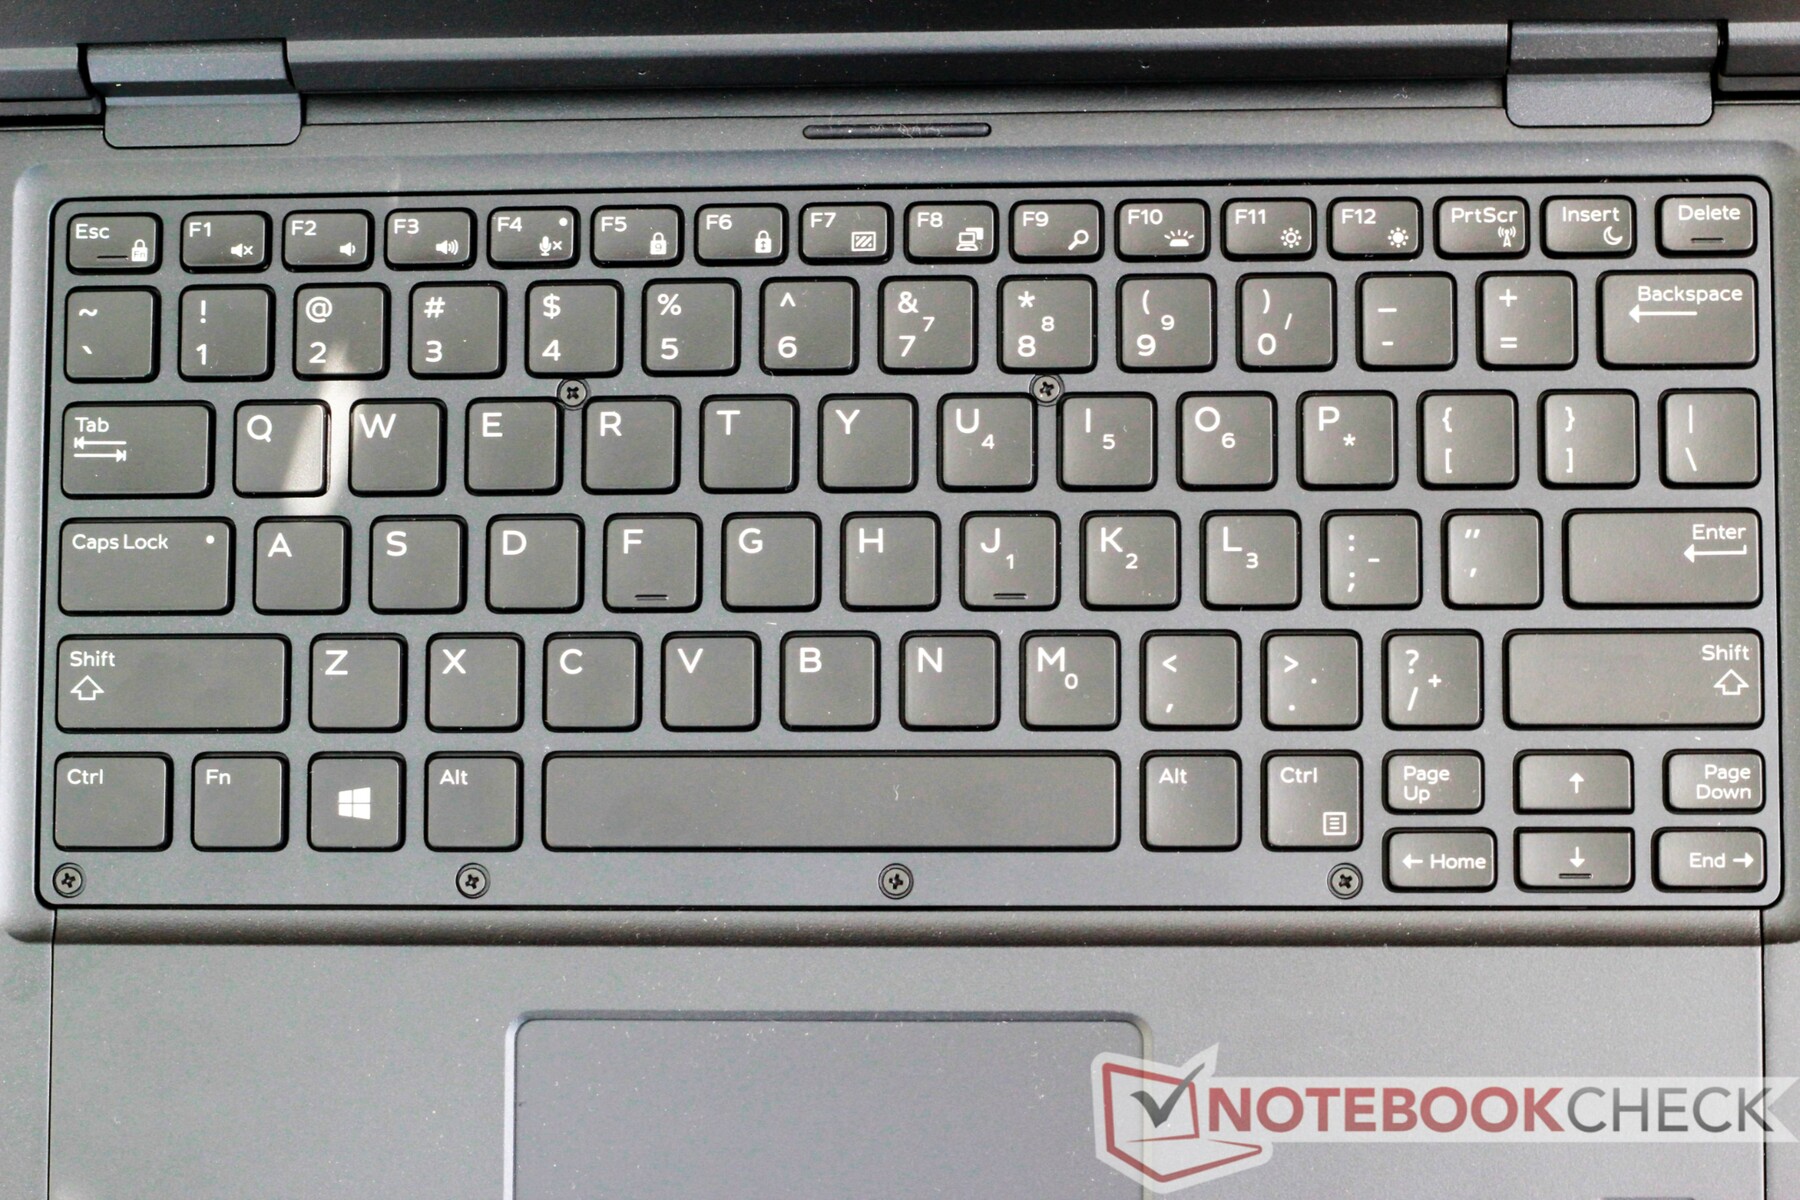
The Latitude 7424 uses the same keyboard as the Latitude 540 Rugged. As such, it offers the same quiet keys, good response, and solid backplate. The pressure point is similarly soft and may feel mushy to some. Compared to the fine-tuned ThinkPad keyboards, the Latitude 7424's comes up short but should still offer a pleasing experience to most typists.
Touchpad & touchscreen
The touchpad and touchscreen leave quite a bit to be desired. Both have poor response and glide, but for a good reason: they use resistive sensors rather than the typical capacitive sensors seen in most laptops. While the resistive touchpad and touchscreen lack the smooth glide and precise response of capacitive sensors, they can be used with gloves as they rely on pressure rather than electrical current.
Users will need to apply consistent pressure to the touchpad and touchscreen in order to trigger the sensors, and this takes some major adjustment. It also makes dragging and dropping via both inputs difficult. The resistive design is likely beneficial for the Latitude 7424 Rugged Extreme's target audience but can be frustrating to use.

Display

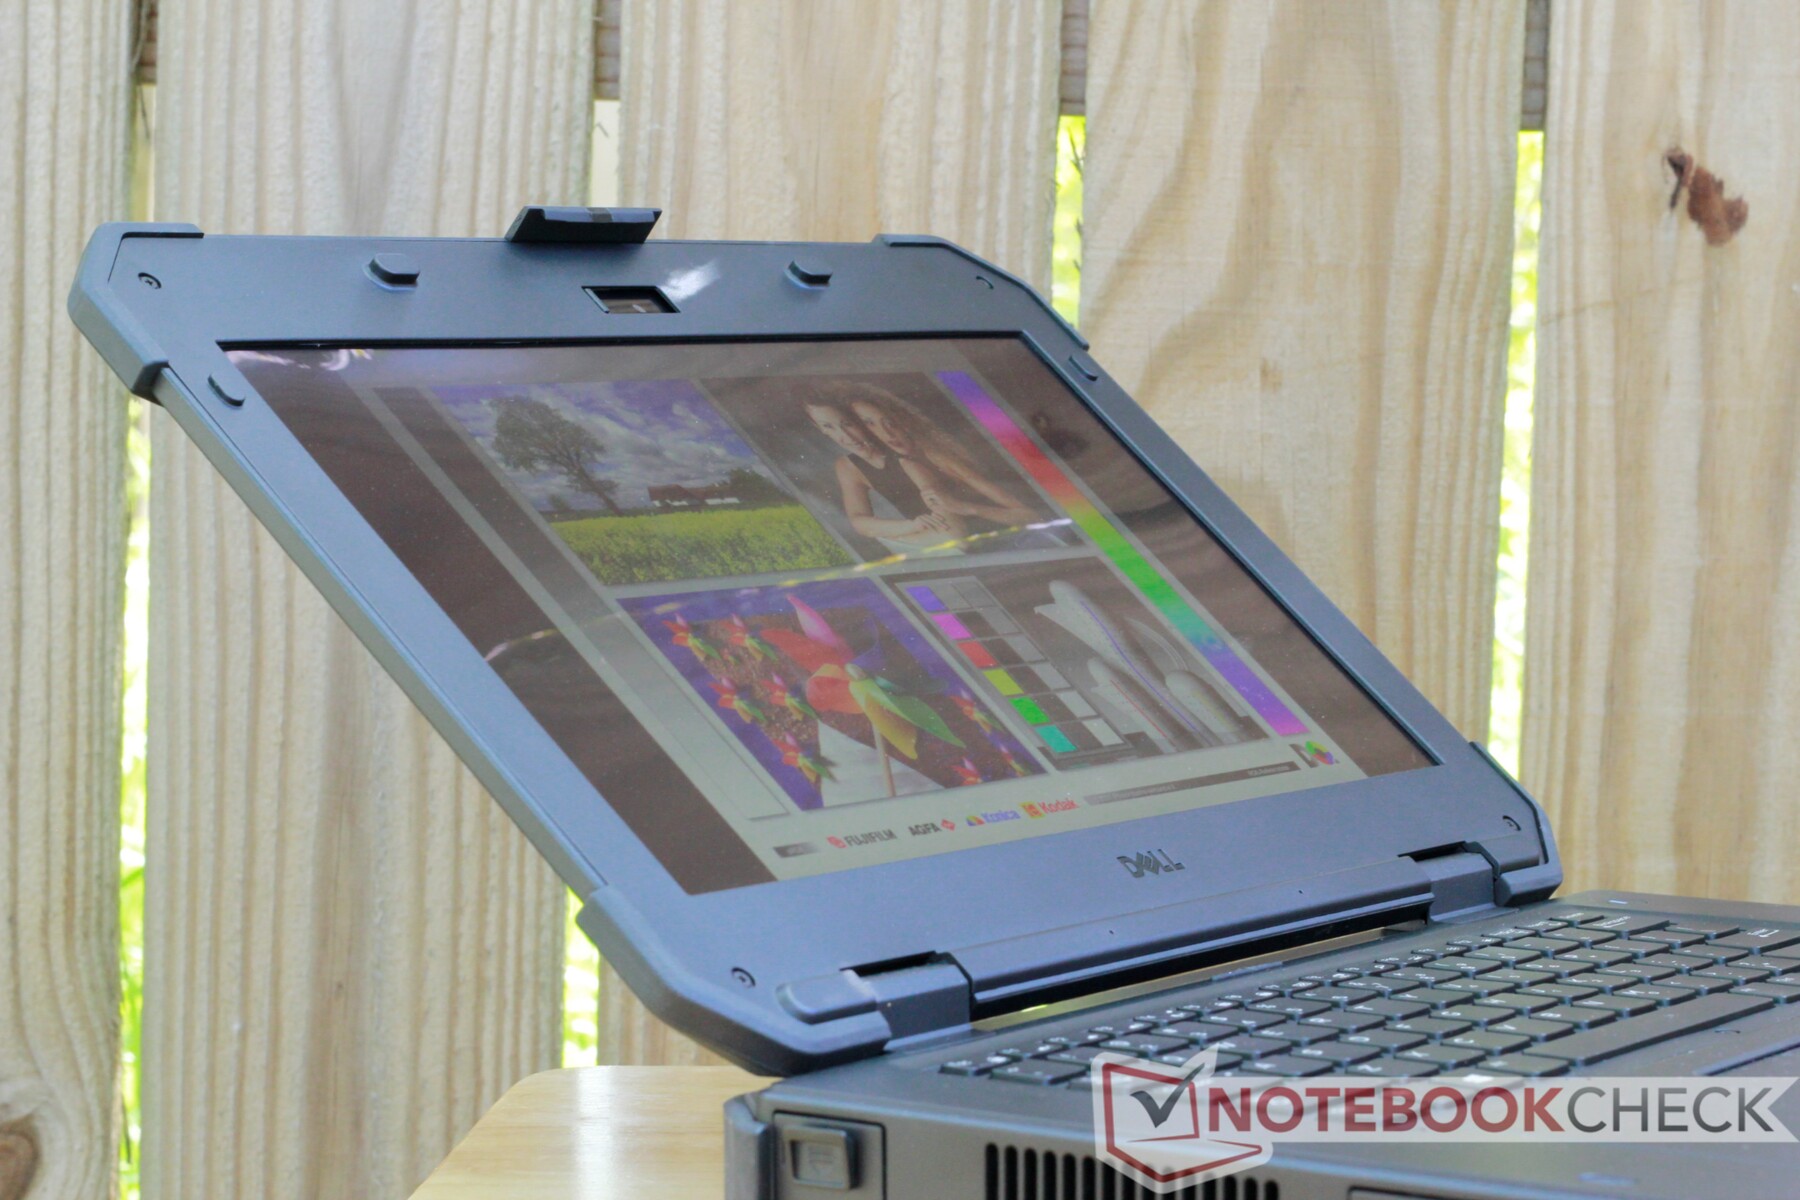
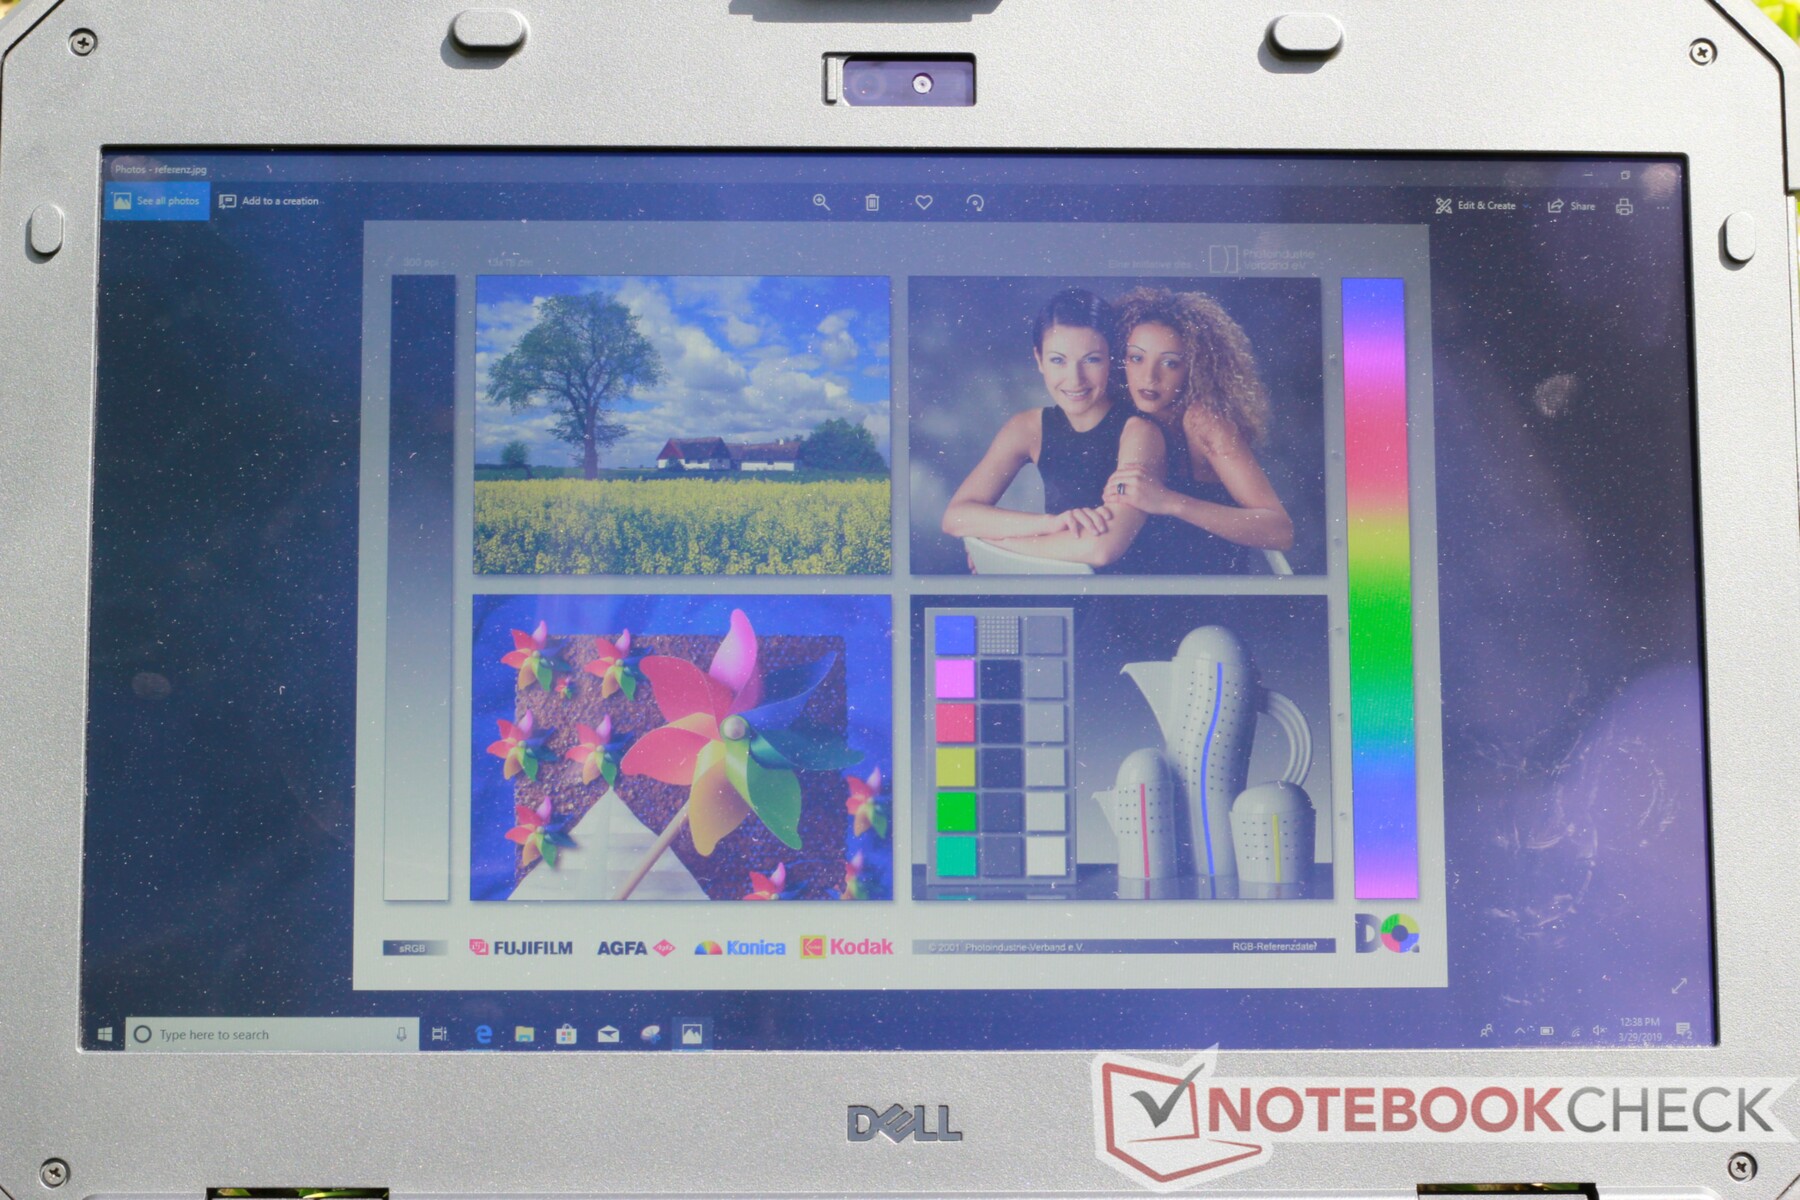
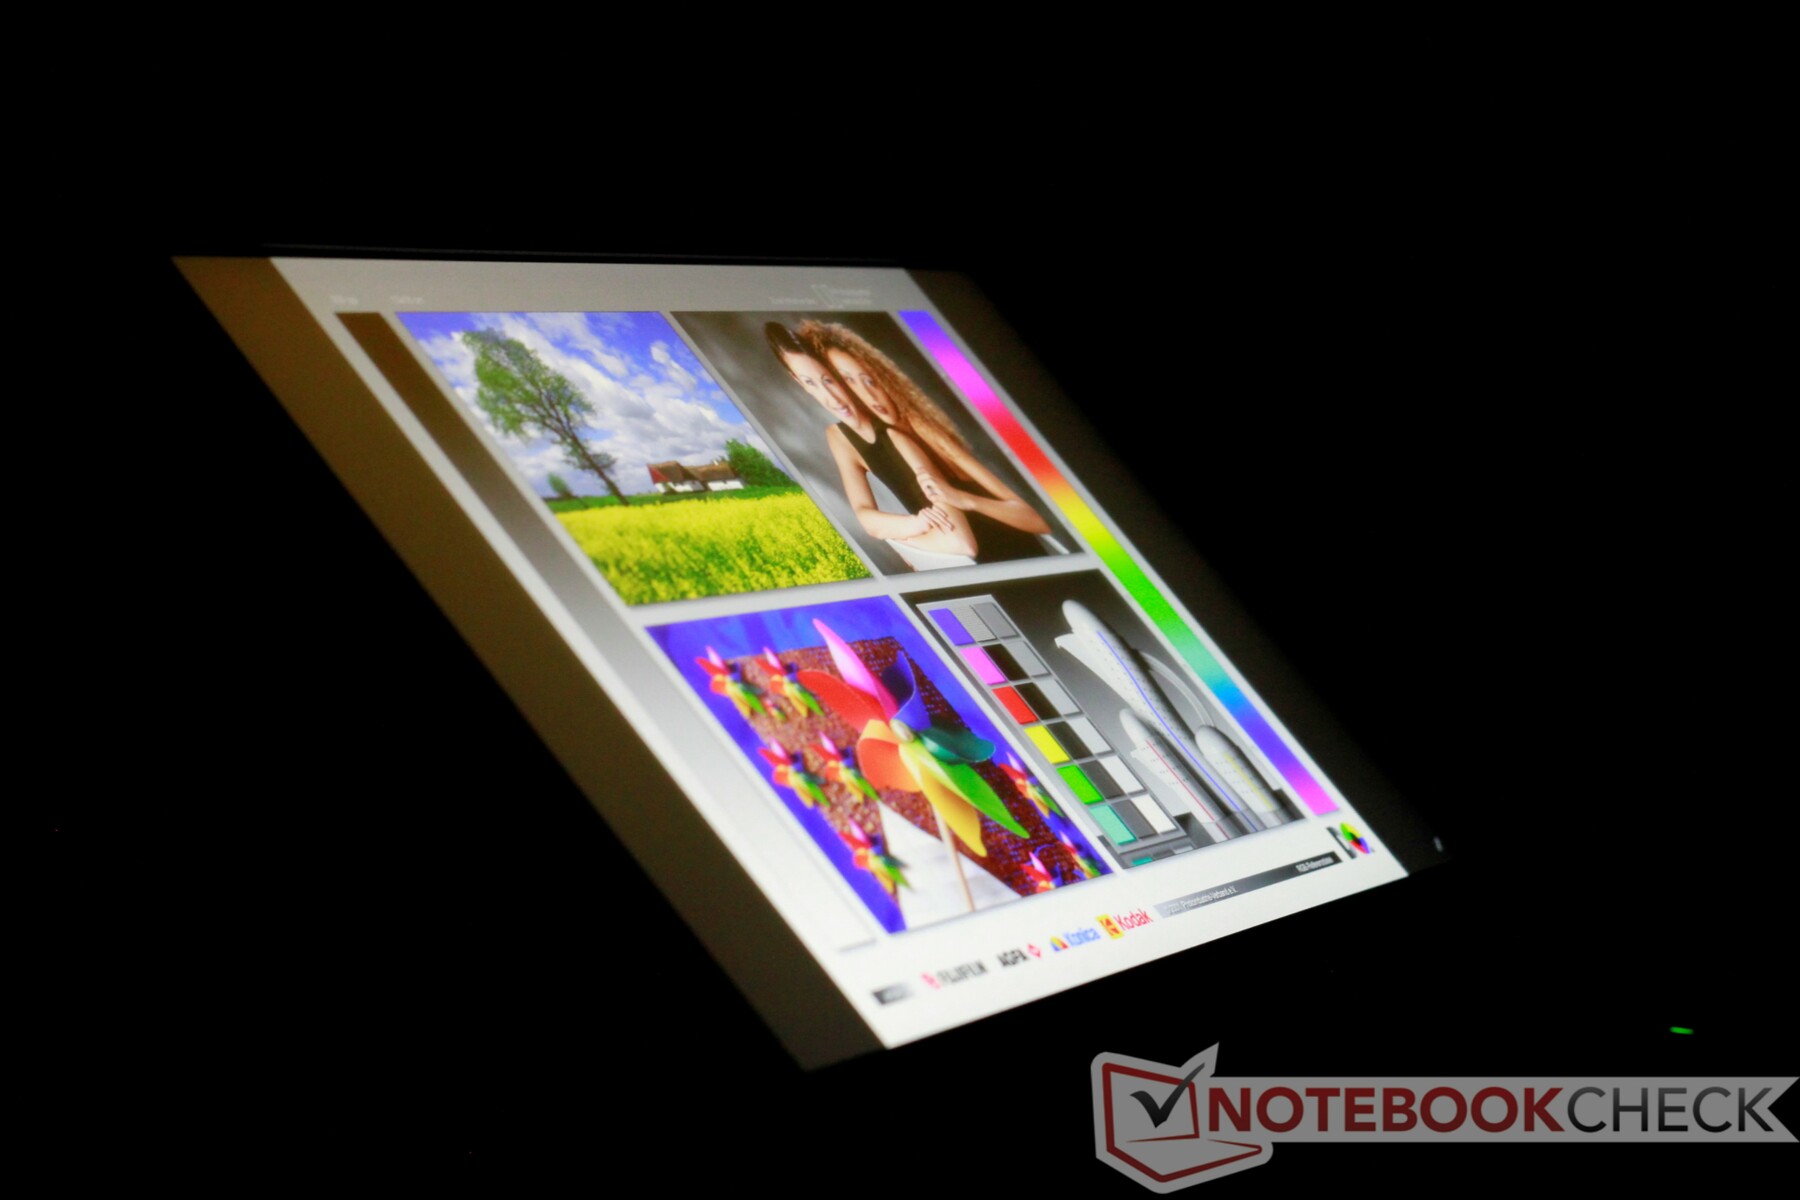
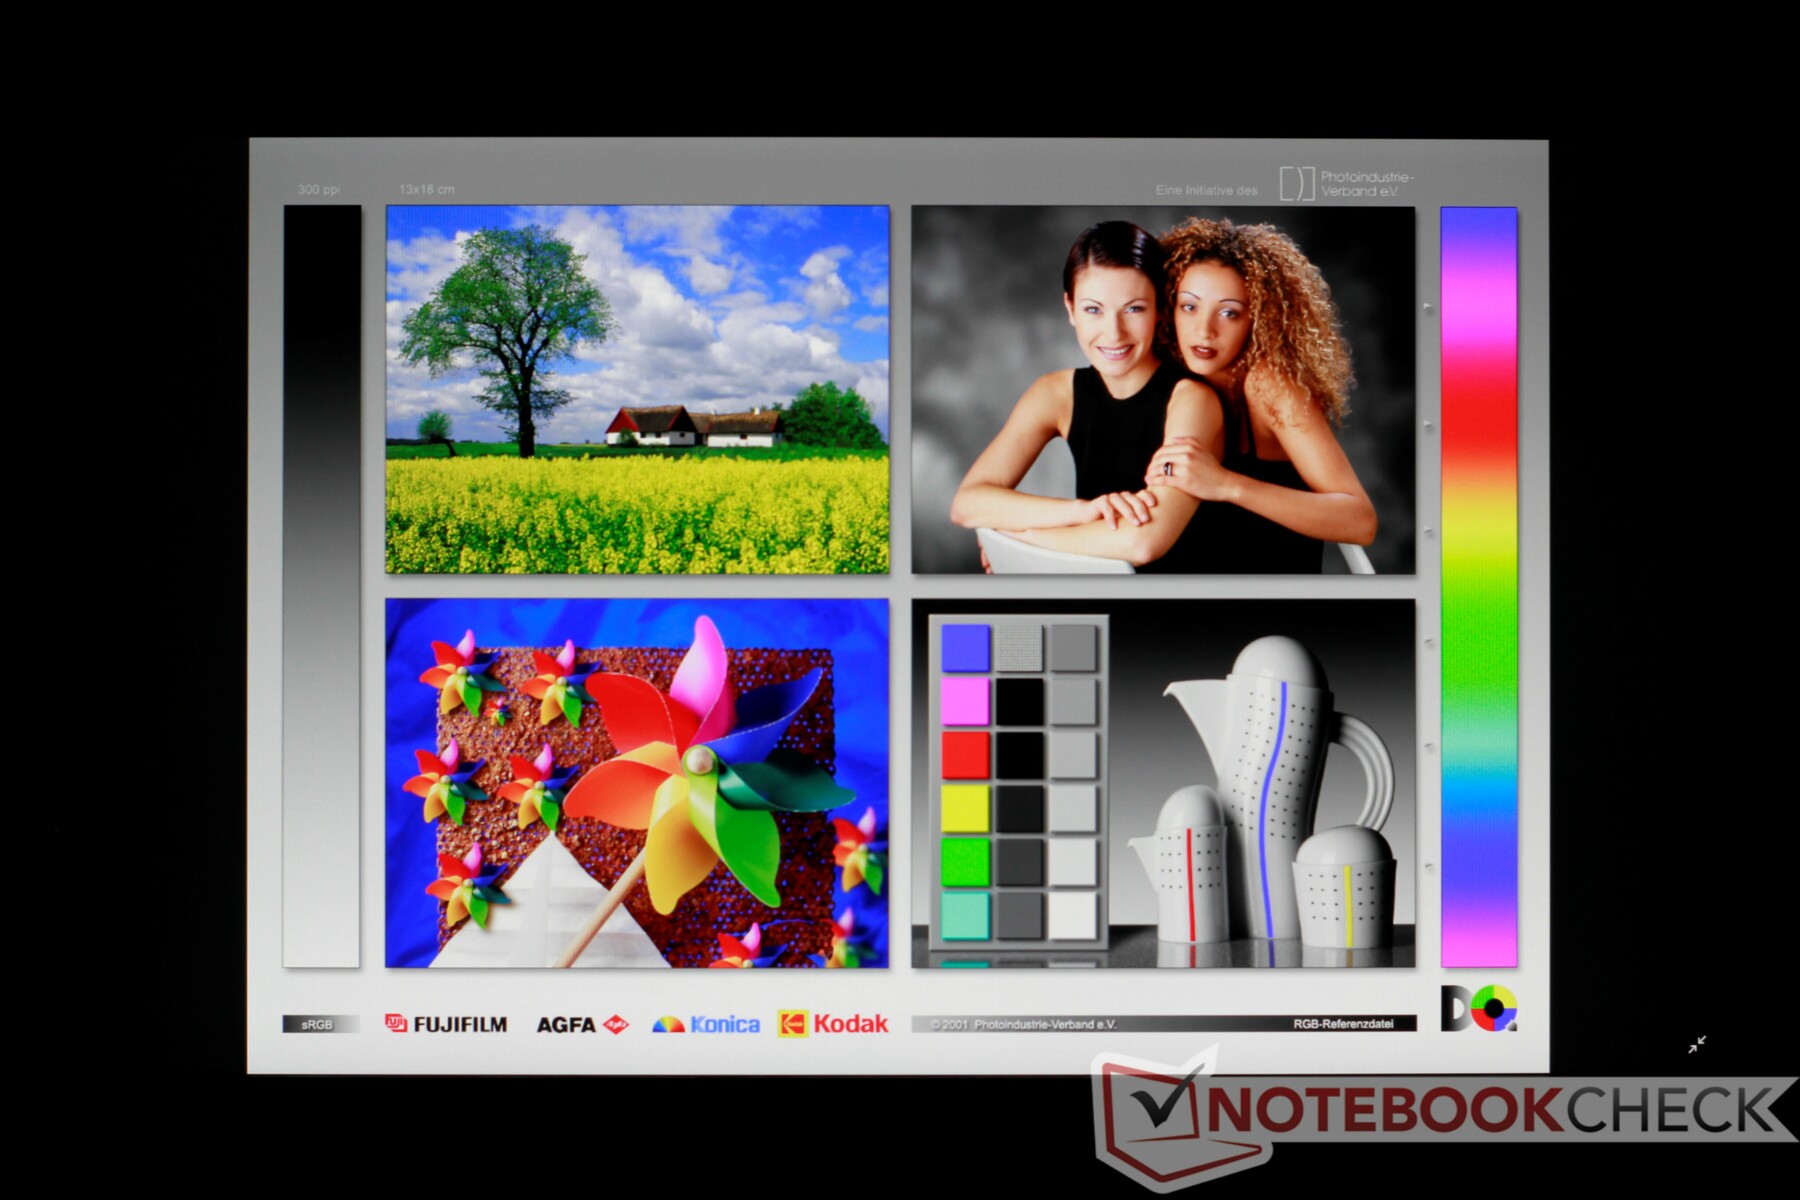
The Latitude 7424 Rugged Extreme is billed as a rough, outdoor-use computer, and the screen plays into that label well. The display gets extremely bright (~800 nits) and is fully visible in any lighting, even directly under the sun. Contrast is very good (1563:1) despite the bright back panel. Response times are below average for an IPS display. We also detect PWM (763 Hz), but only at 100% brightness, which is odd. Brightness levels of 99% and lower have no detectable PWM.
The weakest point of the screen is the grainy film caused by the resistive touch panel's second layer. Text and images look a bit blurry compared to a standard IPS display, and lighter backgrounds bear noticeable visual noise.
| |||||||||||||||||||||||||
Brightness Distribution: 88 %
Center on Battery: 844 cd/m²
Contrast: 1563:1 (Black: 0.54 cd/m²)
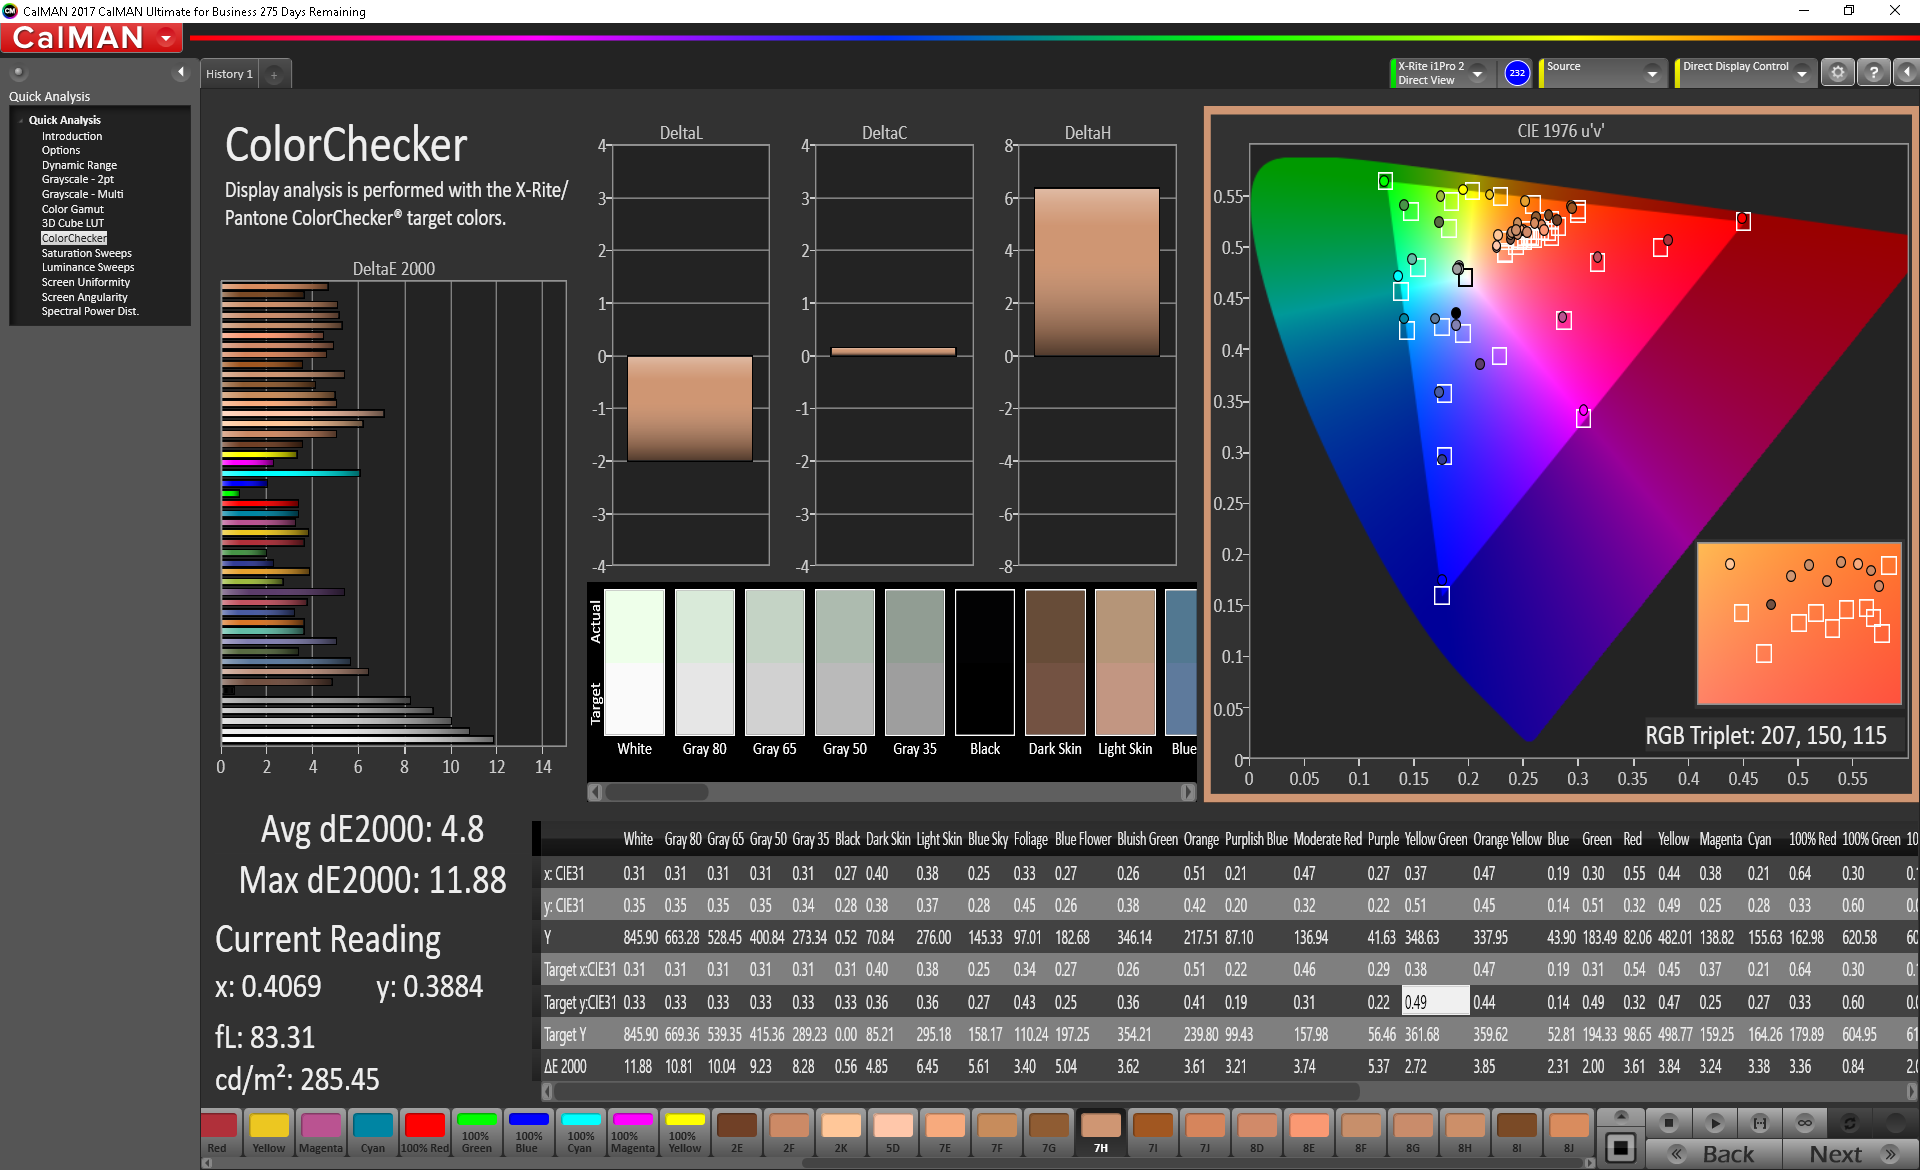
ΔE Color 4.8 | 0.5-29.43 Ø5, calibrated: 1.15
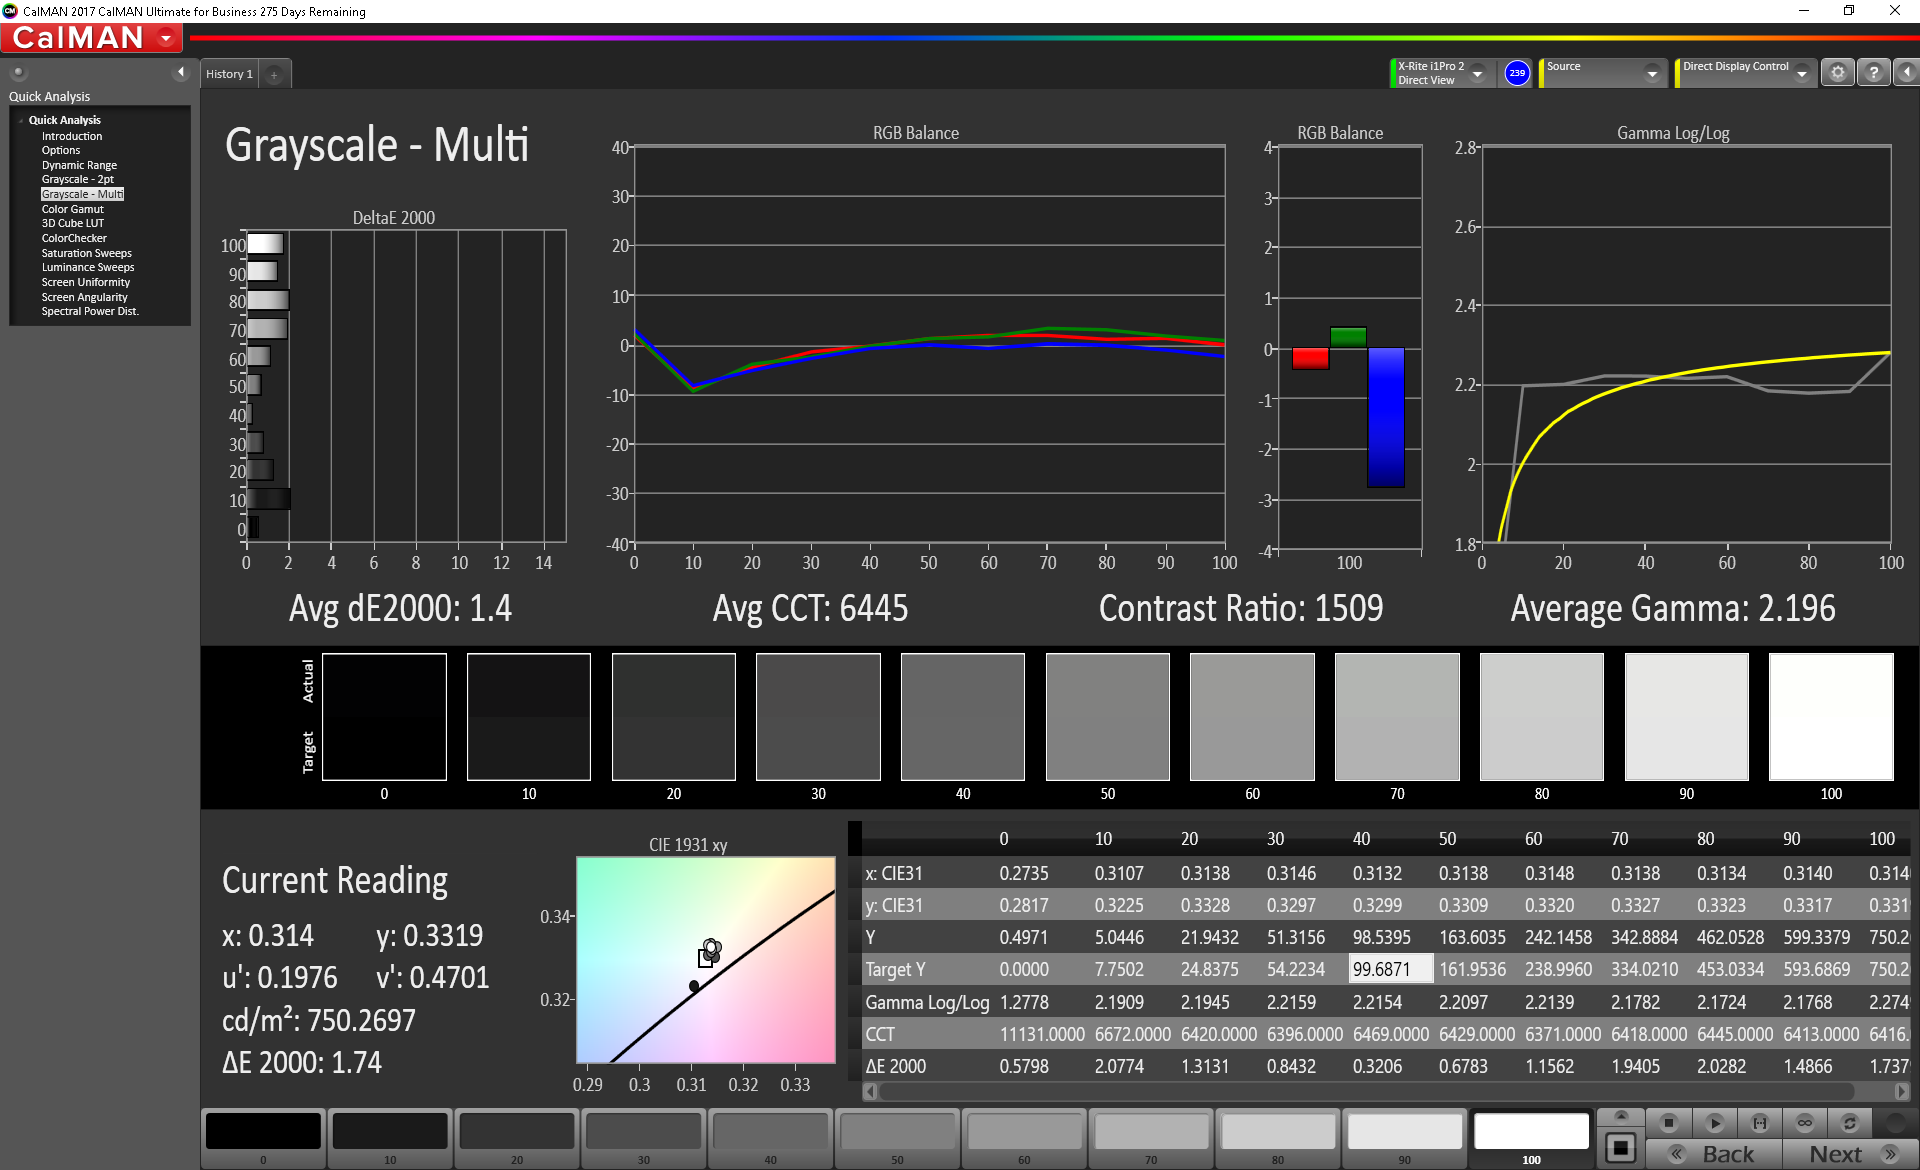
ΔE Greyscale 7.6 | 0.57-98 Ø5.3
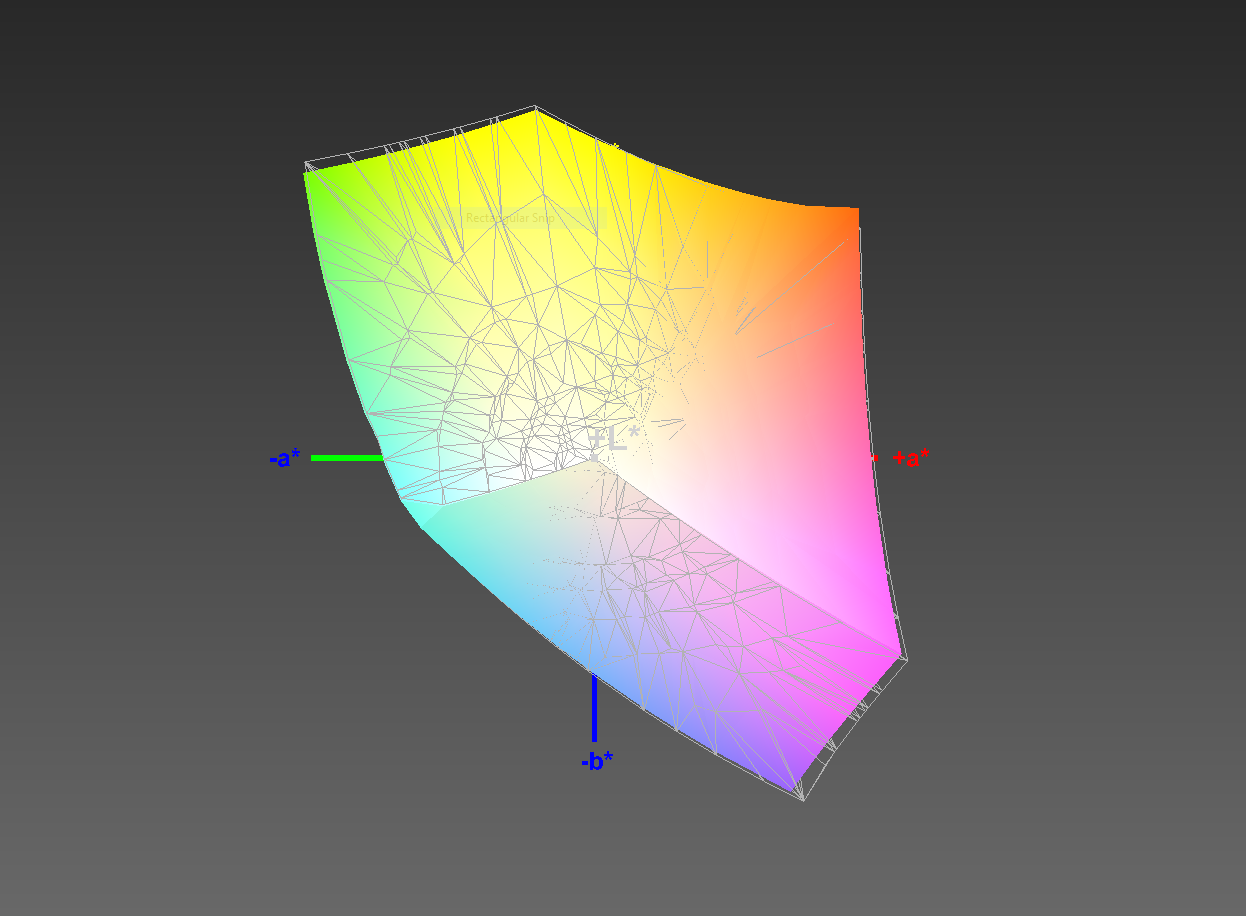
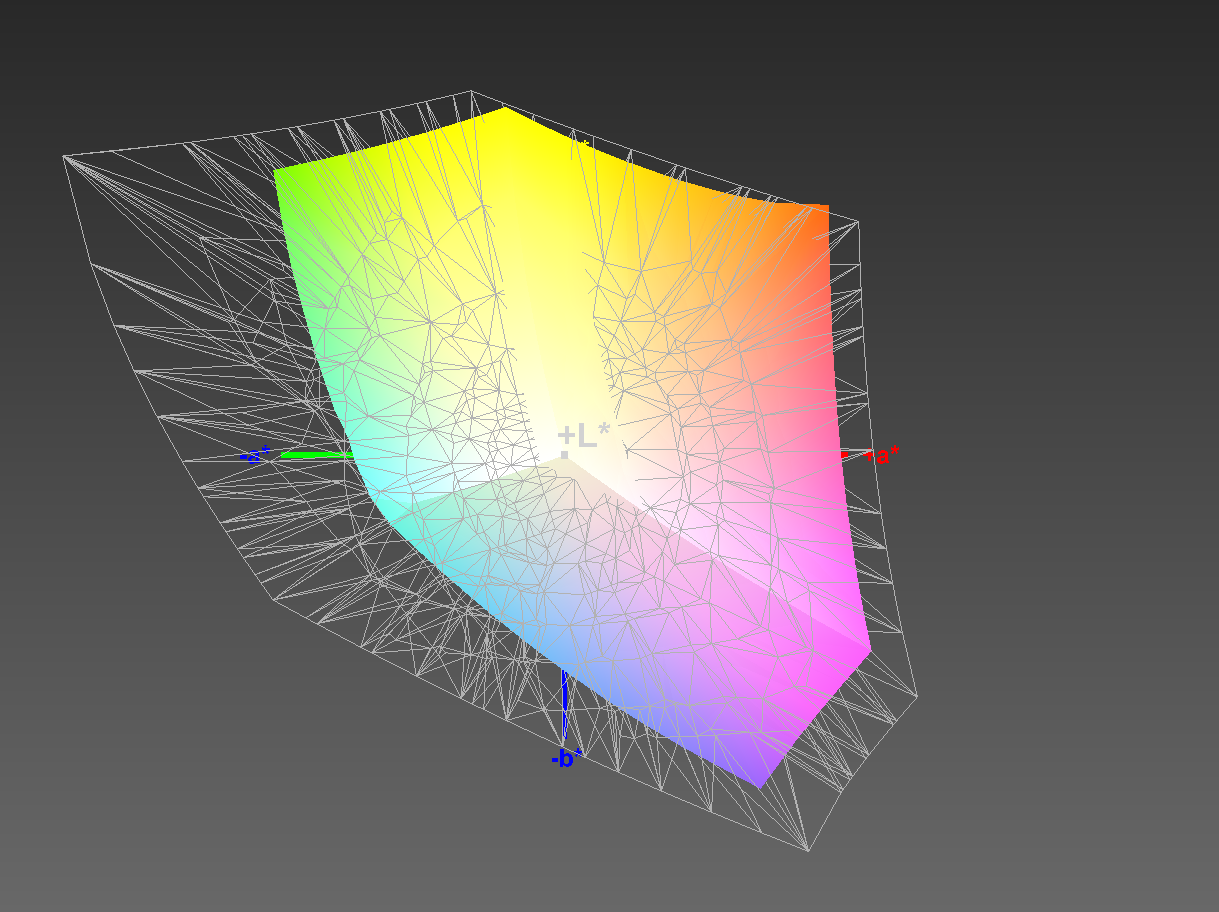
97% sRGB (Argyll 1.6.3 3D)
62% AdobeRGB 1998 (Argyll 1.6.3 3D)
67.3% AdobeRGB 1998 (Argyll 2.2.0 3D)
96.9% sRGB (Argyll 2.2.0 3D)
65.3% Display P3 (Argyll 2.2.0 3D)
Gamma: 2.334
| Dell Latitude 7424 Rugged Extreme AU Optronics AUO523D, IPS, 14.00, 1920x1080 | Getac S410 CMN N140BGE-E33, TN PED, 14.00, 1366x768 | Panasonic Toughbook CF-54G2999VM B140XTN, AUO2E3C, TN LED, 14.00, 1366x768 | Panasonic Toughbook CF-XZ6 Semi-Matte Beschichtung, IPS LED, 12.00, 2160x1440 | Dell Latitude 5420 Rugged-P85G AU Optronics AUO523D, IPS, 14.00, 1920x1080 | Lenovo ThinkPad T480-20L50010US B140HAK01.0, TFT-LCD, 14.00, 1920x1080 | Lenovo ThinkPad P52 20MAS03N00 N156HCE-EN1, IPS LED, 15.60, 1920x1080 | |
|---|---|---|---|---|---|---|---|
| Display | -38% | -43% | -29% | -5% | -44% | -3% | |
| Display P3 Coverage | 65.3 | 40.46 -38% | 37.36 -43% | 46.47 -29% | 62.5 -4% | 36.31 -44% | 65.6 0% |
| sRGB Coverage | 96.9 | 60.9 -37% | 56.1 -42% | 70 -28% | 92.4 -5% | 54.5 -44% | 90.3 -7% |
| AdobeRGB 1998 Coverage | 67.3 | 41.8 -38% | 38.62 -43% | 48.01 -29% | 64.2 -5% | 37.51 -44% | 65.9 -2% |
| Response Times | 38% | 44% | 18% | 1% | 31% | 1094% | |
| Response Time Grey 50% / Grey 80% * | 62.8 ? | 41.2 ? 34% | 43.2 ? 31% | 39 ? 38% | 68 ? -8% | 39.2 ? 38% | 39.2 ? 38% |
| Response Time Black / White * | 40 ? | 14 ? 65% | 17.2 ? 57% | 30 ? 25% | 33.6 ? 16% | 30.8 ? 23% | 26 ? 35% |
| PWM Frequency | 763 | 877 ? 15% | 694 ? -9% | 735 ? -4% | 25250 ? 3209% | ||
| Screen | -86% | -92% | -7% | -9% | -61% | -14% | |
| Brightness middle | 844 | 265.1 -69% | 174.5 -79% | 565 -33% | 1111.7 32% | 276.7 -67% | 304 -64% |
| Brightness | 793 | 246 -69% | 164 -79% | 538 -32% | 1026 29% | 272 -66% | 293 -63% |
| Brightness Distribution | 88 | 81 -8% | 71 -19% | 82 -7% | 80 -9% | 90 2% | 88 0% |
| Black Level * | 0.54 | 0.58 -7% | 0.6 -11% | 0.4 26% | 0.81 -50% | 0.21 61% | 0.26 52% |
| Contrast | 1563 | 457 -71% | 291 -81% | 1413 -10% | 1372 -12% | 1318 -16% | 1169 -25% |
| Colorchecker dE 2000 * | 4.8 | 14.24 -197% | 12.05 -151% | 5.06 -5% | 3.83 20% | 7.22 -50% | 4.5 6% |
| Colorchecker dE 2000 max. * | 11.88 | 26.66 -124% | 27.5 -131% | 8.1 32% | 7.85 34% | 25.87 -118% | 7.7 35% |
| Colorchecker dE 2000 calibrated * | 1.15 | 3.94 -243% | 4.34 -277% | 2.98 -159% | 5.01 -336% | 2.4 -109% | |
| Greyscale dE 2000 * | 7.6 | 14.2 -87% | 14.8 -95% | 6.4 16% | 5.6 26% | 6.7 12% | 5.2 32% |
| Gamma | 2.334 94% | 2.03 108% | 1.4 157% | 2.25 98% | 2.306 95% | 2.321 95% | 2.26 97% |
| CCT | 6546 99% | 17152 38% | 14529 45% | 5794 112% | 7676 85% | 6656 98% | 6789 96% |
| Color Space (Percent of AdobeRGB 1998) | 62 | 38.7 -38% | 35.7 -42% | 44 -29% | 59 -5% | 34 -45% | 53.8 -13% |
| Color Space (Percent of sRGB) | 97 | 61 -37% | 56.2 -42% | 70 -28% | 93 -4% | 54 -44% | 90.1 -7% |
| Total Average (Program / Settings) | -29% /
-56% | -30% /
-65% | -6% /
-6% | -4% /
-6% | -25% /
-46% | 359% /
183% |
* ... smaller is better
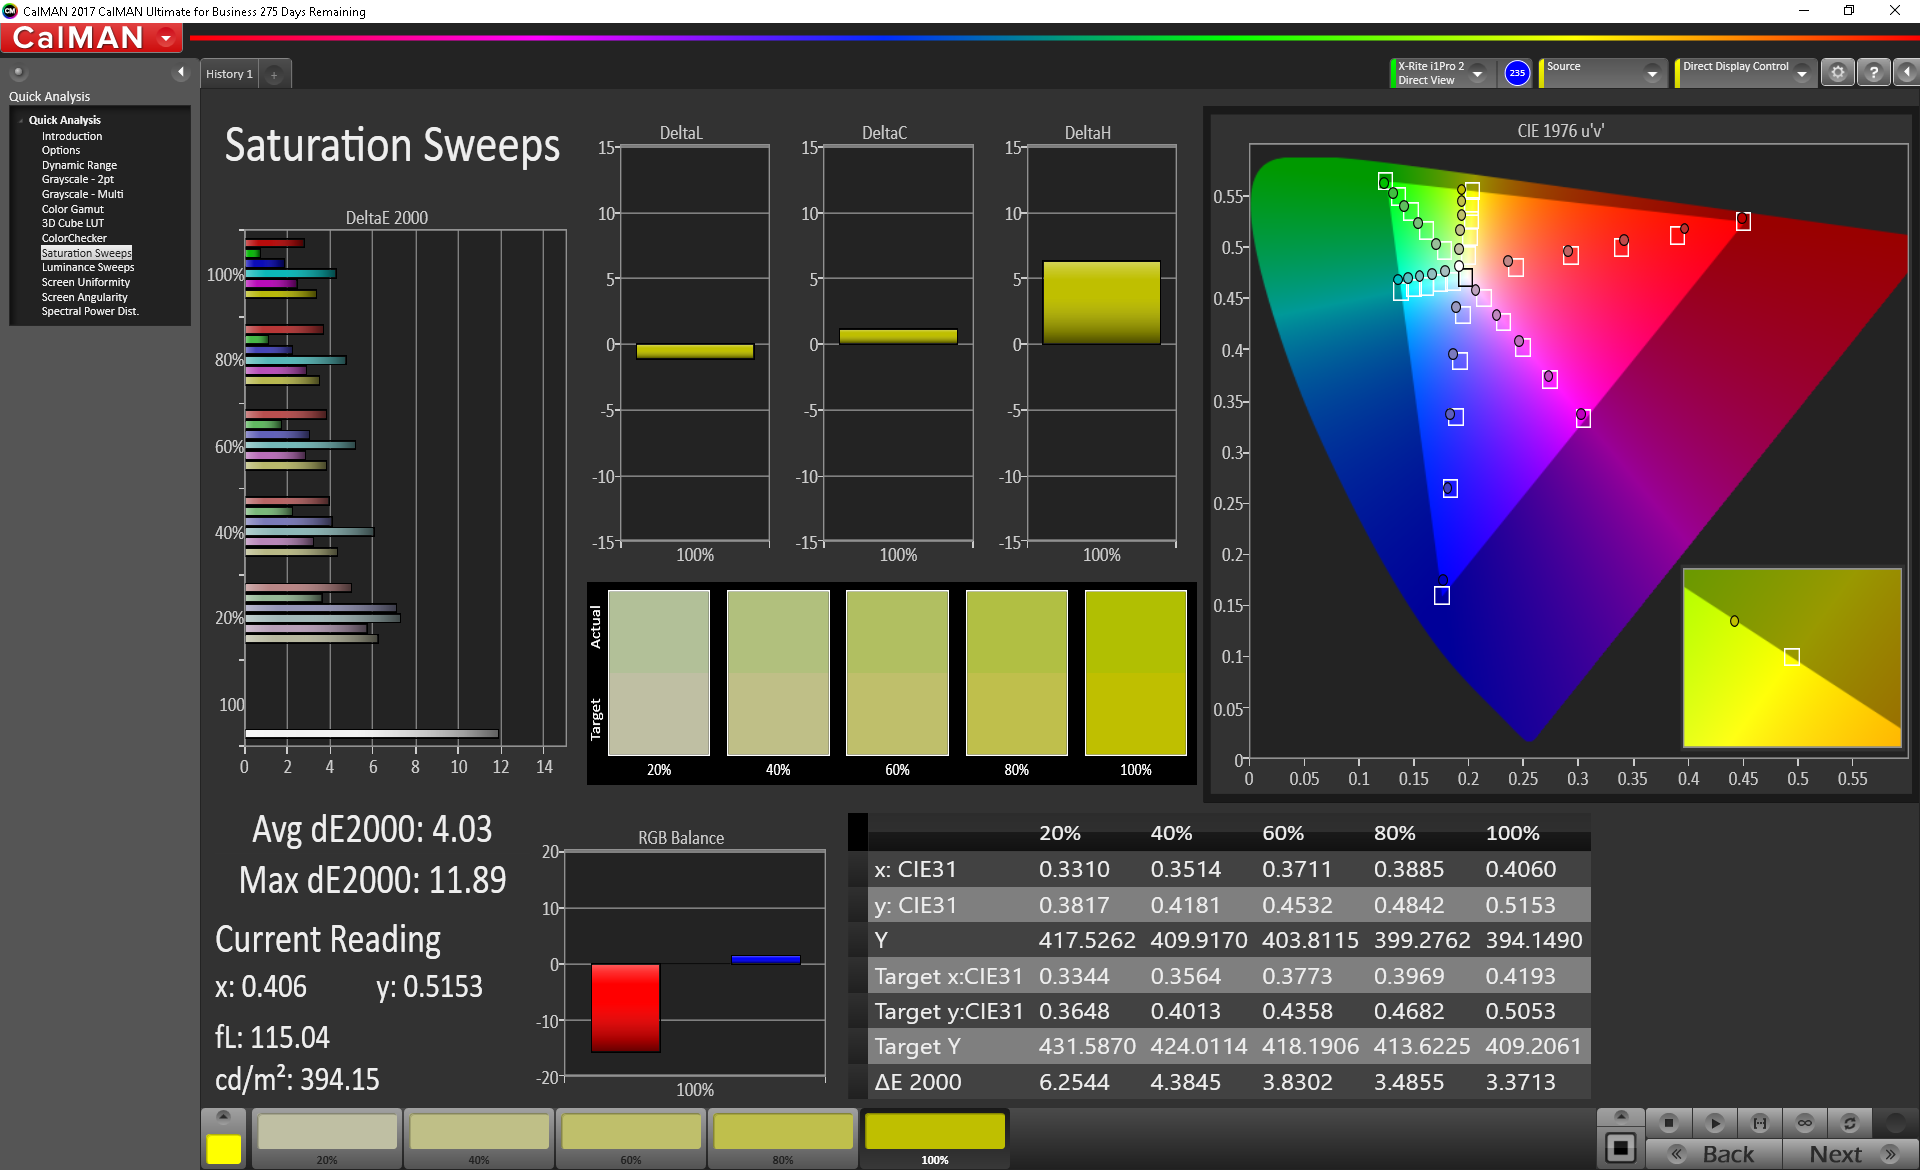
Color accuracy is average out of the box. DeltaE2000 scores for colors and grays sit at 4.8 and 7.6, respectively. (Generally, a DeltaE2000 score of 3 or lower is considered acceptable for professional work.) The screen is particularly weak in shades of black and gray, possibly due to the filmy look caused by the resistive layer.
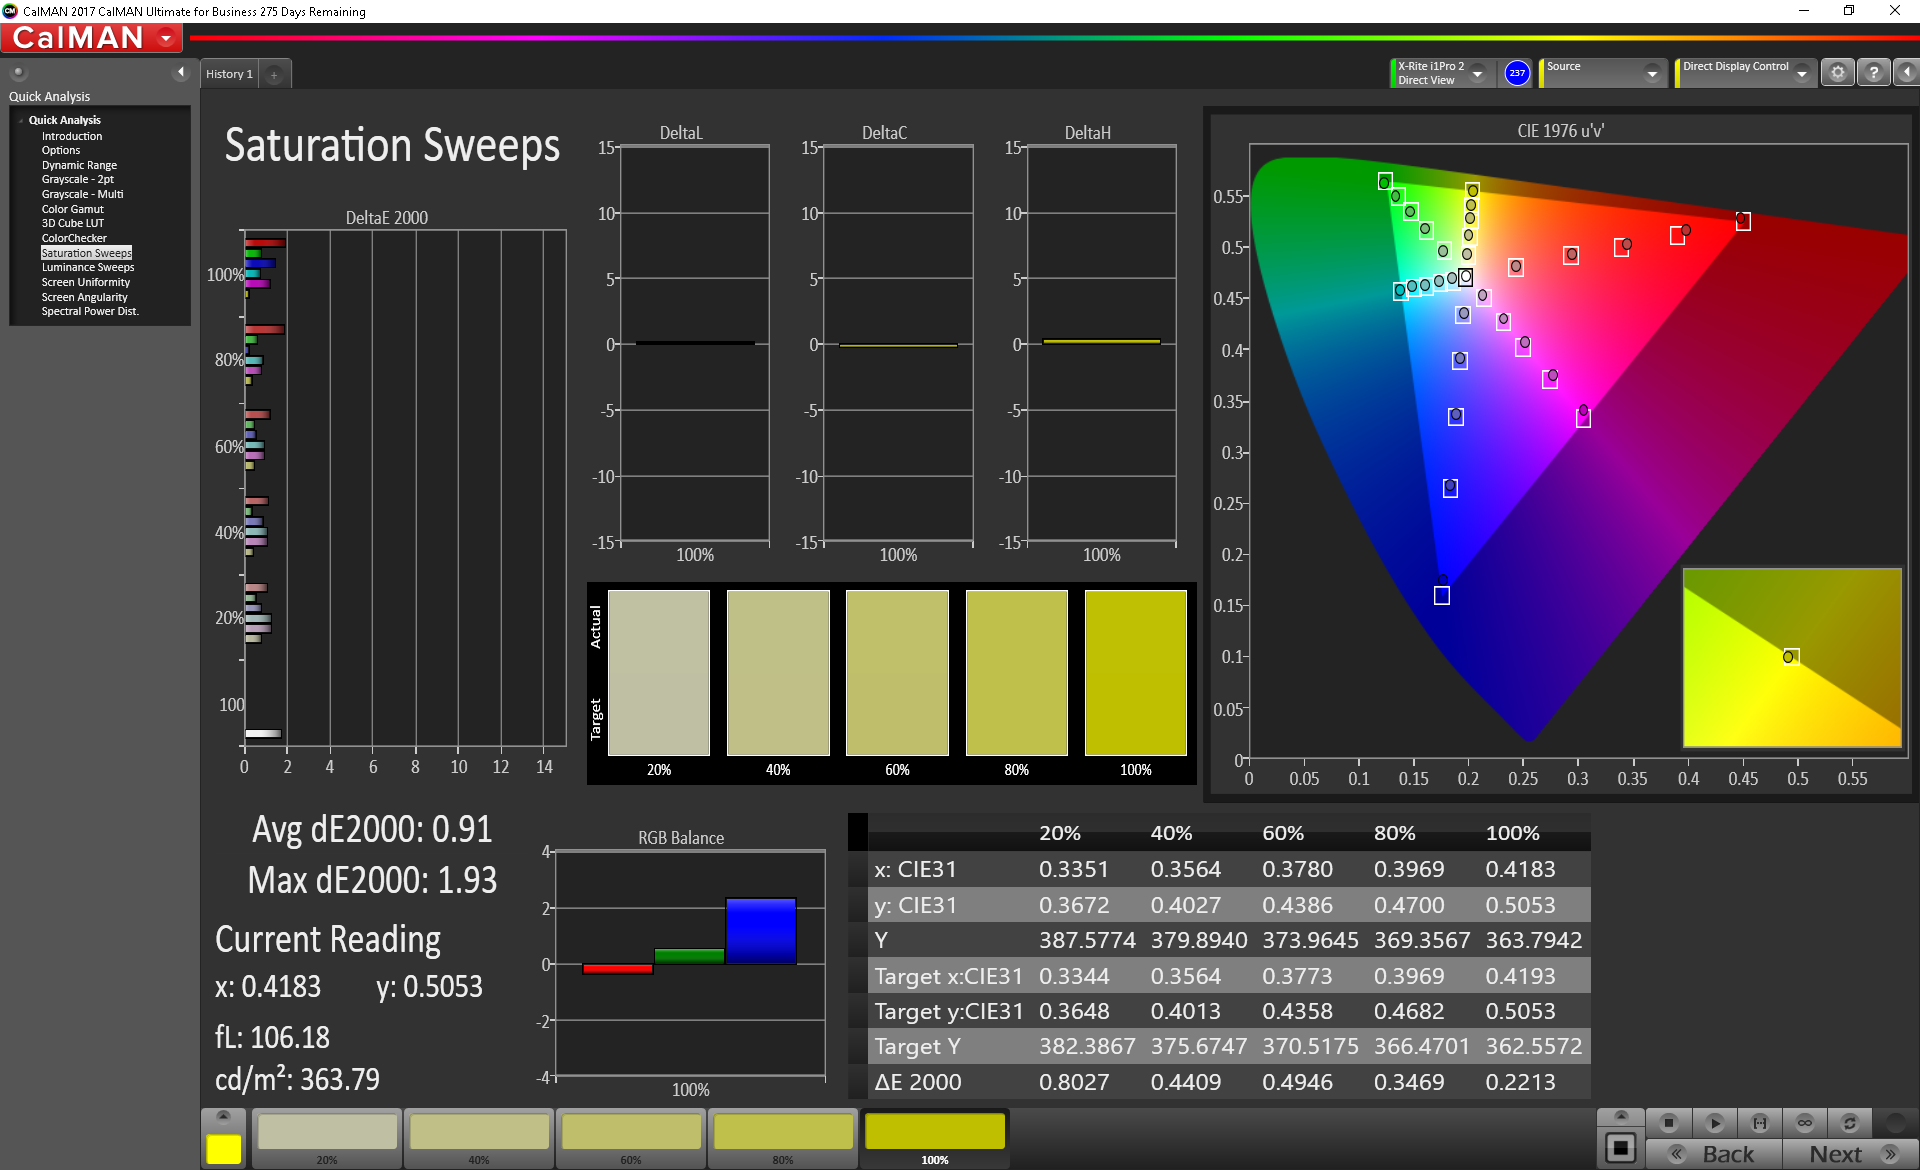
There is a silver lining to this gray cloud. With calibration, the Latitude 7424 Rugged Extreme's screen is excellent. DeltaE2000 scores drop to 1.15 and 1.4 for colors and grays, respectively. Color variance becomes very tight as well. Despite the excellent color accuracy, we would not recommend the laptop for outdoor photographers or videographers as the screen overall looks dull.


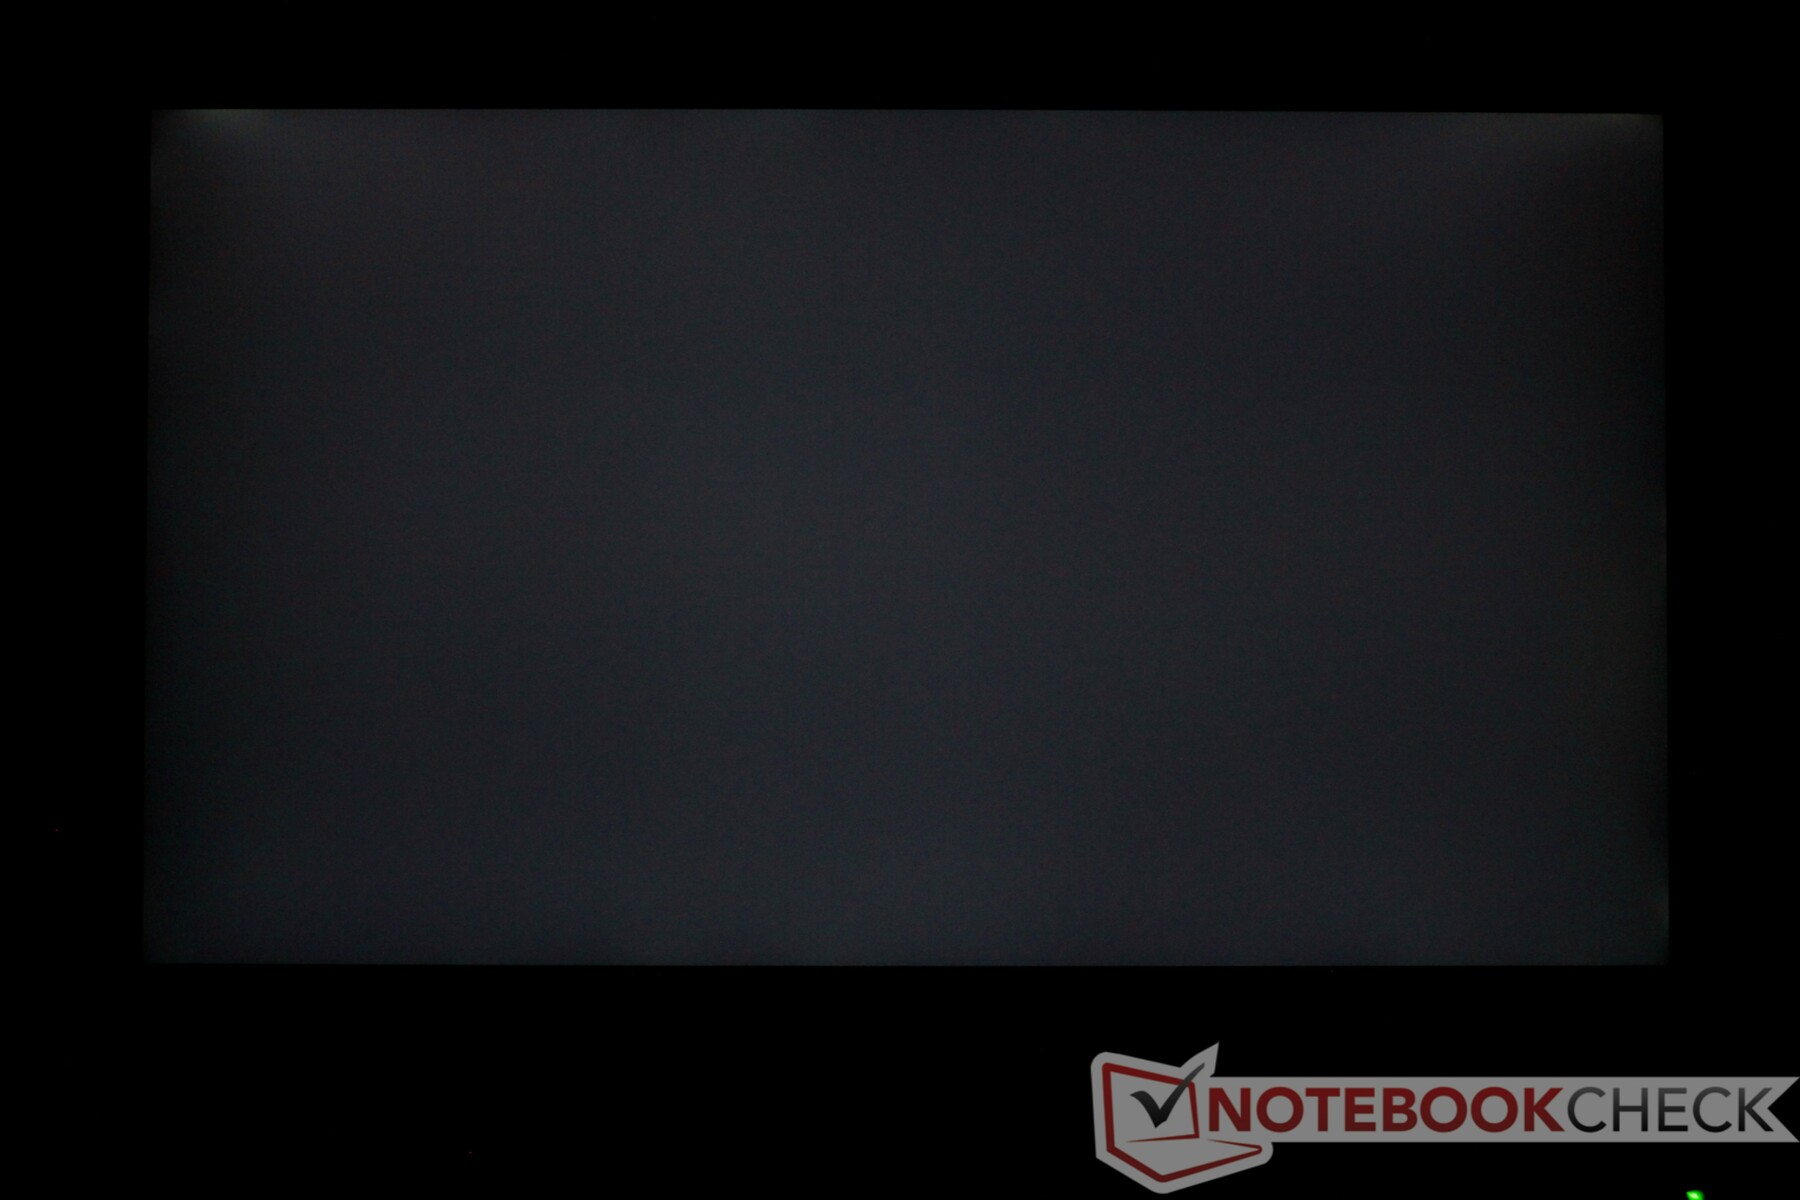
Due to its bright backlight, the Latitude 7424 Rugged Extreme can be used in any lighting condition. Even under direct sunlight, text and images remain perfectly clear. The strong backlight does not show much bleed. The backlight peeks out from the upper corners, but only in small areas. This is not distracting in low-light environments.


Display Response Times
| ↔ Response Time Black to White | ||
|---|---|---|
| 40 ms ... rise ↗ and fall ↘ combined | ↗ 24.4 ms rise | 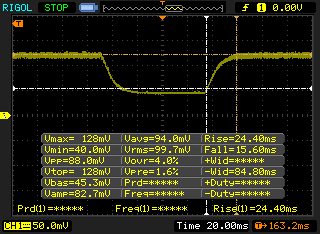 |
| ↘ 15.6 ms fall | ||
| The screen shows slow response rates in our tests and will be unsatisfactory for gamers. In comparison, all tested devices range from 0.1 (minimum) to 240 (maximum) ms. » 97 % of all devices are better. This means that the measured response time is worse than the average of all tested devices (21.5 ms). | ||
| ↔ Response Time 50% Grey to 80% Grey | ||
| 62.8 ms ... rise ↗ and fall ↘ combined | ↗ 35.6 ms rise | 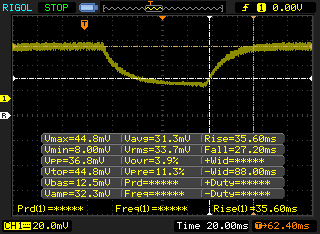 |
| ↘ 27.2 ms fall | ||
| The screen shows slow response rates in our tests and will be unsatisfactory for gamers. In comparison, all tested devices range from 0.2 (minimum) to 636 (maximum) ms. » 97 % of all devices are better. This means that the measured response time is worse than the average of all tested devices (33.8 ms). | ||
Screen Flickering / PWM (Pulse-Width Modulation)
| Screen flickering / PWM detected | 763 Hz | 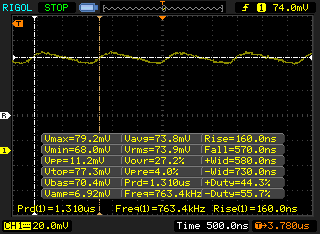 | |
The display backlight flickers at 763 Hz (worst case, e.g., utilizing PWM) . The frequency of 763 Hz is quite high, so most users sensitive to PWM should not notice any flickering. In comparison: 53 % of all tested devices do not use PWM to dim the display. If PWM was detected, an average of 17933 (minimum: 5 - maximum: 3846000) Hz was measured. | |||
Viewing angles are typical for an IPS display. We do notice a slight red shift when the display is viewed off-axis horizontally. This shift is noticeable at brightness settings of 30% and higher and may be distracting to some.

Performance
We recently saw the Core i7-8650U in the Latitude 5420 Rugged, and it performed well alongside the AMD Radeon RX 540. The Latitude 7424 Rugged Extreme's performance is largely similar, but a few shortcomings hinder the machine when compared to its little brother.


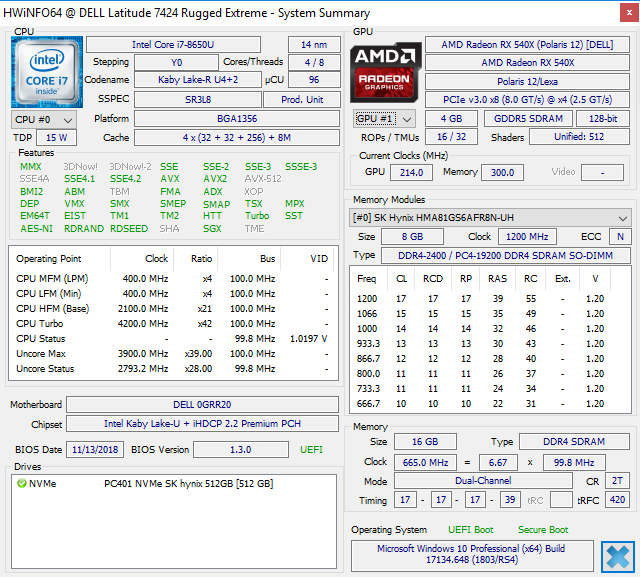
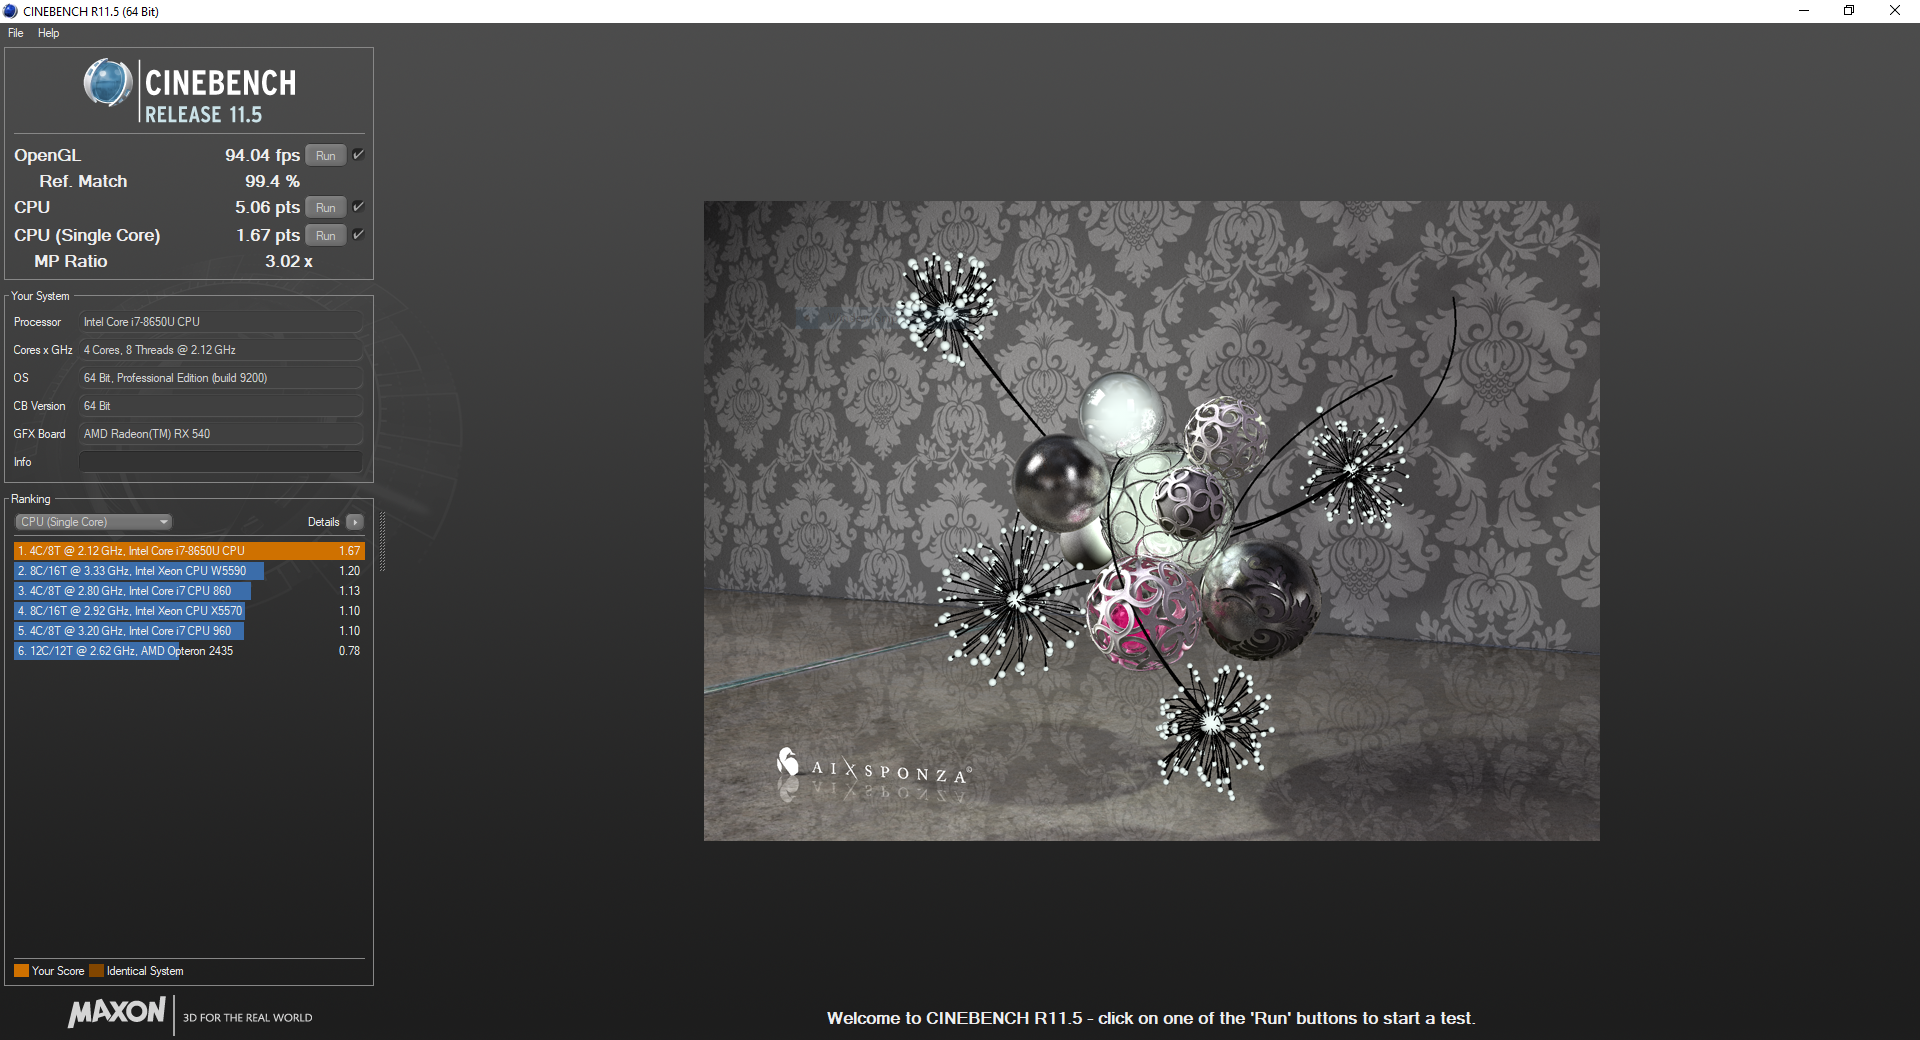
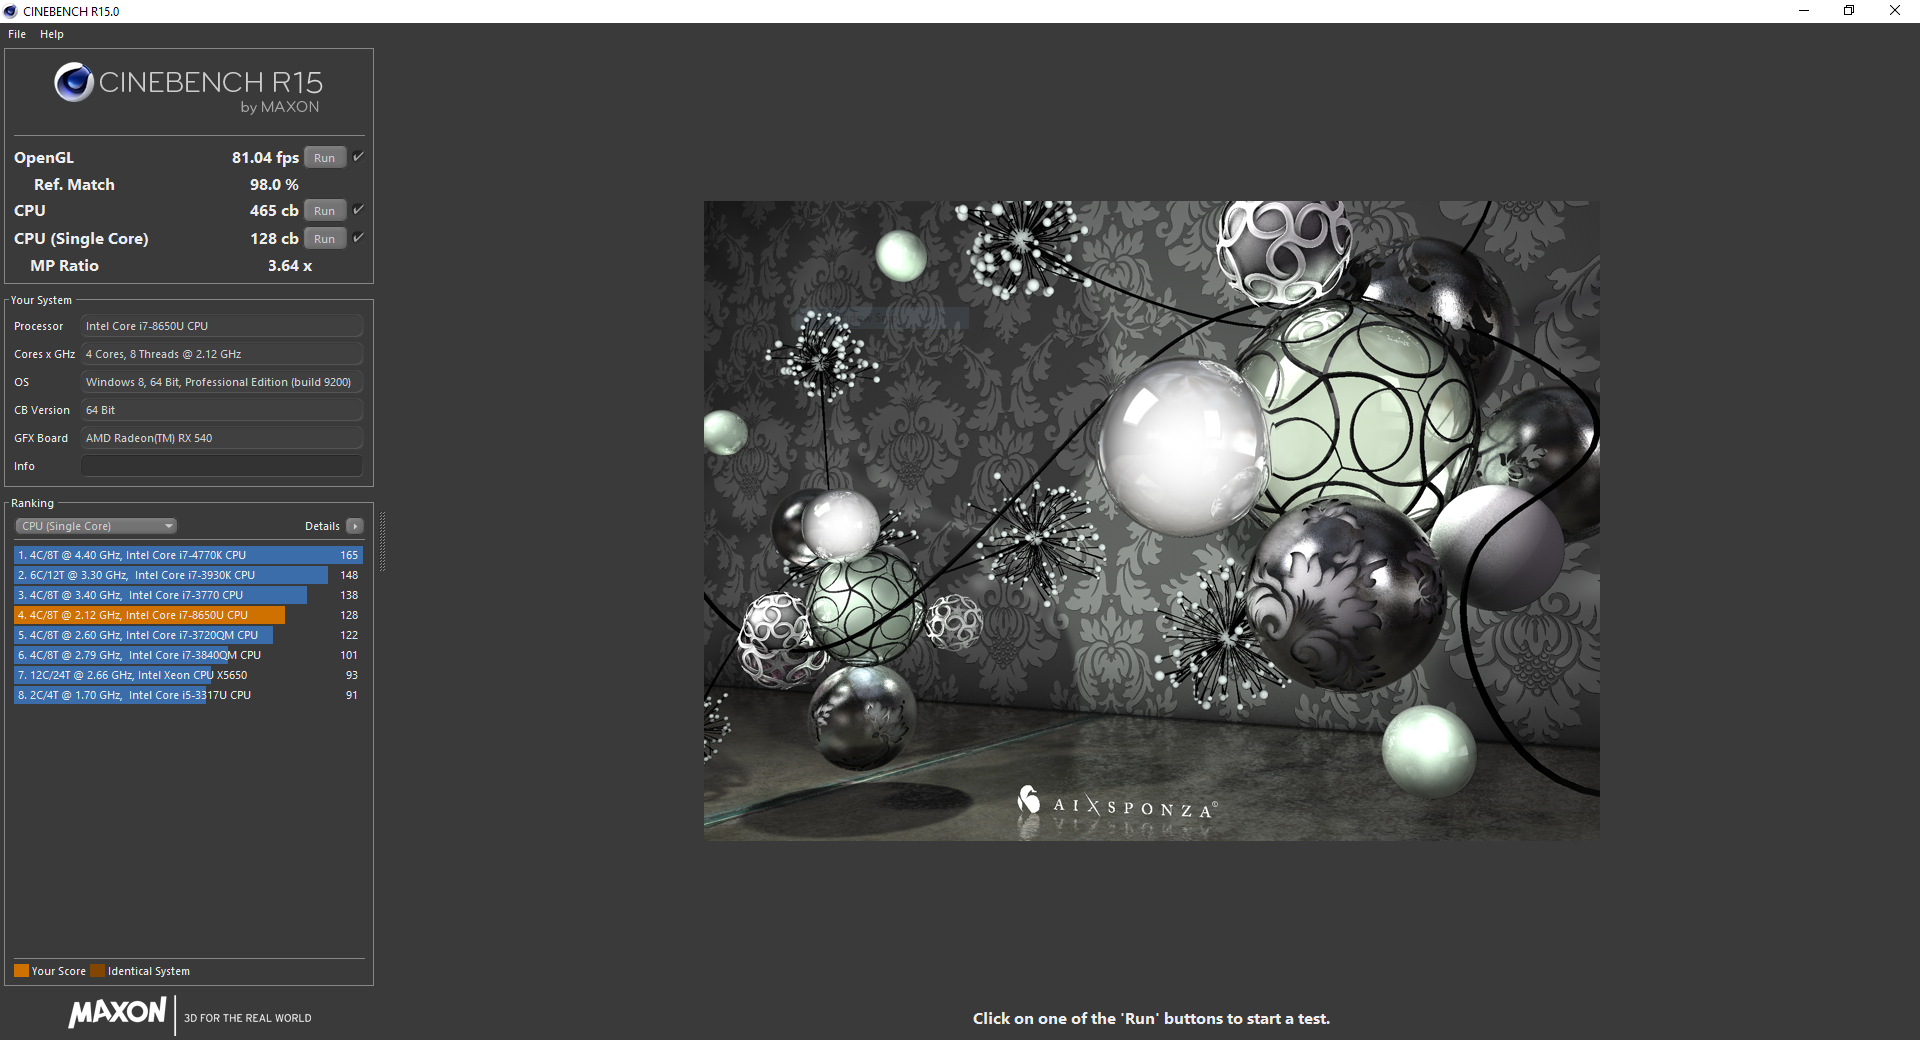
Processor
The Intel Core i7-8650U brings a quad-core architecture to Intel's ULV platform. The performance bump between Intel's 7th generation dual-core chips and its 8th generation CPUs is incredible. Sadly, the Latitude 7424 Rugged Extreme is not the best picture of this performance increase. The machine falls about 20% below the average Cinebench R15 multi-core score. Performance is decent, but there is definite room for improvement.
Long-term CPU performance is fairly stable. A quick note: we encountered hurdles running our Cinebench R15 loop test at the beginning of the review period; the benchmark would fail after a few runs and crash our loop script. An update from Dell received during our review seems to have resolved these issues. The loop now runs without incident, even after multiple passes.
| wPrime 2.10 - 1024m | |
| Acer Swift 3 SF313-51-59SZ | |
| Average Intel Core i7-8650U (268 - 335, n=3) | |
* ... smaller is better
System Performance
Overall system performance is good. The NVMe PCIe drive is very quick and can cut through a workflow without much trouble. The AMD Radeon RX 540 dGPU helps with graphical loads and is a nice boost over the integrated Intel UHD Graphics 620 GPU. The Latitude 7424 Rugged Extreme bests its competitors in most of PCMark 10's productivity tests, making it a formidable workhorse.
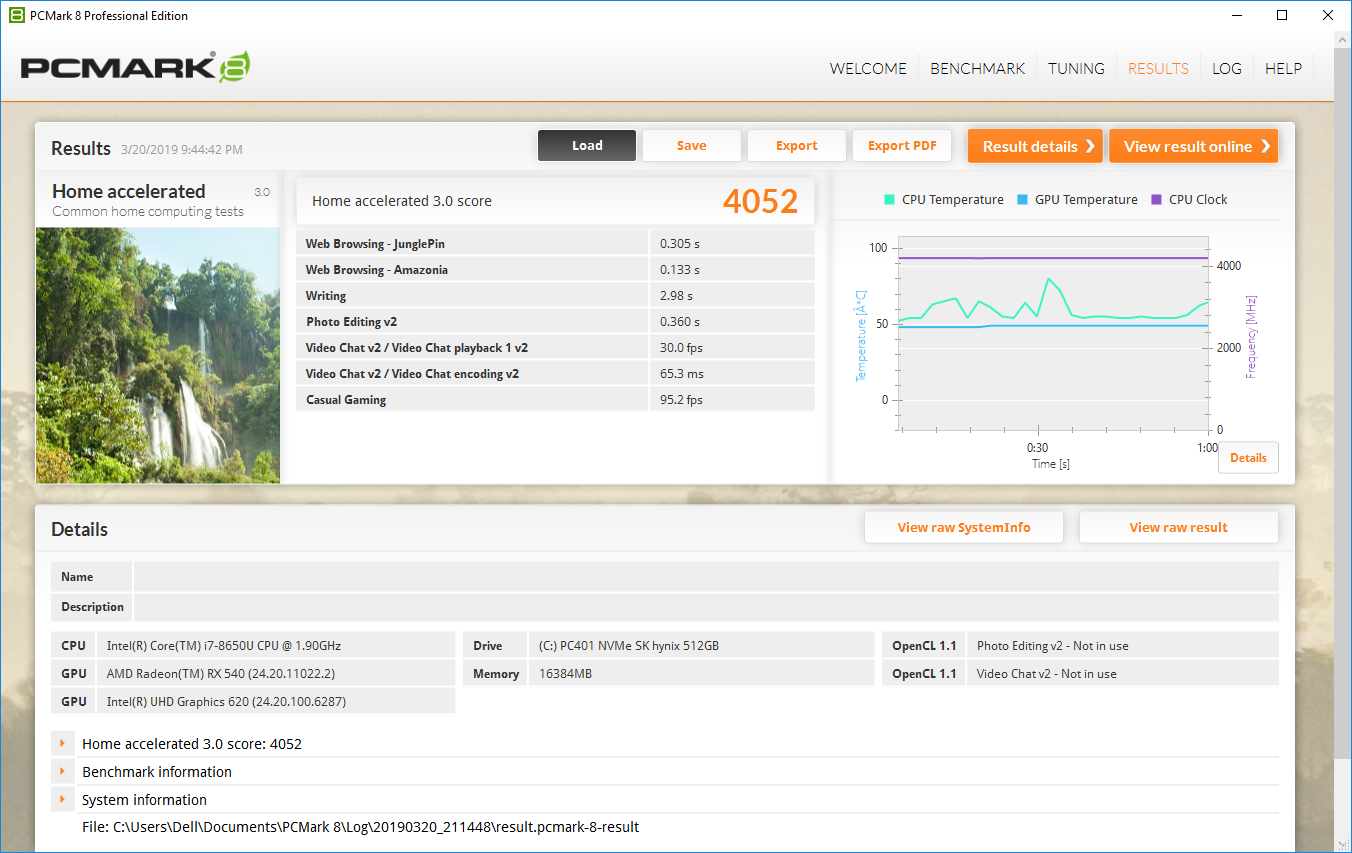

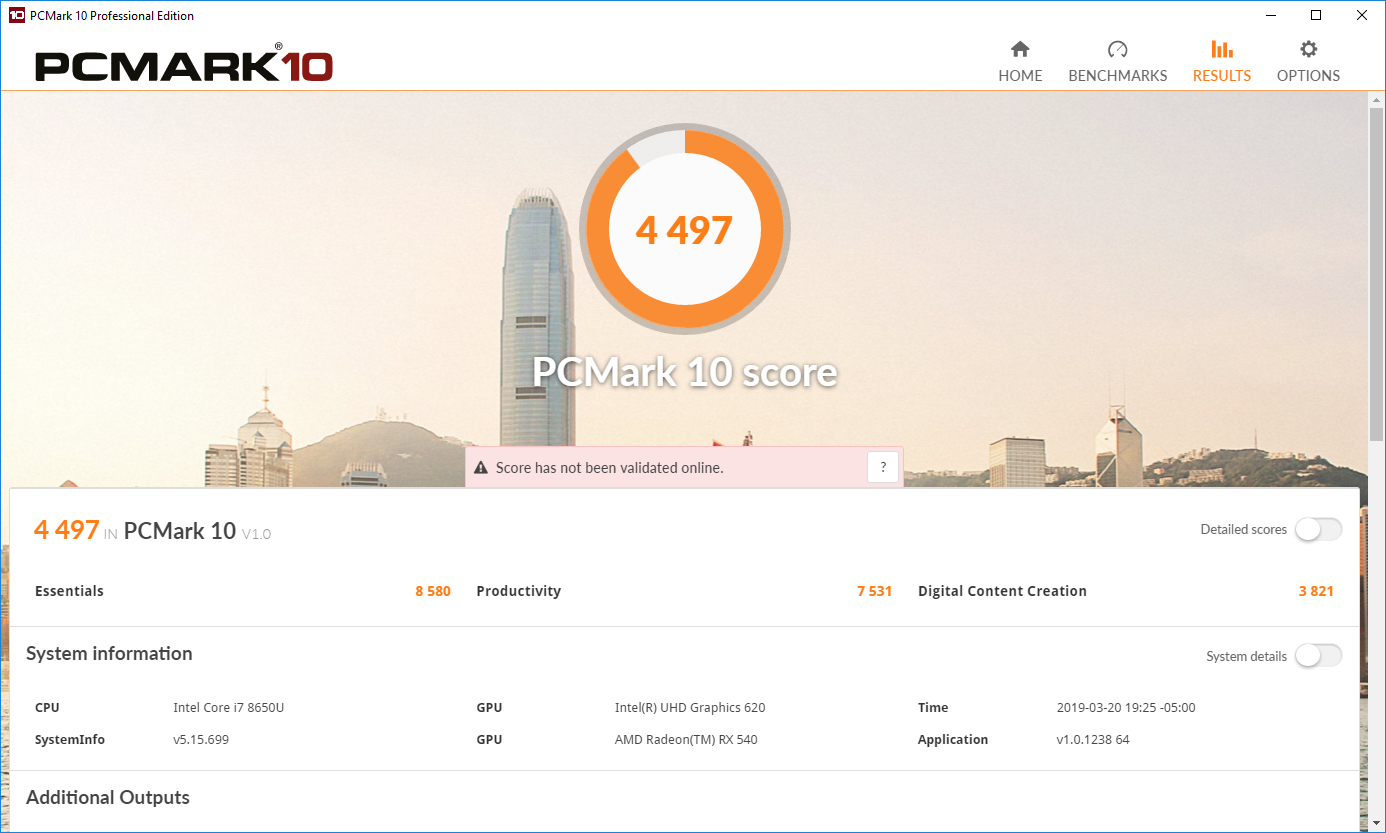
| PCMark 8 Home Score Accelerated v2 | 4052 points | |
| PCMark 8 Work Score Accelerated v2 | 5231 points | |
| PCMark 10 Score | 4497 points | |
Help | ||
Storage Devices
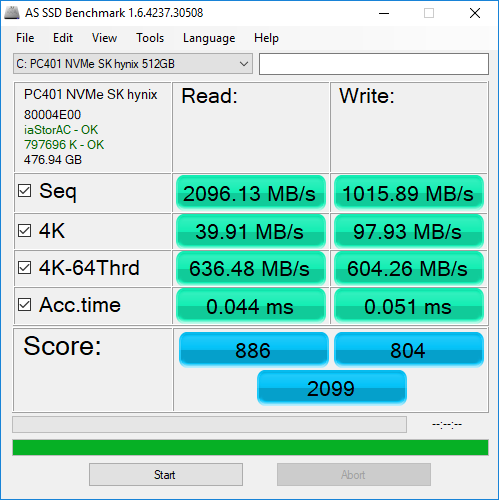
The 512 GB PCIe SSD offer quick read speeds but somewhat disappointing write speeds. Still, the drive is more than fast enough for almost any workflow. The drive can also be changed out easily by pulling the removable sled on the right side of the machine.
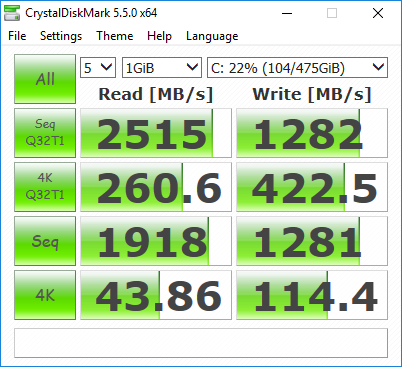
| Dell Latitude 7424 Rugged Extreme SK Hynix PC401 512GB M.2 (HFS512GD9TNG) | Getac S410 CUKUSA 1 TB SATA SSD Q0526A | Panasonic Toughbook CF-54G2999VM Seagate BarraCuda Compute 1TB ST1000LM048 | Panasonic Toughbook CF-XZ6 Samsung SSD PM871a MZNLN256HMHQ | Dell Latitude 5420 Rugged-P85G SK hynix PC401 NVMe 500 GB | Lenovo ThinkPad T480-20L50010US Samsung SSD PM981 MZVLB512HAJQ | Lenovo ThinkPad P52 20MAS03N00 Samsung SSD PM981 MZVLB512HAJQ | Average SK Hynix PC401 512GB M.2 (HFS512GD9TNG) | |
|---|---|---|---|---|---|---|---|---|
| CrystalDiskMark 5.2 / 6 | -51% | -97% | -41% | -18% | -9% | 10% | 19% | |
| Write 4K | 114.4 | 74 -35% | 1.145 -99% | 97.7 -15% | 98.8 -14% | 123.2 8% | 108.5 -5% | 143.3 ? 25% |
| Read 4K | 43.86 | 31.85 -27% | 0.453 -99% | 34.76 -21% | 38.51 -12% | 44.43 1% | 42.78 -2% | 45.3 ? 3% |
| Write Seq | 1281 | 460.6 -64% | 52.2 -96% | 479.4 -63% | 843 -34% | 845 -34% | 1645 28% | 1514 ? 18% |
| Read Seq | 1918 | 514 -73% | 122.7 -94% | 507 -74% | 1282 -33% | 865 -55% | 1485 -23% | 1758 ? -8% |
| Write 4K Q32T1 | 422.5 | 211.4 -50% | 2.428 -99% | 273.5 -35% | 355.5 -16% | 287.3 -32% | 269.2 -36% | 425 ? 1% |
| Read 4K Q32T1 | 260.6 | 203.5 -22% | 1.063 -100% | 296.3 14% | 241.4 -7% | 360.9 38% | 348.7 34% | 459 ? 76% |
| Write Seq Q32T1 | 1282 | 523 -59% | 73.7 -94% | 524 -59% | 893 -30% | 1718 34% | 1877 46% | 1531 ? 19% |
| Read Seq Q32T1 | 2515 | 554 -78% | 120.4 -95% | 554 -78% | 2478 -1% | 1779 -29% | 3419 36% | 2895 ? 15% |
| Write 4K Q8T8 | 1523 | 918 ? | ||||||
| Read 4K Q8T8 | 1614 | 819 ? |

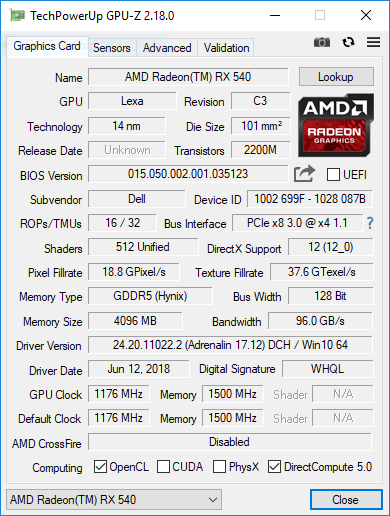
GPU Performance
The Radeon RX 540 GPU is essentially AMD's answer to Nvidia's MX150, which itself is an entry-level graphics card designed to give office-grade and consumer laptops a bit more graphical oomph. The RX 540 edges out the MX150 in most benchmarks and should be good enough for light photo and video editing. There is a significant drop in graphical performance when the Latitude 7424 is on battery power, so users will need to lug the power adapter along for graphical work away from the desk.


| 3DMark 11 Performance | 5273 points | |
| 3DMark Cloud Gate Standard Score | 13804 points | |
| 3DMark Fire Strike Score | 3488 points | |
Help | ||
Gaming Performance
The AMD Radeon RX 540 is capable of running most modern games at 1366x768, Medium/High settings. Older titles can be pushed to FHD, but settings may need to be reduced. Lighter titles like Stardew Valley and Terraria present no problem and run well at maximum settings.
| The Witcher 3 - 1366x768 Medium Graphics & Postprocessing | |
| Average of class Workstation (73 - 430, n=26, last 2 years) | |
| Asus TUF FX505DY | |
| Dell Latitude 7424 Rugged Extreme | |
| Average AMD Radeon RX 540 (29.3 - 39, n=3) | |
| low | med. | high | ultra | |
| The Witcher 3 (2015) | 37 |
Emissions
System Noise
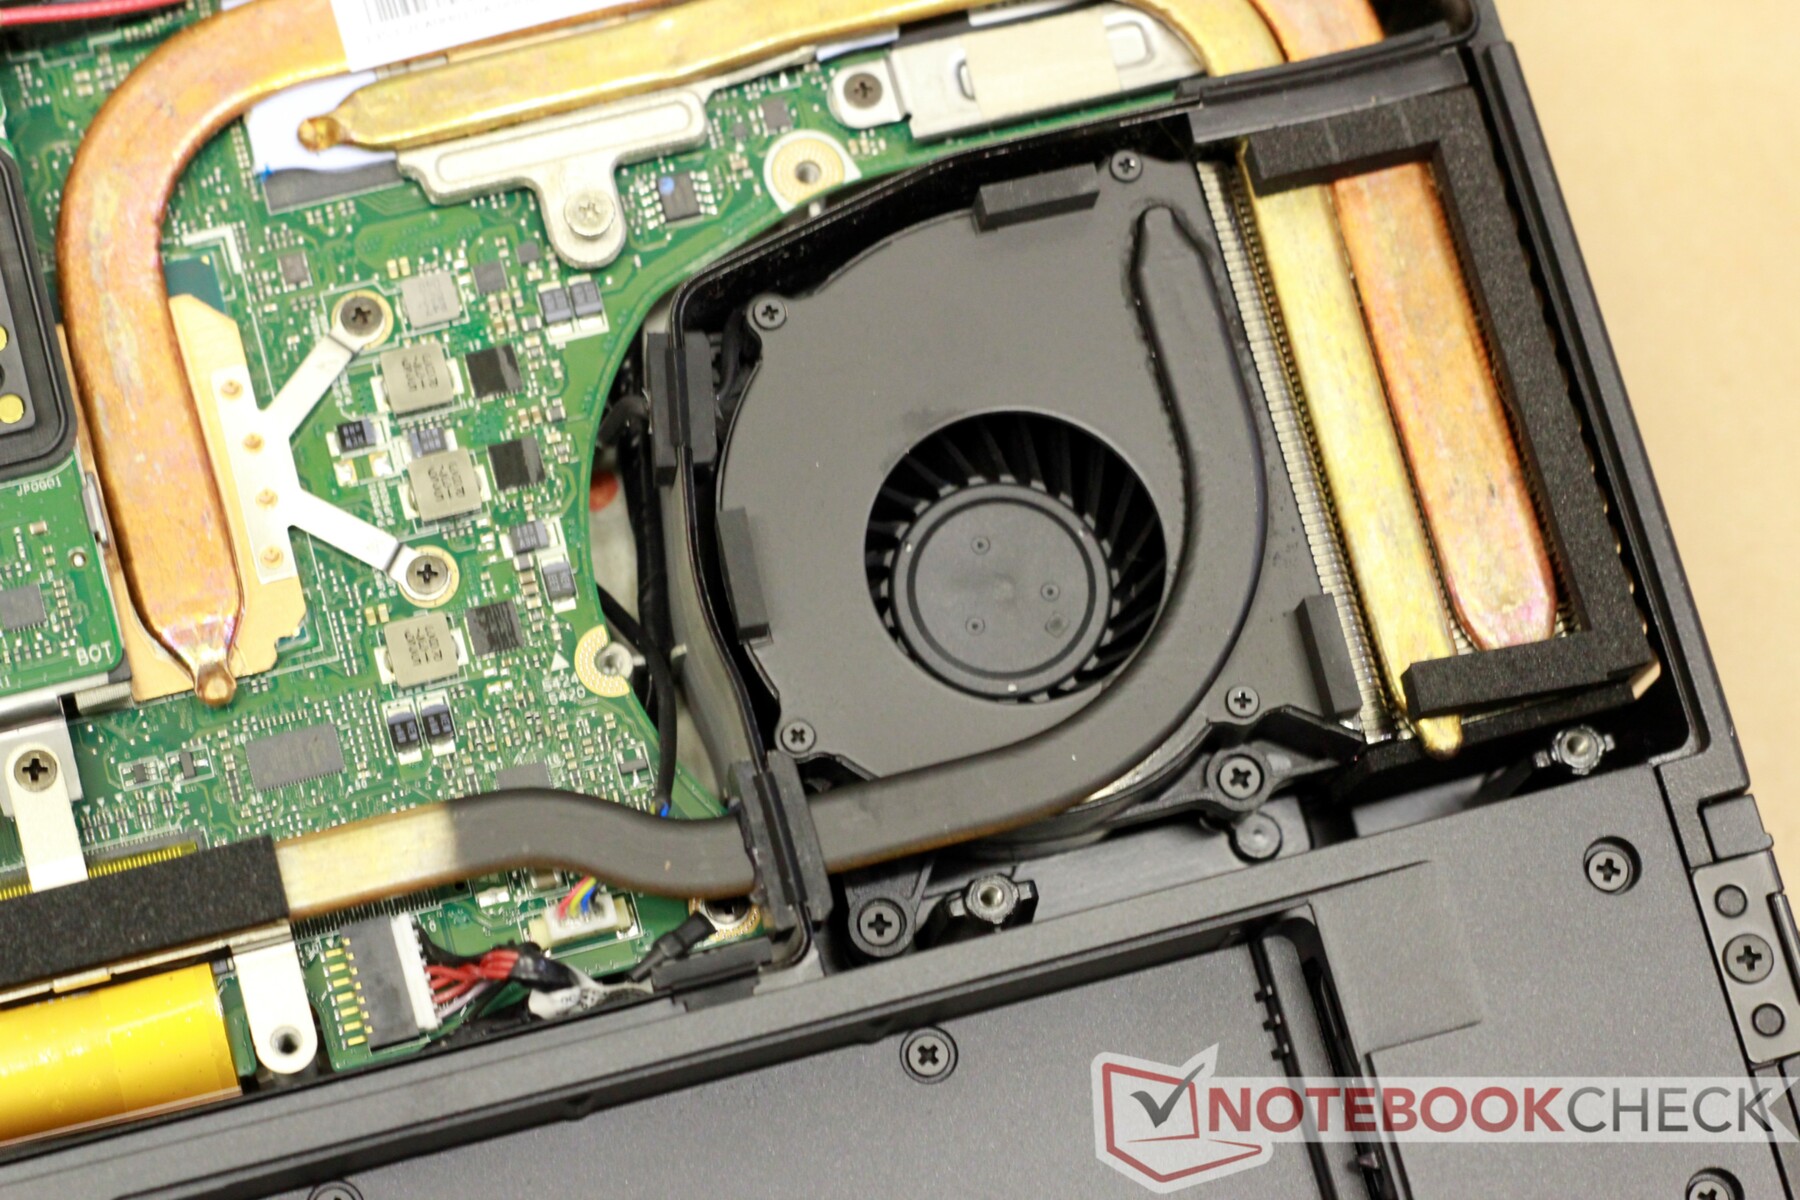
Fan noise is similar to that of the Latitude 5420 Rugged. When idle, the system is completely silent. There is no noticeable coil whine. Under load, the fan will ramp up to ~40 dB(A) for a second or two before falling back down to silent. It will occasionally spin up to 33 dB(A) but will fall silent again after a very brief time. The fan is not whiny due to its low pitch.
Noise Level
| Idle |
| 28.6 / 28.6 / 28.6 dB(A) |
| Load |
| 32.9 / 39 dB(A) |
 | ||
30 dB silent 40 dB(A) audible 50 dB(A) loud |
||
min: | ||
Temperature

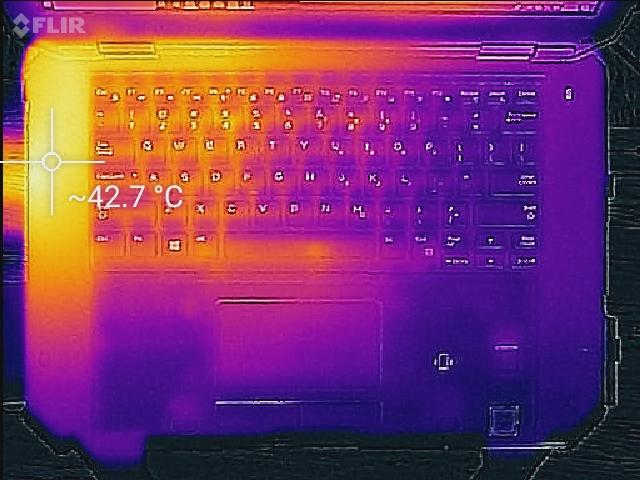
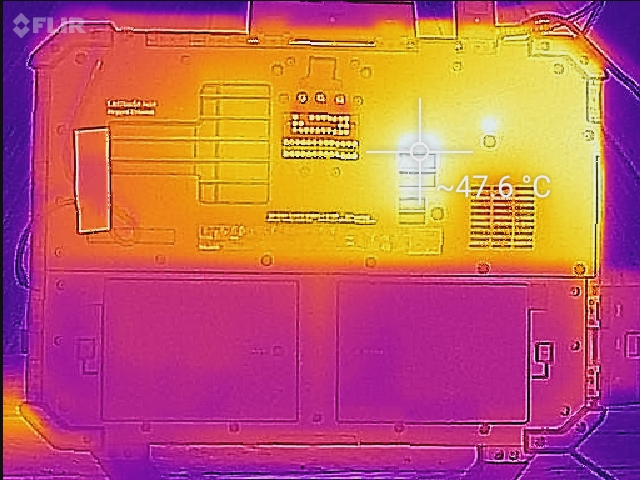
Heat is fairly well managed. Save for a few hot spots along the single side vent, the chassis remains relatively cool under load. The keyboard never grows uncomfortably warm save for the spot around the tilde (~) key. The bottom panel can get toasty along the vent, so caution should be exercised. It's unlikely users will hold the machine in their laps due to the sheer size and weight of the chassis, however.
Stress Test
The Latitude 7424 Rugged Extreme handles stress fairly well. Loading the CPU via Prime95 sees the 8650U sit near its base at 2.0 GHz. Temperatures stay below 60° C. Graphical stress pushes the machine more. The CPU spikes to 97° C during an hour-long run of FurMark. The GPU oscillates rapidly between 800 and 900 MHz, and its core temperature hovers around 76° C.
Under real-world stress, the Latitude 7424 fares much better. Over an hour-long gameplay session of The Witcher 3, the CPU freely boosts to about 4.0 GHz while the GPU boosts to 1050 MHz. Temperatures on both chips stay near 70° C.
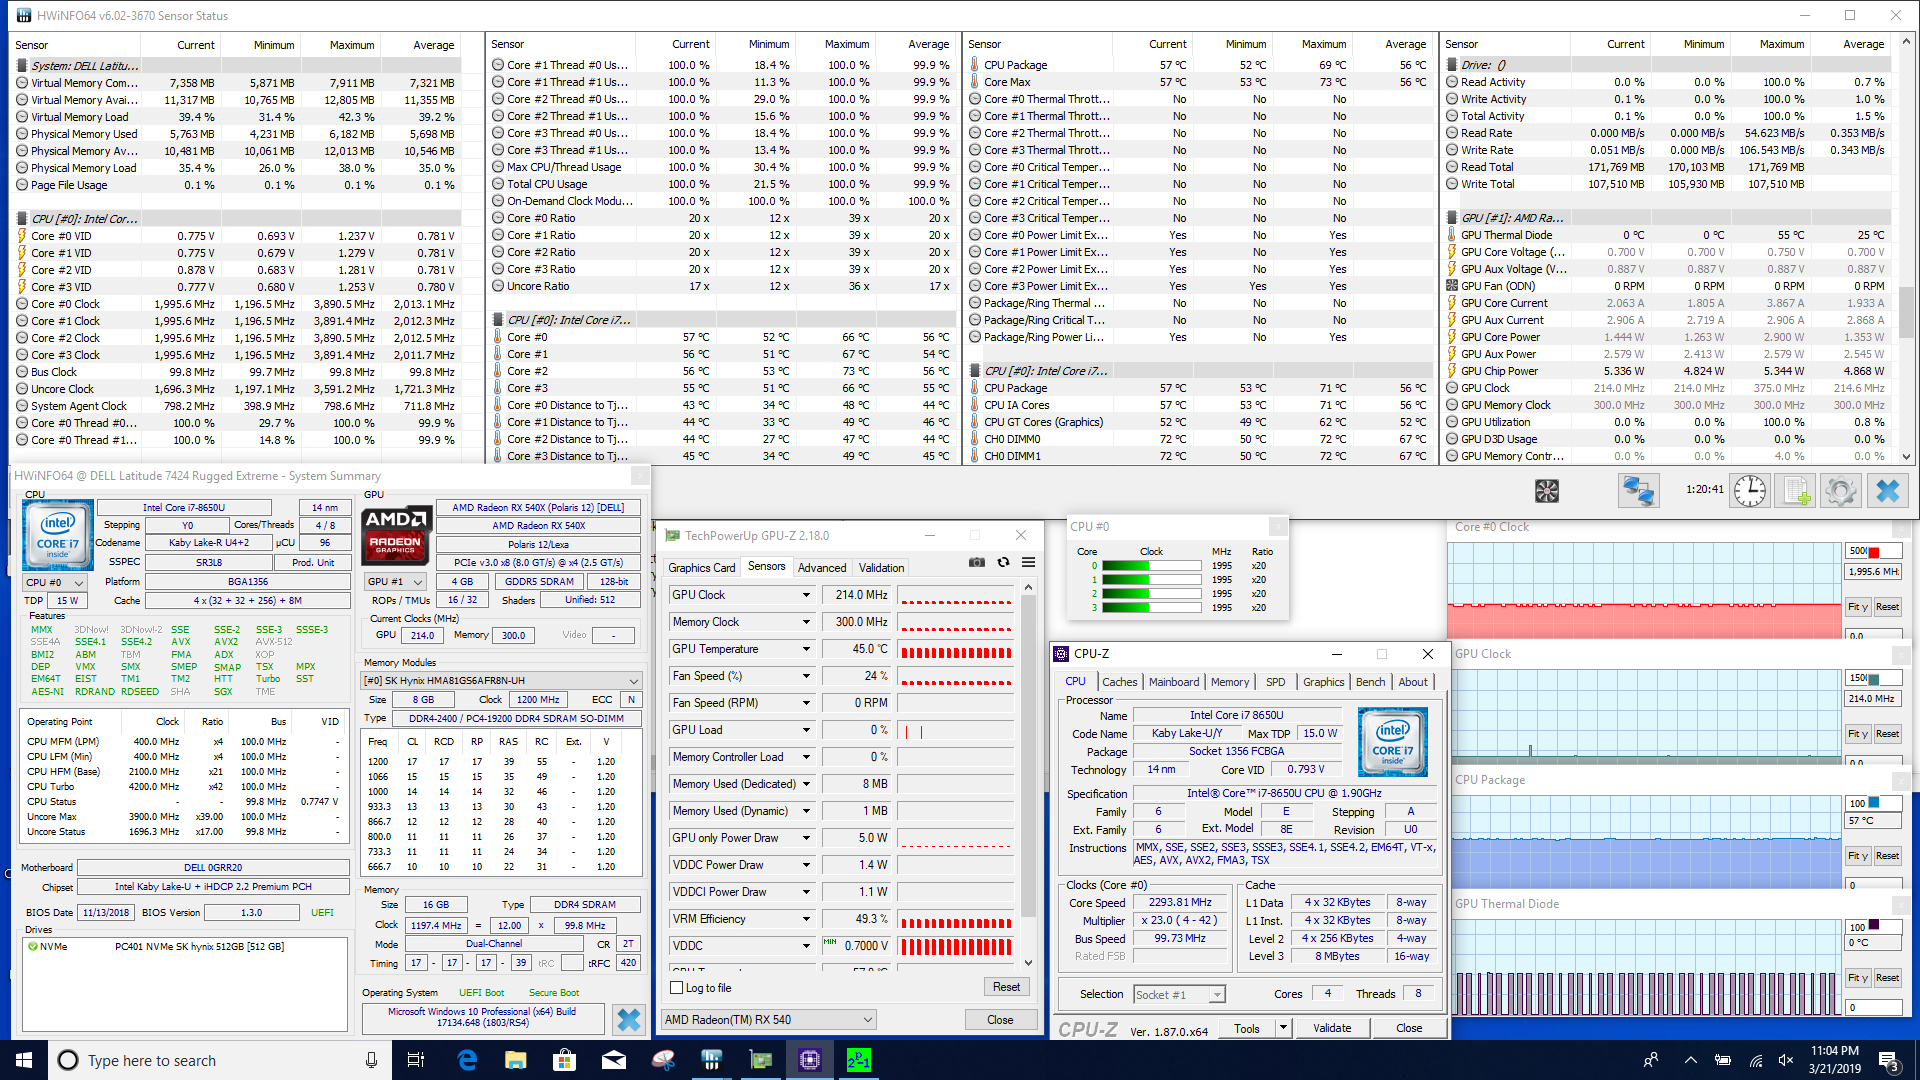
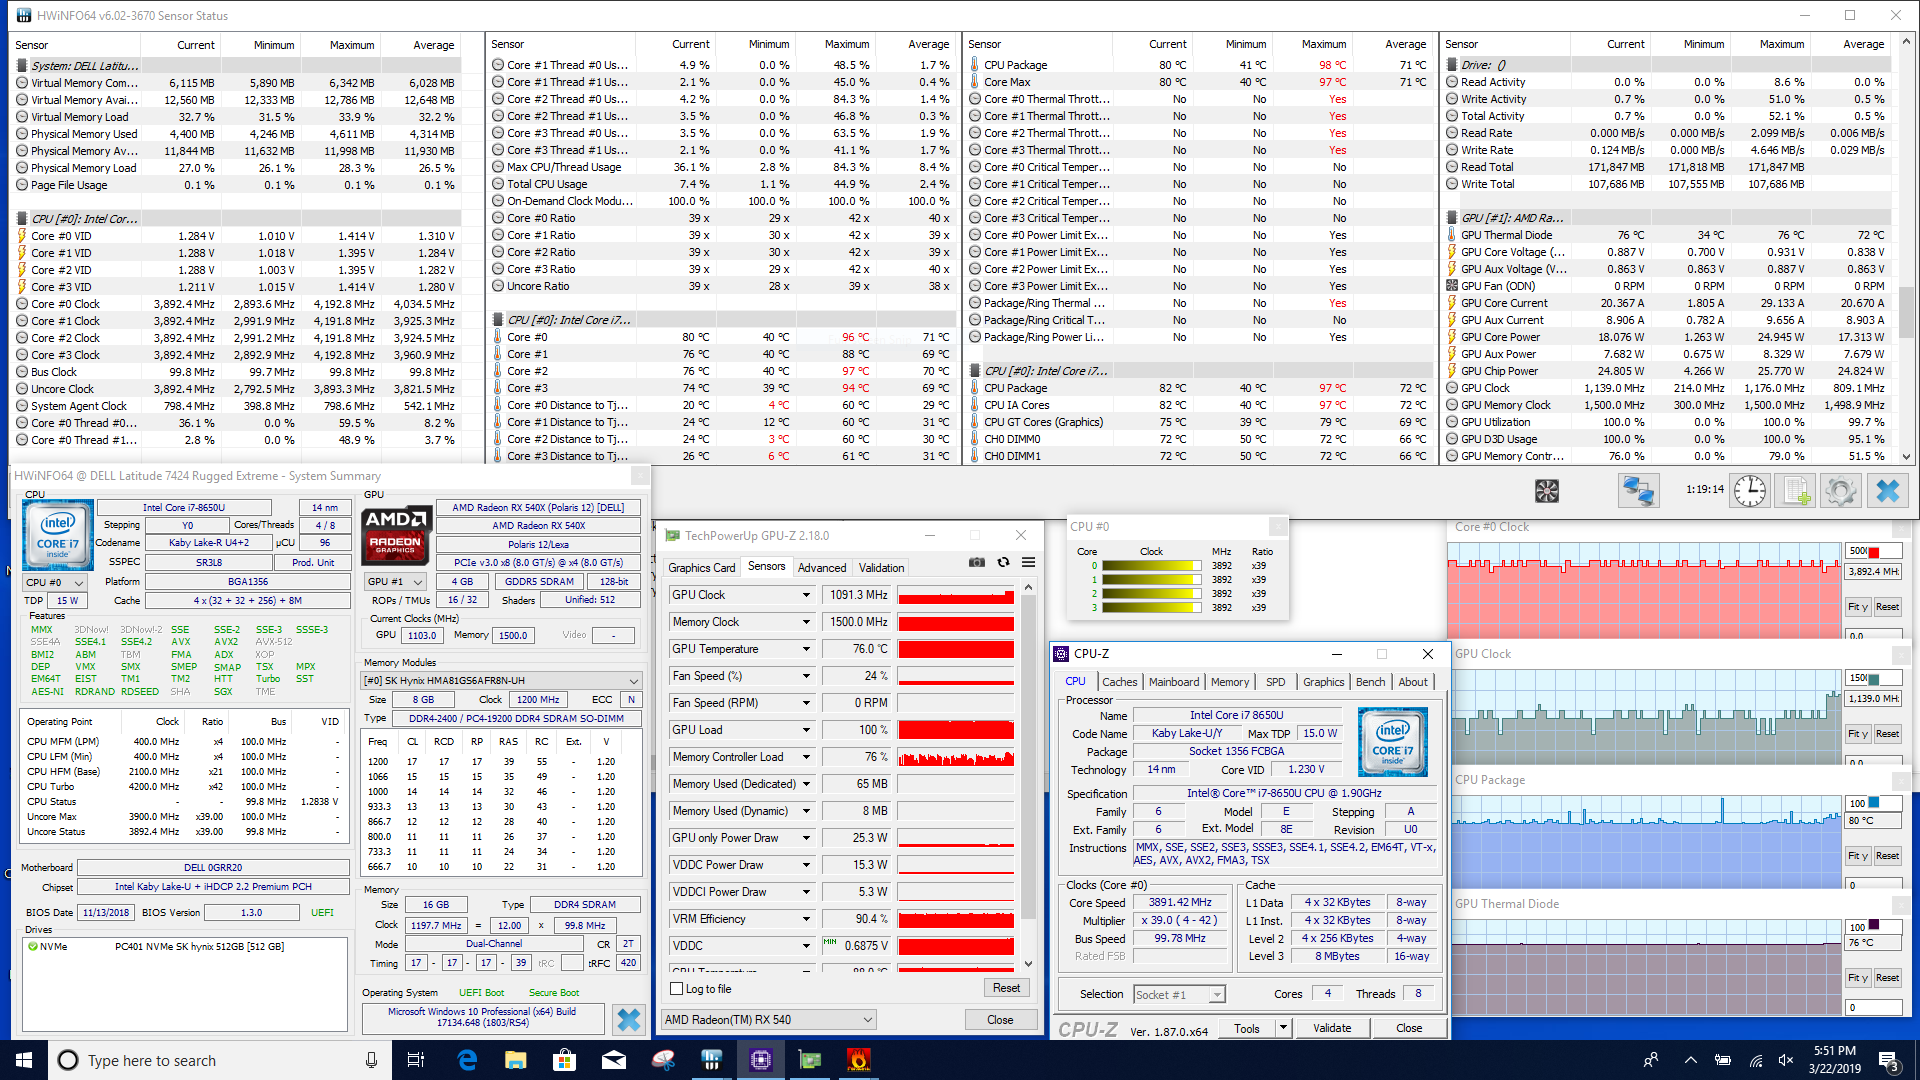
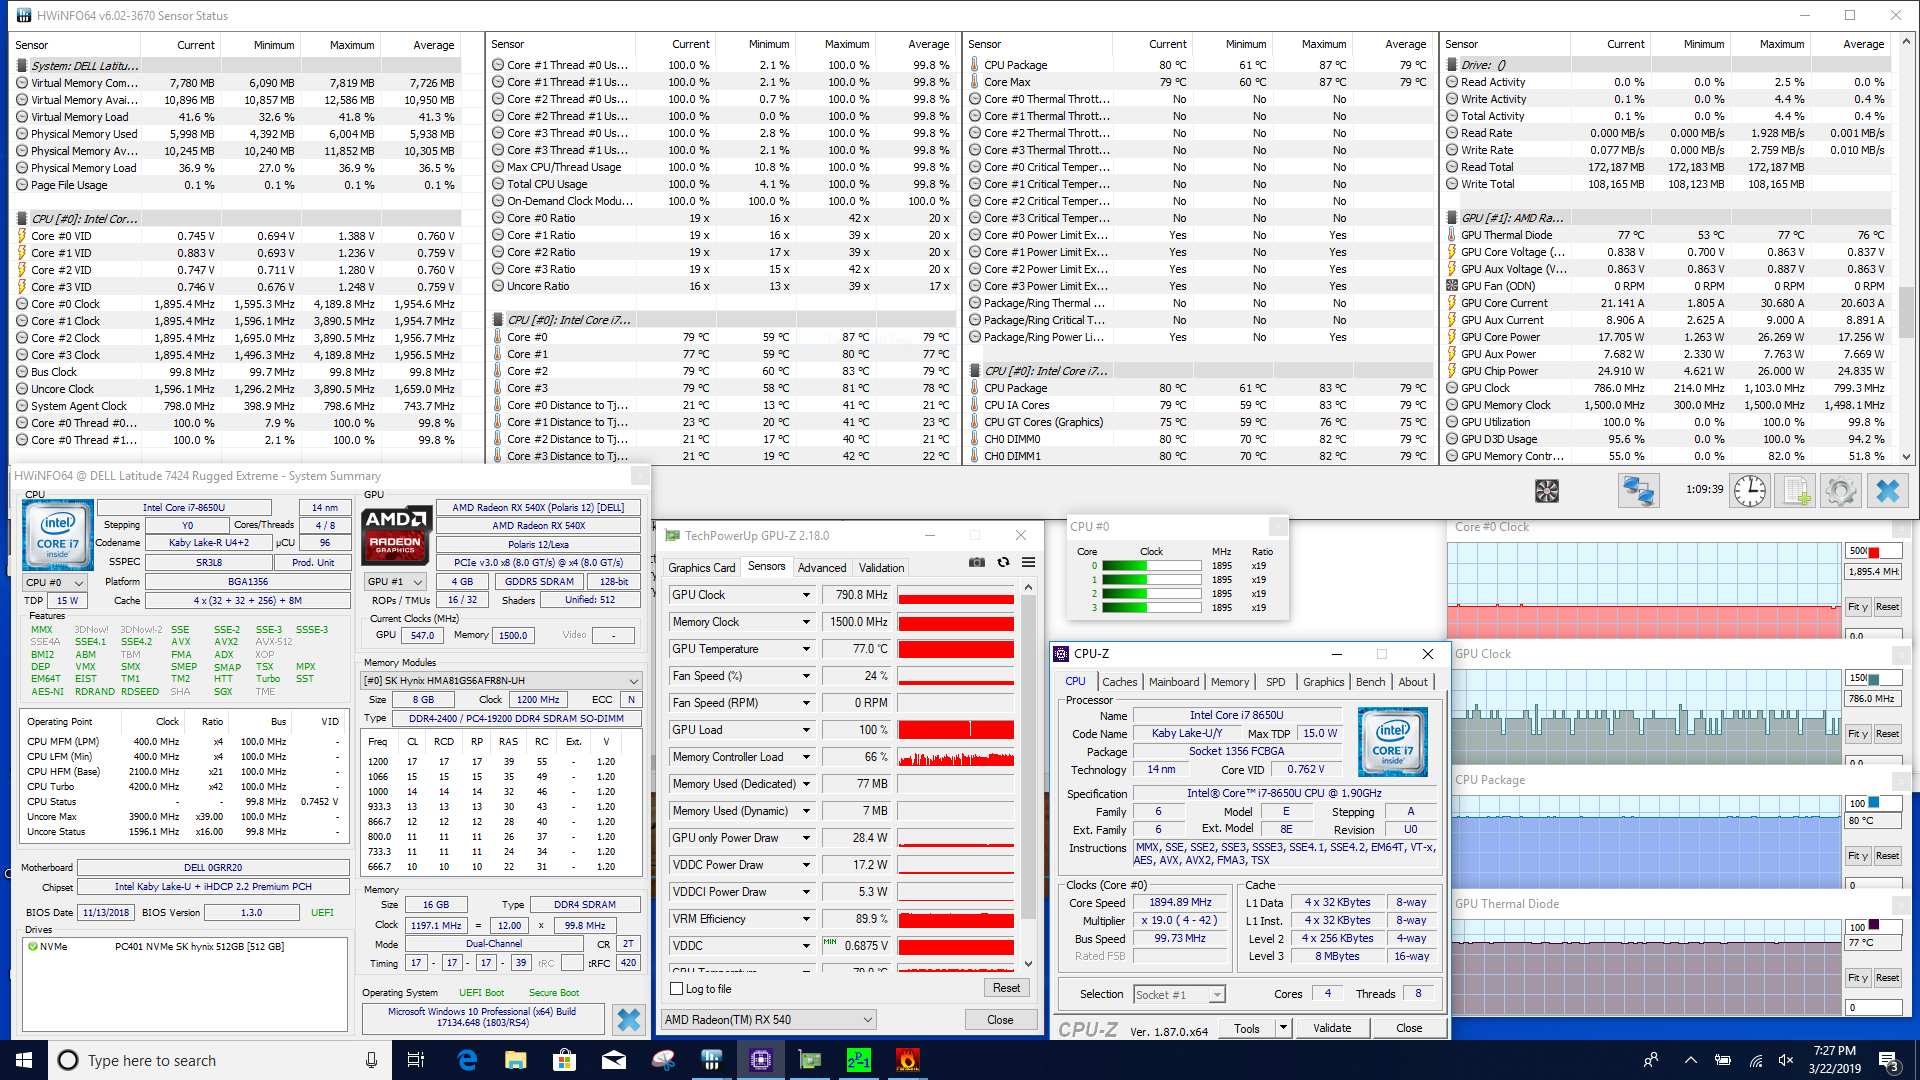

| CPU Clock (GHz) | GPU Clock (MHz) | Average CPU Temperature (°C) | Average GPU Temperature (°C) | |
| Prime95 Stress | 2.0 | - | 57 | - |
| FurMark Stress | 3.9-4.0 | 800-900 | 82 | 76 |
| Prime95 + FurMark Stress | 2.0 | 900 | 80 | 77 |
| Witcher 3 Stress | 3.9 | 1050 | 67 | 70 |
(±) The maximum temperature on the upper side is 41.6 °C / 107 F, compared to the average of 38.1 °C / 101 F, ranging from 22.2 to 69.8 °C for the class Workstation.
(-) The bottom heats up to a maximum of 47.6 °C / 118 F, compared to the average of 41.3 °C / 106 F
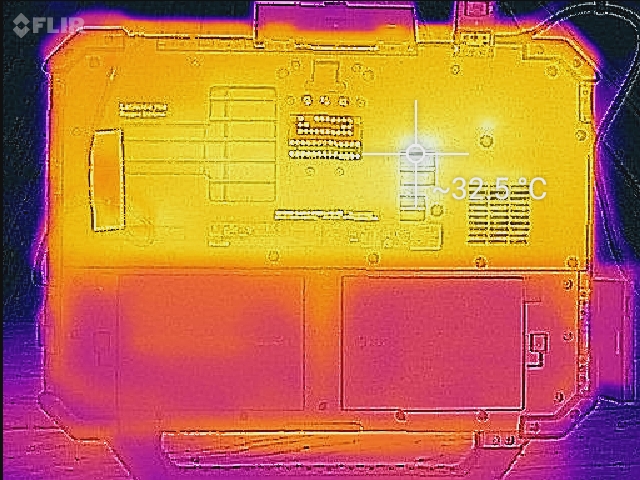
(+) In idle usage, the average temperature for the upper side is 25.4 °C / 78 F, compared to the device average of 32 °C / 90 F.
(+) The palmrests and touchpad are cooler than skin temperature with a maximum of 27 °C / 80.6 F and are therefore cool to the touch.
(±) The average temperature of the palmrest area of similar devices was 27.8 °C / 82 F (+0.8 °C / 1.4 F).

Speakers

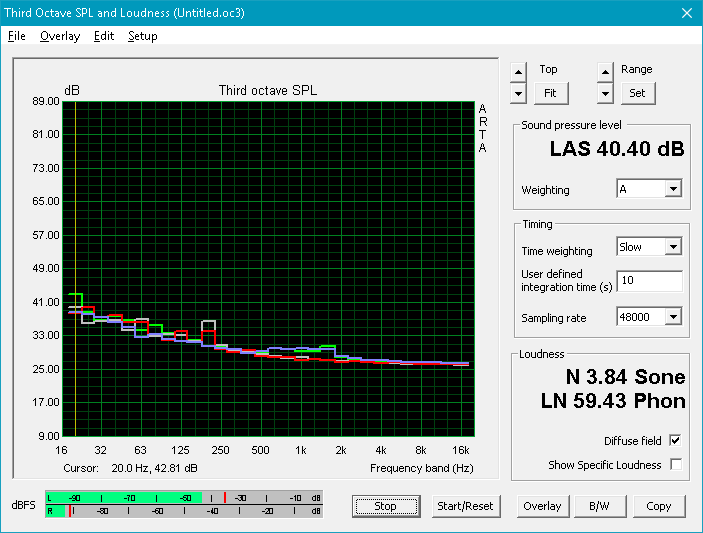
The single speaker is nothing special. Bass is anemic, but mids and highs are well-balanced. The speaker can get loud (~82 dB), and sound remains clear at the highest volume setting with no chassis rattle. However, the Latitude 7424 Rugged Extreme suffers from the same problem as the 5420: the speaker sounds heavily muffled, likely due to a water-resistant design.
Dell Latitude 7424 Rugged Extreme audio analysis
(±) | speaker loudness is average but good (81.7 dB)
Bass 100 - 315 Hz
(-) | nearly no bass - on average 16.6% lower than median
(±) | linearity of bass is average (11.4% delta to prev. frequency)
Mids 400 - 2000 Hz
(+) | balanced mids - only 4.7% away from median
(±) | linearity of mids is average (7.6% delta to prev. frequency)
Highs 2 - 16 kHz
(+) | balanced highs - only 4.6% away from median
(±) | linearity of highs is average (7.6% delta to prev. frequency)
Overall 100 - 16.000 Hz
(±) | linearity of overall sound is average (17.7% difference to median)
Compared to same class
» 47% of all tested devices in this class were better, 11% similar, 42% worse
» The best had a delta of 7%, average was 18%, worst was 35%
Compared to all devices tested
» 30% of all tested devices were better, 8% similar, 62% worse
» The best had a delta of 4%, average was 25%, worst was 134%
Getac S410 audio analysis
(±) | speaker loudness is average but good (76.2 dB)
Bass 100 - 315 Hz
(±) | reduced bass - on average 13.6% lower than median
(+) | bass is linear (6.1% delta to prev. frequency)
Mids 400 - 2000 Hz
(±) | higher mids - on average 6.5% higher than median
(±) | linearity of mids is average (8.4% delta to prev. frequency)
Highs 2 - 16 kHz
(+) | balanced highs - only 3.1% away from median
(+) | highs are linear (6.2% delta to prev. frequency)
Overall 100 - 16.000 Hz
(±) | linearity of overall sound is average (19.9% difference to median)
Compared to same class
» 36% of all tested devices in this class were better, 9% similar, 55% worse
» The best had a delta of 7%, average was 22%, worst was 53%
Compared to all devices tested
» 46% of all tested devices were better, 7% similar, 47% worse
» The best had a delta of 4%, average was 25%, worst was 134%
Panasonic Toughbook CF-54G2999VM audio analysis
(-) | not very loud speakers (65.9 dB)
Bass 100 - 315 Hz
(-) | nearly no bass - on average 25.6% lower than median
(+) | bass is linear (5% delta to prev. frequency)
Mids 400 - 2000 Hz
(±) | higher mids - on average 7.8% higher than median
(-) | mids are not linear (17.3% delta to prev. frequency)
Highs 2 - 16 kHz
(+) | balanced highs - only 4.3% away from median
(±) | linearity of highs is average (7.9% delta to prev. frequency)
Overall 100 - 16.000 Hz
(-) | overall sound is not linear (39.6% difference to median)
Compared to same class
» 99% of all tested devices in this class were better, 1% similar, 1% worse
» The best had a delta of 7%, average was 22%, worst was 53%
Compared to all devices tested
» 94% of all tested devices were better, 0% similar, 6% worse
» The best had a delta of 4%, average was 25%, worst was 134%
Energy Management
Power Consumption
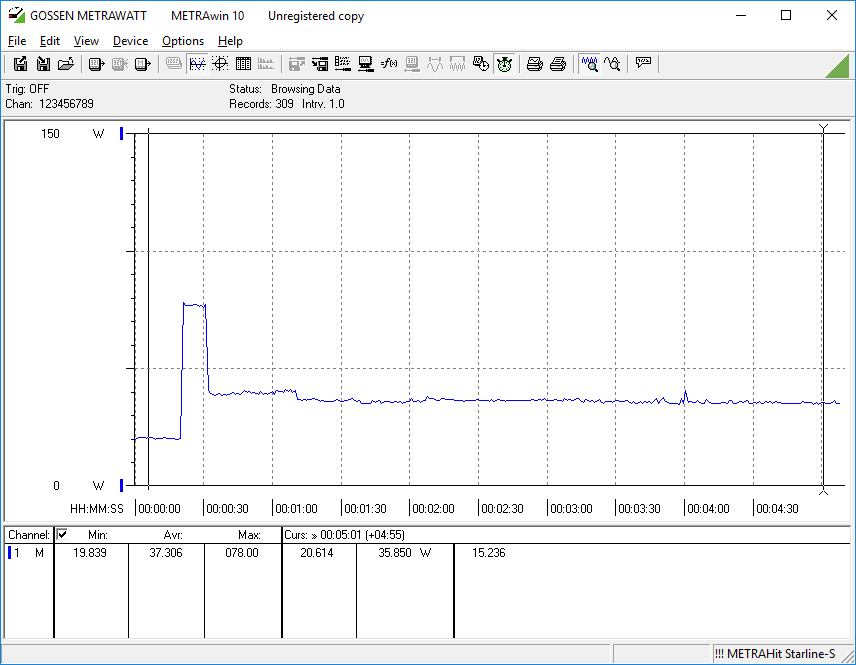
Due to its bright backlight and dedicated GPU, the Latitude 7424 Rugged Extreme draws significantly more power than other ruggedized laptops. Under load, the machines averages about 70 Watts, which is double the draw of the Getac S410 and Panasonic Toughbook CF-54. Power draw spikes to 95 Watts, which is higher than the power supply's 90 Watt rating. These spikes are very brief and shouldn't be problematic.
| Off / Standby | |
| Idle | |
| Load |
|
| Dell Latitude 7424 Rugged Extreme i7-8650U, Radeon RX 540, SK Hynix PC401 512GB M.2 (HFS512GD9TNG), IPS, 1920x1080, 14.00 | Getac S410 i5-8550U, UHD Graphics 620, CUKUSA 1 TB SATA SSD Q0526A, TN PED, 1366x768, 14.00 | Panasonic Toughbook CF-54G2999VM i5-7300U, HD Graphics 620, Seagate BarraCuda Compute 1TB ST1000LM048, TN LED, 1366x768, 14.00 | Panasonic Toughbook CF-XZ6 i5-7300U, HD Graphics 620, Samsung SSD PM871a MZNLN256HMHQ, IPS LED, 2160x1440, 12.00 | Dell Latitude 5420 Rugged-P85G i7-8650U, Radeon RX 540, SK hynix PC401 NVMe 500 GB, IPS, 1920x1080, 14.00 | Lenovo ThinkPad T480-20L50010US i7-8650U, UHD Graphics 620, Samsung SSD PM981 MZVLB512HAJQ, TFT-LCD, 1920x1080, 14.00 | Lenovo ThinkPad P52 20MAS03N00 i7-8750H, Quadro P1000, Samsung SSD PM981 MZVLB512HAJQ, IPS LED, 1920x1080, 15.60 | |
|---|---|---|---|---|---|---|---|
| Power Consumption | 45% | 52% | 64% | 9% | 44% | 7% | |
| Idle Minimum * | 6.5 | 5.6 14% | 4.4 32% | 3.15 52% | 4.8 26% | 3.8 42% | 4.02 38% |
| Idle Average * | 15.1 | 7.9 48% | 6.3 58% | 6 60% | 13.6 10% | 7.7 49% | 7.2 52% |
| Idle Maximum * | 16.1 | 8.4 48% | 6.5 60% | 6.3 61% | 13.8 14% | 9.3 42% | 11.46 29% |
| Load Average * | 70.5 | 32.8 53% | 36.3 49% | 21 70% | 67.8 4% | 45.7 35% | 76.3 -8% |
| Witcher 3 ultra * | 68.1 | 69.1 -1% | 74 -9% | ||||
| Load Maximum * | 95.2 | 34.3 64% | 38.3 60% | 23 76% | 93.5 2% | 46.1 52% | 154 -62% |
* ... smaller is better
Battery Life
Like its little brother, the Latitude 7424 Rugged Extreme excels in battery life. Thanks to its dual 51 Wh batteries (102 Wh total), the machine lasts over 11.5 hours in our Wifi v1.3 battery test. Workers can feel comfortable leaving the power supply at home provided they don't plan on doing graphically intensive work. Road warriors that need even more time should look at the Latitude 5420, which lasted over 16 hours in the same Wifi test. Should it be needed, the AC adapter (13.3 x 7.0 x 2.5 cm) easily slips into a bag.
| Dell Latitude 7424 Rugged Extreme i7-8650U, Radeon RX 540, 102 Wh | Getac S410 i5-8550U, UHD Graphics 620, 46.6 Wh | Panasonic Toughbook CF-54G2999VM i5-7300U, HD Graphics 620, 33 Wh | Panasonic Toughbook CF-XZ6 i5-7300U, HD Graphics 620, 76 Wh | Dell Latitude 5420 Rugged-P85G i7-8650U, Radeon RX 540, 102 Wh | Lenovo ThinkPad T480-20L50010US i7-8650U, UHD Graphics 620, 24 Wh | Lenovo ThinkPad P52 20MAS03N00 i7-8750H, Quadro P1000, 96 Wh | |
|---|---|---|---|---|---|---|---|
| Battery Runtime | -56% | -50% | 19% | 29% | -38% | -30% | |
| WiFi v1.3 | 703 | 312 -56% | 352 -50% | 841 20% | 972 38% | 437 -38% | 637 -9% |
| Load | 160 | 188 18% | 190 19% | 79 -51% | |||
| Reader / Idle | 1325 | 1882 | 1519 |
Pros
Cons
Verdict

The Dell Latitude 7424 Rugged Extreme is the icon of ruggedized laptops. It is thick. It is heavy. But it is durable. The machine is dust-tight and water-resistant, so it should be suitable for difficult work environments like constructions sites and fieldwork. The machine is a competent workhorse that can handle a variety of workflows with aplomb and is rather versatile.
That said, it pales in comparison to the Dell Latitude 5420 Rugged. The 5420 is much more portable due to its thinner profile. The 5420 also offers comparable performance, a better display, and longer battery life. The biggest advantage of the 7424 Rugged Extreme is its superior weather-proofing and its glove-friendly inputs. The 7424 runs slightly faster and cooler than the 5420, but the difference is marginal at best.
All said, the Dell Latitude 7424 Rugged Extreme is a tough laptop that offers great all-around performance, but there are better options. Unless you need the added water and dust protection or often work with gloves, the Latitude 5420 Rugged is a better buy for several reasons.
Dell Latitude 7424 Rugged Extreme
-
03/30/2019 v6(old)
Sam Medley
More articles related to this device
Dell Latitude 7424 Rugged Extreme (Latitude 14 Rugged Series)Related Articles


Pricecompare
