 Deutsch
 English
 Español
 Français
 Italiano
 Nederlands
 Polski
 Português
 Русский
 Türkçe
 Svenska
 Chinese
 Magyar
Getac S410 Gen 4 laptop review: Simple changes with huge upgrades
")
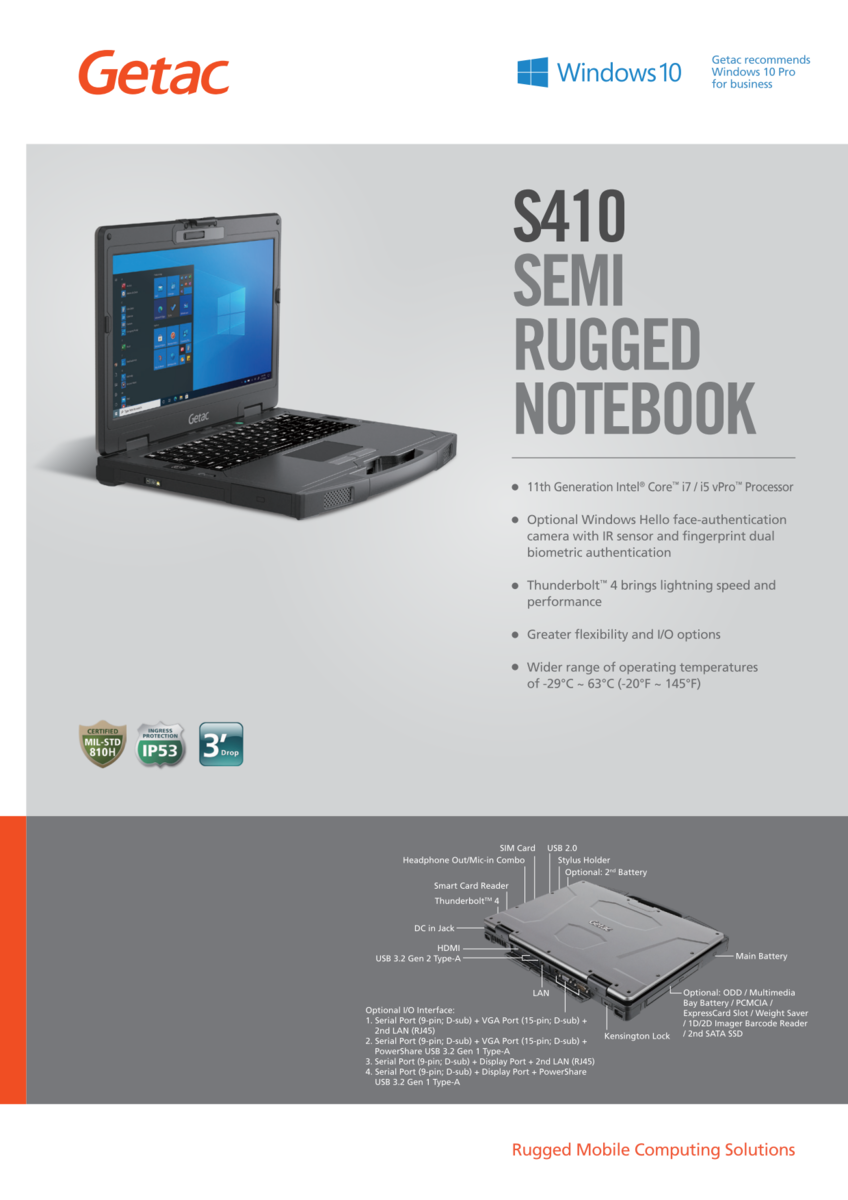
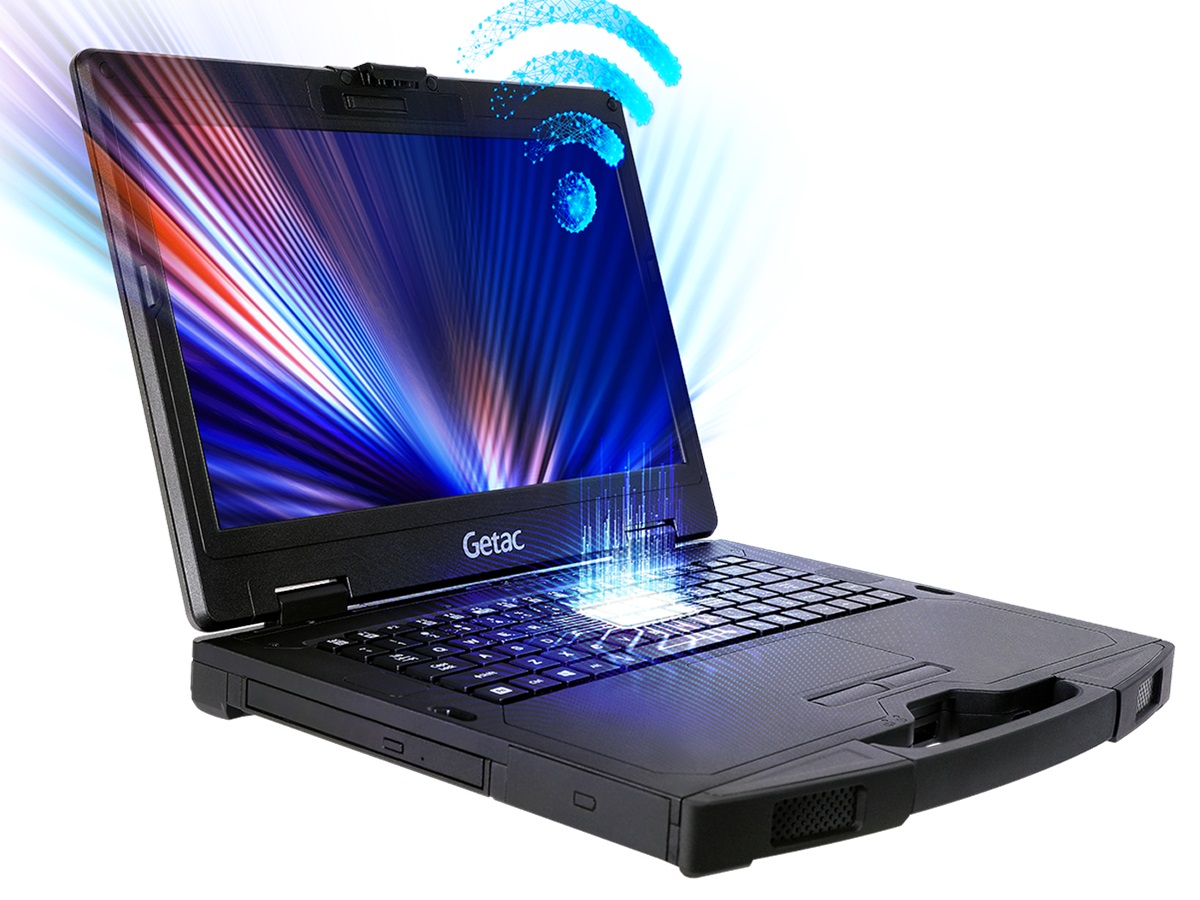
The Getac S410 Gen 4 is the 11th gen Intel Tiger Lake-U update to the existing Gen 3 and earlier models. It otherwise shares the same chassis design as its predecessors and so our existing comments on the original 2018 S410 model still apply here.
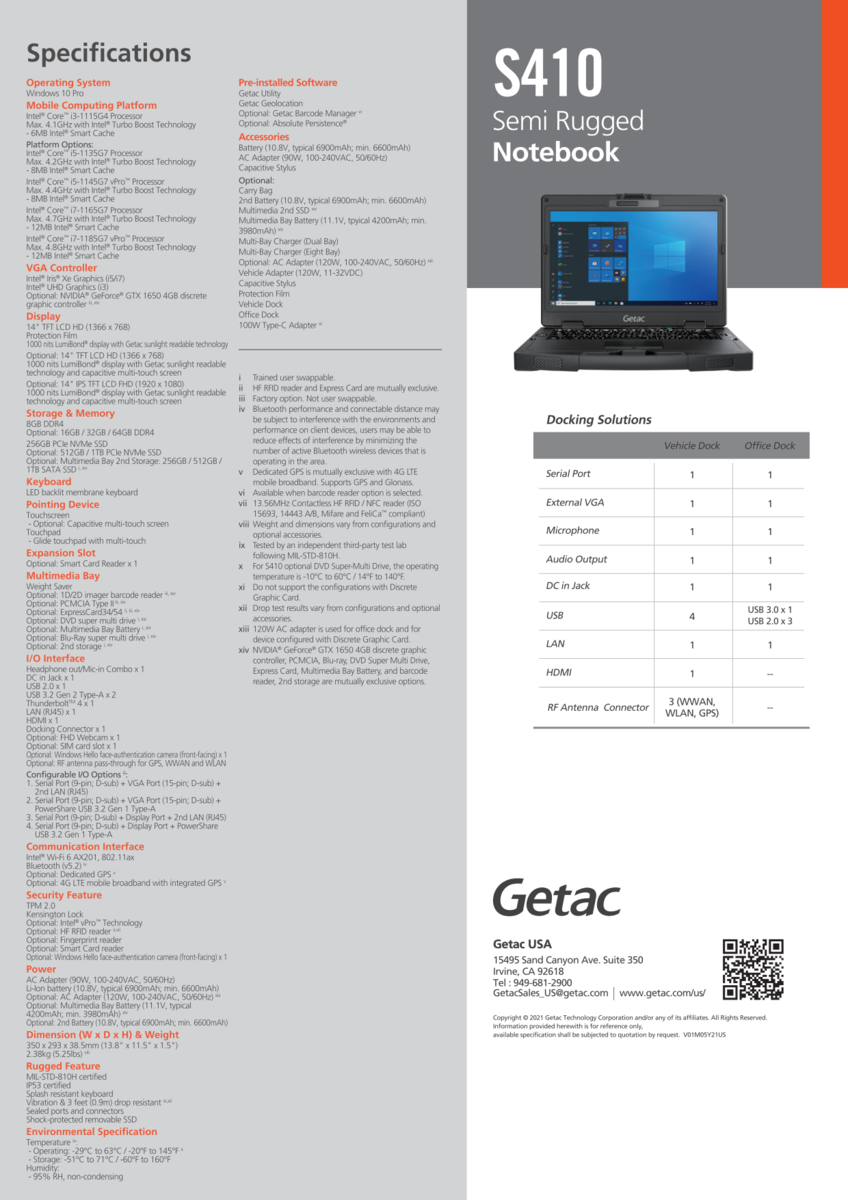
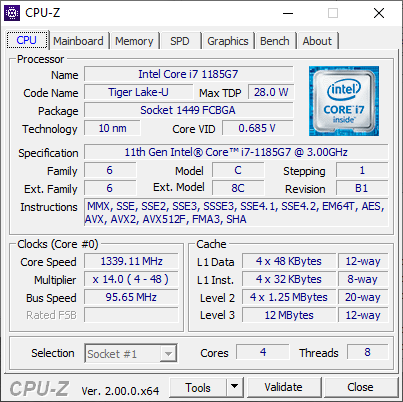
Our specific review unit is a higher-end configuration with the Core i7-1185U CPU and 1000-nit 1080p IPS touchscreen. Lower-end SKUs are available as detailed by the official specifications sheet below. More information on the G410 series can be found on its product page here.
More Getac reviews:
Potential Competitors in Comparison
Rating | Date | Model | Weight | Height | Size | Resolution | Best Price |
|---|---|---|---|---|---|---|---|
| 81.7 % | 05/2022 | Getac S410 Gen 4 i7-1185G7, Iris Xe G7 96EUs | 3.2 kg | 34.9 mm | 14.00" | 1920x1080 | |
| 83.9 % | 09/2021 | Panasonic Toughbook FZ-55 MK2 i7-1185G7, Iris Xe G7 96EUs | 2.3 kg | 33 mm | 14.00" | 1920x1080 | |
| 81.9 % | 10/2018 | Getac S410 i5-8550U, UHD Graphics 620 | 3.2 kg | 34.9 mm | 14.00" | 1366x768 | |
| 89.2 % | 03/2019 | Dell Latitude 5420 Rugged-P85G i7-8650U, Radeon RX 540 | 2.8 kg | 32.9 mm | 14.00" | 1920x1080 | |
| 82.4 % | 12/2021 | Acer Enduro Urban N3 EUN314 i7-1165G7, Iris Xe G7 96EUs | 1.8 kg | 21.95 mm | 14.00" | 1920x1080 | |
04/2021 | Durabook S14I i7-1165G7, Iris Xe G7 96EUs | 3 kg | 38.1 mm | 14.00" | 1920x1080 |
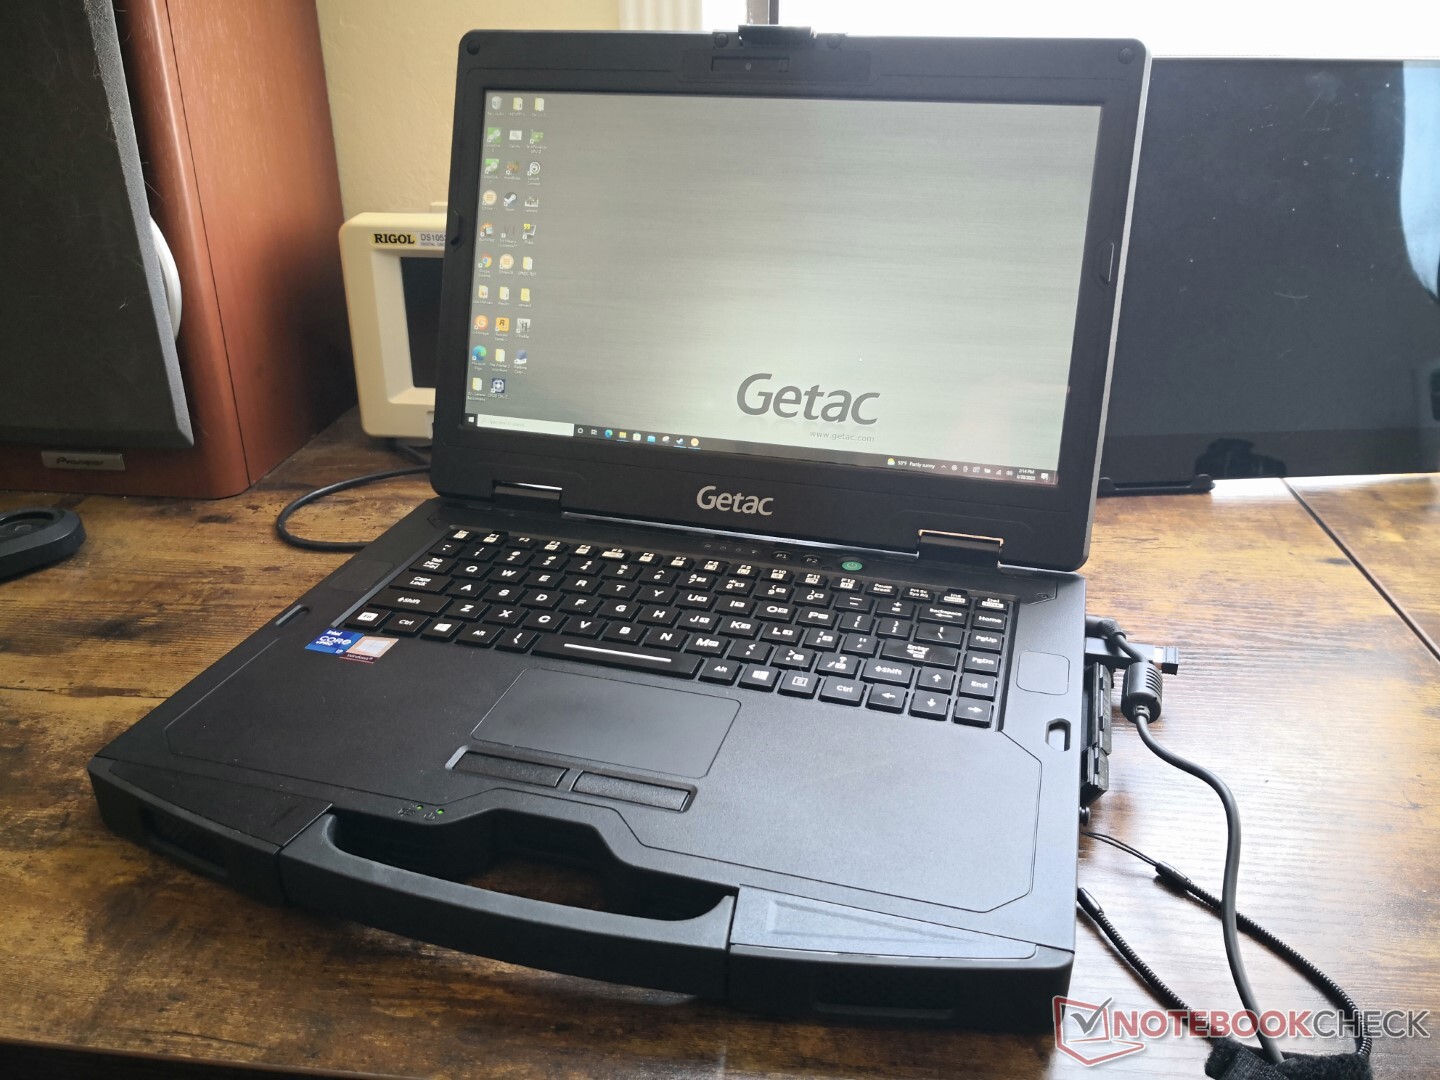
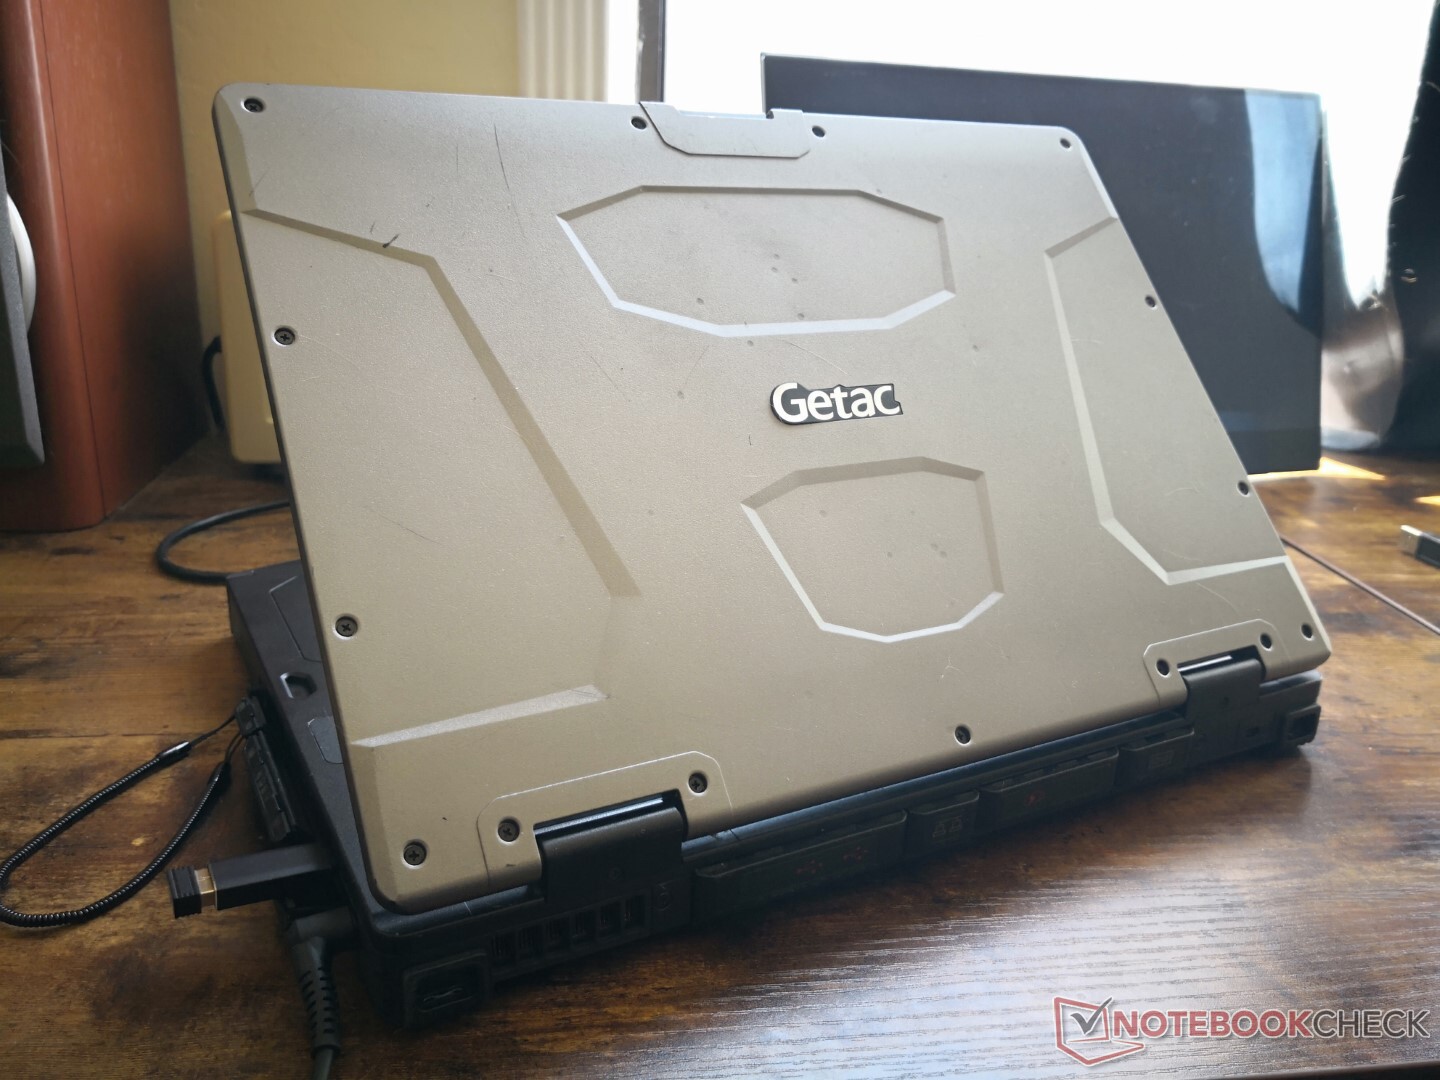
Case
Communication
WLAN has been upgraded from the Intel 8265 to the AX201 for Wi-Fi 6 compatibility. Real-world transfer rates are at least two times faster based on our tests.
Webcam
The 720p webcam remains unchanged. It would have been great to see an upgrade to 1080p for a crisper picture.


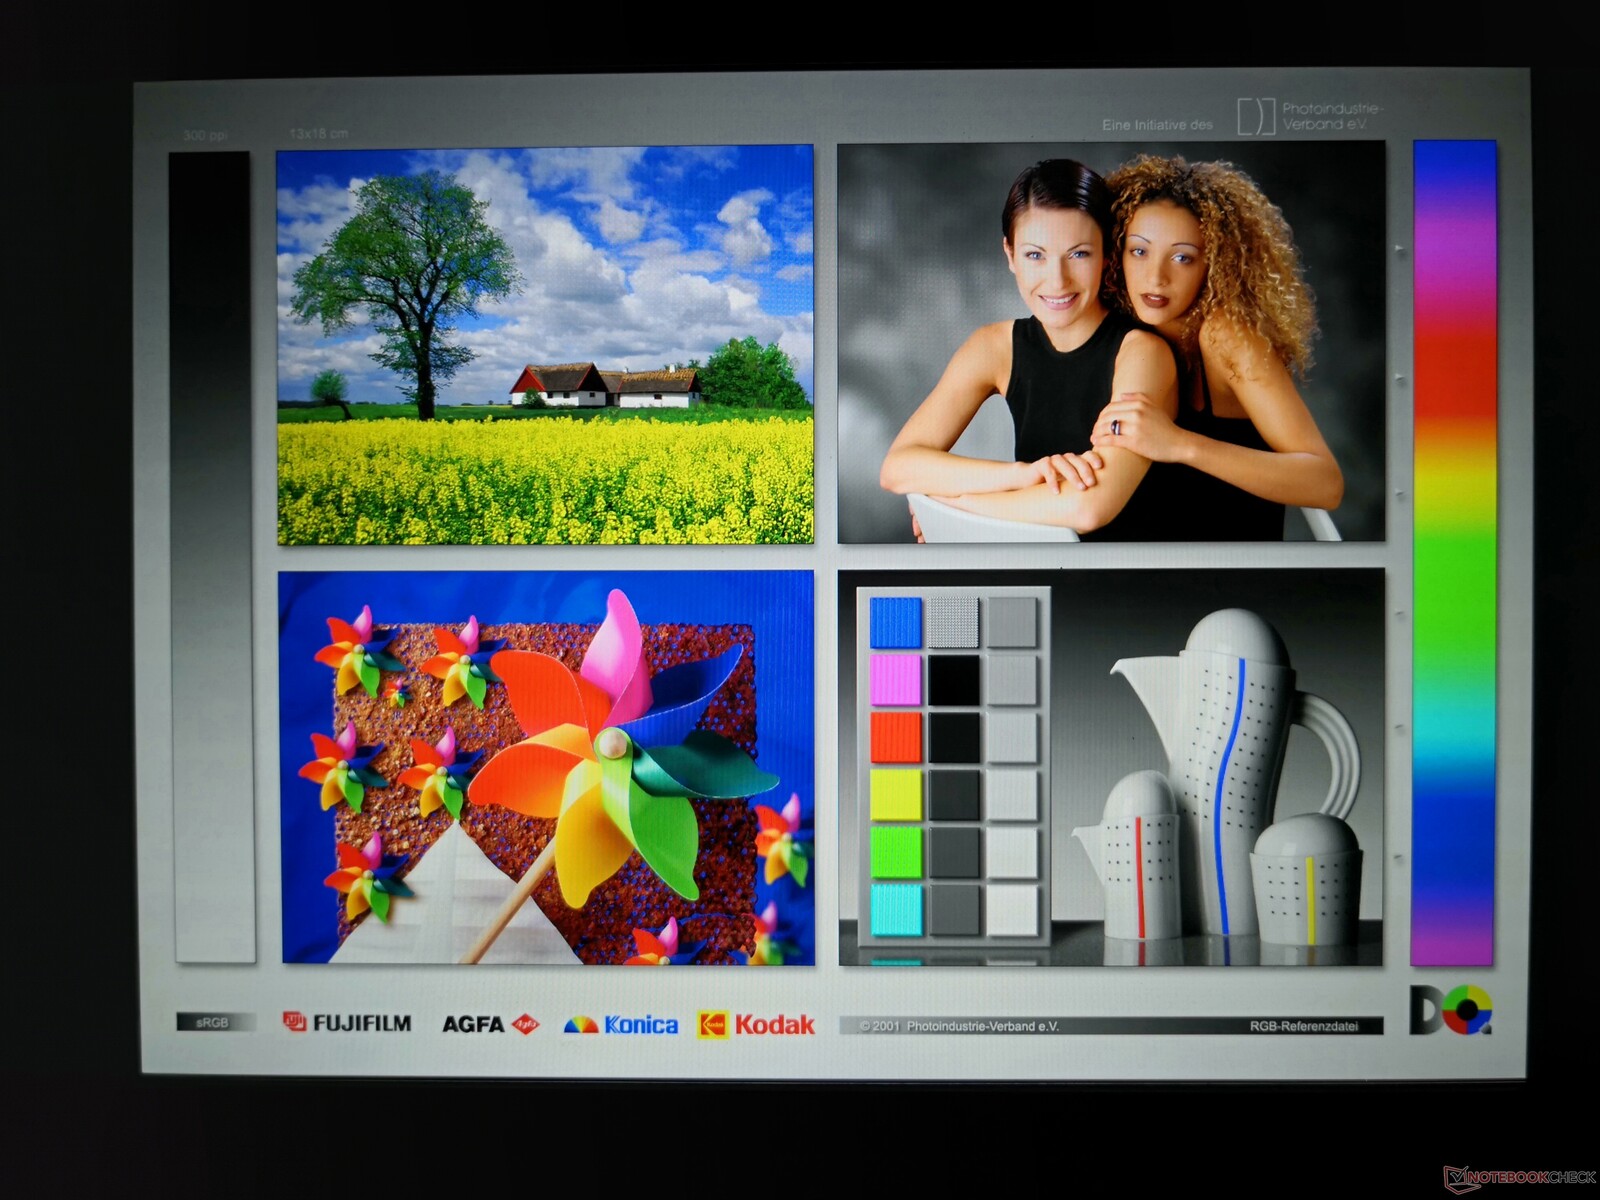
Display
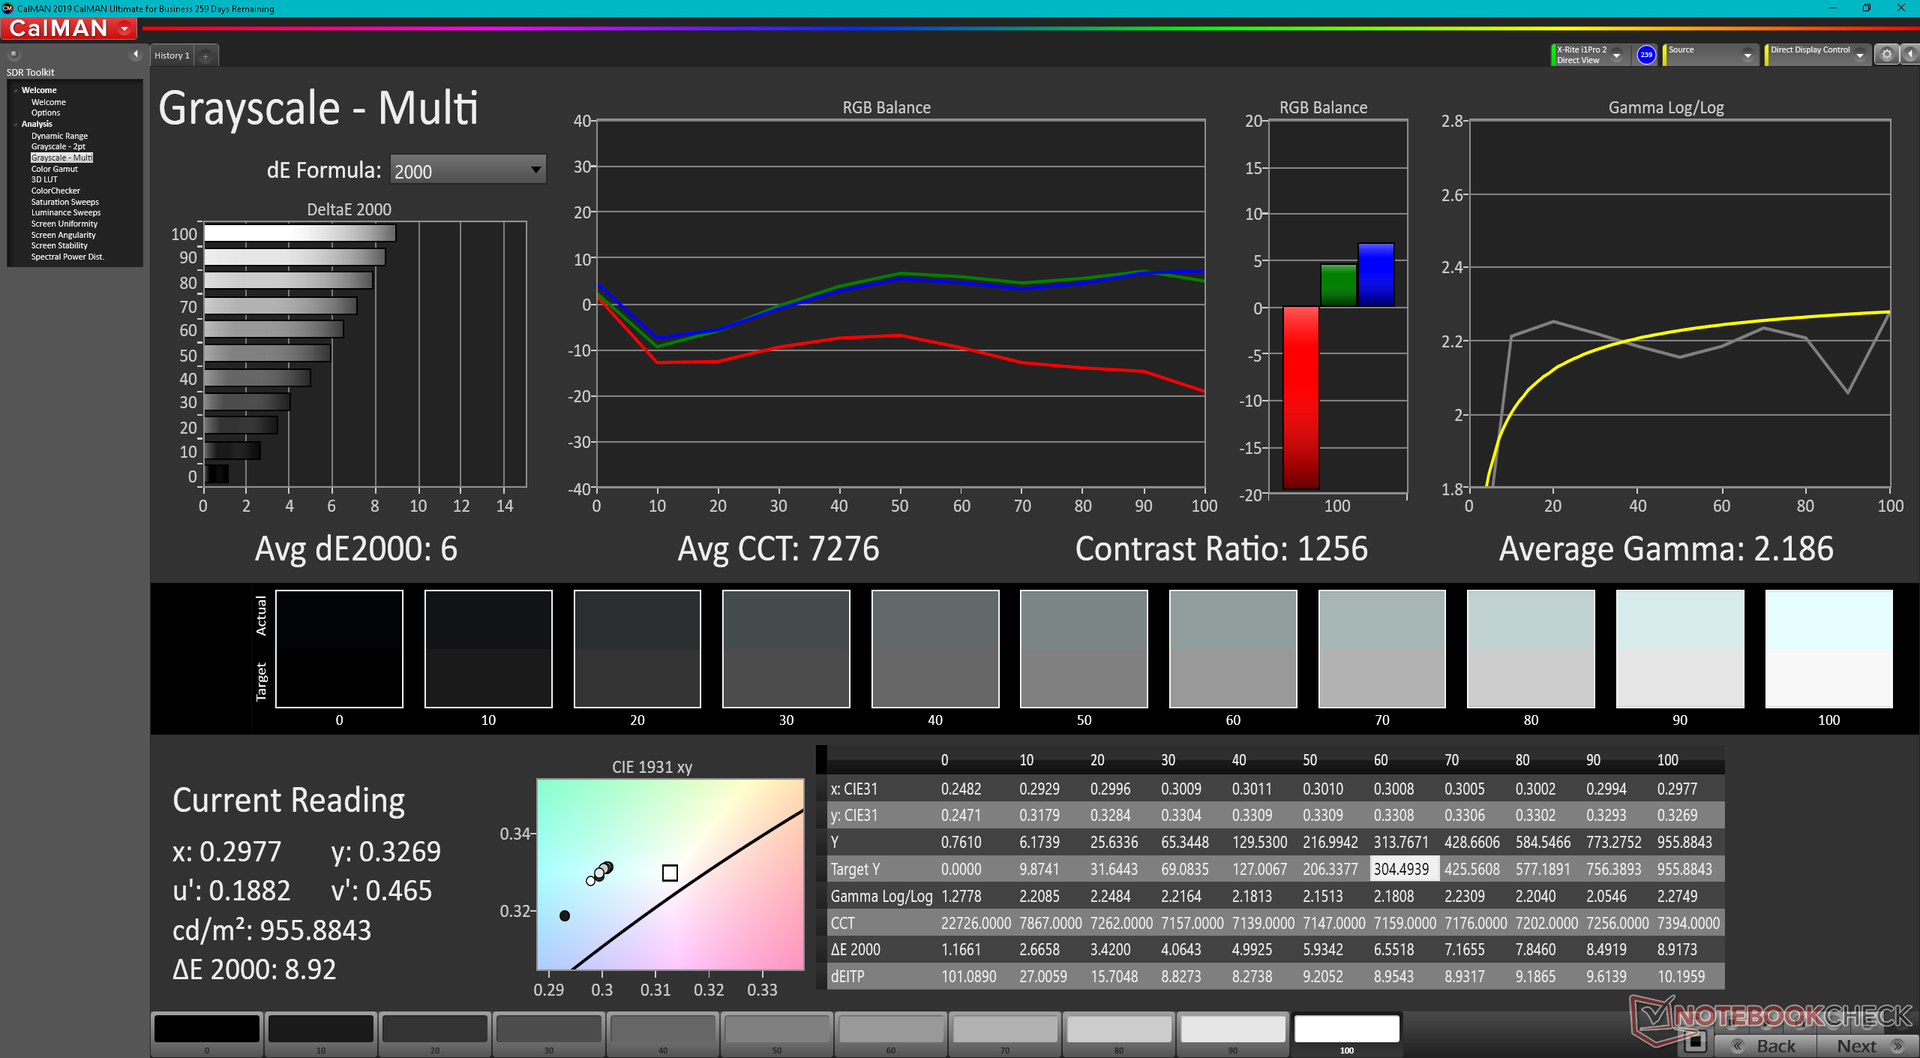
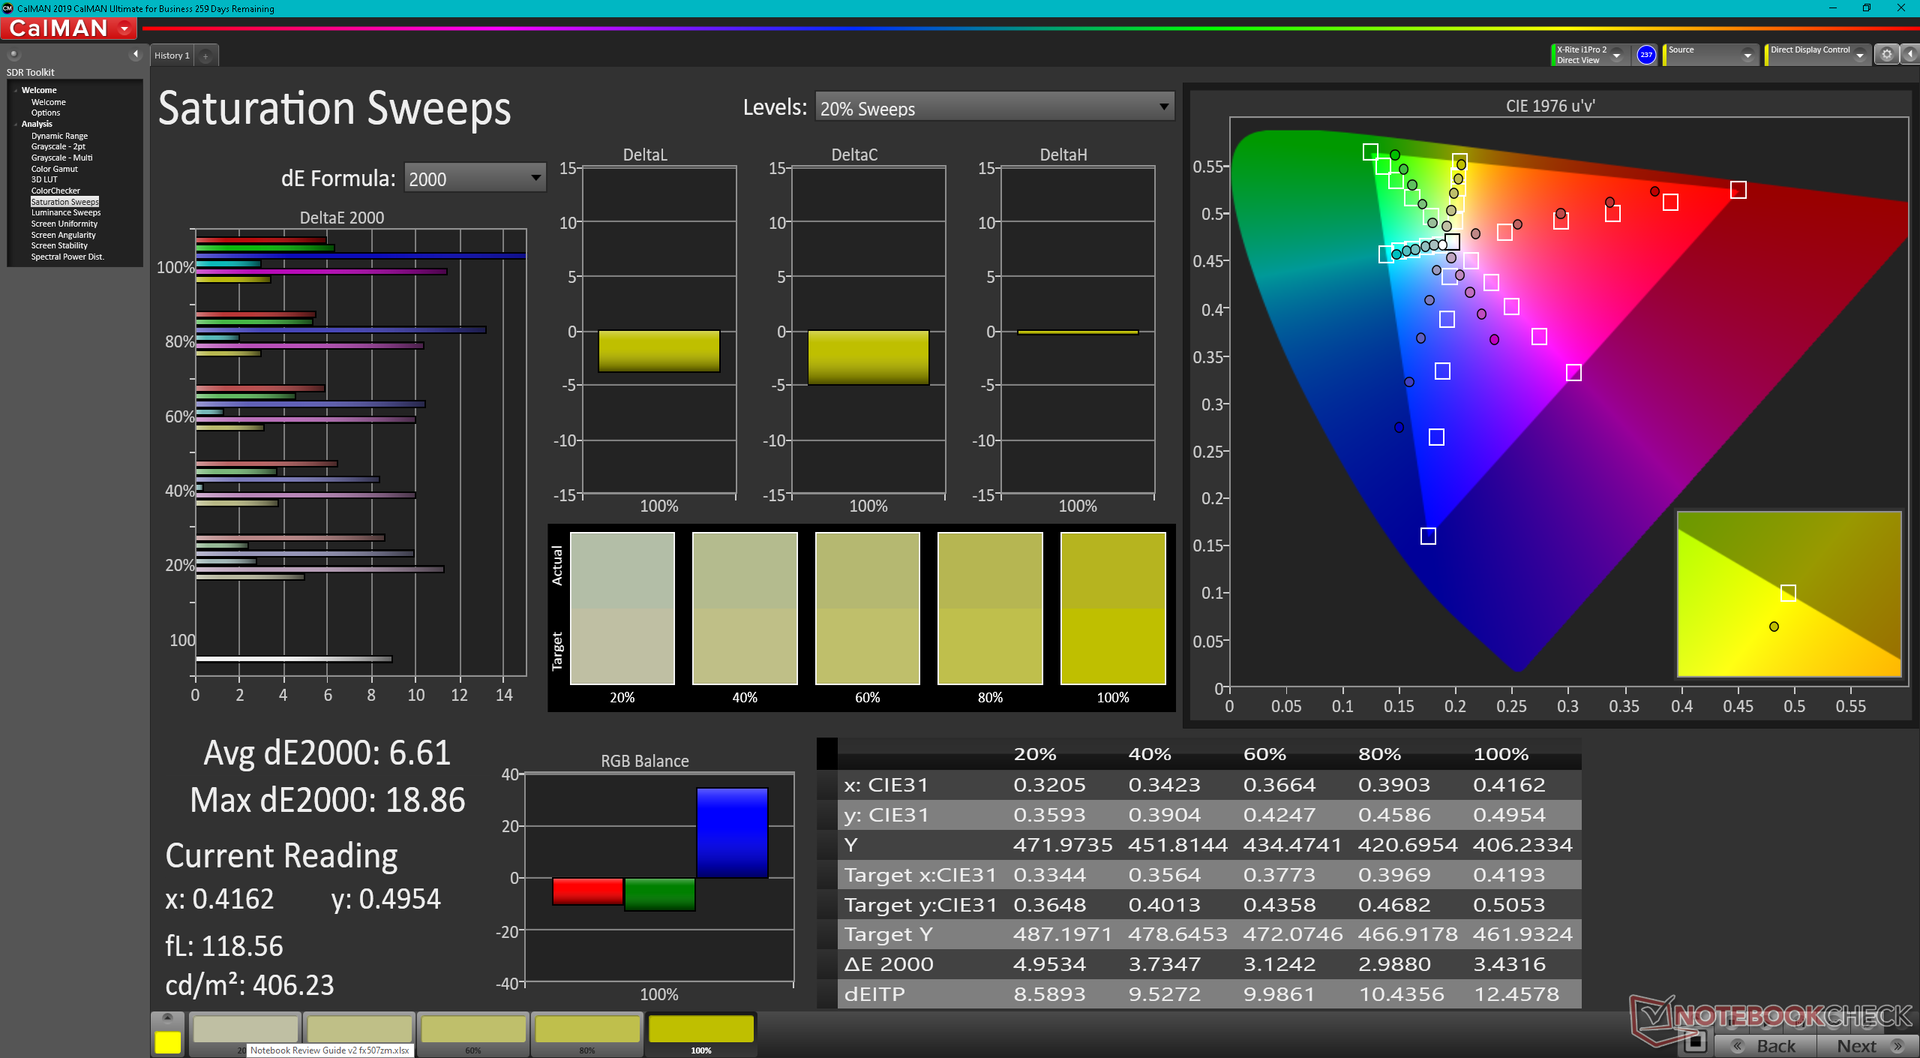
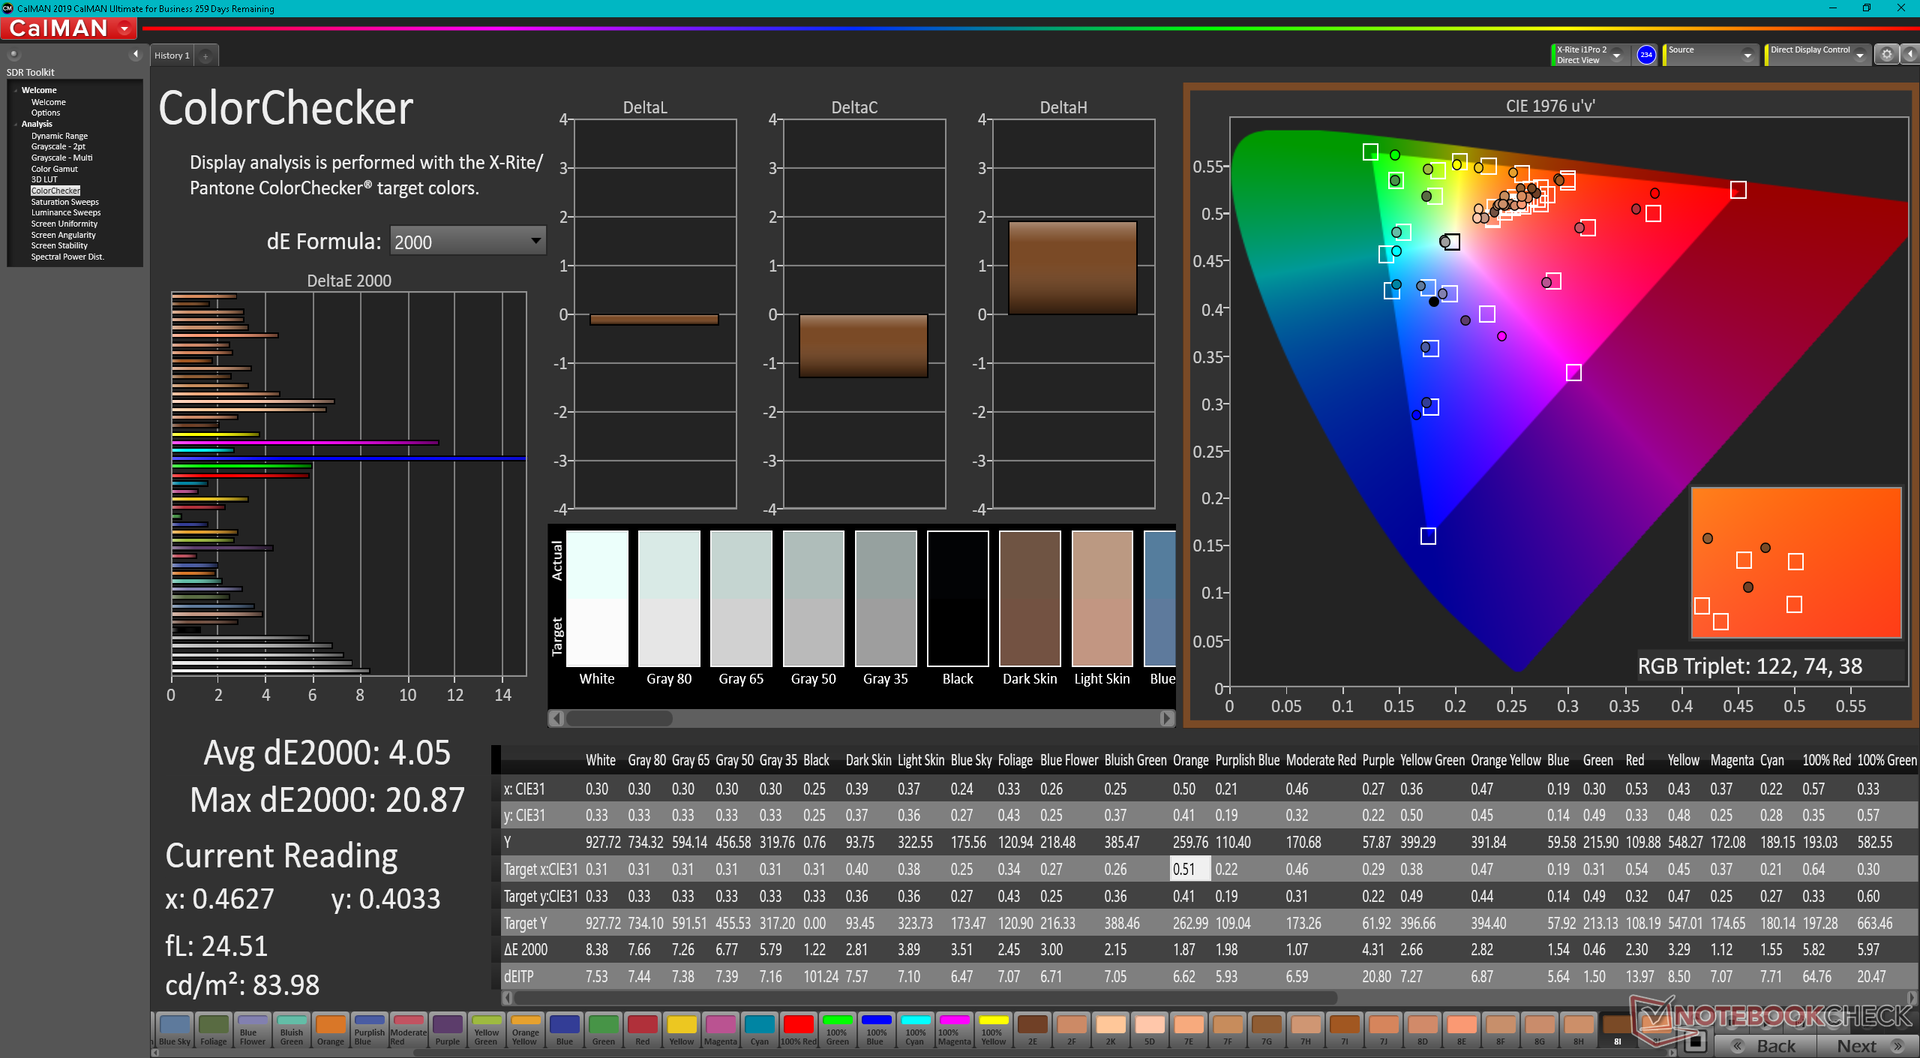
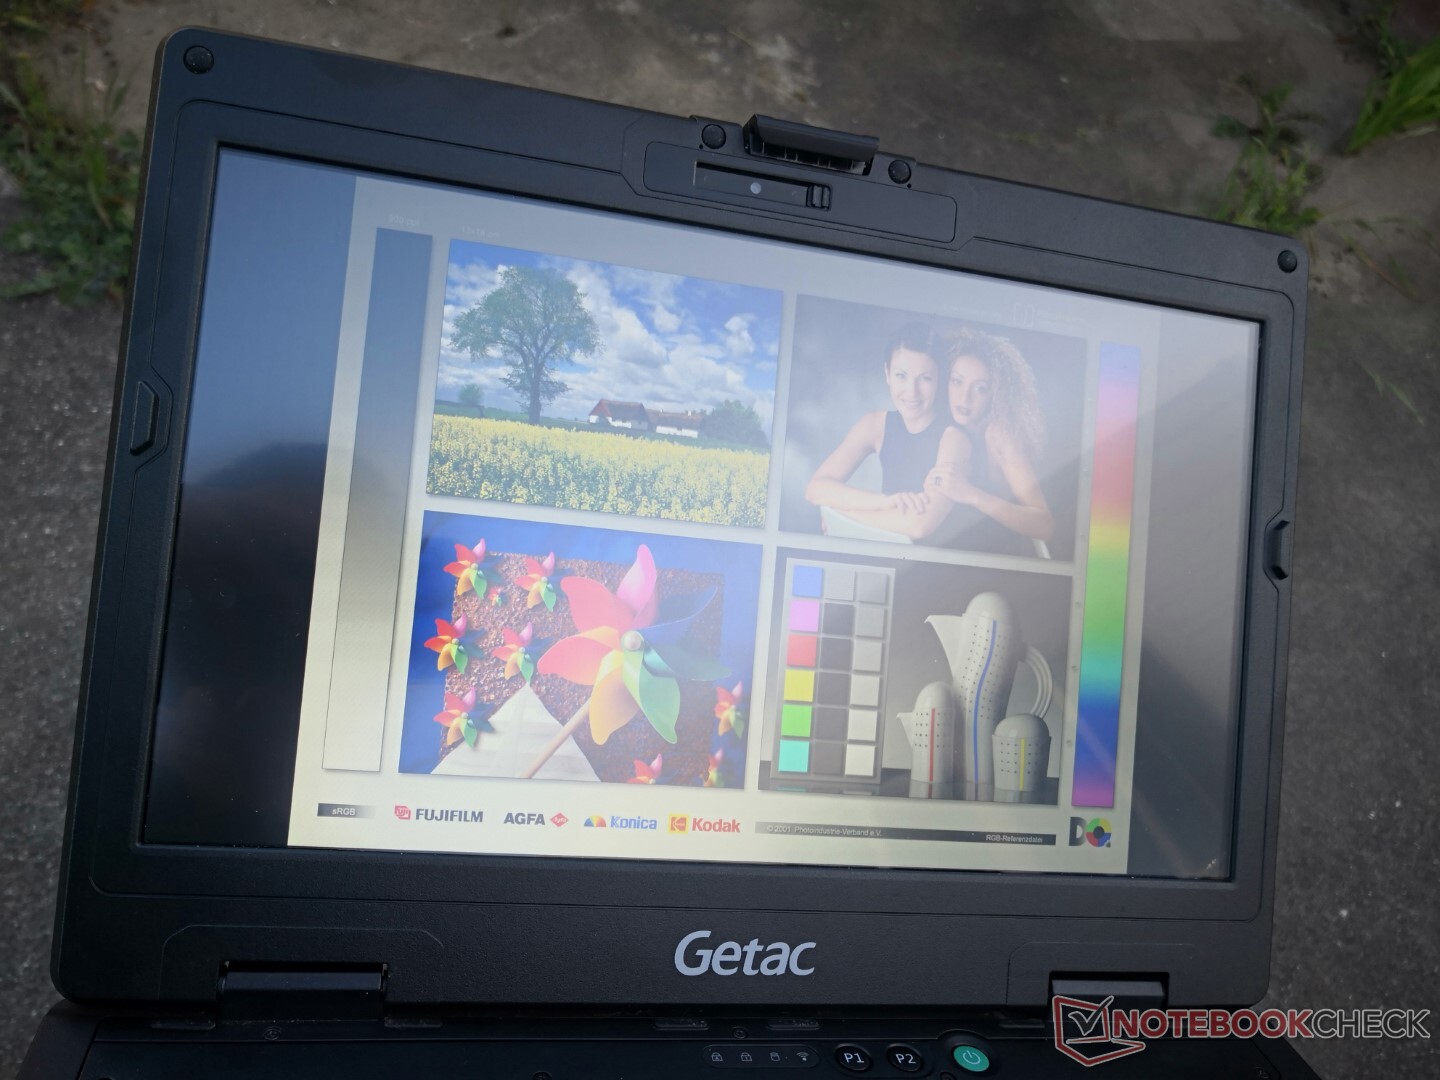
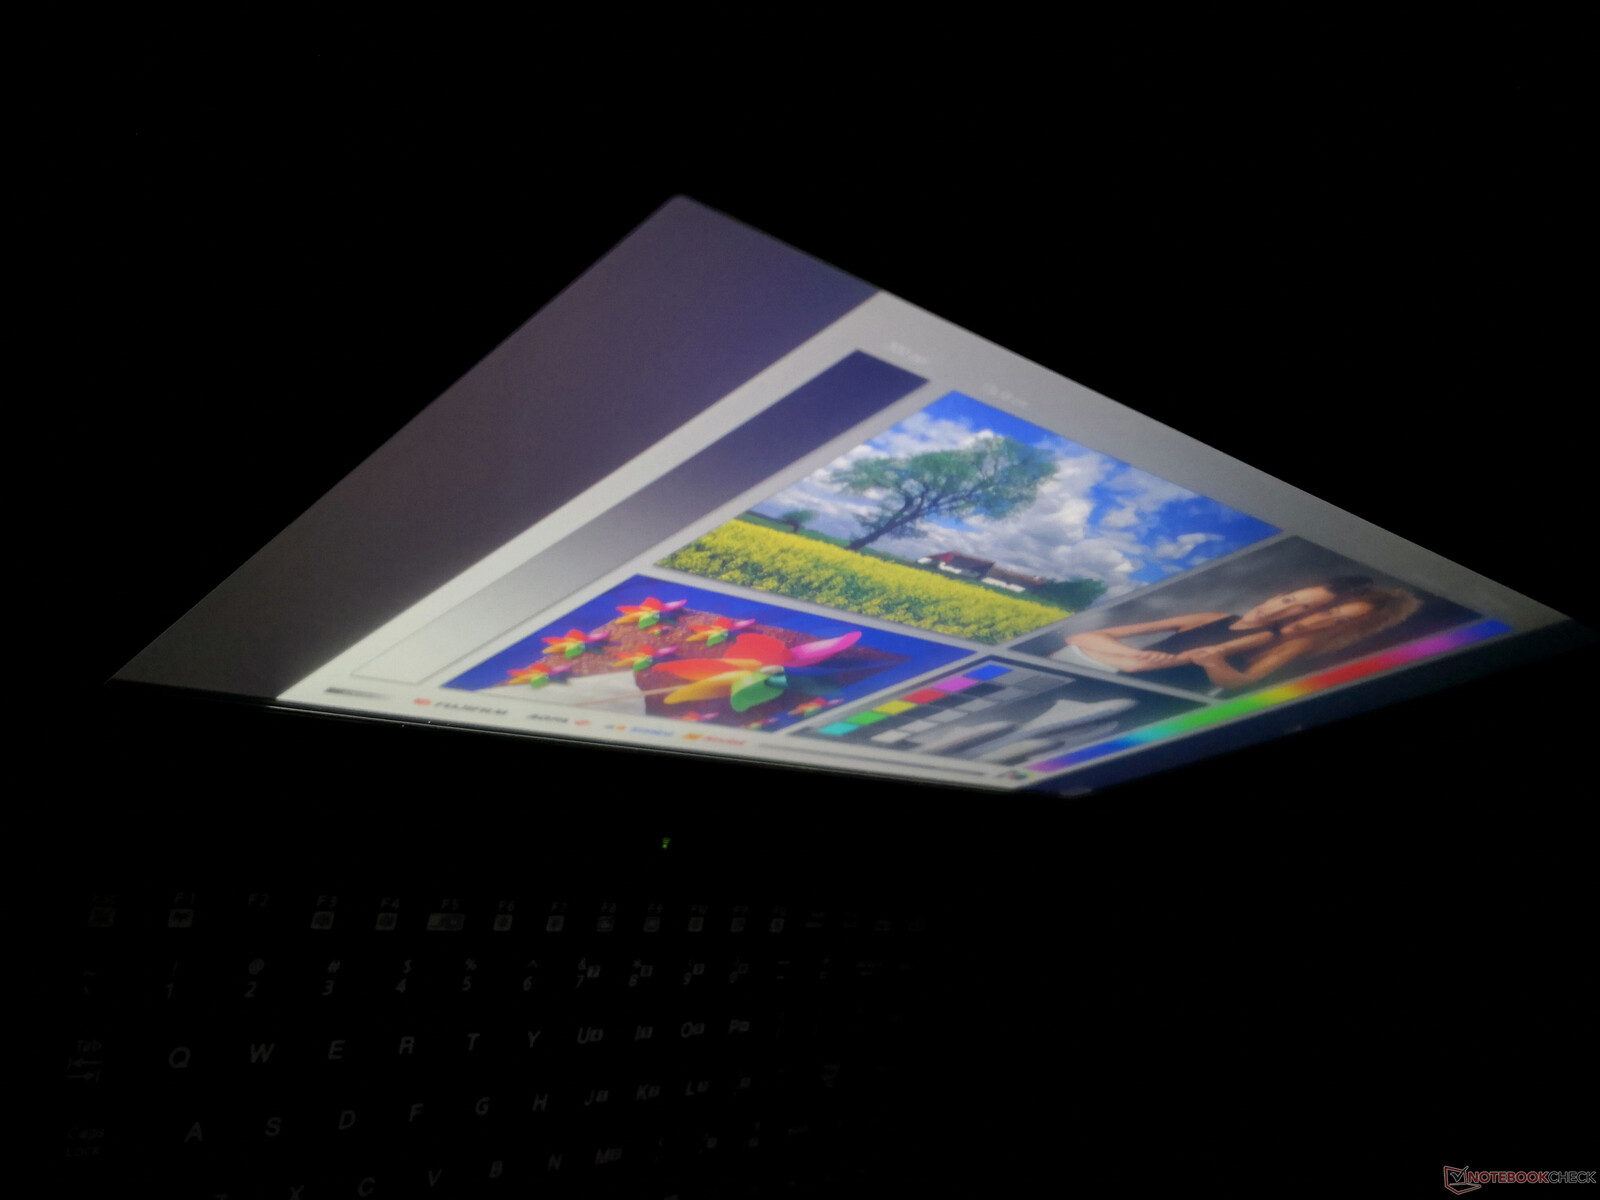
The 1000-nit 1080p IPS panel is a significant upgrade over the 250-nit 768p TN panel on our original 2018 S410 Gen 1. Contrast has even doubled, but color space remains almost unchanged.
Keep in mind that pulse-width modulation is present on all brightness levels even when at maximum. The constant screen flickering may be bothersome to a small subset of users with sensitive eyes.


| |||||||||||||||||||||||||
Brightness Distribution: 84 %
Center on Battery: 956.9 cd/m²
Contrast: 1181:1 (Black: 0.81 cd/m²)
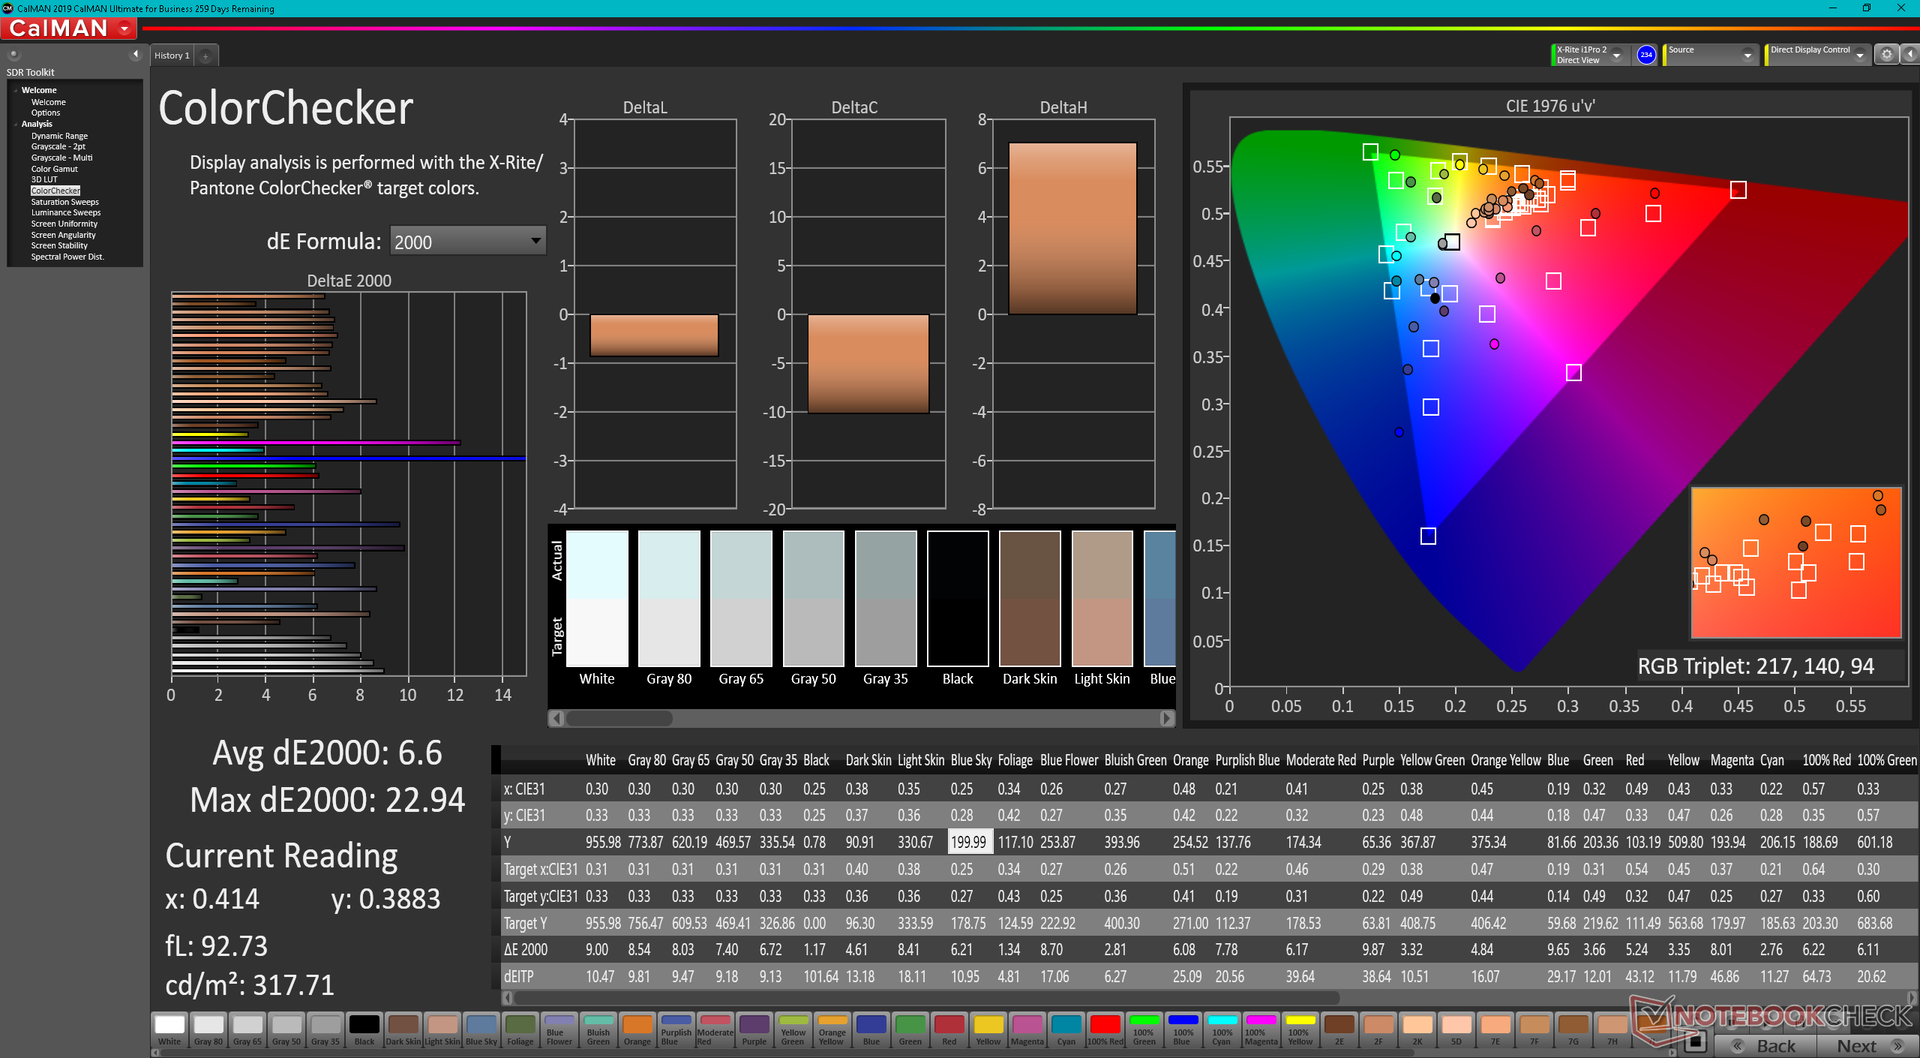
ΔE Color 6.6 | 0.5-29.43 Ø5, calibrated: 4.05
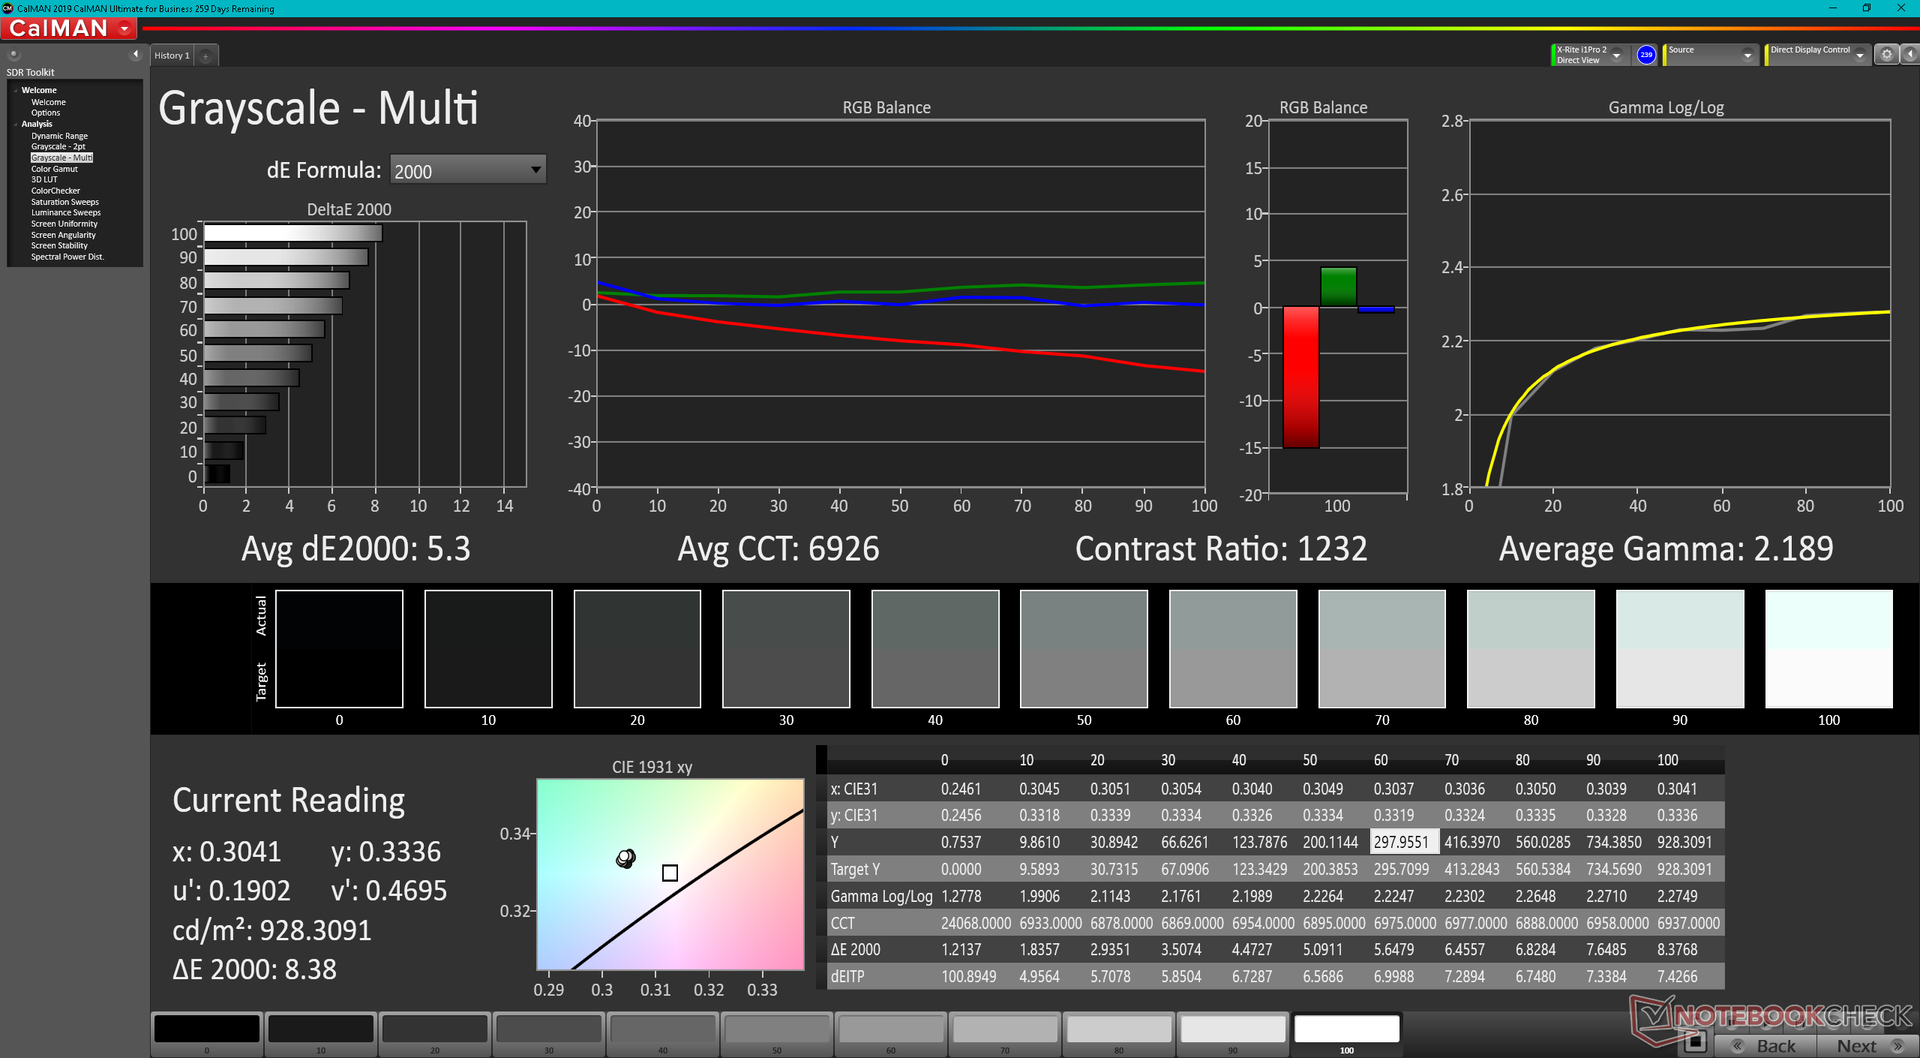
ΔE Greyscale 6 | 0.57-98 Ø5.3
39.5% AdobeRGB 1998 (Argyll 2.2.0 3D)
57.2% sRGB (Argyll 2.2.0 3D)
38.3% Display P3 (Argyll 2.2.0 3D)
Gamma: 2.19
| Getac S410 Gen 4 AU Optronics AUO413D, IPS, 1920x1080, 14.00 | Panasonic Toughbook FZ-55 MK2 InfoVision M140NWF5 R3, IPS, 1920x1080, 14.00 | Getac S410 CMN N140BGE-E33, TN PED, 1366x768, 14.00 | Dell Latitude 5420 Rugged-P85G AU Optronics AUO523D, IPS, 1920x1080, 14.00 | Acer Enduro Urban N3 EUN314 XR140EA6T, IPS, 1920x1080, 14.00 | Durabook S14I KD140N0730A01, TN, 1920x1080, 14.00 | |
|---|---|---|---|---|---|---|
| Display | -9% | 6% | 63% | 64% | 14% | |
| Display P3 Coverage | 38.3 | 34.8 -9% | 40.46 6% | 62.5 63% | 63.5 66% | 43.55 14% |
| sRGB Coverage | 57.2 | 52.2 -9% | 60.9 6% | 92.4 62% | 91.9 61% | 65.4 14% |
| AdobeRGB 1998 Coverage | 39.5 | 36 -9% | 41.8 6% | 64.2 63% | 65.5 66% | 45 14% |
| Response Times | 1% | 13% | -39% | -19% | 4% | |
| Response Time Grey 50% / Grey 80% * | 35.2 ? | 28.4 ? 19% | 41.2 ? -17% | 68 ? -93% | 56 ? -59% | 30.4 ? 14% |
| Response Time Black / White * | 31.2 ? | 30 ? 4% | 14 ? 55% | 33.6 ? -8% | 35.2 ? -13% | 11.8 ? 62% |
| PWM Frequency | 870 ? | 685 ? -21% | 877 ? 1% | 735 ? -16% | 1000 ? 15% | 304.9 ? -65% |
| Screen | 19% | -50% | 19% | 1% | -42% | |
| Brightness middle | 956.9 | 1061.1 11% | 265.1 -72% | 1111.7 16% | 487.8 -49% | 1180.7 23% |
| Brightness | 984 | 997 1% | 246 -75% | 1026 4% | 464 -53% | 1102 12% |
| Brightness Distribution | 84 | 76 -10% | 81 -4% | 80 -5% | 89 6% | 89 6% |
| Black Level * | 0.81 | 0.7 14% | 0.58 28% | 0.81 -0% | 0.48 41% | 1.91 -136% |
| Contrast | 1181 | 1516 28% | 457 -61% | 1372 16% | 1016 -14% | 618 -48% |
| Colorchecker dE 2000 * | 6.6 | 4.64 30% | 14.24 -116% | 3.83 42% | 6.51 1% | 13.45 -104% |
| Colorchecker dE 2000 max. * | 22.94 | 20.92 9% | 26.66 -16% | 7.85 66% | 11.36 50% | 22.52 2% |
| Colorchecker dE 2000 calibrated * | 4.05 | 2.52 38% | 3.94 3% | 2.98 26% | 1.77 56% | 3.19 21% |
| Greyscale dE 2000 * | 6 | 2.8 53% | 14.2 -137% | 5.6 7% | 7.8 -30% | 15.4 -157% |
| Gamma | 2.19 100% | 2.08 106% | 2.03 108% | 2.306 95% | 2.28 96% | 1.97 112% |
| CCT | 7276 89% | 6364 102% | 17152 38% | 7676 85% | 8102 80% | 21134 31% |
| Color Space (Percent of AdobeRGB 1998) | 38.7 | 59 | 41.6 | |||
| Color Space (Percent of sRGB) | 61 | 93 | 65.5 | |||
| Total Average (Program / Settings) | 4% /
10% | -10% /
-26% | 14% /
16% | 15% /
10% | -8% /
-22% |
* ... smaller is better
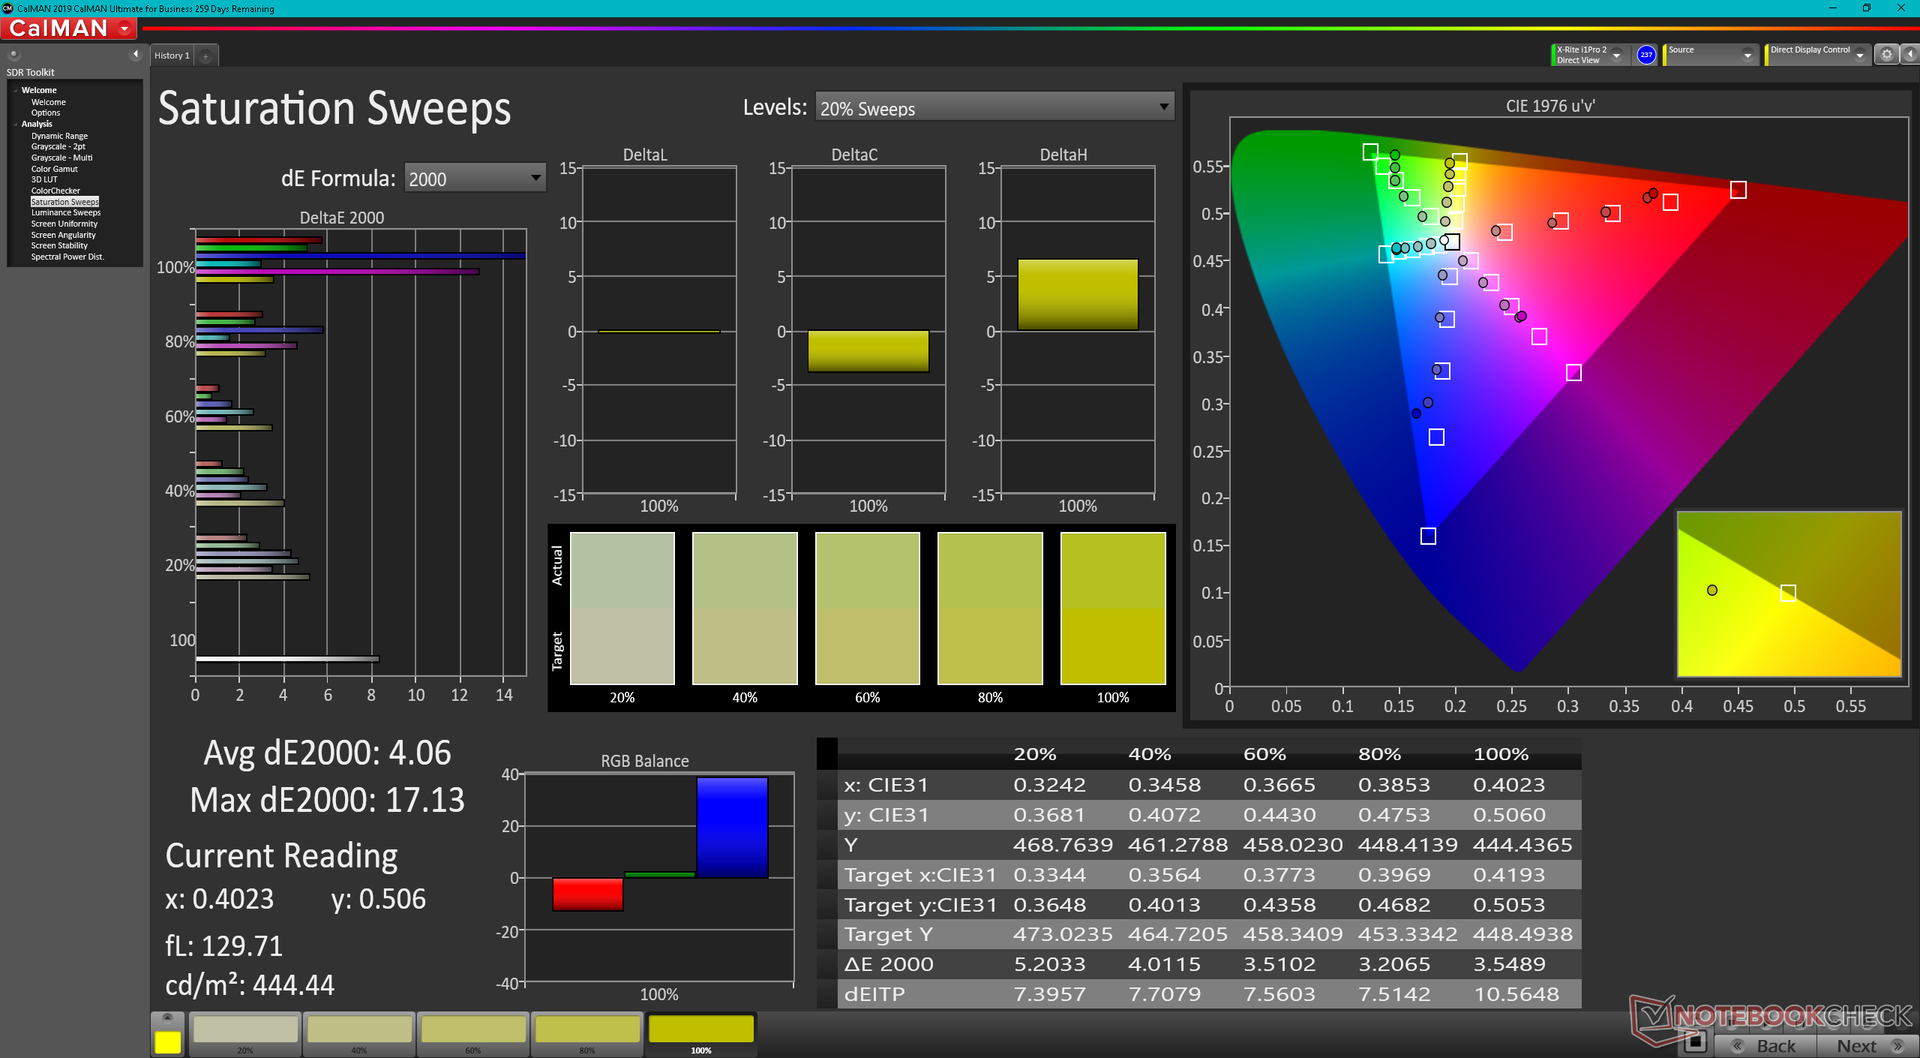
Color space is limited to just 57 percent of sRGB compared to over 90 percent of many consumer Ultrabooks. This system wasn't designed for professional graphics editing, after all.
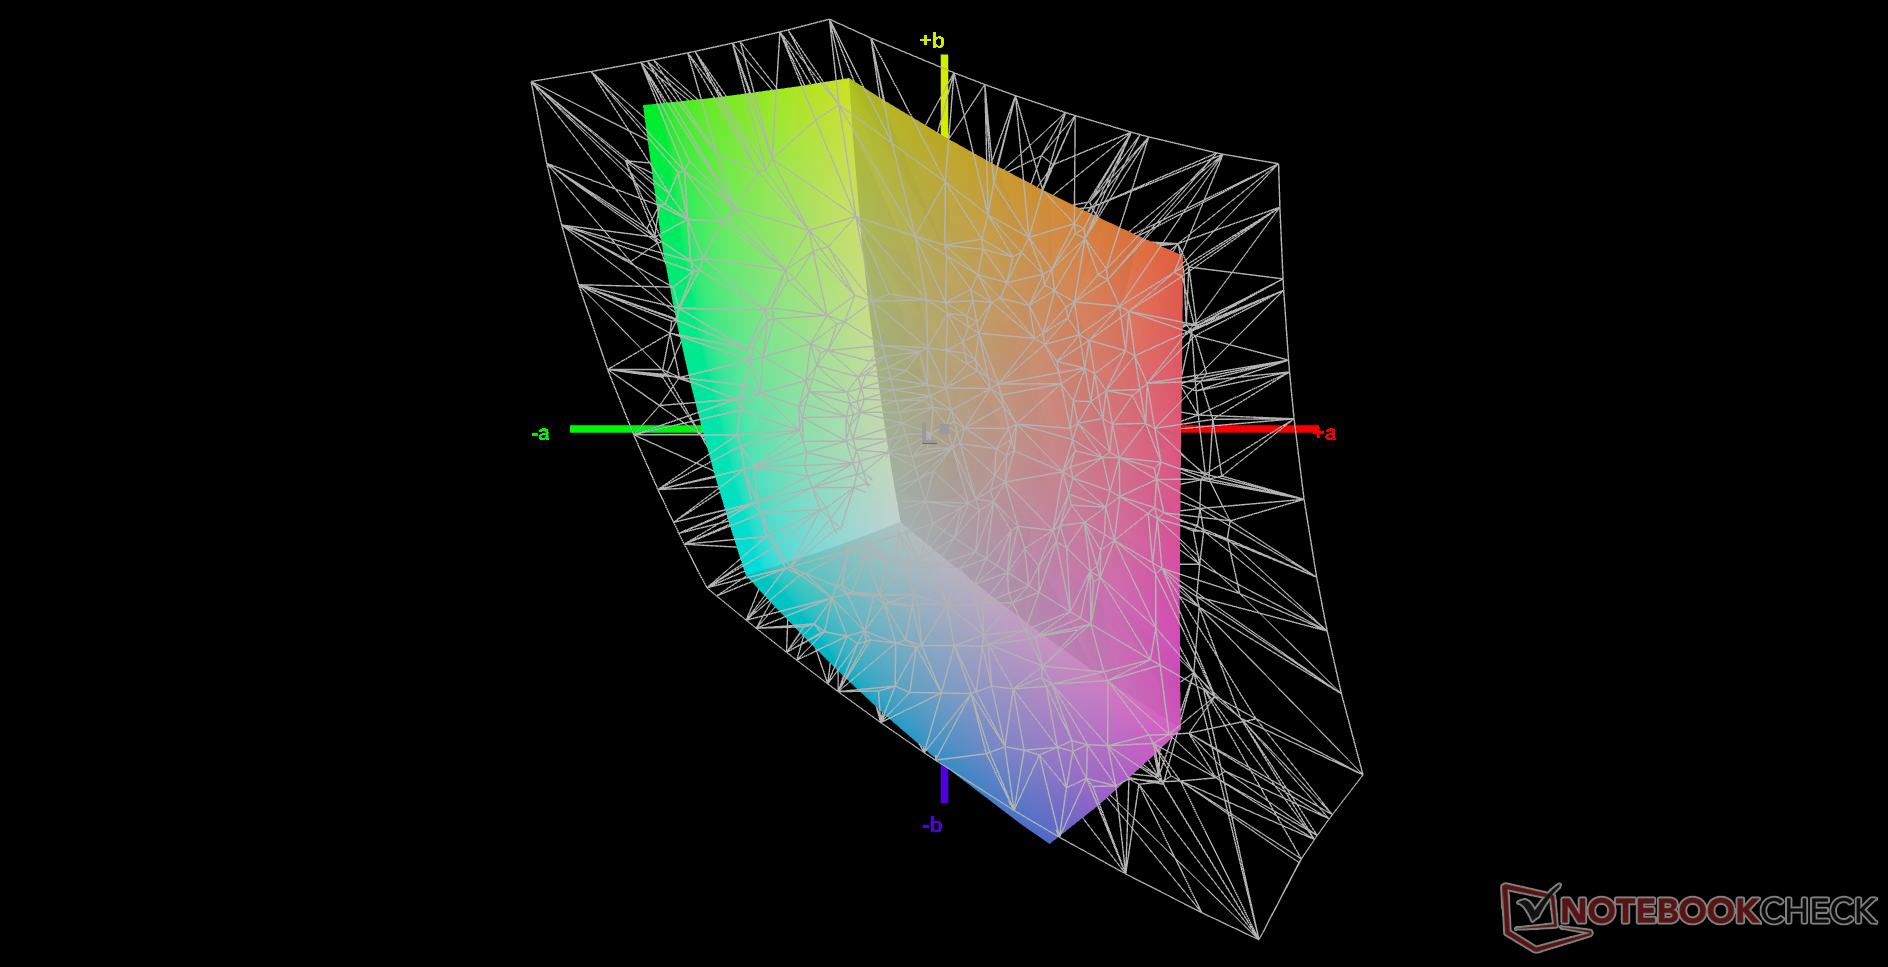
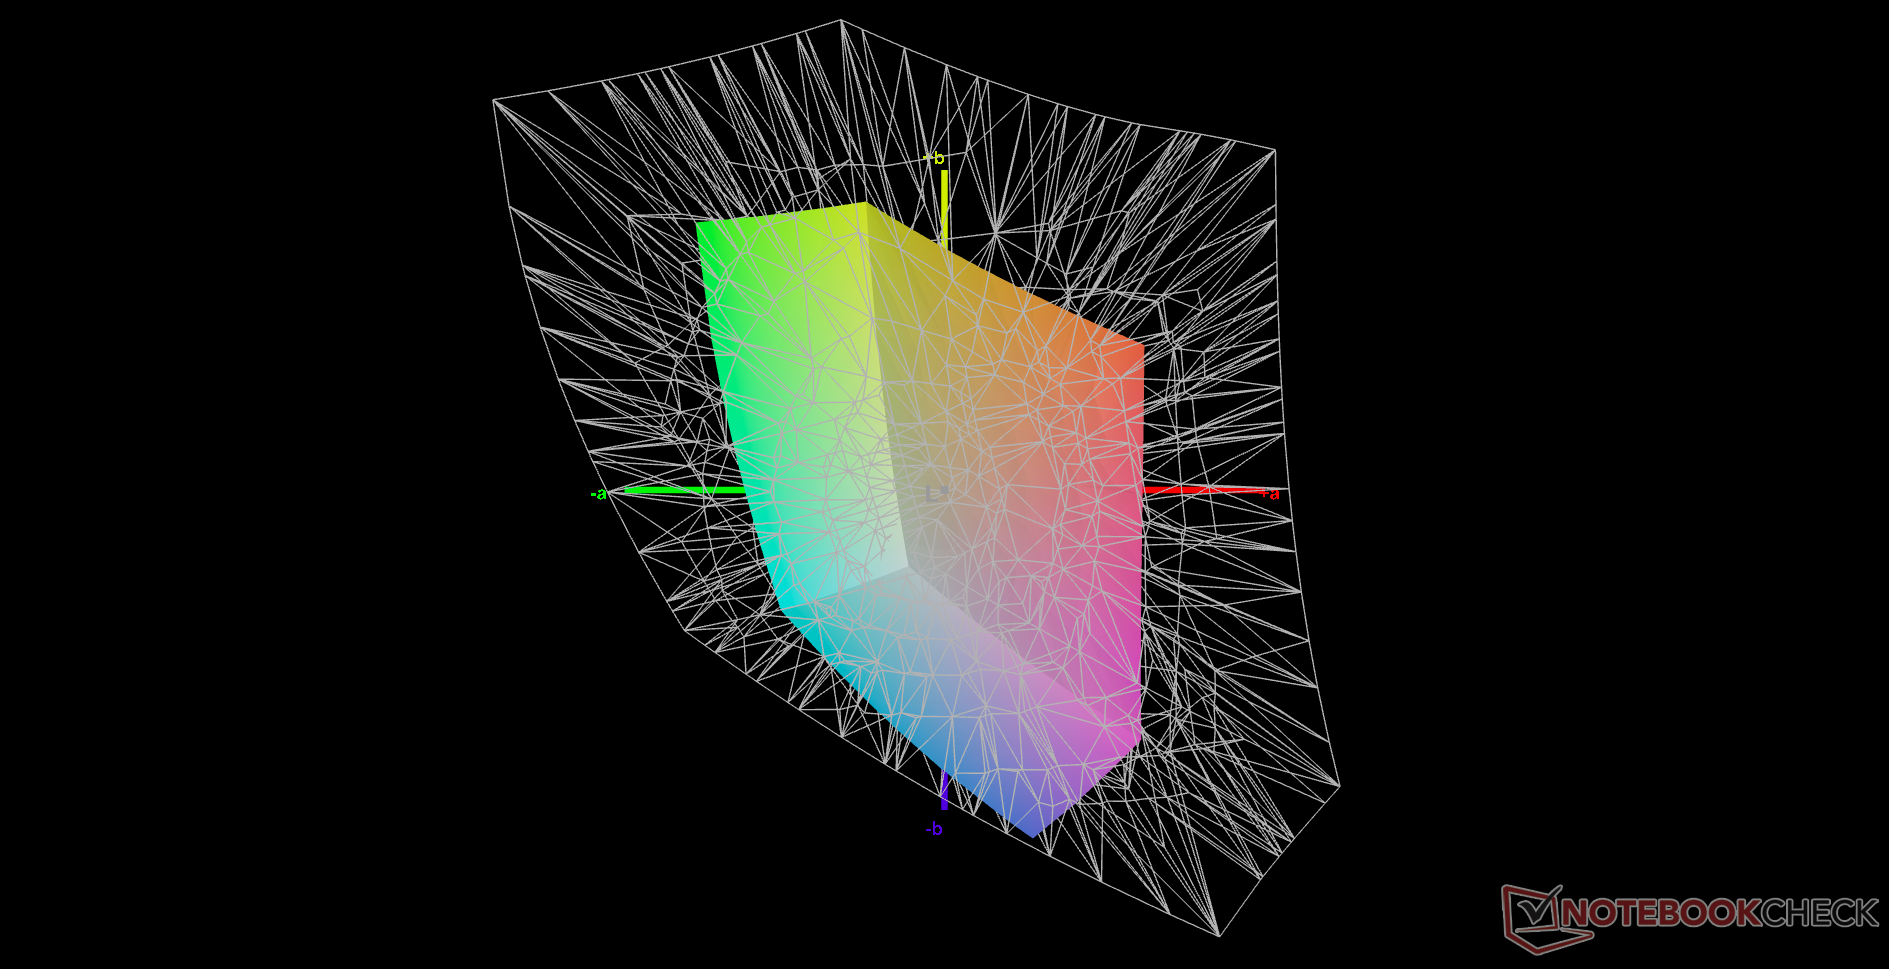
Color temperature is overly cool which is common on panels with very narrow color ranges. Average DeltaE values do not improve significantly even after calibrating with our own X-Rite colorimeter.
Display Response Times
| ↔ Response Time Black to White | ||
|---|---|---|
| 31.2 ms ... rise ↗ and fall ↘ combined | ↗ 19.2 ms rise | 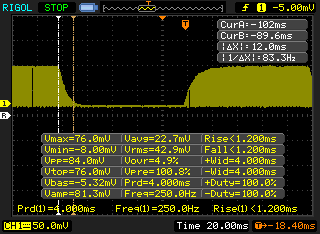 |
| ↘ 12 ms fall | ||
| The screen shows slow response rates in our tests and will be unsatisfactory for gamers. In comparison, all tested devices range from 0.1 (minimum) to 240 (maximum) ms. » 82 % of all devices are better. This means that the measured response time is worse than the average of all tested devices (21.5 ms). | ||
| ↔ Response Time 50% Grey to 80% Grey | ||
| 35.2 ms ... rise ↗ and fall ↘ combined | ↗ 17.6 ms rise | 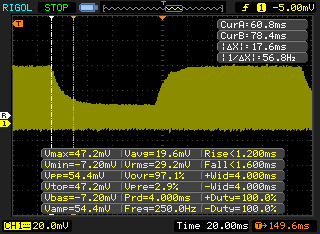 |
| ↘ 17.6 ms fall | ||
| The screen shows slow response rates in our tests and will be unsatisfactory for gamers. In comparison, all tested devices range from 0.2 (minimum) to 636 (maximum) ms. » 43 % of all devices are better. This means that the measured response time is similar to the average of all tested devices (33.7 ms). | ||
Screen Flickering / PWM (Pulse-Width Modulation)
| Screen flickering / PWM detected | 870 Hz | ≤ 100 % brightness setting | 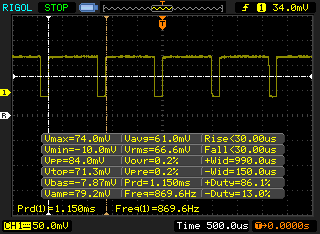 |
The display backlight flickers at 870 Hz (worst case, e.g., utilizing PWM) Flickering detected at a brightness setting of 100 % and below. There should be no flickering or PWM above this brightness setting. The frequency of 870 Hz is quite high, so most users sensitive to PWM should not notice any flickering. In comparison: 53 % of all tested devices do not use PWM to dim the display. If PWM was detected, an average of 17900 (minimum: 5 - maximum: 3846000) Hz was measured. | |||
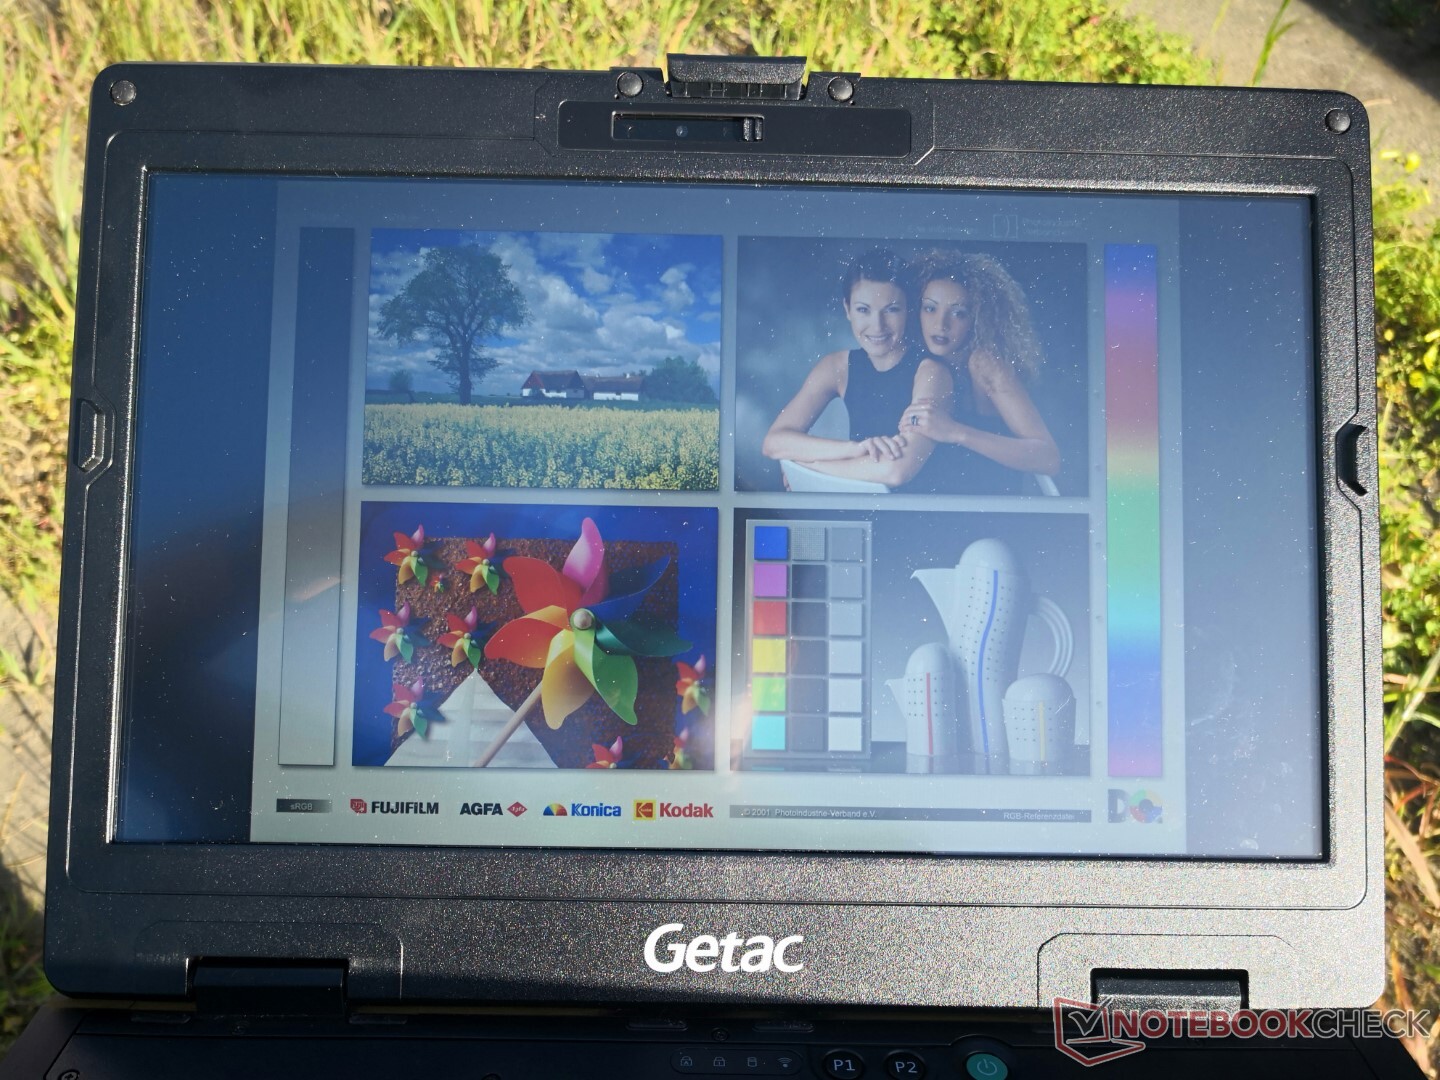
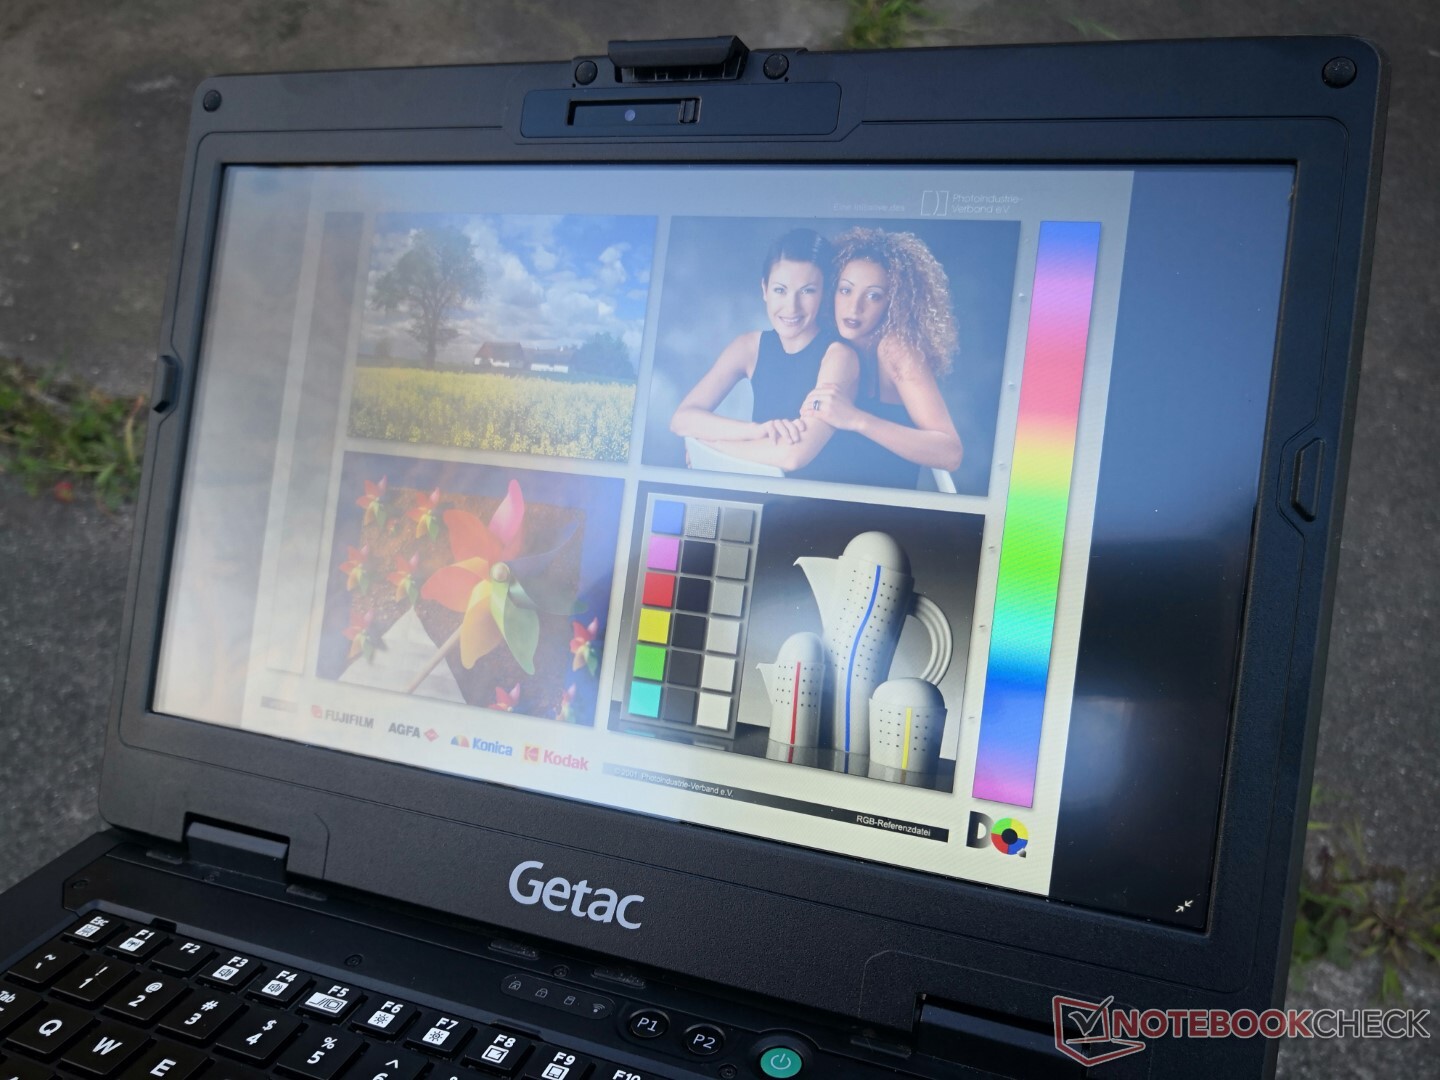
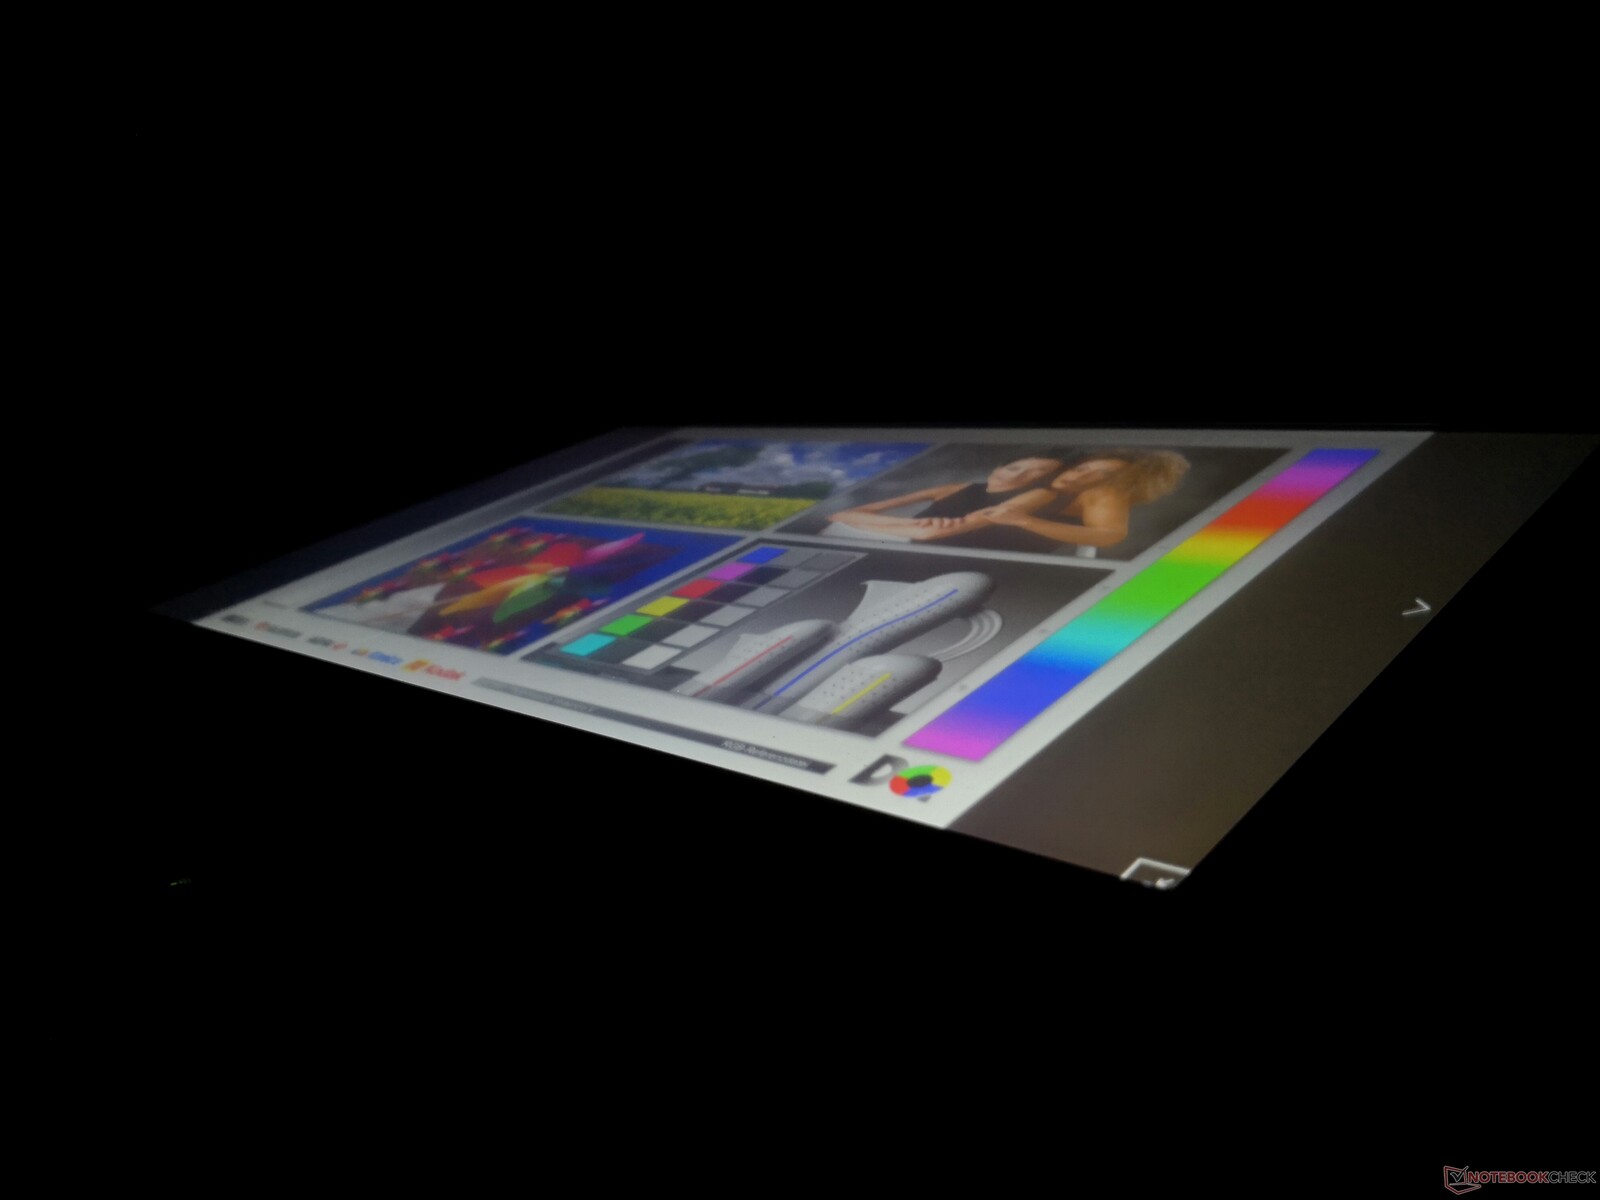
Outdoor visibility is good especially when under shade. Nonetheless, brighter displays do exist such as on the Dell Latitude 7330 Rugged Extreme and its 1400-nit panel.
Performance
Testing Conditions
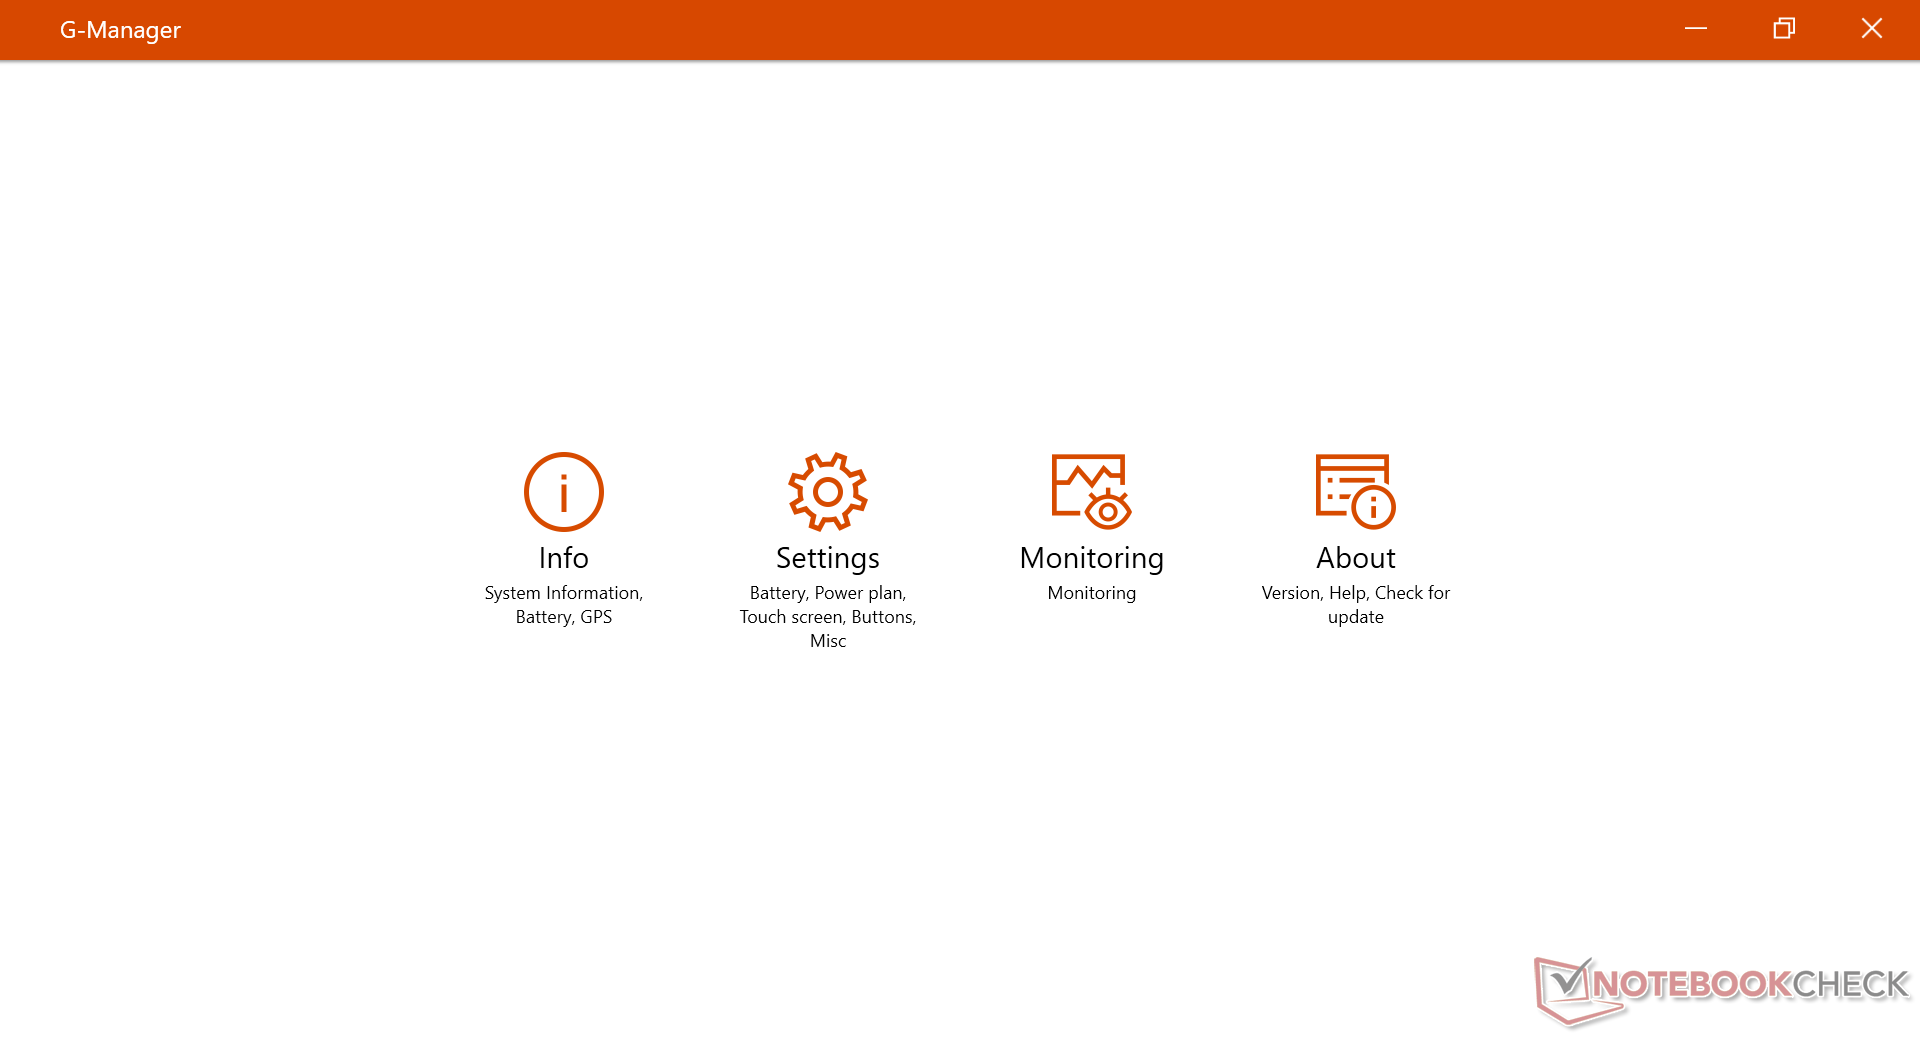
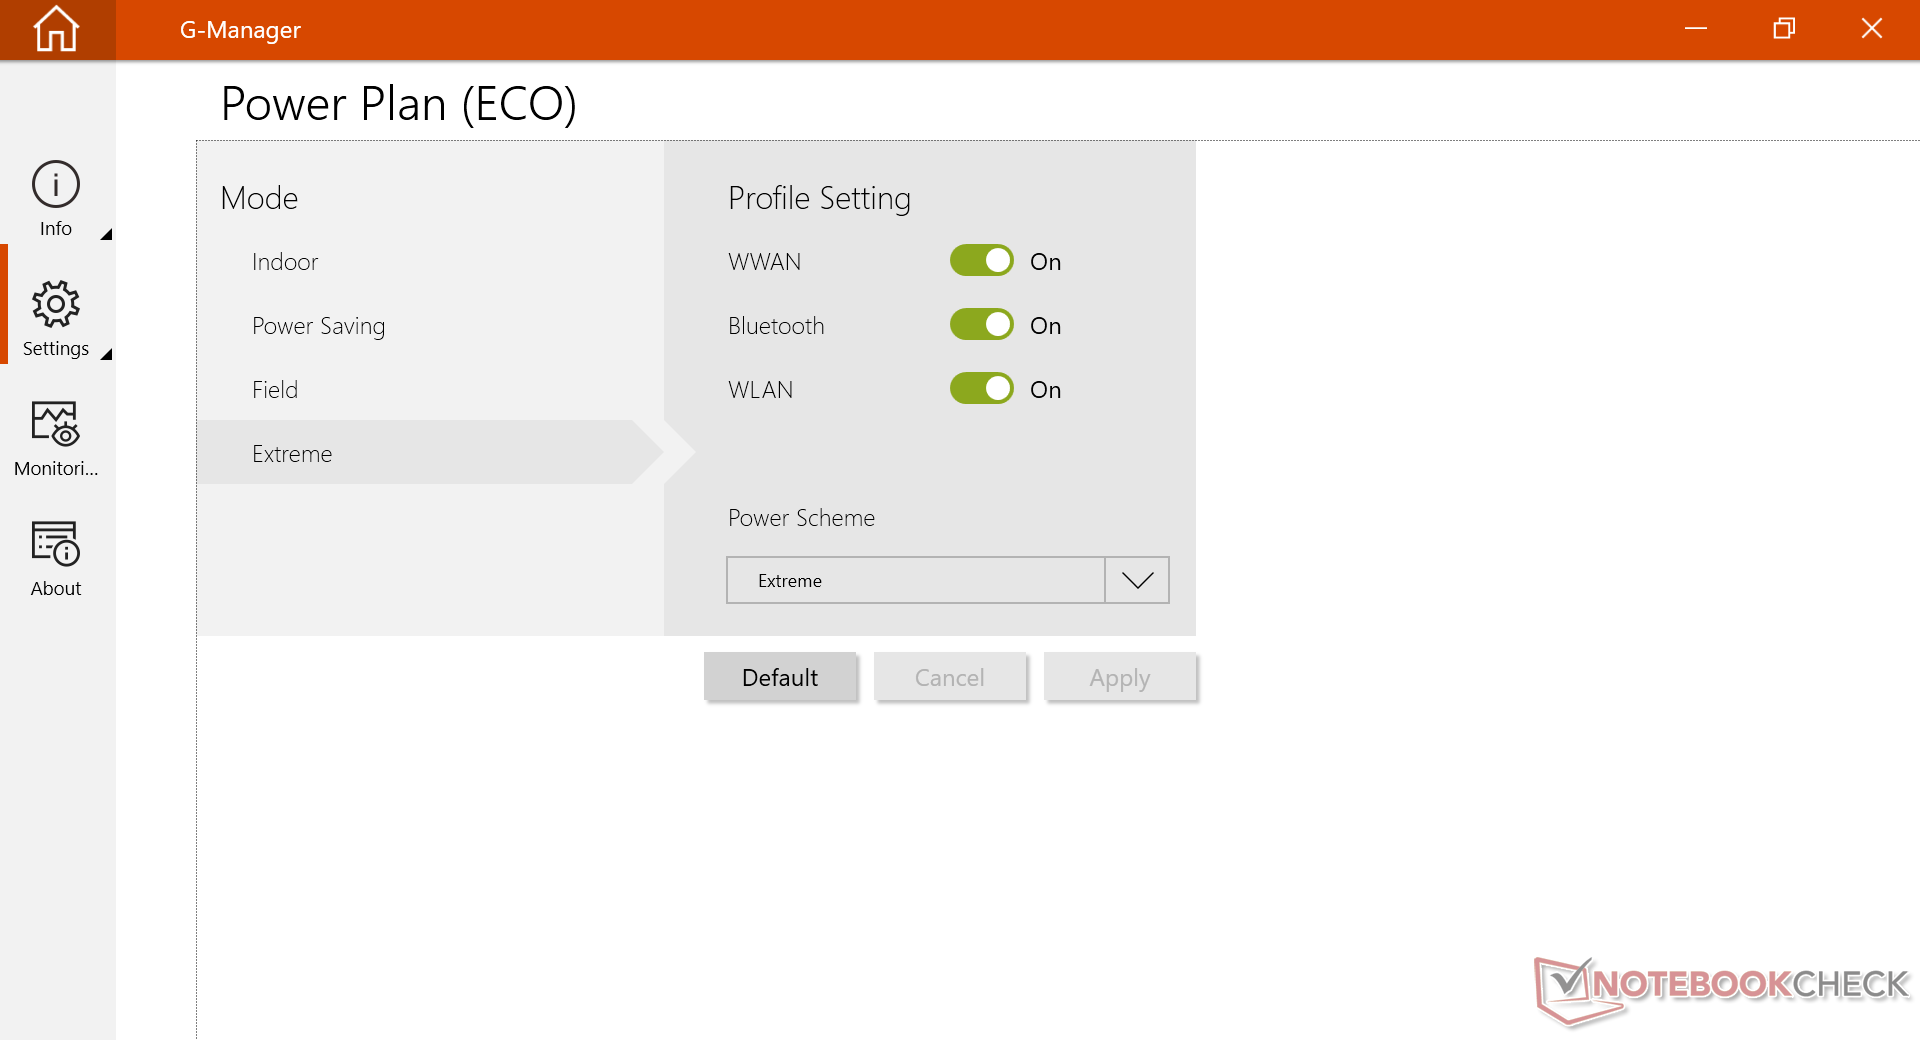
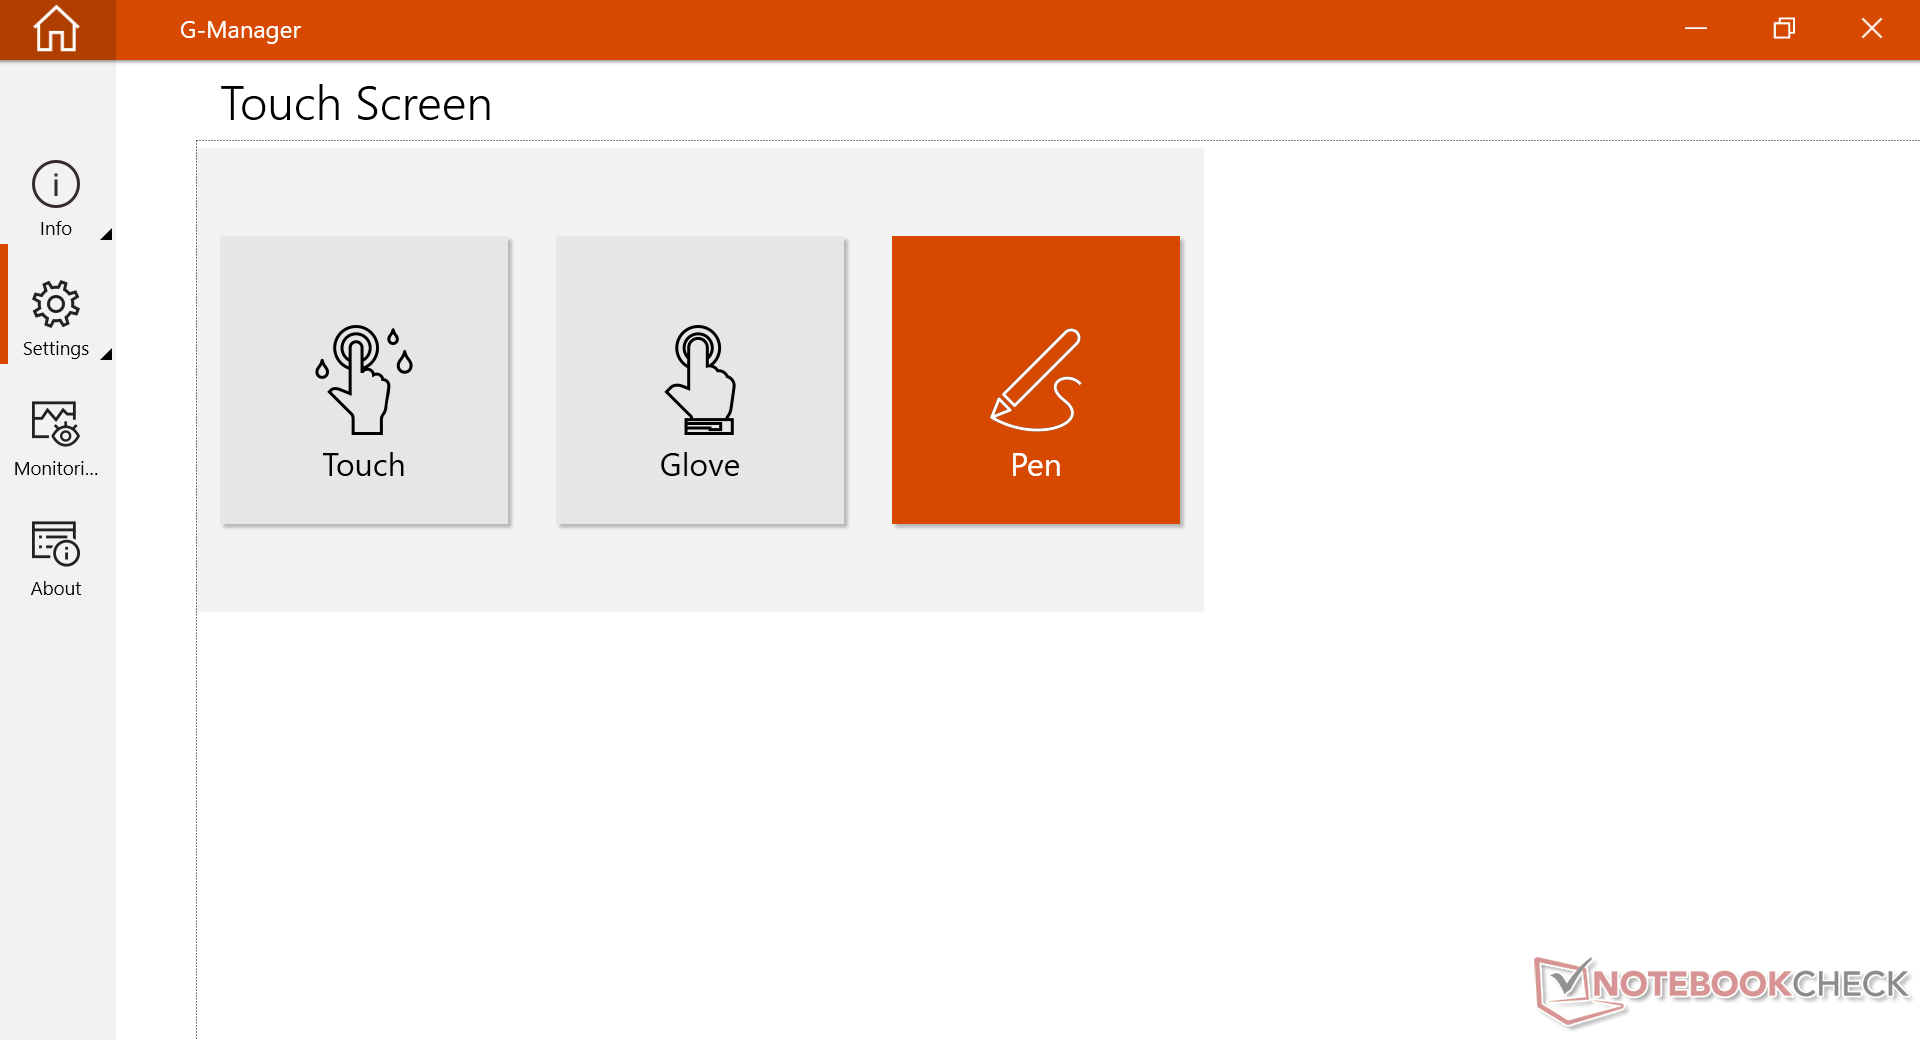
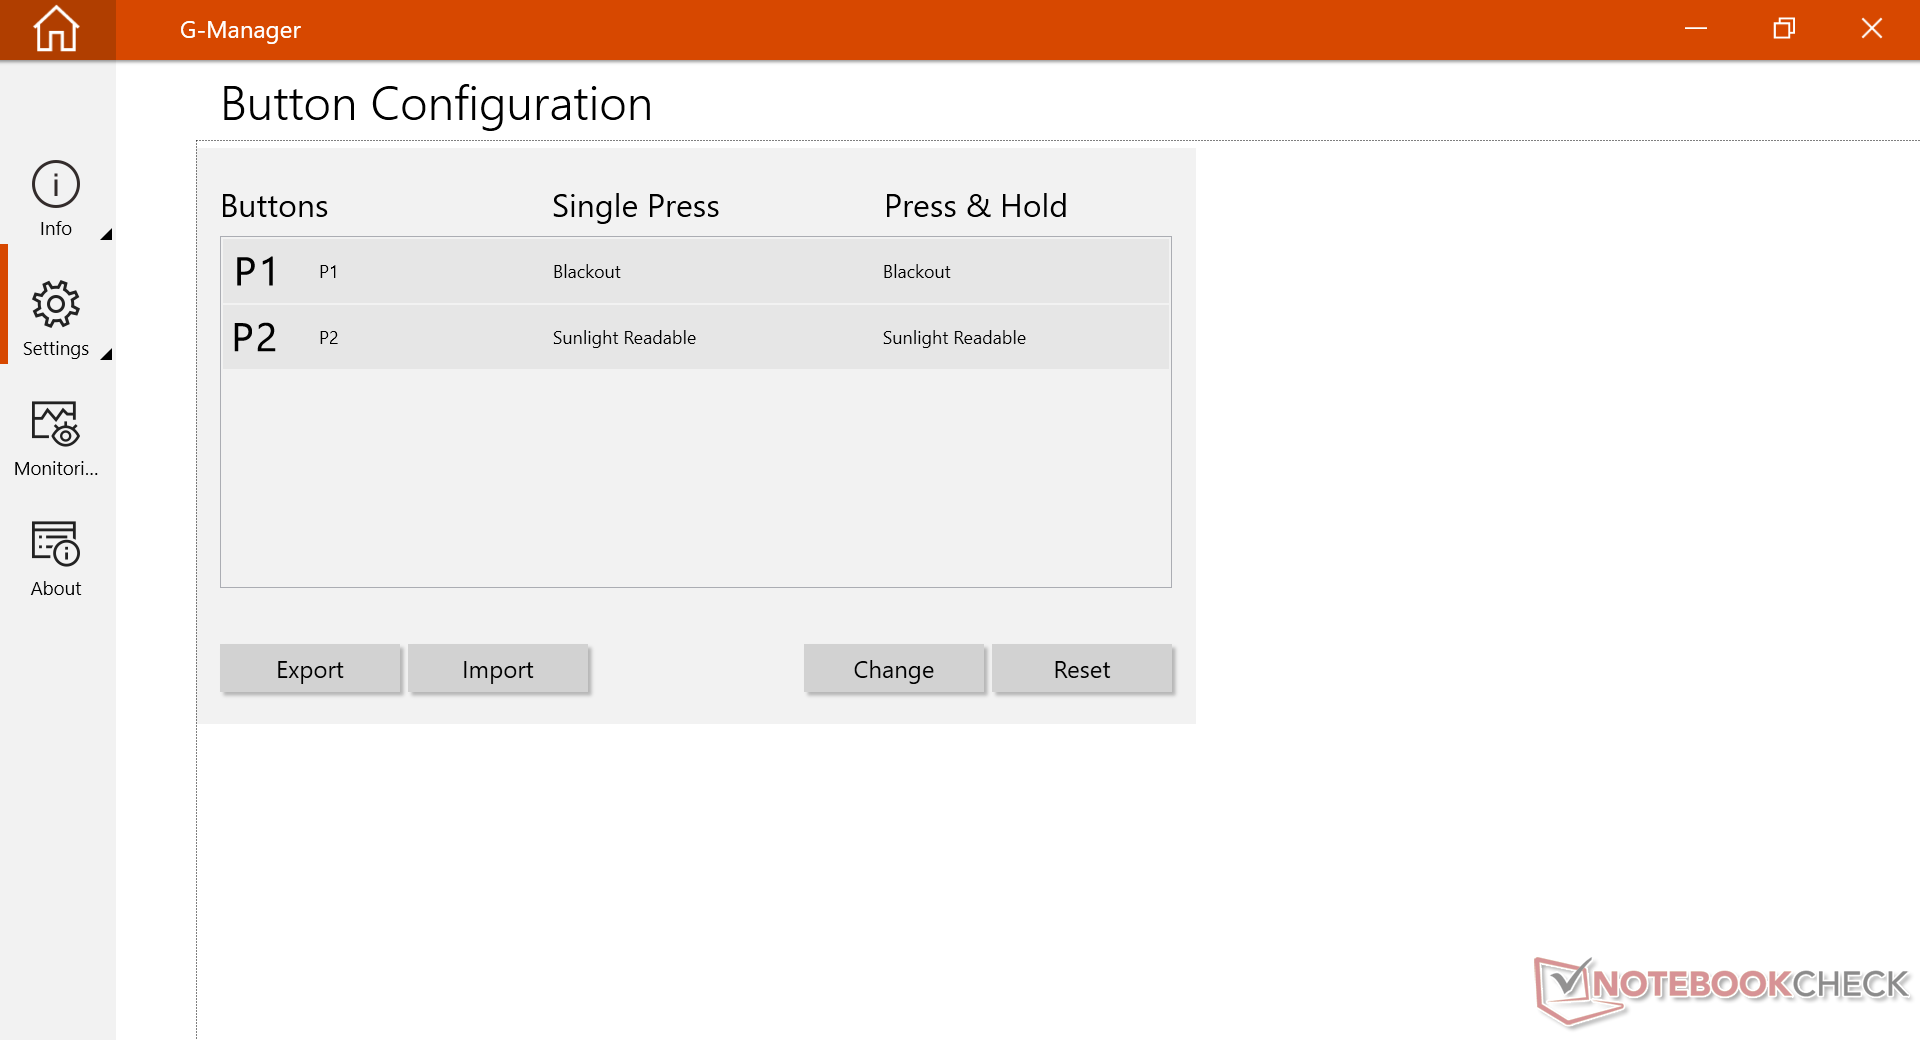
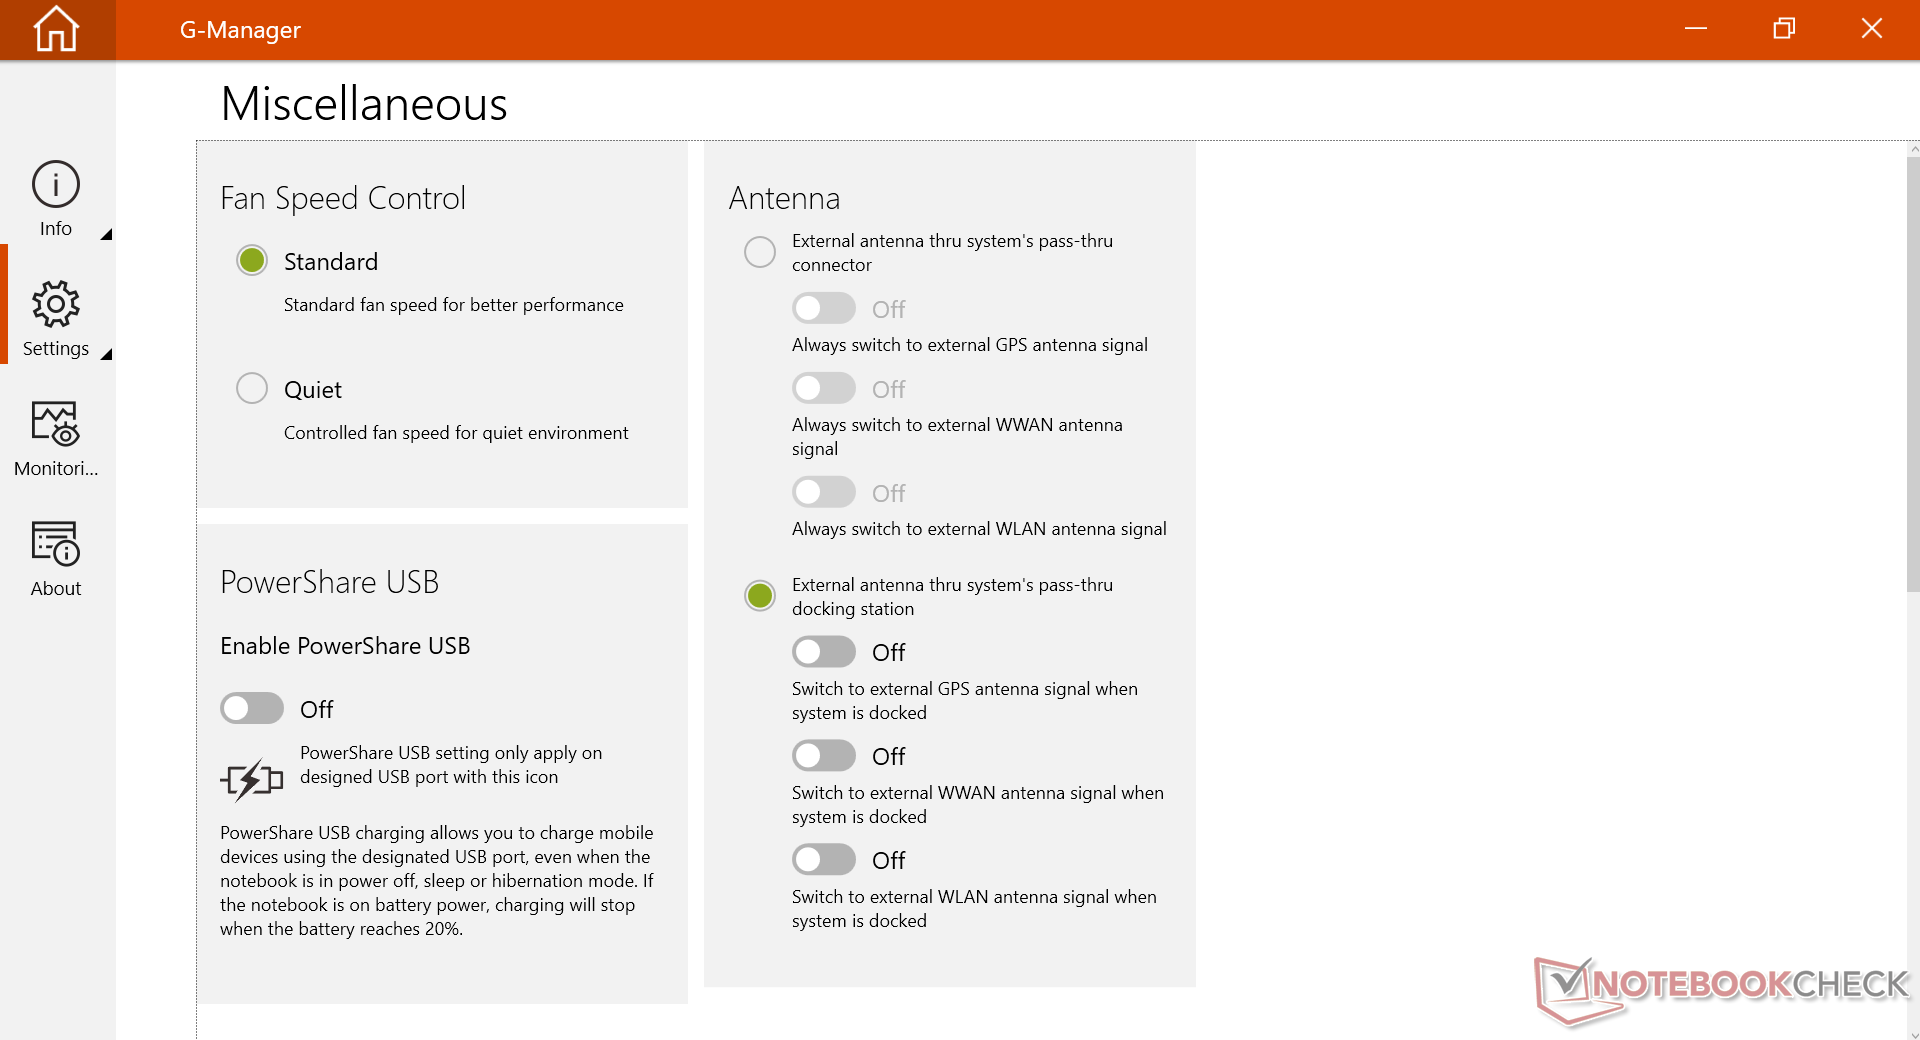
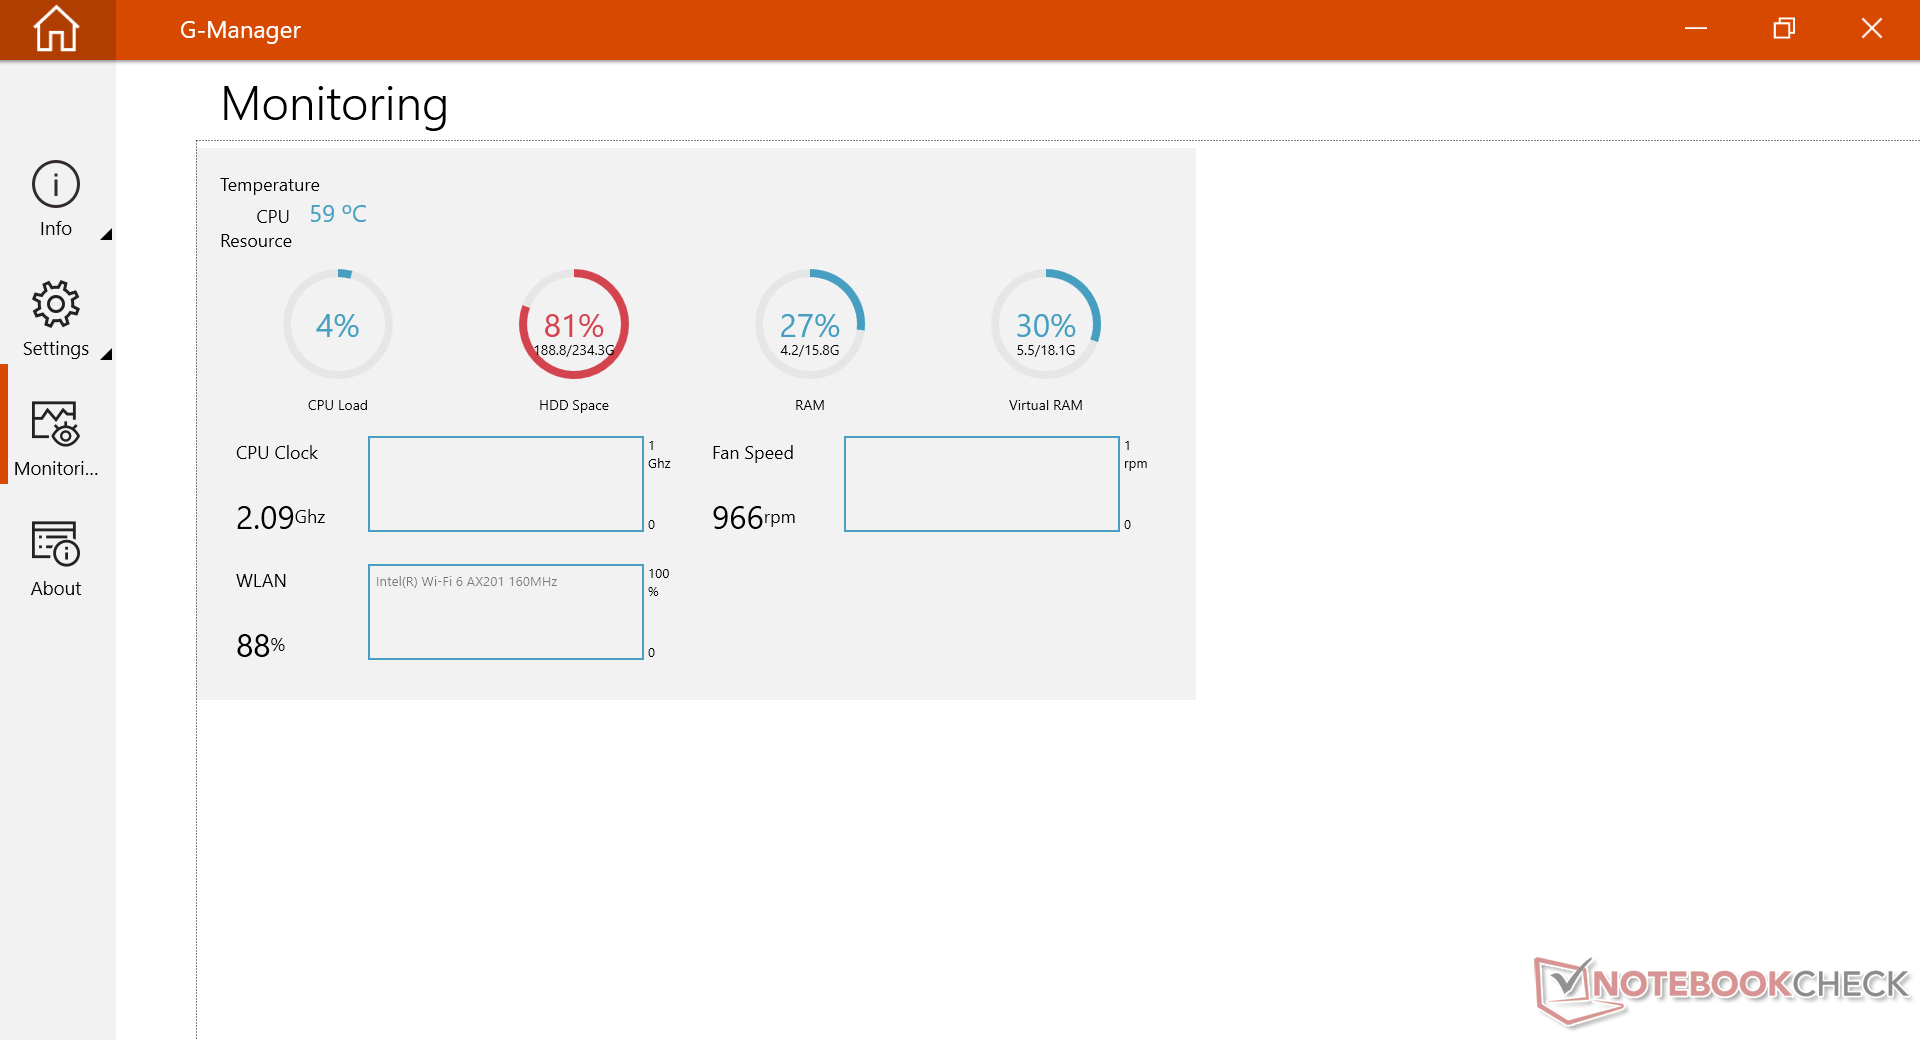
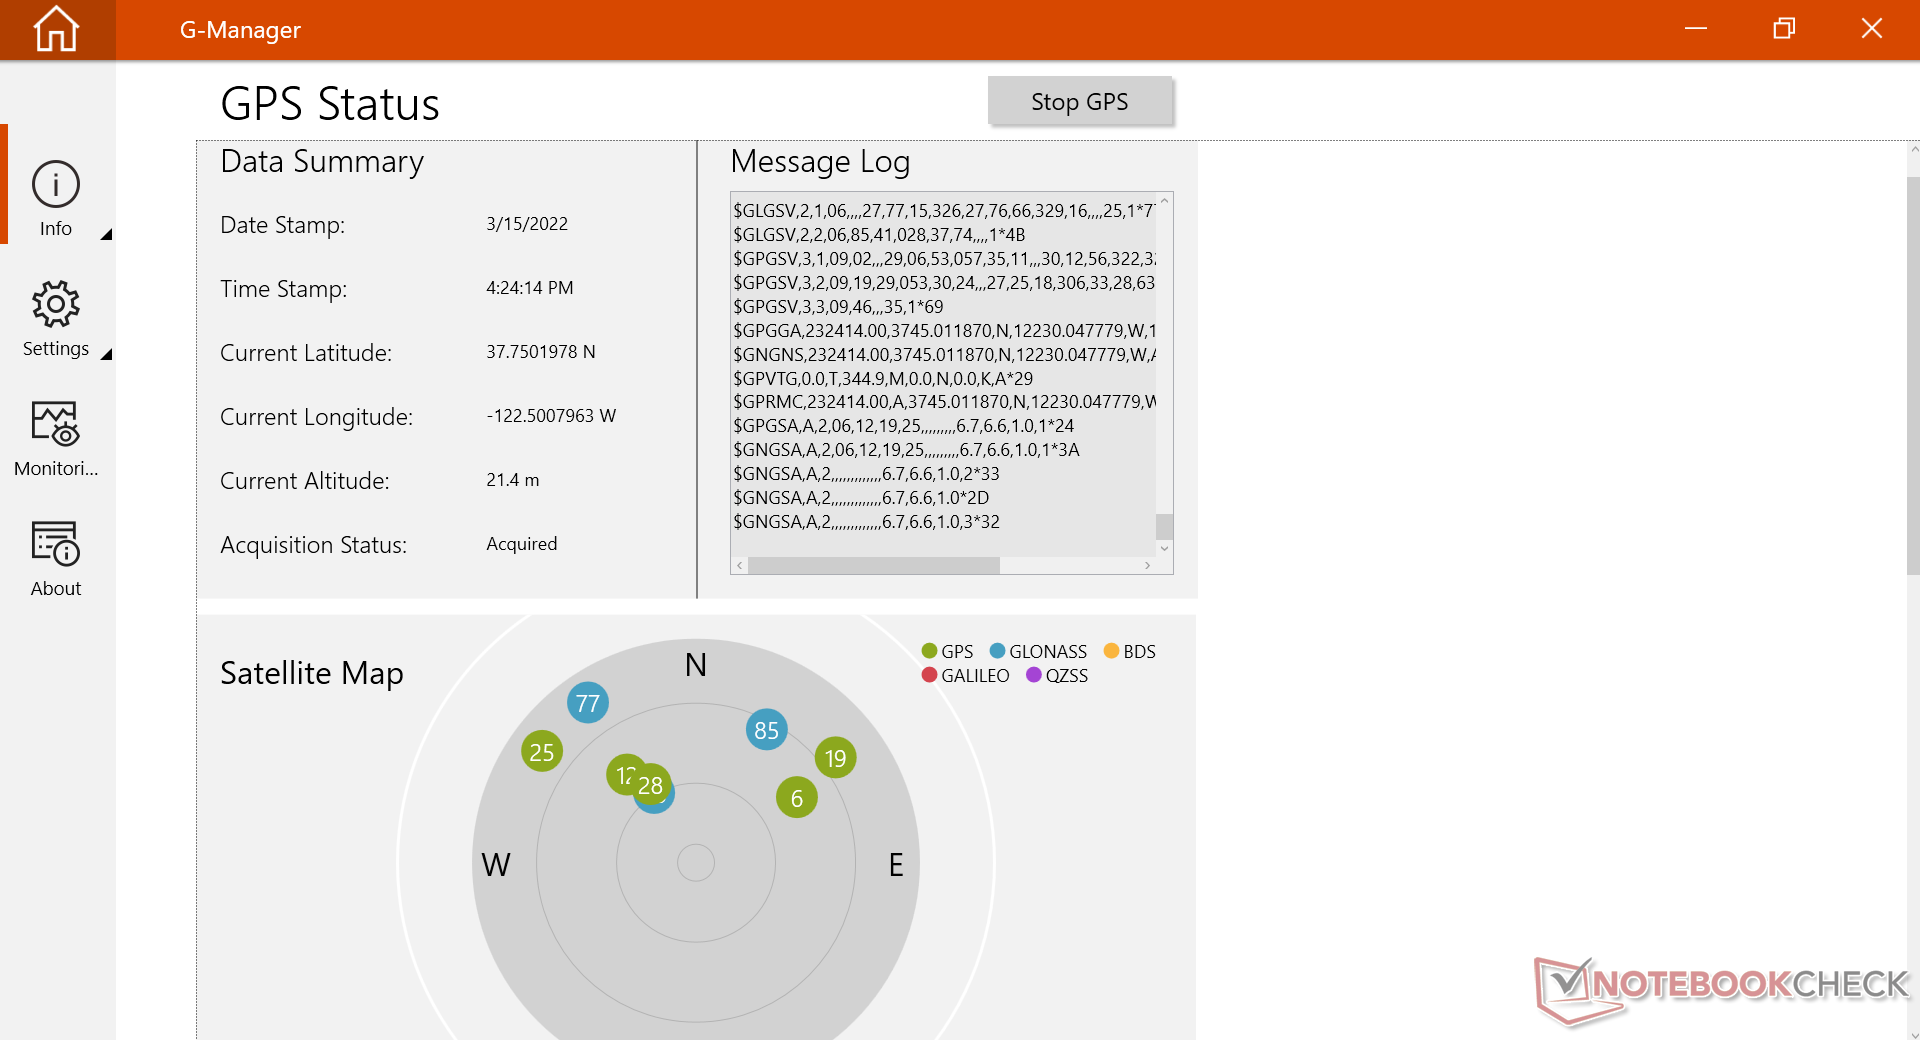
Our unit was set to the Extreme power plan via the G-Manager software prior to running any performance benchmarks below for the highest possible scores. We recommend users become familiar with this software as key features and updates are toggled here.

Processor
Raw single-thread and multi-thread performance is about 30 percent and 50 percent faster, respectively, than the Core i7-8550U in the original S410. Opting for the lesser Core i5-1135G7 or Core i5-1145G7 is only expected to impact processor performance by about 10 to 15 percent.
Cinebench R15 Multi Loop
Cinebench R20: CPU (Multi Core) | CPU (Single Core)
Cinebench R23: Multi Core | Single Core
Blender: v2.79 BMW27 CPU
7-Zip 18.03: 7z b 4 | 7z b 4 -mmt1
Geekbench 5.5: Multi-Core | Single-Core
HWBOT x265 Benchmark v2.2: 4k Preset
LibreOffice : 20 Documents To PDF
R Benchmark 2.5: Overall mean
| Cinebench R20 / CPU (Multi Core) | |
| Lenovo ThinkPad L15 G2 AMD | |
| Acer Swift 3 SF314-43-R8BP | |
| Dell Latitude 14 5420-D2G5W | |
| Average Intel Core i7-1185G7 (1425 - 2493, n=28) | |
| Getac S410 Gen 4 | |
| Asus ExpertBook B7 Flip B7402FEA | |
| Dell Latitude 7420 JW6MH | |
| Dell Latitude 5320-TM4V2 | |
| Getac B360 | |
| Infinix INBook X2 | |
| BMAX X14 Pro | |
| Cinebench R20 / CPU (Single Core) | |
| Asus ExpertBook B7 Flip B7402FEA | |
| Average Intel Core i7-1185G7 (489 - 593, n=28) | |
| Getac S410 Gen 4 | |
| Lenovo ThinkPad L15 G2 AMD | |
| Dell Latitude 7420 JW6MH | |
| Dell Latitude 14 5420-D2G5W | |
| Dell Latitude 5320-TM4V2 | |
| Acer Swift 3 SF314-43-R8BP | |
| Getac B360 | |
| Infinix INBook X2 | |
| BMAX X14 Pro | |
| Cinebench R23 / Single Core | |
| Asus ExpertBook B7 Flip B7402FEA | |
| Average Intel Core i7-1185G7 (1251 - 1532, n=24) | |
| Getac S410 Gen 4 | |
| Dell Latitude 7420 JW6MH | |
| Lenovo ThinkPad L15 G2 AMD | |
| Dell Latitude 14 5420-D2G5W | |
| Dell Latitude 5320-TM4V2 | |
| Acer Swift 3 SF314-43-R8BP | |
| Infinix INBook X2 | |
| BMAX X14 Pro | |
| Getac B360 | |
| Geekbench 5.5 / Single-Core | |
| Asus ExpertBook B7 Flip B7402FEA | |
| Average Intel Core i7-1185G7 (1398 - 1626, n=21) | |
| Getac S410 Gen 4 | |
| Dell Latitude 7420 JW6MH | |
| Lenovo ThinkPad L15 G2 AMD | |
| Dell Latitude 5320-TM4V2 | |
| Getac B360 | |
| Dell Latitude 14 5420-D2G5W | |
| Infinix INBook X2 | |
| Acer Swift 3 SF314-43-R8BP | |
| BMAX X14 Pro | |
| HWBOT x265 Benchmark v2.2 / 4k Preset | |
| Lenovo ThinkPad L15 G2 AMD | |
| Acer Swift 3 SF314-43-R8BP | |
| Asus ExpertBook B7 Flip B7402FEA | |
| Getac S410 Gen 4 | |
| Average Intel Core i7-1185G7 (5.02 - 8.13, n=27) | |
| Dell Latitude 14 5420-D2G5W | |
| Getac B360 | |
| Dell Latitude 7420 JW6MH | |
| Infinix INBook X2 | |
| BMAX X14 Pro | |
| LibreOffice / 20 Documents To PDF | |
| BMAX X14 Pro | |
| Acer Swift 3 SF314-43-R8BP | |
| Infinix INBook X2 | |
| Dell Latitude 5320-TM4V2 | |
| Dell Latitude 14 5420-D2G5W | |
| Dell Latitude 7420 JW6MH | |
| Getac S410 Gen 4 | |
| Average Intel Core i7-1185G7 (41.3 - 61.7, n=26) | |
| Lenovo ThinkPad L15 G2 AMD | |
| Asus ExpertBook B7 Flip B7402FEA | |
| R Benchmark 2.5 / Overall mean | |
| BMAX X14 Pro | |
| Infinix INBook X2 | |
| Getac B360 | |
| Dell Latitude 14 5420-D2G5W | |
| Dell Latitude 5320-TM4V2 | |
| Acer Swift 3 SF314-43-R8BP | |
| Dell Latitude 7420 JW6MH | |
| Getac S410 Gen 4 | |
| Average Intel Core i7-1185G7 (0.55 - 0.615, n=27) | |
| Asus ExpertBook B7 Flip B7402FEA | |
| Lenovo ThinkPad L15 G2 AMD | |
Cinebench R20: CPU (Multi Core) | CPU (Single Core)
Cinebench R23: Multi Core | Single Core
Blender: v2.79 BMW27 CPU
7-Zip 18.03: 7z b 4 | 7z b 4 -mmt1
Geekbench 5.5: Multi-Core | Single-Core
HWBOT x265 Benchmark v2.2: 4k Preset
LibreOffice : 20 Documents To PDF
R Benchmark 2.5: Overall mean
* ... smaller is better
AIDA64: FP32 Ray-Trace | FPU Julia | CPU SHA3 | CPU Queen | FPU SinJulia | FPU Mandel | CPU AES | CPU ZLib | FP64 Ray-Trace | CPU PhotoWorxx
| Performance Rating | |
| Asus ExpertBook B7 Flip B7402FEA | |
| Dell Latitude 14 5420-D2G5W | |
| Average Intel Core i7-1185G7 | |
| Getac S410 Gen 4 | |
| Getac B360 | |
| Infinix INBook X2 | |
| AIDA64 / FP32 Ray-Trace | |
| Dell Latitude 14 5420-D2G5W | |
| Asus ExpertBook B7 Flip B7402FEA | |
| Average Intel Core i7-1185G7 (5621 - 7453, n=20) | |
| Getac S410 Gen 4 | |
| Getac B360 | |
| Infinix INBook X2 | |
| AIDA64 / FPU Julia | |
| Dell Latitude 14 5420-D2G5W | |
| Asus ExpertBook B7 Flip B7402FEA | |
| Average Intel Core i7-1185G7 (23248 - 32614, n=20) | |
| Getac B360 | |
| Getac S410 Gen 4 | |
| Infinix INBook X2 | |
| AIDA64 / CPU SHA3 | |
| Dell Latitude 14 5420-D2G5W | |
| Asus ExpertBook B7 Flip B7402FEA | |
| Average Intel Core i7-1185G7 (1530 - 2209, n=20) | |
| Getac S410 Gen 4 | |
| Infinix INBook X2 | |
| Getac B360 | |
| AIDA64 / CPU Queen | |
| Getac B360 | |
| Asus ExpertBook B7 Flip B7402FEA | |
| Average Intel Core i7-1185G7 (44677 - 52815, n=20) | |
| Getac S410 Gen 4 | |
| Dell Latitude 14 5420-D2G5W | |
| Infinix INBook X2 | |
| AIDA64 / FPU SinJulia | |
| Asus ExpertBook B7 Flip B7402FEA | |
| Getac B360 | |
| Average Intel Core i7-1185G7 (3870 - 5027, n=20) | |
| Dell Latitude 14 5420-D2G5W | |
| Getac S410 Gen 4 | |
| Infinix INBook X2 | |
| AIDA64 / FPU Mandel | |
| Dell Latitude 14 5420-D2G5W | |
| Asus ExpertBook B7 Flip B7402FEA | |
| Average Intel Core i7-1185G7 (14584 - 19594, n=20) | |
| Getac S410 Gen 4 | |
| Getac B360 | |
| Infinix INBook X2 | |
| AIDA64 / CPU AES | |
| Asus ExpertBook B7 Flip B7402FEA | |
| Dell Latitude 14 5420-D2G5W | |
| Infinix INBook X2 | |
| Average Intel Core i7-1185G7 (33002 - 76826, n=20) | |
| Getac S410 Gen 4 | |
| Getac B360 | |
| AIDA64 / CPU ZLib | |
| Asus ExpertBook B7 Flip B7402FEA | |
| Dell Latitude 14 5420-D2G5W | |
| Getac B360 | |
| Getac S410 Gen 4 | |
| Average Intel Core i7-1185G7 (258 - 412, n=22) | |
| Infinix INBook X2 | |
| AIDA64 / FP64 Ray-Trace | |
| Dell Latitude 14 5420-D2G5W | |
| Asus ExpertBook B7 Flip B7402FEA | |
| Average Intel Core i7-1185G7 (2821 - 4094, n=20) | |
| Getac S410 Gen 4 | |
| Getac B360 | |
| Infinix INBook X2 | |
| AIDA64 / CPU PhotoWorxx | |
| Average Intel Core i7-1185G7 (22349 - 43701, n=20) | |
| Infinix INBook X2 | |
| Getac S410 Gen 4 | |
| Getac B360 | |
| Asus ExpertBook B7 Flip B7402FEA | |
| Dell Latitude 14 5420-D2G5W | |
System Performance
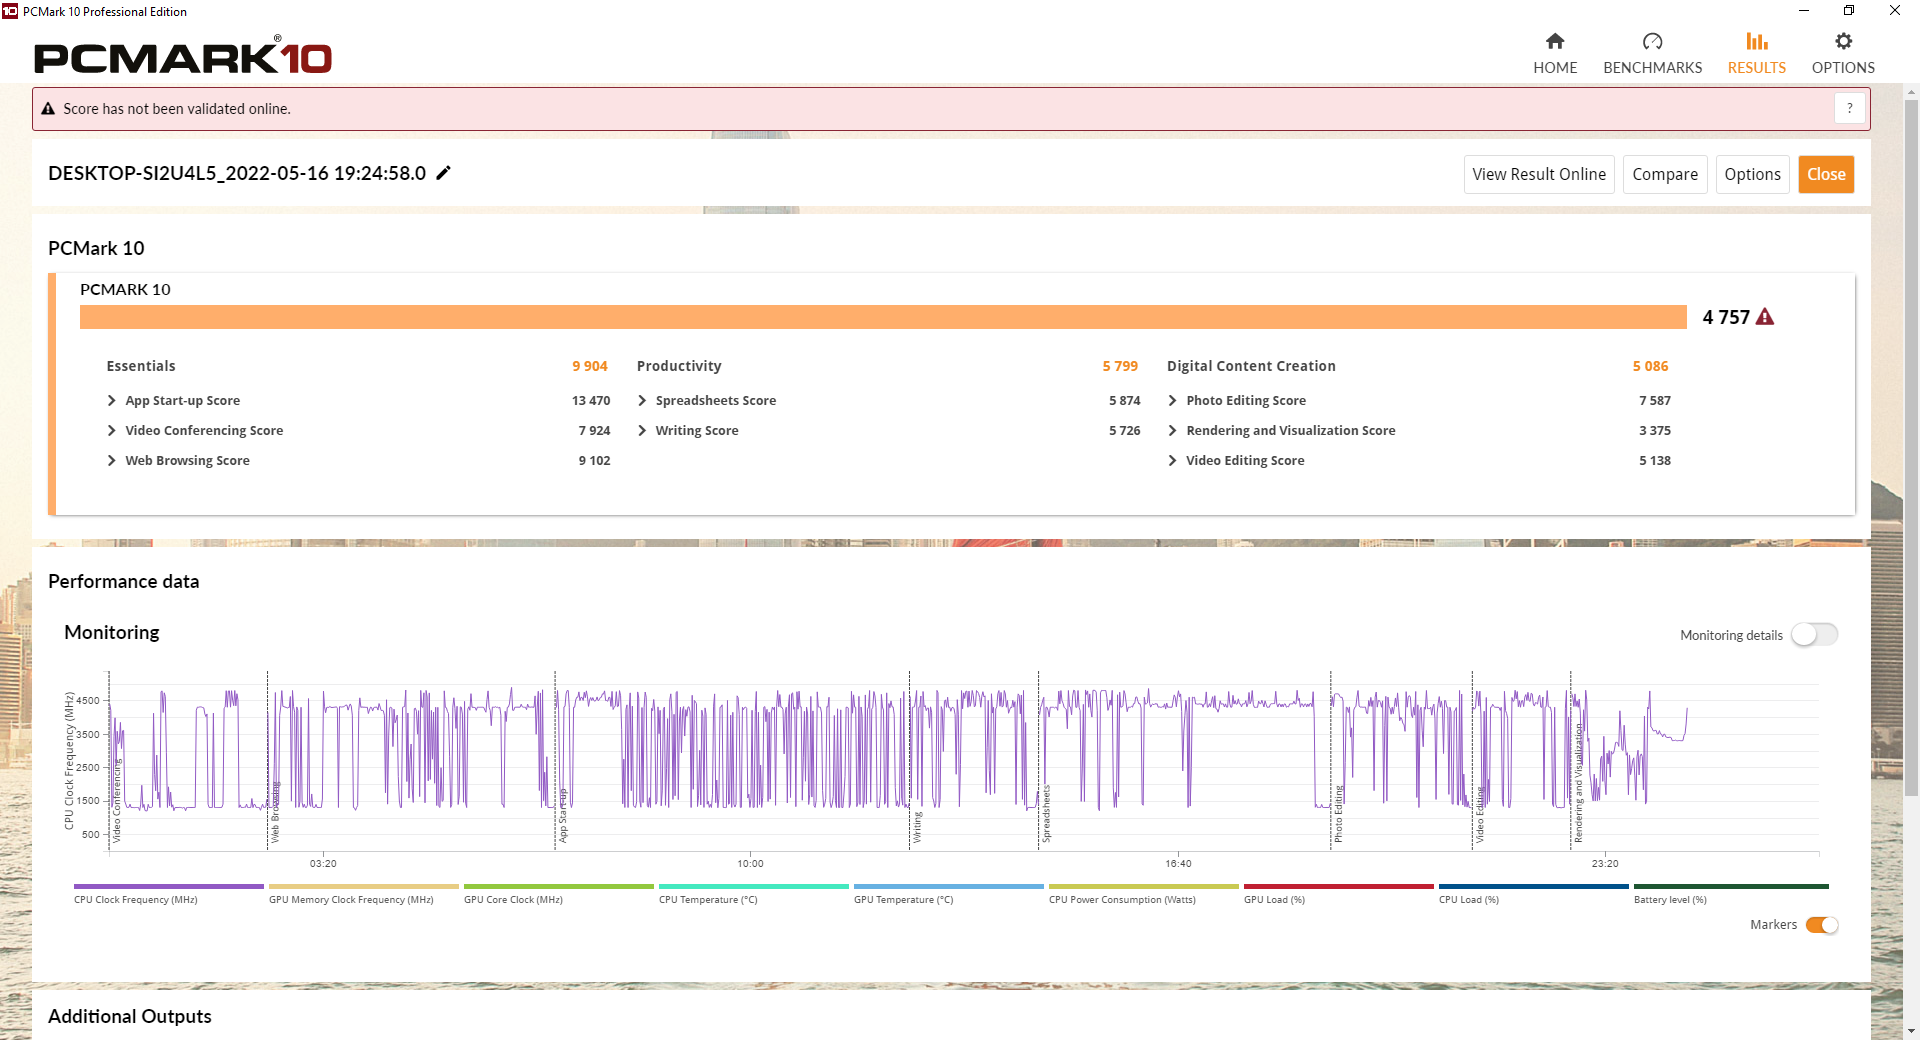
PCMark results are higher than what we observed on the S410 Gen 1 aside from the Productivity subtest likely due to the slower-than-expected SSD performance on our unit as shown in the next section below. The biggest gain can be seen in the Digital Content Creation subtest due to the performance benefits of Iris Xe over the much older UHD Graphics 620.
CrossMark: Overall | Productivity | Creativity | Responsiveness
| PCMark 10 / Score | |
| Asus ExpertBook B7 Flip B7402FEA | |
| MSI Prestige 14 A10SC-009 | |
| Average Intel Core i7-1185G7, Intel Iris Xe Graphics G7 96EUs (4746 - 5561, n=20) | |
| Getac S410 Gen 4 | |
| Dell Latitude 14 5420-D2G5W | |
| Infinix INBook X2 | |
| Getac B360 | |
| Getac S410 | |
| PCMark 10 / Essentials | |
| Asus ExpertBook B7 Flip B7402FEA | |
| Getac S410 Gen 4 | |
| Average Intel Core i7-1185G7, Intel Iris Xe Graphics G7 96EUs (8279 - 10664, n=20) | |
| Getac B360 | |
| Dell Latitude 14 5420-D2G5W | |
| MSI Prestige 14 A10SC-009 | |
| Infinix INBook X2 | |
| Getac S410 | |
| PCMark 10 / Productivity | |
| Getac B360 | |
| Asus ExpertBook B7 Flip B7402FEA | |
| Getac S410 | |
| MSI Prestige 14 A10SC-009 | |
| Average Intel Core i7-1185G7, Intel Iris Xe Graphics G7 96EUs (5799 - 8770, n=20) | |
| Dell Latitude 14 5420-D2G5W | |
| Getac S410 Gen 4 | |
| Infinix INBook X2 | |
| PCMark 10 / Digital Content Creation | |
| MSI Prestige 14 A10SC-009 | |
| Asus ExpertBook B7 Flip B7402FEA | |
| Average Intel Core i7-1185G7, Intel Iris Xe Graphics G7 96EUs (4424 - 5684, n=20) | |
| Getac S410 Gen 4 | |
| Dell Latitude 14 5420-D2G5W | |
| Infinix INBook X2 | |
| Getac B360 | |
| Getac S410 | |
| CrossMark / Overall | |
| Asus ExpertBook B7 Flip B7402FEA | |
| Average Intel Core i7-1185G7, Intel Iris Xe Graphics G7 96EUs (1233 - 1474, n=5) | |
| Getac S410 Gen 4 | |
| Dell Latitude 14 5420-D2G5W | |
| CrossMark / Productivity | |
| Asus ExpertBook B7 Flip B7402FEA | |
| Average Intel Core i7-1185G7, Intel Iris Xe Graphics G7 96EUs (1277 - 1506, n=5) | |
| Getac S410 Gen 4 | |
| Dell Latitude 14 5420-D2G5W | |
| CrossMark / Creativity | |
| Average Intel Core i7-1185G7, Intel Iris Xe Graphics G7 96EUs (1291 - 1513, n=5) | |
| Asus ExpertBook B7 Flip B7402FEA | |
| Getac S410 Gen 4 | |
| Dell Latitude 14 5420-D2G5W | |
| CrossMark / Responsiveness | |
| Asus ExpertBook B7 Flip B7402FEA | |
| Average Intel Core i7-1185G7, Intel Iris Xe Graphics G7 96EUs (969 - 1411, n=5) | |
| Dell Latitude 14 5420-D2G5W | |
| Getac S410 Gen 4 | |
| PCMark 10 Score | 4757 points | |
Help | ||
| AIDA64 / Memory Copy | |
| Average Intel Core i7-1185G7 (36515 - 68450, n=20) | |
| Acer Swift 3 SF314-43-R8BP | |
| Infinix INBook X2 | |
| Getac S410 Gen 4 | |
| Getac B360 | |
| Asus ExpertBook B7 Flip B7402FEA | |
| BMAX X14 Pro | |
| Dell Latitude 14 5420-D2G5W | |
| AIDA64 / Memory Read | |
| Average Intel Core i7-1185G7 (38394 - 64291, n=20) | |
| Infinix INBook X2 | |
| Acer Swift 3 SF314-43-R8BP | |
| Getac S410 Gen 4 | |
| Getac B360 | |
| BMAX X14 Pro | |
| Asus ExpertBook B7 Flip B7402FEA | |
| Dell Latitude 14 5420-D2G5W | |
| AIDA64 / Memory Write | |
| Average Intel Core i7-1185G7 (37684 - 66873, n=20) | |
| Infinix INBook X2 | |
| Acer Swift 3 SF314-43-R8BP | |
| Getac S410 Gen 4 | |
| Getac B360 | |
| BMAX X14 Pro | |
| Dell Latitude 14 5420-D2G5W | |
| Asus ExpertBook B7 Flip B7402FEA | |
| AIDA64 / Memory Latency | |
| BMAX X14 Pro | |
| Acer Swift 3 SF314-43-R8BP | |
| Infinix INBook X2 | |
| Asus ExpertBook B7 Flip B7402FEA | |
| Average Intel Core i7-1185G7 (78.3 - 117, n=22) | |
| Getac S410 Gen 4 | |
| Dell Latitude 14 5420-D2G5W | |
| Getac B360 | |
* ... smaller is better
DPC Latency
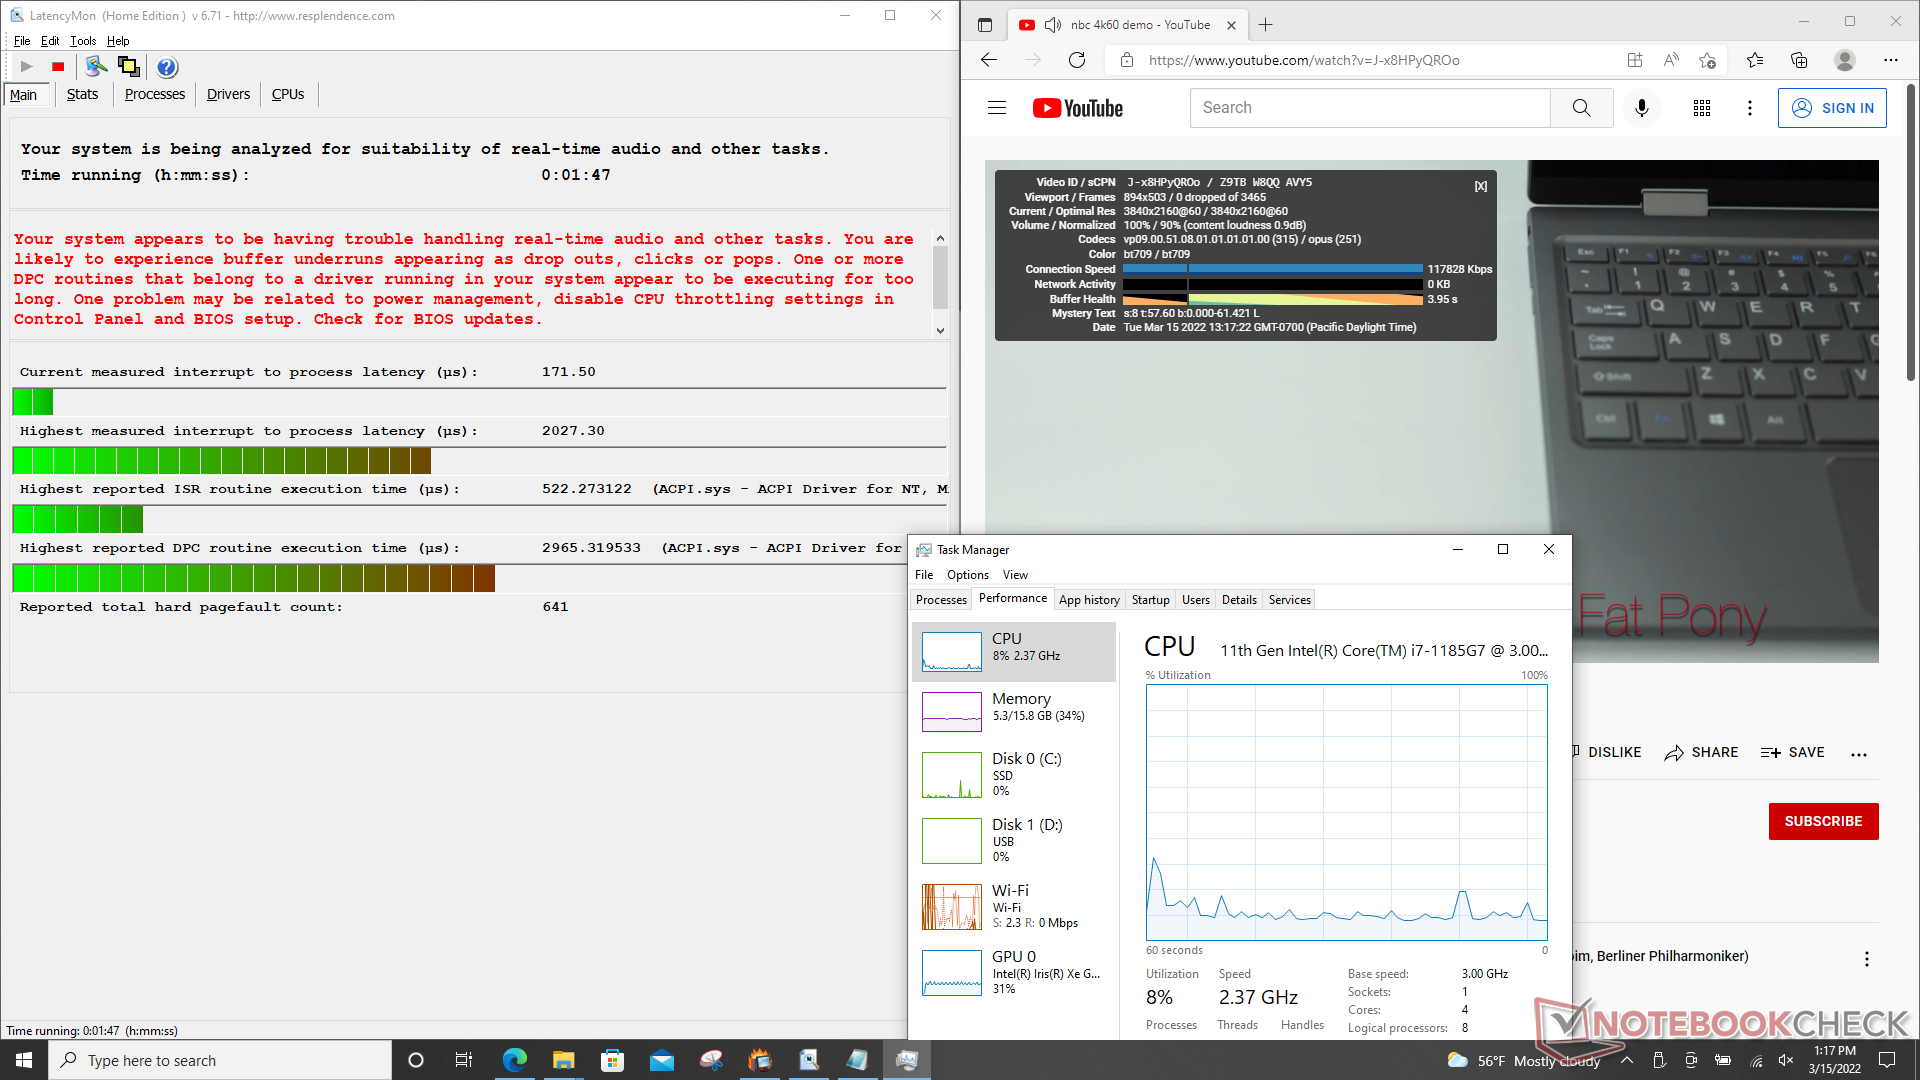
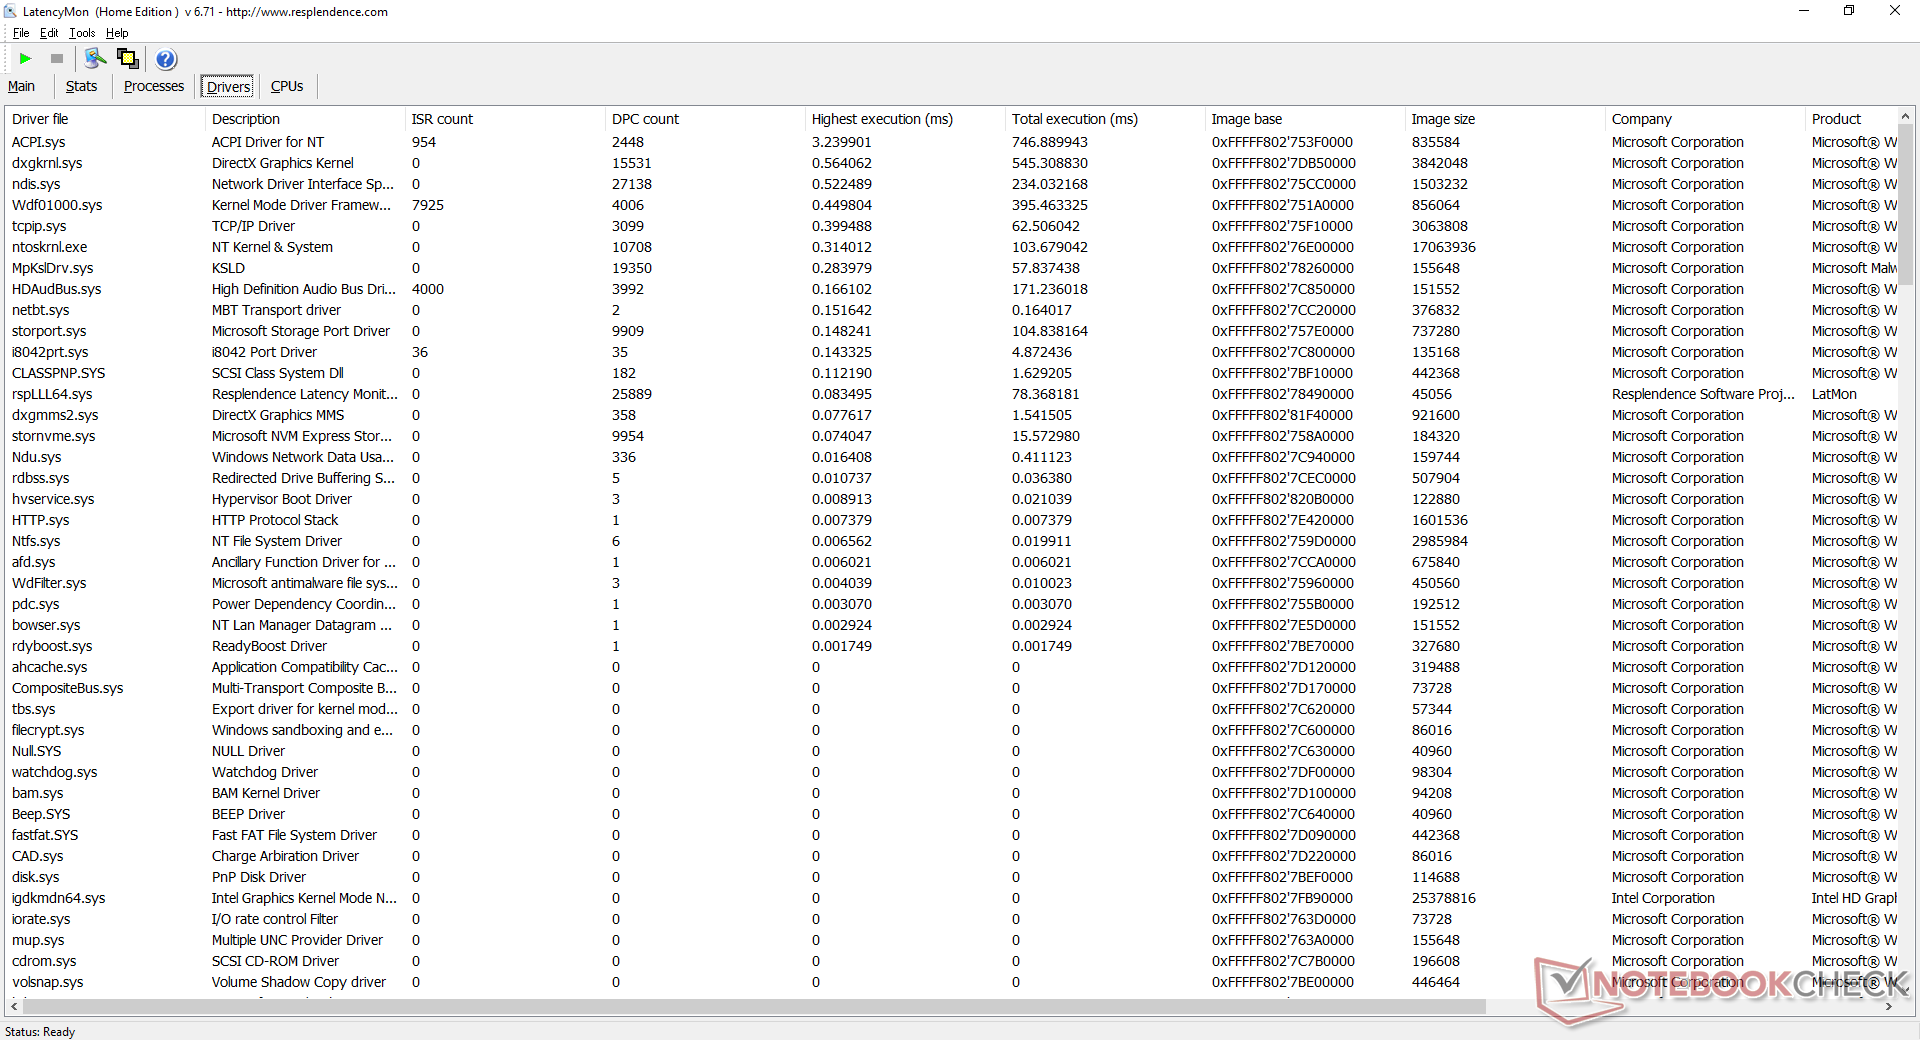
LatencyMon reveals DPC issues when opening multiple browser tabs of our homepage. 4K video playback at 60 FPS is otherwise smooth and without any dropped frames.
| DPC Latencies / LatencyMon - interrupt to process latency (max), Web, Youtube, Prime95 | |
| Dell Latitude 14 5420-D2G5W | |
| BMAX X14 Pro | |
| Getac S410 Gen 4 | |
| Asus ExpertBook B7 Flip B7402FEA | |
| Acer Swift 3 SF314-43-R8BP | |
| Getac B360 | |
| Infinix INBook X2 | |
* ... smaller is better
Storage Devices
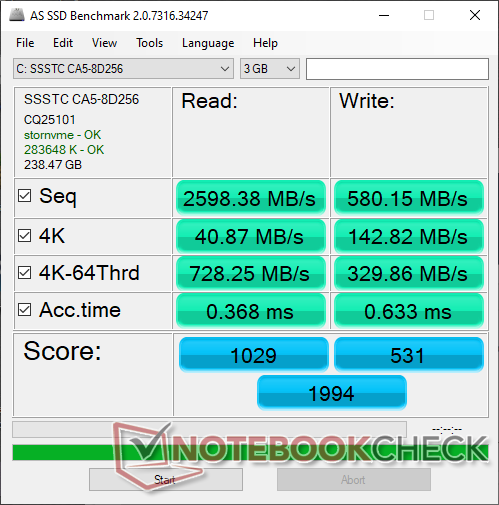
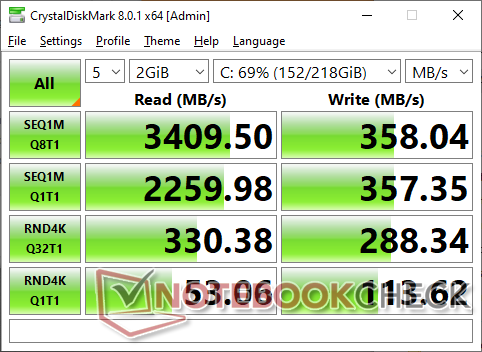
Our unit comes with a 256 GB SSSTC CA5 M.2 2280 PCIe3 x4 SSD with advertised sequential read and write rates of 3200 MB/s and 1600 MB/s, respectively. On our unit, however, we're able to reach the maximum write rate without issues while sequential write rates would be unusually slow at around 580 MB/s despite multiple reruns.

| Drive Performance Rating - Percent | |
| Asus ExpertBook B7 Flip B7402FEA | |
| MSI Prestige 14 A10SC-009 -8! | |
| Getac B360 | |
| Infinix INBook X2 | |
| Acer Swift 3 SF314-43-R8BP | |
| Dell Latitude 14 5420-D2G5W | |
| Getac S410 Gen 4 | |
| Getac S410 -8! | |
| BMAX X14 Pro | |
* ... smaller is better
Disk Throttling: DiskSpd Read Loop, Queue Depth 8
GPU Performance
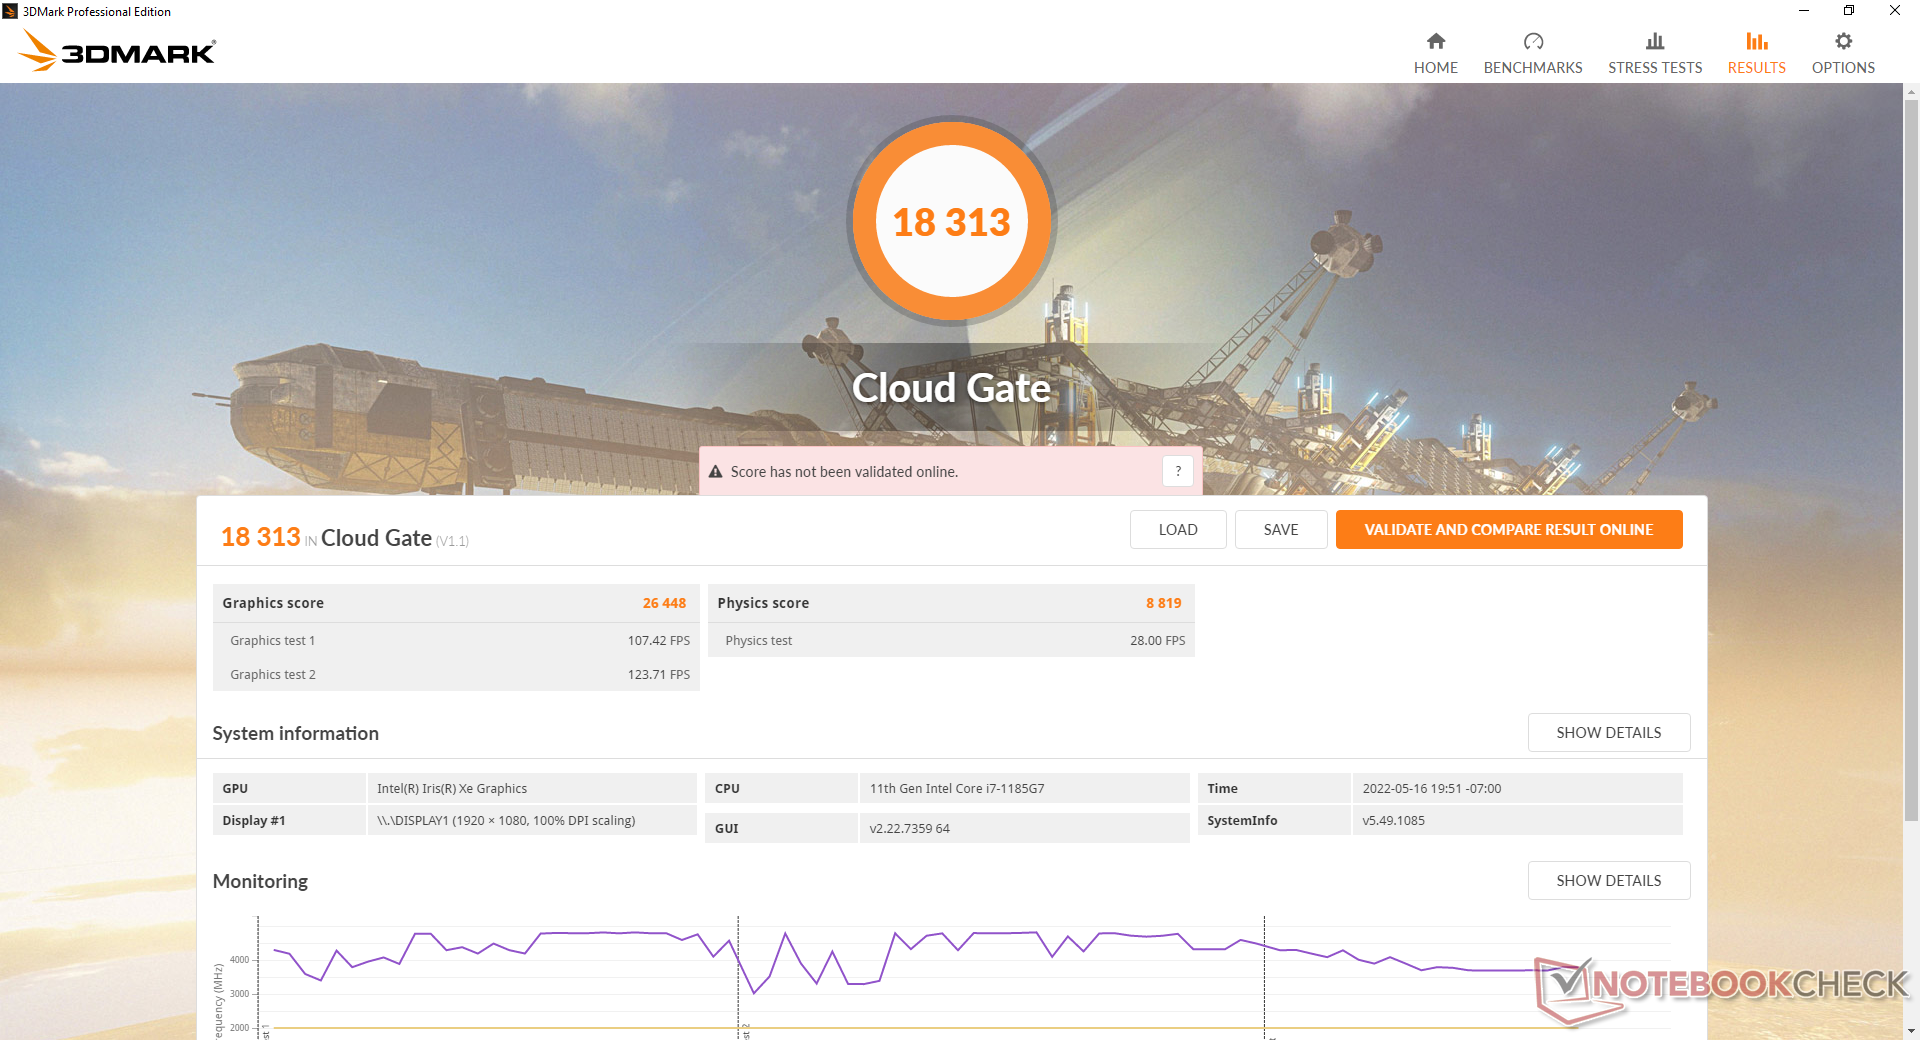
Graphics performance is excellent and where we expect it to be relative to other laptops with the same integrated Iris Xe 96 EUs GPU. Opting for the lesser Iris Xe 80 EUs configuration should only be about 10 percent slower based on our time with the Dell Latitude 7420. In either case, graphics performance on the S410 Gen 4 can offer over 3x the performance of the older UHD Graphics 620 as found on the S410 Gen 1.
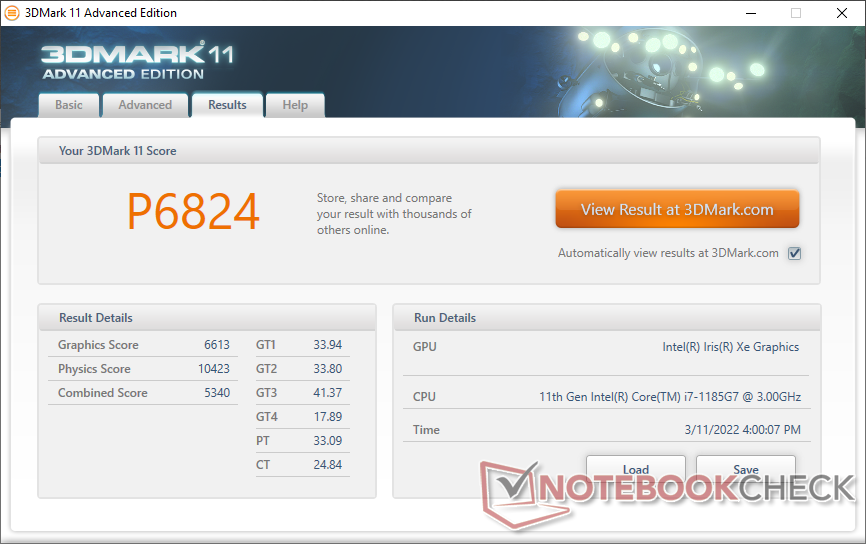
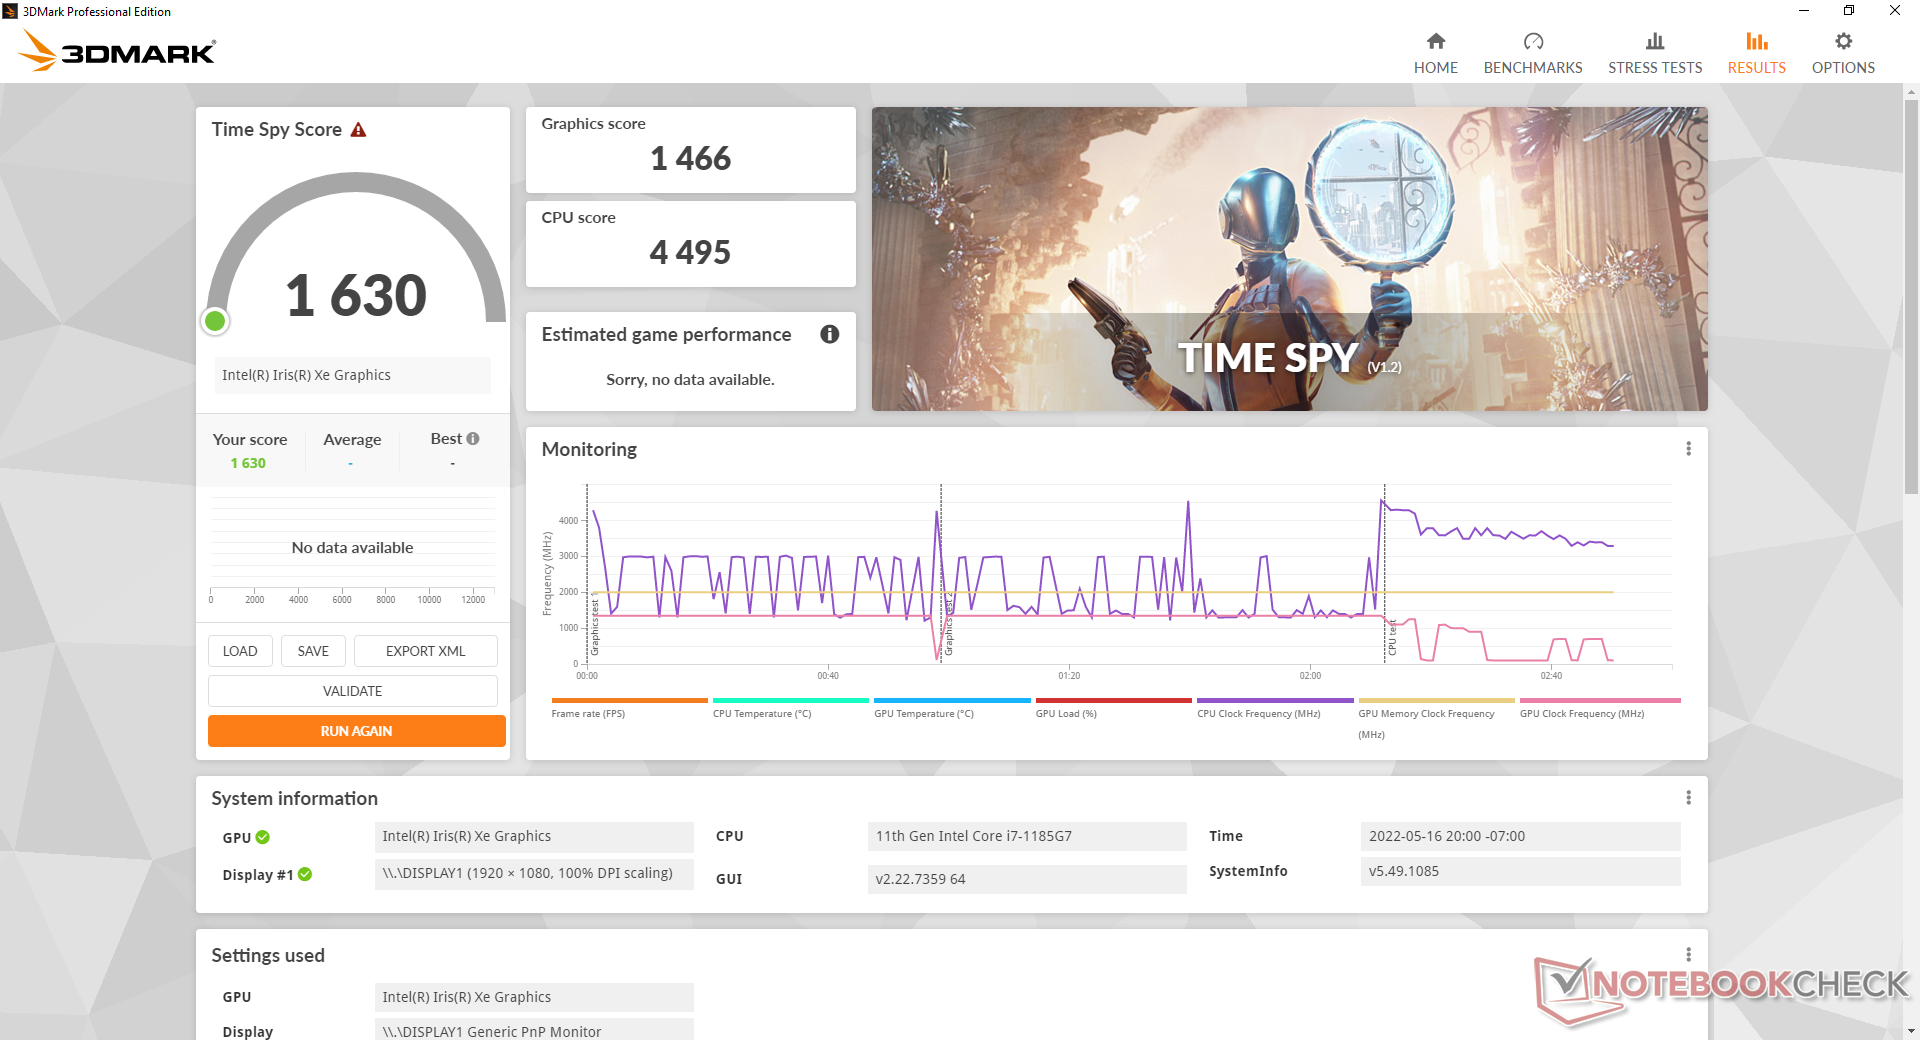
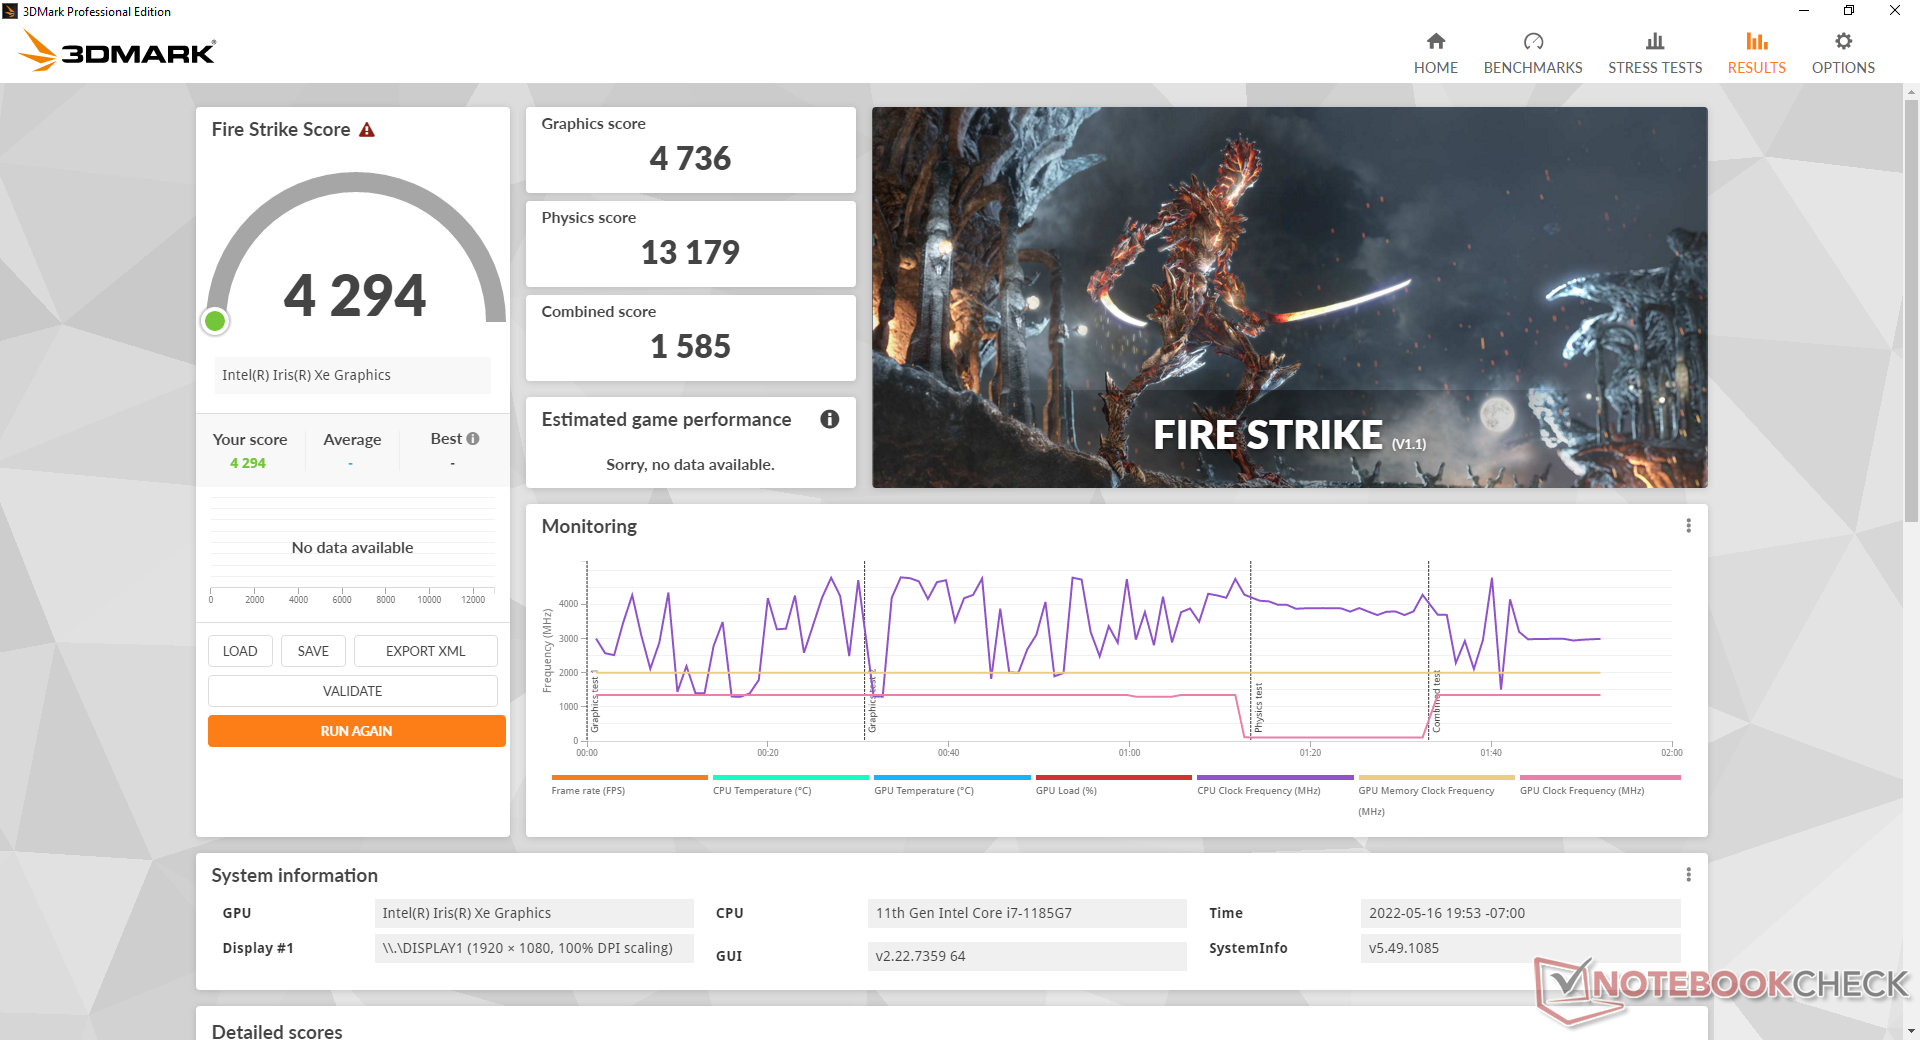
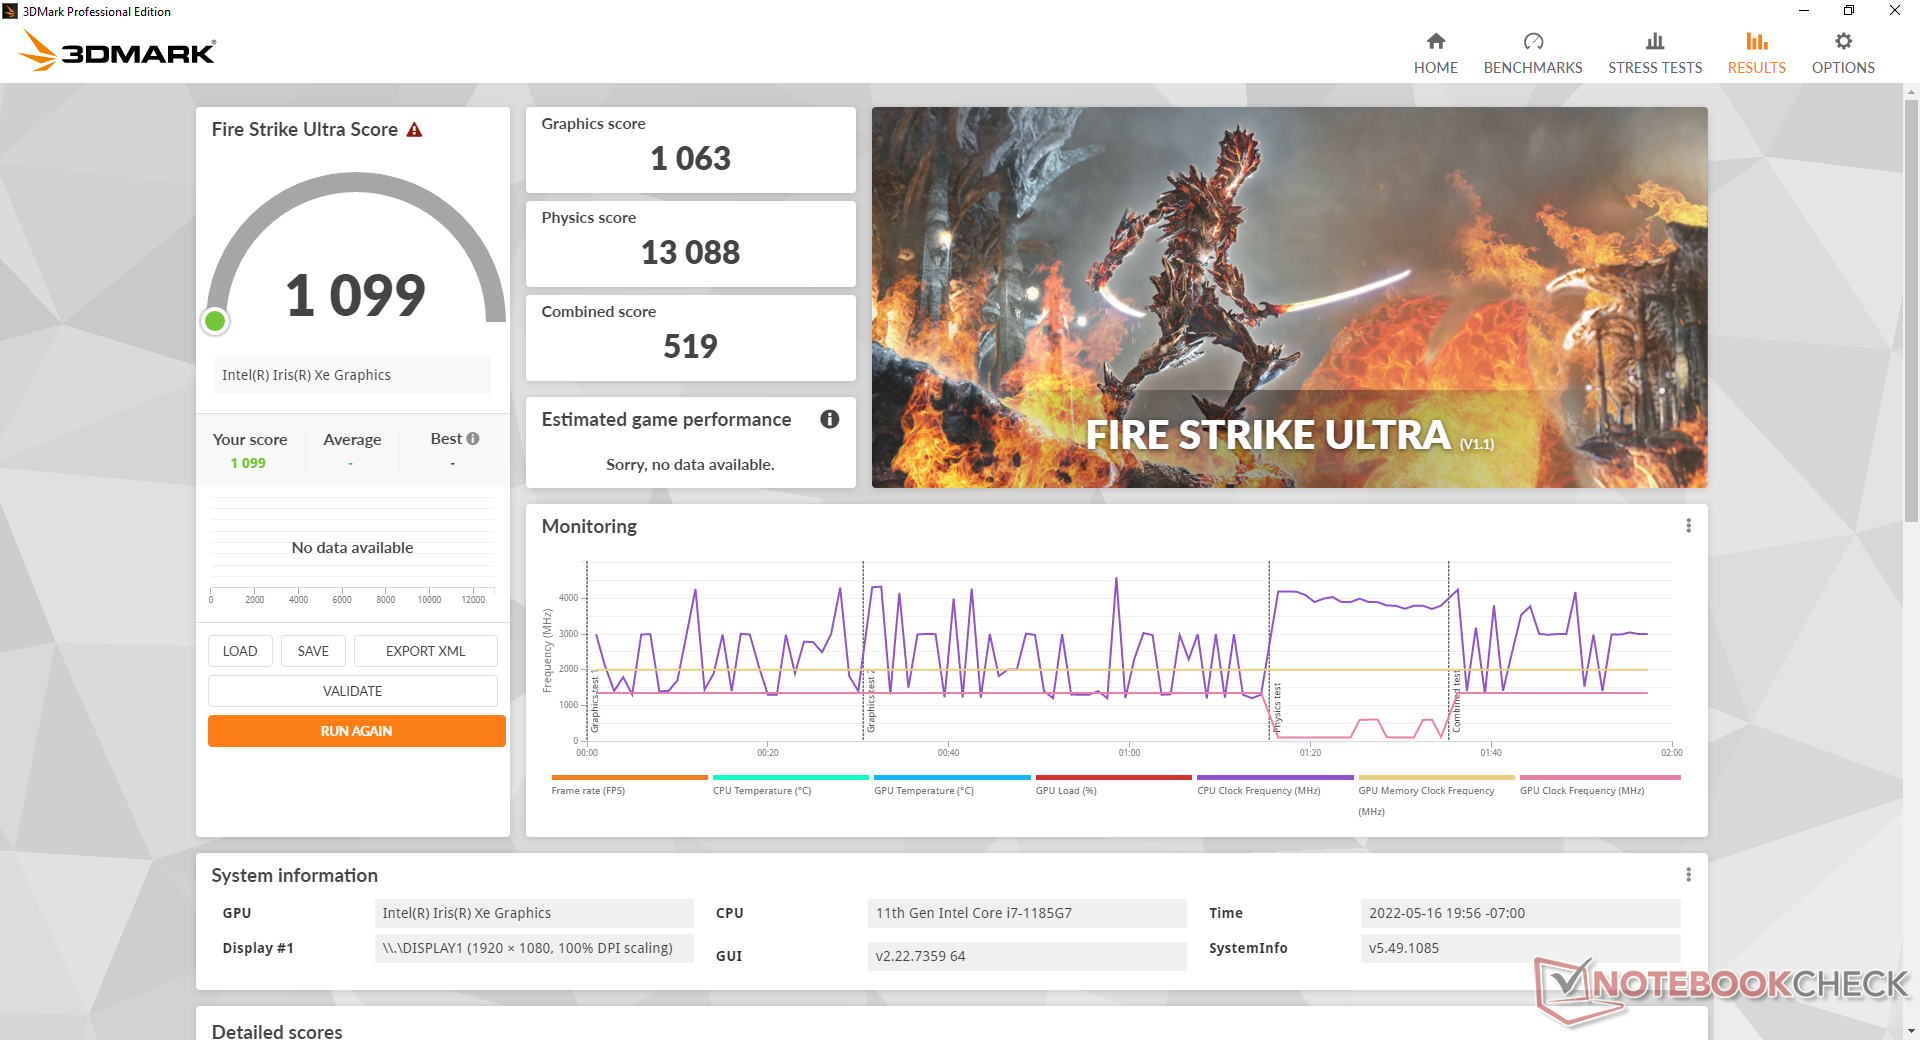
| 3DMark 11 Performance | 6824 points | |
| 3DMark Cloud Gate Standard Score | 18313 points | |
| 3DMark Fire Strike Score | 4294 points | |
| 3DMark Time Spy Score | 1630 points | |
Help | ||
| The Witcher 3 | |
| 1024x768 Low Graphics & Postprocessing | |
| Average Intel Iris Xe Graphics G7 96EUs (28.9 - 110, n=182) | |
| Getac S410 Gen 4 | |
| Asus ExpertBook B7 Flip B7402FEA | |
| Infinix INBook X2 | |
| BMAX X14 Pro | |
| Dell Latitude 14 5420-D2G5W | |
| Getac B360 | |
| 1366x768 Medium Graphics & Postprocessing | |
| Average Intel Iris Xe Graphics G7 96EUs (21.4 - 74.1, n=180) | |
| Getac S410 Gen 4 | |
| Asus ExpertBook B7 Flip B7402FEA | |
| Infinix INBook X2 | |
| Acer Swift 3 SF314-43-R8BP | |
| BMAX X14 Pro | |
| Dell Latitude 14 5420-D2G5W | |
| Getac B360 | |
| 1920x1080 High Graphics & Postprocessing (Nvidia HairWorks Off) | |
| Average Intel Iris Xe Graphics G7 96EUs (10.6 - 45.9, n=185) | |
| Getac S410 Gen 4 | |
| Asus ExpertBook B7 Flip B7402FEA | |
| Infinix INBook X2 | |
| Acer Swift 3 SF314-43-R8BP | |
| BMAX X14 Pro | |
| Dell Latitude 14 5420-D2G5W | |
| Getac B360 | |
| 1920x1080 Ultra Graphics & Postprocessing (HBAO+) | |
| Average Intel Iris Xe Graphics G7 96EUs (8.79 - 20.1, n=175) | |
| Acer Swift 3 SF314-43-R8BP | |
| Getac S410 Gen 4 | |
| Asus ExpertBook B7 Flip B7402FEA | |
| Infinix INBook X2 | |
| BMAX X14 Pro | |
| Dell Latitude 14 5420-D2G5W | |
| Getac B360 | |
| GTA V | |
| 1024x768 Lowest Settings possible | |
| Average Intel Iris Xe Graphics G7 96EUs (52 - 157, n=155) | |
| Getac S410 Gen 4 | |
| Asus ExpertBook B7 Flip B7402FEA | |
| Dell Latitude 14 5420-D2G5W | |
| 1920x1080 Lowest Settings possible | |
| Average Intel Iris Xe Graphics G7 96EUs (34.7 - 115.4, n=129) | |
| Getac S410 Gen 4 | |
| Asus ExpertBook B7 Flip B7402FEA | |
| 1366x768 Normal/Off AF:4x | |
| Average Intel Iris Xe Graphics G7 96EUs (24.1 - 137, n=158) | |
| Getac S410 Gen 4 | |
| Asus ExpertBook B7 Flip B7402FEA | |
| Dell Latitude 14 5420-D2G5W | |
| 1920x1080 Normal/Off AF:4x | |
| Average Intel Iris Xe Graphics G7 96EUs (20 - 109, n=130) | |
| Getac S410 Gen 4 | |
| Asus ExpertBook B7 Flip B7402FEA | |
| 1920x1080 High/On (Advanced Graphics Off) AA:2xMSAA + FX AF:8x | |
| Average Intel Iris Xe Graphics G7 96EUs (9.39 - 51.6, n=150) | |
| Getac S410 Gen 4 | |
| Asus ExpertBook B7 Flip B7402FEA | |
| Dell Latitude 14 5420-D2G5W | |
| 1920x1080 Highest Settings possible AA:4xMSAA + FX AF:16x | |
| Average Intel Iris Xe Graphics G7 96EUs (4.13 - 22.9, n=144) | |
| Getac S410 Gen 4 | |
| Asus ExpertBook B7 Flip B7402FEA | |
Witcher 3 FPS Chart
| low | med. | high | ultra | |
| GTA V (2015) | 78.7 | 65.6 | 18.9 | 8.04 |
| The Witcher 3 (2015) | 77.3 | 49.4 | 25.6 | 12.9 |
| Dota 2 Reborn (2015) | 83.1 | 67.7 | 48 | 45.7 |
| Final Fantasy XV Benchmark (2018) | 39.4 | 20.1 | 15.3 | |
| X-Plane 11.11 (2018) | 44.4 | 33.9 | 30.9 | |
| Strange Brigade (2018) | 79.2 | 31.5 | 26.8 | 22 |
Emissions
System Noise
Fan noise appears to be both louder and more likely to pulse than on the original S410 Gen 1 model. Additionally, the internal fan reaches its maximum RPM pretty quickly when running demanding loads meaning that pulsing is steep and very noticeable. We recommend running the system at lower power profiles to reduce the fan pulsing.
Noise Level
| Idle |
| 23.5 / 23.5 / 28 dB(A) |
| Load |
| 42.8 / 42.6 dB(A) |
 | ||
30 dB silent 40 dB(A) audible 50 dB(A) loud |
||
min: | ||
| Getac S410 Gen 4 Iris Xe G7 96EUs, i7-1185G7, SSSTC CA5-8D256 | Dell Latitude 14 5420-D2G5W Iris Xe G7 80EUs, i5-1135G7, WDC PC SN530 SDBPTPZ-256G | Getac B360 UHD Graphics 620, i7-10710U, Lite-On CA5-8D512 | Getac S410 UHD Graphics 620, i5-8550U, CUKUSA 1 TB SATA SSD Q0526A | Durabook S14I Iris Xe G7 96EUs, i7-1165G7, UDinfo M2P M2P80DE512GBAEP | |
|---|---|---|---|---|---|
| Noise | -3% | 13% | -2% | -2% | |
| off / environment * | 23.3 | 25 -7% | 24.3 -4% | 28.4 -22% | 25.2 -8% |
| Idle Minimum * | 23.5 | 25 -6% | 24.5 -4% | 28.4 -21% | 25.2 -7% |
| Idle Average * | 23.5 | 25 -6% | 24.5 -4% | 28.4 -21% | 25.2 -7% |
| Idle Maximum * | 28 | 25 11% | 24.6 12% | 28.4 -1% | 34.5 -23% |
| Load Average * | 42.8 | 36.5 15% | 29.8 30% | 30.3 29% | 34.5 19% |
| Witcher 3 ultra * | 42.3 | 27.3 35% | |||
| Load Maximum * | 42.6 | 52.4 -23% | 30.8 28% | 33.3 22% | 36.2 15% |
* ... smaller is better
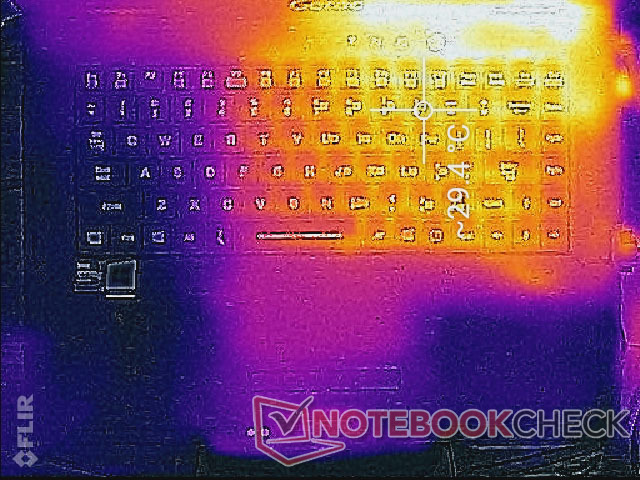
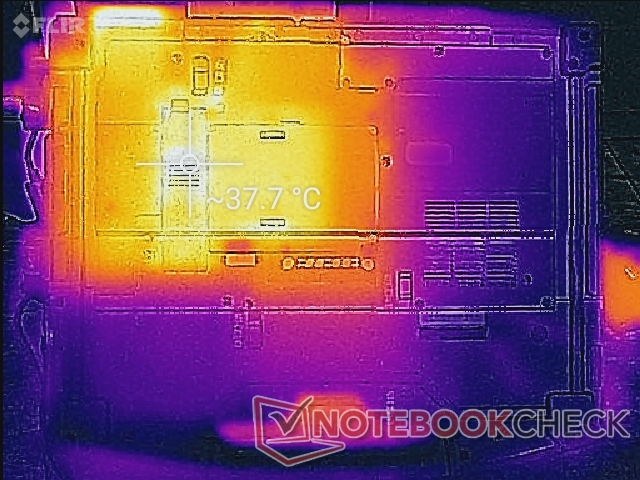
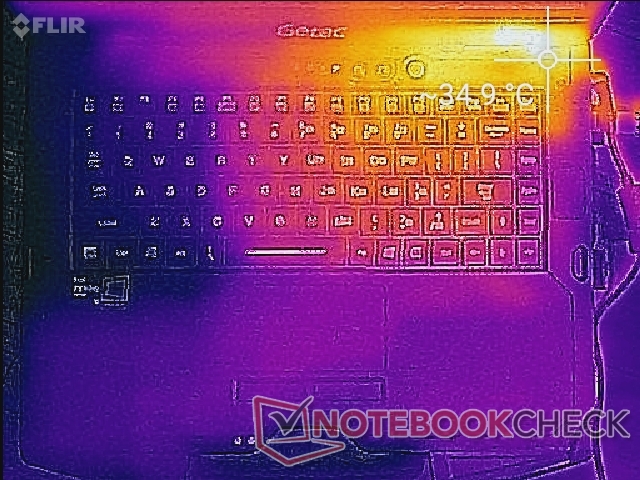
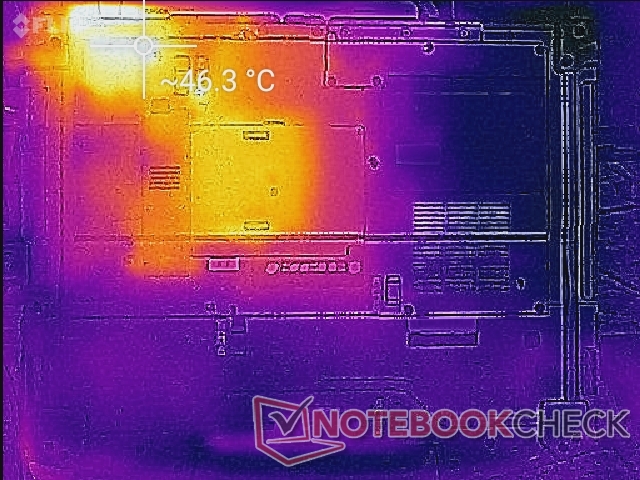
Temperature
Surface temperatures are warmest on the right half the chassis than on the left due to the positioning of the processor and cooling solution inside. Hot spots can reach 35 C and 46 C on the top and bottom sides, respectively, although they are toward the rear of the system where skin is unlikely to touch.
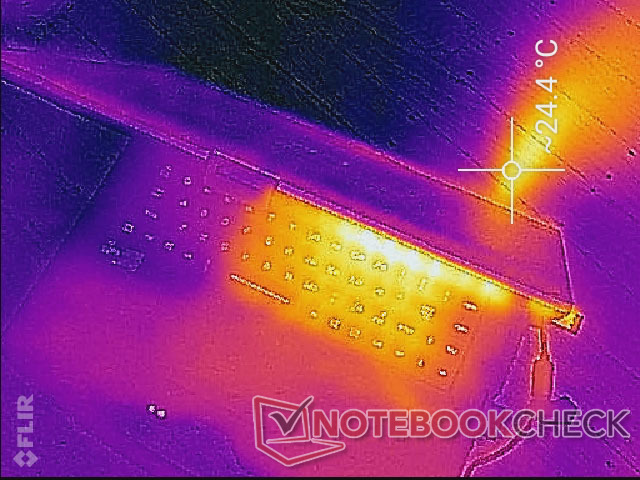
(+) The maximum temperature on the upper side is 36 °C / 97 F, compared to the average of 34.2 °C / 94 F, ranging from 21.2 to 62.5 °C for the class Office.
(-) The bottom heats up to a maximum of 46.8 °C / 116 F, compared to the average of 36.7 °C / 98 F
(+) In idle usage, the average temperature for the upper side is 25.2 °C / 77 F, compared to the device average of 29.5 °C / 85 F.
(+) The palmrests and touchpad are cooler than skin temperature with a maximum of 24 °C / 75.2 F and are therefore cool to the touch.
(+) The average temperature of the palmrest area of similar devices was 27.7 °C / 81.9 F (+3.7 °C / 6.7 F).
| Getac S410 Gen 4 Intel Core i7-1185G7, Intel Iris Xe Graphics G7 96EUs | Panasonic Toughbook FZ-55 MK2 Intel Core i7-1185G7, Intel Iris Xe Graphics G7 96EUs | Getac S410 Intel Core i7-8550U, Intel UHD Graphics 620 | Dell Latitude 5420 Rugged-P85G Intel Core i7-8650U, AMD Radeon RX 540 | Acer Enduro Urban N3 EUN314 Intel Core i7-1165G7, Intel Iris Xe Graphics G7 96EUs | Durabook S14I Intel Core i7-1165G7, Intel Iris Xe Graphics G7 96EUs | |
|---|---|---|---|---|---|---|
| Heat | 4% | -4% | 1% | 8% | 5% | |
| Maximum Upper Side * | 36 | 36.2 -1% | 42.6 -18% | 42.2 -17% | 37.8 -5% | 36.4 -1% |
| Maximum Bottom * | 46.8 | 42.2 10% | 49 -5% | 42 10% | 45.8 2% | 38.6 18% |
| Idle Upper Side * | 30 | 31 -3% | 30.8 -3% | 31.6 -5% | 26.4 12% | 32.6 -9% |
| Idle Bottom * | 38.2 | 34 11% | 34.4 10% | 31.8 17% | 30.2 21% | 33.8 12% |
* ... smaller is better
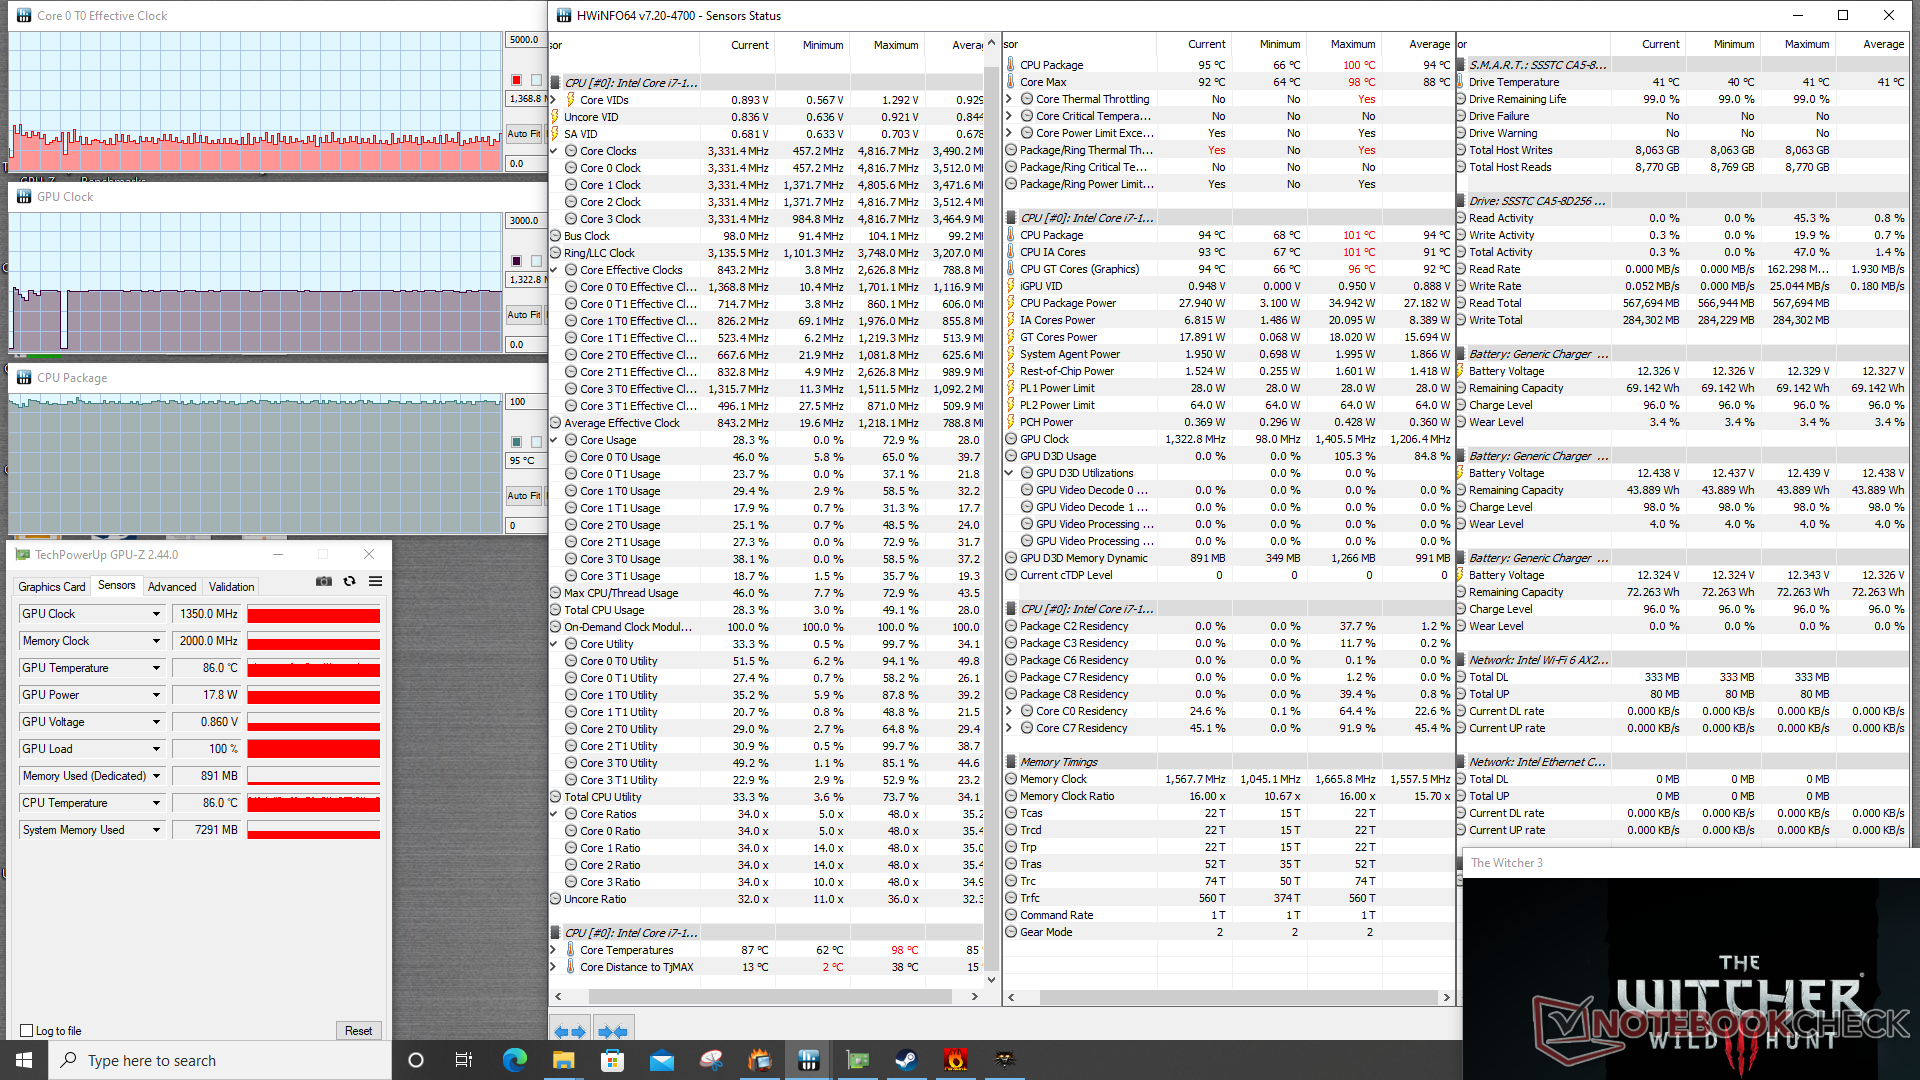
Stress Test
When running Prime95, CPU clock rates would boost to 2.9 GHz for a very short period before quickly falling and stabilizing at 2.4 GHz. CPU package power would be as high as 41 W during the start of the test before stabilizing at 26 W. The high core temperature of 95 C suggests that the CPU is going as fast as it can within the limits of the chassis when subjected to demanding processing loads. In comparison, the CPUs in the S410 Gen 1 and Dell Latitude 7330 Rugged would stabilize at a lower 80 C and 62 C, respectively, when subjected to the same conditions.
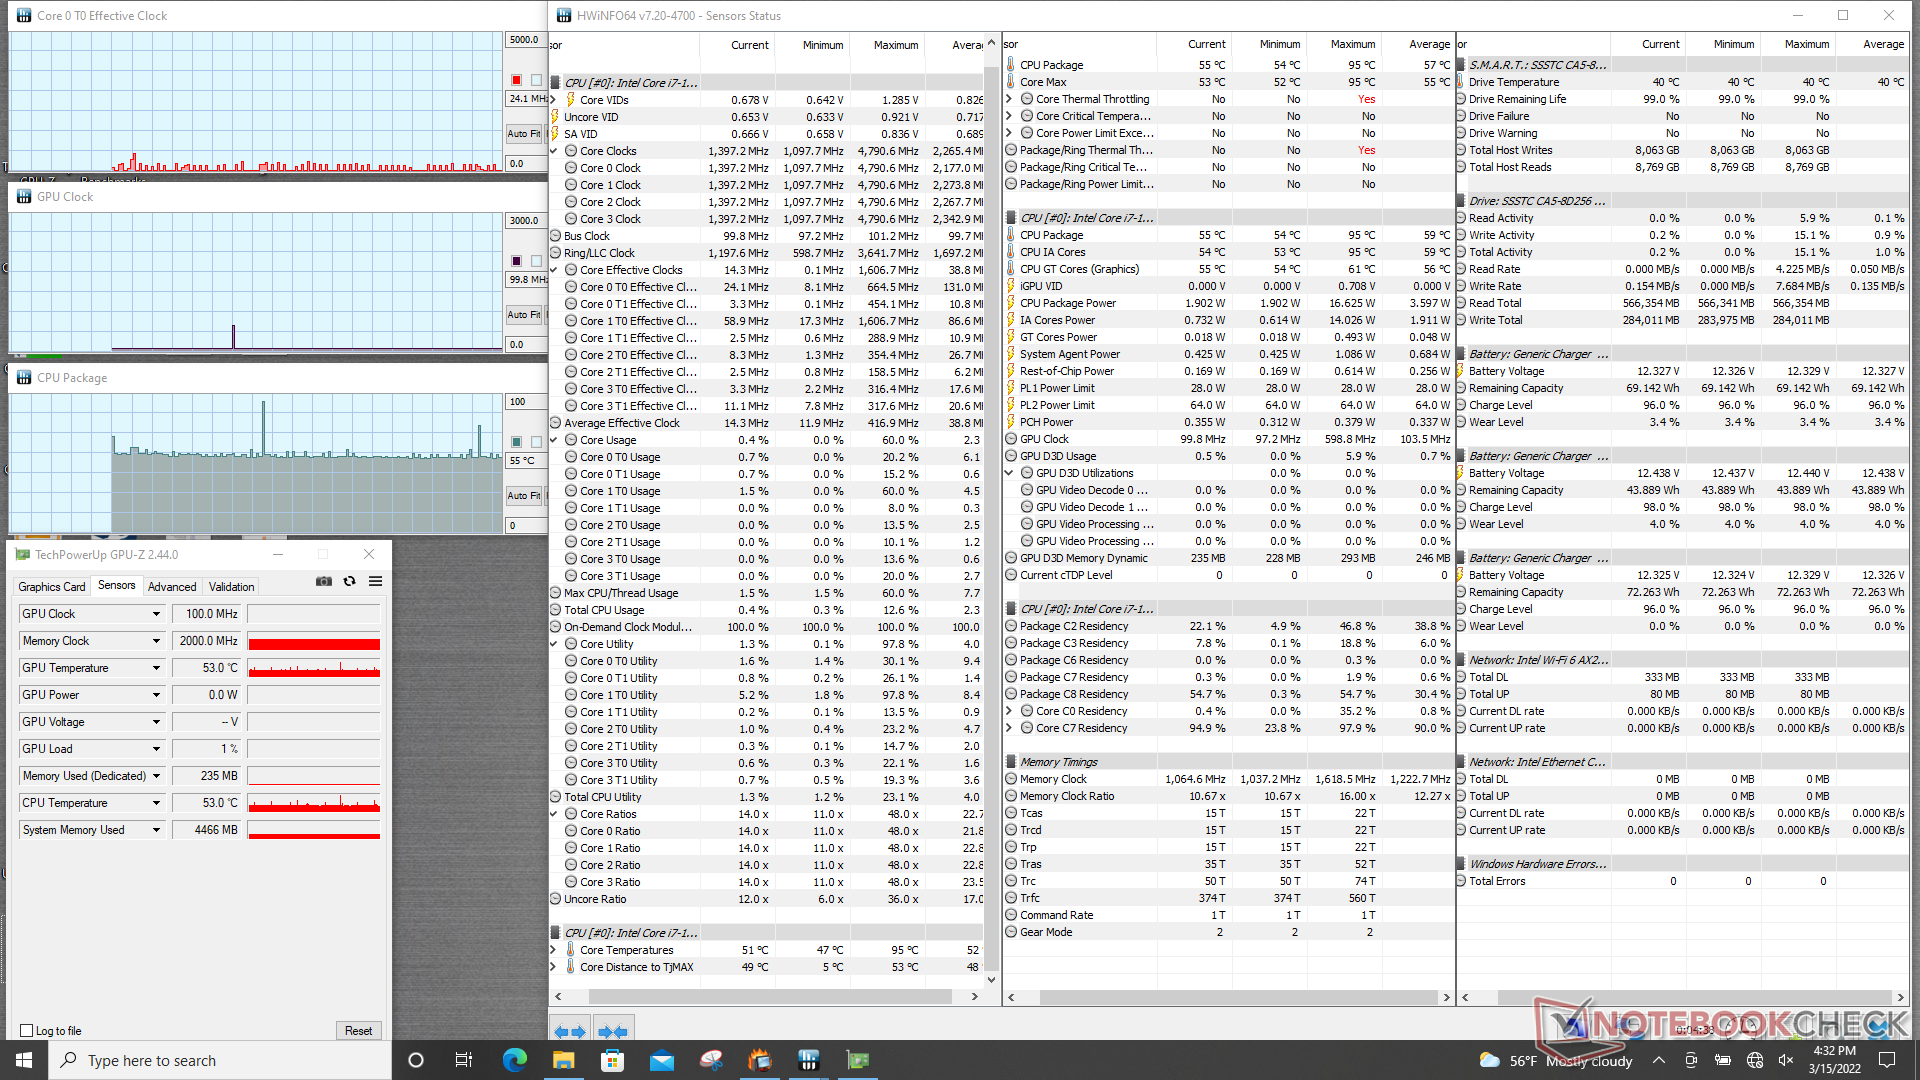
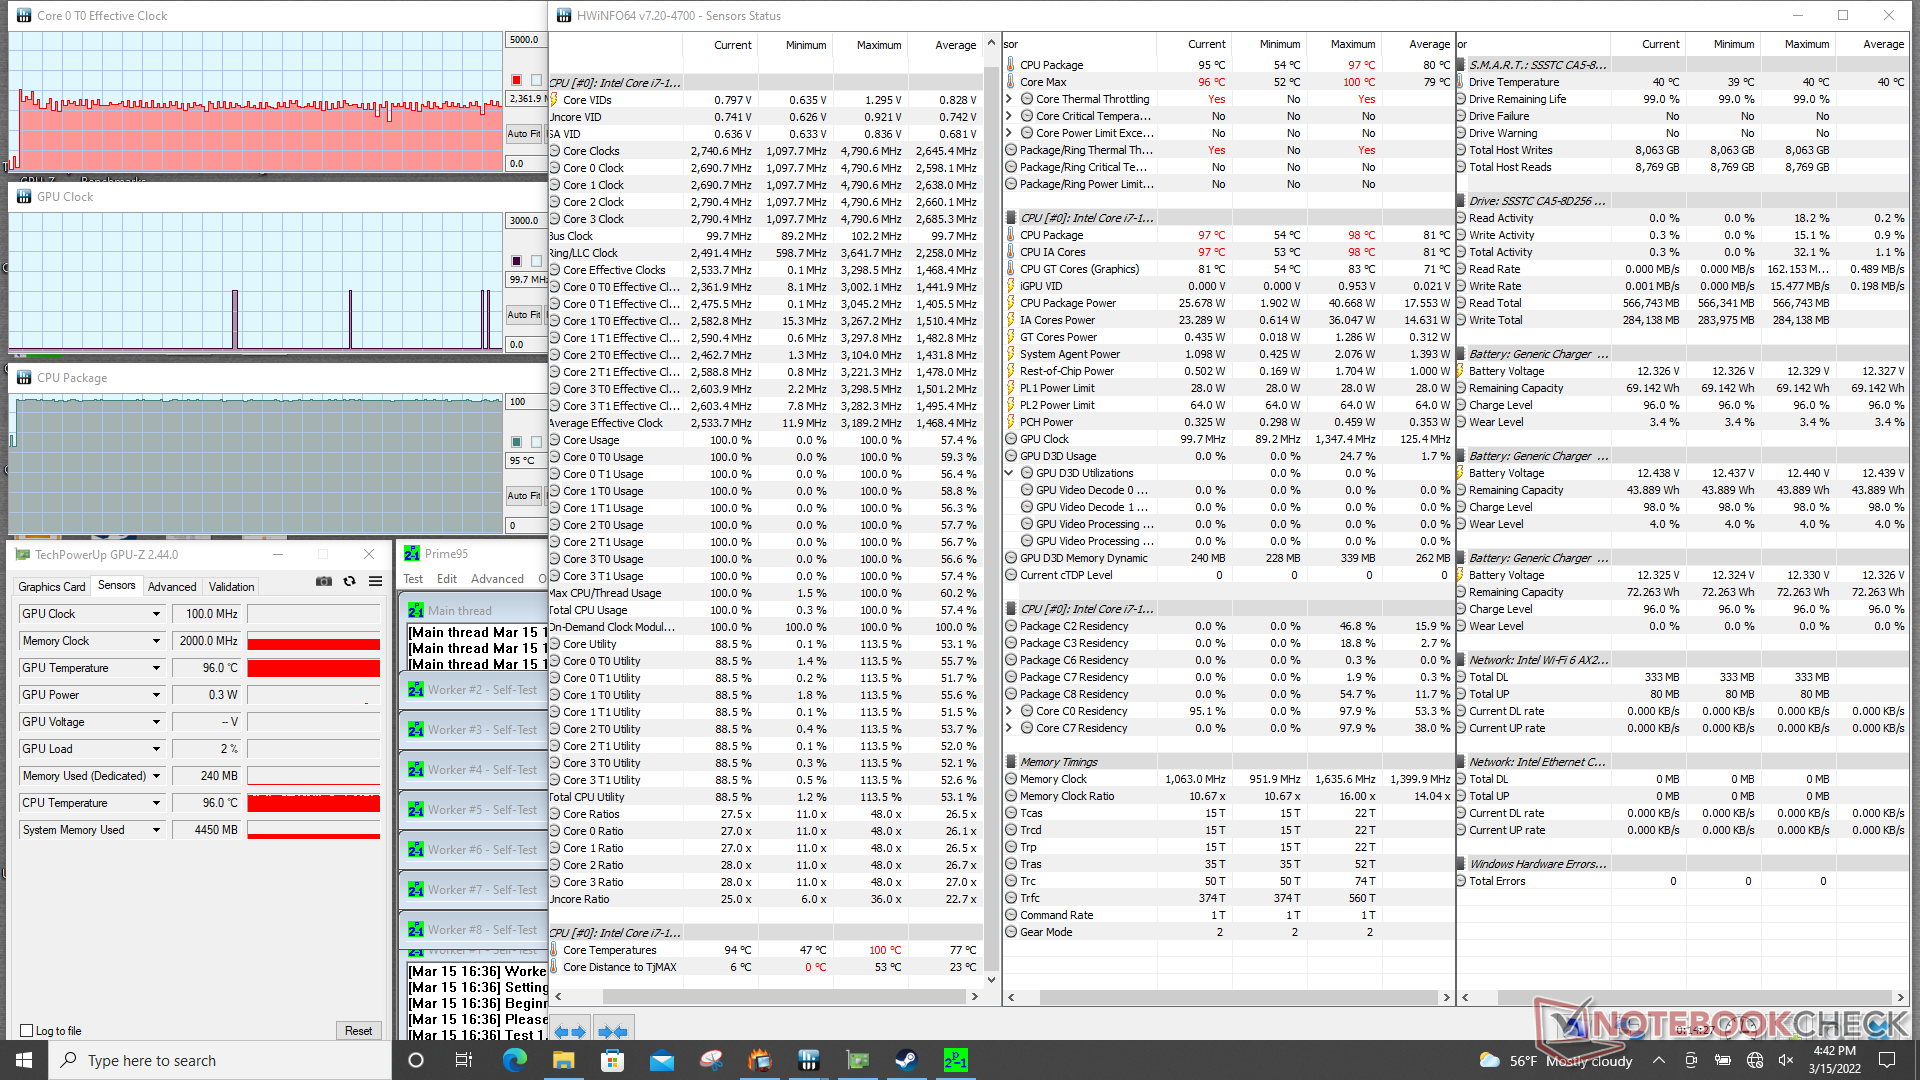
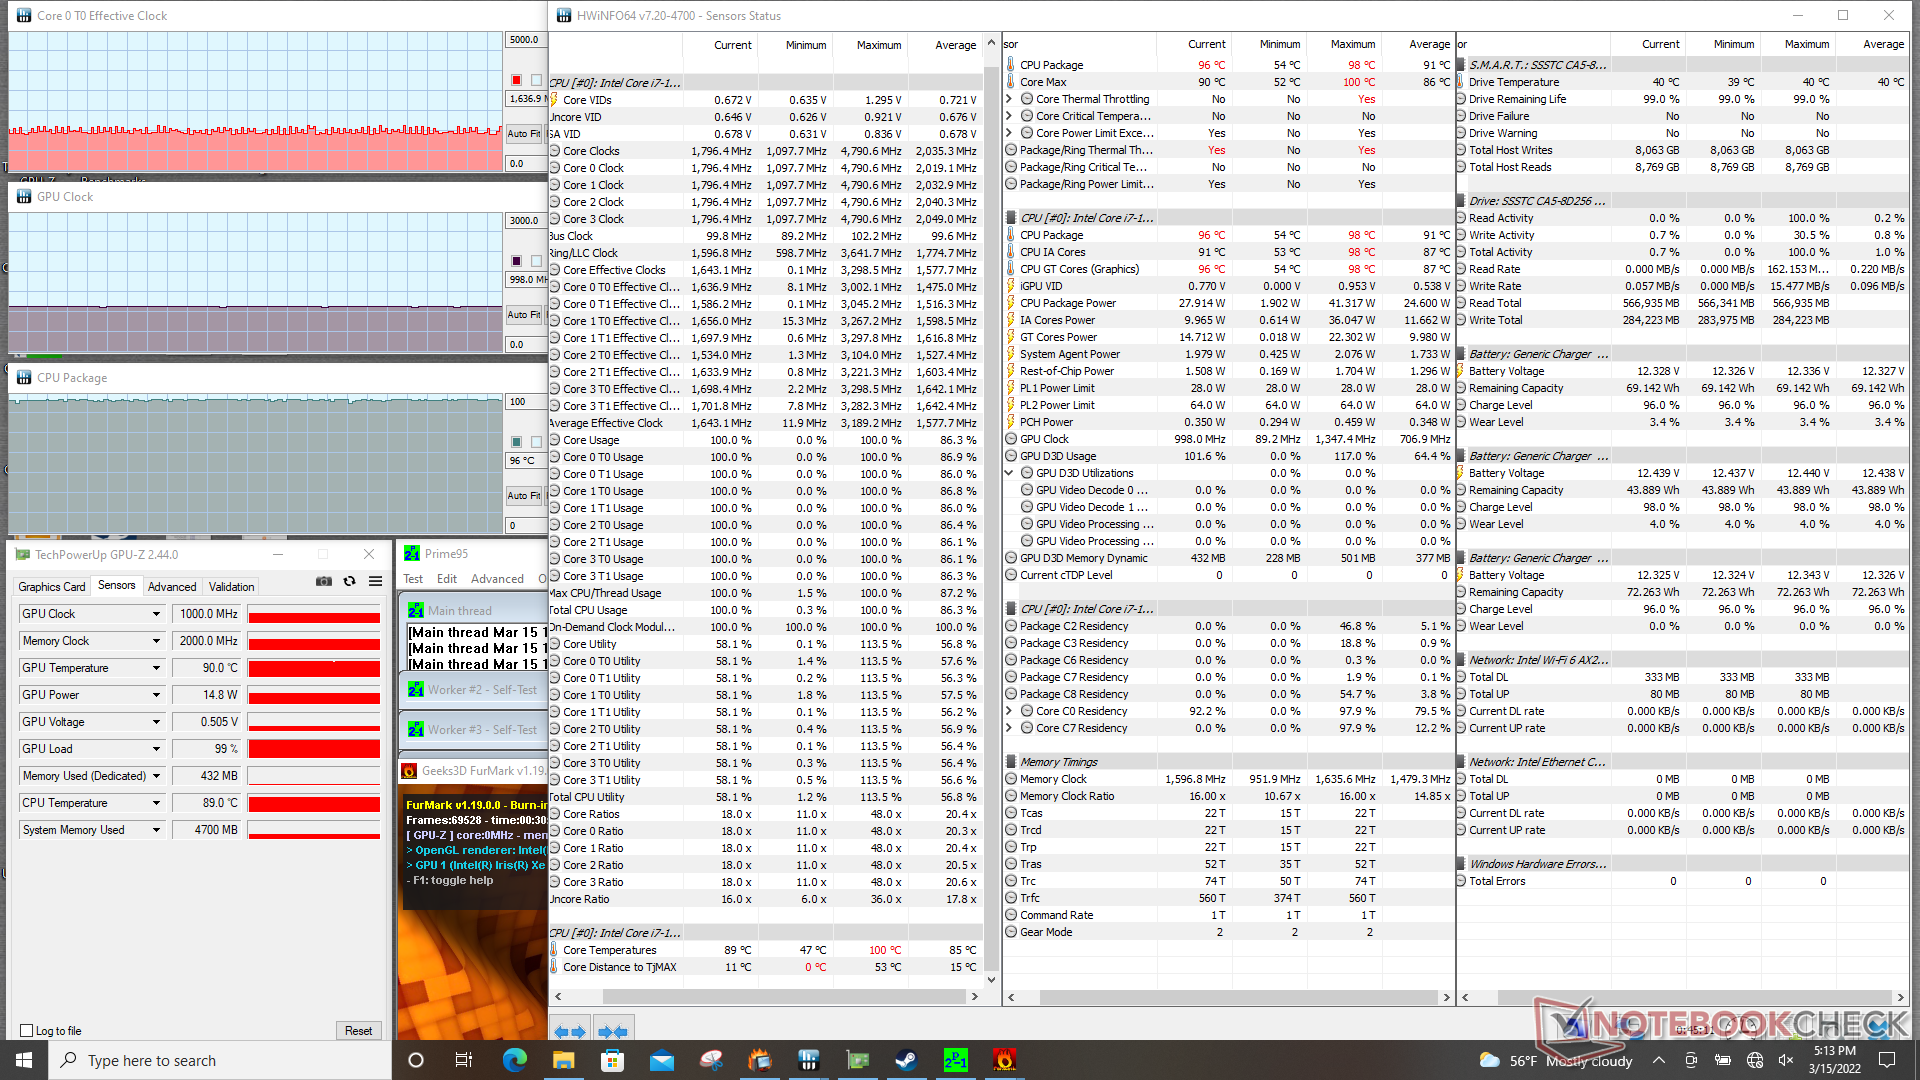
| CPU Clock (GHz) | GPU Clock (MHz) | Average CPU Temperature (°C) | |
| System Idle | -- | -- | 55 |
| Prime95 Stress | 2.3 - 2.4 | -- | 95 |
| Prime95 + FurMark Stress | 1.4 - 1.6 | 1000 | 96 |
| Witcher 3 Stress | 1.2 - 1.4 | 1350 | 95 |
Speakers
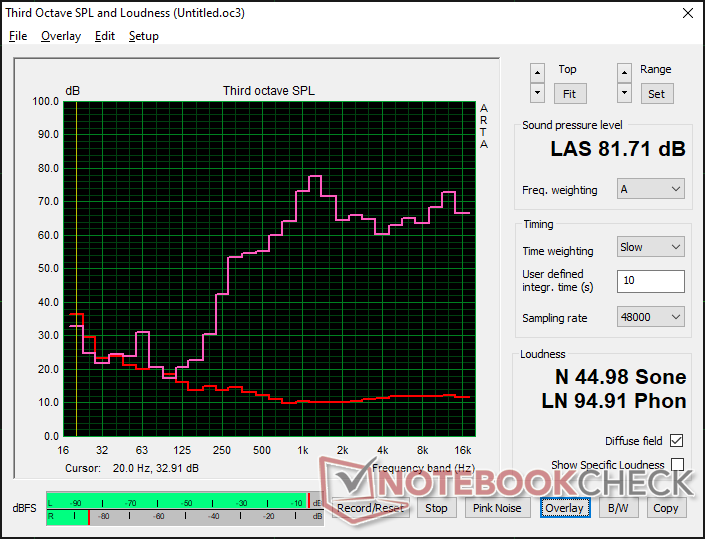
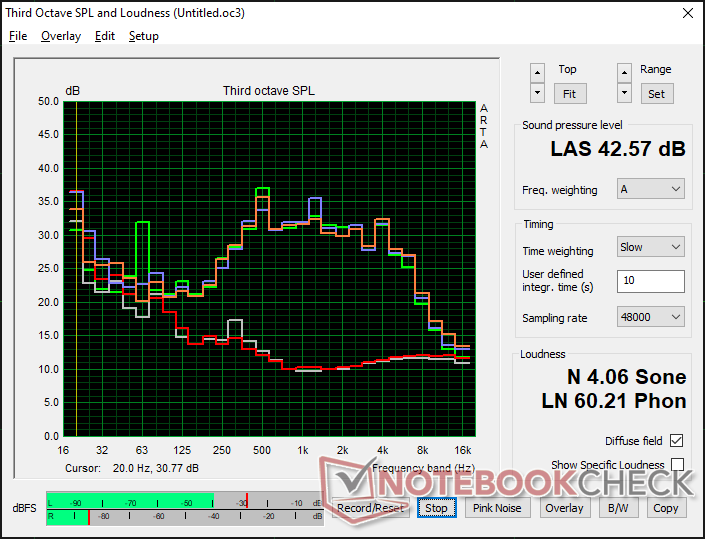
Getac S410 Gen 4 audio analysis
(±) | speaker loudness is average but good (81.7 dB)
Bass 100 - 315 Hz
(-) | nearly no bass - on average 32.3% lower than median
(±) | linearity of bass is average (12.7% delta to prev. frequency)
Mids 400 - 2000 Hz
(±) | higher mids - on average 6.8% higher than median
(±) | linearity of mids is average (9.1% delta to prev. frequency)
Highs 2 - 16 kHz
(+) | balanced highs - only 2% away from median
(+) | highs are linear (5.2% delta to prev. frequency)
Overall 100 - 16.000 Hz
(±) | linearity of overall sound is average (24.2% difference to median)
Compared to same class
» 67% of all tested devices in this class were better, 9% similar, 24% worse
» The best had a delta of 7%, average was 22%, worst was 53%
Compared to all devices tested
» 69% of all tested devices were better, 7% similar, 25% worse
» The best had a delta of 4%, average was 25%, worst was 134%
Apple MacBook Pro 16 2021 M1 Pro audio analysis
(+) | speakers can play relatively loud (84.7 dB)
Bass 100 - 315 Hz
(+) | good bass - only 3.8% away from median
(+) | bass is linear (5.2% delta to prev. frequency)
Mids 400 - 2000 Hz
(+) | balanced mids - only 1.3% away from median
(+) | mids are linear (2.1% delta to prev. frequency)
Highs 2 - 16 kHz
(+) | balanced highs - only 1.9% away from median
(+) | highs are linear (2.7% delta to prev. frequency)
Overall 100 - 16.000 Hz
(+) | overall sound is linear (4.6% difference to median)
Compared to same class
» 0% of all tested devices in this class were better, 0% similar, 100% worse
» The best had a delta of 5%, average was 18%, worst was 45%
Compared to all devices tested
» 0% of all tested devices were better, 0% similar, 100% worse
» The best had a delta of 4%, average was 25%, worst was 134%
Energy Management
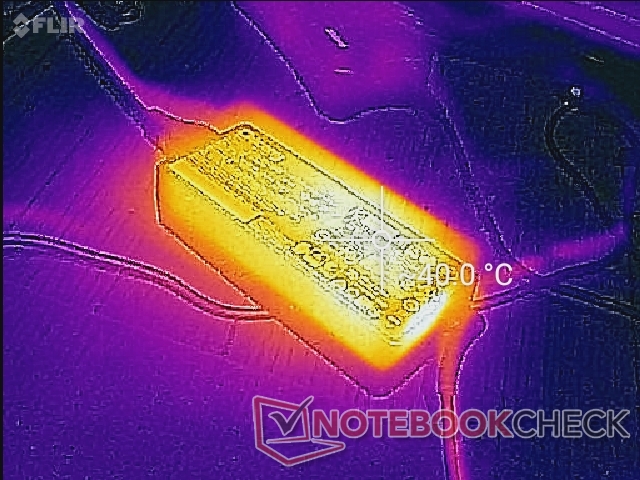
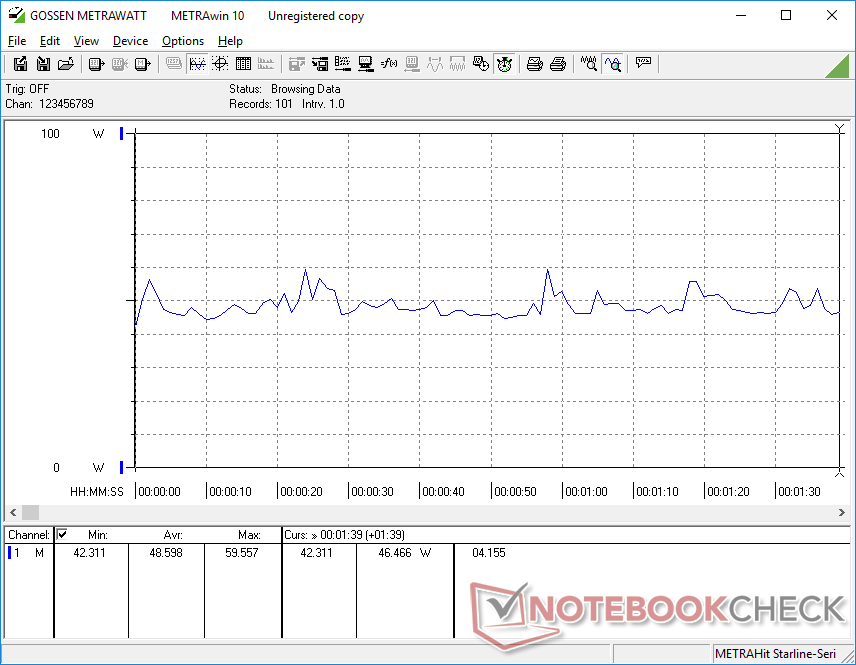
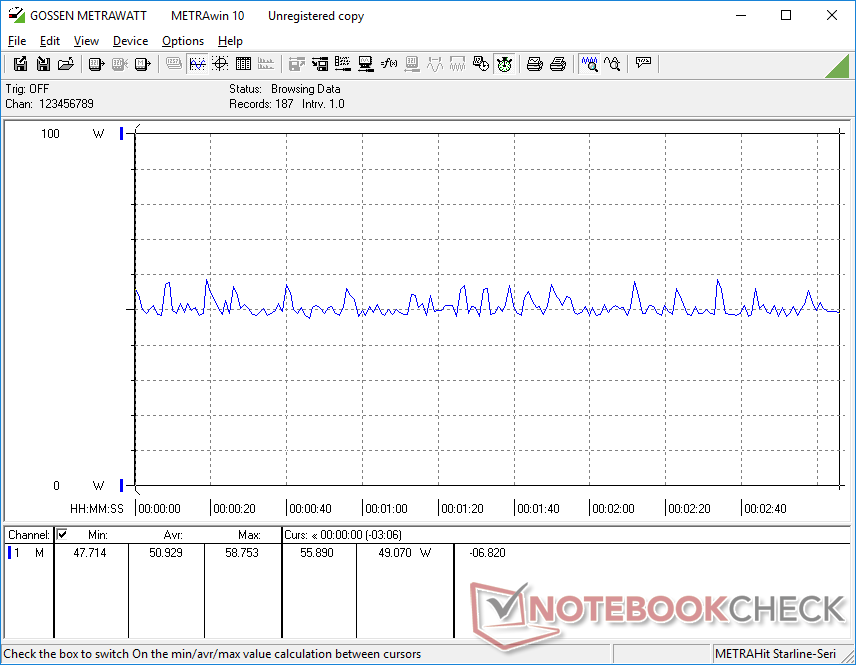
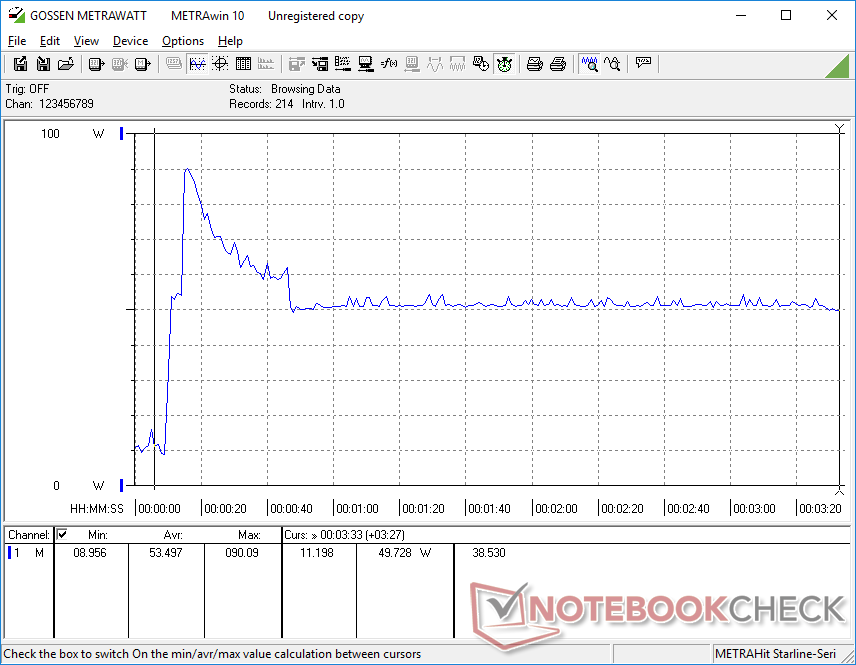
Power Consumption
The system comes with a small (~12.8 x 5.2 x 3.0 cm) and relatively high capacity 90 W AC adapter compared to the 65 W AC adapter that shipped with the S410 Gen 1 and most other 14-inch Ultrabooks for that matter. The higher capacity essentially "unlocks" the CPU so it to run at potentially higher TDP targets and thus higher clock rates to outperform many other laptops with the same processor. The higher power output can also come in handy if attaching different Thunderbolt-compatible accessories and for maintaining a steady charge rate regardless of onscreen activity.
Power consumption is high for a 14-inch form factor. Idling on desktop can range between 8 W to 15 W to be two times more demanding than expected due partly to the extra-bright display. Meanwhile, running higher loads like games would consume around 50 W compared to ~33 W on the older S410 Gen 1.

| Off / Standby | |
| Idle | |
| Load |
|
| Getac S410 Gen 4 i7-1185G7, Iris Xe G7 96EUs, SSSTC CA5-8D256, IPS, 1920x1080, 14.00 | Asus ExpertBook B7 Flip B7402FEA i7-1195G7, Iris Xe G7 96EUs, Samsung PM9A1 MZVL21T0HCLR, IPS, 1900x1200, 14.00 | Dell Latitude 14 5420-D2G5W i5-1135G7, Iris Xe G7 80EUs, WDC PC SN530 SDBPTPZ-256G, IPS, 1920x1080, 14.00 | Getac B360 i7-10710U, UHD Graphics 620, Lite-On CA5-8D512, IPS, 1920x1080, 13.30 | Getac S410 i5-8550U, UHD Graphics 620, CUKUSA 1 TB SATA SSD Q0526A, TN PED, 1366x768, 14.00 | Durabook S14I i7-1165G7, Iris Xe G7 96EUs, UDinfo M2P M2P80DE512GBAEP, TN, 1920x1080, 14.00 | |
|---|---|---|---|---|---|---|
| Power Consumption | 40% | 36% | 15% | 39% | -3% | |
| Idle Minimum * | 8.3 | 3.2 61% | 3.4 59% | 5.4 35% | 5.6 33% | 6.8 18% |
| Idle Average * | 10.5 | 6.3 40% | 7.1 32% | 12.2 -16% | 7.9 25% | 16.4 -56% |
| Idle Maximum * | 14.9 | 7.5 50% | 8.4 44% | 12.6 15% | 8.4 44% | 16.9 -13% |
| Load Average * | 48.6 | 35 28% | 35.3 27% | 39.1 20% | 32.8 33% | 39.2 19% |
| Witcher 3 ultra * | 50.9 | 35.4 30% | 35.4 30% | 36.5 28% | ||
| Load Maximum * | 90.1 | 63 30% | 67 26% | 81.8 9% | 34.3 62% | 73.1 19% |
* ... smaller is better
Power Consumption Witcher 3 / Stresstest
Power Consumption external Monitor
Battery Life
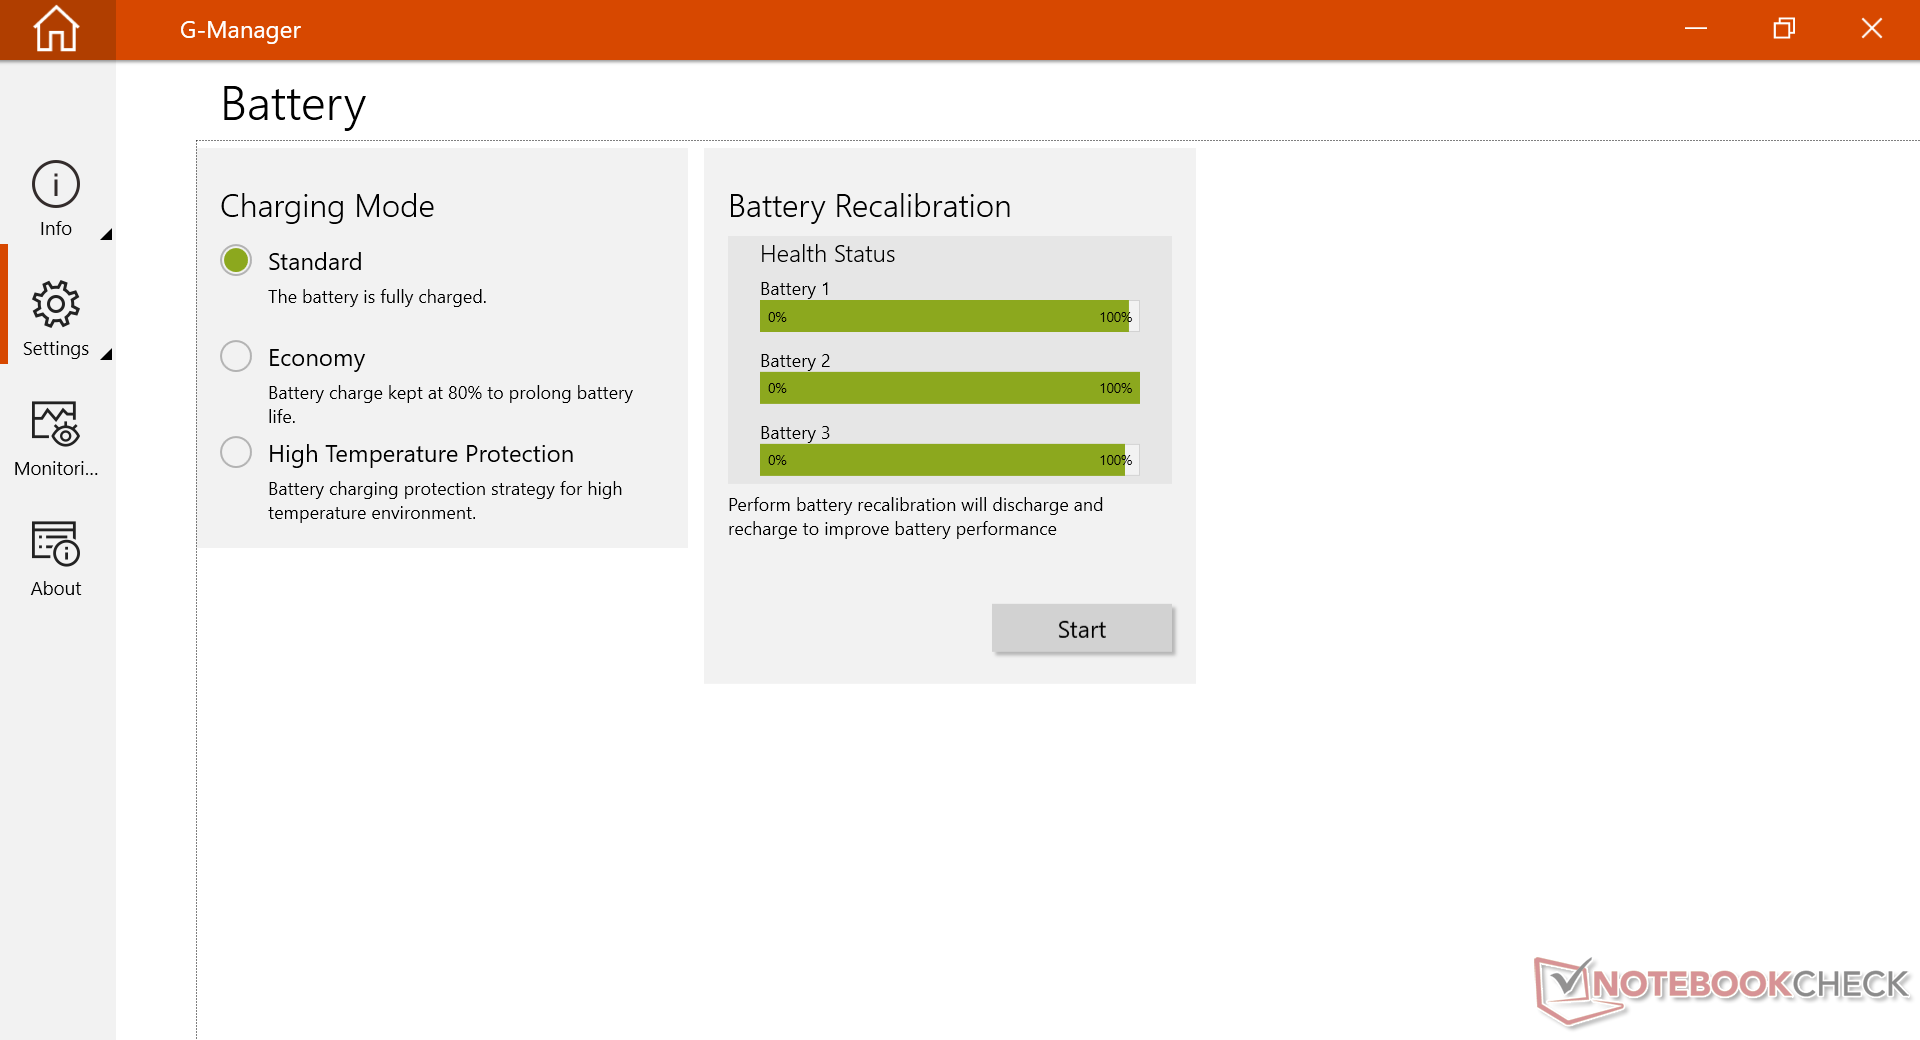
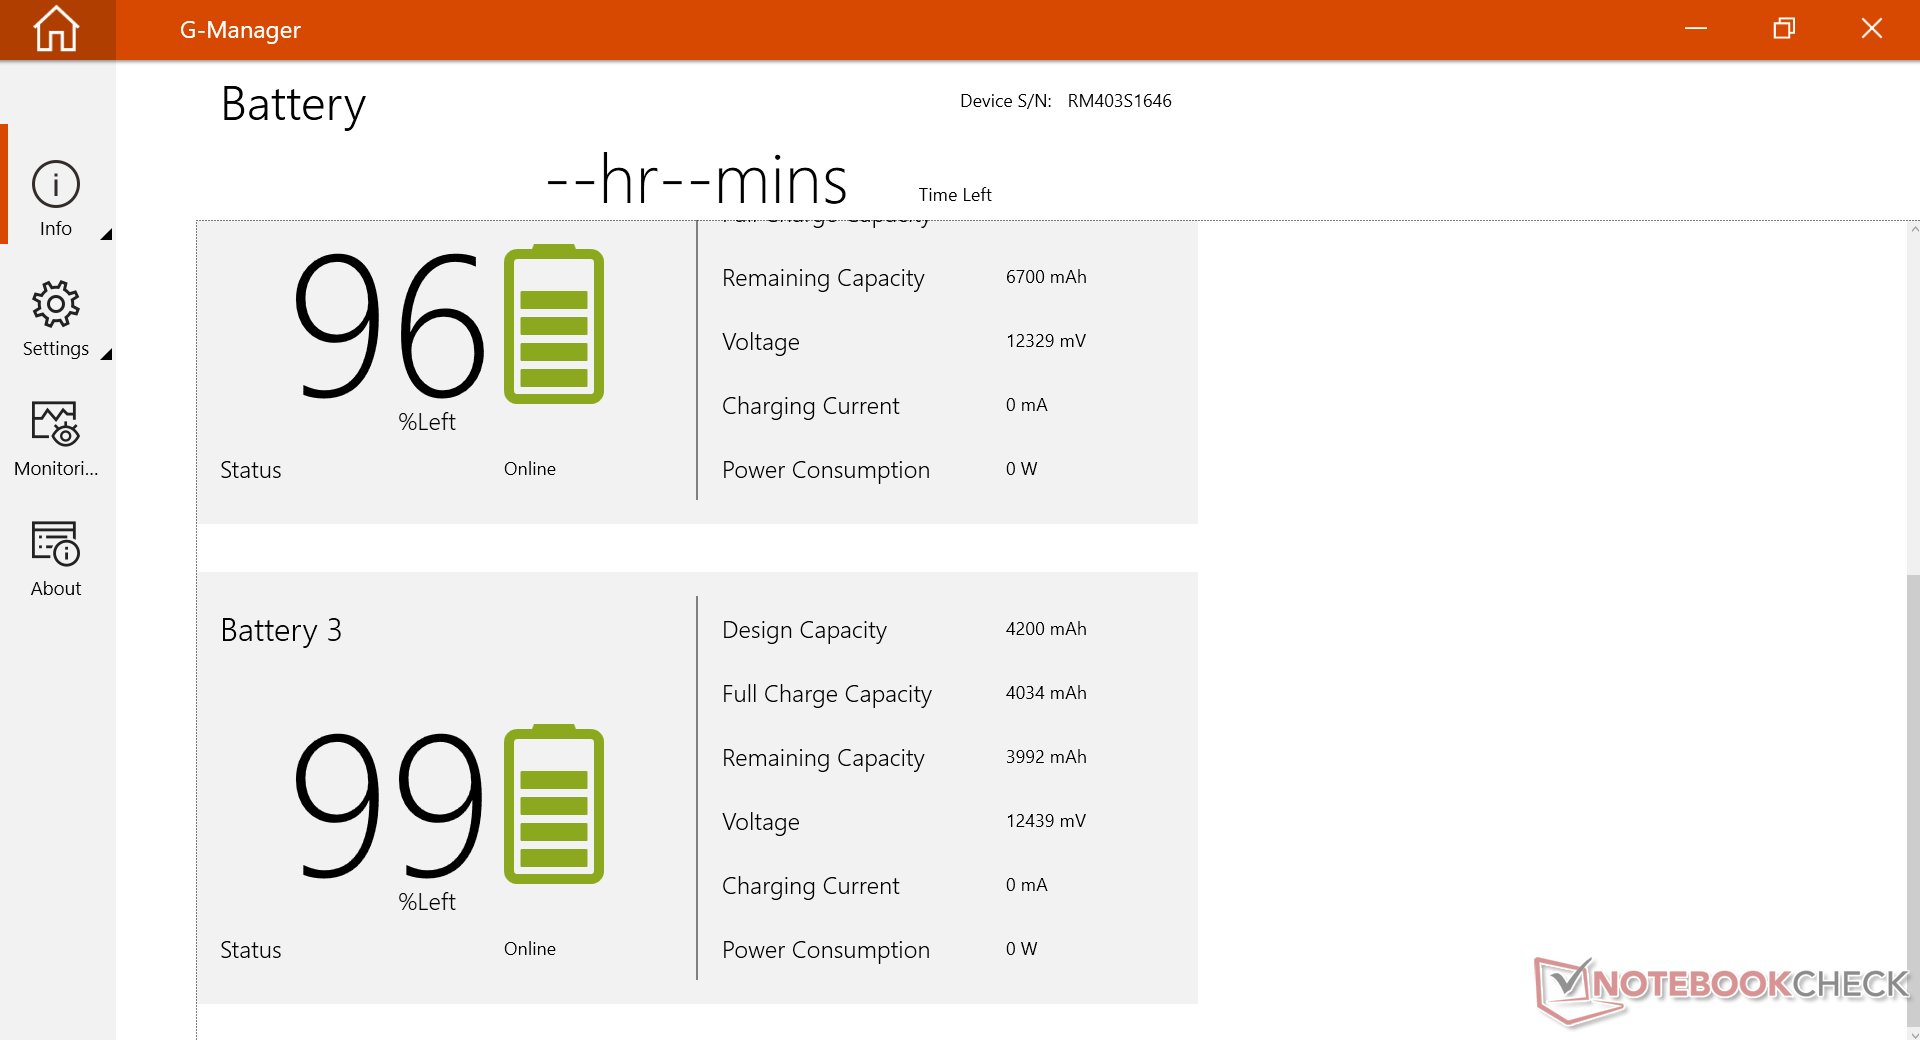
The model can support multiple batteries at a time. Our particular unit integrates a 44 Wh internal battery plus two removable batteries of 75 Wh each for at total of 194 Wh. The removable batteries attach through the docking slots along the edges of the chassis. We're able to record a real-world WLAN runtime of over 28 hours across all three batteries.
The system cannot be recharged via USB-C.
| Getac S410 Gen 4 i7-1185G7, Iris Xe G7 96EUs, 194 Wh | Asus ExpertBook B7 Flip B7402FEA i7-1195G7, Iris Xe G7 96EUs, 63 Wh | Dell Latitude 14 5420-D2G5W i5-1135G7, Iris Xe G7 80EUs, 63 Wh | Getac B360 i7-10710U, UHD Graphics 620, 46 Wh | Getac S410 i5-8550U, UHD Graphics 620, 46.6 Wh | Durabook S14I i7-1165G7, Iris Xe G7 96EUs, 50 Wh | |
|---|---|---|---|---|---|---|
| Battery Runtime | -59% | -55% | -72% | -82% | -81% | |
| WiFi v1.3 | 1715 | 705 -59% | 769 -55% | 484 -72% | 312 -82% | 329 -81% |
| Reader / Idle | 1371 | |||||
| Load | 146 |
Pros
Cons
Verdict
The differences between 10th gen Intel and 11th gen Intel are significant especially in terms of graphics performance. The new Iris Xe GPU is at least 2x to 3x faster than the previous generation UHD Graphics 620 without consuming all that much more power for remarkably higher performance-per-watt. If your workloads are heavy on the GPU, then even this simple processor update can offer noticeably smoother performance than previous generation S410 models.
The chassis has remained largely unchanged for over 4 years meaning many of the same drawbacks that we mentioned in 2018 are still present on this 2022 version. We would love to see QoL improvements such as port covers that are easier to open, higher resolution webcam, or even USB-C Power Delivery which would have made the system more versatile should the proprietary AC adapter be unavailable. Pulse-width modulation is still present as well meaning users sensitive to onscreen flickering may want to avoid using the S410 for long periods. In contrast, the Dell Latitude 7330 Rugged exhibits no such flickering behavior while integrating both easier-to-open port covers and USB-C PD.
Price and Availability
Users can request a quote from the manufacturer here.
Getac S410 Gen 4
-
05/18/2022 v7
Allen Ngo


Pricecompare
