

Nvidia RTX 3500 Ada performance debut: HP ZBook Fury 16 G11 workstation review
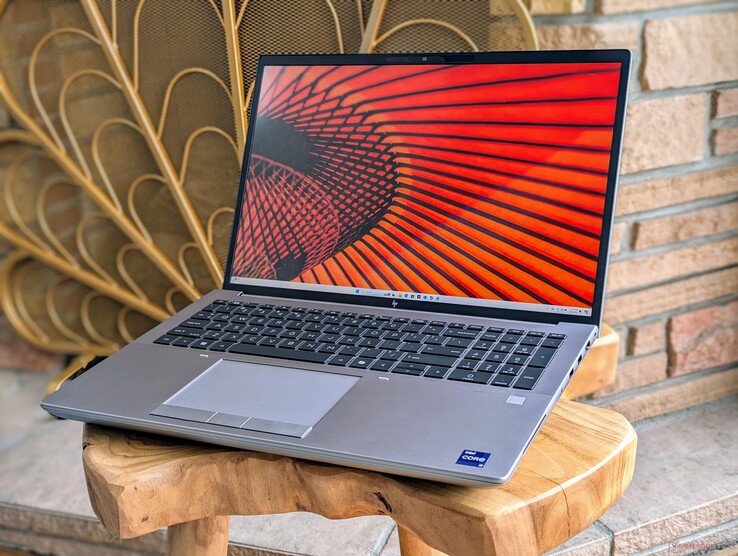
The 2024 ZBook Fury 16 G11 succeeds the 2023 Fury 16 G10 by swapping out Raptor Lake-HX CPUs for newer Raptor Lake-HX Refresh options. Otherwise, the chassis remains identical to the Fury 16 G10 or Fury 16 G9 as do many of the configurable options. We recommend checking out our review on the Fury 16 G9 to learn more about the physical features of the model.
Our test unit is an upper-midrange configuration with the Core i9-14900HX CPU, RTX 3500 Ada GPU, and 120 Hz 3840 x 2400 IPS display for approximately $3300. Other SKUs start with the Core i5-13600HX up to the RTX 5000 Ada and 2400p OLED touchscreen. There are no Meteor Lake CPU options.
Competitors to the ZBook Fury 16 G11 include other 16-inch workstations like the Dell Precision 5690, Lenovo ThinkPad P16 G2, or Asus ProArt Studiobook 16.
More HP reviews:
Potential Competitors in Comparison
Rating | Version | Date | Model | Weight | Height | Size | Resolution | Price |
|---|---|---|---|---|---|---|---|---|
| 85.9 % | v8 | 08 / 2024 | HP ZBook Fury 16 G11 i9-14900HX, NVIDIA RTX 3500 Ada Generation Laptop GPU | 2.6 kg | 28.5 mm | 16.00" | 3840x2400 | |
| 92.3 % v7 (old) | v7 (old) | 09 / 2023 | HP ZBook Fury 16 G10 i9-13950HX, NVIDIA RTX 5000 Ada Generation Laptop GPU | 2.6 kg | 28.5 mm | 16.00" | 3840x2400 | |
| 91 % v7 (old) | v7 (old) | 06 / 2023 | HP ZBook Fury 16 G9 i9-12950HX, RTX A5500 Laptop GPU | 2.6 kg | 28.5 mm | 16.00" | 3840x2400 | |
| 88.3 % v7 (old) | v7 (old) | 05 / 2024 | Dell Precision 5690 Ultra 9 185H, NVIDIA RTX 5000 Ada Generation Laptop GPU | 2.3 kg | 22.17 mm | 16.00" | 3840x2400 | |
| 90.2 % v7 (old) | v7 (old) | 03 / 2024 | Lenovo ThinkPad P16 G2 21FA000FGE i7-13700HX, NVIDIA RTX 2000 Ada Generation Laptop GPU | 3 kg | 30.23 mm | 16.00" | 2560x1600 | |
| 90.1 % v7 (old) | v7 (old) | 12 / 2023 | Lenovo ThinkPad P1 G6 21FV001KUS i7-13800H, NVIDIA GeForce RTX 4080 Laptop GPU | 1.9 kg | 17.5 mm | 16.00" | 3480x2400 | |
| 86.1 % v7 (old) | v7 (old) | 06 / 2023 | Asus ProArt Studiobook 16 OLED H7604 i9-13980HX, NVIDIA GeForce RTX 4070 Laptop GPU | 2.4 kg | 23.9 mm | 16.00" | 3200x2000 |
Hinweis: Wir haben unser Rating-System kürzlich aktualisiert und die Ergebnisse von Version 8 sind nicht mit den Ergebnissen von Version 7 vergleichbar. Weitere Informationen dazu sind hier verfügbar.
Note: We have recently updated our rating system and the results of version 8 are not comparable with the results of version 7. More information is available here .
Case
An easy way to distinguish the ZBook Fury 16 G11 from earlier iterations is to look for the Co-Pilot key on the keyboard. Otherwise, the chassis design remains the same as before.

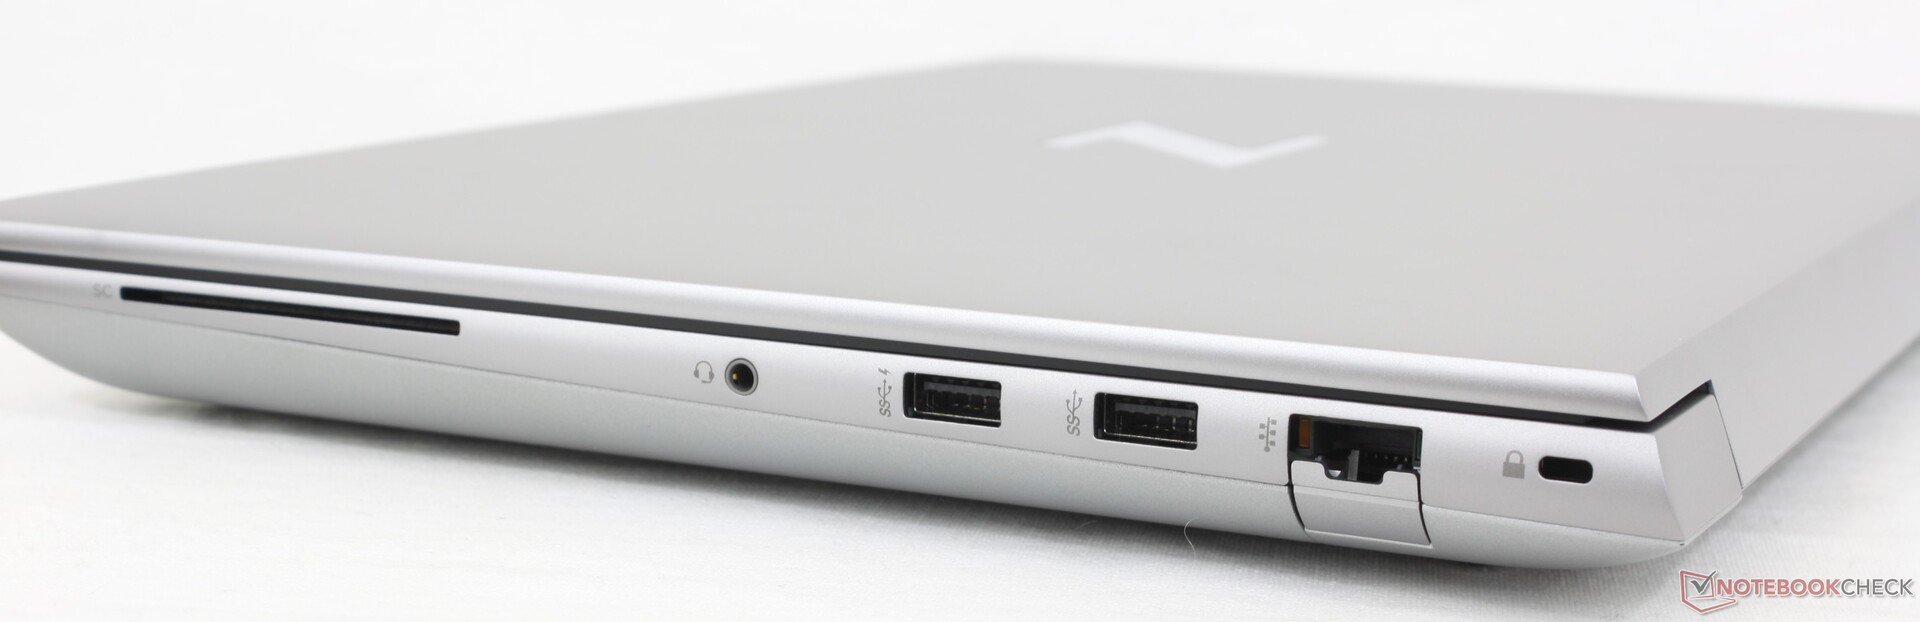
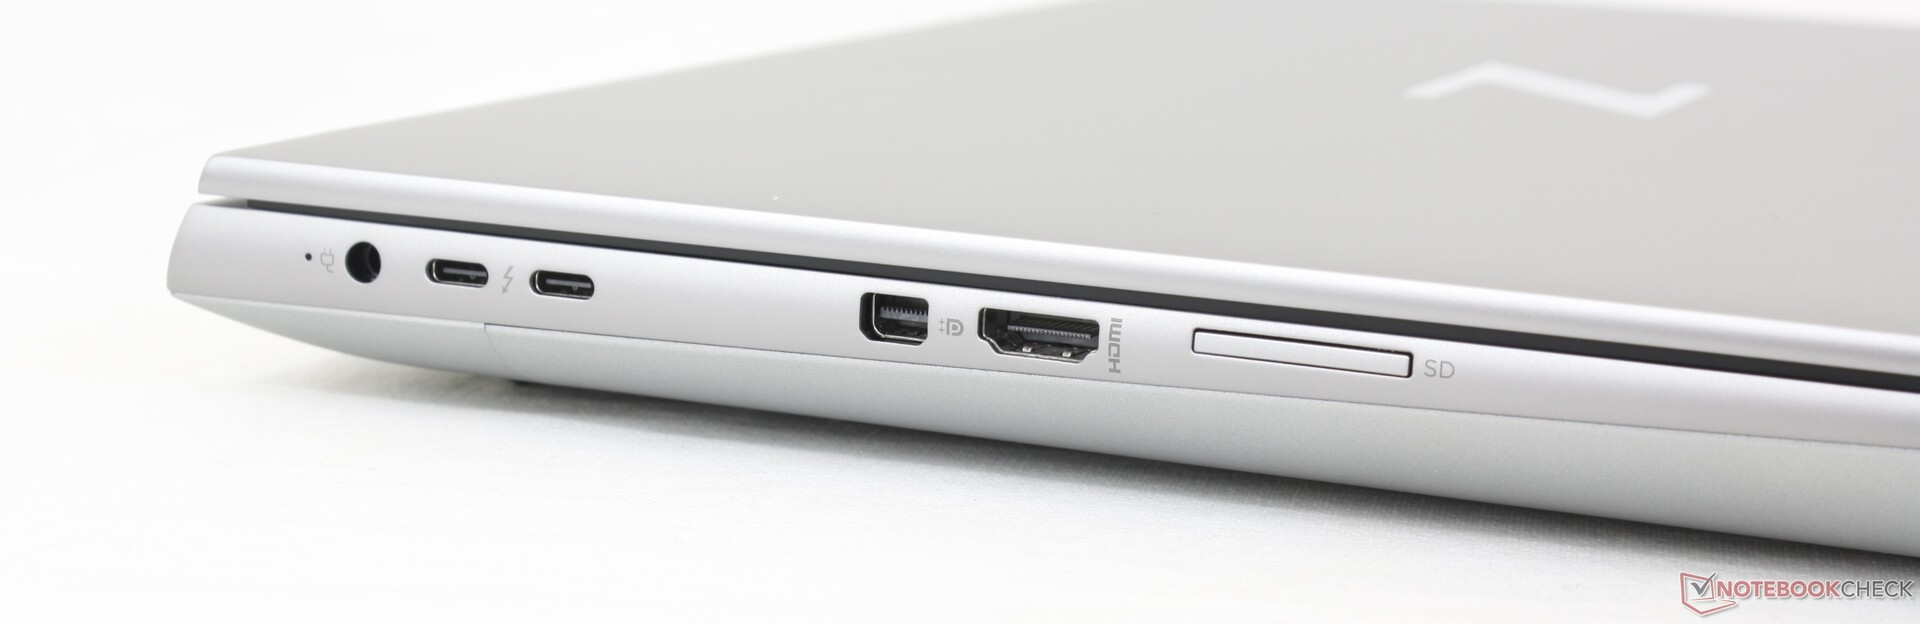
Connectivity
SD Card Reader
| SD Card Reader | |
| average JPG Copy Test (av. of 3 runs) | |
| Lenovo ThinkPad P1 G6 21FV001KUS (Toshiba Exceria Pro SDXC 64 GB UHS-II) | |
| HP ZBook Fury 16 G11 (Toshiba Exceria Pro SDXC 64 GB UHS-II) | |
| HP ZBook Fury 16 G10 (Toshiba Exceria Pro SDXC 64 GB UHS-II) | |
| HP ZBook Fury 16 G9 (PNY EliteX-PRO60) | |
| Asus ProArt Studiobook 16 OLED H7604 (Angelibird AV Pro V60) | |
| Lenovo ThinkPad P16 G2 21FA000FGE | |
| maximum AS SSD Seq Read Test (1GB) | |
| HP ZBook Fury 16 G11 (Toshiba Exceria Pro SDXC 64 GB UHS-II) | |
| Lenovo ThinkPad P1 G6 21FV001KUS (Toshiba Exceria Pro SDXC 64 GB UHS-II) | |
| HP ZBook Fury 16 G10 (Toshiba Exceria Pro SDXC 64 GB UHS-II) | |
| HP ZBook Fury 16 G9 (PNY EliteX-PRO60) | |
| Lenovo ThinkPad P16 G2 21FA000FGE | |
| Asus ProArt Studiobook 16 OLED H7604 (Angelibird AV Pro V60) | |
Communication
WLAN has been upgraded from the Intel AX211 to the BE200 for proper Wi-Fi 7 support. In practice, however, most users will still be connecting to Wi-Fi 6 or 6E access points.
Webcam


Maintenance
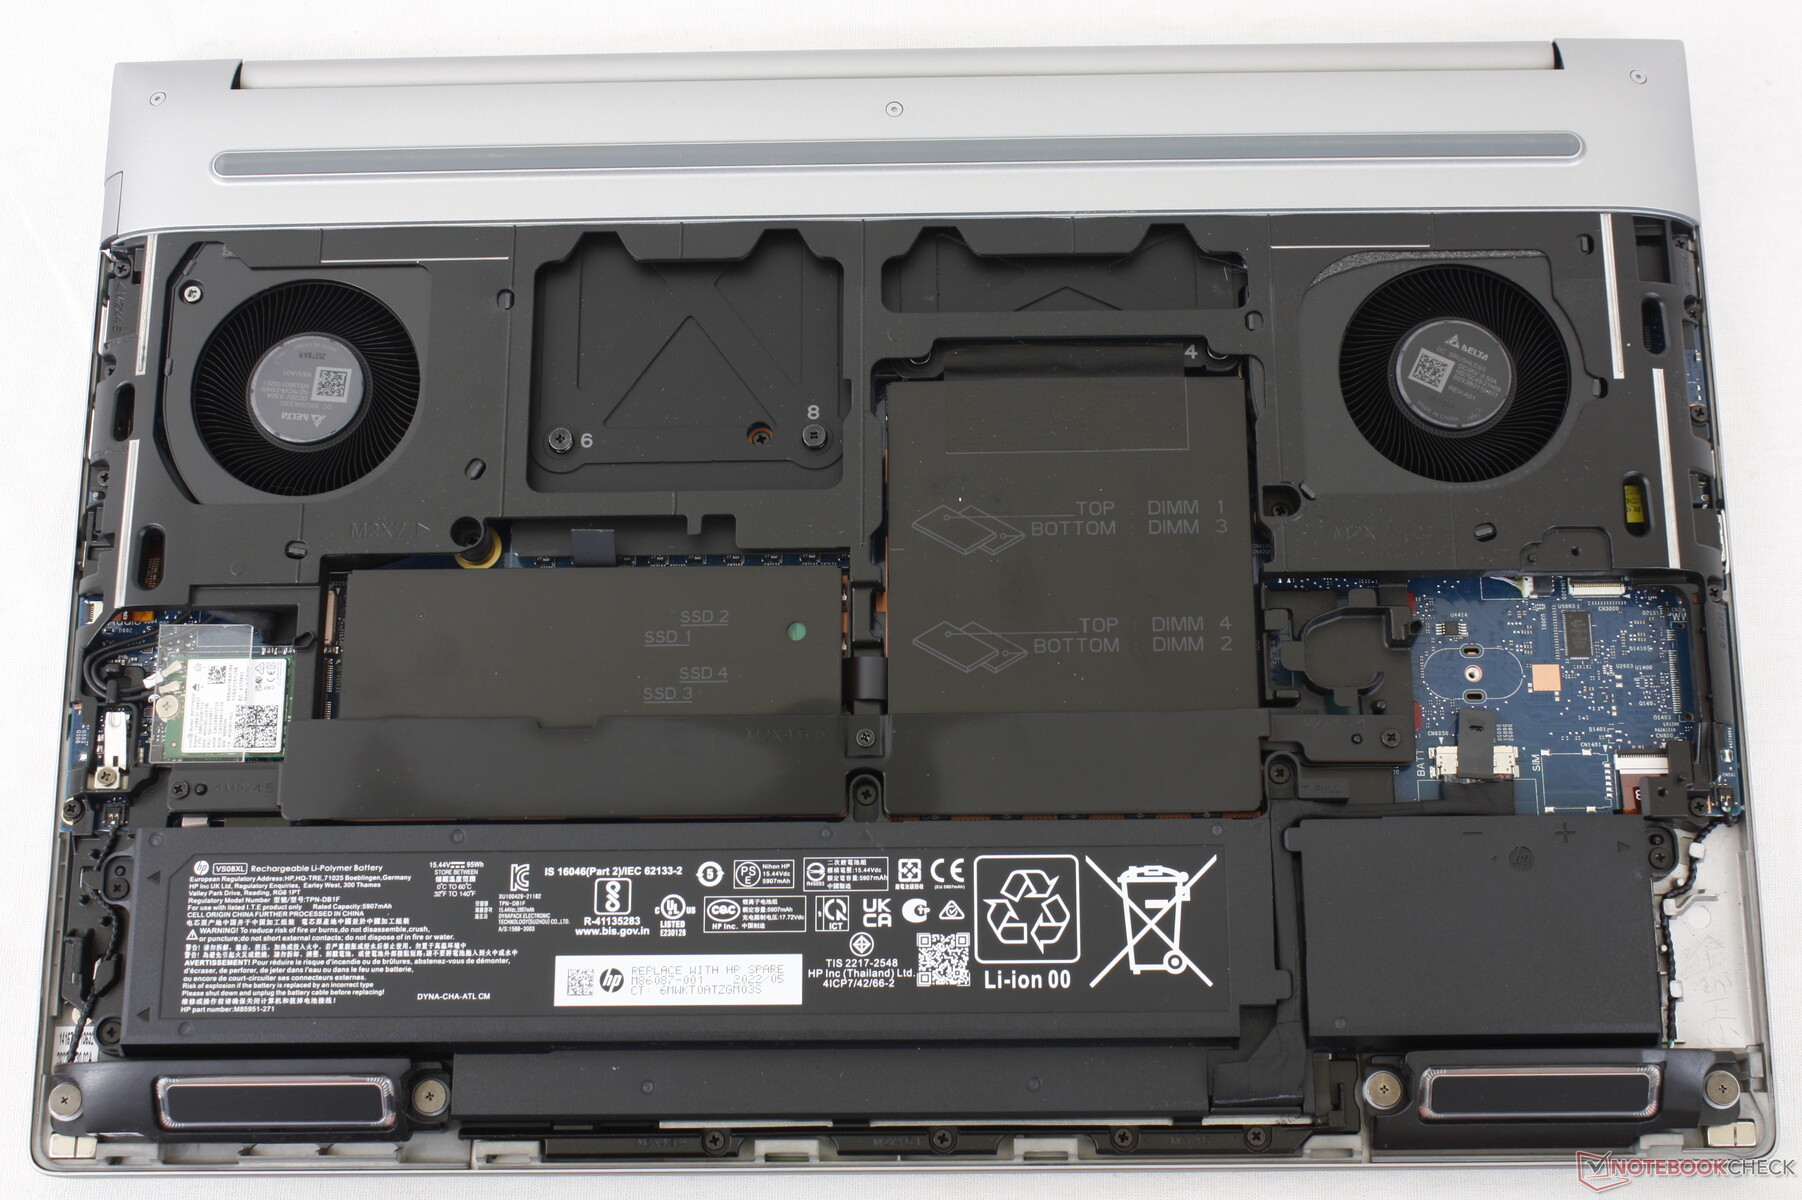
HP has been boasting tool-less servicing for its Fury 16 series since the G9 model earlier last year. While the bottom panel would readily slide off without any tools, the RAM and SODIMM modules were still protected by an aluminum cover requiring a screwdriver to remove. This aluminum cover has been redesigned with latches instead of screws on the G11 model meaning that users can now install RAM modules without any tools at all.
The SSDs, however, are still secured to the motherboard with screws and so a screwdriver is still needed when swapping out drives. The system can support up to four SSDs and four RAM modules.


Sustainability
The packaging is fully recyclable and consists mostly of paper. The AC adapter is the only item that comes wrapped in plastic.
Accessories And Warranty
The retail box includes no extras beyond the AC adapter and paperwork. A three-year manufacturer warranty comes standard if purchased in the US.
Display
Five display options are available as follows. Our specific test unit comes with the bolded panel.
- 3840 x 2400, OLED, touchscreen, glossy, 400 nits, 100% DCI-P3, 60 Hz
- 3840 x 2400, IPS, non-touch, matte, 500 nits, 100% DCI-P3, 120 Hz
- 1920 x 1200, IPS, non-touch, matte, 400 nits, 100% sRGB, 60 Hz
- 1920 x 1200, IPS, non-touch, matte, 1000 nits, 100% sRGB, 60 Hz, Sure View Integrated
- 1920 x 1200, IPS, touchscreen, glossy, 400 nits, 100% sRGB, 60 Hz
This particular panel happens to be the same one that shipped with our ZBook Fury 16 G10 and so the visual experience remains identical. Buyers who intend to use the laptop outdoors may want to consider the 1000-nit option, but this panel is unfortunately tied to Sure View which significantly limits viewing angles to make the screen harder to share with others. Meanwhile, the OLED option will offer far superior black levels to cater to digital artists and multimedia editing applications, but its glossy overlay and meager 60 Hz refresh rate can be a turn off.
Windows dynamic refresh rate is supported only down to 60 Hz on our configured panel.


| |||||||||||||||||||||||||
Brightness Distribution: 83 %
Center on Battery: 457.6 cd/m²
Contrast: 1064:1 (Black: 0.43 cd/m²)
ΔE ColorChecker Calman: 2.78 | ∀{0.5-29.43 Ø4.81}
calibrated: 1.37
ΔE Greyscale Calman: 2 | ∀{0.09-98 Ø5.1}
86% AdobeRGB 1998 (Argyll 3D)
99.9% sRGB (Argyll 3D)
98.4% Display P3 (Argyll 3D)
Gamma: 2.28
CCT: 6806 K
| HP ZBook Fury 16 G11 AUO87A8, IPS, 3840x2400, 16", 120 Hz | HP ZBook Fury 16 G10 AUO87A8, IPS, 3840x2400, 16", 120 Hz | HP ZBook Fury 16 G9 BOE0A52, IPS, 3840x2400, 16", 60 Hz | Dell Precision 5690 Samsung 160YV03, OLED, 3840x2400, 16", 60 Hz | Lenovo ThinkPad P16 G2 21FA000FGE MNG007DA1-9, IPS LED, 2560x1600, 16", 165 Hz | Lenovo ThinkPad P1 G6 21FV001KUS Samsung ATNA60YV04-0, OLED, 3480x2400, 16", 60 Hz | Asus ProArt Studiobook 16 OLED H7604 ATNA60BX01-1, OLED, 3200x2000, 16", 120 Hz | |
|---|---|---|---|---|---|---|---|
| Display | 0% | -0% | 4% | -15% | 5% | 2% | |
| Display P3 Coverage (%) | 98.4 | 98 0% | 97.4 -1% | 99.8 1% | 71 -28% | 99.8 1% | 99.6 1% |
| sRGB Coverage (%) | 99.9 | 99.9 0% | 99.9 0% | 100 0% | 99.2 -1% | 100 0% | 100 0% |
| AdobeRGB 1998 Coverage (%) | 86 | 86.2 0% | 86.3 0% | 96.6 12% | 73.2 -15% | 97.9 14% | 89.4 4% |
| Response Times | -9% | -11% | 83% | -16% | 82% | 93% | |
| Response Time Grey 50% / Grey 80% * (ms) | 11.4 ? | 11.9 ? -4% | 13.7 ? -20% | 1.7 ? 85% | 12.8 ? -12% | 1.69 ? 85% | 0.59 ? 95% |
| Response Time Black / White * (ms) | 8.4 ? | 9.6 ? -14% | 8.6 ? -2% | 1.7 ? 80% | 10.1 ? -20% | 1.73 ? 79% | 0.79 ? 91% |
| PWM Frequency (Hz) | 60 ? | 60 ? | 240 ? | ||||
| Screen | 19% | -25% | -8% | -7% | 19% | 179% | |
| Brightness middle (cd/m²) | 457.6 | 514.6 12% | 530.5 16% | 348.1 -24% | 510 11% | 375.1 -18% | 349 -24% |
| Brightness (cd/m²) | 466 | 495 6% | 476 2% | 351 -25% | 517 11% | 379 -19% | 350 -25% |
| Brightness Distribution (%) | 83 | 90 8% | 83 0% | 97 17% | 89 7% | 98 18% | 95 14% |
| Black Level * (cd/m²) | 0.43 | 0.46 -7% | 0.57 -33% | 0.37 14% | 0.02 95% | ||
| Contrast (:1) | 1064 | 1119 5% | 931 -12% | 1378 30% | 17450 1540% | ||
| Colorchecker dE 2000 * | 2.78 | 2.4 14% | 2.26 19% | 4.18 -50% | 2.6 6% | 1.16 58% | 2.1 24% |
| Colorchecker dE 2000 max. * | 5.53 | 4.86 12% | 6.68 -21% | 5.2 6% | 2.94 47% | 5.5 1% | |
| Colorchecker dE 2000 calibrated * | 1.37 | 0.4 71% | 4.73 -245% | 0.97 29% | 2.3 -68% | 2.1 -53% | |
| Greyscale dE 2000 * | 2 | 1 50% | 1 50% | 1.7 15% | 3.6 -80% | 1.4 30% | 1.2 40% |
| Gamma | 2.28 96% | 2.3 96% | 2.28 96% | 2.2 100% | 2.26 97% | 2.2 100% | 2.19 100% |
| CCT | 6806 96% | 6553 99% | 6543 99% | 6198 105% | 5969 109% | 6325 103% | 6545 99% |
| Total Average (Program / Settings) | 3% /
11% | -12% /
-17% | 26% /
10% | -13% /
-10% | 35% /
27% | 91% /
129% |
* ... smaller is better


The display is well-calibrated against the P3 standard with average deltaE grayscale and color values of just 2 and 2.18, respectively. Calibrating the panel even further with our X-Rite colorimeter would improve accuracy only slightly to be mostly unnecessary for most users.


Display Response Times
| ↔ Response Time Black to White | ||
|---|---|---|
| 8.4 ms ... rise ↗ and fall ↘ combined | ↗ 4.7 ms rise |  |
| ↘ 3.7 ms fall | ||
| The screen shows fast response rates in our tests and should be suited for gaming. In comparison, all tested devices range from 0.1 (minimum) to 240 (maximum) ms. » 22 % of all devices are better. This means that the measured response time is better than the average of all tested devices (20.4 ms). | ||
| ↔ Response Time 50% Grey to 80% Grey | ||
| 11.4 ms ... rise ↗ and fall ↘ combined | ↗ 5.3 ms rise |  |
| ↘ 6.1 ms fall | ||
| The screen shows good response rates in our tests, but may be too slow for competitive gamers. In comparison, all tested devices range from 0.165 (minimum) to 636 (maximum) ms. » 23 % of all devices are better. This means that the measured response time is better than the average of all tested devices (31.9 ms). | ||
Screen Flickering / PWM (Pulse-Width Modulation)
| Screen flickering / PWM not detected |  | ||
In comparison: 53 % of all tested devices do not use PWM to dim the display. If PWM was detected, an average of 8260 (minimum: 5 - maximum: 343500) Hz was measured. | |||


Performance — Higher Turbo Boost Potential


Testing Conditions
We set both Windows and MyHP to Performance mode prior to running the benchmarks below. We also disabled GPU ECC mode via Nvidia Control Panel.


Processor
Jumping from the Core i9-12950HX in the ZBook Fury 16 G9 to the Core i9-13950HX in the ZBook Fury 16 G10 brought significant performance gains. Unfortunately, the same can't be said when jumping from the Core i9-13950HX in the Fury 16 G10 to the Core i9-14900HX in our Fury 16 G11 configuration. The gains are much smaller by about 10 to 15 percent before accounting for any throttling. Once throttling is accounted for, overall processor performance would be essentially identical to the Core i9-13950HX as shown by our CineBench R15 xT loop test results below. The Core i9-14900HX utilizes the same underlying architecture as the Core i9-13950HX and so it can be considered a rebrand of last year's options. Thus, the higher Turbo Boost ceiling is its main advantage over the outgoing processor even if those higher Turbo Boost speeds are short-lived.
The Lenovo Legion 9 16IRX9, which ships with the same Core i9-14900HX as our HP, would run up to 20 percent faster likely due to its more capable cooling solution to sustain higher Turbo Boost clock rates.
Cinebench R15 Multi Loop
Cinebench R23: Multi Core | Single Core
Cinebench R20: CPU (Multi Core) | CPU (Single Core)
Cinebench R15: CPU Multi 64Bit | CPU Single 64Bit
Blender: v2.79 BMW27 CPU
7-Zip 18.03: 7z b 4 | 7z b 4 -mmt1
Geekbench 6.4: Multi-Core | Single-Core
Geekbench 5.5: Multi-Core | Single-Core
HWBOT x265 Benchmark v2.2: 4k Preset
LibreOffice : 20 Documents To PDF
R Benchmark 2.5: Overall mean
| Geekbench 6.4 / Multi-Core | |
| Average Intel Core i9-14900HX (13158 - 19665, n=37) | |
| HP ZBook Fury 16 G10 | |
| HP ZBook Fury 16 G11 | |
| Dell Precision 5000 5680 | |
| Dell Precision 5690 | |
| Lenovo ThinkPad P1 G6 21FV001KUS | |
| Lenovo ThinkPad P1 G6-21FV000DGE | |
| Lenovo ThinkPad P16v G1 AMD | |
| Geekbench 6.4 / Single-Core | |
| Average Intel Core i9-14900HX (2419 - 3129, n=37) | |
| HP ZBook Fury 16 G10 | |
| HP ZBook Fury 16 G11 | |
| Lenovo ThinkPad P1 G6 21FV001KUS | |
| Lenovo ThinkPad P1 G6-21FV000DGE | |
| Dell Precision 5000 5680 | |
| Lenovo ThinkPad P16v G1 AMD | |
| Dell Precision 5690 | |
Cinebench R23: Multi Core | Single Core
Cinebench R20: CPU (Multi Core) | CPU (Single Core)
Cinebench R15: CPU Multi 64Bit | CPU Single 64Bit
Blender: v2.79 BMW27 CPU
7-Zip 18.03: 7z b 4 | 7z b 4 -mmt1
Geekbench 6.4: Multi-Core | Single-Core
Geekbench 5.5: Multi-Core | Single-Core
HWBOT x265 Benchmark v2.2: 4k Preset
LibreOffice : 20 Documents To PDF
R Benchmark 2.5: Overall mean
* ... smaller is better
AIDA64: FP32 Ray-Trace | FPU Julia | CPU SHA3 | CPU Queen | FPU SinJulia | FPU Mandel | CPU AES | CPU ZLib | FP64 Ray-Trace | CPU PhotoWorxx
| Performance Rating | |
| Asus ProArt Studiobook 16 OLED H7604 | |
| Average Intel Core i9-14900HX | |
| HP ZBook Fury 16 G10 | |
| HP ZBook Fury 16 G11 | |
| Dell Precision 5690 | |
| Lenovo ThinkPad P16 G2 21FA000FGE | |
| HP ZBook Fury 16 G9 | |
| Lenovo ThinkPad P1 G6 21FV001KUS | |
| AIDA64 / FP32 Ray-Trace | |
| Asus ProArt Studiobook 16 OLED H7604 | |
| Average Intel Core i9-14900HX (13098 - 33474, n=36) | |
| HP ZBook Fury 16 G10 | |
| HP ZBook Fury 16 G11 | |
| Dell Precision 5690 | |
| Lenovo ThinkPad P16 G2 21FA000FGE | |
| HP ZBook Fury 16 G9 | |
| Lenovo ThinkPad P1 G6 21FV001KUS | |
| AIDA64 / FPU Julia | |
| Asus ProArt Studiobook 16 OLED H7604 | |
| Average Intel Core i9-14900HX (67573 - 166040, n=36) | |
| HP ZBook Fury 16 G10 | |
| HP ZBook Fury 16 G11 | |
| HP ZBook Fury 16 G9 | |
| Dell Precision 5690 | |
| Lenovo ThinkPad P16 G2 21FA000FGE | |
| Lenovo ThinkPad P1 G6 21FV001KUS | |
| AIDA64 / CPU SHA3 | |
| Asus ProArt Studiobook 16 OLED H7604 | |
| Average Intel Core i9-14900HX (3589 - 7979, n=36) | |
| HP ZBook Fury 16 G10 | |
| HP ZBook Fury 16 G11 | |
| Dell Precision 5690 | |
| Lenovo ThinkPad P16 G2 21FA000FGE | |
| HP ZBook Fury 16 G9 | |
| Lenovo ThinkPad P1 G6 21FV001KUS | |
| AIDA64 / CPU Queen | |
| Average Intel Core i9-14900HX (118405 - 148966, n=36) | |
| HP ZBook Fury 16 G11 | |
| Asus ProArt Studiobook 16 OLED H7604 | |
| HP ZBook Fury 16 G10 | |
| Lenovo ThinkPad P1 G6 21FV001KUS | |
| Lenovo ThinkPad P16 G2 21FA000FGE | |
| HP ZBook Fury 16 G9 | |
| Dell Precision 5690 | |
| AIDA64 / FPU SinJulia | |
| Asus ProArt Studiobook 16 OLED H7604 | |
| Average Intel Core i9-14900HX (10475 - 18517, n=36) | |
| HP ZBook Fury 16 G11 | |
| HP ZBook Fury 16 G10 | |
| Lenovo ThinkPad P16 G2 21FA000FGE | |
| HP ZBook Fury 16 G9 | |
| Dell Precision 5690 | |
| Lenovo ThinkPad P1 G6 21FV001KUS | |
| AIDA64 / FPU Mandel | |
| Asus ProArt Studiobook 16 OLED H7604 | |
| Average Intel Core i9-14900HX (32543 - 83662, n=36) | |
| HP ZBook Fury 16 G10 | |
| HP ZBook Fury 16 G11 | |
| Dell Precision 5690 | |
| HP ZBook Fury 16 G9 | |
| Lenovo ThinkPad P16 G2 21FA000FGE | |
| Lenovo ThinkPad P1 G6 21FV001KUS | |
| AIDA64 / CPU ZLib | |
| Asus ProArt Studiobook 16 OLED H7604 | |
| Average Intel Core i9-14900HX (1054 - 2292, n=36) | |
| HP ZBook Fury 16 G11 | |
| HP ZBook Fury 16 G10 | |
| Dell Precision 5690 | |
| HP ZBook Fury 16 G9 | |
| Lenovo ThinkPad P1 G6 21FV001KUS | |
| Lenovo ThinkPad P16 G2 21FA000FGE | |
| AIDA64 / FP64 Ray-Trace | |
| Asus ProArt Studiobook 16 OLED H7604 | |
| Average Intel Core i9-14900HX (6809 - 18349, n=36) | |
| HP ZBook Fury 16 G10 | |
| HP ZBook Fury 16 G11 | |
| Lenovo ThinkPad P16 G2 21FA000FGE | |
| Dell Precision 5690 | |
| Lenovo ThinkPad P1 G6 21FV001KUS | |
| HP ZBook Fury 16 G9 | |
| AIDA64 / CPU PhotoWorxx | |
| Dell Precision 5690 | |
| Asus ProArt Studiobook 16 OLED H7604 | |
| Average Intel Core i9-14900HX (23903 - 54702, n=36) | |
| HP ZBook Fury 16 G10 | |
| HP ZBook Fury 16 G9 | |
| HP ZBook Fury 16 G11 | |
| Lenovo ThinkPad P16 G2 21FA000FGE | |
| Lenovo ThinkPad P1 G6 21FV001KUS | |
Stress Test
When running Prime95 to stress the CPU, core clock rates and package power draw would spike to 3.7 GHz and 139 W, respectively, lasting for only a minute at most with core temperature also spiking to 99 C. The CPU would eventually settle at 2.3 GHz and 69 W in order to maintain a more manageable core temperature of 82 C. The relatively steep drop in performance over time leads to the progressively lower CineBench R15 xT loop scores noted above.
CPU and GPU temperatures when running higher loads like games would stabilize at nearly the same readings as what we recorded on last year's ZBook Fury 16 G10 despite their performance differences.


| Average CPU Clock (GHz) | GPU Clock (MHz) | Average CPU Temperature (°C) | Average GPU Temperature (°C) | |
| System Idle | -- | -- | 51 | 42 |
| Prime95 Stress | 2.2 - 2.6 | -- | 82 | 57 |
| Prime95 + FurMark Stress | 1.8 | 1995 | 81 | 65 |
| Cyberpunk 2077 Stress | 1.1 | 1845 | 81 | 69 |
System Performance
PCMark results are similar to what we recorded on last year's ZBook Fury 16 G10 to suggest that the ZBook Fury 16 G11 won't be running most day-to-day tasks any faster than its predecessor.
Keep in mind that maximum RAM speed is limited to just 4000 MT/s if configured with 128 GB of memory due to the limitations of the SODIMM standard. The model supports both ECC RAM and non-ECC RAM.

CrossMark: Overall | Productivity | Creativity | Responsiveness
WebXPRT 3: Overall
WebXPRT 4: Overall
Mozilla Kraken 1.1: Total
| PCMark 10 / Score | |
| HP ZBook Fury 16 G10 | |
| Dell Precision 5690 | |
| Lenovo ThinkPad P1 G6 21FV001KUS | |
| HP ZBook Fury 16 G11 | |
| Average Intel Core i9-14900HX, NVIDIA RTX 3500 Ada Generation Laptop GPU (n=1) | |
| Asus ProArt Studiobook 16 OLED H7604 | |
| Lenovo ThinkPad P16 G2 21FA000FGE | |
| HP ZBook Fury 16 G9 | |
| PCMark 10 / Essentials | |
| Lenovo ThinkPad P1 G6 21FV001KUS | |
| HP ZBook Fury 16 G10 | |
| Dell Precision 5690 | |
| Lenovo ThinkPad P16 G2 21FA000FGE | |
| HP ZBook Fury 16 G9 | |
| Asus ProArt Studiobook 16 OLED H7604 | |
| HP ZBook Fury 16 G11 | |
| Average Intel Core i9-14900HX, NVIDIA RTX 3500 Ada Generation Laptop GPU (n=1) | |
| PCMark 10 / Productivity | |
| Dell Precision 5690 | |
| Lenovo ThinkPad P1 G6 21FV001KUS | |
| Asus ProArt Studiobook 16 OLED H7604 | |
| HP ZBook Fury 16 G11 | |
| Average Intel Core i9-14900HX, NVIDIA RTX 3500 Ada Generation Laptop GPU (n=1) | |
| Lenovo ThinkPad P16 G2 21FA000FGE | |
| HP ZBook Fury 16 G10 | |
| HP ZBook Fury 16 G9 | |
| PCMark 10 / Digital Content Creation | |
| HP ZBook Fury 16 G10 | |
| HP ZBook Fury 16 G11 | |
| Average Intel Core i9-14900HX, NVIDIA RTX 3500 Ada Generation Laptop GPU (n=1) | |
| Lenovo ThinkPad P1 G6 21FV001KUS | |
| Dell Precision 5690 | |
| Asus ProArt Studiobook 16 OLED H7604 | |
| Lenovo ThinkPad P16 G2 21FA000FGE | |
| HP ZBook Fury 16 G9 | |
| CrossMark / Overall | |
| Asus ProArt Studiobook 16 OLED H7604 | |
| HP ZBook Fury 16 G11 | |
| Average Intel Core i9-14900HX, NVIDIA RTX 3500 Ada Generation Laptop GPU (n=1) | |
| HP ZBook Fury 16 G10 | |
| HP ZBook Fury 16 G9 | |
| Lenovo ThinkPad P16 G2 21FA000FGE | |
| Lenovo ThinkPad P1 G6 21FV001KUS | |
| Dell Precision 5690 | |
| CrossMark / Productivity | |
| Asus ProArt Studiobook 16 OLED H7604 | |
| HP ZBook Fury 16 G11 | |
| Average Intel Core i9-14900HX, NVIDIA RTX 3500 Ada Generation Laptop GPU (n=1) | |
| HP ZBook Fury 16 G10 | |
| HP ZBook Fury 16 G9 | |
| Dell Precision 5690 | |
| Lenovo ThinkPad P1 G6 21FV001KUS | |
| Lenovo ThinkPad P16 G2 21FA000FGE | |
| CrossMark / Creativity | |
| Asus ProArt Studiobook 16 OLED H7604 | |
| HP ZBook Fury 16 G11 | |
| Average Intel Core i9-14900HX, NVIDIA RTX 3500 Ada Generation Laptop GPU (n=1) | |
| Lenovo ThinkPad P16 G2 21FA000FGE | |
| HP ZBook Fury 16 G9 | |
| HP ZBook Fury 16 G10 | |
| Lenovo ThinkPad P1 G6 21FV001KUS | |
| Dell Precision 5690 | |
| CrossMark / Responsiveness | |
| Asus ProArt Studiobook 16 OLED H7604 | |
| HP ZBook Fury 16 G11 | |
| Average Intel Core i9-14900HX, NVIDIA RTX 3500 Ada Generation Laptop GPU (n=1) | |
| HP ZBook Fury 16 G10 | |
| HP ZBook Fury 16 G9 | |
| Dell Precision 5690 | |
| Lenovo ThinkPad P1 G6 21FV001KUS | |
| Lenovo ThinkPad P16 G2 21FA000FGE | |
| WebXPRT 3 / Overall | |
| HP ZBook Fury 16 G10 | |
| Asus ProArt Studiobook 16 OLED H7604 | |
| Lenovo ThinkPad P16 G2 21FA000FGE | |
| HP ZBook Fury 16 G11 | |
| Average Intel Core i9-14900HX, NVIDIA RTX 3500 Ada Generation Laptop GPU (n=1) | |
| Lenovo ThinkPad P1 G6 21FV001KUS | |
| HP ZBook Fury 16 G9 | |
| Dell Precision 5690 | |
| WebXPRT 4 / Overall | |
| HP ZBook Fury 16 G11 | |
| Average Intel Core i9-14900HX, NVIDIA RTX 3500 Ada Generation Laptop GPU (n=1) | |
| HP ZBook Fury 16 G10 | |
| Asus ProArt Studiobook 16 OLED H7604 | |
| Lenovo ThinkPad P1 G6 21FV001KUS | |
| HP ZBook Fury 16 G9 | |
| Dell Precision 5690 | |
| Mozilla Kraken 1.1 / Total | |
| Dell Precision 5690 | |
| HP ZBook Fury 16 G9 | |
| Lenovo ThinkPad P16 G2 21FA000FGE | |
| Lenovo ThinkPad P1 G6 21FV001KUS | |
| HP ZBook Fury 16 G10 | |
| HP ZBook Fury 16 G11 | |
| Average Intel Core i9-14900HX, NVIDIA RTX 3500 Ada Generation Laptop GPU (n=1) | |
| Asus ProArt Studiobook 16 OLED H7604 | |
* ... smaller is better
| PCMark 10 Score | 7607 points | |
Help | ||
| AIDA64 / Memory Copy | |
| Dell Precision 5690 | |
| Average Intel Core i9-14900HX (38028 - 83392, n=36) | |
| Asus ProArt Studiobook 16 OLED H7604 | |
| HP ZBook Fury 16 G10 | |
| HP ZBook Fury 16 G9 | |
| HP ZBook Fury 16 G11 | |
| Lenovo ThinkPad P16 G2 21FA000FGE | |
| Lenovo ThinkPad P1 G6 21FV001KUS | |
| AIDA64 / Memory Read | |
| Dell Precision 5690 | |
| Average Intel Core i9-14900HX (43306 - 87568, n=36) | |
| Asus ProArt Studiobook 16 OLED H7604 | |
| HP ZBook Fury 16 G10 | |
| HP ZBook Fury 16 G11 | |
| HP ZBook Fury 16 G9 | |
| Lenovo ThinkPad P16 G2 21FA000FGE | |
| Lenovo ThinkPad P1 G6 21FV001KUS | |
| AIDA64 / Memory Write | |
| Dell Precision 5690 | |
| Average Intel Core i9-14900HX (37146 - 80589, n=36) | |
| Asus ProArt Studiobook 16 OLED H7604 | |
| HP ZBook Fury 16 G10 | |
| HP ZBook Fury 16 G9 | |
| Lenovo ThinkPad P16 G2 21FA000FGE | |
| HP ZBook Fury 16 G11 | |
| Lenovo ThinkPad P1 G6 21FV001KUS | |
| AIDA64 / Memory Latency | |
| Dell Precision 5690 | |
| HP ZBook Fury 16 G10 | |
| Lenovo ThinkPad P16 G2 21FA000FGE | |
| HP ZBook Fury 16 G11 | |
| HP ZBook Fury 16 G9 | |
| Asus ProArt Studiobook 16 OLED H7604 | |
| Lenovo ThinkPad P1 G6 21FV001KUS | |
| Average Intel Core i9-14900HX (76.1 - 105, n=36) | |
* ... smaller is better
DPC Latency
LatencyMon reveals DPC issues when opening multiple browser tabs of our homepage. 4K video playback at 60 FPS is otherwise perfect with no dropped frames recorded.


| DPC Latencies / LatencyMon - interrupt to process latency (max), Web, Youtube, Prime95 | |
| HP ZBook Fury 16 G11 | |
| HP ZBook Fury 16 G10 | |
| HP ZBook Fury 16 G9 | |
| Asus ProArt Studiobook 16 OLED H7604 | |
| Lenovo ThinkPad P1 G6 21FV001KUS | |
| Lenovo ThinkPad P16 G2 21FA000FGE | |
| Dell Precision 5690 | |
* ... smaller is better
Storage Devices
Our test unit ships with the same 1 TB SK Hynix PC801 HFS001TEJ9X101N PCIe4 M.2 SSD as found on last year's ZBook Fury 16 G10. Unfortunately, the drive suffers from the same performance throttling issues as well. When running DiskSpd in a loop, transfer rates would start out very high at almost 7000 MB/s before falling to as low as 3400 MB/s just a few minutes later as shown by the graph below. This can be attributed to insufficient cooling for the drives, but that is perhaps the price to pay for supporting more individual drives than most on other laptops.


* ... smaller is better
Disk Throttling: DiskSpd Read Loop, Queue Depth 8
GPU Performance
Users can expect the RTX 3500 Ada to perform roughly 20 to 30 percent slower than the RTX 5000 Ada. Since Nvidia has not yet introduced a new generation of mobile GPUs, the ZBook Fury 16 G11 ships with the same GPU options as on last year's model for no noteworthy performance gains. The RTA 5000 Ada remains the fastest mobile workstation GPU available.
| Power Profile | Graphics Score | Physics Score | Combined Score |
| Performance Mode | 29248 | 36682 | 11830 |
| Balanced Mode | 28214 (-4%) | 33094 (-10%) | 10246 (-13%) |
| Battery Power | 16618 (-43%) | 25118 (-32%) | 4101 (-65%) |
Running on Balanced mode instead of Performance mode would impact performance by up to 10 to 15 percent as shown by our Fire Strike table above. The performance deficit grows even larger if running on battery power which is to be expected from most high-performance laptops.


| 3DMark Performance Rating - Percent | |
| HP ZBook Fury 16 G10 -2! | |
| Dell Precision 5690 -2! | |
| Dell Precision 5000 5680 -2! | |
| HP ZBook Fury 16 G11 | |
| Average NVIDIA RTX 3500 Ada Generation Laptop GPU | |
| Lenovo ThinkPad P1 G6 21FV001KUS -2! | |
| Lenovo ThinkPad P1 G6-21FV000DGE -17! | |
| HP ZBook Fury 16 G9 -2! | |
| Lenovo ThinkPad P16 G2 21FA000FGE -17! | |
| MSI CreatorPro Z16P B12UKST -17! | |
| Asus ProArt Studiobook 16 OLED H7604 -17! | |
| Asus ExpertBook B6 Flip B6602FC2 -17! | |
| Lenovo ThinkPad P1 G4-20Y4S0KS00 -10! | |
| Lenovo ThinkPad P16v G1 AMD -17! | |
| 3DMark 11 Performance | 34779 points | |
| 3DMark Fire Strike Score | 26188 points | |
| 3DMark Time Spy Score | 13191 points | |
| 3DMark Steel Nomad Score | 2793 points | |
Help | ||
* ... smaller is better
Gaming Performance
Though not designed for gaming, the RTX 3500 Ada performs slightly above mobile GeForce RTX 4070 but below the mobile RTX 4080 especially when taking a look at the number of unified pipelines, tensor cores, and memory bandwidth. Performance may nonetheless gradually slow over time when stressed as GPU boost speeds are not indefinite. When idling on Cyberpunk 2077 at 1080p Ultra settings, for example, performance would start out at just over 70 FPS before gradually declining to the low 60 FPS range after only 30 minutes as shown by the graph below.
| Performance Rating - Percent | |
| HP ZBook Fury 16 G10 -2! | |
| Lenovo ThinkPad P1 G6 21FV001KUS -1! | |
| HP ZBook Fury 16 G11 | |
| Asus ProArt Studiobook 16 OLED H7604 -1! | |
| Dell Precision 5690 -1! | |
| HP ZBook Fury 16 G9 -1! | |
| Lenovo ThinkPad P16 G2 21FA000FGE -1! | |
| GTA V - 1920x1080 Highest Settings possible AA:4xMSAA + FX AF:16x | |
| Asus ProArt Studiobook 16 OLED H7604 | |
| Lenovo ThinkPad P1 G6 21FV001KUS | |
| HP ZBook Fury 16 G9 | |
| HP ZBook Fury 16 G11 | |
| Lenovo ThinkPad P16 G2 21FA000FGE | |
| Final Fantasy XV Benchmark - 1920x1080 High Quality | |
| HP ZBook Fury 16 G10 | |
| Lenovo ThinkPad P1 G6 21FV001KUS | |
| Dell Precision 5690 | |
| HP ZBook Fury 16 G11 | |
| Asus ProArt Studiobook 16 OLED H7604 | |
| HP ZBook Fury 16 G9 | |
| Lenovo ThinkPad P16 G2 21FA000FGE | |
| Strange Brigade - 1920x1080 ultra AA:ultra AF:16 | |
| HP ZBook Fury 16 G10 | |
| Dell Precision 5690 | |
| HP ZBook Fury 16 G11 | |
| HP ZBook Fury 16 G9 | |
| Lenovo ThinkPad P16 G2 21FA000FGE | |
| Asus ProArt Studiobook 16 OLED H7604 | |
| Dota 2 Reborn - 1920x1080 ultra (3/3) best looking | |
| Asus ProArt Studiobook 16 OLED H7604 | |
| HP ZBook Fury 16 G10 | |
| HP ZBook Fury 16 G11 | |
| HP ZBook Fury 16 G9 | |
| Lenovo ThinkPad P16 G2 21FA000FGE | |
| Lenovo ThinkPad P1 G6 21FV001KUS | |
| Dell Precision 5690 | |
| Cyberpunk 2077 2.2 Phantom Liberty - 1920x1080 Ultra Preset (FSR off) | |
| Dell Precision 5690 | |
| Lenovo ThinkPad P1 G6 21FV001KUS | |
| HP ZBook Fury 16 G11 | |
| Baldur's Gate 3 | |
| 1920x1080 Ultra Preset AA:T | |
| Dell Precision 5690 | |
| Lenovo ThinkPad P1 G6 21FV001KUS | |
| HP ZBook Fury 16 G11 | |
| Average NVIDIA RTX 3500 Ada Generation Laptop GPU (n=1) | |
| 2560x1440 Ultra Preset AA:T | |
| Dell Precision 5690 | |
| Lenovo ThinkPad P1 G6 21FV001KUS | |
| HP ZBook Fury 16 G11 | |
| Average NVIDIA RTX 3500 Ada Generation Laptop GPU (n=1) | |
| 3840x2160 Ultra Preset AA:T | |
| Dell Precision 5690 | |
| Lenovo ThinkPad P1 G6 21FV001KUS | |
| HP ZBook Fury 16 G11 | |
| Average NVIDIA RTX 3500 Ada Generation Laptop GPU (n=1) | |
Cyberpunk 2077 ultra FPS Chart
| low | med. | high | ultra | QHD | 4K | |
|---|---|---|---|---|---|---|
| GTA V (2015) | 184.3 | 181 | 170.1 | 115.5 | 97.5 | 59.6 |
| Dota 2 Reborn (2015) | 201 | 177.7 | 162.1 | 153.9 | 134.4 | |
| Final Fantasy XV Benchmark (2018) | 200 | 167.6 | 128.9 | 97.5 | 54.2 | |
| X-Plane 11.11 (2018) | 144.6 | 137.8 | 110.9 | 92.7 | ||
| Far Cry 5 (2018) | 133 | 135 | 127 | 109 | 62 | |
| Strange Brigade (2018) | 411 | 296 | 235 | 223 | 159.2 | 78.6 |
| Tiny Tina's Wonderlands (2022) | 232.5 | 195.4 | 137.9 | 109.3 | 74.4 | 41.6 |
| F1 22 (2022) | 228 | 223 | 182.8 | 72.9 | 48.3 | 24 |
| Baldur's Gate 3 (2023) | 164.8 | 136.2 | 118.6 | 117.3 | 80.2 | 41.2 |
| Cyberpunk 2077 2.2 Phantom Liberty (2023) | 121.2 | 113.1 | 101.8 | 90.3 | 60.2 | 21.3 |
Emissions
System Noise
Fan noise and behavior are about the same as what we recorded on last year's model if not slightly louder when running higher loads. The fans would still occasionally pulse when idling on desktop as well even when set to Balanced mode with no running applications. Worse yet, our specific unit suffers from noticeable coil whine that would persist throughout the entire testing period.

Noise Level
| Idle |
| 23.2 / 23.2 / 29.5 dB(A) |
| Load |
| 43 / 48.2 dB(A) |
 | ||
30 dB silent 40 dB(A) audible 50 dB(A) loud |
||
min: | ||
| HP ZBook Fury 16 G11 NVIDIA RTX 3500 Ada Generation Laptop GPU, i9-14900HX, SK hynix PC801 HFS001TEJ9X101N | HP ZBook Fury 16 G10 NVIDIA RTX 5000 Ada Generation Laptop GPU, i9-13950HX, SK hynix PC801 HFS001TEJ9X101N | HP ZBook Fury 16 G9 RTX A5500 Laptop GPU, i9-12950HX, Micron 3400 1TB MTFDKBA1T0TFH | Dell Precision 5690 NVIDIA RTX 5000 Ada Generation Laptop GPU, Ultra 9 185H, 2x Samsung PM9A1 1TB (RAID 0) | Lenovo ThinkPad P16 G2 21FA000FGE NVIDIA RTX 2000 Ada Generation Laptop GPU, i7-13700HX, SK hynix PC801 HFS001TEJ9X162N | Lenovo ThinkPad P1 G6 21FV001KUS NVIDIA GeForce RTX 4080 Laptop GPU, i7-13800H, Kioxia XG8 KXG8AZNV1T02 | Asus ProArt Studiobook 16 OLED H7604 NVIDIA GeForce RTX 4070 Laptop GPU, i9-13980HX, Phison EM2804TBMTCB47 | |
|---|---|---|---|---|---|---|---|
| Noise | 3% | 4% | -3% | -4% | 9% | -5% | |
| off / environment * (dB) | 23.2 | 22.9 1% | 22.6 3% | 23.4 -1% | 23.5 -1% | 22.5 3% | 24.5 -6% |
| Idle Minimum * (dB) | 23.2 | 22.9 1% | 22.7 2% | 23.6 -2% | 23.5 -1% | 22.5 3% | 24.5 -6% |
| Idle Average * (dB) | 23.2 | 22.9 1% | 22.7 2% | 24.9 -7% | 29.2 -26% | 22.5 3% | 24.5 -6% |
| Idle Maximum * (dB) | 29.5 | 28.5 3% | 28.8 2% | 30.9 -5% | 29.5 -0% | 22.5 24% | 24.5 17% |
| Load Average * (dB) | 43 | 40.6 6% | 36.2 16% | 40.4 6% | 32.7 24% | 28.7 33% | 47.6 -11% |
| Cyberpunk 2077 ultra * (dB) | 48.2 | ||||||
| Load Maximum * (dB) | 48.2 | 45.8 5% | 49.3 -2% | 51.9 -8% | 56.6 -17% | 54.4 -13% | 56.7 -18% |
| Witcher 3 ultra * (dB) | 44.1 | 49.5 | 48.3 | 50.6 | 47.5 | 55.9 |
* ... smaller is better
Temperature


(±) The maximum temperature on the upper side is 42.2 °C / 108 F, compared to the average of 38.2 °C / 101 F, ranging from 22.2 to 69.8 °C for the class Workstation.
(-) The bottom heats up to a maximum of 48 °C / 118 F, compared to the average of 41.2 °C / 106 F
(±) In idle usage, the average temperature for the upper side is 33.8 °C / 93 F, compared to the device average of 32 °C / 90 F.
(-) 3: The average temperature for the upper side is 38.5 °C / 101 F, compared to the average of 32 °C / 90 F for the class Workstation.
(±) The palmrests and touchpad can get very hot to the touch with a maximum of 37.6 °C / 99.7 F.
(-) The average temperature of the palmrest area of similar devices was 27.9 °C / 82.2 F (-9.7 °C / -17.5 F).


| HP ZBook Fury 16 G11 Intel Core i9-14900HX, NVIDIA RTX 3500 Ada Generation Laptop GPU | HP ZBook Fury 16 G10 Intel Core i9-13950HX, Nvidia RTX 5000 Ada Generation Laptop GPU | HP ZBook Fury 16 G9 Intel Core i9-12950HX, NVIDIA RTX A5500 Laptop GPU | Dell Precision 5690 Intel Core Ultra 9 185H, Nvidia RTX 5000 Ada Generation Laptop GPU | Lenovo ThinkPad P16 G2 21FA000FGE Intel Core i7-13700HX, NVIDIA RTX 2000 Ada Generation Laptop GPU | Lenovo ThinkPad P1 G6 21FV001KUS Intel Core i7-13800H, NVIDIA GeForce RTX 4080 Laptop GPU | Asus ProArt Studiobook 16 OLED H7604 Intel Core i9-13980HX, NVIDIA GeForce RTX 4070 Laptop GPU | |
|---|---|---|---|---|---|---|---|
| Heat | 3% | 10% | 13% | 15% | 4% | 3% | |
| Maximum Upper Side * (°C) | 42.2 | 44.8 -6% | 43.2 -2% | 46.6 -10% | 47.2 -12% | 42 -0% | 44.1 -5% |
| Maximum Bottom * (°C) | 48 | 50 -4% | 50.4 -5% | 33 31% | 39.5 18% | 45.2 6% | 48 -0% |
| Idle Upper Side * (°C) | 37 | 34.4 7% | 28.6 23% | 32.4 12% | 28.1 24% | 33 11% | 32.7 12% |
| Idle Bottom * (°C) | 36.8 | 31.8 14% | 28.2 23% | 29.4 20% | 25.3 31% | 37 -1% | 34.9 5% |
* ... smaller is better
Speakers

HP ZBook Fury 16 G11 audio analysis
(+) | speakers can play relatively loud (88.9 dB)
Bass 100 - 315 Hz
(±) | reduced bass - on average 13.3% lower than median
(±) | linearity of bass is average (11.2% delta to prev. frequency)
Mids 400 - 2000 Hz
(+) | balanced mids - only 2.2% away from median
(+) | mids are linear (3.2% delta to prev. frequency)
Highs 2 - 16 kHz
(+) | balanced highs - only 3.7% away from median
(+) | highs are linear (4.6% delta to prev. frequency)
Overall 100 - 16.000 Hz
(+) | overall sound is linear (12.9% difference to median)
Compared to same class
» 18% of all tested devices in this class were better, 6% similar, 76% worse
» The best had a delta of 7%, average was 18%, worst was 35%
Compared to all devices tested
» 11% of all tested devices were better, 3% similar, 86% worse
» The best had a delta of 4%, average was 24%, worst was 134%
Apple MacBook Pro 16 2021 M1 Pro audio analysis
(+) | speakers can play relatively loud (84.7 dB)
Bass 100 - 315 Hz
(+) | good bass - only 3.8% away from median
(+) | bass is linear (5.2% delta to prev. frequency)
Mids 400 - 2000 Hz
(+) | balanced mids - only 1.3% away from median
(+) | mids are linear (2.1% delta to prev. frequency)
Highs 2 - 16 kHz
(+) | balanced highs - only 1.9% away from median
(+) | highs are linear (2.7% delta to prev. frequency)
Overall 100 - 16.000 Hz
(+) | overall sound is linear (4.6% difference to median)
Compared to same class
» 0% of all tested devices in this class were better, 0% similar, 100% worse
» The best had a delta of 5%, average was 18%, worst was 45%
Compared to all devices tested
» 0% of all tested devices were better, 0% similar, 100% worse
» The best had a delta of 4%, average was 24%, worst was 134%
Energy Management
Power Consumption
The system is more efficient when idling on desktop compared to our ZBook Fury 16 G10 configuration. Otherwise, consumption becomes nearly the same when running more demanding loads such as games even though the configured GPUs are different between our two examples. Performance-per-watt therefore increases when selecting higher-end GPU configurations versus our midrange RTX 3500 Ada.
Consumption when running Prime95 or CineBench R15 xT would be noticeably higher on our unit when compared to last year's model due to the higher Turbo Boost potential of our Core i9-14900HX processor. After a minute or so, however, consumption would fall to be nearly in line with what we measured on last year's model as shown by the comparison graph below which aligns with our CineBench R15 xT loop observations from above. Thus, our higher initial Turbo Boost potential is the key advantage between the newer Core i9-14900HX and older Core i9-13950HX.
We're able to record a maximum consumption of 236 W from the large (~18 x 8.8 x 2.5 cm) 230 W AC adapter when the CPU and GPU are each at 100 percent utilization.


| Off / Standby | |
| Idle | |
| Load |
|
Key:
min: | |
| HP ZBook Fury 16 G11 i9-14900HX, NVIDIA RTX 3500 Ada Generation Laptop GPU, SK hynix PC801 HFS001TEJ9X101N, IPS, 3840x2400, 16" | HP ZBook Fury 16 G10 i9-13950HX, NVIDIA RTX 5000 Ada Generation Laptop GPU, SK hynix PC801 HFS001TEJ9X101N, IPS, 3840x2400, 16" | HP ZBook Fury 16 G9 i9-12950HX, RTX A5500 Laptop GPU, Micron 3400 1TB MTFDKBA1T0TFH, IPS, 3840x2400, 16" | Dell Precision 5690 Ultra 9 185H, NVIDIA RTX 5000 Ada Generation Laptop GPU, 2x Samsung PM9A1 1TB (RAID 0), OLED, 3840x2400, 16" | Lenovo ThinkPad P16 G2 21FA000FGE i7-13700HX, NVIDIA RTX 2000 Ada Generation Laptop GPU, SK hynix PC801 HFS001TEJ9X162N, IPS LED, 2560x1600, 16" | Lenovo ThinkPad P1 G6 21FV001KUS i7-13800H, NVIDIA GeForce RTX 4080 Laptop GPU, Kioxia XG8 KXG8AZNV1T02, OLED, 3480x2400, 16" | Asus ProArt Studiobook 16 OLED H7604 i9-13980HX, NVIDIA GeForce RTX 4070 Laptop GPU, Phison EM2804TBMTCB47, OLED, 3200x2000, 16" | |
|---|---|---|---|---|---|---|---|
| Power Consumption | -34% | -77% | -1% | 4% | 7% | -24% | |
| Idle Minimum * (Watt) | 8.6 | 15.3 -78% | 19.5 -127% | 7.9 8% | 9.3 -8% | 8 7% | 12.8 -49% |
| Idle Average * (Watt) | 14.8 | 18.2 -23% | 29 -96% | 12 19% | 14.1 5% | 9.5 36% | 19.9 -34% |
| Idle Maximum * (Watt) | 15.7 | 28 -78% | 40.7 -159% | 28.6 -82% | 15.5 1% | 23.7 -51% | 20.3 -29% |
| Load Average * (Watt) | 129.4 | 137.9 -7% | 142.1 -10% | 98.8 24% | 133.6 -3% | 97.2 25% | 131.4 -2% |
| Cyberpunk 2077 ultra external monitor * (Watt) | 192.6 | ||||||
| Cyberpunk 2077 ultra * (Watt) | 199.4 | ||||||
| Load Maximum * (Watt) | 236.1 | 202 14% | 224.4 5% | 174.8 26% | 179.6 24% | 197.2 16% | 246.8 -5% |
| Witcher 3 ultra * (Watt) | 189.4 | 188.6 | 144.5 | 144.9 | 144 | 196.5 |
* ... smaller is better
Power Consumption Cyberpunk / Stress Test
Power Consumption external Monitor
Battery Life
Runtimes are very similar to last year's ZBook Fury 16 G11 if not slightly shorter likely due to the higher Turbo Boost ceiling for the Raptor Lake-HX Refresh CPU. Competing models like the Precision 5690 or ThinkPad P16 G2 can each last at least an hour or so longer in comparison.
Charging from empty to full capacity with the included barrel AC adapter is relatively fast at just over 60 minutes.
| HP ZBook Fury 16 G11 i9-14900HX, NVIDIA RTX 3500 Ada Generation Laptop GPU, 95 Wh | HP ZBook Fury 16 G10 i9-13950HX, NVIDIA RTX 5000 Ada Generation Laptop GPU, 95 Wh | HP ZBook Fury 16 G9 i9-12950HX, RTX A5500 Laptop GPU, 95 Wh | Dell Precision 5690 Ultra 9 185H, NVIDIA RTX 5000 Ada Generation Laptop GPU, 98 Wh | Lenovo ThinkPad P16 G2 21FA000FGE i7-13700HX, NVIDIA RTX 2000 Ada Generation Laptop GPU, 94 Wh | Lenovo ThinkPad P1 G6 21FV001KUS i7-13800H, NVIDIA GeForce RTX 4080 Laptop GPU, 90 Wh | Asus ProArt Studiobook 16 OLED H7604 i9-13980HX, NVIDIA GeForce RTX 4070 Laptop GPU, 90 Wh | |
|---|---|---|---|---|---|---|---|
| Battery Runtime | 9% | -10% | 37% | 28% | -37% | -16% | |
| WiFi v1.3 (h) | 6.7 | 7.3 9% | 6 -10% | 9.2 37% | 8.6 28% | 4.2 -37% | 5.6 -16% |
| Reader / Idle (h) | 5.3 | ||||||
| Load (h) | 1.2 | 1.1 | |||||
| H.264 (h) | 6 |
Pros
Cons
Verdict — Strong Design Dragged Down By Limited Turbo Boost

We love the design of the ZBook Fury 16 G11. While it remains the same as the Fury 16 G9, its ease of servicing, wide configurable options, ECC RAM support, and comfortable keyboard and touchpad check off all the right boxes for workstation users.
Instead, the main problems with the ZBook Fury 16 G11 lie in its performance. When another laptop like the Lenovo Legion 9 16IRX9 can run the exact same Core i9-14900HX CPU up to 20 percent faster than our ZBook, then the cooling solution in the HP could definitely use an upgrade to support higher Turbo Boost speeds for longer. Similarly, the M.2 SSDs could benefit from heat spreaders for the same reason as they would also throttle when stressed. These limitations mar the benefits of the Core i9 CPU and PCIe4 SSD as they can potentially perform faster on competing machines from Dell or Lenovo.
The ZBook Fury 16 G11 is only a minor update over last year's ZBook Fury G10. Though it still looks and feels great, performance tends to throttle for heavier usage scenarios.
Lastly, it's a bit unfortunate that the model offers no Meteor Lake options for no local AI acceleration. Granted, such a feature likely only appeals to a small subset of workstation users, but it would have helped to further distinguish the Fury 16 G11 from the Fury 16 G10. You can get essentially the same performance and features from the barely one-year old Fury 16 G10 as you can on the latest Fury 16 G11.
Price and Availability
The ZBook Fury 16 G11 is currently shipping for around $3400 as configured with the Core i9-14900HX and RTX 3500 Ada up to over $5500 if fully configured with the RTX 5000 Ada.
Hinweis: Wir haben unser Rating-System kürzlich aktualisiert und die Ergebnisse von Version 8 sind nicht mit den Ergebnissen von Version 7 vergleichbar. Weitere Informationen dazu sind hier verfügbar.
Note: We have recently updated our rating system and the results of version 8 are not comparable with the results of version 7. More information is available here .
HP ZBook Fury 16 G11
- 08/12/2024 v8
Allen Ngo
 Total Sustainability Score:


Transparency
The selection of devices to be reviewed is made by our editorial team. The test sample was provided to the author as a loan by the manufacturer or retailer for the purpose of this review. The lender had no influence on this review, nor did the manufacturer receive a copy of this review before publication. There was no obligation to publish this review. We never accept compensation or payment in return for our reviews. As an independent media company, Notebookcheck is not subjected to the authority of manufacturers, retailers or publishers.
This is how Notebookcheck is testing
Every year, Notebookcheck independently reviews hundreds of laptops and smartphones using standardized procedures to ensure that all results are comparable. We have continuously developed our test methods for around 20 years and set industry standards in the process. In our test labs, high-quality measuring equipment is utilized by experienced technicians and editors. These tests involve a multi-stage validation process. Our complex rating system is based on hundreds of well-founded measurements and benchmarks, which maintains objectivity. Further information on our test methods can be found here.
Price comparison
