HP ProBook 450 G7 Core i7 Laptop Review: Is It Better Than The Ryzen 7 ProBook 455 G7?
Earlier last month, we had checked out the AMD-powered HP ProBook 455 G7 and found it to be packed with useful features considering the ~$1000 price point. The HP ProBook 450 G7, which is the Intel version of the ProBook 455 G7, is identical save for the obvious change in processors and other minor tweaks. Potential customers will inevitably ask themselves: Which is the better deal?
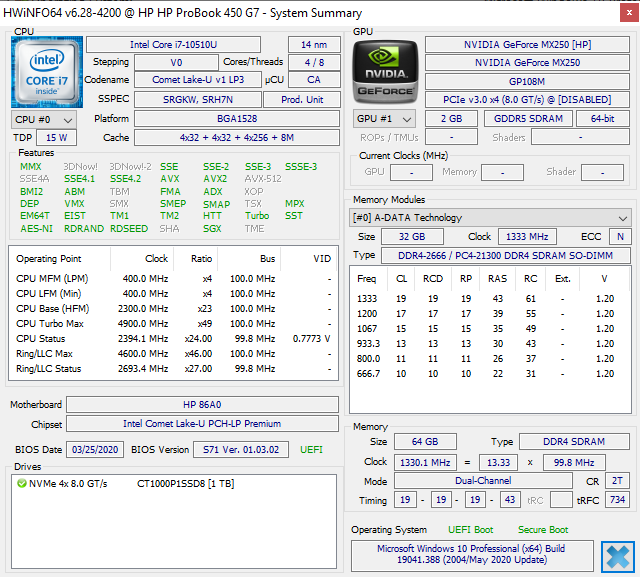
Our ProBook 450 G7 test unit today comes from CUKUSA equipped with the Intel 10th gen Comet Lake-U Core i7-10510U CPU and GeForce MX250 GPU for approximately $1100 USD or more depending on how much storage or RAM is configured. This gives us an excellent opportunity to directly compare the Intel ProBook 450 G7 to the AMD ProBook 455 G7 in key aspects ranging from battery life to fan noise and performance. Additional details on the keyboard and other physical features can be found on our review of the ProBook 455 G7 since the two systems share the same chassis design.
More HP reviews:
Rating | Date | Model | Weight | Height | Size | Resolution | Price |
|---|---|---|---|---|---|---|---|
| 81.4 % v7 (old) | 08 / 2020 | HP ProBook 450 G7 8WC04UT i7-10510U, GeForce MX250 | 1.9 kg | 19 mm | 15.60" | 1920x1080 | |
| 82.6 % v7 (old) | 07 / 2020 | HP ProBook 455 G7-175W8EA R7 4700U, Vega 7 | 1.8 kg | 19 mm | 15.60" | 1920x1080 | |
| 80.1 % v7 (old) | 02 / 2020 | MSI Modern 15 A10RB i7-10510U, GeForce MX250 | 1.6 kg | 15.9 mm | 15.60" | 1920x1080 | |
| 79.6 % v6 (old) | 06 / 2019 | Dell Latitude 15 3590 i5-8250U, UHD Graphics 620 | 2.1 kg | 22 mm | 15.60" | 1920x1080 | |
| 83.2 % v7 (old) | 10 / 2019 | Lenovo ThinkPad L590-20Q70019GE i5-8265U, UHD Graphics 620 | 2 kg | 23 mm | 15.60" | 1920x1080 | |
| 82.9 % v7 (old) | 11 / 2019 | Dynabook Tecra X50-F i7-8665U, UHD Graphics 620 | 1.4 kg | 17.6 mm | 15.60" | 1920x1080 |
Case
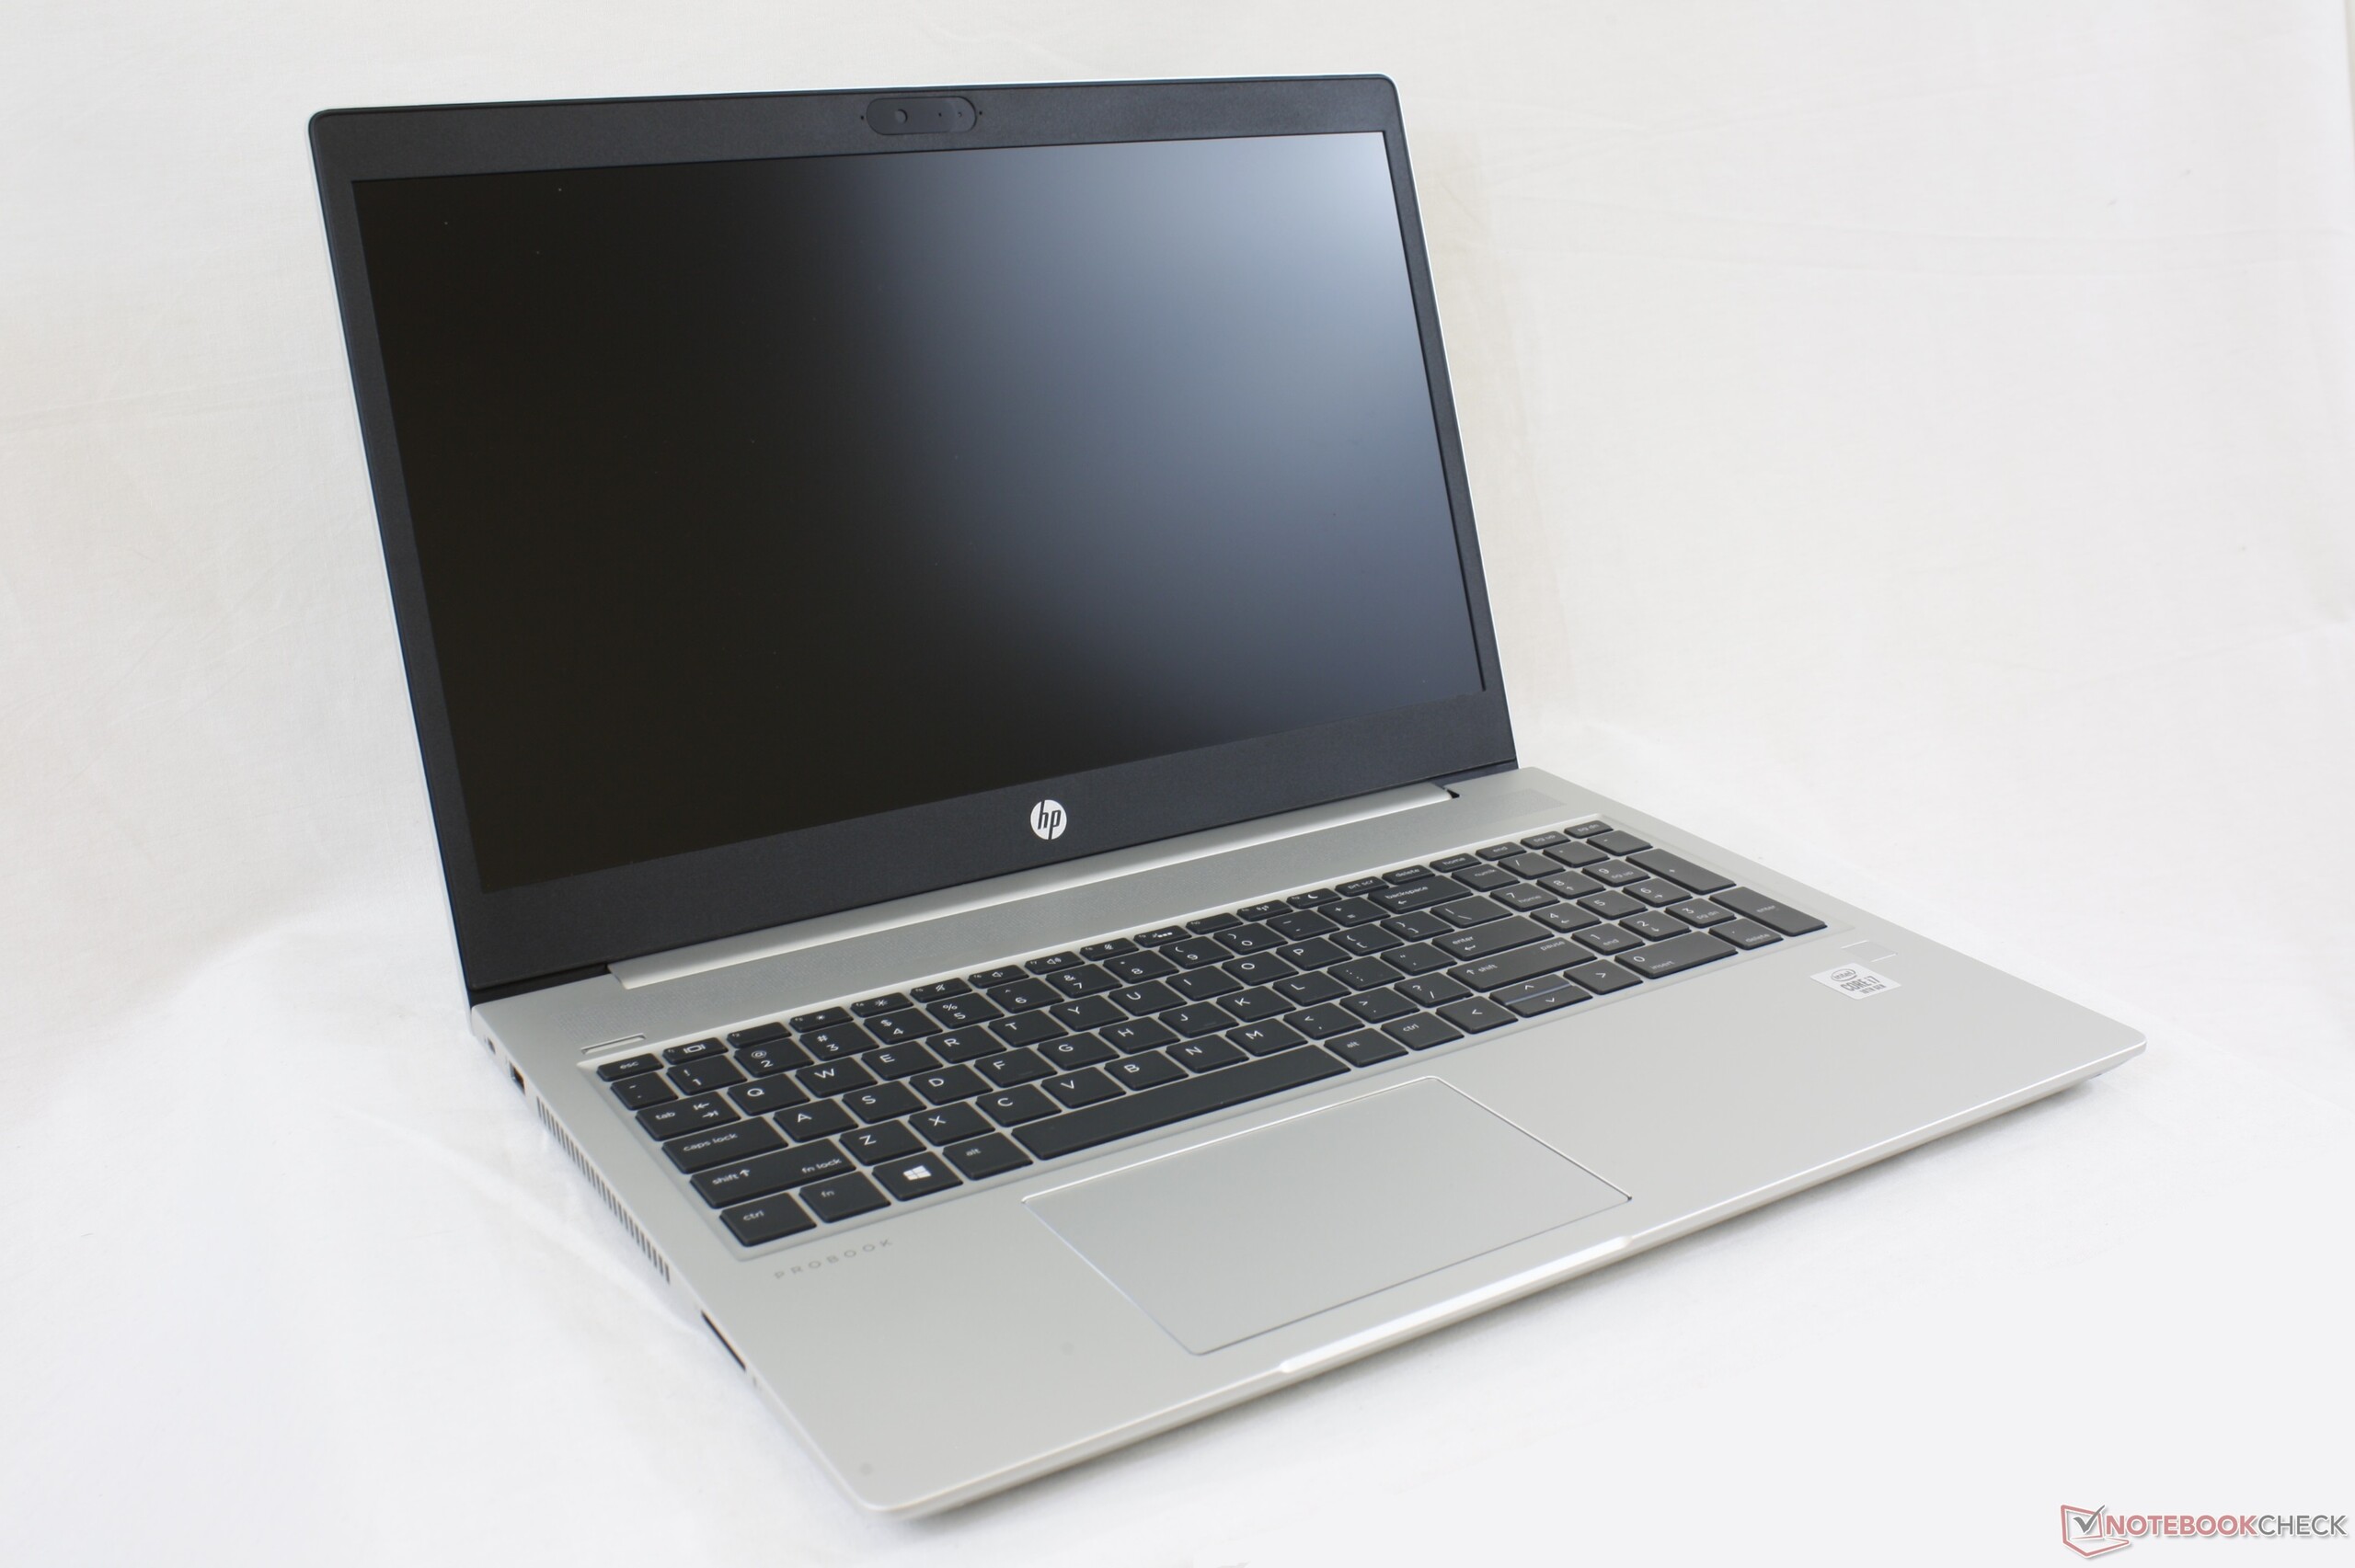
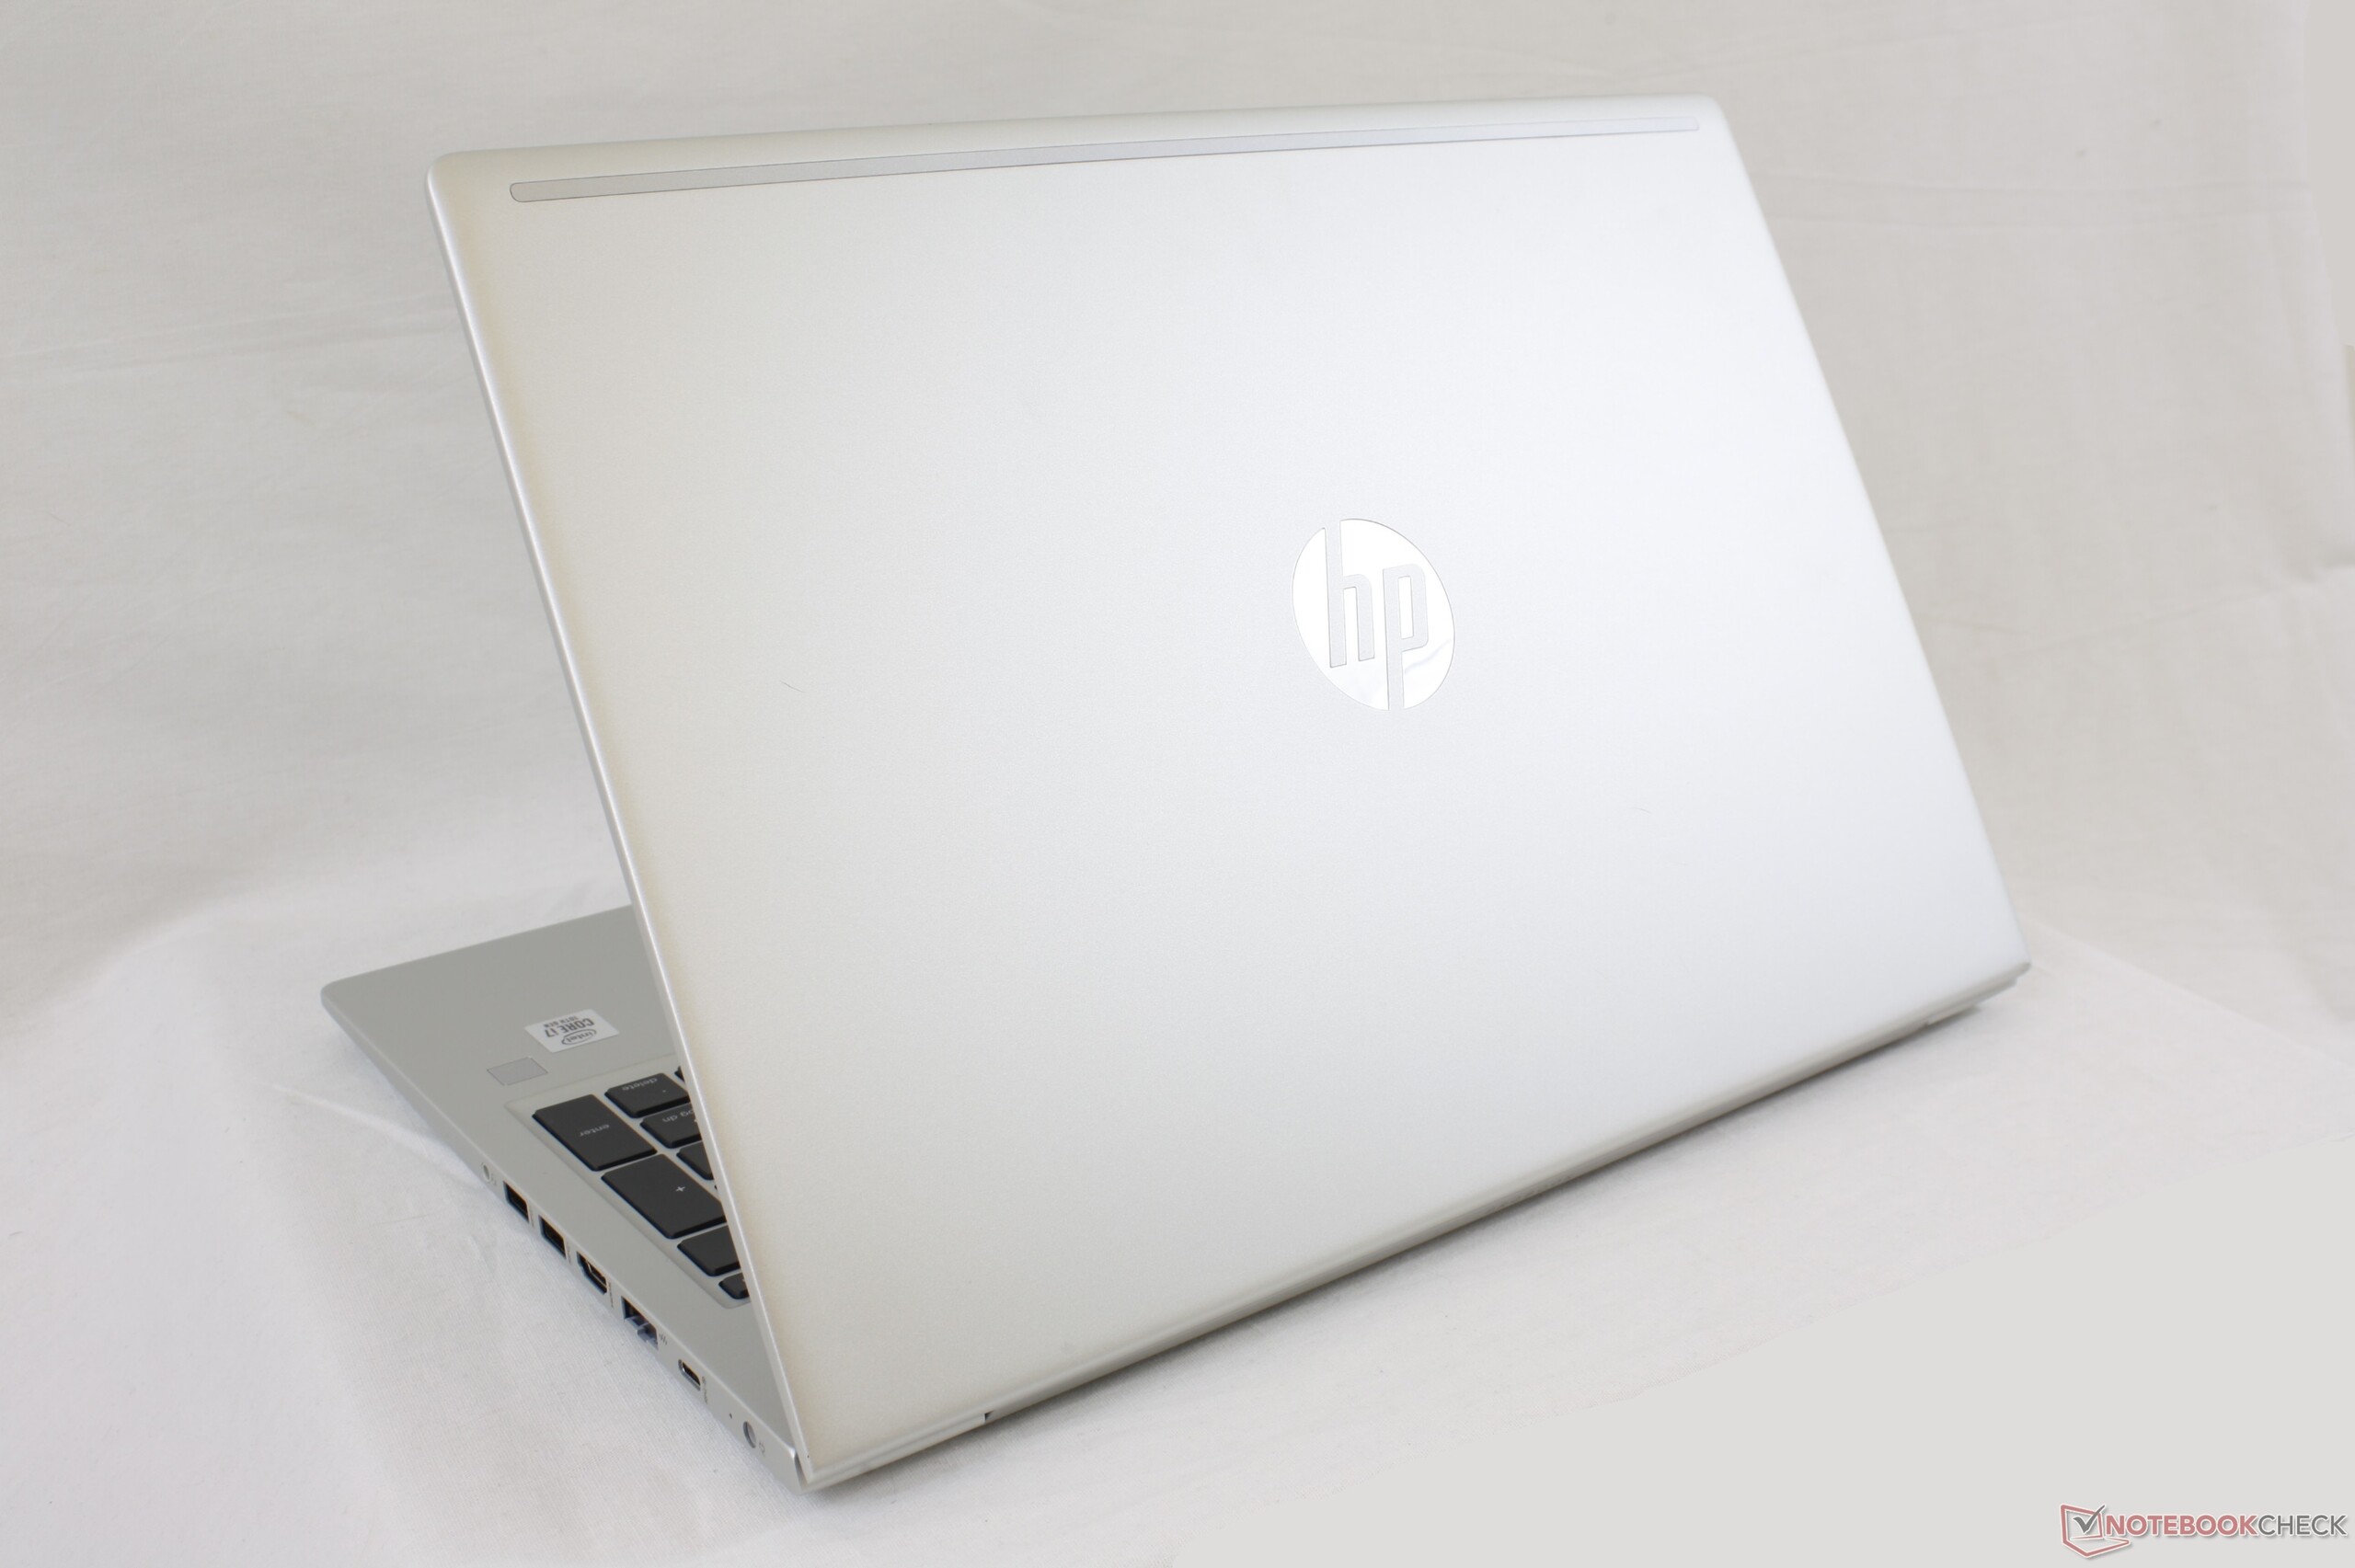
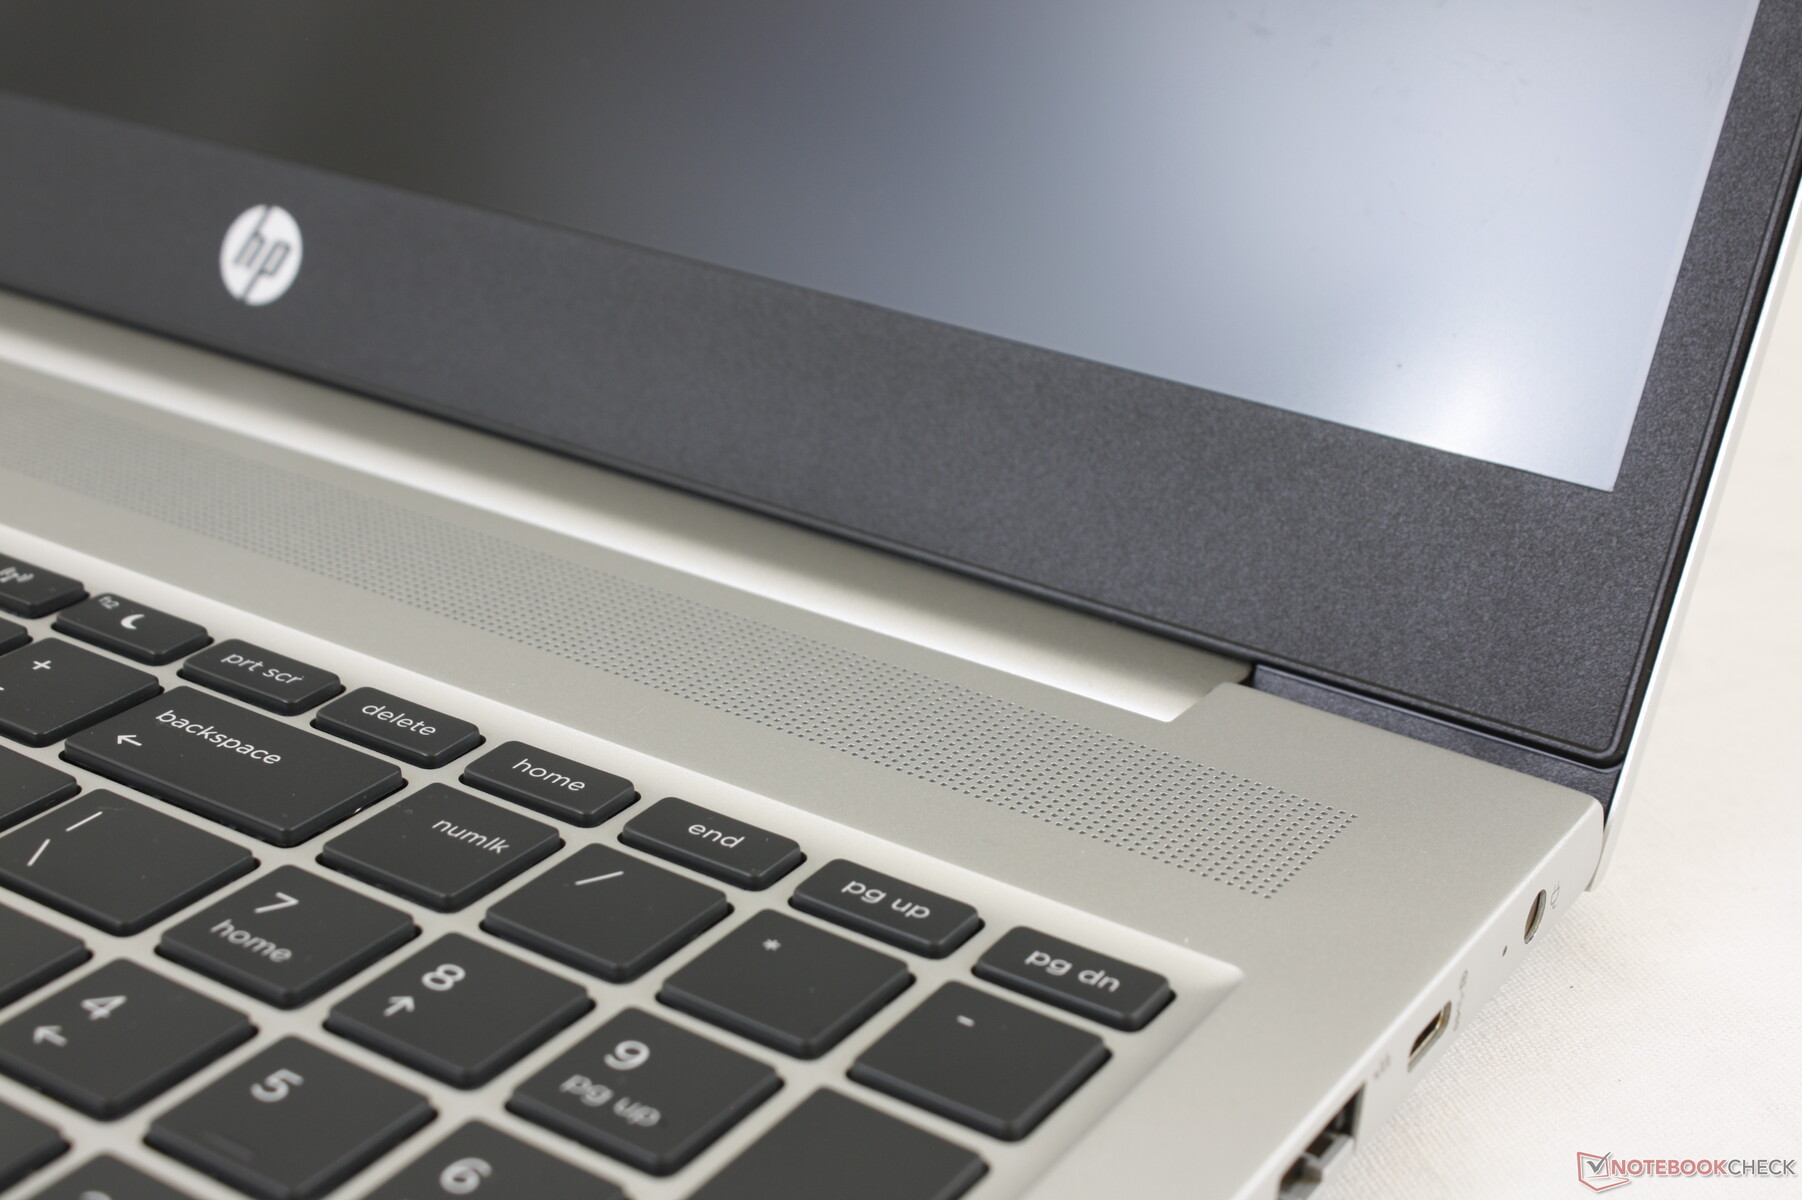
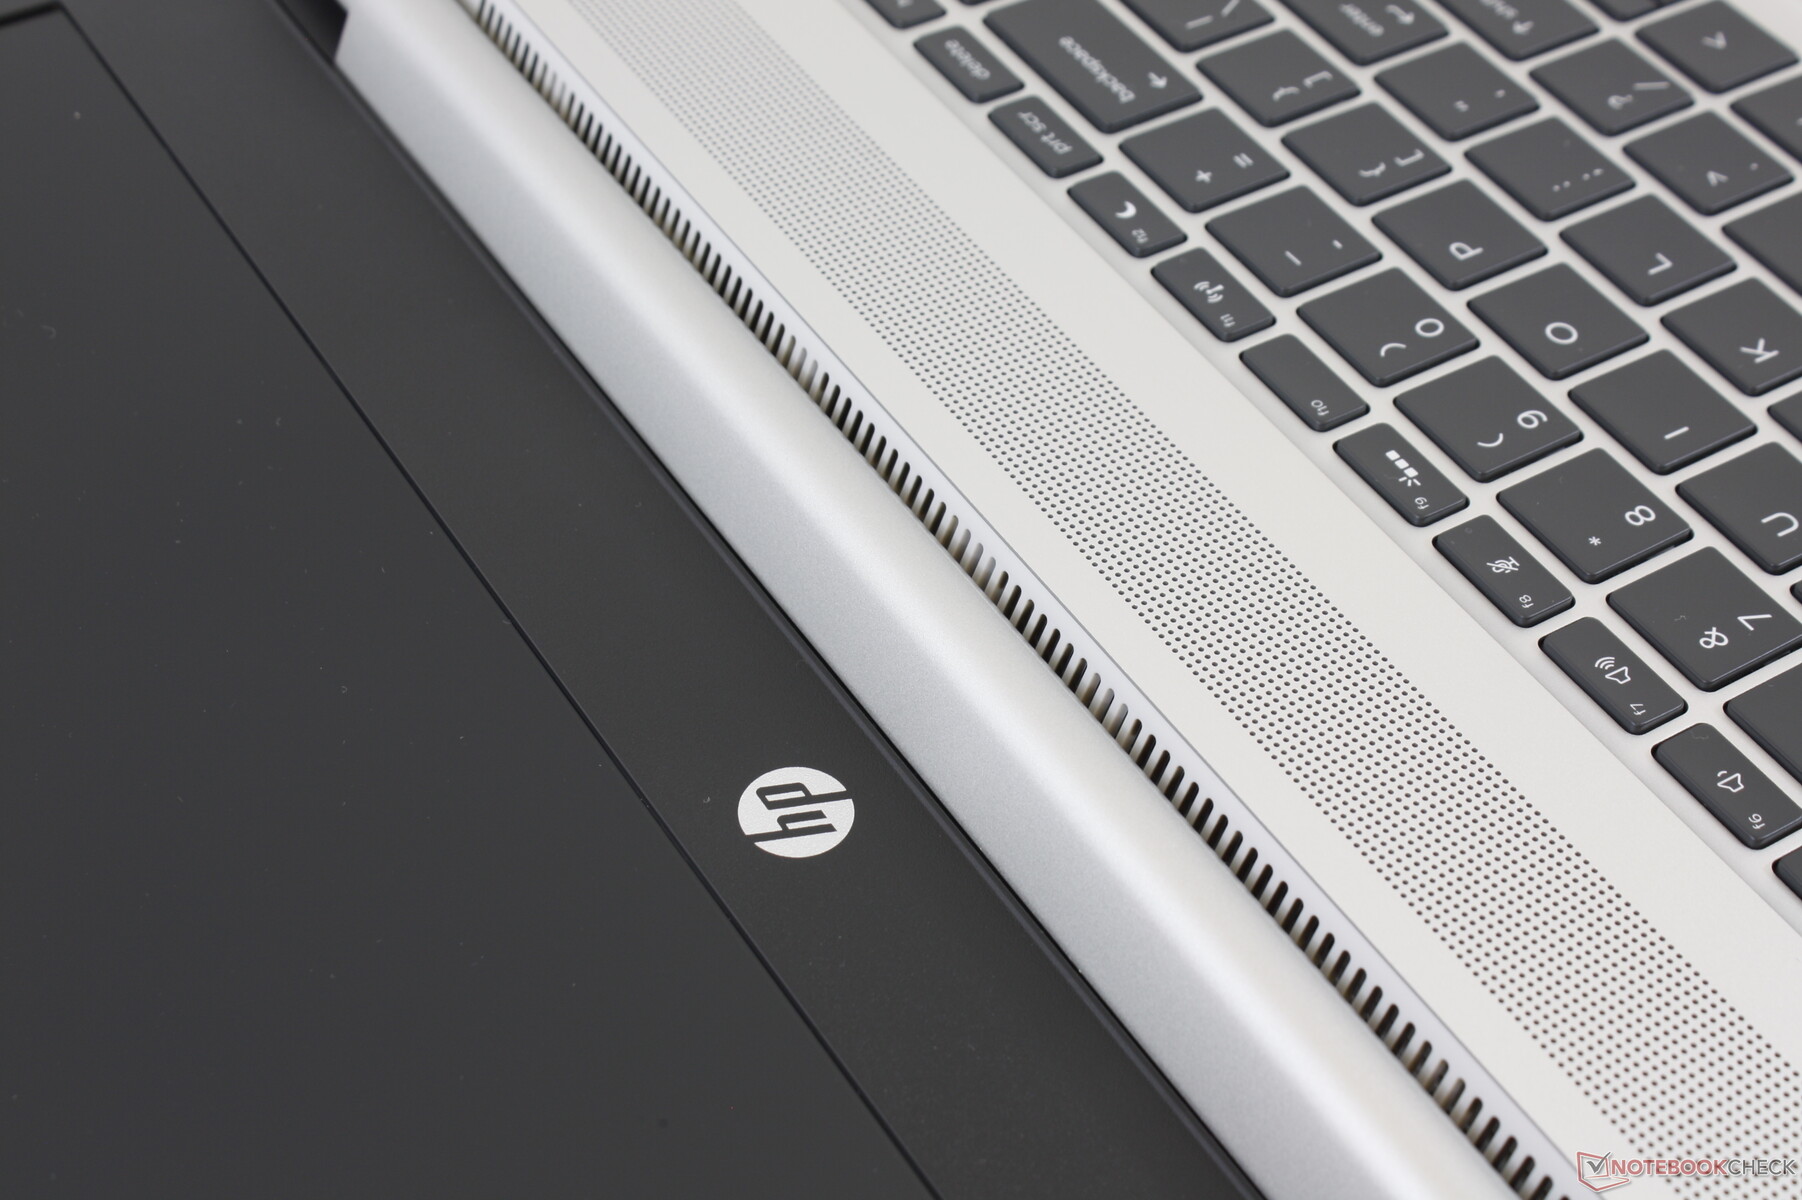
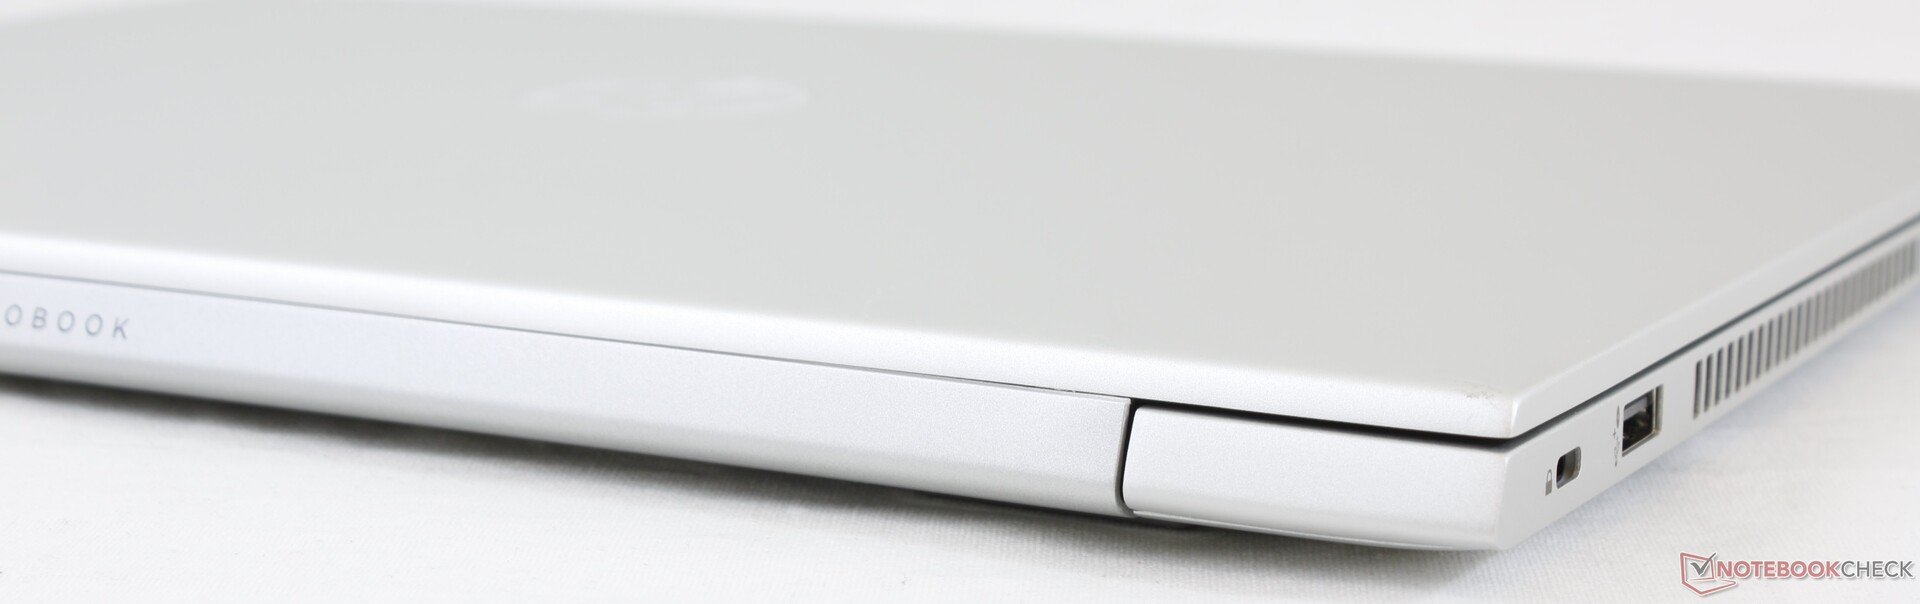
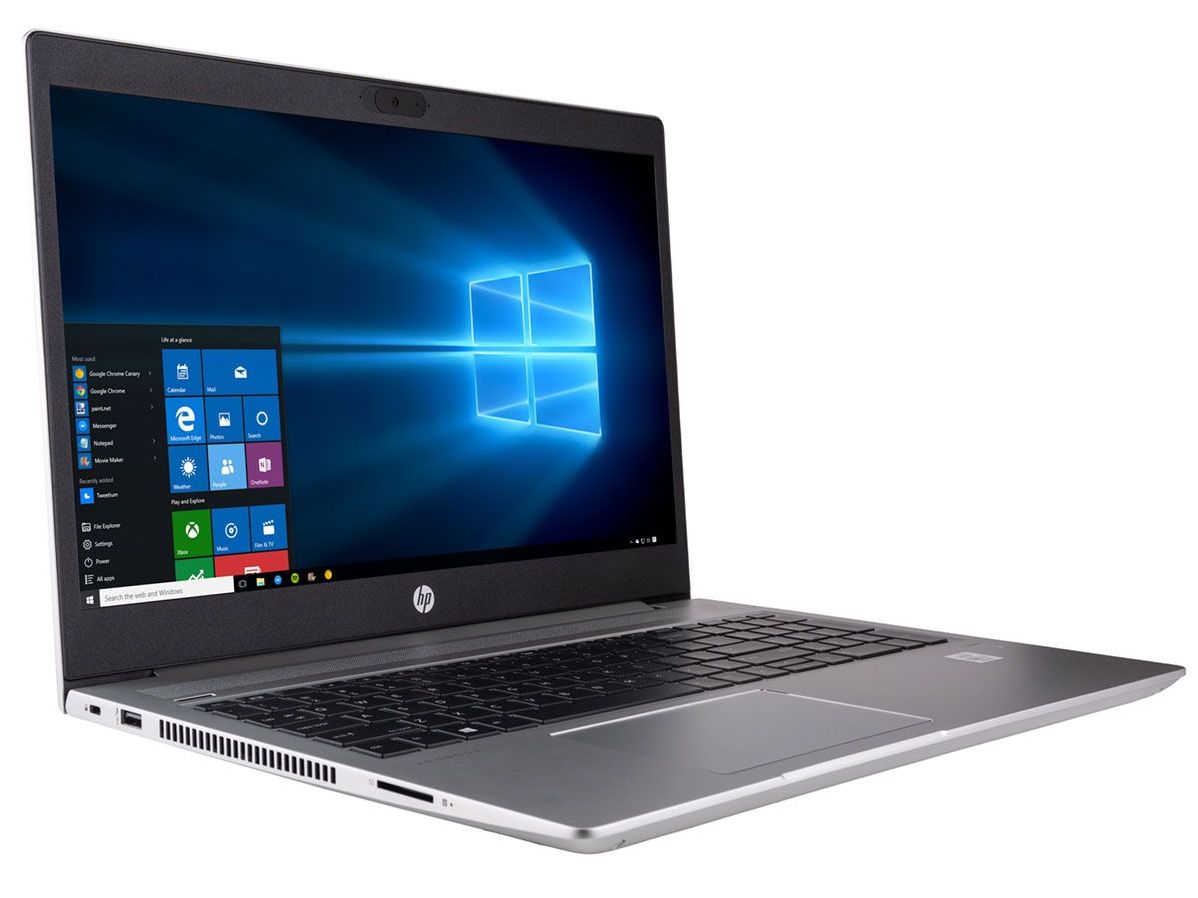
The chassis remains visually identical to the ProBook 455 G7 and even last year's ProBook 450 G6 to make it the second year running that HP is sticking to the same design. OEMs will typically use the same chassis for two or three years before finally introducing a brand new look meaning that users will have to wait until at least the ProBook 450 G8 or ProBook 450 G9 before seeing a full-on refresh.
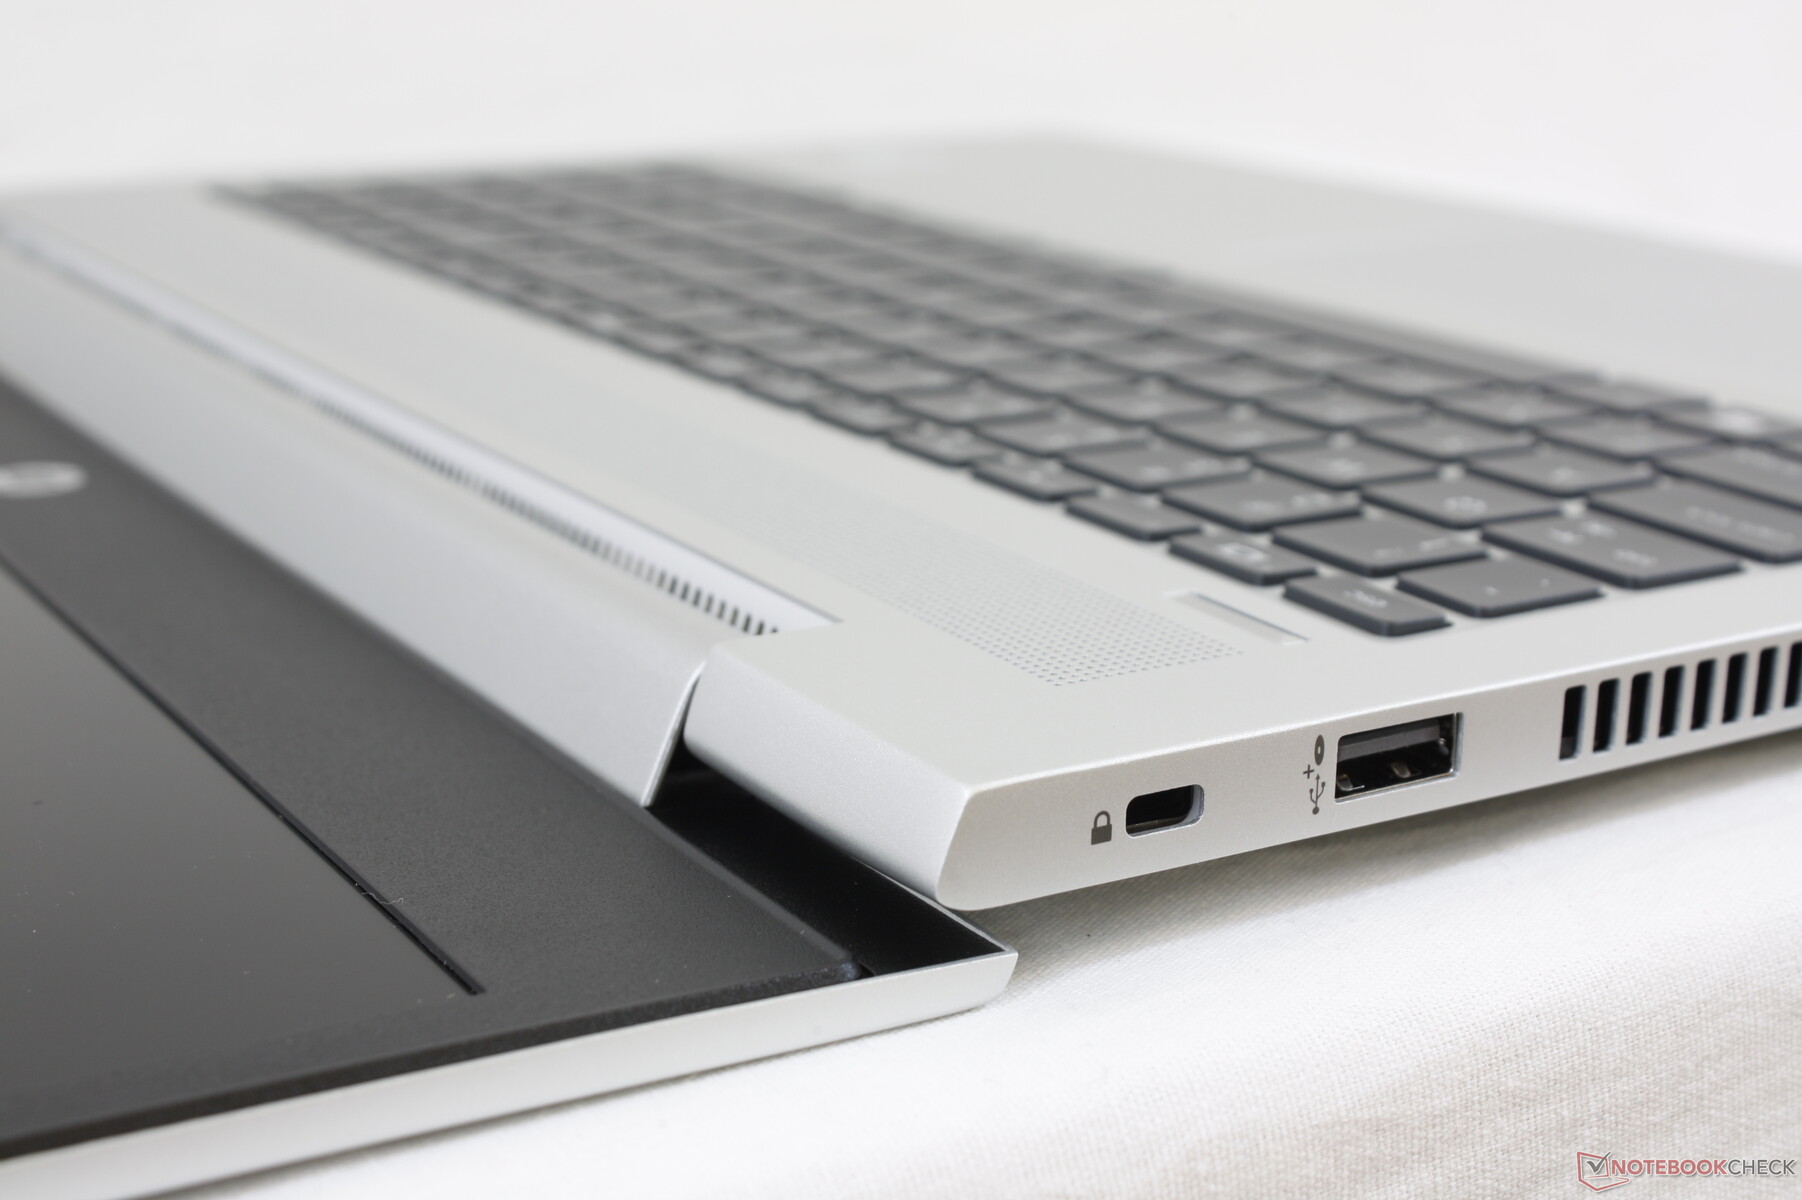
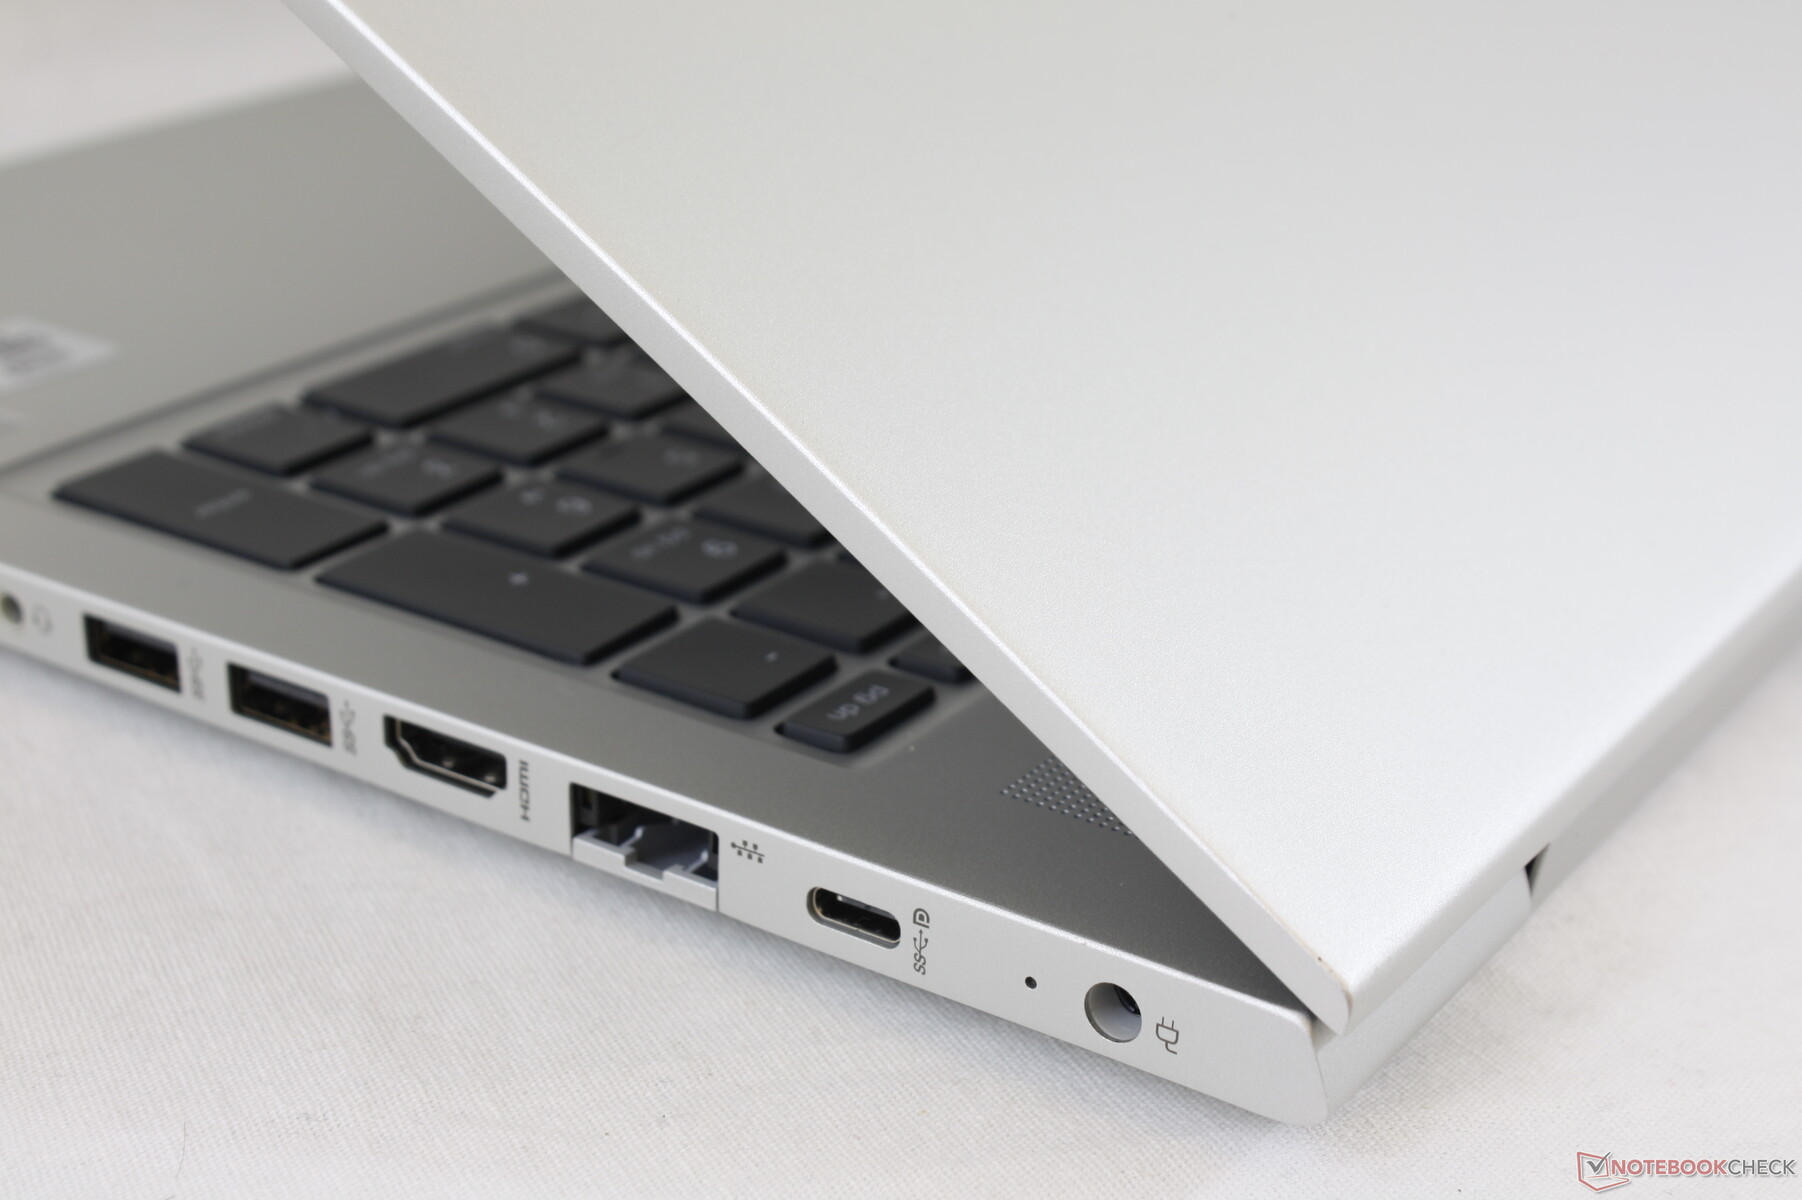
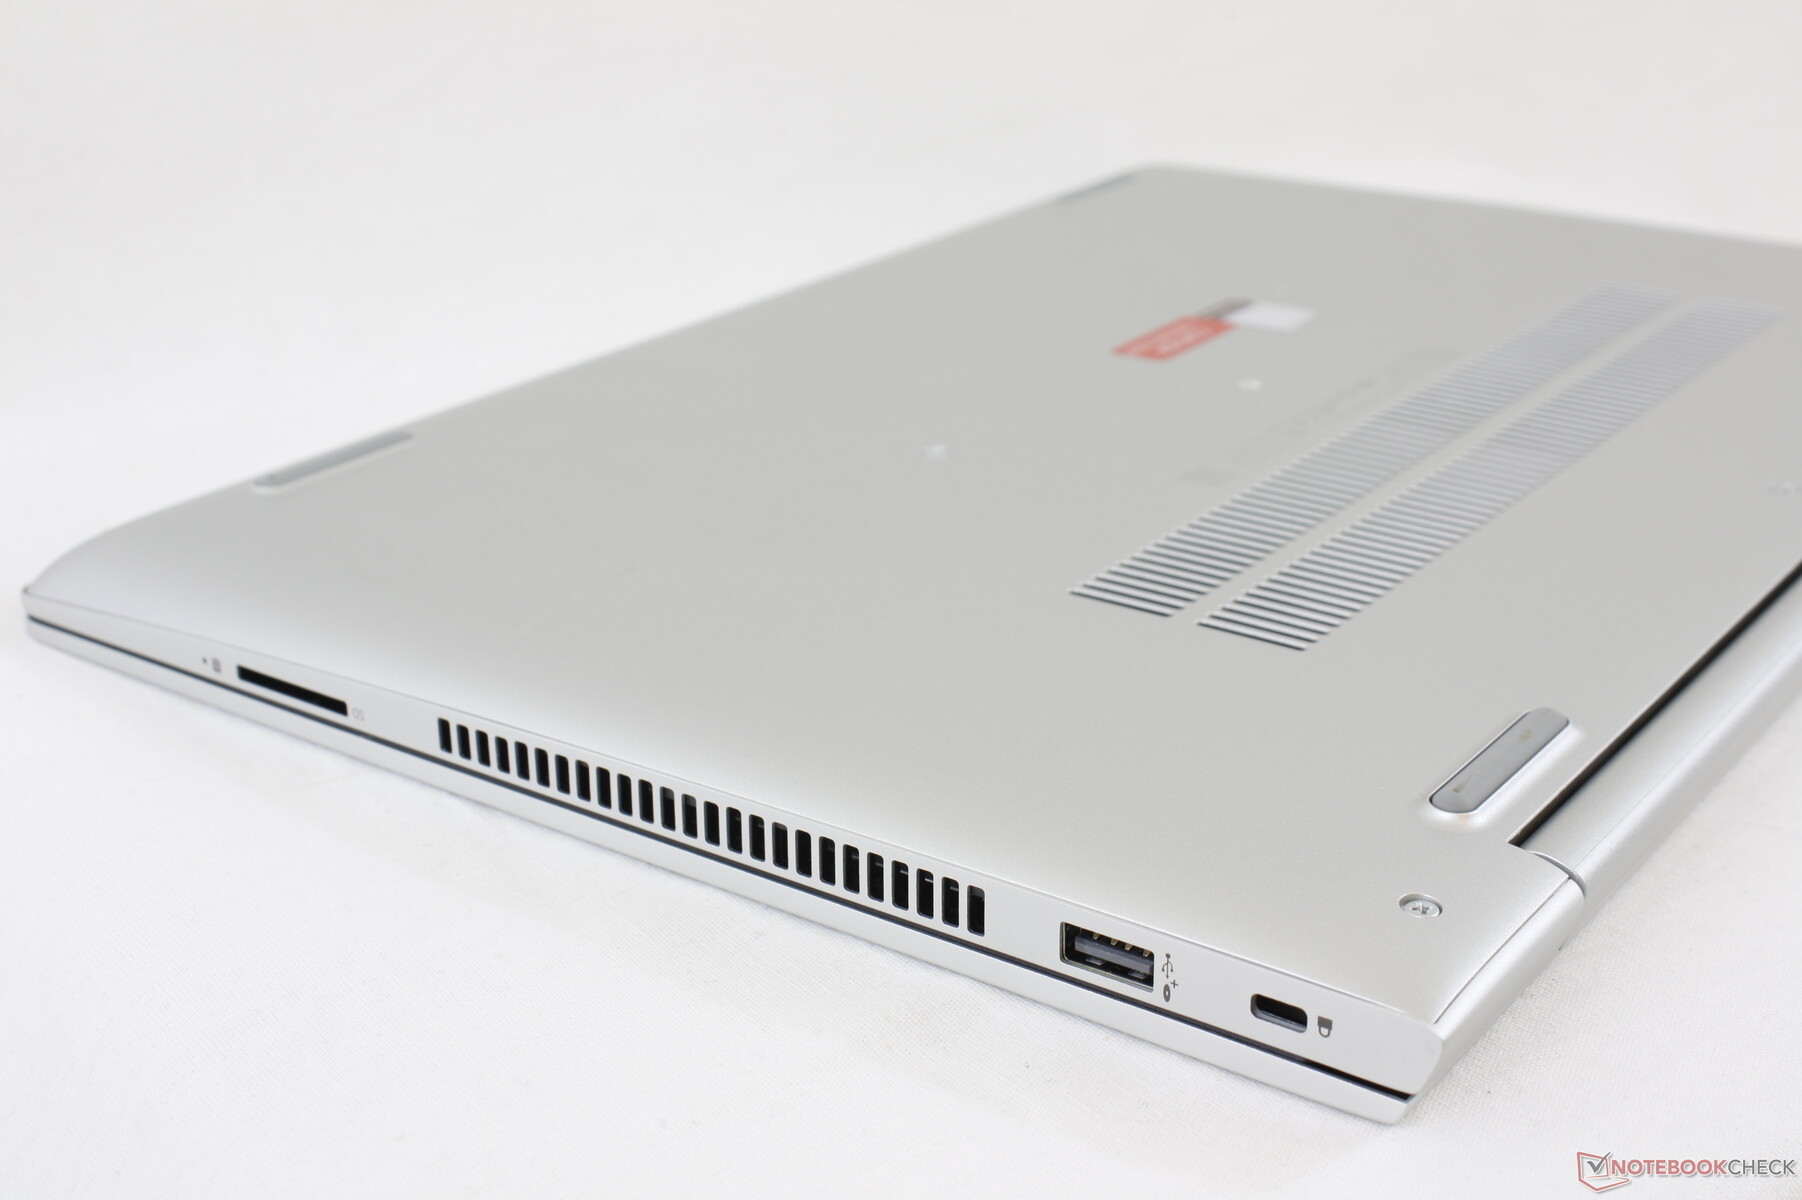
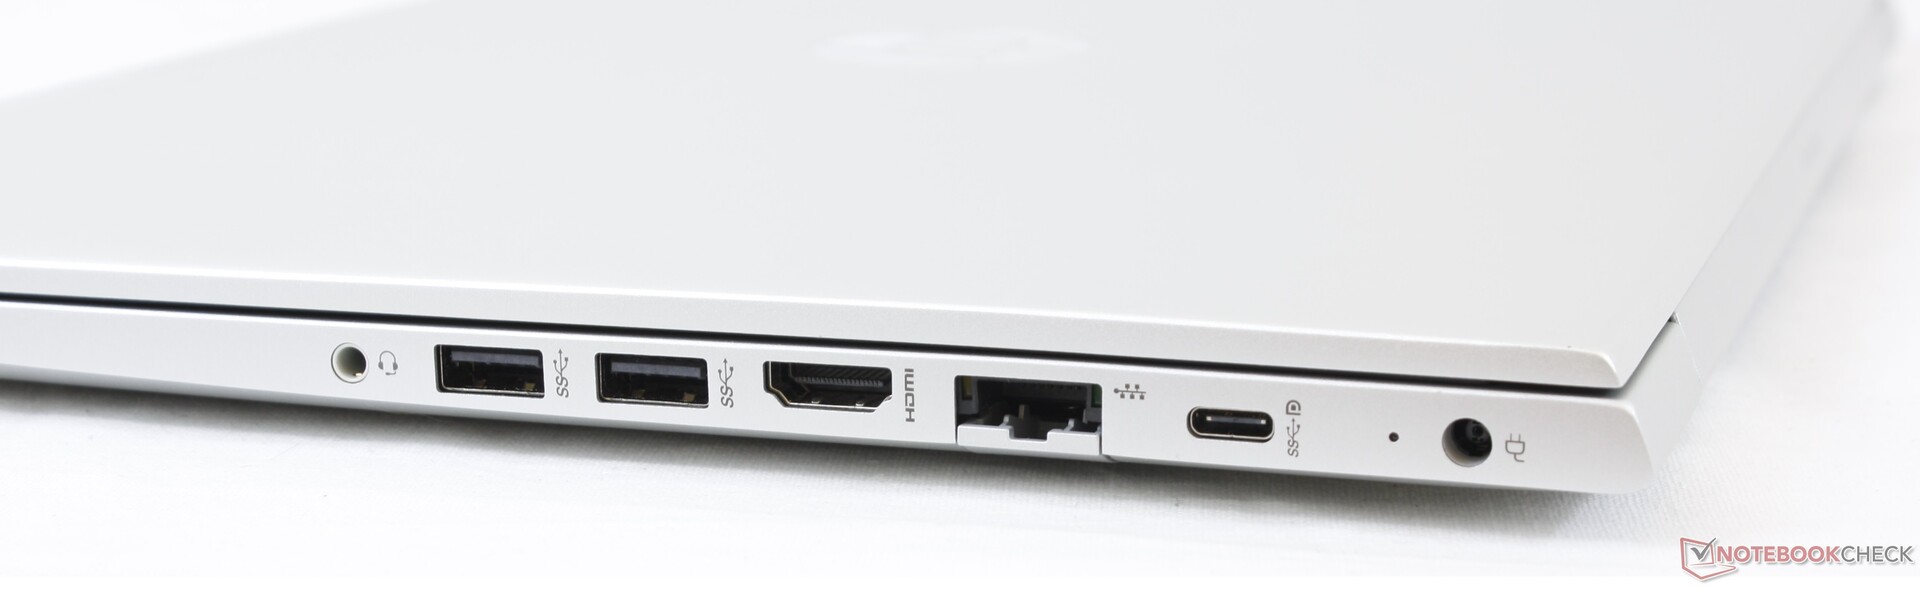
Connectivity
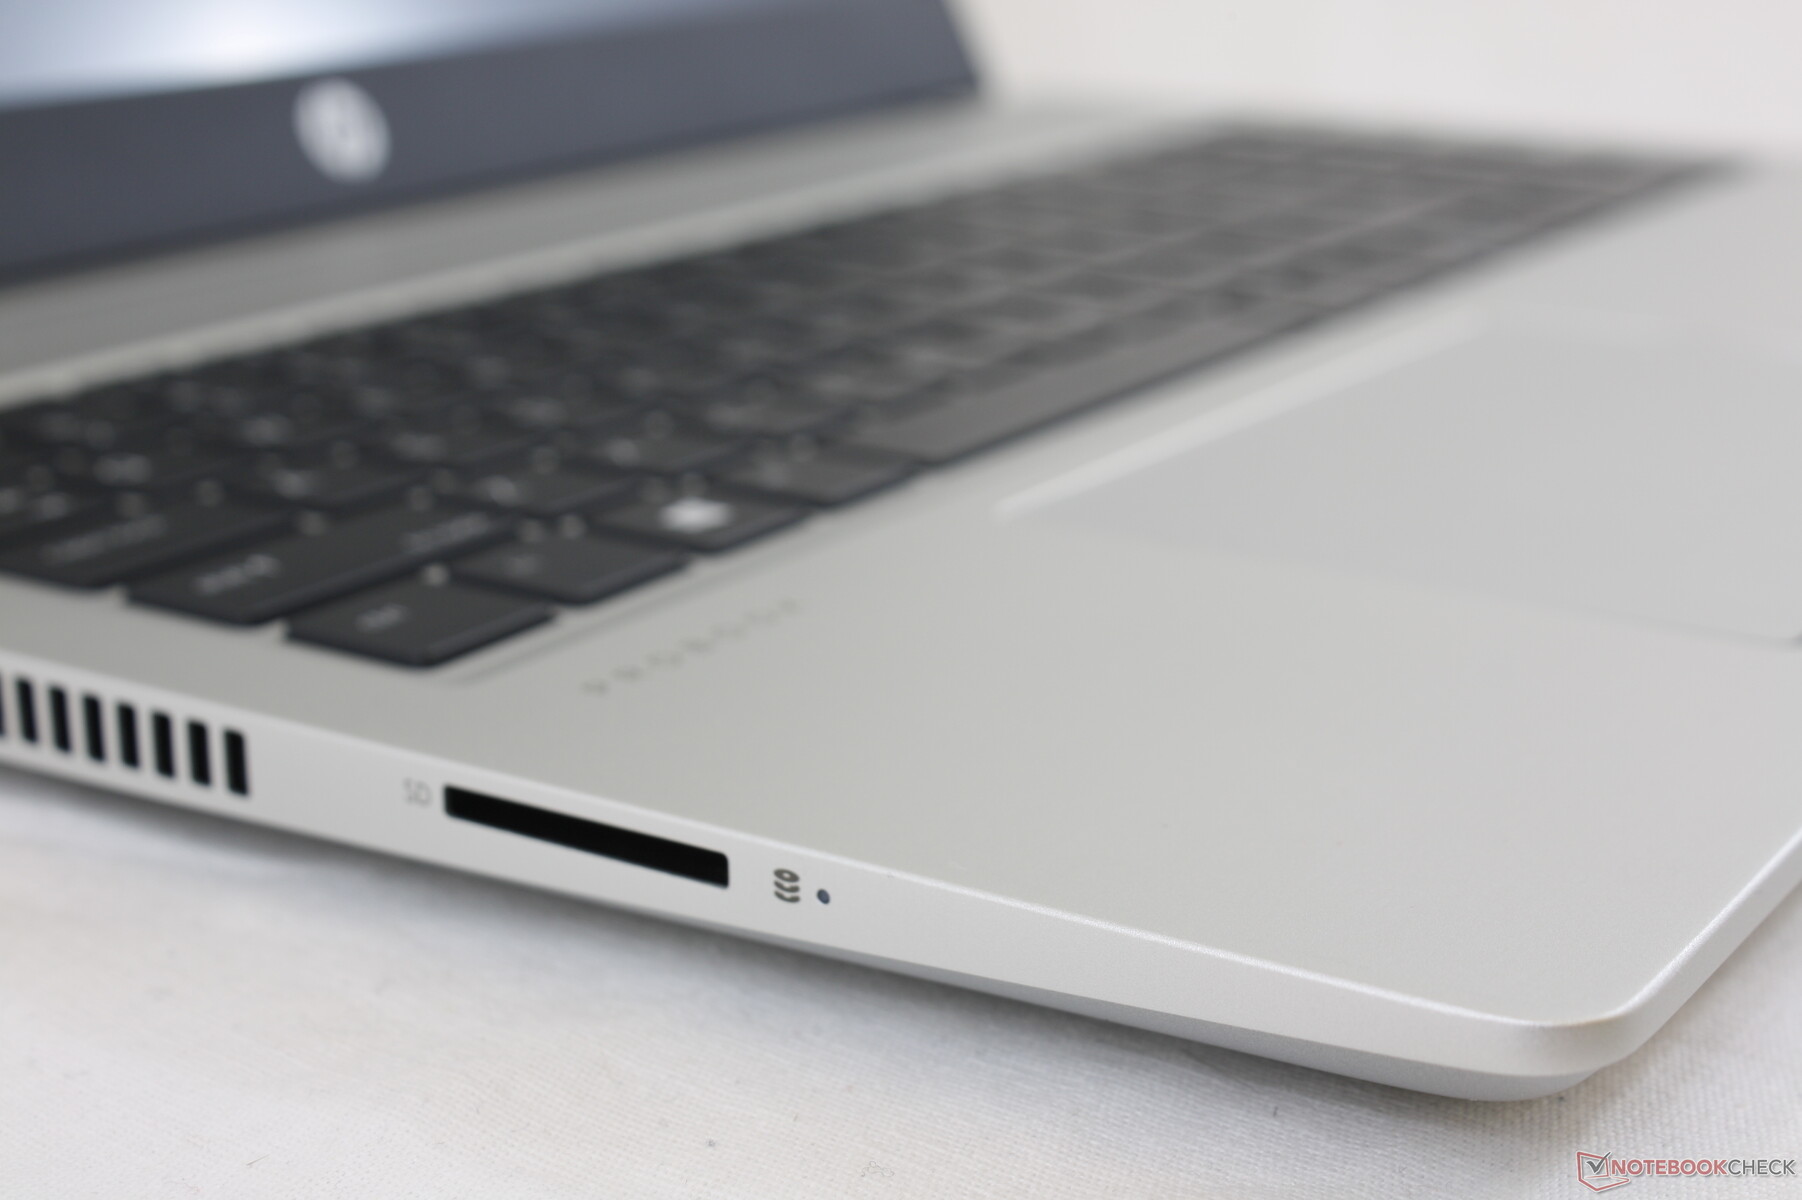
SD Card Reader
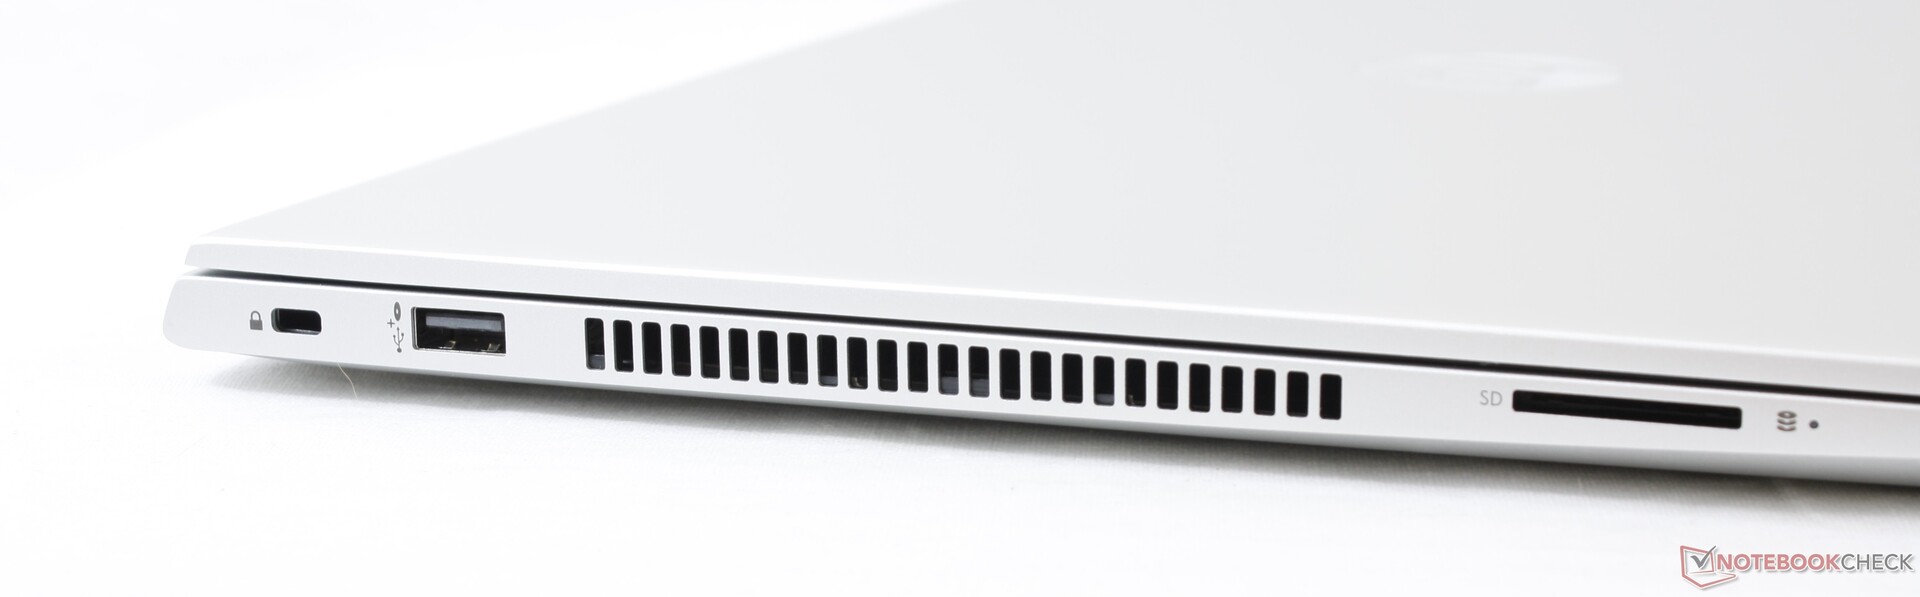
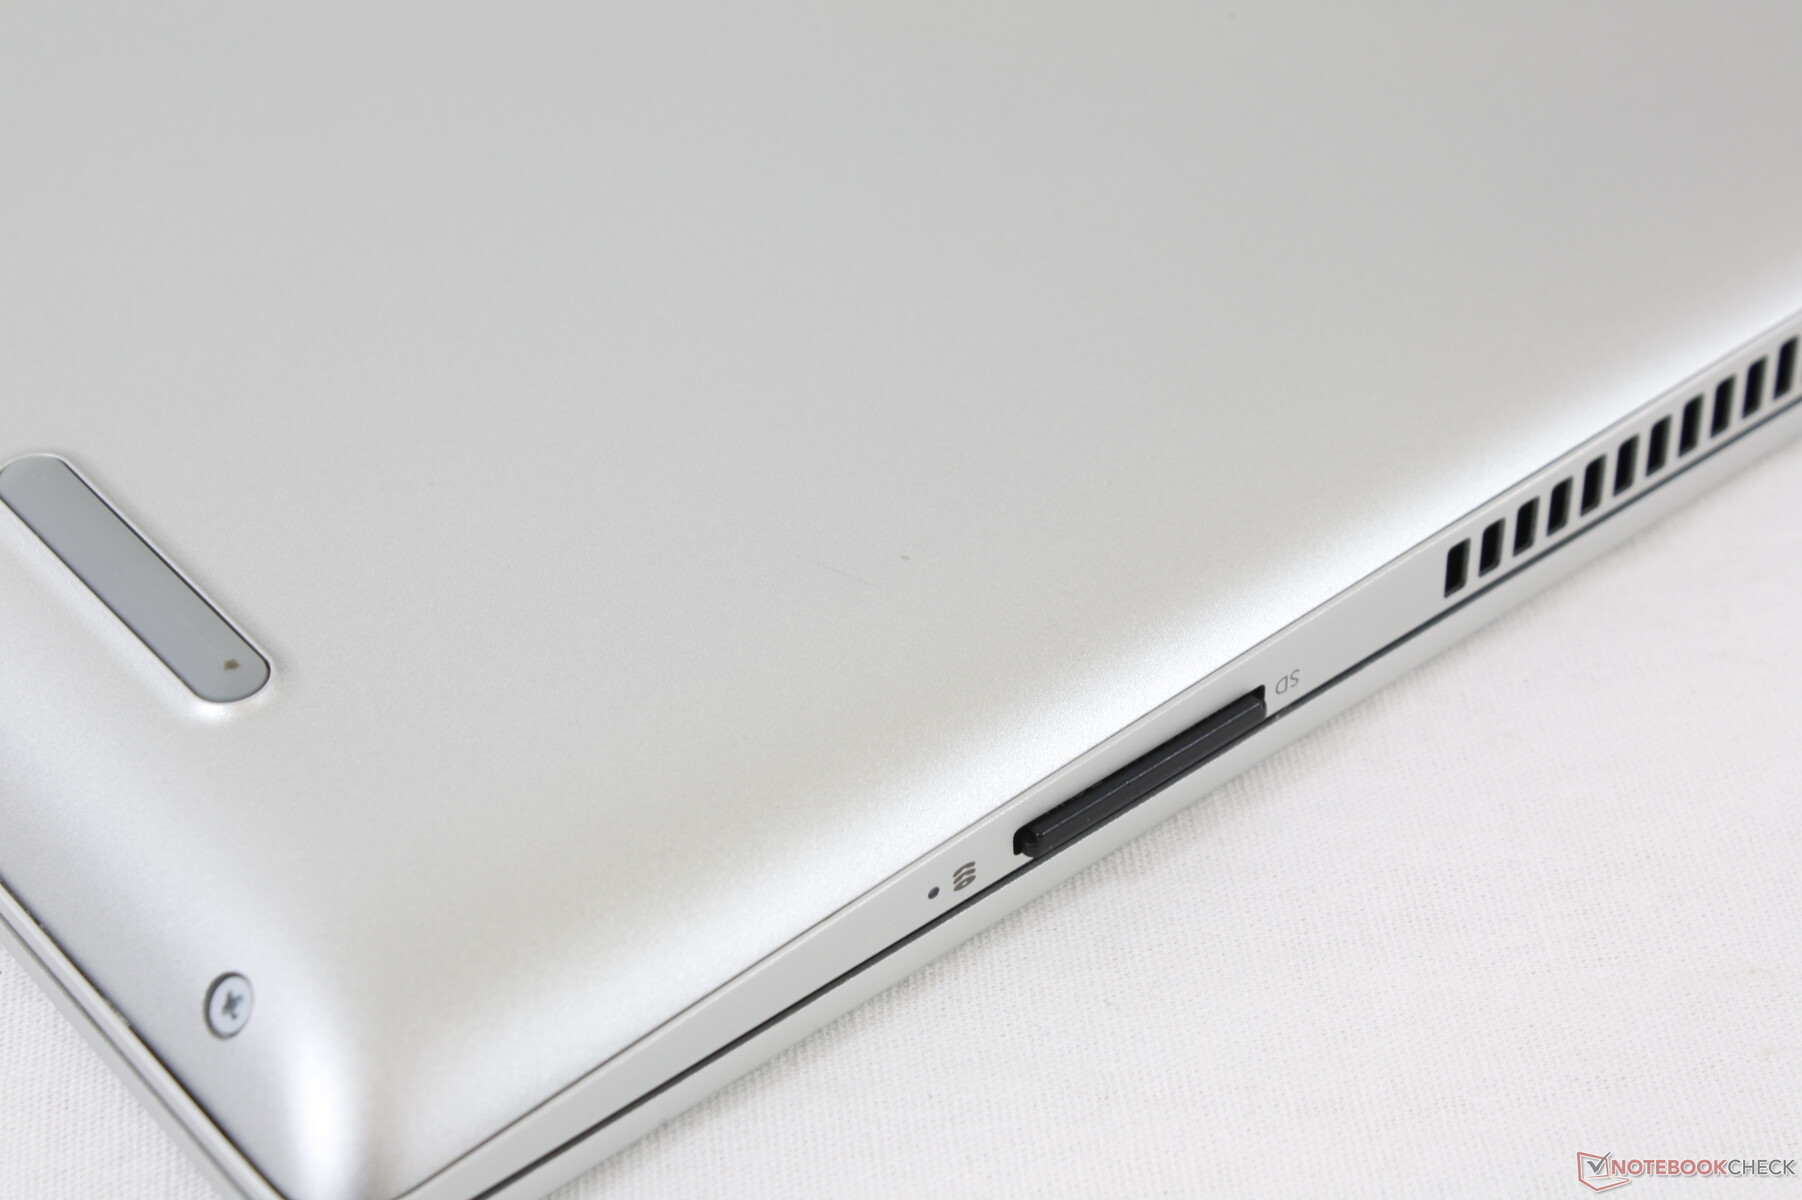
Transfer rates from the spring-loaded SD card reader are average at about 80 MB/s. Card readers on more expensive HP EliteBook laptops like the EliteBook 1050 G1 can offer two to three times the transfer rates.
| SD Card Reader | |
| average JPG Copy Test (av. of 3 runs) | |
| HP EliteBook 1050 G1-4QY20EA (Toshiba Exceria Pro SDXC 64 GB UHS-II) | |
| HP ProBook 455 G7-175W8EA (Toshiba Exceria Pro SDXC 64 GB UHS-II) | |
| HP ProBook 450 G7 8WC04UT (Toshiba Exceria Pro SDXC 64 GB UHS-II) | |
| Lenovo ThinkPad L590-20Q70019GE (Toshiba Exceria Pro M501 64 GB UHS-II) | |
| MSI Modern 15 A10RB (Toshiba Exceria Pro M501 UHS-II) | |
| Dell Latitude 15 3590 (Toshiba Exceria Pro SDXC 64 GB UHS-II) | |
| maximum AS SSD Seq Read Test (1GB) | |
| HP EliteBook 1050 G1-4QY20EA (Toshiba Exceria Pro SDXC 64 GB UHS-II) | |
| HP ProBook 455 G7-175W8EA (Toshiba Exceria Pro SDXC 64 GB UHS-II) | |
| Lenovo ThinkPad L590-20Q70019GE (Toshiba Exceria Pro M501 64 GB UHS-II) | |
| HP ProBook 450 G7 8WC04UT (Toshiba Exceria Pro SDXC 64 GB UHS-II) | |
| MSI Modern 15 A10RB (Toshiba Exceria Pro M501 UHS-II) | |
| Dell Latitude 15 3590 (Toshiba Exceria Pro SDXC 64 GB UHS-II) | |
Communication
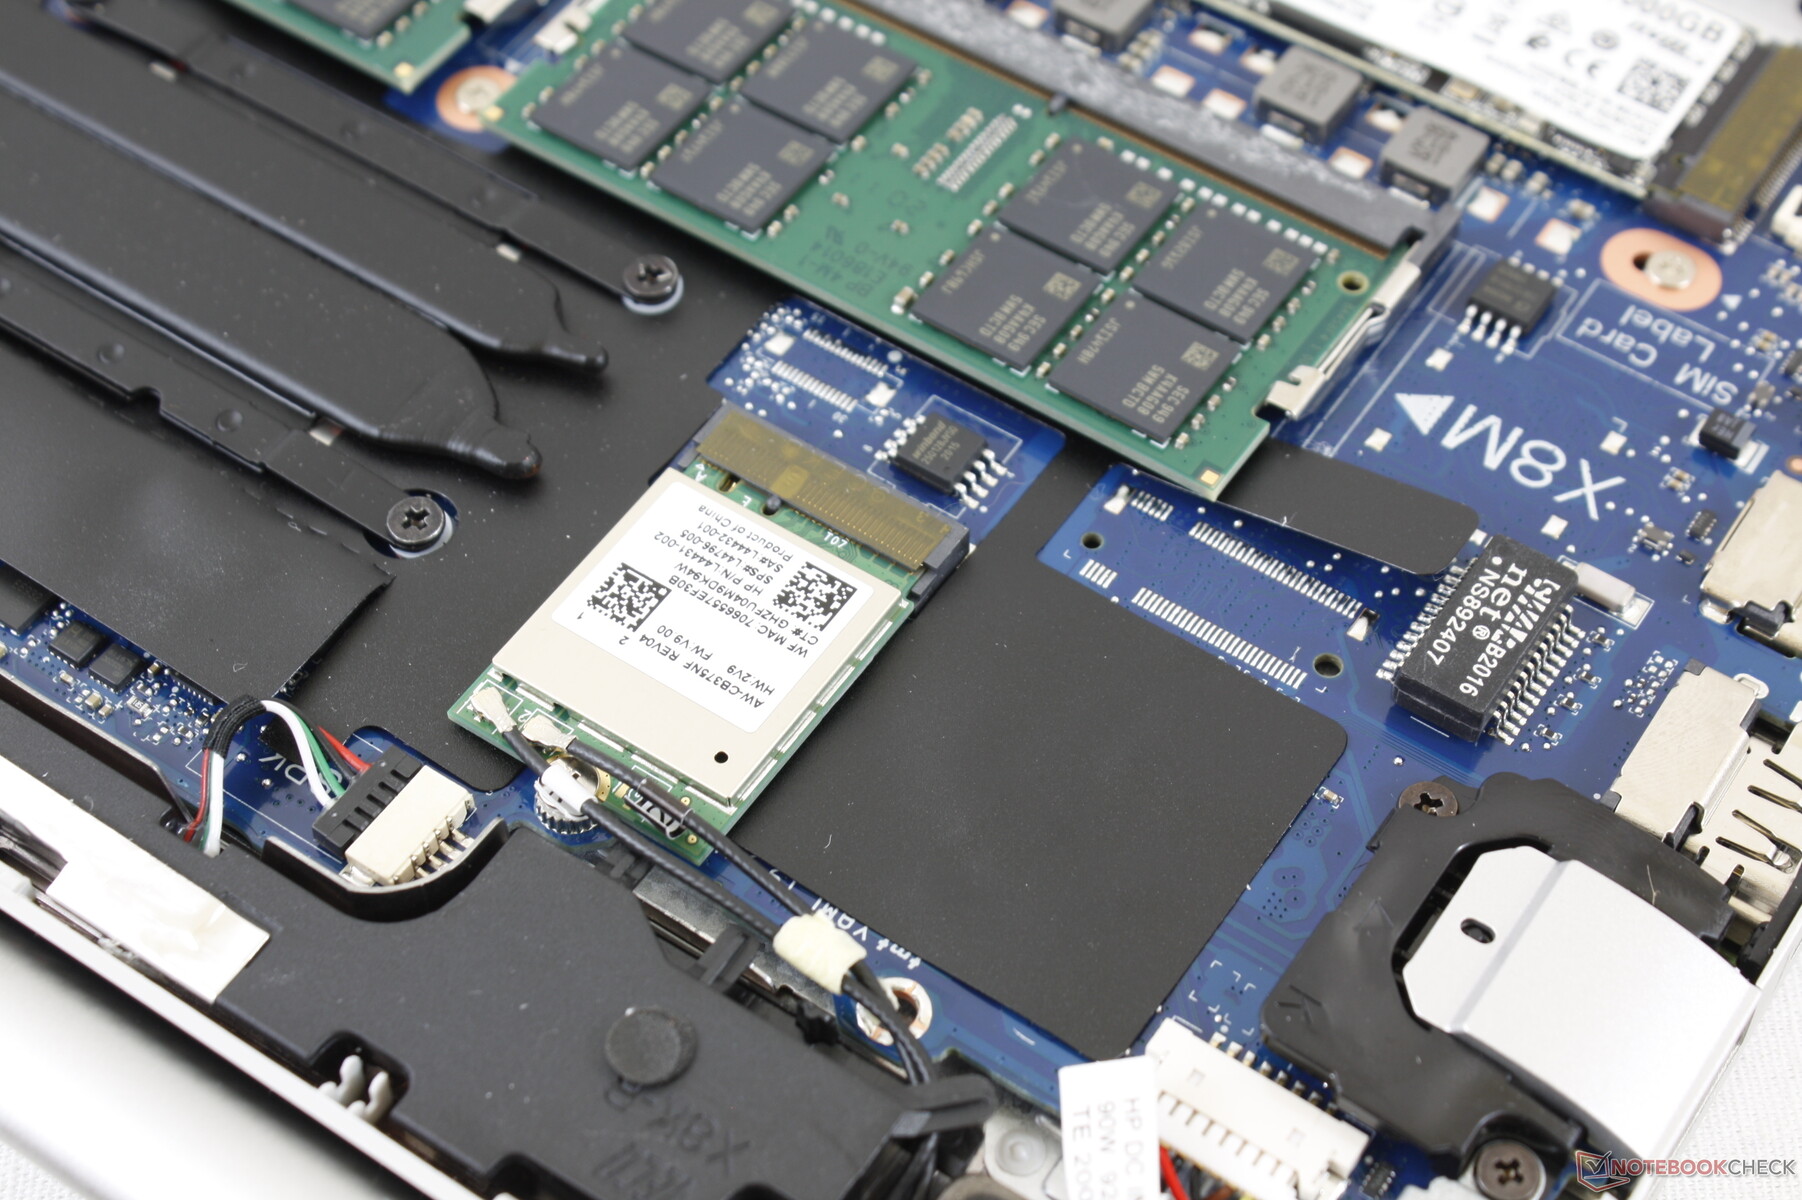
Our unit comes with the Realtek 8822CE for Wi-Fi 5 connectivity and we experienced no issues when connected to our Netgear RAX200 test router. Intel AX200/201 options are available.
Webcam
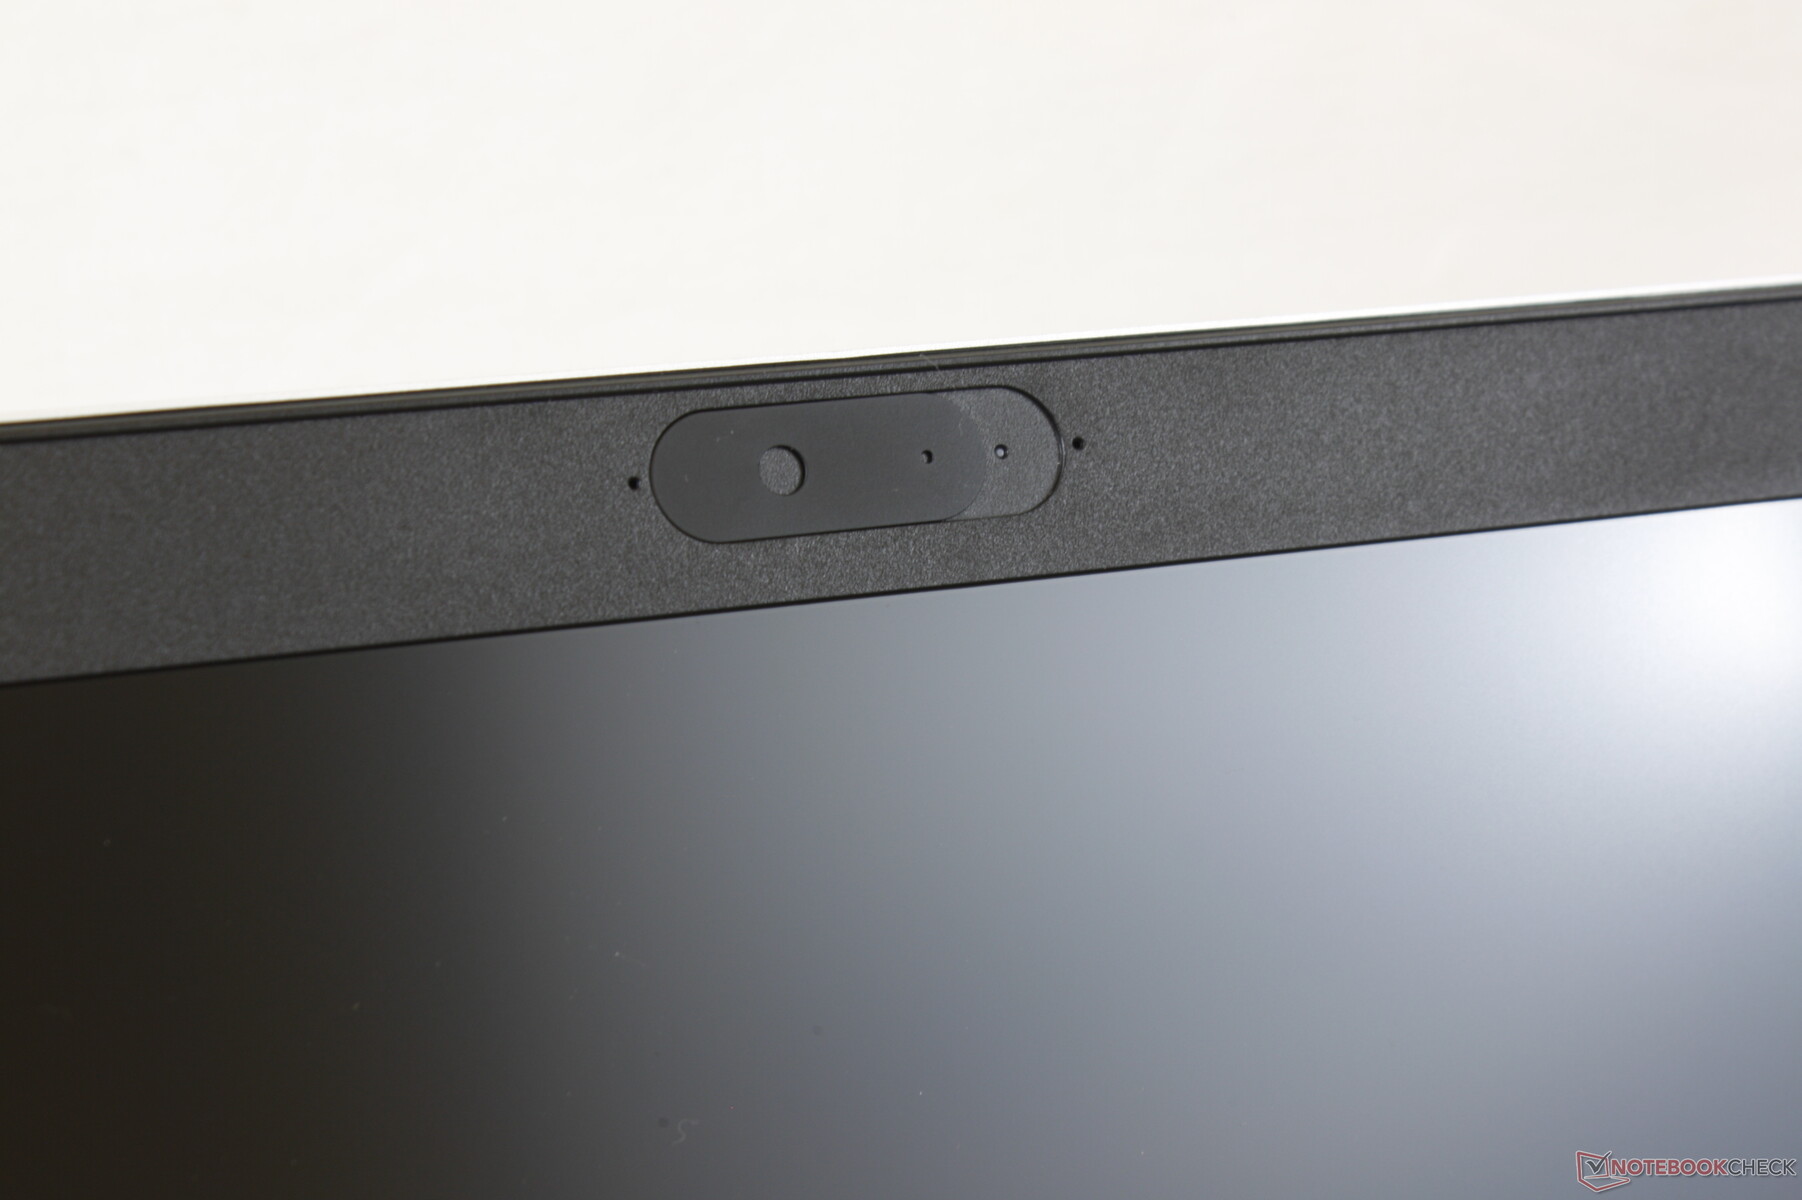
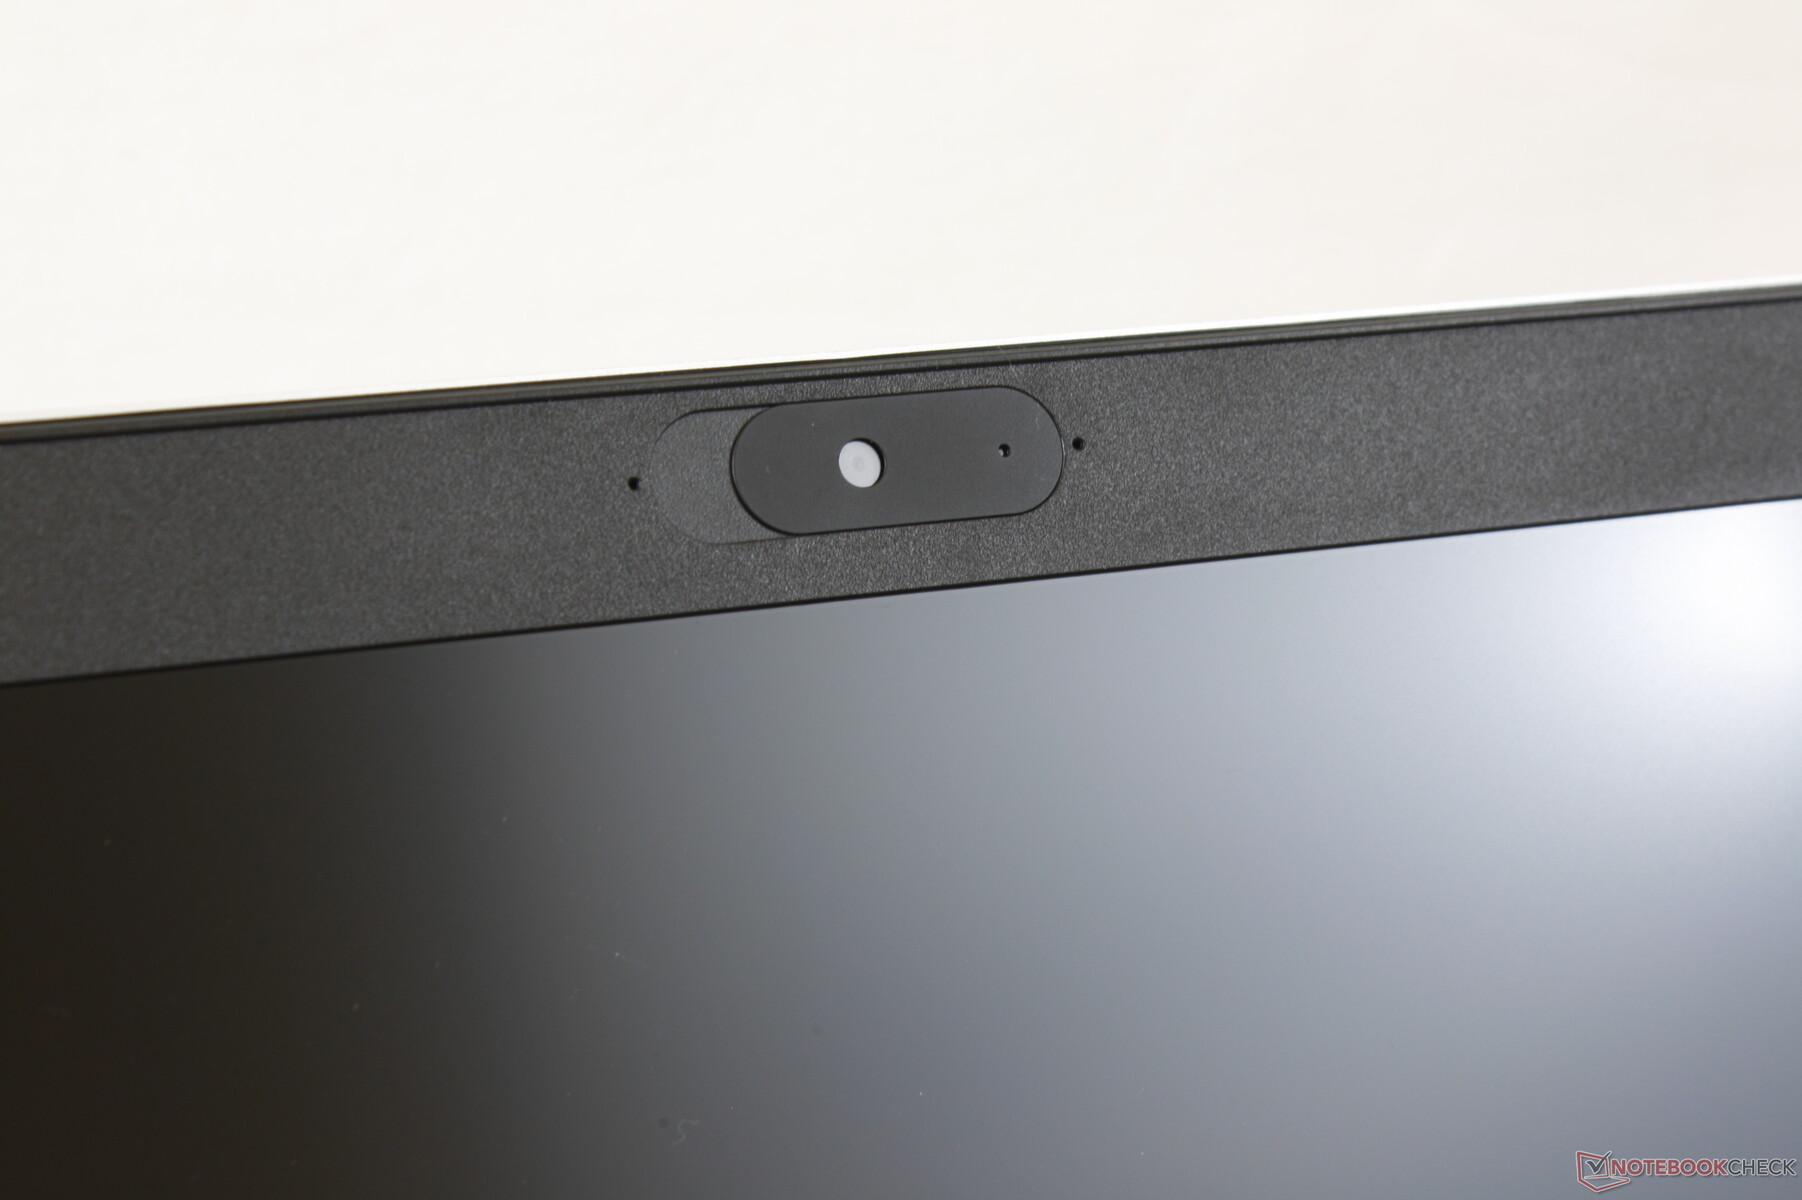


Security
Fingerprint reader, vPro, Sure View, and IR camera are all optional while the webcam privacy shutter comes standard. More advanced software features from HP like Sure Click, Sure Start, BIOSphere, Client Security, and Sure Sense are included as well much like on the pricier EliteBook series.
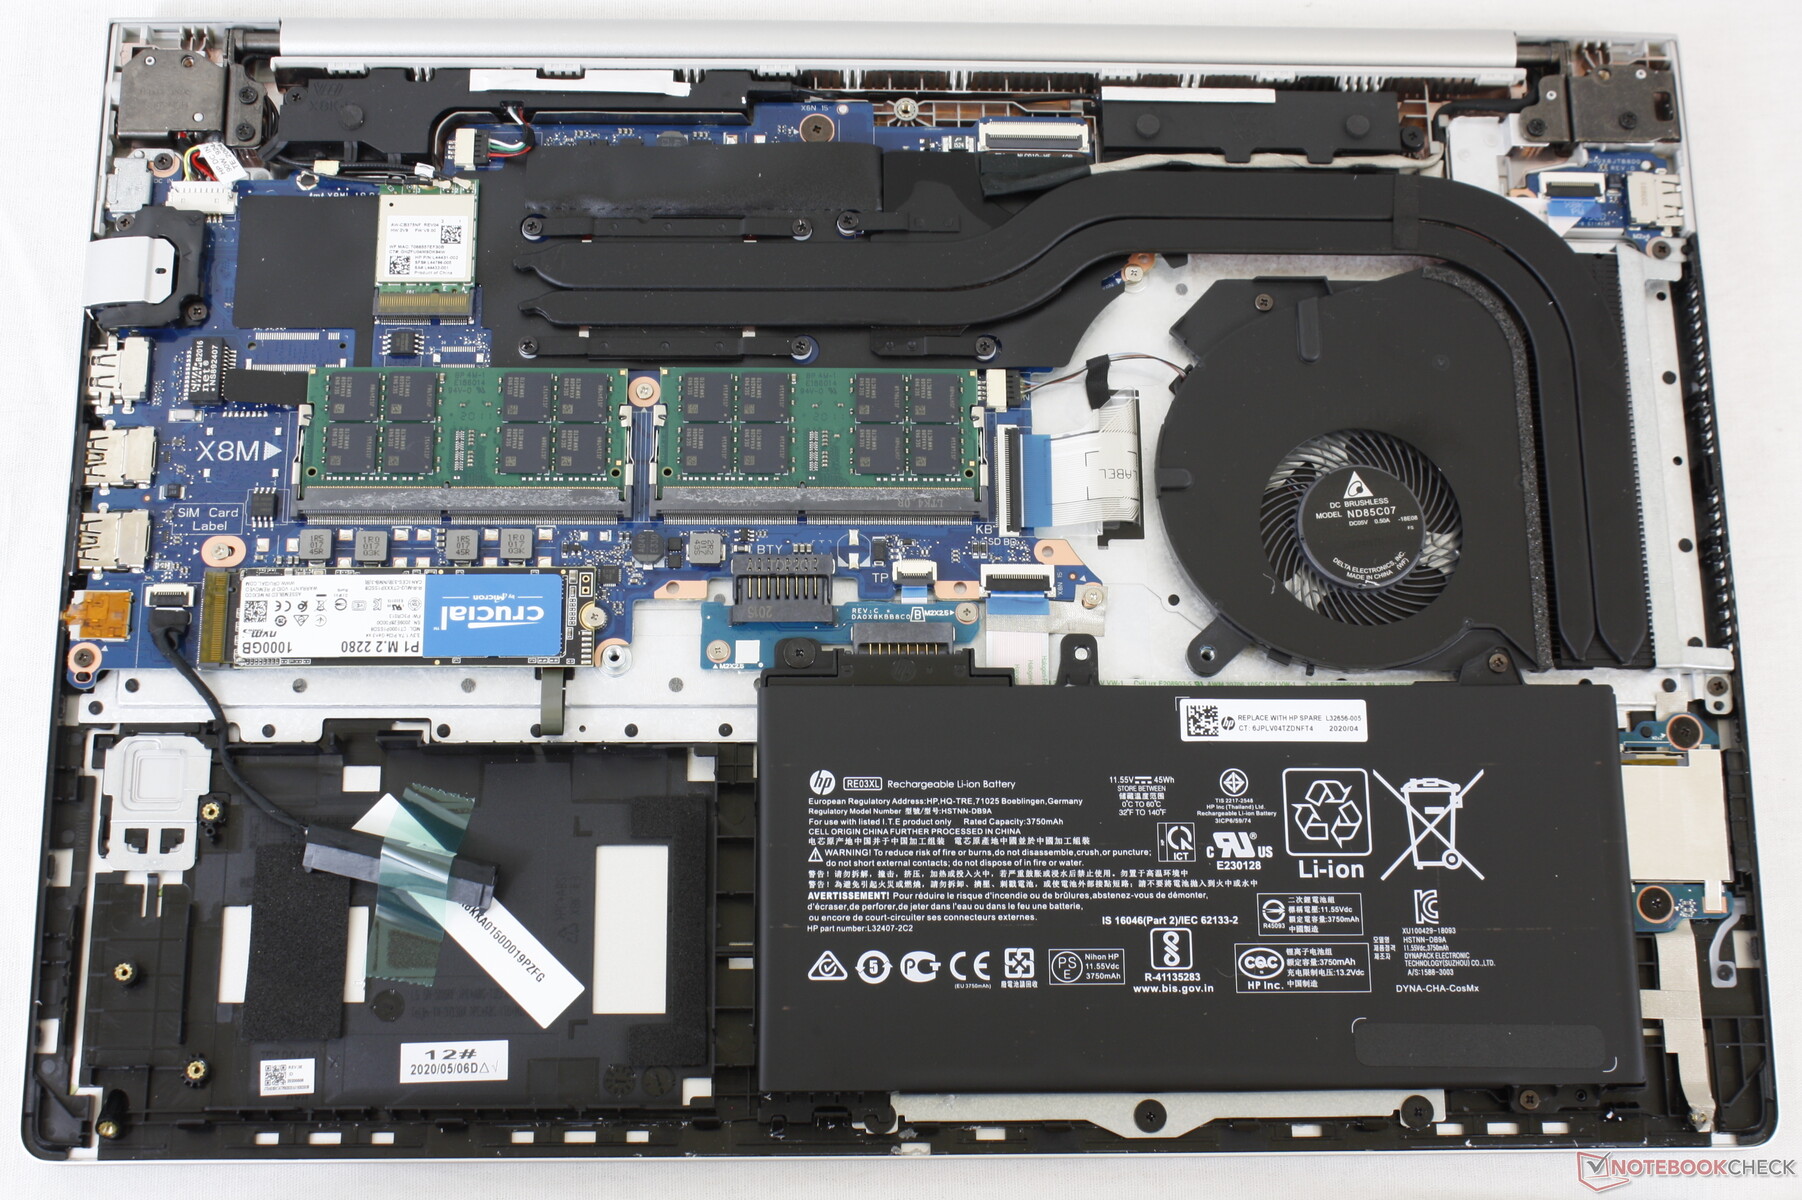
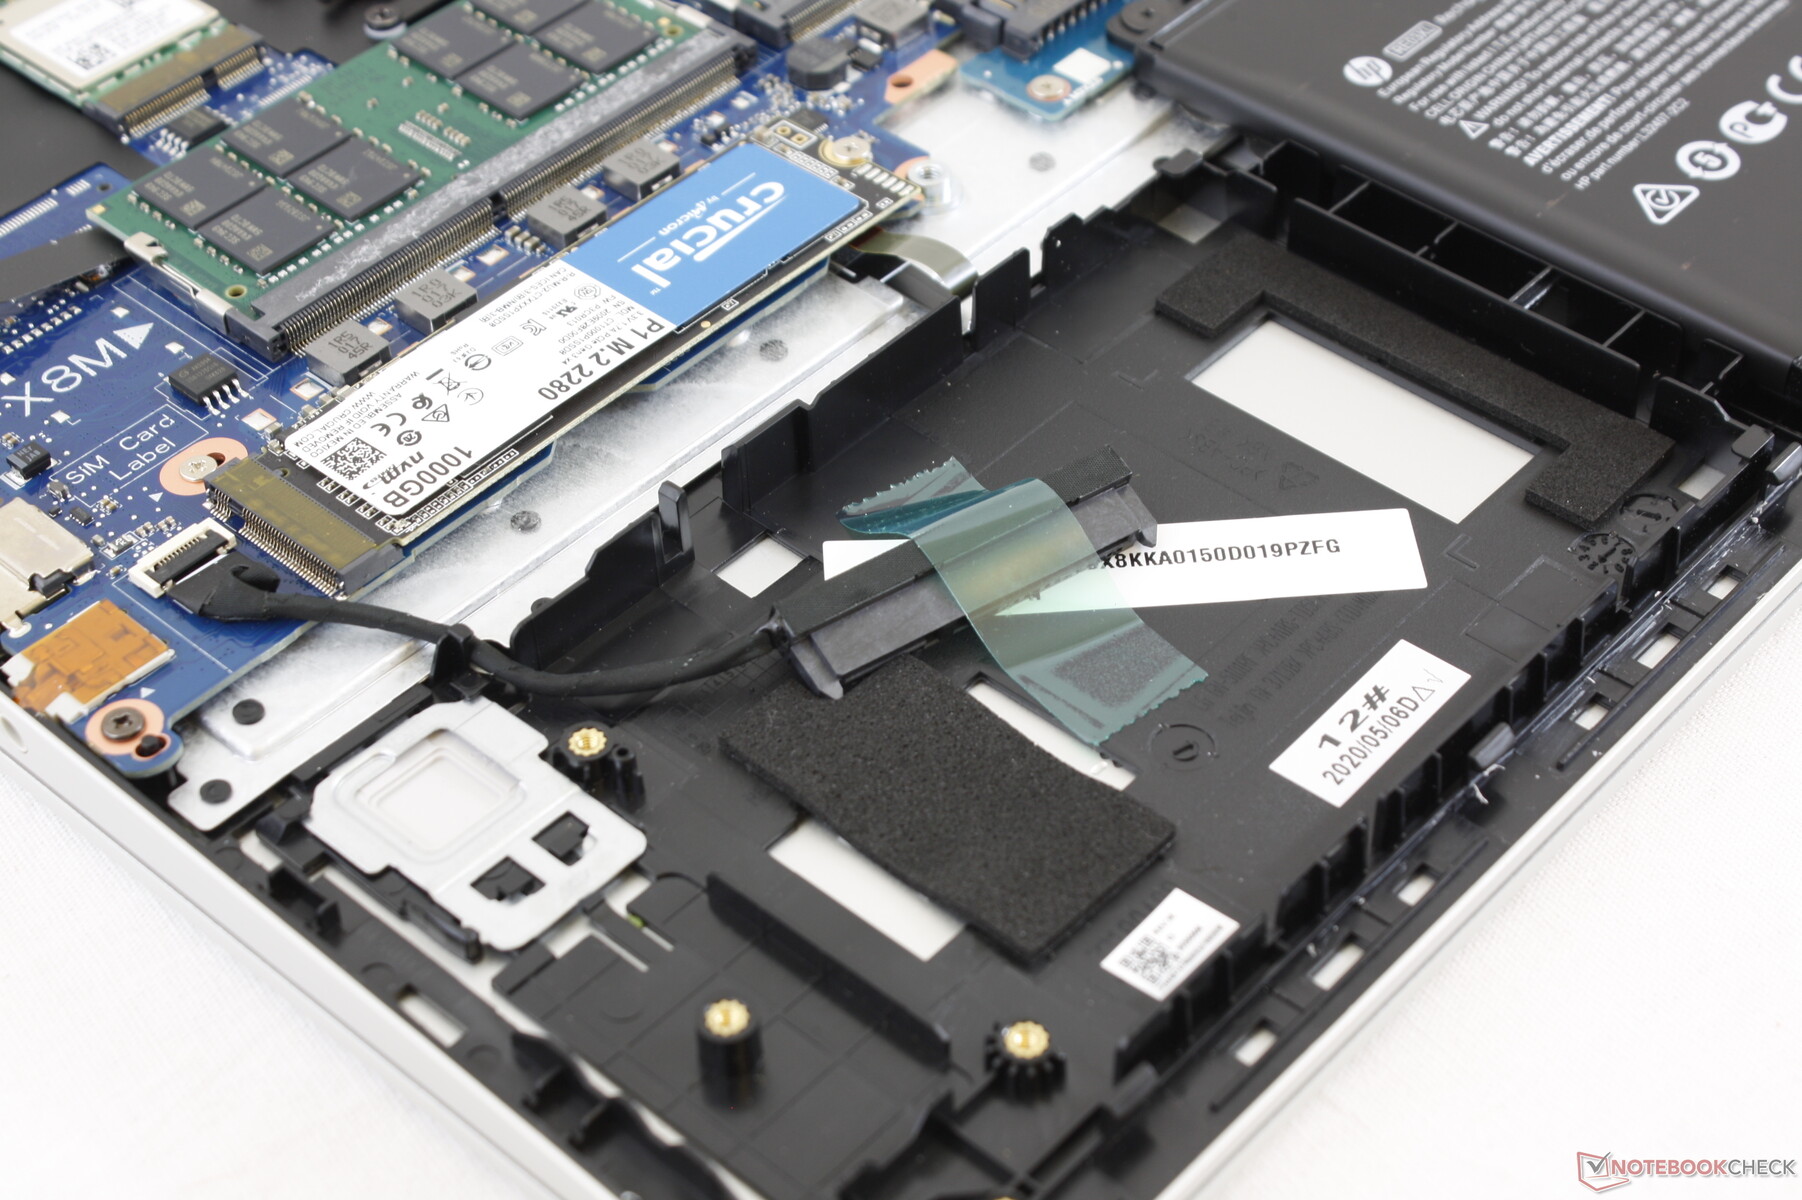
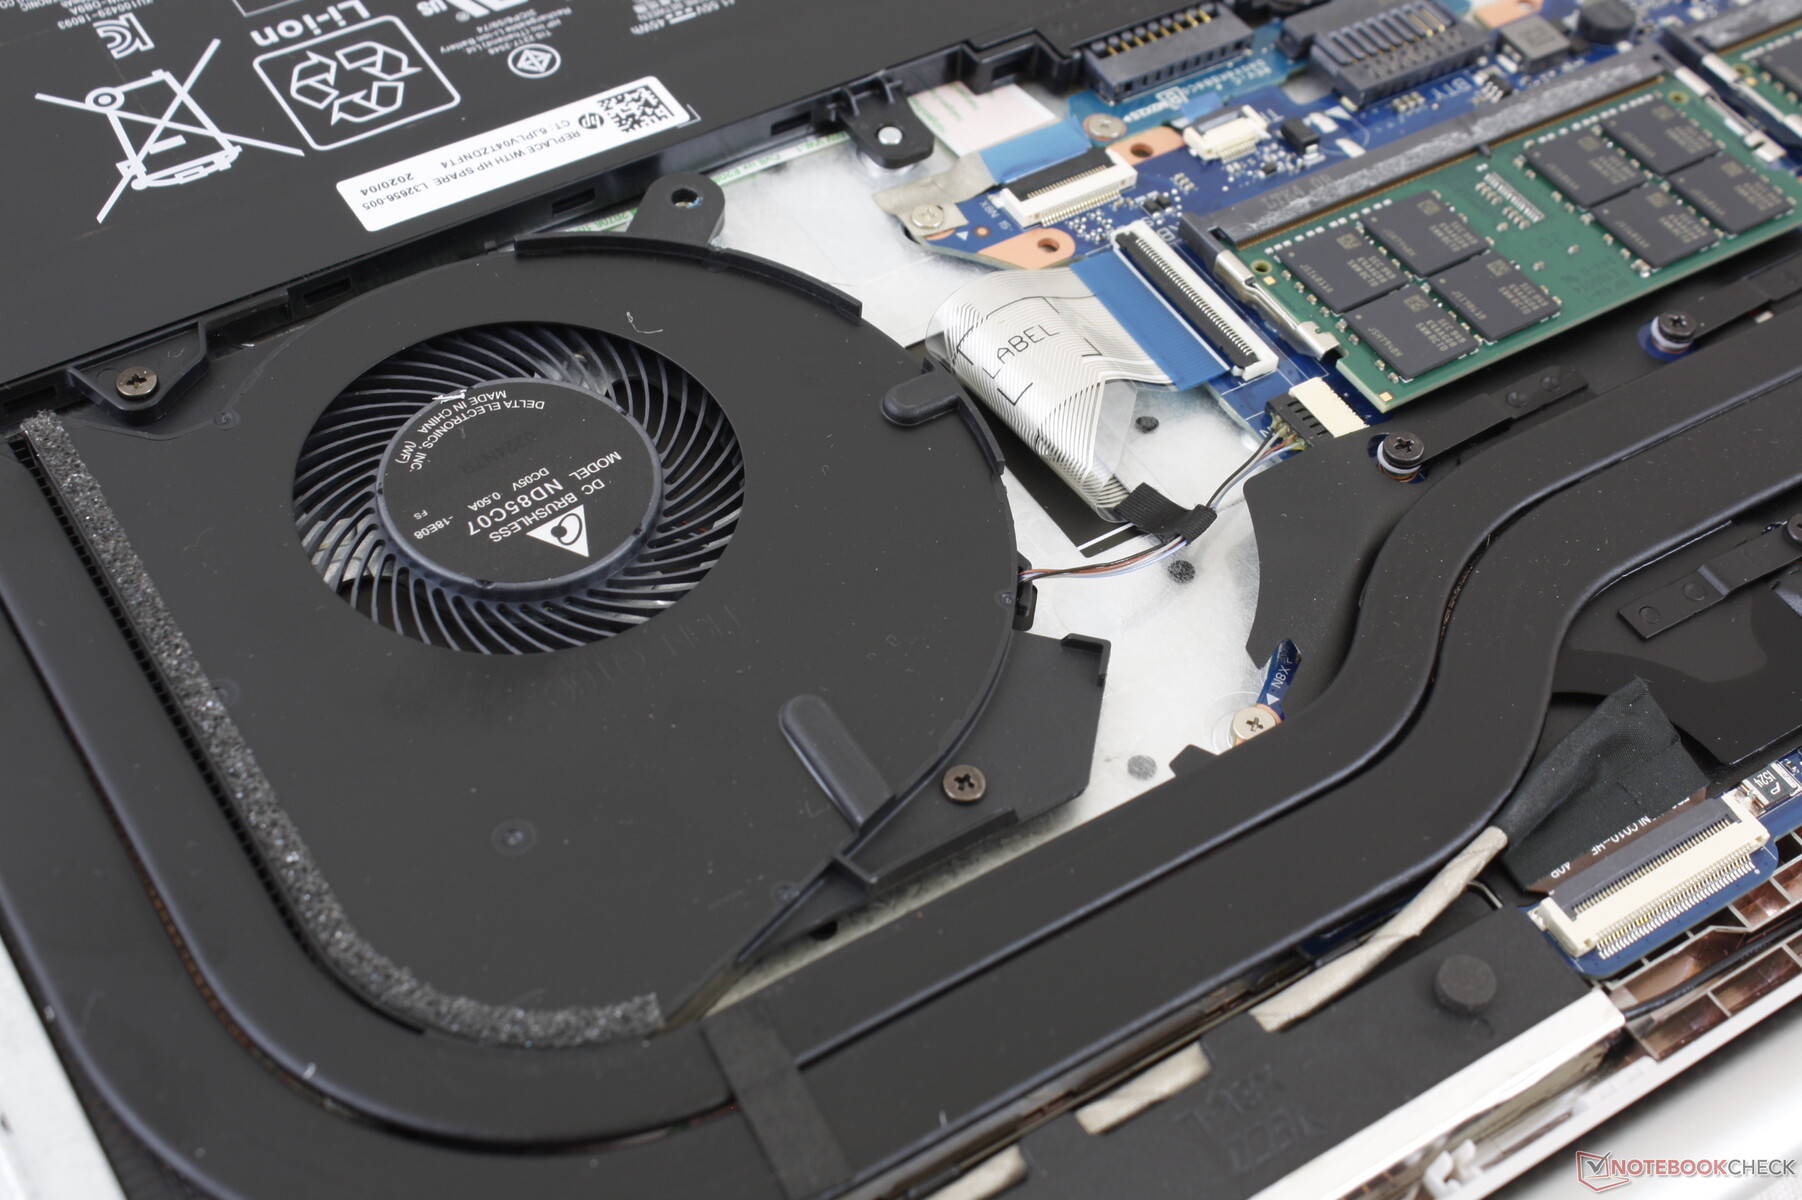
Maintenance
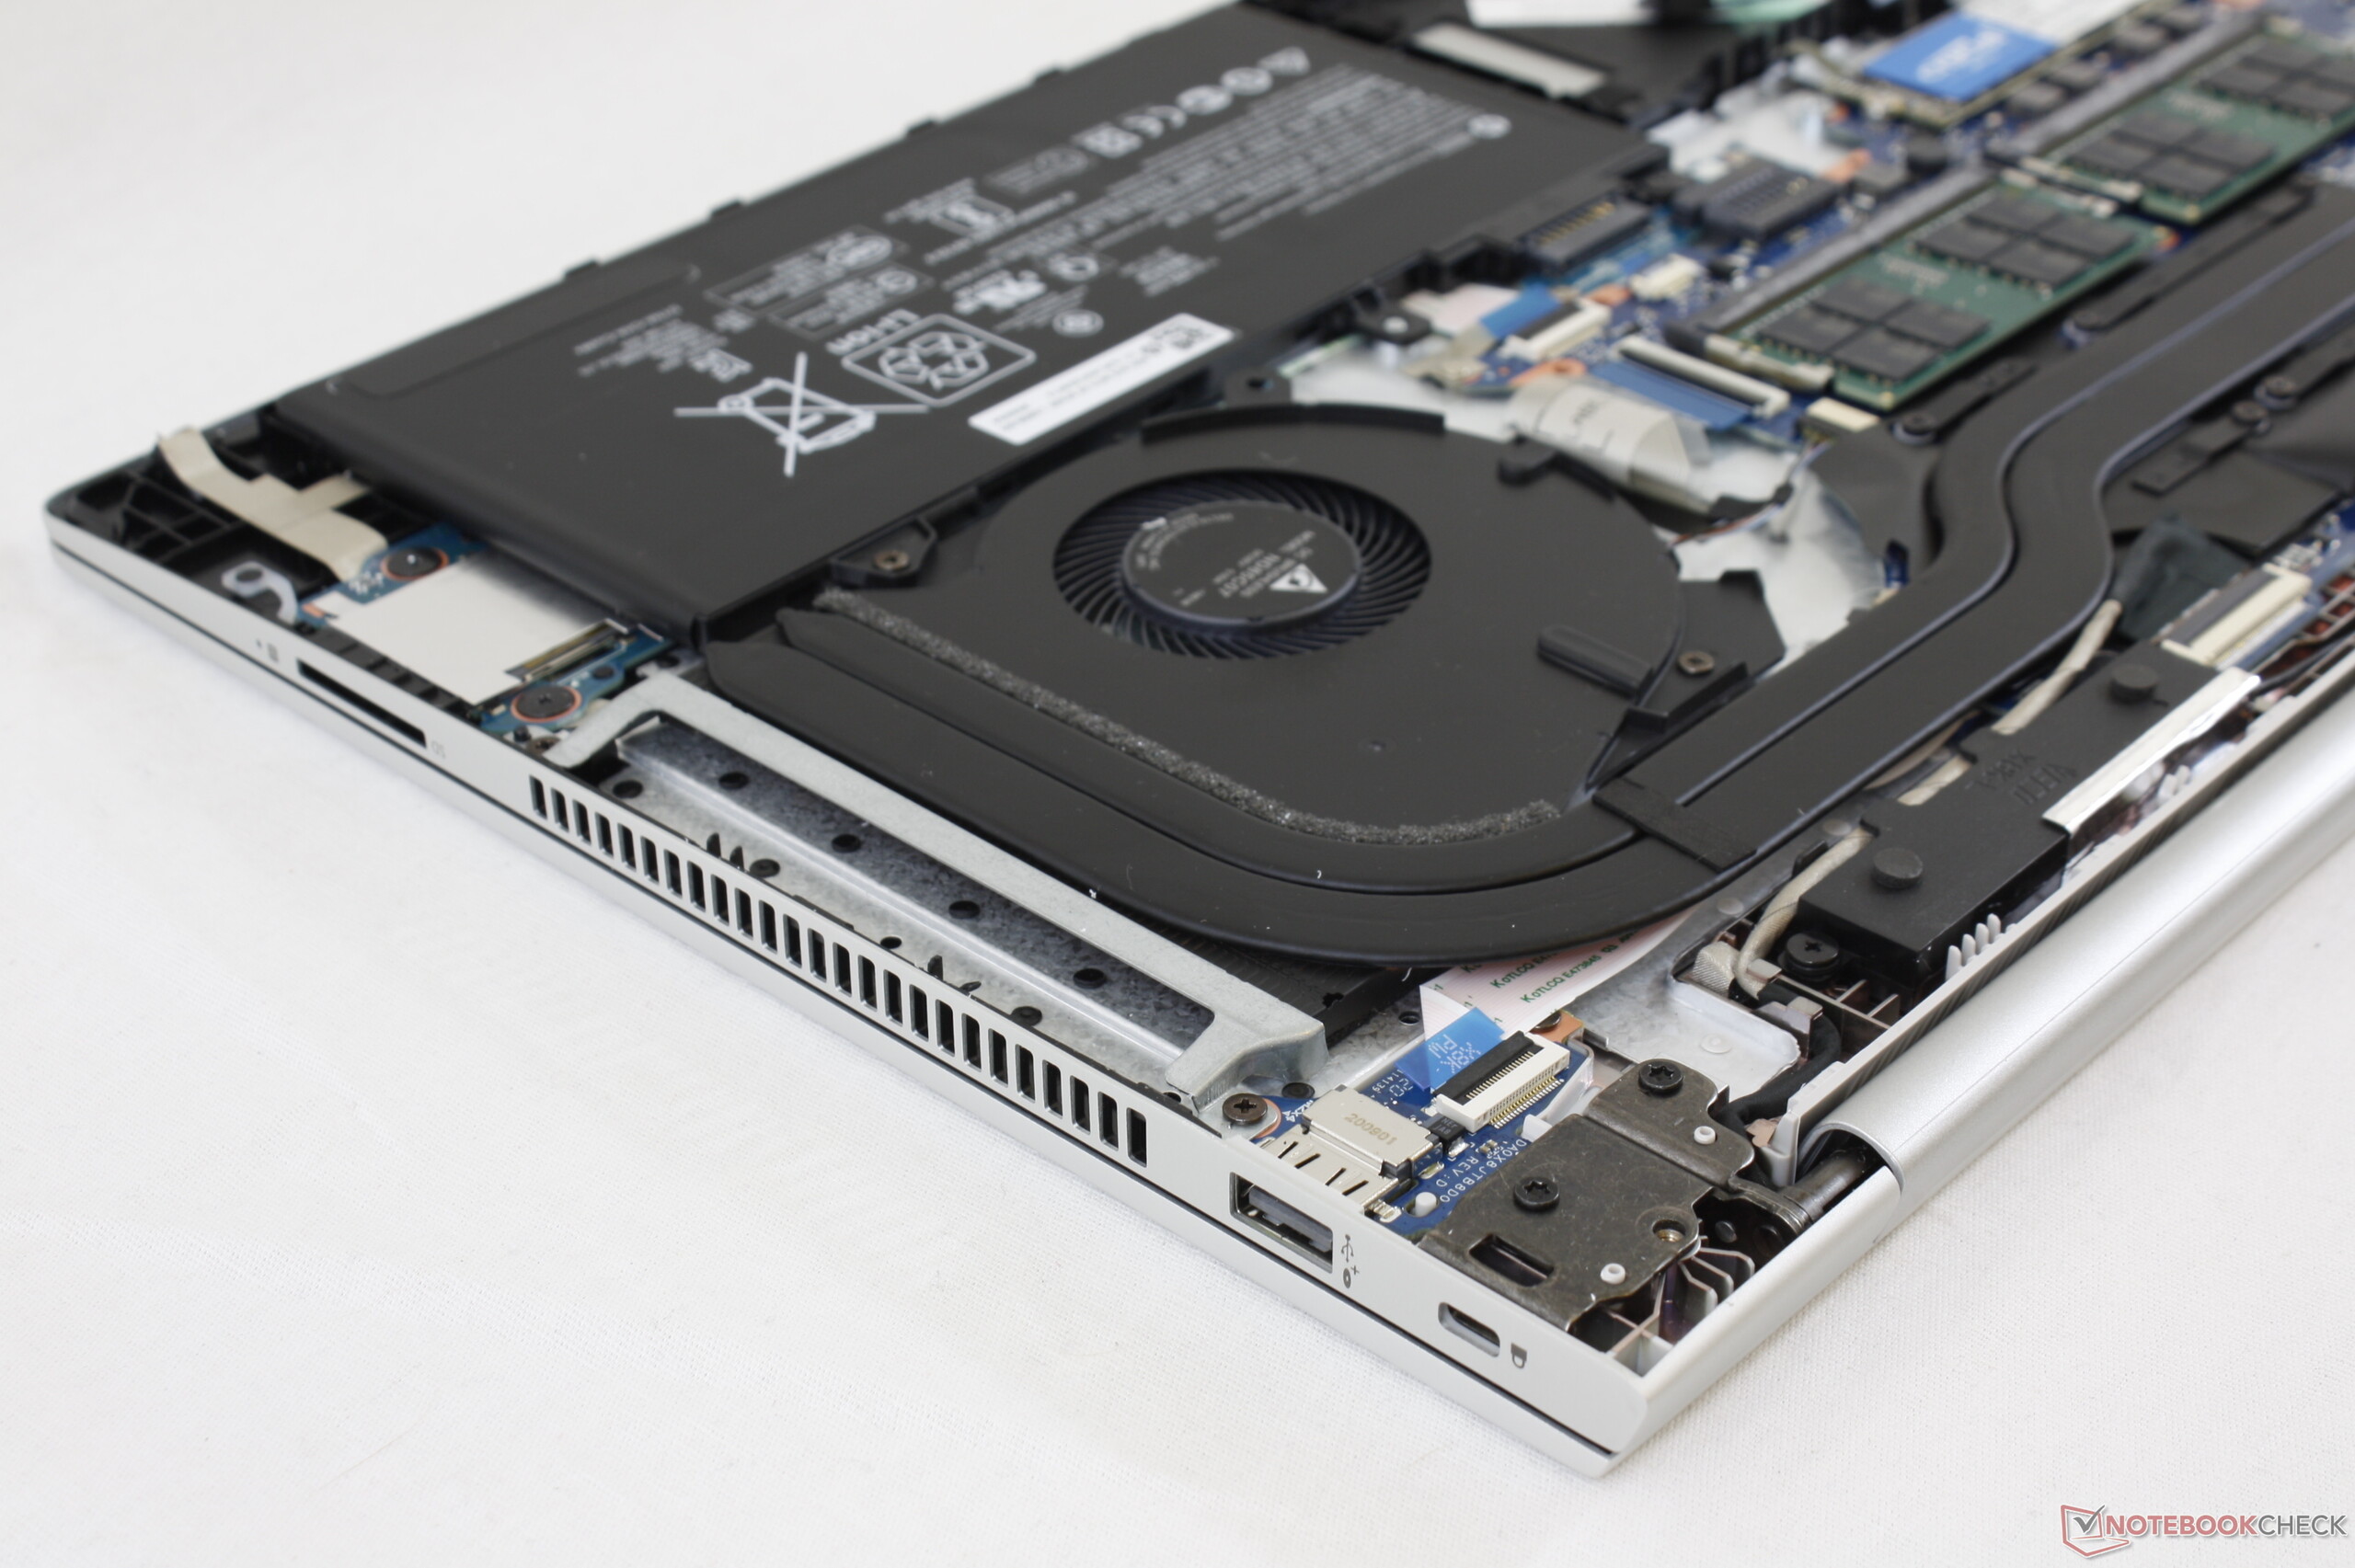
Servicing requires a Philips screwdriver and flat edge. The plastic bottom panel takes some patience to remove because its edges and corners are latched very tightly to the base of the chassis.
Accessories and Warranty
There are no included extras in the box outside of the AC adapter and paperwork. The standard one-year limited warranty applies if ordered from either HP.com or CUKUSA.com with options to extend up to three years. CUKUSA will cover any parts they add themselves such as RAM or storage for three years.
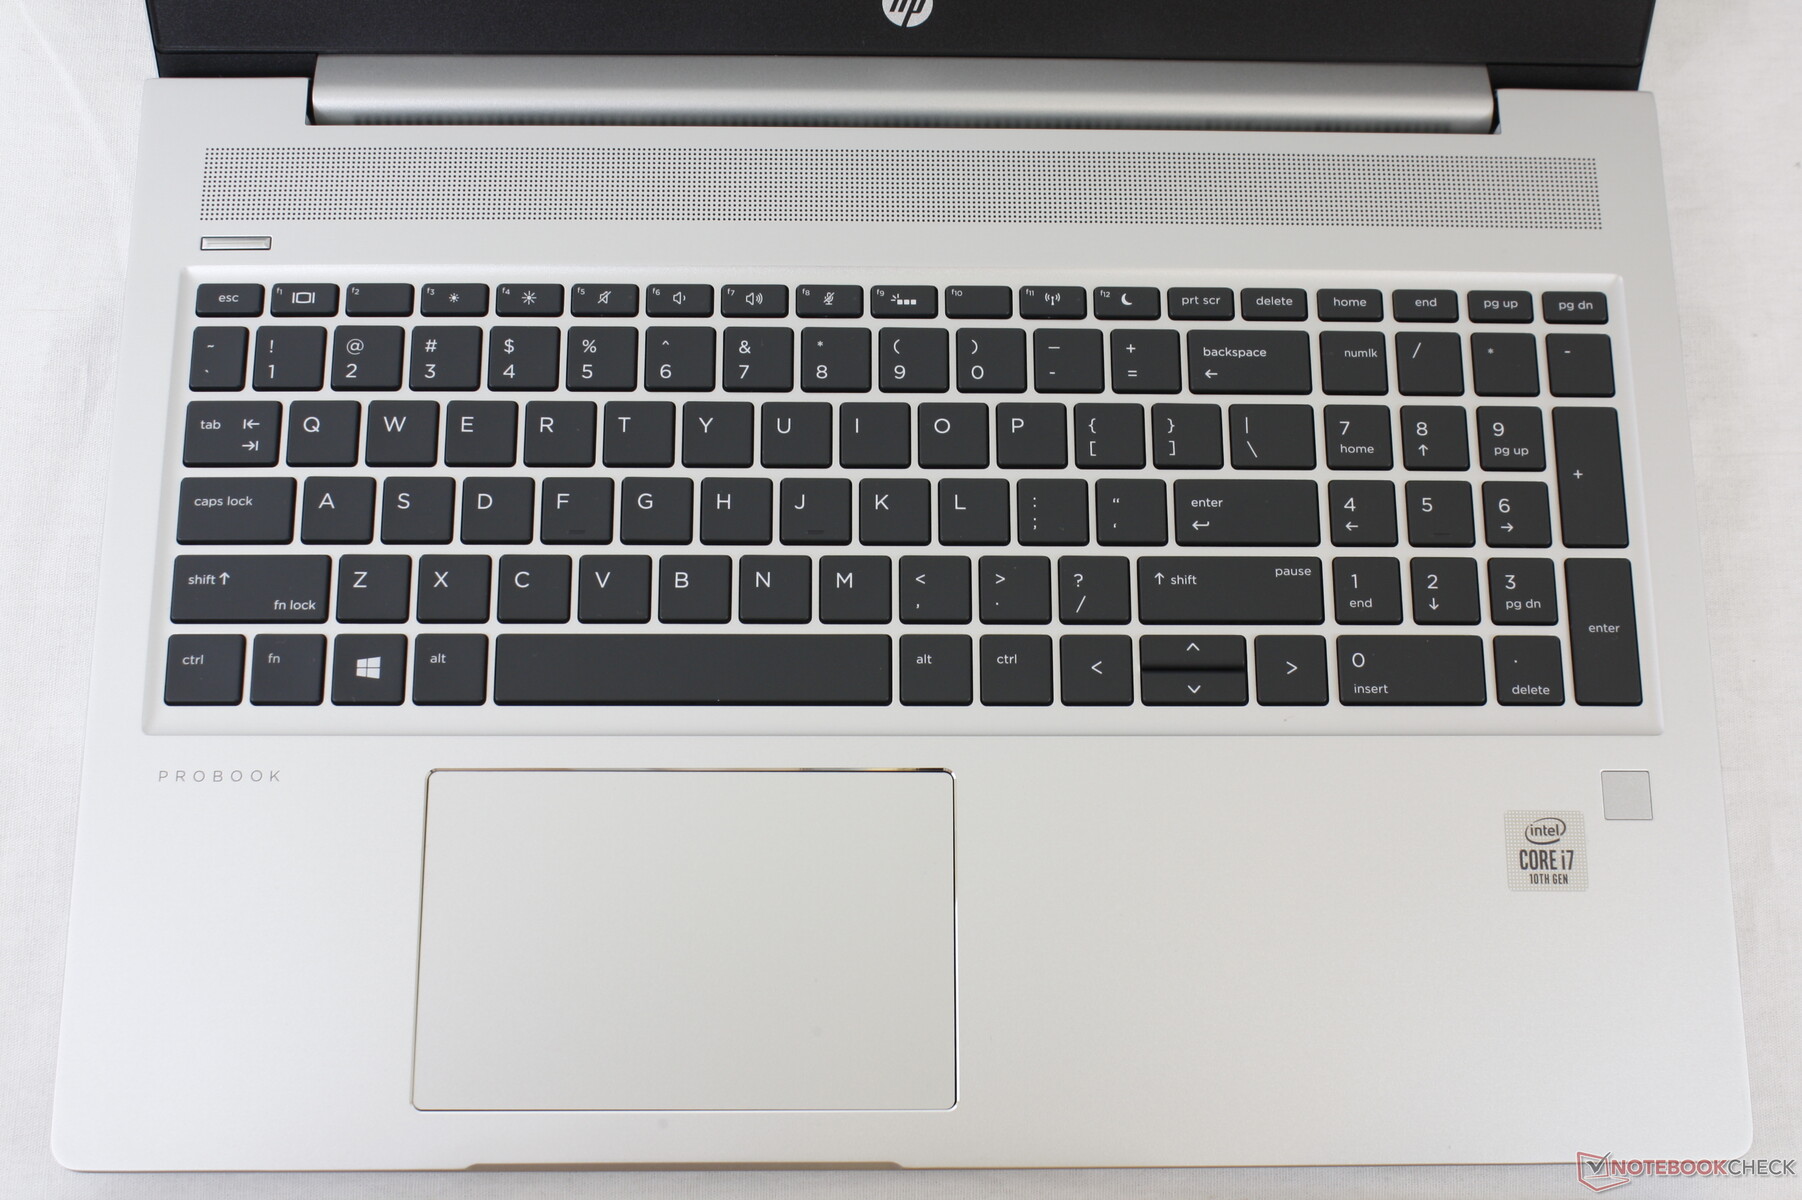
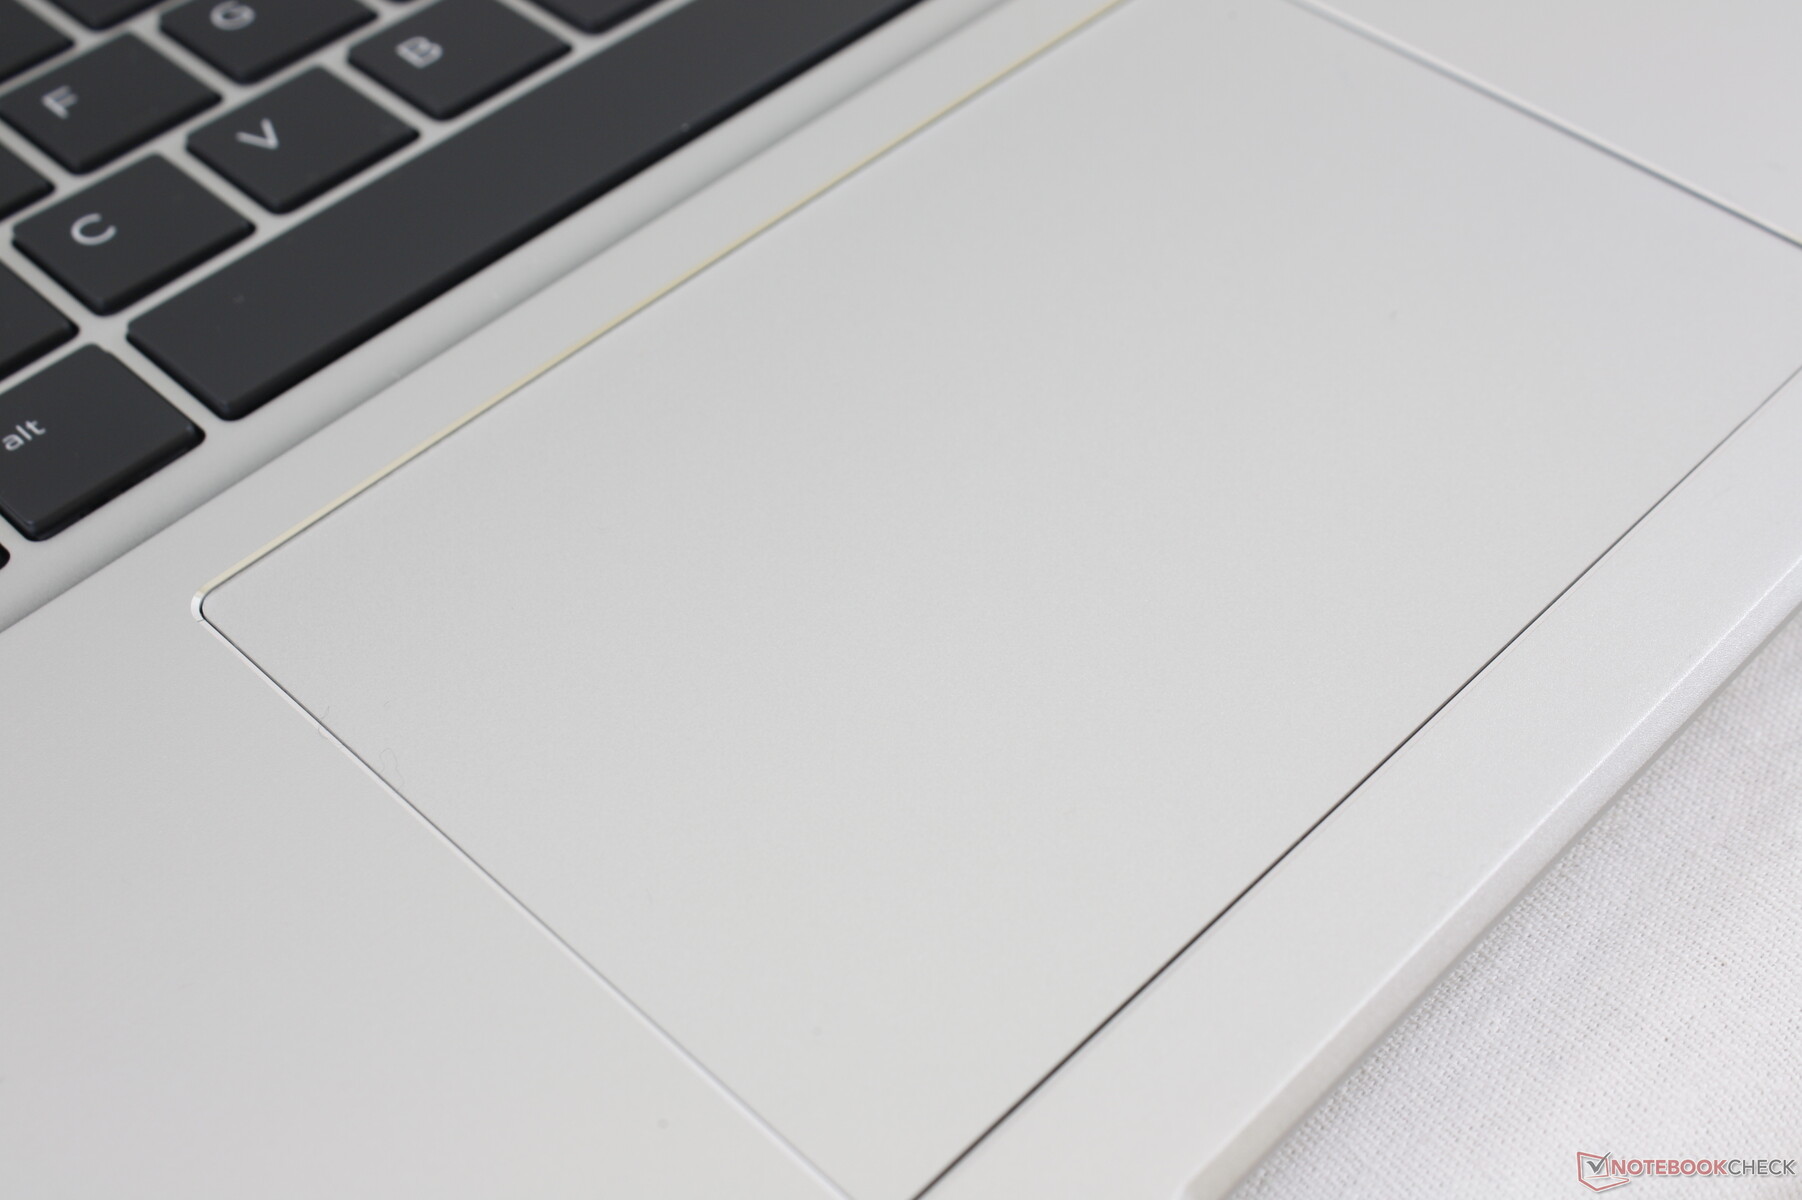
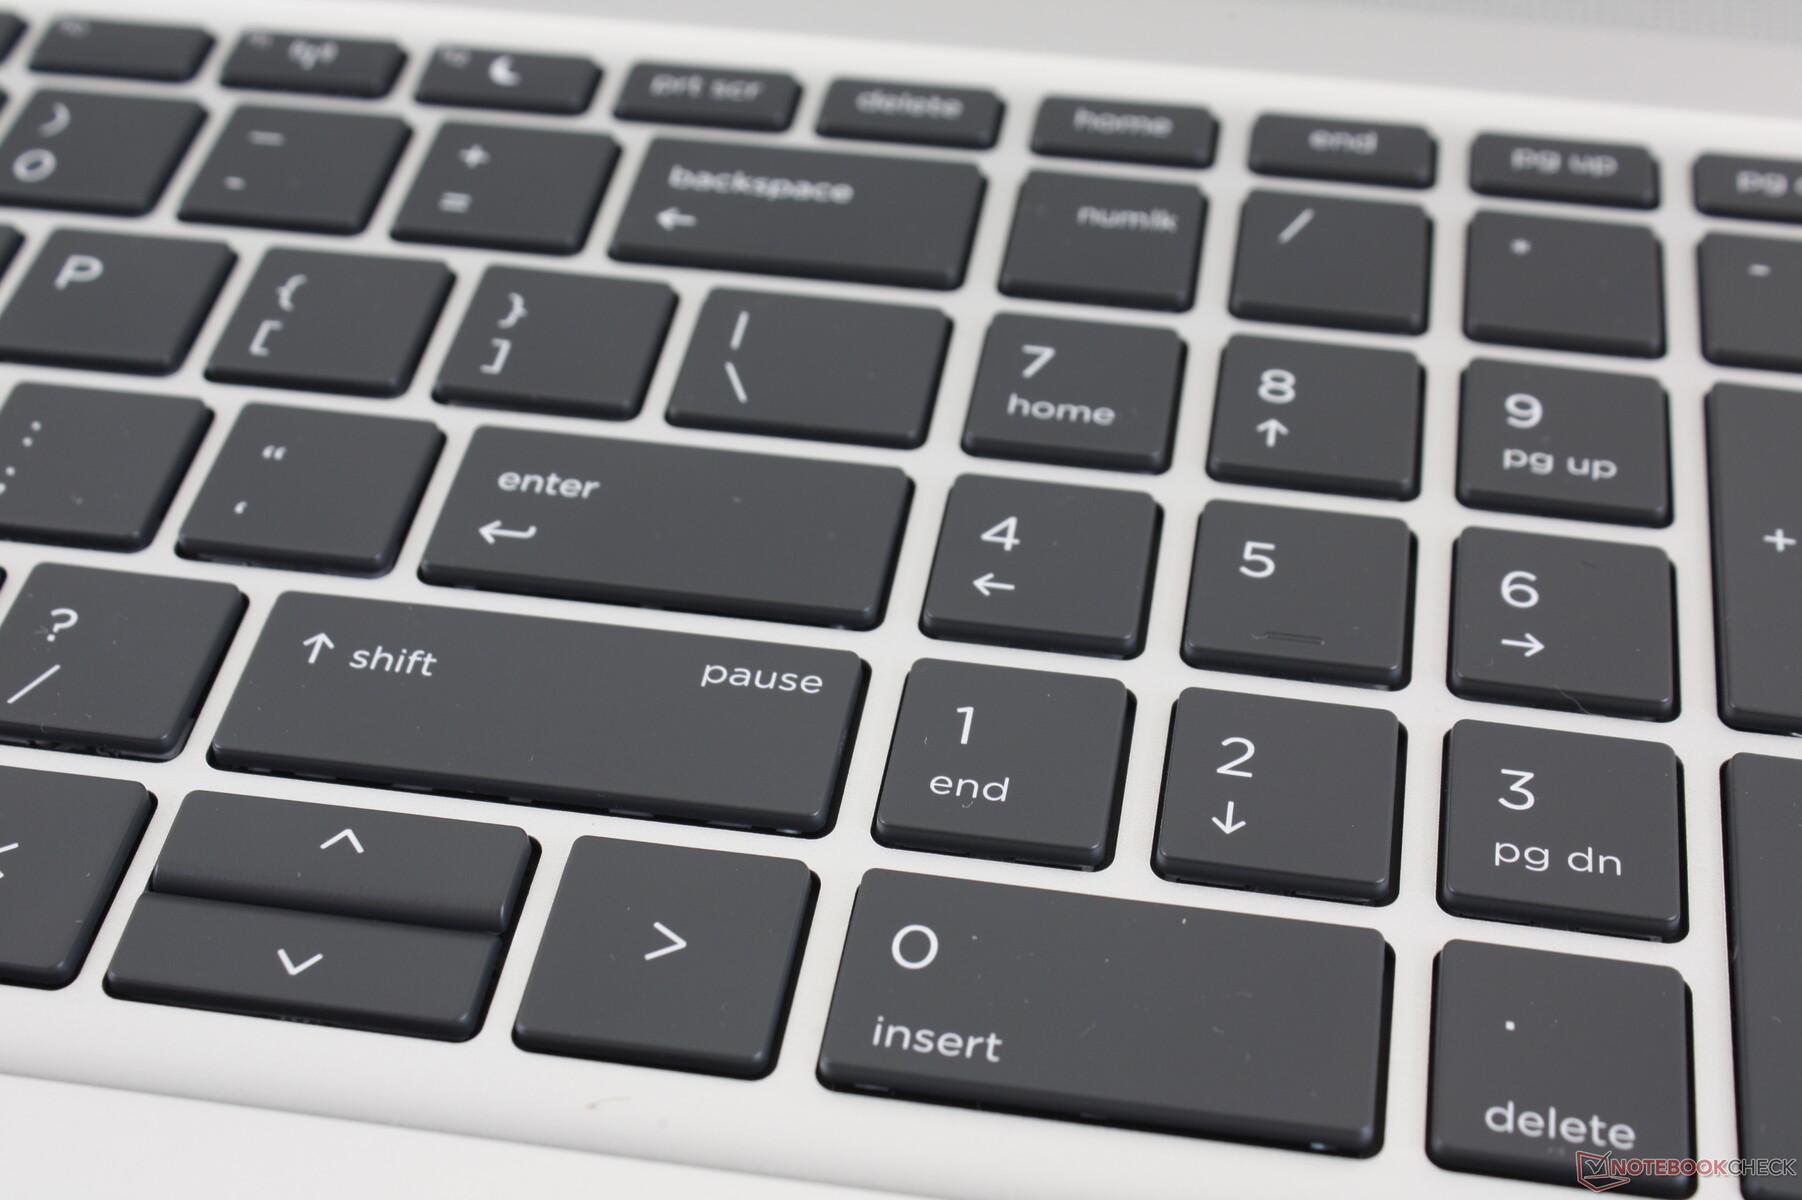
Input Devices

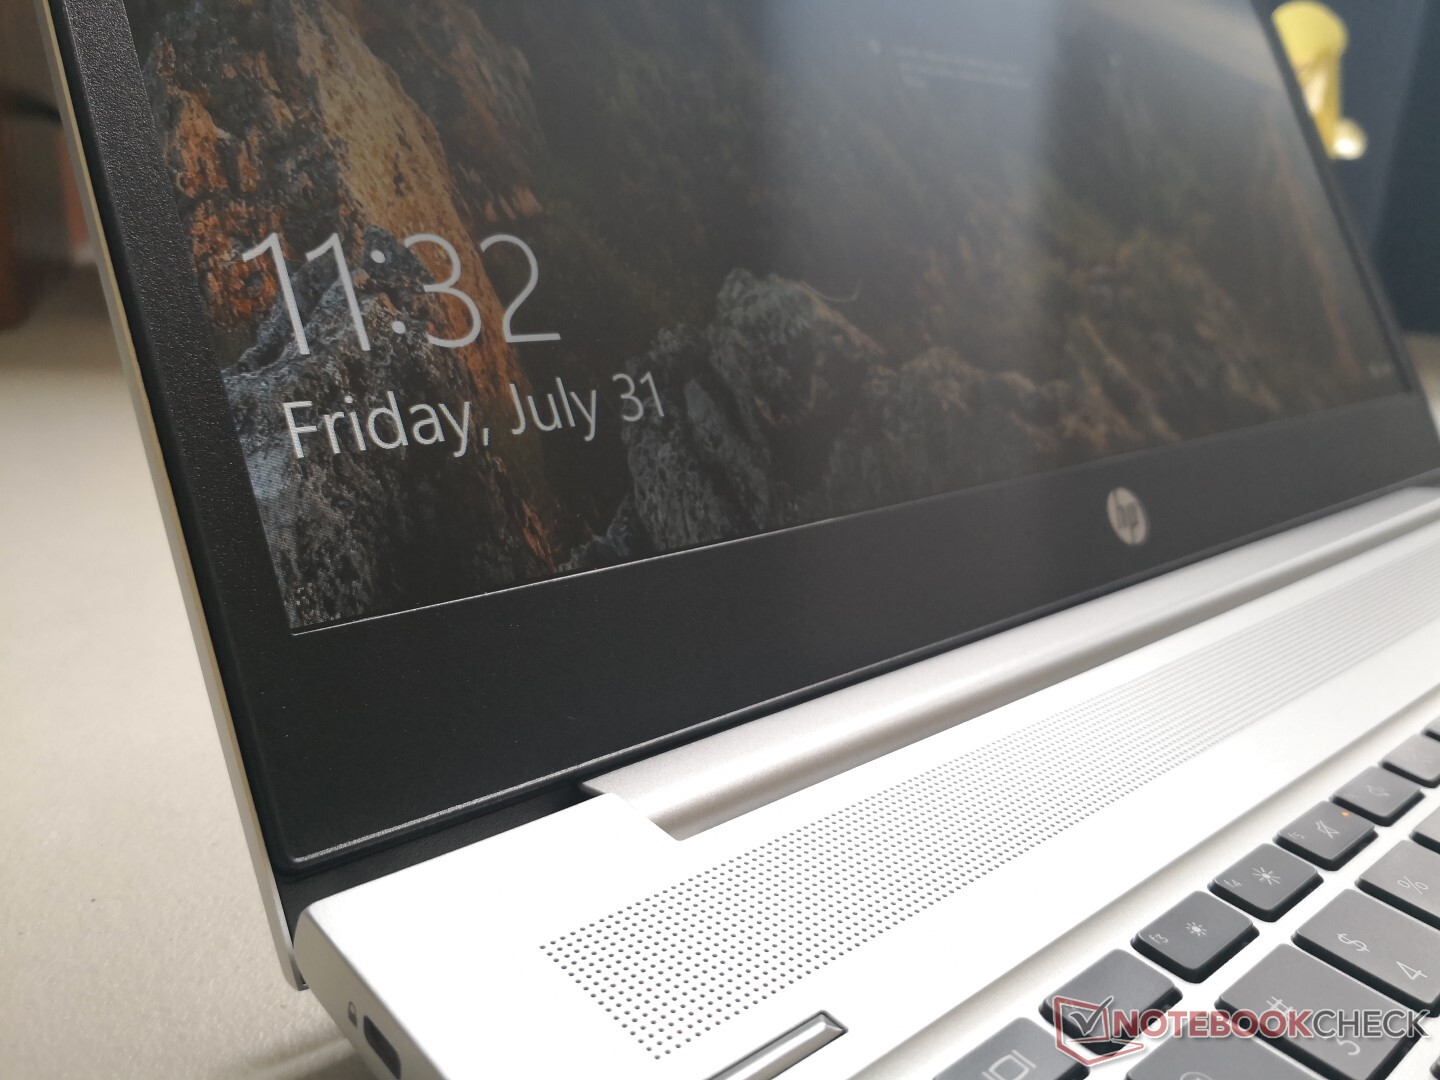
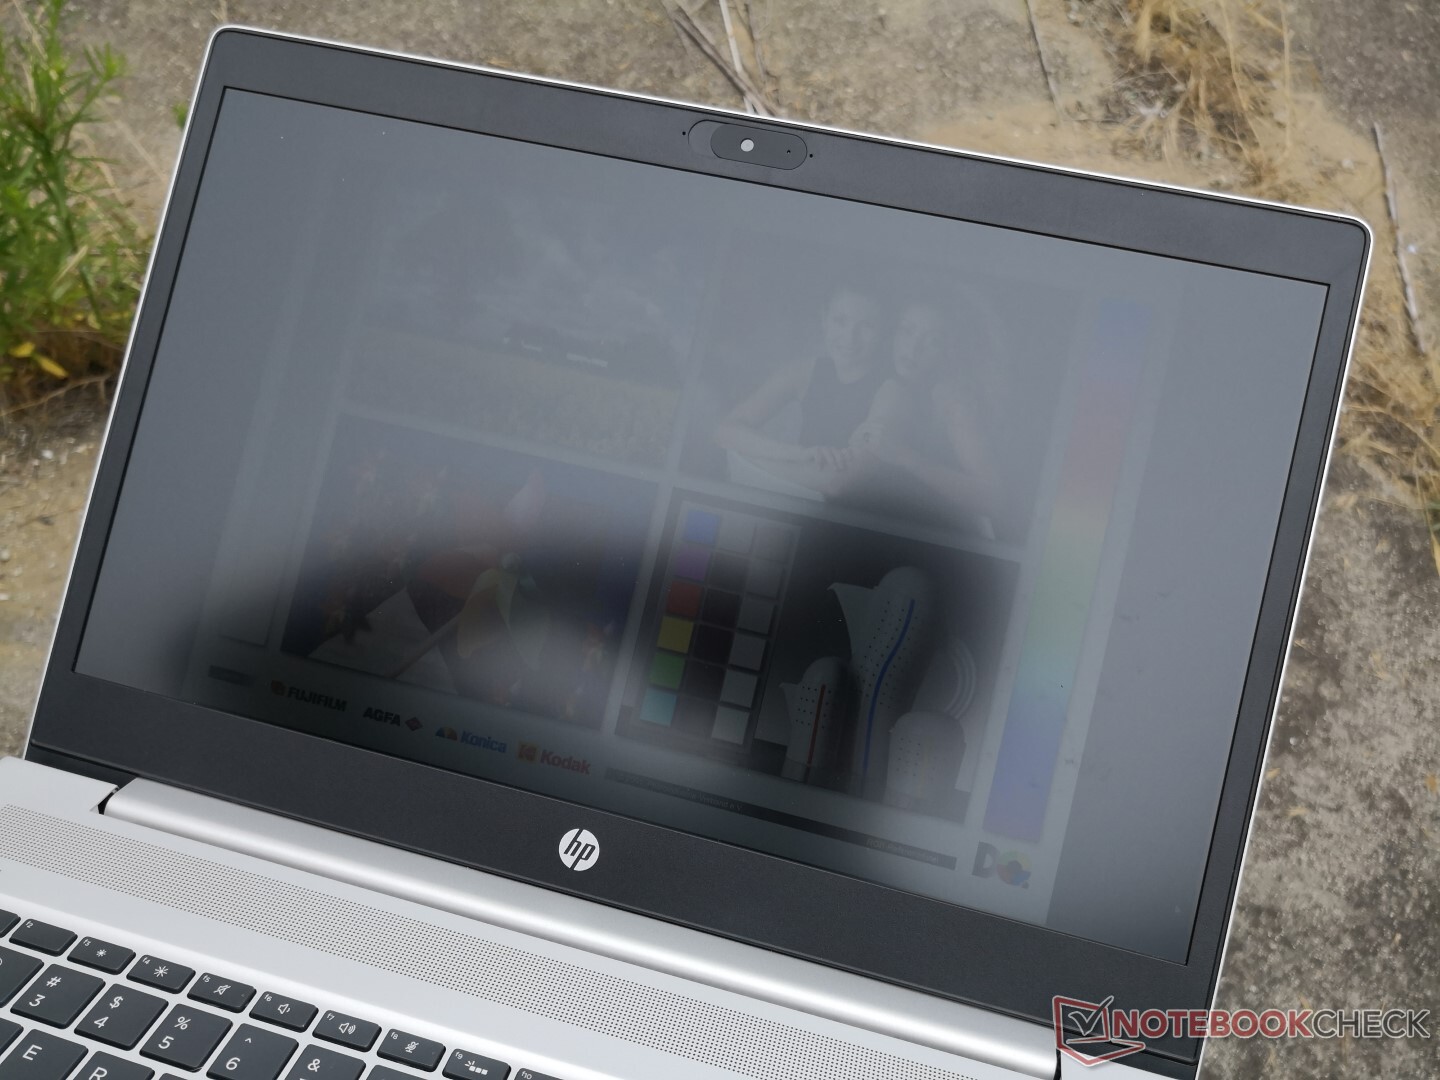
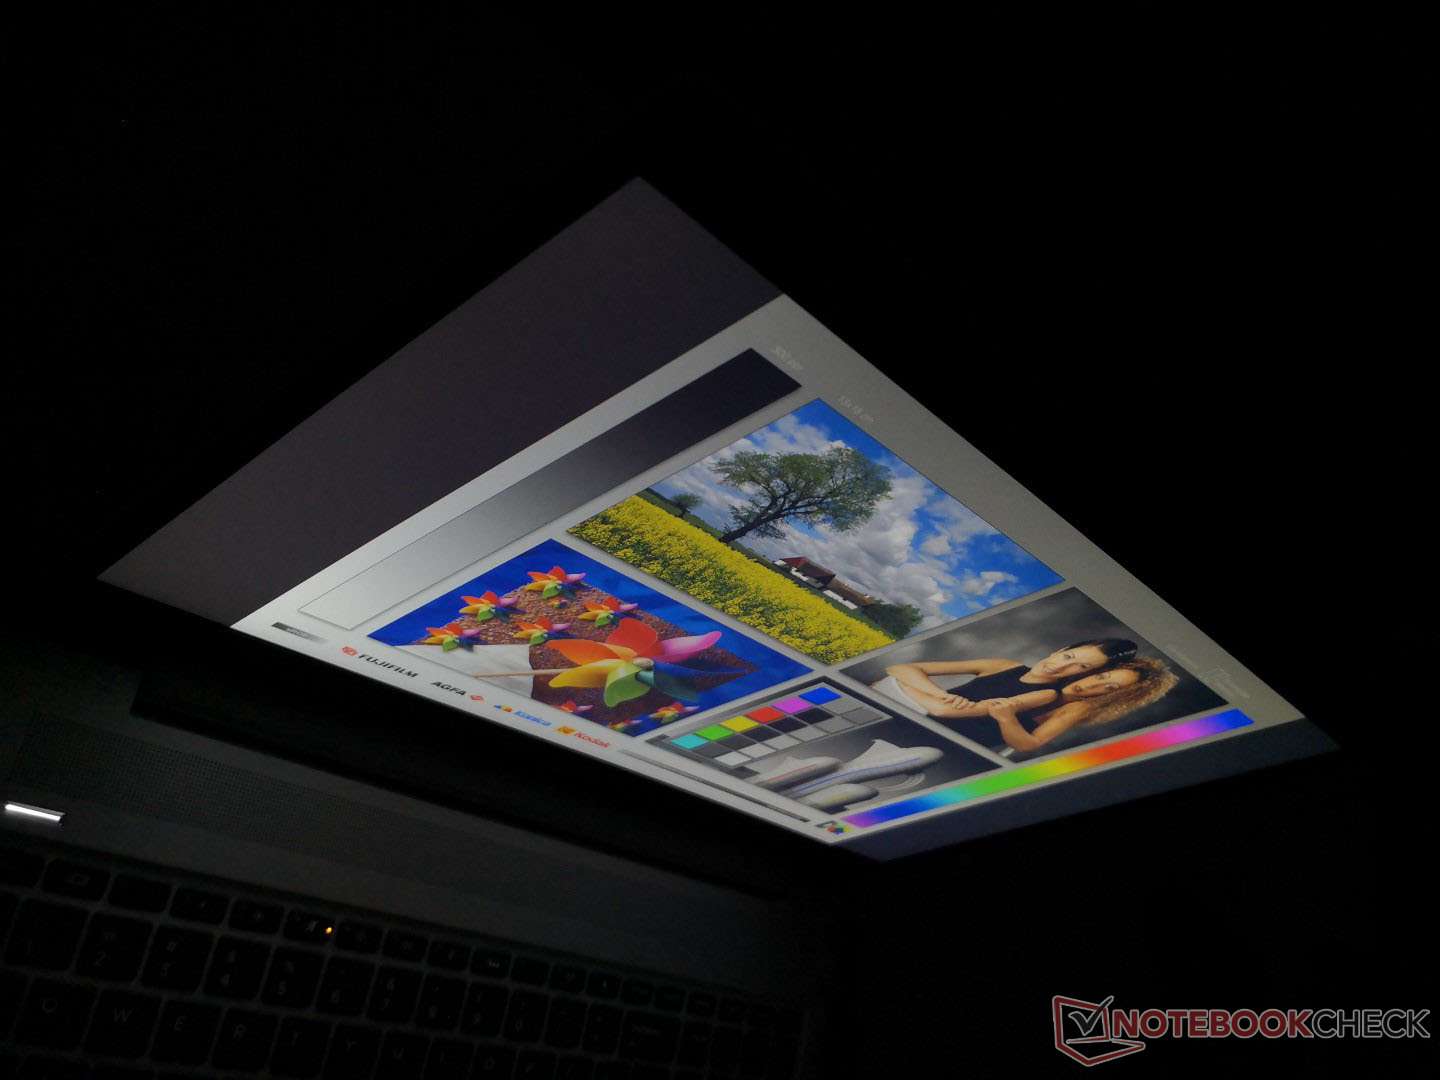
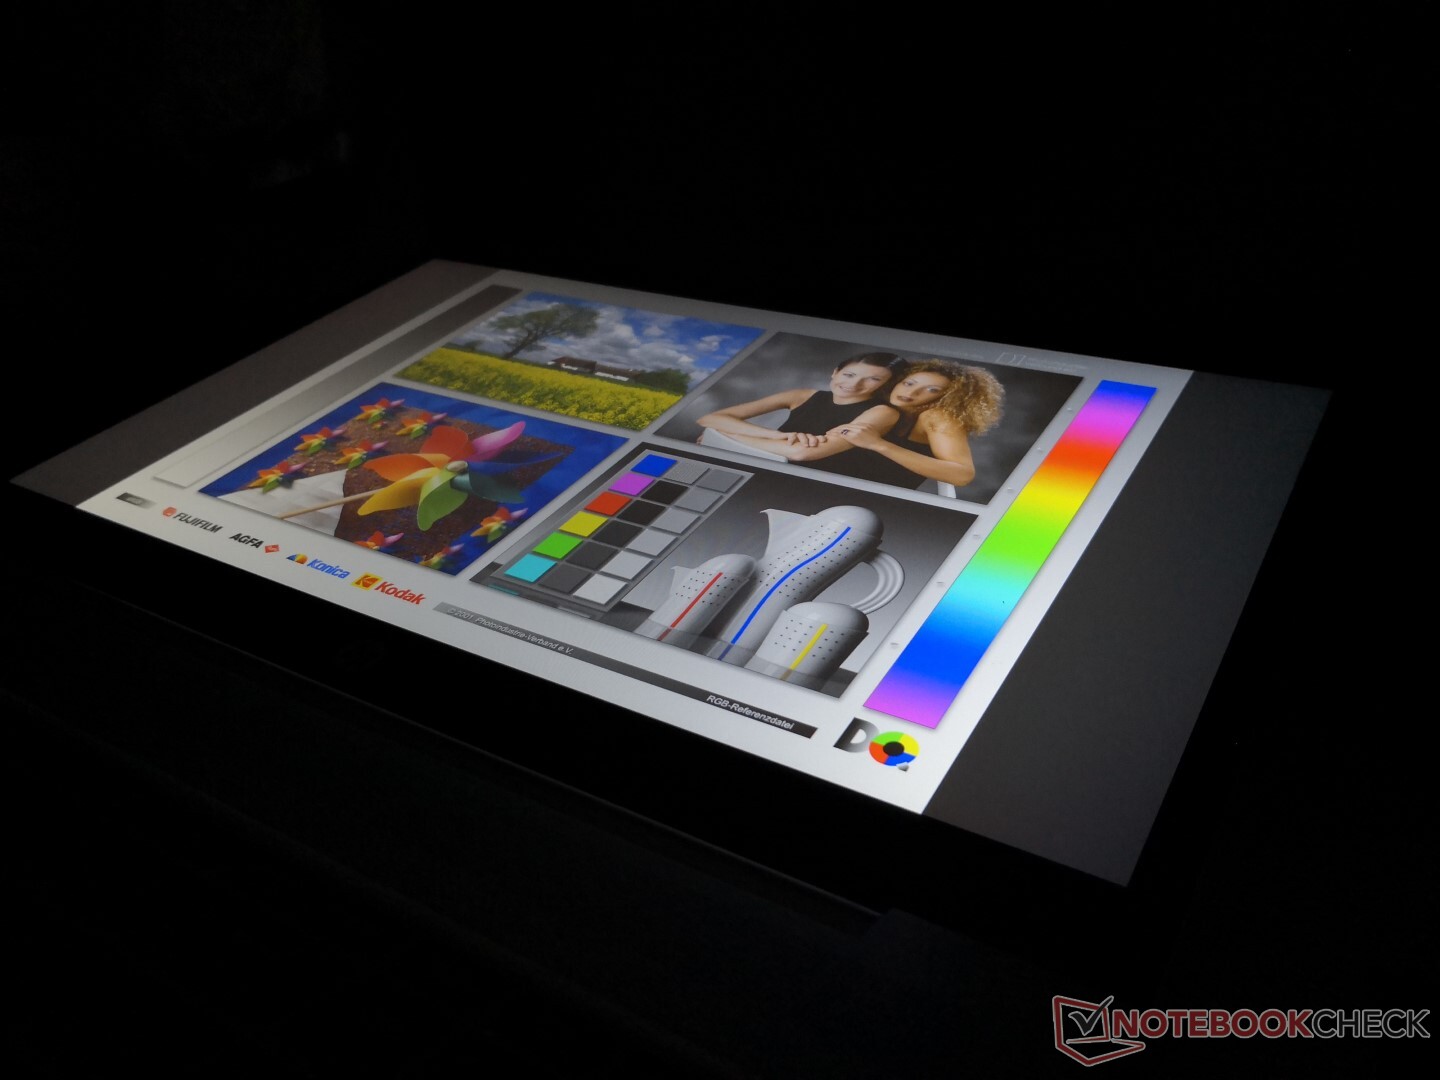
Display
Our Intel ProBook comes with an LG Philips panel in contrast to the AU Optronics panel on our AMD model. The contrast ratio is much shallower on the LG Philips panel, but both panels are otherwise similar in terms of color space, brightness, and response times. HP offers other options ranging from the lesser 768p up to even a 1000-nit 1080p panel with Sure View privacy to limit viewing angles.


| |||||||||||||||||||||||||
Brightness Distribution: 91 %
Center on Battery: 224.3 cd/m²
Contrast: 619:1 (Black: 0.42 cd/m²)
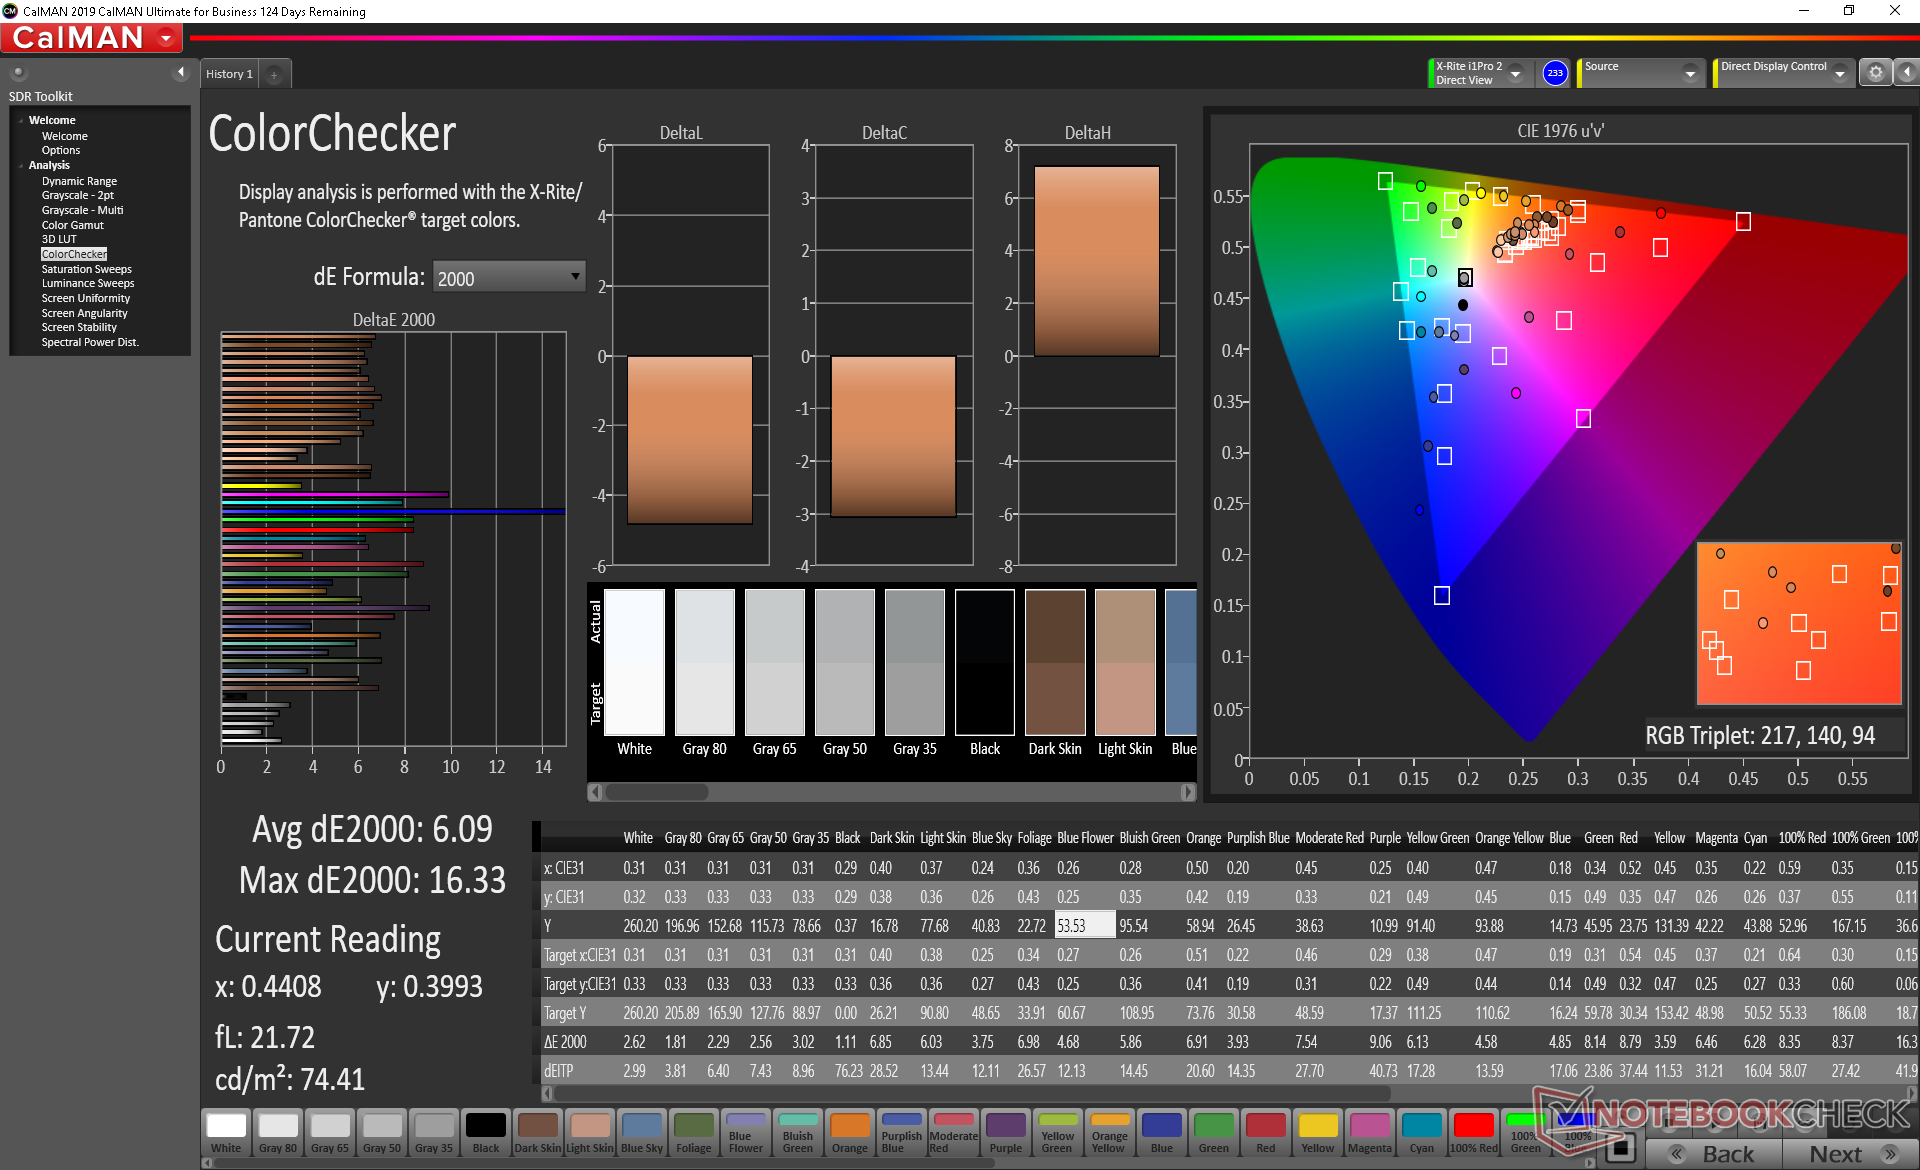
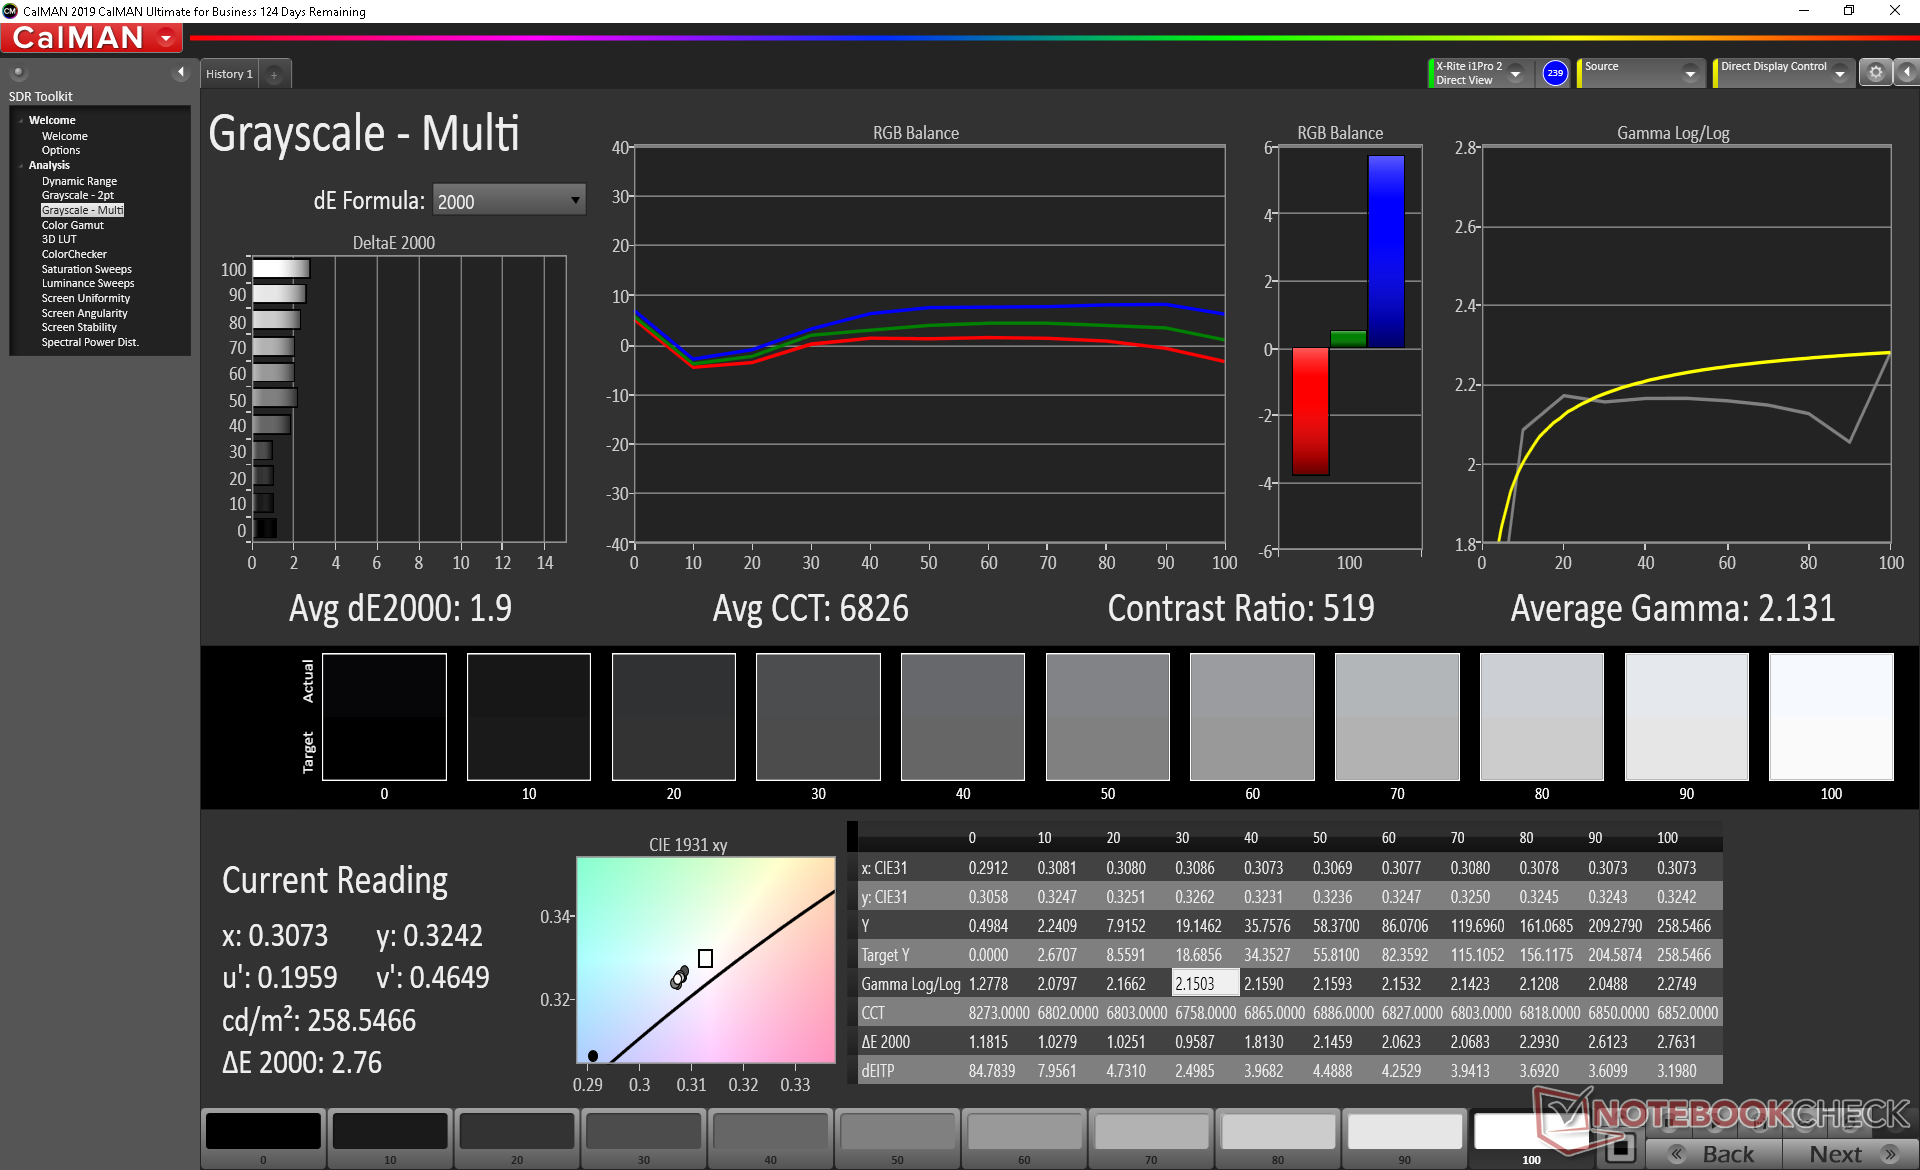
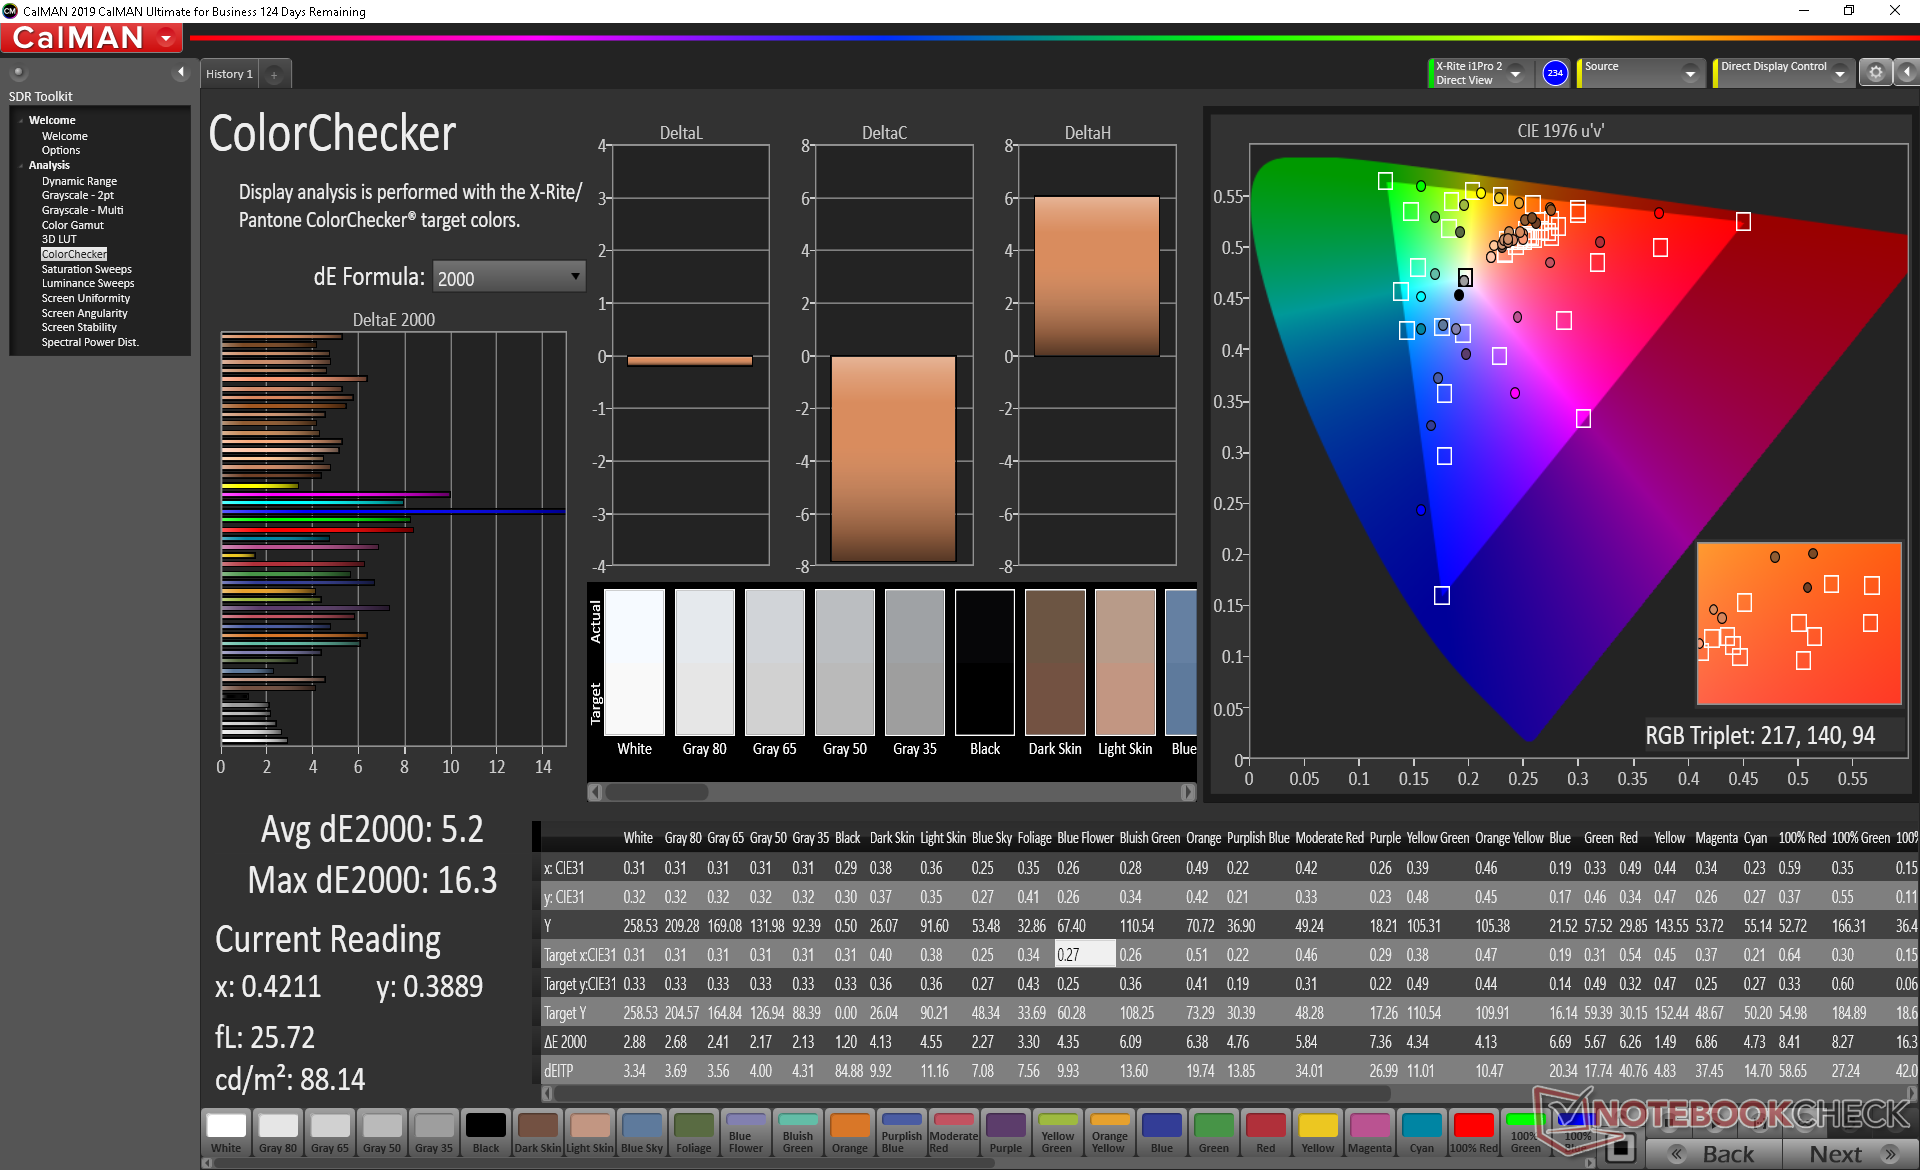
ΔE ColorChecker Calman: 6.09 | ∀{0.5-29.43 Ø4.73}
calibrated: 5.2
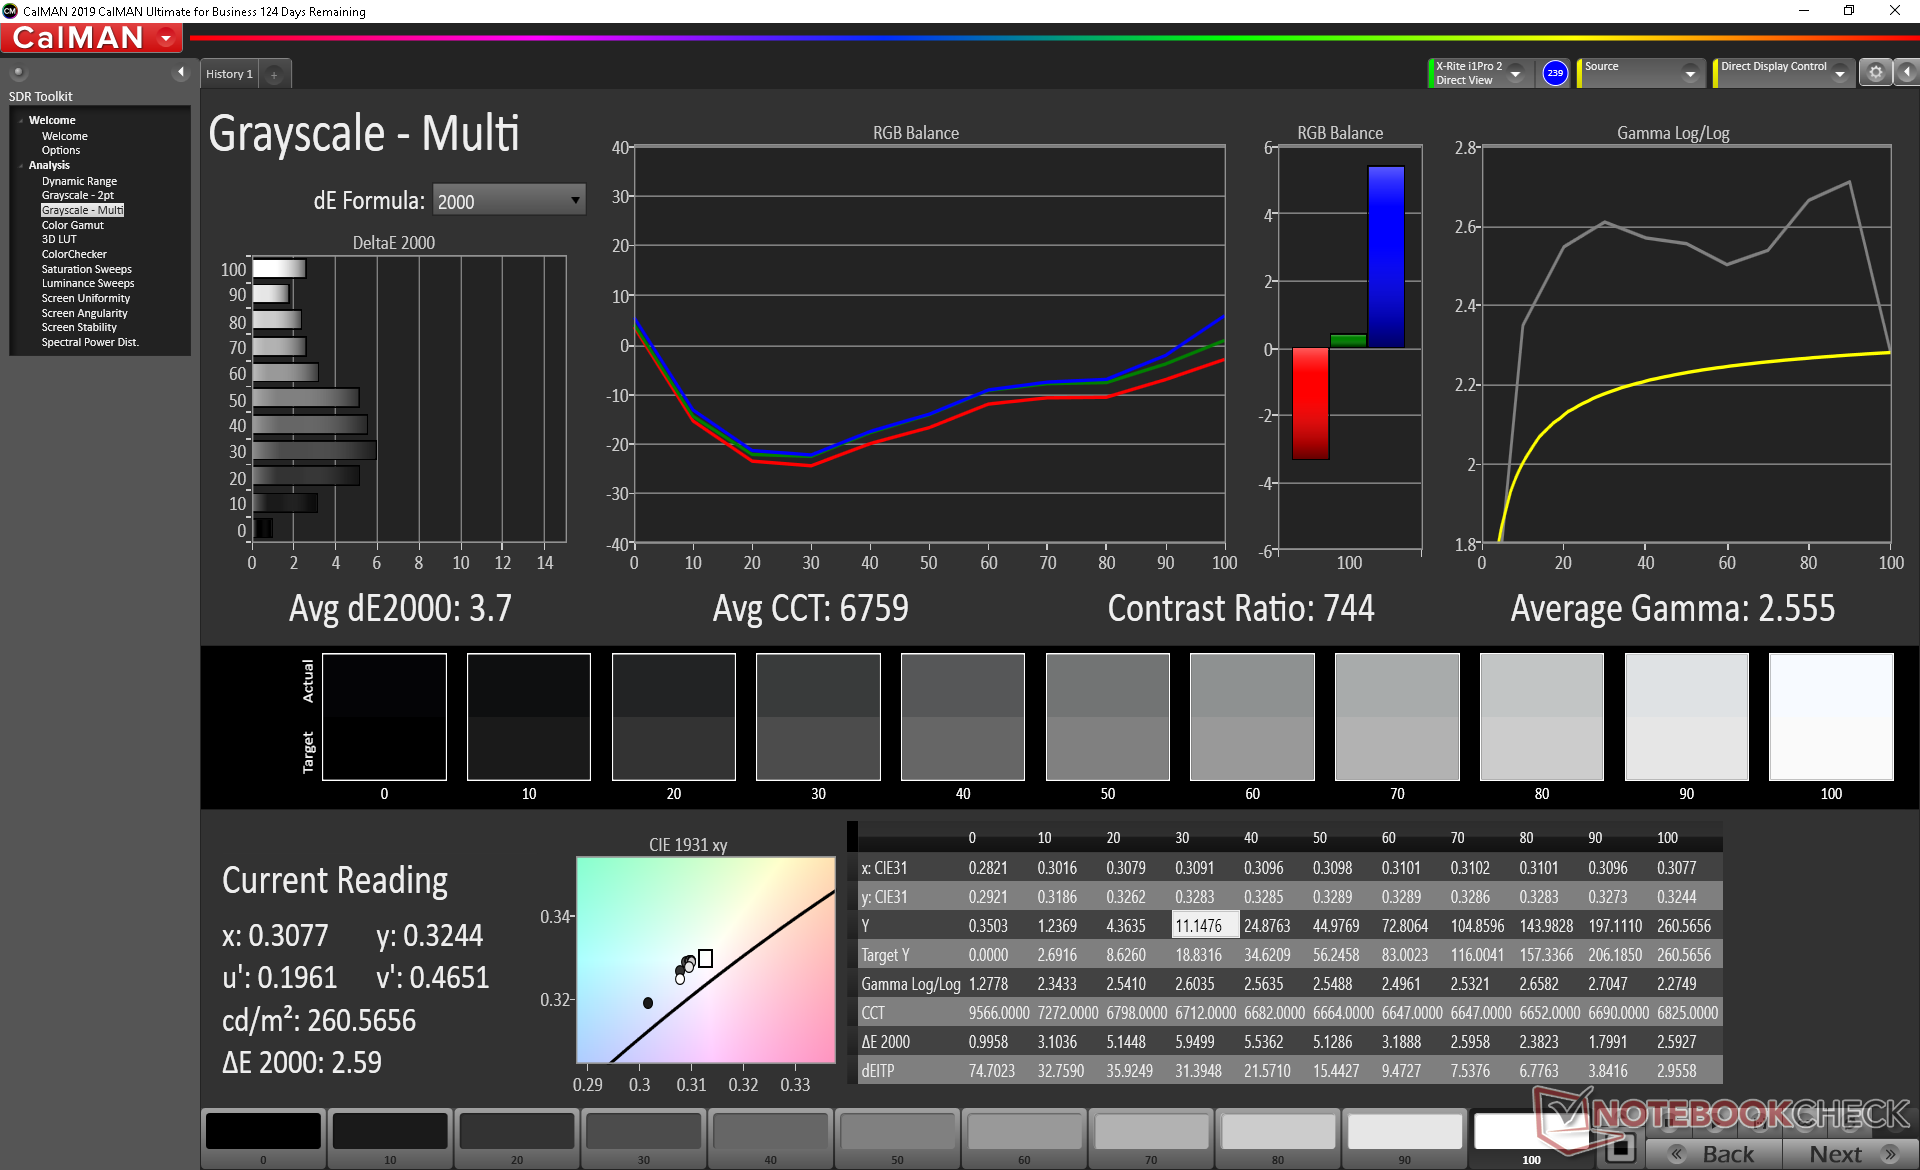
ΔE Greyscale Calman: 3.7 | ∀{0.09-98 Ø4.98}
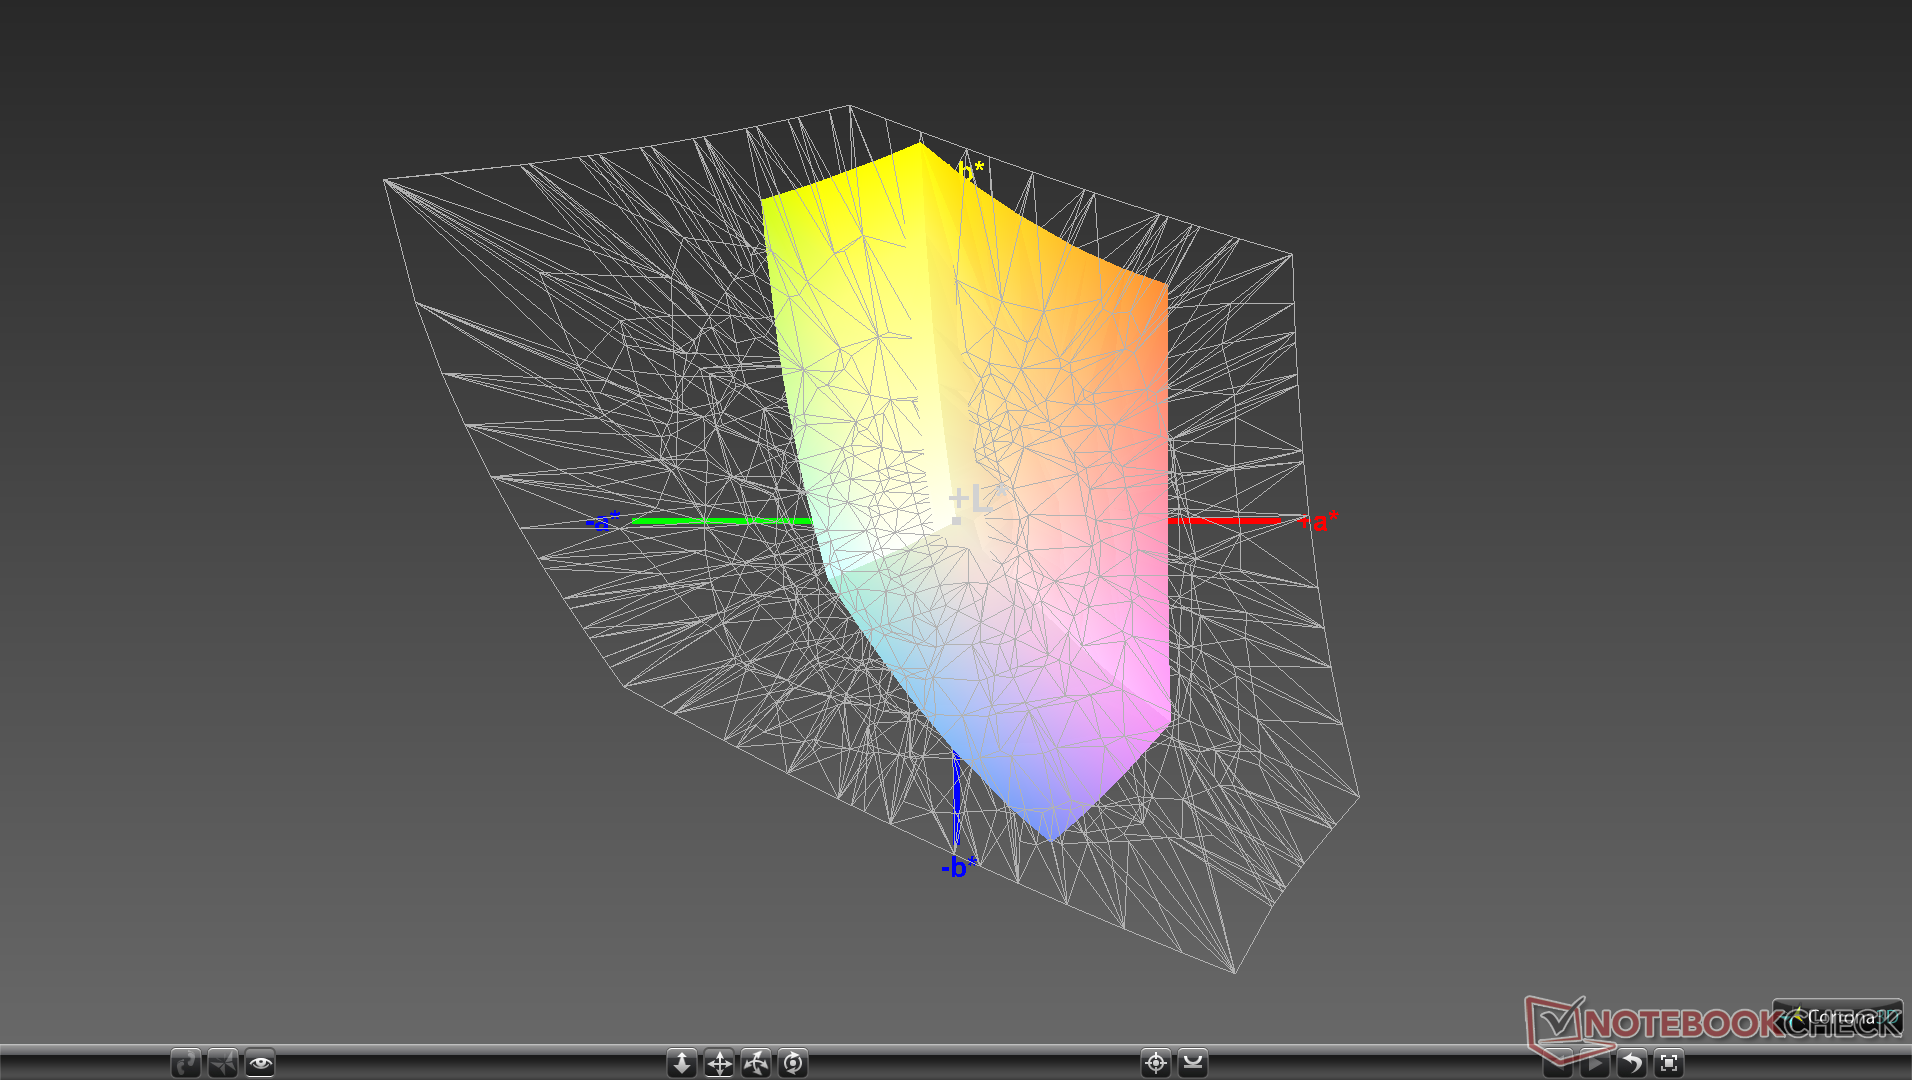
56.2% sRGB (Argyll 1.6.3 3D)
35.7% AdobeRGB 1998 (Argyll 1.6.3 3D)
39.08% AdobeRGB 1998 (Argyll 3D)
56.5% sRGB (Argyll 3D)
37.9% Display P3 (Argyll 3D)
Gamma: 2.56
CCT: 6759 K
| HP ProBook 450 G7 8WC04UT LG Philips LGD062E, IPS, 15.6", 1920x1080 | HP ProBook 455 G7-175W8EA AUO, B156HW02, IPS, 15.6", 1920x1080 | MSI Modern 15 A10RB Chi Mei N156HCE-EN1, IPS, 15.6", 1920x1080 | Dell Latitude 15 3590 BOE0802 / NT15N41 / Dell: M9P74, TN LED, 15.6", 1920x1080 | Lenovo ThinkPad L590-20Q70019GE N156HCE-EAA, IPS, 15.6", 1920x1080 | Dynabook Tecra X50-F Toshiba TOS508F, IPS, 15.6", 1920x1080 | |
|---|---|---|---|---|---|---|
| Display | 0% | 69% | 5% | 14% | -3% | |
| Display P3 Coverage (%) | 37.9 | 37.92 0% | 66 74% | 39.67 5% | 43.3 14% | 36.68 -3% |
| sRGB Coverage (%) | 56.5 | 57.1 1% | 92.1 63% | 59.7 6% | 64.4 14% | 55 -3% |
| AdobeRGB 1998 Coverage (%) | 39.08 | 39.18 0% | 66.5 70% | 40.99 5% | 44.81 15% | 37.92 -3% |
| Response Times | -1% | -18% | 23% | -12% | 4% | |
| Response Time Grey 50% / Grey 80% * (ms) | 35.2 ? | 41 ? -16% | 43.2 ? -23% | 41 ? -16% | 42.8 ? -22% | 38 ? -8% |
| Response Time Black / White * (ms) | 30.4 ? | 26 ? 14% | 34.4 ? -13% | 12 ? 61% | 30.8 ? -1% | 25.6 ? 16% |
| PWM Frequency (Hz) | 26040 ? | 250 ? | 24510 ? | |||
| Screen | 20% | 41% | -28% | 11% | 3% | |
| Brightness middle (cd/m²) | 259.8 | 282 9% | 289.4 11% | 215 -17% | 247 -5% | 295.9 14% |
| Brightness (cd/m²) | 251 | 264 5% | 273 9% | 214 -15% | 228 -9% | 270 8% |
| Brightness Distribution (%) | 91 | 88 -3% | 82 -10% | 91 0% | 81 -11% | 86 -5% |
| Black Level * (cd/m²) | 0.42 | 0.19 55% | 0.27 36% | 0.385 8% | 0.18 57% | 0.3 29% |
| Contrast (:1) | 619 | 1484 140% | 1072 73% | 558 -10% | 1372 122% | 986 59% |
| Colorchecker dE 2000 * | 6.09 | 5.56 9% | 2.32 62% | 10.31 -69% | 5.9 3% | 6.55 -8% |
| Colorchecker dE 2000 max. * | 16.33 | 19.07 -17% | 5.76 65% | 20.44 -25% | 22.9 -40% | 21.52 -32% |
| Colorchecker dE 2000 calibrated * | 5.2 | 4.5 13% | 2.49 52% | 3.88 25% | 4.7 10% | 5.73 -10% |
| Greyscale dE 2000 * | 3.7 | 3.57 4% | 3 19% | 11.84 -220% | 5.1 -38% | 4.3 -16% |
| Gamma | 2.56 86% | 2.61 84% | 2.22 99% | 2.67 82% | 2.21 100% | 2.475 89% |
| CCT | 6759 96% | 6895 94% | 6867 95% | 13398 49% | 6398 102% | 7002 93% |
| Color Space (Percent of AdobeRGB 1998) (%) | 35.7 | 36 1% | 59.8 68% | 39 9% | 41.2 15% | 35 -2% |
| Color Space (Percent of sRGB) (%) | 56.2 | 57 1% | 92 64% | 61 9% | 64.1 14% | 54 -4% |
| Total Average (Program / Settings) | 6% /
14% | 31% /
39% | 0% /
-15% | 4% /
9% | 1% /
2% |
* ... smaller is better
Color space is narrow at just 36 percent and 56 percent of AdobeRGB and sRGB, respectively, to indicate a budget panel. Most mid-range Ultrabooks these days cover >90 percent of sRGB for noticeably deeper and more vibrant colors. This shouldn't be an issue so long as your workloads don't require accurate colors.
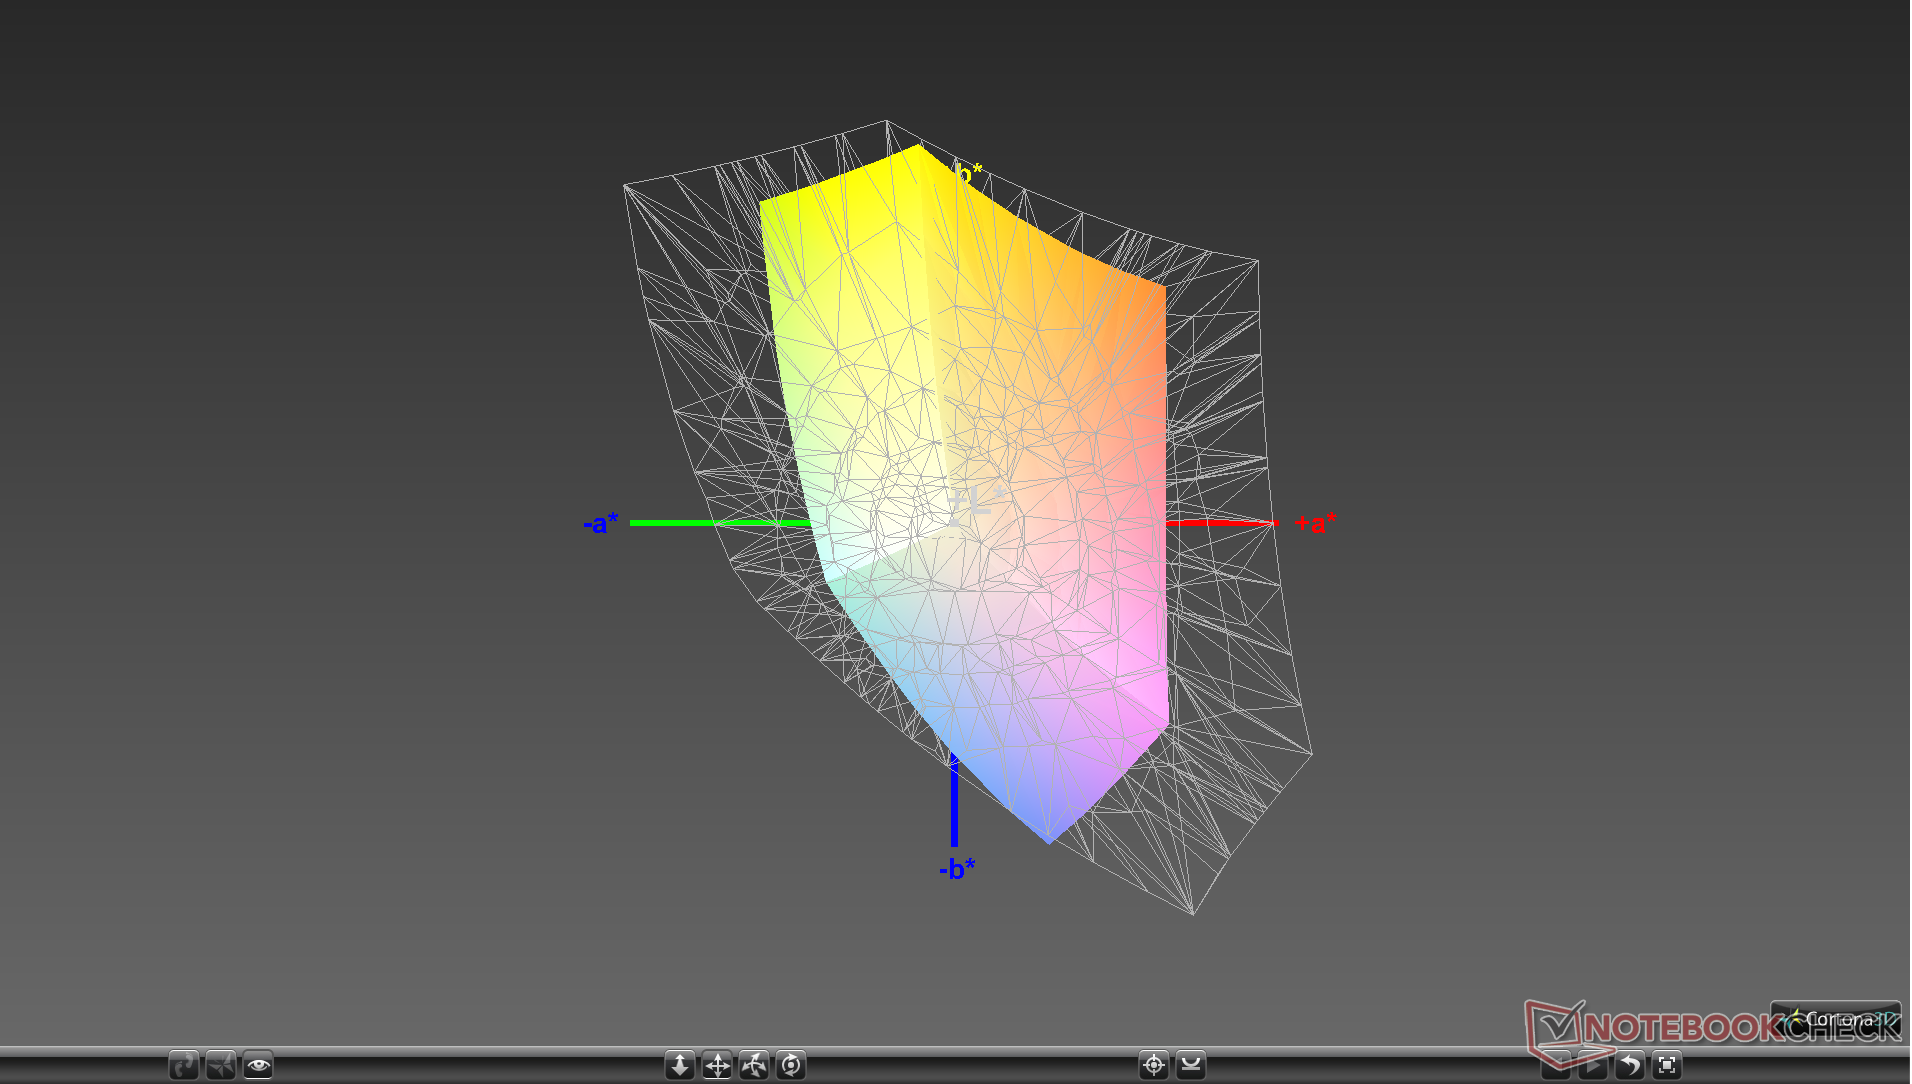
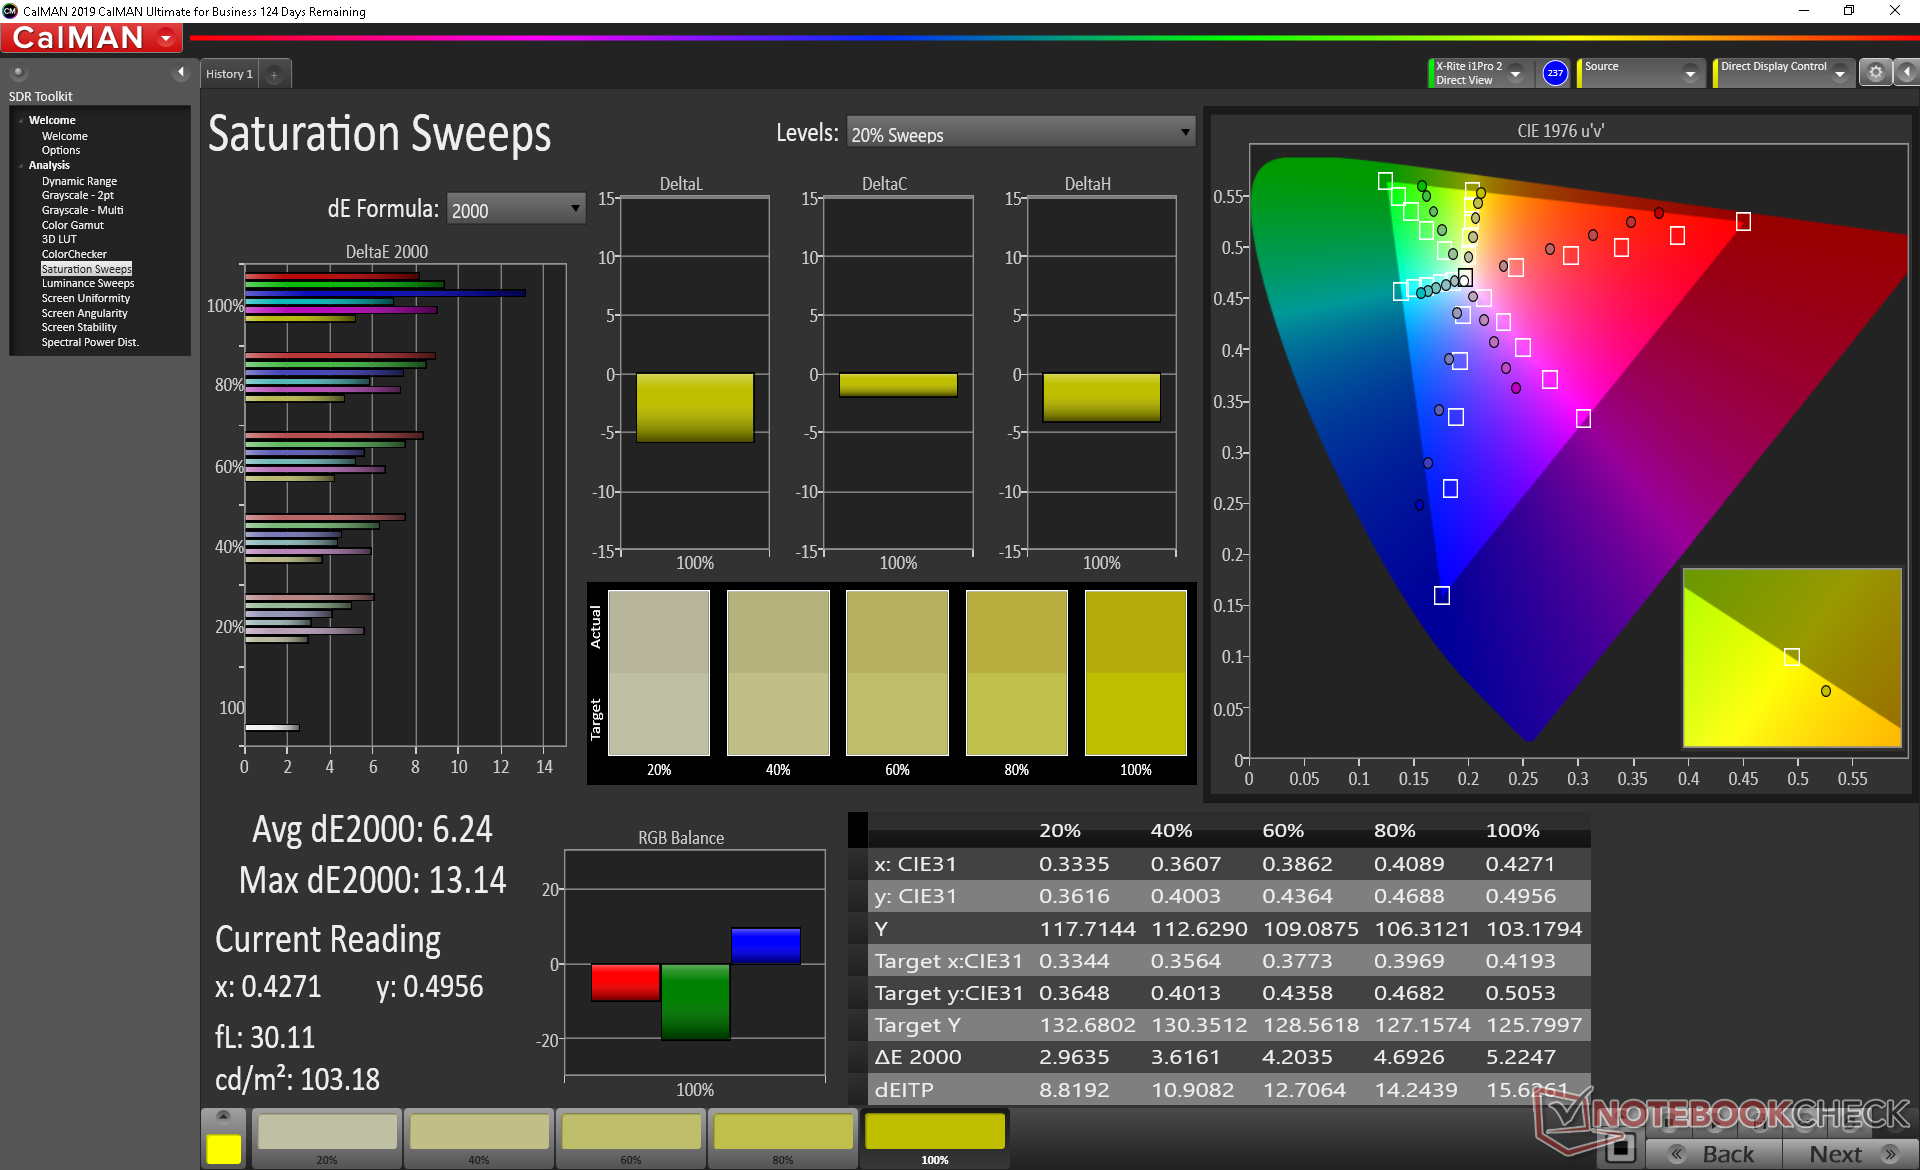
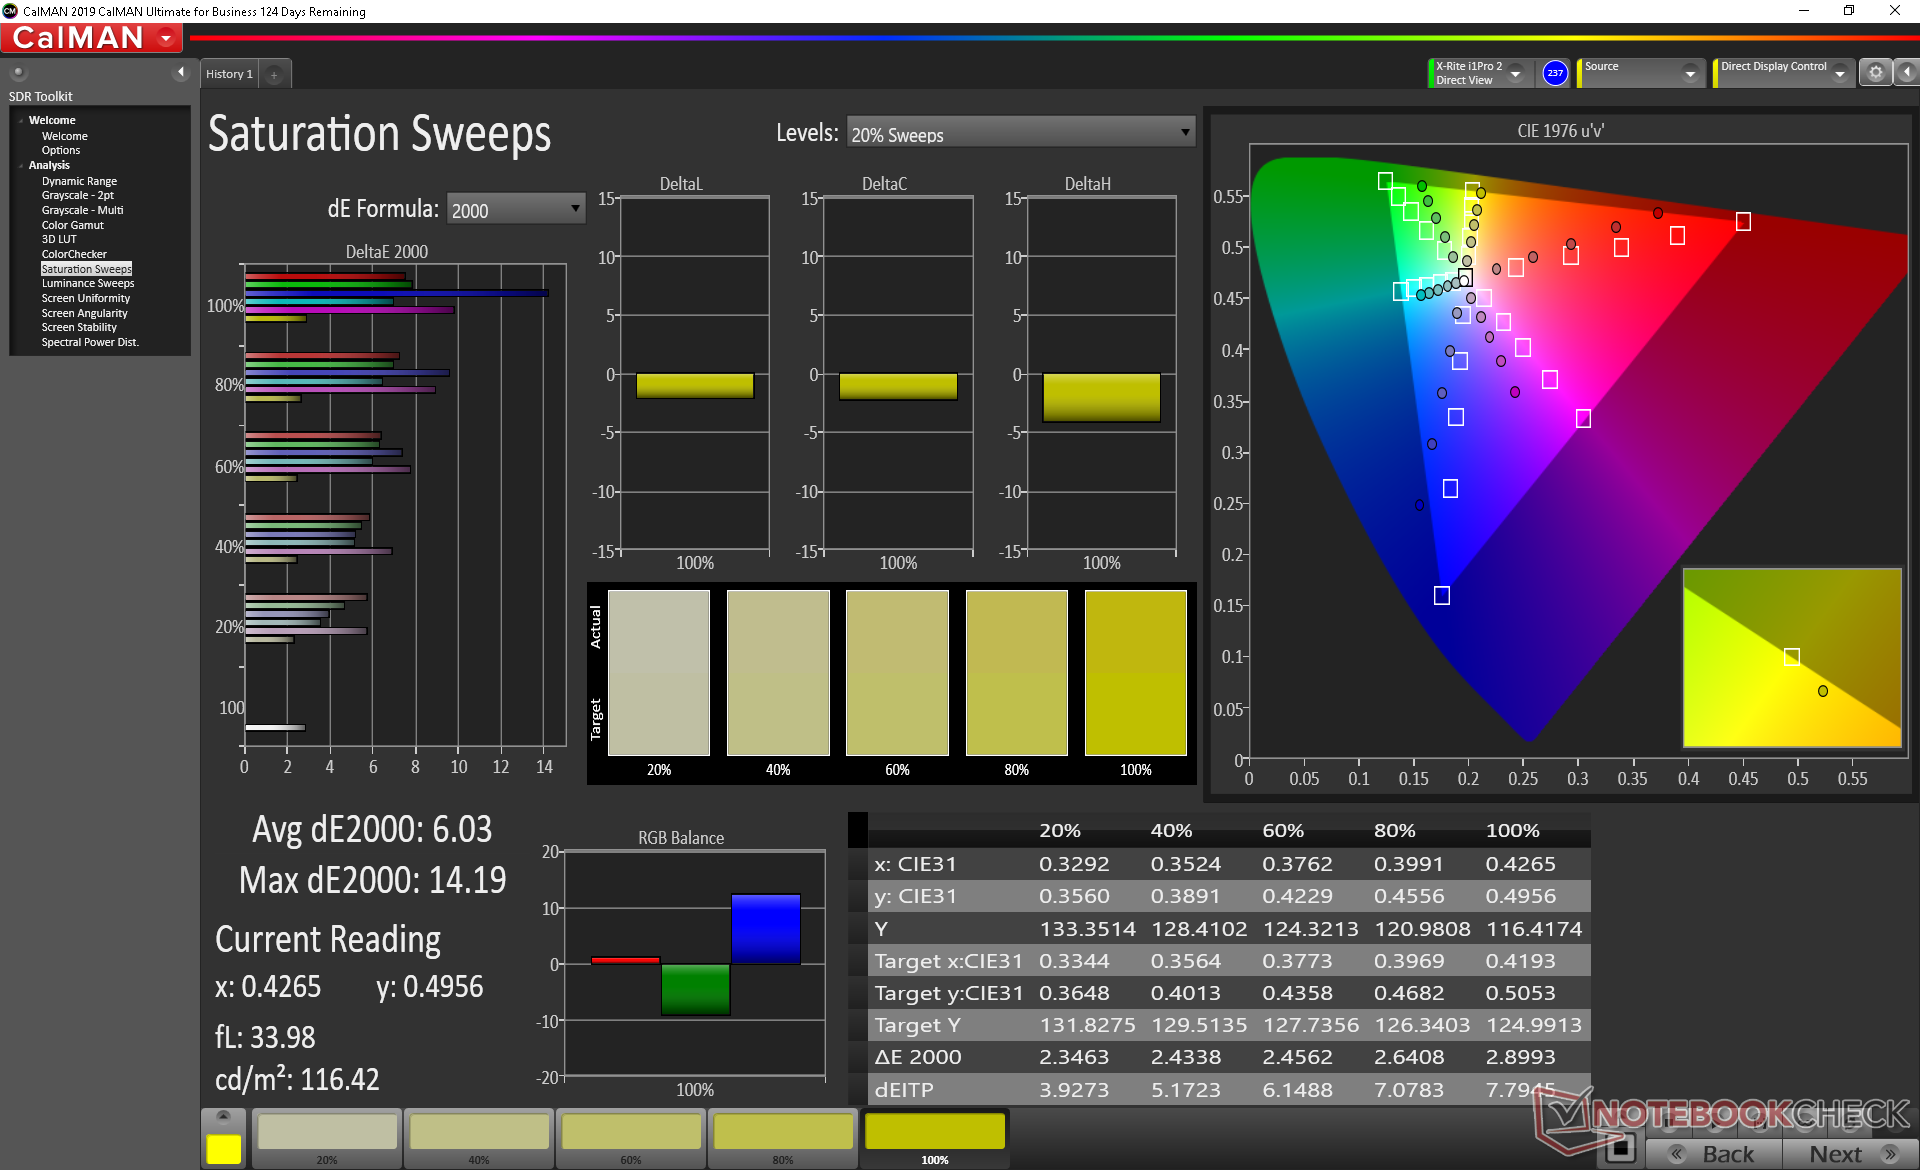
X-Rite colorimeter measurements reveal poor RGB balance out of the box which can fortunately be fixed with an end-user calibration. Colors still becoming increasingly inaccurate the higher the saturation level due to the limited color space mentioned above. Blue in particular is represented less accurately than other colors.
Display Response Times
| ↔ Response Time Black to White | ||
|---|---|---|
| 30.4 ms ... rise ↗ and fall ↘ combined | ↗ 19.6 ms rise | 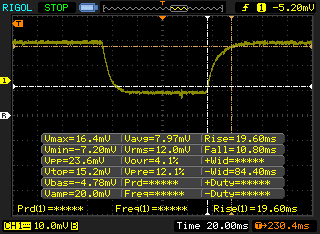 |
| ↘ 10.8 ms fall | ||
| The screen shows slow response rates in our tests and will be unsatisfactory for gamers. In comparison, all tested devices range from 0.1 (minimum) to 240 (maximum) ms. » 82 % of all devices are better. This means that the measured response time is worse than the average of all tested devices (19.9 ms). | ||
| ↔ Response Time 50% Grey to 80% Grey | ||
| 35.2 ms ... rise ↗ and fall ↘ combined | ↗ 19.6 ms rise | 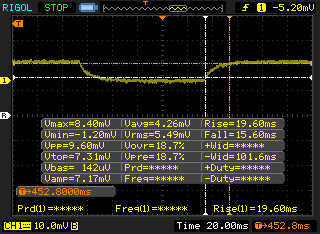 |
| ↘ 15.6 ms fall | ||
| The screen shows slow response rates in our tests and will be unsatisfactory for gamers. In comparison, all tested devices range from 0.165 (minimum) to 636 (maximum) ms. » 49 % of all devices are better. This means that the measured response time is worse than the average of all tested devices (31.1 ms). | ||
Screen Flickering / PWM (Pulse-Width Modulation)
| Screen flickering / PWM not detected | 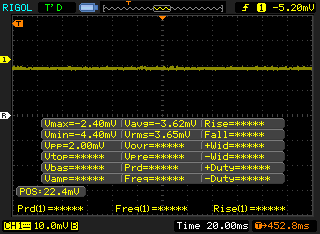 | ||
In comparison: 52 % of all tested devices do not use PWM to dim the display. If PWM was detected, an average of 7818 (minimum: 1.31 - maximum: 343500) Hz was measured. | |||
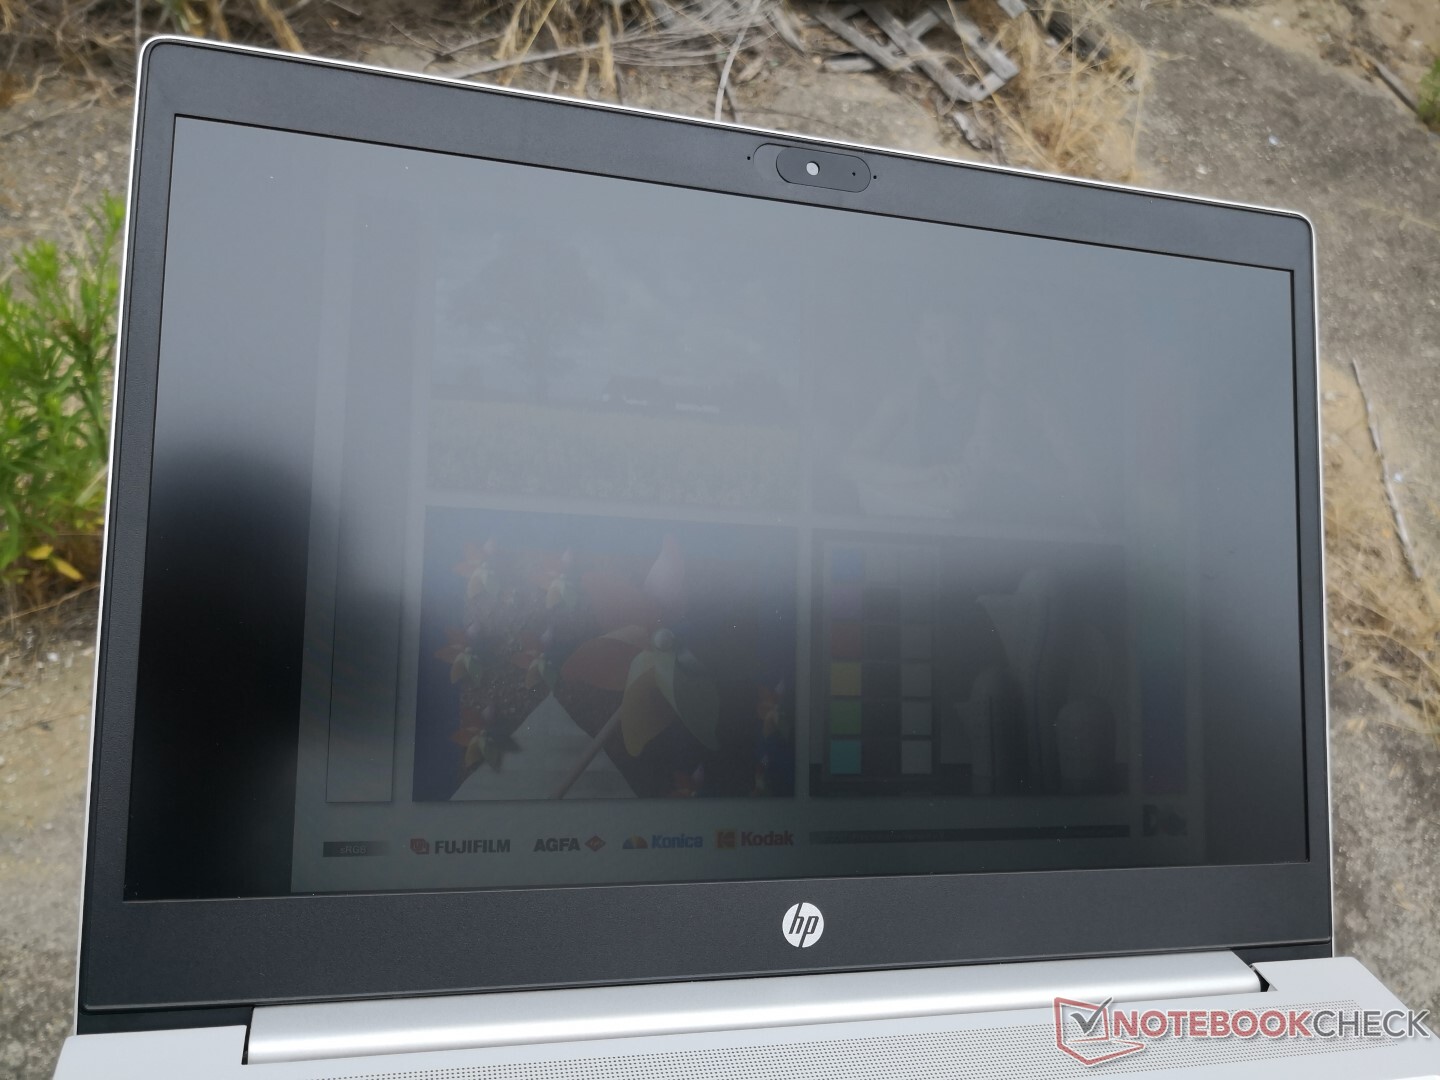
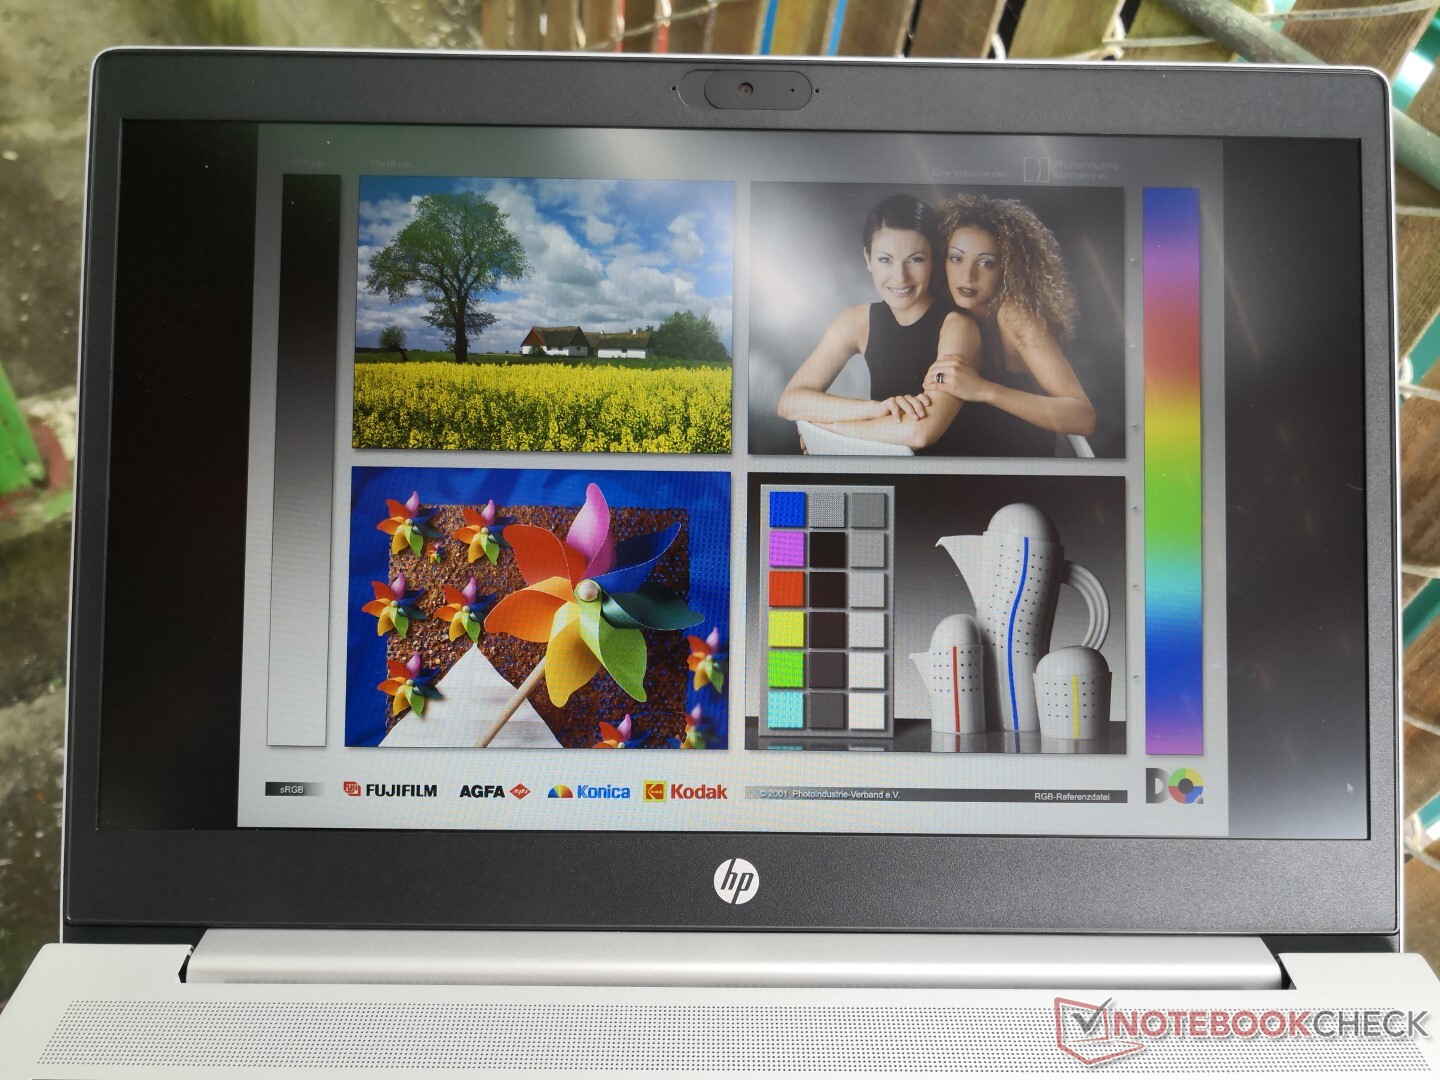
Outdoor visibility is poor due to the low brightness of the backlight. In fact, maximum brightness drops from 259.8 nits to 224.3 nits when running on battery power no matter the Intel Command Center settings. Configure with the 1000-nit panel option if you plan on using this laptop outdoors frequently.

Performance
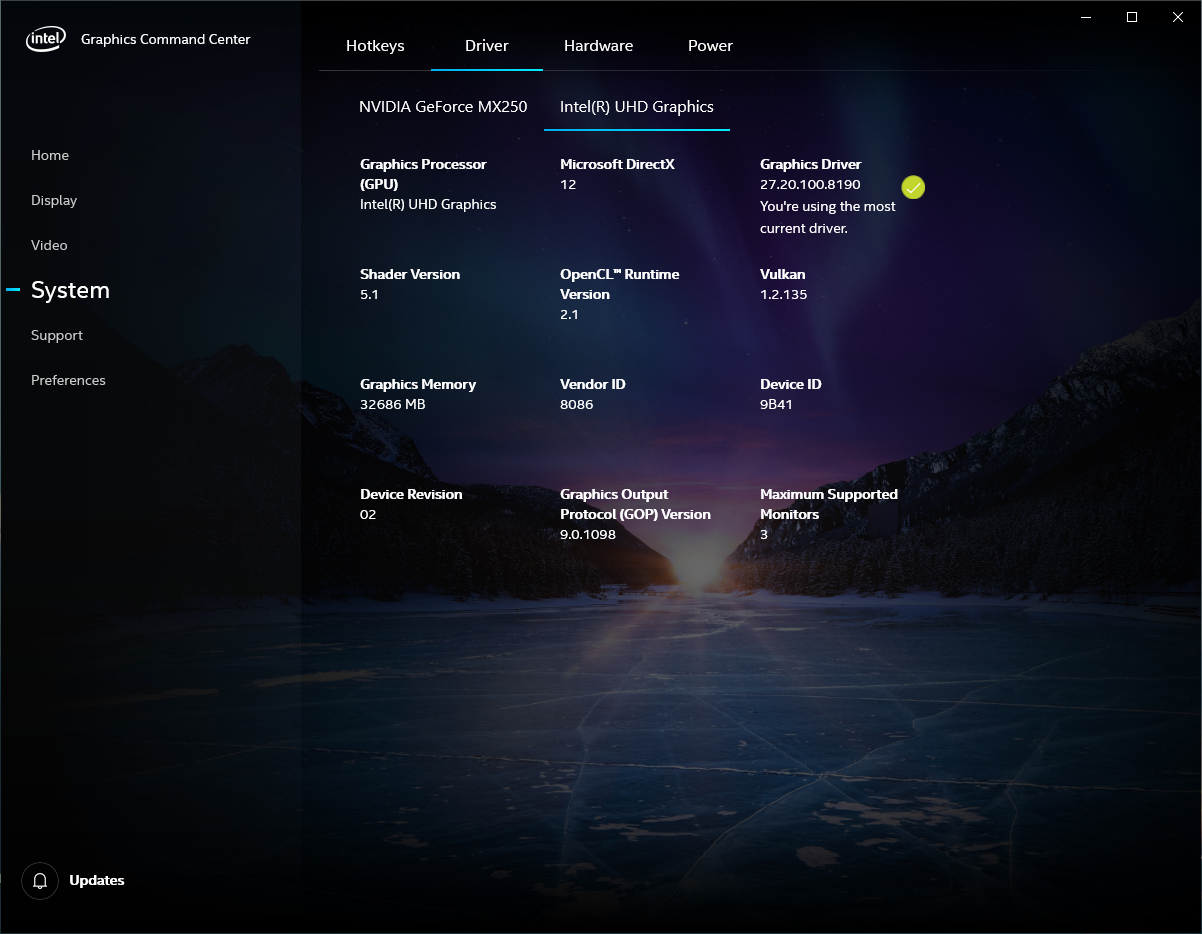
CPU options range from the Core i3-10110U up to the Core i7-10610U with vPro support while GPU options range from the integrated UHD Graphics 620 up to the GeForce MX130 or MX250. These are common processors as found on most Ultrabooks in contrast to the Core-H or GeForce GTX options on high-performance alternatives like the Lenovo ThinkPad X1 Extreme.
Nvidia Optimus comes standard for graphics switching if configured with a GeForce GPU.
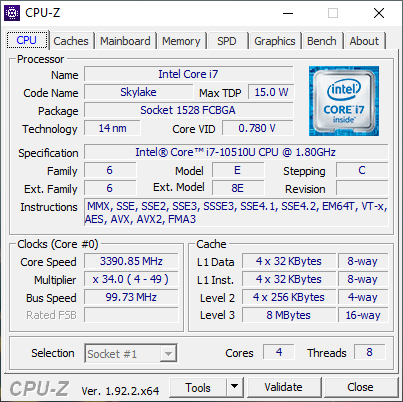
Processor
CPU performance is disappointing at up to 30 percent slower than the average Core i7-10510U in our database. Worse yet, the competing Ryzen 7 4700U in the ProBook 455 G7 is able to offer over two times the raw processor performance even after adjusting for any throttling on both systems. The Core i7-10510U in the ProBook 450 G7 runs more like a cheaper Core i5 instead. We made sure to set our test unit to High Performance mode prior to these tests, but results would not improve.
Cinebench R15: CPU Multi 64Bit | CPU Single 64Bit
Blender: v2.79 BMW27 CPU
7-Zip 18.03: 7z b 4 -mmt1 | 7z b 4
Geekbench 5.5: Single-Core | Multi-Core
HWBOT x265 Benchmark v2.2: 4k Preset
LibreOffice : 20 Documents To PDF
R Benchmark 2.5: Overall mean
| Cinebench R20 / CPU (Multi Core) | |
| HP ProBook 455 G7-175W8EA | |
| MSI Prestige 15 A10SC | |
| Microsoft Surface Laptop 3 15 i7-1065G7 | |
| Lenovo ThinkBook 15 | |
| Average Intel Core i7-10510U (1015 - 1897, n=38) | |
| Lenovo ThinkPad L590-20Q70019GE | |
| Lenovo ThinkPad E590-20NB0012GE | |
| HP ProBook 450 G7 8WC04UT | |
| LG Gram 15Z90N | |
| Lenovo IdeaPad 3 14IIL05 | |
| HP 17-by2437ng | |
| Cinebench R20 / CPU (Single Core) | |
| HP ProBook 455 G7-175W8EA | |
| MSI Prestige 15 A10SC | |
| Microsoft Surface Laptop 3 15 i7-1065G7 | |
| Average Intel Core i7-10510U (362 - 497, n=37) | |
| Lenovo ThinkPad E590-20NB0012GE | |
| Lenovo ThinkBook 15 | |
| Lenovo ThinkPad L590-20Q70019GE | |
| HP 17-by2437ng | |
| HP ProBook 450 G7 8WC04UT | |
| LG Gram 15Z90N | |
| Lenovo IdeaPad 3 14IIL05 | |
| Cinebench R15 / CPU Single 64Bit | |
| MSI Prestige 15 A10SC | |
| Microsoft Surface Laptop 3 15 i7-1065G7 | |
| Lenovo ThinkPad E590-20NB0012GE | |
| HP ProBook 455 G7-175W8EA | |
| Average Intel Core i7-10510U (113 - 202, n=42) | |
| Lenovo ThinkBook 15 | |
| Lenovo ThinkPad L590-20Q70019GE | |
| HP 17-by2437ng | |
| Lenovo IdeaPad 3 14IIL05 | |
| LG Gram 15Z90N | |
| HP ProBook 450 G7 8WC04UT | |
| Blender / v2.79 BMW27 CPU | |
| HP 17-by2437ng | |
| Lenovo IdeaPad 3 14IIL05 | |
| LG Gram 15Z90N | |
| HP ProBook 450 G7 8WC04UT | |
| Lenovo ThinkPad L590-20Q70019GE | |
| Lenovo ThinkPad E590-20NB0012GE | |
| Average Intel Core i7-10510U (628 - 1051, n=31) | |
| Lenovo ThinkBook 15 | |
| HP ProBook 455 G7-175W8EA | |
| 7-Zip 18.03 / 7z b 4 -mmt1 | |
| Lenovo ThinkPad E590-20NB0012GE | |
| Average Intel Core i7-10510U (3747 - 4981, n=31) | |
| HP 17-by2437ng | |
| HP ProBook 455 G7-175W8EA | |
| Lenovo ThinkBook 15 | |
| LG Gram 15Z90N | |
| Lenovo IdeaPad 3 14IIL05 | |
| HP ProBook 450 G7 8WC04UT | |
| Lenovo ThinkPad L590-20Q70019GE | |
| 7-Zip 18.03 / 7z b 4 | |
| HP ProBook 455 G7-175W8EA | |
| Lenovo ThinkBook 15 | |
| Average Intel Core i7-10510U (12196 - 21298, n=31) | |
| Lenovo ThinkPad E590-20NB0012GE | |
| Lenovo ThinkPad L590-20Q70019GE | |
| LG Gram 15Z90N | |
| HP ProBook 450 G7 8WC04UT | |
| Lenovo IdeaPad 3 14IIL05 | |
| HP 17-by2437ng | |
| Geekbench 5.5 / Single-Core | |
| HP ProBook 450 G7 8WC04UT | |
| Average Intel Core i7-10510U (977 - 1287, n=31) | |
| LG Gram 15Z90N | |
| Lenovo IdeaPad 3 14IIL05 | |
| HP ProBook 455 G7-175W8EA | |
| HP 17-by2437ng | |
| Geekbench 5.5 / Multi-Core | |
| HP ProBook 455 G7-175W8EA | |
| Average Intel Core i7-10510U (2474 - 4484, n=31) | |
| HP ProBook 450 G7 8WC04UT | |
| LG Gram 15Z90N | |
| Lenovo IdeaPad 3 14IIL05 | |
| HP 17-by2437ng | |
| HWBOT x265 Benchmark v2.2 / 4k Preset | |
| HP ProBook 455 G7-175W8EA | |
| Lenovo ThinkBook 15 | |
| Average Intel Core i7-10510U (3.41 - 6.04, n=31) | |
| Lenovo ThinkPad E590-20NB0012GE | |
| Lenovo ThinkPad L590-20Q70019GE | |
| Lenovo IdeaPad 3 14IIL05 | |
| HP ProBook 450 G7 8WC04UT | |
| HP 17-by2437ng | |
| LibreOffice / 20 Documents To PDF | |
| HP ProBook 455 G7-175W8EA | |
| HP ProBook 450 G7 8WC04UT | |
| HP 17-by2437ng | |
| Average Intel Core i7-10510U (50.7 - 77.8, n=27) | |
| Lenovo IdeaPad 3 14IIL05 | |
| LG Gram 15Z90N | |
| R Benchmark 2.5 / Overall mean | |
| LG Gram 15Z90N | |
| Lenovo IdeaPad 3 14IIL05 | |
| HP ProBook 450 G7 8WC04UT | |
| HP 17-by2437ng | |
| Average Intel Core i7-10510U (0.637 - 0.81, n=28) | |
| HP ProBook 455 G7-175W8EA | |
* ... smaller is better
System Performance
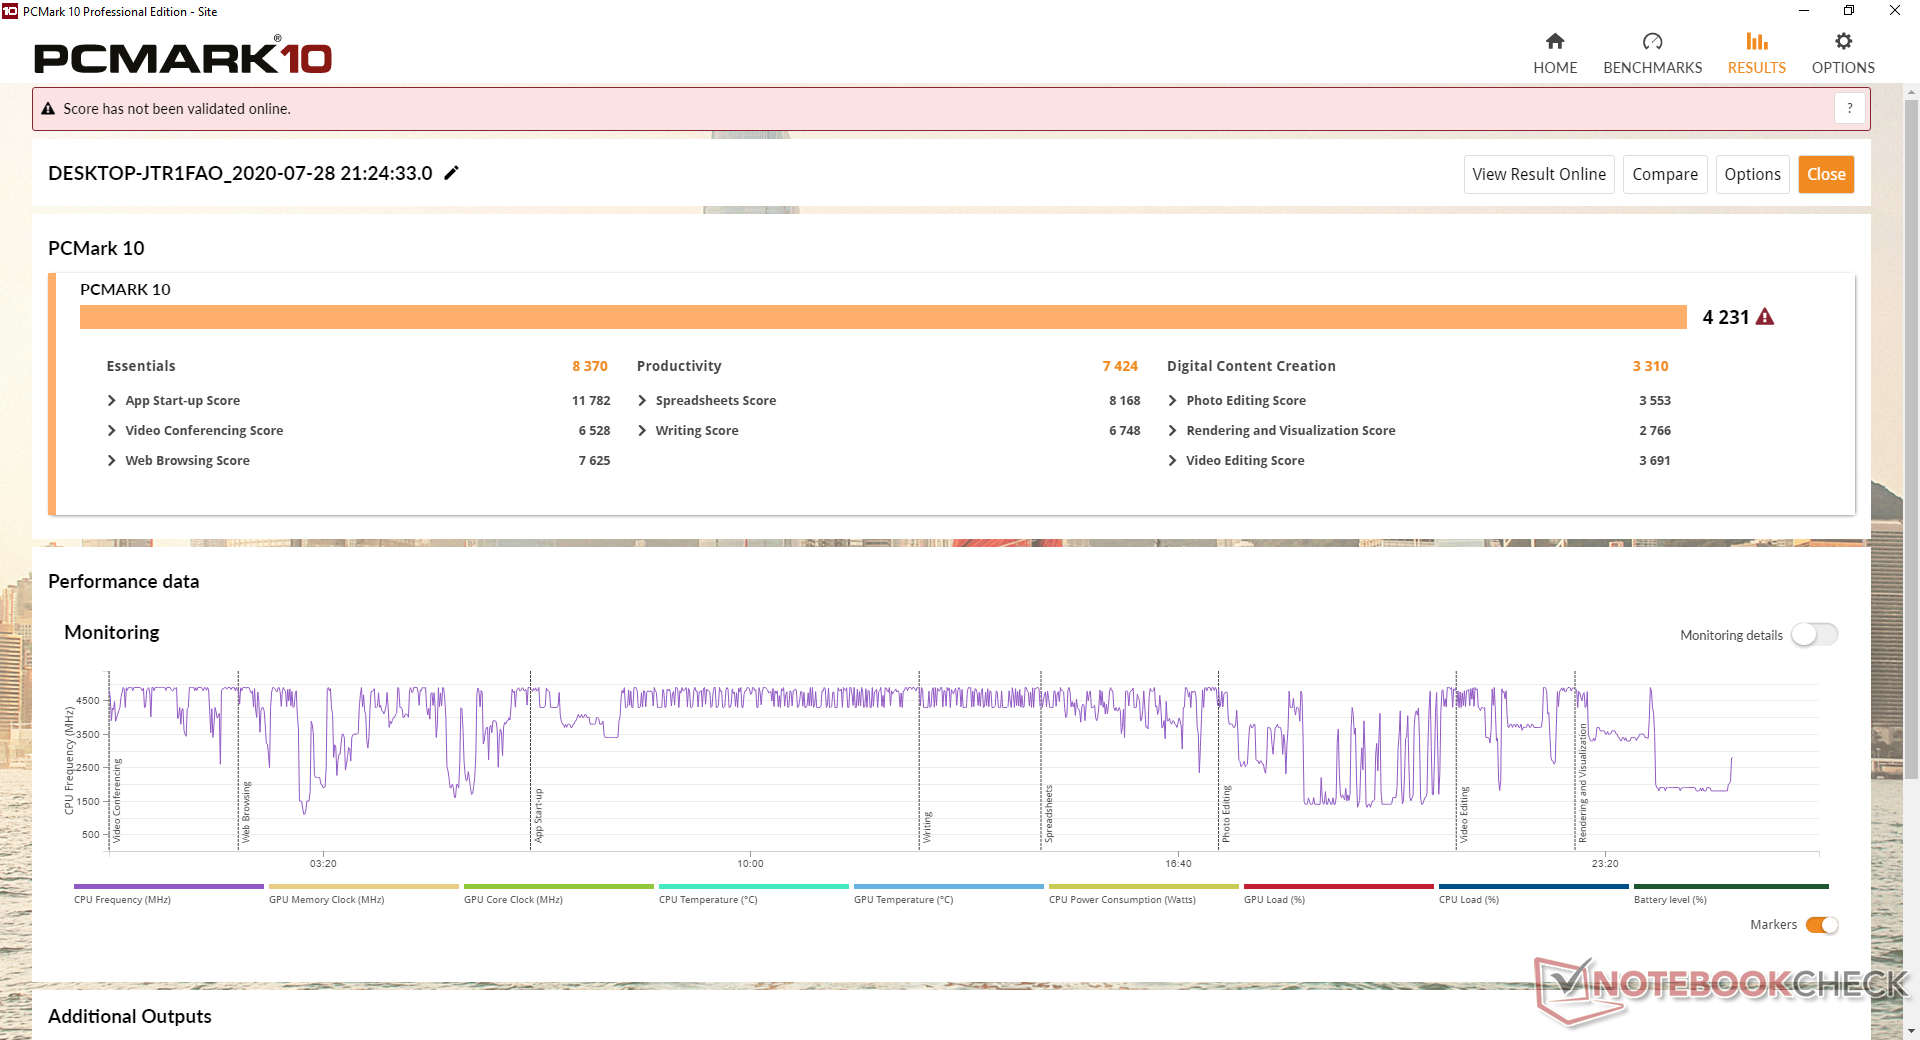
PCMark results are where we expect them to be relative to other laptops with the exact same CPU and GPU despite the slower CPU performance mentioned above. The ProBook 445 G7 is able to outscore our Intel unit in Digital Content Creation likely because PCMark has always been unreliable when it comes to systems with discrete GPUs like our GeForce-powered ProBook.
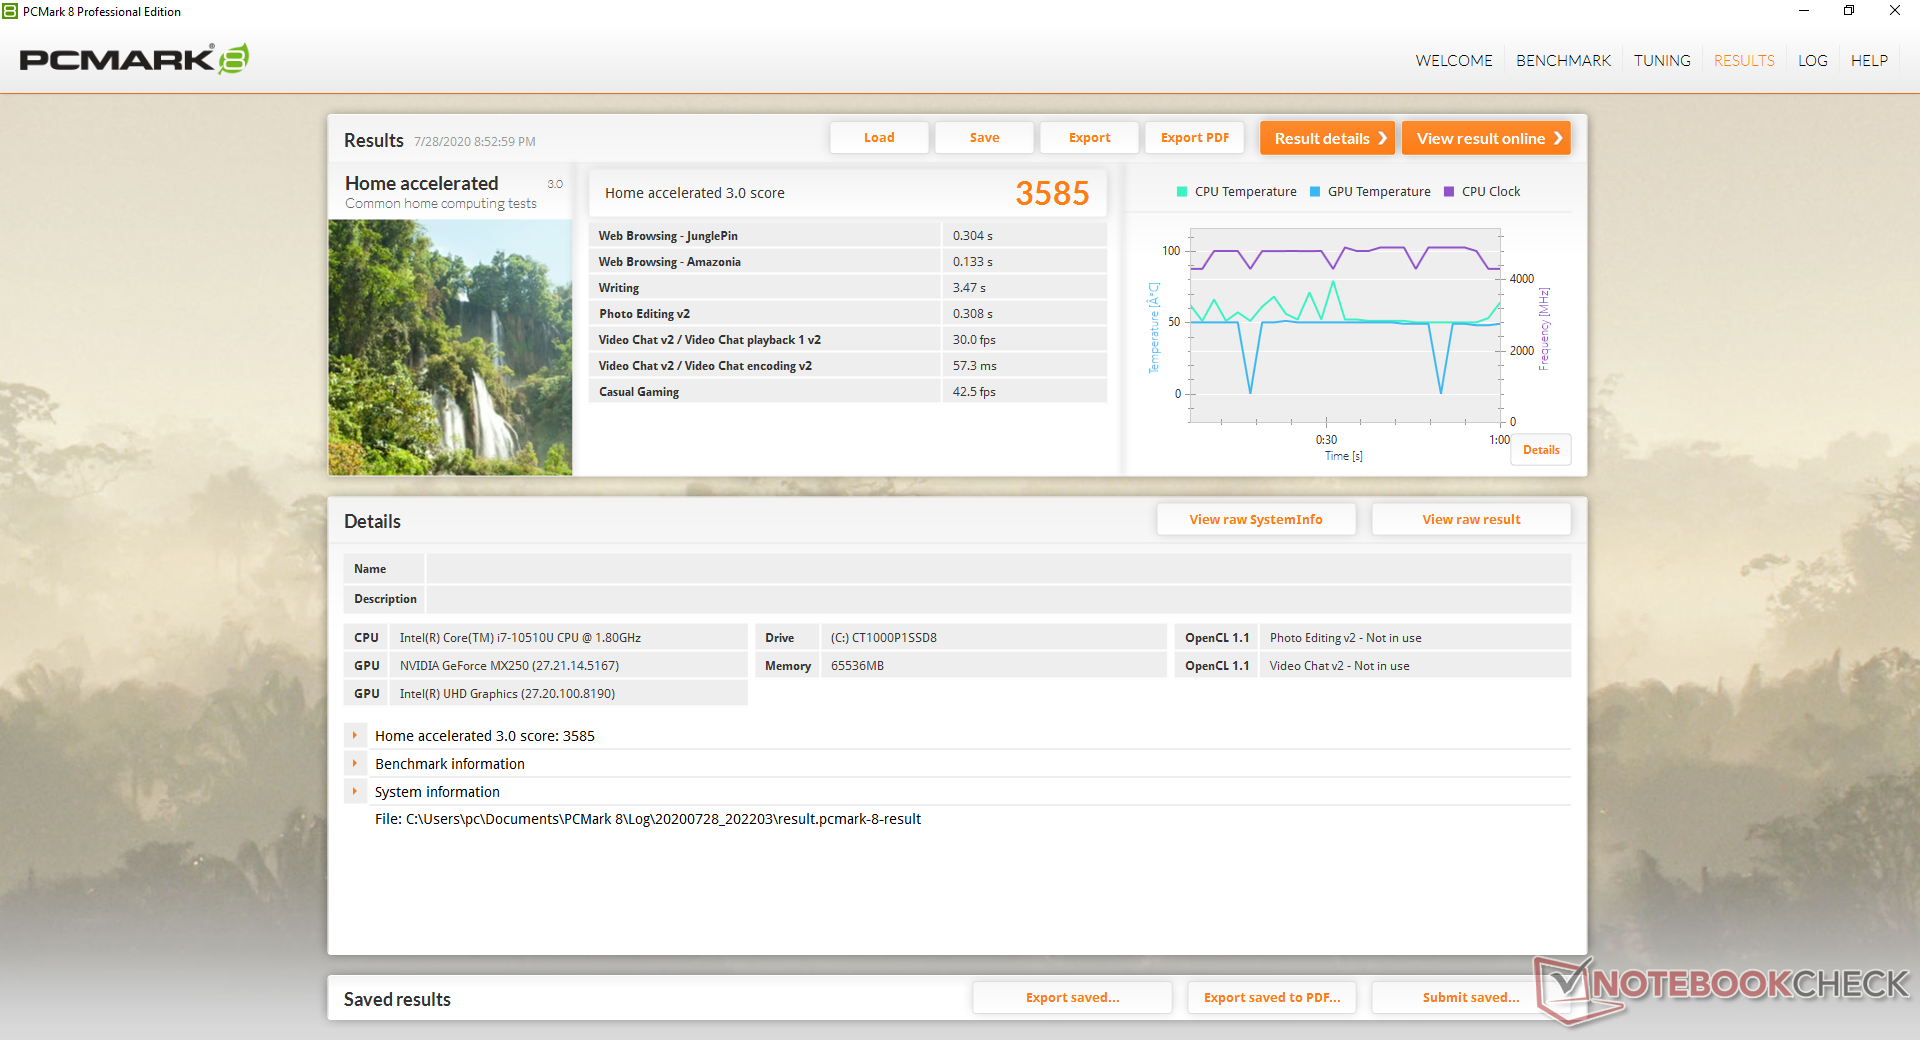
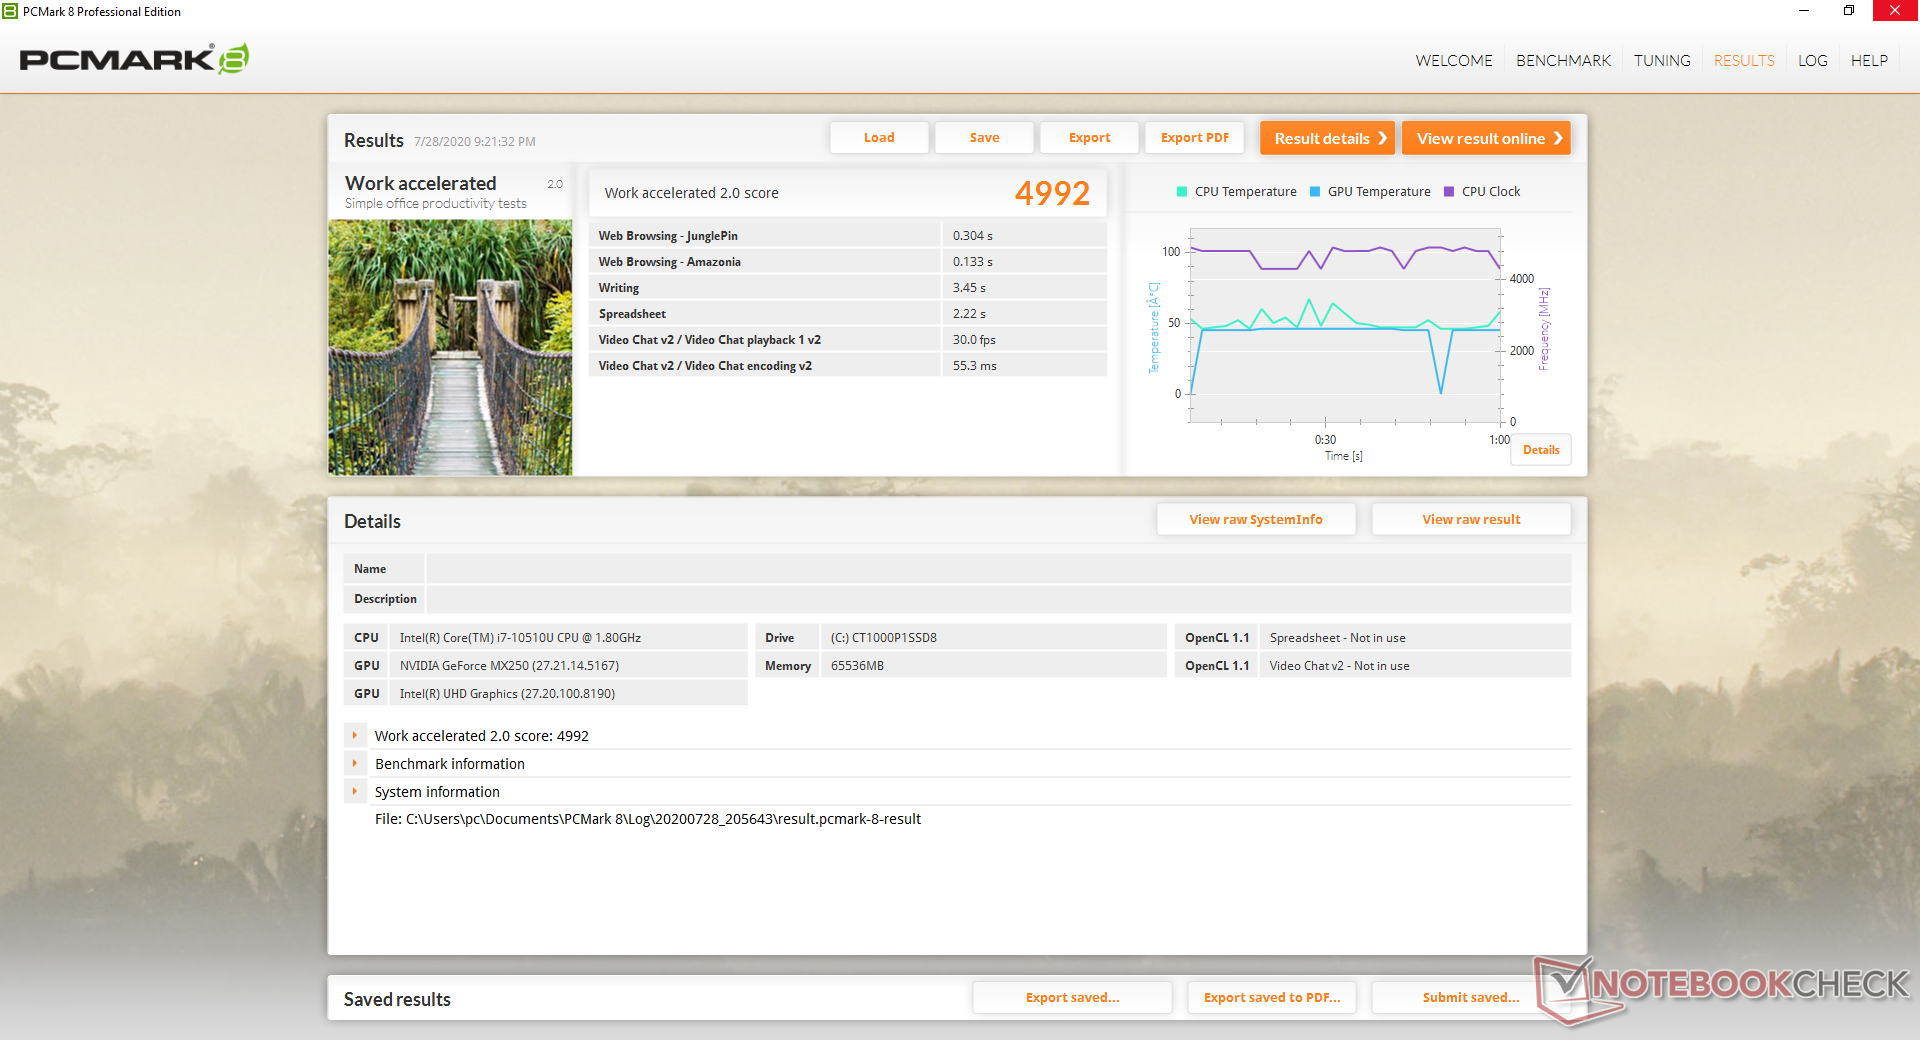
| PCMark 8 Home Score Accelerated v2 | 3585 points | |
| PCMark 8 Work Score Accelerated v2 | 4992 points | |
| PCMark 10 Score | 4231 points | |
Help | ||
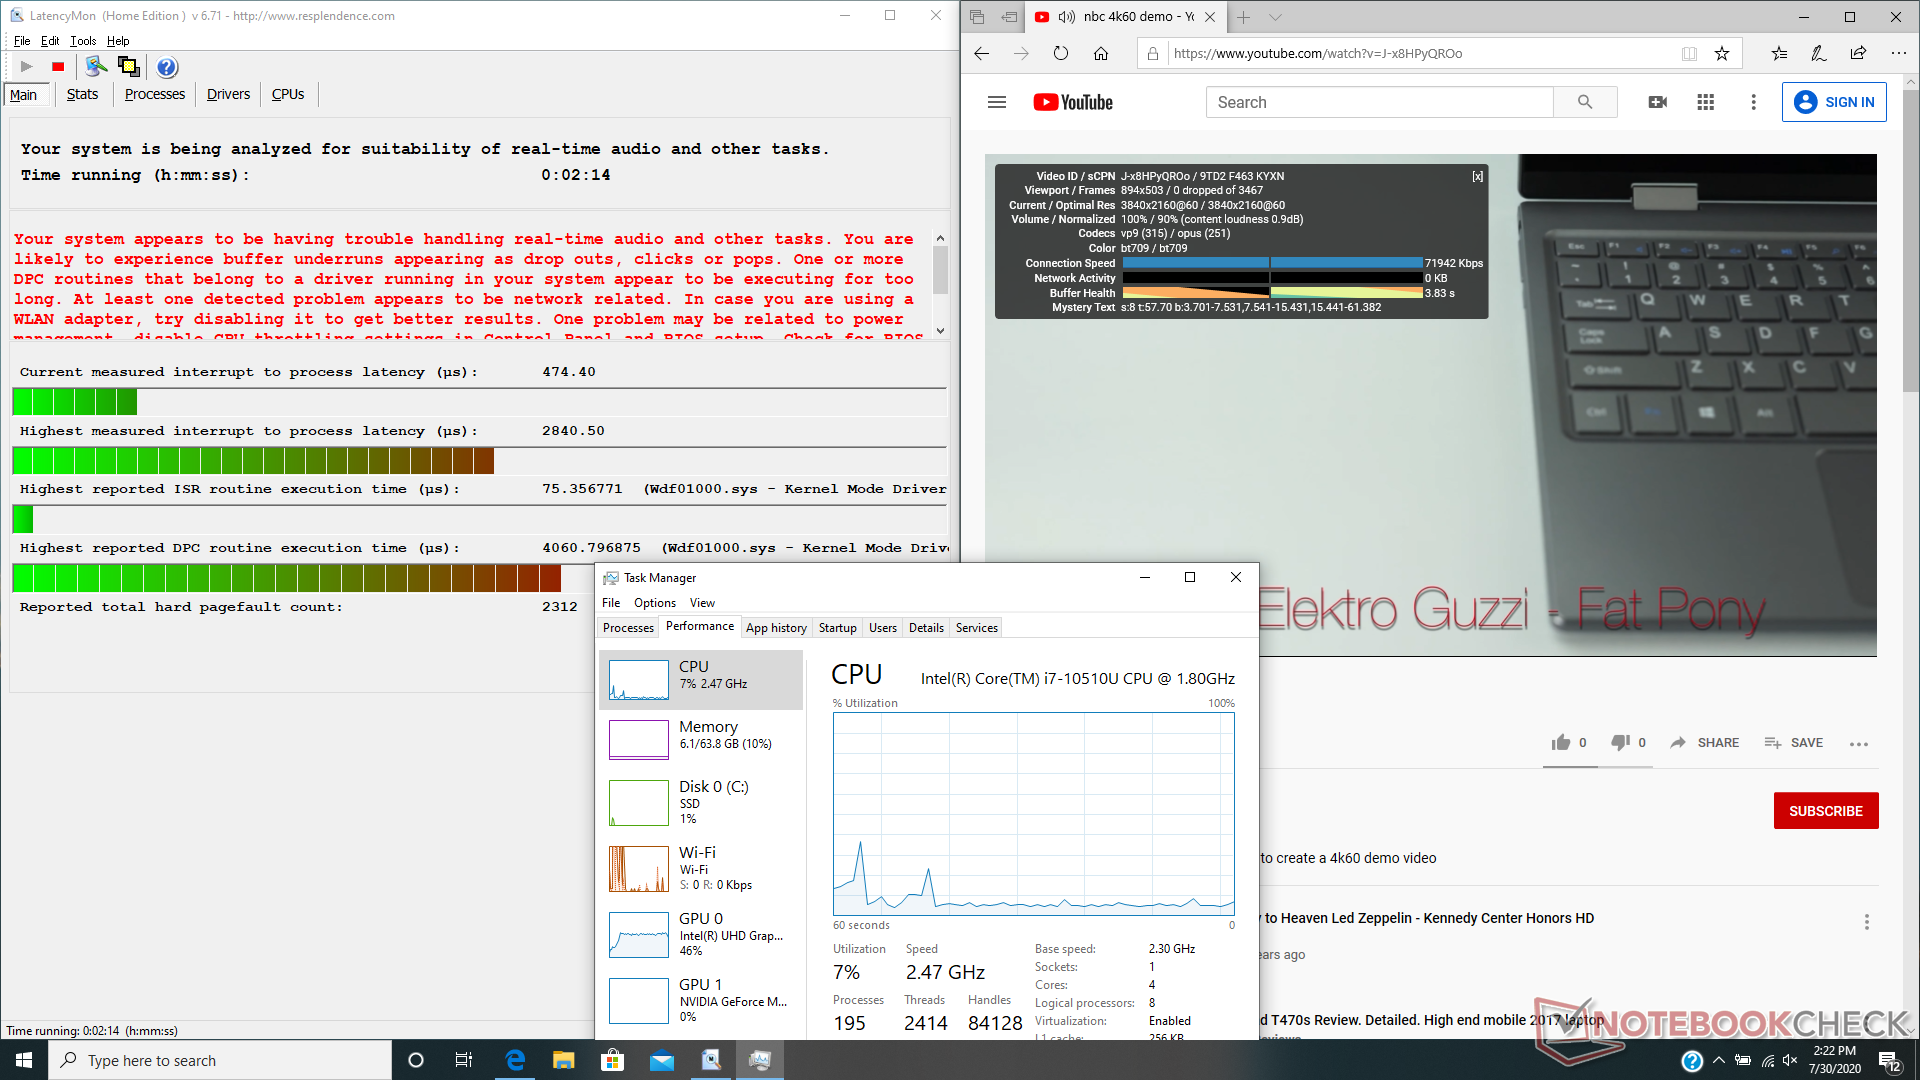
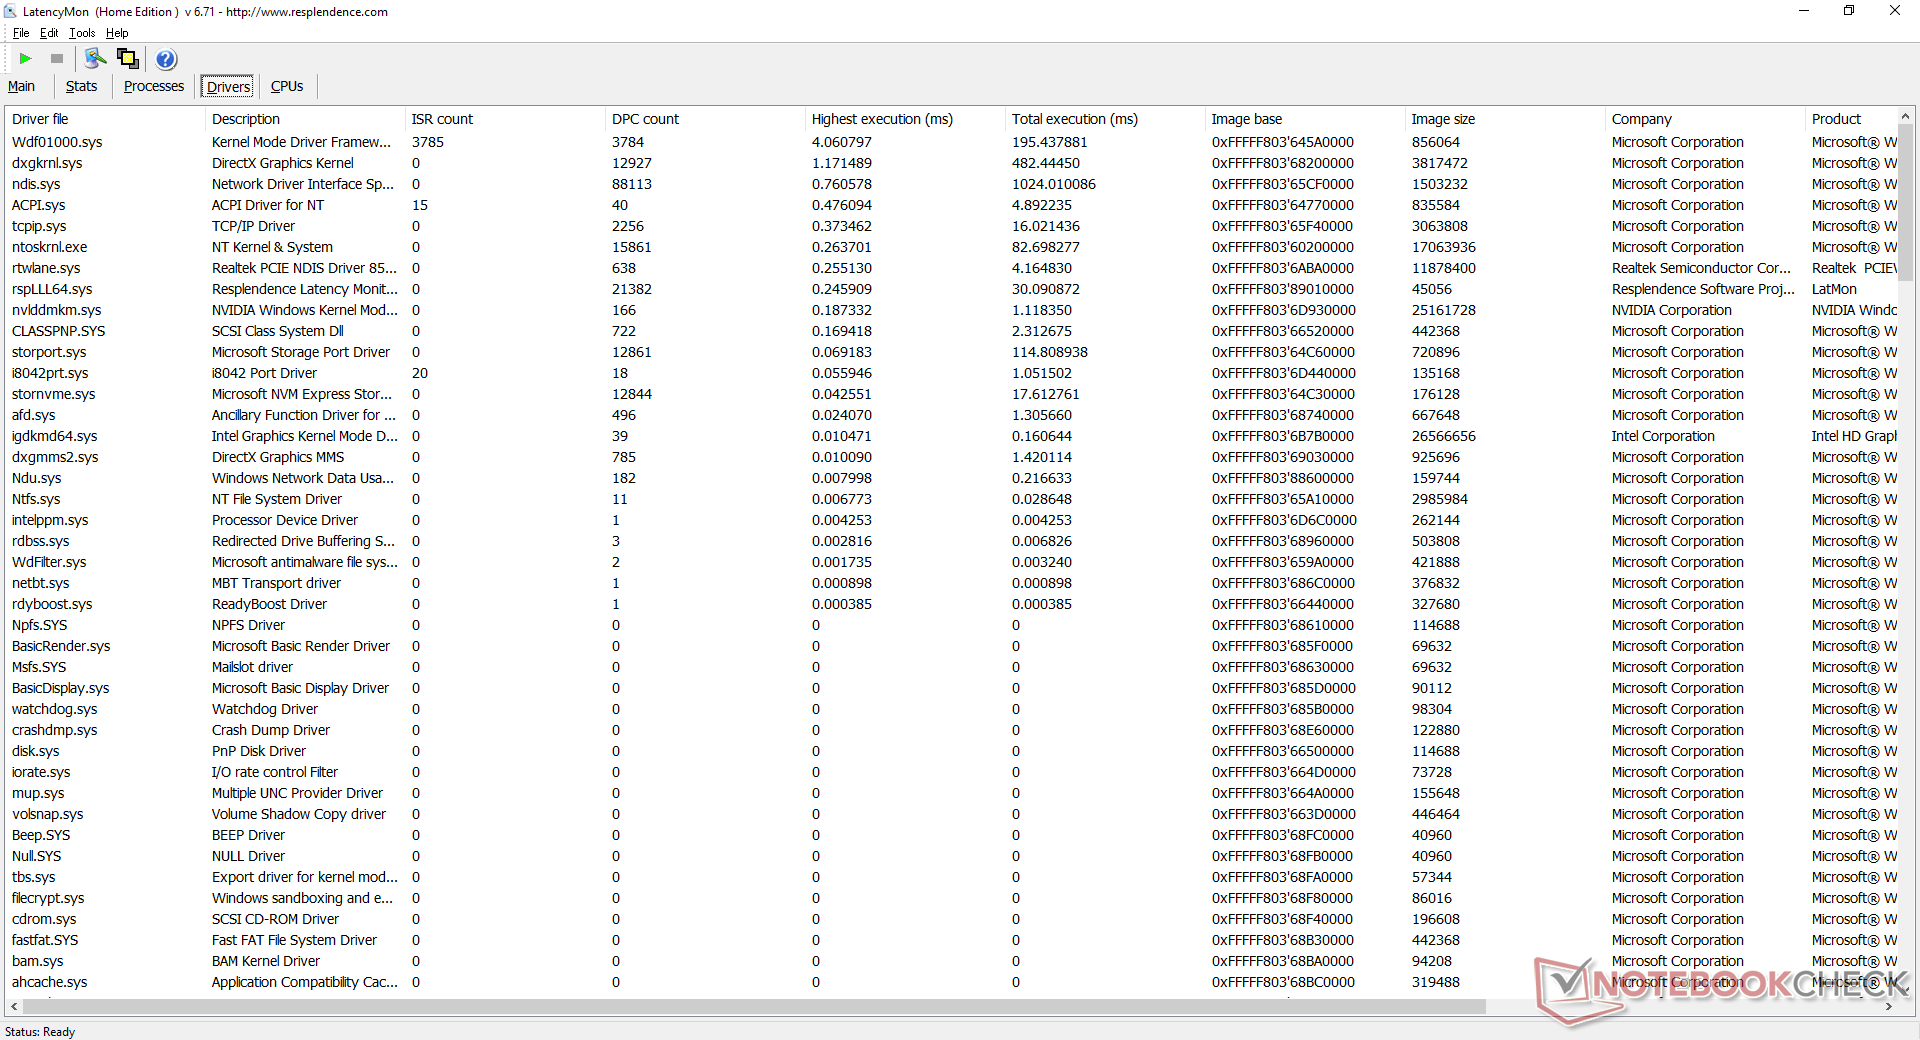
DPC Latency
LatencyMon shows DPC latency issues related to Wdf01000.sys. 4K UHD playback on YouTube is otherwise smooth and with no dropped frames during testing.
| DPC Latencies / LatencyMon - interrupt to process latency (max), Web, Youtube, Prime95 | |
| LG Gram 15Z90N | |
| HP Envy x360 15-dr1679cl | |
| HP ProBook 450 G7 8WC04UT | |
| HP 17-by2437ng | |
| Asus VivoBook 17 S712FA-DS76 | |
| HP ProBook 455 G7-175W8EA | |
| Lenovo IdeaPad 3 14IIL05 | |
* ... smaller is better
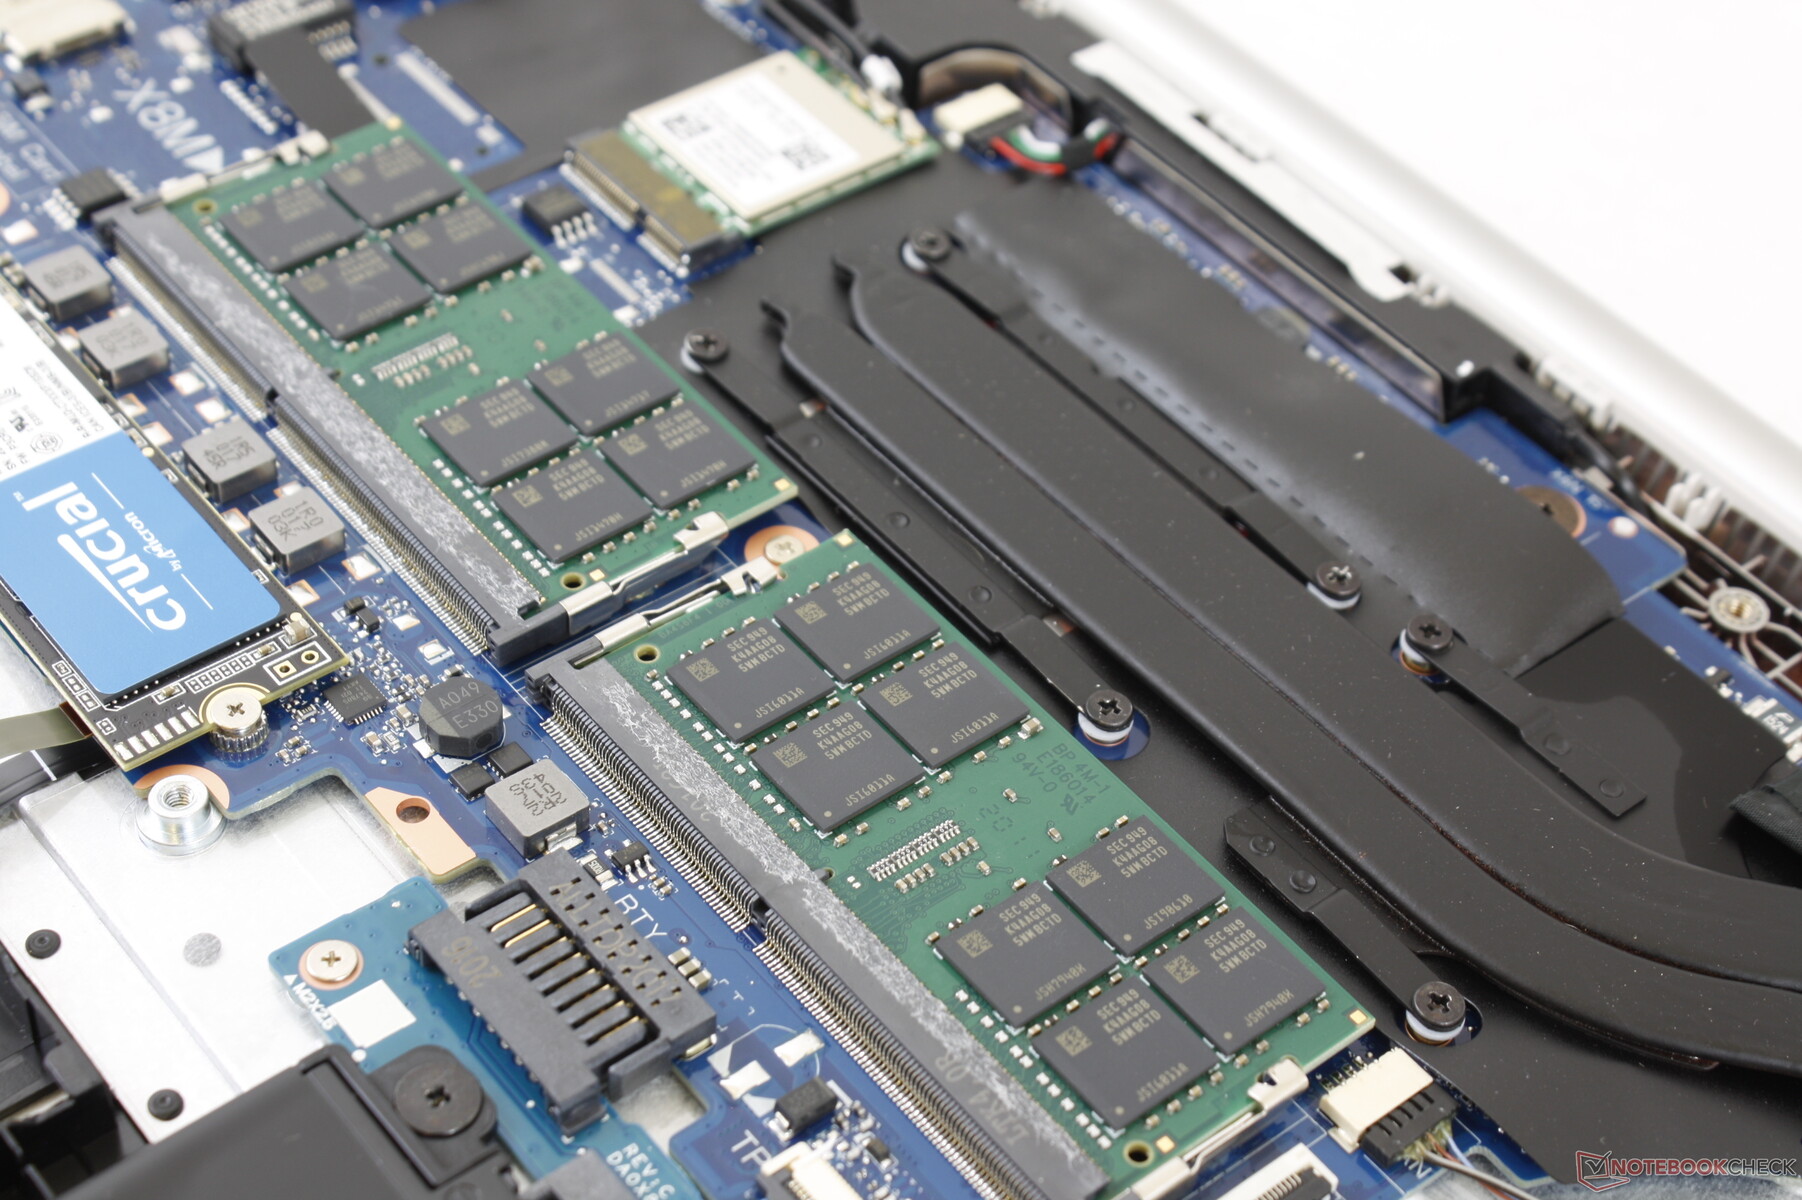
Storage Devices
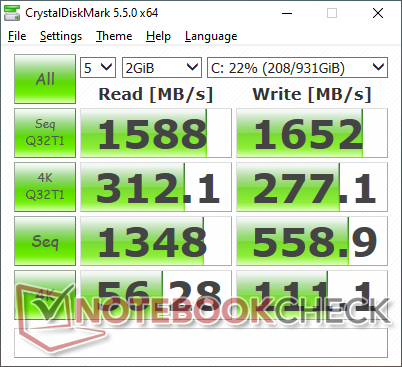
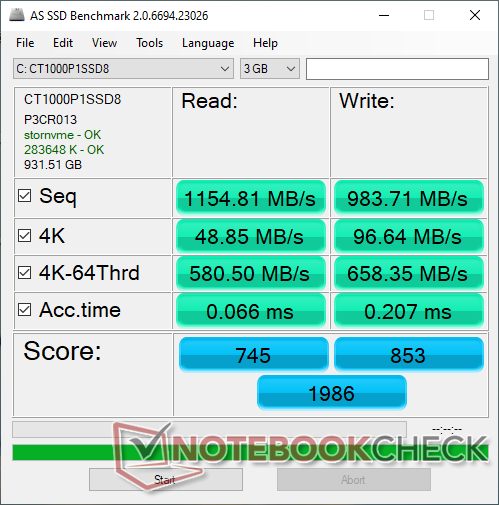
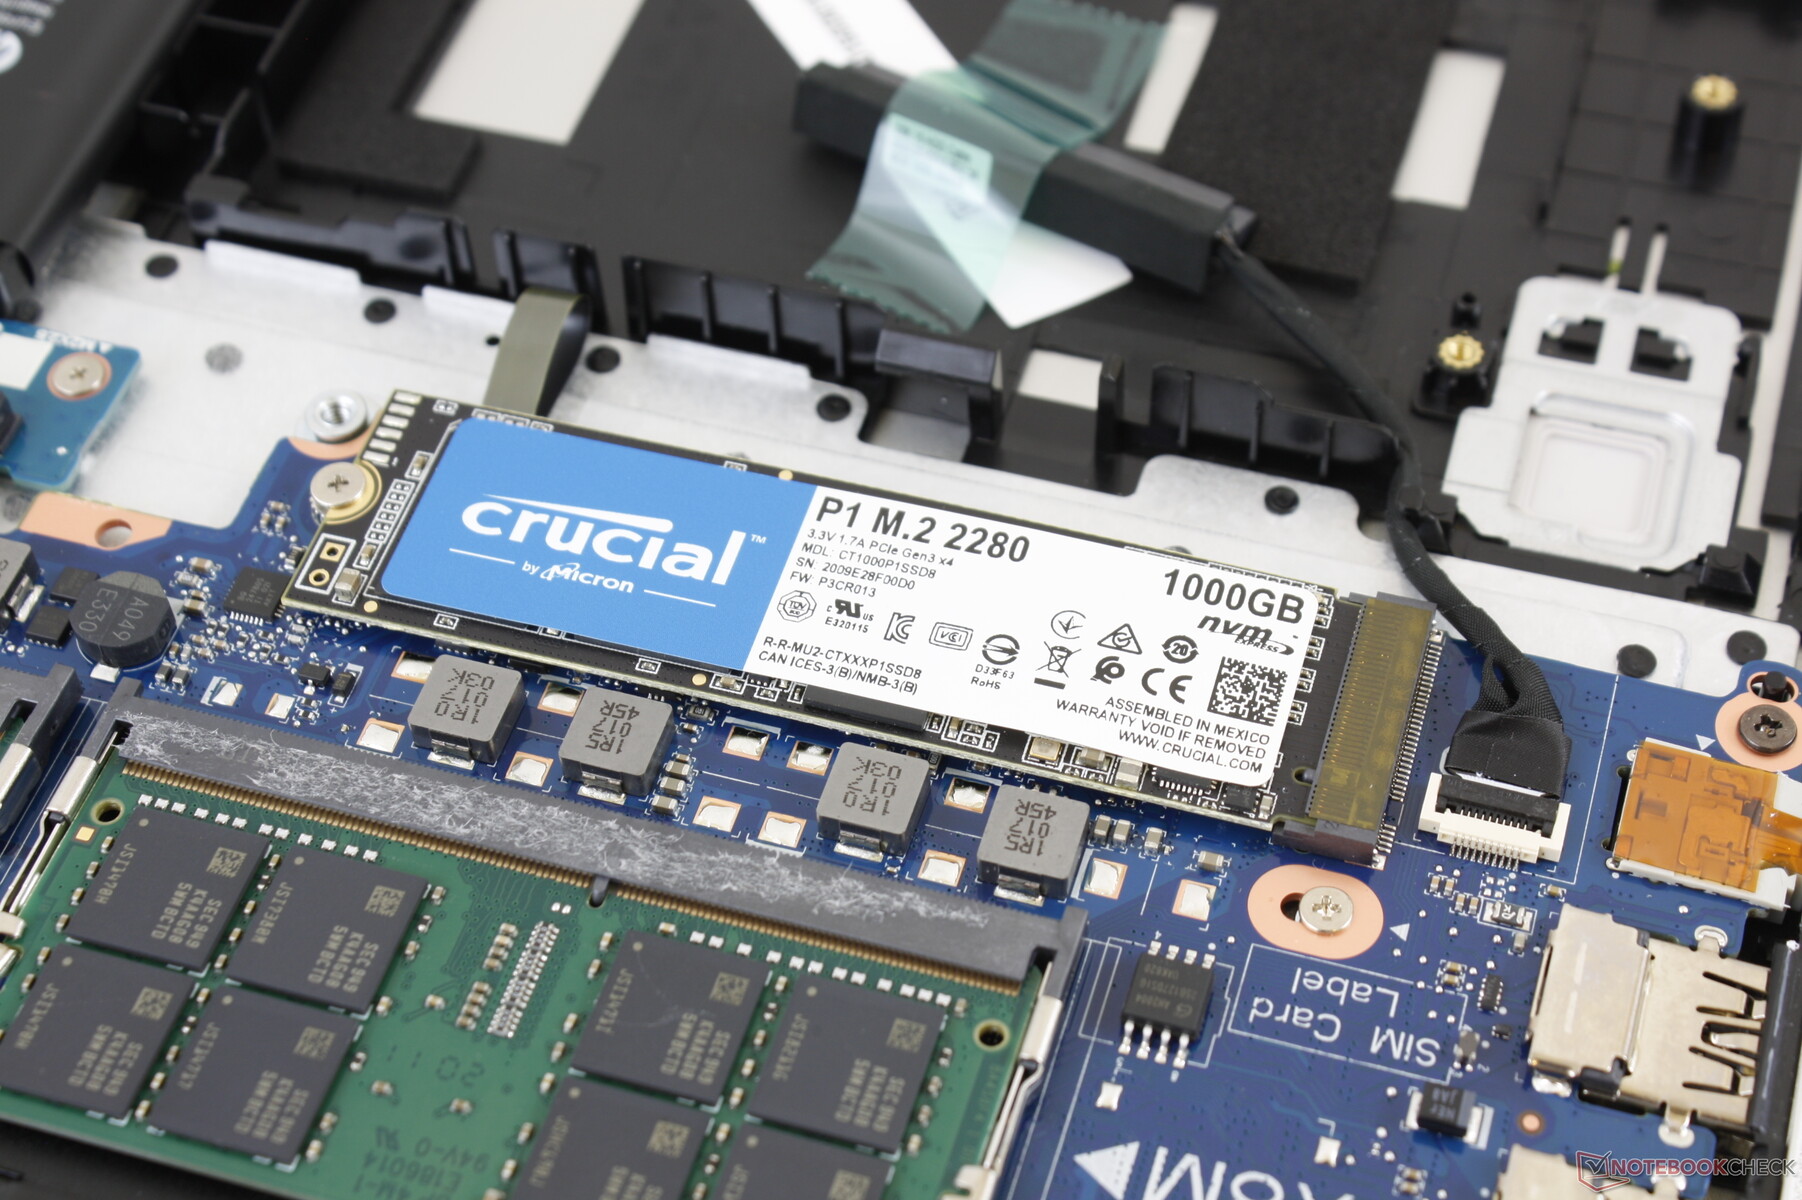
CUKUSA likes to equip a lot of its laptops with the 1 TB Crucial P1 CT1000P1SSD8 SSD which is a mid-range PCIe x4 NVMe drive with theoretical sequential read and write rates of up to 2000 MB/s and 1700 MB/s, respectively. Even so, transfer rates top out at about 1400 to 1600 MB/s on our ProBook even when under optical conditions.
| HP ProBook 450 G7 8WC04UT Crucial P1 SSD CT1000P1SSD8 | HP ProBook 455 G7-175W8EA Samsung PM991 MZVLQ512HALU | MSI Modern 15 A10RB WDC PC SN730 SDBPNTY-512G | Dell Latitude 15 3590 Samsung SSD PM871b MZ7LN256HAJQ | Lenovo ThinkPad L590-20Q70019GE Toshiba XG6 KXG6AZNV512G | Dynabook Tecra X50-F Samsung SSD PM981 MZVLB512HAJQ | |
|---|---|---|---|---|---|---|
| AS SSD | 19% | 113% | -29% | 67% | 31% | |
| Seq Read (MB/s) | 1155 | 1929 67% | 2084 80% | 498.7 -57% | 1383 20% | 1461 26% |
| Seq Write (MB/s) | 984 | 1199 22% | 2442 148% | 361.7 -63% | 852 -13% | 1039 6% |
| 4K Read (MB/s) | 48.85 | 43.9 -10% | 47.52 -3% | 34.65 -29% | 45.72 -6% | 45.98 -6% |
| 4K Write (MB/s) | 96.6 | 116.2 20% | 135.8 41% | 79.8 -17% | 120.2 24% | 125.5 30% |
| 4K-64 Read (MB/s) | 581 | 897 54% | 1043 80% | 372.5 -36% | 1344 131% | 560 -4% |
| 4K-64 Write (MB/s) | 658 | 801 22% | 955 45% | 247.7 -62% | 926 41% | 1162 77% |
| Access Time Read * (ms) | 0.066 | 0.069 -5% | 0.062 6% | 0.06 9% | 0.063 5% | 0.045 32% |
| Access Time Write * (ms) | 0.207 | 0.033 84% | 0.076 63% | 0.042 80% | 0.036 83% | 0.032 85% |
| Score Read (Points) | 745 | 1134 52% | 1299 74% | 457 -39% | 1528 105% | 752 1% |
| Score Write (Points) | 853 | 1037 22% | 1335 57% | 364 -57% | 1132 33% | 1391 63% |
| Score Total (Points) | 1986 | 2723 37% | 3326 67% | 1060 -47% | 3420 72% | 2521 27% |
| Copy ISO MB/s (MB/s) | 2635 | 1409 -47% | 1926 -27% | 1147 -56% | ||
| Copy Program MB/s (MB/s) | 95.1 | 70.2 -26% | 714 651% | 419.8 341% | ||
| Copy Game MB/s (MB/s) | 361.9 | 254.9 -30% | 1425 294% | 928 156% | ||
| CrystalDiskMark 5.2 / 6 | 19% | 108% | -36% | 21% | 10% | |
| Write 4K (MB/s) | 111.1 | 141.9 28% | 208.4 88% | 79.5 -28% | 115.3 4% | 100.1 -10% |
| Read 4K (MB/s) | 56.3 | 37.25 -34% | 51 -9% | 32.72 -42% | 43.34 -23% | 42.4 -25% |
| Write Seq (MB/s) | 559 | 998 79% | 2687 381% | 472.5 -15% | 1014 81% | |
| Read Seq (MB/s) | 1348 | 1233 -9% | 2168 61% | 504 -63% | 1481 10% | |
| Write 4K Q32T1 (MB/s) | 277.1 | 338.4 22% | 489.2 77% | 322.6 16% | 495.4 79% | 245.9 -11% |
| Read 4K Q32T1 (MB/s) | 312.1 | 431.1 38% | 600 92% | 249.9 -20% | 332.6 7% | 230.3 -26% |
| Write Seq Q32T1 (MB/s) | 1652 | 1367 -17% | 2699 63% | 531 -68% | 1654 0% | 1910 16% |
| Read Seq Q32T1 (MB/s) | 1588 | 2355 48% | 3374 112% | 544 -66% | 1746 10% | 3454 118% |
| Write 4K Q8T8 (MB/s) | 877 | 1033 | ||||
| Read 4K Q8T8 (MB/s) | 518 | 892 | ||||
| Total Average (Program / Settings) | 19% /
19% | 111% /
111% | -33% /
-32% | 44% /
50% | 21% /
23% |
* ... smaller is better

Disk Throttling: DiskSpd Read Loop, Queue Depth 8
GPU Performance
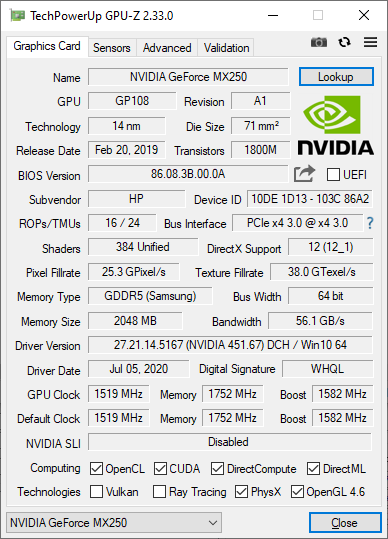
The discrete Nvidia GPU is performing where we expect it to be relative to the average GeForce MX250 in our database. Performance is about 40 to 50 percent faster than the integrated Radeon RX Vega 7 in the ProBook 445 G7 and at least two to three times faster than the aging integrated UHD Graphics 620. However, it's worth noting that our ProBook 445 G7 was running on single-channel RAM only meaning that its RX Vega 7 could perform much closer to the GeForce MX250 if configured with dual-channel RAM.
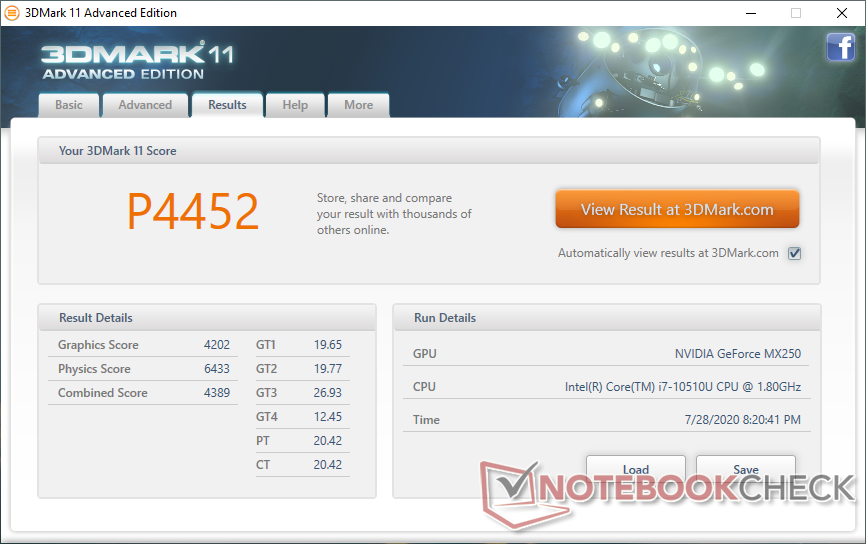
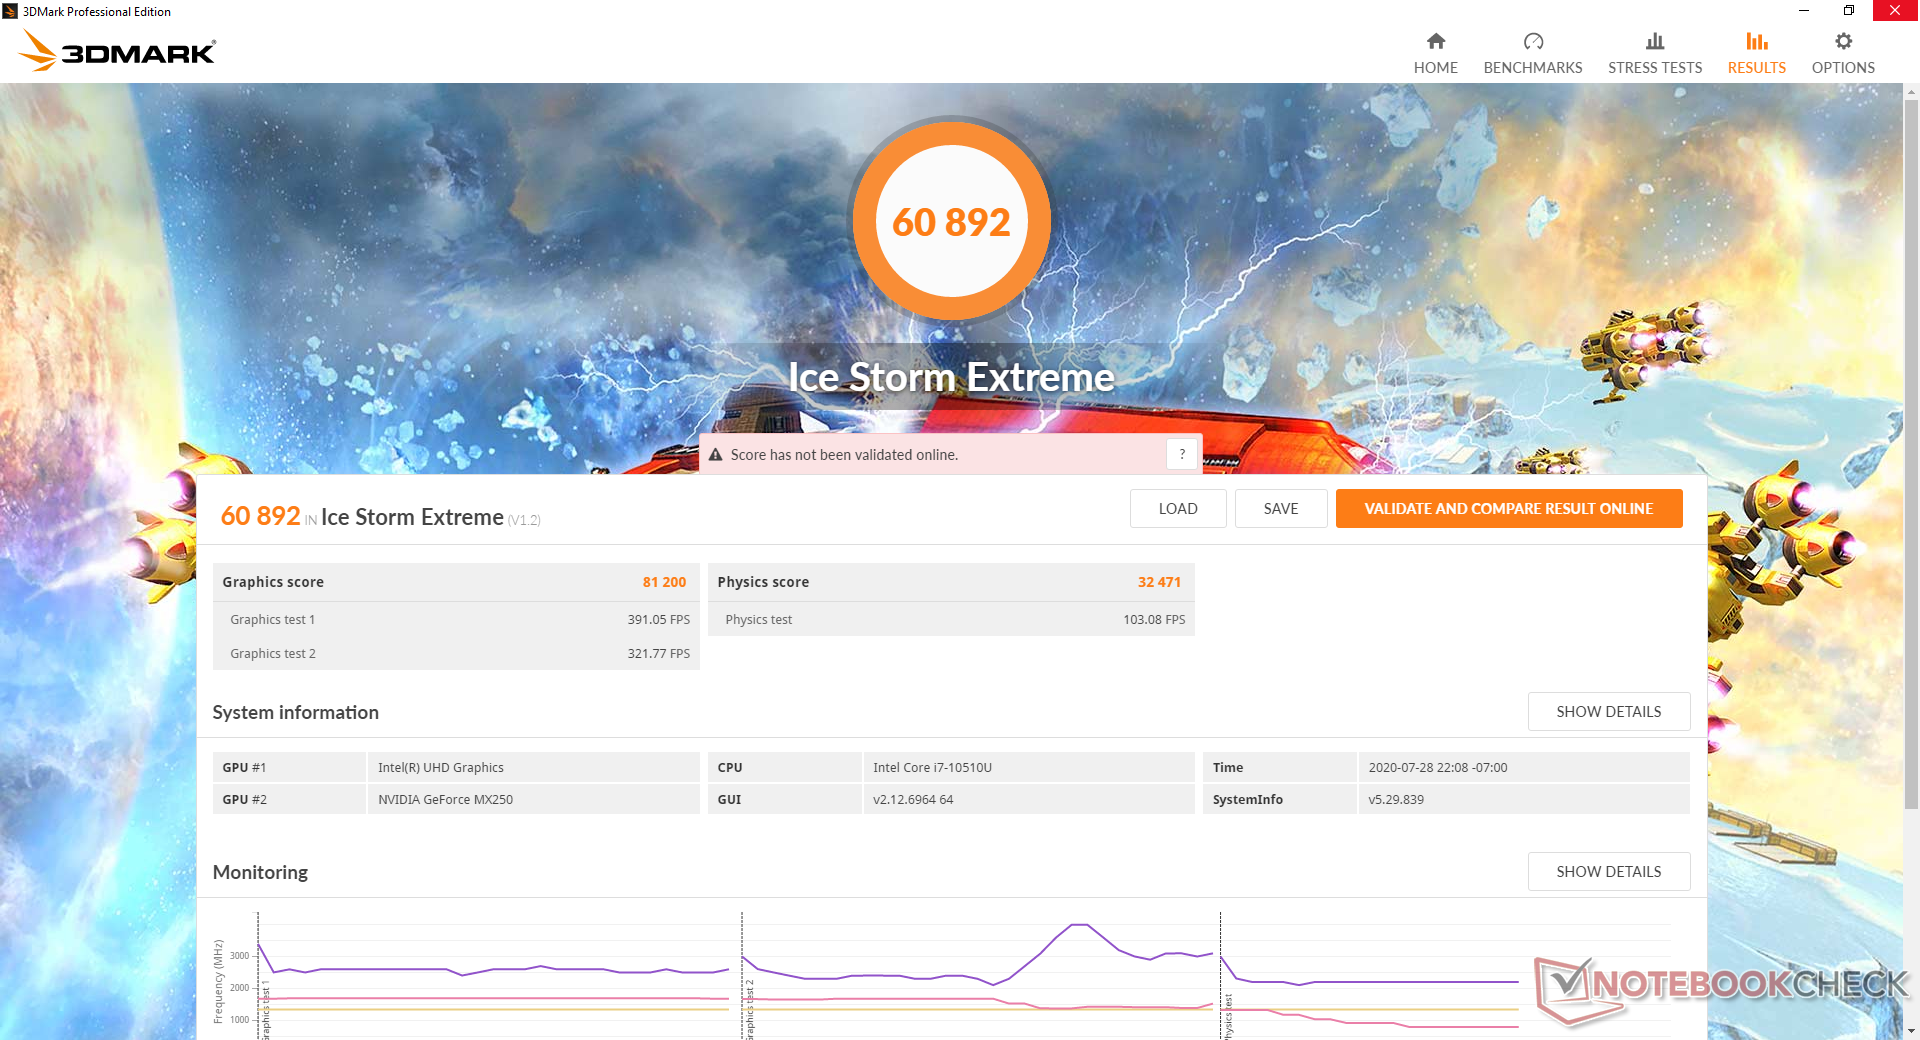
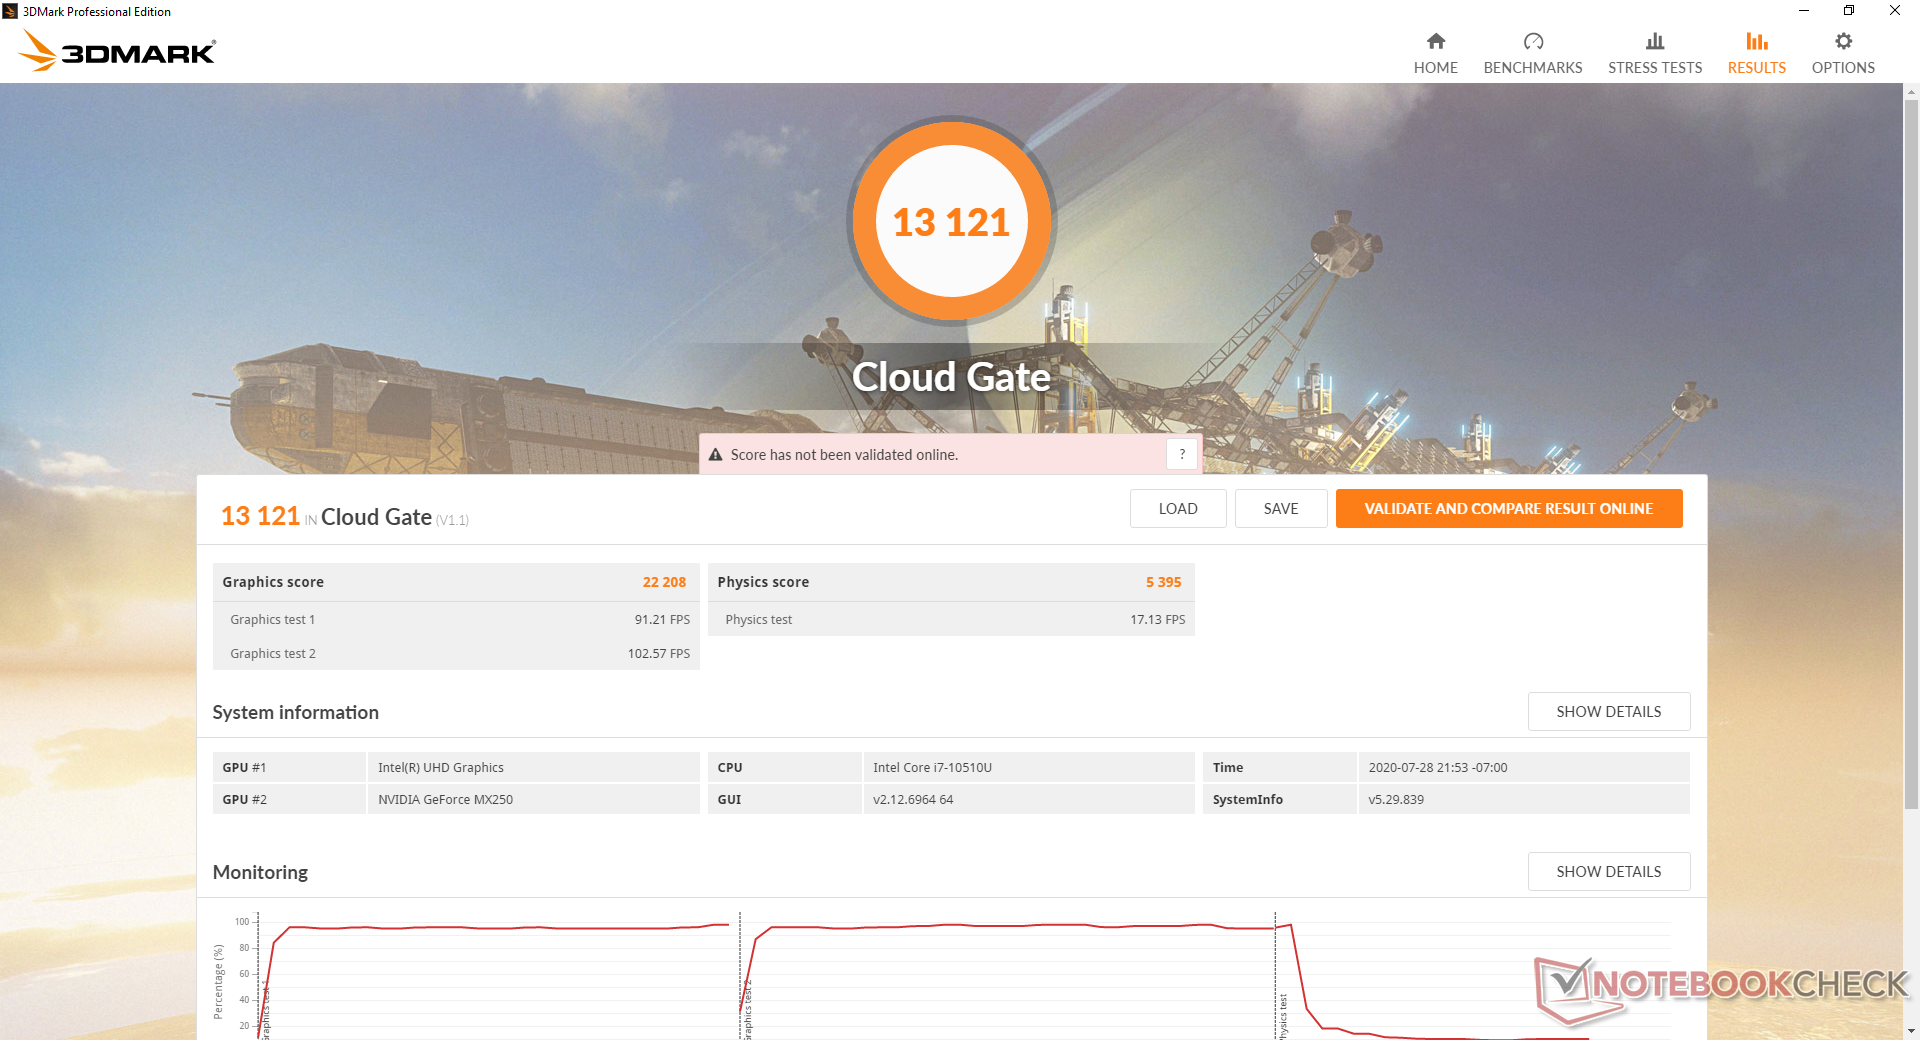
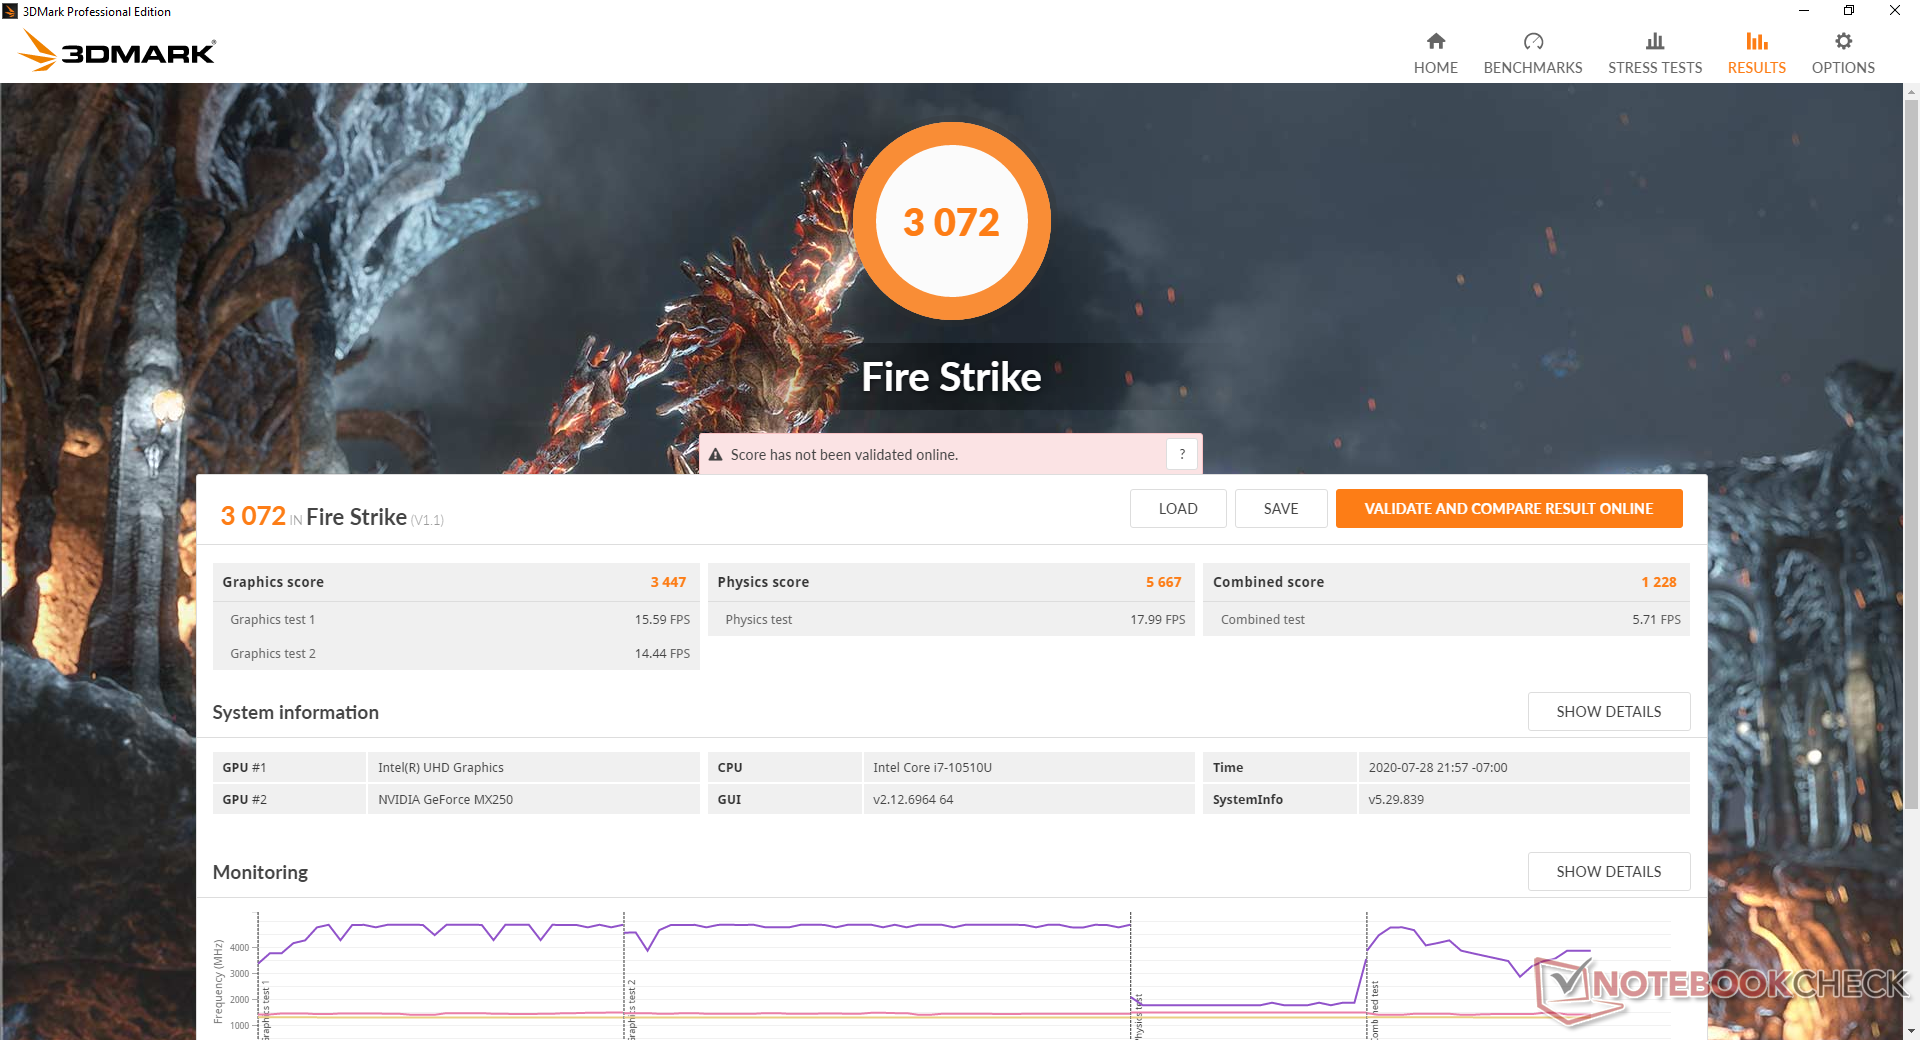
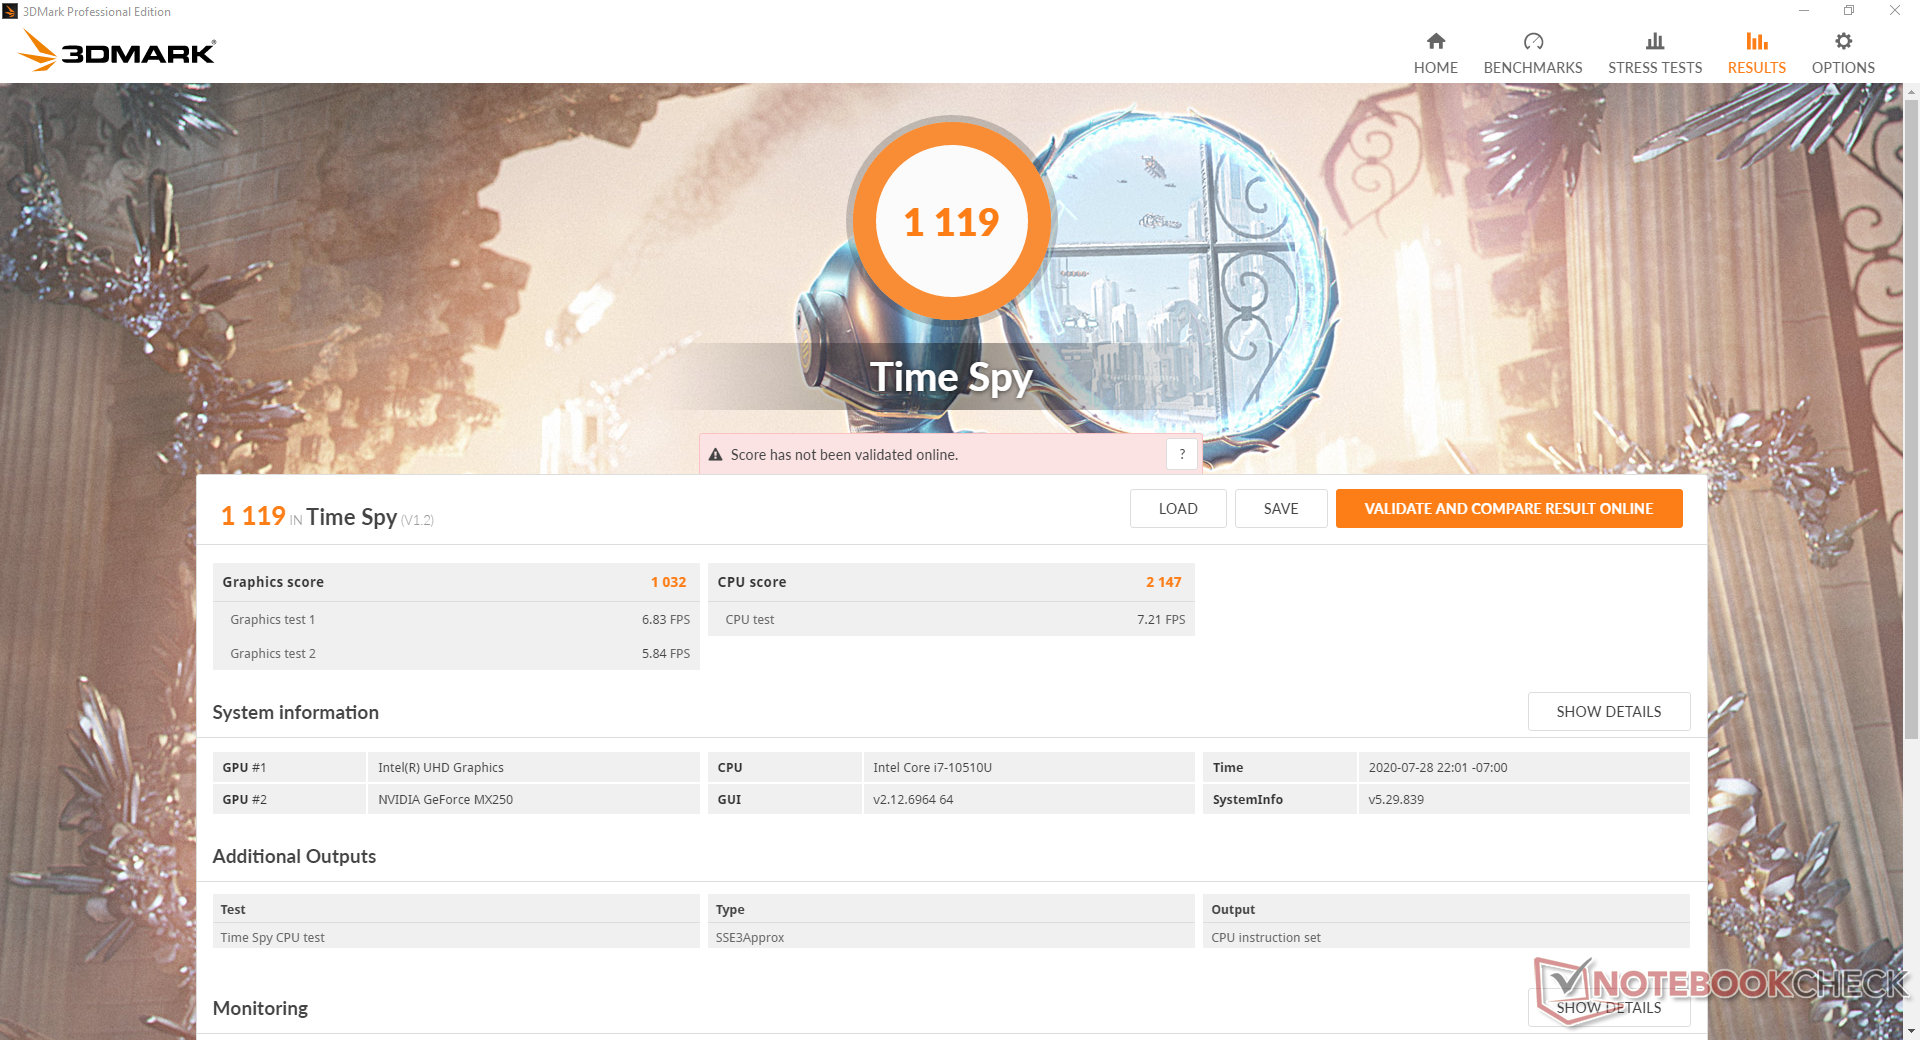
| 3DMark 11 Performance | 4452 points | |
| 3DMark Cloud Gate Standard Score | 13121 points | |
| 3DMark Fire Strike Score | 3072 points | |
| 3DMark Time Spy Score | 1119 points | |
Help | ||
| low | med. | high | ultra | |
|---|---|---|---|---|
| The Witcher 3 (2015) | 66.7 | 34.7 | 21 | 11.2 |
| Dota 2 Reborn (2015) | 110 | 96.2 | 68 | 60.7 |
| X-Plane 11.11 (2018) | 44.3 | 38.7 | 35.5 |
Emissions
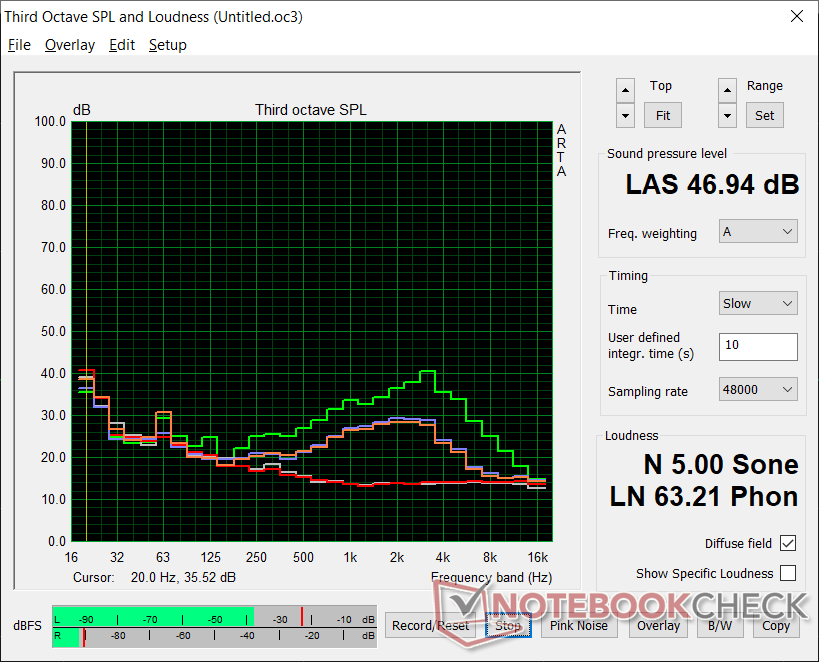
System Noise
The internal fan will be idle during most low loads like browsing or word processing for a completely silent experience. At worst, the fan may jump up to 31 dB(A) or 34 dB(A) which are still manageable levels. Any pulsing behavior is kept to a minimum.
Fan noise picks up significantly when running higher loads like gaming where it can range from 37.5 dB(A) up to 47 dB(A) if fully stressed. This makes the ProBook louder than most other business laptops which is the price to pay for having a more powerful discrete GeForce MX GPU.
| HP ProBook 450 G7 8WC04UT GeForce MX250, i7-10510U, Crucial P1 SSD CT1000P1SSD8 | HP ProBook 455 G7-175W8EA Vega 7, R7 4700U, Samsung PM991 MZVLQ512HALU | MSI Modern 15 A10RB GeForce MX250, i7-10510U, WDC PC SN730 SDBPNTY-512G | Dell Latitude 15 3590 UHD Graphics 620, i5-8250U, Samsung SSD PM871b MZ7LN256HAJQ | Lenovo ThinkPad L590-20Q70019GE UHD Graphics 620, i5-8265U, Toshiba XG6 KXG6AZNV512G | Dynabook Tecra X50-F UHD Graphics 620, i7-8665U, Samsung SSD PM981 MZVLB512HAJQ | |
|---|---|---|---|---|---|---|
| Noise | -6% | -11% | -11% | 1% | -5% | |
| off / environment * (dB) | 26.2 | 30.7 -17% | 28.3 -8% | 30.6 -17% | 29 -11% | 30.2 -15% |
| Idle Minimum * (dB) | 26.2 | 30.7 -17% | 32 -22% | 30.6 -17% | 29 -11% | 30.2 -15% |
| Idle Average * (dB) | 26.2 | 30.7 -17% | 32 -22% | 31.9 -22% | 29 -11% | 30.2 -15% |
| Idle Maximum * (dB) | 26.2 | 30.7 -17% | 32 -22% | 31.9 -22% | 29 -11% | 30.2 -15% |
| Load Average * (dB) | 38.1 | 33.9 11% | 34.5 9% | 39 -2% | 29 24% | 33.4 12% |
| Witcher 3 ultra * (dB) | 37.5 | 39.5 -5% | ||||
| Load Maximum * (dB) | 47 | 36.8 22% | 50.9 -8% | 39.1 17% | 33.8 28% | 39 17% |
* ... smaller is better
Noise level
| Idle |
| 26.2 / 26.2 / 26.2 dB(A) |
| Load |
| 38.1 / 47 dB(A) |
 | ||
30 dB silent 40 dB(A) audible 50 dB(A) loud |
||
min: | ||
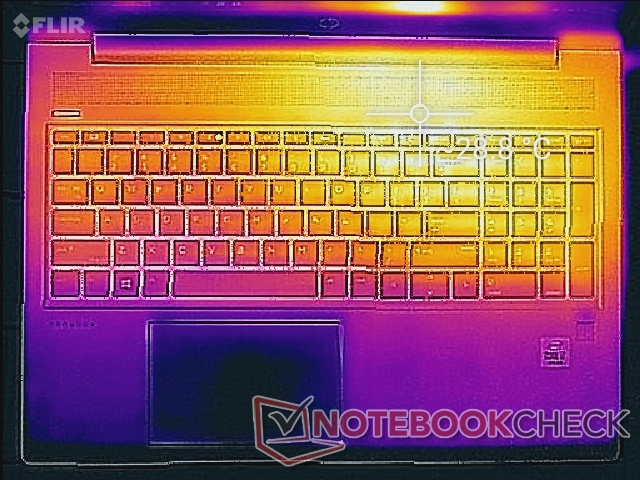
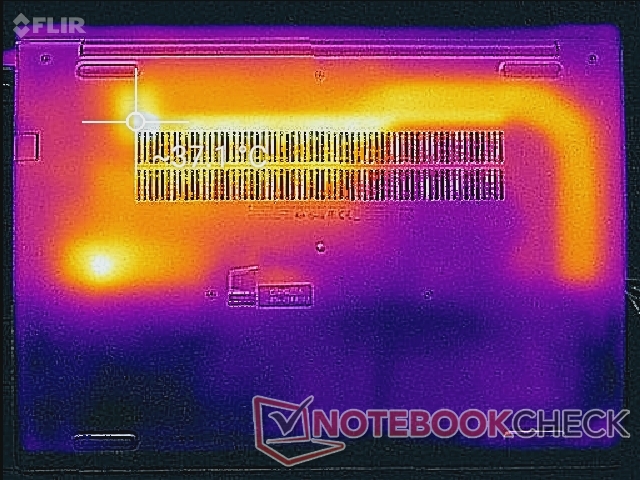
Temperature
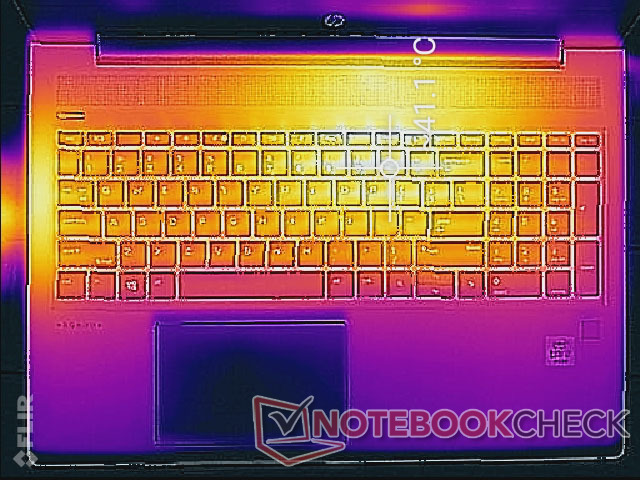
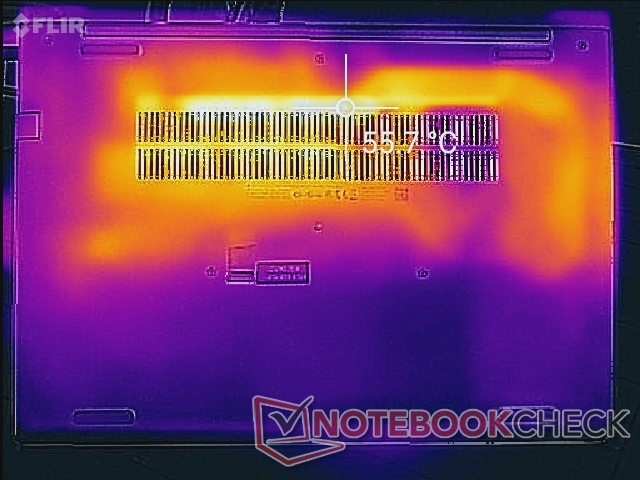
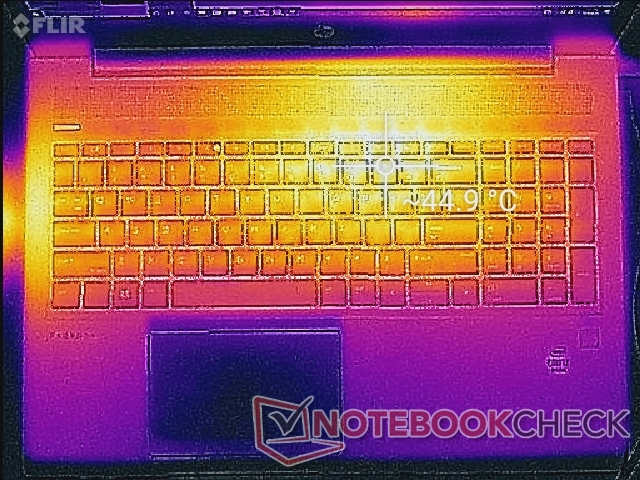
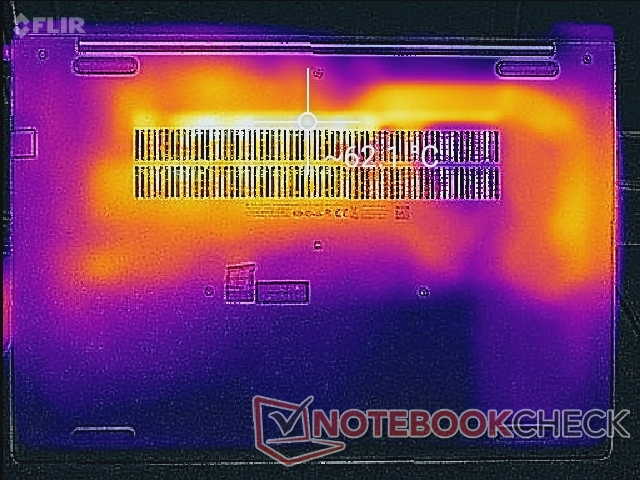
Hot spots are toward the rear of the system closest to the processor and extended copper heat pipe as shown by our temperature maps below. Thus, the palm rests and most of the keyboard keys remain relatively cool for comfortable typing. The hot spots can become very warm nonetheless at up to 44 C and 62 C on the top and bottom sides, respectively, compared to only 41 C on the Dell Latitude 3590.
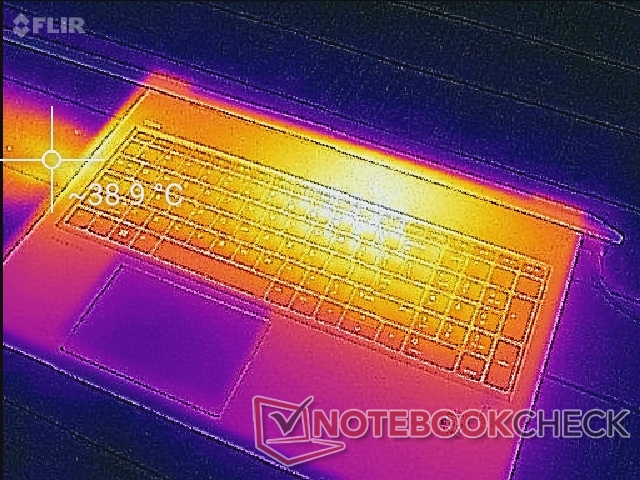
(±) The maximum temperature on the upper side is 40 °C / 104 F, compared to the average of 34.3 °C / 94 F, ranging from 21.2 to 62.5 °C for the class Office.
(-) The bottom heats up to a maximum of 56.6 °C / 134 F, compared to the average of 36.8 °C / 98 F
(+) In idle usage, the average temperature for the upper side is 26 °C / 79 F, compared to the device average of 29.5 °C / 85 F.
(±) Playing The Witcher 3, the average temperature for the upper side is 35.2 °C / 95 F, compared to the device average of 29.5 °C / 85 F.
(+) The palmrests and touchpad are cooler than skin temperature with a maximum of 29.8 °C / 85.6 F and are therefore cool to the touch.
(-) The average temperature of the palmrest area of similar devices was 27.5 °C / 81.5 F (-2.3 °C / -4.1 F).
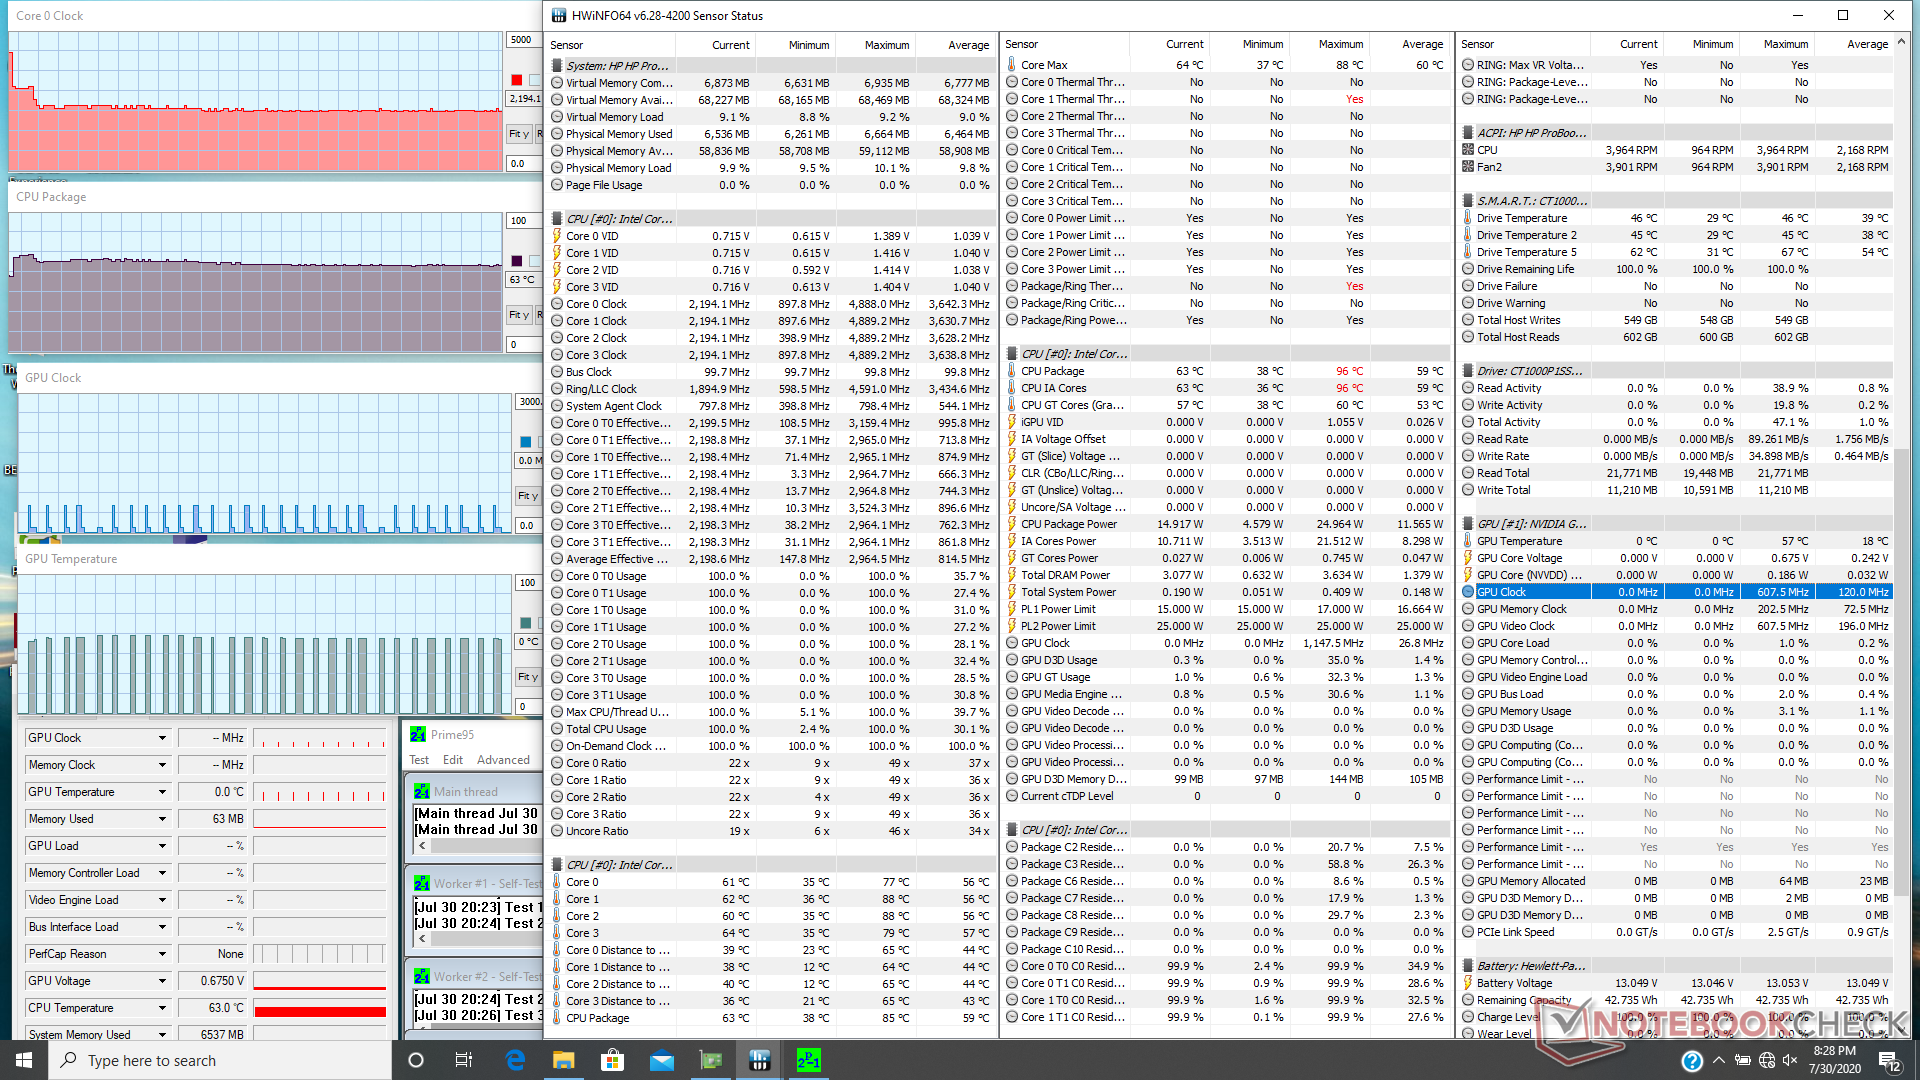
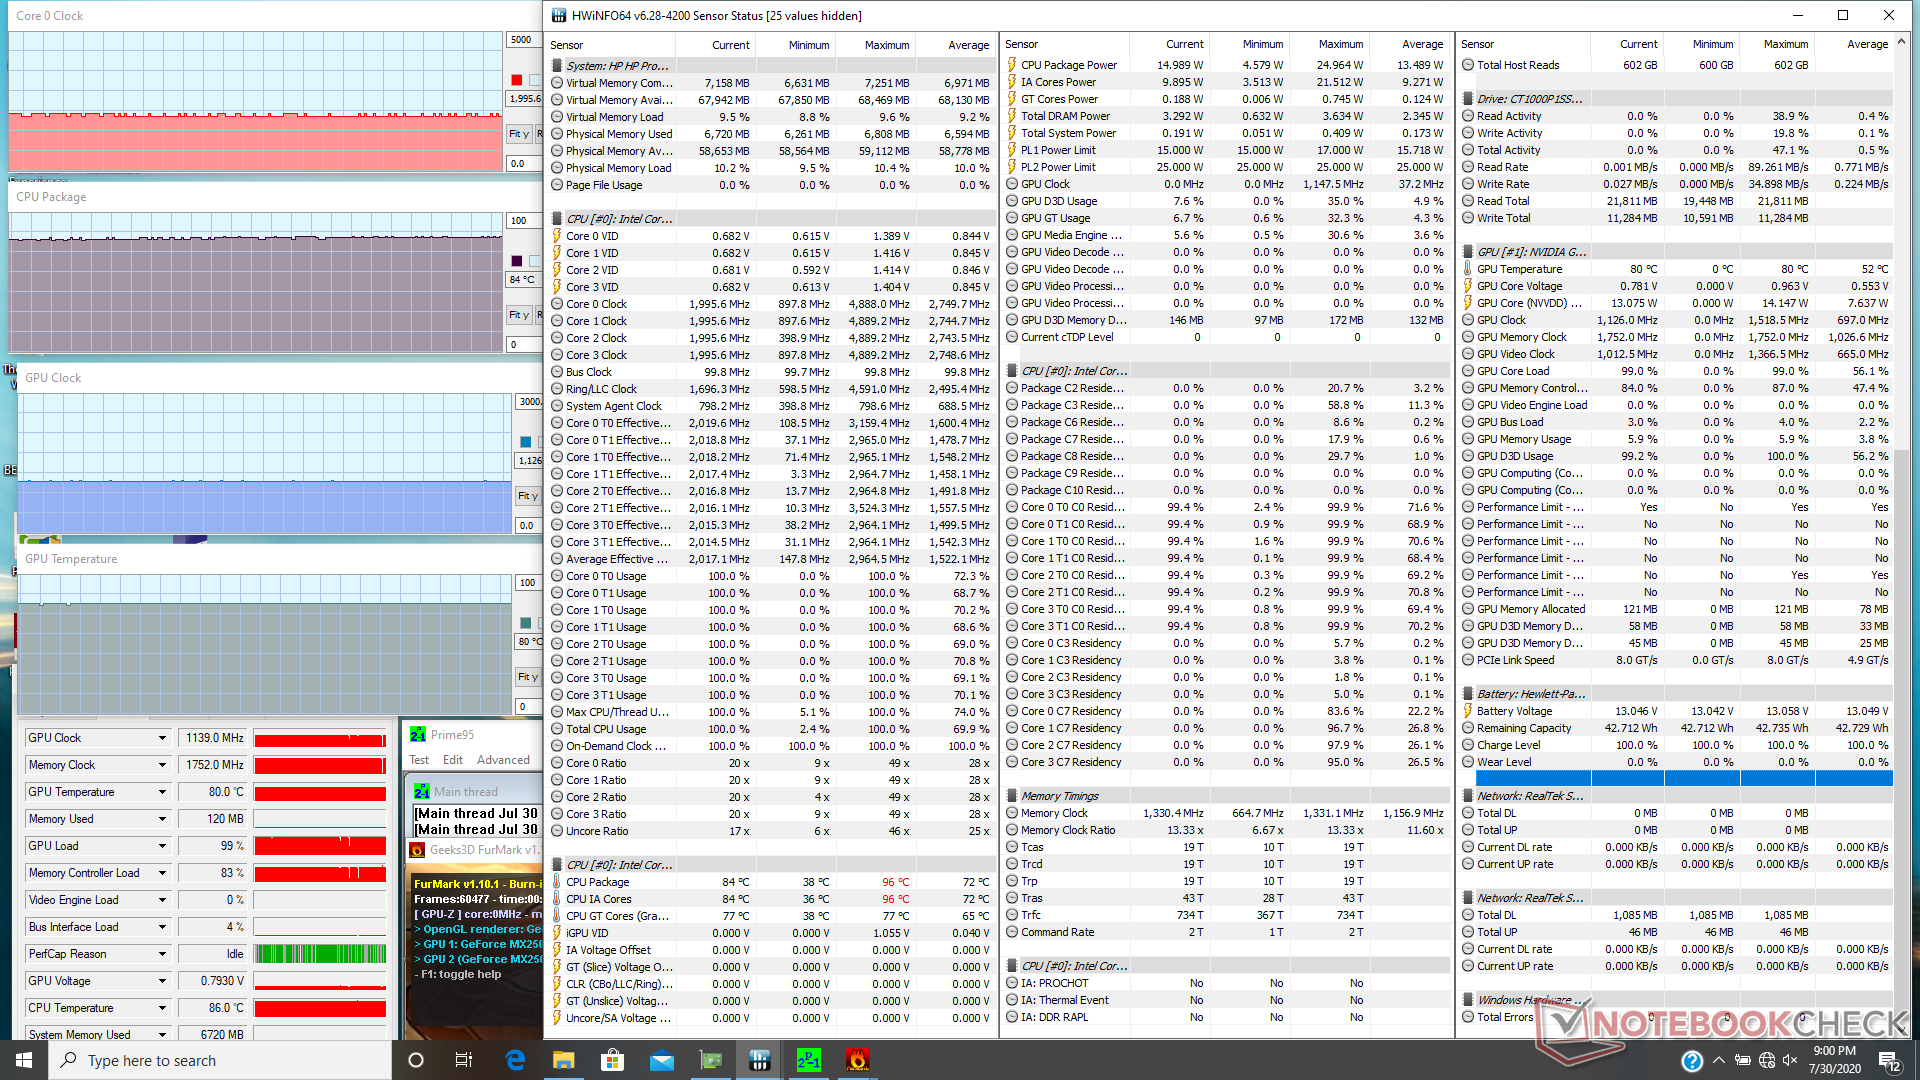
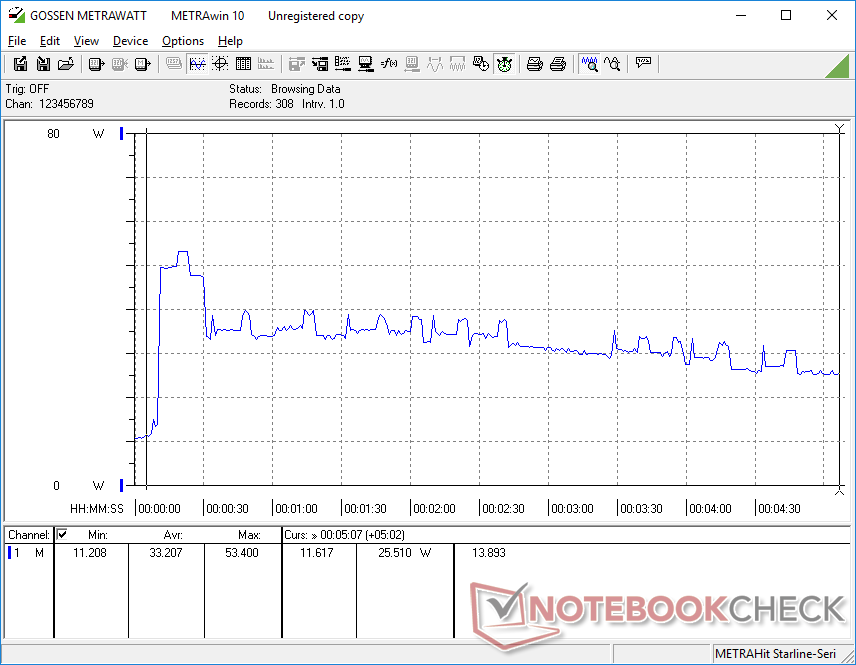
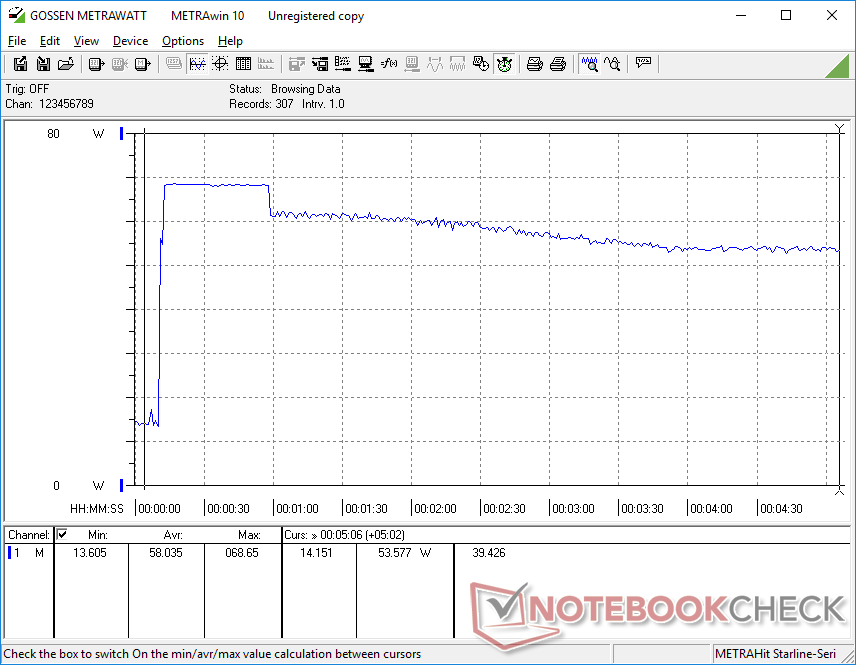
Stress Test
When running Prime95, the CPU would boost to 3.1 GHz for about 20 seconds before falling and stabilizing at 2.2 GHz and 63 C. These stable clock rates are relatively low when compared to other laptops with the same CPU which explains the lower-than-expected CineBench scores above. The Lenovo ThinkPad T490 with Core i7-10510U, for example, would stabilize at 2.9 to 3.0 GHz when under similar conditions. High loads like gaming would cause the CPU and GPU to stabilize at 84 C and 79 C, respectively, compared to ~67 C on the Ryzen-powered ProBook 455 G7.
Running on batteries will not reduce performance. A Fire Strike run on battery power would return Physics and Graphics scores of 5647 and 3750 points, respectively, compared to 5667 and 3447 points when on mains.
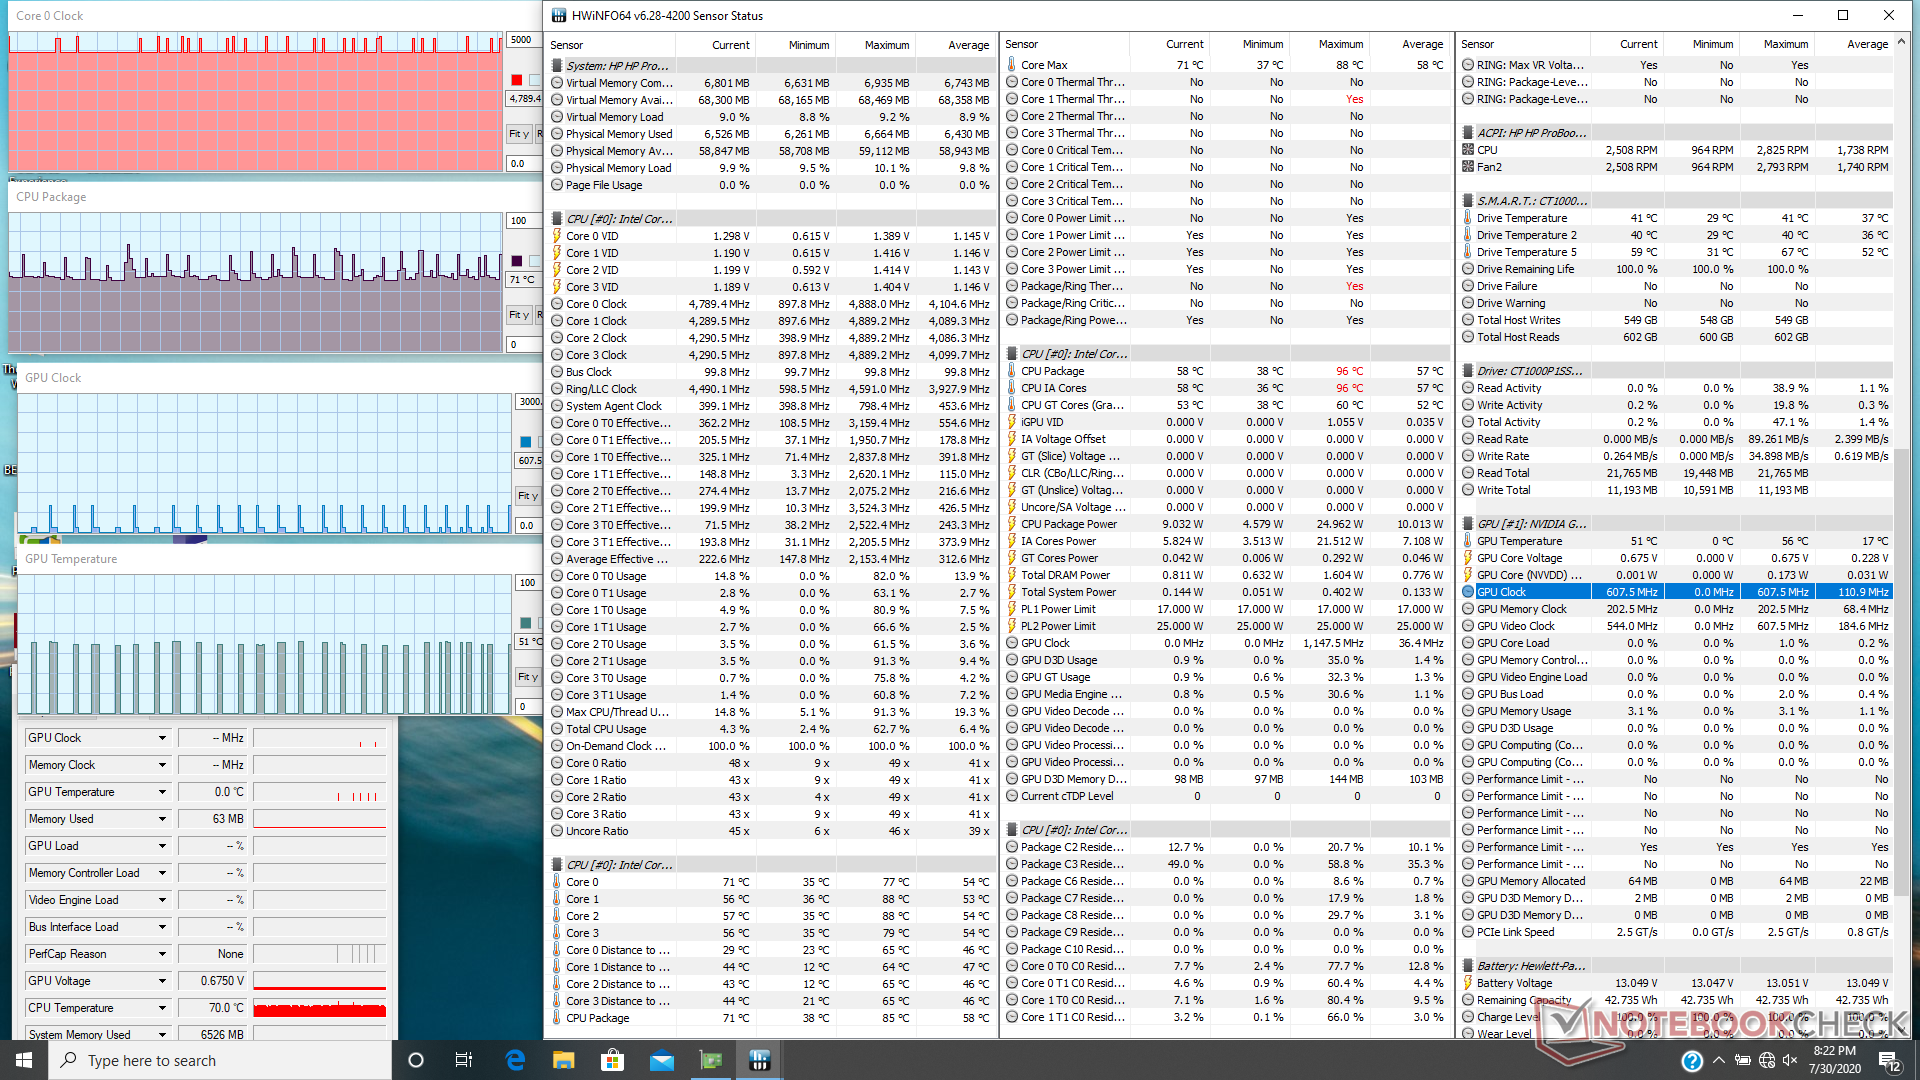
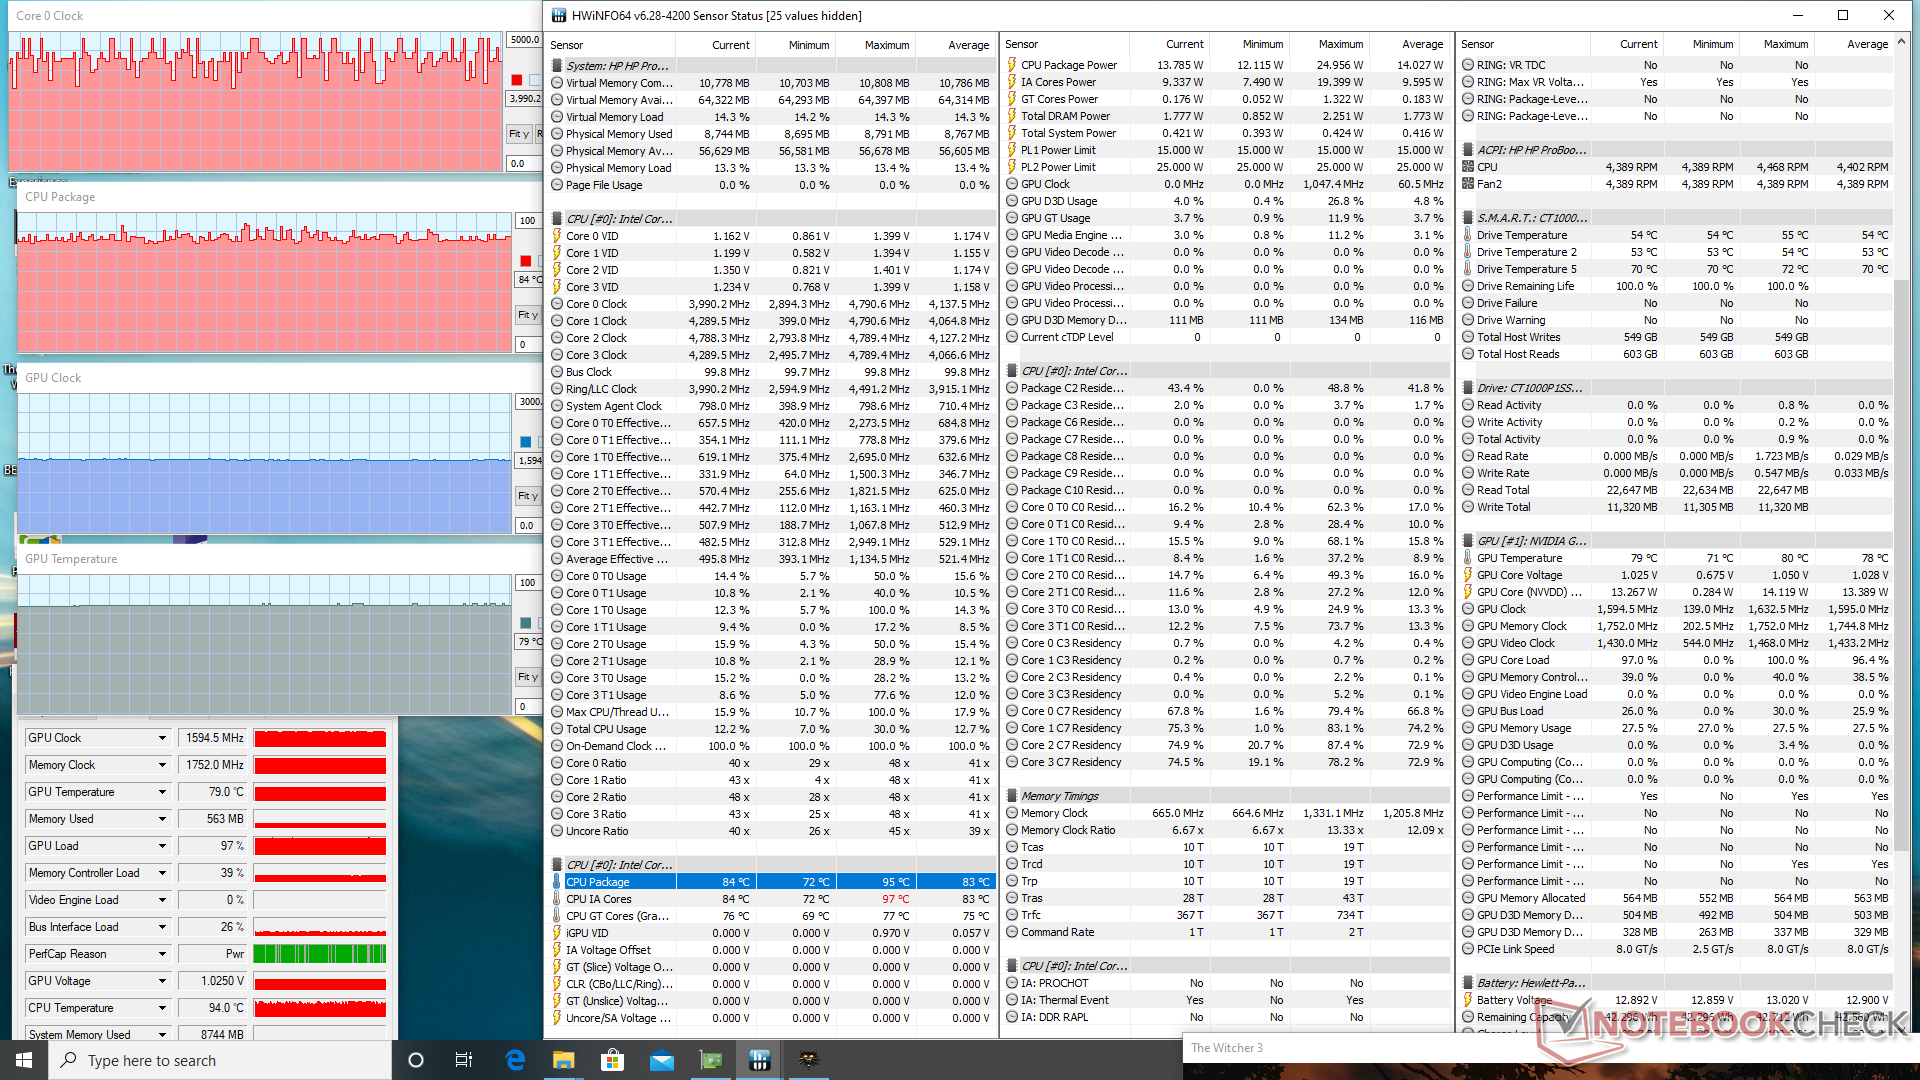
| CPU Clock (GHz) | GPU Clock (MHz) | Average CPU Temperature (°C) | Average GPU Temperature (°C) | |
| System Idle | -- | -- | 57 | 51 |
| Prime95 Stress | 2.2 | -- | 63 | 57 |
| Prime95 + FurMark Stress | 2.0 - 2.1 | 1139 | 84 | 80 |
| Witcher 3 Stress | ~4.0 | 1595 | 84 | 79 |
Speakers


HP ProBook 450 G7 8WC04UT audio analysis
(±) | speaker loudness is average but good (81.8 dB)
Bass 100 - 315 Hz
(-) | nearly no bass - on average 18.4% lower than median
(±) | linearity of bass is average (12.2% delta to prev. frequency)
Mids 400 - 2000 Hz
(+) | balanced mids - only 2.9% away from median
(+) | mids are linear (5.4% delta to prev. frequency)
Highs 2 - 16 kHz
(+) | balanced highs - only 2.8% away from median
(+) | highs are linear (5.4% delta to prev. frequency)
Overall 100 - 16.000 Hz
(+) | overall sound is linear (14.5% difference to median)
Compared to same class
» 11% of all tested devices in this class were better, 3% similar, 85% worse
» The best had a delta of 7%, average was 21%, worst was 53%
Compared to all devices tested
» 18% of all tested devices were better, 4% similar, 78% worse
» The best had a delta of 4%, average was 24%, worst was 134%
Apple MacBook 12 (Early 2016) 1.1 GHz audio analysis
(+) | speakers can play relatively loud (83.6 dB)
Bass 100 - 315 Hz
(±) | reduced bass - on average 11.3% lower than median
(±) | linearity of bass is average (14.2% delta to prev. frequency)
Mids 400 - 2000 Hz
(+) | balanced mids - only 2.4% away from median
(+) | mids are linear (5.5% delta to prev. frequency)
Highs 2 - 16 kHz
(+) | balanced highs - only 2% away from median
(+) | highs are linear (4.5% delta to prev. frequency)
Overall 100 - 16.000 Hz
(+) | overall sound is linear (10.2% difference to median)
Compared to same class
» 7% of all tested devices in this class were better, 2% similar, 91% worse
» The best had a delta of 5%, average was 18%, worst was 53%
Compared to all devices tested
» 5% of all tested devices were better, 1% similar, 94% worse
» The best had a delta of 4%, average was 24%, worst was 134%
Energy Management
Power Consumption
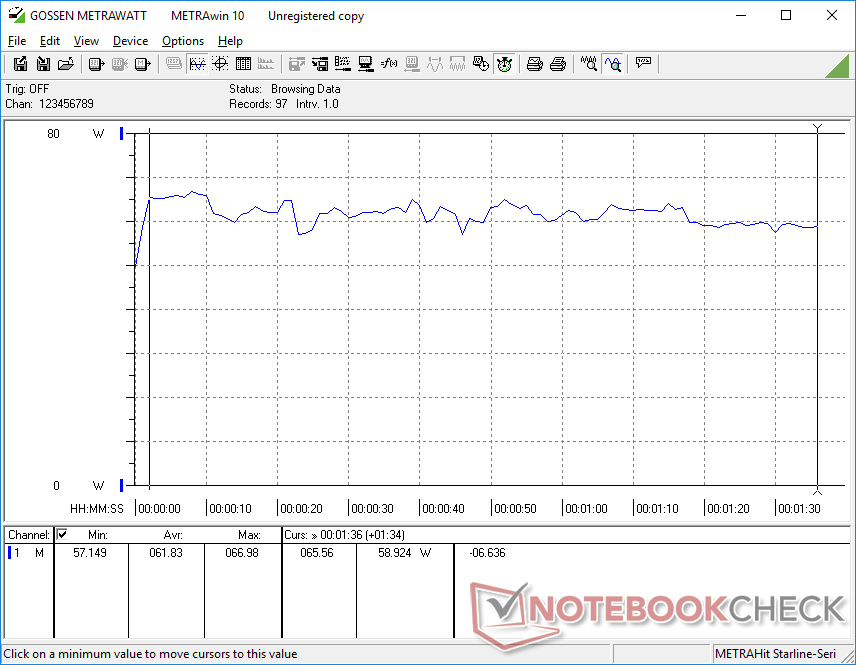
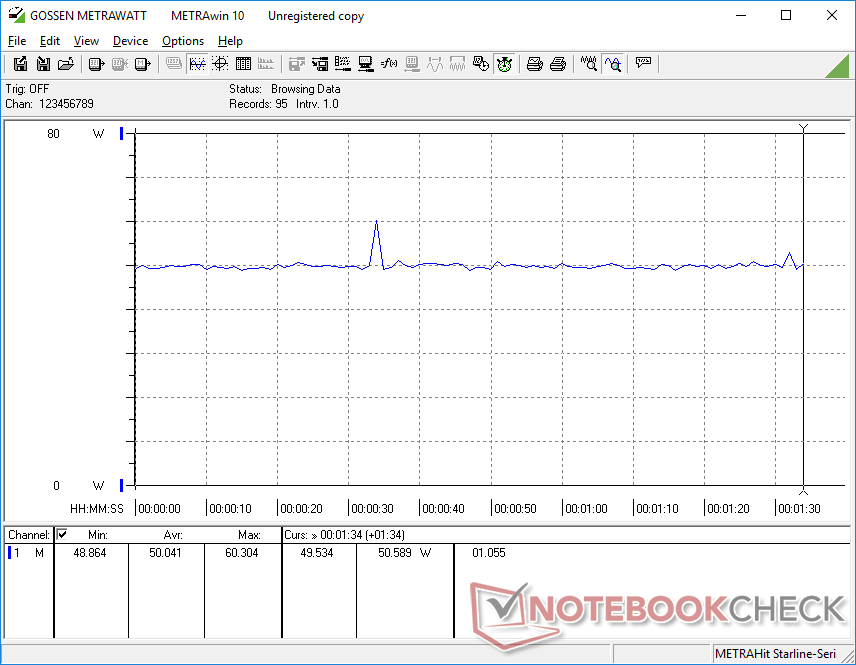
The ProBook 450 G7 consumes about 50 to 90 percent more power than the ProBook 455 G7 when under high loads due to the discrete GeForce MX250. Thus, while our Intel-GeForce configuration is able to offer faster graphics performance than the Ryzen 7, this comes at the cost of higher power consumption. Otherwise, both laptops are almost the same when idling on desktop or running low processing loads.
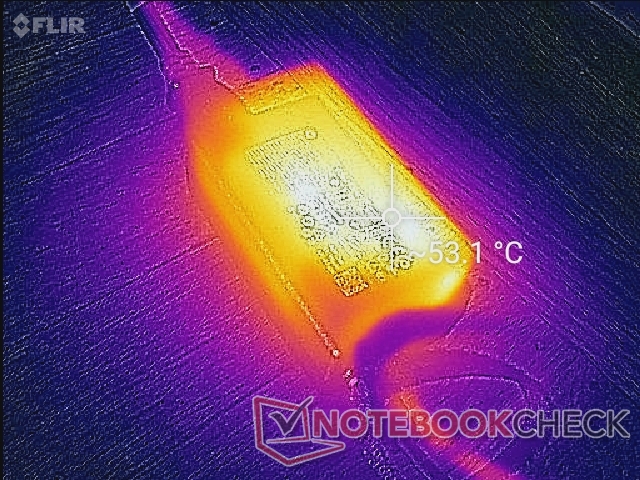
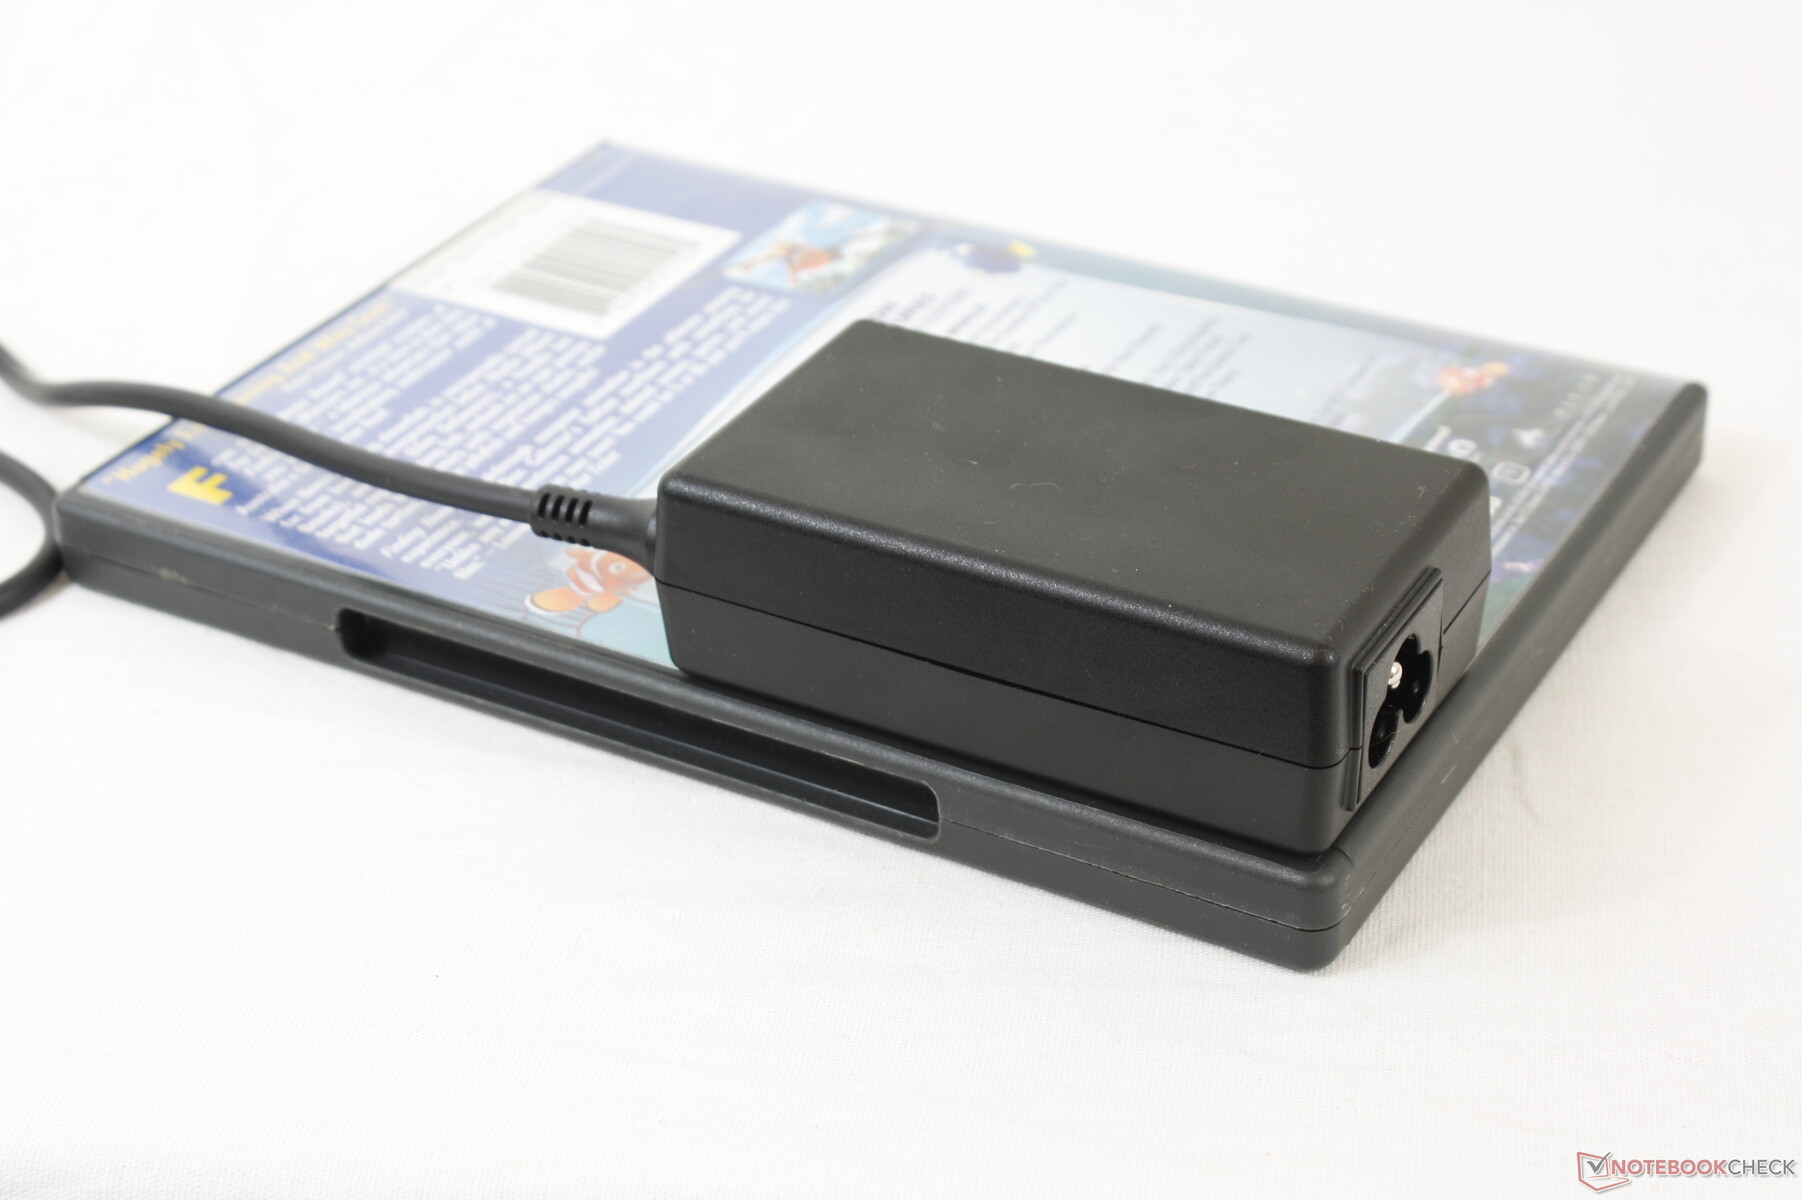
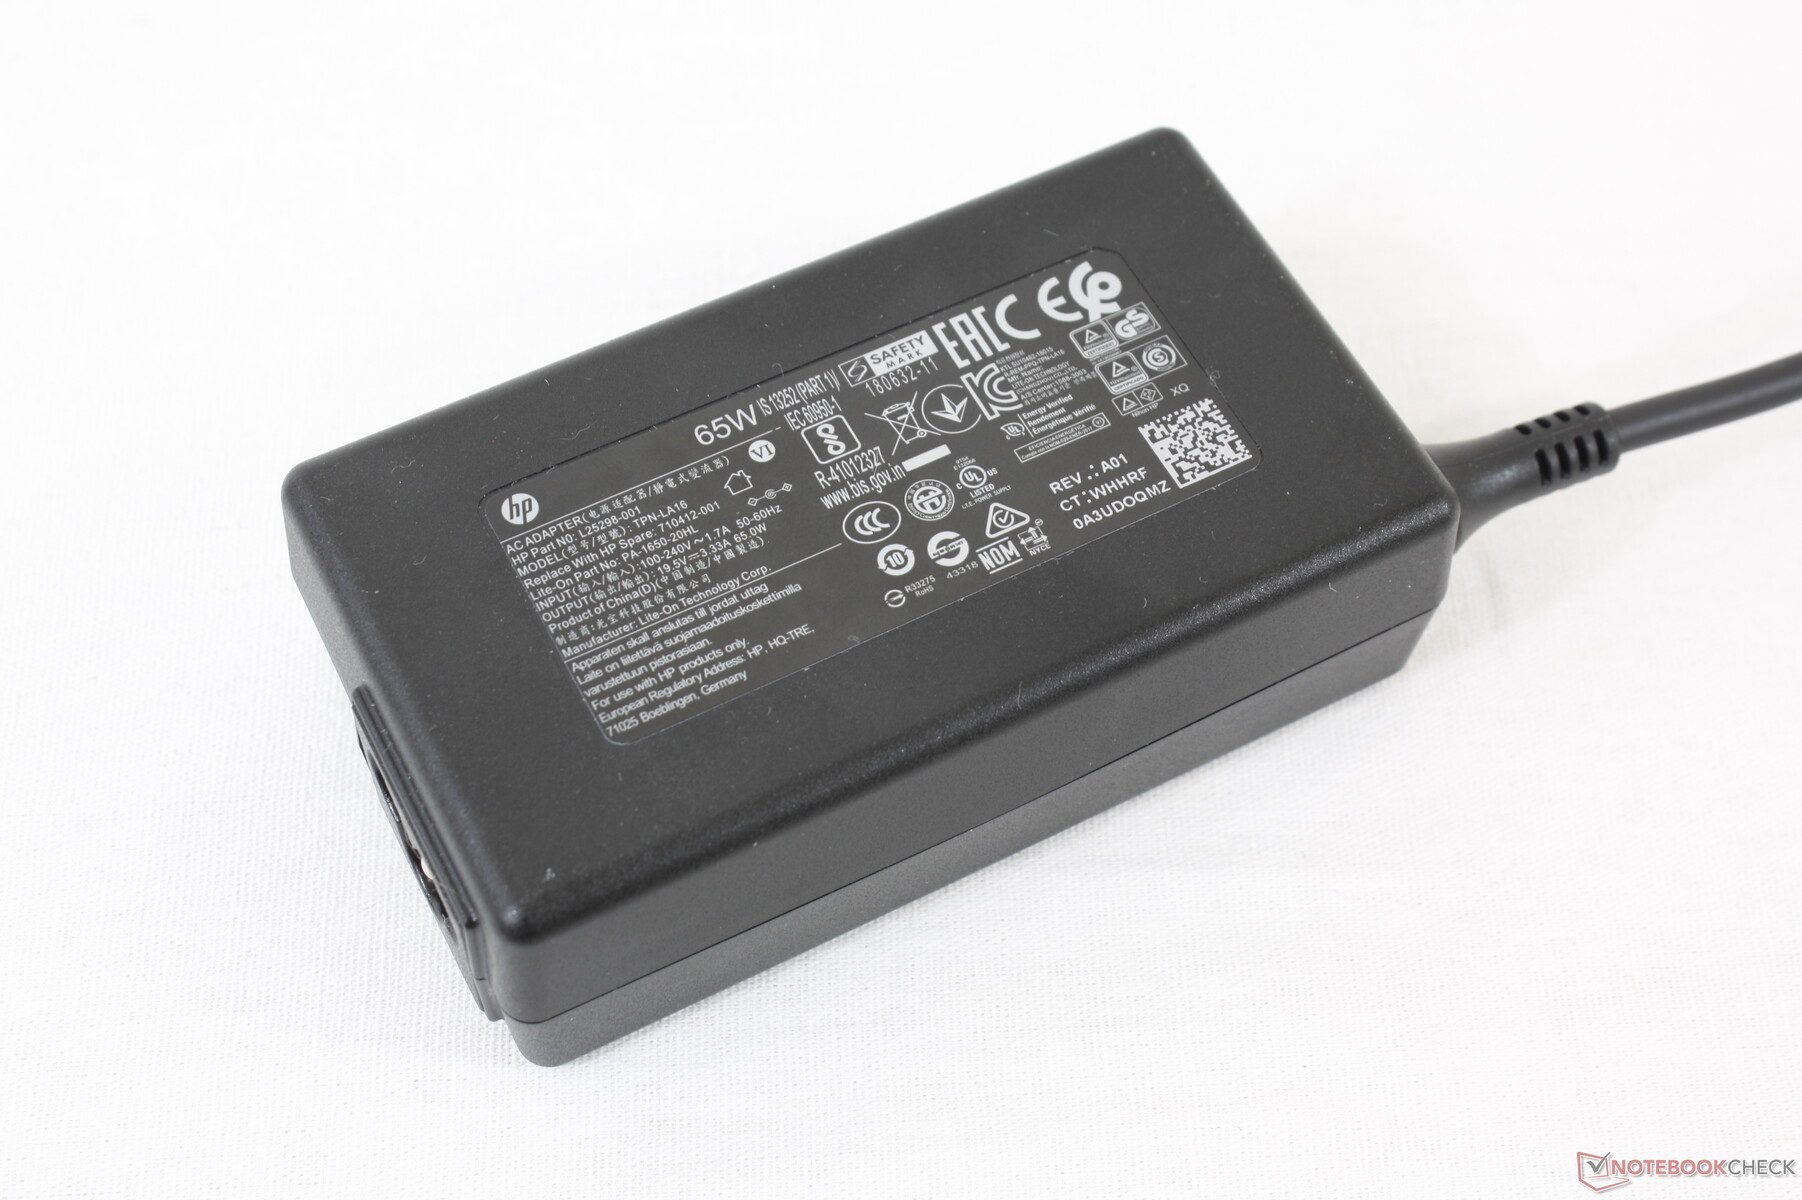
We're able to record a maximum consumption of 69 W from the small (~9 x 5 x 2.8 cm) 65 W AC adapter when running Prime95 and FurMark simultaneously. The high rate is only temporary as shown by our graphs below.
| Off / Standby | |
| Idle | |
| Load |
|
Key:
min: | |
| HP ProBook 450 G7 8WC04UT i7-10510U, GeForce MX250, Crucial P1 SSD CT1000P1SSD8, IPS, 1920x1080, 15.6" | HP ProBook 455 G7-175W8EA R7 4700U, Vega 7, Samsung PM991 MZVLQ512HALU, IPS, 1920x1080, 15.6" | MSI Modern 15 A10RB i7-10510U, GeForce MX250, WDC PC SN730 SDBPNTY-512G, IPS, 1920x1080, 15.6" | Dell Latitude 15 3590 i5-8250U, UHD Graphics 620, Samsung SSD PM871b MZ7LN256HAJQ, TN LED, 1920x1080, 15.6" | Lenovo ThinkPad L590-20Q70019GE i5-8265U, UHD Graphics 620, Toshiba XG6 KXG6AZNV512G, IPS, 1920x1080, 15.6" | Dynabook Tecra X50-F i7-8665U, UHD Graphics 620, Samsung SSD PM981 MZVLB512HAJQ, IPS, 1920x1080, 15.6" | |
|---|---|---|---|---|---|---|
| Power Consumption | 25% | -32% | 29% | 27% | 28% | |
| Idle Minimum * (Watt) | 4.8 | 3.8 21% | 6.6 -38% | 4.3 10% | 3.96 17% | 3.9 19% |
| Idle Average * (Watt) | 9.5 | 7.7 19% | 9.9 -4% | 7.2 24% | 6.9 27% | 7 26% |
| Idle Maximum * (Watt) | 10.7 | 10.5 2% | 14.7 -37% | 9.8 8% | 9.8 8% | 7.3 32% |
| Load Average * (Watt) | 61.8 | 32 48% | 82.9 -34% | 38 39% | 31.4 49% | 32.7 47% |
| Witcher 3 ultra * (Watt) | 50 | 59.4 -19% | ||||
| Load Maximum * (Watt) | 69 | 45.4 34% | 109.3 -58% | 24 65% | 45.4 34% | 57.8 16% |
* ... smaller is better
Battery Life
Runtimes are about the same as what we recorded on the Ryzen-powered ProBook 455 G7 at around 7 hours of real-world WLAN use. Charging from empty to full capacity takes about 1.5 hours. The system can be recharged via USB-C as well.
| HP ProBook 450 G7 8WC04UT i7-10510U, GeForce MX250, 45 Wh | HP ProBook 455 G7-175W8EA R7 4700U, Vega 7, 45 Wh | MSI Modern 15 A10RB i7-10510U, GeForce MX250, 52 Wh | Dell Latitude 15 3590 i5-8250U, UHD Graphics 620, 56 Wh | Lenovo ThinkPad L590-20Q70019GE i5-8265U, UHD Graphics 620, 45 Wh | Dynabook Tecra X50-F i7-8665U, UHD Graphics 620, 48 Wh | |
|---|---|---|---|---|---|---|
| Battery runtime | -6% | -7% | 24% | 19% | -37% | |
| Reader / Idle (h) | 14.8 | 12.6 -15% | 15.4 4% | 20.2 36% | 17.4 18% | 5.8 -61% |
| WiFi v1.3 (h) | 7.2 | 7.6 6% | 6.5 -10% | 9.1 26% | 7.2 0% | 4.6 -36% |
| Load (h) | 2 | 1.8 -10% | 1.7 -15% | 2.2 10% | 2.8 40% | 1.7 -15% |
Pros
Cons
Verdict

When configured with the Core i7 CPU, no GeForce GPU, 1080p display, 8 GB of RAM, and 500 GB HDD, the ProBook 450 G7 retails for about $1200 USD on HP.com. When configuring the ProBook 455 G7 with the exact same specifications but with the Ryzen 7 CPU instead, the system would retail for only about $800 USD. These prices may very well change in the future, but the message remains clear: the Ryzen-powered ProBook 455 G7 is both the faster and cheaper option to make it the better system especially in terms of performance-per-dollar.
Is the Intel-powered ProBook 450 G7 still worth purchasing? Nvidia GeForce options are available only on Intel SKUs which will offer faster graphics performance than the integrated AMD solution for those who need it. Potential deals on the ProBook 450 G7 like the one on CUKUSA may also make the system worth considering. Otherwise, Intel has a long uphill battle against AMD and its rising Ryzen alternatives.
The HP ProBook 450 G7 integrates a lot of features for a budget business laptop including a dedicated GeForce MX GPU. If the latter is unimportant for your workloads, however, then the ProBook 455 G7 will be the superior option in almost every way.
HP ProBook 450 G7 8WC04UT
- 08/02/2020 v7 (old)
Allen Ngo
Price comparison
