HP 470 G7 in Review: Lackluster 17.3-inch Desktop Replacement

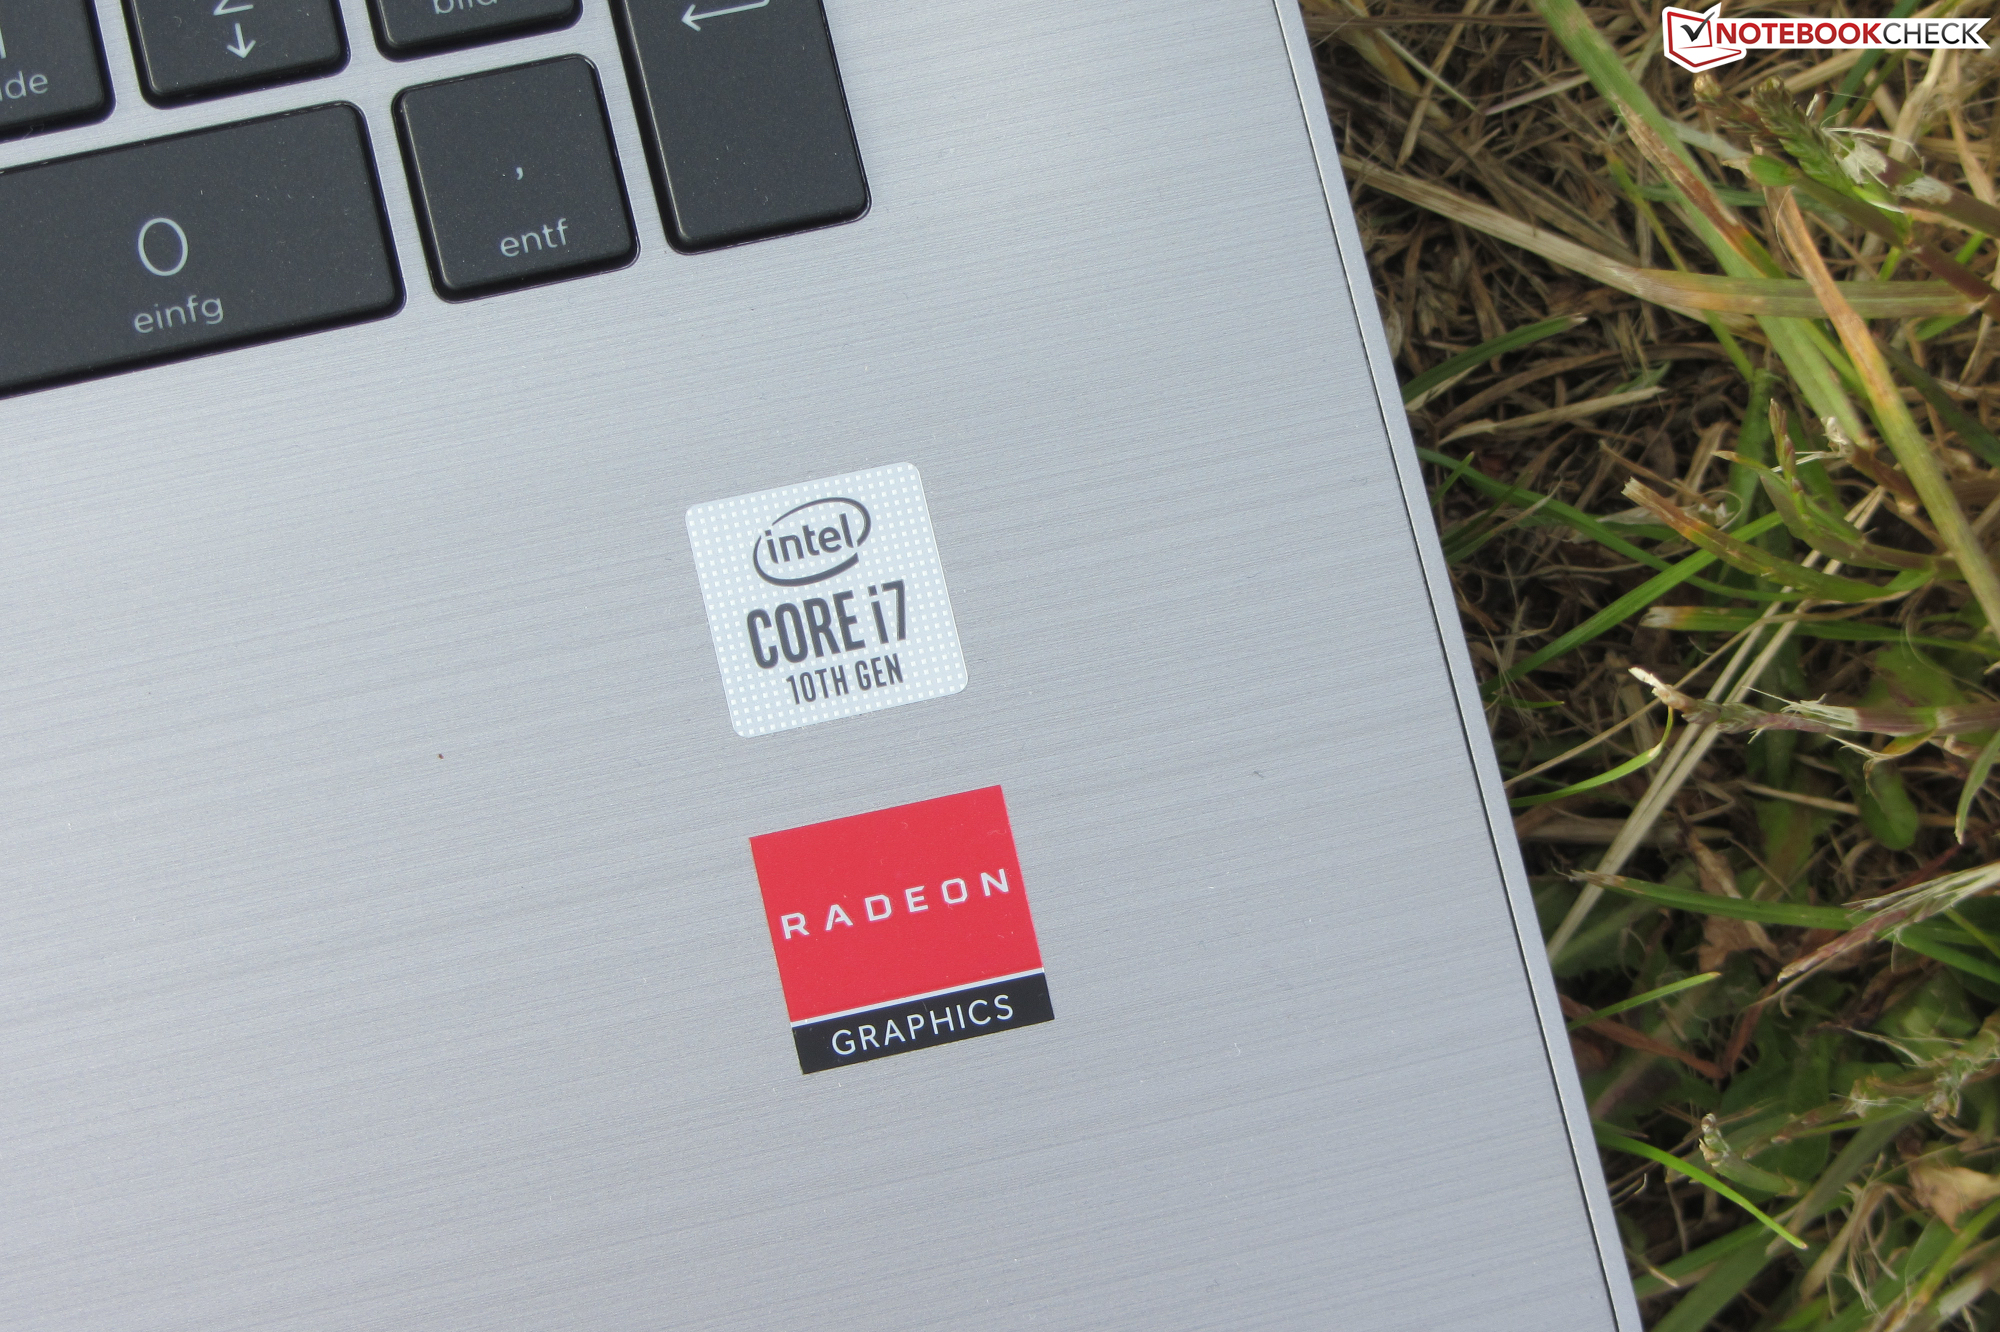
Hewlett Packard’s 470 G7 is a 17.3-inch notebook aimed at both professional as well as home users. Given that a 470 G6 was never released the G7 is the successor to the ProBook 470 G5, and its name was stripped of the ProBook moniker meaning the 470 G7 is no longer a member of HP’s ProBook family. It is powered by a Comet Lake CPU and a Radeon 530 GPU. Its main competitors are the Dell Inspiron 17 3780, Lenovo IdeaPad 330-17IKB, and Lenovo IdeaPad L340-17API.
Rating | Date | Model | Weight | Height | Size | Resolution | Price |
|---|---|---|---|---|---|---|---|
| 78.8 % v7 (old) | 06 / 2020 | HP 470 G7 8VU24EA i7-10510U, Radeon 530 | 2.4 kg | 24.5 mm | 17.30" | 1920x1080 | |
| 87.1 % v6 (old) | 01 / 2018 | HP ProBook 470 G5 i5-8250U, GeForce 930MX | 2.5 kg | 22.5 mm | 17.30" | 1920x1080 | |
| 78.9 % v6 (old) | 05 / 2019 | Dell Inspiron 17 3780 i7-8565U, Radeon 520 | 2.8 kg | 25 mm | 17.30" | 1920x1080 | |
| 75.8 % v6 (old) | 03 / 2019 | Lenovo IdeaPad 330-17IKB 81DM i5-8550U, GeForce MX150 | 2.8 kg | 24.9 mm | 17.30" | 1600x900 | |
| 80.8 % v6 (old) | 08 / 2019 | Lenovo Ideapad L340-17API-81LY0004GE R5 3500U, Vega 8 | 2.8 kg | 24.3 mm | 17.30" | 1600x900 |
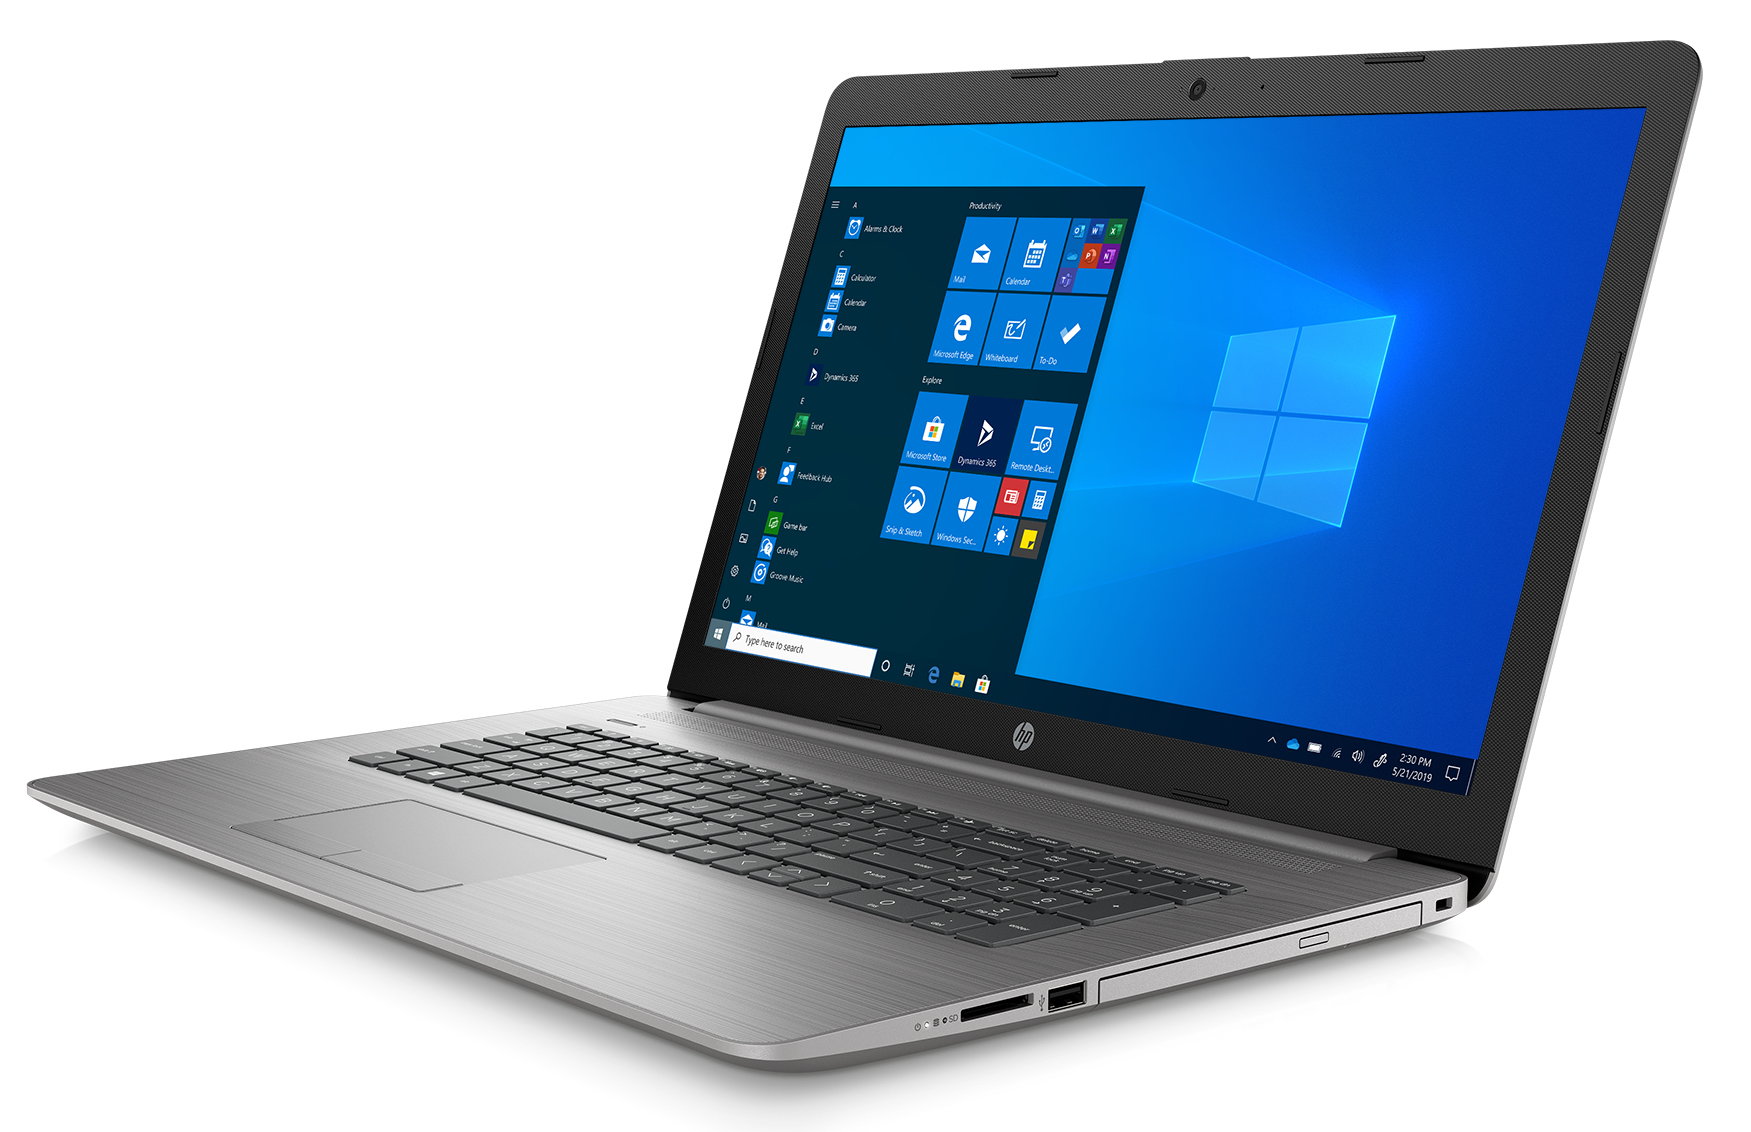
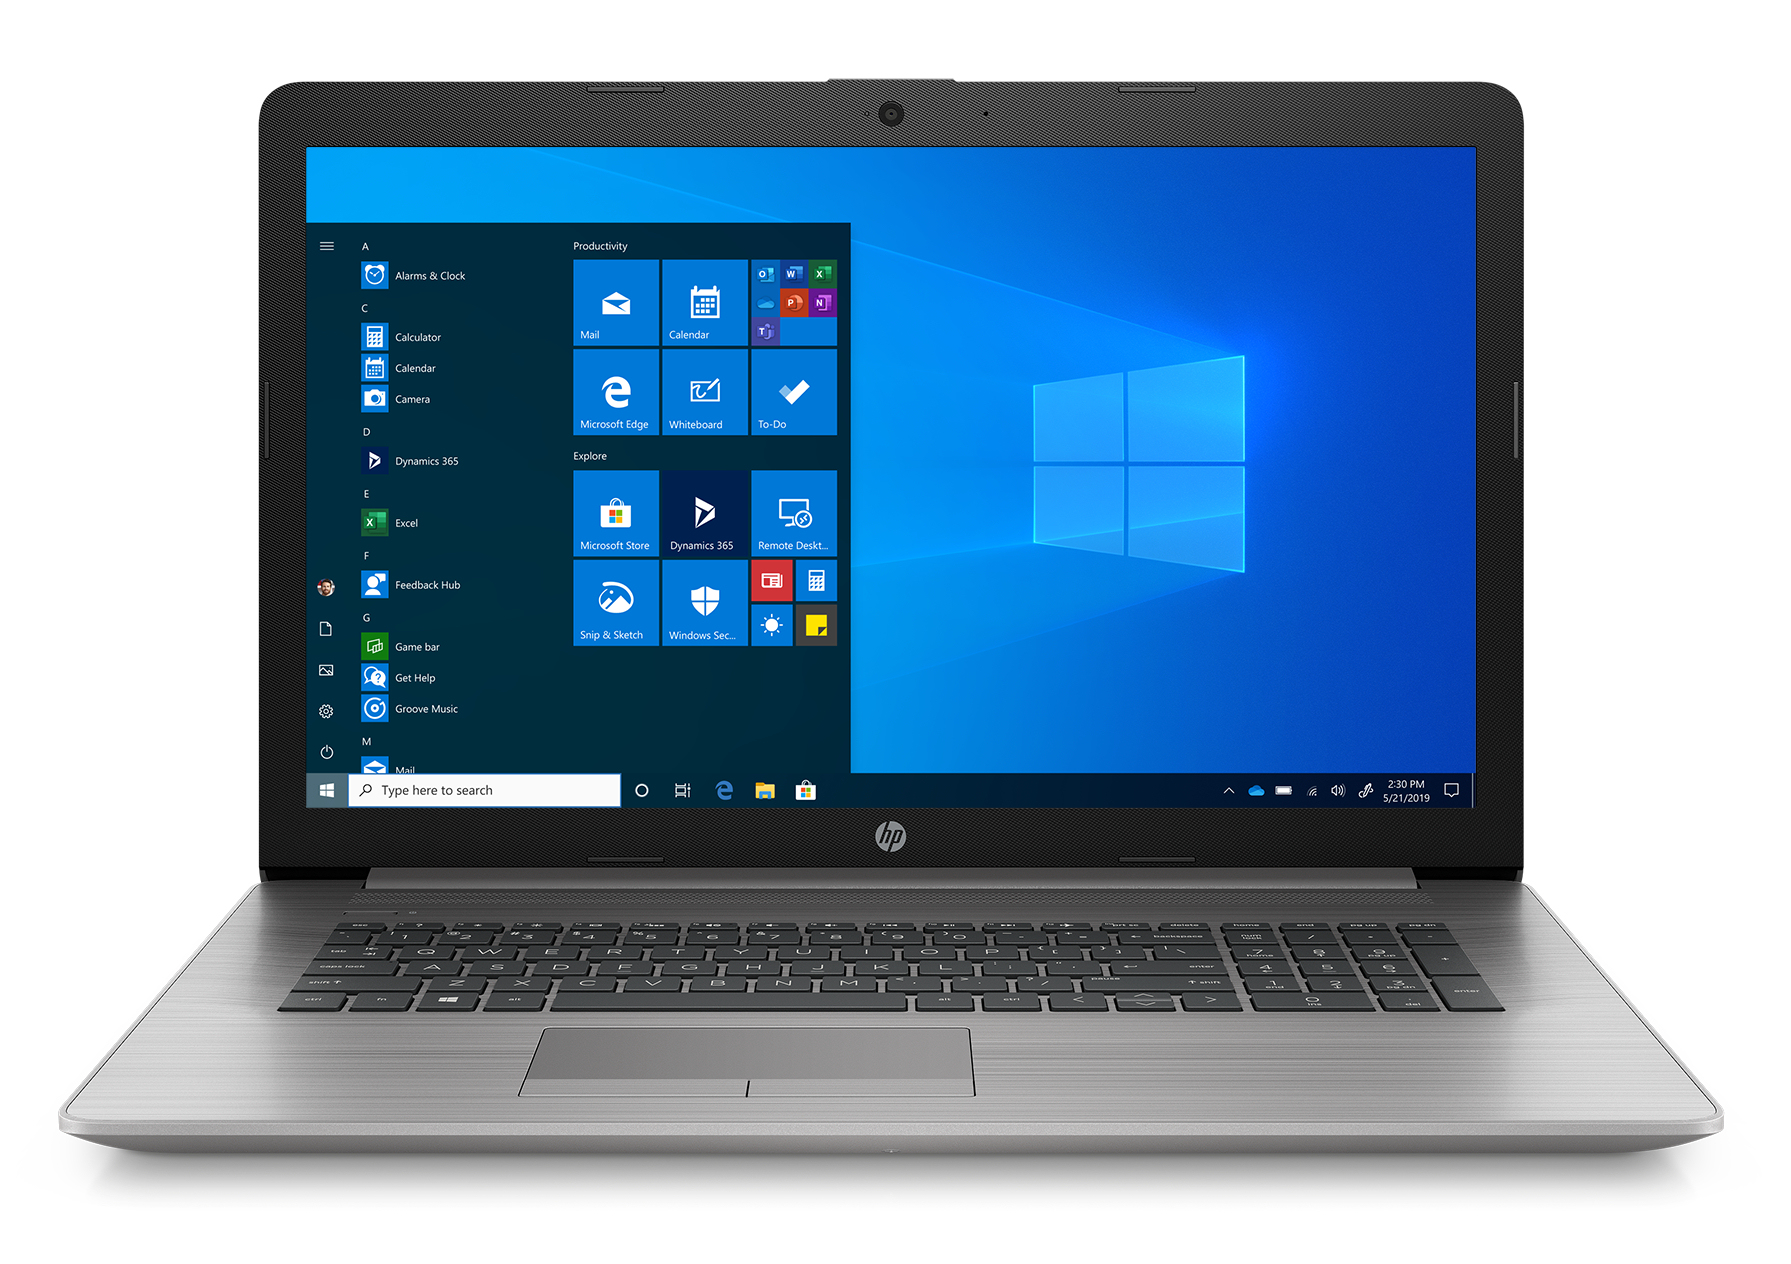
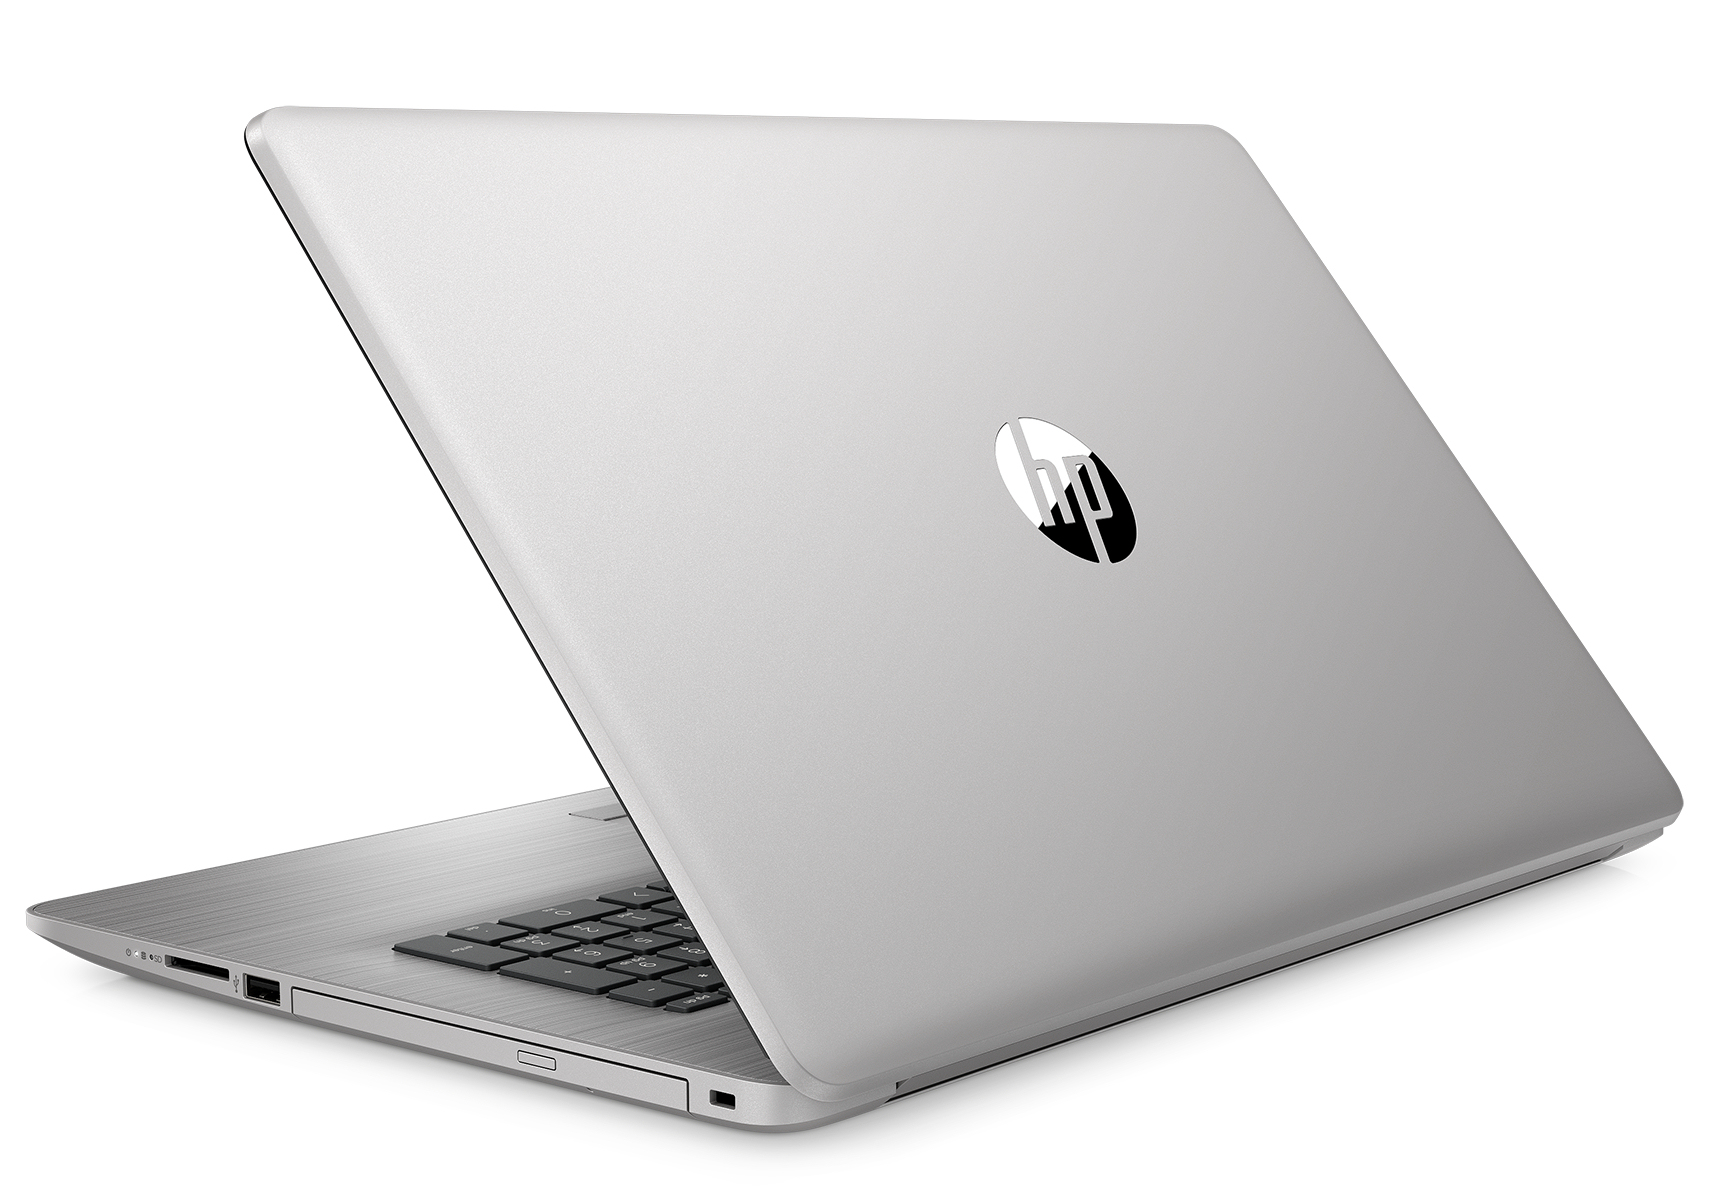
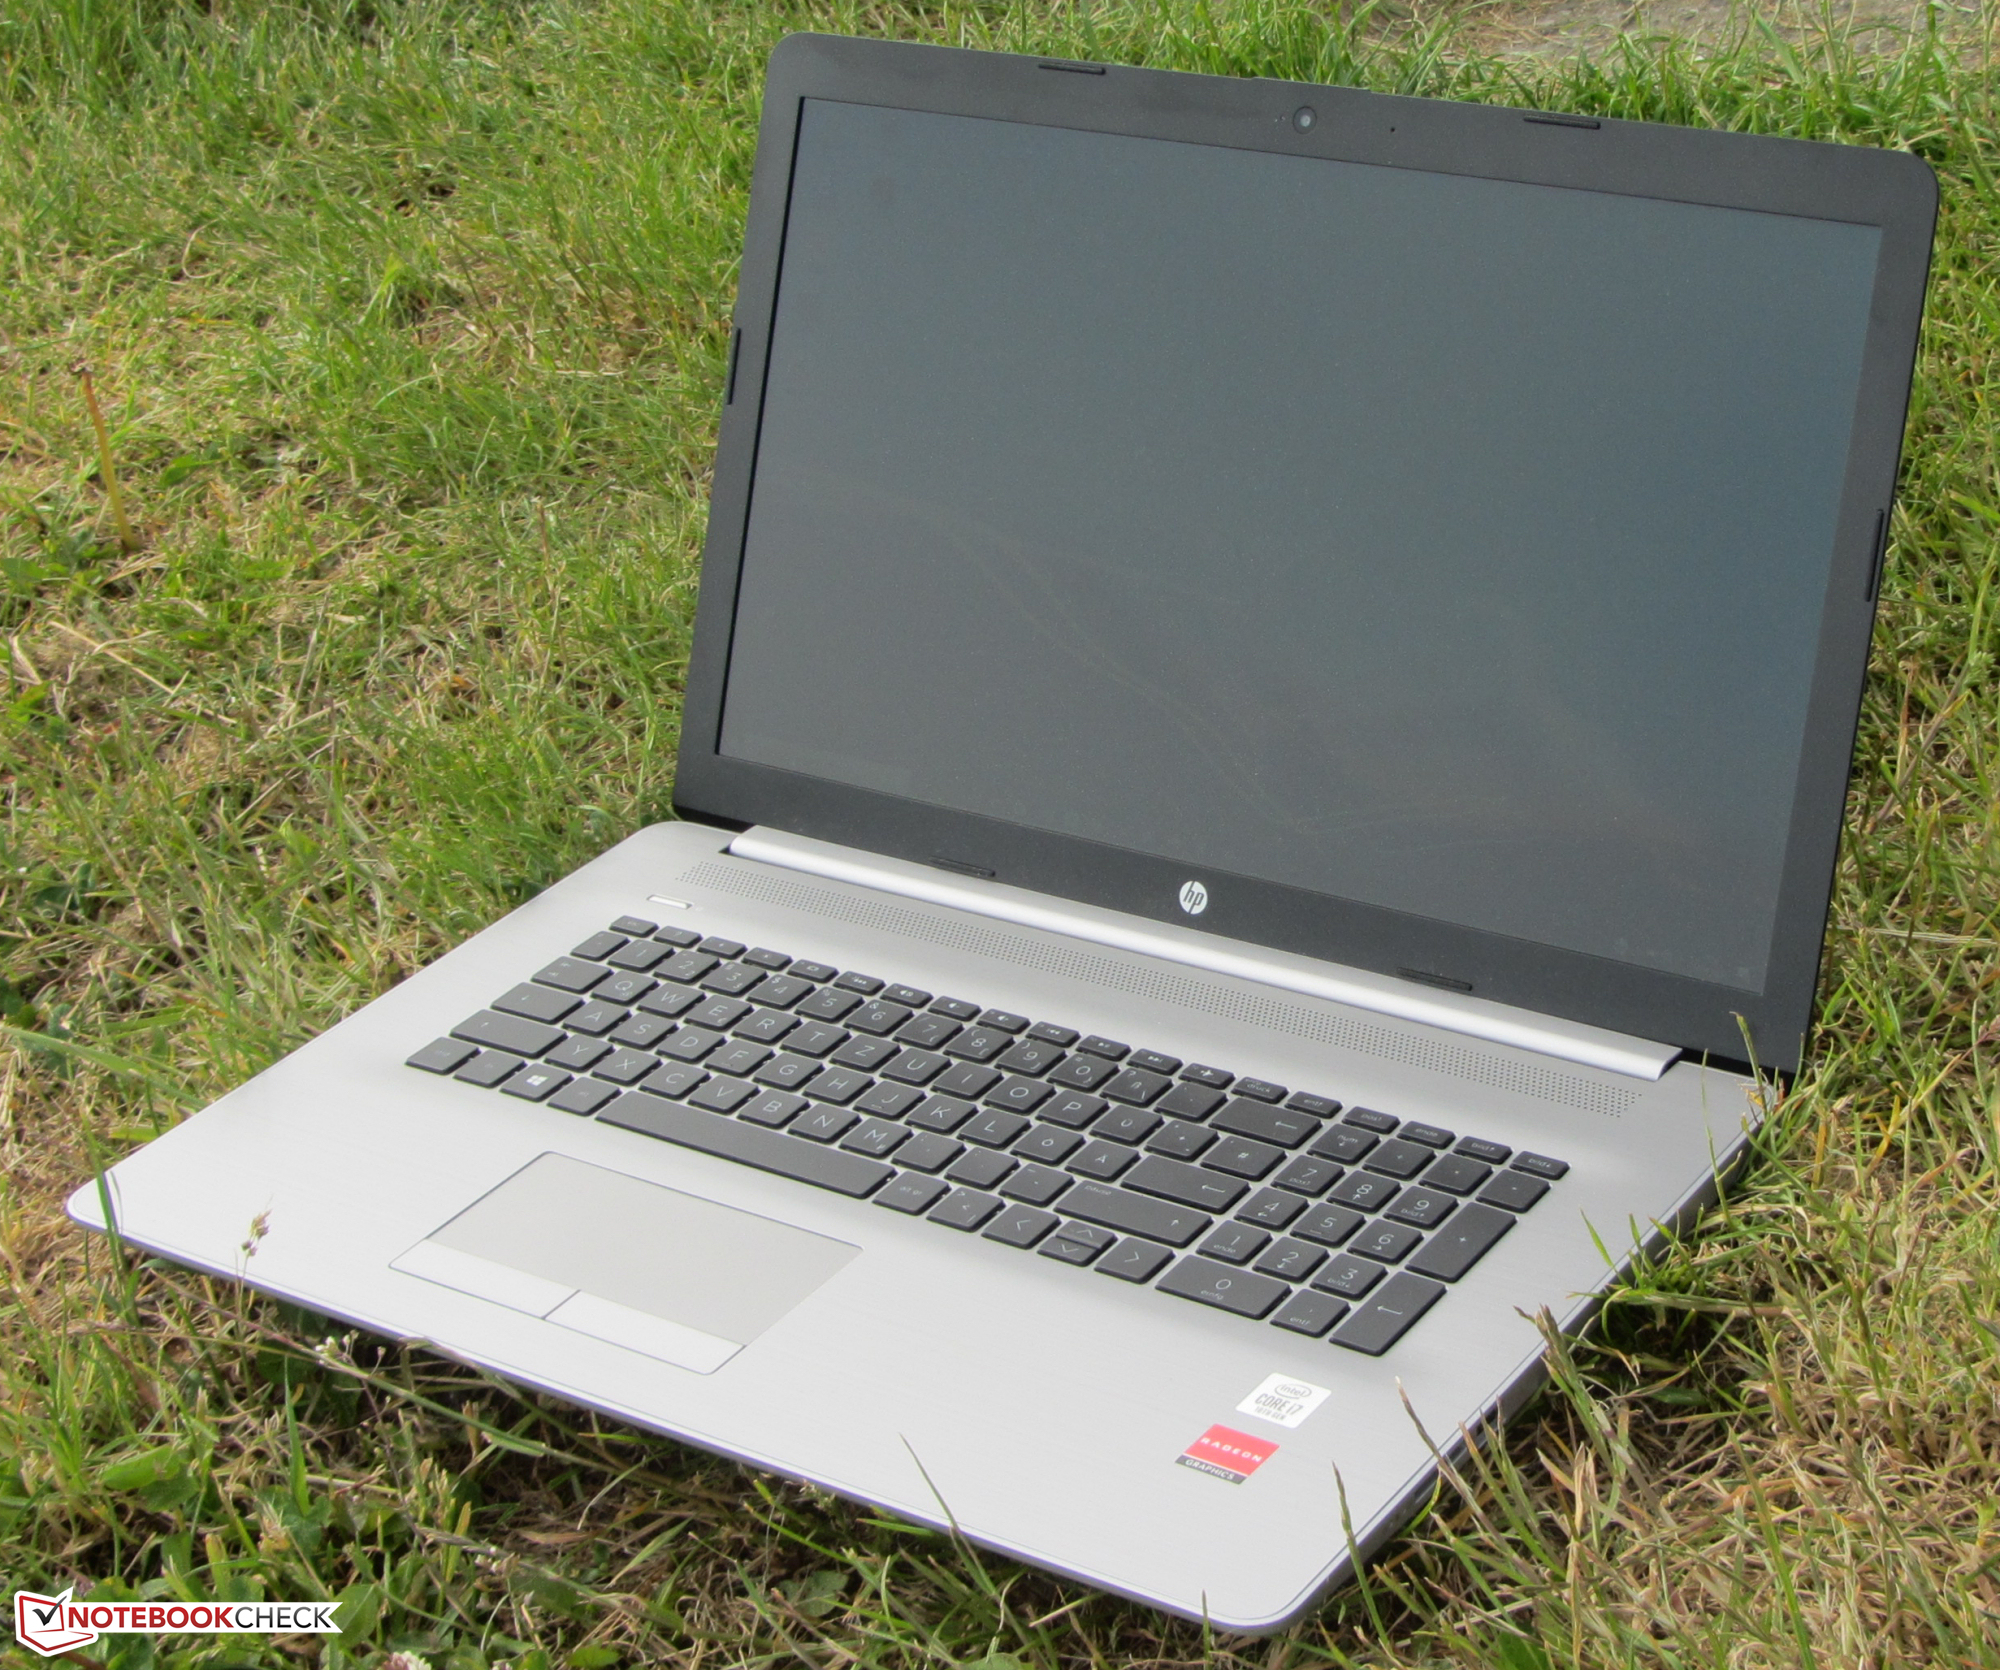
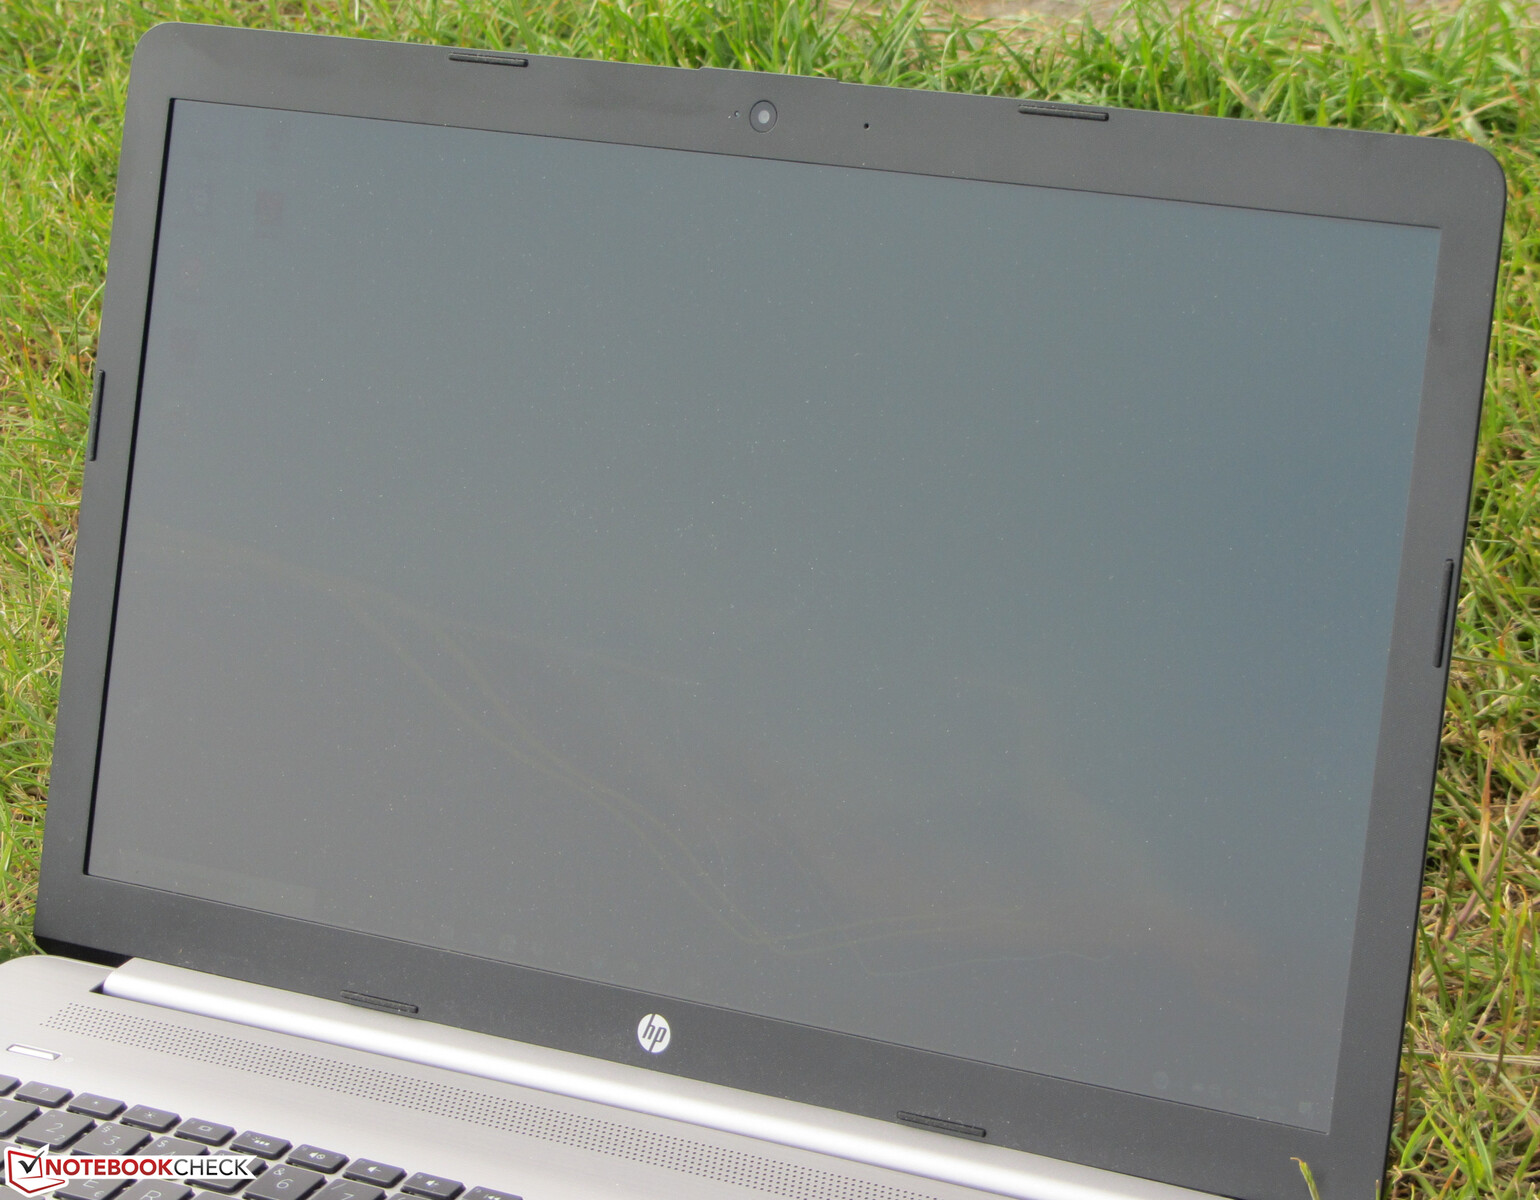
Case – 470 only available in Plastic
The 470 G7’s case is made entirely out of plastic, which is the first major difference to previous ProBook 470 devices. The latter feature a metal top case, at least some of them, and together with the ProBook moniker that, too, had to go and was replaced with a printed brushed metal texture to imitate the design. The overall color is silver-gray with a touch of black in the display bezels. The device lacks a maintenance hatch. It has to be taken apart in order to access the internal hardware. Yet another cut corner compared to ProBook 470 models that to this day feature dedicated maintenance hatches.
Overall build quality was okay, except for the poor fitting of the base’s top case. Stability is in need of improvement. We were easily able to depress the base underneath the touchpad, and warping it was a breeze. The latter is also true for the display lid. Applying pressure to the back of the display results in minor image distortions. The hinges managed to hold the display firmly in place with only some teetering. Opening the lid one-handed is possible, although it requires some finger-arm-gymnastics.
The 470 G7 is available with and without optical drive. Our review unit lacked the optical drive, and there is no way to fit one retroactively as the case itself lacks the required drive bay.
All things considered the 470 G7 is a tad smaller than its competitors, and overall comparable to the ProBook 470 G5.
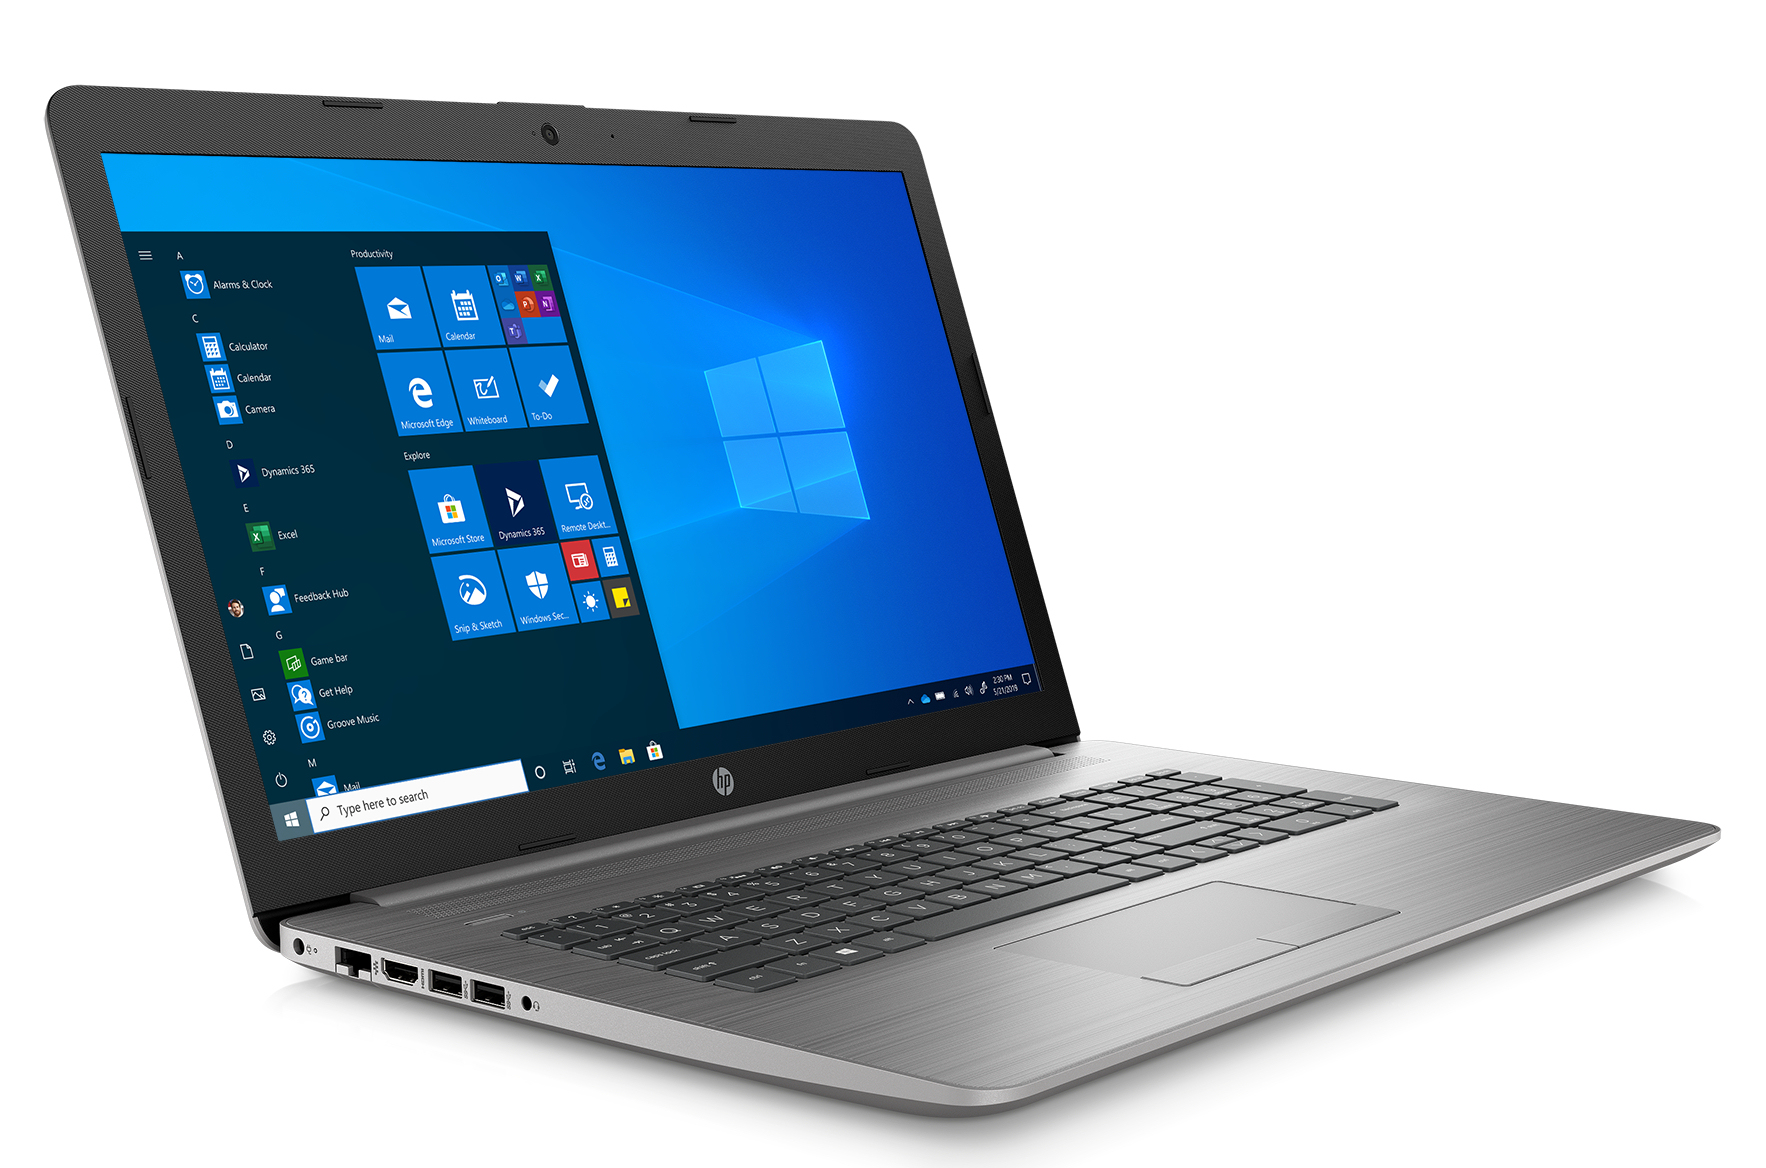
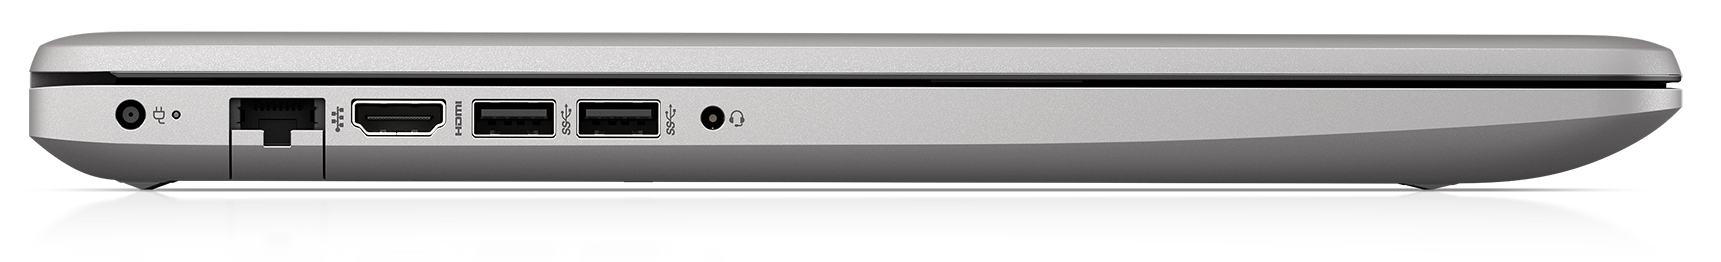
Connectivity – HP gets rid of USB-C
Connectivity is a dramatic regression compared to the ProBook 470 G5. The latter featured three video outputs (HDMI, VGA, DisplayPort via USB-C), the new model is limited to HDMI only. The USB-C port (Power Delivery, DisplayPort) was completely eliminated. The Type A ports remained unchanged, and the G7 continues to feature two USB 3.2 Gen 1 and one USB 2.0 ports.
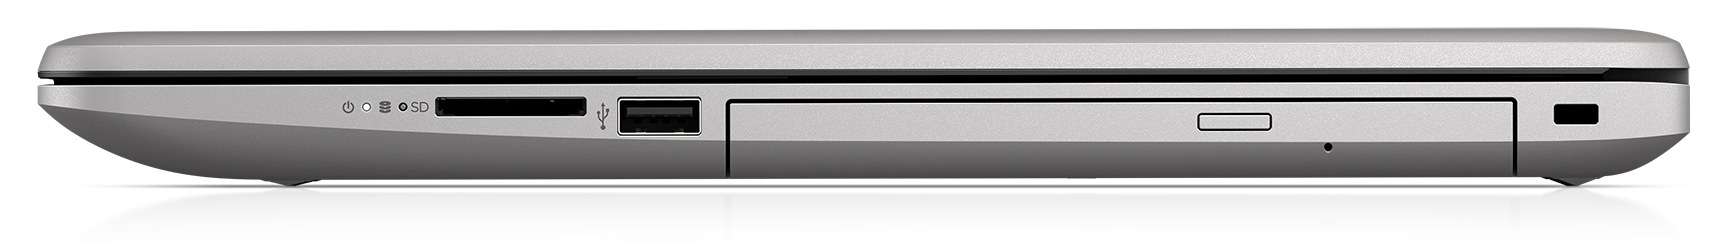
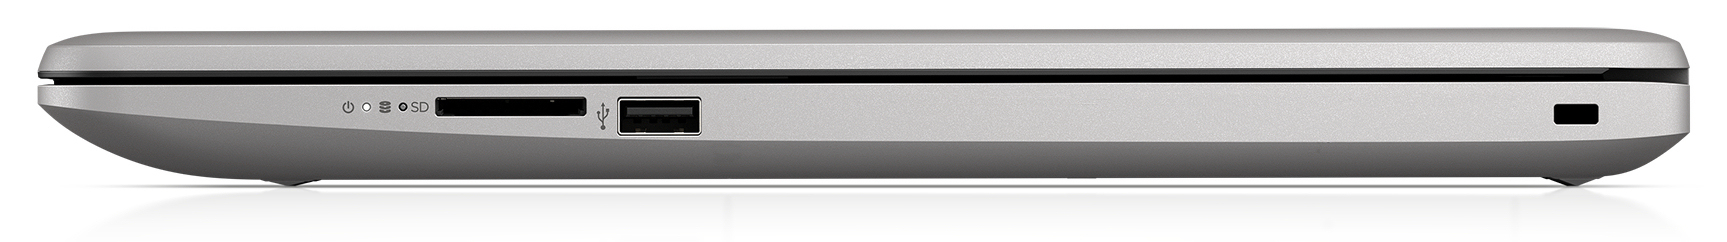
SD Card Reader
The built-in card reader swallows inserted SD cards almost entirely save for a 4 mm (~0.16 in) protrusion. With transfer rates of 35.1 MB/s (copying around 250 5 MB large JPEG files) and 34.9 MB/s (copying large blocks) it turned out to be one of the slower units. All tests were performed with our 64 GB Toshiba Exceria Pro SDXC UHS-II reference card.
| SD Card Reader | |
| average JPG Copy Test (av. of 3 runs) | |
| HP ProBook 470 G5 (Toshiba Exceria Pro SDXC 64 GB UHS-II) | |
| Average of class Office (19.8 - 198.5, n=22, last 2 years) | |
| HP 470 G7 8VU24EA (Toshiba Exceria Pro SDXC 64 GB UHS-II) | |
| Lenovo IdeaPad 330-17IKB 81DM (Toshiba Exceria Pro SDXC 64 GB UHS-II) | |
| Dell Inspiron 17 3780 (Toshiba Exceria Pro SDXC 64 GB UHS-II) | |
| maximum AS SSD Seq Read Test (1GB) | |
| HP ProBook 470 G5 (Toshiba Exceria Pro SDXC 64 GB UHS-II) | |
| Average of class Office (27.4 - 249, n=21, last 2 years) | |
| HP 470 G7 8VU24EA (Toshiba Exceria Pro SDXC 64 GB UHS-II) | |
| Dell Inspiron 17 3780 (Toshiba Exceria Pro SDXC 64 GB UHS-II) | |
| Lenovo IdeaPad 330-17IKB 81DM (Toshiba Exceria Pro SDXC 64 GB UHS-II) | |
Communication
HP’s Wi-Fi chip of choice, Intel’s Wi-Fi 6 AX201, supports 802.11 a/b/g/n/ac/ax as well as Bluetooth 5. Its performance was very good under ideal conditions (no other Wi-Fi devices nearby, short distance between notebook and server). Wired communications are handled by a Realtek RTL8168/8111 ethernet chip that worked flawlessly and without any issues.
Webcam
The built-in 0.9 MP webcam offers a maximum resolution of 1280x720 pixels. The results were somewhat washed-out, and colors were inaccurate resulting in a DeltaE deviation of 19 (ideal: less than 3).


Accessories
There are no extras in the box besides the usual documentation (warranty booklet, quick-start guide).
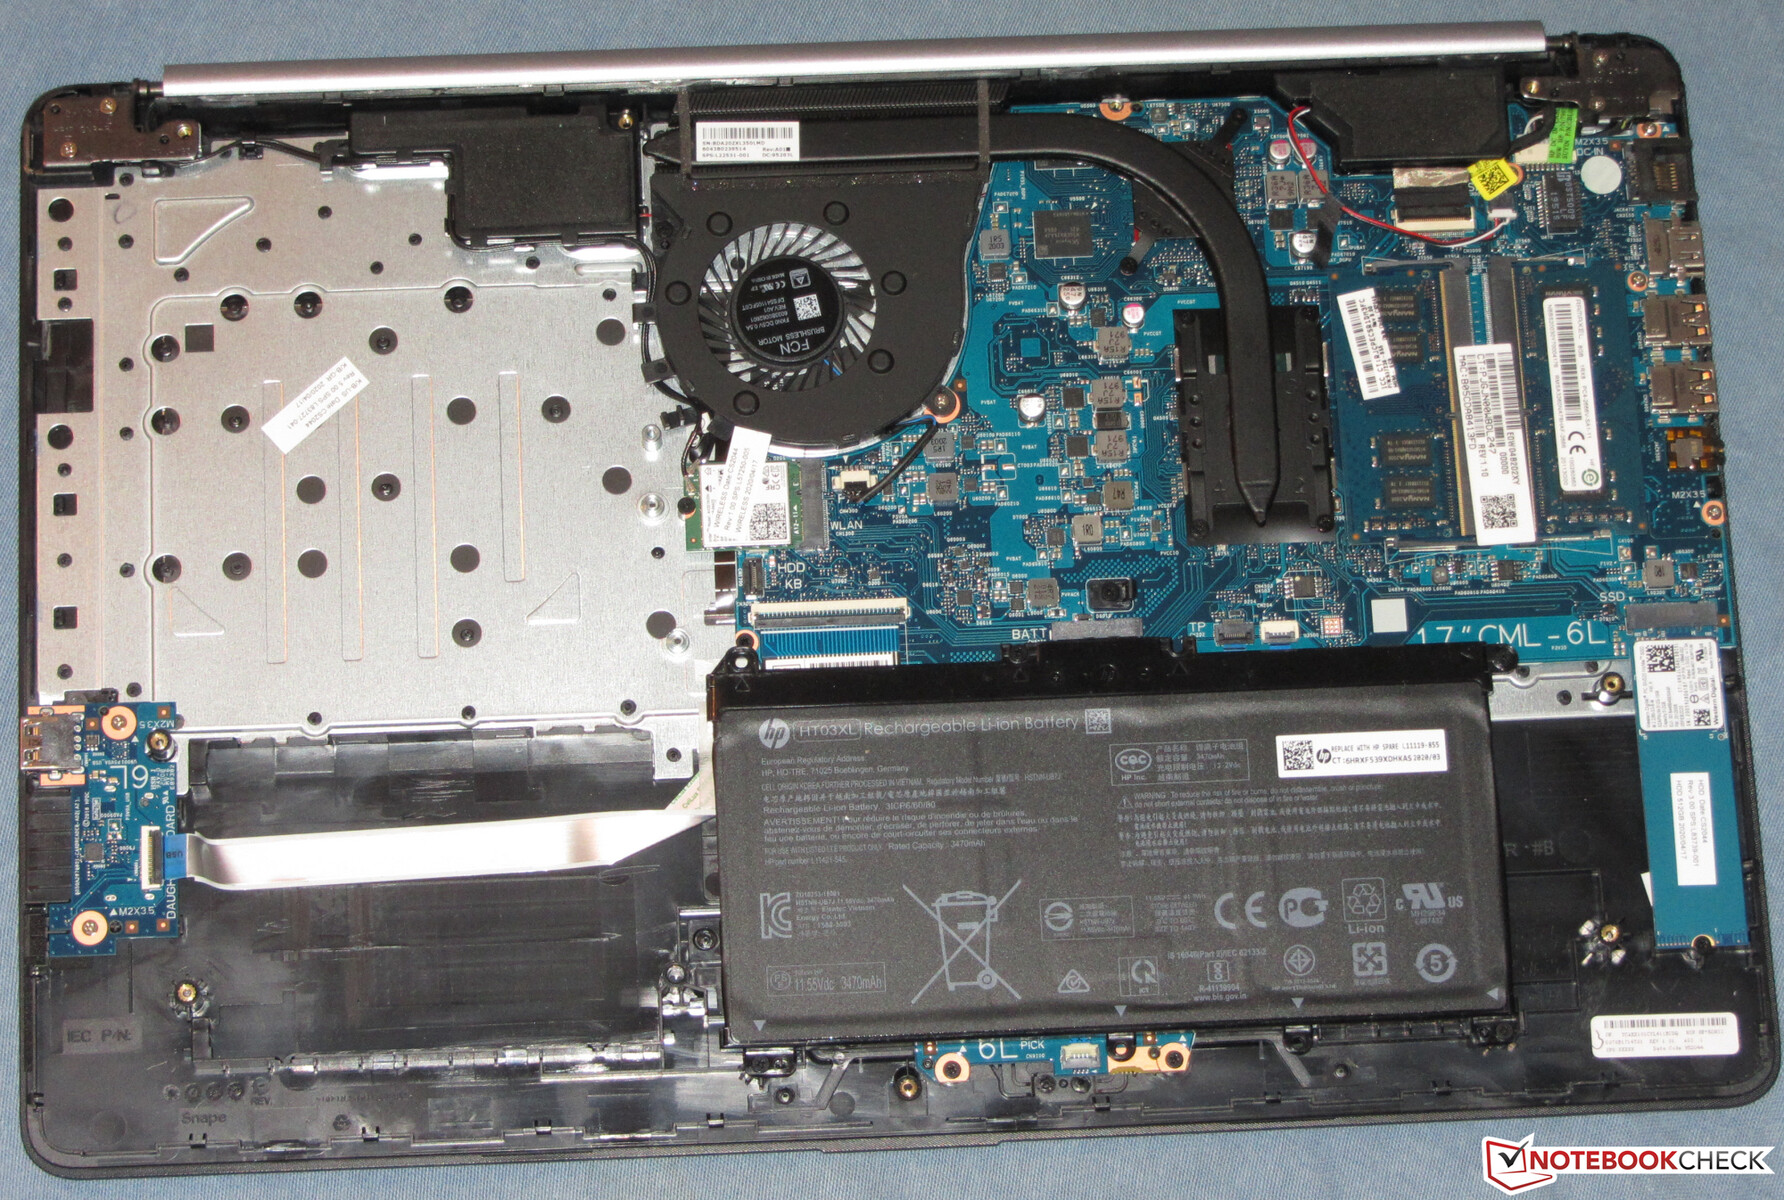
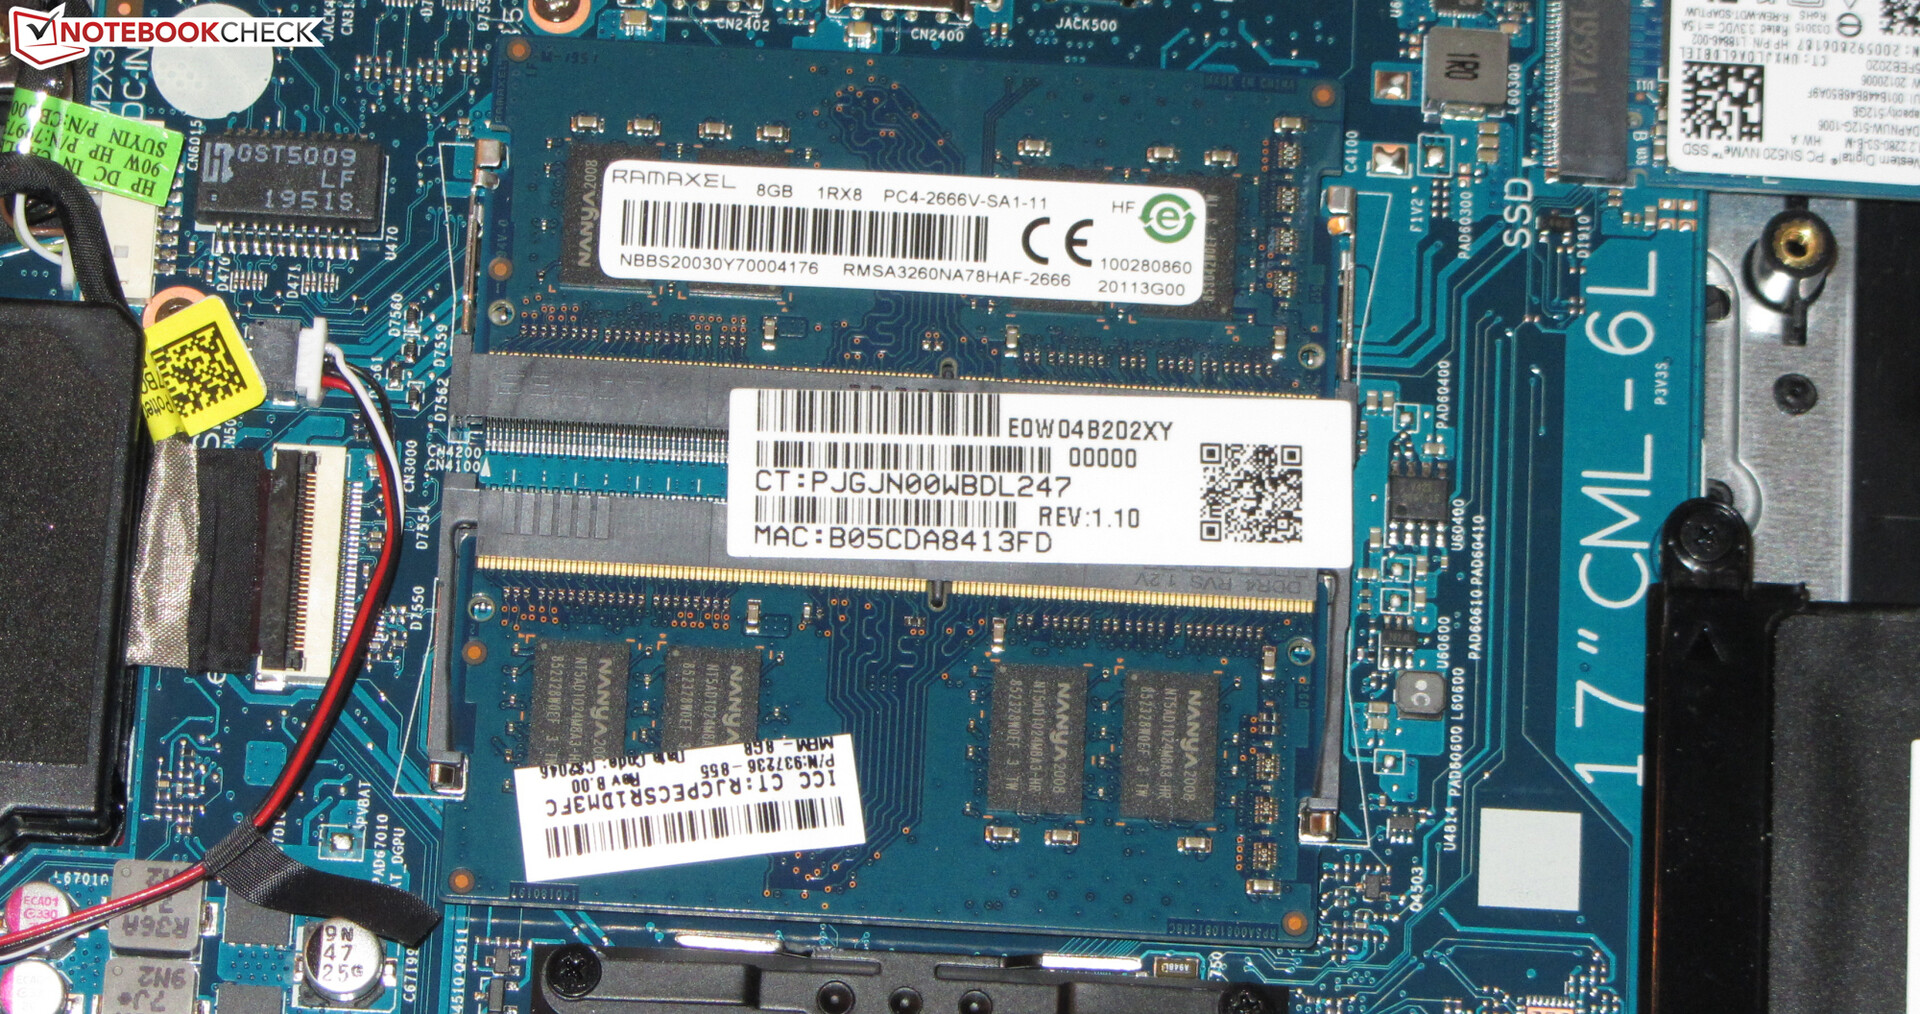
Maintenance
While the ProBook 470 laptops were very easily upgraded and maintained thanks to their integrated maintenance hatch, HP has made this task much more arduous on the 470 G7. The bottom cover needs to be removed in order to access the internal hardware, which requires removal of all screws including the two hidden ones underneath the rubber strips. The latter need to be removed very carefully as to not tear in half. Once all screws are removed you need a plastic spudger to carefully pry the case open. We suggest taking a look at HP’s maintenance manual first.
Warranty
Depending on country of purchase the 17.3-inch laptop is available with up to three years of warranty, including pickup and return service by default, which can be extended even further to include additional services, such as for example on-site service. Prices and availability for these additional services and warranty extensions vary by region and country.
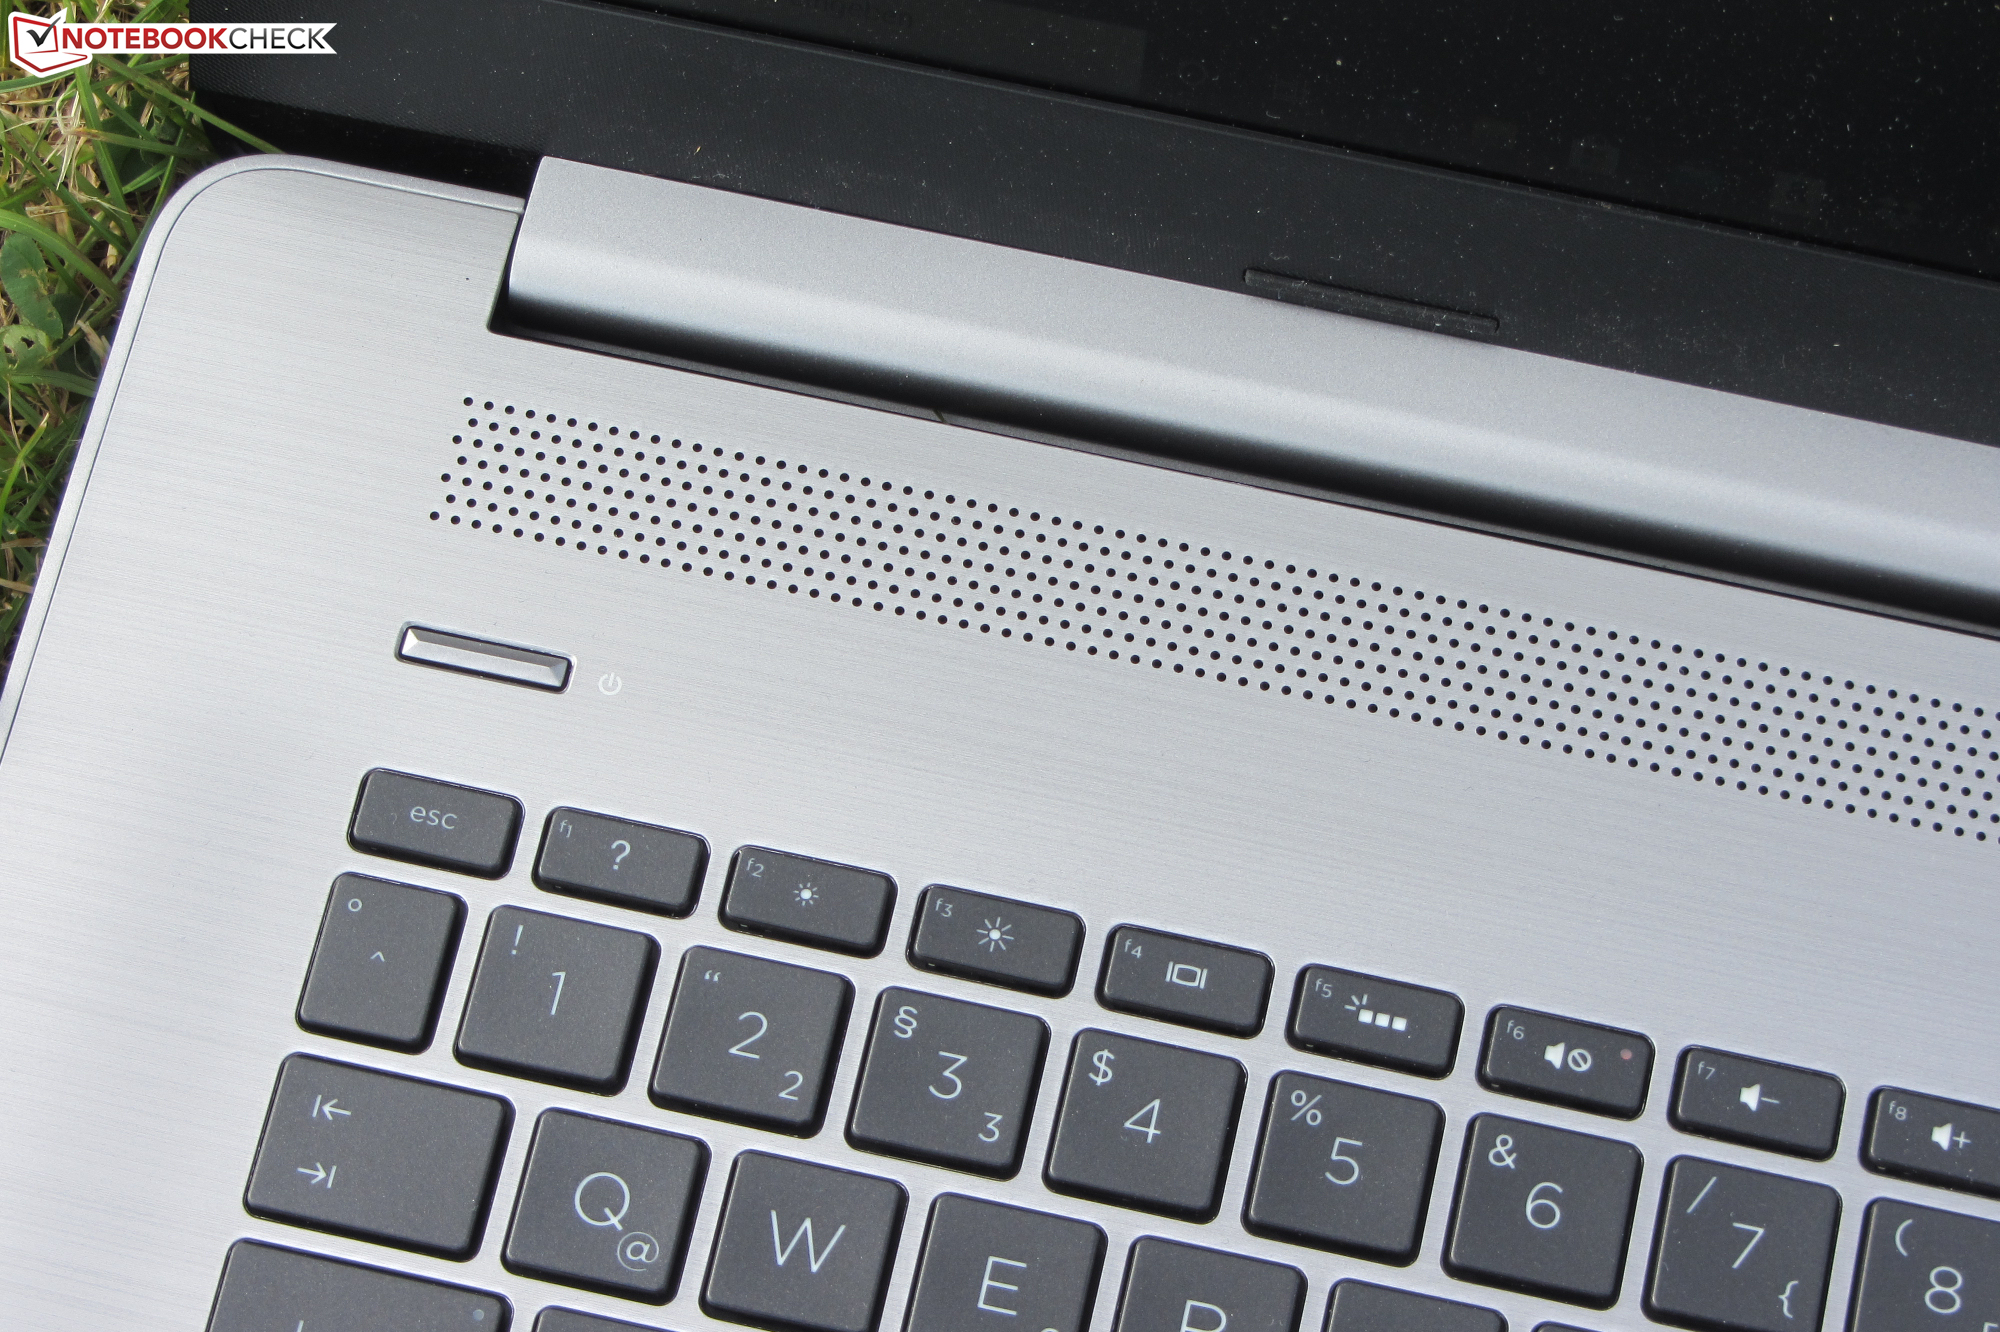
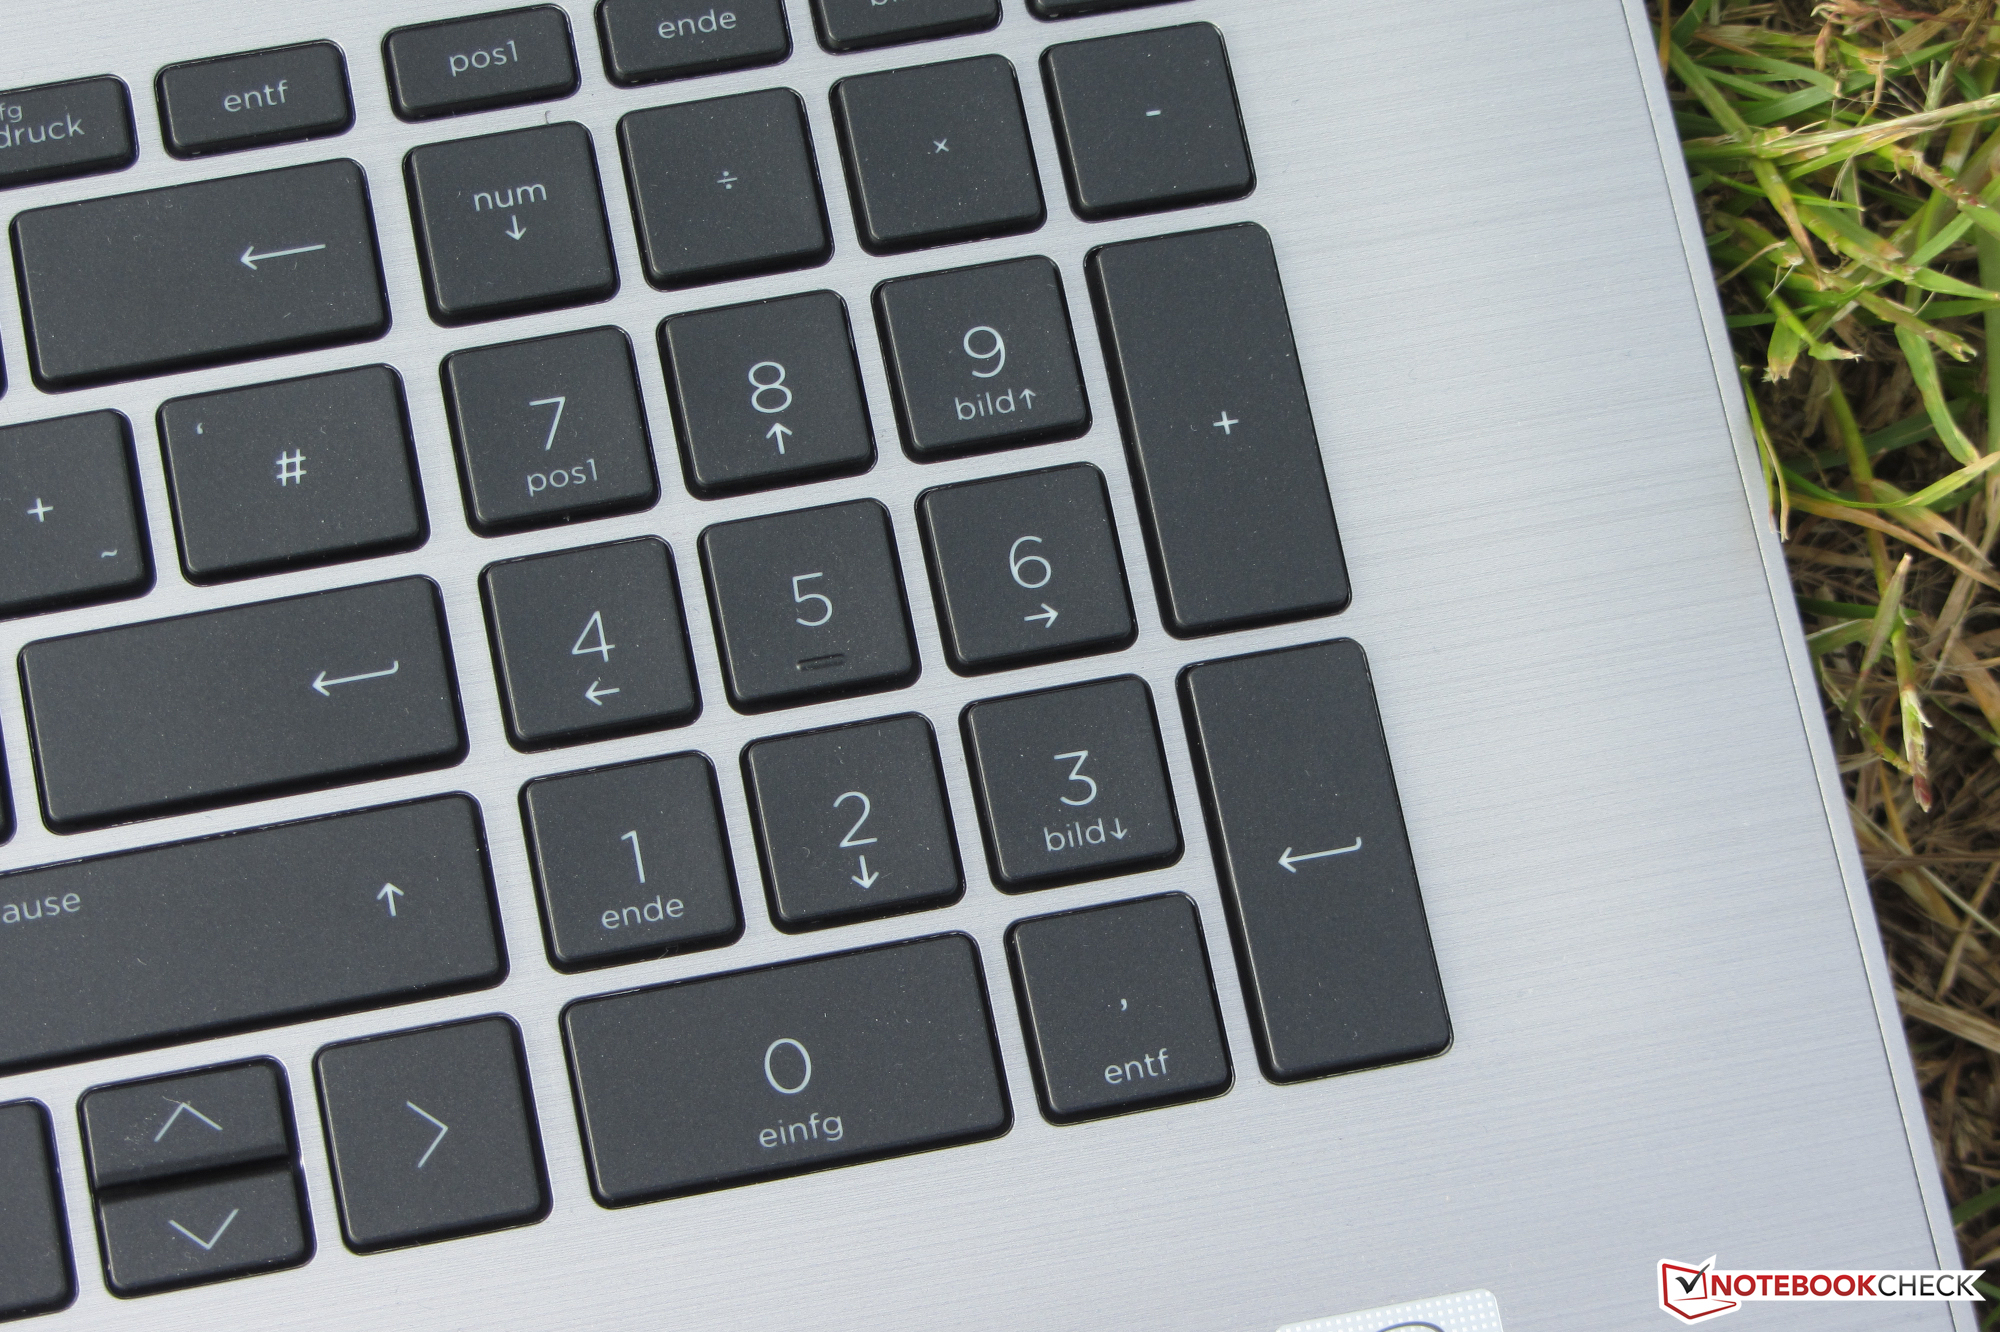
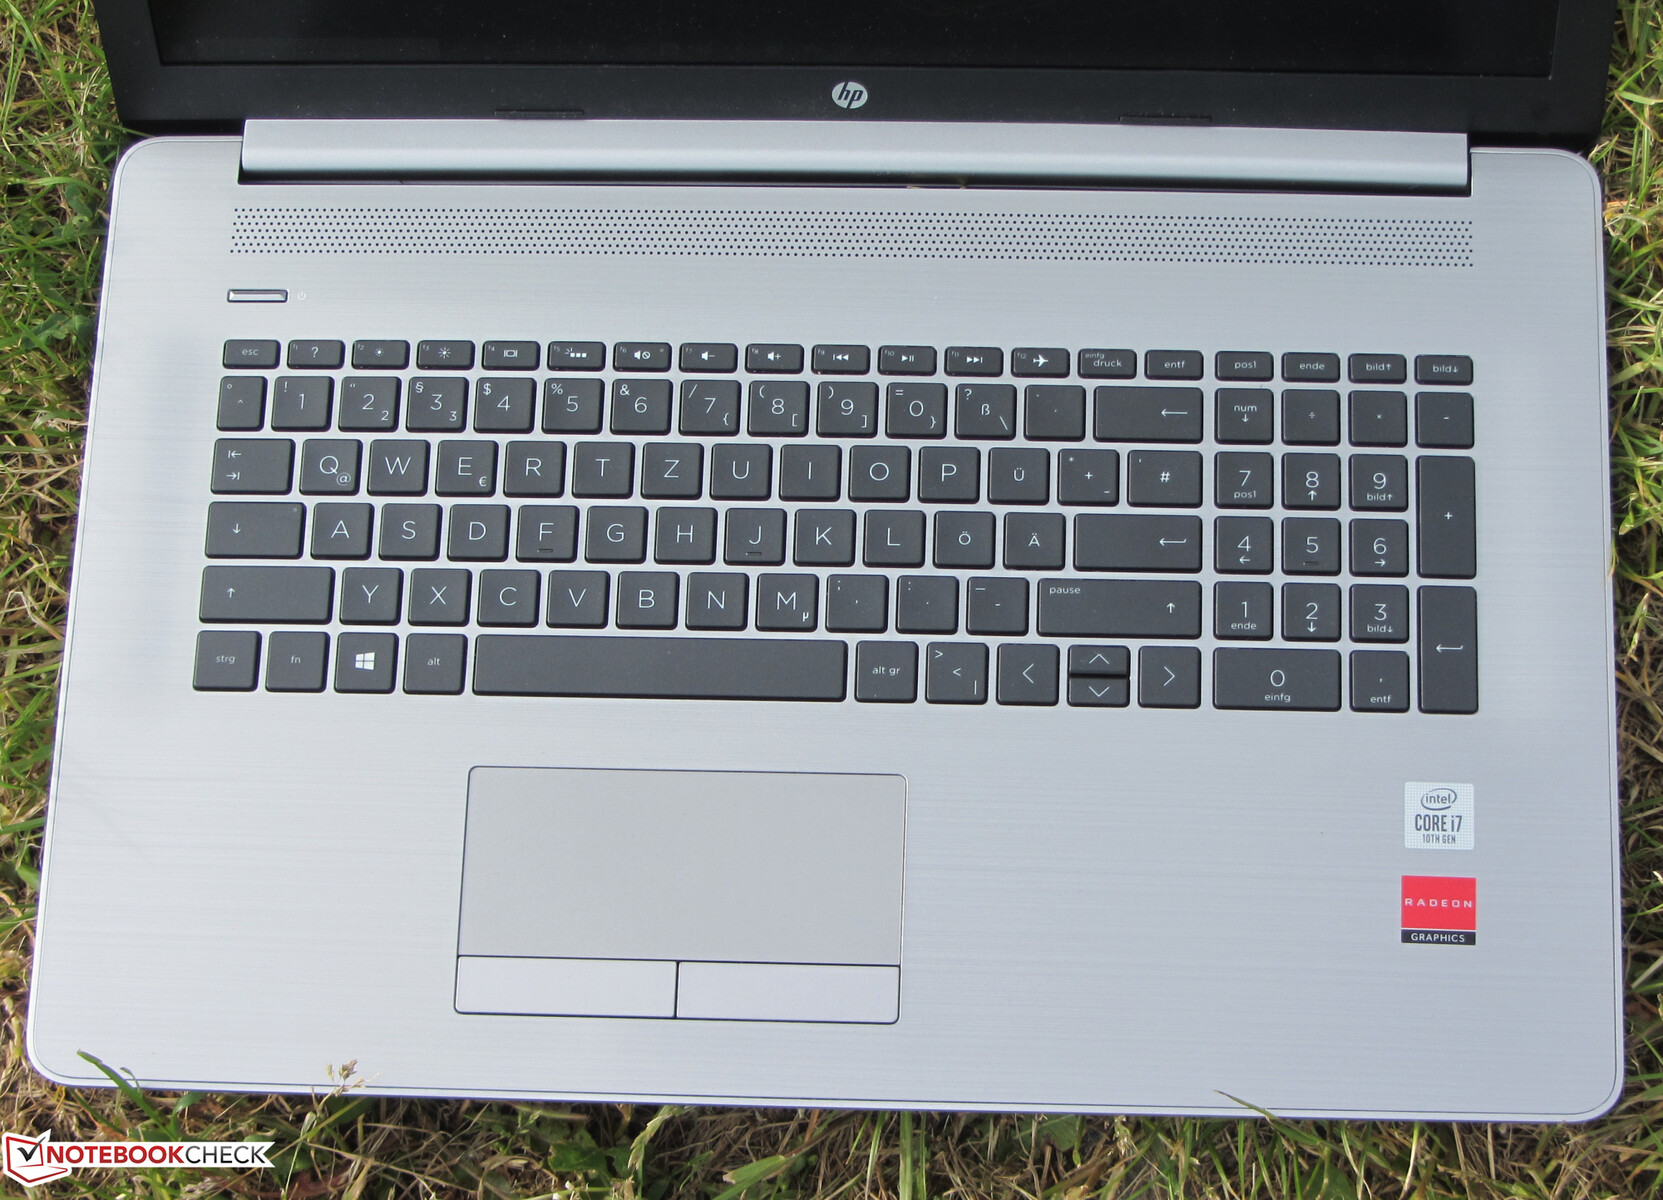
Input Devices – HP Laptop with Backlit Keyboard
Keyboard
The laptop comes with a backlit chiclet keyboard with smooth and level keycaps, medium key travel, and a very clear accentuation point. We liked the key resistance overall. The keyboard flexed slightly while typing. This did not bother us. A two-stage backlight can be enabled and controlled via a function key. All things considered the keyboard was usable.
Touchpad
The multi-touch touchpad is around 11.5 x 5.1 cm large (4.5 x 2 inches). Its smooth surface did not impede usability. The touchpad was usable up to its very edges. The two dedicated mouse buttons feature short key travel and a clear accentuation point.
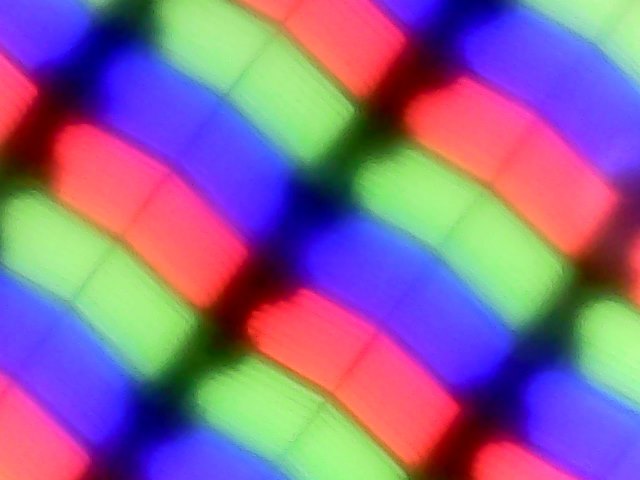
Display – IPS Panel for the HP Notebook
The 470 G7’s matte 17.3-inch display runs at a native resolution of 1920x1080 pixels. Its maximum brightness of 281.3 nits and the contrast ratio of 966:1 are barely acceptable, and too low for a notebook in the G7’s price range. We expect results north of 300 nits and 1000:1.
The panel displayed PWM flickering at a frequency of just 250 Hz, which is low enough to cause headaches or eyesore in sensitive people.
| |||||||||||||||||||||||||
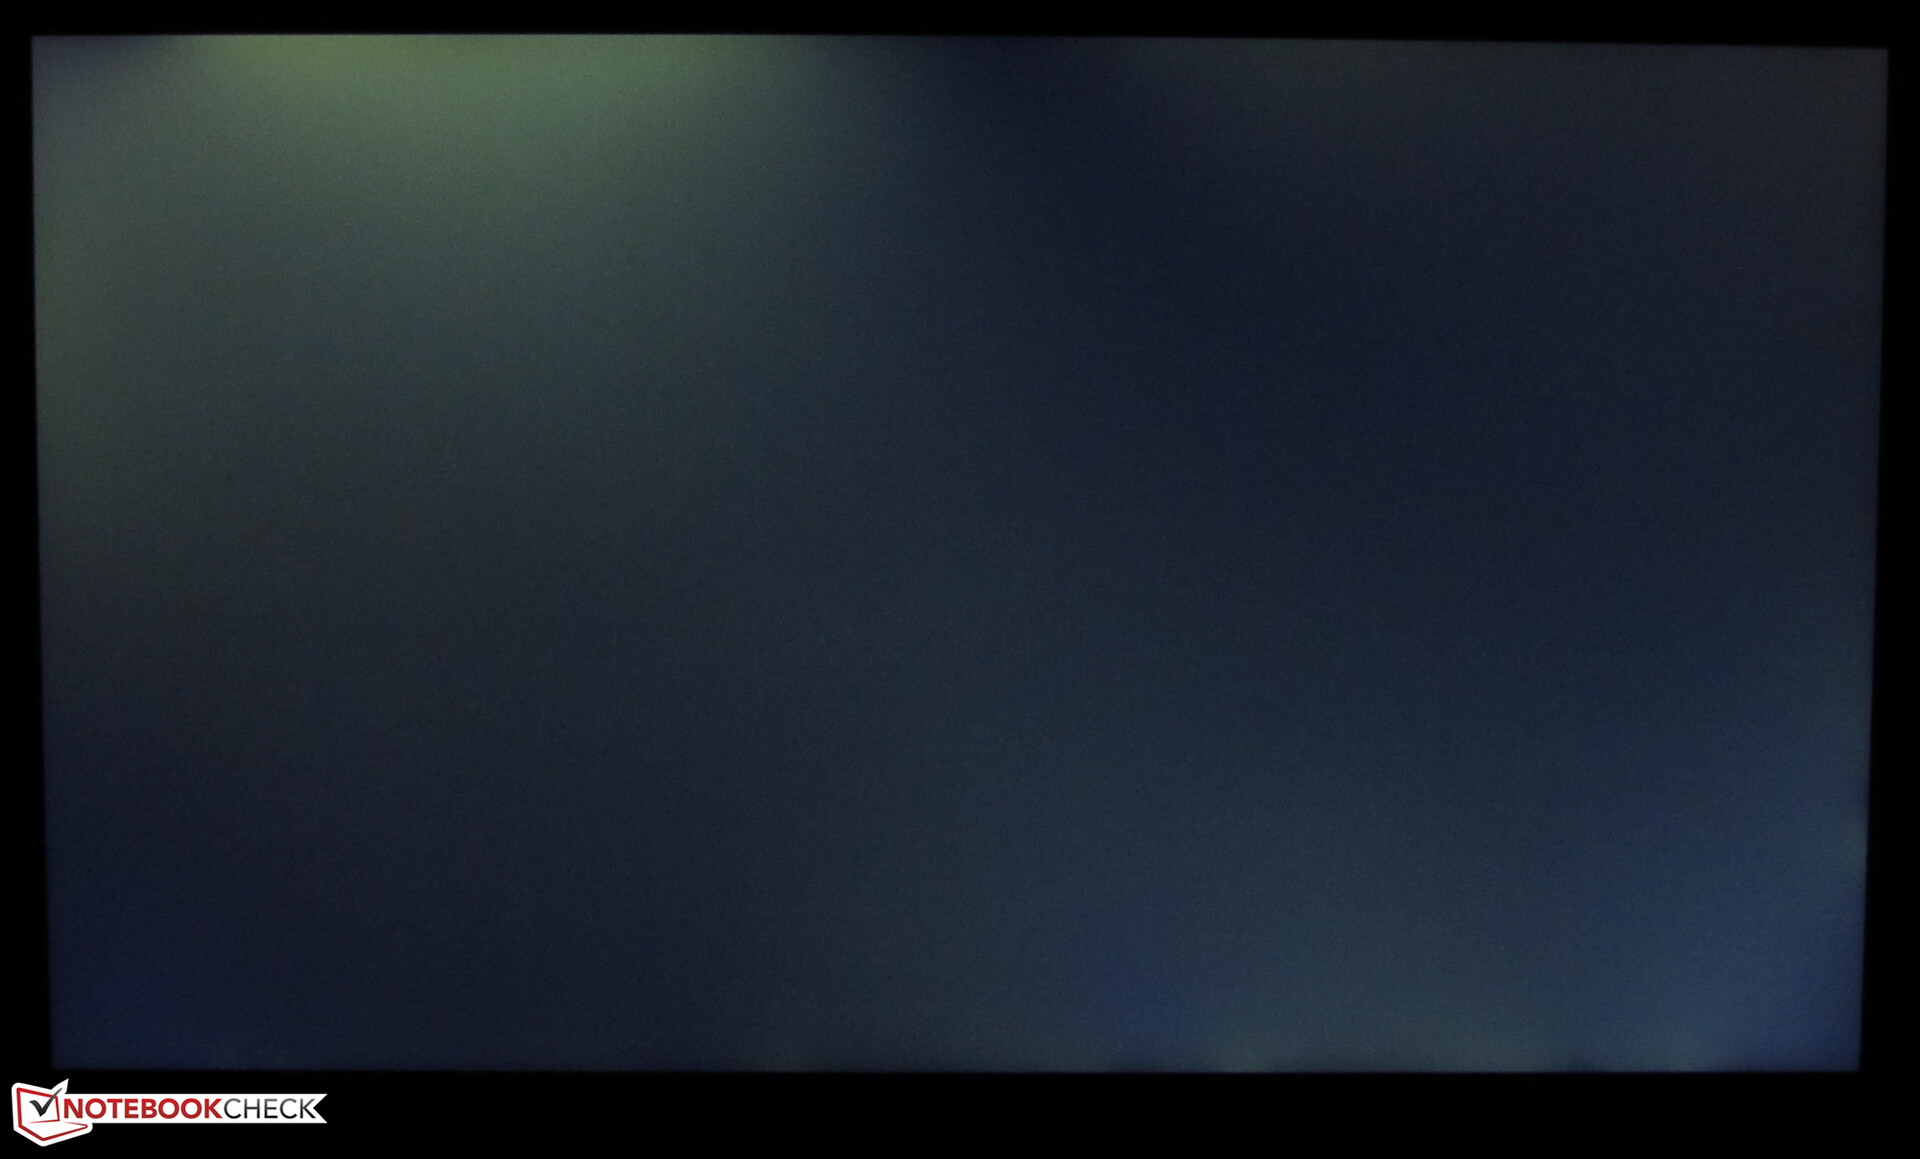
Brightness Distribution: 83 %
Center on Battery: 237 cd/m²
Contrast: 966:1 (Black: 0.29 cd/m²)
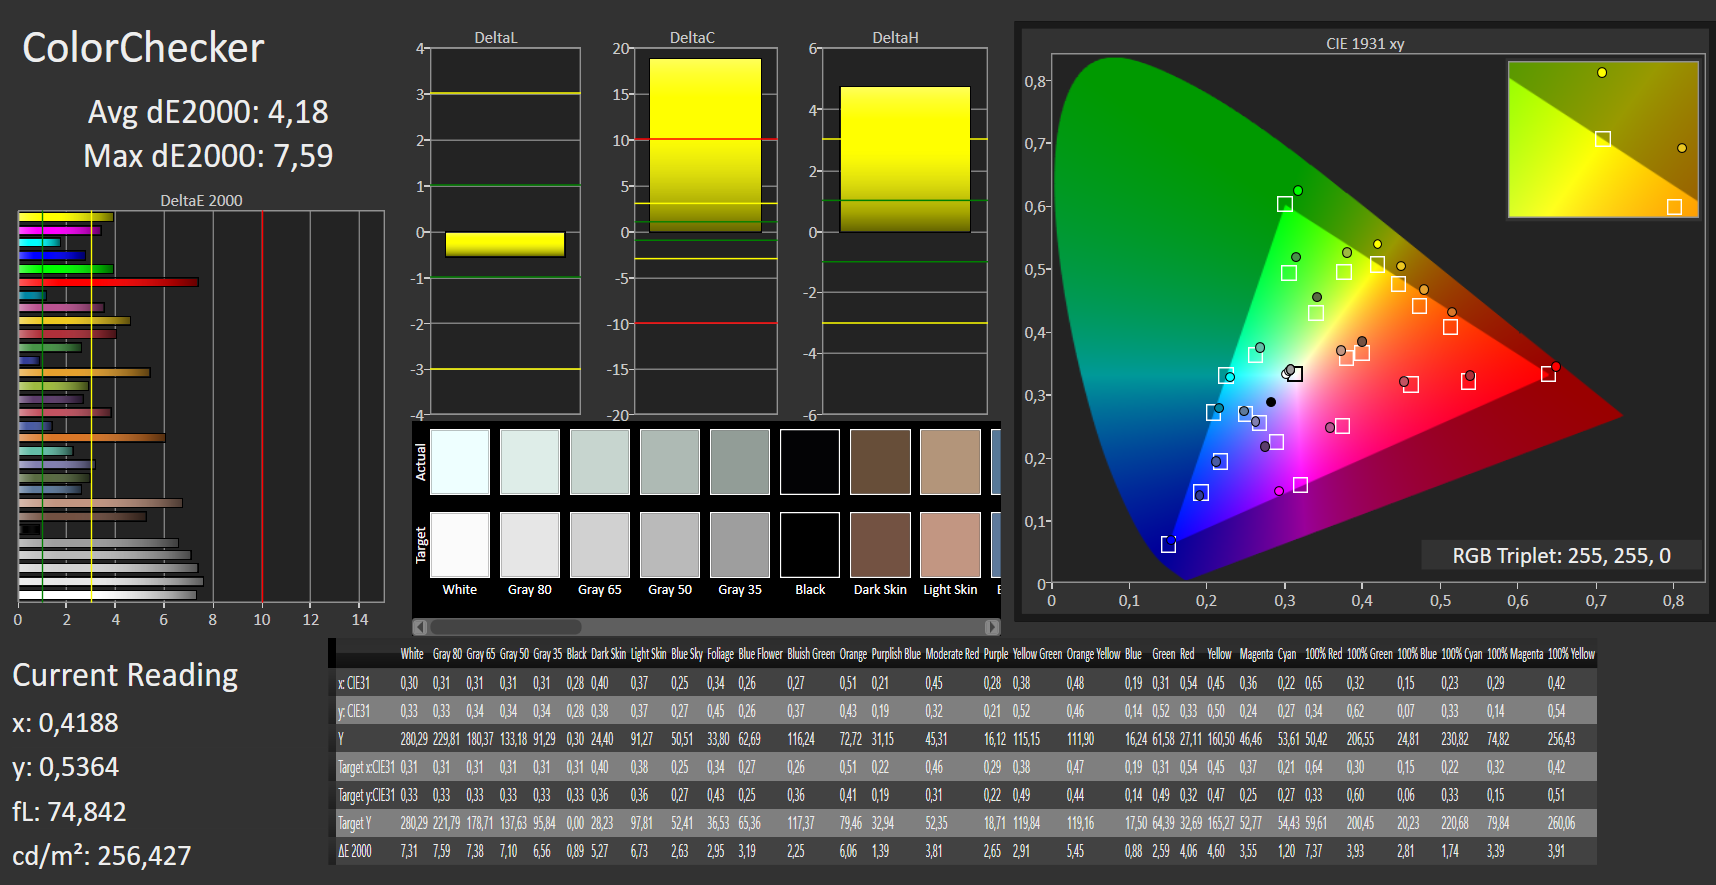
ΔE ColorChecker Calman: 4.18 | ∀{0.5-29.43 Ø4.73}
calibrated: 2
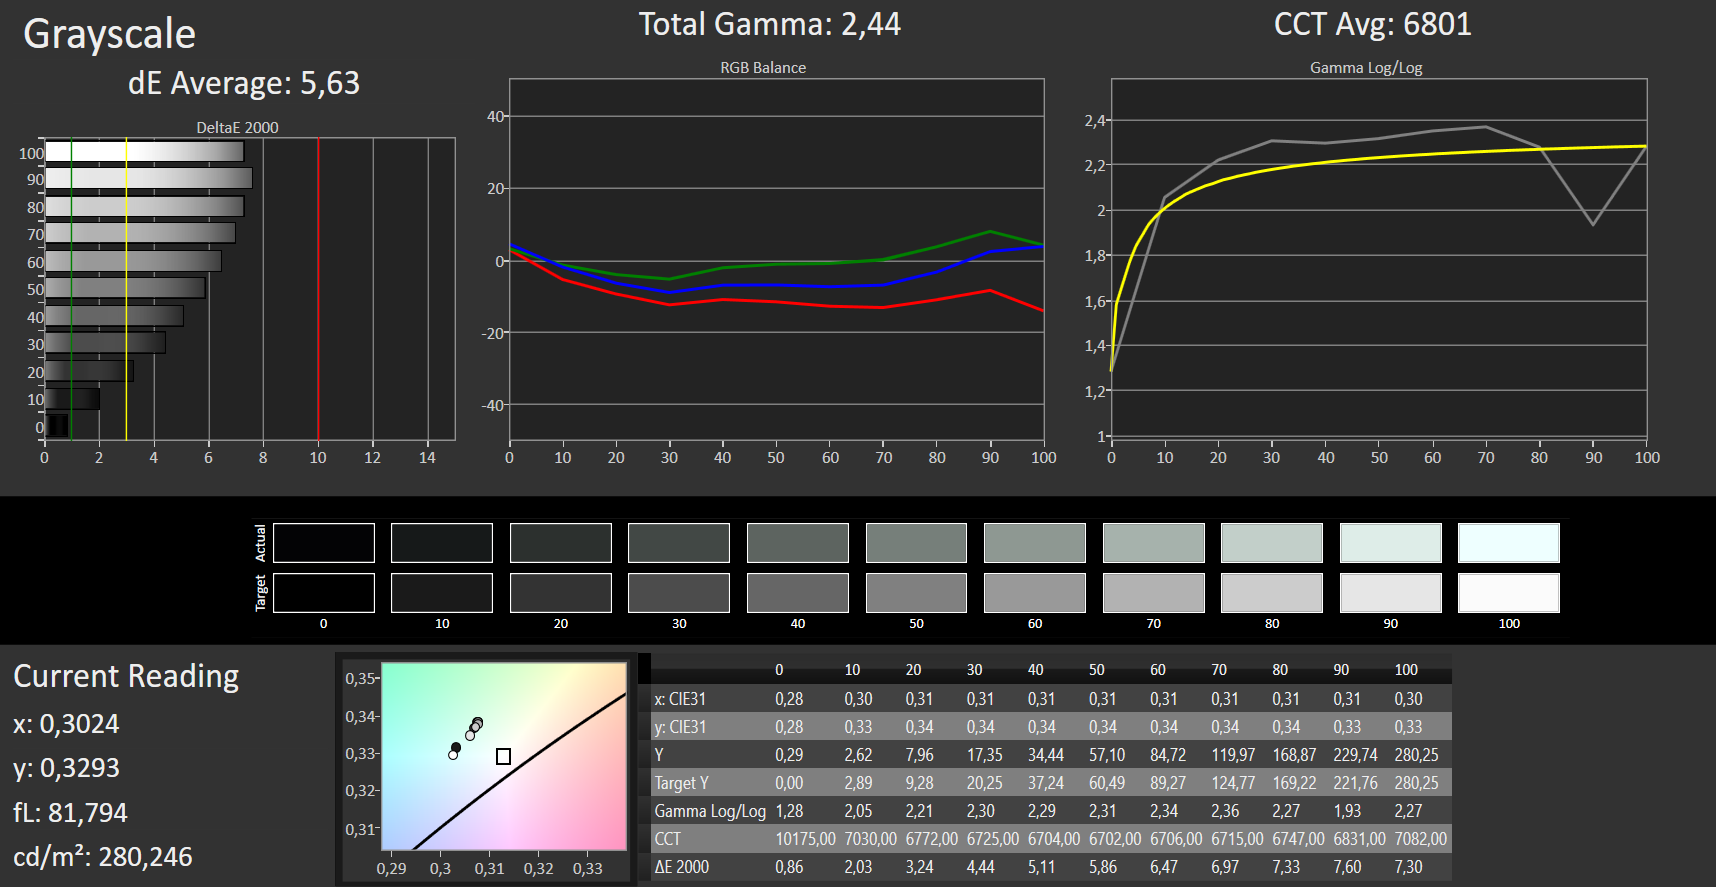
ΔE Greyscale Calman: 5.63 | ∀{0.09-98 Ø4.97}
92% sRGB (Argyll 1.6.3 3D)
60% AdobeRGB 1998 (Argyll 1.6.3 3D)
67.5% AdobeRGB 1998 (Argyll 3D)
92.3% sRGB (Argyll 3D)
69.1% Display P3 (Argyll 3D)
Gamma: 2.44
CCT: 6801 K
| HP 470 G7 8VU24EA IPS, 1920x1080, 17.3" | HP ProBook 470 G5 IPS, 1920x1080, 17.3" | Dell Inspiron 17 3780 IPS, 1920x1080, 17.3" | Lenovo IdeaPad 330-17IKB 81DM TN LED, 1600x900, 17.3" | Lenovo Ideapad L340-17API-81LY0004GE TN LED, 1600x900, 17.3" | |
|---|---|---|---|---|---|
| Display | -7% | -5% | -17% | -23% | |
| Display P3 Coverage (%) | 69.1 | 66.1 -4% | 63.7 -8% | 56.9 -18% | 51.1 -26% |
| sRGB Coverage (%) | 92.3 | 84.4 -9% | 88.9 -4% | 76.3 -17% | 73.9 -20% |
| AdobeRGB 1998 Coverage (%) | 67.5 | 61.8 -8% | 64.6 -4% | 55.9 -17% | 52.7 -22% |
| Response Times | 11% | -14% | 32% | 32% | |
| Response Time Grey 50% / Grey 80% * (ms) | 42 ? | 36 ? 14% | 46 ? -10% | 38.8 ? 8% | 42 ? -0% |
| Response Time Black / White * (ms) | 30 ? | 28 ? 7% | 35.2 ? -17% | 13.6 ? 55% | 11 ? 63% |
| PWM Frequency (Hz) | 250 | ||||
| Screen | -6% | 1% | -66% | -63% | |
| Brightness middle (cd/m²) | 280 | 400 43% | 322.9 15% | 210.5 -25% | 230 -18% |
| Brightness (cd/m²) | 281 | 374 33% | 322 15% | 204 -27% | 201 -28% |
| Brightness Distribution (%) | 83 | 87 5% | 84 1% | 94 13% | 78 -6% |
| Black Level * (cd/m²) | 0.29 | 0.63 -117% | 0.26 10% | 0.63 -117% | 0.46 -59% |
| Contrast (:1) | 966 | 635 -34% | 1242 29% | 334 -65% | 500 -48% |
| Colorchecker dE 2000 * | 4.18 | 4.34 -4% | 4.19 -0% | 9.48 -127% | 10.36 -148% |
| Colorchecker dE 2000 max. * | 7.59 | 8.29 -9% | 7.04 7% | 17.19 -126% | 18.63 -145% |
| Colorchecker dE 2000 calibrated * | 2 | 3.55 -78% | 4.04 -102% | ||
| Greyscale dE 2000 * | 5.63 | 3.51 38% | 4.5 20% | 12 -113% | 13.32 -137% |
| Gamma | 2.44 90% | 2.45 90% | 1.97 112% | 2.12 104% | 2.54 87% |
| CCT | 6801 96% | 6570 99% | 7041 92% | 13874 47% | 14124 46% |
| Color Space (Percent of AdobeRGB 1998) (%) | 60 | 55 -8% | 57.6 -4% | 49.4 -18% | 48 -20% |
| Color Space (Percent of sRGB) (%) | 92 | 84 -9% | 88.4 -4% | 75.8 -18% | 74 -20% |
| Total Average (Program / Settings) | -1% /
-4% | -6% /
-2% | -17% /
-45% | -18% /
-42% |
* ... smaller is better
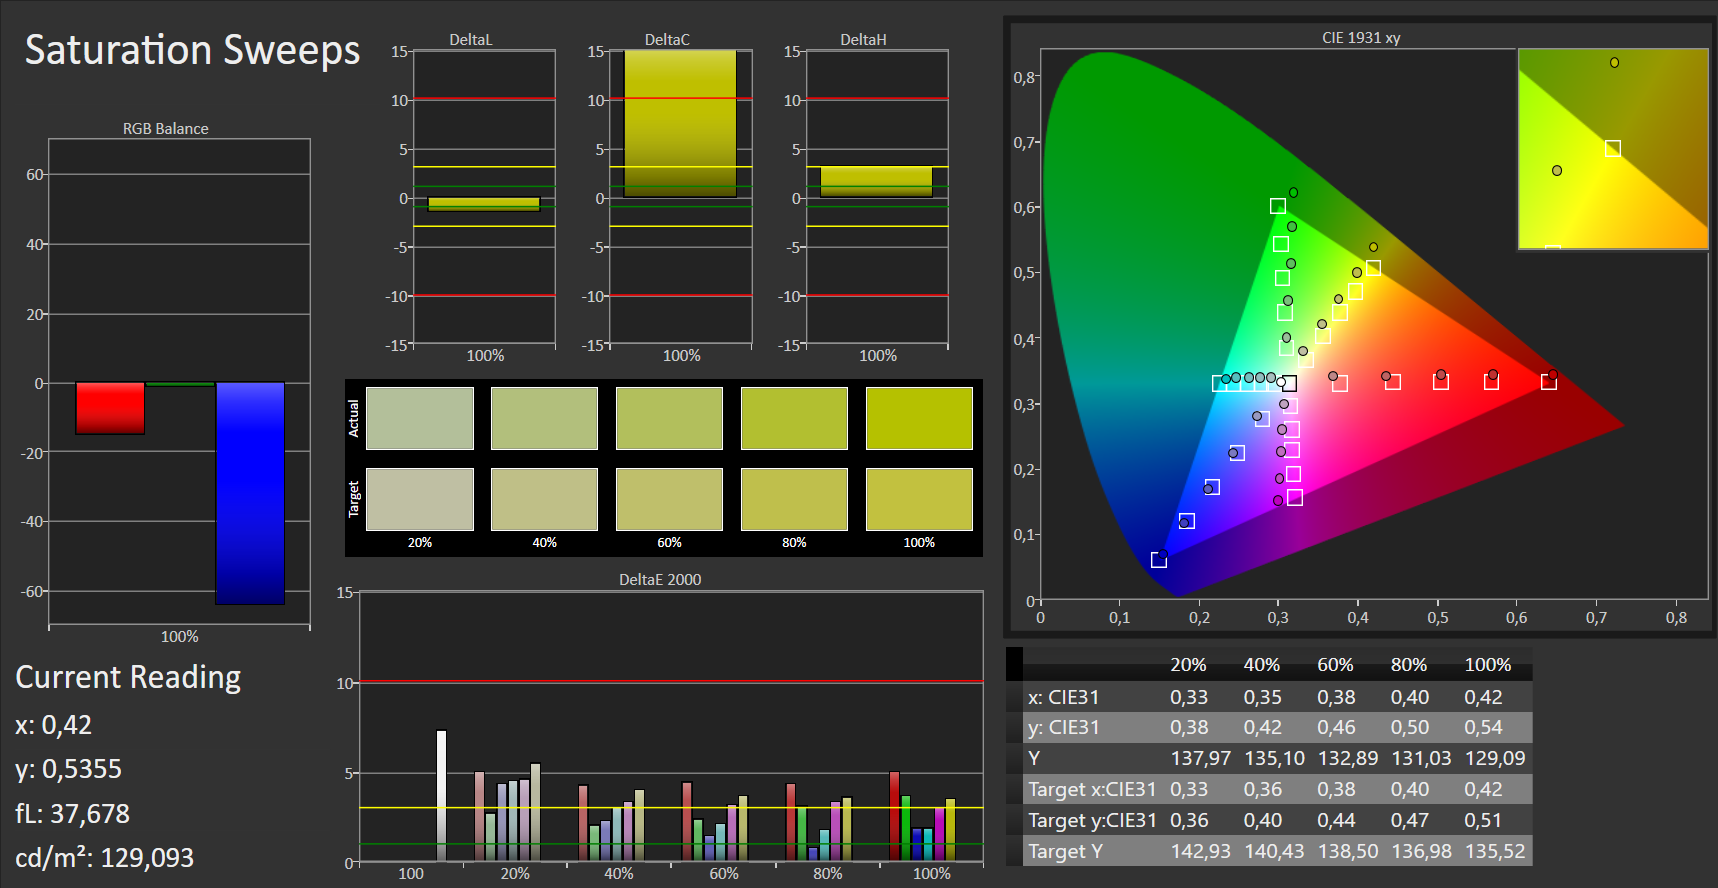
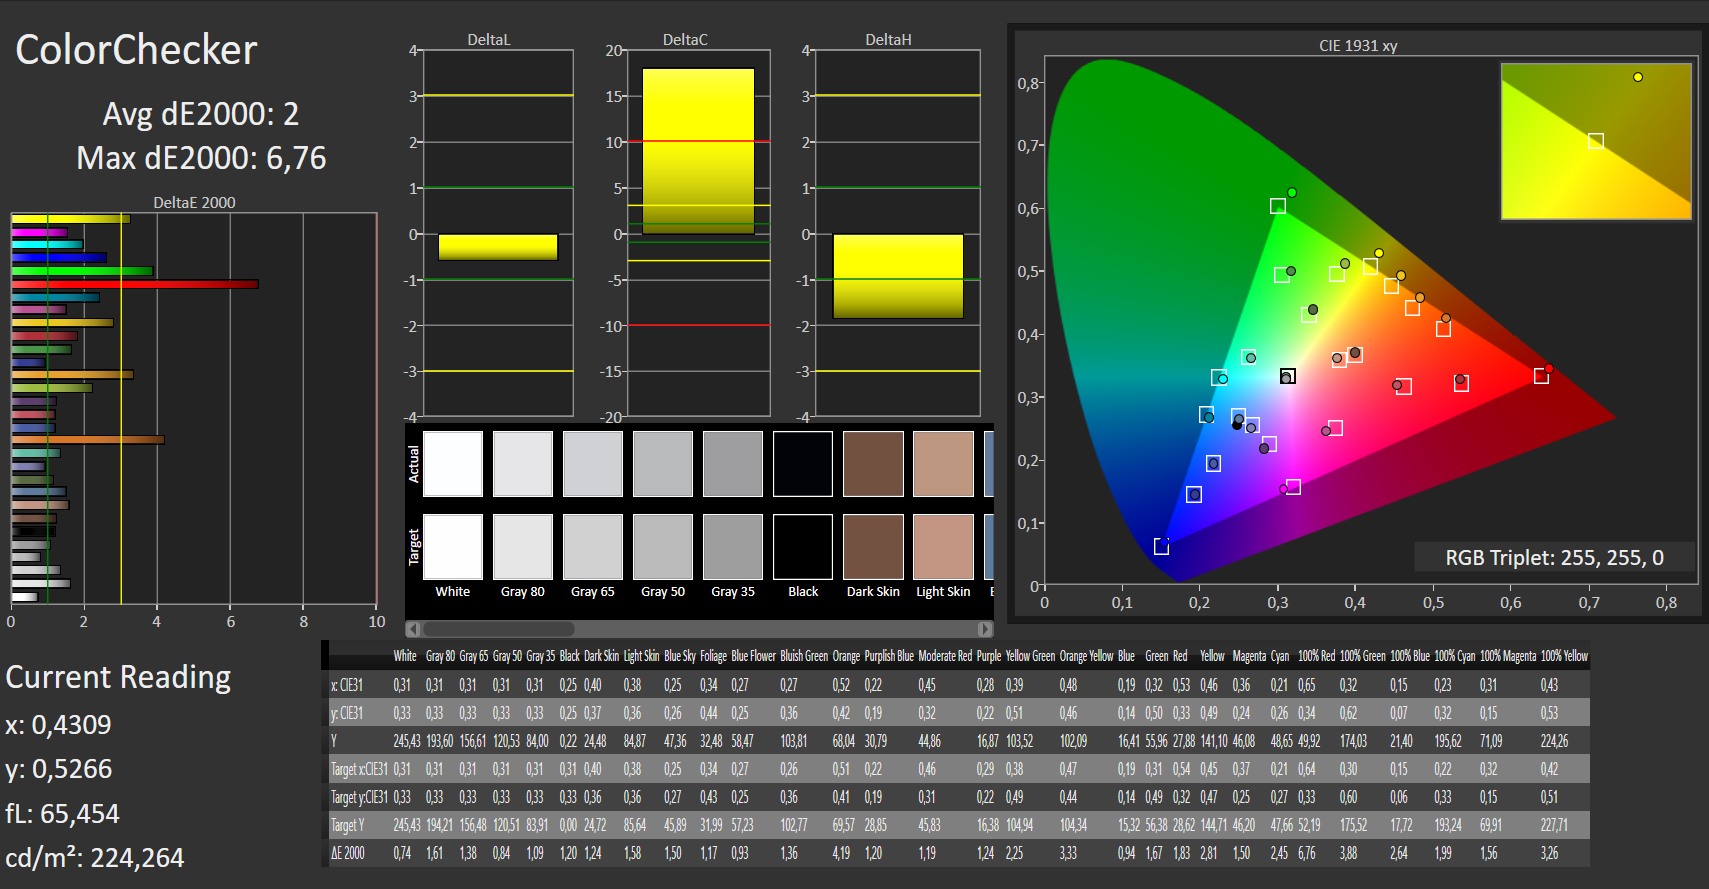
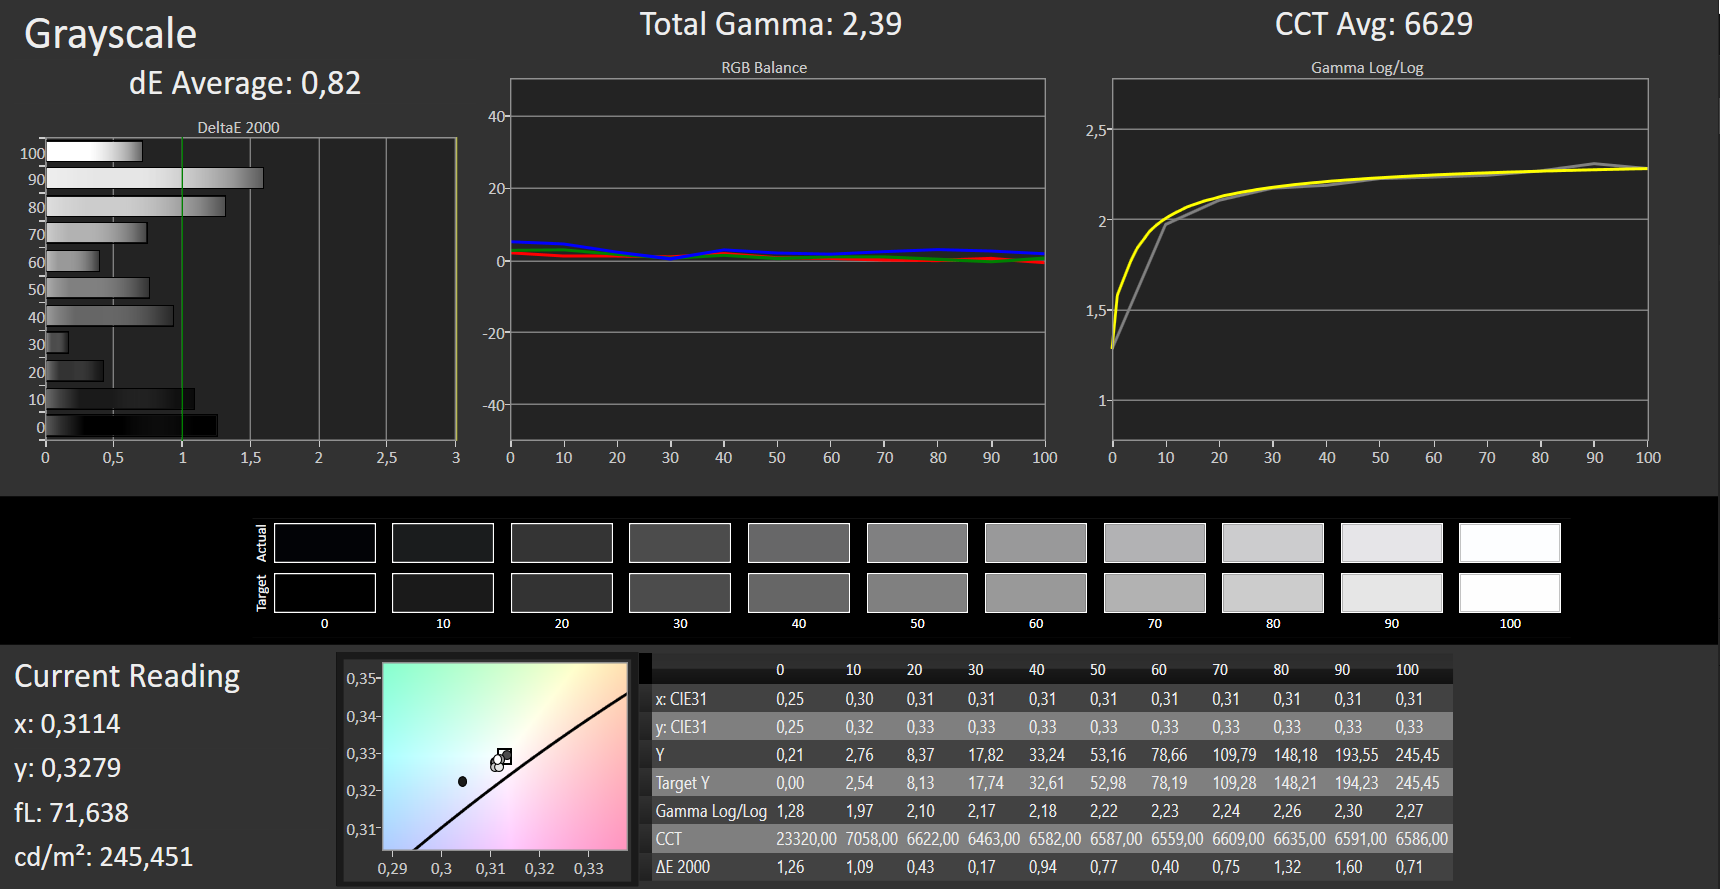
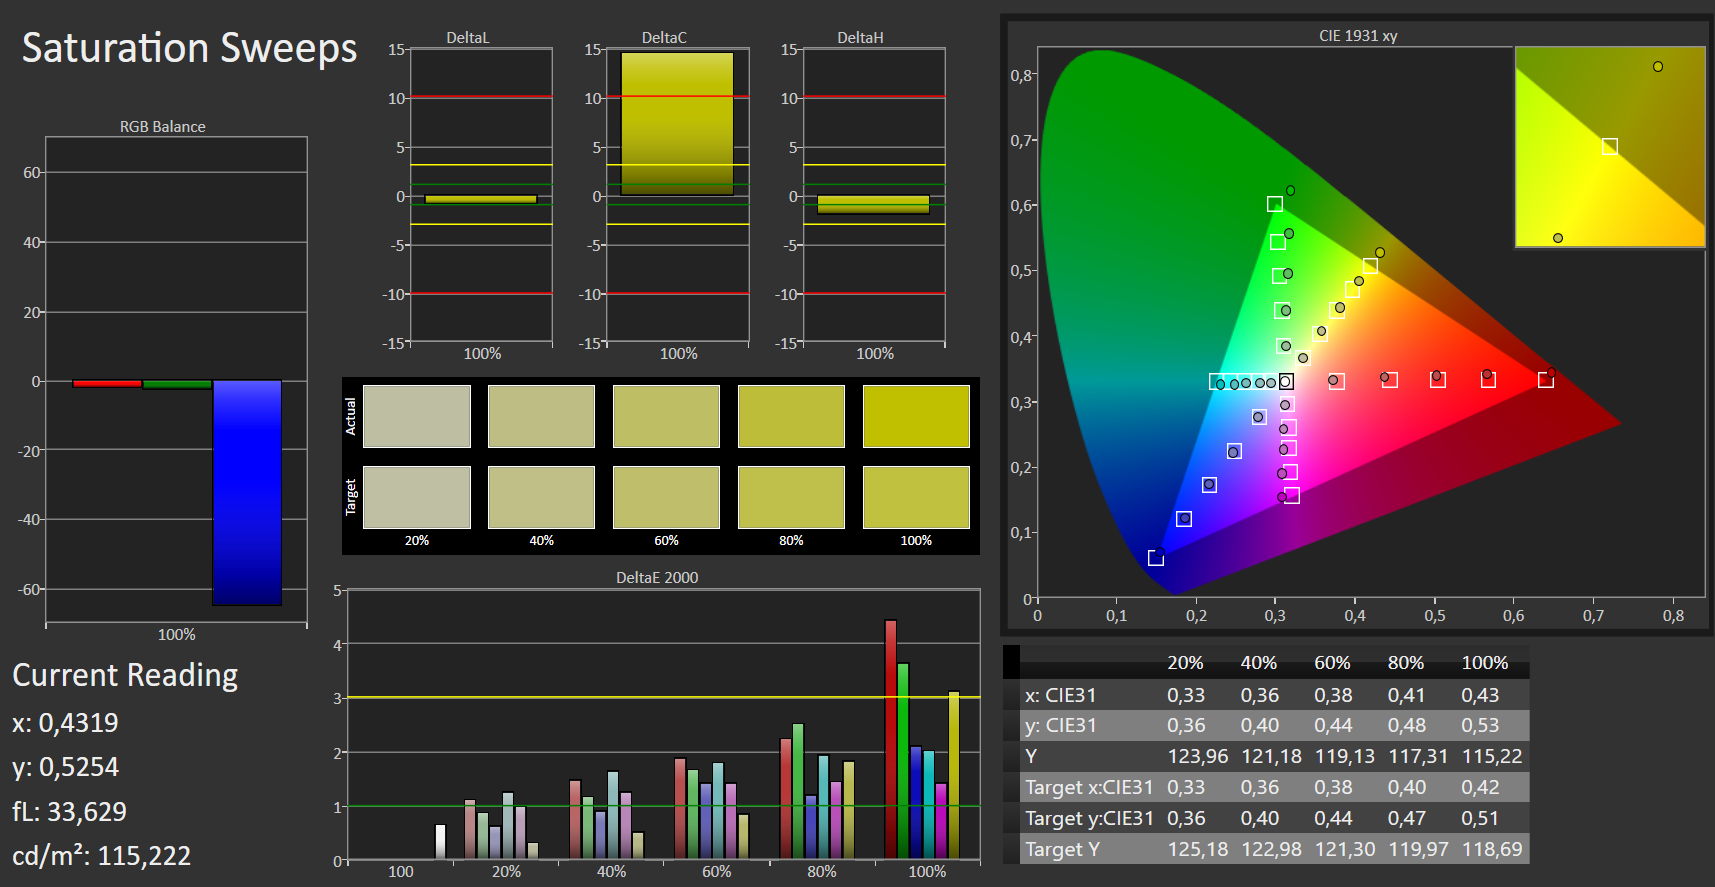
Color accuracy was decent by default, and the DeltaE deviation of 4.2 for colors just barely missed the ideal value of less than 3. The display did not suffer from a blue tint. We were able to improve accuracy through calibration. DeltaE for colors was lowered to 2, and grayscale accuracy was much more balanced. Neither AdobeRGB (60%) nor sRGB (92%) are completely covered.
Display Response Times
| ↔ Response Time Black to White | ||
|---|---|---|
| 30 ms ... rise ↗ and fall ↘ combined | ↗ 16 ms rise | 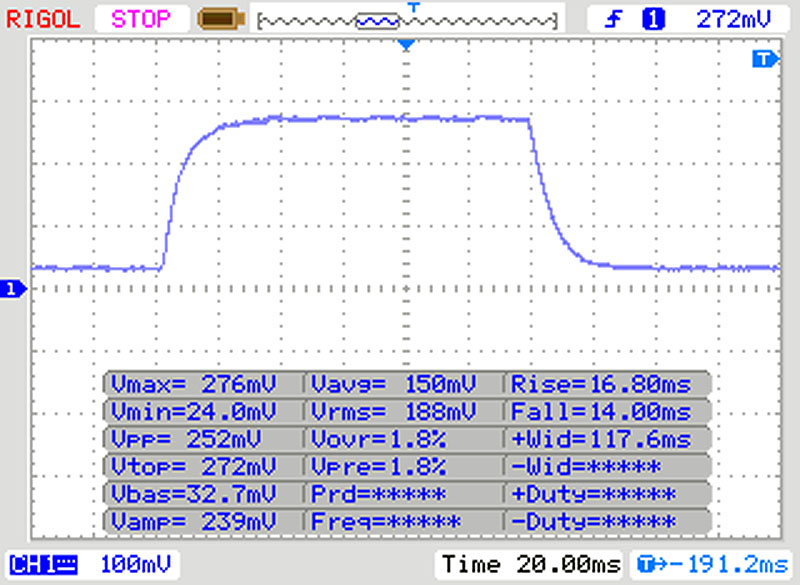 |
| ↘ 14 ms fall | ||
| The screen shows slow response rates in our tests and will be unsatisfactory for gamers. In comparison, all tested devices range from 0.1 (minimum) to 240 (maximum) ms. » 80 % of all devices are better. This means that the measured response time is worse than the average of all tested devices (19.9 ms). | ||
| ↔ Response Time 50% Grey to 80% Grey | ||
| 42 ms ... rise ↗ and fall ↘ combined | ↗ 22 ms rise | 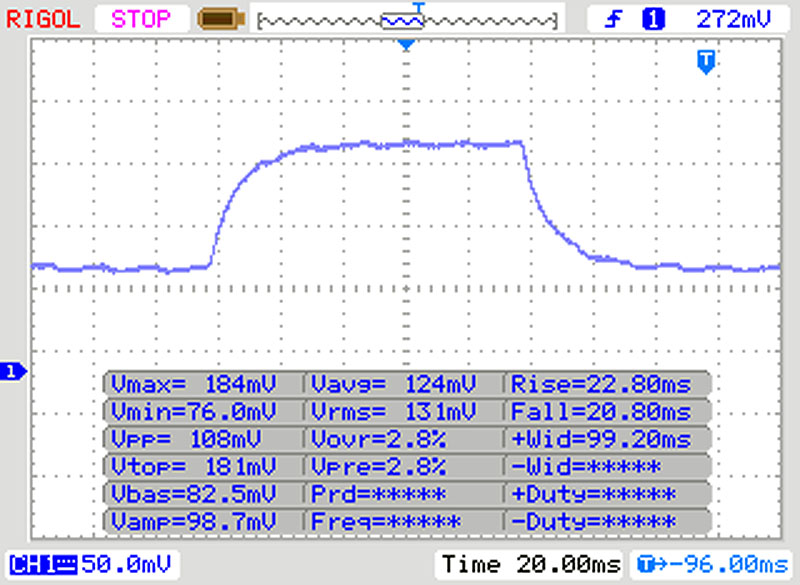 |
| ↘ 20 ms fall | ||
| The screen shows slow response rates in our tests and will be unsatisfactory for gamers. In comparison, all tested devices range from 0.165 (minimum) to 636 (maximum) ms. » 67 % of all devices are better. This means that the measured response time is worse than the average of all tested devices (31.1 ms). | ||
Screen Flickering / PWM (Pulse-Width Modulation)
| Screen flickering / PWM detected | 250 Hz | 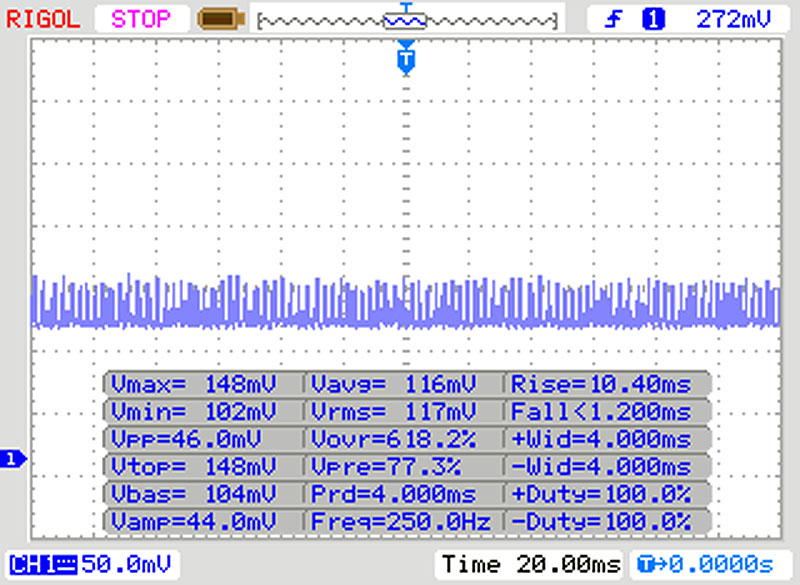 | |
The display backlight flickers at 250 Hz (worst case, e.g., utilizing PWM) . The frequency of 250 Hz is relatively low, so sensitive users will likely notice flickering and experience eyestrain at the stated brightness setting and below. In comparison: 52 % of all tested devices do not use PWM to dim the display. If PWM was detected, an average of 7791 (minimum: 5 - maximum: 343500) Hz was measured. | |||
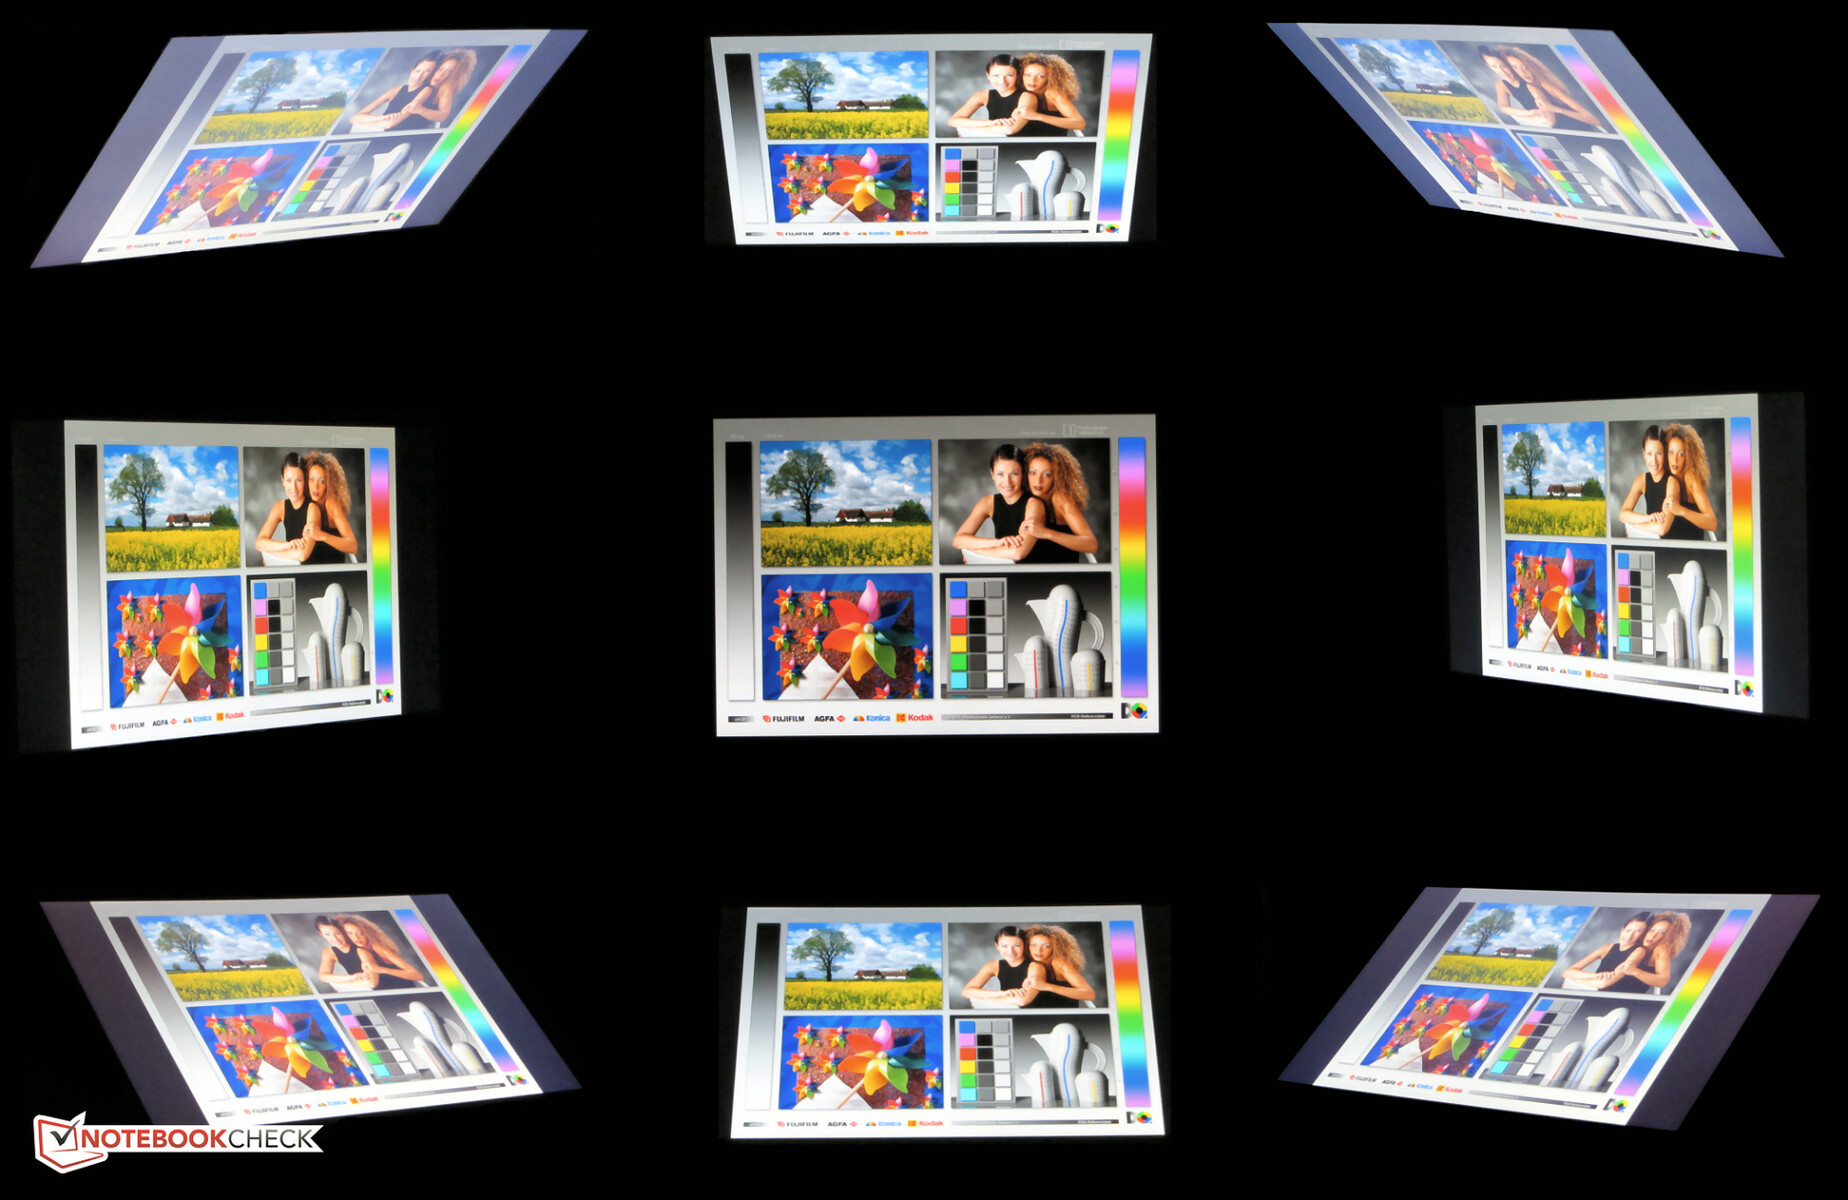
The 470 G7 is equipped with an IPS panel with wide viewing angles. The display remains readable from all angles. Outdoors, the notebook was barely usable at all. This was particularly true on battery since maximum brightness was reduced even further when running on battery.
Performance – Enough for Office and Internet
The 470 G7 is a 17.3-inch notebook by Hewlett Packard aimed at professional and home users alike. It offers more than enough performance for office and internet tasks. At the time of writing our review unit sold for slightly over $1,000. Other models are available as well, and prices start at around $700.
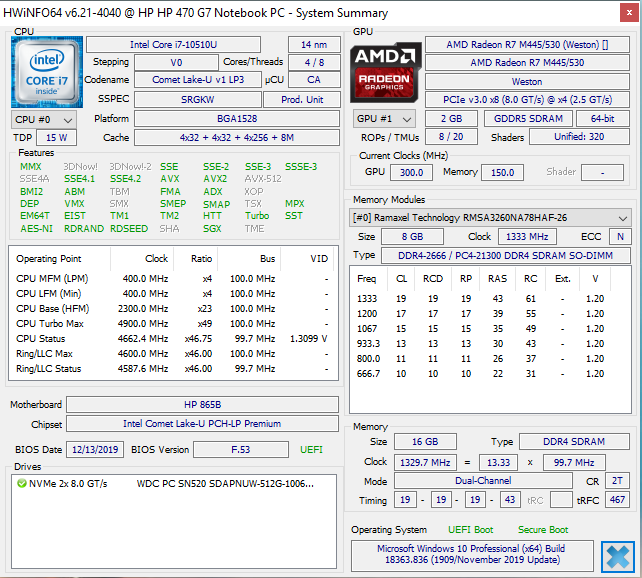
Processor
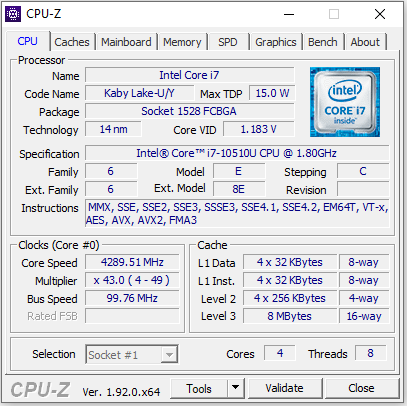
The 470 G7 is equipped with a Core-i7 10510U quad-core processor based on Intel’s Comet Lake architecture. This particular ULV processor with a TDP of 15 W runs at a base clock of 1.8 GHz and can turbo boost up to 4.3 GHz on all cores, 4.8 GHz on two cores, or 4.9 GHz on one core.
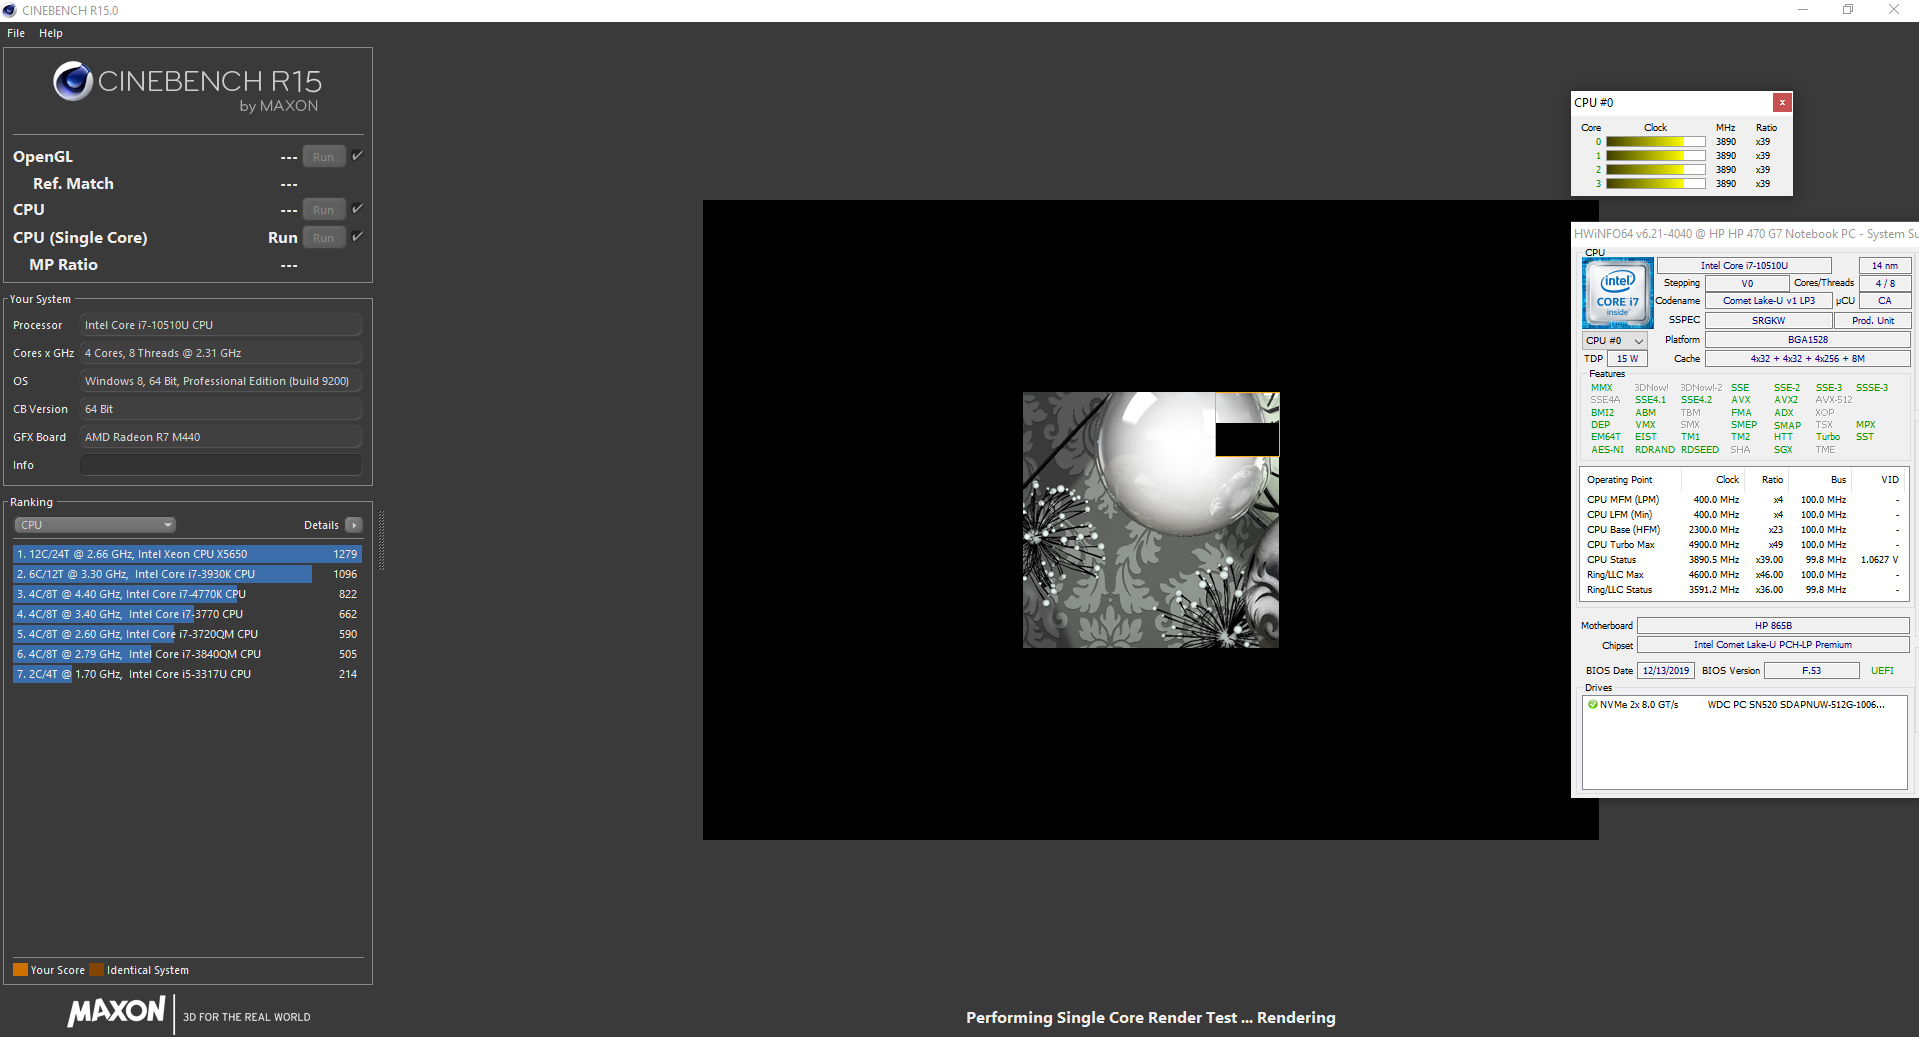
In our multi-thread Cinebench benchmark the CPU ran at 3.4 to 3.6 GHz or 4.2 to 4.9 GHz in the single-thread test at first. After a short period of time these were reduced to just 2.3-2.4 GHz and 3.7-3.9 GHz in the multi and single-thread test, respectively. On battery, the CPU ran at 1.8-2.4 GHz (multi-thread) and 3.9-4.0 GHz (single-thread).
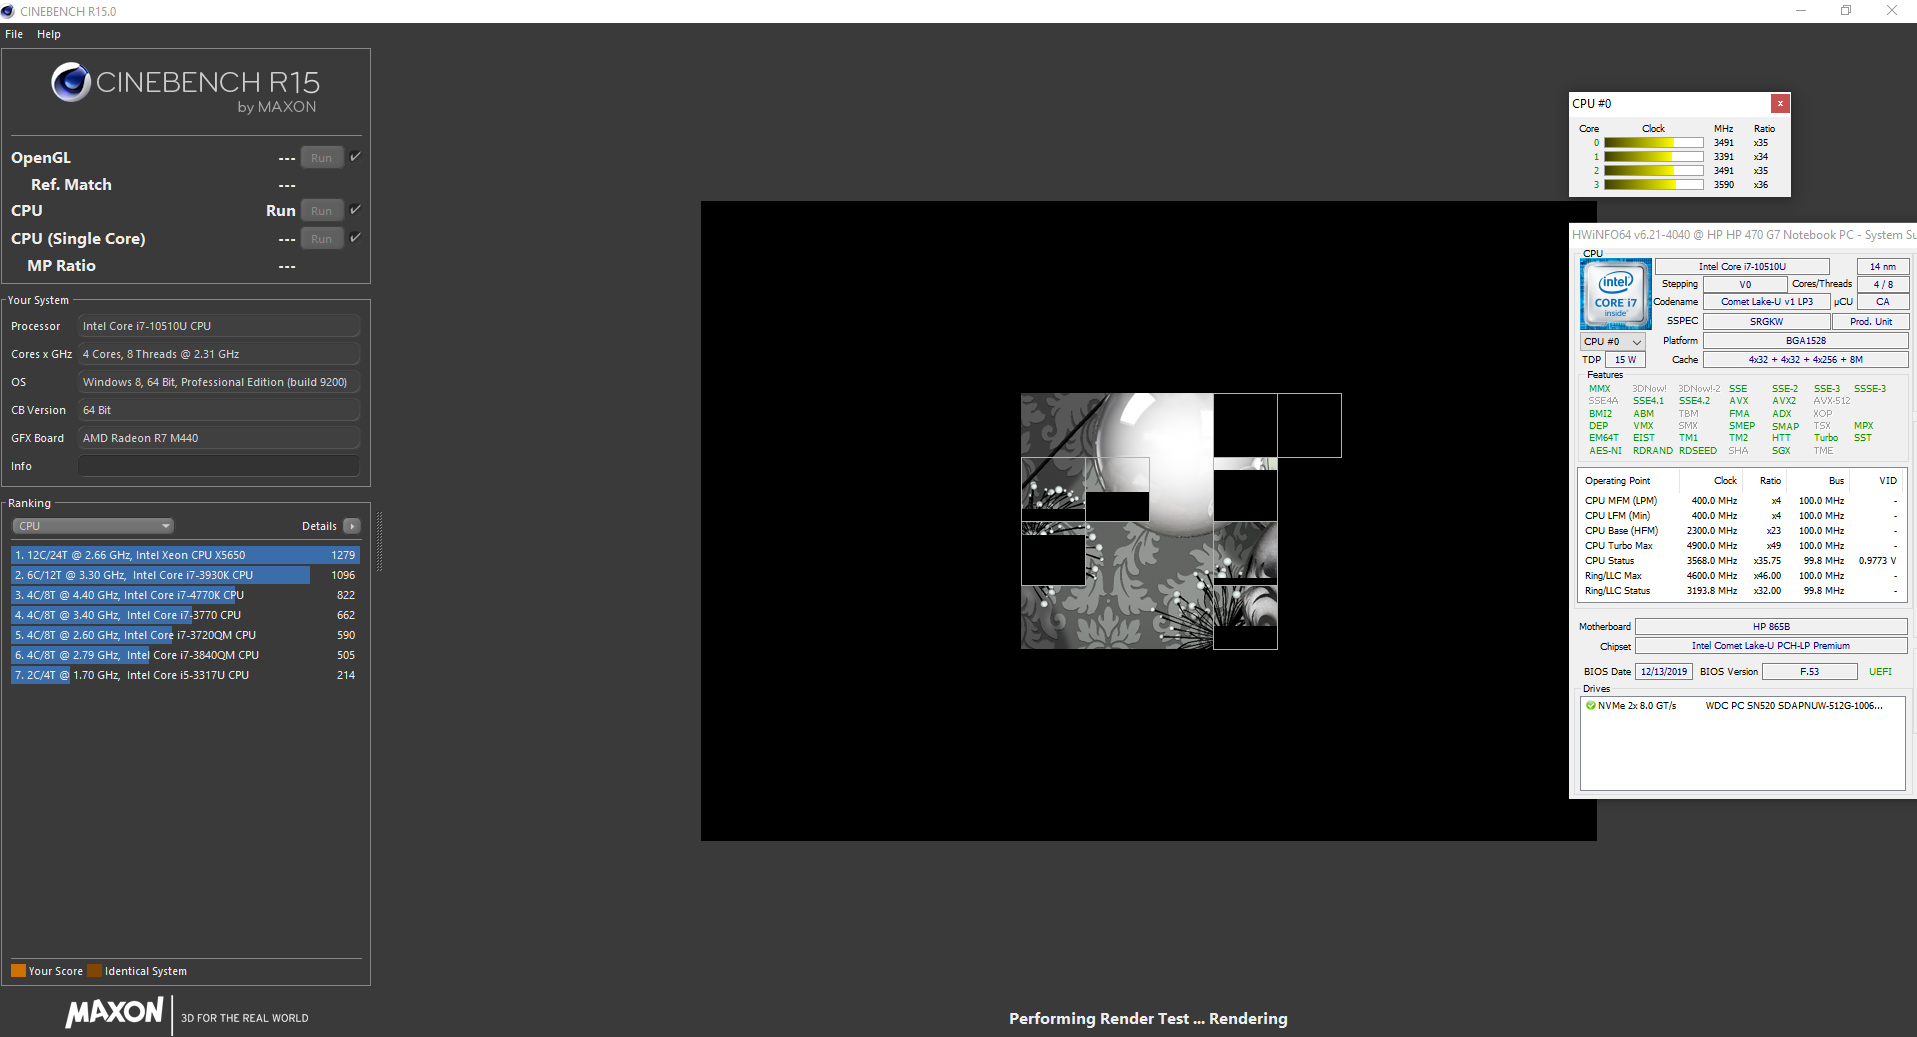
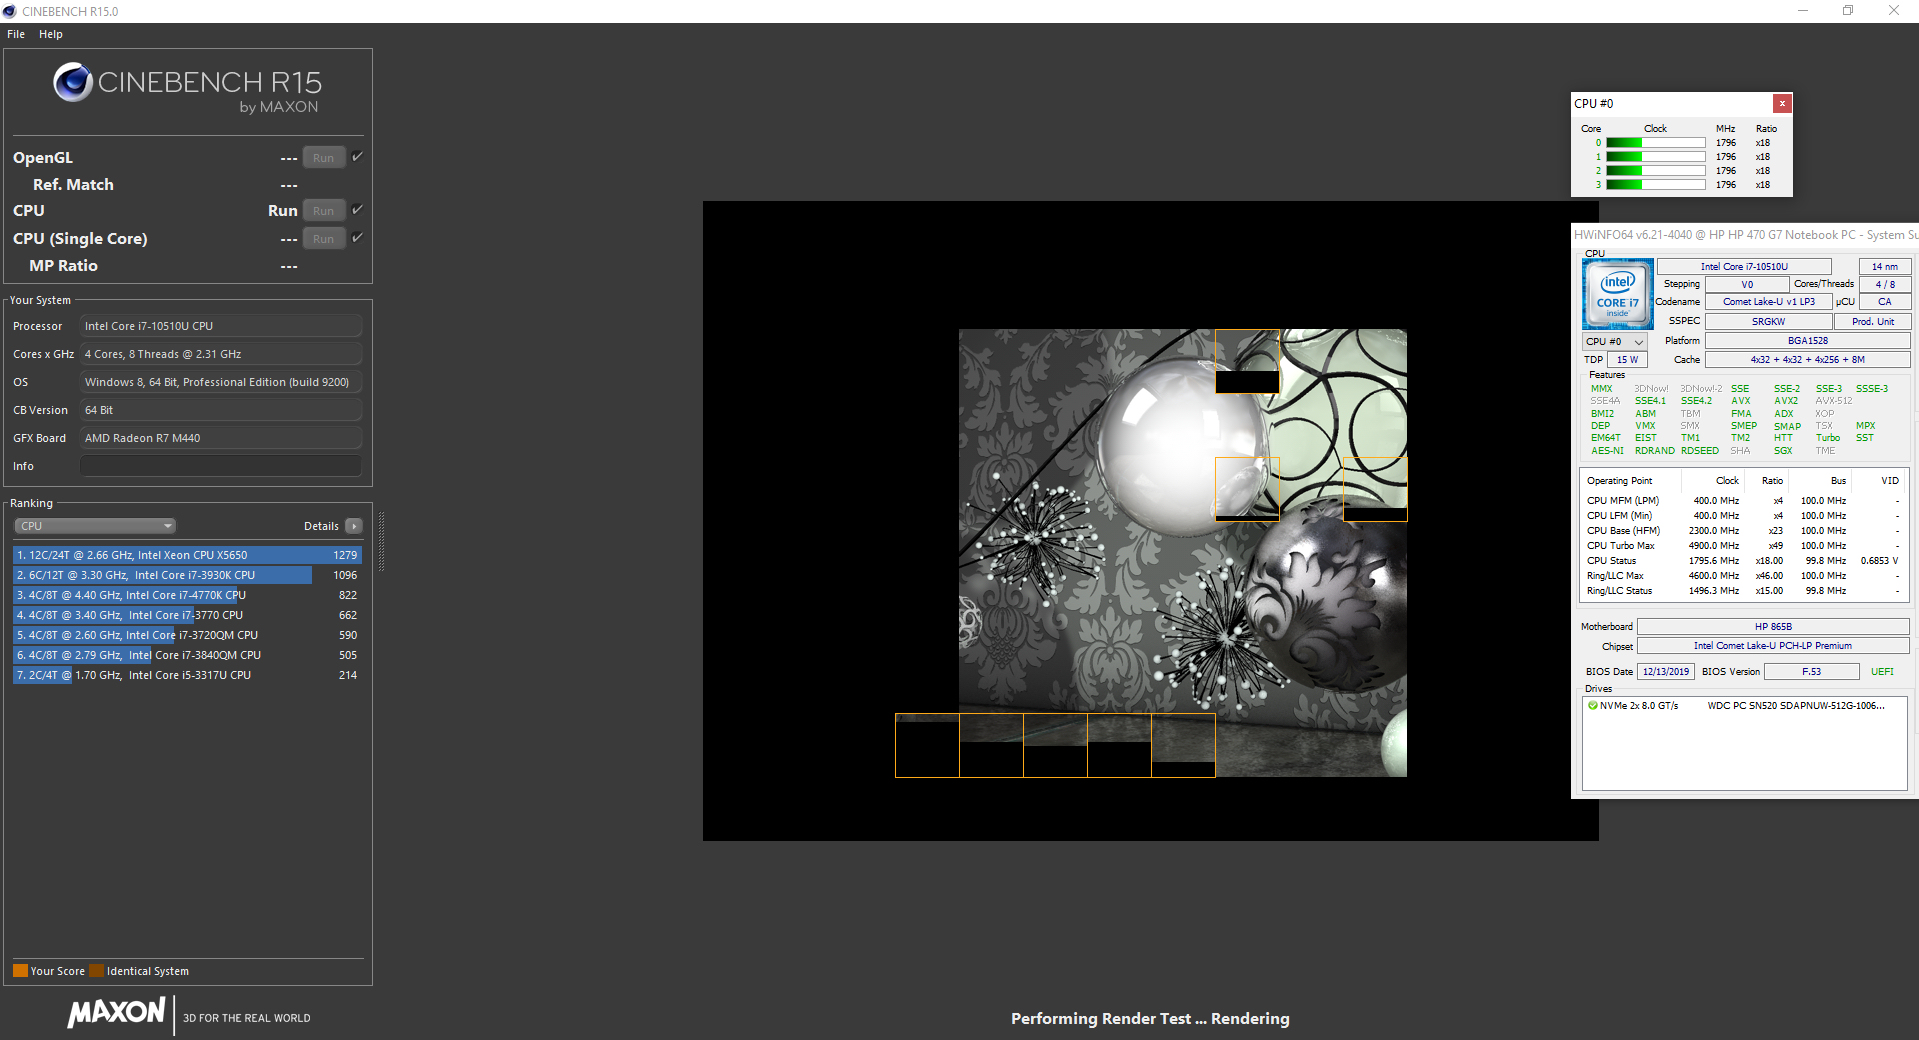
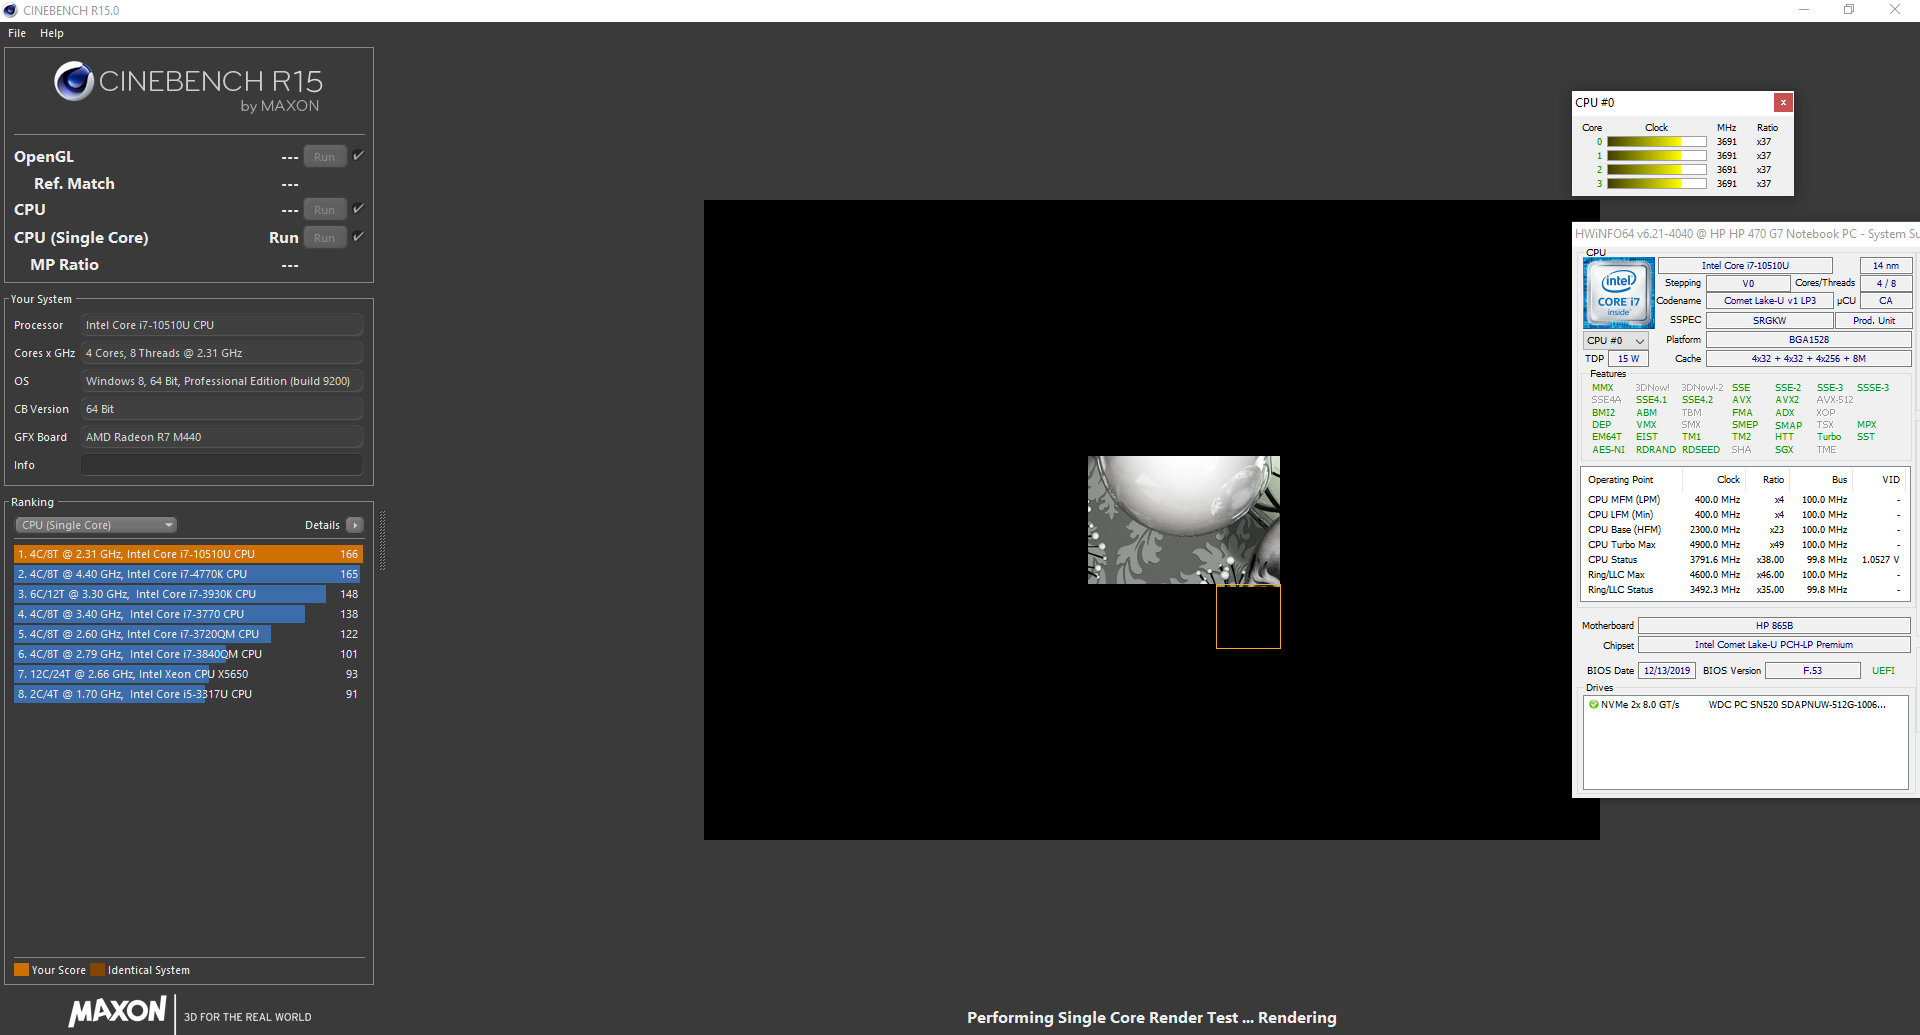
We run Cinebench R15 in a loop for at least 30 minutes in order to determine whether or not CPU turbo remains applied for sustained periods of load as well. Scores dropped between the first and second run but remained consistent afterwards. Given that the CPU was unable to fully utilize its turbo boost potential it was even slower than the ProBook 470 G5’s Core i5-8250U.
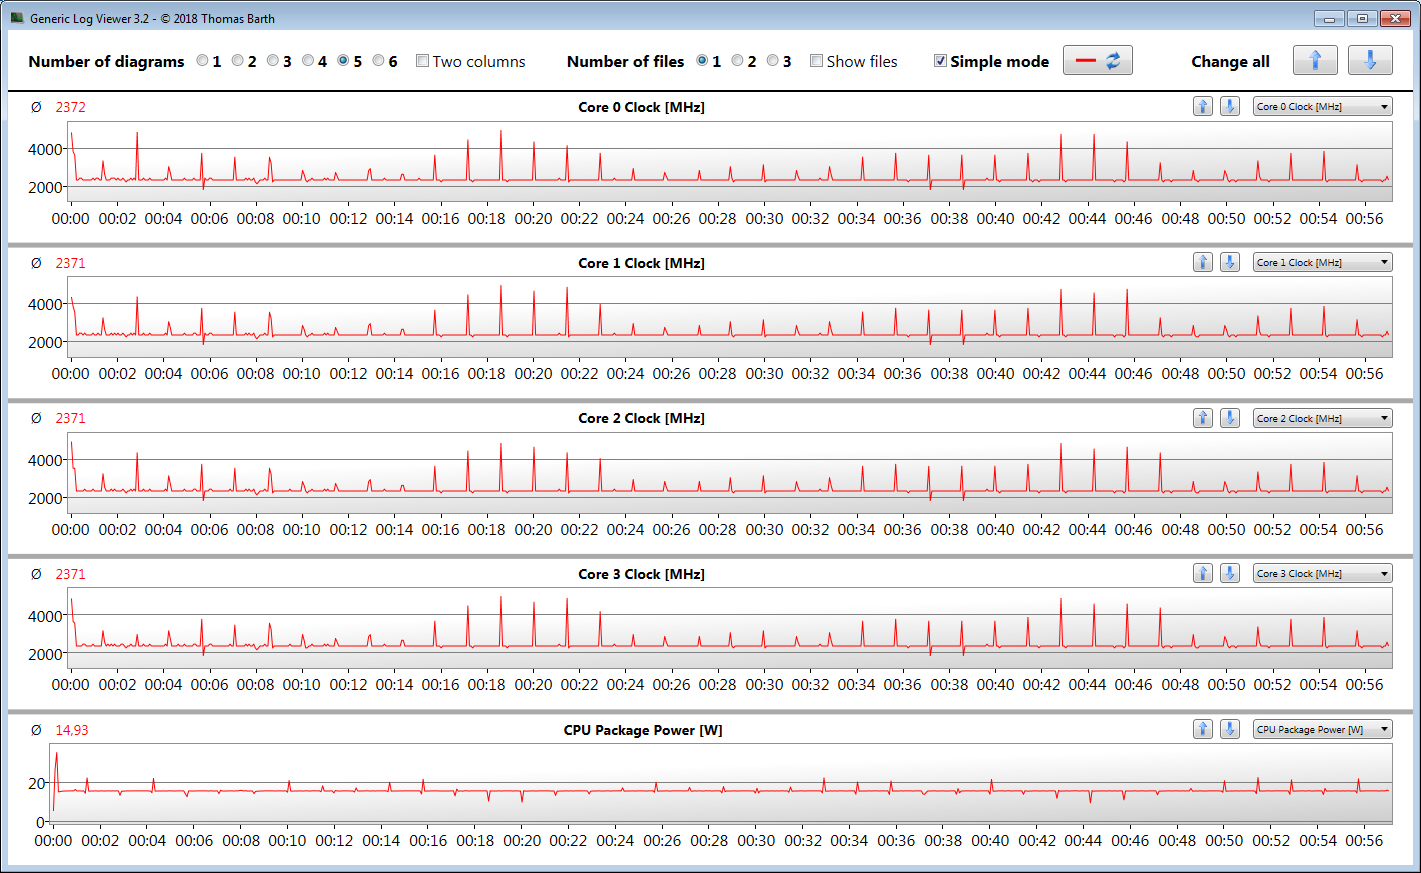
CPU performance results were fairly poor overall. Due to the lackluster turbo boost utilization the results were lower than on most other 10510U notebooks. The difference was more pronounced in multi-thread than in single-thread tests. We would have expected much more, particularly considering the spacious 17.3-inch case that should not stand in the way of adequate cooling.
| Blender - v2.79 BMW27 CPU | |
| HP 470 G7 8VU24EA | |
| Average Intel Core i7-10510U (628 - 1051, n=31) | |
| Average of class Office (158 - 1940, n=74, last 2 years) | |
| HWBOT x265 Benchmark v2.2 - 4k Preset | |
| Average of class Office (2.21 - 26, n=74, last 2 years) | |
| Average Intel Core i7-10510U (3.41 - 6.04, n=31) | |
| HP 470 G7 8VU24EA | |
| LibreOffice - 20 Documents To PDF | |
| Average Intel Core i7-10510U (50.7 - 77.8, n=27) | |
| Average of class Office (39.9 - 102.3, n=74, last 2 years) | |
| HP 470 G7 8VU24EA | |
| R Benchmark 2.5 - Overall mean | |
| HP 470 G7 8VU24EA | |
| Average Intel Core i7-10510U (0.637 - 0.81, n=28) | |
| Average of class Office (0.4098 - 0.888, n=74, last 2 years) | |
| Mozilla Kraken 1.1 - Total | |
| Lenovo Ideapad L340-17API-81LY0004GE (Edge 44) | |
| HP 470 G7 8VU24EA (Edge 44) | |
| HP 470 G7 8VU24EA (Chrome 82) | |
| Dell Inspiron 17 3780 (Edge 44.17763.1.0) | |
| HP ProBook 470 G5 (Edge 41) | |
| Average Intel Core i7-10510U (742 - 1184, n=36) | |
| Average of class Office (391 - 1297, n=76, last 2 years) | |
| Octane V2 - Total Score | |
| Average of class Office (49011 - 122119, n=19, last 2 years) | |
| Average Intel Core i7-10510U (31505 - 51741, n=17) | |
| HP ProBook 470 G5 (Edge 41) | |
| HP 470 G7 8VU24EA (Edge 44) | |
| Lenovo Ideapad L340-17API-81LY0004GE (Edge 44) | |
| Dell Inspiron 17 3780 (Edge 44.17763.1.0) | |
| JetStream 1.1 - 1.1 Total | |
| HP 470 G7 8VU24EA (Edge 44) | |
| Average Intel Core i7-10510U (142.6 - 296, n=15) | |
| HP ProBook 470 G5 (Edge 41) | |
| Dell Inspiron 17 3780 (Edge 44.17763.1.0) | |
| Lenovo IdeaPad 330-17IKB 81DM (Edge 41.16299.1004.0) | |
| Lenovo Ideapad L340-17API-81LY0004GE (Edge 44) | |
* ... smaller is better
System Performance
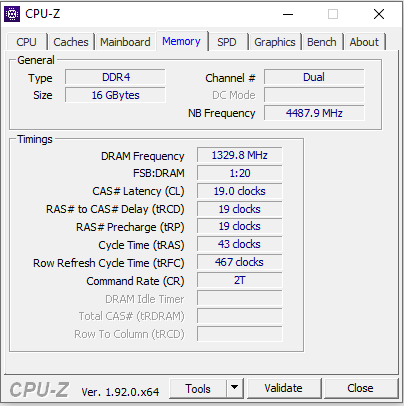
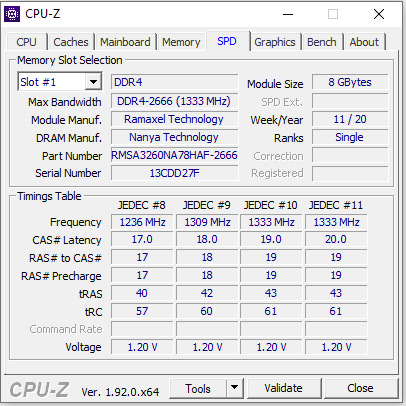
Overall, the system performed quite smoothly, and we did not encounter any problems. The Core i7 processor offers adequate performance for most office and internet applications. It also performed fairly well in our PCMark benchmarks. Thankfully, the G7’s RAM was running in dual-channel mode.
| PCMark 8 Home Score Accelerated v2 | 3717 points | |
| PCMark 8 Creative Score Accelerated v2 | 3705 points | |
| PCMark 8 Work Score Accelerated v2 | 5056 points | |
| PCMark 10 Score | 4494 points | |
Help | ||
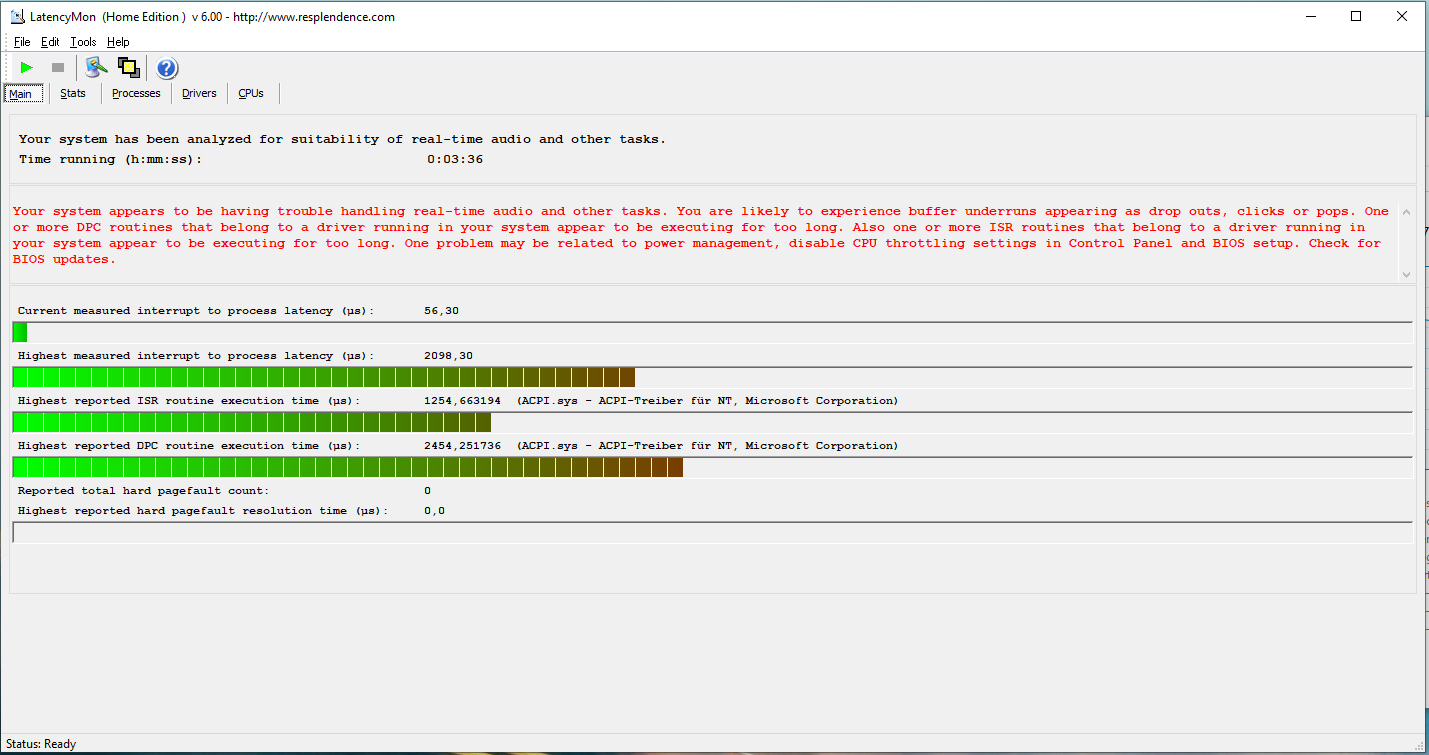
DPC Latencies
Our standardized latency monitor test (browsing the web, 4K video playback, high Prime95 load) reported high DPC latencies. The device is thus not suited for real-time video and audio editing tasks.
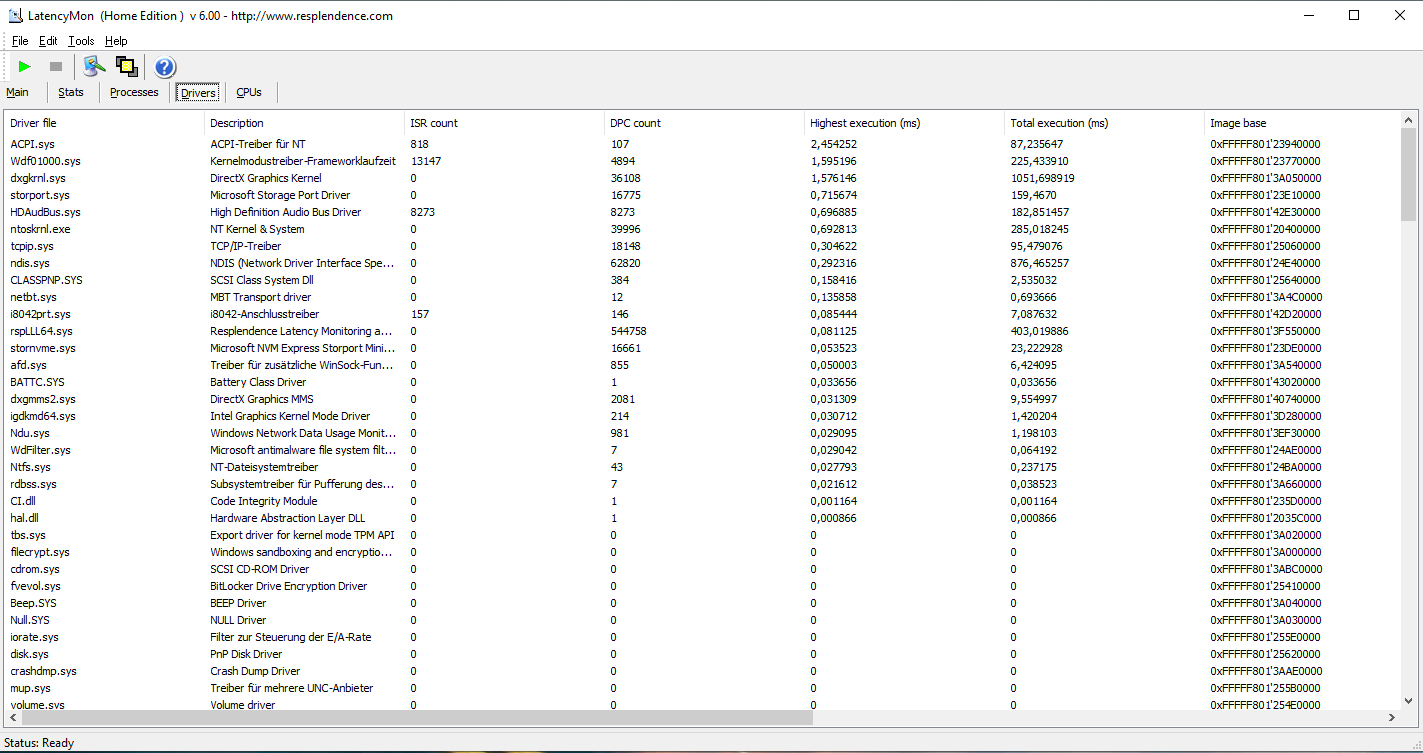
| DPC Latencies / LatencyMon - interrupt to process latency (max), Web, Youtube, Prime95 | |
| HP 470 G7 8VU24EA | |
* ... smaller is better
Storage Devices
Our review unit was equipped with a 512 GB large M.2-2280 NVMe SSD made by Western Digital that performed quite well overall.
In theory, the notebook can be equipped with a secondary 2.5-inch storage device. Unfortunately, our particular unit lacked both the mounting frame and the SATA ribbon cable, which means we would have been unable to add a secondary storage device.
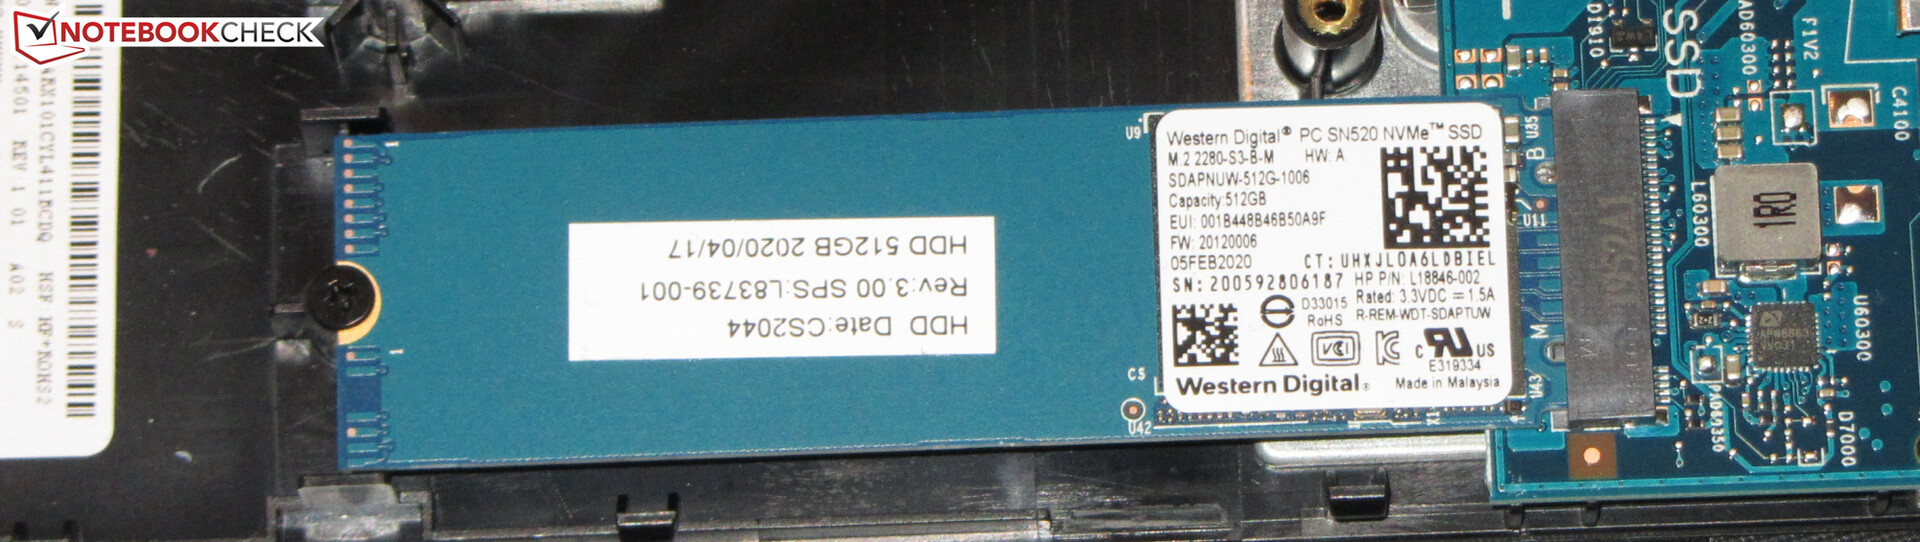

| HP 470 G7 8VU24EA WDC PC SN520 SDAPNUW-512G | Dell Inspiron 17 3780 SK Hynix BC501 NVMe 256 GB | Lenovo IdeaPad 330-17IKB 81DM WDC Blue WD10SPZX-24Z10T0 | Lenovo Ideapad L340-17API-81LY0004GE Samsung SSD PM871b MZ7LN256HAJQ | Average WDC PC SN520 SDAPNUW-512G | |
|---|---|---|---|---|---|
| CrystalDiskMark 5.2 / 6 | -19% | -95% | -53% | -4% | |
| Write 4K (MB/s) | 190.6 | 120.3 -37% | 10.42 -95% | 94.4 -50% | 138.5 ? -27% |
| Read 4K (MB/s) | 49.01 | 41.81 -15% | 0.416 -99% | 32.45 -34% | 44.2 ? -10% |
| Write Seq (MB/s) | 1108 | 619 -44% | 116.4 -89% | 482.8 -56% | 1265 ? 14% |
| Read Seq (MB/s) | 1077 | 1119 4% | 76.8 -93% | 524 -51% | 1237 ? 15% |
| Write 4K Q32T1 (MB/s) | 429.3 | 492.2 15% | 14.15 -97% | 232 -46% | 404 ? -6% |
| Read 4K Q32T1 (MB/s) | 544 | 398.8 -27% | 0.417 -100% | 253.6 -53% | 421 ? -23% |
| Write Seq Q32T1 (MB/s) | 1458 | 812 -44% | 108.1 -93% | 496.5 -66% | 1491 ? 2% |
| Read Seq Q32T1 (MB/s) | 1734 | 1616 -7% | 79.6 -95% | 540 -69% | 1741 ? 0% |
Dauerleistung Lesen: DiskSpd Read Loop, Queue Depth 8
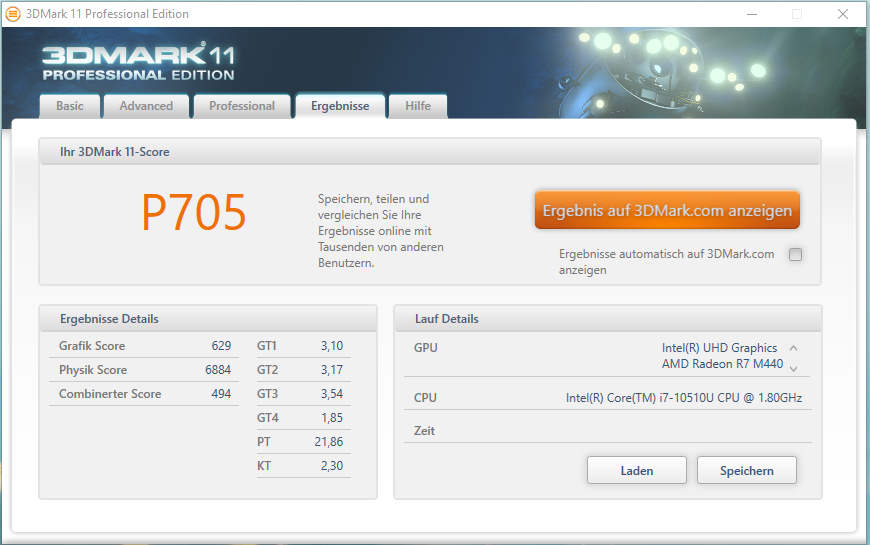
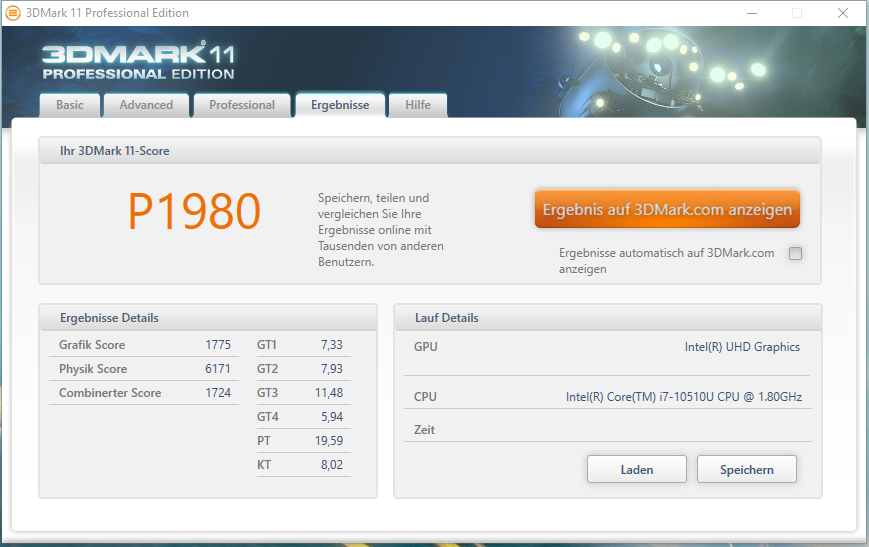
Graphics Card
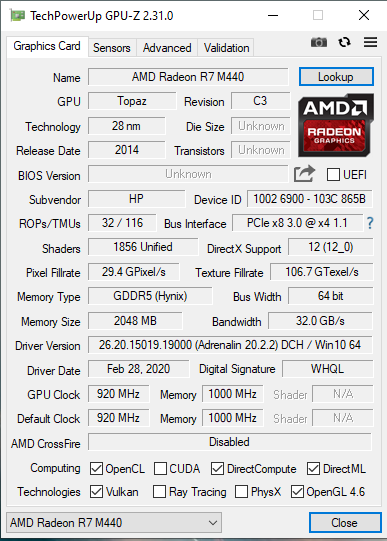
Despite the fact that it fits perfectly well into AMD’s current naming scheme the 530 is not a current GPU. It dates back to 2014 and is manufactured in the now outdated 28-nm lithography process. It has been re-released repeatedly over the years. We were not surprised when the GPU identified itself as a M440 during a driver update.
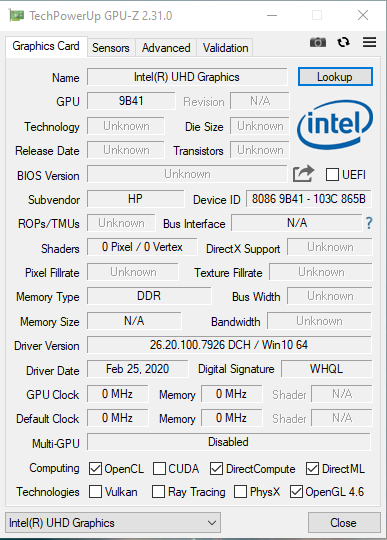
The 530 supports DirectX 12 and runs at a maximum clock speed of 920 MHz. It thus remained below AMD’s officially specified maximum of up to 1,024 MHz, which must be a decision made by HP. The GPU has access to 2 GB of GDDR5 VRAM. It supports switchable graphics in tandem with the UHD Graphics 620, a technology referred to as Enduro by AMD.
3DMark benchmark results are on a level expected of this particular GPU, and they were not significantly higher than the ProBook 470 G5’s. The latter featured a GeForce 930MX with DDR3 VRAM, and its 3DMark results were on a par with the Radeon 530.

| 3DMark 06 Standard Score | 13132 points | |
| 3DMark 11 Performance | 2602 points | |
| 3DMark Ice Storm Standard Score | 68469 points | |
| 3DMark Cloud Gate Standard Score | 8035 points | |
| 3DMark Fire Strike Score | 1609 points | |
| 3DMark Time Spy Score | 559 points | |
Help | ||
Gaming Performance
Many games can be played smoothly on the 17.3-inch 470 G7, although these are mainly games with either low hardware requirements or those that are already a few years old. Either way, most games will require lowered resolutions and reduced details (medium or even low) in order to run smoothly. AAA titles of recent years are not playable at all.
| The Witcher 3 - 1024x768 Low Graphics & Postprocessing | |
| Average of class Office (32.2 - 103.7, n=4, last 2 years) | |
| Lenovo IdeaPad 330-17IKB 81DM | |
| HP ProBook 470 G5 | |
| Dell Inspiron 17 3780 | |
| HP 470 G7 8VU24EA | |
| Average AMD Radeon 530 (24 - 32.8, n=4) | |
| BioShock Infinite - 1366x768 High Preset | |
| Lenovo IdeaPad 330-17IKB 81DM | |
| HP 470 G7 8VU24EA | |
| HP ProBook 470 G5 | |
| Lenovo Ideapad L340-17API-81LY0004GE | |
| Average AMD Radeon 530 (33.7 - 49.7, n=5) | |
| Dell Inspiron 17 3780 | |
| GTA V - 1366x768 Normal/Off AF:4x | |
| Average of class Office (51.9 - 174.4, n=64, last 2 years) | |
| HP 470 G7 8VU24EA | |
| Average AMD Radeon 530 (n=1) | |
In order to determine whether or not a device can maintain consistent frame rates over long periods of time we run “The Witcher 3” in a 60-minute loop in FHD resolution on maximum details. The avatar remains stationary throughout the entire test. We did not notice a drop in frame rates, and the GPU was thus capable of ensuring a consistent performance.
| low | med. | high | ultra | |
|---|---|---|---|---|
| Tomb Raider (2013) | 118.7 | 59 | 43.5 | 20.3 |
| BioShock Infinite (2013) | 118.2 | 60.3 | 49.7 | 16.6 |
| Middle-earth: Shadow of Mordor (2014) | 52.2 | 32.3 | 16 | |
| GTA V (2015) | 85.6 | 79.2 | 16.2 | 7.1 |
| The Witcher 3 (2015) | 29.4 | 18.9 | 10.1 | 6.1 |
| Batman: Arkham Knight (2015) | 29 | 24 | 11 | |
| Dota 2 Reborn (2015) | 106 | 66.6 | 30 | 27.7 |
| Civilization 6 (2016) | 74.4 | 31.7 | 12.1 | |
| Fortnite (2018) | 80.9 | 41.4 | 12.6 | |
| X-Plane 11.11 (2018) | 18.6 | 12.3 | 12.2 | |
| Far Cry 5 (2018) | 25 | 11 | 10 | |
| Shadow of the Tomb Raider (2018) | 25 | 9 | 7 | |
| Assassin´s Creed Odyssey (2018) | 31 | 18 | 15 | |
| Battlefield V (2018) | 37.8 | 15.7 | 12.8 | |
| Apex Legends (2019) | 36.3 | 14.2 | 10.6 | |
| Metro Exodus (2019) | 10.3 | 6.7 | 4.9 | |
| Dirt Rally 2.0 (2019) | 42.7 | 13.5 | 11 | |
| The Division 2 (2019) | 29 | 11 | 7 | |
| Anno 1800 (2019) | 32.8 | 10.7 | 6.4 | |
| Rage 2 (2019) | 17.6 | 5.6 | ||
| Total War: Three Kingdoms (2019) | 33.1 | 9.5 | 5.5 | |
| F1 2019 (2019) | 36 | 17 | 15 | |
| Control (2019) | 24 | 7.1 | 4.9 | |
| Borderlands 3 (2019) | 24.6 | 9.6 | 6 | |
| FIFA 20 (2019) | 99.6 | 52.1 | 49.1 | 37.8 |
| Ghost Recon Breakpoint (2019) | 16 | 8 | 7 | |
| GRID 2019 (2019) | 35.6 | 12.8 | 7.1 | |
| Call of Duty Modern Warfare 2019 (2019) | 21.7 | 12.2 | 8.5 | |
| Need for Speed Heat (2019) | 25.1 | 11.3 | 8.9 | |
| Star Wars Jedi Fallen Order (2019) | 12.7 | 10.2 | ||
| Escape from Tarkov (2020) | 31.5 | 16.3 | 11.6 | |
| Hunt Showdown (2020) | 20.7 | 9 | 7.7 | |
| Doom Eternal (2020) | 16.5 | |||
| Gears Tactics (2020) | 45.6 | 16.9 | 10.8 |
Emissions – Moderate Heat Emission from the 470 G7
System Noise
When idle, the 470 G7’s fan ran at low speeds at all times. Once again, the culprit for this behavior was the BIOS setting “Fan always on”. Once disabled the fan was off very often when the device was idle. It very quickly ramped up under load and reached up to 42 dB(A) under both medium and high load. Too much noise for a notebook at this performance level. When running our Witcher 3 loop the fan settled at a slightly quieter 40.7 dB(A).
Noise level
| Idle |
| 32.7 / 32.7 / 32.8 dB(A) |
| Load |
| 42 / 42 dB(A) |
 | ||
30 dB silent 40 dB(A) audible 50 dB(A) loud |
||
min: | ||
| HP 470 G7 8VU24EA i7-10510U, Radeon 530 | HP ProBook 470 G5 i5-8250U, GeForce 930MX | Dell Inspiron 17 3780 i7-8565U, Radeon 520 | Lenovo IdeaPad 330-17IKB 81DM i5-8550U, GeForce MX150 | Lenovo Ideapad L340-17API-81LY0004GE R5 3500U, Vega 8 | Average AMD Radeon 530 | Average of class Office | |
|---|---|---|---|---|---|---|---|
| Noise | 9% | 2% | 8% | 10% | 3% | 19% | |
| off / environment * (dB) | 31.2 | 30.5 2% | 28.1 10% | 28.6 8% | 30 4% | 29.7 ? 5% | 24.2 ? 22% |
| Idle Minimum * (dB) | 32.7 | 30.5 7% | 31.7 3% | 29 11% | 30 8% | 31.6 ? 3% | 24.4 ? 25% |
| Idle Average * (dB) | 32.7 | 30.5 7% | 31.8 3% | 29 11% | 30 8% | 31.6 ? 3% | 24.6 ? 25% |
| Idle Maximum * (dB) | 32.8 | 30.5 7% | 31.8 3% | 31.8 3% | 30.2 8% | 31.8 ? 3% | 25.4 ? 23% |
| Load Average * (dB) | 42 | 33 21% | 38.7 8% | 34.8 17% | 35.4 16% | 39.5 ? 6% | 33.9 ? 19% |
| Witcher 3 ultra * (dB) | 40.7 | 39.9 2% | |||||
| Load Maximum * (dB) | 42 | 38 10% | 48.5 -15% | 40.8 3% | 35.3 16% | 42.3 ? -1% | 41.1 ? 2% |
* ... smaller is better
Temperature
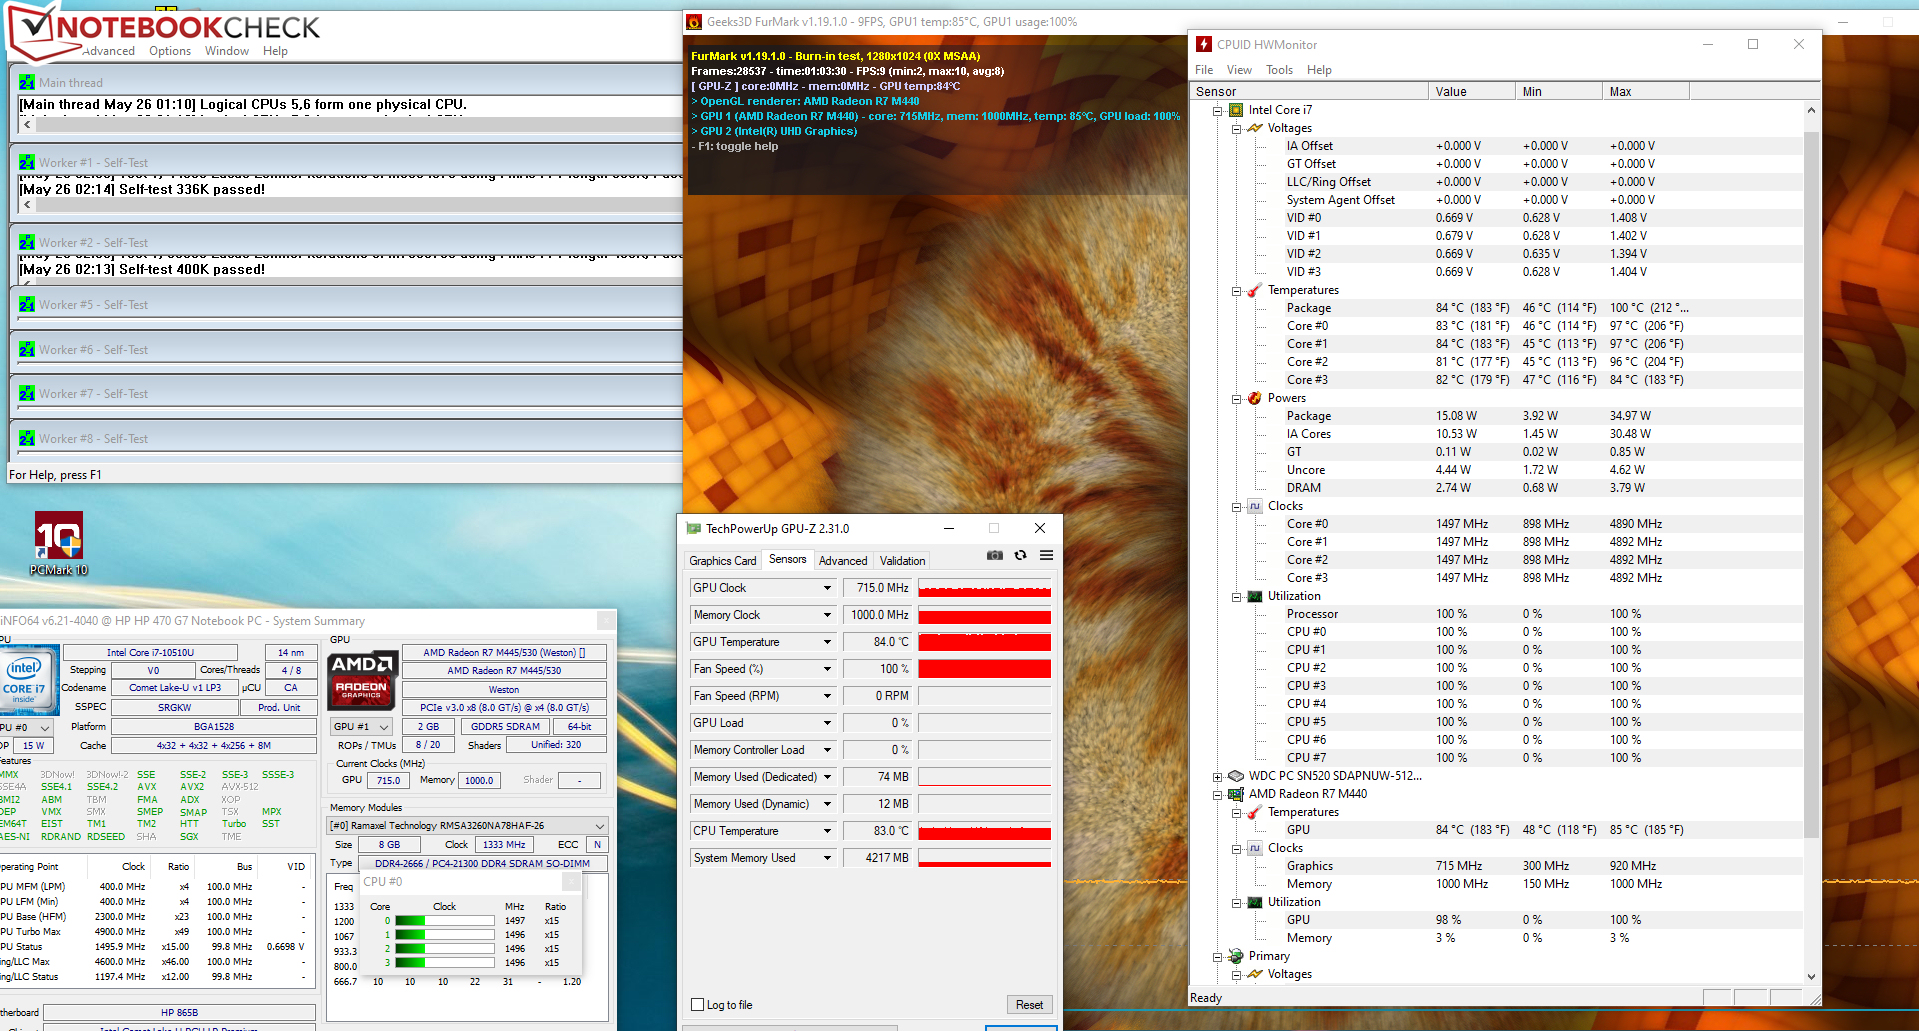
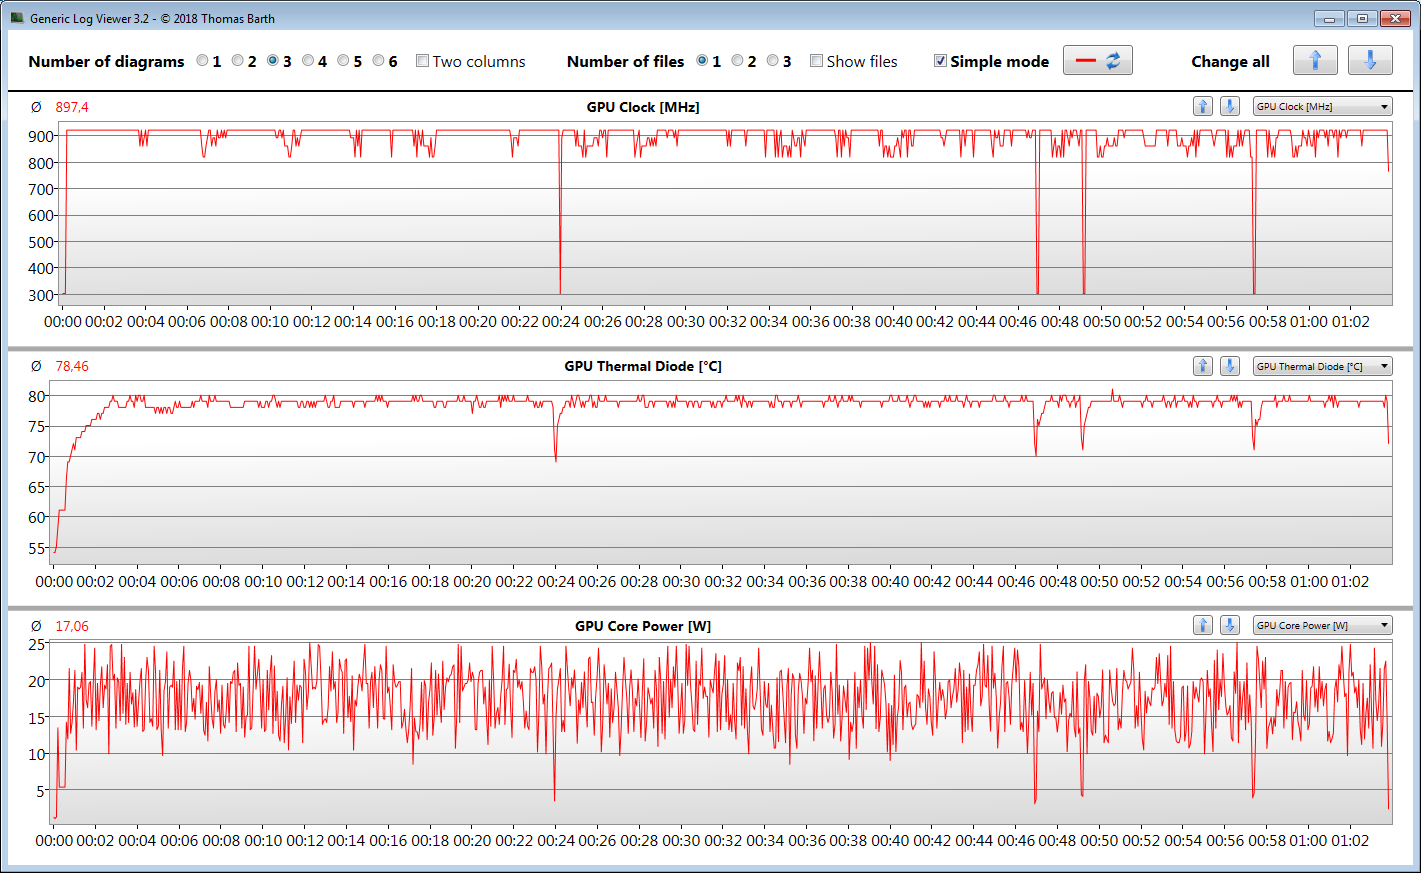
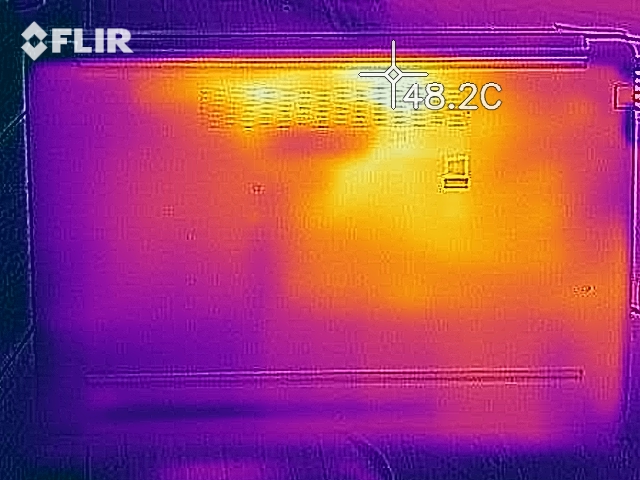
Our stress test (Prime95 and FurMark simultaneously for at least one hour) was performed identically on battery and on mains with the CPU running at between 1.5 and 1.8 GHz. GPU performance differed and varied between 300 MHz on battery and 715 MHz on mains. Keep in mind that our stress test represents an extreme load scenario that rarely ever occurs during everyday use. We use this test to check for potential stability issues under maximum load.
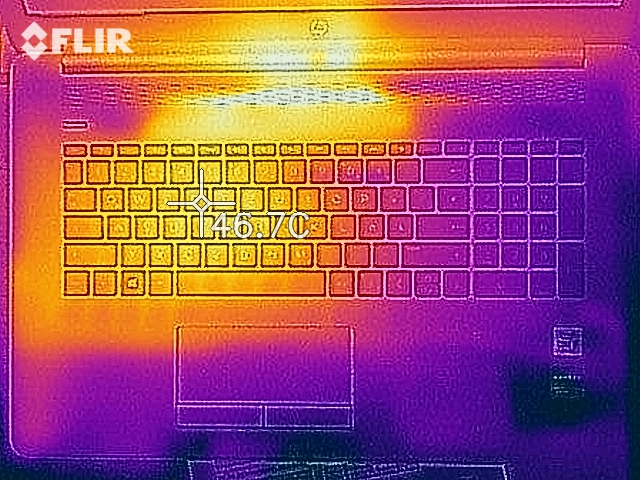
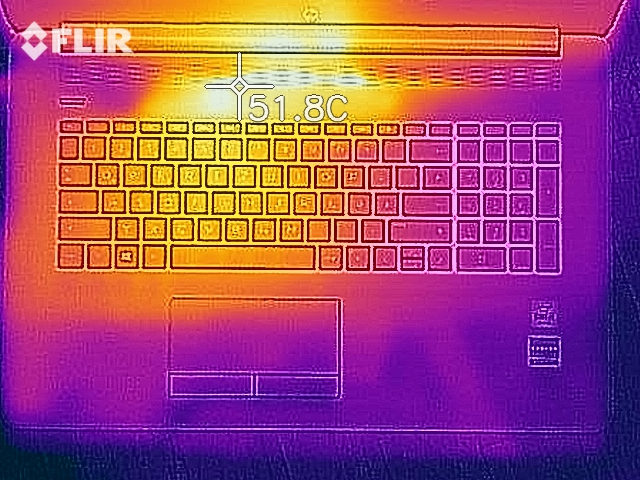
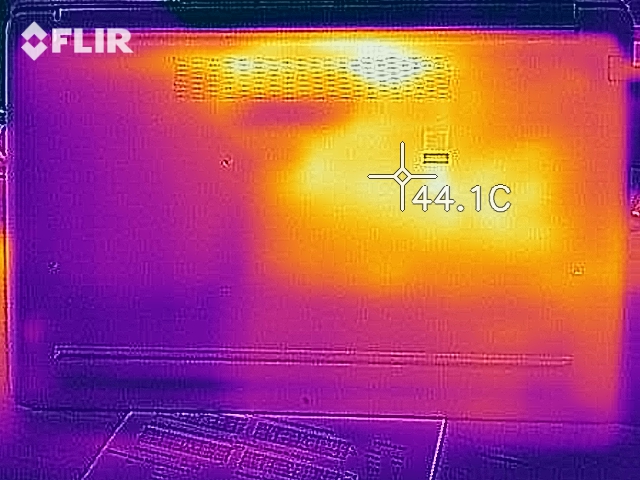
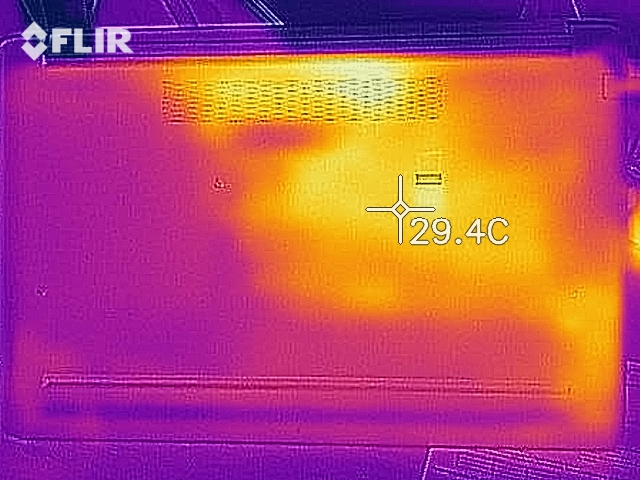
The notebook remained comparatively cool under maximum load (stress test) as well as gaming load (Witcher 3 loop), and we only found a few singular hot spots of more than 40 °C (~104 °F). Temperatures were much lower in normal everyday use scenarios.
(+) The maximum temperature on the upper side is 39 °C / 102 F, compared to the average of 34.3 °C / 94 F, ranging from 21.2 to 62.5 °C for the class Office.
(±) The bottom heats up to a maximum of 40 °C / 104 F, compared to the average of 36.8 °C / 98 F
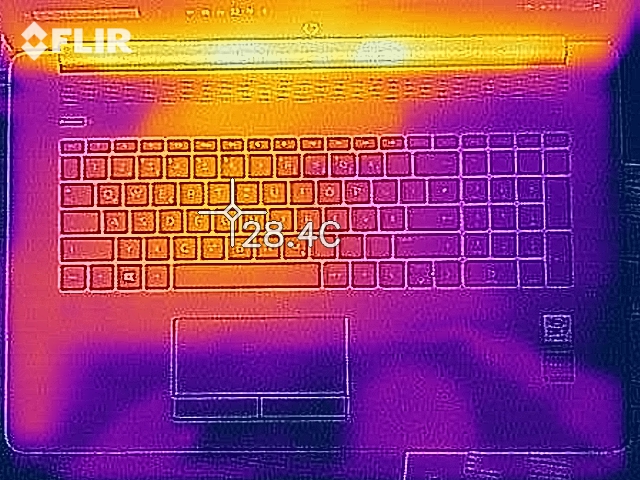
(+) In idle usage, the average temperature for the upper side is 23.7 °C / 75 F, compared to the device average of 29.5 °C / 85 F.
(+) Playing The Witcher 3, the average temperature for the upper side is 30.1 °C / 86 F, compared to the device average of 29.5 °C / 85 F.
(+) The palmrests and touchpad are cooler than skin temperature with a maximum of 26.7 °C / 80.1 F and are therefore cool to the touch.
(±) The average temperature of the palmrest area of similar devices was 27.5 °C / 81.5 F (+0.8 °C / 1.4 F).
| HP 470 G7 8VU24EA i7-10510U, Radeon 530 | HP ProBook 470 G5 i5-8250U, GeForce 930MX | Dell Inspiron 17 3780 i7-8565U, Radeon 520 | Lenovo IdeaPad 330-17IKB 81DM i5-8550U, GeForce MX150 | Lenovo Ideapad L340-17API-81LY0004GE R5 3500U, Vega 8 | Average AMD Radeon 530 | Average of class Office | |
|---|---|---|---|---|---|---|---|
| Heat | -1% | -23% | -23% | -10% | -12% | -9% | |
| Maximum Upper Side * (°C) | 39 | 38.4 2% | 49 -26% | 47.4 -22% | 36.7 6% | 41.7 ? -7% | 40.6 ? -4% |
| Maximum Bottom * (°C) | 40 | 40.1 -0% | 39.6 1% | 51 -27% | 44.1 -10% | 42.3 ? -6% | 42.8 ? -7% |
| Idle Upper Side * (°C) | 24.9 | 25.4 -2% | 32.2 -29% | 29 -16% | 28.8 -16% | 28.3 ? -14% | 27.3 ? -10% |
| Idle Bottom * (°C) | 24.5 | 24.9 -2% | 33.8 -38% | 30.6 -25% | 29.3 -20% | 29.3 ? -20% | 28.5 ? -16% |
* ... smaller is better
Speakers
The speakers are located above the keyboard behind a perforated cover. They are quite voluminous but lack bass.
HP 470 G7 8VU24EA audio analysis
(±) | speaker loudness is average but good (72.3 dB)
Bass 100 - 315 Hz
(-) | nearly no bass - on average 24.4% lower than median
(±) | linearity of bass is average (8.3% delta to prev. frequency)
Mids 400 - 2000 Hz
(±) | higher mids - on average 6.9% higher than median
(±) | linearity of mids is average (14% delta to prev. frequency)
Highs 2 - 16 kHz
(±) | higher highs - on average 6.6% higher than median
(+) | highs are linear (6.4% delta to prev. frequency)
Overall 100 - 16.000 Hz
(±) | linearity of overall sound is average (27.7% difference to median)
Compared to same class
» 86% of all tested devices in this class were better, 4% similar, 10% worse
» The best had a delta of 7%, average was 21%, worst was 53%
Compared to all devices tested
» 84% of all tested devices were better, 3% similar, 13% worse
» The best had a delta of 4%, average was 24%, worst was 134%
HP ProBook 470 G5 audio analysis
(-) | not very loud speakers (71.7 dB)
Bass 100 - 315 Hz
(-) | nearly no bass - on average 25.6% lower than median
(±) | linearity of bass is average (8.8% delta to prev. frequency)
Mids 400 - 2000 Hz
(+) | balanced mids - only 3.6% away from median
(±) | linearity of mids is average (7.5% delta to prev. frequency)
Highs 2 - 16 kHz
(+) | balanced highs - only 4% away from median
(+) | highs are linear (4.1% delta to prev. frequency)
Overall 100 - 16.000 Hz
(±) | linearity of overall sound is average (22.2% difference to median)
Compared to same class
» 58% of all tested devices in this class were better, 9% similar, 33% worse
» The best had a delta of 7%, average was 21%, worst was 53%
Compared to all devices tested
» 64% of all tested devices were better, 6% similar, 29% worse
» The best had a delta of 4%, average was 24%, worst was 134%
Energy Management – HP system with poor stamina
Power Consumption
HP’s notebook did not offer any surprises in regard to power consumption. When idle we determined a maximum consumption of 9.8 W, which increased to 61 W during our stress test (Prime95 and FurMark simultaneously for at least one hour). The power supply is rated at 65 W.
| Off / Standby | |
| Idle | |
| Load |
|
Key:
min: | |
| HP 470 G7 8VU24EA i7-10510U, Radeon 530 | HP ProBook 470 G5 i5-8250U, GeForce 930MX | Dell Inspiron 17 3780 i7-8565U, Radeon 520 | Lenovo IdeaPad 330-17IKB 81DM i5-8550U, GeForce MX150 | Lenovo Ideapad L340-17API-81LY0004GE R5 3500U, Vega 8 | Average AMD Radeon 530 | Average of class Office | |
|---|---|---|---|---|---|---|---|
| Power Consumption | -8% | -27% | -24% | 20% | -15% | -4% | |
| Idle Minimum * (Watt) | 3 | 3.4 -13% | 5 -67% | 4.7 -57% | 3.8 -27% | 5.34 ? -78% | 4.41 ? -47% |
| Idle Average * (Watt) | 7.7 | 9.6 -25% | 10.9 -42% | 9.2 -19% | 6.3 18% | 8.12 ? -5% | 7.37 ? 4% |
| Idle Maximum * (Watt) | 9.8 | 11.8 -20% | 12 -22% | 10.6 -8% | 6.8 31% | 11.3 ? -15% | 8.58 ? 12% |
| Load Average * (Watt) | 52 | 43 17% | 49.6 5% | 56.3 -8% | 31 40% | 46.5 ? 11% | 43 ? 17% |
| Witcher 3 ultra * (Watt) | 43 | 55 -28% | |||||
| Load Maximum * (Watt) | 61 | 61 -0% | 66.9 -10% | 75.3 -23% | 38.6 37% | 54.8 ? 10% | 64.6 ? -6% |
* ... smaller is better
Battery Life
In our real-life Wi-Fi battery test, the 470 G7 ran for 4:34 hours. This test simulates typical web browsing load. All energy-saving features are disabled, the power profile is set to “Balanced”, and display brightness is normalized to 150 nits. In our video test, the 17.3-inch device ran out of power after 5:37 hours. In this test we run the Big Buck Bunny short film (H.264-encoding, FHD resolution) in a loop. The power profile is set to “Energy Saver”, all wireless modules as well as energy-saving features are disabled, and display brightness is once again normalized to 150 nits.
| HP 470 G7 8VU24EA i7-10510U, Radeon 530, 41.6 Wh | HP ProBook 470 G5 i5-8250U, GeForce 930MX, 48 Wh | Dell Inspiron 17 3780 i7-8565U, Radeon 520, 42 Wh | Lenovo IdeaPad 330-17IKB 81DM i5-8550U, GeForce MX150, 34 Wh | Lenovo Ideapad L340-17API-81LY0004GE R5 3500U, Vega 8, 36 Wh | Average of class Office | |
|---|---|---|---|---|---|---|
| Battery runtime | 56% | -18% | -13% | 50% | 114% | |
| Reader / Idle (h) | 14 | 18.7 34% | 9.6 -31% | 8.5 -39% | 23.7 ? 69% | |
| H.264 (h) | 5.6 | 7.6 36% | 15 ? 168% | |||
| WiFi v1.3 (h) | 4.6 | 8.1 76% | 4.2 -9% | 3.9 -15% | 6.9 50% | 12.9 ? 180% |
| Load (h) | 1.3 | 2.3 77% | 1.1 -15% | 1.5 15% | 1.807 ? 39% |
Pros
Cons
Verdict
HP’s 470 G7 is a 17.3-inch office notebook made for home and professional use alike. While its predecessors were part of HP’s ProBook family the current model has been degraded and lacks the ProBook moniker. The device is enclosed by an all-plastic case that should have been more robust.
The 470 G7 is a solid notebook for desktop use. It fails to set itself apart from its predecessor.
The Core i7 Comet Lake processor performed adequately well for office and internet applications. Due to its unsatisfactory turbo boost capabilities the 470 G7 performed worse than many other 10510U-equipped notebooks. This became particularly noticeable in multi-thread performance tests and less so in the more-important-for-everyday-use single-thread scenarios.
The processor is accompanied by an ancient Radeon 530 GPU that allows for some very limited gaming (older games, games with low hardware requirements). Compared to Intel’s integrated UHD Graphics 620 the Radeon 530 did not perform that much better.
Overall system performance was solid, thanks to its NVMe SSD. Swapping the SSD requires opening the case. The same must be done when upgrading the RAM, although our device was already equipped with the supported maximum of 16 GB.
The matte IPS FHD display offered wide viewing angles, good colors, and a decent color space coverage. Brightness and contrast ratio should have been better. The backlit keyboard turned out to be quite usable. Battery life was rather poor.
The 470 G7 cannot distance itself from its predecessor. The ProBook 470 G5 offers more: maintenance openings, higher-quality case, swappable keyboard, up to 32 GB of RAM, three video-out ports, USB Type-C including Power Delivery and DisplayPort via USB-C, and a much better battery life. If you are in the market for a 17.3-inch business laptop we suggest going for the ProBook 470 G5 instead as long as it is still available.
HP 470 G7 8VU24EA
- 06/04/2020 v7 (old)
Sascha Mölck
Price comparison

