

Asus ProArt StudioBook 16 H7600ZW Review: The definitive MacBook Pro alternative for content creators

The Asus ProArt lineup is targeted at creative professionals who need top-of-the-line hardware for unhindered productivity. The ProArt StudioBook aims to be MacBook Pro replacement for creatives on the Windows side and comes with unique features tailored towards creators on the move.
We previously reviewed the ProArt StudioBook 16 Pro W7600 workstation laptop featuring the Intel Xeon W-11955M and an Nvidia RTX A5000 Laptop GPU. Now, we have with us the ProArt StudioBook 16 H7600ZW featuring an Intel Core i9-12900H and an Nvidia GeForce RTX 3070 Ti Laptop GPU.
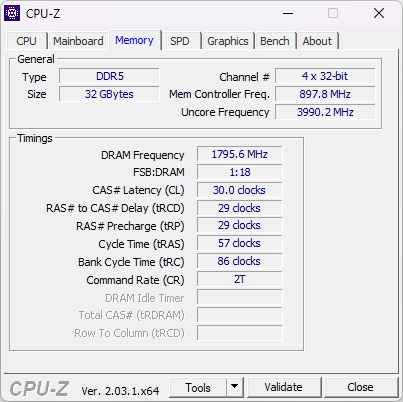
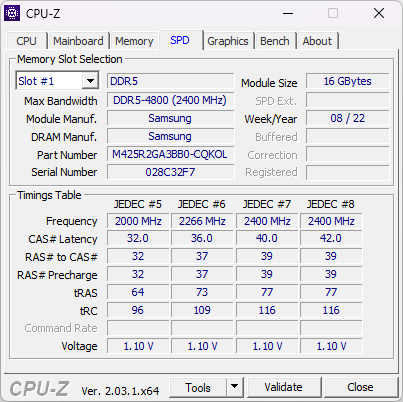
Our test sample is also equipped with 32 GB DDR5-4800 RAM, a 16-inch Samsung 4K OLED panel, and 1 TB PCIe storage. Asus has currently priced this configuration starting from ₹1,99,990 MRP or from US$2,699.99 in the US.
Unfortunately, Asus has skipped Ryzen 6000 or Ryzen 7000 options altogether for the ProArt series. The only Ryzen-based SKU currently available is the ProArt StudioBook 16 OLED H5600 with a Ryzen 9 5900HX and RTX 3070 Laptop GPU. A review of this variant will follow shortly.
However, Asus unveiled the ProArt StudioBook 16 3D OLED at CES 2023 with Intel 13th gen and 3D OLED panel upgrades, which we hope to review in the coming weeks.
In this review, we put the Asus ProArt StudioBook 16 H7600ZW to the test and see if this laptop indeed has the potential to let your creativity flow unhindered.
Potential Competitors in Comparison
Rating | Date | Model | Weight | Height | Size | Resolution | Price |
|---|---|---|---|---|---|---|---|
| 89 % v7 (old) | 02 / 2023 | Asus ProArt StudioBook 16 H7600ZW i9-12900H, GeForce RTX 3070 Ti Laptop GPU | 2.4 kg | 19.9 mm | 16.00" | 3840x2400 | |
| 83.8 % v7 (old) | 09 / 2022 | MSI Creator Z17 A12UGST-054 i9-12900H, GeForce RTX 3070 Ti Laptop GPU | 2.5 kg | 19 mm | 17.00" | 2560x1600 | |
| 83.7 % v7 (old) | 06 / 2022 | MSI Creator Z16P B12UHST i9-12900H, GeForce RTX 3080 Ti Laptop GPU | 2.4 kg | 20.4 mm | 16.00" | 2560x1600 | |
| 86.3 % v7 (old) | 05 / 2022 | Asus ROG Strix Scar 15 G533ZW-LN106WS i9-12900H, GeForce RTX 3070 Ti Laptop GPU | 2.3 kg | 27.2 mm | 15.60" | 2560x1440 | |
| 88.4 % v7 (old) | 12 / 2022 | Asus ZenBook Pro 16X OLED UX7602ZM-ME115W i9-12900H, GeForce RTX 3060 Laptop GPU | 2.4 kg | 19.5 mm | 16.00" | 3840x2400 | |
| 84.7 % v7 (old) | 03 / 2022 | Gigabyte Aero 16 YE5 i9-12900HK, GeForce RTX 3080 Ti Laptop GPU | 2.3 kg | 22.4 mm | 16.00" | 3840x2400 | |
| 87.9 % v7 (old) | 10 / 2022 | Lenovo ThinkBook 16p G3 ARH R9 6900HX, GeForce RTX 3060 Laptop GPU | 2.1 kg | 19.5 mm | 16.00" | 2560x1600 | |
| 88.2 % v7 (old) | 05 / 2022 | Asus ROG Zephyrus Duo 16 GX650RX R9 6900HX, GeForce RTX 3080 Ti Laptop GPU | 2.6 kg | 20.5 mm | 16.00" | 3840x2400 | |
| 93.2 % v7 (old) | 11 / 2021 | Apple MacBook Pro 16 2021 M1 Pro M1 Pro, M1 Pro 16-Core GPU | 2.2 kg | 16.8 mm | 16.20" | 3456x2234 | |
| 92.1 % v7 (old) | 04 / 2022 | Apple MacBook Pro 14 2021 M1 Max 24-Core GPU M1 Max, M1 Max 24-Core GPU | 1.6 kg | 15.5 mm | 14.20" | 3024x1964 |
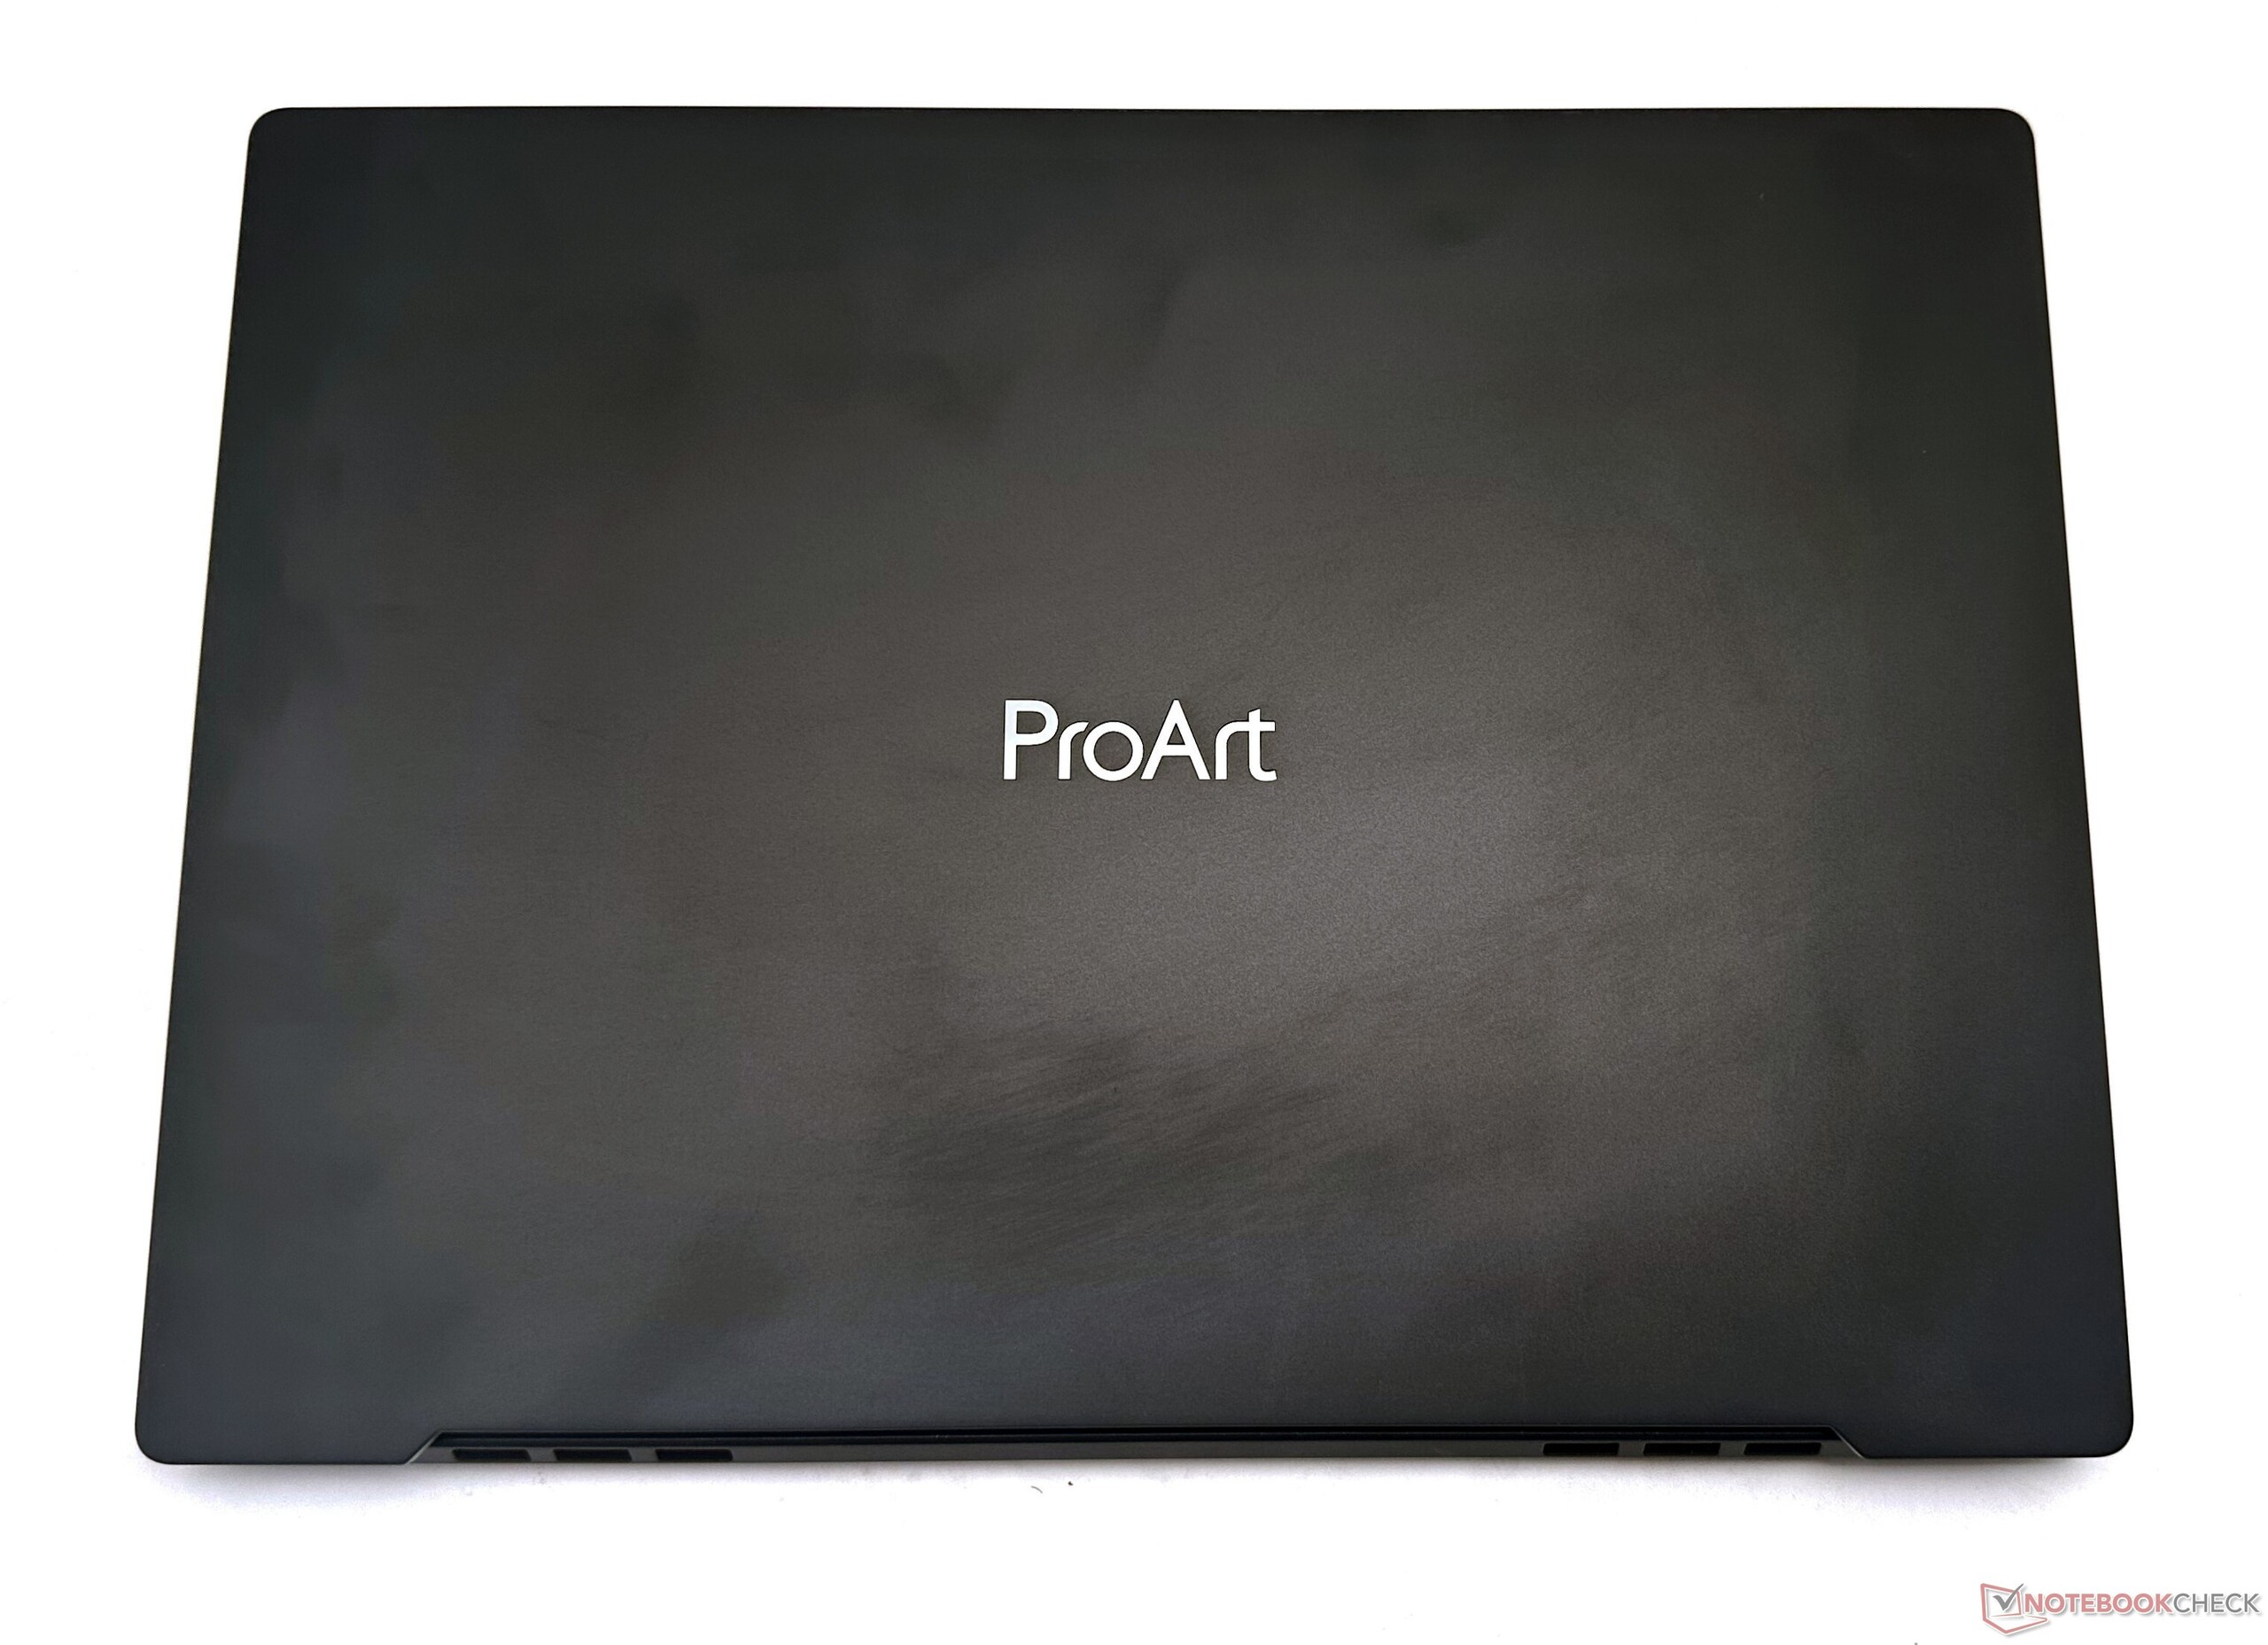
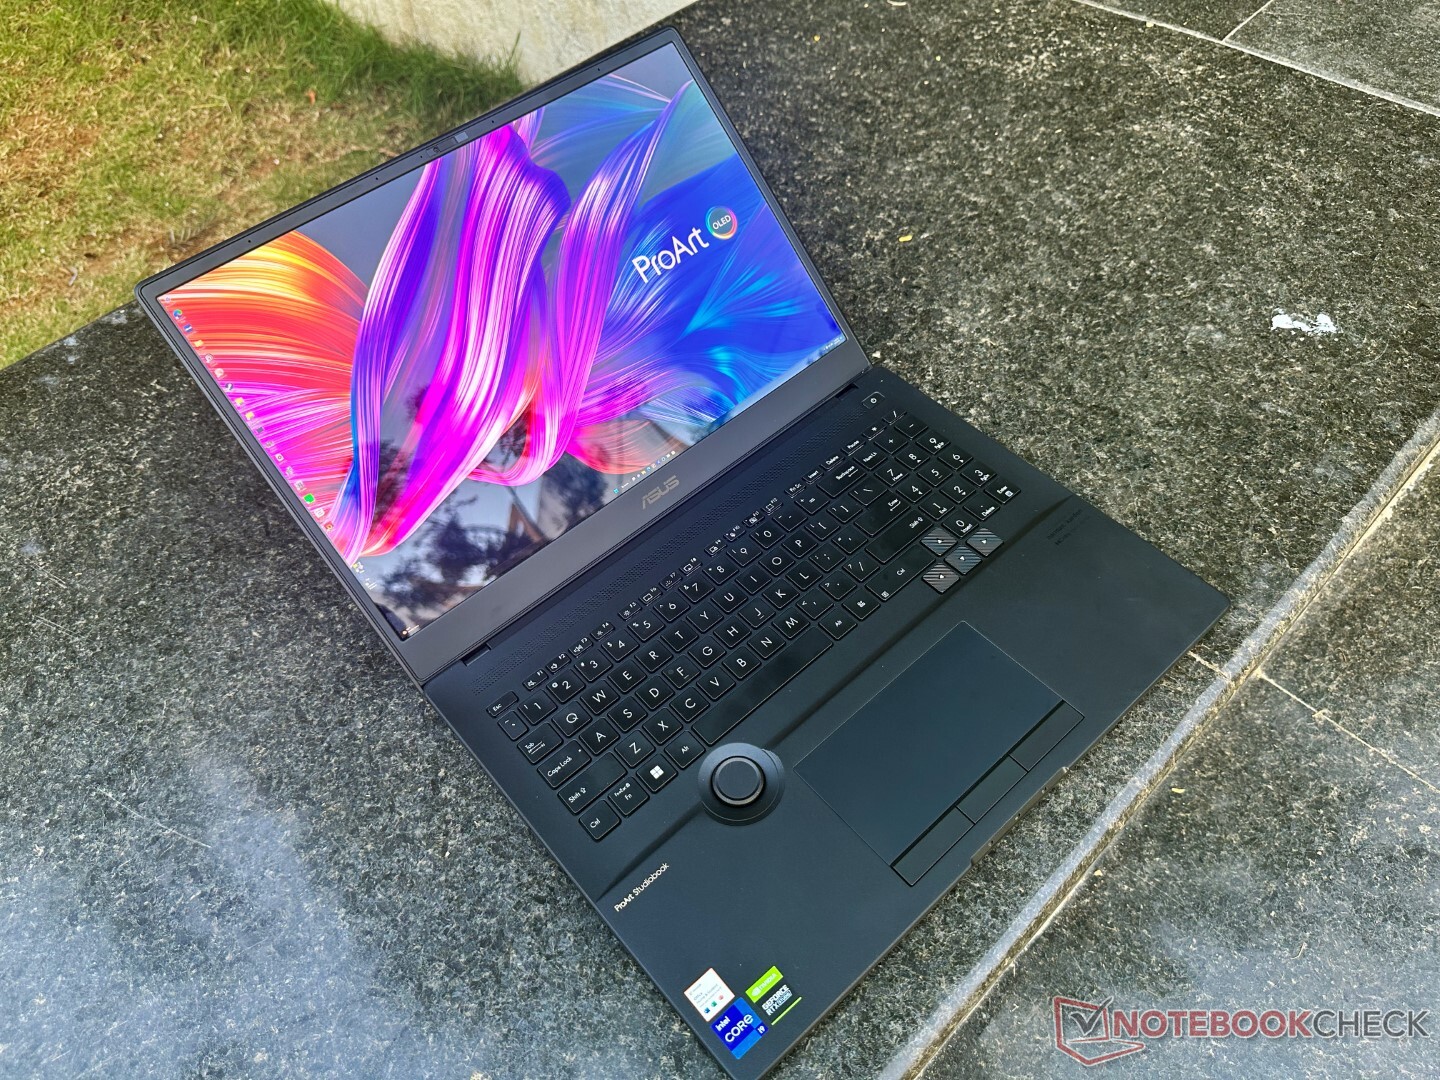
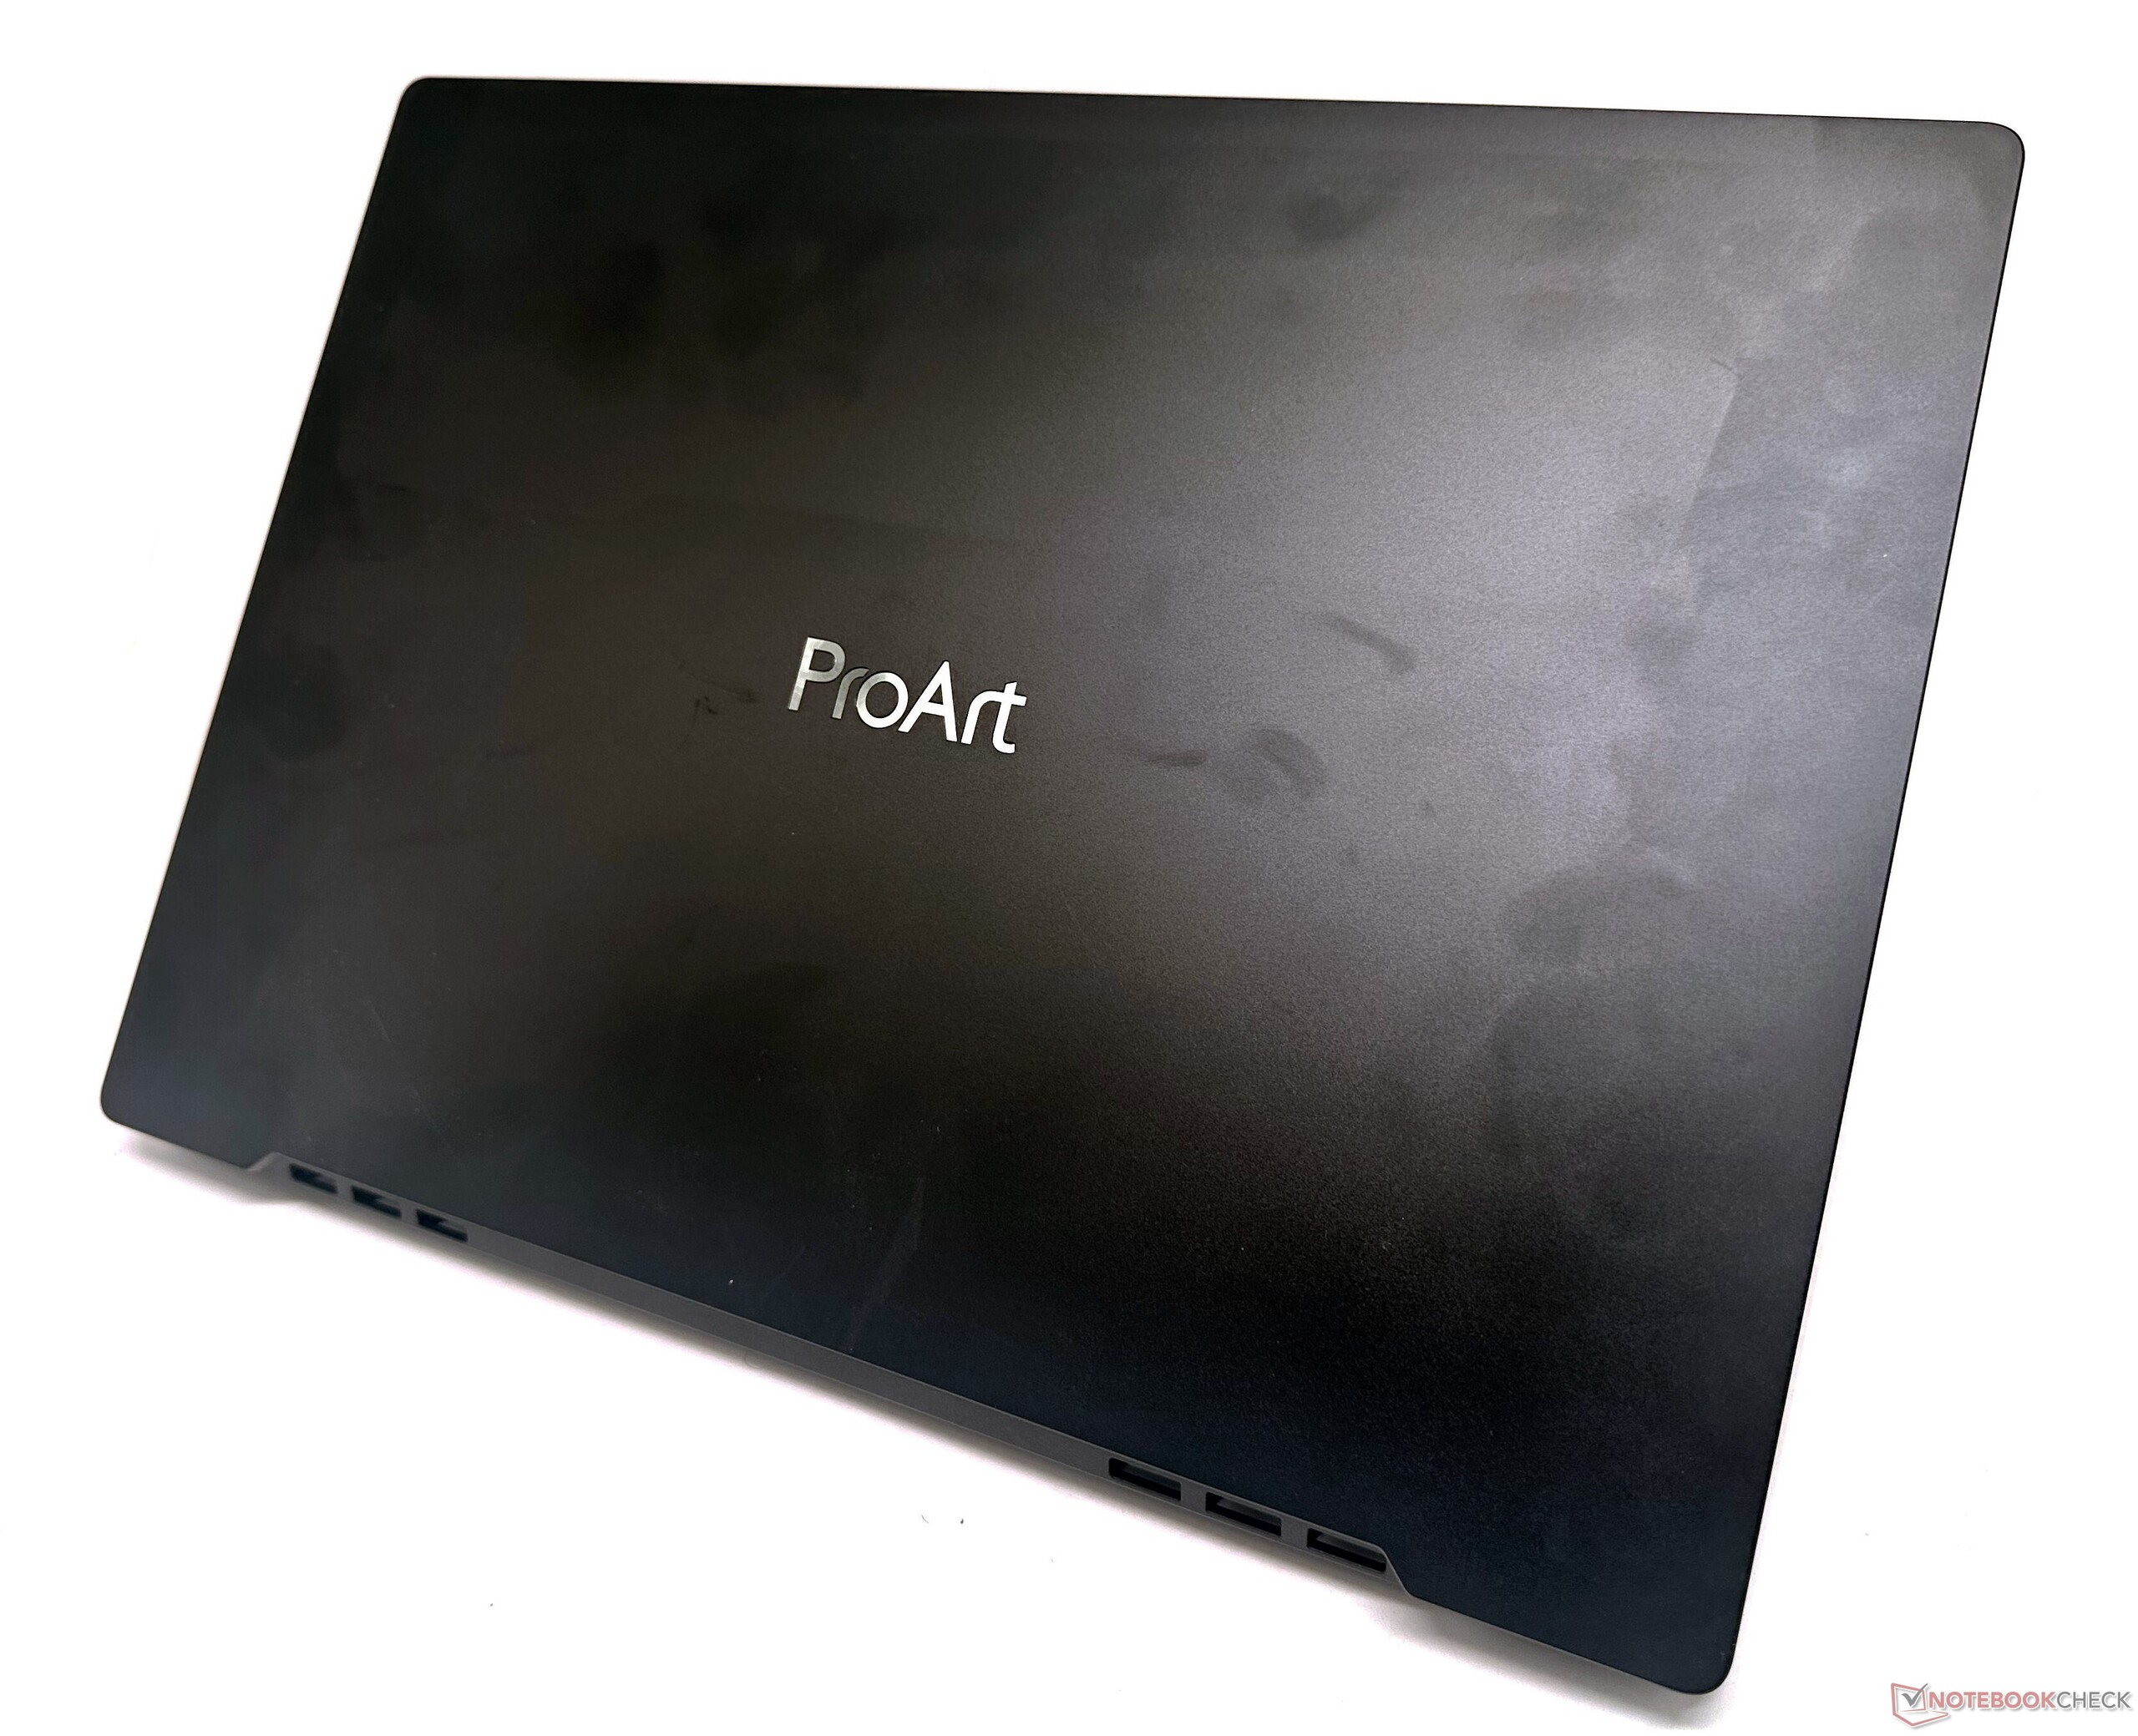
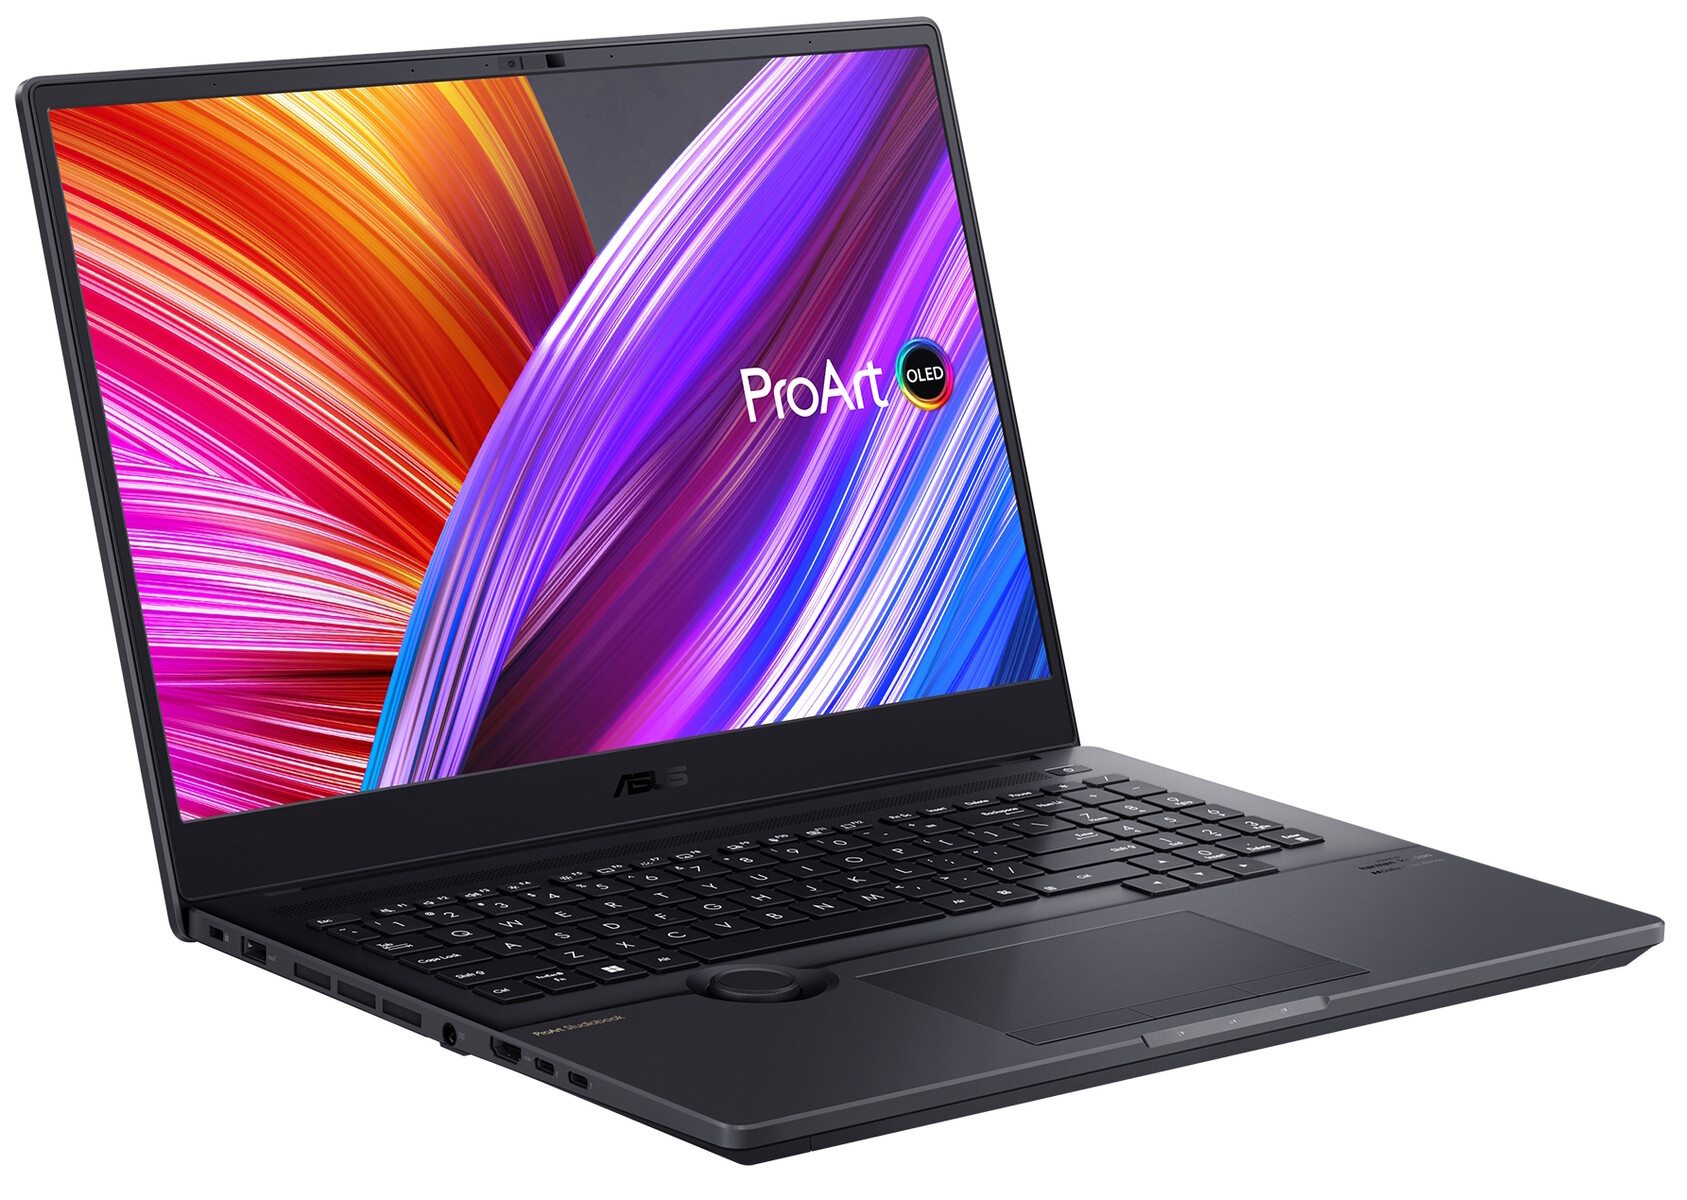
Case: Confidence-inspiring aluminum alloy
The chassis and haptics are exactly identical to that of the ProArt StudioBook 16 Pro W7600. The laptop is quite hefty at 2.4 kg, but the equal weight distribution across the 0.78-inch slim 16-inch chassis does inspire confidence in daily handling.
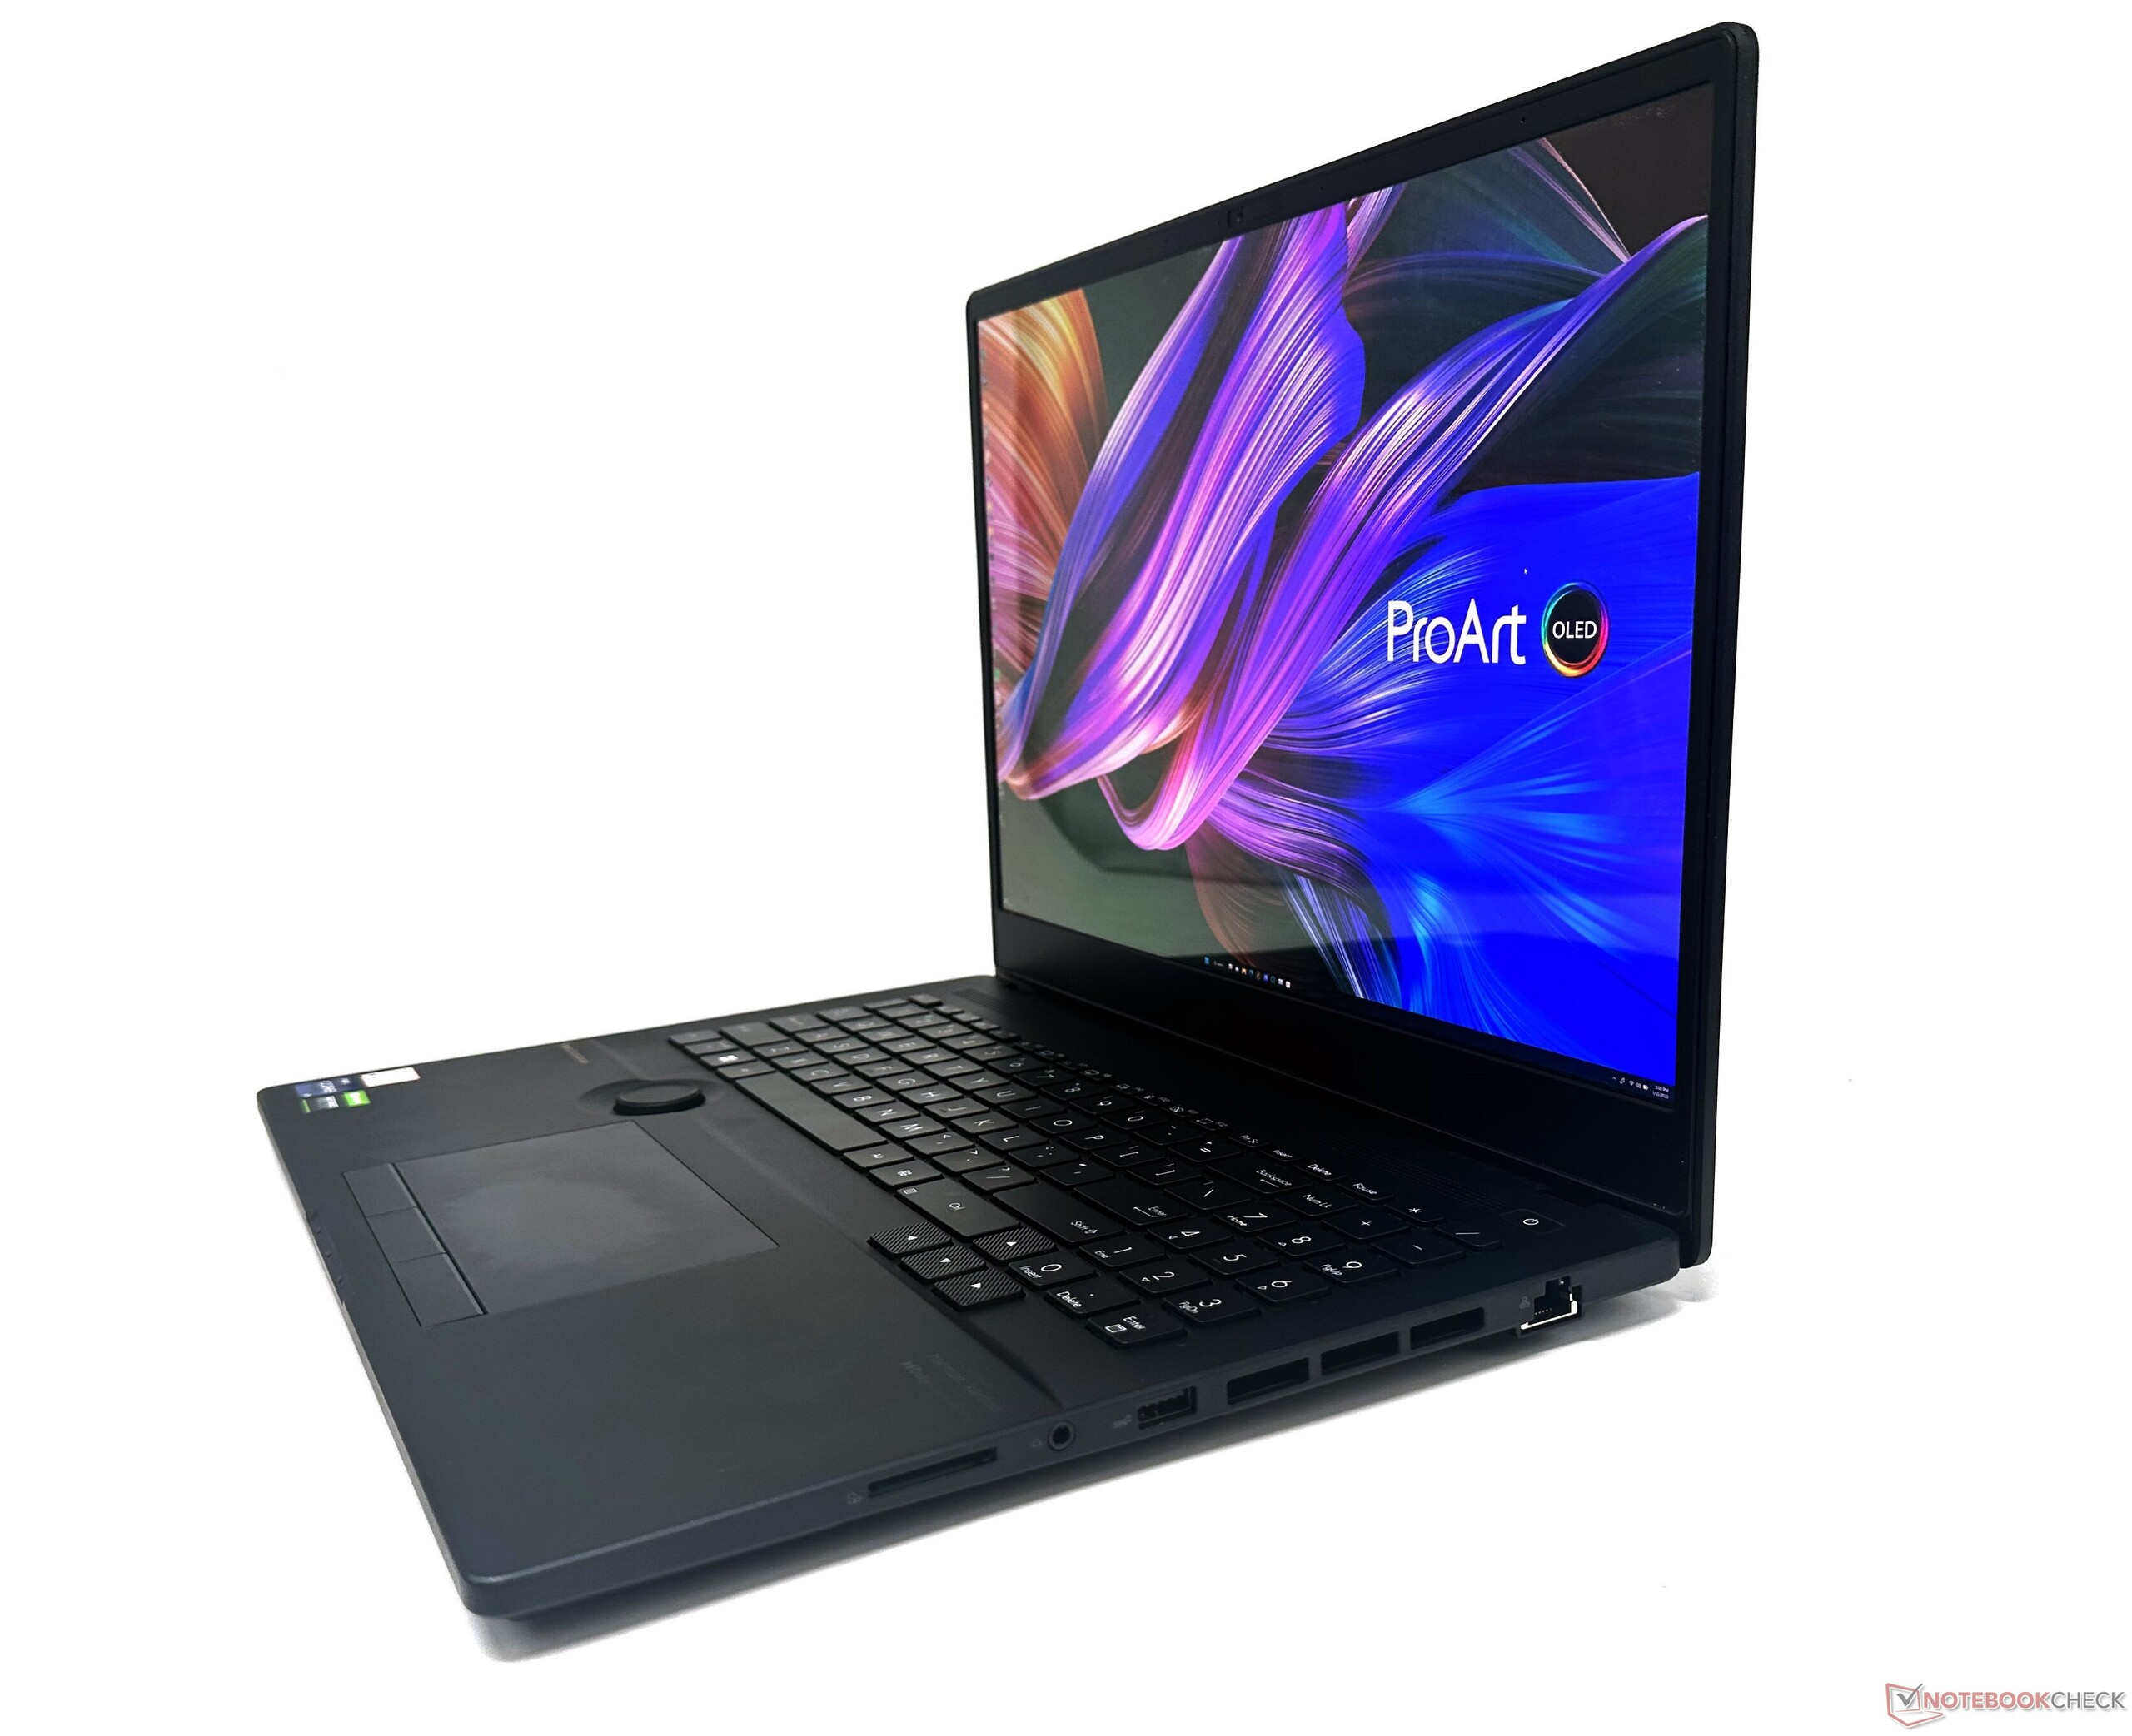
In particular, we like the raised design that allows for a more comfortable typing experience and for unhindered airflow. There are no sharp edges, and we didn't experience any wanton display wobbles. The lid is fairly resistant to twisting as well. The lid can be opened with one finger up to 150° without any stability issues.
The top of the keyboard deck has air intake vents. The deck itself is well-built and has no perceivable flex. There are three status indicators on the bottom for power, battery, and SSD activity.
Asus claims that the matte lid with a Mineral Black color scheme features a "high-tech anti-fingerprint nano-coating". Though fingerprints may not be visible, the lid is not immune to grime and is not oleophobic.
The ProArt StudioBook 16 also meets MIL-STD-810H criteria for durability and can easily withstand the vagaries of working in the great outdoors.
Overall, the Asus ProArt StudioBook 16 may not exactly give off MacBook Pro vibes, but the aluminum alloy construction is definitely premium, minimalist, and tallies well with the asking price.
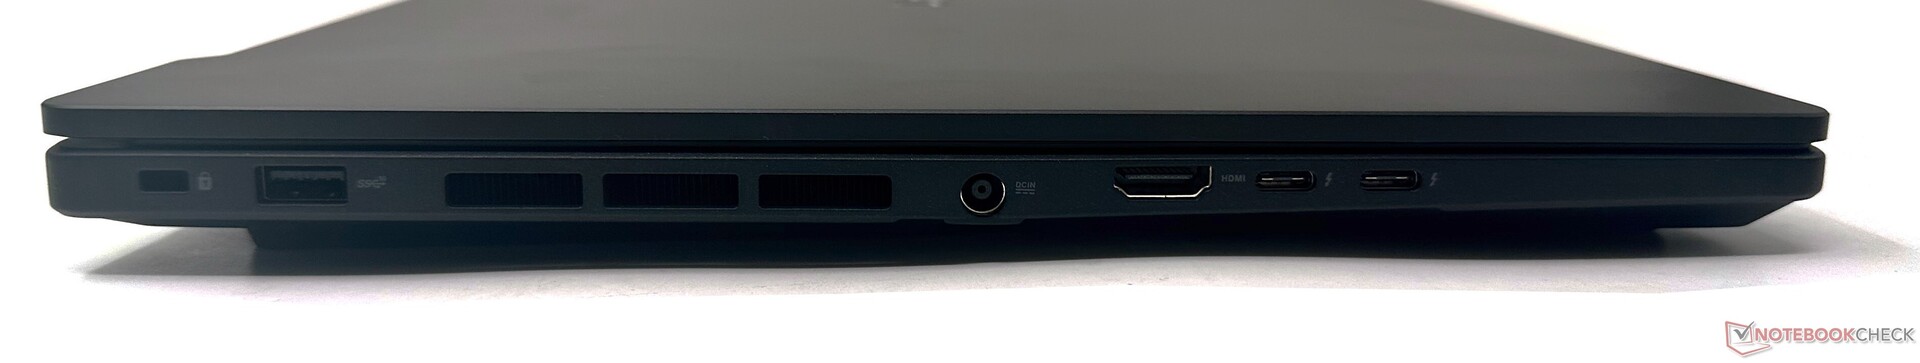
Connectivity: Slow, inconsistent Wi-Fi 6E throughput
Port selection on the Asus ProArt StudioBook 16 decent but not very extensive. Asus completely foregoes USB 2.0 ports. Instead, you get two USB 3.2 Gen2 Type-A ports, one on either side.
By virtue of being an Intel platform, a couple of Thunderbolt 4 ports are also available towards the left. There's also a HDMI 2.1-out and a 2.5 Gb LAN port available.
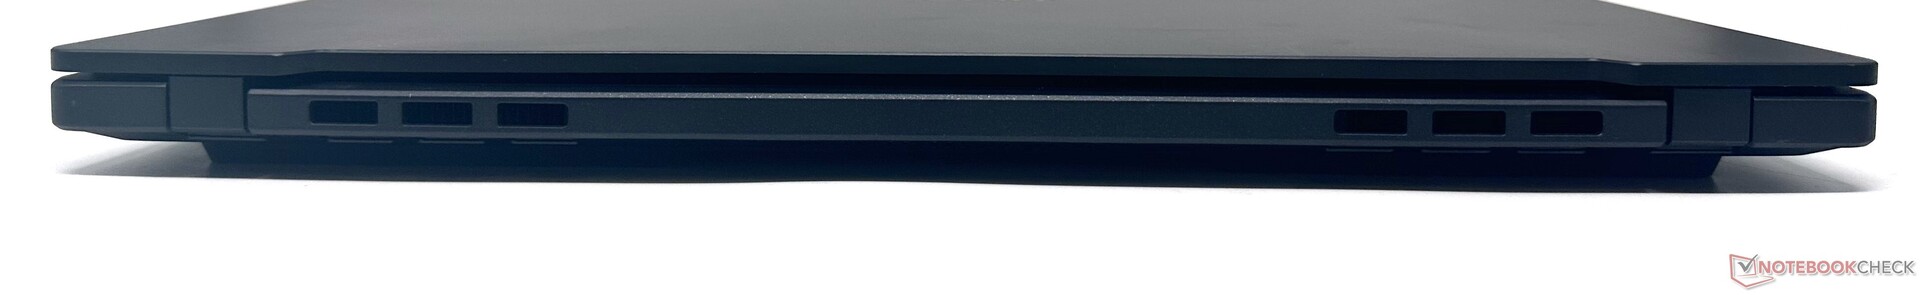
The rear offers no connectivity. Since this is a creator-focused laptop, it would have probably made better sense to place the Thunderbolt 4 ports at the back instead of cramming both of them on the left side of the chassis. This would have helped in avoiding clutter in the main working area due to docks and other such accessories.
Nevertheless, we did not find any particular hindrance while connecting multiple peripherals.
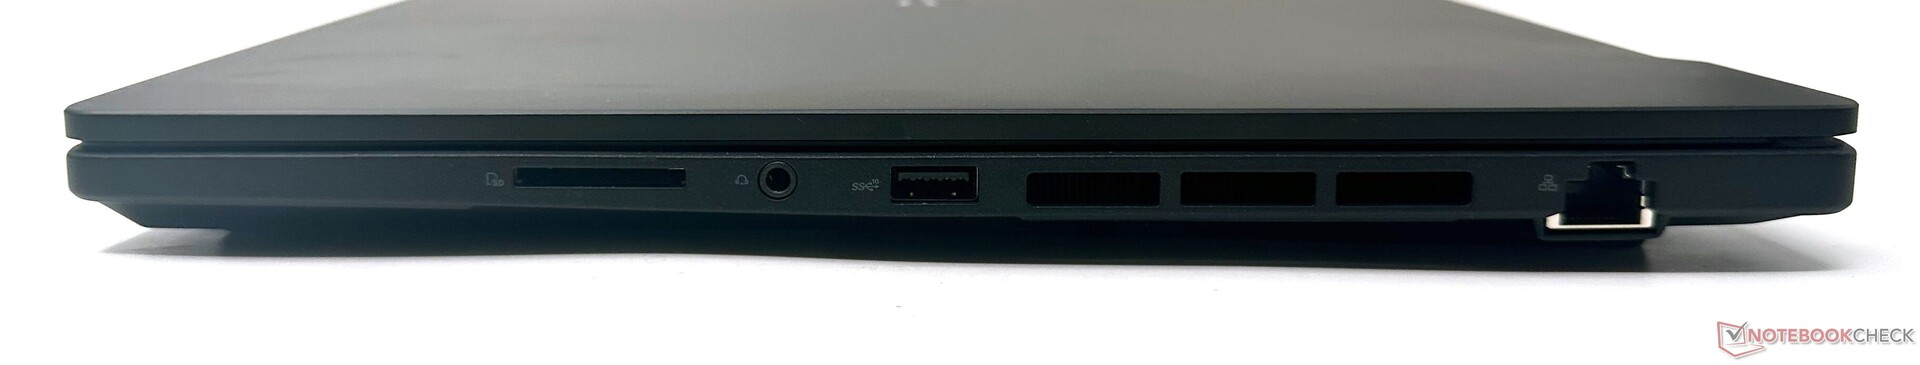
SD Card Reader
Asus equips the ProArt StudoBook 16 with an SD Express 7.0 card reader. The card reader offers decent transfer speeds that is close to the class average and is similar to the ones in the Lenovo ThinkBook 16p Gen 3 and the Asus ZenBook Pro 16X OLED.
However, this is not the fastest SD card performance we've seen — that credit goes to the ROG Zephyrus Duo 16 and the 2021 Apple MacBook Pro 16.
| SD Card Reader | |
| average JPG Copy Test (av. of 3 runs) | |
| Asus ROG Zephyrus Duo 16 GX650RX (AV PRO microSD 128 GB V60) | |
| Apple MacBook Pro 16 2021 M1 Pro (Angelbird AV Pro V60) | |
| Average of class Multimedia (21.1 - 198, n=43, last 2 years) | |
| MSI Creator Z17 A12UGST-054 (AV Pro SD microSD 128 GB V60) | |
| MSI Creator Z16P B12UHST (AV PRO microSD 128 GB V60) | |
| Lenovo ThinkBook 16p G3 ARH (AV PRO microSD 128 GB V60) | |
| Asus ProArt StudioBook 16 H7600ZW (AV PRO microSD 128 GB V60) | |
| Asus ZenBook Pro 16X OLED UX7602ZM-ME115W (AV Pro SD microSD 128 GB V60) | |
| maximum AS SSD Seq Read Test (1GB) | |
| Asus ROG Zephyrus Duo 16 GX650RX (AV PRO microSD 128 GB V60) | |
| Average of class Multimedia (27.4 - 262, n=43, last 2 years) | |
| Lenovo ThinkBook 16p G3 ARH (AV PRO microSD 128 GB V60) | |
| Asus ProArt StudioBook 16 H7600ZW (AV PRO microSD 128 GB V60) | |
| Asus ZenBook Pro 16X OLED UX7602ZM-ME115W (AV Pro SD microSD 128 GB V60) | |
| MSI Creator Z17 A12UGST-054 (AV Pro SD microSD 128 GB V60) | |
Communication
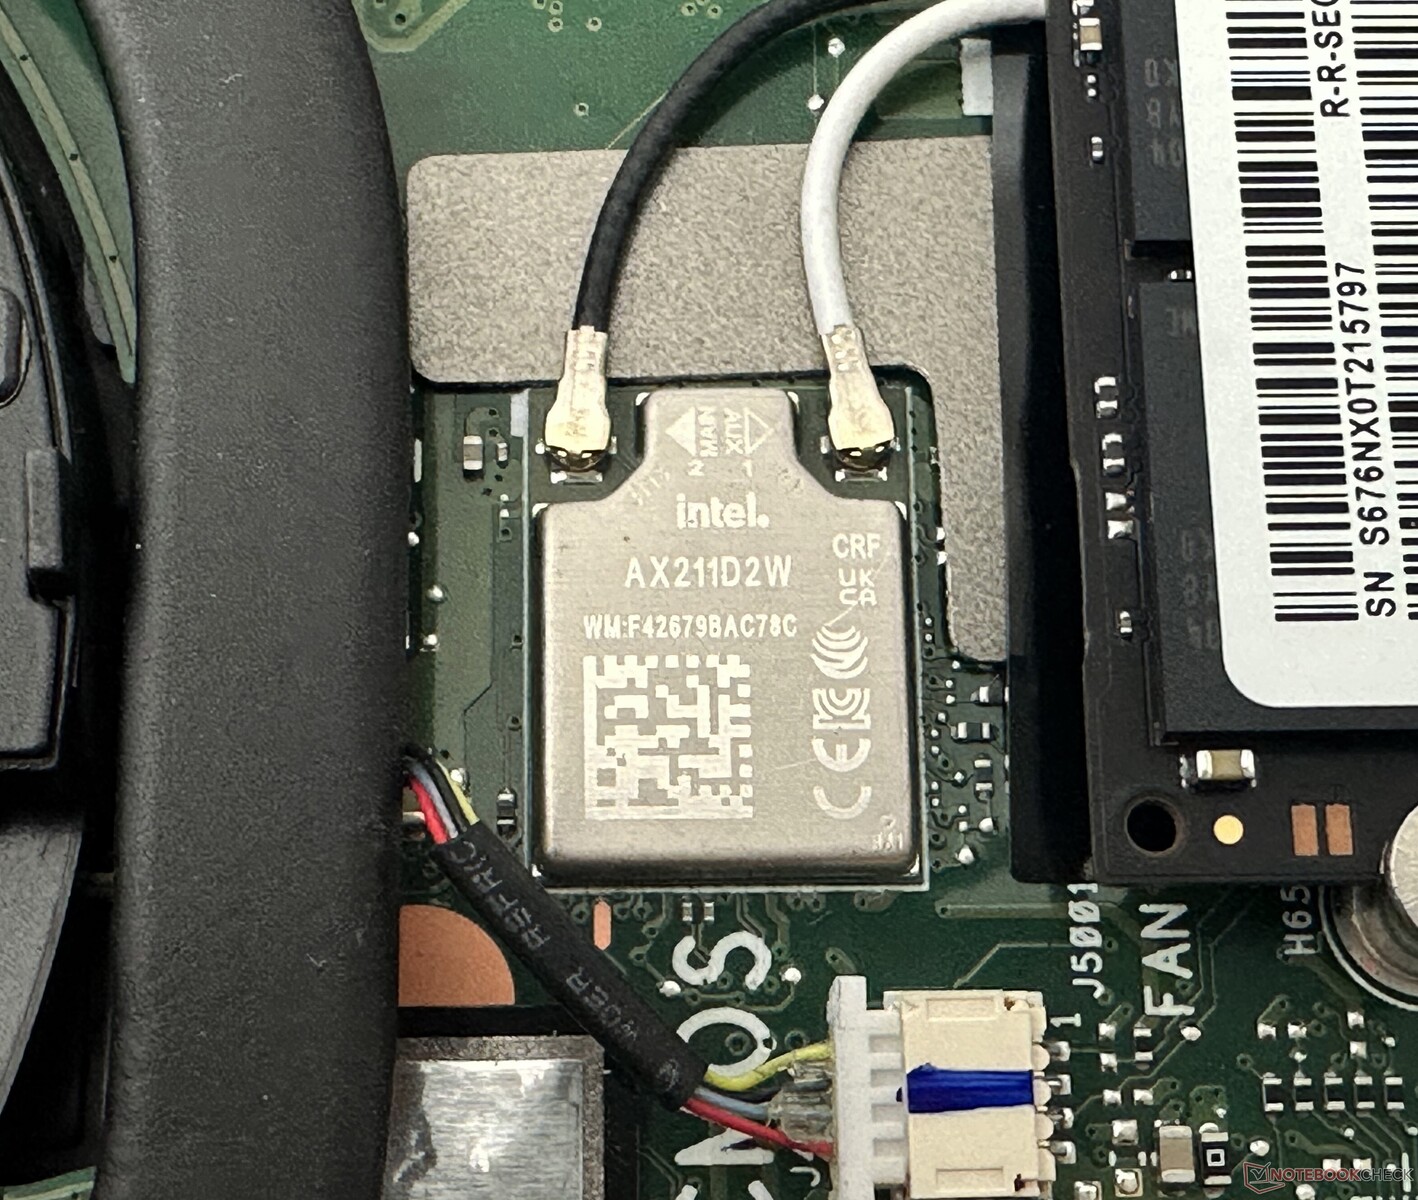
The ProArt StudioBook 16 features an Intel Wi-Fi 6E AX211 WLAN card, which is unfortunately soldered onto the motherboard. We tested Wi-Fi performance in both the 5 GHz and 6 GHz bands with our reference Asus ROG Rapture GT-AXE11000 router at a distance of 1 m from the laptop with no other connected device or external interference.
The laptop showed decent transfer rates in the 5 GHz spectrum that is generally on par with the competition. The 6 GHz band, however, performs rather poorly, particularly in the transmit test, with a lot of instability. We found this to be the case even after multiple repeats.
Webcam
The ProArt StudioBook 16 lacks a quality webcam. The included 720p camera's image quality is nothing to write home about.
The pictures show large color deviations and lack sharpness and detail, though they can be just about serviceable for the odd video call or two as long there's adequate ambient light. It possible to turn off the webcam via a shortcut on the F11 key.
Asus could have easily supplied a 1080p module instead for the asking price.


Security
The ProArt StudioBook 16 comes with a physical shutter for the webcam and offers an IR camera for Windows Hello-based logins. There's no fingerprint reader, but a TPM 2.0 chip and a Kensington lock slot are present.
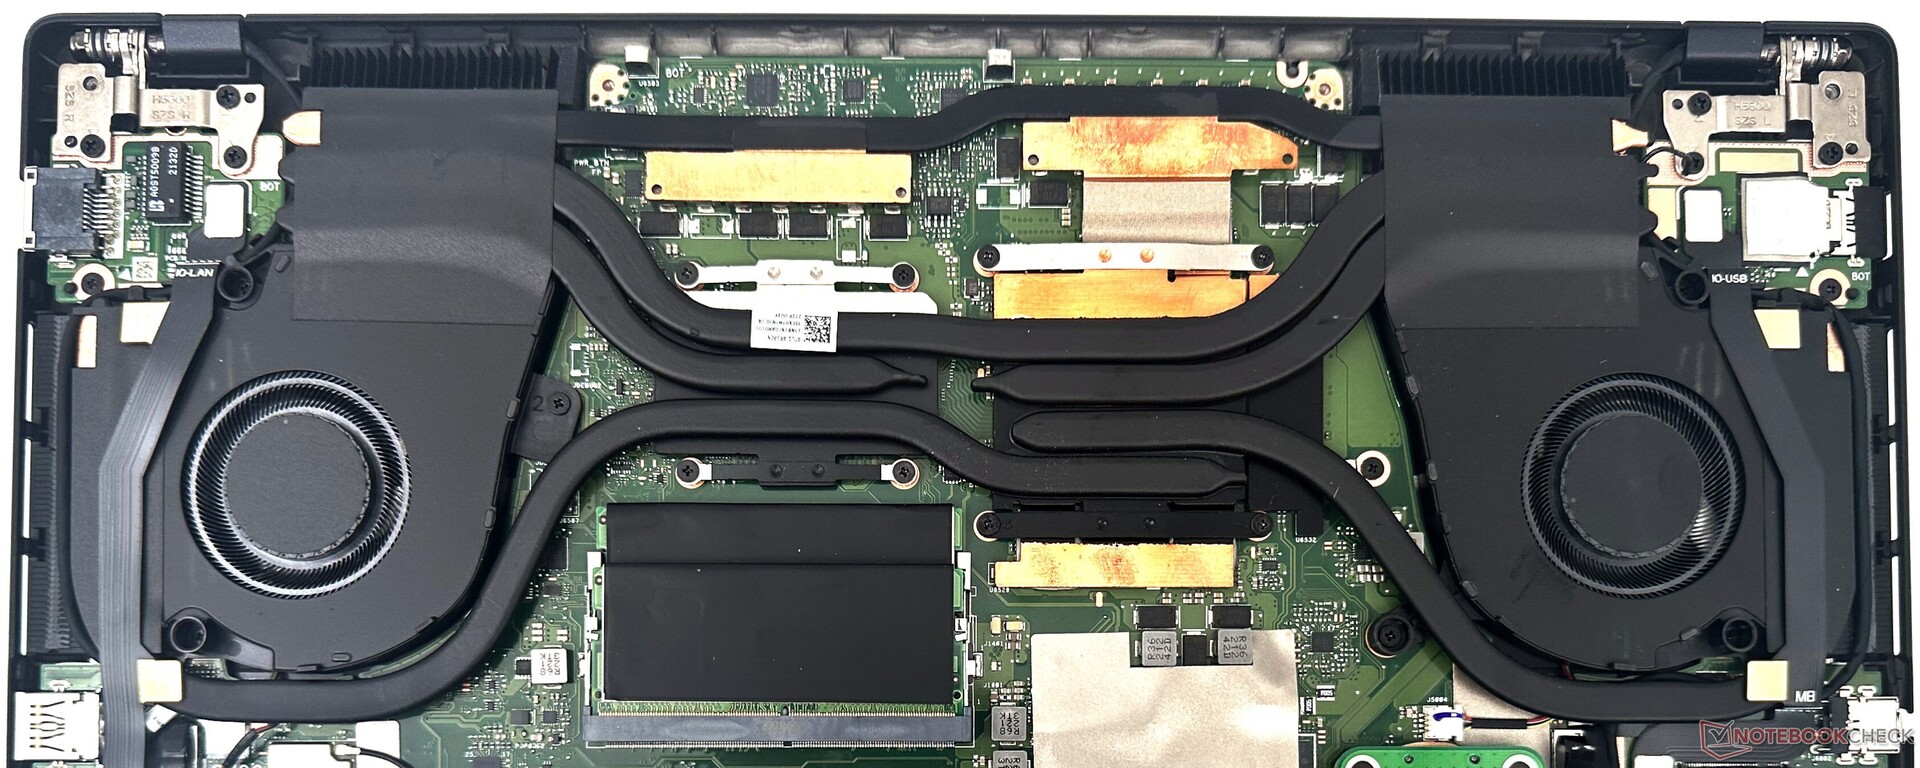
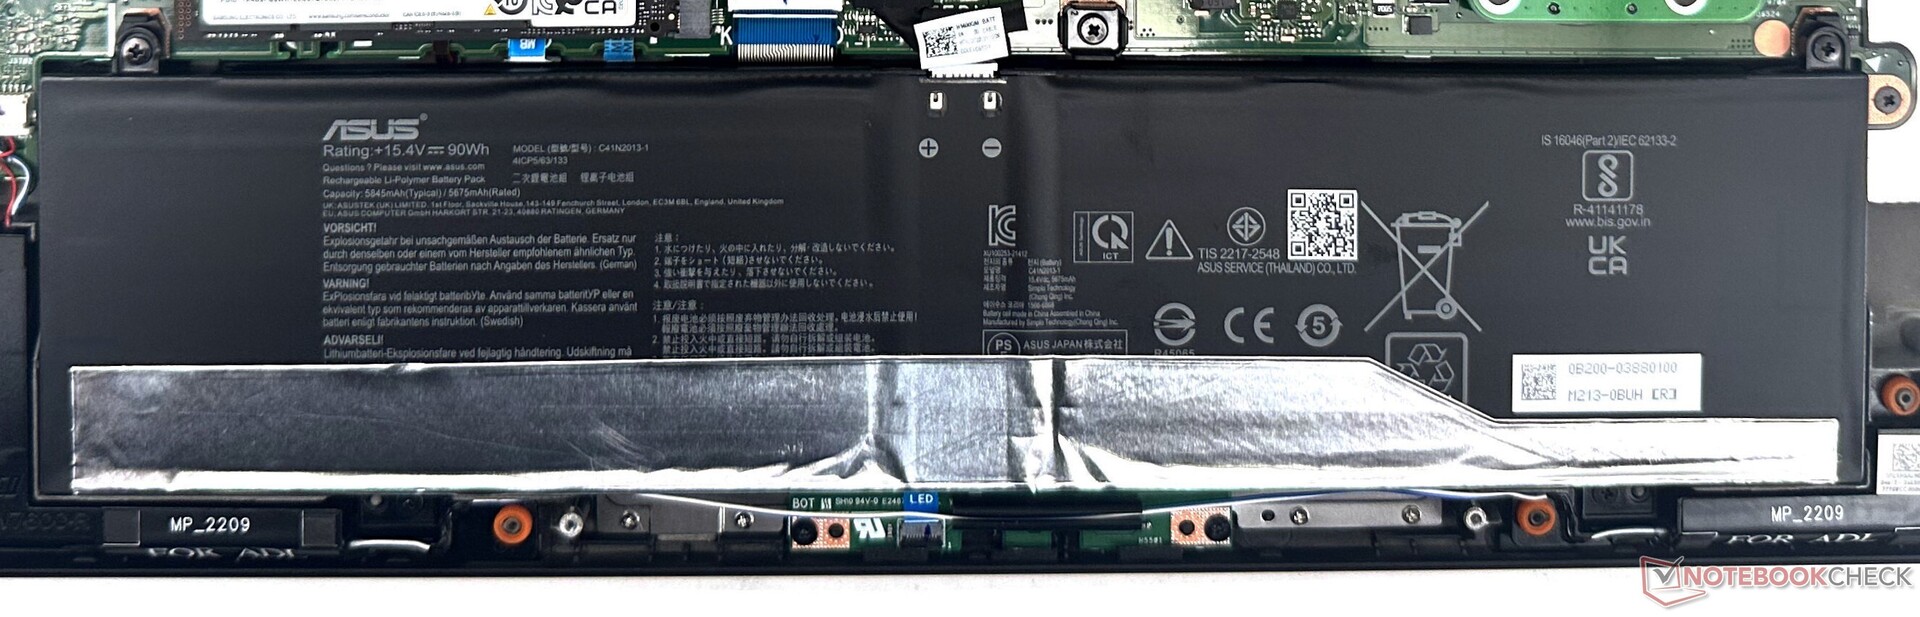
Maintenance
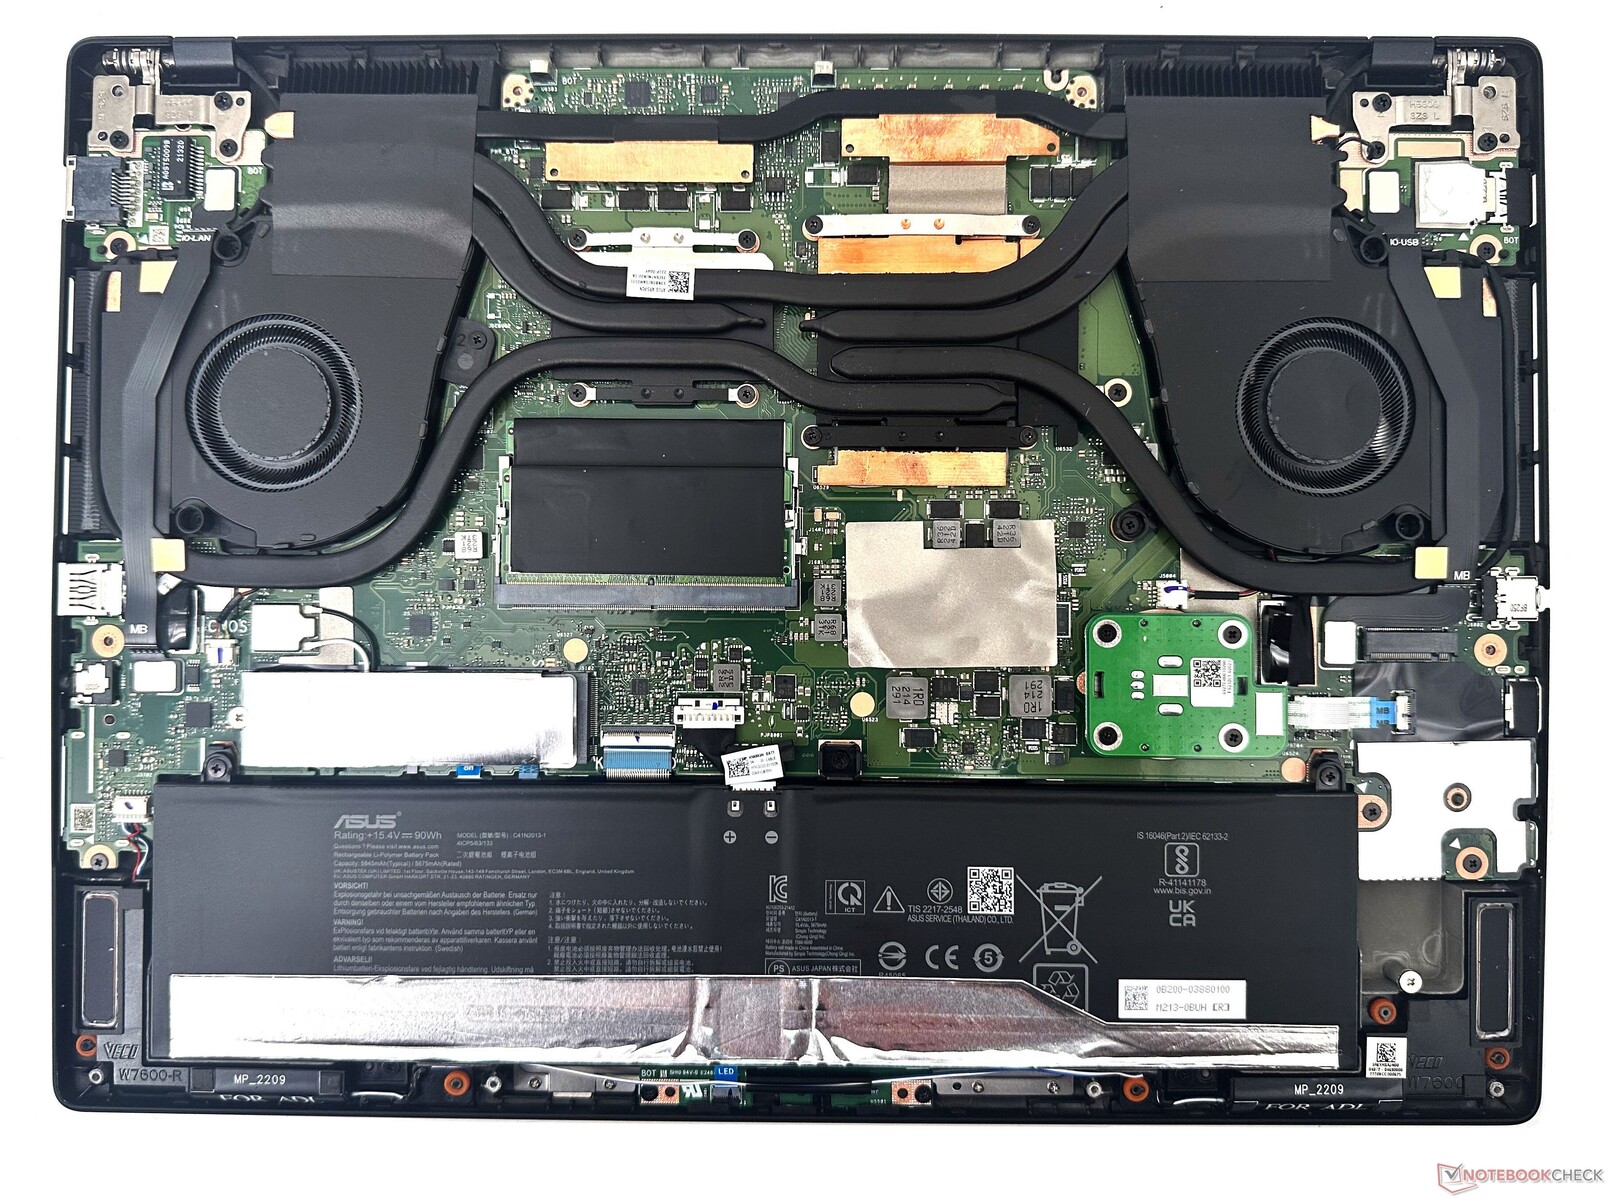
The ProArt StudioBook 16 offers good serviceability. Accessing the innards requires removing the 13 odd Torx T5 screws on the back panel. The roomy chassis affords good separation between various components.
The RAM and NVMe SSD can be swapped out or upgraded while the Wi-Fi card comes soldered. The battery can be unscrewed if necessary. We also see a separate PCB for the Asus Dial.
Accessories and Warranty
The box contains the 240 W power adapter along with the usual paperwork. Additionally, Asus provides a utilitarian backpack designed for creatives on the move.
Asus offers a one-year international warranty. Additional warranty including accidental coverage can be purchased separately.
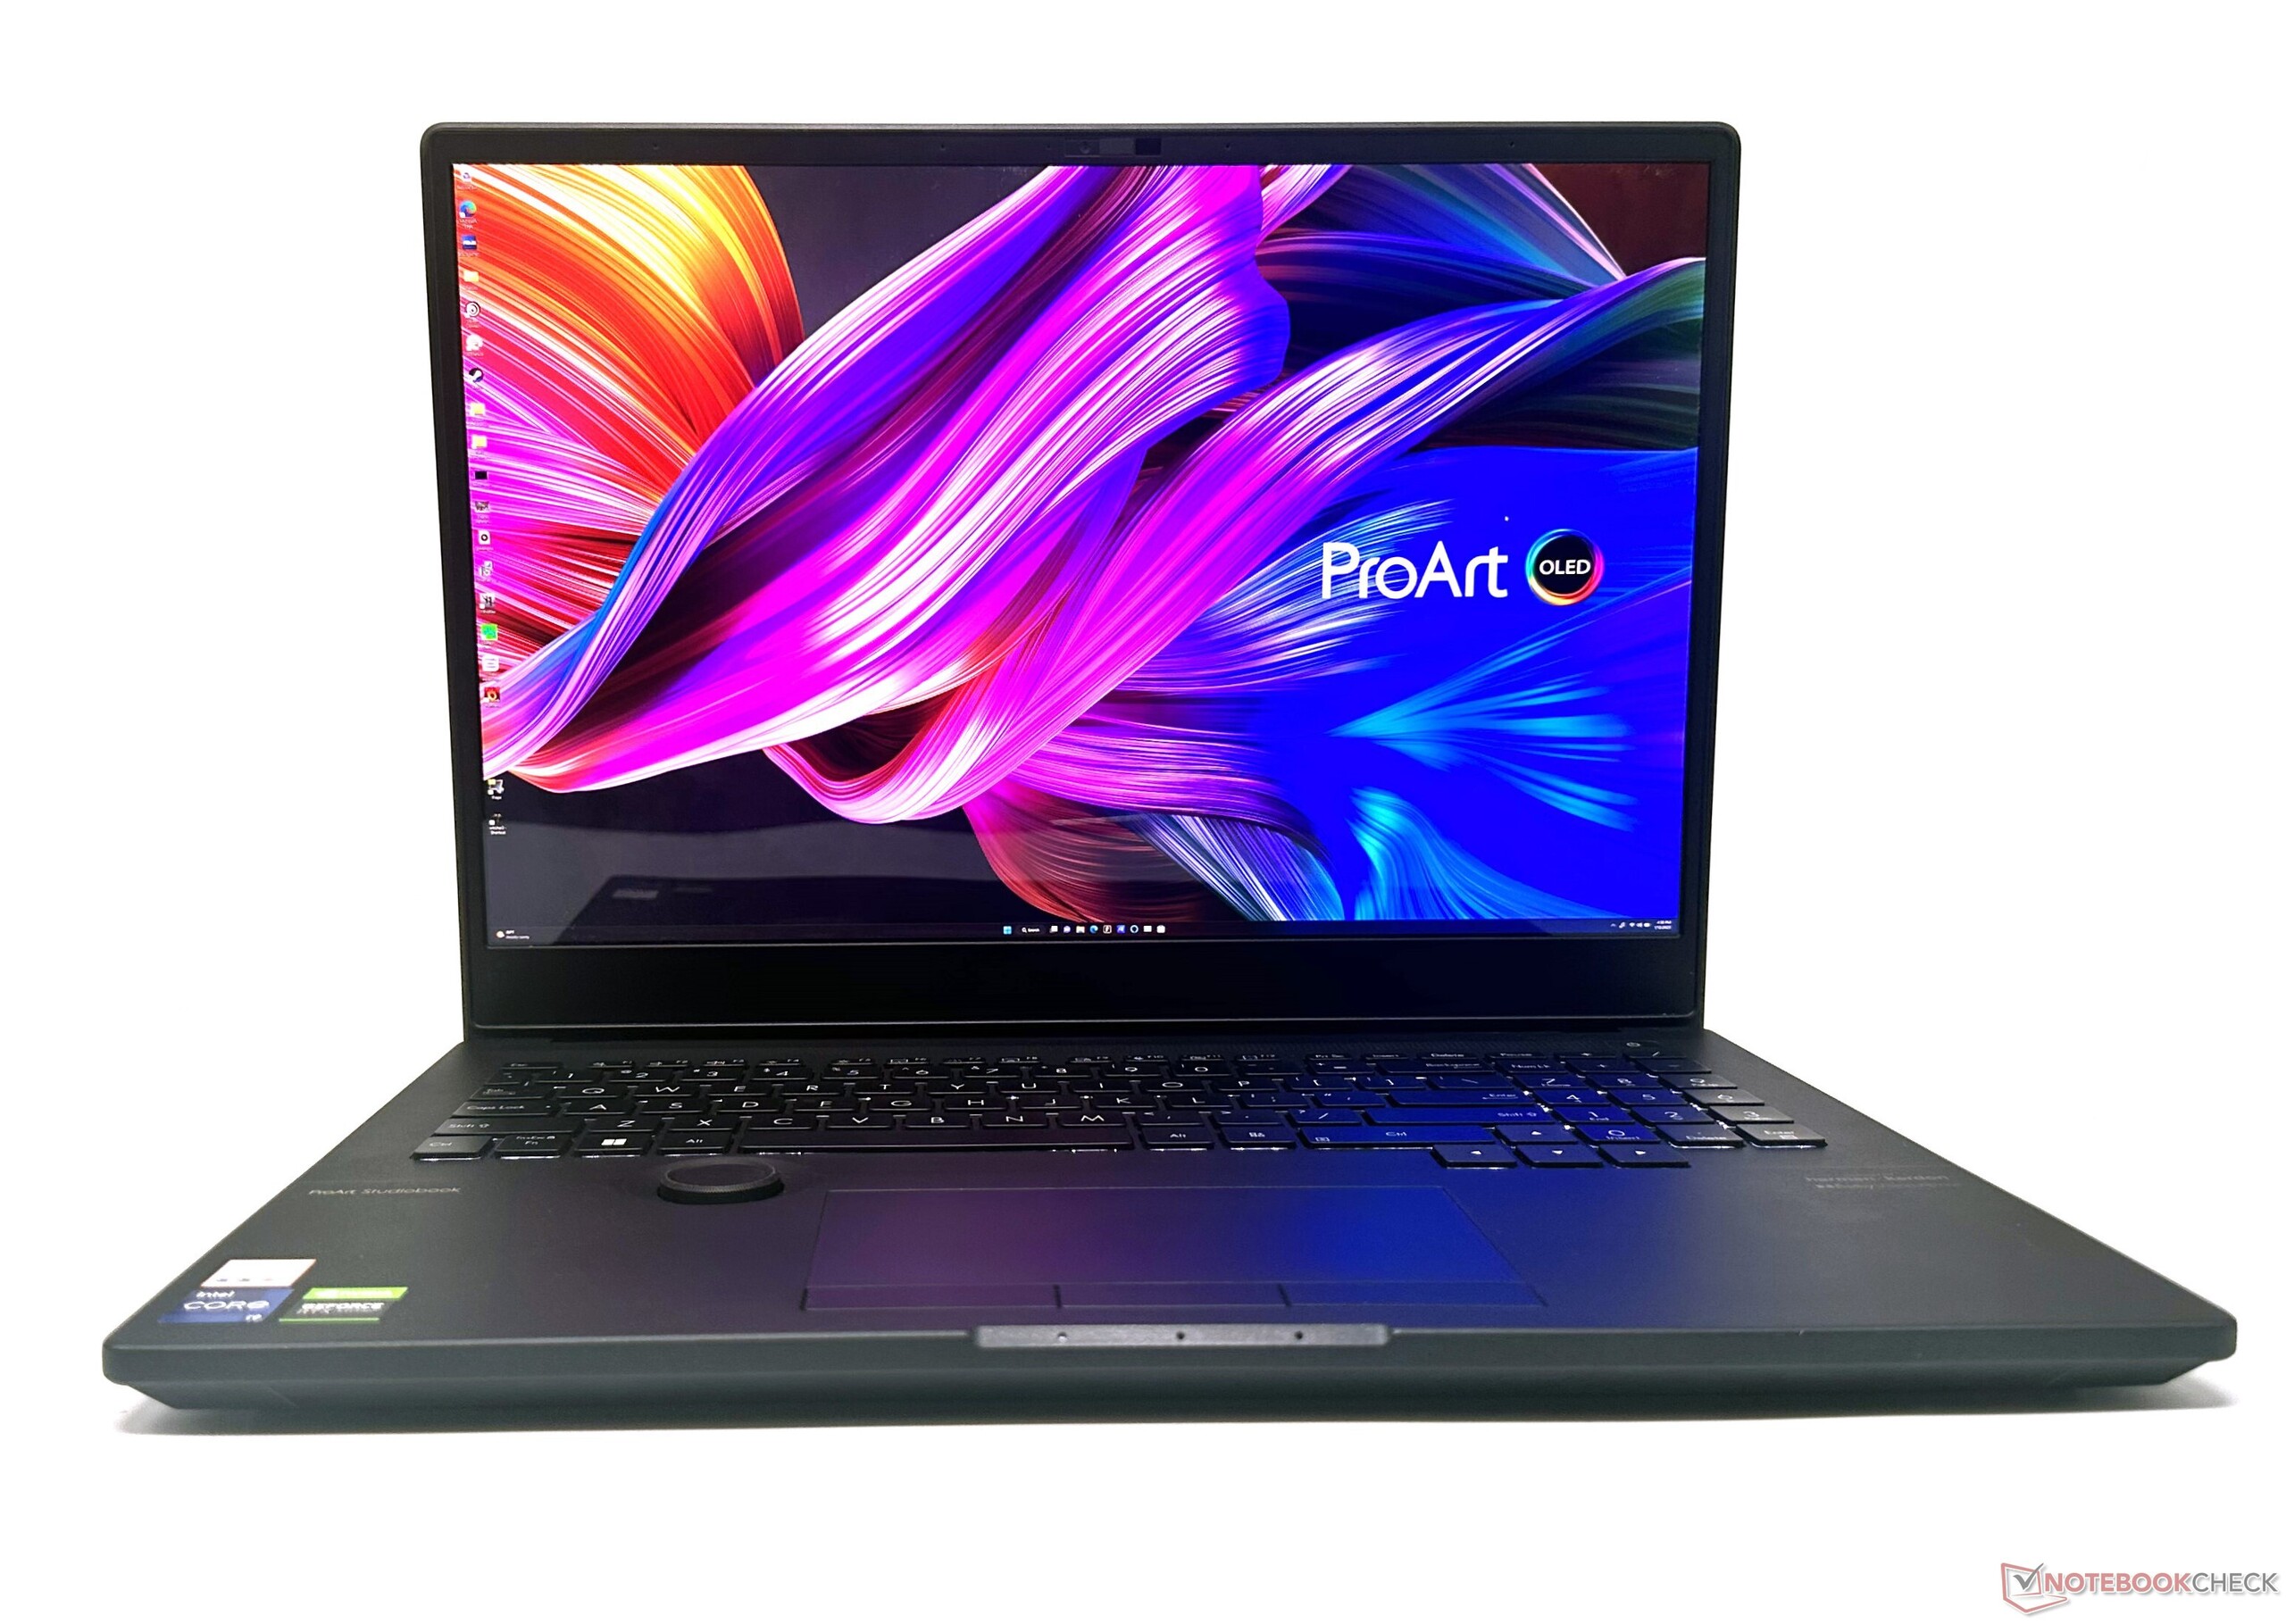
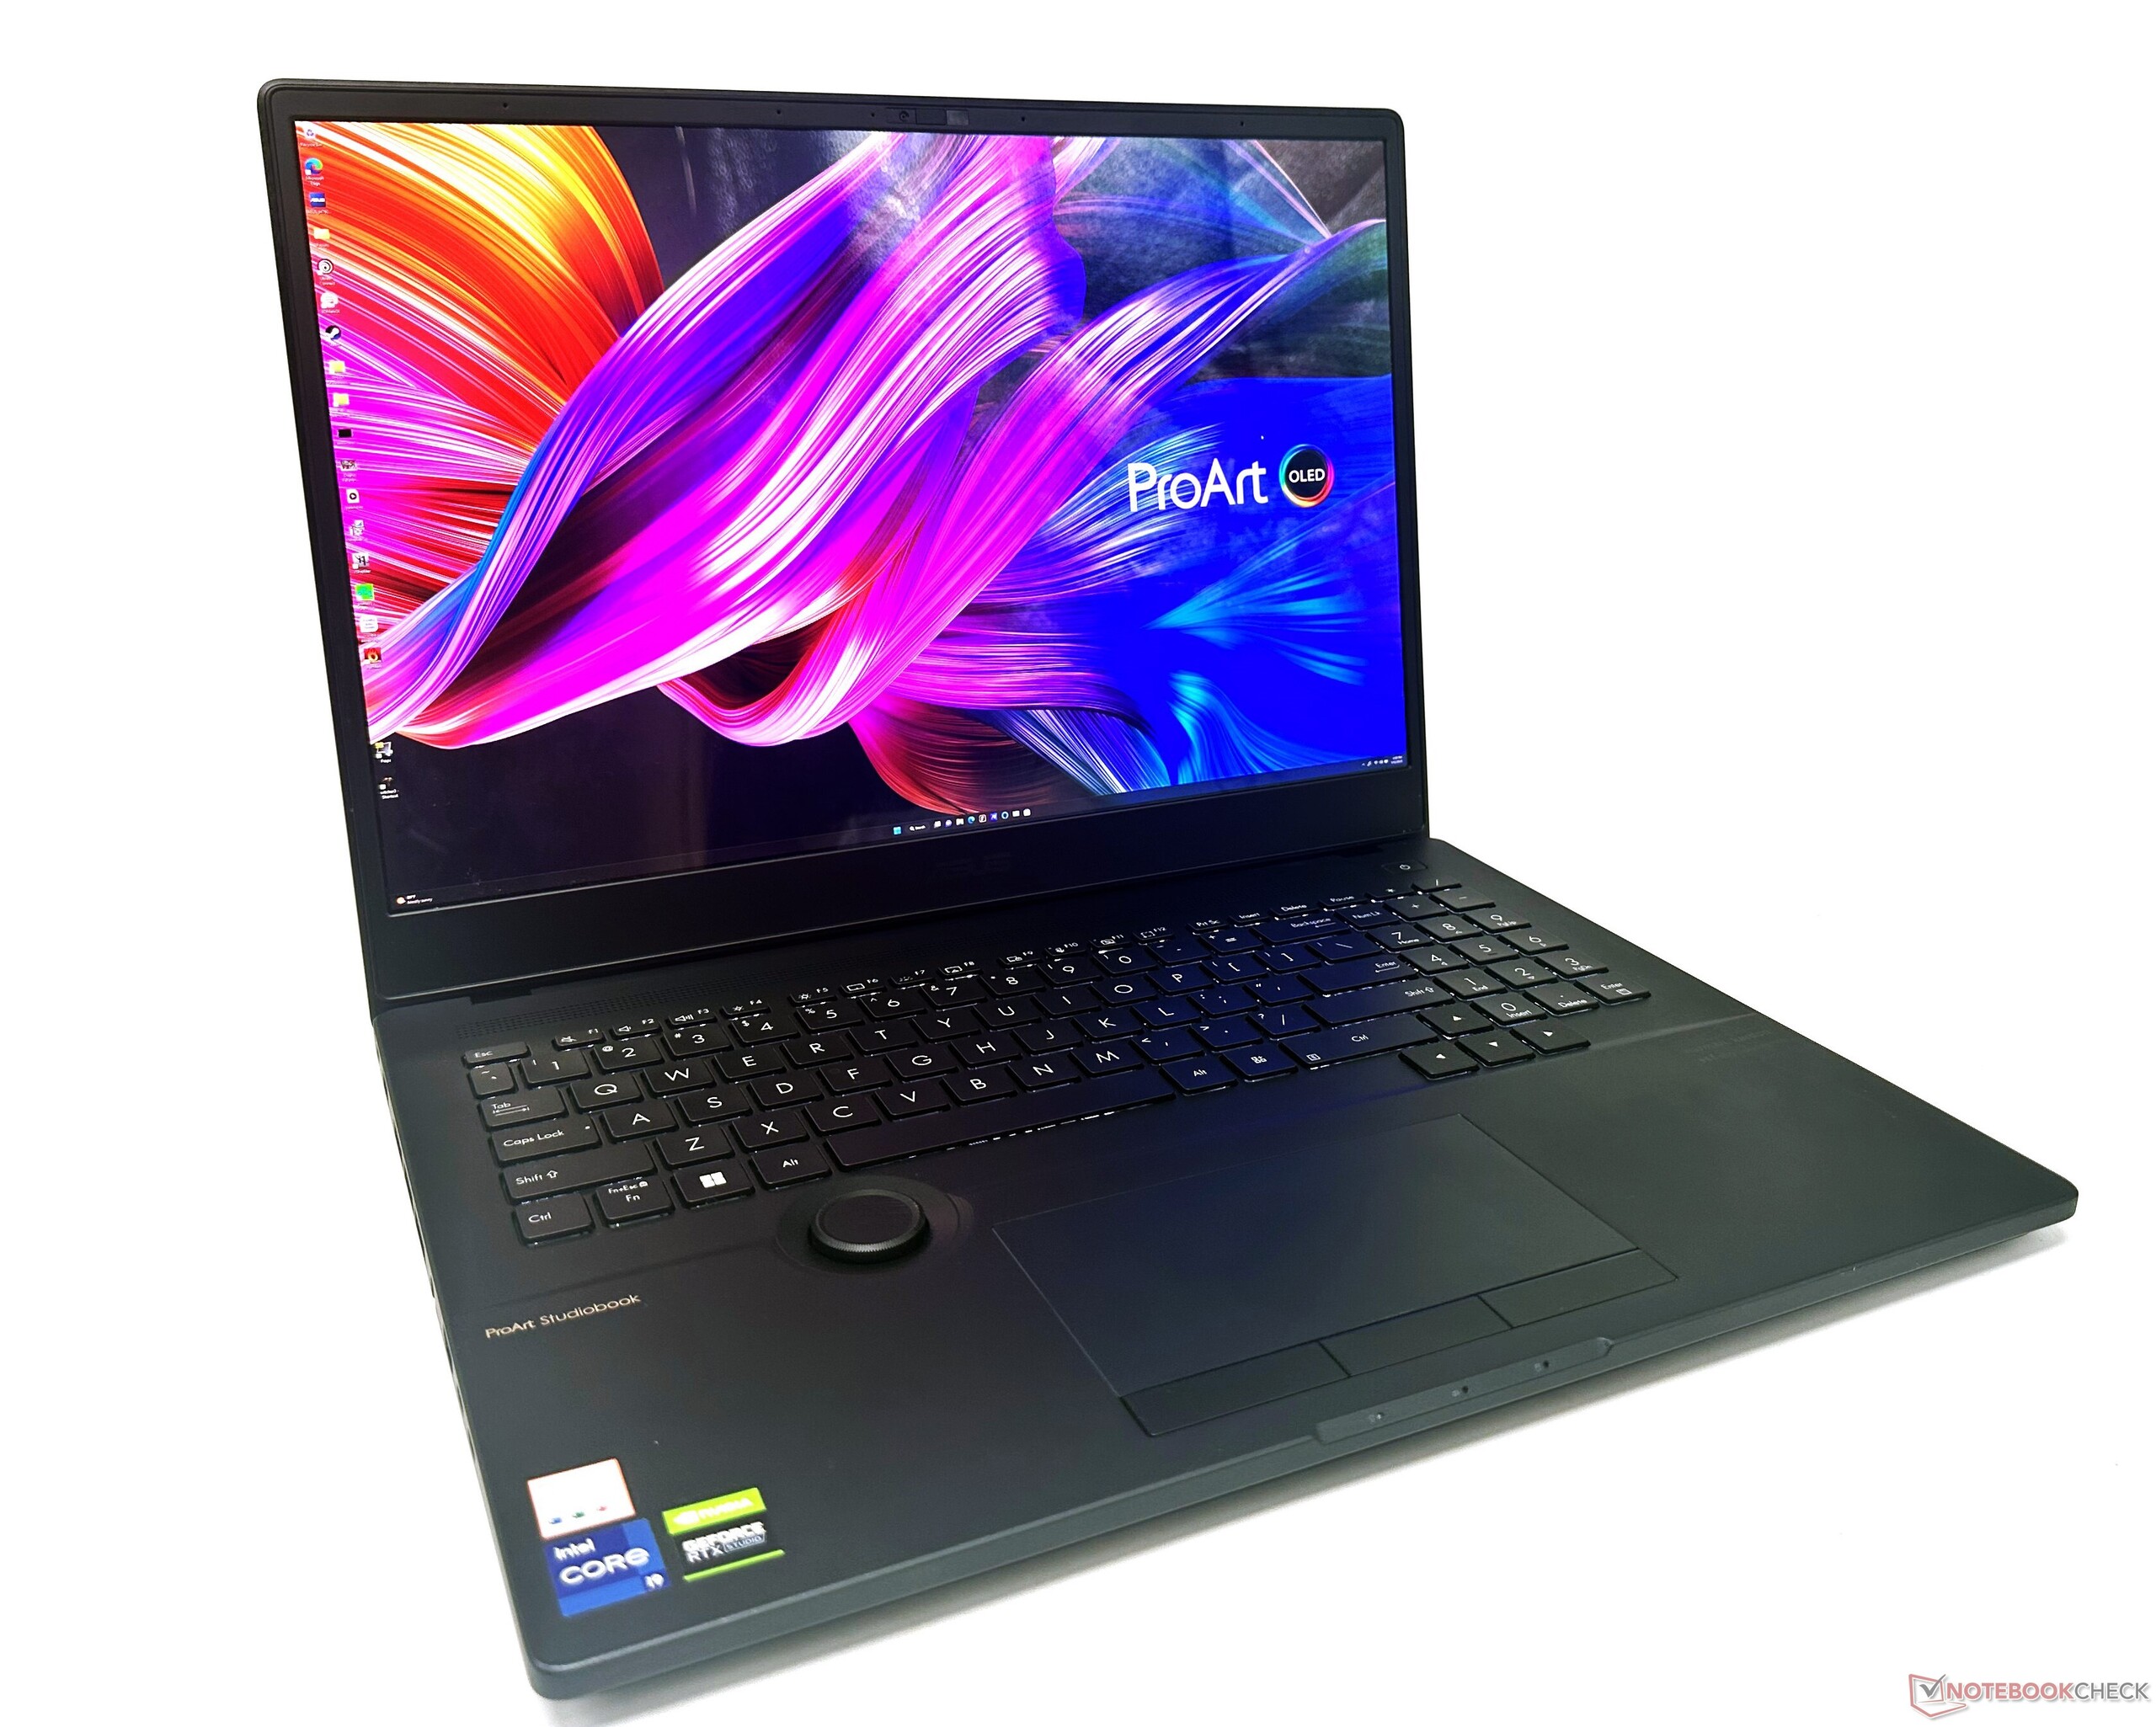
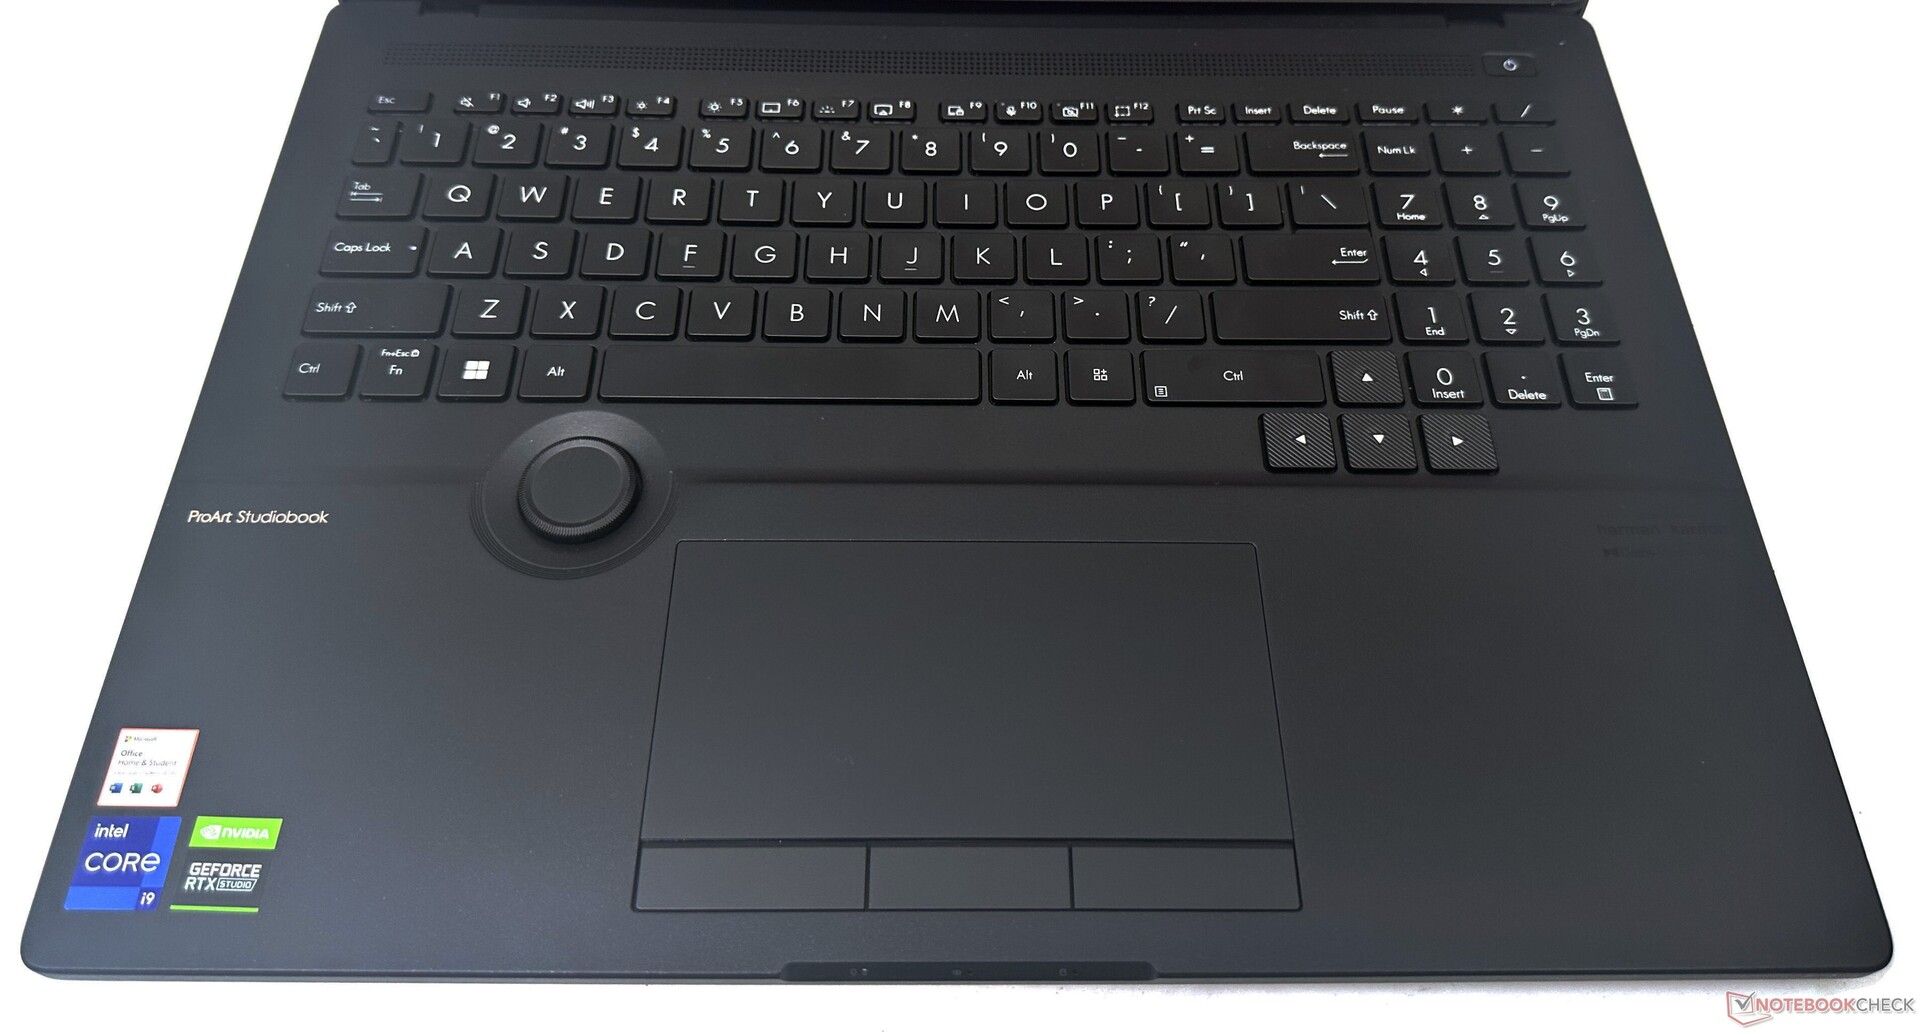
Input Devices: The touchpad has a mind of its own
Keyboard
The full-size backlit chiclet keyboard feels roomy with appropriately sized arrow keys. The 1.4 mm travel distance makes typing quite comfortable with decent tactile feedback and low clatter. The topmost row offers shortcuts to common functions including adjusting the three-stage backlight.
Asus Dial
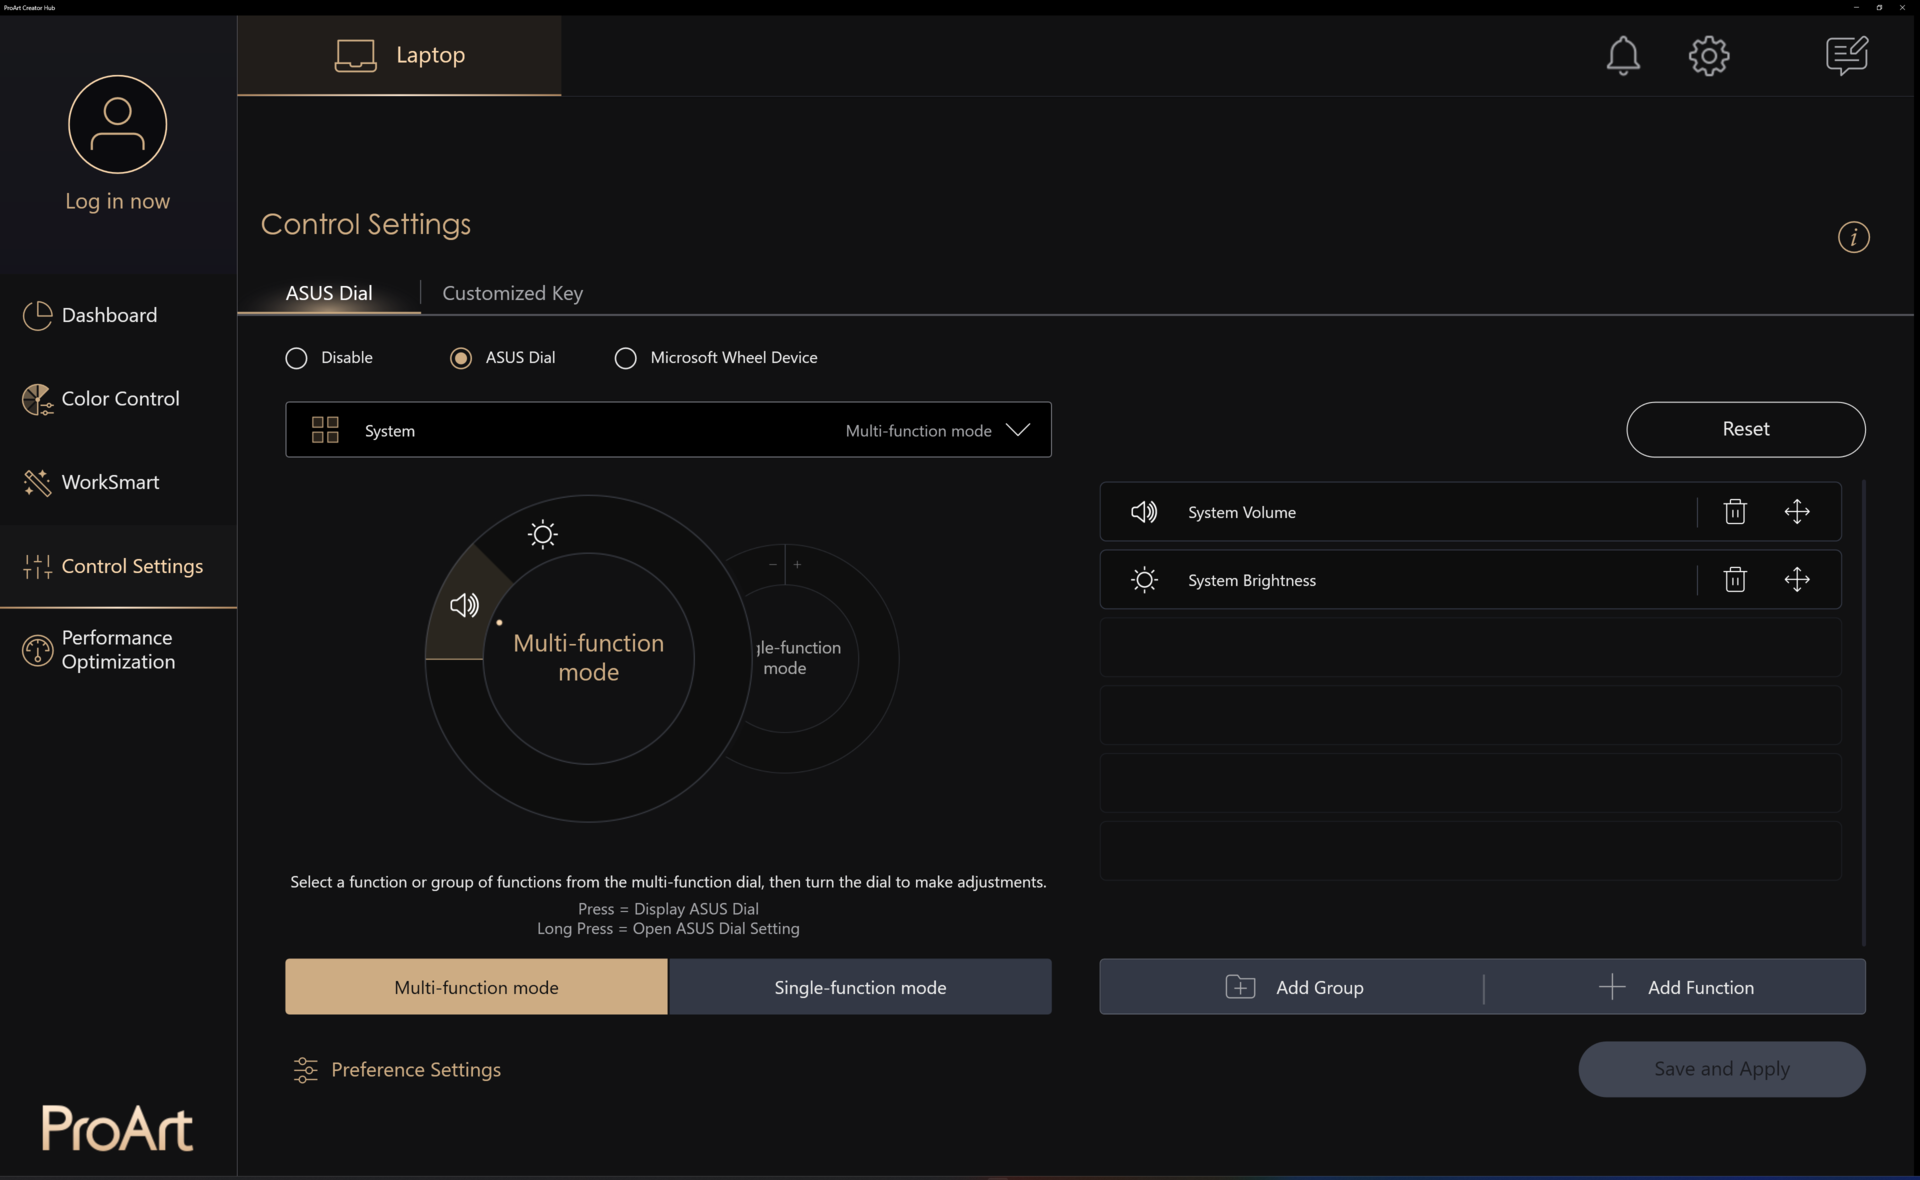
The Asus Dial is the standout feature of the ProArt StudioBook series. The Dial gives creators an analog feel of working with their apps.
Currently, Asus offers compatibility with Adobe programs such as Photoshop, Illustrator, Lightroom Classic, Premiere Pro, and After Effects with support for more apps in the offing.
The Dial also works with common Windows functions such as brightness and volume adjustment. Other functions of the Dial can be added from within the ProArt Creator Hub.
In practice, the Asus Dial is quite intuitive but might require some time to get used to accessing functions with muscle memory. The dial does not come in the way of typing or using the touchpad.
Touchpad
The ProArt StudioBook 16 features a premium glass touchpad that is fully compatible with Windows Precision gestures. Asus offers three physical buttons at the base of the touchpad, which is a rarity these days but can be useful in creative applications to pan or rotate objects in the scene.
The touchpad itself does not click although left clicks are still registered with a tap. However, our review unit's touchpad seemed overly sensitive. This often results in the touchpad misrecognizing a tap as a drag and hold gesture. Changing mouse sensitivity in the Control Panel didn't help much either.
It is but natural that more than one finger often hits the touchpad in normal use. This immediately triggers a drag and hold gesture making UI navigation somewhat unintuitive. The physical buttons offer a somewhat mushy yet satisfying click.
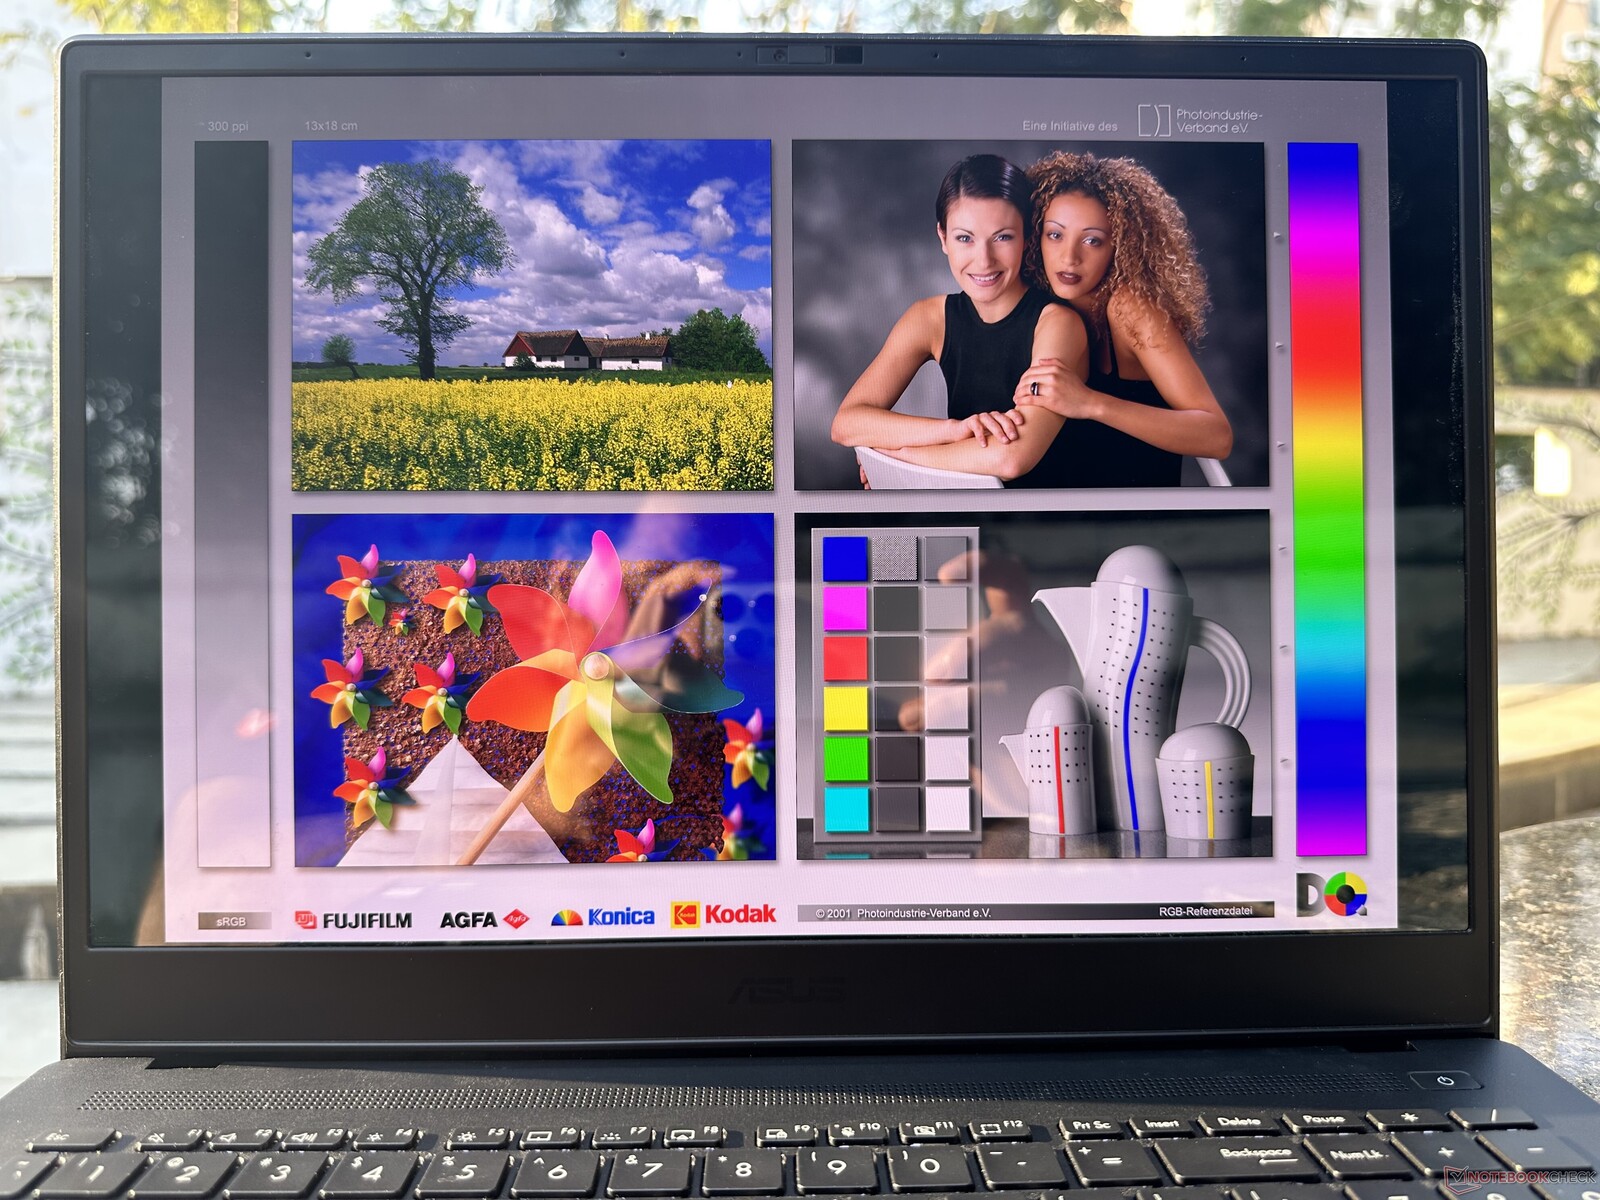
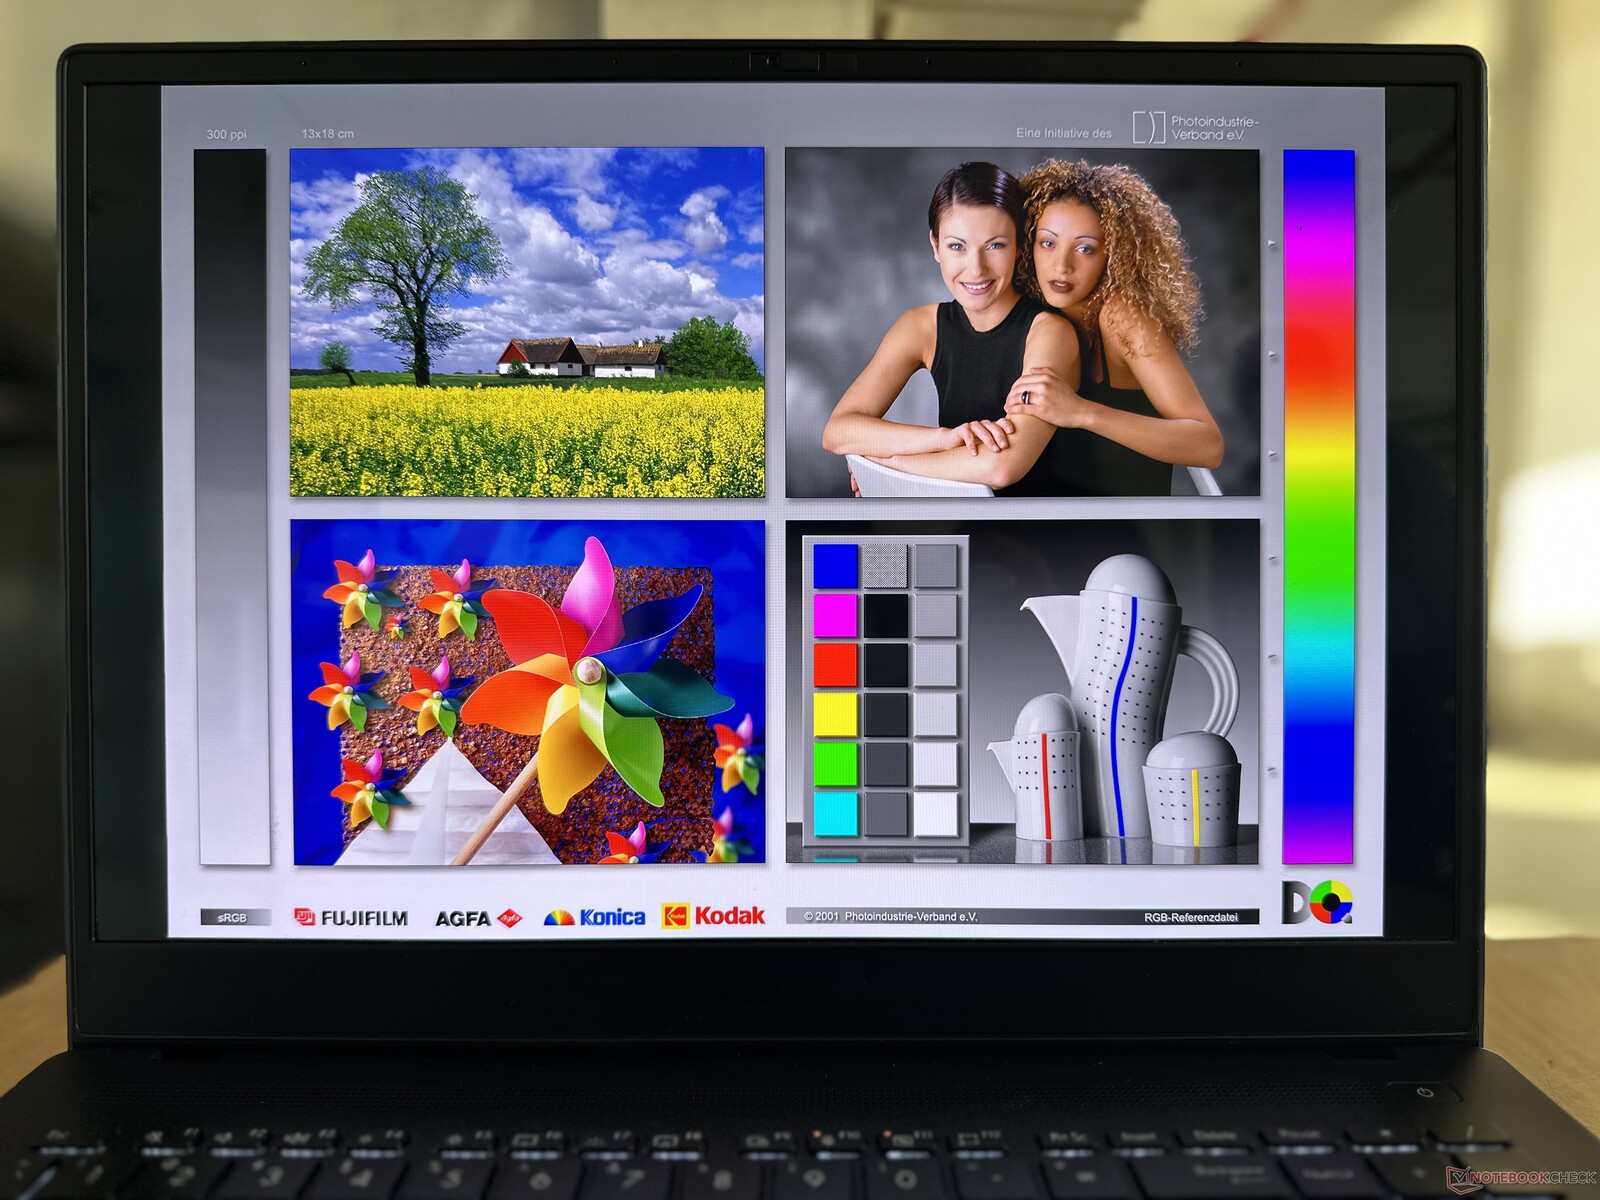
Display: 60 Hz Dolby Vision OLED panel with PWM
The ProArt StudioBook 16 comes equipped with a 16-inch 16:10 4K (3840 x 2400) OLED panel from Samsung. Asus makes do with just a 60 Hz panel but makes up for it in other areas as we will see below.
The sub-pixel arrangement suggests an S-Stripe RGB matrix with an overall density of 283 PPI. Since this is an OLED, there's no backlight bleed observed.


By virtue of being an OLED panel, the Samsung ATNA60YV02 offers a uniform 98% brightness distribution and basically an infinite contrast ratio. We measured a 378 nits average SDR brightness level.
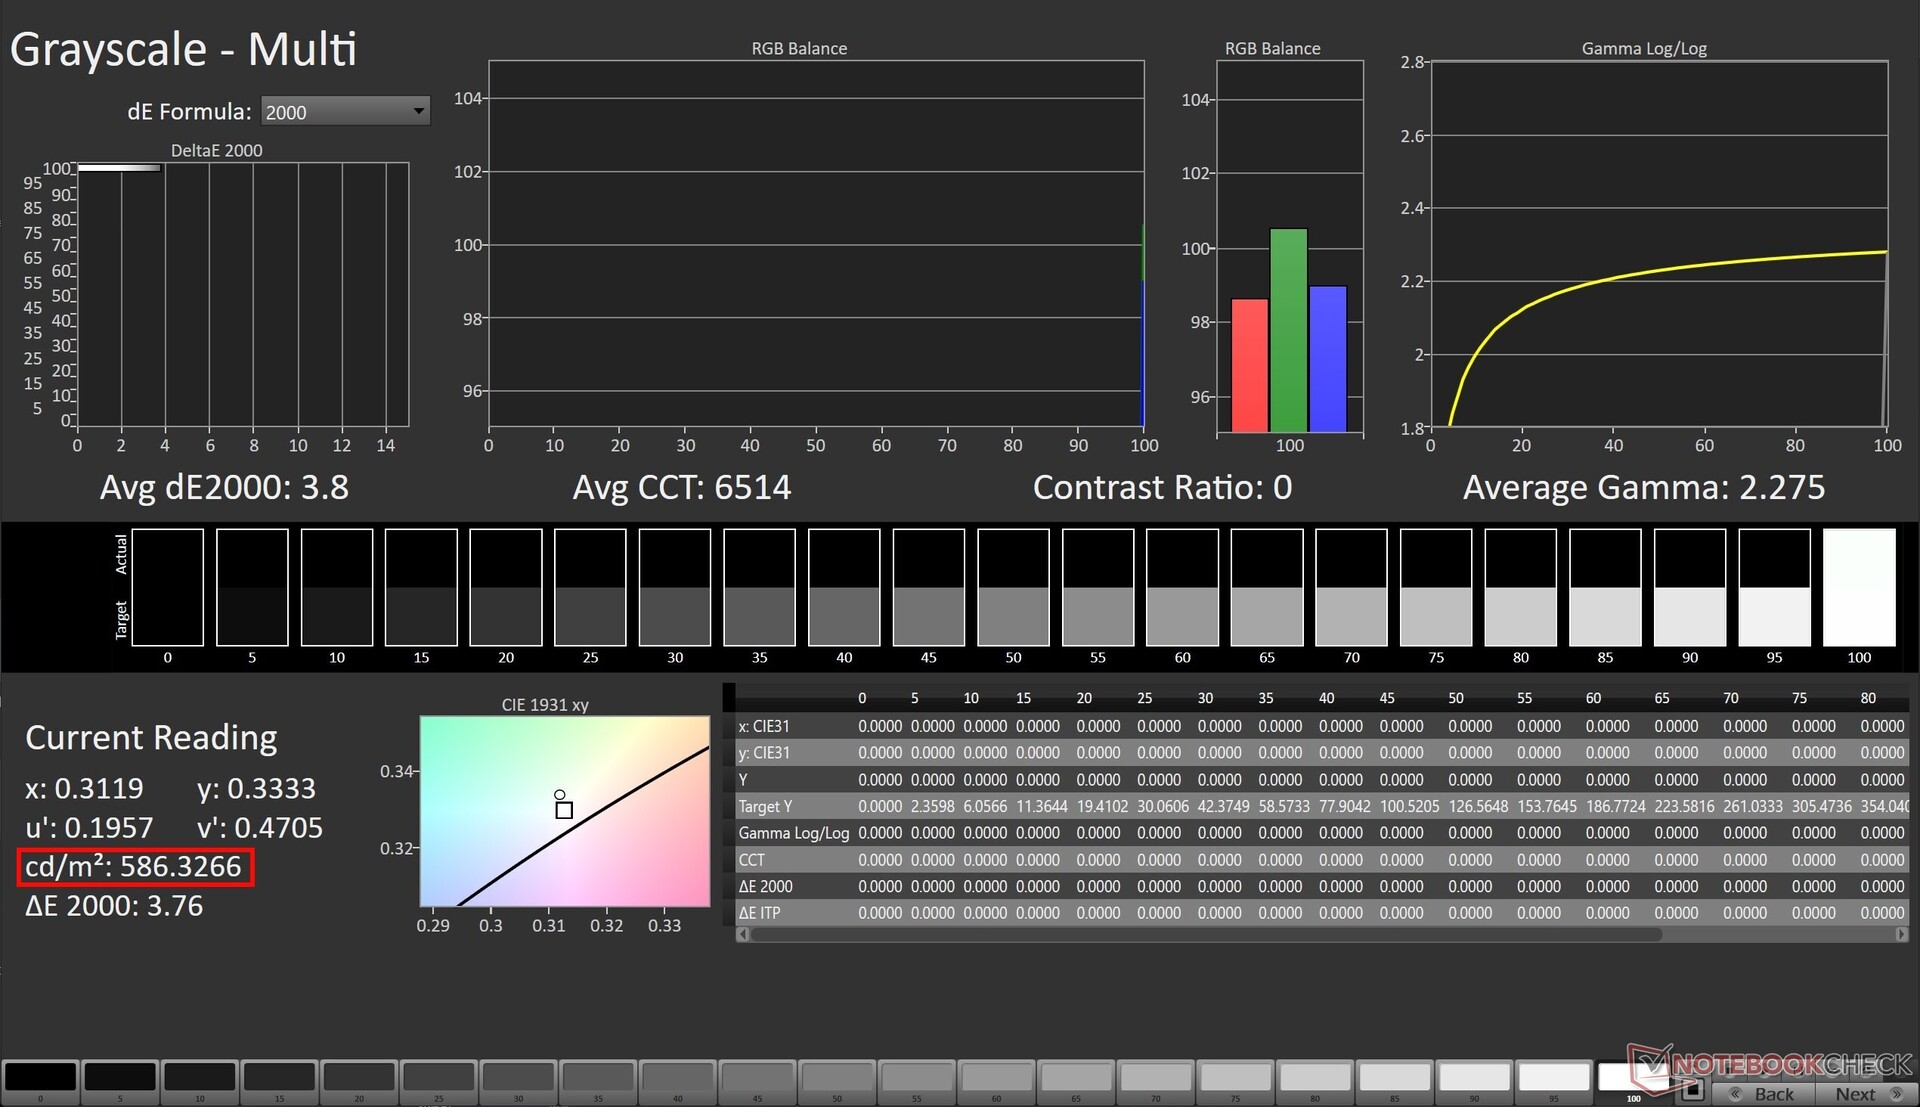
According to Asus, the ProArt StudioBook 16's OLED panel is VESA DisplayHDR True Black 600-certified. Dolby Vision HDR is supported.
In our testing, we recorded a peak brightness of 586 nits in HDR mode with a 100% white image.
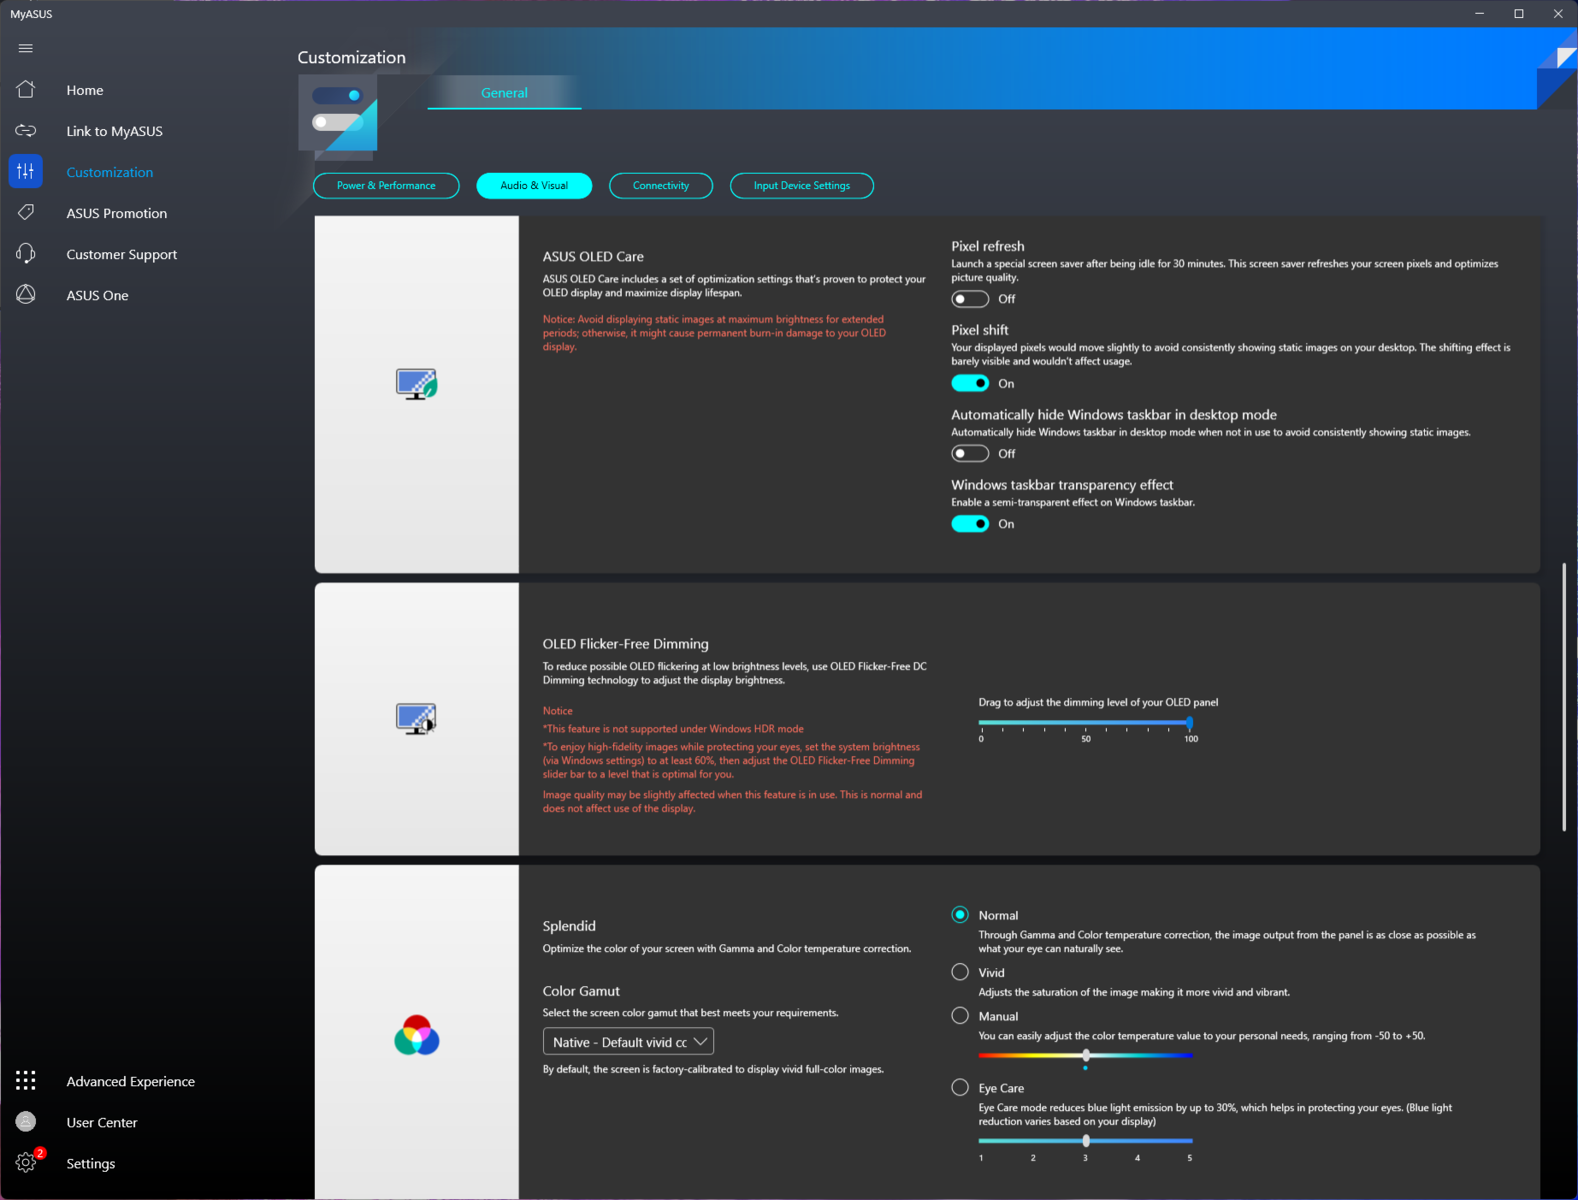
The MyAsus app offers options to set pixel refresh and pixel shift settings to protect the OLED from burn-in. Users can also adjust the extent of DC Dimming to be used.
You also get to choose between various color profiles via Splendid. We performed display calibration with the Normal setting.
| |||||||||||||||||||||||||
Brightness Distribution: 98 %
Center on Battery: 369 cd/m²
Contrast: ∞:1 (Black: 0 cd/m²)
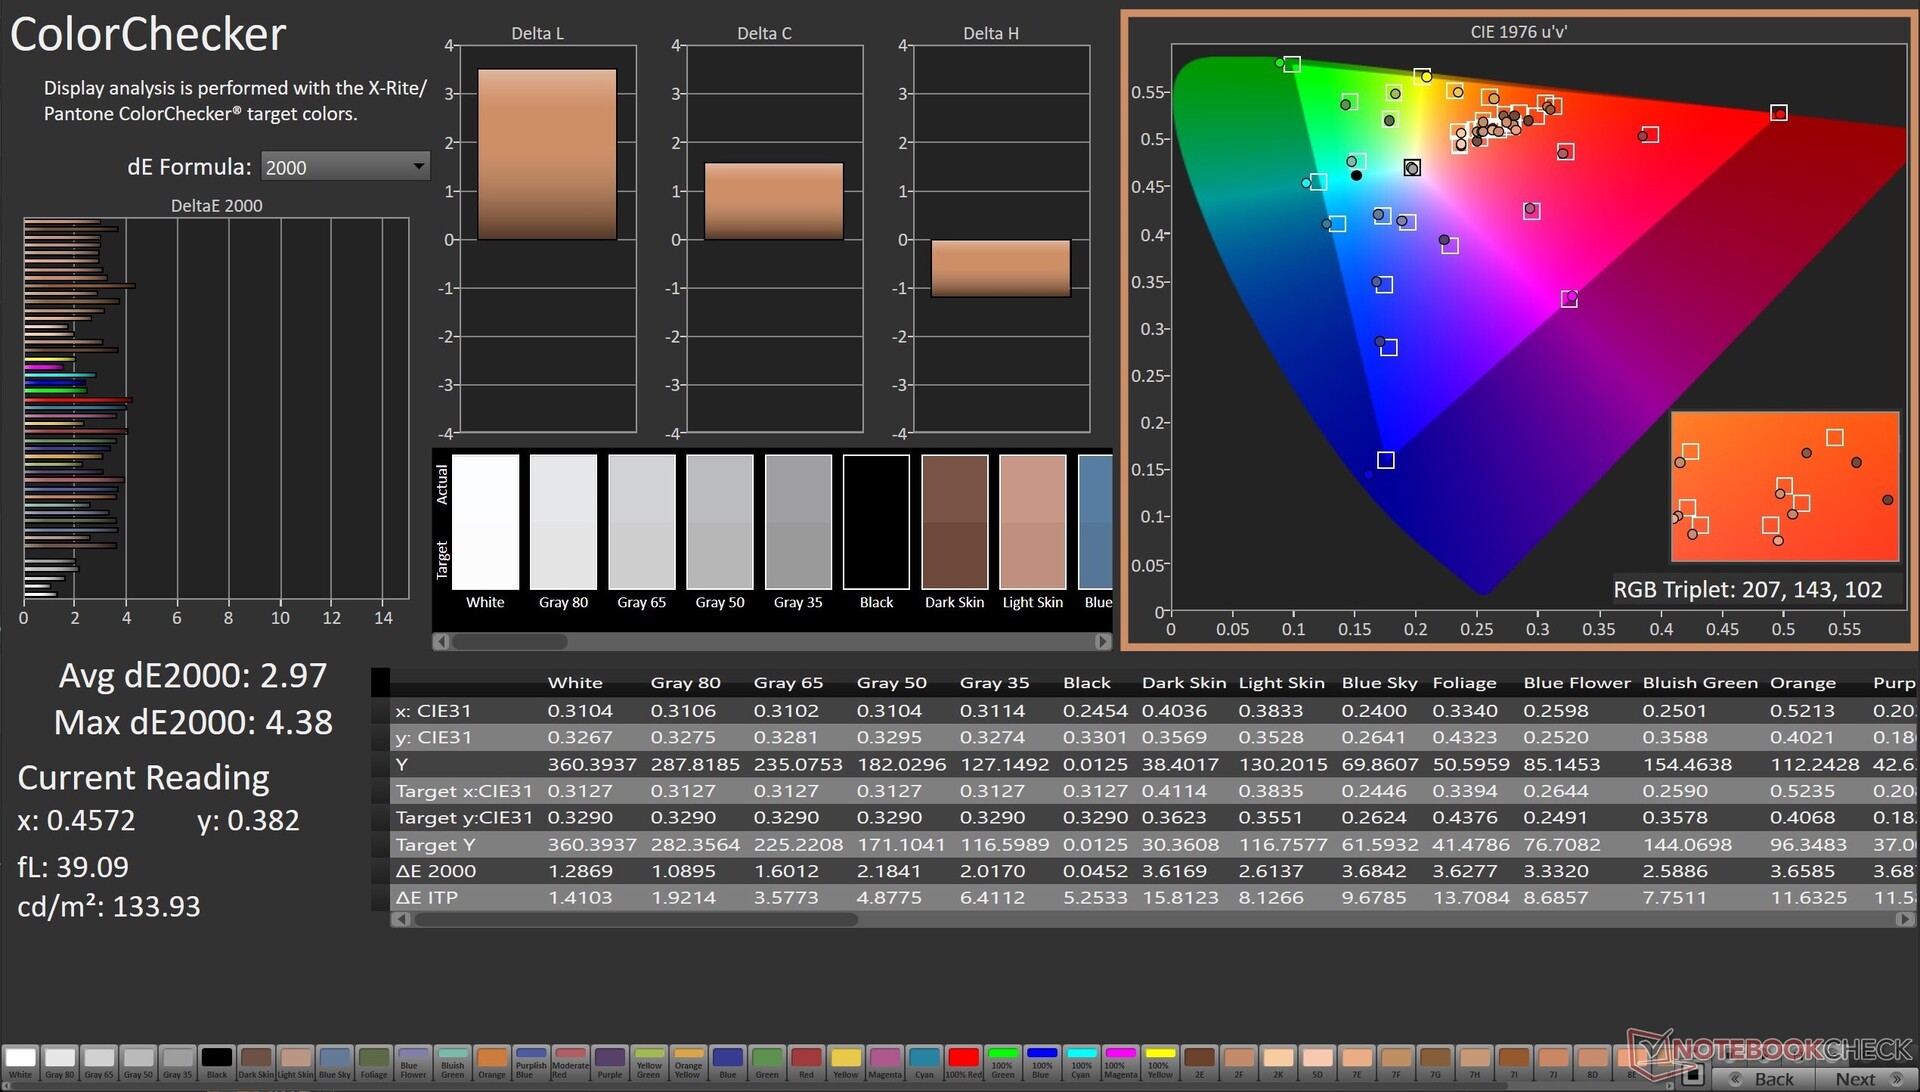
ΔE ColorChecker Calman: 2.97 | ∀{0.5-29.43 Ø4.81}
calibrated: 2.15
ΔE Greyscale Calman: 2.9 | ∀{0.09-98 Ø5.1}
96.5% AdobeRGB 1998 (Argyll 3D)
100% sRGB (Argyll 3D)
99.6% Display P3 (Argyll 3D)
Gamma: 2.13
CCT: 6636 K
| Asus ProArt StudioBook 16 H7600ZW Samsung ATNA60YV02, OLED, 3840x2400, 16" | MSI Creator Z16P B12UHST AUOD298, IPS True Pixel (~100% DCI-P3), 2560x1600, 16" | Asus ROG Strix Scar 15 G533ZW-LN106WS BOE CQ NE156QHM-NZ2, IPS-level, 2560x1440, 15.6" | Asus ZenBook Pro 16X OLED UX7602ZM-ME115W Samsung SDC415D, OLED, 3840x2400, 16" | Asus ROG Zephyrus Duo 16 GX650RX BOE NE160QAM-NX1, IPS-Level, 3840x2400, 16" | Apple MacBook Pro 16 2021 M1 Pro Liquid Retina XDR, Mini-LED, 3456x2234, 16.2" | |
|---|---|---|---|---|---|---|
| Display | -4% | -5% | -3% | -4% | -3% | |
| Display P3 Coverage (%) | 99.6 | 97.6 -2% | 96.2 -3% | 99.84 0% | 98 -2% | 99.1 -1% |
| sRGB Coverage (%) | 100 | 99.9 0% | 99.9 0% | 99.99 0% | 99.9 0% | 100 0% |
| AdobeRGB 1998 Coverage (%) | 96.5 | 86.8 -10% | 84.5 -12% | 88.9 -8% | 86.3 -11% | 88 -9% |
| Response Times | -321% | -165% | 32% | -372% | -1488% | |
| Response Time Grey 50% / Grey 80% * (ms) | 1.6 ? | 12.9 ? -706% | 7.86 ? -391% 4.21 ? -163% | 2 ? -25% | 14.6 ? -813% | 42.8 ? -2575% |
| Response Time Black / White * (ms) | 18.32 ? | 6.4 ? 65% | 7.5 ? 59% | 2 ? 89% | 5.6 ? 69% | 91.6 ? -400% |
| PWM Frequency (Hz) | 60 ? | 59 ? | 14880 | |||
| Screen | 12% | -14% | 6% | -10% | 30% | |
| Brightness middle (cd/m²) | 370 | 428 16% | 346 -6% | 346 -6% | 459 24% | 514 39% |
| Brightness (cd/m²) | 374 | 394 5% | 329 -12% | 354 -5% | 434 16% | 497 33% |
| Brightness Distribution (%) | 98 | 86 -12% | 91 -7% | 96 -2% | 88 -10% | 95 -3% |
| Black Level * (cd/m²) | 0.42 | 0.59 | 0.44 | 0.02 | ||
| Colorchecker dE 2000 * | 2.97 | 1.67 44% | 3.06 -3% | 2.28 23% | 2.97 -0% | 1.4 53% |
| Colorchecker dE 2000 max. * | 4.38 | 5.71 -30% | 5.81 -33% | 4.94 -13% | 8.13 -86% | 2.8 36% |
| Colorchecker dE 2000 calibrated * | 2.15 | 0.71 67% | 2.57 -20% | 2.16 -0% | 1.03 52% | |
| Greyscale dE 2000 * | 2.9 | 3.1 -7% | 1.64 43% | 4.9 -69% | 2.3 21% | |
| Gamma | 2.13 103% | 2.195 100% | 2.12 104% | 2.37 93% | 2.235 98% | 2.27 97% |
| CCT | 6636 98% | 6498 100% | 7021 93% | 6384 102% | 6775 96% | 6792 96% |
| Contrast (:1) | 1019 | 586 | 1043 | 25700 | ||
| Total Average (Program / Settings) | -104% /
-48% | -61% /
-49% | 12% /
8% | -129% /
-69% | -487% /
-255% |
* ... smaller is better
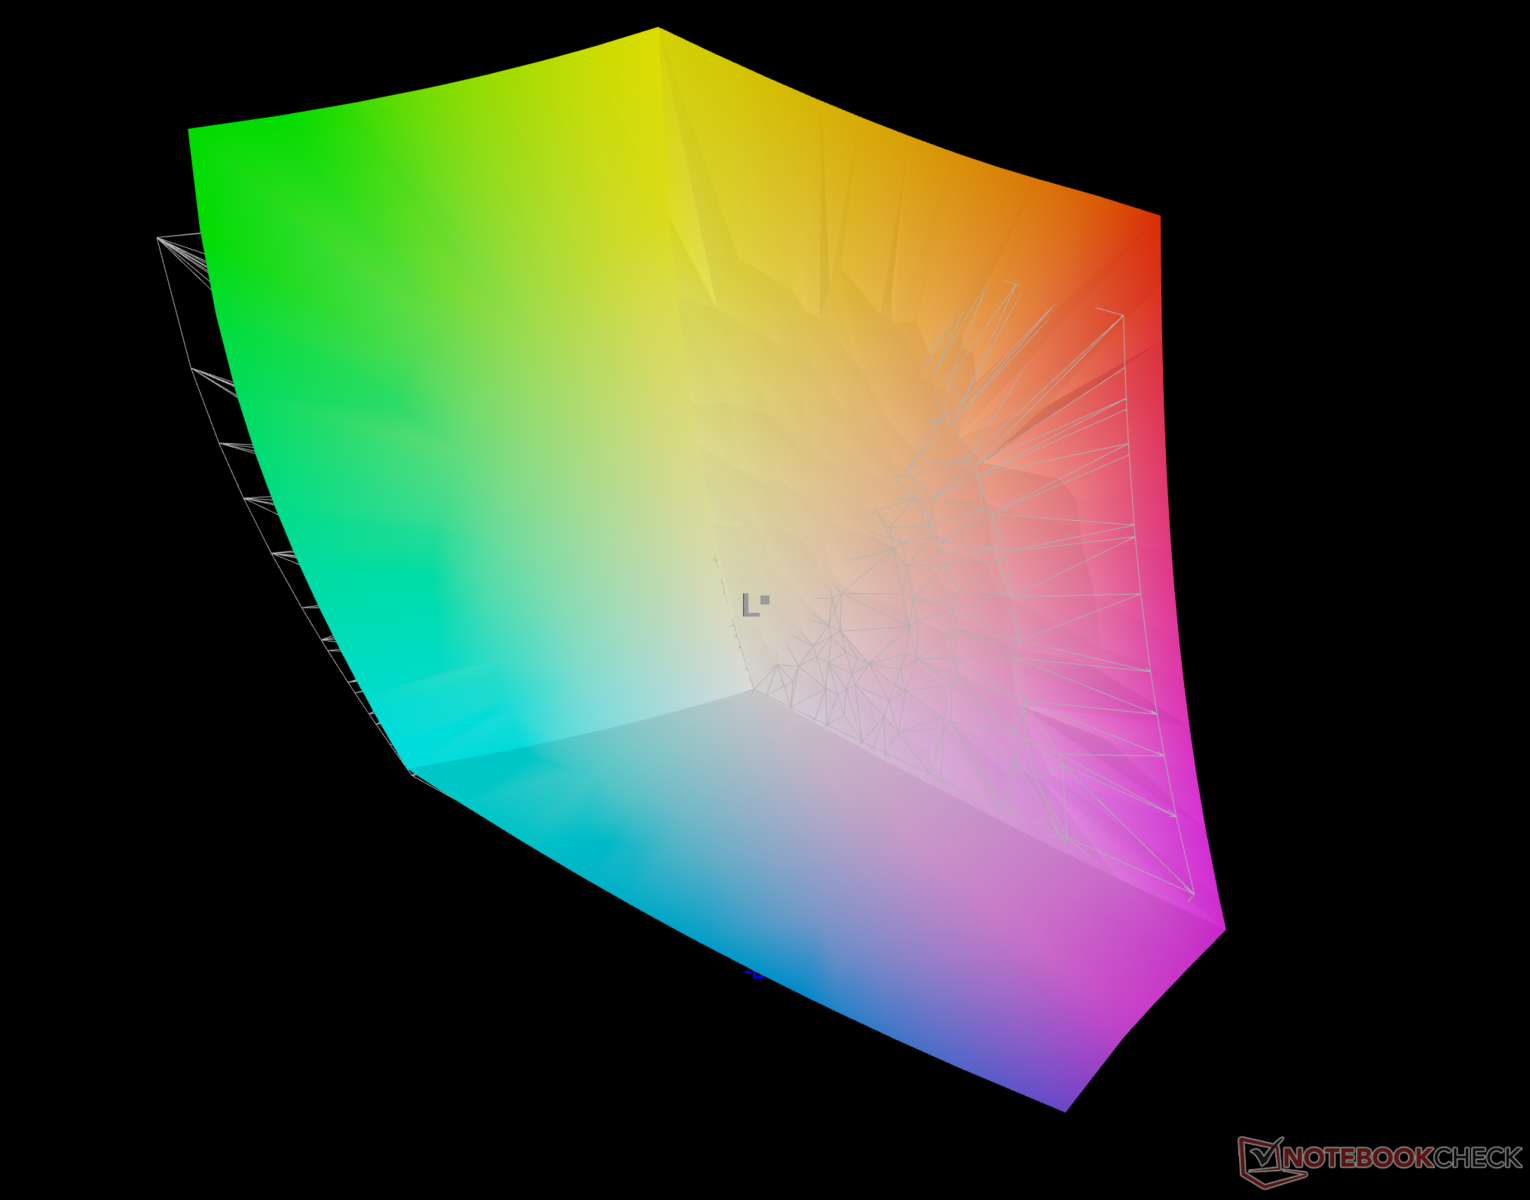
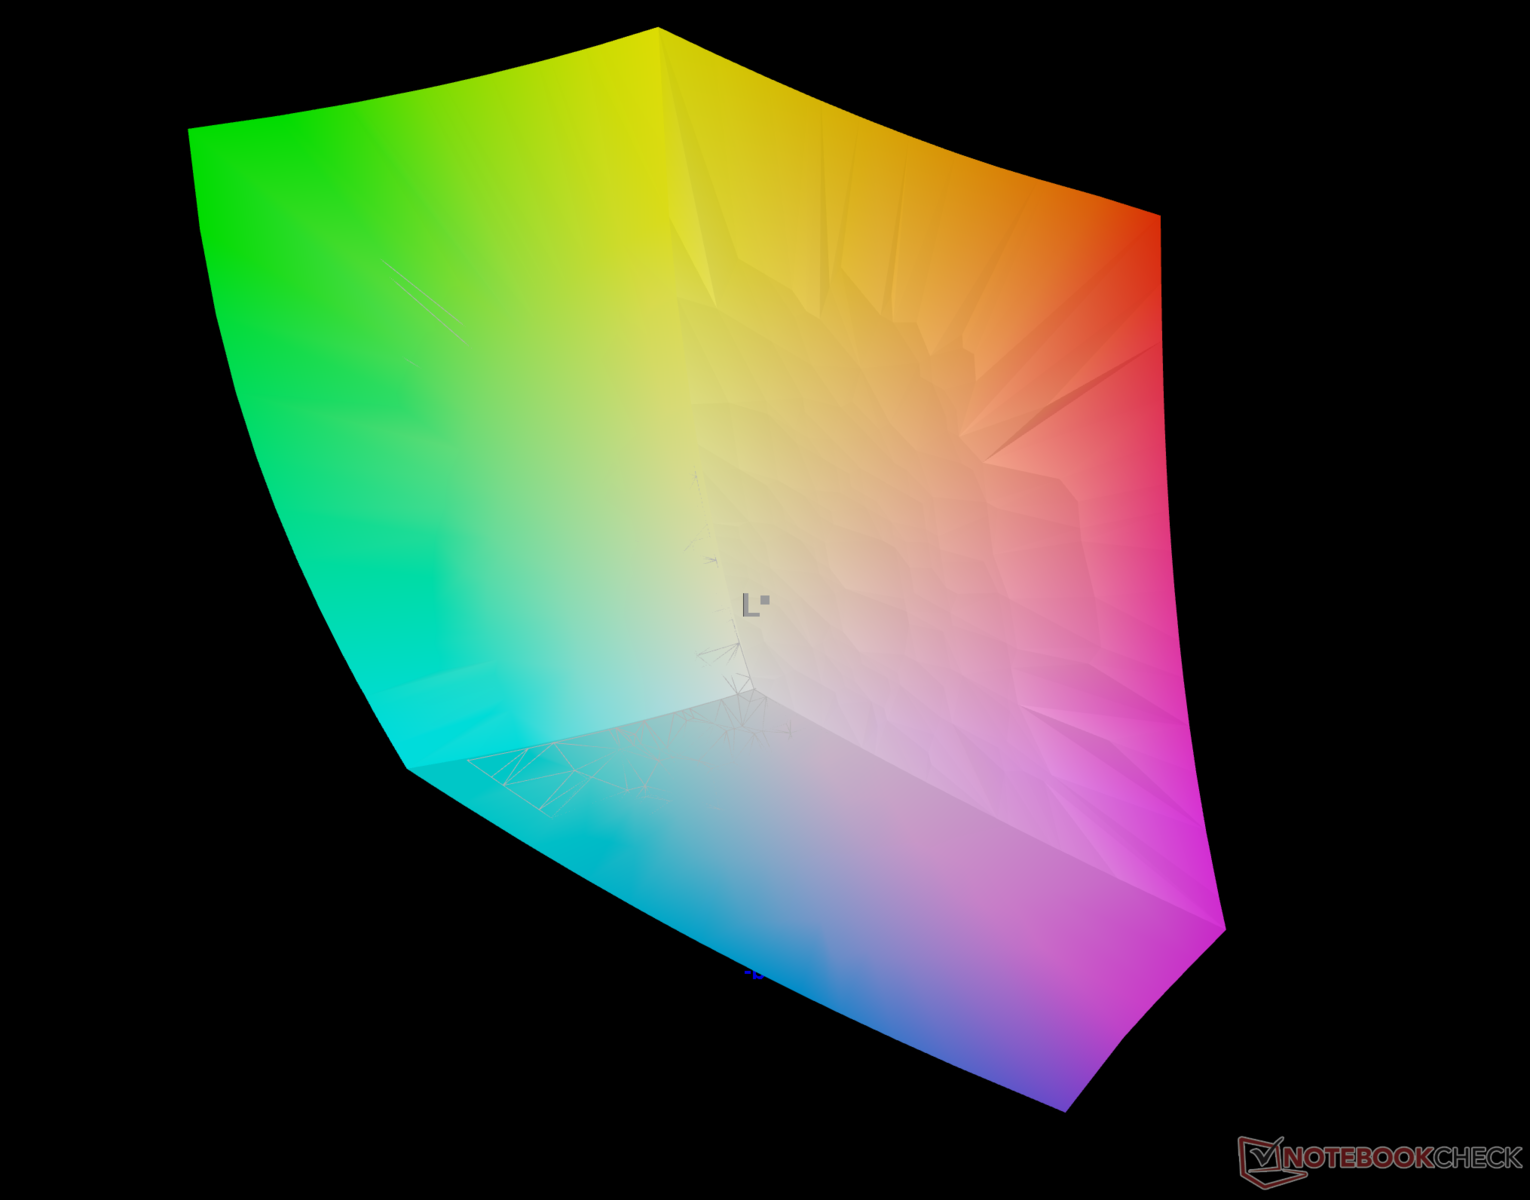
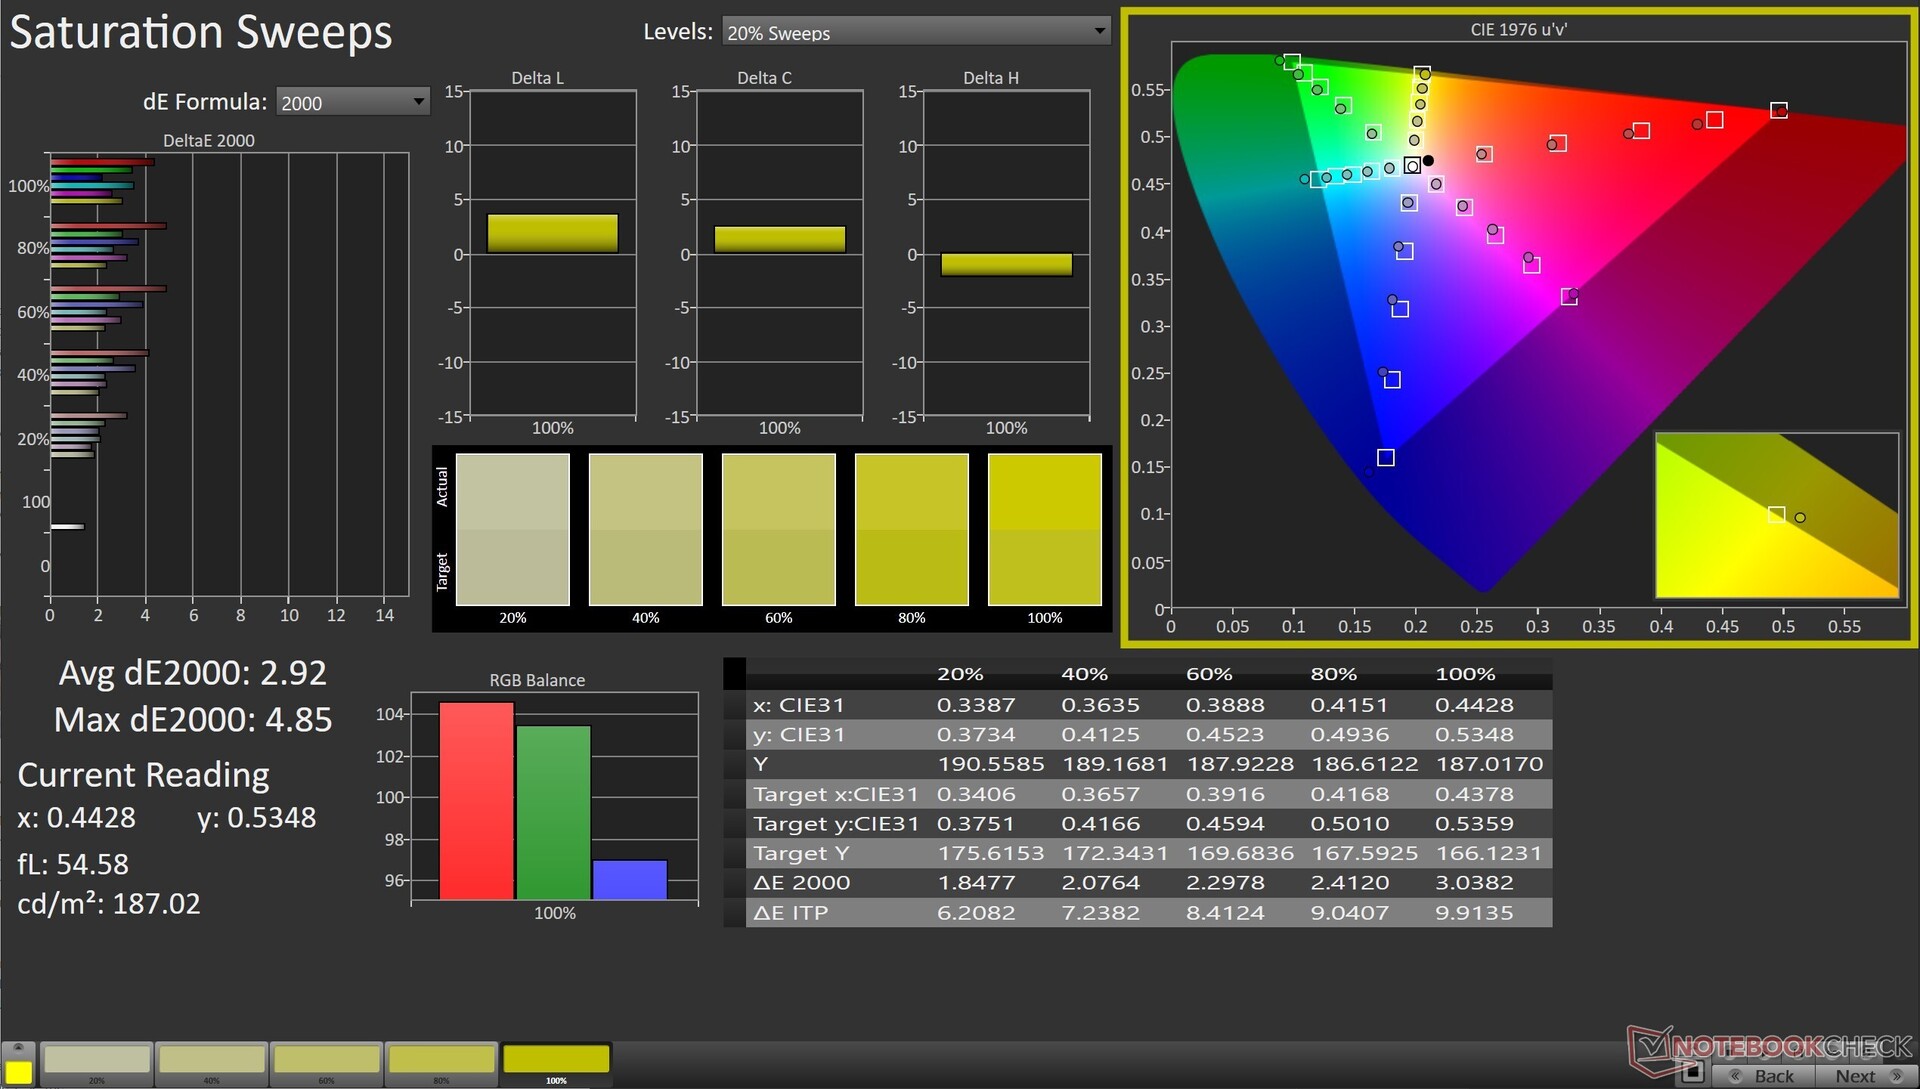
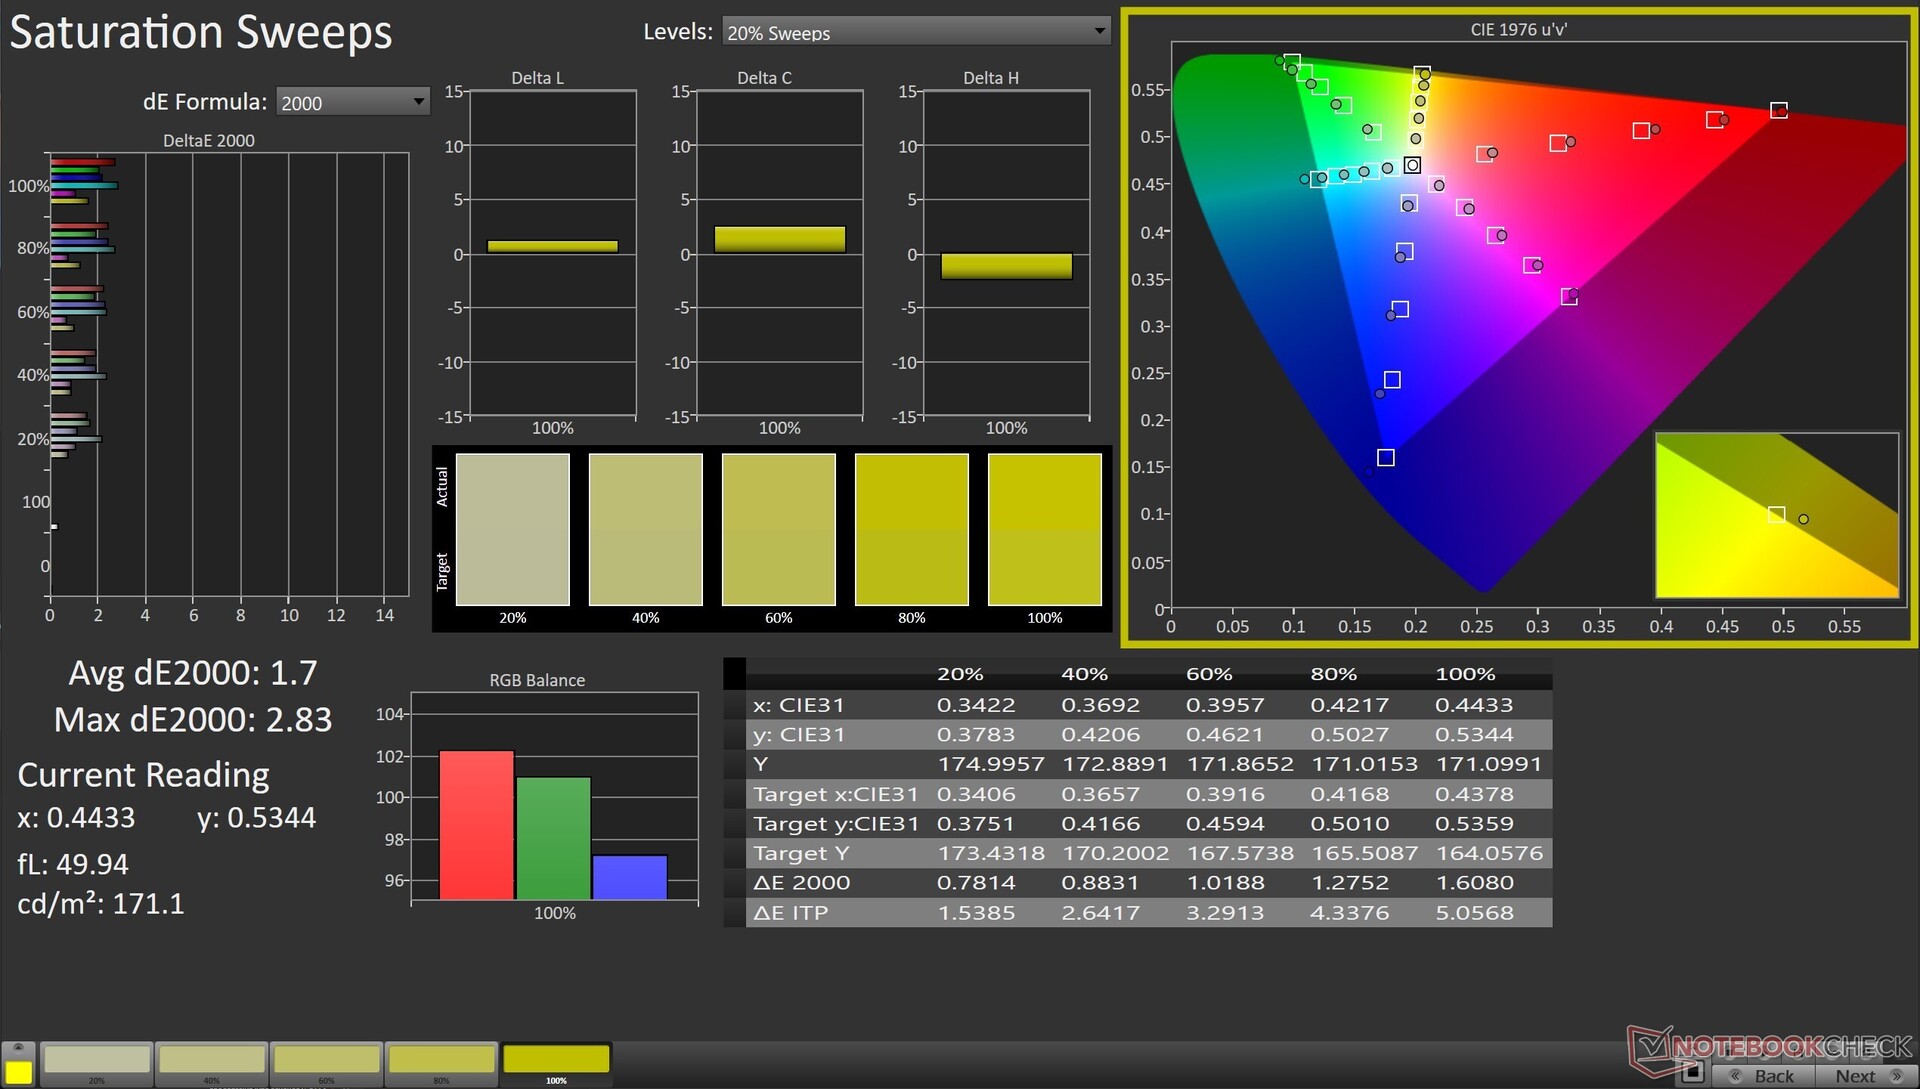
Asus advertises a 100% DCI-P3 color gamut coverage for the Samsung OLED panel, and our measurements show that the panel is indeed able to fully cover the sRGB and Display P3 color spaces.
Adobe RGB coverage is also very good at 96.5%, which makes the ProArt StudioBook 16 excellent for both content creation and multimedia consumption.

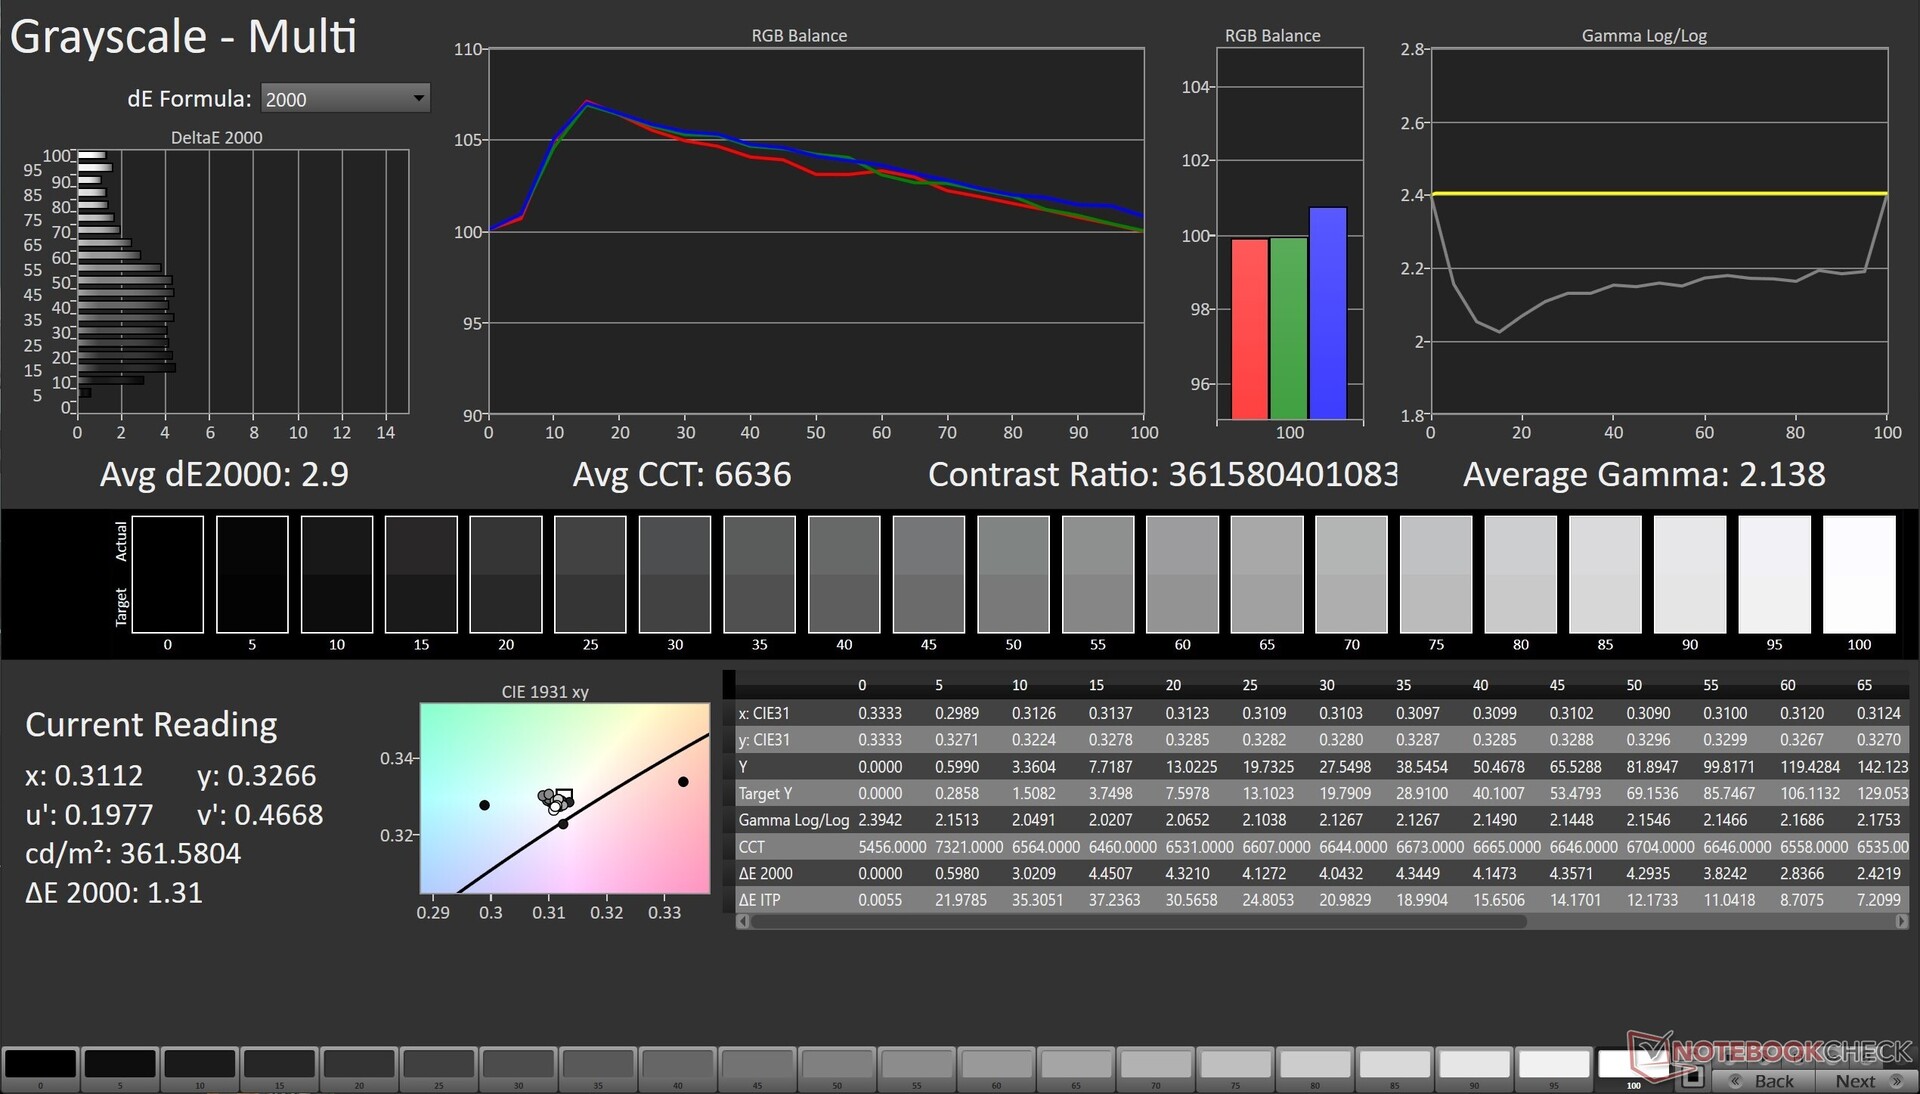
The PANTONE-validated display is supposed to offer an average Delta E of 1.6 out-of-the-box. However, we measured Delta Es of 2.9 and 2.97 in Grayscale and ColorChecker in the Normal color profile.
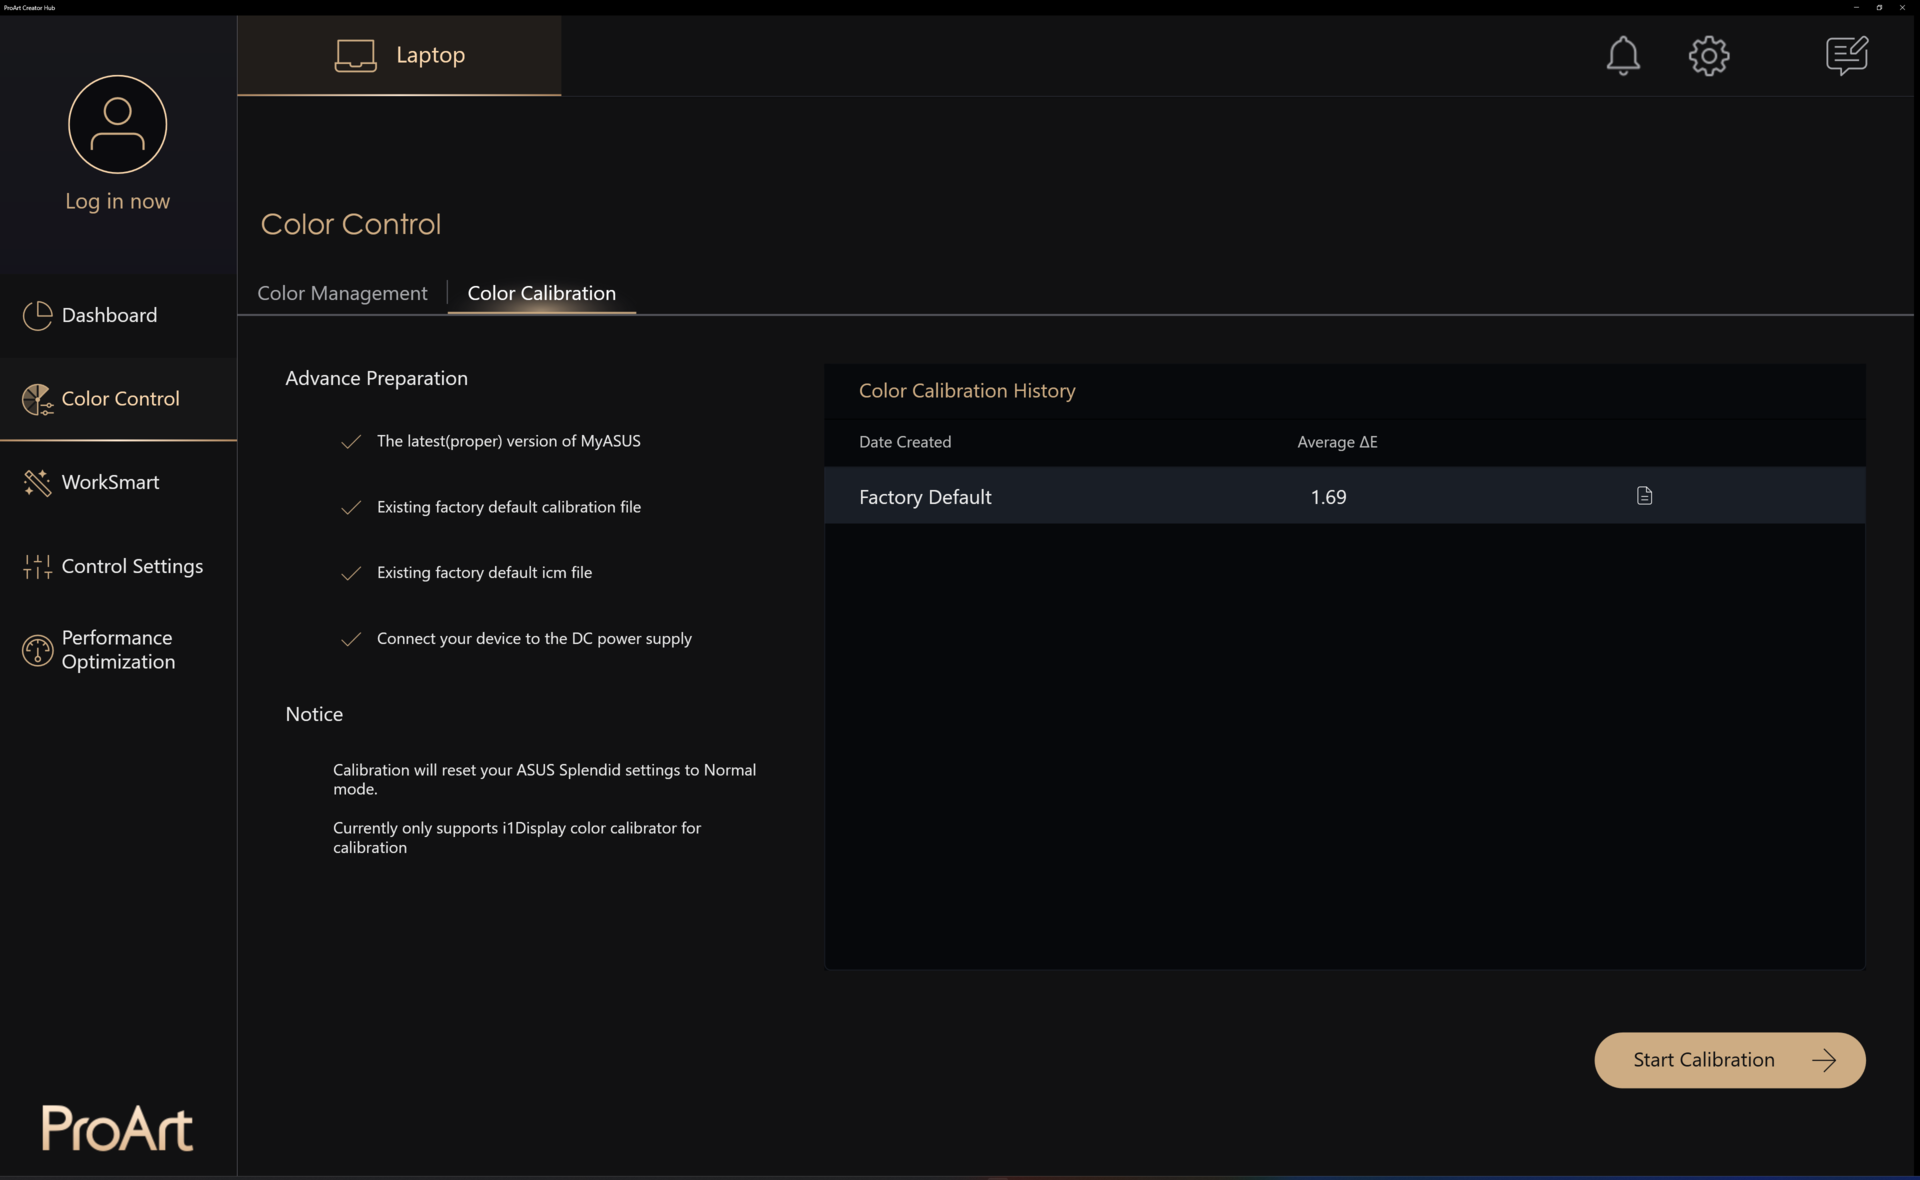
Asus also offers a way to perform display calibration from within the ProArt Creator Hub app with a compatible spectrophotometer.
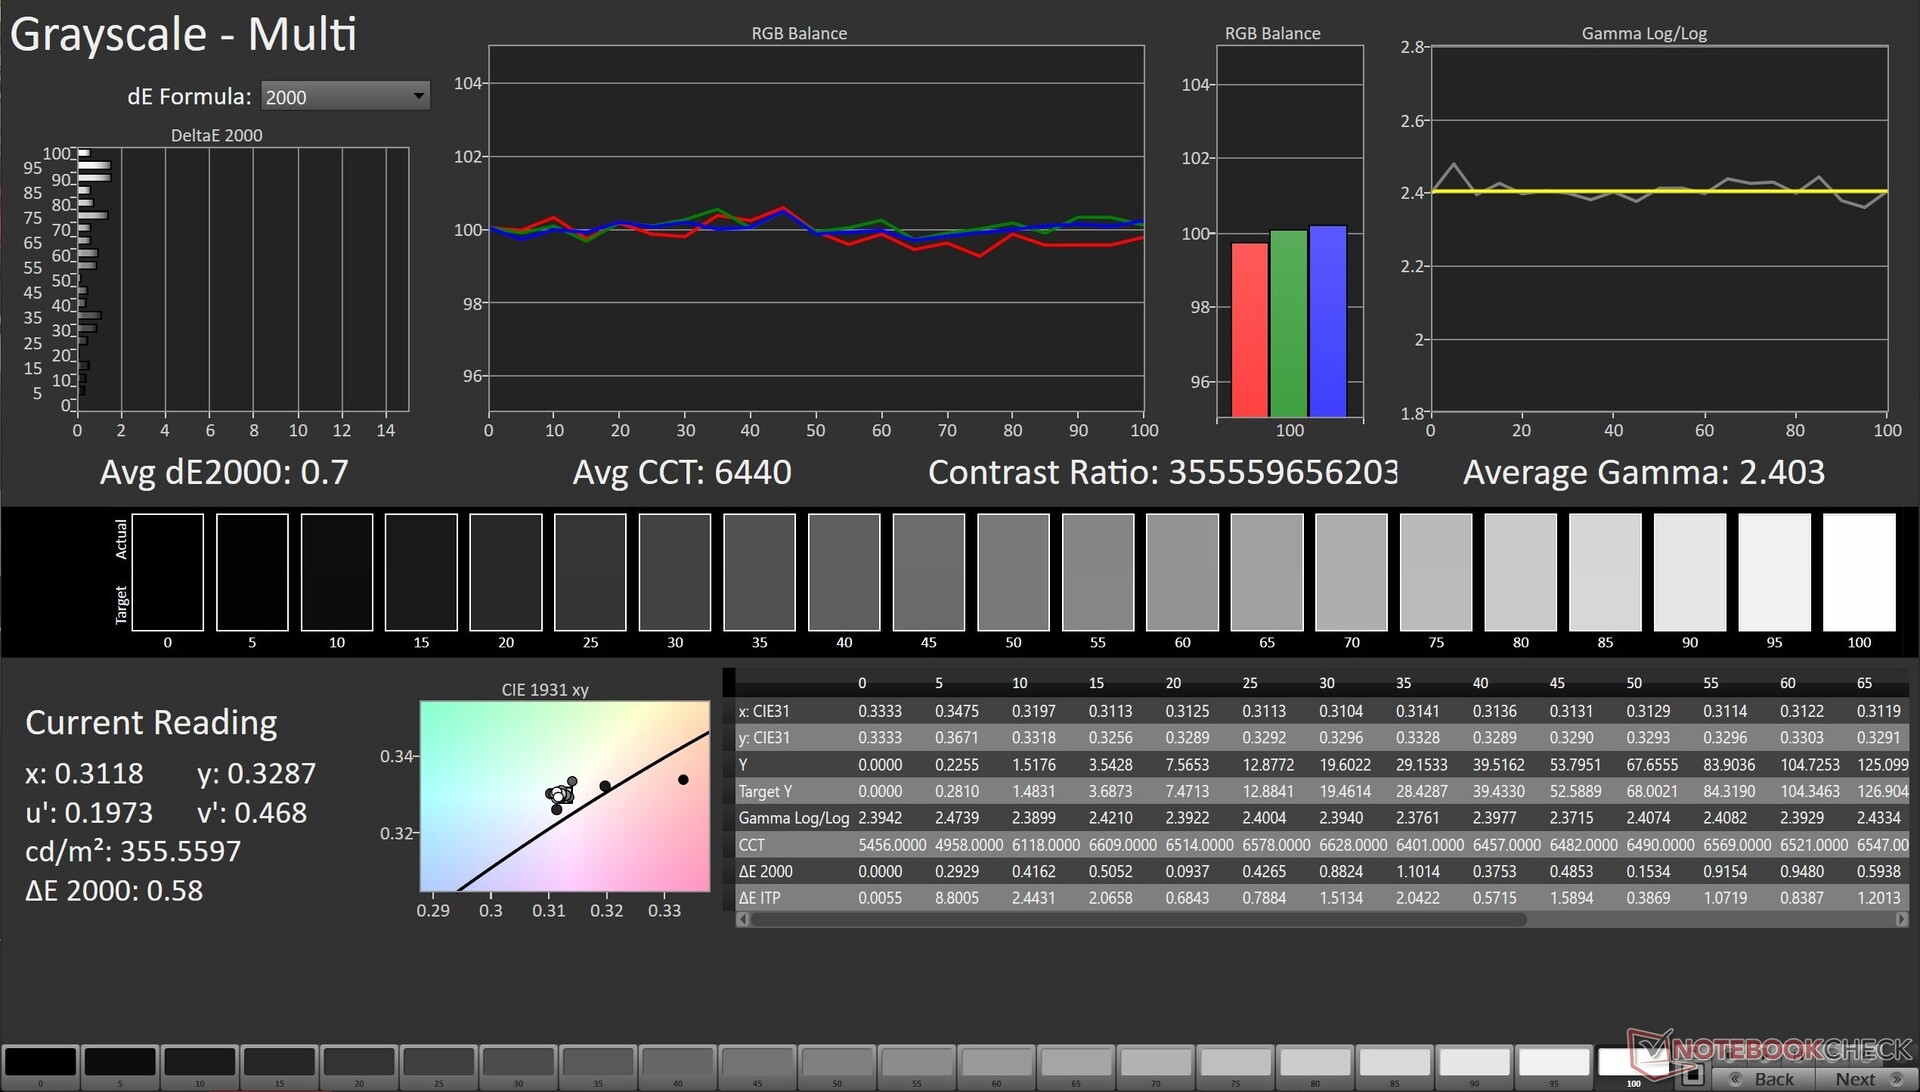
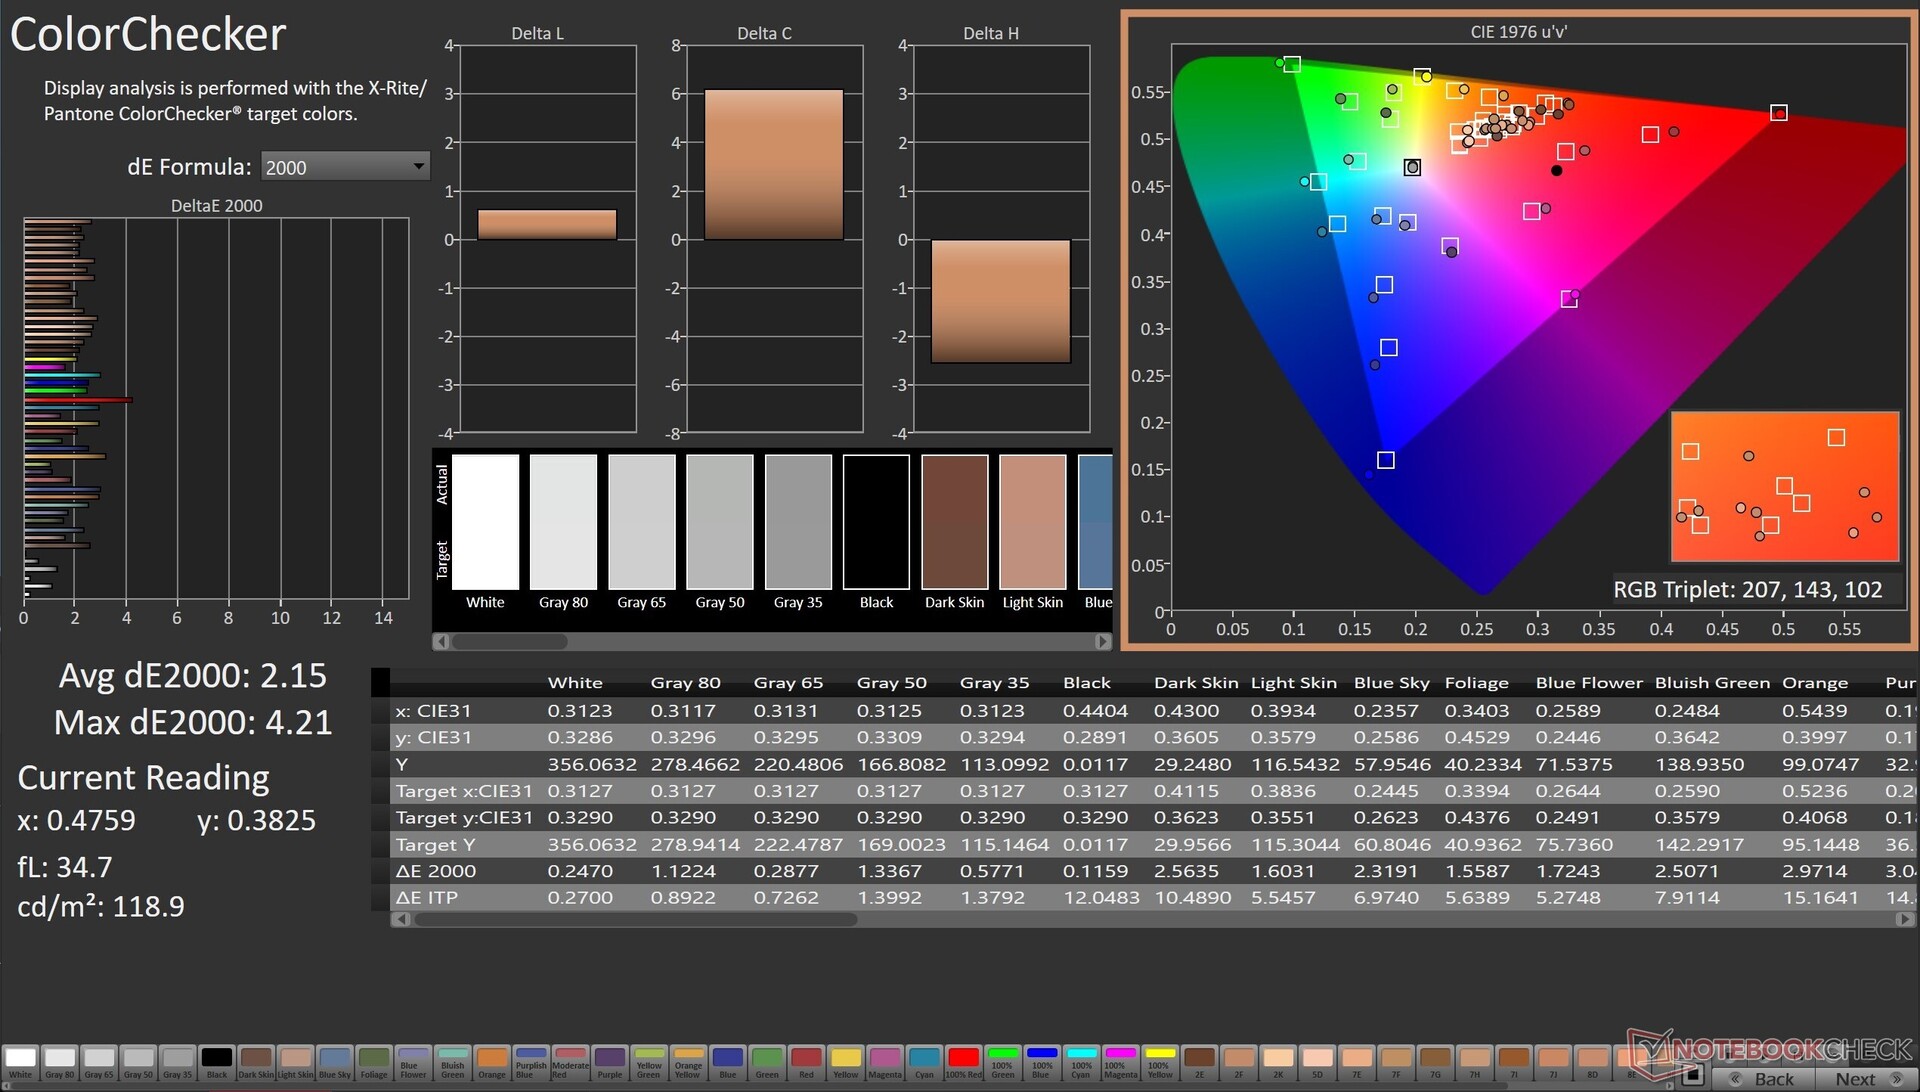
Further calibrating the display in DCI-P3 using the X-rite i1Basic Pro 3 spectrophotometer and Calman Ultimate color calibration software from Portrait Displays results in a significantly improved Grayscale Delta E of just 0.7.
ColorChecker Delta E improves slightly after calibration to 2.15. Visually, most colors except 100% red and shades of blue show accuracy improvements after calibration.
The calibrated ICC file can be downloaded from the link above.
Display Response Times
| ↔ Response Time Black to White | ||
|---|---|---|
| 18.32 ms ... rise ↗ and fall ↘ combined | ↗ 17.39 ms rise | 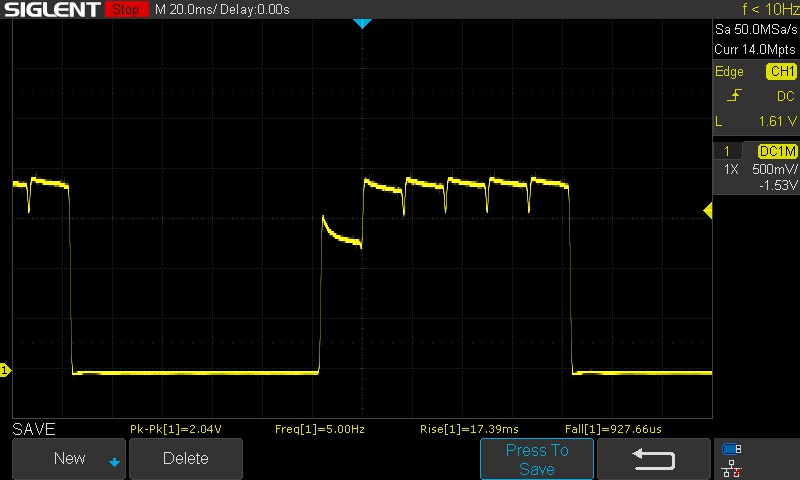 |
| ↘ 0.93 ms fall | ||
| The screen shows good response rates in our tests, but may be too slow for competitive gamers. In comparison, all tested devices range from 0.1 (minimum) to 240 (maximum) ms. » 39 % of all devices are better. This means that the measured response time is better than the average of all tested devices (20.4 ms). | ||
| ↔ Response Time 50% Grey to 80% Grey | ||
| 1.6 ms ... rise ↗ and fall ↘ combined | ↗ 0.82 ms rise | 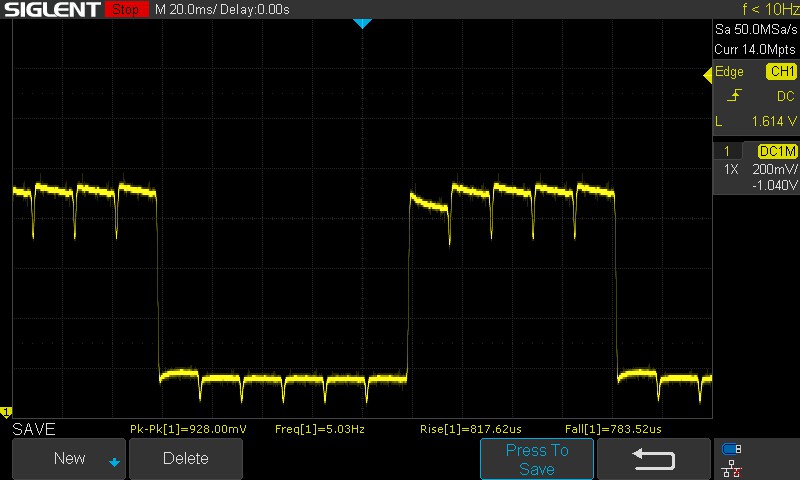 |
| ↘ 0.78 ms fall | ||
| The screen shows very fast response rates in our tests and should be very well suited for fast-paced gaming. In comparison, all tested devices range from 0.165 (minimum) to 636 (maximum) ms. » 6 % of all devices are better. This means that the measured response time is better than the average of all tested devices (31.8 ms). | ||
The OLED panel offers an excellent 50% grey to 80% grey response time of 1.6 ms. The 100% black to 100% white transition, however, takes 18.32 ms. This should still be okay for gaming and is definitely not a problem for the laptop's intended use case.
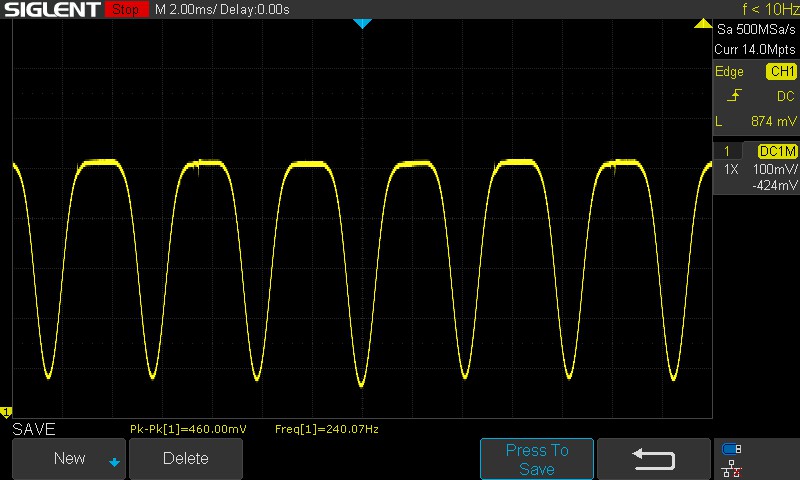
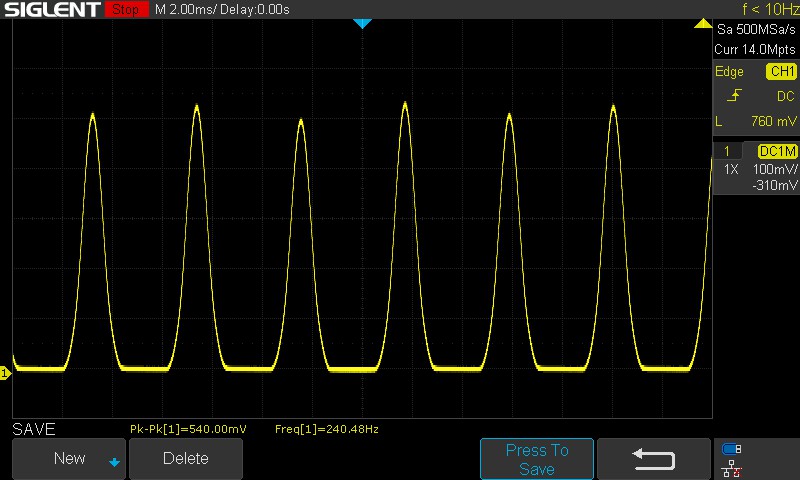
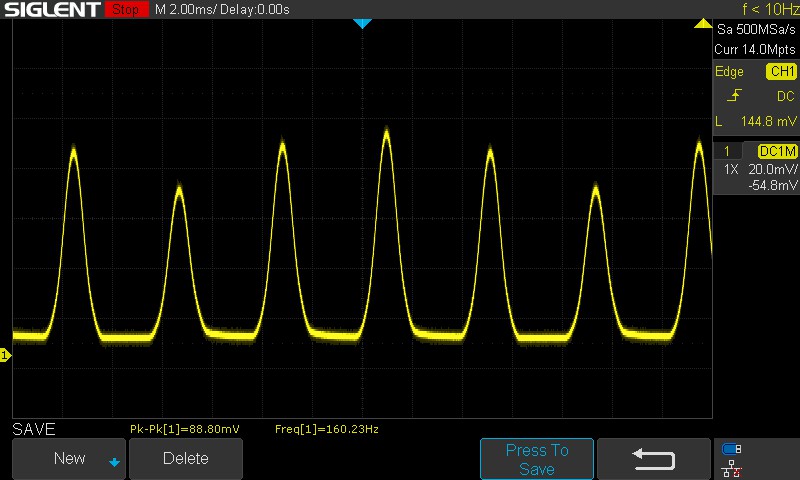
Screen Flickering / PWM (Pulse-Width Modulation)
| Screen flickering / PWM detected | 60 Hz | ≤ 100 % brightness setting | 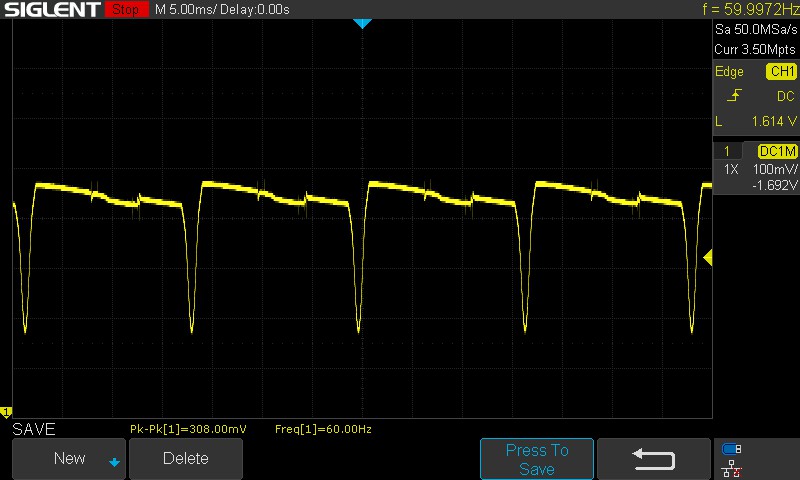 |
The display backlight flickers at 60 Hz (worst case, e.g., utilizing PWM) Flickering detected at a brightness setting of 100 % and below. There should be no flickering or PWM above this brightness setting. The frequency of 60 Hz is very low, so the flickering may cause eyestrain and headaches after extended use. In comparison: 53 % of all tested devices do not use PWM to dim the display. If PWM was detected, an average of 8224 (minimum: 5 - maximum: 343500) Hz was measured. | |||
Asus uses DC Dimming to adjust the backlight intensity. DC Dimming at 60 Hz is seen at brightness levels above 51% to 100%. Below 50%, panel uses PWM and flickers at a frequency of 240 Hz. This reduces to 160 Hz when the Windows brightness slider is set to 0%.
The bright screen ensures good visibility in sunlight. Viewing angles are relatively stable except for minimal loss of brightness at the extremes.

Performance: No holds barred Core i9-12900H and RTX 3070 Ti combination
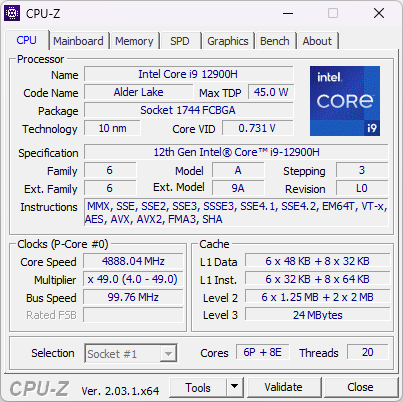
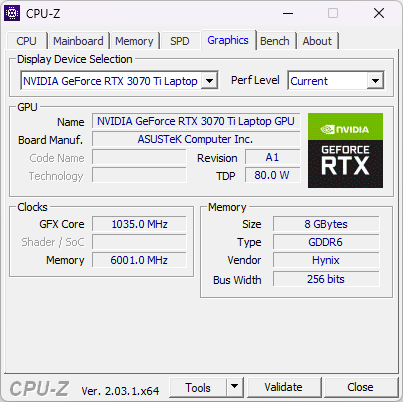
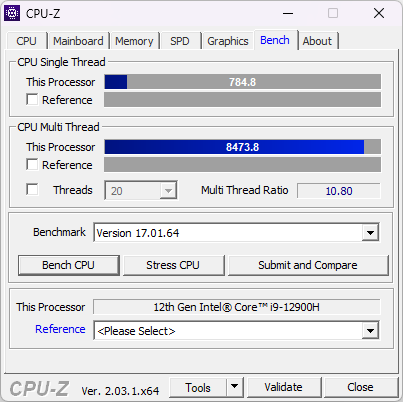
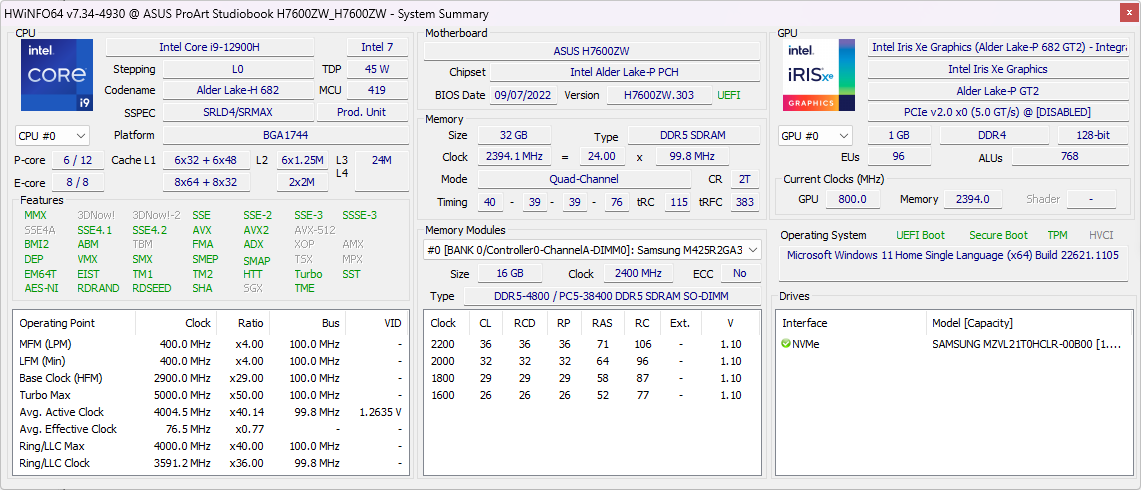
Our Asus ProArt StudioBook 16 is powered by the Intel Core i9-12900H processor and a 115 W Nvidia GeForce RTX 3070 Ti Laptop GPU. Buyers also have the option of choosing SKUs featuring the Core i7-12700H and either a GeForce RTX 3060 or RTX 3080 Ti Laptop GPU along with upgradeable DDR5-4800 memory options up to 64 GB.
Testing Conditions
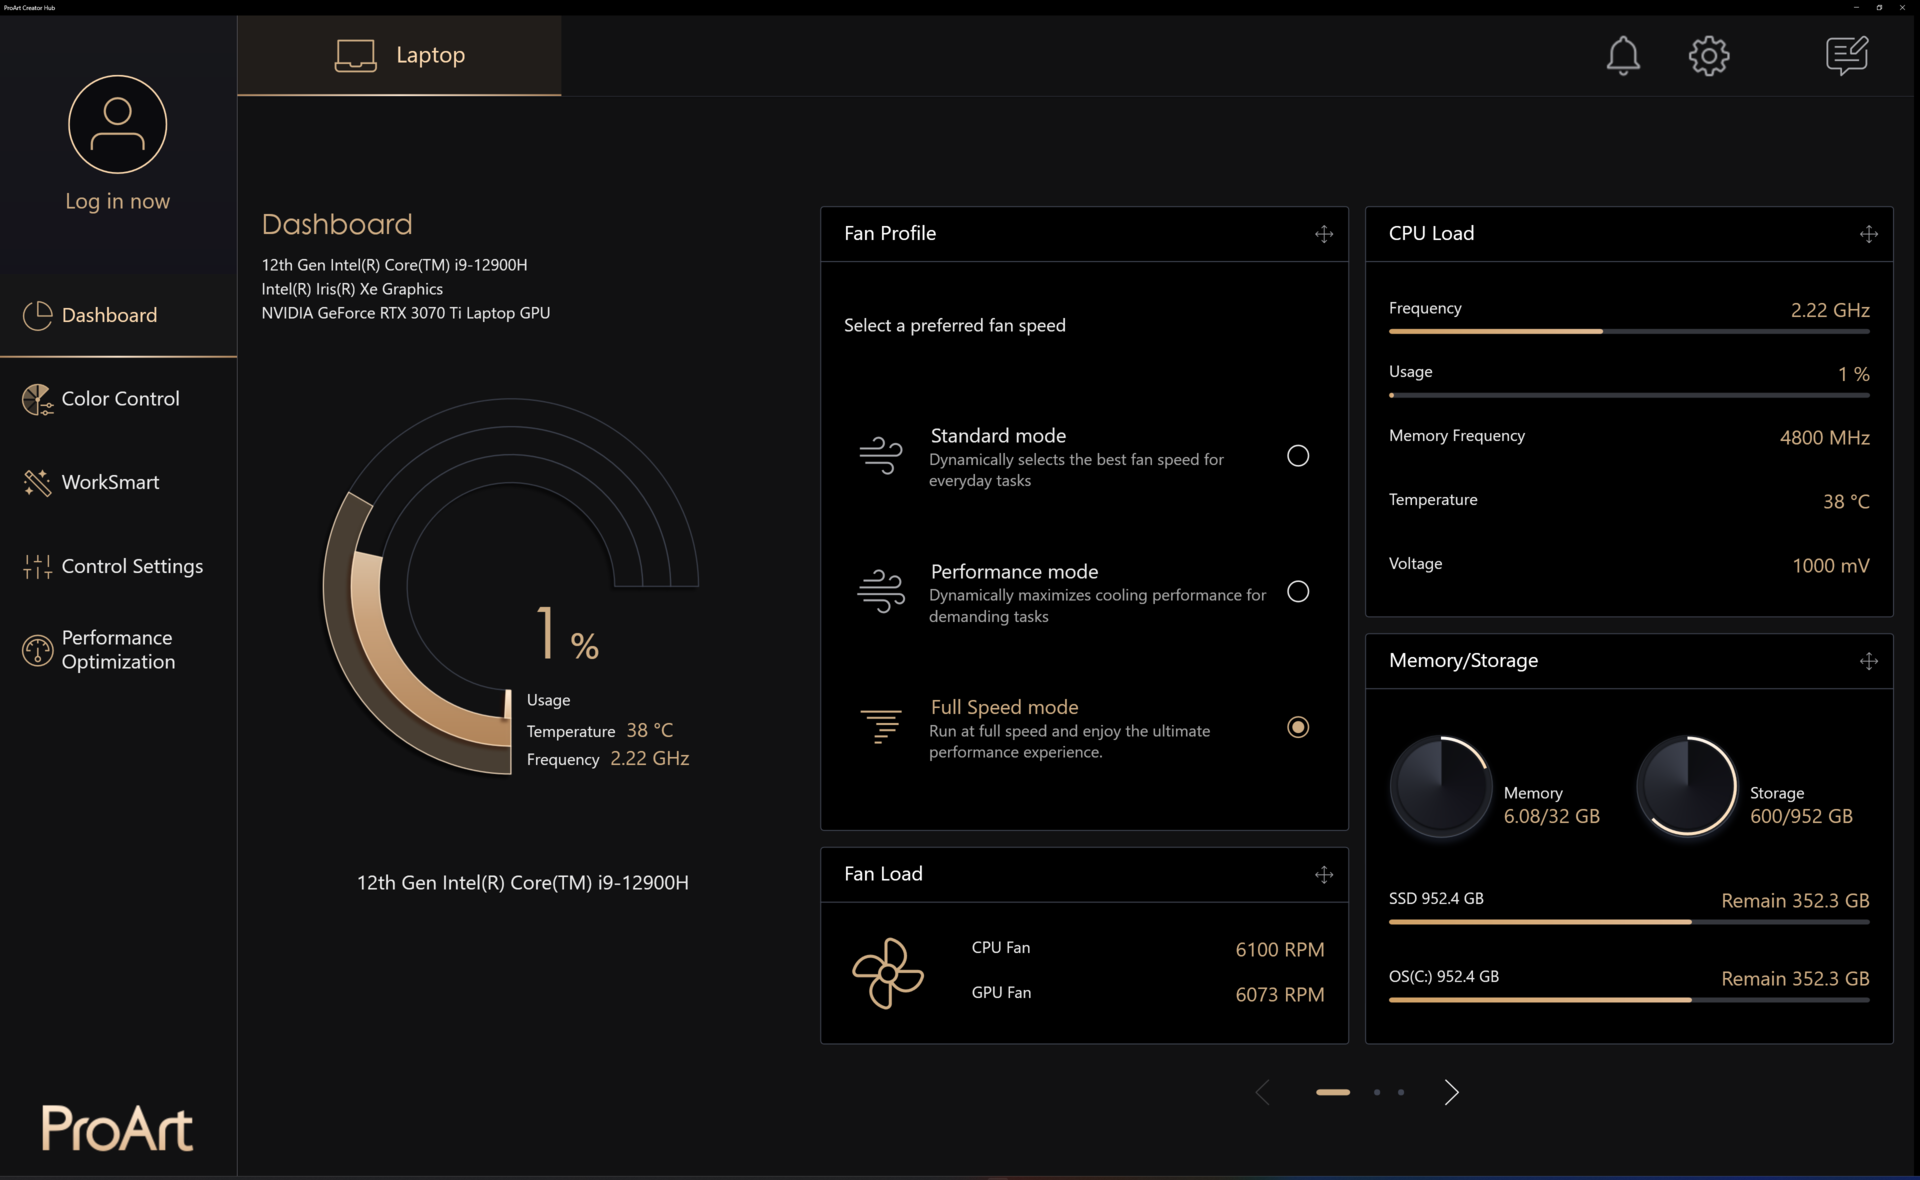
Device settings are distributed between the ProArt Creator Hub and the MyAsus app, which can get a bit confusing initially for those new to the ProArt lineup.
The ProArt Creator Hub allows you to select between three available performance modes, which affect the Core i9-12900H's TDP as per the table below.
We used the Full Speed performance mode for all our tests except for the battery run time tests, which were performed in the Standard mode.
| Performance Mode | PL1 (PBP) / Tau | PL2 (MTP) / Tau |
|---|---|---|
| Standard | 60 W / 56 s | 115 W / 2.44 ms |
| Performance | 110 W / 56 s | 115 W / 2.44 ms |
| Full Speed | 110 W / 56 s | 115 W / 2.44 ms |
Processor
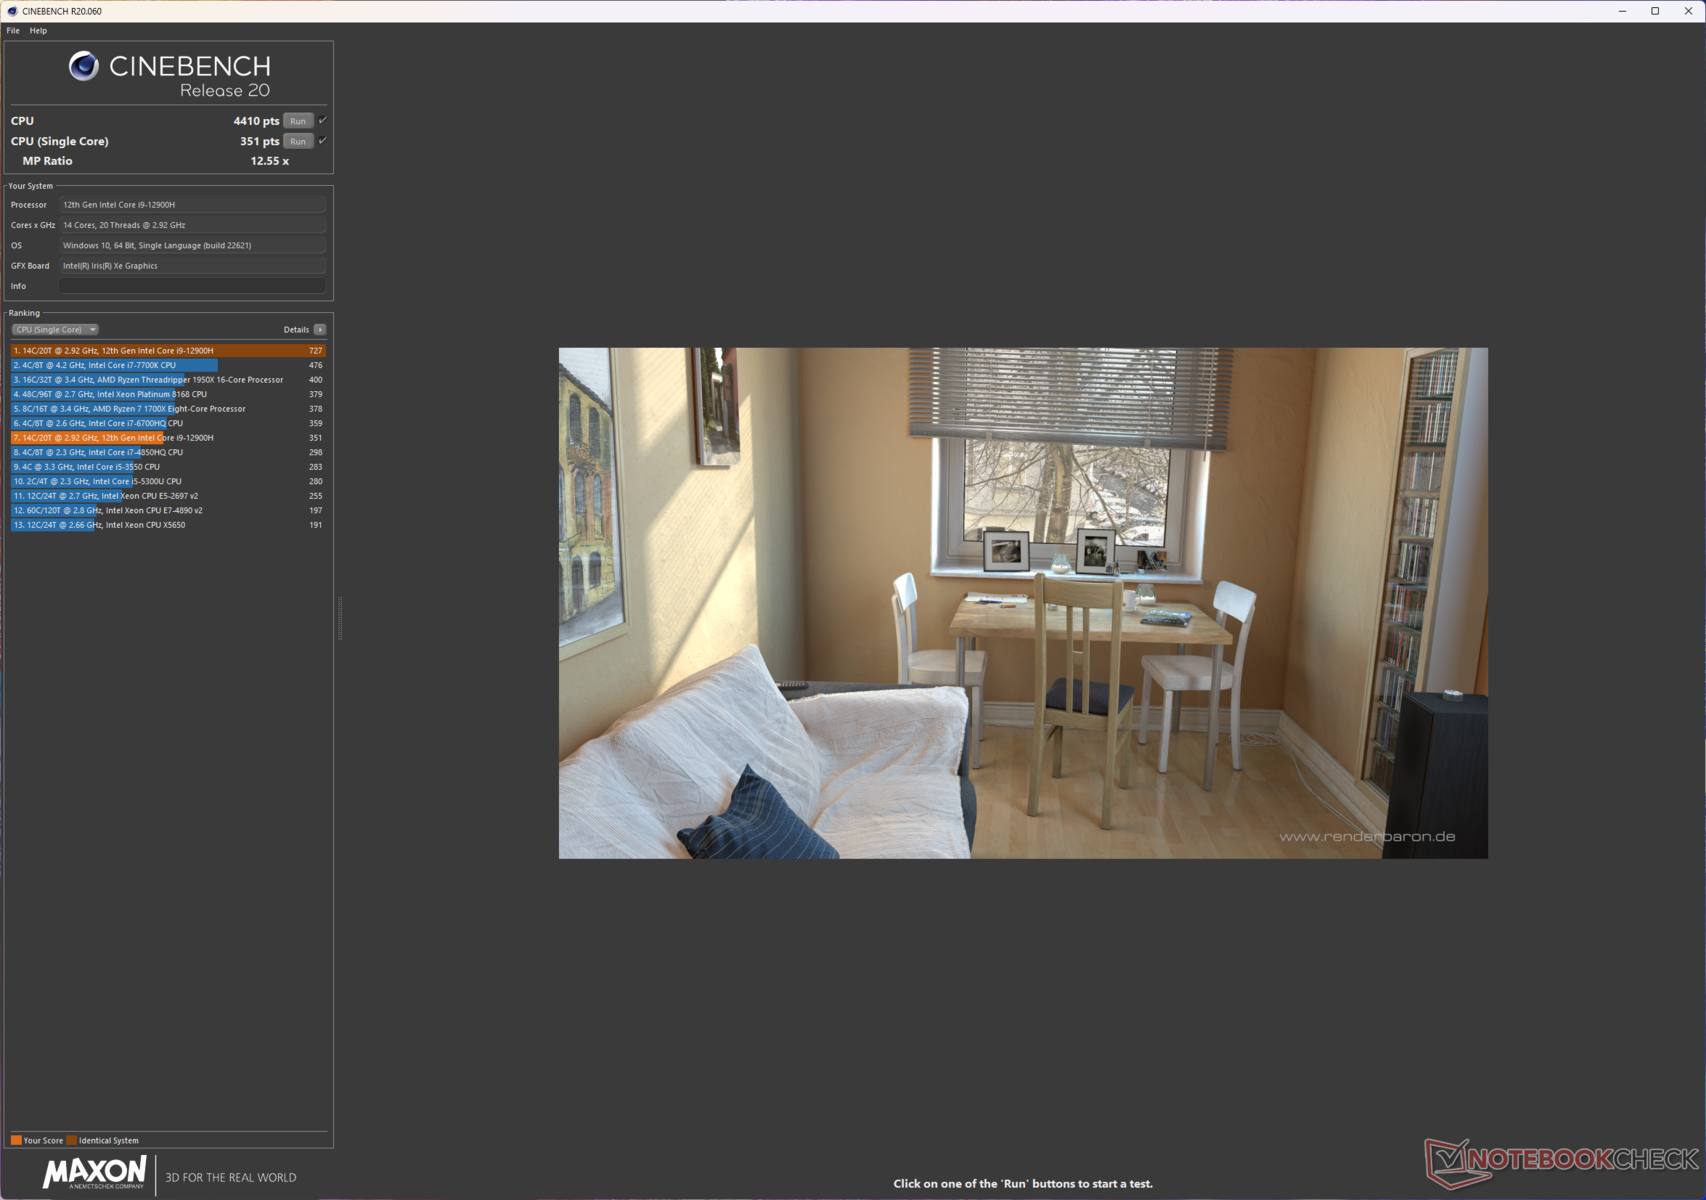
The Intel Alder Lake-H Core i9-12900H features 14 cores and 20 threads with boosts up to 5 GHz. Asus's cooling implementation seems to be quite robust as evidenced by our Cinebench R15 multi-core loop test that shows no perceivable signs of throttling.
The ProArt StudioBook 16 leads the charts in overall CPU performance albeit with marginal leads compared to competitors featuring the same processor. That being said, the single-core performance takes a miniscule hit owing to the 115 W PL2 compared to the MSI Creator Z16P's 160 W, Asus ROG Strix Scar 15's 135 W, and the MSI Creator Z17's 120 W.
Compared to the Apple M1 Pro and M1 Max, the Core i9-12900H in the ProArt StudioBook 16 is up to 22% faster in single-core and 55% faster in multi-core in Cinebench R23.
Cinebench R15 Multi Loop
Cinebench R23: Multi Core | Single Core
Cinebench R20: CPU (Multi Core) | CPU (Single Core)
Cinebench R15: CPU Multi 64Bit | CPU Single 64Bit
Blender: v2.79 BMW27 CPU
7-Zip 18.03: 7z b 4 | 7z b 4 -mmt1
Geekbench 5.5: Multi-Core | Single-Core
HWBOT x265 Benchmark v2.2: 4k Preset
LibreOffice : 20 Documents To PDF
R Benchmark 2.5: Overall mean
| CPU Performance rating | |
| Asus ProArt StudioBook 16 H7600ZW | |
| Asus ROG Strix Scar 15 G533ZW-LN106WS | |
| MSI Creator Z16P B12UHST | |
| Gigabyte Aero 16 YE5 | |
| Asus ZenBook Pro 16X OLED UX7602ZM-ME115W | |
| MSI Creator Z17 A12UGST-054 | |
| Average Intel Core i9-12900H | |
| Average of class Multimedia | |
| Asus ROG Zephyrus Duo 16 GX650RX | |
| Apple MacBook Pro 16 2021 M1 Pro -5! | |
| Apple MacBook Pro 14 2021 M1 Max 24-Core GPU -5! | |
| Lenovo ThinkBook 16p G3 ARH | |
| Cinebench R20 / CPU (Multi Core) | |
| Asus ProArt StudioBook 16 H7600ZW | |
| Asus ROG Strix Scar 15 G533ZW-LN106WS | |
| MSI Creator Z16P B12UHST | |
| Gigabyte Aero 16 YE5 | |
| MSI Creator Z17 A12UGST-054 | |
| Asus ZenBook Pro 16X OLED UX7602ZM-ME115W | |
| Average of class Multimedia (1887 - 11924, n=65, last 2 years) | |
| Average Intel Core i9-12900H (2681 - 7471, n=28) | |
| Asus ROG Zephyrus Duo 16 GX650RX | |
| Lenovo ThinkBook 16p G3 ARH | |
| Apple MacBook Pro 14 2021 M1 Max 24-Core GPU | |
| Apple MacBook Pro 16 2021 M1 Pro | |
| Cinebench R20 / CPU (Single Core) | |
| MSI Creator Z16P B12UHST | |
| Asus ProArt StudioBook 16 H7600ZW | |
| Asus ROG Strix Scar 15 G533ZW-LN106WS | |
| MSI Creator Z17 A12UGST-054 | |
| Average Intel Core i9-12900H (624 - 738, n=28) | |
| Gigabyte Aero 16 YE5 | |
| Asus ZenBook Pro 16X OLED UX7602ZM-ME115W | |
| Average of class Multimedia (420 - 853, n=65, last 2 years) | |
| Lenovo ThinkBook 16p G3 ARH | |
| Asus ROG Zephyrus Duo 16 GX650RX | |
| Apple MacBook Pro 14 2021 M1 Max 24-Core GPU | |
| Apple MacBook Pro 16 2021 M1 Pro | |
| Cinebench R15 / CPU Multi 64Bit | |
| Asus ROG Strix Scar 15 G533ZW-LN106WS | |
| Asus ProArt StudioBook 16 H7600ZW | |
| MSI Creator Z16P B12UHST | |
| Gigabyte Aero 16 YE5 | |
| Asus ZenBook Pro 16X OLED UX7602ZM-ME115W | |
| MSI Creator Z17 A12UGST-054 | |
| Average of class Multimedia (856 - 5224, n=73, last 2 years) | |
| Average Intel Core i9-12900H (1395 - 3077, n=28) | |
| Asus ROG Zephyrus Duo 16 GX650RX | |
| Lenovo ThinkBook 16p G3 ARH | |
| Apple MacBook Pro 16 2021 M1 Pro | |
| Apple MacBook Pro 14 2021 M1 Max 24-Core GPU | |
| 7-Zip 18.03 / 7z b 4 | |
| Asus ProArt StudioBook 16 H7600ZW | |
| MSI Creator Z16P B12UHST | |
| Asus ZenBook Pro 16X OLED UX7602ZM-ME115W | |
| Gigabyte Aero 16 YE5 | |
| Asus ROG Strix Scar 15 G533ZW-LN106WS | |
| Asus ROG Zephyrus Duo 16 GX650RX | |
| MSI Creator Z17 A12UGST-054 | |
| Average Intel Core i9-12900H (34684 - 76677, n=28) | |
| Average of class Multimedia (29095 - 130368, n=60, last 2 years) | |
| Lenovo ThinkBook 16p G3 ARH | |
| 7-Zip 18.03 / 7z b 4 -mmt1 | |
| Asus ProArt StudioBook 16 H7600ZW | |
| Gigabyte Aero 16 YE5 | |
| MSI Creator Z16P B12UHST | |
| Asus ROG Strix Scar 15 G533ZW-LN106WS | |
| MSI Creator Z17 A12UGST-054 | |
| Average Intel Core i9-12900H (5302 - 6289, n=28) | |
| Asus ZenBook Pro 16X OLED UX7602ZM-ME115W | |
| Asus ROG Zephyrus Duo 16 GX650RX | |
| Average of class Multimedia (3666 - 7545, n=60, last 2 years) | |
| Lenovo ThinkBook 16p G3 ARH | |
| HWBOT x265 Benchmark v2.2 / 4k Preset | |
| Asus ProArt StudioBook 16 H7600ZW | |
| Asus ROG Strix Scar 15 G533ZW-LN106WS | |
| Asus ZenBook Pro 16X OLED UX7602ZM-ME115W | |
| MSI Creator Z16P B12UHST | |
| Gigabyte Aero 16 YE5 | |
| Asus ROG Zephyrus Duo 16 GX650RX | |
| MSI Creator Z17 A12UGST-054 | |
| Average Intel Core i9-12900H (8.05 - 22.5, n=28) | |
| Average of class Multimedia (5.26 - 34.3, n=60, last 2 years) | |
| Lenovo ThinkBook 16p G3 ARH | |
| LibreOffice / 20 Documents To PDF | |
| Lenovo ThinkBook 16p G3 ARH | |
| Average of class Multimedia (23.9 - 146.7, n=61, last 2 years) | |
| Asus ROG Zephyrus Duo 16 GX650RX | |
| Asus ProArt StudioBook 16 H7600ZW | |
| Average Intel Core i9-12900H (36.8 - 59.8, n=28) | |
| MSI Creator Z17 A12UGST-054 | |
| Asus ZenBook Pro 16X OLED UX7602ZM-ME115W | |
| Asus ROG Strix Scar 15 G533ZW-LN106WS | |
| Gigabyte Aero 16 YE5 | |
| MSI Creator Z16P B12UHST | |
| R Benchmark 2.5 / Overall mean | |
| Lenovo ThinkBook 16p G3 ARH | |
| Average of class Multimedia (0.3604 - 0.947, n=60, last 2 years) | |
| Asus ROG Zephyrus Duo 16 GX650RX | |
| Average Intel Core i9-12900H (0.4218 - 0.506, n=28) | |
| MSI Creator Z17 A12UGST-054 | |
| Asus ZenBook Pro 16X OLED UX7602ZM-ME115W | |
| Asus ProArt StudioBook 16 H7600ZW | |
| MSI Creator Z16P B12UHST | |
| Asus ROG Strix Scar 15 G533ZW-LN106WS | |
| Gigabyte Aero 16 YE5 | |
* ... smaller is better
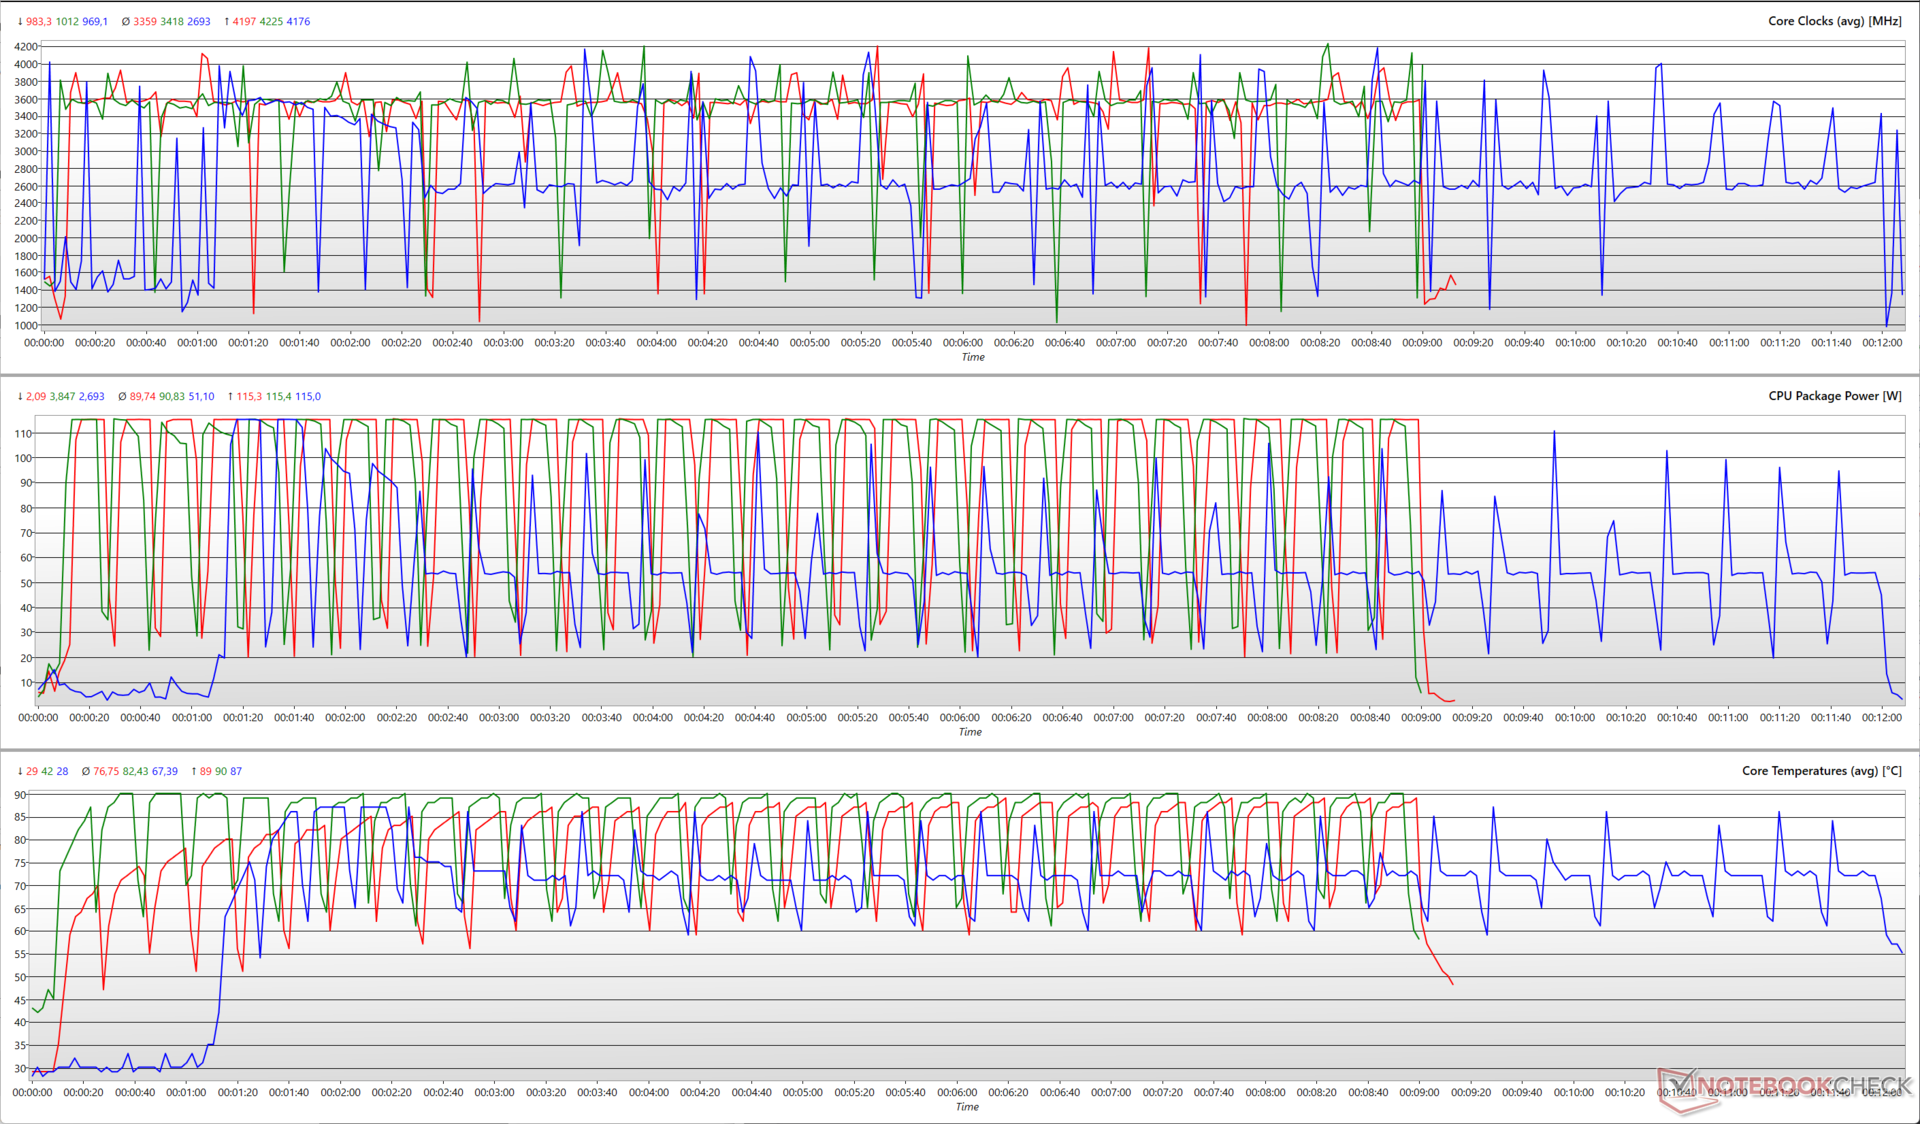
The graph below illustrates how various CPU parameters change during a Cinebench R15 multi-core loop test. We see that all three performance modes are able to attain the maximum clock, power, and temperature limits.
However, the Standard mode settles at a lower average package power of 51 W compared to 90 W in the other two modes. This results in lower average core clocks of about 2.7 GHz and lower core temperatures hovering around the 67 °C mark.
The Performance and Full Speed modes are more or less the same in terms of power limits, but the latter spins the fans continuously at maximum speed even under idle. Thus, the average core temperatures in Full Speed mode are about 6 °C lower compared to the Performance mode.
Performance takes a hit on battery power, however. Cinebench R20 scores drop by 52% in single-core and 40% in multi-core when run on battery.
Unlike Apple silicon-powered MacBook Pros that perform fairly consistently whether plugged in or on battery power, the ProArt StudioBook 16, like all modern x86 devices, can only fully flex its muscles when connected to the mains.
That being said, the reduced performance on battery should still be adequate to help you get creative work done on the move.
Overall, the ProArt StudioBook 16 offers enough CPU horsepower to sail through most demanding workflows without breaking a sweat.
AIDA64: FP32 Ray-Trace | FPU Julia | CPU SHA3 | CPU Queen | FPU SinJulia | FPU Mandel | CPU AES | CPU ZLib | FP64 Ray-Trace | CPU PhotoWorxx
| Performance rating | |
| Asus ProArt StudioBook 16 H7600ZW | |
| Asus ROG Zephyrus Duo 16 GX650RX | |
| Lenovo ThinkBook 16p G3 ARH | |
| Asus ZenBook Pro 16X OLED UX7602ZM-ME115W | |
| Average of class Multimedia | |
| Asus ROG Strix Scar 15 G533ZW-LN106WS | |
| MSI Creator Z16P B12UHST | |
| Average Intel Core i9-12900H | |
| Gigabyte Aero 16 YE5 | |
| MSI Creator Z17 A12UGST-054 | |
| AIDA64 / FP32 Ray-Trace | |
| Asus ProArt StudioBook 16 H7600ZW | |
| Asus ROG Zephyrus Duo 16 GX650RX | |
| Average of class Multimedia (5121 - 50388, n=58, last 2 years) | |
| Lenovo ThinkBook 16p G3 ARH | |
| Asus ZenBook Pro 16X OLED UX7602ZM-ME115W | |
| Average Intel Core i9-12900H (4074 - 18289, n=28) | |
| Asus ROG Strix Scar 15 G533ZW-LN106WS | |
| MSI Creator Z16P B12UHST | |
| Gigabyte Aero 16 YE5 | |
| MSI Creator Z17 A12UGST-054 | |
| AIDA64 / FPU Julia | |
| Asus ROG Zephyrus Duo 16 GX650RX | |
| Lenovo ThinkBook 16p G3 ARH | |
| Asus ProArt StudioBook 16 H7600ZW | |
| Average of class Multimedia (14528 - 201874, n=59, last 2 years) | |
| Asus ZenBook Pro 16X OLED UX7602ZM-ME115W | |
| Average Intel Core i9-12900H (22307 - 93236, n=28) | |
| Asus ROG Strix Scar 15 G533ZW-LN106WS | |
| MSI Creator Z16P B12UHST | |
| Gigabyte Aero 16 YE5 | |
| MSI Creator Z17 A12UGST-054 | |
| AIDA64 / CPU SHA3 | |
| Asus ProArt StudioBook 16 H7600ZW | |
| Asus ZenBook Pro 16X OLED UX7602ZM-ME115W | |
| Average of class Multimedia (1188 - 8623, n=59, last 2 years) | |
| Asus ROG Zephyrus Duo 16 GX650RX | |
| Asus ROG Strix Scar 15 G533ZW-LN106WS | |
| Lenovo ThinkBook 16p G3 ARH | |
| Average Intel Core i9-12900H (1378 - 4215, n=28) | |
| MSI Creator Z16P B12UHST | |
| Gigabyte Aero 16 YE5 | |
| MSI Creator Z17 A12UGST-054 | |
| AIDA64 / CPU Queen | |
| Asus ProArt StudioBook 16 H7600ZW | |
| Asus ZenBook Pro 16X OLED UX7602ZM-ME115W | |
| Gigabyte Aero 16 YE5 | |
| MSI Creator Z16P B12UHST | |
| MSI Creator Z17 A12UGST-054 | |
| Asus ROG Zephyrus Duo 16 GX650RX | |
| Asus ROG Strix Scar 15 G533ZW-LN106WS | |
| Lenovo ThinkBook 16p G3 ARH | |
| Average Intel Core i9-12900H (78172 - 111241, n=28) | |
| Average of class Multimedia (21547 - 181505, n=59, last 2 years) | |
| AIDA64 / FPU SinJulia | |
| Lenovo ThinkBook 16p G3 ARH | |
| Asus ROG Zephyrus Duo 16 GX650RX | |
| Asus ProArt StudioBook 16 H7600ZW | |
| Asus ROG Strix Scar 15 G533ZW-LN106WS | |
| MSI Creator Z16P B12UHST | |
| Average of class Multimedia (1240 - 28794, n=59, last 2 years) | |
| Asus ZenBook Pro 16X OLED UX7602ZM-ME115W | |
| Gigabyte Aero 16 YE5 | |
| MSI Creator Z17 A12UGST-054 | |
| Average Intel Core i9-12900H (5709 - 10410, n=28) | |
| AIDA64 / FPU Mandel | |
| Asus ROG Zephyrus Duo 16 GX650RX | |
| Lenovo ThinkBook 16p G3 ARH | |
| Asus ProArt StudioBook 16 H7600ZW | |
| Average of class Multimedia (9903 - 105740, n=58, last 2 years) | |
| Asus ZenBook Pro 16X OLED UX7602ZM-ME115W | |
| Average Intel Core i9-12900H (11257 - 45581, n=28) | |
| Asus ROG Strix Scar 15 G533ZW-LN106WS | |
| MSI Creator Z16P B12UHST | |
| Gigabyte Aero 16 YE5 | |
| MSI Creator Z17 A12UGST-054 | |
| AIDA64 / CPU AES | |
| Asus ProArt StudioBook 16 H7600ZW | |
| Asus ROG Zephyrus Duo 16 GX650RX | |
| Asus ROG Strix Scar 15 G533ZW-LN106WS | |
| MSI Creator Z16P B12UHST | |
| Gigabyte Aero 16 YE5 | |
| MSI Creator Z17 A12UGST-054 | |
| Average Intel Core i9-12900H (31935 - 151546, n=28) | |
| Average of class Multimedia (26066 - 169946, n=59, last 2 years) | |
| Asus ZenBook Pro 16X OLED UX7602ZM-ME115W | |
| Lenovo ThinkBook 16p G3 ARH | |
| AIDA64 / CPU ZLib | |
| MSI Creator Z16P B12UHST | |
| Asus ROG Strix Scar 15 G533ZW-LN106WS | |
| Asus ProArt StudioBook 16 H7600ZW | |
| Asus ZenBook Pro 16X OLED UX7602ZM-ME115W | |
| Gigabyte Aero 16 YE5 | |
| Average of class Multimedia (440 - 2022, n=59, last 2 years) | |
| MSI Creator Z17 A12UGST-054 | |
| Average Intel Core i9-12900H (449 - 1193, n=28) | |
| Asus ROG Zephyrus Duo 16 GX650RX | |
| Lenovo ThinkBook 16p G3 ARH | |
| AIDA64 / FP64 Ray-Trace | |
| Asus ProArt StudioBook 16 H7600ZW | |
| Asus ROG Zephyrus Duo 16 GX650RX | |
| Average of class Multimedia (2759 - 26875, n=59, last 2 years) | |
| Lenovo ThinkBook 16p G3 ARH | |
| Asus ZenBook Pro 16X OLED UX7602ZM-ME115W | |
| Average Intel Core i9-12900H (2235 - 10511, n=28) | |
| Asus ROG Strix Scar 15 G533ZW-LN106WS | |
| MSI Creator Z16P B12UHST | |
| Gigabyte Aero 16 YE5 | |
| MSI Creator Z17 A12UGST-054 | |
| AIDA64 / CPU PhotoWorxx | |
| Asus ZenBook Pro 16X OLED UX7602ZM-ME115W | |
| Average of class Multimedia (12860 - 65787, n=59, last 2 years) | |
| Asus ProArt StudioBook 16 H7600ZW | |
| MSI Creator Z16P B12UHST | |
| Asus ROG Strix Scar 15 G533ZW-LN106WS | |
| MSI Creator Z17 A12UGST-054 | |
| Gigabyte Aero 16 YE5 | |
| Average Intel Core i9-12900H (20960 - 48269, n=29) | |
| Asus ROG Zephyrus Duo 16 GX650RX | |
| Lenovo ThinkBook 16p G3 ARH | |
Check out our dedicated Intel Core i9-12900H page for more information and performance comparisons.
System Performance
The ProArt StudioBook 16 poses no issues with everyday system performance and responsiveness. Overall PCMark 10 scores are on expected lines for this configuration.
CrossMark sees a slight setback when compared to the likes of the Asus ROG Strix Scar 15 and the MSI Creator Z17, but the StudioBook 16 is about 17% faster than an M1 Max MacBook Pro 14 and 22% faster than an M1 Pro MacBook Pro 16.
Affinity Photo 2, however, sees Apple silicon being significantly ahead of the Core i9-12900H. The ProArt StudioBook 16 trails by 14% in the combined CPU test and by up to 55% in the combined GPU test against the M1 Max-based MacBook Pro 14.
CrossMark: Overall | Productivity | Creativity | Responsiveness
Affinity Photo 2: Combined (Multi CPU) | Combined (Single / Multi GPU)
| PCMark 10 / Score | |
| MSI Creator Z16P B12UHST | |
| Asus ProArt StudioBook 16 H7600ZW | |
| Asus ROG Strix Scar 15 G533ZW-LN106WS | |
| Gigabyte Aero 16 YE5 | |
| Average Intel Core i9-12900H, NVIDIA GeForce RTX 3070 Ti Laptop GPU (7087 - 8072, n=6) | |
| Asus ZenBook Pro 16X OLED UX7602ZM-ME115W | |
| MSI Creator Z17 A12UGST-054 | |
| Average of class Multimedia (4325 - 8670, n=56, last 2 years) | |
| Lenovo ThinkBook 16p G3 ARH | |
| Asus ROG Zephyrus Duo 16 GX650RX | |
| PCMark 10 / Essentials | |
| Asus ProArt StudioBook 16 H7600ZW | |
| MSI Creator Z16P B12UHST | |
| Asus ZenBook Pro 16X OLED UX7602ZM-ME115W | |
| Gigabyte Aero 16 YE5 | |
| Average Intel Core i9-12900H, NVIDIA GeForce RTX 3070 Ti Laptop GPU (10266 - 11663, n=6) | |
| Asus ROG Strix Scar 15 G533ZW-LN106WS | |
| Average of class Multimedia (8025 - 12420, n=56, last 2 years) | |
| MSI Creator Z17 A12UGST-054 | |
| Lenovo ThinkBook 16p G3 ARH | |
| Asus ROG Zephyrus Duo 16 GX650RX | |
| PCMark 10 / Productivity | |
| MSI Creator Z16P B12UHST | |
| Asus ProArt StudioBook 16 H7600ZW | |
| Asus ROG Strix Scar 15 G533ZW-LN106WS | |
| Average Intel Core i9-12900H, NVIDIA GeForce RTX 3070 Ti Laptop GPU (9402 - 10742, n=6) | |
| Asus ZenBook Pro 16X OLED UX7602ZM-ME115W | |
| Gigabyte Aero 16 YE5 | |
| MSI Creator Z17 A12UGST-054 | |
| Lenovo ThinkBook 16p G3 ARH | |
| Average of class Multimedia (6763 - 10615, n=56, last 2 years) | |
| Asus ROG Zephyrus Duo 16 GX650RX | |
| PCMark 10 / Digital Content Creation | |
| Asus ROG Strix Scar 15 G533ZW-LN106WS | |
| Gigabyte Aero 16 YE5 | |
| MSI Creator Z16P B12UHST | |
| Asus ProArt StudioBook 16 H7600ZW | |
| Average Intel Core i9-12900H, NVIDIA GeForce RTX 3070 Ti Laptop GPU (10009 - 12541, n=6) | |
| Asus ZenBook Pro 16X OLED UX7602ZM-ME115W | |
| MSI Creator Z17 A12UGST-054 | |
| Asus ROG Zephyrus Duo 16 GX650RX | |
| Average of class Multimedia (3651 - 15187, n=56, last 2 years) | |
| Lenovo ThinkBook 16p G3 ARH | |
| CrossMark / Overall | |
| Gigabyte Aero 16 YE5 | |
| Asus ROG Strix Scar 15 G533ZW-LN106WS | |
| MSI Creator Z17 A12UGST-054 | |
| Asus ProArt StudioBook 16 H7600ZW | |
| Average Intel Core i9-12900H, NVIDIA GeForce RTX 3070 Ti Laptop GPU (1664 - 2044, n=6) | |
| Asus ZenBook Pro 16X OLED UX7602ZM-ME115W | |
| Average of class Multimedia (866 - 2255, n=66, last 2 years) | |
| Asus ROG Zephyrus Duo 16 GX650RX | |
| Apple MacBook Pro 14 2021 M1 Max 24-Core GPU | |
| Apple MacBook Pro 16 2021 M1 Pro | |
| Lenovo ThinkBook 16p G3 ARH | |
| CrossMark / Productivity | |
| Gigabyte Aero 16 YE5 | |
| Asus ROG Strix Scar 15 G533ZW-LN106WS | |
| MSI Creator Z17 A12UGST-054 | |
| Asus ProArt StudioBook 16 H7600ZW | |
| Average Intel Core i9-12900H, NVIDIA GeForce RTX 3070 Ti Laptop GPU (1591 - 1968, n=6) | |
| Asus ROG Zephyrus Duo 16 GX650RX | |
| Asus ZenBook Pro 16X OLED UX7602ZM-ME115W | |
| Average of class Multimedia (913 - 2050, n=66, last 2 years) | |
| Lenovo ThinkBook 16p G3 ARH | |
| Apple MacBook Pro 14 2021 M1 Max 24-Core GPU | |
| Apple MacBook Pro 16 2021 M1 Pro | |
| CrossMark / Creativity | |
| Gigabyte Aero 16 YE5 | |
| Apple MacBook Pro 14 2021 M1 Max 24-Core GPU | |
| MSI Creator Z17 A12UGST-054 | |
| Asus ROG Strix Scar 15 G533ZW-LN106WS | |
| Asus ProArt StudioBook 16 H7600ZW | |
| Apple MacBook Pro 16 2021 M1 Pro | |
| Asus ZenBook Pro 16X OLED UX7602ZM-ME115W | |
| Average Intel Core i9-12900H, NVIDIA GeForce RTX 3070 Ti Laptop GPU (1797 - 2148, n=6) | |
| Average of class Multimedia (907 - 2795, n=66, last 2 years) | |
| Asus ROG Zephyrus Duo 16 GX650RX | |
| Lenovo ThinkBook 16p G3 ARH | |
| CrossMark / Responsiveness | |
| Gigabyte Aero 16 YE5 | |
| Asus ROG Strix Scar 15 G533ZW-LN106WS | |
| MSI Creator Z17 A12UGST-054 | |
| Average Intel Core i9-12900H, NVIDIA GeForce RTX 3070 Ti Laptop GPU (1514 - 2069, n=6) | |
| Asus ROG Zephyrus Duo 16 GX650RX | |
| Asus ProArt StudioBook 16 H7600ZW | |
| Asus ZenBook Pro 16X OLED UX7602ZM-ME115W | |
| Average of class Multimedia (605 - 2094, n=66, last 2 years) | |
| Lenovo ThinkBook 16p G3 ARH | |
| Apple MacBook Pro 14 2021 M1 Max 24-Core GPU | |
| Apple MacBook Pro 16 2021 M1 Pro | |
| Affinity Photo 2 / Combined (Multi CPU) | |
| Apple MacBook Pro 16 2021 M1 Pro | |
| Apple MacBook Pro 14 2021 M1 Max 24-Core GPU | |
| Asus ProArt StudioBook 16 H7600ZW | |
| Average Intel Core i9-12900H, NVIDIA GeForce RTX 3070 Ti Laptop GPU (n=1) | |
| Affinity Photo 2 / Combined (Single / Multi GPU) | |
| Apple MacBook Pro 14 2021 M1 Max 24-Core GPU | |
| Apple MacBook Pro 16 2021 M1 Pro | |
| Asus ProArt StudioBook 16 H7600ZW | |
| Average Intel Core i9-12900H, NVIDIA GeForce RTX 3070 Ti Laptop GPU (n=1) | |
| PCMark 8 Home Score Accelerated v2 | 5440 points | |
| PCMark 8 Work Score Accelerated v2 | 5380 points | |
| PCMark 10 Score | 8072 points | |
Help | ||
| AIDA64 / Memory Copy | |
| Average of class Multimedia (21158 - 108302, n=59, last 2 years) | |
| Asus ZenBook Pro 16X OLED UX7602ZM-ME115W | |
| MSI Creator Z16P B12UHST | |
| Gigabyte Aero 16 YE5 | |
| Asus ProArt StudioBook 16 H7600ZW | |
| MSI Creator Z17 A12UGST-054 | |
| Asus ROG Strix Scar 15 G533ZW-LN106WS | |
| Average Intel Core i9-12900H (34438 - 74264, n=28) | |
| Asus ROG Zephyrus Duo 16 GX650RX | |
| Lenovo ThinkBook 16p G3 ARH | |
| AIDA64 / Memory Read | |
| Average of class Multimedia (24312 - 125604, n=59, last 2 years) | |
| Asus ZenBook Pro 16X OLED UX7602ZM-ME115W | |
| MSI Creator Z16P B12UHST | |
| Asus ProArt StudioBook 16 H7600ZW | |
| Gigabyte Aero 16 YE5 | |
| MSI Creator Z17 A12UGST-054 | |
| Asus ROG Strix Scar 15 G533ZW-LN106WS | |
| Average Intel Core i9-12900H (36365 - 74642, n=28) | |
| Asus ROG Zephyrus Duo 16 GX650RX | |
| Lenovo ThinkBook 16p G3 ARH | |
| AIDA64 / Memory Write | |
| Average of class Multimedia (24382 - 117933, n=59, last 2 years) | |
| Asus ROG Strix Scar 15 G533ZW-LN106WS | |
| MSI Creator Z16P B12UHST | |
| MSI Creator Z17 A12UGST-054 | |
| Asus ProArt StudioBook 16 H7600ZW | |
| Asus ZenBook Pro 16X OLED UX7602ZM-ME115W | |
| Gigabyte Aero 16 YE5 | |
| Average Intel Core i9-12900H (32276 - 67858, n=28) | |
| Asus ROG Zephyrus Duo 16 GX650RX | |
| Lenovo ThinkBook 16p G3 ARH | |
| AIDA64 / Memory Latency | |
| Lenovo ThinkBook 16p G3 ARH | |
| Average of class Multimedia (7 - 346, n=59, last 2 years) | |
| Asus ZenBook Pro 16X OLED UX7602ZM-ME115W | |
| Asus ROG Strix Scar 15 G533ZW-LN106WS | |
| MSI Creator Z16P B12UHST | |
| MSI Creator Z17 A12UGST-054 | |
| Asus ROG Zephyrus Duo 16 GX650RX | |
| Gigabyte Aero 16 YE5 | |
| Asus ProArt StudioBook 16 H7600ZW | |
| Average Intel Core i9-12900H (74.7 - 118.1, n=27) | |
* ... smaller is better
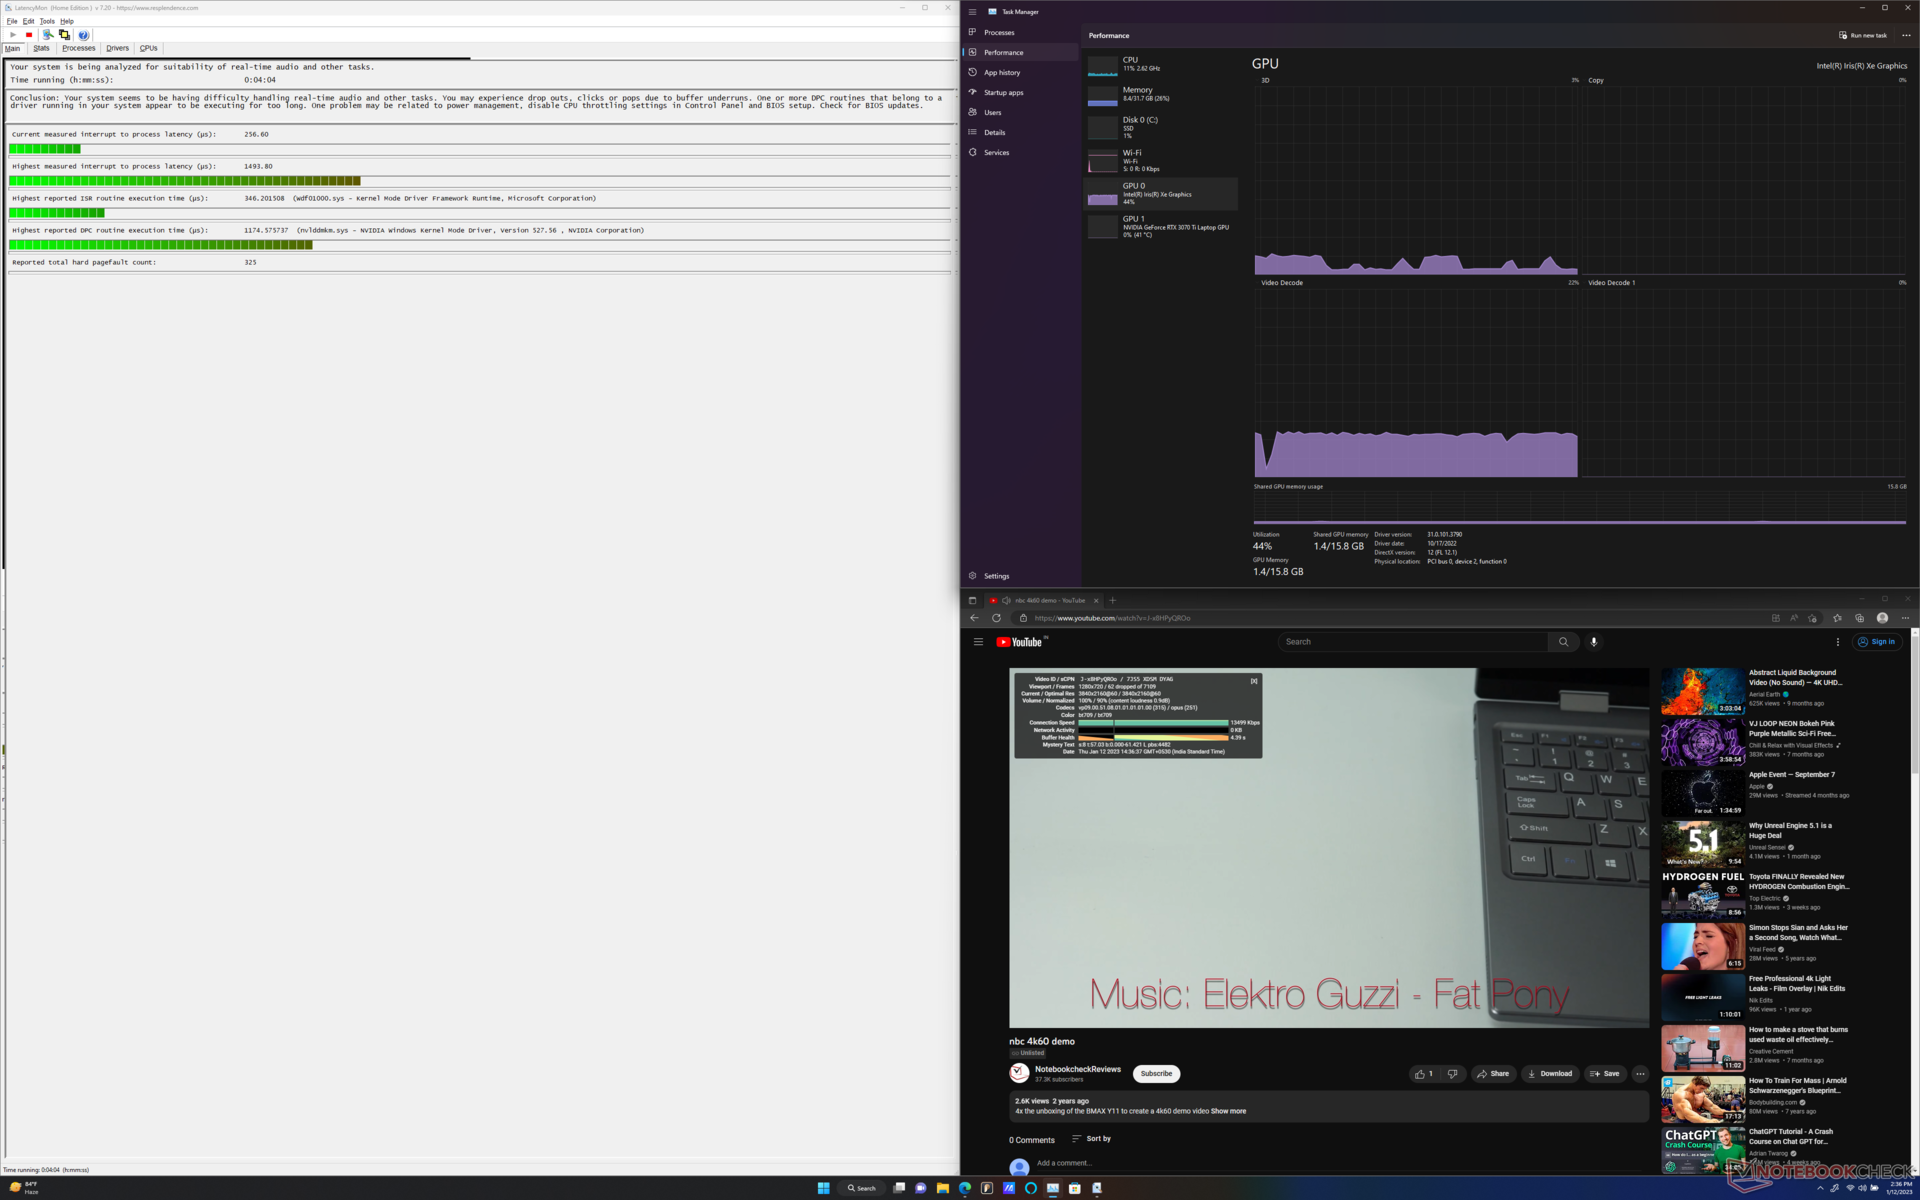
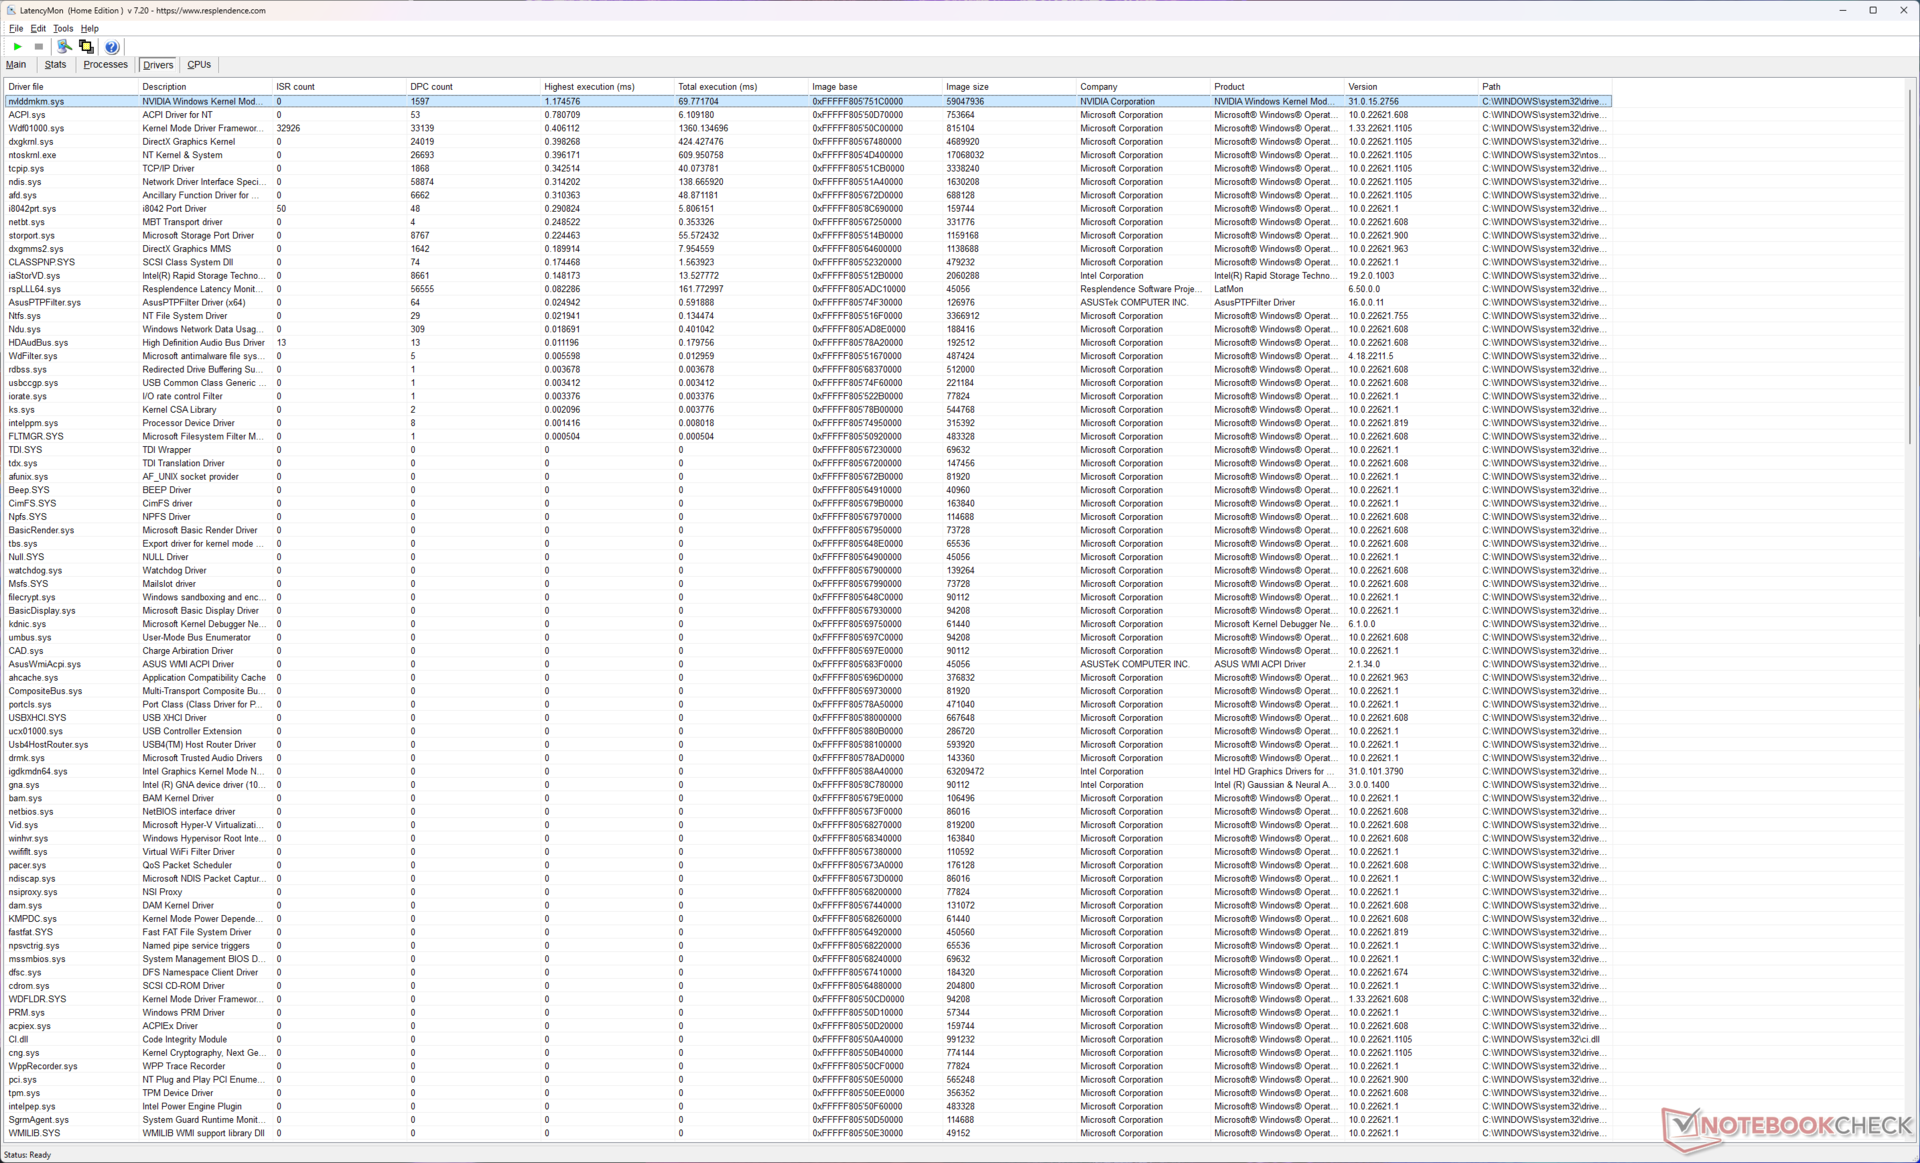
DPC Latency
We measured the highest interrupt to process latency to be 1493.8 µs, which is on the higher side for a content creator-focused laptop. The Nvidia kernel mode system driver seems to be the reason for the increased latency.
| DPC Latencies / LatencyMon - interrupt to process latency (max), Web, Youtube, Prime95 | |
| Lenovo ThinkBook 16p G3 ARH | |
| MSI Creator Z17 A12UGST-054 | |
| Asus ProArt StudioBook 16 H7600ZW | |
| Asus ROG Strix Scar 15 G533ZW-LN106WS | |
| MSI Creator Z16P B12UHST | |
| Gigabyte Aero 16 YE5 | |
| Asus ROG Zephyrus Duo 16 GX650RX | |
| Asus ZenBook Pro 16X OLED UX7602ZM-ME115W | |
* ... smaller is better
Our DPC Latency Ranking page provides more latency comparisons across reviewed devices.
Storage Devices
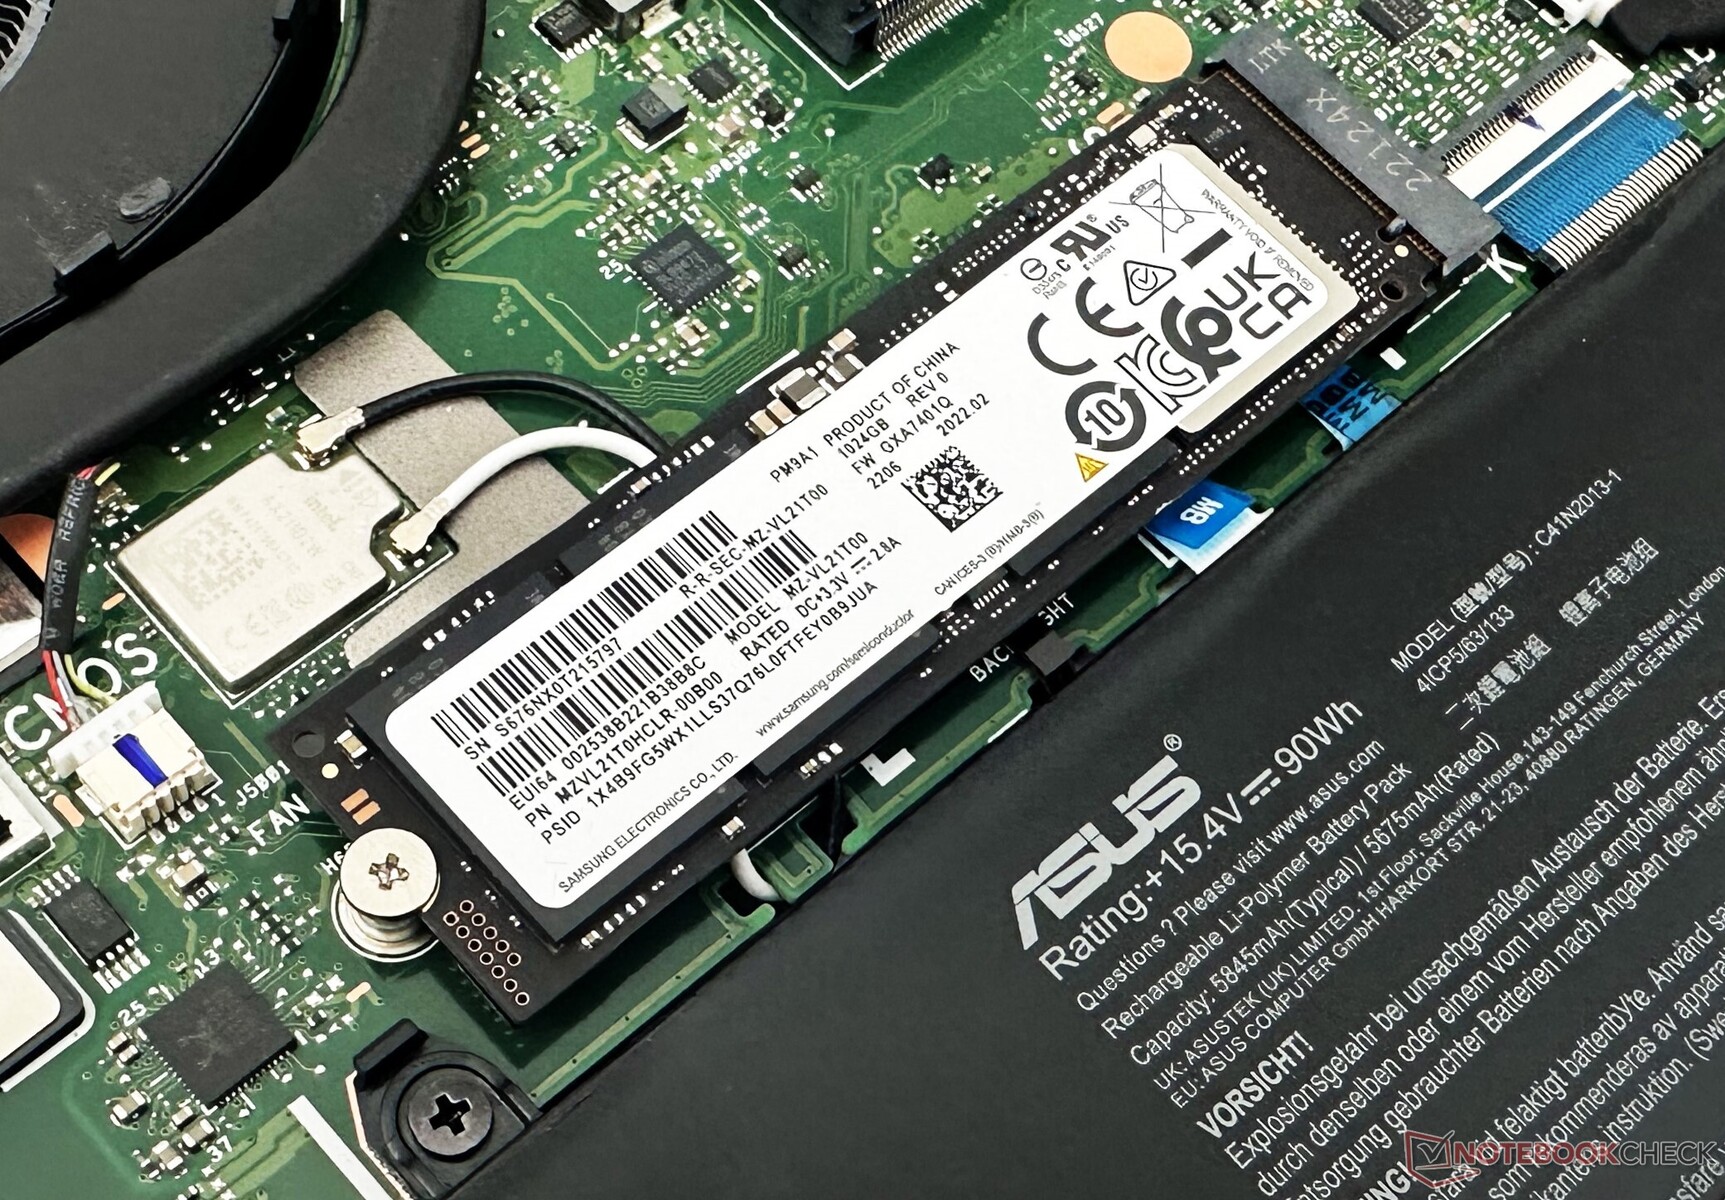
The included Samsung PM9A1 1 TB NVMe SSD performs decently in overall disk benchmarks, but it trails behind its 2 TB cousins found in the ROG Strix Scar 15 and the Creator Z16P. It is still 10% faster than the same drive found in the Asus ZenBook Pro 16X OLED.
The SSD is enclosed in an aluminum wrapper and the back panel has thermal padding as well. However, the drive throttles severely in our DiskSpd read loop test at a queue depth of 8.
A spare M.2 2280 slot is available for adding another NVMe drive. There is no 2.5-inch drive bay, however.

* ... smaller is better
Disk Throttling: DiskSpd Read Loop, Queue Depth 8
Refer to our SSD and HDD Benchmarks page for more storage comparisons.
GPU Performance
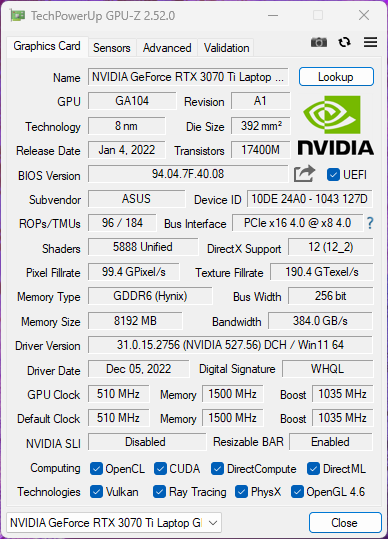
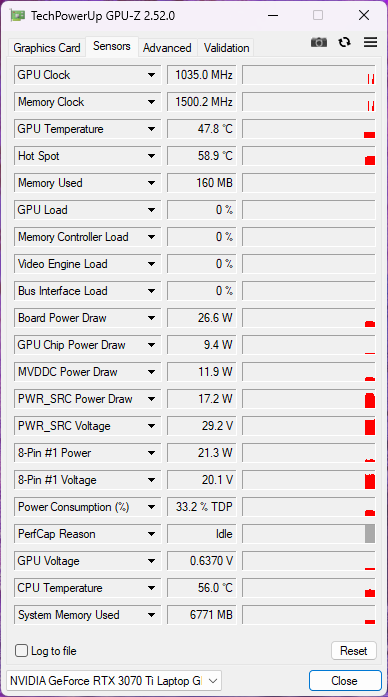
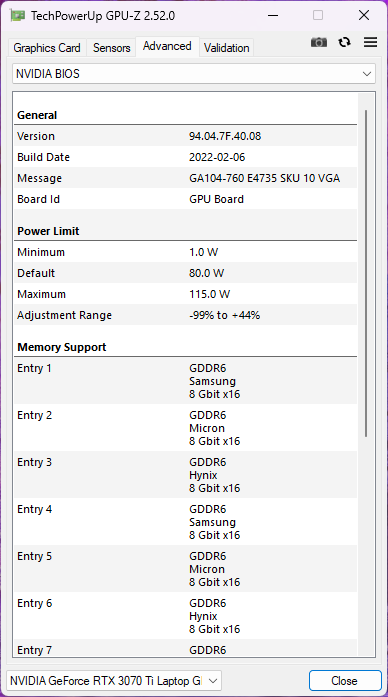
Our ProArt StudioBook 16 unit came equipped with a 115 W Nvidia GeForce RTX 3070 Ti Laptop GPU with 8 GB GDDR6 VRAM. Asus does not specify the Dynamic Boost values for this GPU. The laptop uses Nvidia Studio Drivers by default.
The lower TGP means that the ProArt StudioBook 16 is 15% slower in overall 3DMark performance compared to the ROG Strix Scar 15 that uses a 150 W RTX 3070 Ti. However, it is still 8% faster than a 105 W RTX 3080 Ti Laptop GPU in the Gigabyte Aero 16 YE5.
| 3DMark 11 Performance | 32806 points | |
| 3DMark Ice Storm Standard Score | 75692 points | |
| 3DMark Cloud Gate Standard Score | 49147 points | |
| 3DMark Fire Strike Score | 23989 points | |
| 3DMark Fire Strike Extreme Score | 12966 points | |
| 3DMark Time Spy Score | 10673 points | |
Help | ||
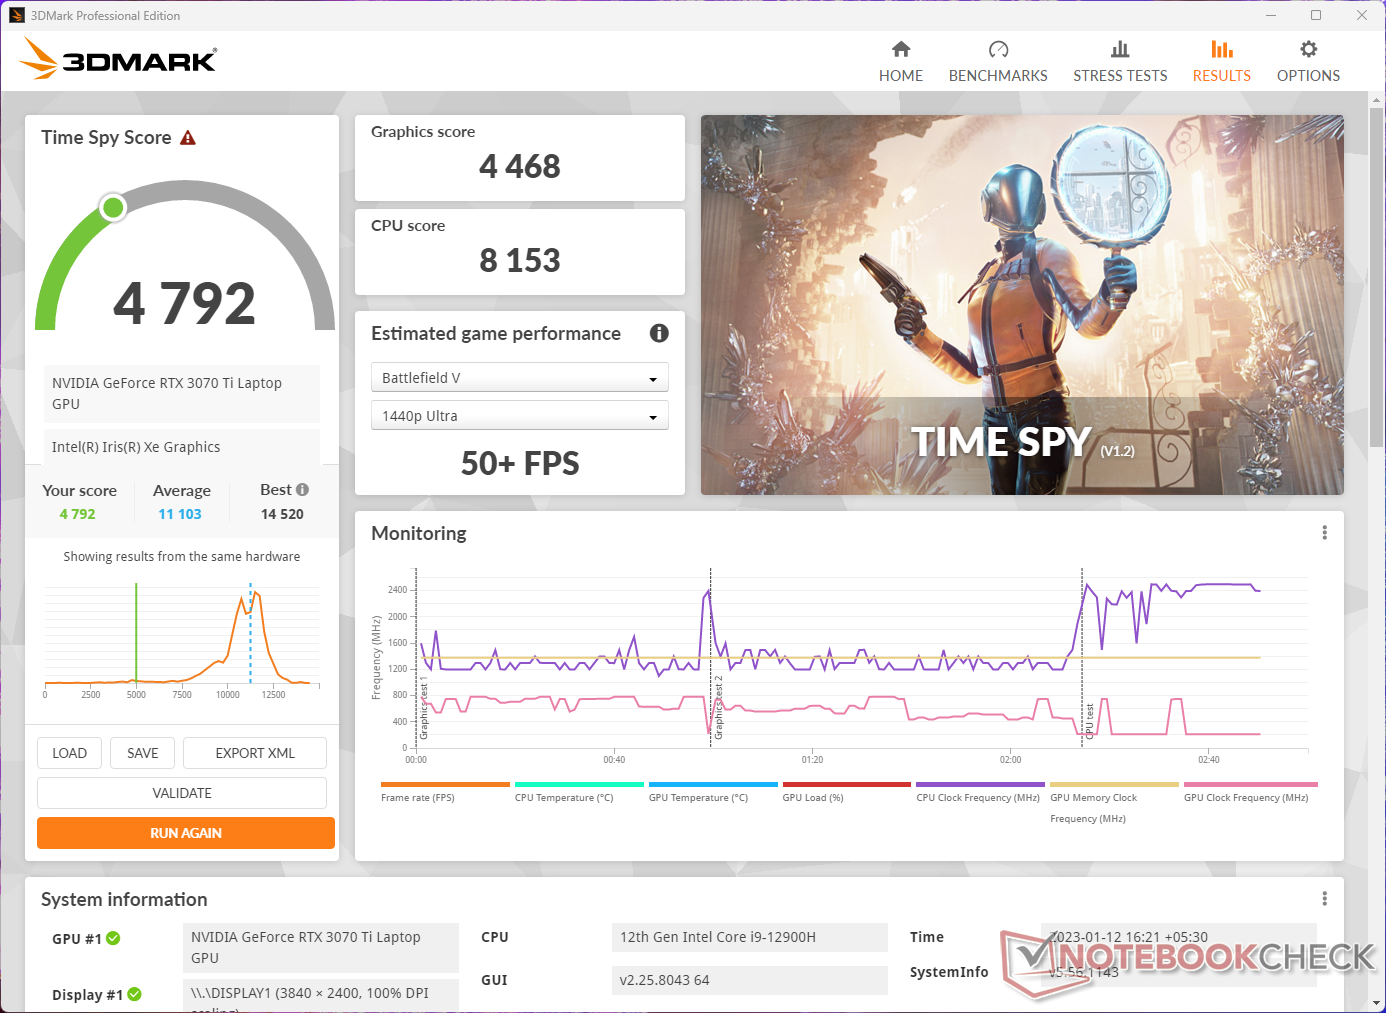
3DMark Time Spy scores drop by 56% on battery. According to the benchmark, this should still enable 50+ fps gameplay at 1440p in Battlefield V.
Compared to RTX 3060-based laptops, the StudioBook 16's RTX 3070 Ti shows significant advantages in Blender tests — the RTX 3060 Laptop GPU is up to 23% and 35% slower in Blender Optix and CUDA tests, respectively.
* ... smaller is better
Gaming Performance
Asus doesn't market the ProArt StudioBook 16 as a gaming laptop, but the provided hardware is certainly capable of running modern games at decent framerates. The cumulative gaming performance is as expected for a device with this configuration but is still about 9% faster overall compared to the MSI Creator Z17.
It even trumps some of the RTX 3080 Ti-powered laptops in the comparison by a perceivable margin. However, note that this inference is valid only at 1080p where game performance is more CPU-limited.
At higher resolutions and in ray tracing, the advantages of the RTX 3080 Ti Laptop GPU become clearly evident. However, the difference between these two GPUs is just within 10% in most cases when it comes to raster performance.
| The Witcher 3 | |
| 3840x2160 High Graphics & Postprocessing (Nvidia HairWorks Off) | |
| Asus ROG Zephyrus Duo 16 GX650RX | |
| Asus ROG Strix Scar 15 G533ZW-LN106WS | |
| Average NVIDIA GeForce RTX 3070 Ti Laptop GPU (73.2 - 78, n=2) | |
| Asus ProArt StudioBook 16 H7600ZW | |
| Gigabyte Aero 16 YE5 | |
| Average of class Multimedia (43 - 71, n=4, last 2 years) | |
| Asus ZenBook Pro 16X OLED UX7602ZM-ME115W | |
| 3840x2160 Ultra Graphics & Postprocessing (HBAO+) | |
| Asus ROG Zephyrus Duo 16 GX650RX | |
| Asus ROG Strix Scar 15 G533ZW-LN106WS | |
| Average NVIDIA GeForce RTX 3070 Ti Laptop GPU (48.4 - 52.3, n=2) | |
| Asus ProArt StudioBook 16 H7600ZW | |
| Gigabyte Aero 16 YE5 | |
| Average of class Multimedia (n=1last 2 years) | |
The Witcher 3 FPS Chart
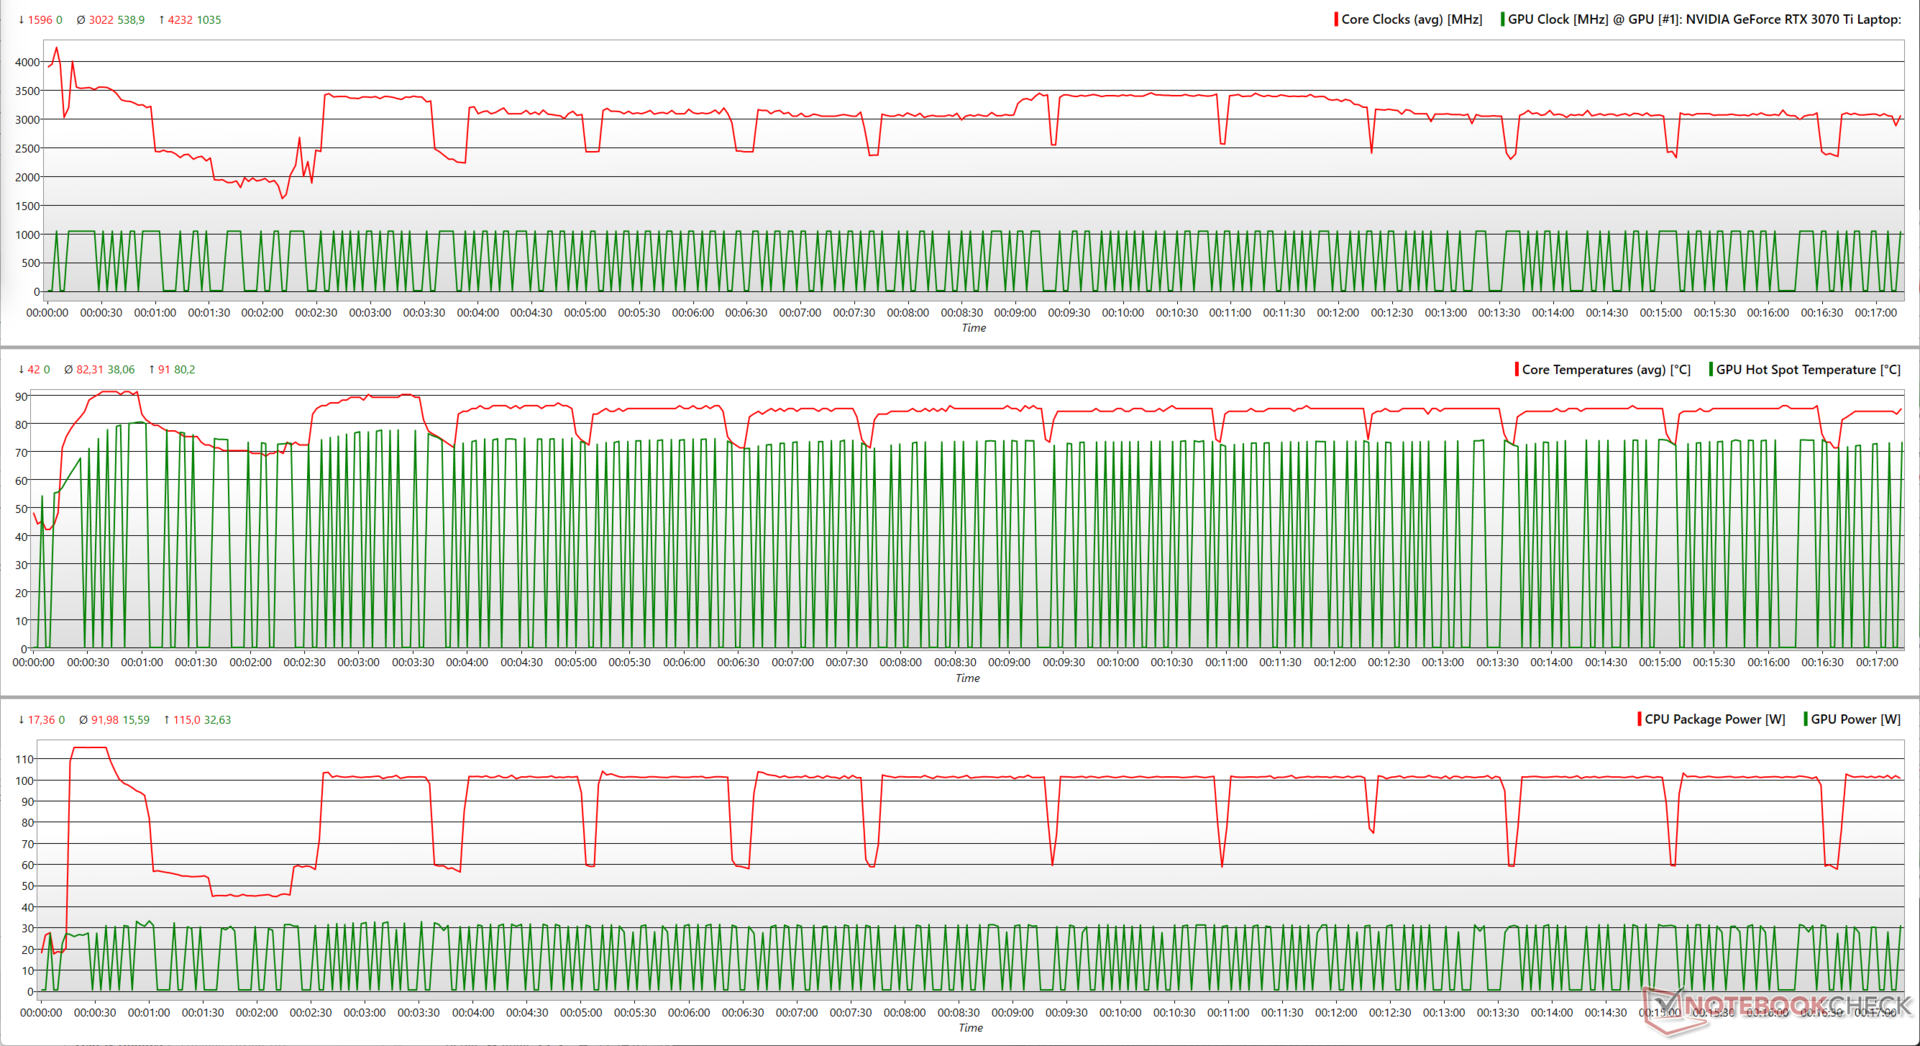
Thanks to Asus's excellent cooling, we see no perceivable frame drops while stressing with The Witcher 3 at 1080p Ultra.
| low | med. | high | ultra | QHD | 4K | |
|---|---|---|---|---|---|---|
| GTA V (2015) | 187.2 | 186.4 | 181.9 | 122.2 | 97.6 | 92.1 |
| The Witcher 3 (2015) | 428 | 316 | 195.9 | 105.6 | 73.2 | |
| Dota 2 Reborn (2015) | 190.6 | 174.7 | 165.6 | 159.2 | 122.6 | |
| Final Fantasy XV Benchmark (2018) | 211 | 140.1 | 106.9 | 81.1 | 46.2 | |
| X-Plane 11.11 (2018) | 155 | 136.1 | 108.4 | 91.3 | ||
| Far Cry 5 (2018) | 182 | 154 | 145 | 137 | 104 | 57 |
| Strange Brigade (2018) | 460 | 257 | 209 | 183.8 | 136.9 | 74.4 |
| F1 2021 (2021) | 371 | 252 | 208 | 119.8 | 93.5 | 53.5 |
| Cyberpunk 2077 1.6 (2022) | 124.5 | 100.3 | 87.4 | 81.3 | 51 | 28.1 |
Emissions: Less than 35 dB(A) fan noise in the Standard profile
System Noise
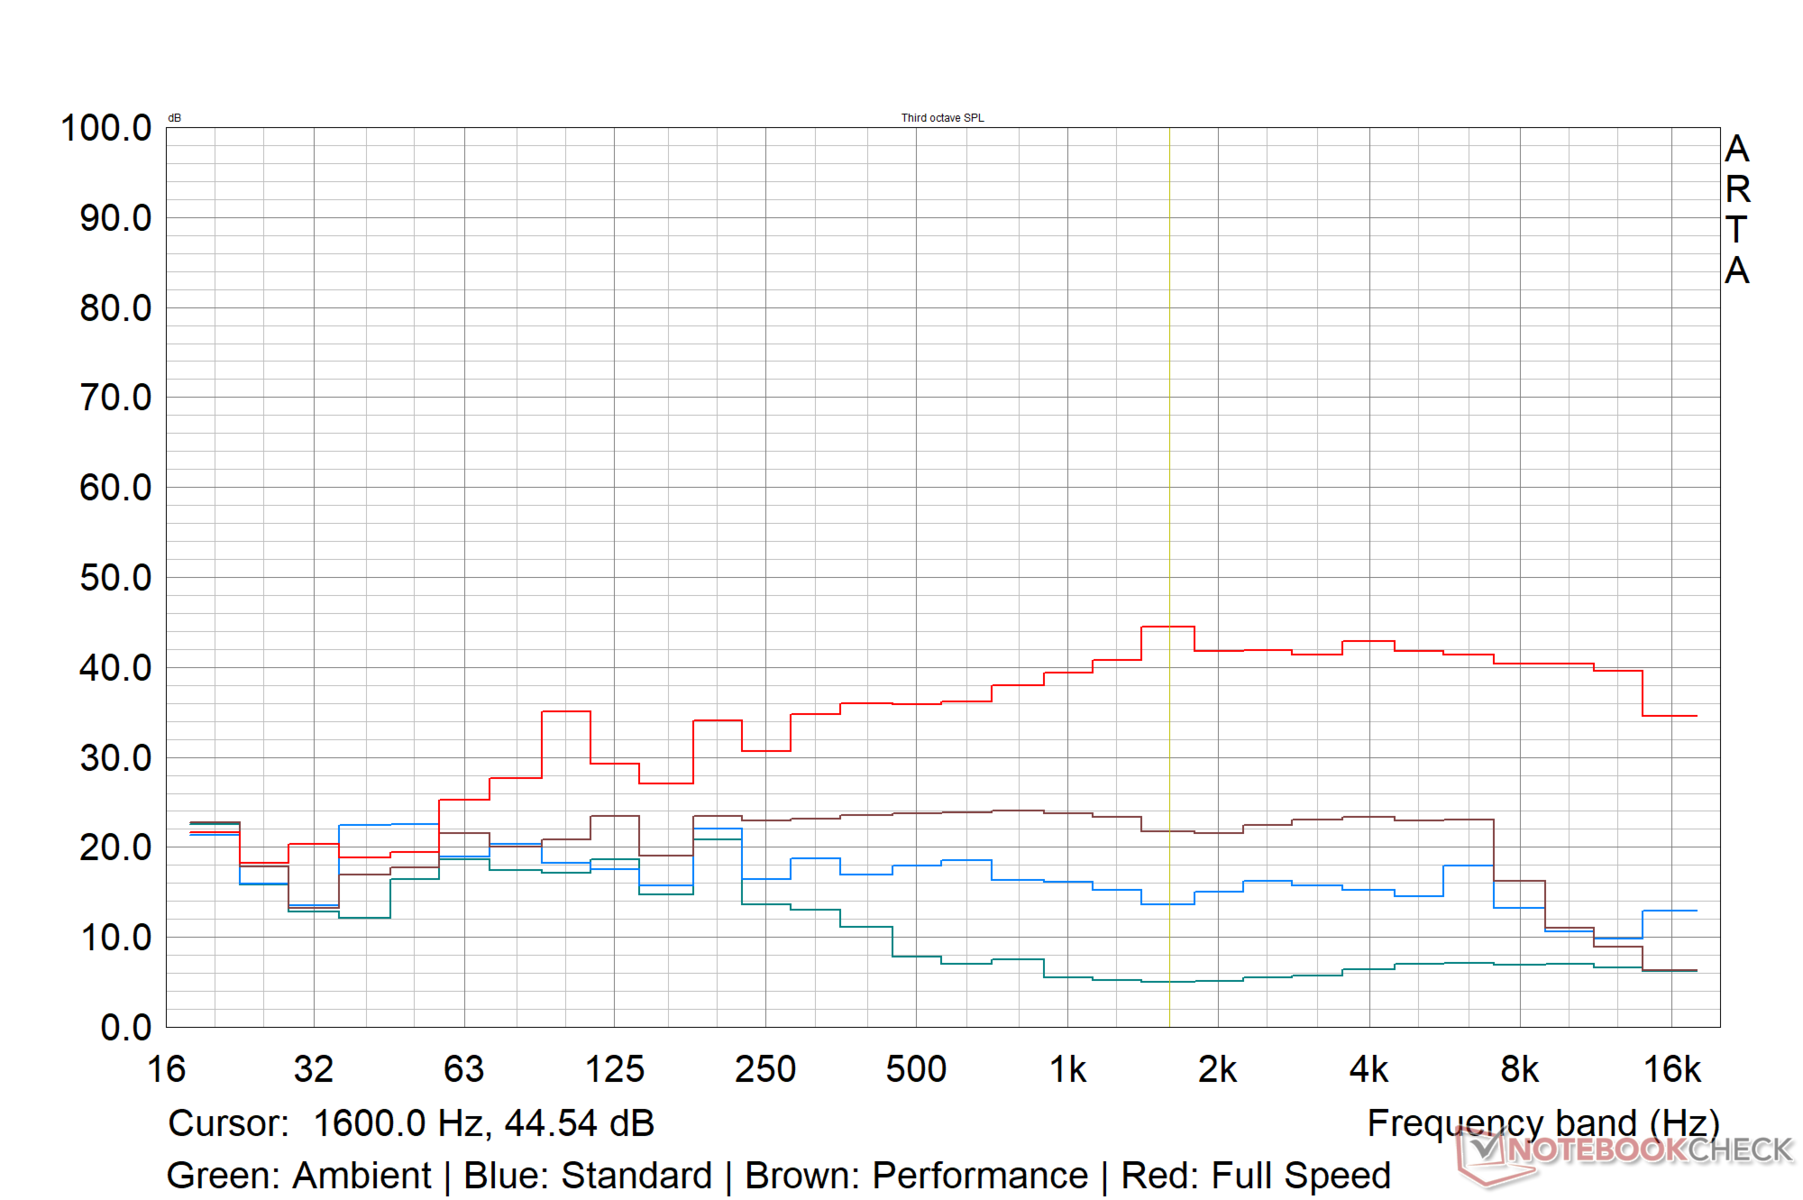
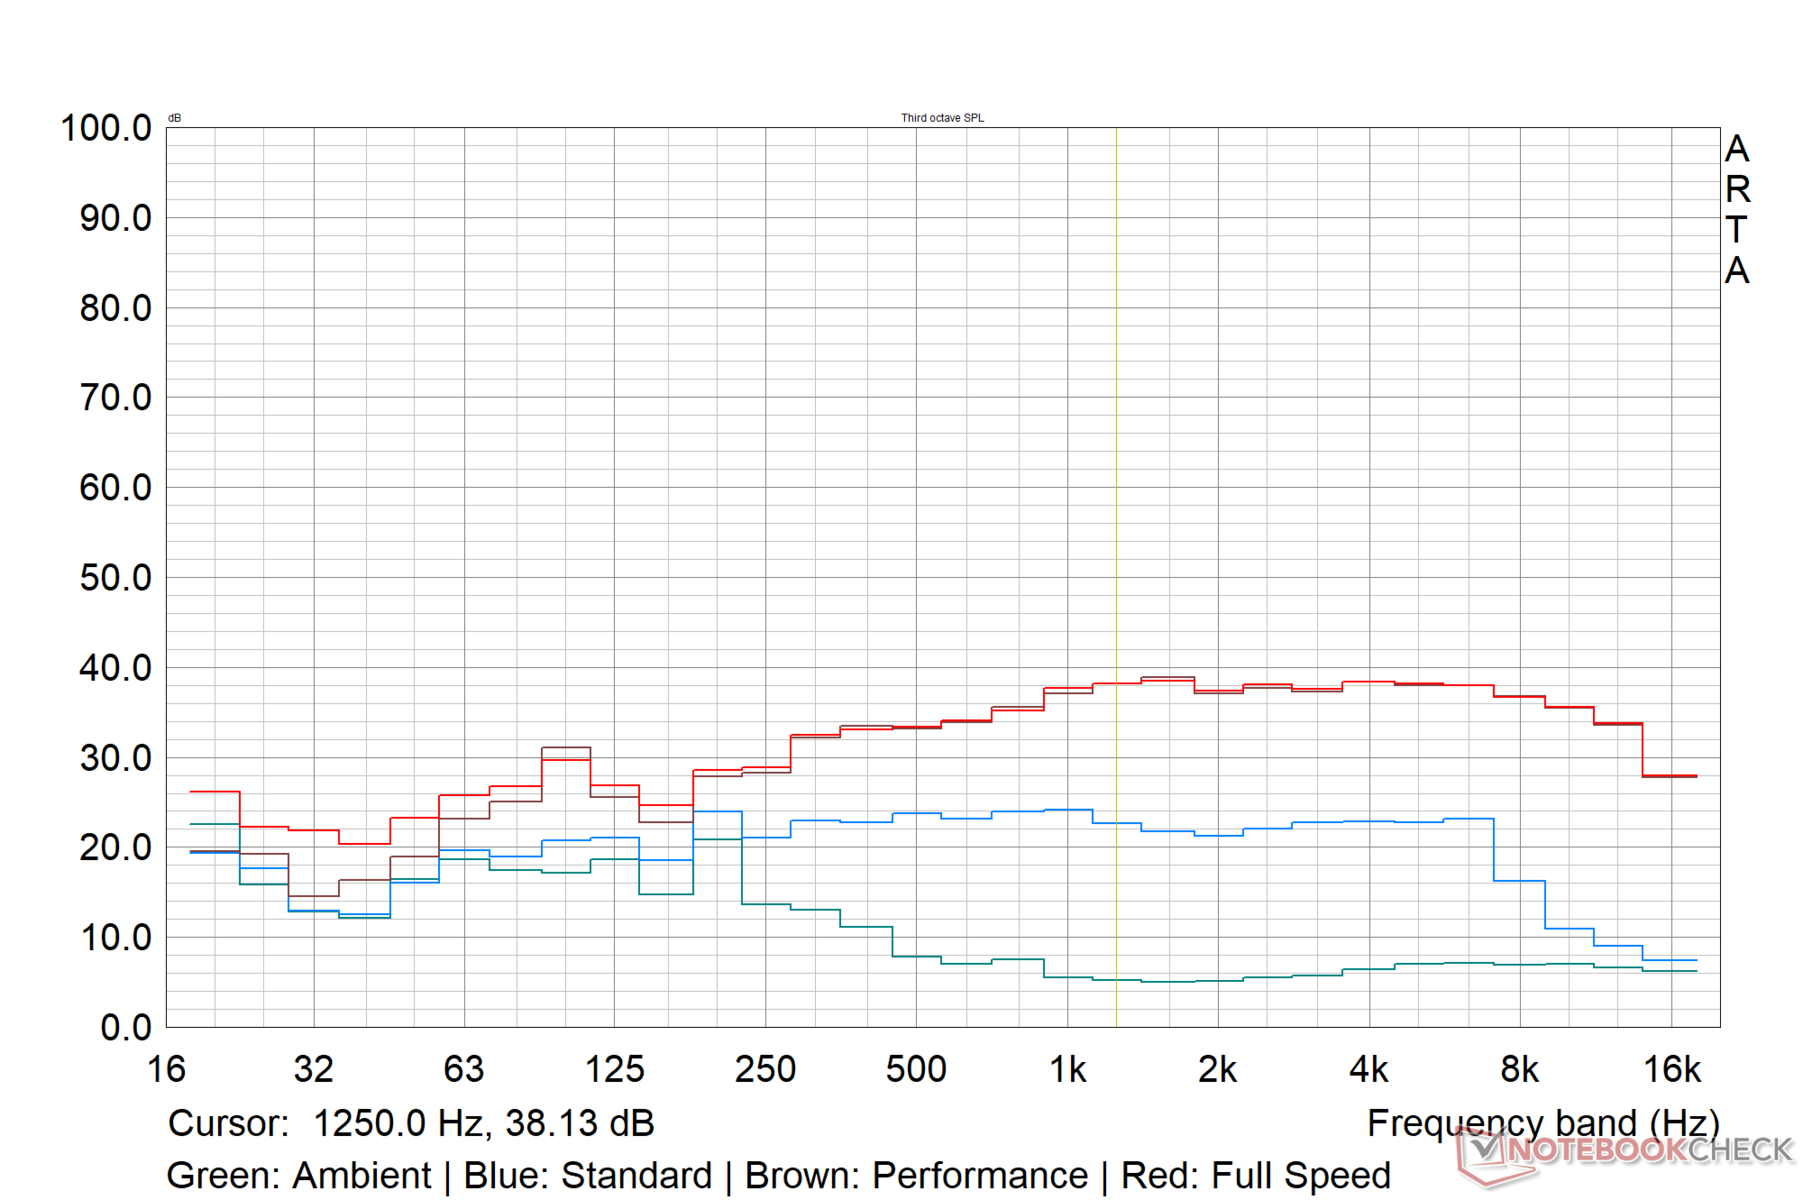
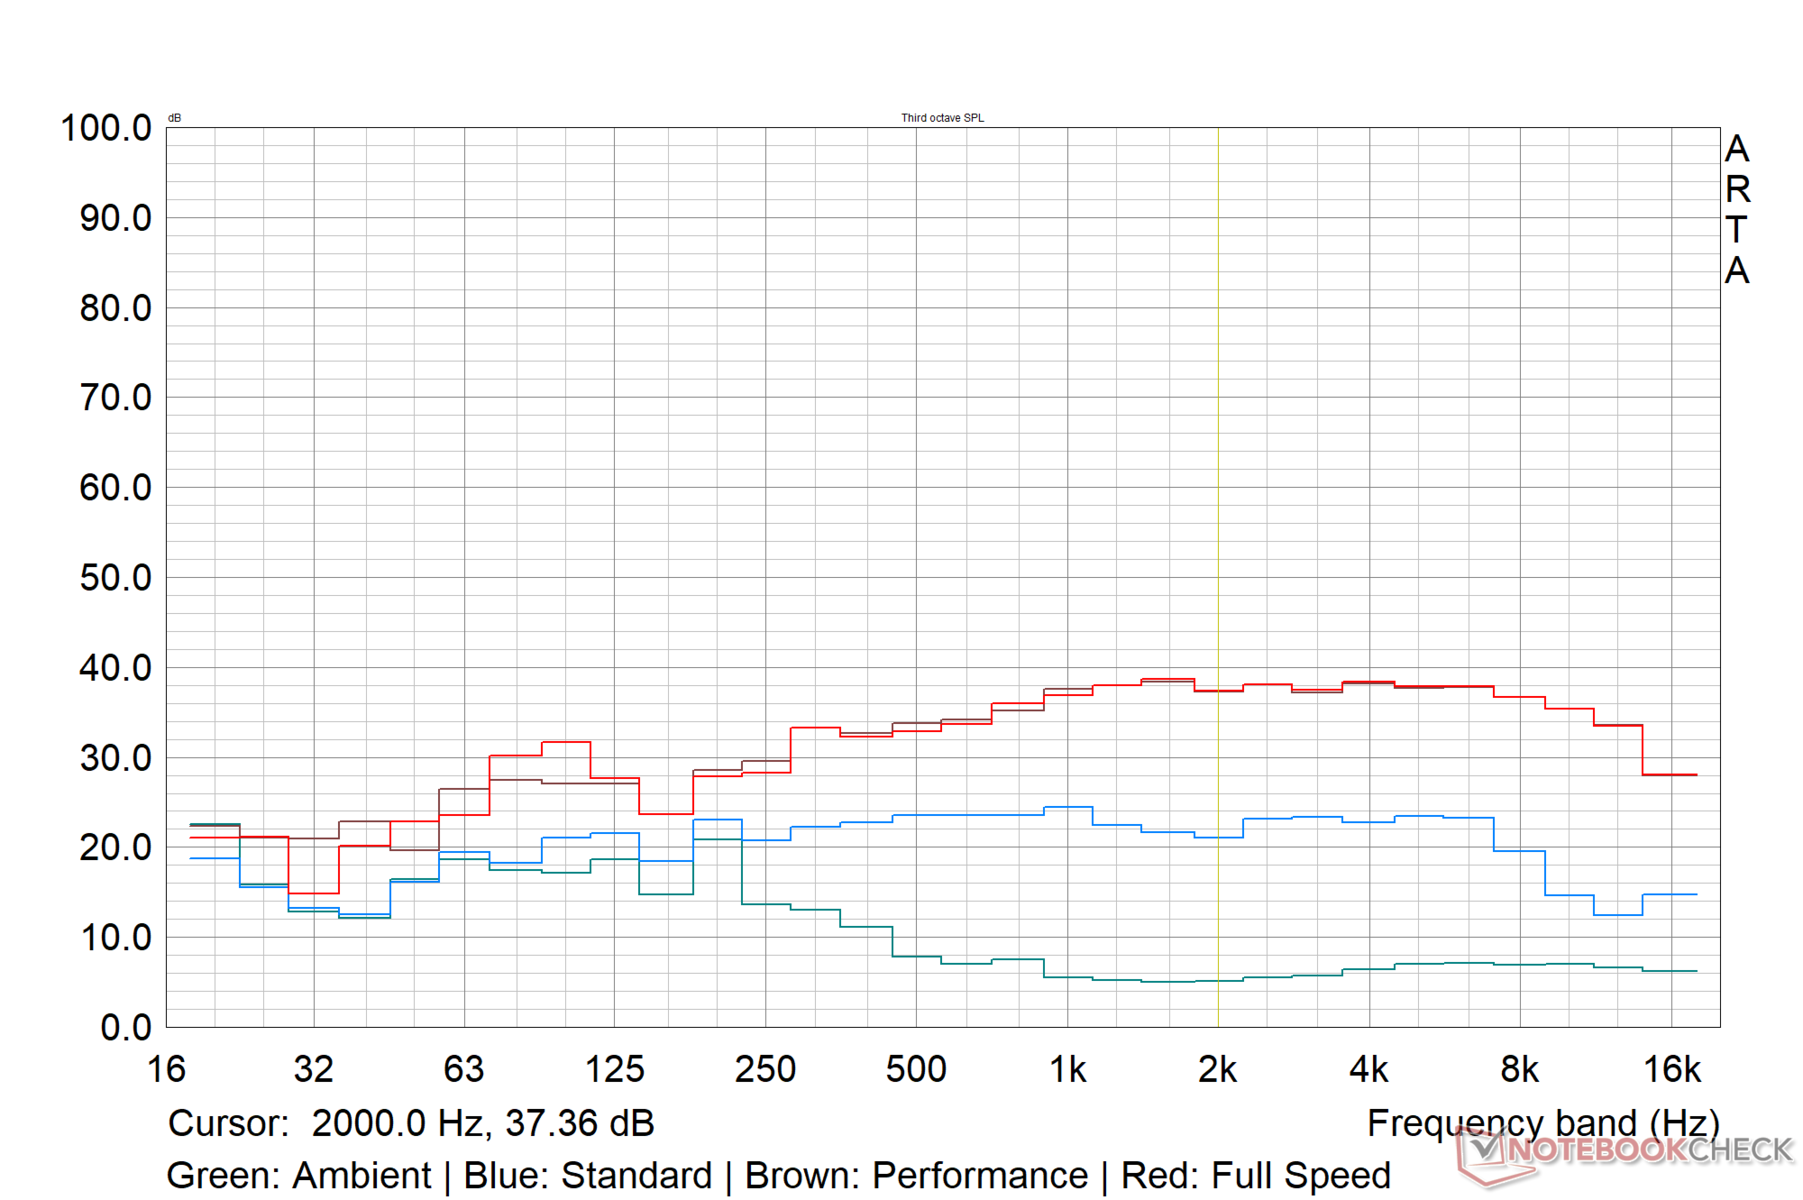
In the Full Speed setting, the fan noise sound pressure level (SPL) is between 50 dB(A) and 53 dB(A) even in idle. Therefore, we used the Performance mode for a more realistic evaluation of the StudioBook 16's noise levels.
We recorded a 49 dB(A) SPL while running The Witcher 3 at 1080p Ultra and in a combined stress of Prime95 and FurMark.
Asus claims a <40 dB(A) noise level in the Standard mode, and we found that to be true. The maximum noise level remains under 35 dB(A) in the Standard profile under all test conditions.
While the Standard profile can be generally recommended for non-intensive use, you will not be getting maximum performance here — we observed a 24% performance drop in Cinebench R15 multi-core score in this mode.
| Performance setting | Idle dB(A) | Load average dB(A) | Load maximum dB(A) | The Witcher 3 dB(A) |
|---|---|---|---|---|
| Standard | 19.54 | 27.84 | 34.31 | 34.60 |
| Performance | 20.07 | 34.53 | 49.21 | 49.14 |
| Full Speed | 53.26 | 53.24 | 49.32 | 49.20 |
Noise level
| Idle |
| 20.07 / 20.07 / 20.07 dB(A) |
| Load |
| 34.53 / 49.21 dB(A) |
 | ||
30 dB silent 40 dB(A) audible 50 dB(A) loud |
||
min: | ||
| Asus ProArt StudioBook 16 H7600ZW i9-12900H, GeForce RTX 3070 Ti Laptop GPU | MSI Creator Z17 A12UGST-054 i9-12900H, GeForce RTX 3070 Ti Laptop GPU | Asus ROG Strix Scar 15 G533ZW-LN106WS i9-12900H, GeForce RTX 3070 Ti Laptop GPU | Asus ROG Zephyrus Duo 16 GX650RX R9 6900HX, GeForce RTX 3080 Ti Laptop GPU | Apple MacBook Pro 14 2021 M1 Max 24-Core GPU M1 Max, M1 Max 24-Core GPU | |
|---|---|---|---|---|---|
| Noise | -41% | -58% | -23% | -9% | |
| off / environment * (dB) | 19.55 | 26 -33% | 26.86 -37% | 26 -33% | 24.8 -27% |
| Idle Minimum * (dB) | 20.07 | 31.8 -58% | 39.07 -95% | 26 -30% | 24.8 -24% |
| Idle Average * (dB) | 20.07 | 31.8 -58% | 39.07 -95% | 27 -35% | 24.8 -24% |
| Idle Maximum * (dB) | 20.07 | 31.8 -58% | 39.07 -95% | 29 -44% | 24.8 -24% |
| Load Average * (dB) | 34.53 | 53.9 -56% | 53.34 -54% | 41 -19% | 30.4 12% |
| Witcher 3 ultra * (dB) | 49.1 | 53.9 -10% | 56.6 -15% | 48 2% | 35.8 27% |
| Load Maximum * (dB) | 49.21 | 54.9 -12% | 56.6 -15% | 50 -2% | 49.5 -1% |
* ... smaller is better
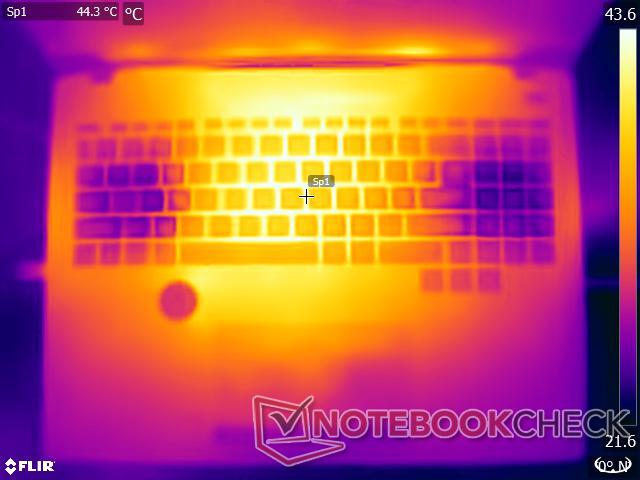
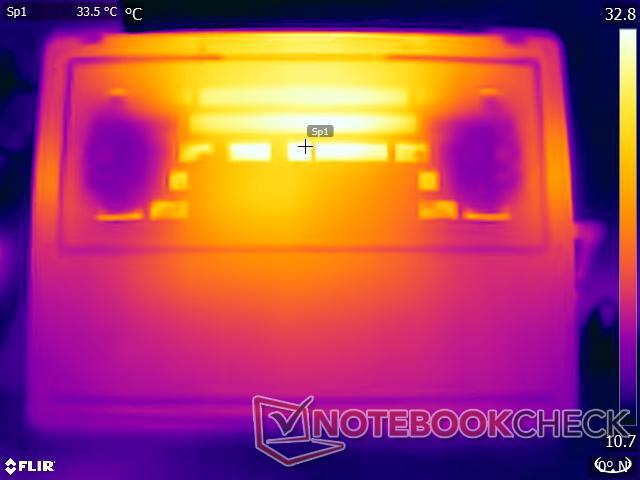
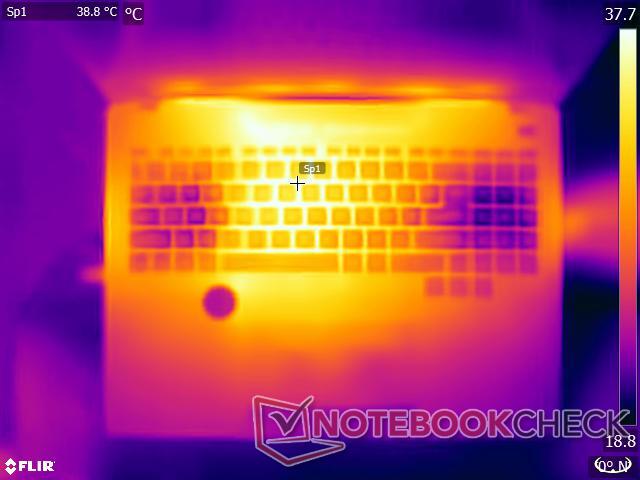
Temperature
The Full Speed mode ensures tolerable surface temperatures under load owing to the continuous fan operation at maximum speed. Higher surface temperatures under load are usually concentrated near the top and middle left regions of the chassis.
Under a combined Prime95 and FurMark load the average top and bottom temperatures seem to be in the 41 °C region. The Witcher 3 at 1080p Ultra sees comparatively lower average surface temperatures at about 34 °C.
The touchpad and palm rest areas get warm under maximum load but otherwise remain relatively cool during The Witcher 3 stress test.
(±) The maximum temperature on the upper side is 41.6 °C / 107 F, compared to the average of 36.9 °C / 98 F, ranging from 21.1 to 71 °C for the class Multimedia.
(±) The bottom heats up to a maximum of 41.4 °C / 107 F, compared to the average of 39.2 °C / 103 F
(+) In idle usage, the average temperature for the upper side is 29.5 °C / 85 F, compared to the device average of 31.3 °C / 88 F.
(±) Playing The Witcher 3, the average temperature for the upper side is 34.2 °C / 94 F, compared to the device average of 31.3 °C / 88 F.
(+) The palmrests and touchpad are reaching skin temperature as a maximum (35.6 °C / 96.1 F) and are therefore not hot.
(-) The average temperature of the palmrest area of similar devices was 28.7 °C / 83.7 F (-6.9 °C / -12.4 F).
Although our stress tests represent extreme scenarios, we recommend using the ProArt StudioBook 16 on the lap only while running non-intensive workloads in the Standard setting for personal safety.


| Asus ProArt StudioBook 16 H7600ZW Intel Core i9-12900H, NVIDIA GeForce RTX 3070 Ti Laptop GPU | MSI Creator Z17 A12UGST-054 Intel Core i9-12900H, NVIDIA GeForce RTX 3070 Ti Laptop GPU | Asus ROG Strix Scar 15 G533ZW-LN106WS Intel Core i9-12900H, NVIDIA GeForce RTX 3070 Ti Laptop GPU | Asus ROG Zephyrus Duo 16 GX650RX AMD Ryzen 9 6900HX, NVIDIA GeForce RTX 3080 Ti Laptop GPU | Apple MacBook Pro 14 2021 M1 Max 24-Core GPU Apple M1 Max, Apple M1 Max 24-Core GPU | |
|---|---|---|---|---|---|
| Heat | -28% | -19% | -12% | 5% | |
| Maximum Upper Side * (°C) | 41.6 | 63.9 -54% | 42.6 -2% | 45 -8% | 49.2 -18% |
| Maximum Bottom * (°C) | 41.4 | 68 -64% | 50.2 -21% | 50 -21% | 44.1 -7% |
| Idle Upper Side * (°C) | 31.8 | 28.3 11% | 36.2 -14% | 33 -4% | 23.5 26% |
| Idle Bottom * (°C) | 29.2 | 30.2 -3% | 40.2 -38% | 33 -13% | 23.6 19% |
* ... smaller is better
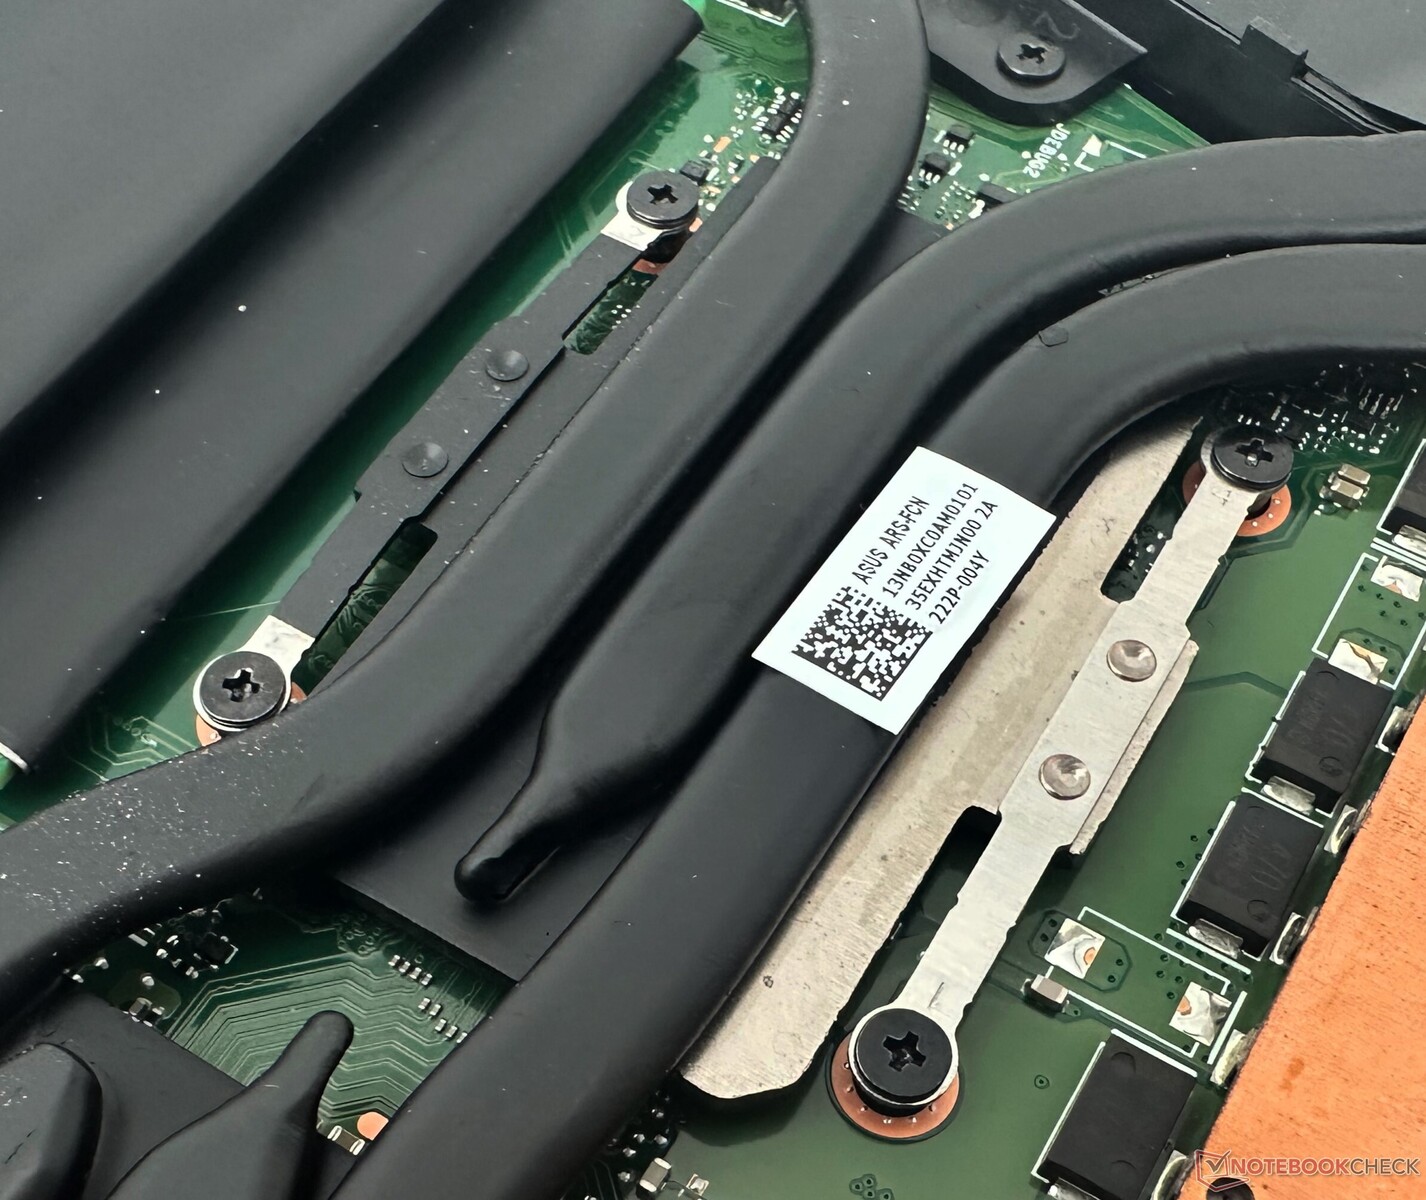
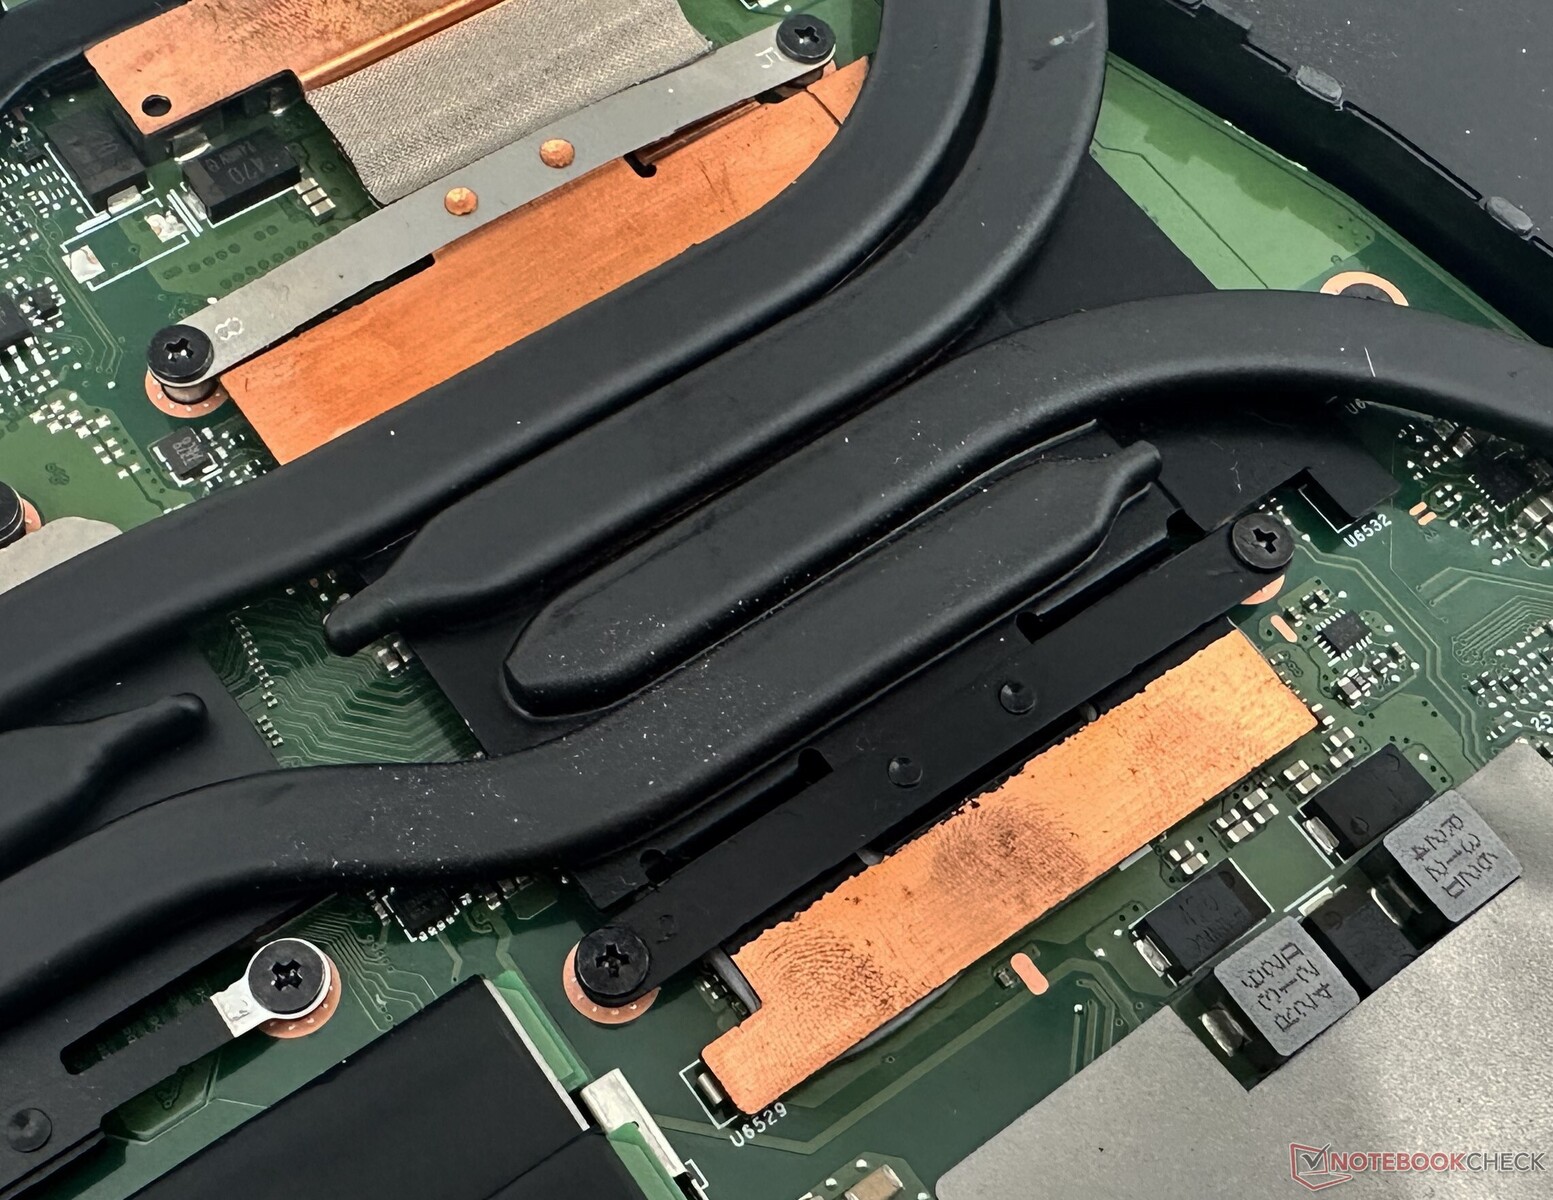
Stress Test
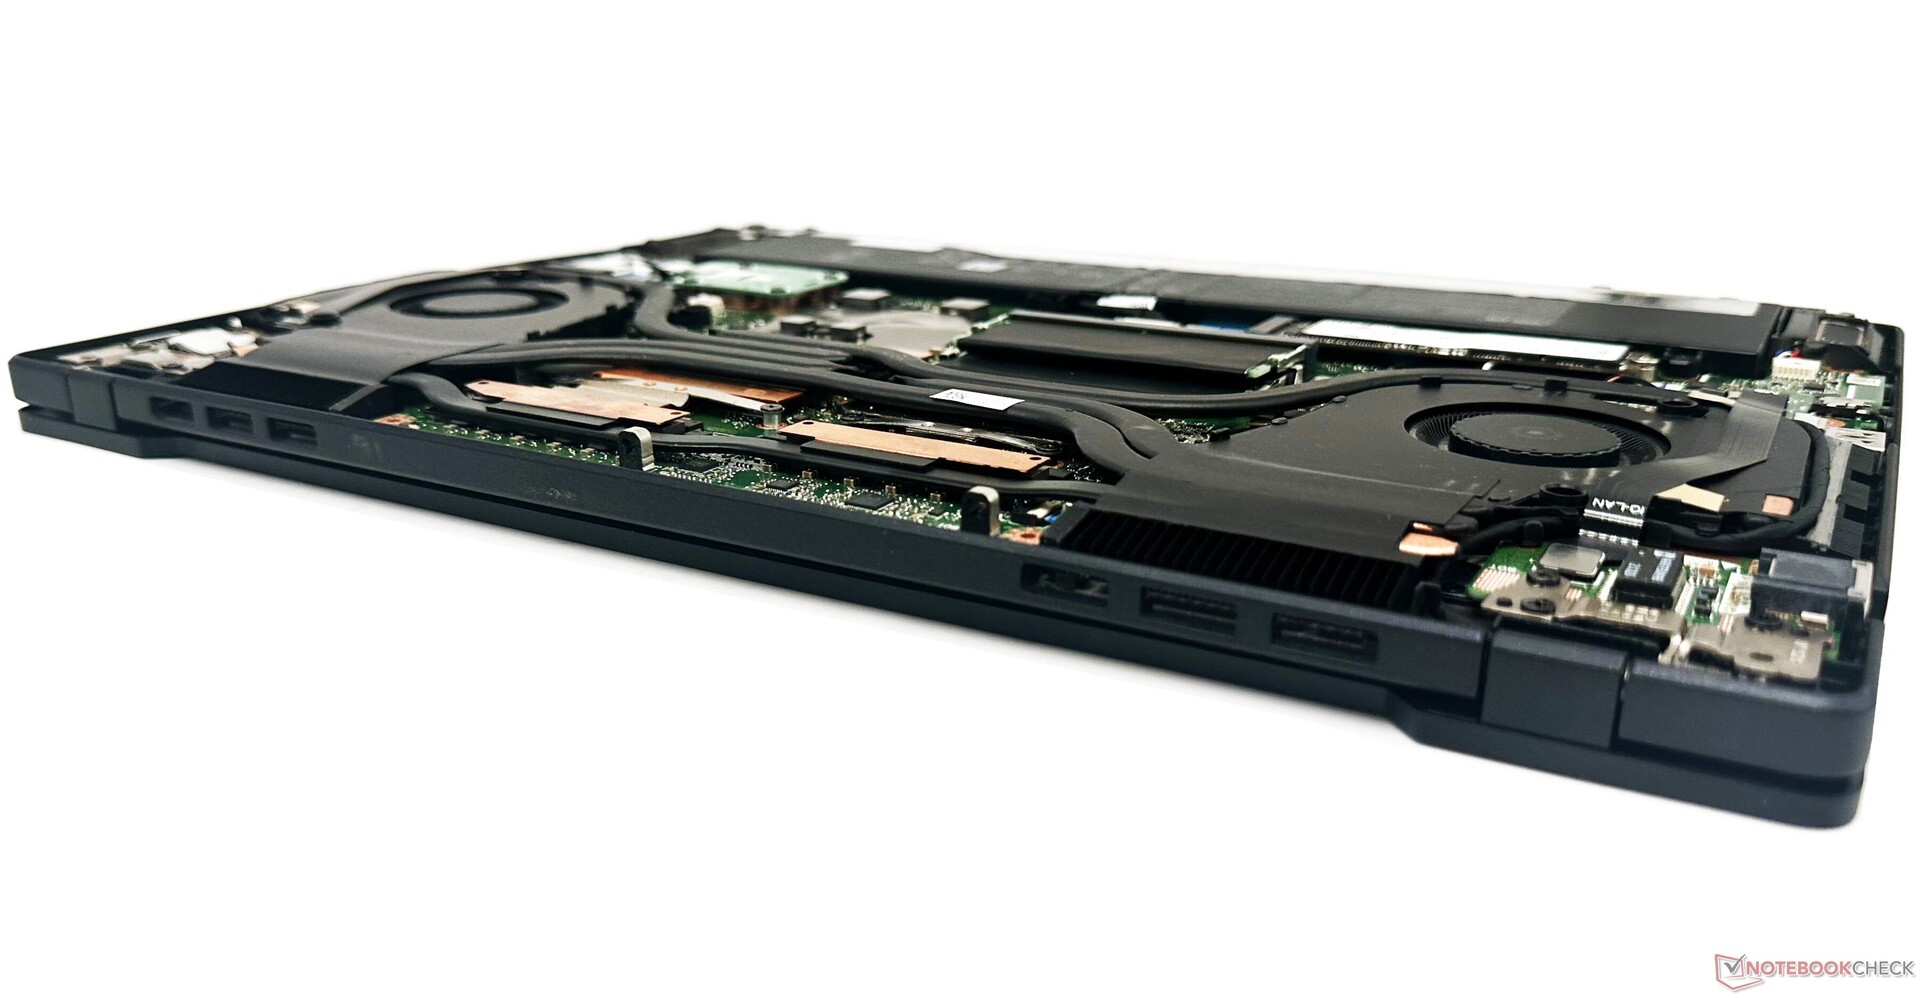
Asus uses a dual-fan, six-heatpipe cooling system and a liquid metal interface for the CPU to keep the ProArt StudioBook 16 running cool.
Running Prime95 in-place large FFTs sees the Core i9-12900H hitting 4.2 GHz with core temperatures peaking at the 91 °C mark and package power hitting 115 W.
Adding FurMark to the mix sees the average CPU clocks drop down to 2.09 GHz, which gives room for the RTX 3070 Ti Laptop GPU to peak up to 1,635 MHz. Both the CPU and the GPU are able to come close to their 115 W power targets albeit momentarily. The Core i9-12900H's average package power gets reduced to 52 W to allow the RTX 3070 Ti to consume 91 W.
The Witcher 3 at 1080p Ultra present a more realistic stress condition. Here, the average CPU clocks hover around the 2.5 GHz mark, but the GPU is able to consistently perform at boost clocks while maxing out at a 113 W TGP throughout the run.
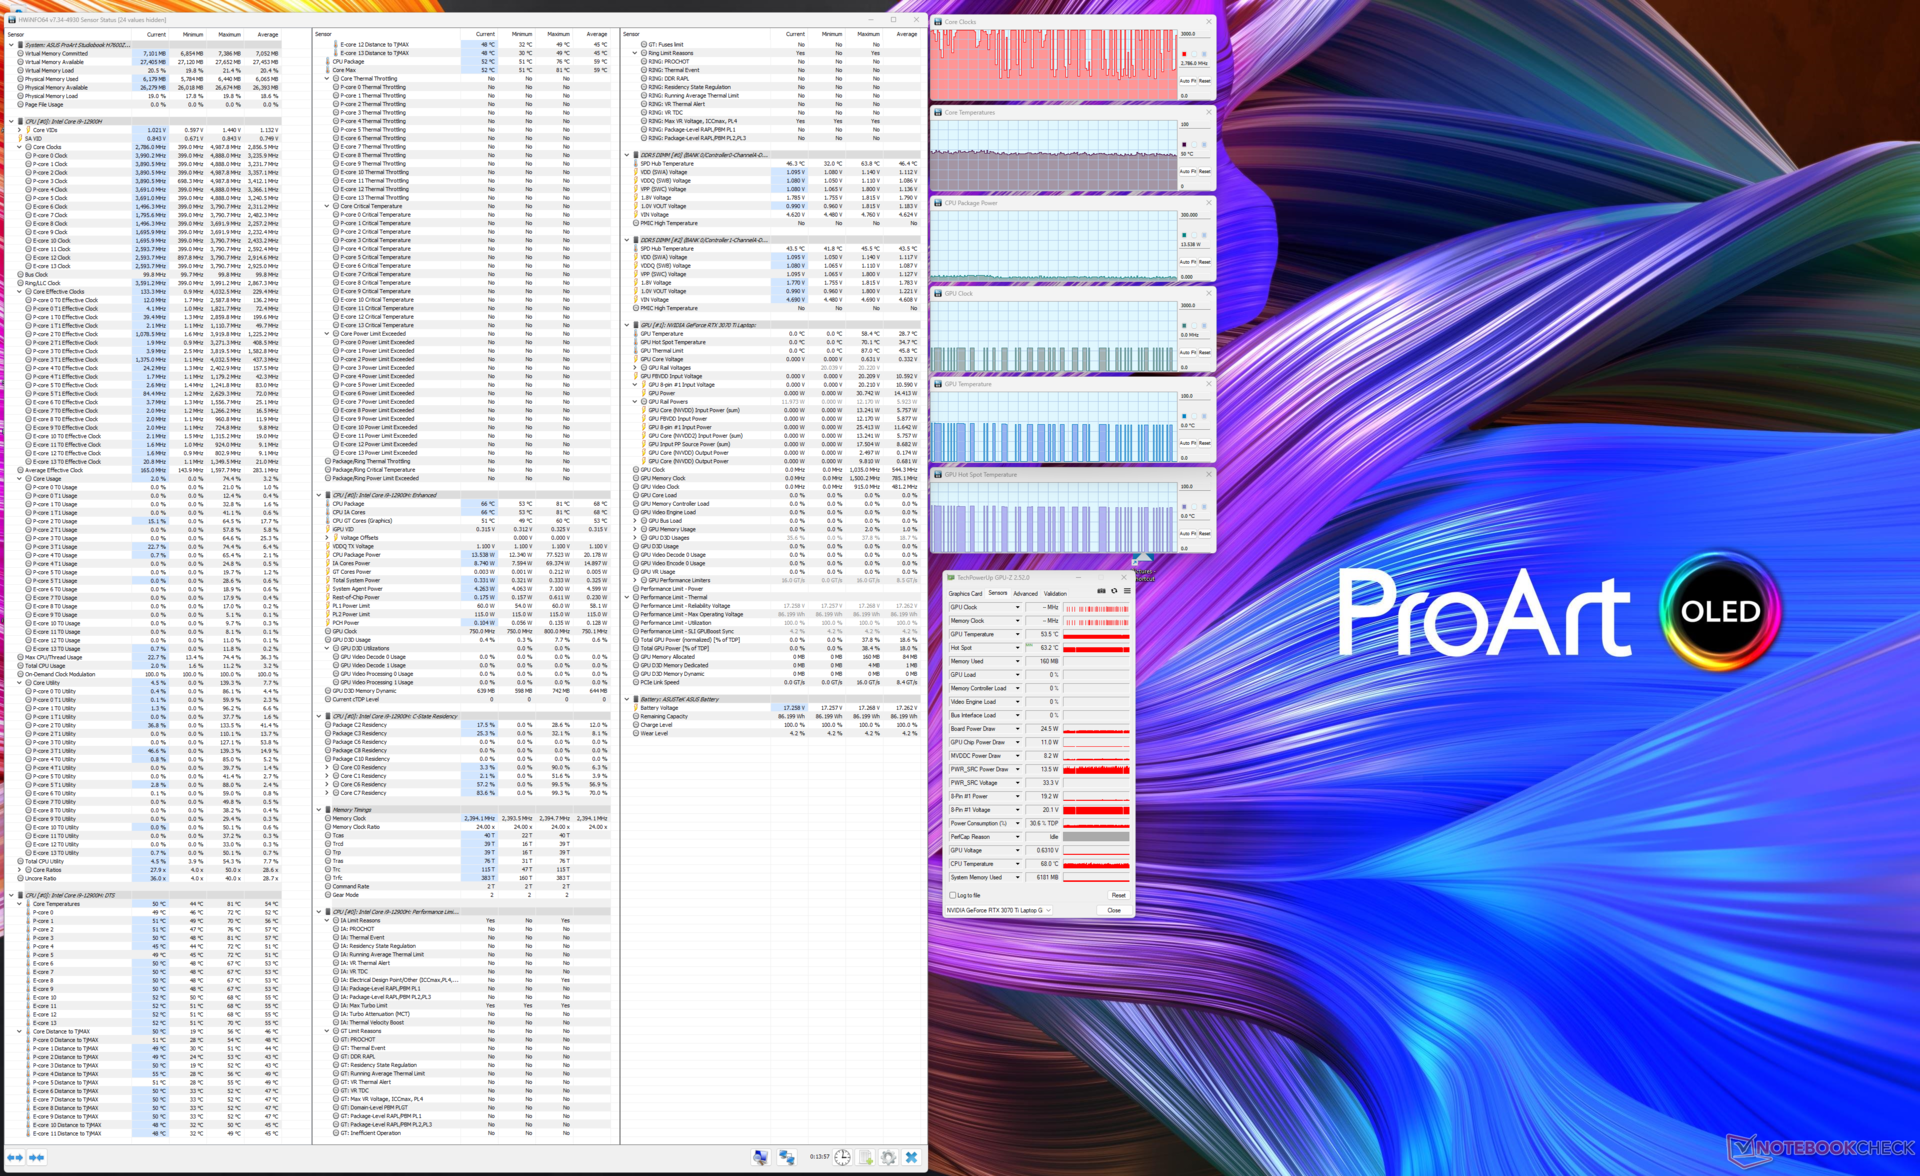
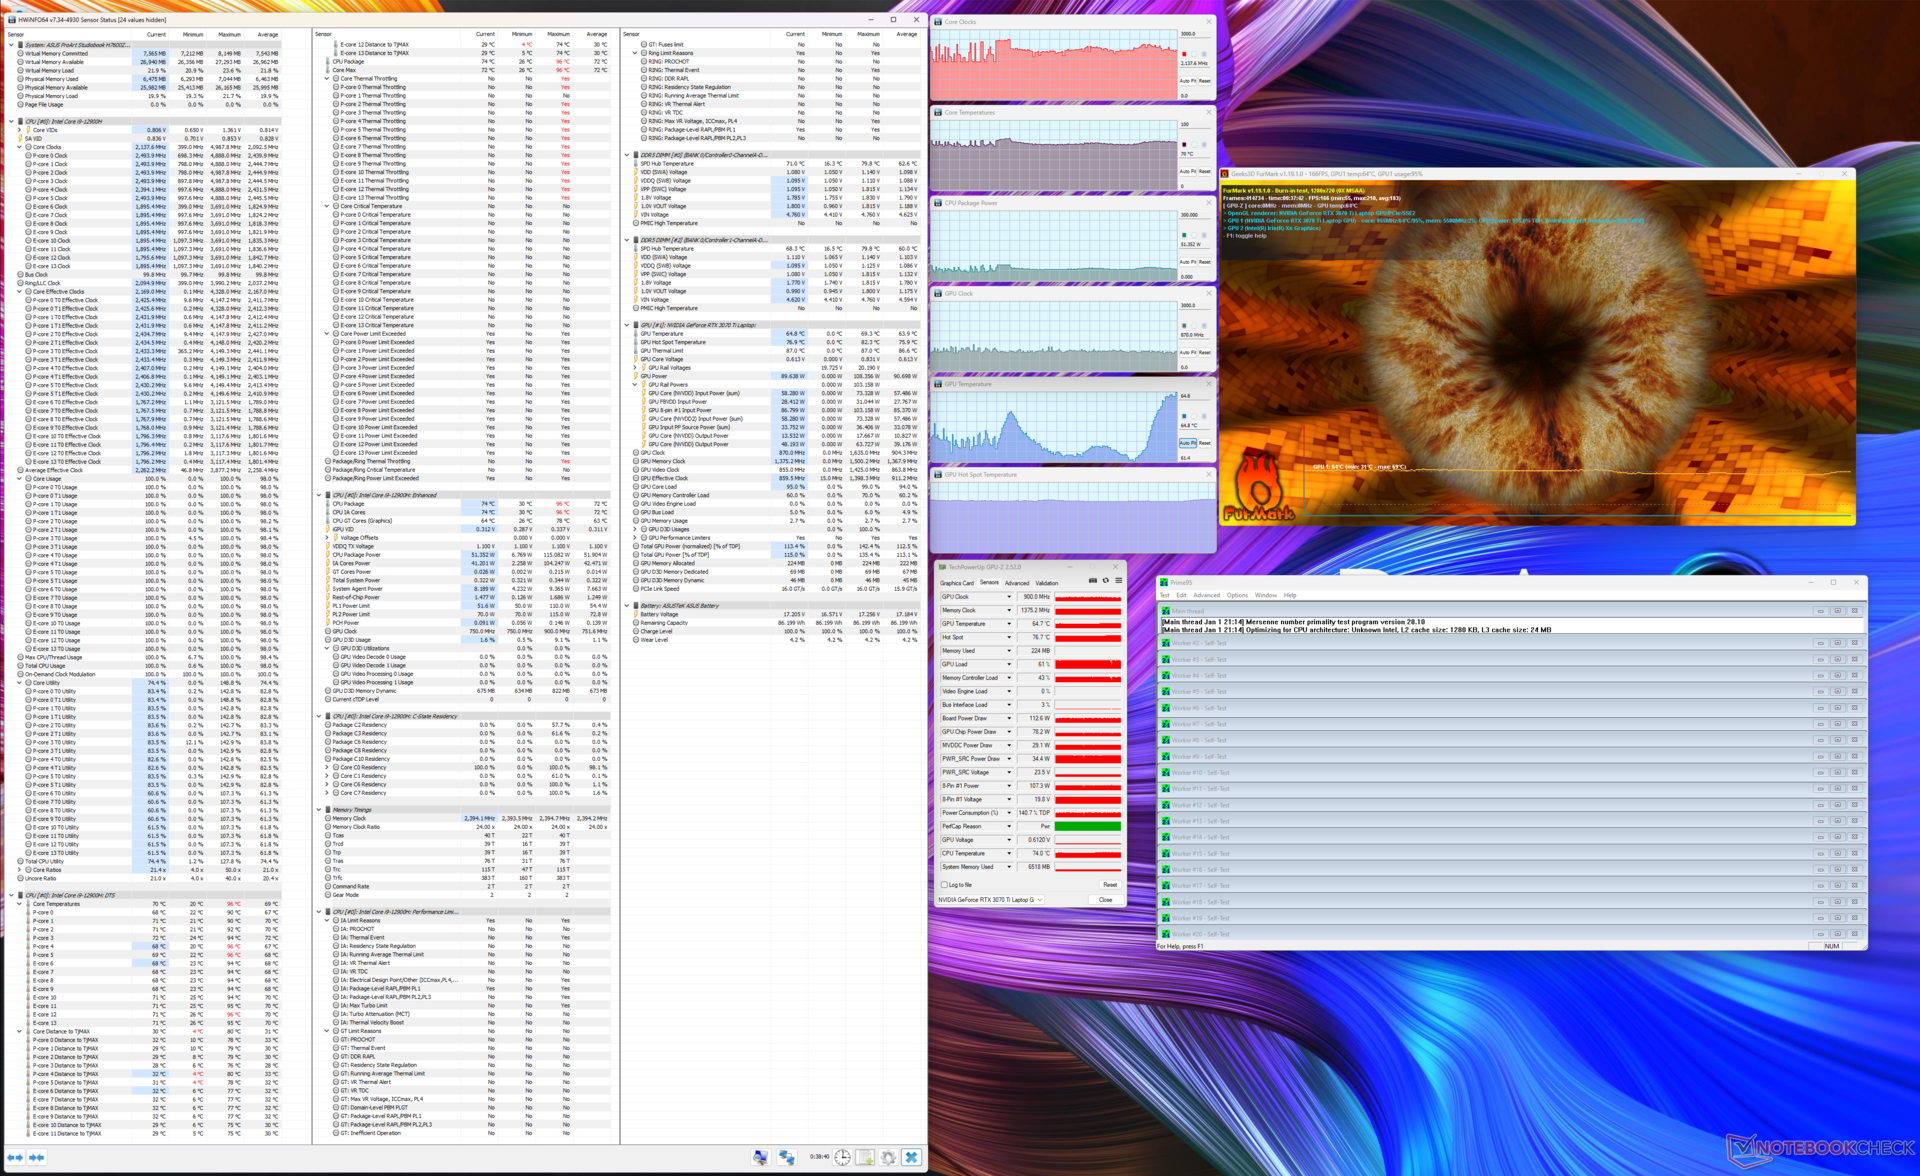
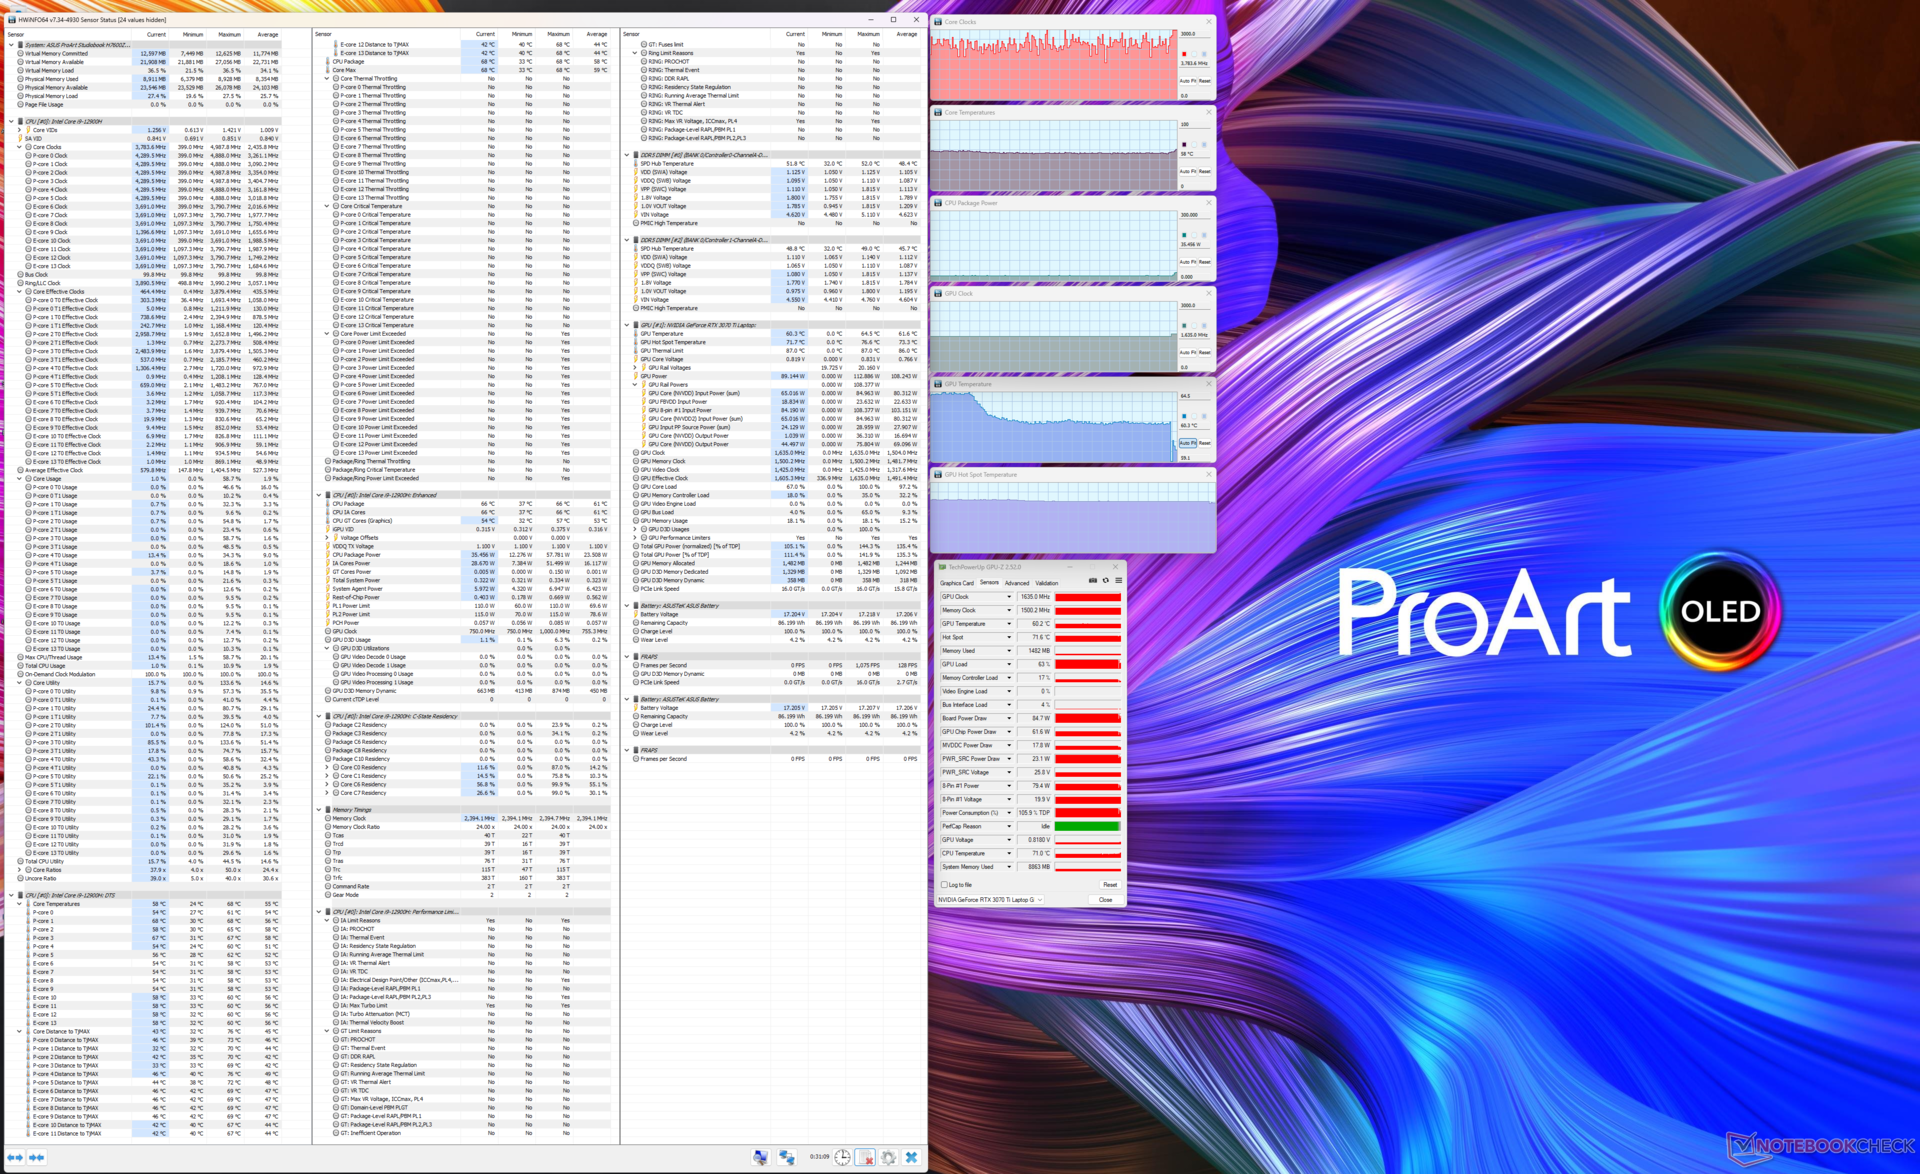
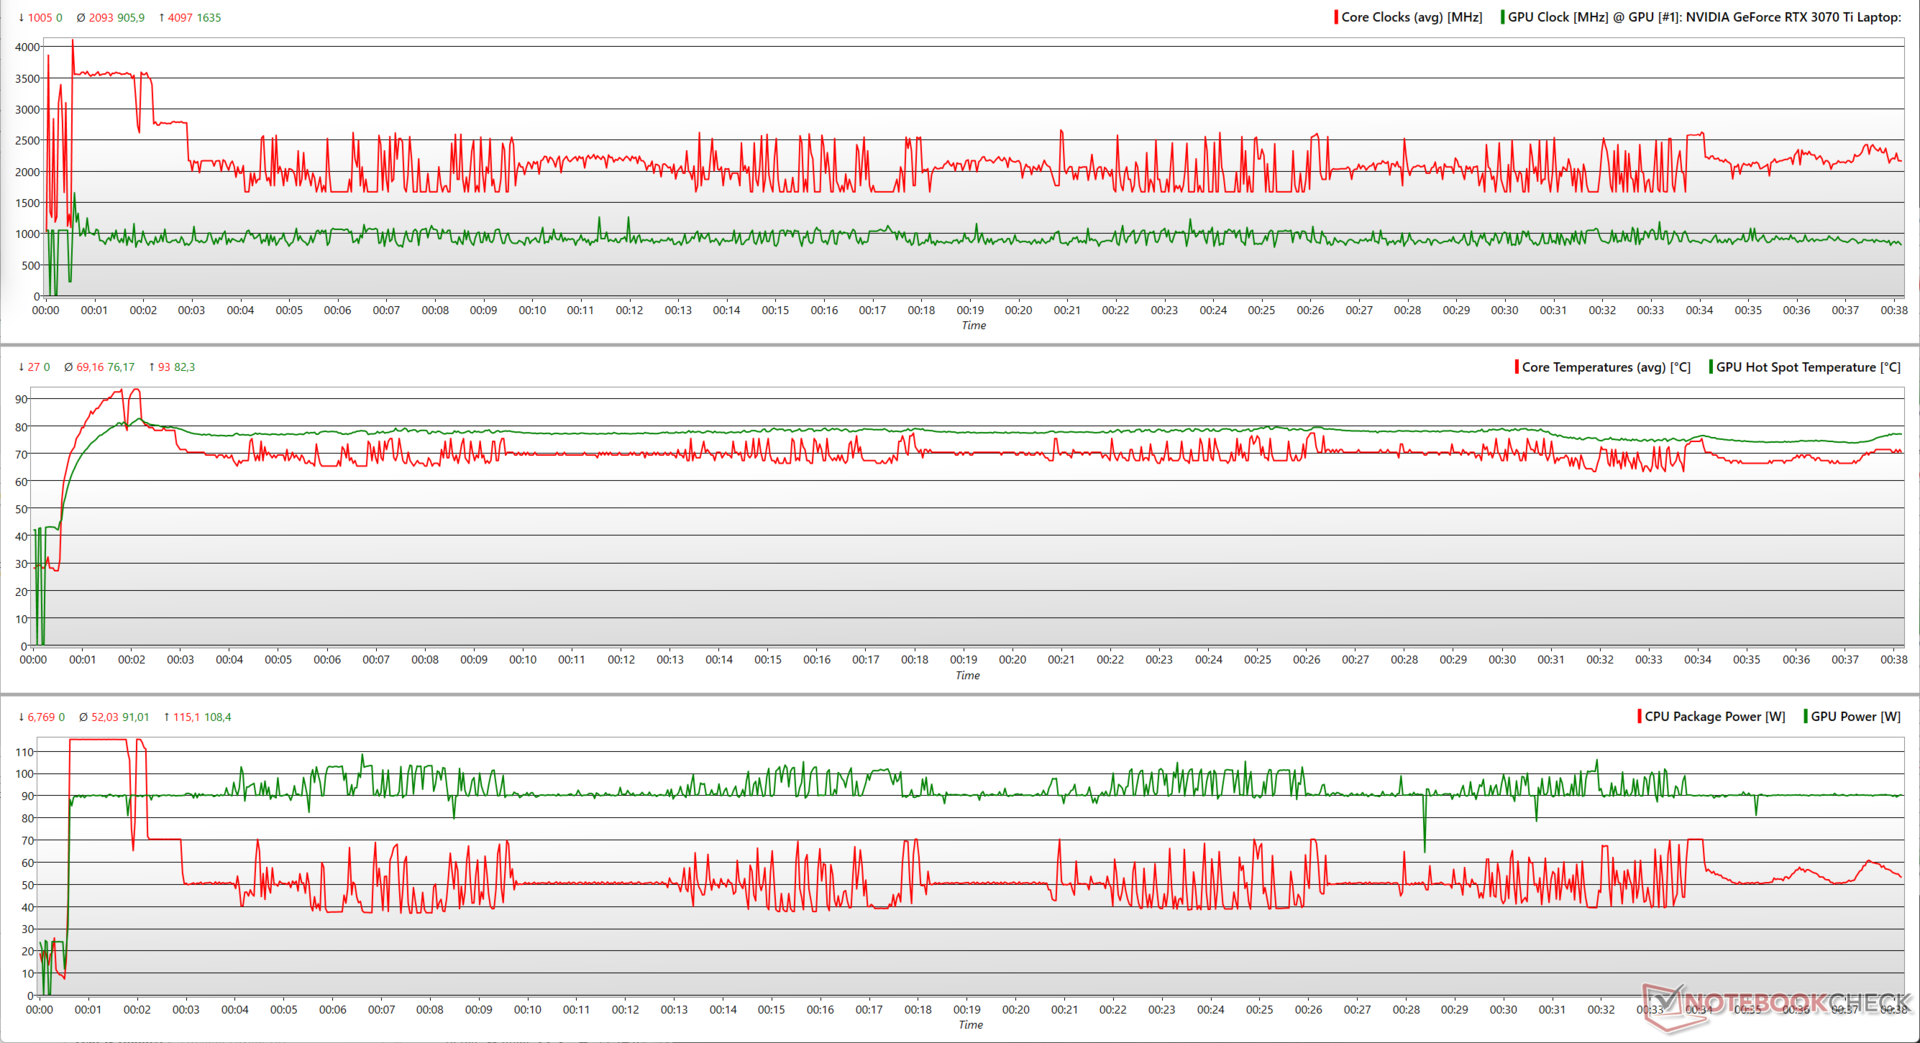
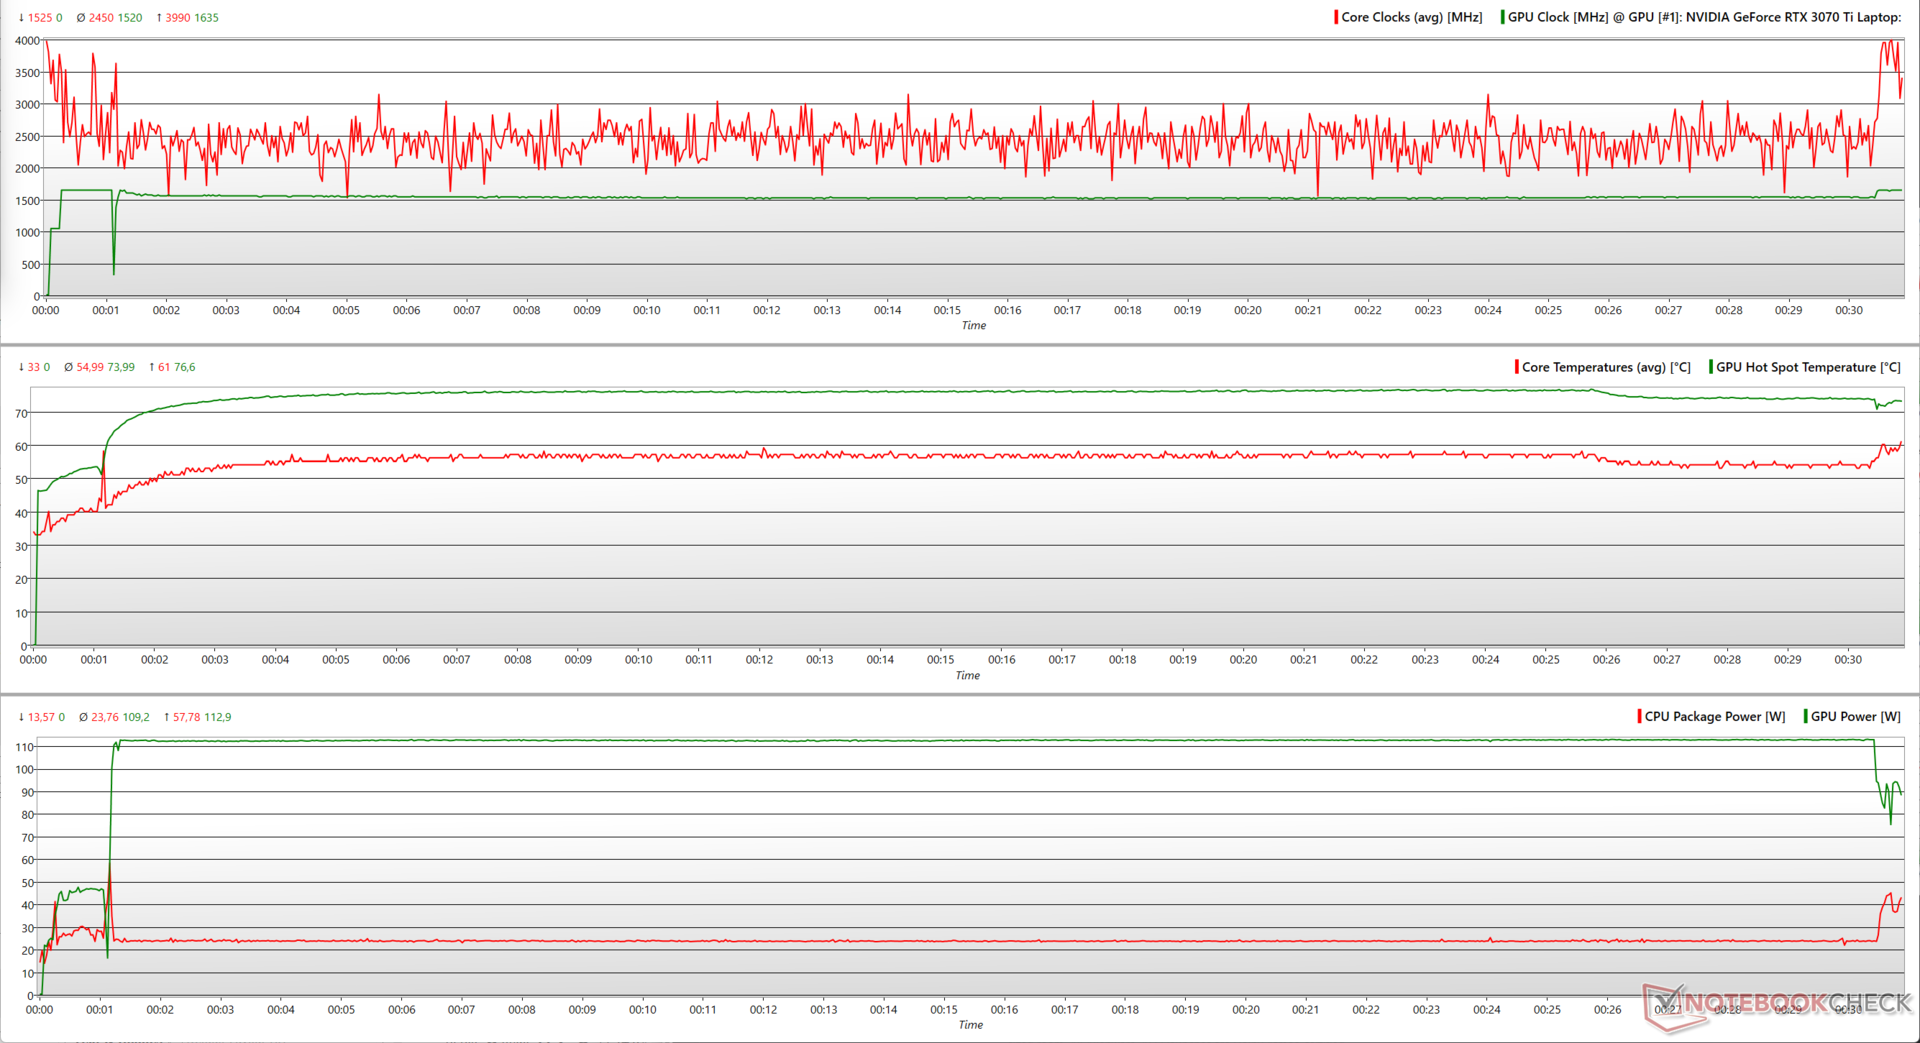
| Stress Test | CPU Clock (GHz) | GPU Clock (MHz) | Average CPU Temperature (°C) | Average GPU Temperature (°C) |
| System Idle | 2.79 | — | 54 | 28.7 |
| Prime95 | 3.03 | — | 82 | 30.9 |
| Prime95 + FurMark | 2.13 | 900 | 69 | 63.9 |
| The Witcher 3 | 3.78 | 1,635 | 55 | 61.6 |
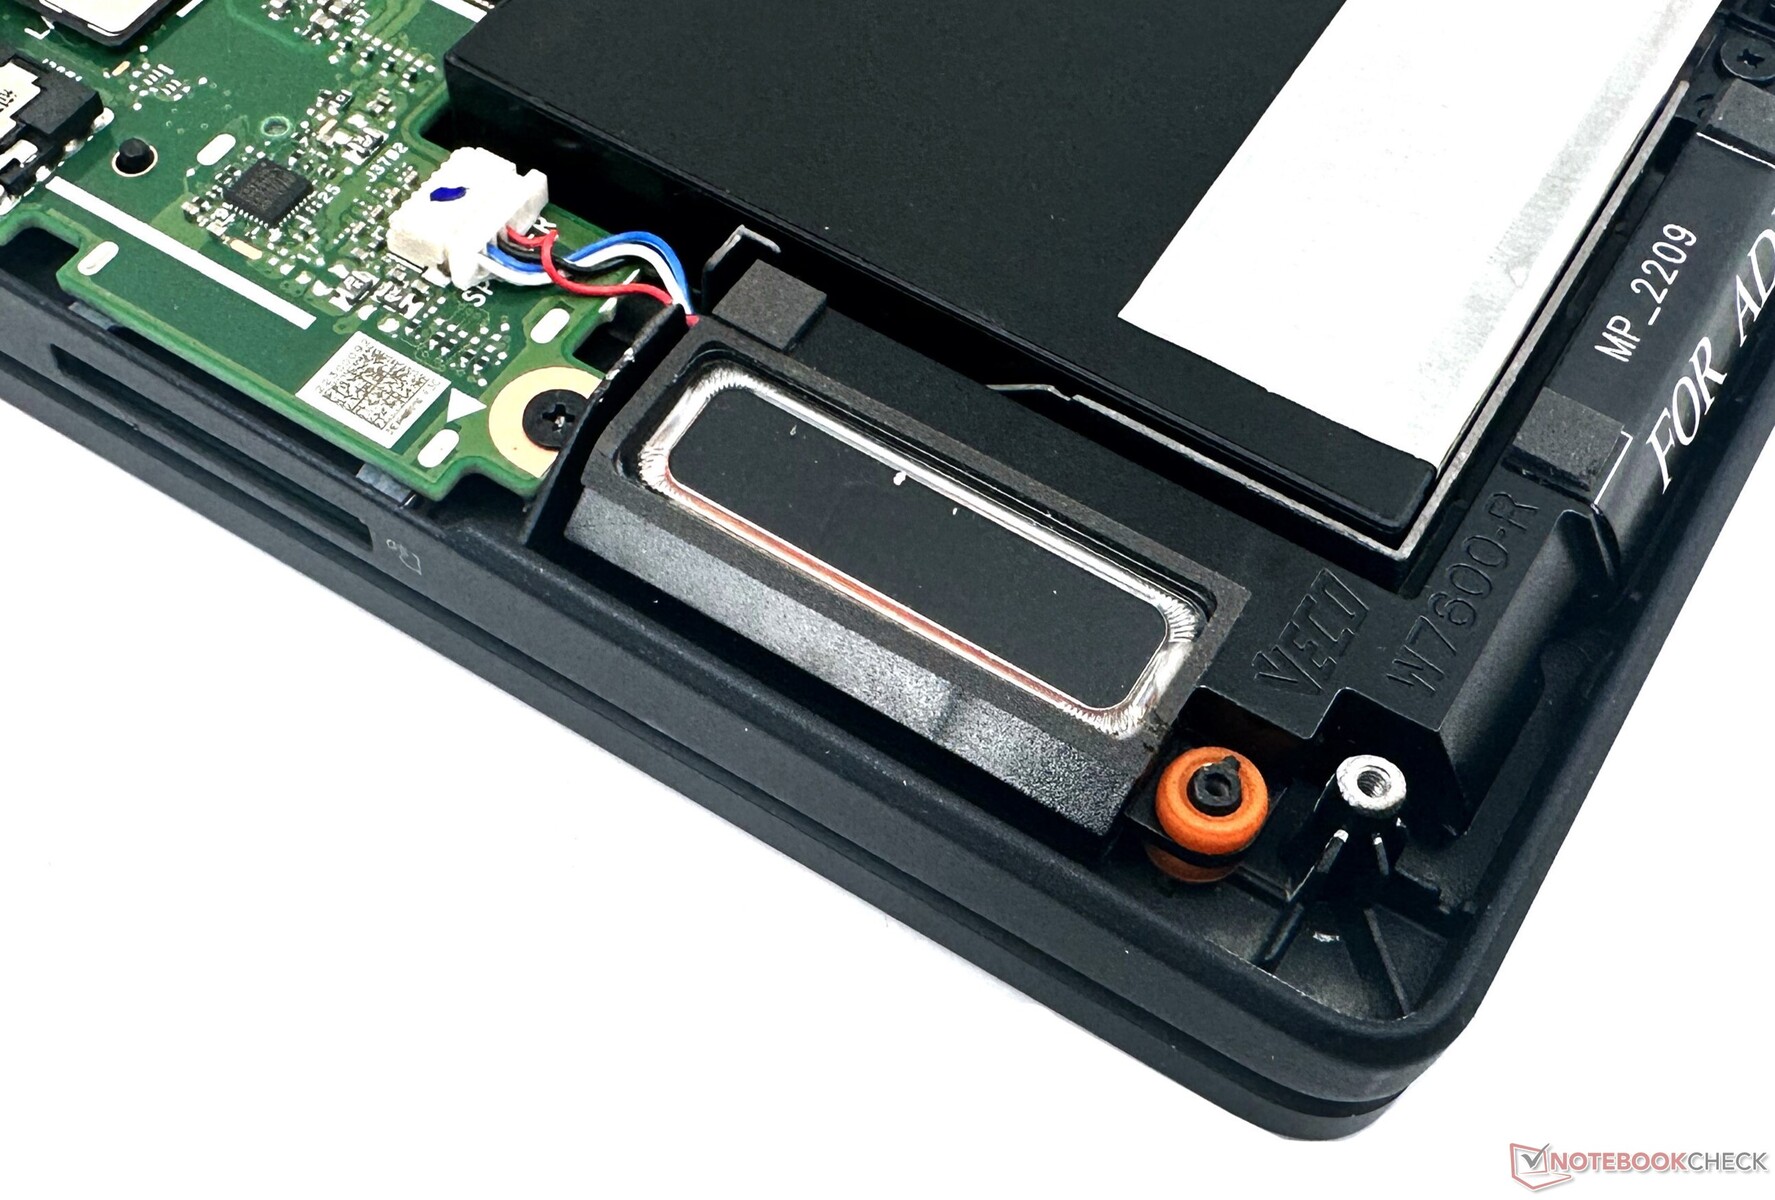
Speakers
Asus has equipped the ProArt StudioBook 16 with Smart Amp-powered Harman Kardon-certified onboard stereo speakers. The audio subsystem also supports Dolby Atmos and an ESS Sabre DAC with Hi-Res Audio certification for driving high-impedance headphones.
The peak loudness of 80.06 dB(A) is adequate for an average-sized room. We observe a reduced but still linear bass response along with good mids and highs. Subjectively, the onboard speakers are fine for casual listening.
A 3.5 mm audio jack and Bluetooth 5.0 are available for those wanting increased audio fidelity.
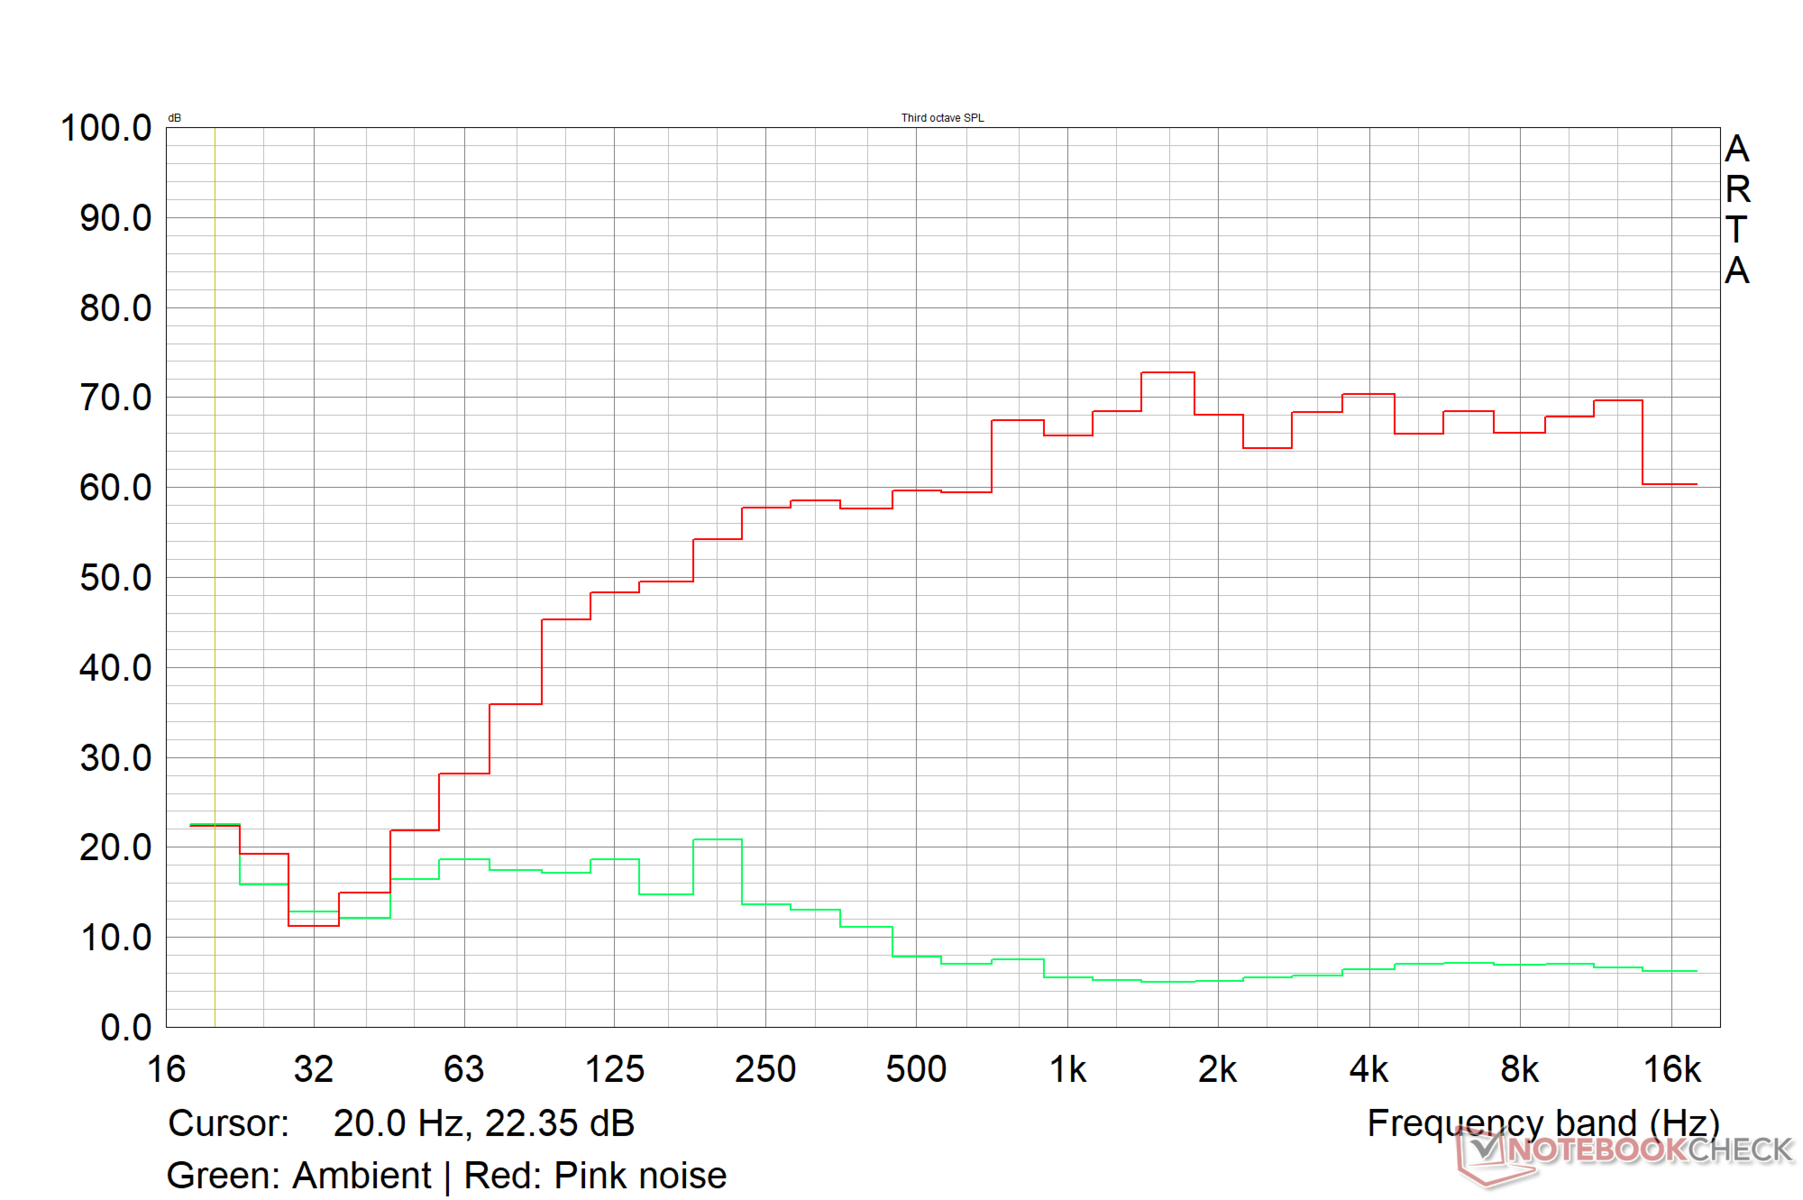
Asus ProArt StudioBook 16 H7600ZW audio analysis
(±) | speaker loudness is average but good (80.1 dB)
Bass 100 - 315 Hz
(±) | reduced bass - on average 13.5% lower than median
(+) | bass is linear (6.4% delta to prev. frequency)
Mids 400 - 2000 Hz
(+) | balanced mids - only 4.3% away from median
(+) | mids are linear (5.2% delta to prev. frequency)
Highs 2 - 16 kHz
(+) | balanced highs - only 2% away from median
(+) | highs are linear (5.1% delta to prev. frequency)
Overall 100 - 16.000 Hz
(+) | overall sound is linear (11.6% difference to median)
Compared to same class
» 15% of all tested devices in this class were better, 4% similar, 81% worse
» The best had a delta of 5%, average was 18%, worst was 45%
Compared to all devices tested
» 7% of all tested devices were better, 2% similar, 90% worse
» The best had a delta of 4%, average was 24%, worst was 134%
Apple MacBook Pro 16 2021 M1 Pro audio analysis
(+) | speakers can play relatively loud (84.7 dB)
Bass 100 - 315 Hz
(+) | good bass - only 3.8% away from median
(+) | bass is linear (5.2% delta to prev. frequency)
Mids 400 - 2000 Hz
(+) | balanced mids - only 1.3% away from median
(+) | mids are linear (2.1% delta to prev. frequency)
Highs 2 - 16 kHz
(+) | balanced highs - only 1.9% away from median
(+) | highs are linear (2.7% delta to prev. frequency)
Overall 100 - 16.000 Hz
(+) | overall sound is linear (4.6% difference to median)
Compared to same class
» 0% of all tested devices in this class were better, 0% similar, 100% worse
» The best had a delta of 5%, average was 18%, worst was 45%
Compared to all devices tested
» 0% of all tested devices were better, 0% similar, 100% worse
» The best had a delta of 4%, average was 24%, worst was 134%
Energy Management: Maxes out 240 W power supply under load
Power Consumption
We recorded a maximum power consumption of 241 W under load, so the supplied 240 W adapter should be just about enough to power the ProArt StudioBook 16 through most demanding tasks. Power consumption from the wall is reminiscent of the pattern we've seen earlier during the stress tests.
Nevertheless, the ProArt StudioBook 16 does not suffer from high idle consumption as is the case with the MSI Creator Z17. The ROG Strix Scar 15 is more economical at idle, but consumption under load is higher than the StudioBook 16.
Unsurprisingly, the Apple MacBook Pro 14 with M1 Max comes across as the most frugal energy sipper in this comparison.
| Off / Standby | |
| Idle | |
| Load |
|
Key:
min: | |
| Asus ProArt StudioBook 16 H7600ZW i9-12900H, GeForce RTX 3070 Ti Laptop GPU, OLED, 3840x2400, 16" | MSI Creator Z17 A12UGST-054 i9-12900H, GeForce RTX 3070 Ti Laptop GPU, IPS, 2560x1600, 17" | Asus ROG Strix Scar 15 G533ZW-LN106WS i9-12900H, GeForce RTX 3070 Ti Laptop GPU, IPS-level, 2560x1440, 15.6" | Lenovo ThinkBook 16p G3 ARH R9 6900HX, GeForce RTX 3060 Laptop GPU, IPS, 2560x1600, 16" | Apple MacBook Pro 14 2021 M1 Max 24-Core GPU M1 Max, M1 Max 24-Core GPU, Mini-LED, 3024x1964, 14.2" | Average NVIDIA GeForce RTX 3070 Ti Laptop GPU | Average of class Multimedia | |
|---|---|---|---|---|---|---|---|
| Power Consumption | -70% | 9% | 16% | 52% | -10% | 47% | |
| Idle Minimum * (Watt) | 12.6 | 34.6 -175% | 7.56 40% | 10.3 18% | 3.2 75% | 14.2 ? -13% | 5.92 ? 53% |
| Idle Average * (Watt) | 17.41 | 43 -147% | 13.5 22% | 16 8% | 12.6 28% | 19.9 ? -14% | 10.7 ? 39% |
| Idle Maximum * (Watt) | 23.12 | 44.9 -94% | 16.87 27% | 24 -4% | 13 44% | 26.2 ? -13% | 12.6 ? 46% |
| Load Average * (Watt) | 117.5 | 145 -23% | 128.9 -10% | 85.4 27% | 57.9 51% | 125.8 ? -7% | 66.4 ? 43% |
| Witcher 3 ultra * (Watt) | 172.6 | 152.4 12% | 196.2 -14% | 132.2 23% | 76.3 56% | ||
| Load Maximum * (Watt) | 241.36 | 220 9% | 274.86 -14% | 181.9 25% | 97.7 60% | 248 ? -3% | 108.5 ? 55% |
* ... smaller is better
Power Consumption: The Witcher 3 / Stress test
Power Consumption: External monitor
Battery Life
Although the ProArt StudioBook 16 cannot match the MacBook Pro when it comes to battery run times, the 90 WHr Li-ion pack ensures decent longevity on the road before you have to reach out for the charger. All battery tests were performed in the Standard mode.
Asus advertises 10 hours of battery run time during video playback, and we were just short of the 9:45 mark with our H.264 1080p video loop test at 150 nits. The MacBook Pro 14 with M1 Max offers a 54% higher run time in our standardized Wi-Fi test at 150 nits screen brightness.
It is possible to unscrew and replace the battery if needed.
| Asus ProArt StudioBook 16 H7600ZW i9-12900H, GeForce RTX 3070 Ti Laptop GPU, 90 Wh | MSI Creator Z17 A12UGST-054 i9-12900H, GeForce RTX 3070 Ti Laptop GPU, 90 Wh | Asus ROG Strix Scar 15 G533ZW-LN106WS i9-12900H, GeForce RTX 3070 Ti Laptop GPU, 90 Wh | Lenovo ThinkBook 16p G3 ARH R9 6900HX, GeForce RTX 3060 Laptop GPU, 71 Wh | Apple MacBook Pro 14 2021 M1 Max 24-Core GPU M1 Max, M1 Max 24-Core GPU, 69.9 Wh | Average of class Multimedia | |
|---|---|---|---|---|---|---|
| Battery runtime | 25% | -2% | -13% | 40% | 70% | |
| H.264 (h) | 9.7 | 5.5 -43% | 8.5 -12% | 12.1 25% | 16 ? 65% | |
| WiFi v1.3 (h) | 7.5 | 5.5 -27% | 8.4 12% | 6.5 -13% | 11.6 55% | 11.6 ? 55% |
| Witcher 3 ultra (h) | 1.3 | 1.2 -8% | ||||
| Load (h) | 0.9 | 2.2 144% | 0.9 0% | 1.698 ? 89% |
Pros
Cons
Verdict: Near-perfect for mobile content creation
The Asus ProArt StudioBook 16 tries its best to differentiate from the growing number of creator-focused laptops out there, and it manages to do so quite convincingly.
The ProArt StudioBook's design is minimalist yet exudes class. The chassis is well built, the lid can be opened with a single finger, and display has very thin bezels for added immersion.
The customizable Asus Dial can come in extremely handy in supported apps for those who want the convenience of an analog-style input.
Asus uses a high-quality Samsung OLED panel in the StudioBook 16. It does not boast of high refresh rates, but the color accuracy and near-100% coverage across sRGB, Adobe RGB, and Display P3 color spaces will be welcomed by creators. The display suffers from PWM at low brightness levels, but the use of DC Dimming at above 50% brightness should still be easy on the eyes.
The Asus ProArt StudioBook 16 offers nearly everything that content creators would expect from a laptop at this price. With a top-performing Core i9-12900H and RTX 3070 Ti Laptop GPU together with a bright, vivid OLED panel and the convenience of the Asus Dial, the ProArt StudioBook 16 has the potential to veer you away from a MacBook Pro.
Performance with the Core i9-12900H and RTX 3070 Ti Laptop GPU combination does not throw up any surprises. In fact, it even edges out its competitors such as the MSI Creator Z17 and Ryzen 9 6900HX-powered Asus ROG Zephyrus Duo 16 and the Lenovo ThinkBook 16p G3, at least in terms of CPU performance.
The RTX 3070 Ti Laptop GPU is great for gaming at QHD and should be more than enough for providing enough juice for content creation applications, particularly with the Nvidia Studio drivers.
Asus is clearly targeting the MacBook Pro crowd, and the ProArt StudioBook 16 is way ahead of its competition from Cupertino when it comes to raw performance. That being said, MacBooks based on Apple silicon do have the architectural advantage in terms of performance away from the wall and in battery life.
Also, as seen in the Affinity Photo 2 benchmark, apps optimized specifically for Apple silicon can show significantly better performance than their x86 versions.
The Asus ProArt StudioBook 16 is not without a few shortcomings, however. The Wi-Fi performance could use some stability and added throughput in the 6 GHz 6E band. SD card performance also can be much improved considering its target demographic.
The three-button touchpad is one of the best you can get on a Windows laptop but needs a lot of fine tuning in terms of sensitivity out-of-the-box. The 90 WHr battery offers above average run times, but this is only under test conditions.
All said, the Asus ProArt StudioBook 16 combines form and functionality with equally good performance making it definitely worthy of consideration for content creators if price is no bar.
Pricing and Availability
The tested Asus ProArt StudioBook 16 H7600 configuration with a Core i9-12900H and RTX 3070 Ti Laptop GPU is available for ₹2,49,990 (~US$3,015) on Amazon India.
In the US, the ProArt StudioBook 16 with a Core i7-12700H, RTX 3070 Ti Laptop GPU, 16 GB RAM, and 2 TB NVMe storage can be had for US$2,549 on Amazon US and for about US$2,699.99 from Best Buy.
Buyers can also opt for a ProArt StudioBook 16 SKU featuring the Nvidia RTX A3000 Laptop GPU for US$2,971 on Amazon US.
Asus ProArt StudioBook 16 H7600ZW
- 02/25/2023 v7 (old)
Vaidyanathan Subramaniam
More articles related to this device
Asus ProArt StudioBook 16 H7600ZW (ProArt StudioBook 16 Series)Related Articles


Transparency
The selection of devices to be reviewed is made by our editorial team. The test sample was provided to the author as a loan by the manufacturer or retailer for the purpose of this review. The lender had no influence on this review, nor did the manufacturer receive a copy of this review before publication. There was no obligation to publish this review. As an independent media company, Notebookcheck is not subjected to the authority of manufacturers, retailers or publishers.
This is how Notebookcheck is testing
Every year, Notebookcheck independently reviews hundreds of laptops and smartphones using standardized procedures to ensure that all results are comparable. We have continuously developed our test methods for around 20 years and set industry standards in the process. In our test labs, high-quality measuring equipment is utilized by experienced technicians and editors. These tests involve a multi-stage validation process. Our complex rating system is based on hundreds of well-founded measurements and benchmarks, which maintains objectivity. Further information on our test methods can be found here.
Price comparison
