Apple MacBook Pro 14 2021 Laptop Review: The performance of the M1 Max is limited
We reviewed the base model of the MacBook Pro 14 with the M1 Pro SoC last year when it launched. The review unit left a very good impression in many sections and also leads our Multimedia Top 10 (in combination with the larger MacBook Pro 16). The new Mini-LED panel offers great picture quality and the high HDR brightness is definitely a highlight in the laptop segment. The 14-inch model is also offered with the more powerful M1 Max chips, which offer more GPU performance.
Today we have a look at the MacBook Pro 14 with the 10-core CPU and the 24-core GPU. The version with 32 GB RAM and 512 GB PCIe-SSD storage has an RRP of 3209 Euros, so around 1000 Euros more than the base model. There are no differences in terms of the chassis, ports, input devices, or the display compared to our previous review, so we will focus on the performance of the M1 Max as well as the effects on the emissions and the battery runtime. Please see our comprehensive review of the base unit for all the other information:
Potential Rivals
Rating | Date | Model | Weight | Height | Size | Resolution | Price |
|---|---|---|---|---|---|---|---|
| 92.1 % v7 (old) | 04 / 2022 | Apple MacBook Pro 14 2021 M1 Max 24-Core GPU M1 Max, M1 Max 24-Core GPU | 1.6 kg | 15.5 mm | 14.20" | 3024x1964 | |
| 92.7 % v7 (old) | 11 / 2021 | Apple MacBook Pro 14 2021 M1 Pro Entry M1 Pro 8-Core, M1 Pro 14-Core GPU | 1.6 kg | 15.5 mm | 14.20" | 3024x1964 | |
| 93.2 % v7 (old) | 11 / 2021 | Apple MacBook Pro 16 2021 M1 Pro M1 Pro, M1 Pro 16-Core GPU | 2.2 kg | 16.8 mm | 16.20" | 3456x2234 | |
| 92.5 % v7 (old) | 11 / 2021 | Apple MacBook Pro 16 2021 M1 Max M1 Max, M1 Max 32-Core GPU | 2.2 kg | 16.8 mm | 16.20" | 3456x2234 |

Display - Full brightness via App
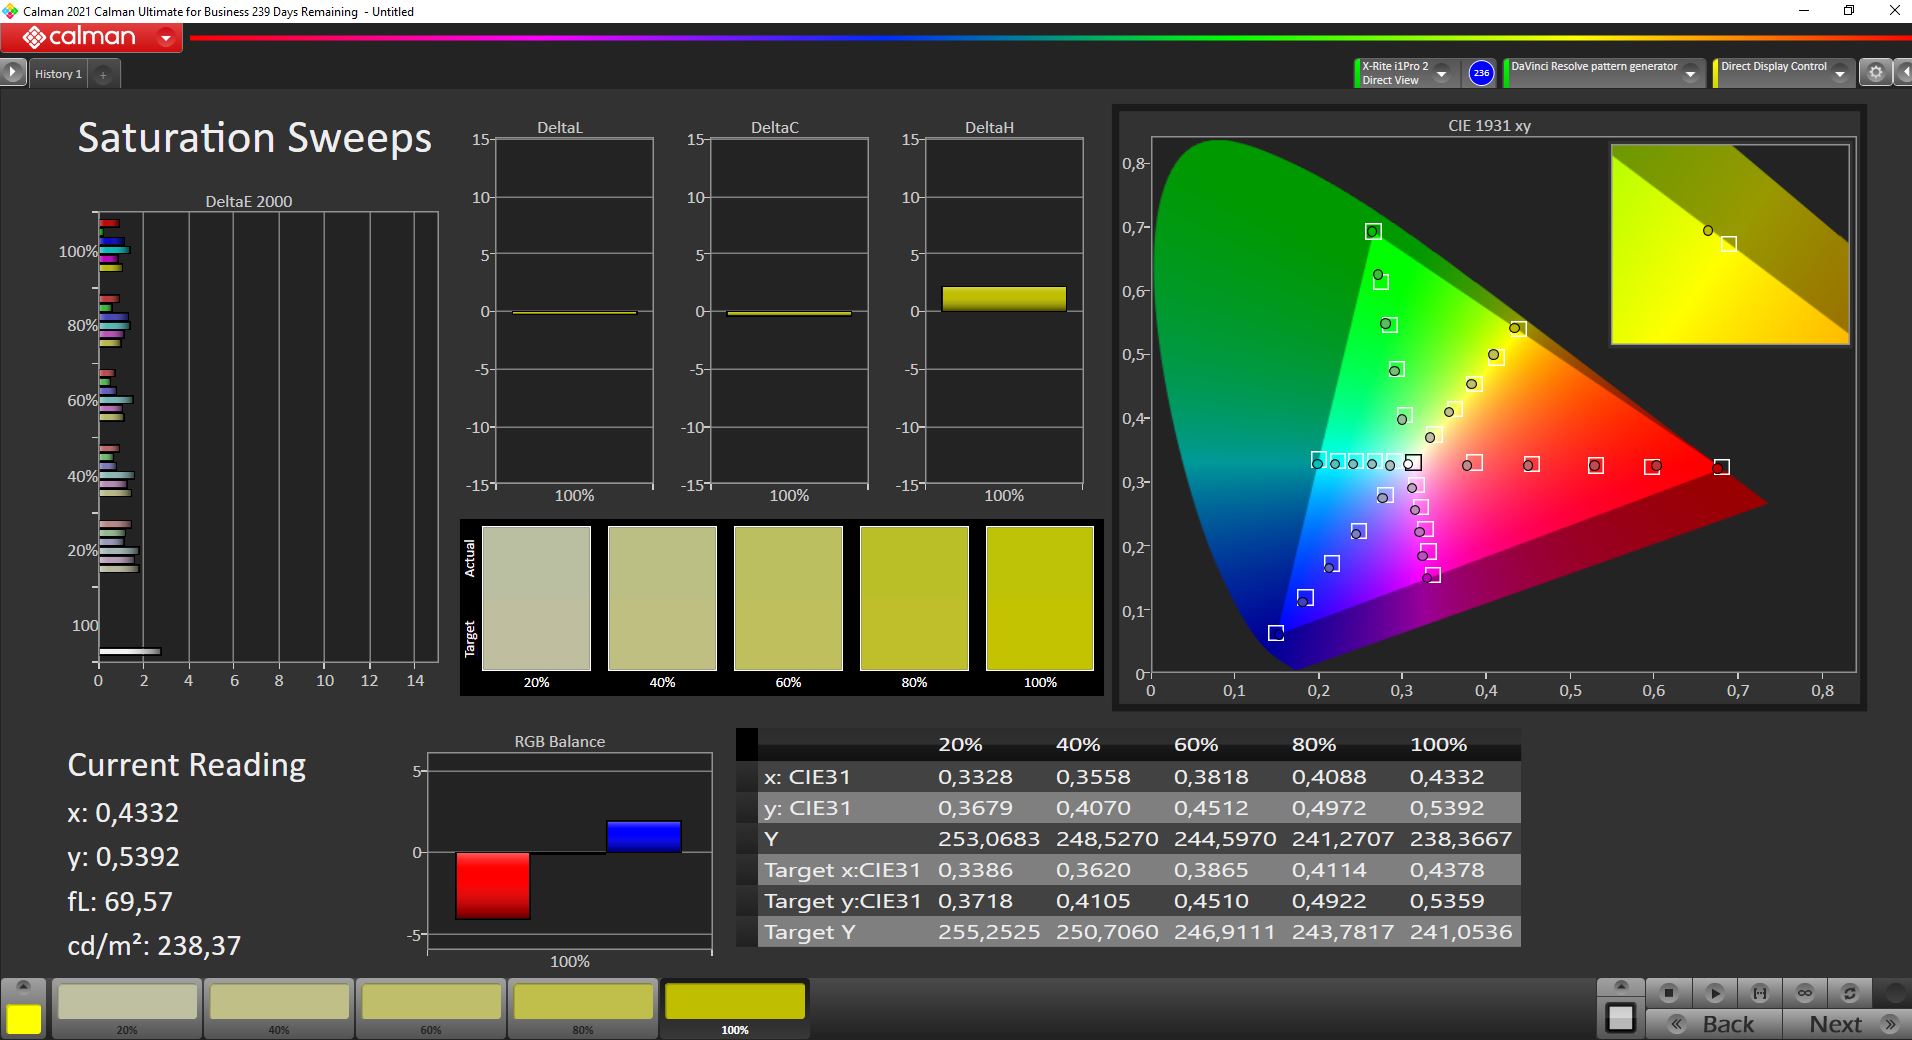
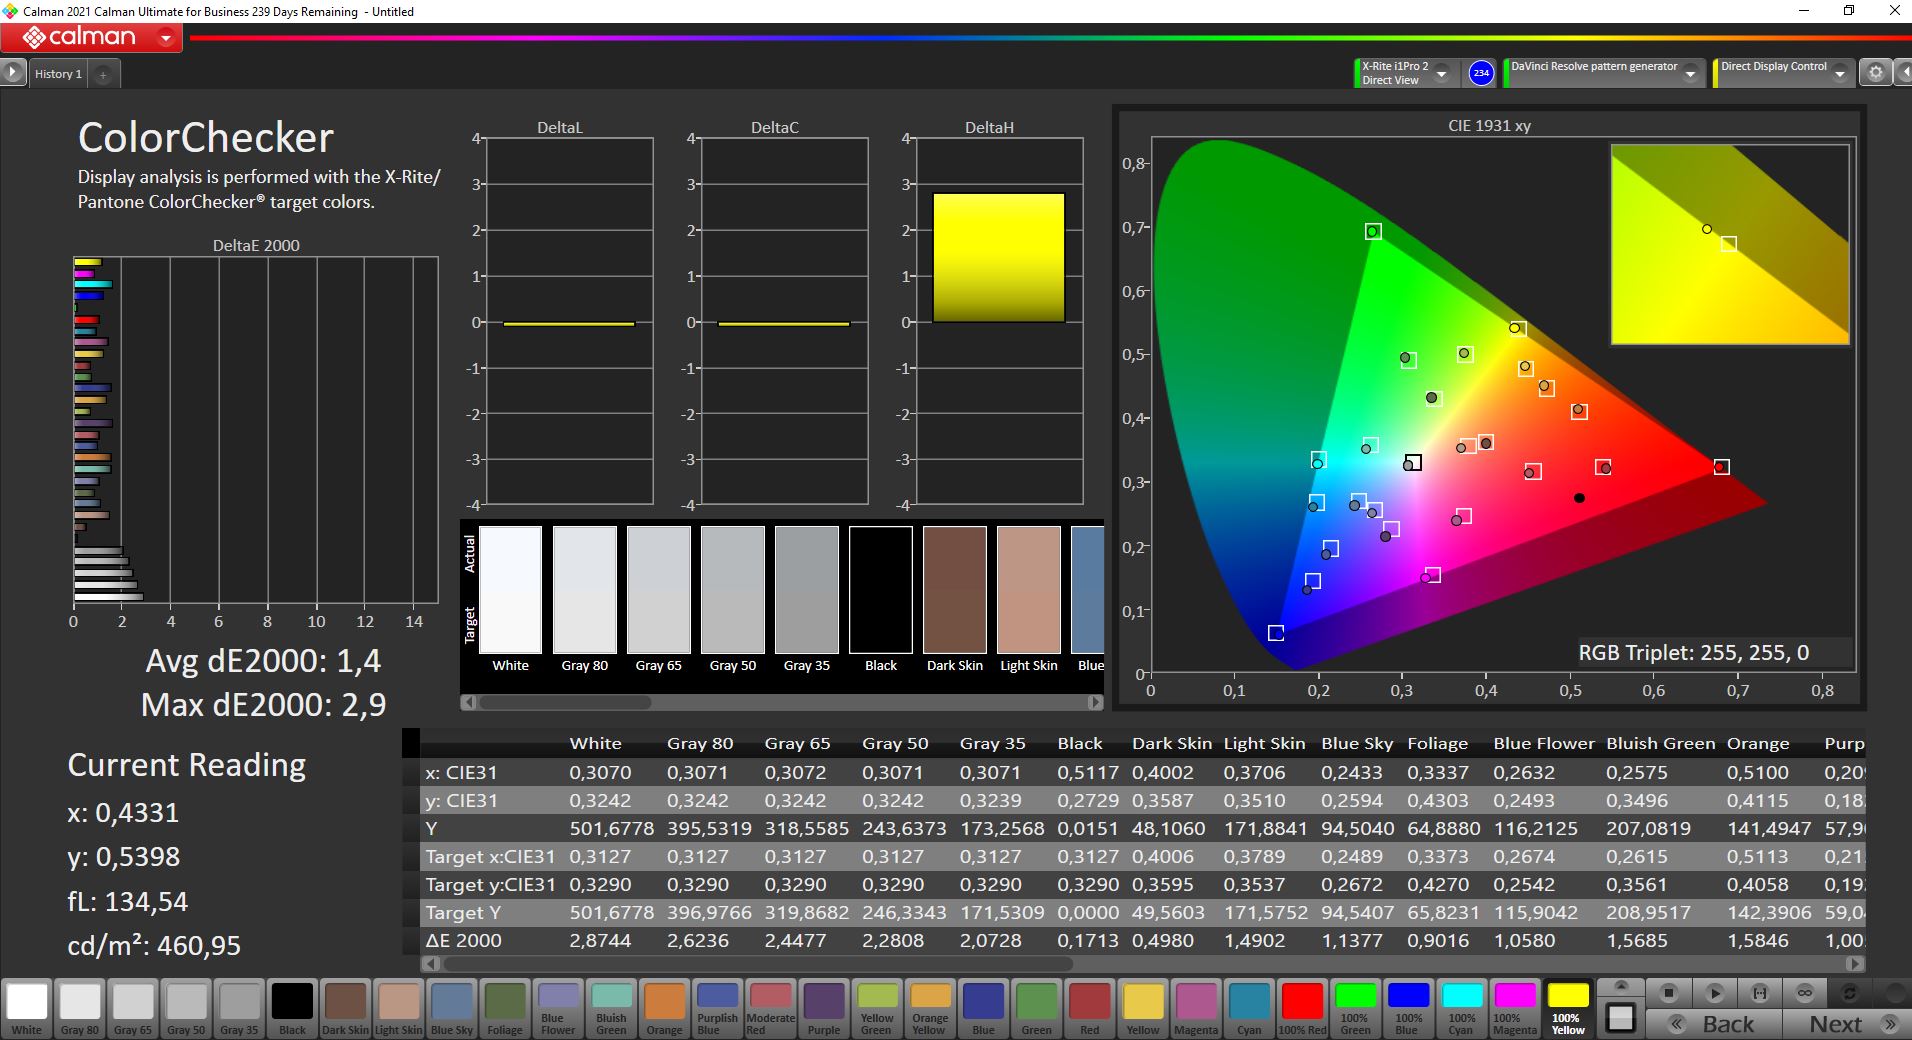
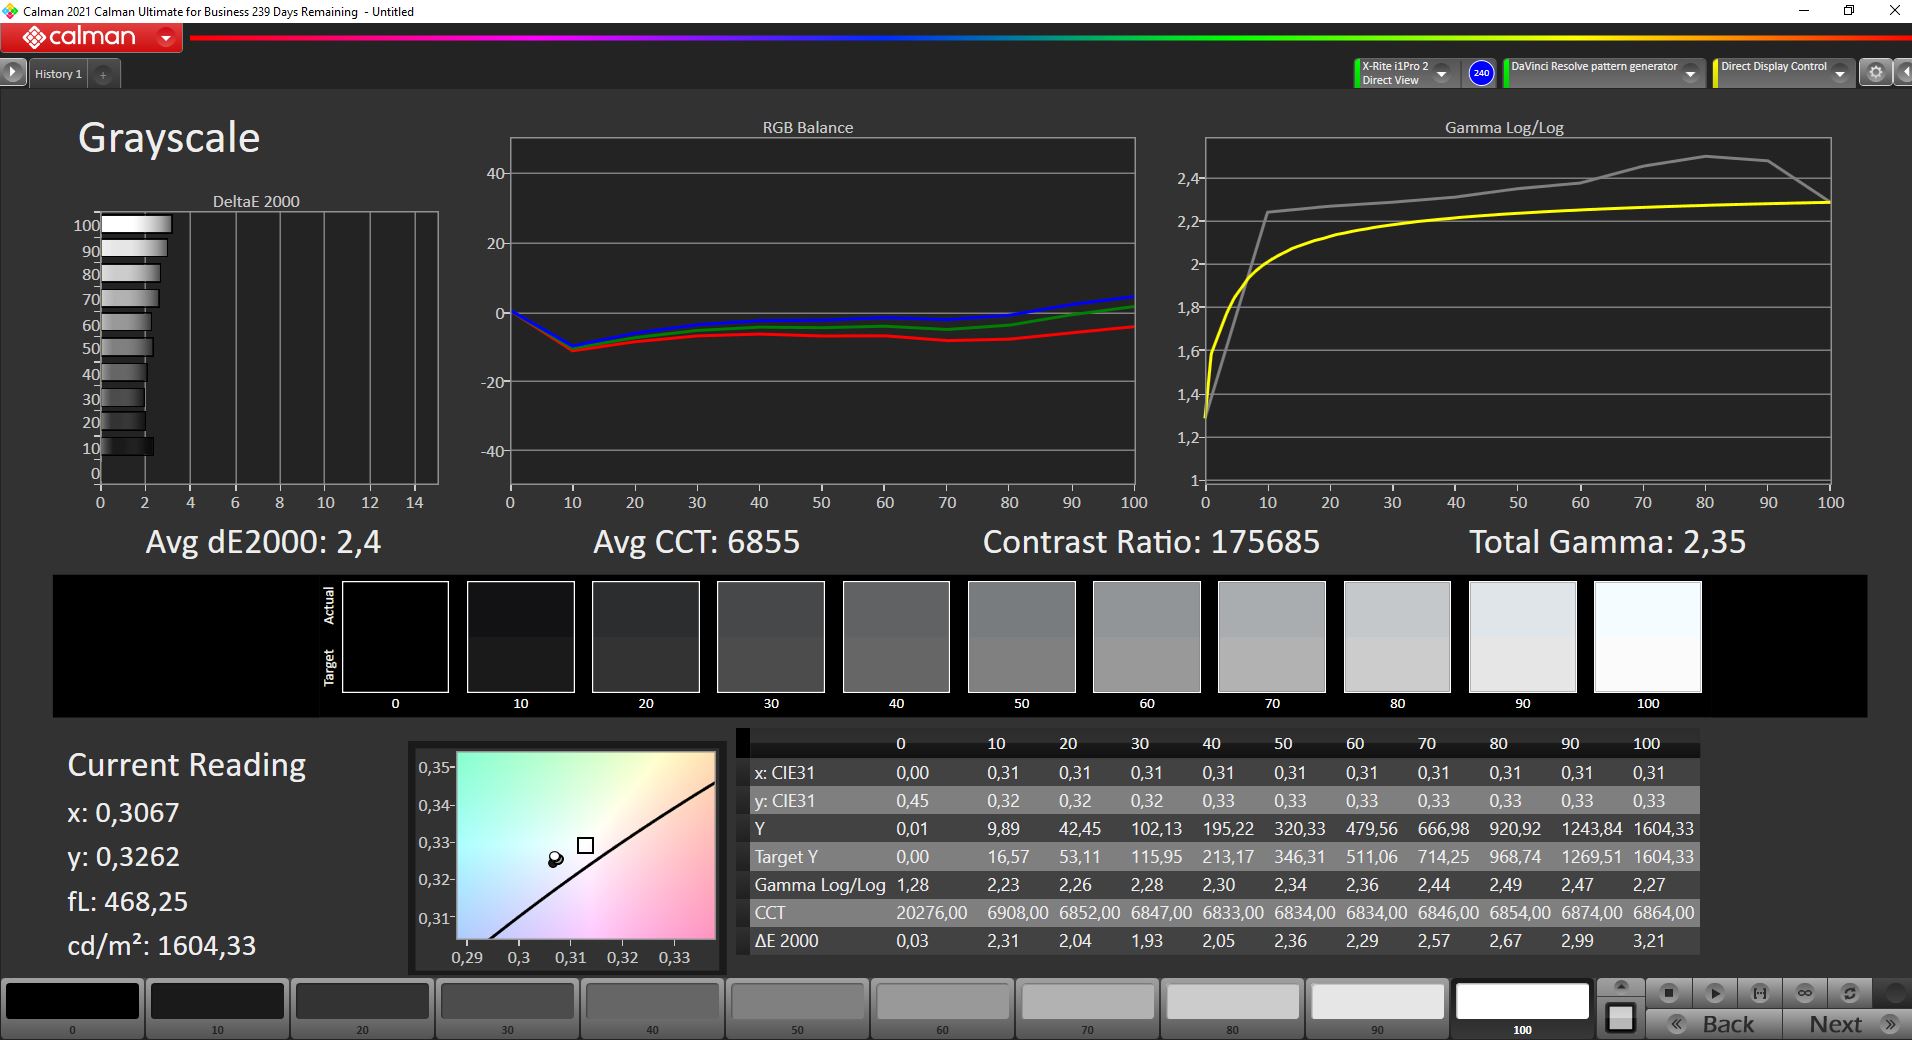
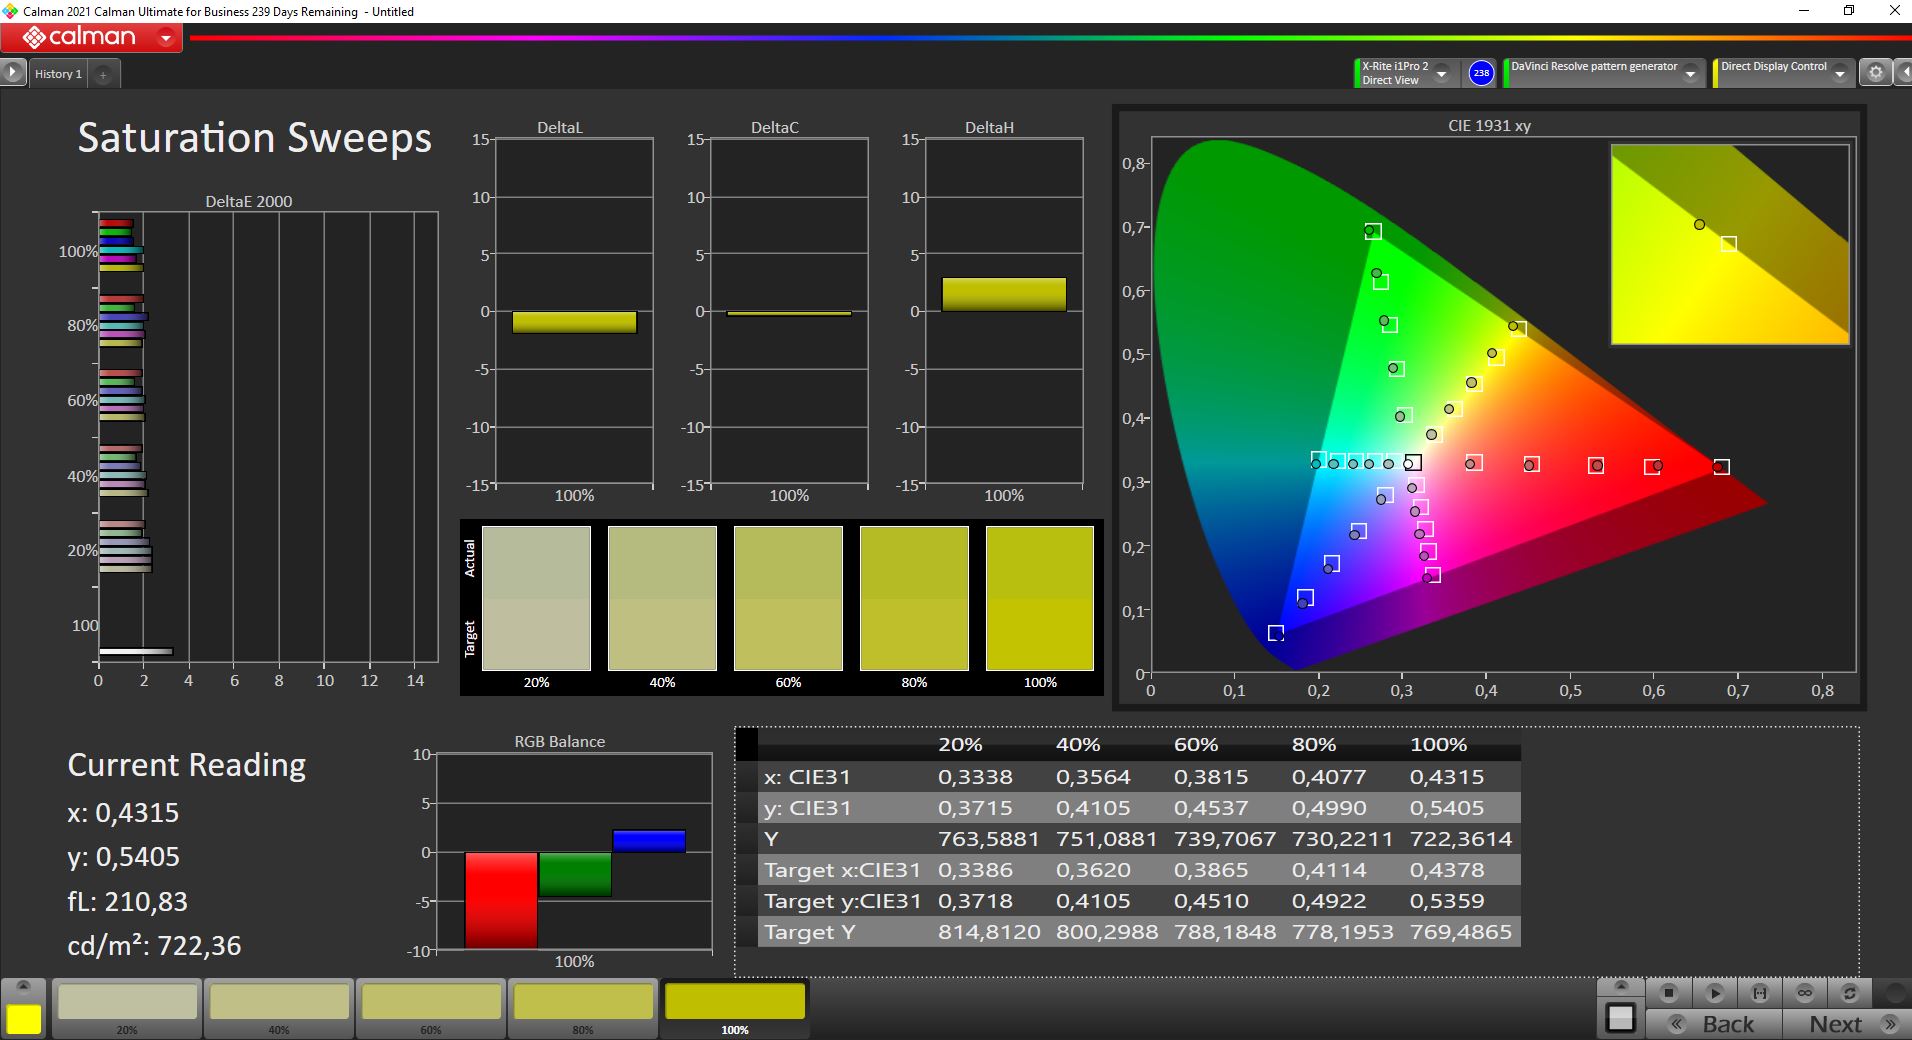
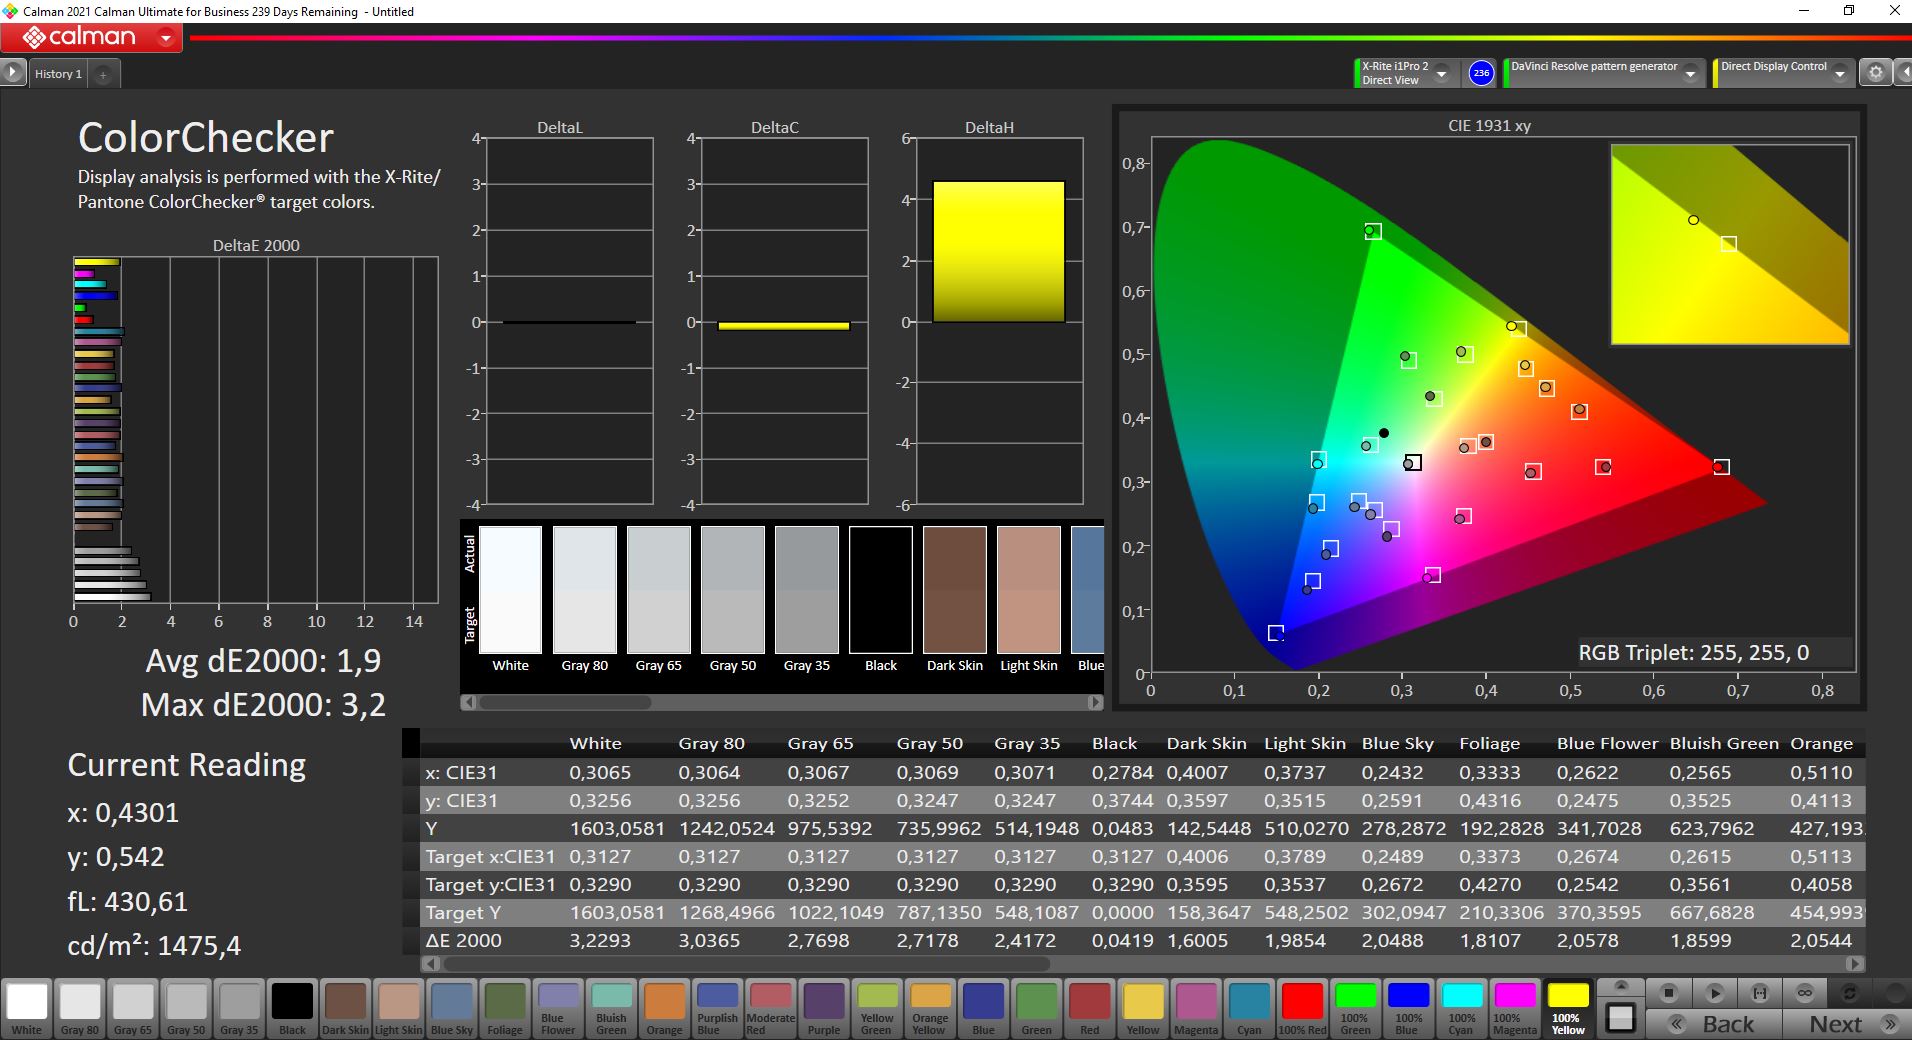
The Mini-LED screen of the MacBook Pro 14 manages brightness values of more than 1500 nits in combination with HDR contents, but is otherwise limited to around 500 nits. This is a bit annoying, especially outdoors where a higher brightness would help. There is now an app called Vivid, which removes this limitation, so you can use the maximum brightness in every situation.
We tested the app with our review unit and it works. You get an additional brightness bar and you can simply increase the brightness further with the regular brightness keys. The maximum values correspond with the HDR results. We measured more than 1100 nits on a completely white display, around 1300 nits on our website, and up to 1600 nits in a small window. If you often use your MacBook Pro outdoors and you would like a brighter image, we recommend you try the app. We also analyzed the panel with the app and there are only minor negligible differences in terms of picture quality, but the lid gets noticeably warmer. We cannot say how the use of the app will affect the lifespan of the LEDs. The battery runtime is also much shorter with the maximum brightness and our Wi-Fi test only runs for 2:28 hours before the battery is empty.

Performance - M1 Max with 24 GPU cores
Apple offers five different M1 versions for the MacBook Pro 14. The base model offers 8 CPU cores, all the other four models 10 CPU-cores. The biggest difference is the number of GPU cores, starting with 14-16 for the M1 Pro and 24 or 32 for the M1 Max. If you select the M1 max, you automatically have to pay about 500 Euros for the upgrade to 32 GB RAM as well and the model is about 1000 Euros more expensive than the entry-level version. The following table shows the five different configurations.
| SoC | CPU Cores | GPU Cores | RAM | Additional Price |
|---|---|---|---|---|
| M1 Pro | 2 Efficiency cores & 6 Performance cores | 14 | 16 or 32 GB | |
| M1 Pro | 2 Efficiency cores & 8 Performance cores | 14 | 16 or 32 GB | 230 Euros |
| M1 Pro | 2 Efficiency cores & 8 Performance cores | 16 | 16 or 32 GB | 270 Euros |
| M1 Max | 2 Efficiency cores & 8 Performance cores | 24 | 32 or 64 GB | 500 Euros |
| M1 Max | 2 Efficiency cores & 8 Performance cores | 32 | 32 or 64 GB | 730 Euros |
Our review unit with the M1 Max and 24-core GPU is the second fastest model you can get, but the CPU performance is identical to the M1 Pro models with 10 CPU cores. The only advantage of the M1 Max is the increased GPU performance and it can be configured with up to 64 GB RAM. Contrary to the review unit of the MacBook Pro 16 with the M1 Max, the MBP 14 does not offer an optional High-Performance mode.
Processor - M1 with 10 cores
We already mentioned that almost all M1 Pro and M1 Max SoCs have the same CPU part with 10 cores, only the entry-level model is equipped with a slower 8-core model. The 10 cores are distributed across three clusters: One efficiency cluster with 2 frugal cores (up to 2064 MHz) and two performance clusters with 4 fast cores each (up to 3228 MHz). We checked the performance values like the power consumption and clocks with the power metrics function and the performance is completely stable, both on battery as well as mains.
The results in the Cinebench R15 Multi loop are on par with the other M1 chips with 10 CPU cores and 28 % ahead of the base model with the 8-core M1 Pro. Cinebench R15, however, does not run natively on the M1 SoC and has to be emulated via Rosetta 2, which results in a higher power consumption of 33W for the CPU cores (40W package power) as well as a slightly reduced performance.
Cinebench R15 Multi Loop
Cinebench R23 and Geekbench, which run natively on the M1 MacBook, are better for the comparison with modern AMD and Intel CPUs. We see a power consumption of 29W (34W package) in multi-core benchmarks and the results are very competitive. The performance is just slightly behind the new Ryzen 9 6900HS in the Asus ROG Zephyrus, which uses much more power. The same applies for the Core i7-12700H, which consumes up to 100W (55W sustained) in the case of the Alienware x14. This means neither the latest chips from AMD, nor Intel, can keep up with Apple in terms of efficiency.
Single-core benchmarks pretty much paint the same picture, and only the new Alder Lake Core i7 with the new performance cores can establish a lead. However, the consumption of the i7 is significantly higher at 25W (IA cores) compared to the M1 Max at ~4W (~9W package). More CPU benchmarks are available here.
Cinebench R23: Multi Core | Single Core
Cinebench R20: CPU (Multi Core) | CPU (Single Core)
Cinebench R15: CPU Multi 64Bit | CPU Single 64Bit
Geekbench 5.5: Multi-Core | Single-Core
| CPU Performance rating | |
| Average of class Multimedia | |
| Alienware x14 i7 RTX 3060 | |
| Asus ROG Zephyrus G14 GA402RK | |
| Lenovo Yoga Slim 7 Pro 14 OLED Ryzen 9 | |
| Apple MacBook Pro 14 2021 M1 Max 24-Core GPU | |
| Average Apple M1 Max | |
| Apple MacBook Pro 16 2021 M1 Pro | |
| Apple MacBook Pro 16 2021 M1 Max | |
| Apple MacBook Pro 14 2021 M1 Pro Entry -2! | |
| Microsoft Surface Laptop Studio i7 RTX 3050 Ti | |
| Cinebench R20 / CPU (Multi Core) | |
| Average of class Multimedia (1887 - 12912, n=64, last 2 years) | |
| Alienware x14 i7 RTX 3060 | |
| Asus ROG Zephyrus G14 GA402RK | |
| Lenovo Yoga Slim 7 Pro 14 OLED Ryzen 9 | |
| Apple MacBook Pro 14 2021 M1 Max 24-Core GPU | |
| Average Apple M1 Max (2735 - 2753, n=3) | |
| Apple MacBook Pro 16 2021 M1 Max | |
| Apple MacBook Pro 16 2021 M1 Pro | |
| Microsoft Surface Laptop Studio i7 RTX 3050 Ti | |
| Cinebench R20 / CPU (Single Core) | |
| Average of class Multimedia (425 - 853, n=64, last 2 years) | |
| Alienware x14 i7 RTX 3060 | |
| Asus ROG Zephyrus G14 GA402RK | |
| Microsoft Surface Laptop Studio i7 RTX 3050 Ti | |
| Lenovo Yoga Slim 7 Pro 14 OLED Ryzen 9 | |
| Apple MacBook Pro 14 2021 M1 Max 24-Core GPU | |
| Apple MacBook Pro 16 2021 M1 Pro | |
| Average Apple M1 Max (390 - 395, n=3) | |
| Apple MacBook Pro 16 2021 M1 Max | |
| Cinebench R15 / CPU Multi 64Bit | |
| Average of class Multimedia (856 - 5224, n=68, last 2 years) | |
| Alienware x14 i7 RTX 3060 | |
| Asus ROG Zephyrus G14 GA402RK | |
| Lenovo Yoga Slim 7 Pro 14 OLED Ryzen 9 | |
| Apple MacBook Pro 16 2021 M1 Max | |
| Average Apple M1 Max (1689 - 1693, n=3) | |
| Apple MacBook Pro 16 2021 M1 Pro | |
| Apple MacBook Pro 14 2021 M1 Max 24-Core GPU | |
| Apple MacBook Pro 14 2021 M1 Pro Entry | |
| Microsoft Surface Laptop Studio i7 RTX 3050 Ti | |
| Cinebench R15 / CPU Single 64Bit | |
| Average of class Multimedia (184.8 - 326, n=66, last 2 years) | |
| Asus ROG Zephyrus G14 GA402RK | |
| Alienware x14 i7 RTX 3060 | |
| Lenovo Yoga Slim 7 Pro 14 OLED Ryzen 9 | |
| Microsoft Surface Laptop Studio i7 RTX 3050 Ti | |
| Apple MacBook Pro 14 2021 M1 Pro Entry | |
| Apple MacBook Pro 14 2021 M1 Max 24-Core GPU | |
| Apple MacBook Pro 16 2021 M1 Pro | |
| Average Apple M1 Max (197 - 210, n=3) | |
| Apple MacBook Pro 16 2021 M1 Max | |
System Performance
It is hardly surprising that the subjective performance impression of the MacBook Pro 14 with the M1 Max processor is extremely good. All inputs are executed instantly and even demanding application like Adobe Photoshop or Premiere Pro are launched without noteworthy loading times. Emulated applications via Rosetta 2 work good as well, but the subjective performance is often noticeably worse.
We also have to differ in the synthetic benchmarks, since only CrossMark and obviously the browser benchmarks run natively on the M1 SoC. The browser test results in particular are very good and the MacBook Pro 14 is also ahead of the Surface Laptop Studio in Photoshop and Premiere Pro, even though we have to use the Intel versions of the apps for the benchmarks. You immediately notice that the Apple silicon versions run better and the real-world advantage should be even bigger than the benchmarks suggest.
Photoshop PugetBench: Overall Score
Premiere Pro PugetBench: Overall Score 0.9
CrossMark: Overall | Productivity | Creativity | Responsiveness
Jetstream 2: 2.0 Total
Speedometer 2.0: Result 2.0
WebXPRT 3: Overall
Mozilla Kraken 1.1: Total
Octane V2: Total Score
| Blackmagic RAW Speed Test / 12:1 8K Metal | |
| Average of class Multimedia (78 - 430, n=7, last 2 years) | |
| Apple MacBook Pro 16 2021 M1 Max | |
| Apple MacBook Pro 14 2021 M1 Max 24-Core GPU | |
| Average Apple M1 Max, Apple M1 Max 24-Core GPU (n=1) | |
| Apple MacBook Pro 16 2021 M1 Pro | |
| Apple MacBook Pro 14 2021 M1 Pro Entry | |
| Apple MacBook Air Late 2020 (M1, 8 Core GPU, 8 GB RAM) | |
| Blackmagic RAW Speed Test / 12:1 8K CPU | |
| Average of class Multimedia (44 - 102, n=7, last 2 years) | |
| Apple MacBook Pro 16 2021 M1 Max | |
| Apple MacBook Pro 14 2021 M1 Max 24-Core GPU | |
| Average Apple M1 Max, Apple M1 Max 24-Core GPU (n=1) | |
| Apple MacBook Pro 16 2021 M1 Pro | |
| Apple MacBook Pro 14 2021 M1 Pro Entry | |
| Apple MacBook Air Late 2020 (M1, 8 Core GPU, 8 GB RAM) | |
| Photoshop PugetBench / Overall Score | |
| Apple MacBook Pro 16 2021 M1 Max | |
| Apple MacBook Pro 14 2021 M1 Max 24-Core GPU | |
| Average Apple M1 Max, Apple M1 Max 24-Core GPU (n=1) | |
| Microsoft Surface Laptop Studio i7 RTX 3050 Ti | |
| Apple MacBook Pro 16 2021 M1 Pro | |
| Apple MacBook Pro 14 2021 M1 Pro Entry | |
| Premiere Pro PugetBench / Overall Score 0.9 | |
| Apple MacBook Pro 14 2021 M1 Max 24-Core GPU | |
| Average Apple M1 Max, Apple M1 Max 24-Core GPU (n=1) | |
| Apple MacBook Pro 16 2021 M1 Max | |
| Apple MacBook Pro 14 2021 M1 Pro Entry | |
| Apple MacBook Pro 16 2021 M1 Pro | |
| Microsoft Surface Laptop Studio i7 RTX 3050 Ti | |
| CrossMark / Overall | |
| Alienware x14 i7 RTX 3060 | |
| Average of class Multimedia (866 - 2728, n=67, last 2 years) | |
| Apple MacBook Pro 14 2021 M1 Max 24-Core GPU | |
| Average Apple M1 Max, Apple M1 Max 24-Core GPU (n=1) | |
| Apple MacBook Pro 16 2021 M1 Max | |
| Apple MacBook Pro 16 2021 M1 Pro | |
| Schenker Vision 14 | |
| Apple MacBook Pro 14 2021 M1 Pro Entry | |
| Lenovo Yoga Slim 7 Pro 14 OLED Ryzen 9 | |
| Microsoft Surface Laptop Studio i7 RTX 3050 Ti | |
| CrossMark / Productivity | |
| Alienware x14 i7 RTX 3060 | |
| Average of class Multimedia (931 - 2489, n=67, last 2 years) | |
| Schenker Vision 14 | |
| Lenovo Yoga Slim 7 Pro 14 OLED Ryzen 9 | |
| Microsoft Surface Laptop Studio i7 RTX 3050 Ti | |
| Apple MacBook Pro 14 2021 M1 Max 24-Core GPU | |
| Average Apple M1 Max, Apple M1 Max 24-Core GPU (n=1) | |
| Apple MacBook Pro 16 2021 M1 Max | |
| Apple MacBook Pro 16 2021 M1 Pro | |
| Apple MacBook Pro 14 2021 M1 Pro Entry | |
| CrossMark / Creativity | |
| Apple MacBook Pro 14 2021 M1 Max 24-Core GPU | |
| Average Apple M1 Max, Apple M1 Max 24-Core GPU (n=1) | |
| Average of class Multimedia (907 - 3465, n=67, last 2 years) | |
| Apple MacBook Pro 16 2021 M1 Max | |
| Alienware x14 i7 RTX 3060 | |
| Apple MacBook Pro 16 2021 M1 Pro | |
| Apple MacBook Pro 14 2021 M1 Pro Entry | |
| Microsoft Surface Laptop Studio i7 RTX 3050 Ti | |
| Schenker Vision 14 | |
| Lenovo Yoga Slim 7 Pro 14 OLED Ryzen 9 | |
| CrossMark / Responsiveness | |
| Alienware x14 i7 RTX 3060 | |
| Average of class Multimedia (605 - 2024, n=67, last 2 years) | |
| Schenker Vision 14 | |
| Lenovo Yoga Slim 7 Pro 14 OLED Ryzen 9 | |
| Microsoft Surface Laptop Studio i7 RTX 3050 Ti | |
| Apple MacBook Pro 14 2021 M1 Max 24-Core GPU | |
| Average Apple M1 Max, Apple M1 Max 24-Core GPU (n=1) | |
| Apple MacBook Pro 16 2021 M1 Max | |
| Apple MacBook Pro 16 2021 M1 Pro | |
| Apple MacBook Pro 14 2021 M1 Pro Entry | |
| Jetstream 2 / 2.0 Total | |
| Average of class Multimedia (261 - 481, n=36, last 2 years) | |
| Alienware x14 i7 RTX 3060 | |
| Apple MacBook Pro 16 2021 M1 Max | |
| Apple MacBook Pro 16 2021 M1 Pro | |
| Average Apple M1 Max, Apple M1 Max 24-Core GPU (n=1) | |
| Apple MacBook Pro 14 2021 M1 Max 24-Core GPU | |
| Apple MacBook Pro 14 2021 M1 Pro Entry | |
| Schenker Vision 14 | |
| Lenovo Yoga Slim 7 Pro 14 OLED Ryzen 9 | |
| Microsoft Surface Laptop Studio i7 RTX 3050 Ti | |
| Speedometer 2.0 / Result 2.0 | |
| Average of class Multimedia (337 - 946, n=35, last 2 years) | |
| Apple MacBook Pro 14 2021 M1 Max 24-Core GPU | |
| Average Apple M1 Max, Apple M1 Max 24-Core GPU (n=1) | |
| Apple MacBook Pro 16 2021 M1 Pro | |
| Apple MacBook Pro 16 2021 M1 Max | |
| Apple MacBook Pro 14 2021 M1 Pro Entry | |
| Alienware x14 i7 RTX 3060 | |
| Schenker Vision 14 | |
| Microsoft Surface Laptop Studio i7 RTX 3050 Ti | |
| Lenovo Yoga Slim 7 Pro 14 OLED Ryzen 9 | |
| WebXPRT 3 / Overall | |
| Apple MacBook Pro 14 2021 M1 Max 24-Core GPU | |
| Average Apple M1 Max, Apple M1 Max 24-Core GPU (n=1) | |
| Apple MacBook Pro 16 2021 M1 Max | |
| Apple MacBook Pro 14 2021 M1 Pro Entry | |
| Apple MacBook Pro 16 2021 M1 Pro | |
| Average of class Multimedia (136.4 - 596, n=70, last 2 years) | |
| Alienware x14 i7 RTX 3060 | |
| Asus ROG Zephyrus G14 GA402RK | |
| Schenker Vision 14 | |
| Lenovo Yoga Slim 7 Pro 14 OLED Ryzen 9 | |
| Microsoft Surface Laptop Studio i7 RTX 3050 Ti | |
| Mozilla Kraken 1.1 / Total | |
| Microsoft Surface Laptop Studio i7 RTX 3050 Ti | |
| Lenovo Yoga Slim 7 Pro 14 OLED Ryzen 9 | |
| Schenker Vision 14 | |
| Asus ROG Zephyrus G14 GA402RK | |
| Alienware x14 i7 RTX 3060 | |
| Apple MacBook Pro 14 2021 M1 Max 24-Core GPU | |
| Average Apple M1 Max, Apple M1 Max 24-Core GPU (n=1) | |
| Average of class Multimedia (228 - 835, n=74, last 2 years) | |
| Apple MacBook Pro 14 2021 M1 Pro Entry | |
| Apple MacBook Pro 16 2021 M1 Pro | |
| Apple MacBook Pro 16 2021 M1 Max | |
| Octane V2 / Total Score | |
| Average of class Multimedia (64079 - 153175, n=35, last 2 years) | |
| Alienware x14 i7 RTX 3060 | |
| Schenker Vision 14 | |
| Apple MacBook Pro 14 2021 M1 Max 24-Core GPU | |
| Average Apple M1 Max, Apple M1 Max 24-Core GPU (n=1) | |
| Apple MacBook Pro 16 2021 M1 Max | |
| Apple MacBook Pro 16 2021 M1 Pro | |
| Microsoft Surface Laptop Studio i7 RTX 3050 Ti | |
| Apple MacBook Pro 14 2021 M1 Pro Entry | |
| Lenovo Yoga Slim 7 Pro 14 OLED Ryzen 9 | |
* ... smaller is better
Storage Devices
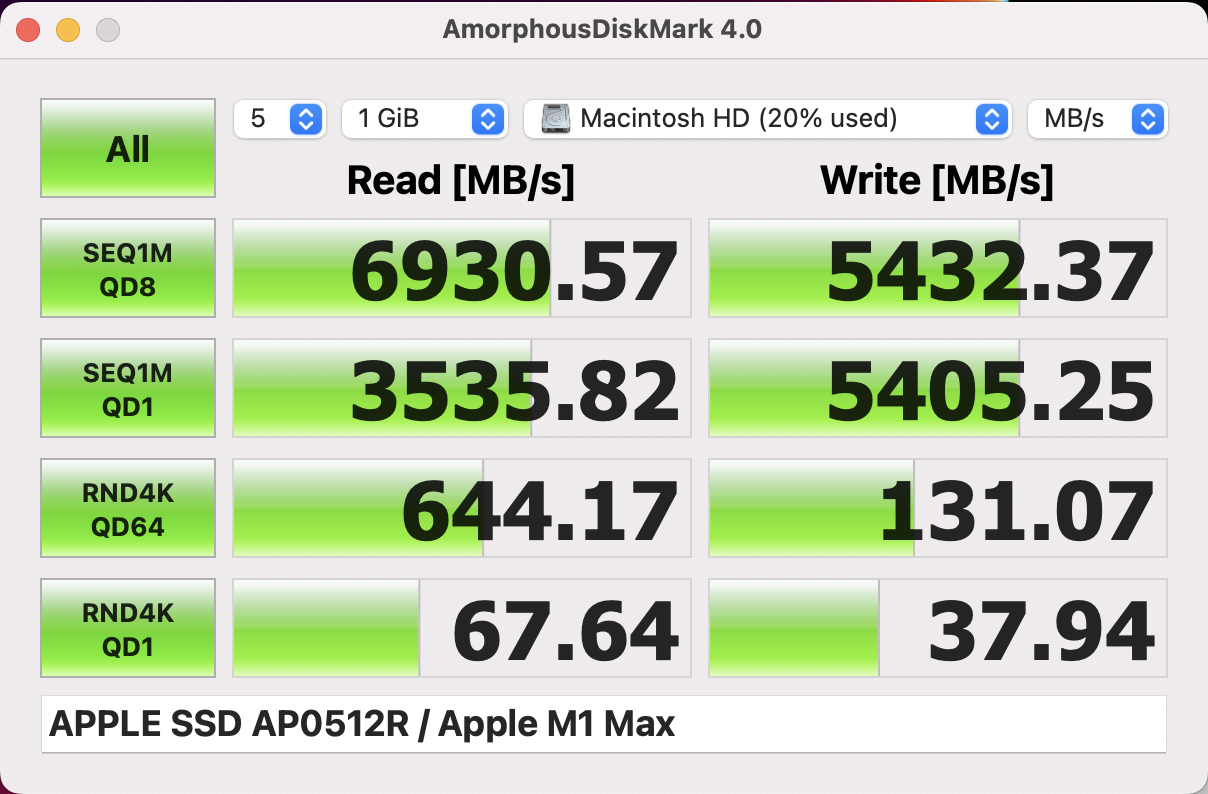
Our test unit is equipped with the default 512 GB SSD, which is attached via the modern PCIe 4.0 interface and it manages very high transfer rates. However, the SSD is slightly slower compared to the entry-level model as well as the drives with higher storage capacities in Blackmagic’s DiskSpeedTest. The difference is not big enough to be noticed in practice, though. Please see our tech section for more SSD benchmarks.
GPU Performance
While the M1 Pro is either available with 14 or 16 GPU cores, the M1 Max features 24 or 32 GPU cores. We observed a maximum power consumption of 44W for the GPU during our review of the MacBook Pro 16 with the 32-core M1 Max and now around 35W for the 24-core M1 Max. The maximum GPU clock was 1.267 MHz during our benchmarks and the MBP 14 is roughly 20 % slower than 32-core model and ~50 % faster than the entry-level version with the 14-core GPU, respectively.
This power consumption is similar to the Nvidia’s GeForce RTX 3050 Ti, which runs at 35-50W in the case of the Schenker Vision 14, for example. If we look at the 3DMark Wildlife Extreme score, however, the performance is more comparable to a fast 130W TGP version of the GeForce RTX 3060.
The performance is also completely stable, both under sustained workloads as well as on battery power. More GPU benchmarks are listed here.
Gaming Performance
Gaming is still a tricky subject. In addition to Apple’s Arcade collection, there are some native titles for the M1 (like World of Warcraft or farming Simulator 22). It is also possible to find some compatible (emulated) games via Steam or Epic Games, which were used for our benchmarks below. They once again show a performance deficit of around 20 % compared to the 32-core M1 Max. The software CrossOver is another possibility to use the full resources of the M1 SoC and it allows the installation of Windows apps like Steam including the games library. We had no problems to install Witcher 3 via Steam and it ran well with maximum settings (without Nvidia HariWorks), but we cannot offer our usual benchmark results due to the lack of fps monitoring. Games usually do not offer the typical 16:9 or even 16:10 resolutions and you will have to launch a game with an external 16:9 screen attached. You can then select the standard resolutions, even when you detach the external screen.
| low | med. | high | ultra | |
|---|---|---|---|---|
| Shadow of the Tomb Raider (2018) | 141 | 85 | 79 | 77 |
| Total War: Three Kingdoms (2019) | 201 | 96 | 62 | 46 |
| Borderlands 3 (2019) | 57.2 | 47.7 | 40.7 | 34.6 |
Emissions - MacBook Pro 14 is very quiet
System Noise
The two fans can reach the same speeds (left side: 5807, right side: 6241 rpm) and the same maximum fan noise of 49.5 dB(A) like the entry-level model, but the fan behavior has changed a bit since we reviewed the base version. The fans usually stay below 4000 rpm and up to 36 dB(A), which is a very quiet fan murmur. This is also the case in our stress test with native apps and we can only provoke the maximum fan speed with sudden changes of the load situation (when we stop the GPU load in the stress test and the CPU suddenly gets more power, for example). The fans are a bit louder with emulated apps, where the fans are often in the range between 40 up to 45 dB(A).
However, these are worst-case scenarios, and you will usually not hear more than a very quiet murmur. You also benefit from the very defensive fan curve, because the fans only start spinning as soon as the chip reaches 95 °C, which takes more than a minute at maximum CPU load, for example. You can expect around 30 dB(A) when you only stress the CPU, which was the case for Cinebench R23 Multi after three minutes. We did not hear any other electronic sounds like coil whine.
Noise level
| Idle |
| 24.8 / 24.8 / 24.8 dB(A) |
| Load |
| 30.4 / 49.5 dB(A) |
 | ||
30 dB silent 40 dB(A) audible 50 dB(A) loud |
||
min: | ||
| Apple MacBook Pro 14 2021 M1 Max 24-Core GPU M1 Max 24-Core GPU, M1 Max, Apple SSD AP0512 | Apple MacBook Pro 14 2021 M1 Pro Entry M1 Pro 14-Core GPU, M1 Pro 8-Core, Apple SSD AP0512 | Apple MacBook Pro 16 2021 M1 Pro M1 Pro 16-Core GPU, M1 Pro, Apple SSD AP1024R | Apple MacBook Pro 16 2021 M1 Max M1 Max 32-Core GPU, M1 Max, Apple SSD AP2048R | Microsoft Surface Laptop Studio i7 RTX 3050 Ti GeForce RTX 3050 Ti Laptop GPU, i7-11370H, SK Hynix PC711 1TB HFS001TDE9X084N | Lenovo Yoga Slim 7 Pro 14 OLED Ryzen 9 GeForce MX450, R9 5900HS, SK Hynix PC711 1TB HFS001TDE9X084N | |
|---|---|---|---|---|---|---|
| Noise | 4% | 6% | -4% | -4% | -8% | |
| off / environment * (dB) | 24.8 | 24.8 -0% | 24.7 -0% | 24.2 2% | 24.7 -0% | 24.7 -0% |
| Idle Minimum * (dB) | 24.8 | 24.8 -0% | 24.7 -0% | 24.2 2% | 24.7 -0% | 24.7 -0% |
| Idle Average * (dB) | 24.8 | 24.8 -0% | 24.7 -0% | 24.2 2% | 24.7 -0% | 24.7 -0% |
| Idle Maximum * (dB) | 24.8 | 24.8 -0% | 24.7 -0% | 24.2 2% | 24.7 -0% | 27.3 -10% |
| Load Average * (dB) | 30.4 | 27.8 9% | 26.1 14% | 42.9 -41% | 33.2 -9% | 41 -35% |
| Witcher 3 ultra * (dB) | 35.8 | 27.8 22% | 39.5 -10% | 44.5 -24% | 43.5 -22% | |
| Load Maximum * (dB) | 49.5 | 49.5 -0% | 37.4 24% | 42.9 13% | 46.7 6% | 43.5 12% |
* ... smaller is better
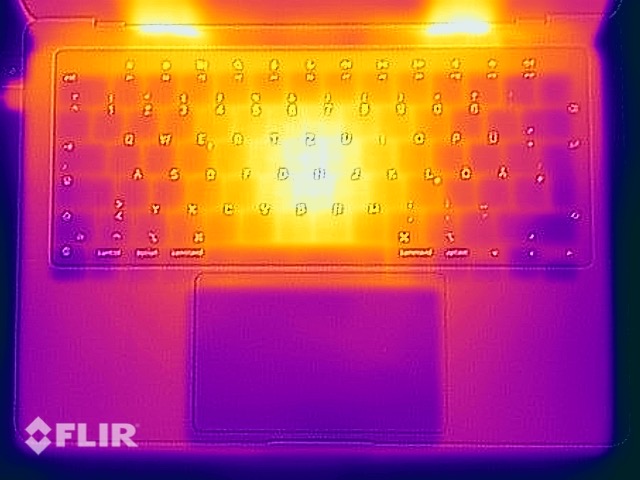
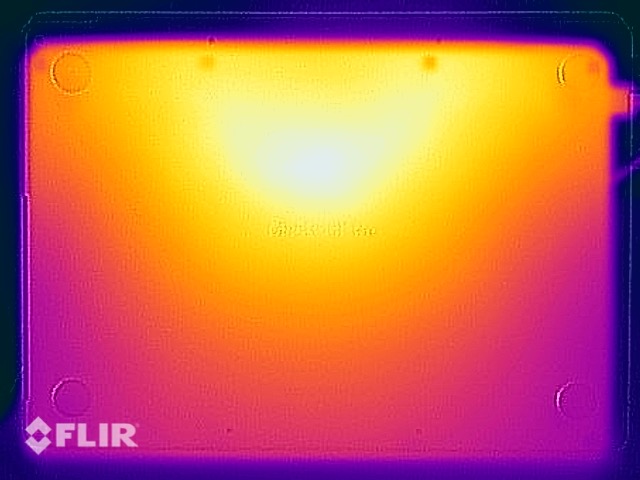
Temperature
Surface temperatures and the distribution are very similar to the base model of the MacBook Pro 14. The laptop is usually very cool in everyday scenarios and you can even put it on your lap under load without any limitations, because the bottom side only warms up to 44 °C. The upper center area of the keyboard on the other hand warms up to almost 50 °C, which can be uncomfortable during typing. The power adapter tops out at ~46 °C, which is not critical.
(-) The maximum temperature on the upper side is 49.2 °C / 121 F, compared to the average of 36.8 °C / 98 F, ranging from 21 to 71 °C for the class Multimedia.
(±) The bottom heats up to a maximum of 44.1 °C / 111 F, compared to the average of 39.1 °C / 102 F
(+) In idle usage, the average temperature for the upper side is 23.1 °C / 74 F, compared to the device average of 31.3 °C / 88 F.
(-) Playing The Witcher 3, the average temperature for the upper side is 39.5 °C / 103 F, compared to the device average of 31.3 °C / 88 F.
(+) The palmrests and touchpad are reaching skin temperature as a maximum (32.9 °C / 91.2 F) and are therefore not hot.
(-) The average temperature of the palmrest area of similar devices was 28.7 °C / 83.7 F (-4.2 °C / -7.5 F).
| Apple MacBook Pro 14 2021 M1 Max 24-Core GPU Apple M1 Max, Apple M1 Max 24-Core GPU | Apple MacBook Pro 14 2021 M1 Pro Entry Apple M1 Pro 8-Core, Apple M1 Pro 14-Core GPU | Apple MacBook Pro 16 2021 M1 Pro Apple M1 Pro, Apple M1 Pro 16-Core GPU | Apple MacBook Pro 16 2021 M1 Max Apple M1 Max, Apple M1 Max 32-Core GPU | Microsoft Surface Laptop Studio i7 RTX 3050 Ti Intel Core i7-11370H, NVIDIA GeForce RTX 3050 Ti Laptop GPU | Lenovo Yoga Slim 7 Pro 14 OLED Ryzen 9 AMD Ryzen 9 5900HS, NVIDIA GeForce MX450 | |
|---|---|---|---|---|---|---|
| Heat | 2% | 6% | 4% | 7% | -22% | |
| Maximum Upper Side * (°C) | 49.2 | 46.8 5% | 41 17% | 42.3 14% | 42.3 14% | 44.5 10% |
| Maximum Bottom * (°C) | 44.1 | 40.9 7% | 39 12% | 41.7 5% | 38.2 13% | 56.4 -28% |
| Idle Upper Side * (°C) | 23.5 | 24.2 -3% | 24 -2% | 23.9 -2% | 23.4 -0% | 29.1 -24% |
| Idle Bottom * (°C) | 23.6 | 24.2 -3% | 24 -2% | 23.9 -1% | 23.5 -0% | 34 -44% |
* ... smaller is better
Stress test
We managed to get observe a maximum package power of 86-90W when we reviewed the larger MacBook Pro 16 with the 32-core M1 Max. The CPU performance of the smaller M1 Max is identical and the GPU consumes about 10W less according to our measurements, so we expected a package power of around 75-80W in combined workloads. This is not the case though and the performance is much more limited compared to the larger MBP 16.
Both the CPU and the GPU consume about 22W (54W package) at the beginning of our stress test, but this value drops to just 12W for the CPU (~2 GHz on all cores) after a couple of seconds, while the GPU maintains around 20W (~900 MHz) for a total package power of ~42W. This is comparable to the entry-level model of the MacBook Pro 14 with the M1 Pro, but the power distribution differs a bit (~20W CPU & 15W GPU). This means the M1 Max offers slightly more GPU performance during the stress test, but also less CPU performance and it is pretty far away from its potential performance. The optional energy-saver mode limits the package power to just 22W (5W CPU & 9W GPU).
All in all, this is a rather disappointing results since the fans certainly have plenty of headroom. If you pay a lot of money for the M1 Max, you will probably want to use the performance in combined workload scenarios, which is not possible here. The power consumption already hits 97W at the beginning of the stress test, which is the limit of the PSU. Apple does not offer a more powerful power adapter for the MacBook Pro 14, so we expect the MBP 14 with the 32-core M1 Max will show a similar behavior. Unfortunately, we could not test the 140W power adapter due to supple issues, we would have liked to check the performance with the more powerful PSU.
Energy Management - M1 Max needs more power
Power Consumption
Our idle measurements show that the M1 Max consumes slightly more power than the base model of the MBP 14 with the M1 Pro. We record a maximum consumption of 97.7W for a short moment, which already seems to be limited by the 96W power adapter. The consumption levels off at around 76W after a couple of seconds. We would have liked to test the behavior with the 140W PSU, but we unfortunately could not get one for testing.
| Off / Standby | |
| Idle | |
| Load |
|
Key:
min: | |
| Apple MacBook Pro 14 2021 M1 Max 24-Core GPU M1 Max, M1 Max 24-Core GPU, Apple SSD AP0512, Mini-LED, 3024x1964, 14.2" | Apple MacBook Pro 14 2021 M1 Pro Entry M1 Pro 8-Core, M1 Pro 14-Core GPU, Apple SSD AP0512, Mini-LED, 3024x1964, 14.2" | Apple MacBook Pro 16 2021 M1 Pro M1 Pro, M1 Pro 16-Core GPU, Apple SSD AP1024R, Mini-LED, 3456x2234, 16.2" | Apple MacBook Pro 16 2021 M1 Max M1 Max, M1 Max 32-Core GPU, Apple SSD AP2048R, Mini-LED, 3456x2234, 16.2" | Microsoft Surface Laptop Studio i7 RTX 3050 Ti i7-11370H, GeForce RTX 3050 Ti Laptop GPU, SK Hynix PC711 1TB HFS001TDE9X084N, IPS, 2400x1600, 14.4" | Lenovo Yoga Slim 7 Pro 14 OLED Ryzen 9 R9 5900HS, GeForce MX450, SK Hynix PC711 1TB HFS001TDE9X084N, OLED, 2880x1800, 14" | Average Apple M1 Max 24-Core GPU | Average of class Multimedia | |
|---|---|---|---|---|---|---|---|---|
| Power Consumption | 16% | -16% | -44% | 10% | -43% | 0% | -16% | |
| Idle Minimum * (Watt) | 3.2 | 2.9 9% | 5 -56% | 5.4 -69% | 2.6 19% | 9.5 -197% | 3.2 ? -0% | 5.71 ? -78% |
| Idle Average * (Watt) | 12.6 | 11.6 8% | 15.1 -20% | 16.4 -30% | 7.1 44% | 14.1 -12% | 12.6 ? -0% | 10.1 ? 20% |
| Idle Maximum * (Watt) | 13 | 11.9 8% | 15.5 -19% | 16.7 -28% | 7.9 39% | 14.9 -15% | 13 ? -0% | 12.4 ? 5% |
| Load Average * (Watt) | 57.9 | 49.5 15% | 54 7% | 94 -62% | 76.8 -33% | 79.5 -37% | 57.9 ? -0% | 65 ? -12% |
| Witcher 3 ultra * (Watt) | 76.3 | 58.2 24% | 104 -36% | 83 -9% | 73.5 4% | |||
| Load Maximum * (Watt) | 97.7 | 68.5 30% | 90 8% | 135 -38% | 97.3 -0% | 98.5 -1% | 97.7 ? -0% | 112.2 ? -15% |
* ... smaller is better
Power Consumption Witcher 3 / Stress test
Power Consumption external screen
Battery Runtime
The higher idle consumption already indicated shorter runtimes and our battery tests confirm that the MacBook Pro 14 with the M1 Max SoC does not last as long as the base model. Our Wi-Fi test at 150 nits (minus 7 large and 2 small steps from the maximum brightness) determines around 11.5 hours and only ~5.5 hours at the maximum brightness. Video playback at 150 nits is possible for more than 13 hours.
The HDR playback of YouTube videos was deactivated shortly after the launch due to some issues, but now it is no problem to watch HDR videos. At the maximum brightness, our HDR test video runs for 3:47 hours, which is 20 minutes shorter compared to the entry-level model.
There is no fast charging, even with the 96W power adapter. A full recharge takes 1 hour and 43 minutes when the laptop is turned on (30 % after 21 minutes, 50 % after 31 minutes, 80 % after 57 minutes).
| Apple MacBook Pro 14 2021 M1 Max 24-Core GPU M1 Max, M1 Max 24-Core GPU, 69.9 Wh | Apple MacBook Pro 14 2021 M1 Pro Entry M1 Pro 8-Core, M1 Pro 14-Core GPU, 69.9 Wh | Apple MacBook Pro 16 2021 M1 Pro M1 Pro, M1 Pro 16-Core GPU, 99.6 Wh | Apple MacBook Pro 16 2021 M1 Max M1 Max, M1 Max 32-Core GPU, 99.6 Wh | Microsoft Surface Laptop Studio i7 RTX 3050 Ti i7-11370H, GeForce RTX 3050 Ti Laptop GPU, 58 Wh | Lenovo Yoga Slim 7 Pro 14 OLED Ryzen 9 R9 5900HS, GeForce MX450, 61 Wh | Average of class Multimedia | |
|---|---|---|---|---|---|---|---|
| Battery runtime | 21% | 46% | 34% | -15% | -53% | 20% | |
| H.264 (h) | 12.1 | 15 24% | 17.5 45% | 17 40% | 12.3 2% | 16.4 ? 36% | |
| WiFi v1.3 (h) | 11.6 | 13.6 17% | 16.9 46% | 14.9 28% | 8 -31% | 5.5 -53% | 12 ? 3% |
| Load (h) | 1.2 | 1.1 | 1 | 1.675 ? |
Pros
Cons
Verdict - M1 Max is limited in the MacBook Pro 14
Apple’s MacBook Pro 14 with the M1 Max is once again a very good multimedia notebook and both the CPU as well as the GPU performance are noticeably better compared to the entry-level model. We are particularly impressed by the efficiency, which is unrivaled right now and neither AMD, Intel, nor Nvidia can keep up right now. The performance results are very good in the respective categories (CPU & GPU), but we were surprised by the limited performance in combined workloads, where the M1 Max falls to the level of the entry-level MBP 14. The larger MacBook Pro 16 did not limit the performance. This is surprising since the fans still have plenty of headroom and you will most likely use the additional performance of the M1 Max if you pay the high premium. It seems that the power adapter might once again be a limiting factor since our review unit already hit the limitation of the 96W adapter for a short moment. The more powerful M1 Max with 32 GPU cores should not be much faster under combined stress, either. The larger 16-inch MBP with the 140W power adapter does not have these issues.
The M1 Max offers a lot of performance in the MacBook Pro 14, but it is limited in combined workloads, which is probably a result of the 96W power adapter. If you want to utilize the full potential of the M1 Max, you should get the larger MacBook Pro 16.
The M1 Max also consumes slightly more power, which affects the battery runtime. The MacBook Pro 14 with the M1 Pro is probably the better and also less expensive choice for many users. The MBP 14 with the M1 Max is still a very good laptop, but you should be sure that you need the additional GPU performance and/or 64 GB RAM. We would recommend the upgrade to the M1 Pro with 10 CPU cores instead.
Price and Availability
The availability of the new MacBook Pro models is still limited. You can order our review configuration from Apple for $2899, but it will take 4-5 weeks for the delivery.
Apple MacBook Pro 14 2021 M1 Max 24-Core GPU
- 04/06/2022 v7 (old)
Andreas Osthoff
Price comparison
