 Deutsch
 English
 Español
 Français
 Italiano
 Nederlands
 Polski
 Português
 Русский
 Türkçe
 Svenska
 Chinese
 Magyar
Intel Core m3-7Y30 vs AMD A12-9720P
Intel Core m3-7Y30
► remove from comparisonThe Intel Core m3-7Y30 is a very efficient dual-core SoC for tablets and passively cooled notebooks based on the Kaby Lake architecture and was announced in the end of August 2016. The CPU consists of two processor cores clocked at 1.0-2.6 GHz (2-core Turbo not specified yet). Thanks to Hyper Threading, the processor can execute up to four threads simultaneously. The chips also includes the Intel HD Graphics 615 GPU, a dual-channel memory controller (DDR3L/LPDDR3) as well as VP9 and H.265 video de- and encoder. It is still produced in a 14 nm process with FinFET transistors.
Architecture
Intel basically used the familiar micro architecture from the Skylake generation, so the per-MHz performance is identical. Only the Speed-Shift technology for faster dynamic adjustments of the voltages and clocks was improved, and the matured 14 nm process now also enables much higher frequencies and better efficiency than before.
Performance
Since Intel basically removed the Core m5 and Core m7 series or included them into the higher i5 and i7 series, respectively, the m3-7Y30 is officially the last Core-m chip. Thanks to its high Turbo clock, the 7Y30 can sometimes keep up with the 15 Watt models for short peak load and single-thread scenarios, but the clocks will drop significantly under sustained workloads. The CPU is still suitable for many more demanding applications as well as multitasking. Thanks to the improved efficiency, the CPU can often even beat the Core m5 and m7 siblings from the previous Skylake generation.
Graphics
The integrated Intel HD Graphics 615 GPU has 24 Execution Units (EUs) like the old HD Graphics 515 and runs with clocks between 300 and 900 MHz in combination with this processor. The performance heavily depends on the TDP limit as well as the memory configuration; with fast LPDDR3-1866 RAM in dual-channel mode, the GPU should sometimes be able to compete with the HD Graphics 520, but can also be much slower in other scenarios. Modern games from 2016 will, if at all, only run smoothly in the lowest settings.
Contrary to Skylake, Kaby Lake now also supports hardware decoding for H.265/HEVC Main10 with a 10-bit color depth as well as Google's VP9 codec.
Power Consumption
The chip is manufactured in an improved 14 nm process with FinFET transistors, so the power efficiency was once again improved significantly. The typical TDP for the Y-series is specified at 4.5 Watts, and can be adjusted in both directions depending on the usage scenario.
AMD A12-9720P
► remove from comparison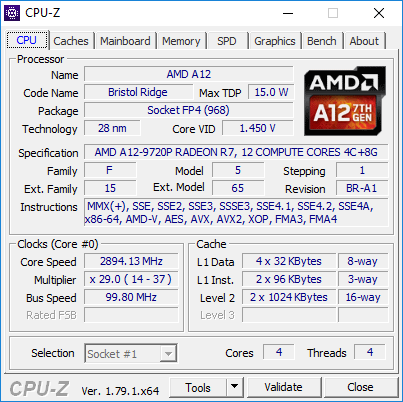
The AMD A12-9720P is a mainstream SoC from the Bristol Ridge APU series for notebooks (7th APU generation), which was introduced in 2017. The ULV chip with a TDP of 15 Watts (can be configured to 12 Watts, not verified) has four CPU cores (two Excavator modules) clocked at 2.7 - 3.8 GHz (4.05 GHz for single core were briefly achievable in our test sample), a Radeon R7 iGPU as well as a dual-channel DDR4-1866 memory controller. Carrizo is a full-fledged SoC and is also equipped with an integrated chipset, which provides all I/0 ports.
Architecture
Bristol Ridge is the successor of the Carrizo architecture and the design is almost identical. Thanks to optimized manufacturing processes and more aggressive Boost behavior, however, the clocks are a bit higher at the same power consumption. The memory controller now also supports DDR4-RAM, in this case up to 1866 MHz. More technical details are available in the following articles:
Performance
The average A12-9720P in our database is in the same league as the Core i5-4210U, as far as multi-thread benchmark scores are concerned, making the former a fairly slow chip that's suitable for basic day-to-day activities only as of late 2022.
Graphics
The integrated Radeon R7 (Bristol Ridge) GPU has 512 active shader units (8 compute cores) clocked at up to 758 MHz. Thanks to the better utilization of the clock range as well as faster DDR4-RAM, the GPU can slightly beat its predecessors Radeon R7 (Carrizo) and competes with a dedicated GeForce 920MX in the best-case scenario (dual-channel memory, low CPU requirements). Many games from 2015/2016 can be played smoothly at low settings.
Power Consumption
AMD specifies the TDP of the A12-9720P with 15 Watts, which is comparable to Intel's ULV models. This means the CPU is a good choice for thin notebooks starting with a 12-inch screen.
| Model | Intel Core m3-7Y30 | AMD A12-9720P | ||||||||||||||||||||||||||||||||||||||||||||||||||||||||||||||||||||||||||||||||||||||||||||||||||||||||||||||||||||||||||||||||||||||||||||||||||||||||||||||||||||||||||||||||||||||||||||||||||||||||||||
| Series | Intel Kaby Lake | AMD Bristol Ridge | ||||||||||||||||||||||||||||||||||||||||||||||||||||||||||||||||||||||||||||||||||||||||||||||||||||||||||||||||||||||||||||||||||||||||||||||||||||||||||||||||||||||||||||||||||||||||||||||||||||||||||||
| Codename | Kaby Lake | Bristol Ridge | ||||||||||||||||||||||||||||||||||||||||||||||||||||||||||||||||||||||||||||||||||||||||||||||||||||||||||||||||||||||||||||||||||||||||||||||||||||||||||||||||||||||||||||||||||||||||||||||||||||||||||||
| Series: Bristol Ridge Bristol Ridge |
|
| ||||||||||||||||||||||||||||||||||||||||||||||||||||||||||||||||||||||||||||||||||||||||||||||||||||||||||||||||||||||||||||||||||||||||||||||||||||||||||||||||||||||||||||||||||||||||||||||||||||||||||||
| Clock | 1000 - 2600 MHz | 2700 - 3600 MHz | ||||||||||||||||||||||||||||||||||||||||||||||||||||||||||||||||||||||||||||||||||||||||||||||||||||||||||||||||||||||||||||||||||||||||||||||||||||||||||||||||||||||||||||||||||||||||||||||||||||||||||||
| L1 Cache | 128 KB | |||||||||||||||||||||||||||||||||||||||||||||||||||||||||||||||||||||||||||||||||||||||||||||||||||||||||||||||||||||||||||||||||||||||||||||||||||||||||||||||||||||||||||||||||||||||||||||||||||||||||||||
| L2 Cache | 512 KB | 2 MB | ||||||||||||||||||||||||||||||||||||||||||||||||||||||||||||||||||||||||||||||||||||||||||||||||||||||||||||||||||||||||||||||||||||||||||||||||||||||||||||||||||||||||||||||||||||||||||||||||||||||||||||
| L3 Cache | 4 MB | |||||||||||||||||||||||||||||||||||||||||||||||||||||||||||||||||||||||||||||||||||||||||||||||||||||||||||||||||||||||||||||||||||||||||||||||||||||||||||||||||||||||||||||||||||||||||||||||||||||||||||||
| Cores / Threads | 2 / 4 | 4 / 4 | ||||||||||||||||||||||||||||||||||||||||||||||||||||||||||||||||||||||||||||||||||||||||||||||||||||||||||||||||||||||||||||||||||||||||||||||||||||||||||||||||||||||||||||||||||||||||||||||||||||||||||||
| TDP | 4.5 Watt | 15 Watt | ||||||||||||||||||||||||||||||||||||||||||||||||||||||||||||||||||||||||||||||||||||||||||||||||||||||||||||||||||||||||||||||||||||||||||||||||||||||||||||||||||||||||||||||||||||||||||||||||||||||||||||
| Technology | 14 nm | 28 nm | ||||||||||||||||||||||||||||||||||||||||||||||||||||||||||||||||||||||||||||||||||||||||||||||||||||||||||||||||||||||||||||||||||||||||||||||||||||||||||||||||||||||||||||||||||||||||||||||||||||||||||||
| max. Temp. | 100 °C | 90 °C | ||||||||||||||||||||||||||||||||||||||||||||||||||||||||||||||||||||||||||||||||||||||||||||||||||||||||||||||||||||||||||||||||||||||||||||||||||||||||||||||||||||||||||||||||||||||||||||||||||||||||||||
| Socket | BGA | FP4 | ||||||||||||||||||||||||||||||||||||||||||||||||||||||||||||||||||||||||||||||||||||||||||||||||||||||||||||||||||||||||||||||||||||||||||||||||||||||||||||||||||||||||||||||||||||||||||||||||||||||||||||
| Features | Dual-Channel DDR3L-1600/LPDDR3-1866 Memory Controller, HyperThreading, AVX, AVX2, Quick Sync, Virtualization, AES-NI, TXT | DDR4-1866 RAM, PCIe 3, MMX, SSE, SSE2, SSE3, SSSE3, SSE4A, SSE4.1, SSE4.2, AVX, AVX2, BMI2, ABM, TBM, FMA4, XOP, SMEP, CPB, AES-NI, RDRAND | ||||||||||||||||||||||||||||||||||||||||||||||||||||||||||||||||||||||||||||||||||||||||||||||||||||||||||||||||||||||||||||||||||||||||||||||||||||||||||||||||||||||||||||||||||||||||||||||||||||||||||||
| iGPU | Intel HD Graphics 615 (300 - 900 MHz) | AMD Radeon R7 (Bristol Ridge) ( - 758 MHz) | ||||||||||||||||||||||||||||||||||||||||||||||||||||||||||||||||||||||||||||||||||||||||||||||||||||||||||||||||||||||||||||||||||||||||||||||||||||||||||||||||||||||||||||||||||||||||||||||||||||||||||||
| Architecture | x86 | x86 | ||||||||||||||||||||||||||||||||||||||||||||||||||||||||||||||||||||||||||||||||||||||||||||||||||||||||||||||||||||||||||||||||||||||||||||||||||||||||||||||||||||||||||||||||||||||||||||||||||||||||||||
| $281 U.S. | ||||||||||||||||||||||||||||||||||||||||||||||||||||||||||||||||||||||||||||||||||||||||||||||||||||||||||||||||||||||||||||||||||||||||||||||||||||||||||||||||||||||||||||||||||||||||||||||||||||||||||||||
| Announced | ||||||||||||||||||||||||||||||||||||||||||||||||||||||||||||||||||||||||||||||||||||||||||||||||||||||||||||||||||||||||||||||||||||||||||||||||||||||||||||||||||||||||||||||||||||||||||||||||||||||||||||||
| Manufacturer | ark.intel.com | |||||||||||||||||||||||||||||||||||||||||||||||||||||||||||||||||||||||||||||||||||||||||||||||||||||||||||||||||||||||||||||||||||||||||||||||||||||||||||||||||||||||||||||||||||||||||||||||||||||||||||||
| Transistors | 3100 Million | |||||||||||||||||||||||||||||||||||||||||||||||||||||||||||||||||||||||||||||||||||||||||||||||||||||||||||||||||||||||||||||||||||||||||||||||||||||||||||||||||||||||||||||||||||||||||||||||||||||||||||||
| Die Size | 250 mm2 |
