Notebookcheck Logo

Intel Core i3-1125G4 vs Intel Celeron N3050 vs Intel Core i5-1145G7

Intel Core i3-1125G4

► remove from comparison Intel i3-1125G4

The Intel Core i3-1125G4 is a 28 W quad-core SoC for laptops and Ultrabooks of the Tiger Lake family (UP3) that was introduced in September 2020. It integrates four Willow Cove processor cores (8 threads thanks to Hyper-Threading). Each core can clock from 2 GHz (guaranteed base speed @ 28 W) to 3.7 GHz (single-core boost). All cores at once can clock at up to 3.3 GHz. The faster Core i7 models offer more Level 3 cache (12 versus 8 MB in the i5) and higher clocked cores.

Another novelty is the integrated Xe GPU based on the completely new Gen 12 architecture. In the i3-1125G4 Intel names the GPU UHD Graphics and offers only 48 of the 96 EUs clocked at 400 - 1250 MHz. The GPU and CPU can together use the 8 MB of L3 cache.

Furthermore, Tiger Lake SoCs add PCIe 4 support (four lanes), AI hardware acceleration, and the partial integration of Thunderbolt 4 / USB 4 and Wi-Fi 6 in the chip.

Performance

While we have not tested a single laptop built around the 1125G4 as of October 2023, we expect the chip's multi-thread performance to be 10% to 20% lower than that of the Core i5-1135G7 (4 cores, 8 threads, somewhat higher clock speeds).

Your mileage may vary depending on how high the CPU power limits are and how competent the cooling solution of your system is.

Power consumption

This Core i3 series chip has a default TDP of 12 W to 28 W, the expectation being that laptop makers will go for a higher value in exchange for higher performance. Either way, that's a little too high to allow for passively cooled designs.

The i3-1125G4 is manufactured on Intel's third-gen 10 nm process marketed as SuperFin for average, as of early 2023, energy efficiency.

Intel Celeron N3050

► remove from comparison Intel N3050

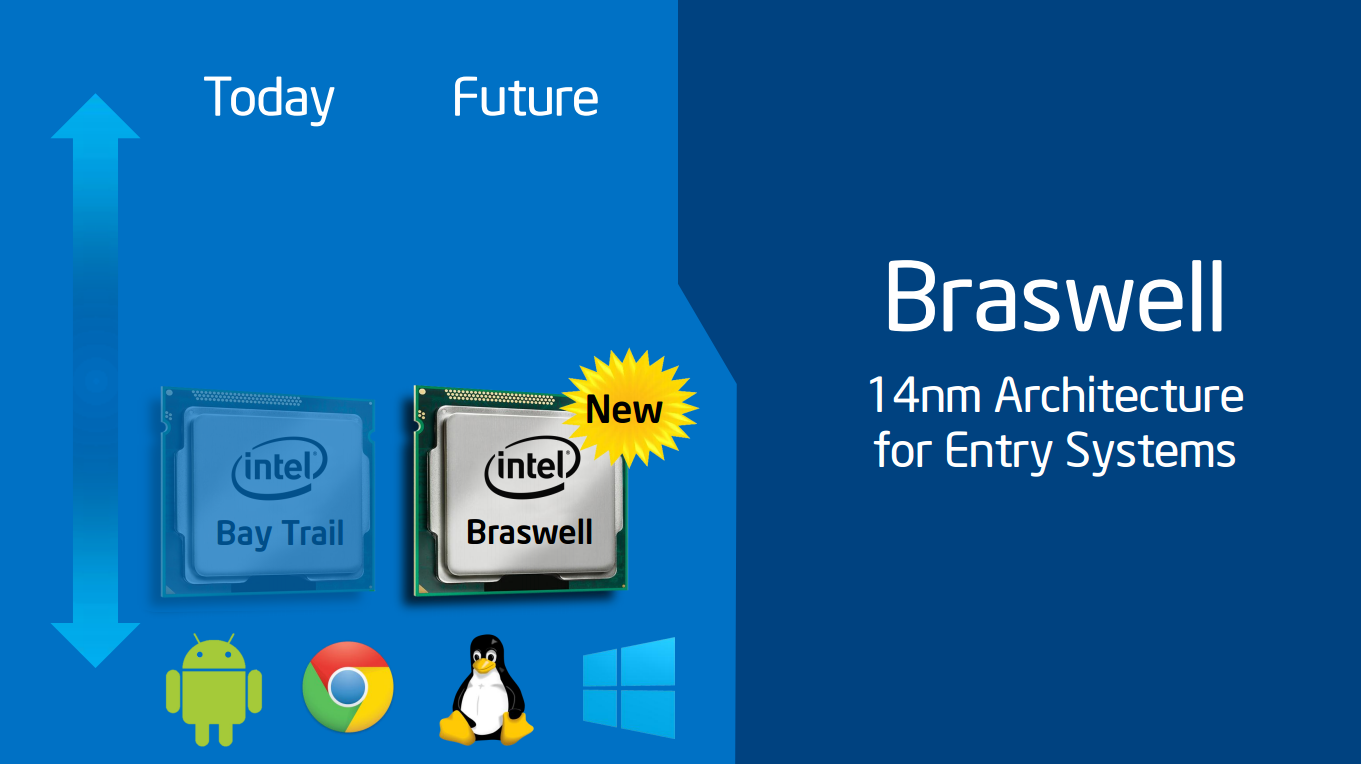
The Intel Celeron N3050 is a low-end dual-core SoC for notebooks, which has been presented in April 2015. It is clocked at 1.6 - 2.16 GHz and part of the Braswell platform. Thanks to its new 14 nanometer low-power process (P1273) with tri-gate transistors, energy efficiency has been significantly improved compared to its predecessor Bay Trail (e.g. Celeron N2840). In addition to the CPU cores, the SoC offers a DirectX 11.2-capable GPU as well as a DDR3L Memory Controller (2x 64 bit, 25.6 GB/s).

Architecture

The processor cores are based on the Airmont architecture, which is basically a slightly modified shrink of the previous Silvermont core. While performance per clock has not been improved, the more efficient 14 nm process leads to a better utilization of the CPU Burst (alias Turbo Boost) and a therefore somewhat higher overall performance.

Performance

Compared to its predecessor Celeron N2815 (1.86 - 2.13 GHz), the N3050 offers an almost identical performance. Using Windows, the CPU is adequate for simple everyday tasks such as light Internet browsing or office applications, but not for complex software or modern games.

Graphics

The HD Graphics (Braswell) is based on the Intel Gen8 architecture, which supports DirectX 11.2 and is also found in the Broadwell series (e.g. HD Graphics 5300). With 12 EUs (Execution Units) and a clock speed of up to 600 MHz, the GPU is almost twice as fast as the HD Graphics (Bay Trail), but still not powerful enough to handle modern 3D games. The GPU also supports 4K/H.265 video acceleration.

Power Consumption

The entire SoC is rated at an TDP of 6 watts (SDP 4 watts). Thus, the chip can be cooled passively.

Intel Core i5-1145G7

► remove from comparison Intel i5-1145G7

The Intel Core i5-1145G7 is a power efficient quad-core SoC for laptops and Ultrabooks based on the Tiger Lake-U generation that was announced early 2021. It integrates four Willow Cove processor cores (8 threads thanks to HyperThreading). The base clock speed depends on the TDP settings and ranges from 1.1 GHz (12 Watt TDP) up to 2.6 GHz (28 Watt). The Boost is always specified at 4.4 GHz (one or two cores).

Another novelty is the integrated Xe graphics card with 80 EUs based on the completely new Gen 12 architecture. It offers a significantly higher performance compared to the older Iris Plus G7 (Ice Lake).

Furthermore, Tiger Lake SoCs add PCIe 4 support (4 lanes), AI hardware acceleration, and the partial integration of Thunderbolt 4 / USB 4 and Wifi 6 in the chip. In addition to this, the i5 supports vPro for easy remote management.

The chip is produced on the improved 10nm SuperFin process at Intel that should be comparable to the 7nm process at TSMC (e.g. Ryzen 4000 series).

All articles on Tiger Lake can be found on our Tiger Lake architecture hub.

ModelIntel Core i3-1125G4Intel Celeron N3050Intel Core i5-1145G7
SeriesIntel Tiger LakeIntel CeleronIntel Tiger Lake
CodenameTiger Lake-UP3BraswellTiger Lake-UP3
Series: Tiger Lake Tiger Lake-UP3
Intel Core i7-1195G72.9 - 5 GHz4 / 8 cores12 MB L3
Intel Core i7-1185G73 - 4.8 GHz4 / 8 cores12 MB L3
Intel Core i7-1165G72.8 - 4.7 GHz4 / 8 cores12 MB L3
Intel Core i5-1155G72.5 - 4.5 GHz4 / 8 cores8 MB L3
Intel Core i5-1145G72.6 - 4.4 GHz4 / 8 cores8 MB L3
Intel Core i5-1135G72.4 - 4.2 GHz4 / 8 cores8 MB L3
Intel Core i3-1125G4 « 2 - 3.7 GHz4 / 8 cores8 MB L3
Intel Core i3-1115G43 - 4.1 GHz2 / 4 cores6 MB L3
Intel Celeron N31601.6 - 2.24 GHz4 / 4 cores
Intel Celeron N31501.6 - 2.08 GHz4 / 4 cores
Intel Celeron N30601.6 - 2.48 GHz2 / 2 cores
Intel Celeron N3050 « 1.6 - 2.16 GHz2 / 2 cores
Intel Celeron N30001.04 - 2.08 GHz2 / 2 cores
Intel Core i7-1195G72.9 - 5 GHz4 / 8 cores12 MB L3
Intel Core i7-1185G73 - 4.8 GHz4 / 8 cores12 MB L3
Intel Core i7-1165G72.8 - 4.7 GHz4 / 8 cores12 MB L3
Intel Core i5-1155G72.5 - 4.5 GHz4 / 8 cores8 MB L3
Intel Core i5-1145G7 « 2.6 - 4.4 GHz4 / 8 cores8 MB L3
Intel Core i5-1135G72.4 - 4.2 GHz4 / 8 cores8 MB L3
Intel Core i3-1125G42 - 3.7 GHz4 / 8 cores8 MB L3
Intel Core i3-1115G43 - 4.1 GHz2 / 4 cores6 MB L3
Clock2000 - 3700 MHz1600 - 2160 MHz2600 - 4400 MHz
L1 Cache320 KB320 KB
L2 Cache5 MB2 MB5 MB
L3 Cache8 MB8 MB
Cores / Threads4 / 82 / 24 / 8
TDP28 Watt6 Watt28 Watt
Technology10 nm14 nm10 nm
max. Temp.100 °C90 °C100 °C
SocketBGA1449FCBGA1170BGA1449
FeaturesDDR4-3200/LPDDR4x-3733 RAM, PCIe 4, 4 GT/s bus, DL Boost, GNA, MMX, SSE, SSE2, SSE3, SSSE3, SSE4.1, SSE4.2, AVX, AVX2, AVX-512, BMI2, ABM, FMA, ADX, VMX, SMX, SMEP, SMAP, EIST, TM1, TM2, Hyper-Threading, Turbo, SST, AES-NI, RDRAND, RDSEED, SHA, TMEIntel HD Graphics (Braswell, 12 EUs, 320 - 600 MHz), Wireless Display, Quick Sync, AES-NI, max. 8 GB Dual-Channel DDR3L-1600 (25,6 GB/s), 5x USB 3.0, 4x PCIe 2.0, 2x SATA 6.0 Gbit/sDDR4-3200/LPDDR4x-4266 RAM, PCIe 4, 4 GT/s bus, DL Boost, GNA, vPro, MMX, SSE, SSE2, SSE3, SSSE3, SSE4.1, SSE4.2, AVX, AVX2, AVX-512, BMI2, ABM, FMA, ADX, VMX, SMX, SMEP, SMAP, EIST, TM1, TM2, HT, Turbo, SST, AES-NI, RDRAND, RDSEED, SHA, TME
iGPUIntel UHD Graphics Xe G4 48EUs (400 - 1250 MHz)Intel HD Graphics (Braswell) (320 - 600 MHz)Intel Iris Xe Graphics G7 80EUs (400 - 1300 MHz)
Architecturex86x86x86
Announced
Manufacturerark.intel.comark.intel.comark.intel.com
$107 U.S.

Benchmarks

Performance Rating - CB R15 + R20 + 7-Zip + X265 + Blender + 3DM11 CPU - i5-1145G7
32.8 pt (45%)
Cinebench R23 - Cinebench R23 Multi Core
min: 4769     avg: 4880     median: 4880 (5%)     max: 4991 Points
Cinebench R23 - Cinebench R23 Single Core
min: 1361     avg: 1375     median: 1374.5 (58%)     max: 1388 Points
Cinebench R20 - Cinebench R20 CPU (Single Core)
531 Points (59%)
Cinebench R20 - Cinebench R20 CPU (Multi Core)
min: 1693     avg: 1842     median: 1841.5 (4%)     max: 1990 Points
1266%
1 i5-1145G7 +
min: 791     avg: 792     median: 791.5 (5%)     max: 792 Points
min: 202     avg: 202.5     median: 202.5 (61%)     max: 203 Points
1173%
1 i5-1145G7 +
min: 9.12     avg: 9.3     median: 9.3 (12%)     max: 9.41 Points
min: 2.26     avg: 2.3     median: 2.3 (57%)     max: 2.36 Points
min: 8225     avg: 8275     median: 8274.5 (50%)     max: 8324 Points
1238%
1 i5-1145G7 +
min: 25475     avg: 25545     median: 25545 (19%)     max: 25615 Points
Cinebench R10 - Cinebench R10 Rend. Multi (64bit)
100%
1 N3050 +
min: 2935     avg: 2943     median: 2943 (2%)     max: 2951 Points
1169%
1 i5-1145G7 +
min: 33427     avg: 34400     median: 34399.5 (24%)     max: 35372 Points
Cinebench R10 - Cinebench R10 Rend. Single (64bit)
100%
1 N3050 +
min: 1568     avg: 1573     median: 1572.5 (2%)     max: 1577 Points
min: 10472     avg: 10648     median: 10648 (13%)     max: 10824 Points
wPrime 2.10 - wPrime 2.0 1024m *
100%
1 N3050 +
min: 1740     avg: 1757     median: 1757 (21%)     max: 1773 s
min: 227.285     avg: 281.1     median: 281.1 (3%)     max: 335 s
wPrime 2.10 - wPrime 2.0 32m *
100%
1 N3050 +
min: 52     avg: 54.4     median: 55.2 (11%)     max: 56.1 s
min: 6.499     avg: 8.4     median: 8.3 (2%)     max: 10.2 s
WinRAR - WinRAR 4.0
100%
1 N3050 +
min: 514     avg: 548     median: 529 (1%)     max: 619 Points
min: 4190     avg: 4707     median: 4706.5 (7%)     max: 5223 Points
7-Zip 18.03 - 7-Zip 18.03 Multli Thread 4 runs
min: 20565     avg: 21844     median: 21844 (13%)     max: 23123 MIPS
7-Zip 18.03 - 7-Zip 18.03 Single Thread 4 runs
min: 4751     avg: 4802     median: 4802 (57%)     max: 4853 MIPS
X264 HD Benchmark 4.0 - x264 Pass 2
100%
1 N3050 +
min: 4.7     avg: 4.7     median: 4.7 (2%)     max: 4.77 fps
46.3 fps (16%)
X264 HD Benchmark 4.0 - x264 Pass 1
100%
1 N3050 +
min: 22.98     avg: 24.8     median: 25.5 (6%)     max: 25.8 fps
192 fps (44%)
HWBOT x265 Benchmark v2.2 - HWBOT x265 4k Preset
min: 5.46     avg: 6     median: 6 (11%)     max: 6.6 fps
TrueCrypt - TrueCrypt Serpent
100%
1 N3050 +
min: 0.04     avg: 0.1     median: 0.1 (0%)     max: 0.059 GB/s
min: 0.437     avg: 0.5     median: 0.5 (0%)     max: 0.469 GB/s
TrueCrypt - TrueCrypt Twofish
100%
1 N3050 +
min: 0.063     avg: 0.1     median: 0.1 (1%)     max: 0.0939 GB/s
min: 0.713     avg: 0.8     median: 0.8 (13%)     max: 0.802 GB/s
TrueCrypt - TrueCrypt AES
100%
1 N3050 +
min: 0.337     avg: 0.4     median: 0.4 (1%)     max: 0.427 GB/s
1324%
1 i5-1145G7 +
5.6 GB/s (15%)
Blender - Blender 3.3 Classroom CPU *
1116 Seconds (14%)
Blender - Blender 2.79 BMW27 CPU *
min: 601     avg: 641     median: 641 (5%)     max: 681 Seconds
R Benchmark 2.5 - R Benchmark 2.5 *
min: 0.627     avg: 0.6     median: 0.6 (14%)     max: 0.63 sec
3DMark 06 - CPU - 3DMark 06 - CPU
100%
1 N3050 +
min: 943     avg: 1150     median: 1243 (3%)     max: 1263 Points
min: 8786     avg: 8923     median: 8922.5 (19%)     max: 9059 Points
Super Pi mod 1.5 XS 1M - Super Pi mod 1.5 XS 1M *
100%
1 N3050 +
min: 22     avg: 32.6     median: 33.6 (7%)     max: 41.3 s
min: 7.2     avg: 7.5     median: 7.5 (2%)     max: 7.825 s
Super Pi mod 1.5 XS 2M - Super Pi mod 1.5 XS 2M *
100%
1 N3050 +
min: 61     avg: 82     median: 88 (4%)     max: 91.1 s
min: 15.7     avg: 16.5     median: 16.5 (1%)     max: 17.298 s
Super Pi Mod 1.5 XS 32M - Super Pi mod 1.5 XS 32M *
100%
1 N3050 +
min: 1566     avg: 1829     median: 1896.5 (8%)     max: 1956 s
min: 366     avg: 389.8     median: 389.8 (2%)     max: 413.691 s
3DMark Vantage - 3DM Vant. Perf. CPU no Physx
100%
1 N3050 +
2247 Points (2%)
1374%
1 i5-1145G7 +
30874 Points (27%)
1203%
1 i5-1145G7 +
min: 10880     avg: 11208     median: 11208 (30%)     max: 11536 Points
63423 Points (52%)
3DMark - 3DMark Ice Storm Extreme Physics
63591 Points (52%)
3DMark - 3DMark Ice Storm Unlimited Physics
65828 Points (55%)
1183%
1 i5-1145G7 +
min: 8524     avg: 8726     median: 8725.5 (22%)     max: 8927 Points
1328%
1 i5-1145G7 +
min: 13209     avg: 13311     median: 13311 (24%)     max: 13413 Points
3DMark - 3DMark Time Spy CPU
min: 4092     avg: 4290     median: 4289.5 (18%)     max: 4487 Points
Geekbench 5.5 - Geekbench 5.1 - 5.4 64 Bit Single-Core
1198 Points (51%)
min: 1427     avg: 1429     median: 1428.5 (60%)     max: 1430 Points
Geekbench 5.5 - Geekbench 5.1 - 5.4 64 Bit Multi-Core
3738 Points (7%)
min: 5055     avg: 5261     median: 5261 (9%)     max: 5467 Points
Geekbench 5.0 - Geekbench 5.0 64 Bit Single-Core
1423 Points (6%)
Geekbench 5.0 - Geekbench 5.0 64 Bit Multi-Core
5351 Points (17%)
Geekbench 4.4 - Geekbench 4.1 - 4.4 64 Bit Single-Core
6226 Points (62%)
Geekbench 4.4 - Geekbench 4.1 - 4.4 64 Bit Multi-Core
20787 Points (23%)
Geekbench 3 - Geekbench 3 64 Bit Multi-Core
100%
1 N3050 +
min: 1594     avg: 1616     median: 1615.5 (3%)     max: 1637 Points
Geekbench 3 - Geekbench 3 64 Bit Single-Core
100%
1 N3050 +
min: 895     avg: 905     median: 904.5 (14%)     max: 914 Points
Geekbench 2 - 32 Bit - Geekbench Stream
100%
1 N3050 +
2477 Points (20%)
Geekbench 2 - 32 Bit - Geekbench Memory
100%
1 N3050 +
2241 Points (20%)
Geekbench 2 - 32 Bit - Geekbench Floating Point
100%
1 N3050 +
2168 Points (4%)
Geekbench 2 - 32 Bit - Geekbench Integer
100%
1 N3050 +
2115 Points (4%)
Geekbench 2 - 32 Bit - Geekbench Total Score
100%
1 N3050 +
2194 Points (6%)
Mozilla Kraken 1.1 - Kraken 1.1 Total Score *
100%
1 N3050 +
min: 4926     avg: 5391     median: 5082.5 (6%)     max: 7633 ms
min: 702     avg: 712     median: 712 (1%)     max: 722 ms
Sunspider - Sunspider 1.0 Total Score *
100%
1 N3050 +
min: 378.8     avg: 407.1     median: 406.4 (4%)     max: 444.5 ms
Octane V2 - Octane V2 Total Score
100%
1 N3050 +
min: 4059     avg: 6704     median: 7291 (7%)     max: 7545 Points
WebXPRT 4 - WebXPRT 4 Score
177.4 Points (51%)
WebXPRT 3 - WebXPRT 3 Score
min: 234     avg: 238.5     median: 238.5 (50%)     max: 243 Points
CrossMark - CrossMark Overall
min: 1279     avg: 1285     median: 1284.5 (49%)     max: 1290 Points
Power Consumption - Prime95 Power Consumption - external Monitor *
min: 38     avg: 42.8     median: 42.8 (7%)     max: 47.5 Watt
Power Consumption - Cinebench R15 Multi Power Consumption - external Monitor *
min: 45.2     avg: 50.4     median: 50.4 (9%)     max: 55.5 Watt
Power Consumption - Idle Power Consumption - external Monitor *
10.9 Watt (7%)
Power Consumption - Idle Power Consumption 150cd 1min *
3.6 Watt (4%)
Power Consumption - Cinebench R15 Multi Power Efficiency - external Monitor
17.5 Points per Watt (13%)

Average Benchmarks Intel Core i3-1125G4 → 0% n=

Average Benchmarks Intel Celeron N3050 → 0% n=

Average Benchmarks Intel Core i5-1145G7 → 0% n=

- Range of benchmark values for this graphics card
- Average benchmark values for this graphics card
* Smaller numbers mean a higher performance
1 This benchmark is not used for the average calculation

v1.26
log 31. 05:52:00

#0 checking url part for id 12740 +0s ... 0s

#1 checking url part for id 6781 +0s ... 0s

#2 checking url part for id 12236 +0s ... 0s

#3 not redirecting to Ajax server +0s ... 0s

#4 did not recreate cache, as it is less than 5 days old! Created at Fri, 31 May 2024 05:40:08 +0200 +0.001s ... 0.001s

#5 composed specs +0.035s ... 0.036s

#6 did output specs +0s ... 0.036s

#7 getting avg benchmarks for device 12740 +0.003s ... 0.039s

#8 got single benchmarks 12740 +0.011s ... 0.05s

#9 getting avg benchmarks for device 6781 +0.003s ... 0.053s

#10 got single benchmarks 6781 +0.057s ... 0.11s

#11 getting avg benchmarks for device 12236 +0.022s ... 0.132s

#12 got single benchmarks 12236 +0.022s ... 0.154s

#13 got avg benchmarks for devices +0s ... 0.154s

#14 min, max, avg, median took s +0.389s ... 0.543s

#15 return log +0s ... 0.543s

Please share our article, every link counts!
> Expert Reviews and News on Laptops, Smartphones and Tech Innovations > Benchmarks / Tech > Processor Comparison - Head 2 Head
Redaktion, 2017-09- 8 (Update: 2023-07- 1)