Notebookcheck Logo

AMD Ryzen 5 5600X vs Intel Core i7-11700K vs Intel Core i5-11600K

AMD Ryzen 5 5600X

► remove from comparison AMD R5 5600X

The AMD Ryzen 5 5600X is a desktop processor with 6 SMT-enabled (12 threads) and based on the Zen 3 architecture. Launched in November 2020, it is the fastest 6-core Ryzen desktop processor. With a TDP of 65 watts, the Ryzen 5 5600X is the least energy-hungry model in the Zen 3 family to date.

The Ryzen 5 5600X is clocked at 3.7 GHz base clock and can be clocked up to 4.6 GHz with Precision Boost 2.

Performance

The average 5600X in our database is in the same league as the Ryzen 9 4900H and the Ryzen 7 6800HS, as far as multi-thread benchmark scores are concerned. While this isn't the fastest CPU money can buy, it still rips through most workloads with ease, as of mid 2022. Find out more in our full review.

Power consumption

This Ryzen 5 series chip has a default TDP (also known as the long-term power limit) of 65 W to be in line with most desktop processors.

The R5 5600X is built with TSMC's 7 nm process for average, as of early 2023, energy efficiency.

Intel Core i7-11700K

► remove from comparison Intel i7-11700K

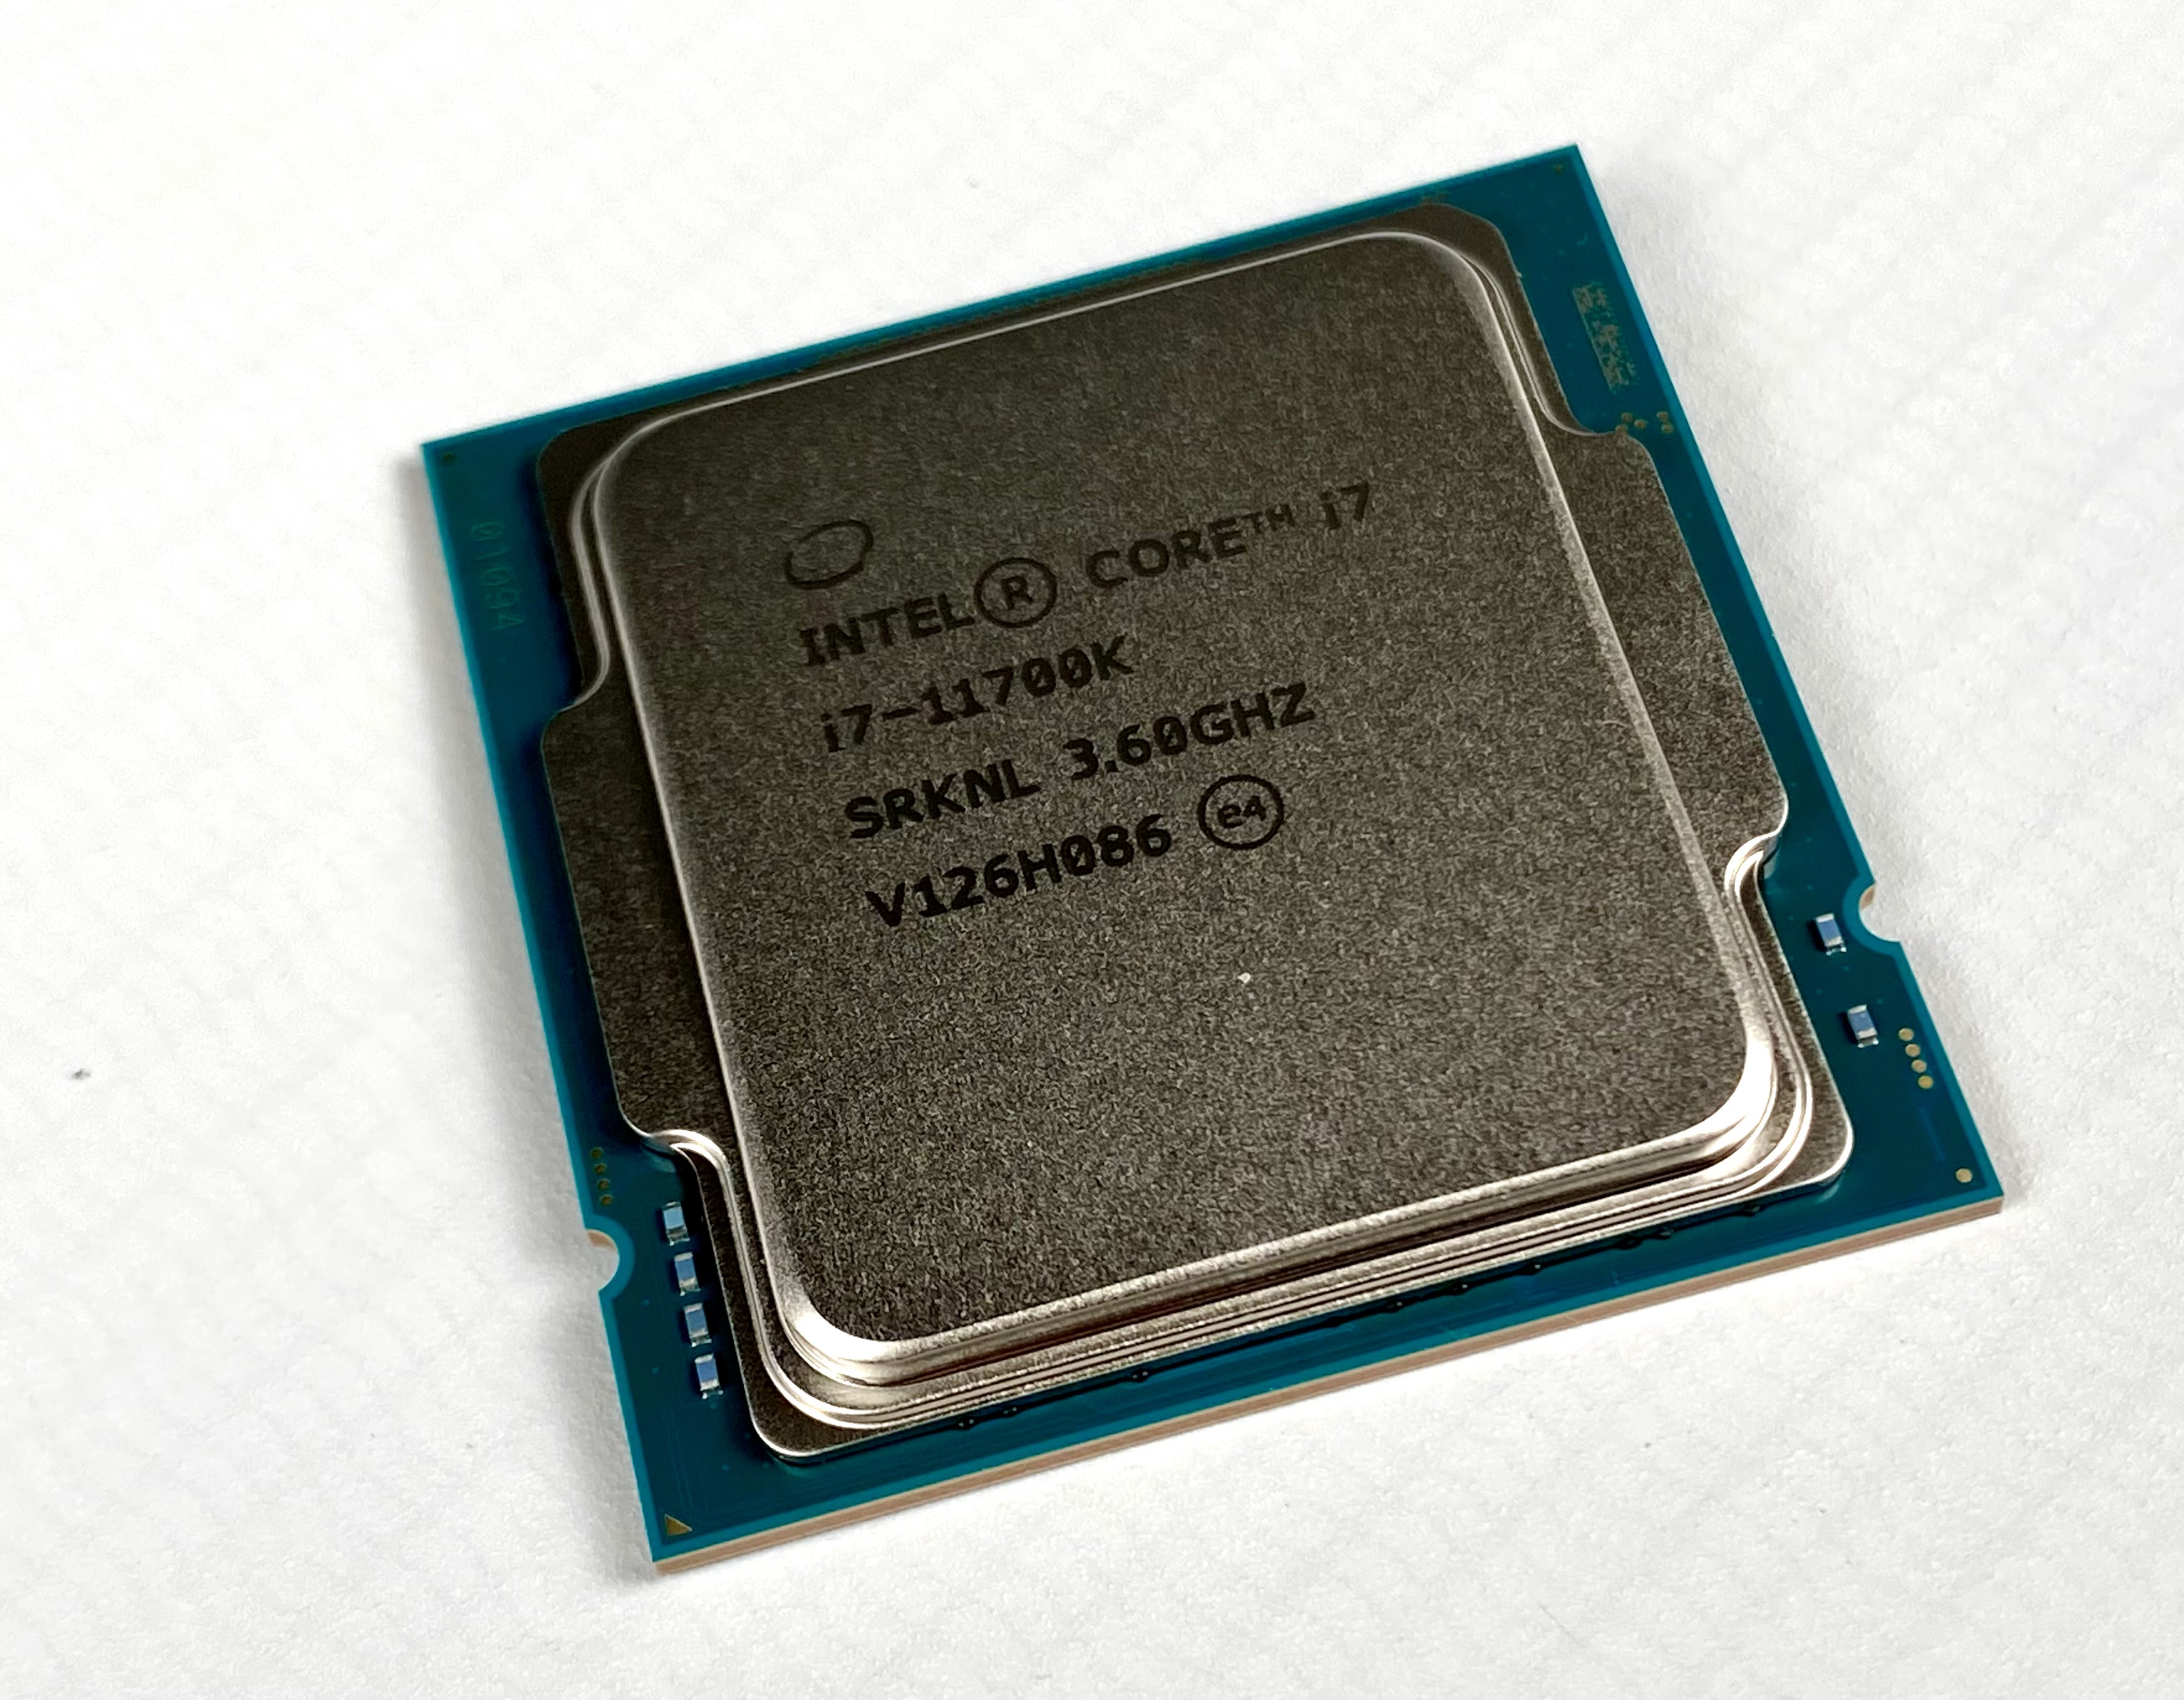
The Intel Core i7-11700K is a high-end desktop CPU based on the Rocket Lake architecture. The CPU offers 8 cores and 16 threads clocked at 3.6 - 4.9 GHz. The TDP is rated at 125 Watt (PL1, power limit sustained load) but the PL2 is set to around 250 Watt for short term boosts (up to 56 seconds). 

The Sunny Cove processor cores (known from the Ice Lake mobile CPUs) offer larger caches and an improved IPC (up to 19%). Furthermore, the chip also includes (partly) integrated WiFi 6E and Thunderbolt 4. The platform supports PCIe 4.0 and Intel DL Boost for AI acceleration.

The faster Rocket Lake-S CPUs also integrate a new Intel UHD Graphics 750 that is based on the current Intel Xe architecture (e.g. mobile Tiger Lake).

The CPU is manufactured on an old 14 nm process like the Comet Lake predecessors.

Intel Core i5-11600K

► remove from comparison Intel i5-11600K

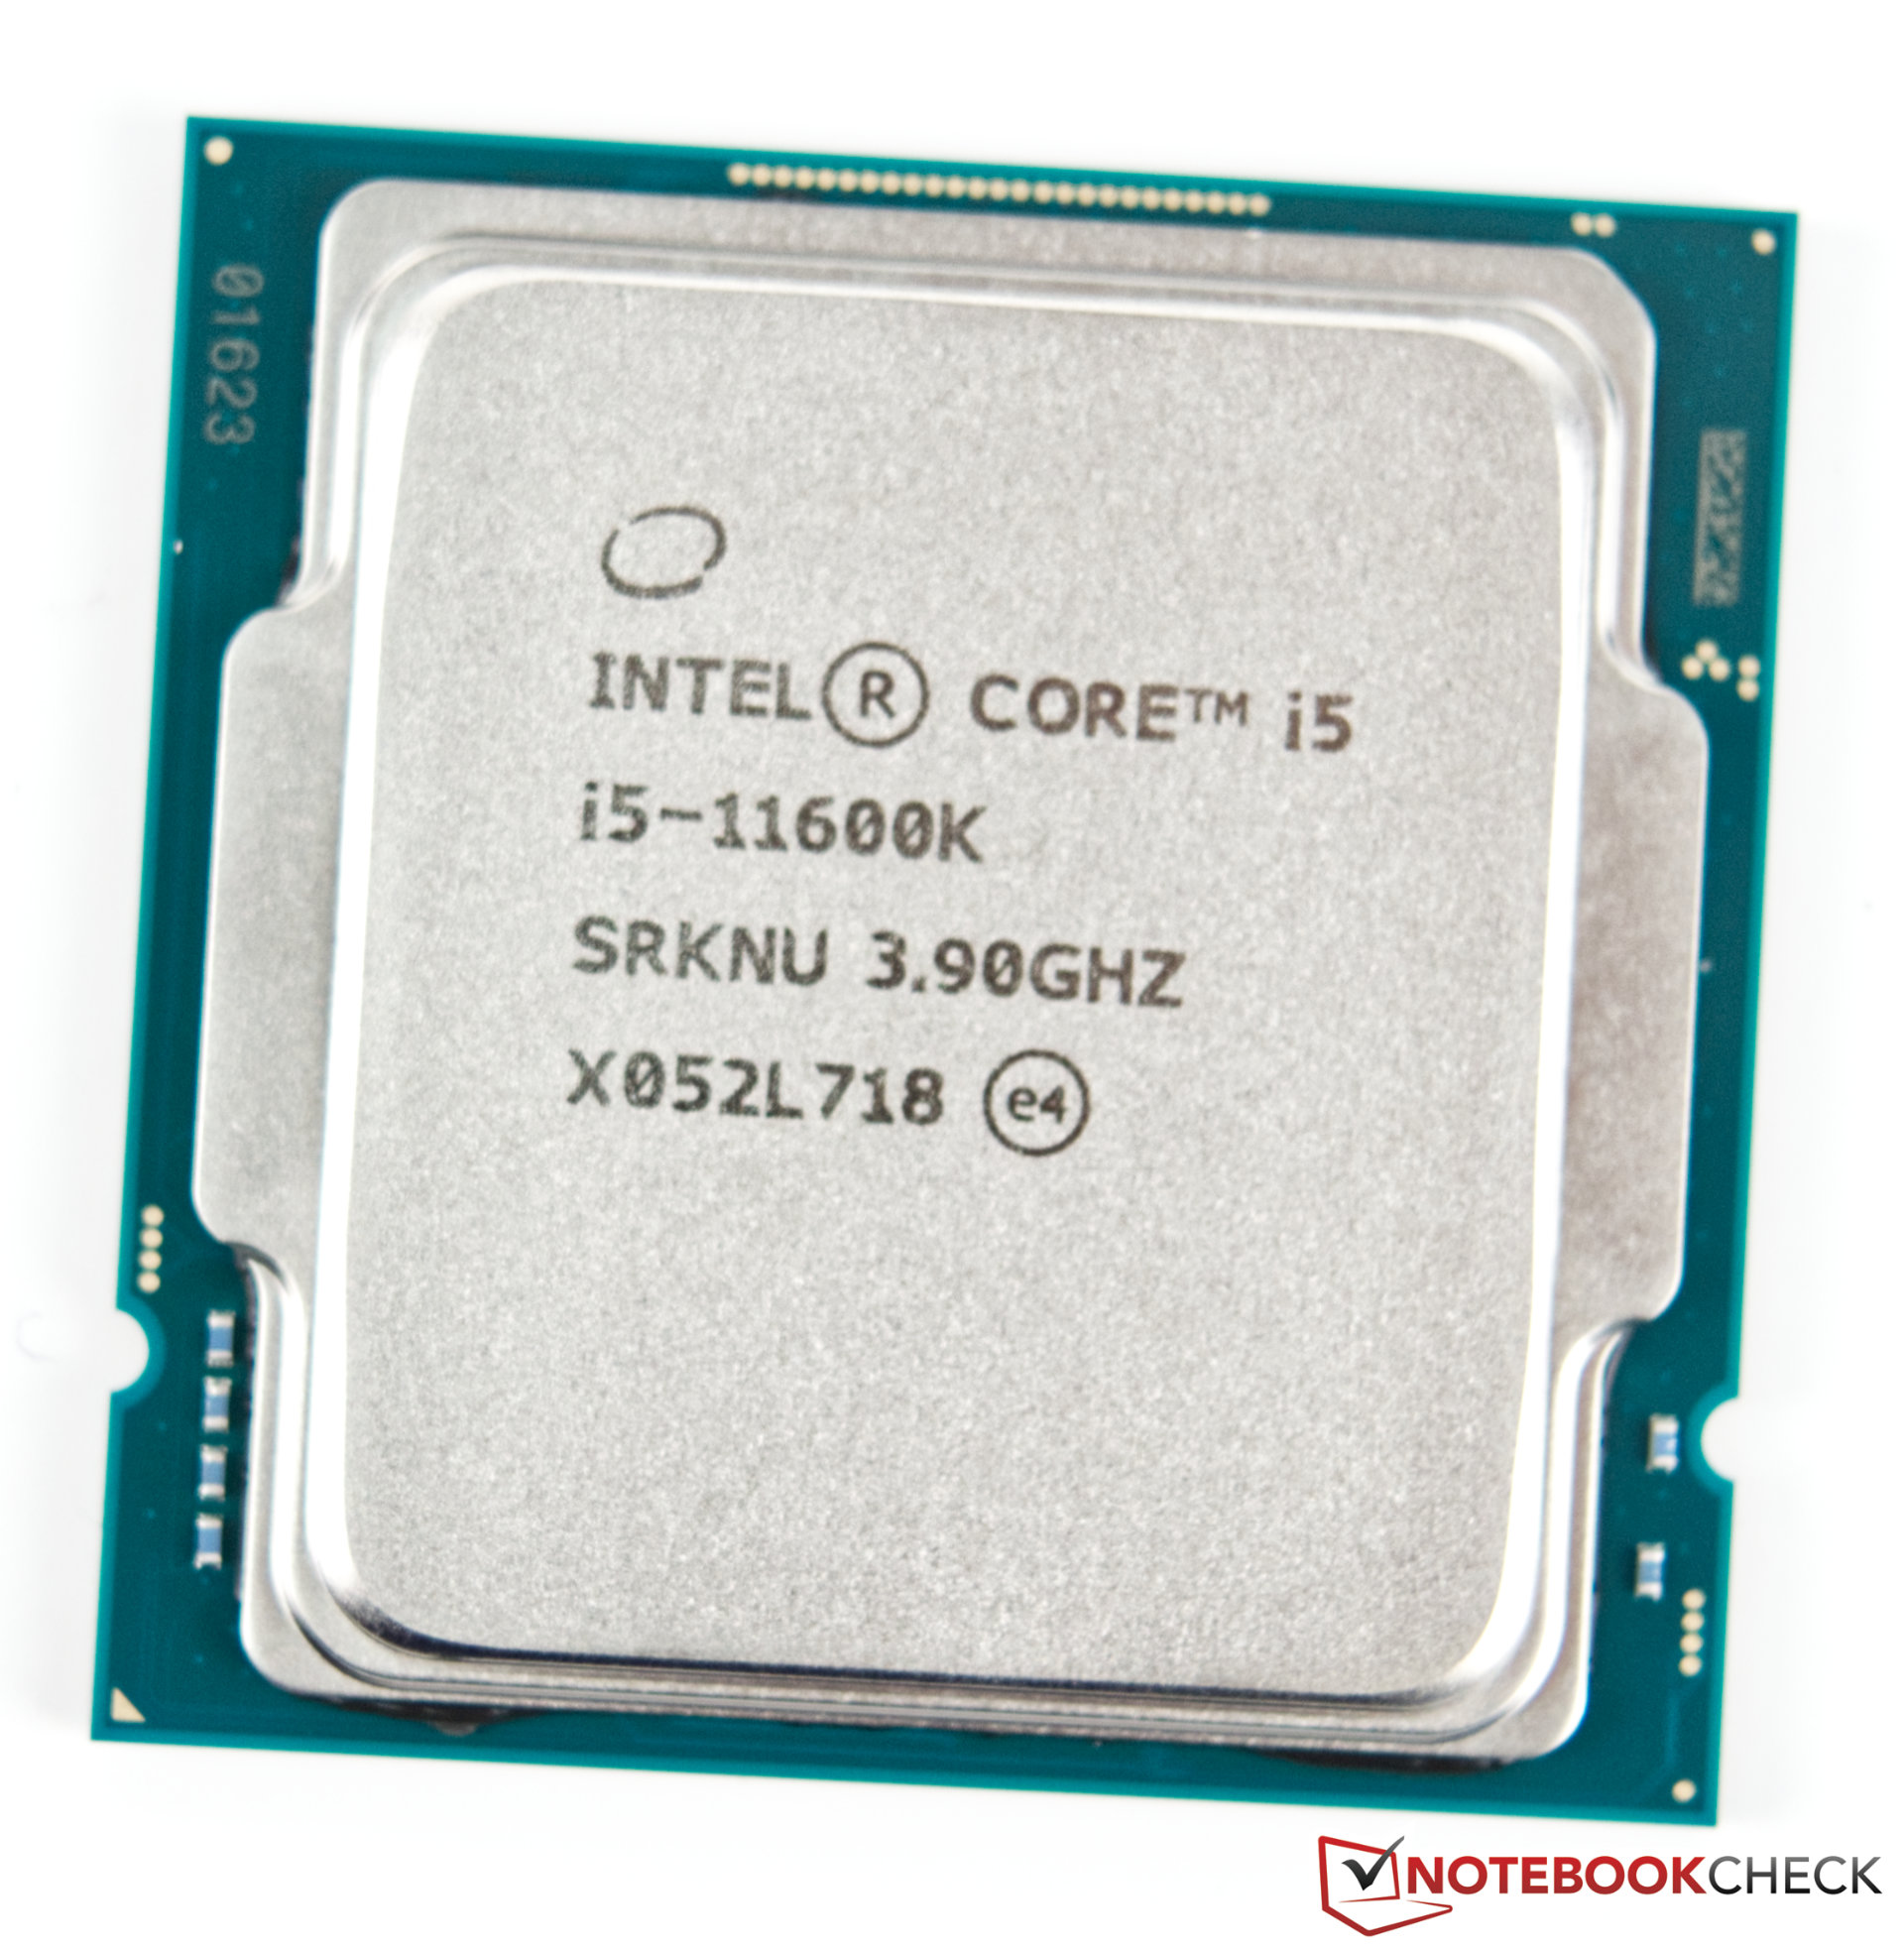
The Intel Core i5-11600K is a high-end desktop CPU based on the Rocket Lake architecture. The CPU offers 6 cores and 12 threads clocked at 3.9 - 4.9 GHz (Turbo Boost 2.0 only). Using all cores, the CPU can clock up to 4.6 GHz.  

The TDP is rated at 125 Watt (PL1, power limit sustained load) but the PL2 is set to around 250 Watt for short term boosts (up to 56 seconds). 

The Sunny Cove processor cores (known from the Ice Lake mobile CPUs) offer larger caches and an improved IPC (up to 19%). Furthermore, the chip also includes (partly) integrated WiFi 6E and Thunderbolt 4. The platform supports PCIe 4.0 and Intel DL Boost for AI acceleration.

Thanks to the faster core architecture, the 11600K can beat the old i5-10600K by around 20 percent. Therefore, the i5-11600K is a good mid range choice for gaming.

The faster Rocket Lake-S CPUs also integrate a new Intel UHD Graphics 750 that is based on the current Intel Xe architecture (e.g. mobile Tiger Lake) and offers 32 EUs. In the 11600K, the GPU is clocked from 350 - 1300 MHz.

The CPU is manufactured on the old 14nm process like the Comet Lake predecessors. The power consumption is not as high, as the Core i9-11900K, but can't come close to the power efficient Ryzen 5 5600X.

ModelAMD Ryzen 5 5600XIntel Core i7-11700KIntel Core i5-11600K
CodenameVermeer (Zen 3)Rocket LakeRocket Lake
SeriesAMD Vermeer (Ryzen 5000)Intel Rocket LakeIntel Rocket Lake
Series: Rocket Lake Rocket Lake
AMD Ryzen 9 5950X3.4 - 4.9 GHz16 / 32 cores64 MB L3
AMD Ryzen 7 5800X3.8 - 4.7 GHz8 / 16 cores32 MB L3
AMD Ryzen 7 5700X3.4 - 4.6 GHz8 / 16 cores32 MB L3
AMD Ryzen 5 5600X « 3.7 - 4.6 GHz6 / 12 cores32 MB L3
Intel Core i9-11900K3.5 - 5.3 GHz8 / 16 cores16 MB L3
Intel Core i7-11700K « 3.6 - 5 GHz8 / 16 cores16 MB L3
Intel Core i7-117002.5 - 4.9 GHz8 / 16 cores16 MB L3
Intel Core i5-11600K3.9 - 4.9 GHz6 / 12 cores12 MB L3
Intel Core i5-11400F2.6 - 4.4 GHz6 / 12 cores12 MB L3
Intel Core i5-11400T1.3 - 3.7 GHz6 / 12 cores12 MB L3
Intel Core i9-11900K3.5 - 5.3 GHz8 / 16 cores16 MB L3
Intel Core i7-11700K3.6 - 5 GHz8 / 16 cores16 MB L3
Intel Core i7-117002.5 - 4.9 GHz8 / 16 cores16 MB L3
Intel Core i5-11600K « 3.9 - 4.9 GHz6 / 12 cores12 MB L3
Intel Core i5-11400F2.6 - 4.4 GHz6 / 12 cores12 MB L3
Intel Core i5-11400T1.3 - 3.7 GHz6 / 12 cores12 MB L3
Clock3700 - 4600 MHz3600 - 5000 MHz3900 - 4900 MHz
L1 Cache384 KB640 KB480 KB
L2 Cache3 MB4 MB3 MB
L3 Cache32 MB16 MB12 MB
Cores / Threads6 / 128 / 166 / 12
TDP65 Watt125 Watt125 Watt
Technology7 nm14 nm14 nm
max. Temp.95 °C100 °C100 °C
SocketAM4LGA1200LGA1200
FeaturesDDR4-3200 RAM, PCIe 4, MMX (+), SSE, SSE2, SSE3, SSSE3, SSE4.1, SSE4.2, SSE4A, AES, AVX, AVX2, FMA3, SHADDR4-3200 RAM, PCIe 4, 8 GT/s bus, DL Boost, GNA, vPro, MMX, SSE, SSE2, SSE3, SSSE3, SSE4.1, SSE4.2, AVX, AVX2, AVX-512, BMI2, ABM, FMA, ADX, VMX, SMX, SMEP, SMAP, MPX, EIST, TM1, TM2, HT, Turbo, SST, AES-NI, RDRAND, RDSEED, SHADDR4-3200 RAM, PCIe 4, 8 GT/s bus, DL Boost, GNA, vPro, MMX, SSE, SSE2, SSE3, SSSE3, SSE4.1, SSE4.2, AVX, AVX2, AVX-512, BMI2, ABM, FMA, ADX, VMX, SMEP, SMAP, MPX, EIST, TM1, TM2, HT, Turbo, SST, AES-NI, RDRAND, RDSEED, SHA
Architecturex86x86x86
$299 U.S.
Announced
Manufacturerwww.amd.comark.intel.comark.intel.com
iGPUIntel UHD Graphics Xe 750 32EUs (Rocket Lake) (350 - 1300 MHz)Intel UHD Graphics Xe 750 32EUs (Rocket Lake) (350 - 1300 MHz)

Benchmarks

Performance Rating - CB R15 + R20 + 7-Zip + X265 + Blender + 3DM11 CPU - R5 5600X
37.5 pt (62%)
Restrict / Search: Model: Max. age: years
Performance Rating - CB R15 + R20 + 7-Zip + X265 + Blender + 3DM11 CPU - i7-11700K
36.8 pt (61%)
Restrict / Search: Model: Max. age: years
Performance Rating - CB R15 + R20 + 7-Zip + X265 + Blender + 3DM11 CPU - i5-11600K
35.9 pt (60%)
Restrict / Search: Model: Max. age: years
Cinebench R23 - Cinebench R23 Multi Core
11838 Points (11%)
14281 Points (13%)
min: 11124     avg: 11218     median: 11217.5 (10%)     max: 11311 Points
Cinebench R23 - Cinebench R23 Single Core
1541 Points (65%)
1558 Points (66%)
min: 1500     avg: 1530     median: 1529.5 (64%)     max: 1559 Points
Cinebench R20 - Cinebench R20 CPU (Single Core)
601 Points (65%)
min: 580     avg: 588     median: 588 (64%)     max: 596 Points
min: 576     avg: 586     median: 585.5 (64%)     max: 595 Points
Cinebench R20 - Cinebench R20 CPU (Multi Core)
4567 Points (11%)
min: 5082     avg: 5361     median: 5361 (13%)     max: 5640 Points
min: 4254     avg: 4302     median: 4301.5 (10%)     max: 4349 Points
Cinebench R15 - Cinebench R15 CPU Multi 64 Bit
1968 Points (12%)
min: 2265     avg: 2299     median: 2299 (15%)     max: 2333 Points
min: 1738     avg: 1744     median: 1744 (11%)     max: 1750 Points
Cinebench R15 - Cinebench R15 CPU Single 64 Bit
254 Points (70%)
240 Points (66%)
min: 234     avg: 238     median: 238 (66%)     max: 242 Points
Cinebench R11.5 - Cinebench R11.5 CPU Multi 64 Bit
21.8 Points (28%)
25.6 Points (33%)
19.3 Points (25%)
Cinebench R11.5 - Cinebench R11.5 CPU Single 64 Bit
3 Points (70%)
2.9 Points (68%)
2.9 Points (68%)
Cinebench R10 - Cinebench R10 Rend. Single (32bit)
6462 Points (39%)
9621 Points (58%)
9745 Points (59%)
Cinebench R10 - Cinebench R10 Rend. Multi (32bit)
39331 Points (28%)
58342 Points (42%)
49408 Points (36%)
Cinebench R10 - Cinebench R10 Rend. Multi (64bit)
69545 Points (44%)
64663 Points (41%)
Cinebench R10 - Cinebench R10 Rend. Single (64bit)
12563 Points (15%)
12957 Points (16%)
wPrime 2.10 - wPrime 2.0 1024m *
113.9 s (1%)
107.6 s (1%)
wPrime 2.10 - wPrime 2.0 32m *
3.9 s (1%)
4.8 s (1%)
4.9 s (1%)
WinRAR - WinRAR 4.0
13282 Points (21%)
7850 Points (12%)
7-Zip 18.03 - 7-Zip 18.03 Multi Thread 4 runs
56607 MIPS (32%)
57129 MIPS (33%)
min: 44620     avg: 44971     median: 44971 (26%)     max: 45322 MIPS
7-Zip 18.03 - 7-Zip 18.03 Single Thread 4 runs
6594 MIPS (78%)
6157 MIPS (73%)
min: 5987     avg: 6062     median: 6061.5 (71%)     max: 6136 MIPS
X264 HD Benchmark 4.0 - x264 Pass 2
117 fps (3%)
128 fps (3%)
min: 100.5     avg: 100.8     median: 100.8 (3%)     max: 101 fps
X264 HD Benchmark 4.0 - x264 Pass 1
320 fps (8%)
292.5 fps (7%)
min: 279     avg: 289     median: 289 (7%)     max: 299 fps
HWBOT x265 Benchmark v2.2 - HWBOT x265 4k Preset
15.7 fps (28%)
16.3 fps (29%)
min: 14     avg: 14.4     median: 14.4 (25%)     max: 14.7 fps
TrueCrypt - TrueCrypt Serpent
0.9 GB/s (28%)
1.2 GB/s (35%)
0.9 GB/s (26%)
TrueCrypt - TrueCrypt Twofish
1.5 GB/s (26%)
1.9 GB/s (33%)
1.5 GB/s (26%)
TrueCrypt - TrueCrypt AES
10.7 GB/s (28%)
12.7 GB/s (33%)
9.7 GB/s (25%)
Blender - Blender 2.79 BMW27 CPU *
260.2 Seconds (2%)
221 Seconds (2%)
min: 264.5     avg: 267.3     median: 267.3 (2%)     max: 270 Seconds
R Benchmark 2.5 - R Benchmark 2.5 *
0.5 sec (10%)
0.5 sec (11%)
min: 0.506     avg: 0.5     median: 0.5 (11%)     max: 0.528 sec
3DMark 06 - CPU - 3DMark 06 - CPU
14576 Points (31%)
16388 Points (35%)
14519 Points (31%)
Super Pi mod 1.5 XS 1M - Super Pi mod 1.5 XS 1M *
8.1 s (2%)
20.2 s (4%)
6.8 s (1%)
Super Pi mod 1.5 XS 2M - Super Pi mod 1.5 XS 2M *
17.5 s (1%)
14.8 s (1%)
Super Pi Mod 1.5 XS 32M - Super Pi mod 1.5 XS 32M *
400.9 s (2%)
685 s (3%)
353.7 s (2%)
3DMark Vantage - 3DM Vant. Perf. CPU no Physx
66603 Points (51%)
3DMark 11 - 3DM11 Performance Physics
19649 Points (48%)
17324 Points (43%)
min: 15381     avg: 16381     median: 16381 (40%)     max: 17381 Points
3DMark - 3DMark Ice Storm Physics
88825 Points (72%)
70388 Points (57%)
min: 70567     avg: 75640     median: 75640 (61%)     max: 80713 Points
3DMark - 3DMark Ice Storm Extreme Physics
88777 Points (72%)
79747 Points (65%)
3DMark - 3DMark Ice Storm Unlimited Physics
91500 Points (73%)
81270 Points (65%)
3DMark - 3DMark Cloud Gate Physics
16447 Points (42%)
18593 Points (47%)
min: 14147     avg: 14403     median: 14402.5 (36%)     max: 14658 Points
3DMark - 3DMark Fire Strike Standard Physics
25990 Points (46%)
25557 Points (46%)
min: 21677     avg: 22154     median: 22154 (39%)     max: 22631 Points
3DMark - 3DMark Time Spy CPU
8911 Points (38%)
min: 8286     avg: 8884     median: 8884 (37%)     max: 9482 Points
Geekbench 6.5 - Geekbench 6.5 Single-Core
2178 Points (53%)
2585 Points (63%)
2284 Points (55%)
Geekbench 6.5 - Geekbench 6.5 Multi-Core
9023 Points (35%)
11679 Points (45%)
9480 Points (37%)
Geekbench 5.5 - Geekbench 5.1 - 5.5 64 Bit Single-Core
1657 Points (63%)
min: 1721     avg: 1766     median: 1765.5 (67%)     max: 1810 Points
min: 1694     avg: 1723     median: 1723 (65%)     max: 1752 Points
Geekbench 5.5 - Geekbench 5.1 - 5.5 64 Bit Multi-Core
8980 Points (16%)
min: 10269     avg: 10787     median: 10786.5 (19%)     max: 11304 Points
min: 8336     avg: 8430     median: 8429.5 (15%)     max: 8523 Points
Geekbench 5.0 - Geekbench 5.0 64 Bit Single-Core
1587 Points (7%)
1731 Points (8%)
Geekbench 5.0 - Geekbench 5.0 64 Bit Multi-Core
8926 Points (28%)
8542 Points (27%)
Geekbench 4.4 - Geekbench 4.1 - 4.4 64 Bit Single-Core
6953 Points (69%)
7438 Points (74%)
Geekbench 4.4 - Geekbench 4.1 - 4.4 64 Bit Multi-Core
35617 Points (35%)
33266 Points (33%)
Mozilla Kraken 1.1 - Kraken 1.1 Total Score *
578 ms (1%)
603 ms (1%)
min: 587     avg: 598     median: 597.5 (1%)     max: 608 ms
Sunspider - Sunspider 1.0 Total Score *
124.2 ms (1%)
Octane V2 - Octane V2 Total Score
71212 Points (52%)
WebXPRT 3 - WebXPRT 3 Score
286 Points (51%)
254 Points (46%)
min: 263     avg: 271.5     median: 271.5 (49%)     max: 280 Points
CrossMark - CrossMark Overall
1489 Points (56%)
1775 Points (66%)
1652 Points (62%)
Power Consumption - Prime95 Power Consumption - external Monitor *
175.8 Watt (30%)
210 Watt (36%)
min: 187     avg: 204.7     median: 199 (34%)     max: 228 Watt
Power Consumption - Cinebench R15 Multi Power Consumption - external Monitor *
170.1 Watt (31%)
244 Watt (45%)
min: 177     avg: 195.3     median: 189 (34%)     max: 219.9 Watt
Power Consumption - Power Efficiency - Cinebench R15 Multi external Monitor
11.6 Points per Watt (9%)
9.6 Points per Watt (7%)
min: 7.9     avg: 8.9     median: 8.9 (7%)     max: 9.89 Points per Watt

Average Benchmarks AMD Ryzen 5 5600X → 100% n=35

Average Benchmarks Intel Core i7-11700K → 106% n=35

Average Benchmarks Intel Core i5-11600K → 97% n=35

- Range of benchmark values for this graphics card
red legend - Average benchmark values for this graphics card
* Smaller numbers mean a higher performance
1 This benchmark is not used for the average calculation

v1.34
log 21. 12:33:48

#0 ran 0s before starting gpusingle class +0s ... 0s

#1 checking url part for id 12785 +0s ... 0s

#2 checking url part for id 12999 +0s ... 0s

#3 checking url part for id 13163 +0s ... 0s

#4 redirected to Ajax server, took 1761042827s time from redirect:1 +0s ... 0s

#5 did not recreate cache, as it is less than 5 days old! Created at Sun, 19 Oct 2025 05:20:51 +0200 +0s ... 0s

#6 composed specs +0.005s ... 0.005s

#7 did output specs +0s ... 0.005s

#8 getting avg benchmarks for device 12785 +0.005s ... 0.01s

#9 got single benchmarks 12785 +0.004s ... 0.014s

#10 getting avg benchmarks for device 12999 +0.004s ... 0.018s

#11 got single benchmarks 12999 +0.004s ... 0.022s

#12 getting avg benchmarks for device 13163 +0.004s ... 0.026s

#13 got single benchmarks 13163 +0.004s ... 0.03s

#14 got avg benchmarks for devices +0s ... 0.03s

#15 min, max, avg, median took s +0.062s ... 0.092s

#16 return log +0s ... 0.092s

Please share our article, every link counts!
Mail Logo
> Expert Reviews and News on Laptops, Smartphones and Tech Innovations > Benchmarks / Tech > Processor Comparison - Head 2 Head
Redaktion, 2017-09- 8 (Update: 2023-07- 1)