Notebookcheck Logo

AMD Ryzen 5 1500X vs AMD Athlon Silver 3050e vs AMD Ryzen 5 1600

AMD Ryzen 5 1500X

► remove from comparison AMD R5 1500X

The AMD Ryzen 5 1500X is a desktop processor with 4 cores and Hyper Threading (SMT). It is the fastest Ryzen 5 quad-core processor in the beginning of 2017, but the 65-watt TDP is similar to the hexa-core Ryzen 5 1600.

The Ryzen 5 1500X has a base frequency of 3.5 GHz and can reach up to 3.7 GHz via Turbo (up to 2 cores) or 3.9 GHz via XFR (also up to 2 cores).

The processor based on the Zen architecture is not fully convincing in games. AMD blames missing optimizations from the gaming producers.

AMD Athlon Silver 3050e

► remove from comparison AMD Athlon 3050e

The AMD Athlon Silver 3050e (Codename Dali) is a mobile APU that integrates two Zen cores (with SMT, therefore 4 threads) clocked at 1.4 to 2.8 GHz. The TDP is specified at 6 Watt and therefore the chip can be passively cooled. The integrated Radeon graphics card offers 3 CUs at up to 1000 MHz (Radeon RX Vega 3). The dual channel memory controller supports only DDR4-2400. The chip is manufactured on a 14 nm node and officially counted to the 3000 series of mobile processors.

More information on Raven Ridge can be found in our launch article.

Performance

The average 3050e in our database is in the same league as the Celeron N4120, as far as multi-thread benchmark scores are concerned. In other words, a slight amount of the AMD Zen magic has not helped this chip much. Its performance can be described as fairly slow, as of mid 2023.

Your mileage may vary depending on how high the CPU power limits are.

Power consumption

Much like Intel's N-class Celeron and Pentium processors, the AMD 3050e has a 6 W TDP (also known as the long-term power limit). This is not much at all and thus good enough for passively cooled tablets, laptops, mini-PCs.

This APU is built with a 14 nm process making for poor, as of early 2023, energy efficiency.

AMD Ryzen 5 1600

► remove from comparison AMD R5 1600

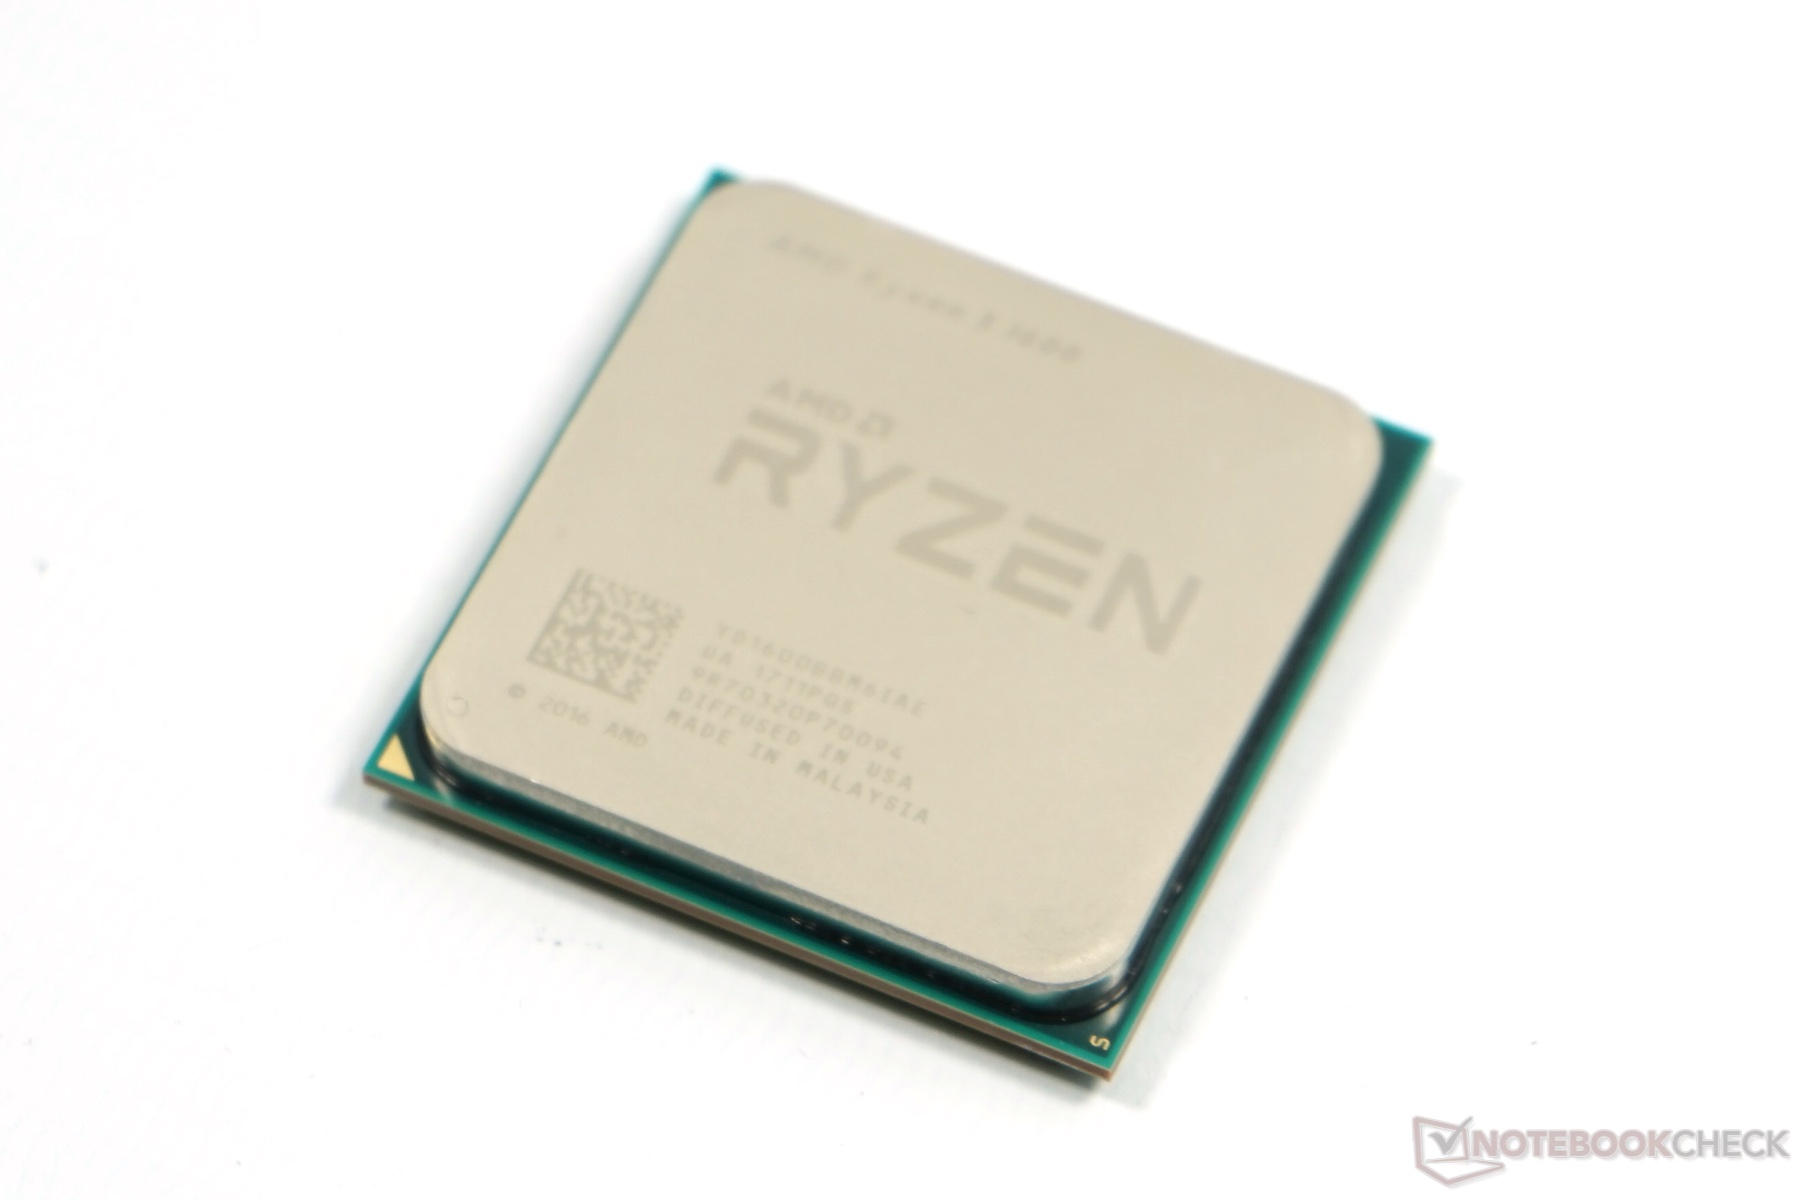
The AMD Ryzen 5 1600 is a desktop processor with 6 cores and Hyper Threading (SMT = 12 threads). It is the second fastest Ryzen 5 processor in the beginning of 2017, but the 65-watt TDP is much lower compared to the higher-clocked Ryzen 5 1600X.

The Ryzen 5 1600 has a base frequency of 3.2 GHz and can reach up to 3.6 GHz via Turbo (up to 2 cores) or 3.7 GHz via XFR (also up to 2 cores). The maximum clock for all six cores is 3.4 GHz.

The performance is particularly good in applications. The chip can benefit from its six native cores. They are divided into two clusters (3 cores with dedicated L3 cache each), which connected via Infinity Fabric.

The processor based on the Zen architecture is not fully convincing in games. AMD blames missing optimizations from the gaming producers. Intel's powerful Core i7 quad-cores are usually faster in this case.

ModelAMD Ryzen 5 1500XAMD Athlon Silver 3050eAMD Ryzen 5 1600
SeriesAMD Ryzen 5AMD Raven Ridge (Ryzen 2000 APU)AMD Ryzen 5
CodenameZenDali (Zen)Zen
Series: Ryzen 5 Zen
AMD Ryzen 5 16003.2 - 3.6 GHz6 / 12 cores16 MB L3
AMD Ryzen 5 1500X « 3.5 - 3.7 GHz4 / 8 cores16 MB L3
AMD Ryzen 5 14003.2 - 3.4 GHz4 / 8 cores8 MB L3
AMD Athlon Silver 3050e « 1.4 - 2.8 GHz2 / 4 cores4 MB L3
AMD 3020e1.2 - 2.6 GHz2 / 2 cores4 MB L3
AMD Ryzen 5 1600 « 3.2 - 3.6 GHz6 / 12 cores16 MB L3
AMD Ryzen 5 1500X3.5 - 3.7 GHz4 / 8 cores16 MB L3
AMD Ryzen 5 14003.2 - 3.4 GHz4 / 8 cores8 MB L3
Clock3500 - 3700 MHz1400 - 2800 MHz3200 - 3600 MHz
L1 Cache384 KB192 KB576 KB
L2 Cache2 MB1 MB3 MB
L3 Cache16 MB4 MB16 MB
Cores / Threads4 / 82 / 46 / 12
TDP65 Watt6 Watt65 Watt
Transistors4800 Million4800 Million
Technology14 nm14 nm14 nm
SocketAM4FP5AM4
FeaturesXFR, FMA3, SSE 4.2, AVX2, SMTDDR4-2400 RAM, PCIe 3, MMX, SSE, SSE2, SSE3, SSSE3, SSE4A, SSE4.1, SSE4.2, AVX, AVX2, BMI2, ABM, FMA, ADX, SMEP, SMAP, SMT, CPB, AES-NI, RDRAND, RDSEED, SHA, SMEXFR, FMA3, SSE 4.2, AVX2, SMT
Architecturex86x86x86
Announced
iGPUAMD Radeon RX Vega 3 ( - 1000 MHz)
Manufacturerwww.amd.com

Benchmarks

Performance Rating - CB R15 + R20 + 7-Zip + X265 + Blender + 3DM11 CPU - R5 1500X
27.8 pt (39%)
Performance Rating - CB R15 + R20 + 7-Zip + X265 + Blender + 3DM11 CPU - Athlon 3050e
19.5 pt (27%)
Performance Rating - CB R15 + R20 + 7-Zip + X265 + Blender + 3DM11 CPU - R5 1600
28.6 pt (40%)
Cinebench R23 - Cinebench R23 Multi Core
min: 4586     avg: 4597     median: 4597 (4%)     max: 4608 Points
min: 991     avg: 1175     median: 1174.5 (1%)     max: 1358 Points
6468 Points (6%)
Cinebench R23 - Cinebench R23 Single Core
min: 938     avg: 947     median: 947 (40%)     max: 956 Points
min: 567     avg: 576     median: 576 (25%)     max: 585 Points
915 Points (39%)
Cinebench R20 - Cinebench R20 CPU (Single Core)
min: 346     avg: 360     median: 360 (40%)     max: 374 Points
min: 220     avg: 224.5     median: 224.5 (25%)     max: 229 Points
min: 317     avg: 349     median: 349 (39%)     max: 381 Points
Cinebench R20 - Cinebench R20 CPU (Multi Core)
min: 1777     avg: 1783     median: 1783 (4%)     max: 1789 Points
min: 386     avg: 419.5     median: 419.5 (1%)     max: 453 Points
min: 2484     avg: 2578     median: 2578 (6%)     max: 2672 Points
Cinebench R15 - Cinebench R15 CPU Multi 64 Bit
min: 796     avg: 806     median: 805 (5%)     max: 818 Points
min: 217     avg: 226.5     median: 226.5 (1%)     max: 236 Points
min: 1125     avg: 1144     median: 1129 (7%)     max: 1200 Points
Cinebench R15 - Cinebench R15 CPU Single 64 Bit
min: 142     avg: 151     median: 154 (46%)     max: 157 Points
102 Points (31%)
min: 134     avg: 144.8     median: 147 (44%)     max: 155 Points
Cinebench R11.5 - Cinebench R11.5 CPU Multi 64 Bit
9 Points (12%)
2.5 Points (3%)
min: 12.5     avg: 12.7     median: 12.6 (16%)     max: 13.07 Points
Cinebench R11.5 - Cinebench R11.5 CPU Single 64 Bit
1.7 Points (43%)
1.2 Points (29%)
min: 1.55     avg: 1.6     median: 1.7 (41%)     max: 1.71 Points
Cinebench R10 - Cinebench R10 Rend. Single (32bit)
4573 Points (28%)
3339 Points (20%)
min: 4330     avg: 4516     median: 4538 (27%)     max: 4681 Points
Cinebench R10 - Cinebench R10 Rend. Multi (32bit)
20186 Points (15%)
6780 Points (5%)
min: 25561     avg: 26196     median: 25970 (19%)     max: 27058 Points
Cinebench R10 - Cinebench R10 Rend. Multi (64bit)
100%
1 R5 1600 +
42924 Points (30%)
Cinebench R10 - Cinebench R10 Rend. Single (64bit)
100%
1 R5 1600 +
7803 Points (10%)
wPrime 2.10 - wPrime 2.0 1024m *
210.6 s (2%)
595 s (7%)
min: 145.8     avg: 216     median: 149 (2%)     max: 353.2 s
wPrime 2.10 - wPrime 2.0 32m *
6.9 s (1%)
19 s (4%)
min: 5.2     avg: 8.2     median: 6.8 (1%)     max: 12.66 s
WinRAR - WinRAR 4.0
3910 Points (6%)
1403 Points (2%)
min: 3040     avg: 3550     median: 3430 (5%)     max: 4299 Points
7-Zip 18.03 - 7-Zip 18.03 Multli Thread 4 runs
min: 21495     avg: 21743     median: 21842 (13%)     max: 21891 MIPS
min: 6540     avg: 6642     median: 6641.5 (4%)     max: 6743 MIPS
min: 28872     avg: 30144     median: 30143.5 (17%)     max: 31415 MIPS
7-Zip 18.03 - 7-Zip 18.03 Single Thread 4 runs
min: 3768     avg: 3858     median: 3865 (46%)     max: 3942 MIPS
min: 2223     avg: 2525     median: 2524.5 (30%)     max: 2826 MIPS
min: 3555     avg: 3834     median: 3834 (46%)     max: 4113 MIPS
X264 HD Benchmark 4.0 - x264 Pass 2
49.5 fps (17%)
13.8 fps (5%)
min: 66.8     avg: 69.5     median: 68.7 (24%)     max: 73.1 fps
X264 HD Benchmark 4.0 - x264 Pass 1
177 fps (41%)
70.1 fps (16%)
min: 163     avg: 179.7     median: 177 (41%)     max: 199 fps
HWBOT x265 Benchmark v2.2 - HWBOT x265 4k Preset
min: 5.09     avg: 5.1     median: 5.1 (9%)     max: 5.12 fps
min: 1.09     avg: 1.3     median: 1.3 (2%)     max: 1.44 fps
min: 6.97     avg: 7.2     median: 7.2 (13%)     max: 7.45 fps
TrueCrypt - TrueCrypt Serpent
0.5 GB/s (0%)
0.2 GB/s (0%)
min: 0.649     avg: 0.7     median: 0.7 (0%)     max: 0.67 GB/s
TrueCrypt - TrueCrypt Twofish
0.7 GB/s (13%)
0.2 GB/s (4%)
1 GB/s (17%)
TrueCrypt - TrueCrypt AES
4.9 GB/s (13%)
1.3 GB/s (3%)
min: 5.3     avg: 6.4     median: 6.4 (17%)     max: 7.3 GB/s
Blender - Blender 2.79 BMW27 CPU *
min: 585     avg: 586     median: 586 (4%)     max: 587 Seconds
min: 2159     avg: 2299     median: 2298.5 (16%)     max: 2438 Seconds
min: 387.2     avg: 404.1     median: 404.1 (3%)     max: 421 Seconds
R Benchmark 2.5 - R Benchmark 2.5 *
min: 0.699     avg: 0.7     median: 0.7 (15%)     max: 0.738 sec
min: 1.152     avg: 1.2     median: 1.2 (26%)     max: 1.215 sec
min: 0.659     avg: 0.7     median: 0.7 (15%)     max: 0.734 sec
3DMark 06 - CPU - 3DMark 06 - CPU
7403 Points (16%)
111%
1 R5 1600 +
min: 8222     avg: 8244     median: 8244 (18%)     max: 8266 Points
Super Pi mod 1.5 XS 1M - Super Pi mod 1.5 XS 1M *
11 s (2%)
41.6 s (9%)
min: 11     avg: 11.9     median: 12 (3%)     max: 12.7 s
Super Pi mod 1.5 XS 2M - Super Pi mod 1.5 XS 2M *
24 s (1%)
100%
1 R5 1600 +
min: 23.78     avg: 26.8     median: 26.2 (1%)     max: 30.5 s
Super Pi Mod 1.5 XS 32M - Super Pi mod 1.5 XS 32M *
640 s (3%)
1302 s (6%)
min: 599     avg: 648     median: 650 (3%)     max: 694 s
3DMark 11 - 3DM11 Performance Physics
9566 Points (26%)
2724 Points (7%)
min: 8803     avg: 10655     median: 11164 (30%)     max: 11998 Points
3DMark - 3DMark Ice Storm Physics
33061 Points (27%)
199%
1 R5 1600 +
65880 Points (54%)
3DMark - 3DMark Ice Storm Extreme Physics
33195 Points (27%)
199%
1 R5 1600 +
65950 Points (54%)
3DMark - 3DMark Ice Storm Unlimited Physics
61854 Points (52%)
38969 Points (33%)
min: 64701     avg: 65495     median: 65495 (55%)     max: 66289 Points
3DMark - 3DMark Cloud Gate Physics
7712 Points (20%)
min: 2687     avg: 2722     median: 2722 (7%)     max: 2757 Points
min: 9471     avg: 10035     median: 10034.5 (25%)     max: 10598 Points
3DMark - 3DMark Fire Strike Standard Physics
min: 3986     avg: 4063     median: 4063 (7%)     max: 4140 Points
389%
1 R5 1600 +
min: 14959     avg: 15666     median: 15818 (28%)     max: 16220 Points
3DMark - 3DMark Time Spy CPU
4067 Points (17%)
1061 Points (4%)
min: 4863     avg: 5425     median: 5542 (23%)     max: 5871 Points
Geekbench 5.5 - Geekbench 5.1 - 5.4 64 Bit Single-Core
min: 917     avg: 919     median: 918.5 (39%)     max: 920 Points
min: 538     avg: 595     median: 594.5 (25%)     max: 651 Points
min: 920     avg: 950     median: 950 (40%)     max: 980 Points
Geekbench 5.5 - Geekbench 5.1 - 5.4 64 Bit Multi-Core
min: 3997     avg: 4604     median: 4603.5 (8%)     max: 5210 Points
min: 1133     avg: 1172     median: 1172 (2%)     max: 1211 Points
min: 5210     avg: 5425     median: 5424.5 (10%)     max: 5639 Points
Geekbench 5.0 - Geekbench 5.0 64 Bit Single-Core
915 Points (4%)
662 Points (3%)
min: 846     avg: 915     median: 914.5 (4%)     max: 983 Points
Geekbench 5.0 - Geekbench 5.0 64 Bit Multi-Core
4035 Points (13%)
1224 Points (4%)
min: 5117     avg: 5403     median: 5402.5 (17%)     max: 5688 Points
Geekbench 4.4 - Geekbench 4.1 - 4.4 64 Bit Single-Core
min: 4105     avg: 4282     median: 4282 (43%)     max: 4459 Points
2948 Points (29%)
min: 3611     avg: 3966     median: 3841 (38%)     max: 4445 Points
Geekbench 4.4 - Geekbench 4.1 - 4.4 64 Bit Multi-Core
min: 15016     avg: 15134     median: 15134 (17%)     max: 15252 Points
5000 Points (5%)
min: 16235     avg: 18578     median: 18788 (21%)     max: 20712 Points
Geekbench 4.0 - Geekbench 4.0 64 Bit Single-Core
4149 Points (56%)
min: 3542     avg: 3775     median: 3652 (50%)     max: 4130 Points
Geekbench 4.0 - Geekbench 4.0 64 Bit Multi-Core
14463 Points (35%)
104%
1 R5 1600 +
min: 15037     avg: 16023     median: 15096 (37%)     max: 17937 Points
Geekbench 3 - Geekbench 3 64 Bit Multi-Core
16558 Points (26%)
128%
1 R5 1600 +
min: 20410     avg: 21267     median: 21266.5 (33%)     max: 22123 Points
Geekbench 3 - Geekbench 3 64 Bit Single-Core
4248 Points (64%)
min: 3449     avg: 3737     median: 3736.5 (56%)     max: 4024 Points
Geekbench 3 - Geekbench 3 32 Bit Multi-Core
100%
1 R5 1600 +
19391 Points (34%)
Geekbench 3 - Geekbench 3 32 Bit Single-Core
100%
1 R5 1600 +
3189 Points (62%)
Geekbench 2 - 32 Bit - Geekbench Stream
11011 Points (89%)
min: 6734     avg: 8501     median: 8501 (69%)     max: 10268 Points
Geekbench 2 - 32 Bit - Geekbench Memory
8616 Points (78%)
min: 6127     avg: 7118     median: 7118 (65%)     max: 8109 Points
Geekbench 2 - 32 Bit - Geekbench Floating Point
15951 Points (31%)
141%
1 R5 1600 +
min: 20566     avg: 22510     median: 22510 (44%)     max: 24454 Points
Geekbench 2 - 32 Bit - Geekbench Integer
13689 Points (28%)
127%
1 R5 1600 +
min: 17236     avg: 17330     median: 17329.5 (35%)     max: 17423 Points
Geekbench 2 - 32 Bit - Geekbench Total Score
13198 Points (35%)
123%
1 R5 1600 +
min: 15944     avg: 16217     median: 16217 (42%)     max: 16490 Points
Mozilla Kraken 1.1 - Kraken 1.1 Total Score *
min: 966     avg: 975     median: 974.5 (1%)     max: 983 ms
min: 1606     avg: 1711     median: 1710.5 (2%)     max: 1815 ms
min: 952     avg: 987     median: 986.5 (1%)     max: 1021 ms
Sunspider - Sunspider 1.0 Total Score *
74.8 ms (1%)
454.6 ms (5%)
89 ms (1%)
Octane V2 - Octane V2 Total Score
36017 Points (32%)
22479 Points (20%)
30668 Points (28%)
WebXPRT 3 - WebXPRT 3 Score
min: 176     avg: 177.5     median: 177.5 (37%)     max: 179 Points
min: 90.2     avg: 98.6     median: 98.6 (21%)     max: 107 Points
180 Points (38%)
Power Consumption - Prime95 Power Consumption - external Monitor *
146 Watt (25%)
175.8 Watt (30%)
Power Consumption - Cinebench R15 Multi Power Consumption - external Monitor *
132 Watt (24%)
157.8 Watt (29%)
Power Consumption - Cinebench R15 Multi Power Efficiency - external Monitor
6.2 Points per Watt (5%)
123%
1 R5 1600 +
7.6 Points per Watt (6%)

Average Benchmarks AMD Ryzen 5 1500X → 100% n=39

Average Benchmarks AMD Athlon Silver 3050e → 54% n=39

Average Benchmarks AMD Ryzen 5 1600 → 114% n=39

- Range of benchmark values for this graphics card
- Average benchmark values for this graphics card
* Smaller numbers mean a higher performance
1 This benchmark is not used for the average calculation

v1.27
log 17. 12:38:16

#0 checking url part for id 9166 +0s ... 0s

#1 checking url part for id 12722 +0s ... 0s

#2 checking url part for id 9132 +0s ... 0s

#3 not redirecting to Ajax server +0s ... 0s

#4 did not recreate cache, as it is less than 5 days old! Created at Sun, 16 Jun 2024 05:37:17 +0200 +0.001s ... 0.001s

#5 composed specs +0.023s ... 0.024s

#6 did output specs +0s ... 0.024s

#7 getting avg benchmarks for device 9166 +0.018s ... 0.042s

#8 got single benchmarks 9166 +0.01s ... 0.051s

#9 getting avg benchmarks for device 12722 +0.017s ... 0.068s

#10 got single benchmarks 12722 +0.01s ... 0.078s

#11 getting avg benchmarks for device 9132 +0.016s ... 0.094s

#12 got single benchmarks 9132 +0.014s ... 0.109s

#13 got avg benchmarks for devices +0s ... 0.109s

#14 min, max, avg, median took s +0.565s ... 0.673s

#15 return log +0s ... 0.673s

Please share our article, every link counts!
> Expert Reviews and News on Laptops, Smartphones and Tech Innovations > Benchmarks / Tech > Processor Comparison - Head 2 Head
Redaktion, 2017-09- 8 (Update: 2023-07- 1)