Notebookcheck Logo

Apple M1 8-Core GPU vs Intel Iris Plus Graphics 650

Apple M1 8-Core GPU

► remove from comparison Apple M1 8-Core GPU

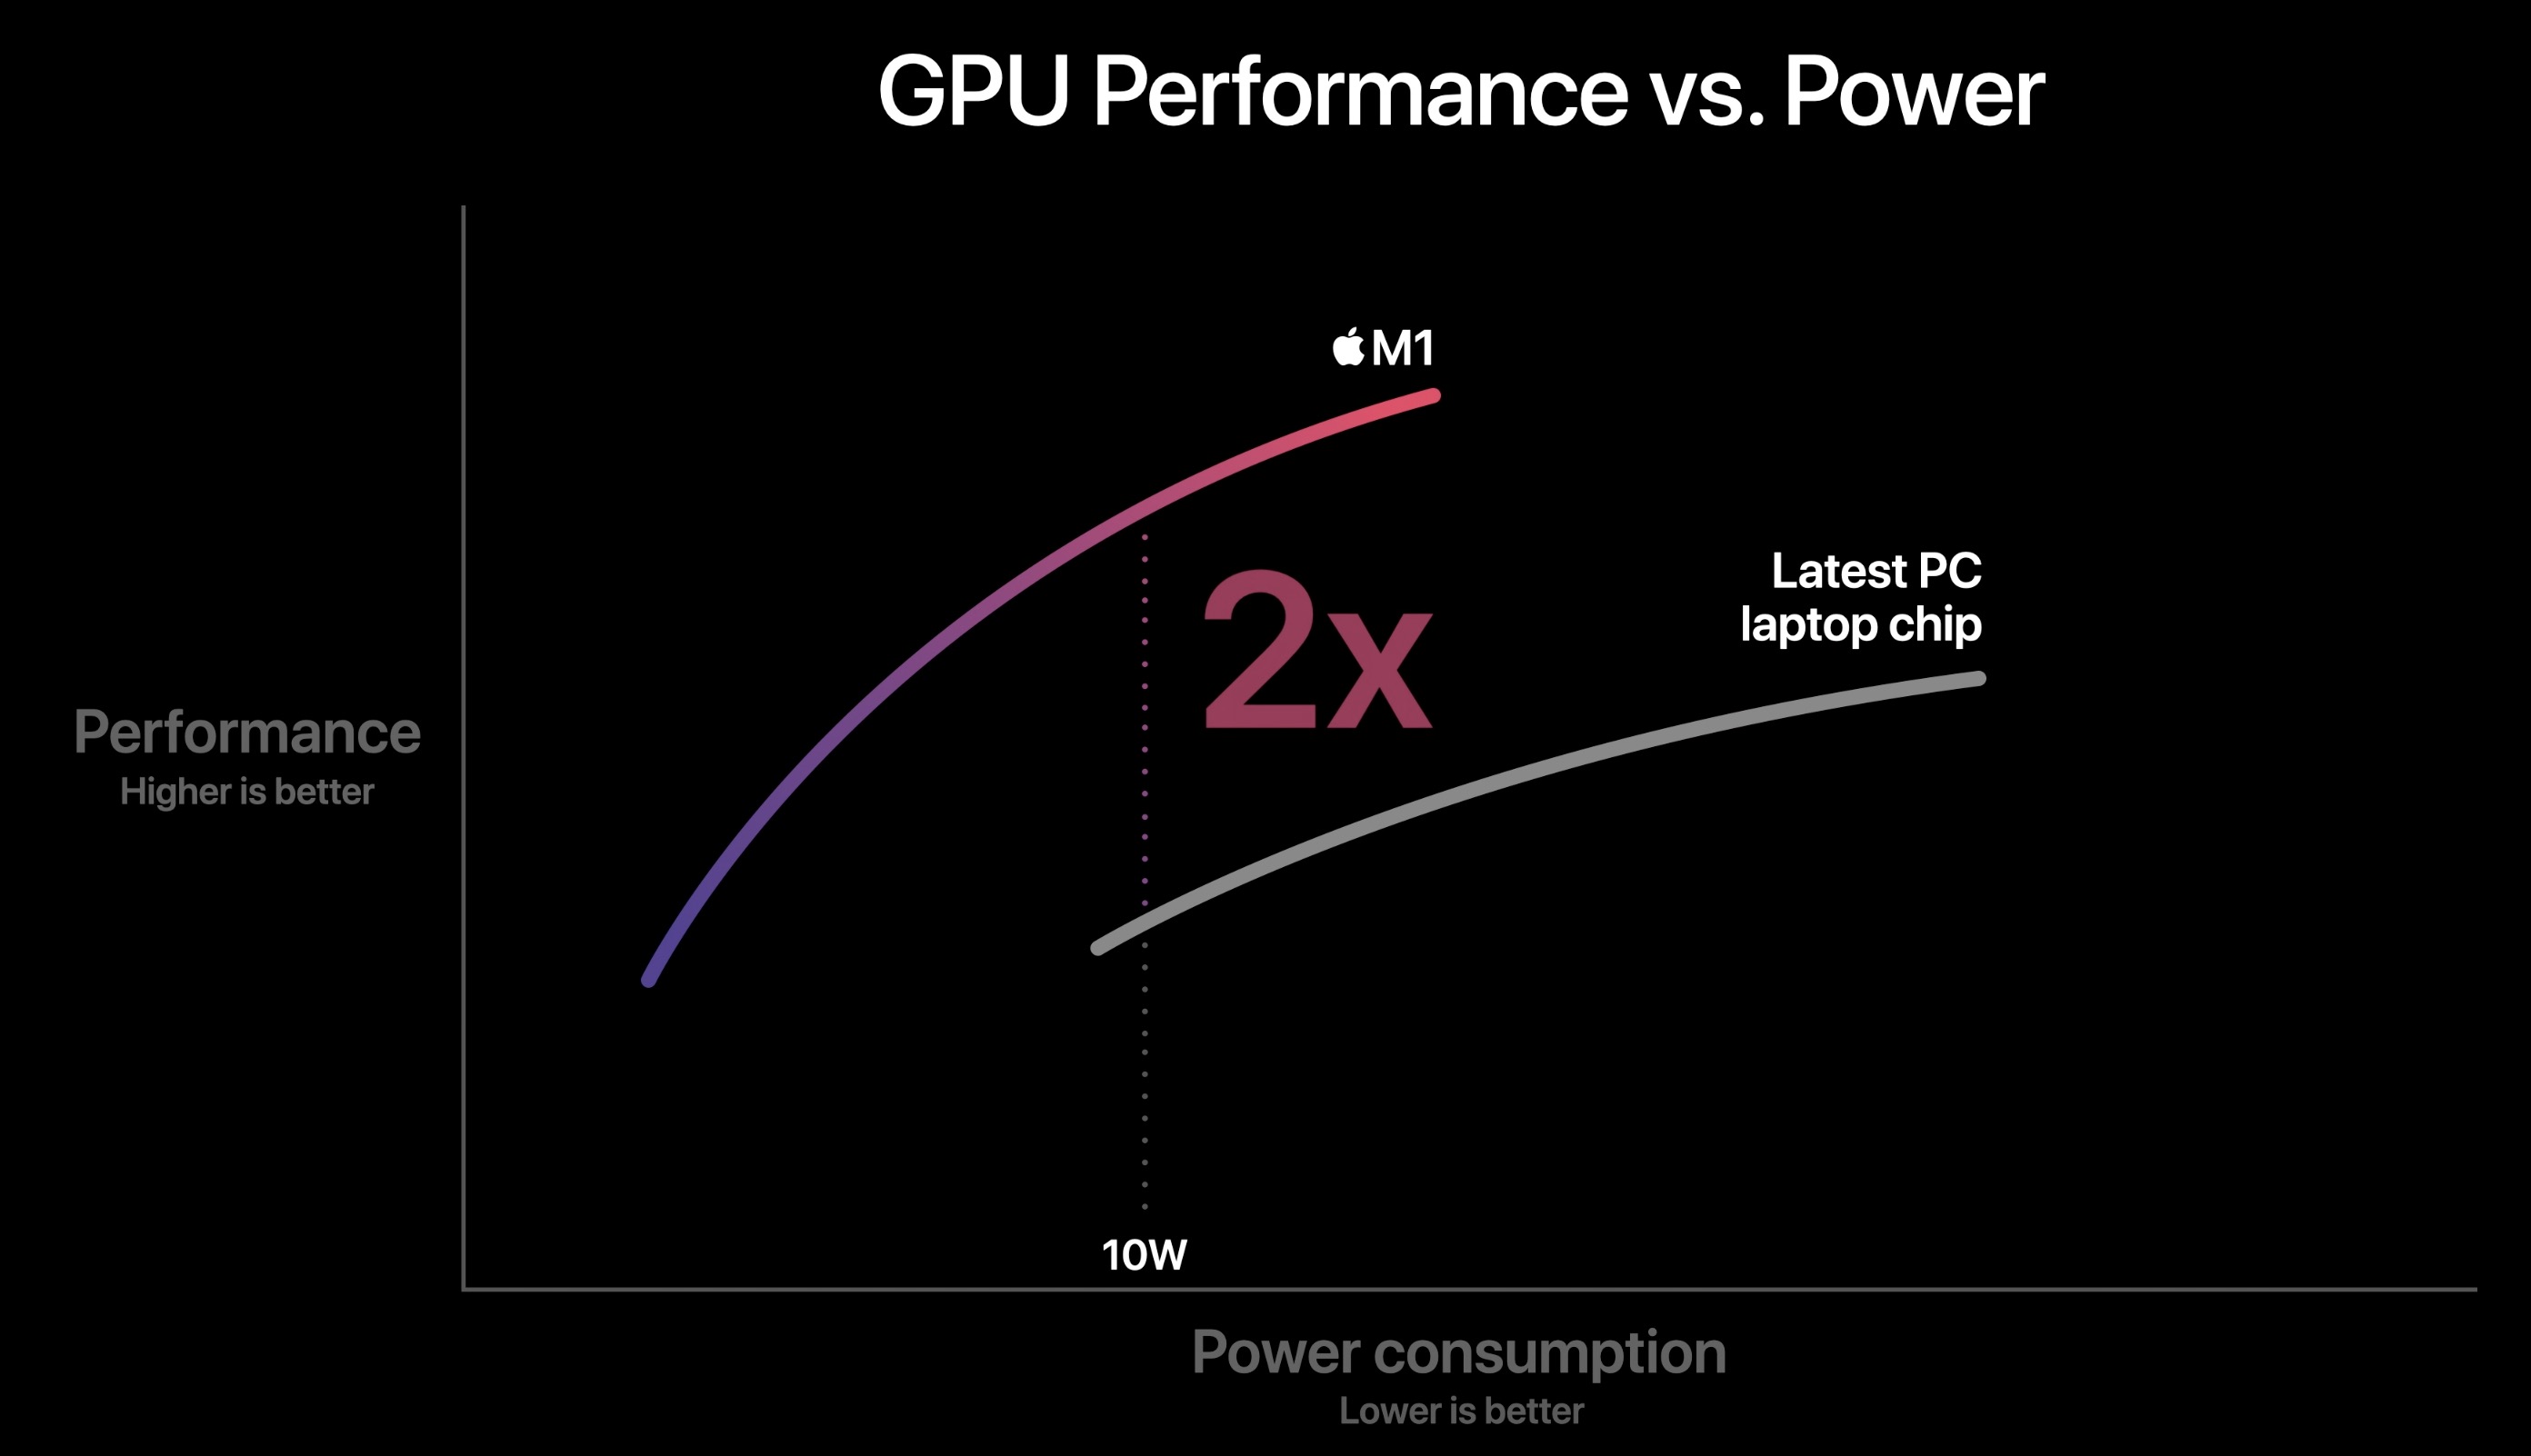
The Apple M1 GPU is an integrated graphics card offering 8 cores (1 deactivated core in the entry MacBook Air) designed by Apple and integrated in the Apple M1 SoC. According to Apple it is faster and more energy efficient as competing products (like the Tiger Lake Xe GPU). The peak performance of the high end variant is 2.6 teraflops and thanks to the unified memory architecture it should have fast access to the RAM.

The Apple M1 is manufactured in the modern 5nm process at TSMC and should offer an excellent energy efficiency. According to internal tools, the M1 GPU uses under load approximately 10 Watt (11.5 Watt package power including the RAM).

Intel Iris Plus Graphics 650

► remove from comparison Intel Iris Plus Graphics 650

The Intel Iris Plus Graphics 650 (GT3e) is a processor graphics card for Kaby Lake models announced in January 2017. As the successor to the Intel Iris Graphics 550 (Skylake), the Iris Plus Graphics 650 is used for 28-Watt models and is equipped with 64 MB eDRAM cache. There should not be any big changes compared to the Iris Graphics 550.

The so called GT3e version of the Kaby Lake GPU probably still has 48 Execution Units (EUs), which can reach up to 1100 MHz depending on the model. Besides eDRAM cache, the Iris 650 can also access the system memory (2x 64 Bit DDR3L-1600/DDR4-2400) via processor interface.

Compared to the Iris Plus 640 from the 15-Watt models, the Iris 650 only has a slightly higher maximum clock as well as almost twice the TDP, which allows a better utilization of the Turbo Boost potential.

Performance

The exact performance of the Iris Plus Graphics 650 depends on the CPU model, because maximum clock as well as the size of the L3 cache can differ a bit. The system memory (DDR3/DDR4) will influence the performance as well.

The fastest chips are high-clocked Core i7 models like the Core i7-7567U. Depending on the game, the Iris Plus 650 will probably be on par with a dedicated GeForce 930M and can handle smooth gameplay in modern titles in low up to medium settings.

Features

The reworked video engine now fully supports hardware decoding of H.265/HEVC videos. Contrary to Skylake, however, Kaby Lake can now also decode H.265/HEVC Main 10 with a 10-bit color depth as well as Google's VP9 codec. The video output is possible via DP 1.2/eDP 1.3 (up to 3840 x 2160 @60 Hz), whereas HDMI is also supported in the older 1.4a standard. An HDMI 2.0 output can be added via converter from DisplayPort. The GPU can drive up to three displays simultaneously.

Power Consumption

The Iris Plus Graphics 650 is used for 28-Watt processor and therefore medium-sized notebooks.

Apple M1 8-Core GPUIntel Iris Plus Graphics 650
Gen. 9.5 Series
M1 Max 32-Core GPU compare 32 @ 1.3 GHz512 Bit
M1 Max 24-Core GPU compare 24 @ 1.3 GHz
M1 Pro 16-Core GPU compare 16 @ 1.3 GHz
M1 Pro 14-Core GPU compare 14 @ 1.3 GHz
M1 8-Core GPU 8 @ 1.28 GHz
M1 7-Core GPU compare 7 @ 1.28 GHz
Iris Plus Graphics 655 compare 48 @ 0.3 - 1.2 GHz
Iris Plus Graphics 650 48 @ 0.3 - 1.1 GHz64/128 Bit
Iris Plus Graphics 645 compare 48 @ 0.3 - 1.15 GHz
Iris Plus Graphics 640 compare 48 @ 0.3 - 1.05 GHz64/128 Bit
UHD Graphics 630 compare 24 @ 0.3 - 1.15 GHz64/128 Bit
UHD Graphics P630 compare 24 @ 0.3 - 1.2 GHz64/128 Bit
HD Graphics 630 compare 24 @ 0.3 - 1.15 GHz64/128 Bit
HD Graphics P630 compare 24 64/128 Bit
UHD Graphics 620 compare 24 @ 0.3 - 1.15 GHz
HD Graphics 620 compare 24 @ 0.3 - 1.05 GHz64/128 Bit
UHD Graphics 617 compare 24 @ 0.3 - 1.15 GHz64/128 Bit
UHD Graphics 615 compare 24 @ 0.3 - 1 GHz64/128 Bit
HD Graphics 615 compare 24 @ 0.3 - 1.05 GHz64/128 Bit
Pipelines8 - unified48 - unified
Core Speed1278 MHz300 - 1100 (Boost) MHz
Theoretical Performance2.6 TFLOPS FP32
Memory TypeLPDDR4X-4266DDR4
Shared Memorynoyes
Power Consumption10 Watt
technology5 nm14 nm
Date of Announcement10.11.2020 03.01.2017
CodenameKaby Lake GT3e
ArchitectureGen. 9.5 Kaby Lake
Memory Bus Width64/128 Bit
APIDirectX 12_1, OpenGL 4.4
FeaturesQuickSync
CPU in M1 8-Core GPUGPU Base SpeedGPU Boost / Turbo
Apple M18 x 2064 MHz? MHz? MHz
CPU in Iris Plus Graphics 650GPU Base SpeedGPU Boost / Turbo
Intel Core i7-7567U2 x 3500 MHz, 28 W300 MHz1100 MHz
Intel Core i5-7287U2 x 3300 MHz, 28 W300 MHz1100 MHz
Intel Core i5-7267U2 x 3100 MHz, 28 W300 MHz1050 MHz
Intel Core i3-7167U2 x 2800 MHz, 28 W300 MHz1000 MHz
min. - max.300 MHz1000 - 1100 MHz

Benchmarks

3DMark - 3DMark Time Spy Score
623 Points (2%)
3DMark - 3DMark Time Spy Graphics
555 Points (1%)
3DMark - 3DMark Ice Storm Unlimited Graphics
280200 Points (28%)
3DMark - 3DMark Cloud Gate Score
min: 8403     avg: 9150     median: 9149.5 (9%)     max: 9896 Points
3DMark - 3DMark Cloud Gate Graphics
13153 Points (3%)
3DMark - 3DMark Fire Strike Standard Score
min: 1586     avg: 1655     median: 1655 (2%)     max: 1724 Points
3DMark - 3DMark Fire Strike Standard Graphics
1698 Points (2%)
3DMark - 3DMark Sling Shot (ES 3.0) Unlimited
min: 7588     avg: 10635     median: 10635 (46%)     max: 13682 Points
3DMark - 3DMark Sling Shot (ES 3.0) Unlimited Graphics
min: 35978     avg: 39365     median: 39364.5 (87%)     max: 42751 Points
3DMark - 3DMark Sling Shot Extreme (ES 3.1) Unlimited
min: 8911     avg: 9606     median: 9605.5 (40%)     max: 10300 Points
3DMark - 3DMark Sling Shot Extreme (ES 3.1) Unlimited Graphics
25707 Points (64%)
3DMark - 3DMark Sling Shot (ES 3.0)
0 Points (0%)
3DMark - 3DMark Sling Shot (ES 3.0) Graphics
0 Points (0%)
3DMark - 3DMark Wild Life Extreme Unlimited
min: 4144     avg: 4696     median: 4821 (6%)     max: 4997 Points
3DMark 11 - 3DM11 Performance Score
2924 Points (4%)
3DMark 11 - 3DM11 Performance GPU
2762 Points (2%)
3DMark 06 3DMark 06 - Standard 1280x1024 + Intel Iris Plus Graphics 650
3DMark 06
15175 Points (20%)
Cinebench R10 Cinebench R10 Shading (32bit) + Intel Iris Plus Graphics 650
Cinebench R10 - Cinebench R10 Shading (32bit)
8773 Points (6%)
Cinebench R11.5 Cinebench R11.5 OpenGL 64 Bit + Intel Iris Plus Graphics 650
Cinebench R11.5 - Cinebench R11.5 OpenGL 64 Bit
45.2 fps (15%)
Cinebench R15
Cinebench R15 OpenGL 64 Bit + Apple M1 8-Core GPU
Cinebench R15 - Cinebench R15 OpenGL 64 Bit
min: 88.1     avg: 89.1     median: 89.4 (5%)     max: 89.8 fps
Cinebench R15 OpenGL 64 Bit + Intel Iris Plus Graphics 650
min: 41.21     avg: 59.1     median: 59.1 (3%)     max: 77 fps
Cinebench R15 OpenGL Ref. Match 64 Bit + Apple M1 8-Core GPU
Cinebench R15 - Cinebench R15 OpenGL Ref. Match 64 Bit
99.5 % (100%)
Cinebench R15 OpenGL Ref. Match 64 Bit + Intel Iris Plus Graphics 650
GFXBench - GFXBench 5.0 Aztec Ruins High Tier Offscreen
min: 60.9     avg: 74.3     median: 78.1 (14%)     max: 81.7 fps
GFXBench - GFXBench 5.0 Aztec Ruins Normal Tier Offscreen
min: 149     avg: 196.9     median: 206 (15%)     max: 216.1 fps
GFXBench - GFXBench Car Chase Offscreen
min: 150     avg: 167.4     median: 165.1 (16%)     max: 197 fps
GFXBench 3.1 - GFXBench Manhattan ES 3.1 Offscreen
min: 216     avg: 248.2     median: 248.7 (5%)     max: 275 fps
GFXBench 3.0 - GFXBench 3.0 Manhattan Offscreen
min: 317     avg: 358.5     median: 345 (14%)     max: 408 fps
GFXBench (DX / GLBenchmark) 2.7
GFXBench T-Rex HD Offscreen C24Z16 + Apple M1 8-Core GPU
GFXBench (DX / GLBenchmark) 2.7 - GFXBench T-Rex HD Offscreen C24Z16
min: 557     avg: 610     median: 588 (5%)     max: 670 fps
Antutu v9 - AnTuTu v9 GPU
min: 549301     avg: 598951     median: 598951 (60%)     max: 648601 Points
LuxMark v2.0 64Bit - LuxMark v2.0 Room GPU
336 Samples/s (1%)
LuxMark v2.0 64Bit - LuxMark v2.0 Sala GPU
813 Samples/s (1%)
ComputeMark v2.1 - ComputeMark v2.1 Result
1730 Points (1%)
Power Consumption - Furmark Stress Test Power Consumption - external Monitor *
51.4 Watt (7%)
Power Consumption - The Witcher 3 Power Consumption - external Monitor *
51.4 Watt (7%)
Power Consumption - Witcher 3 Power Consumption *
min: 19.6     avg: 39.4     median: 39.4 (9%)     max: 59.2 Watt
Power Consumption - GFXBench Aztec Ruins Normal Tier Offscreen Power Consumption 150cd *
min: 16     avg: 16.4     median: 16.5 (6%)     max: 16.6 Watt
Emissions Witcher 3 Fan Noise + Intel Iris Plus Graphics 650
Emissions - Witcher 3 Fan Noise
39.1 dB(A) (56%)
Clock Speed - GPU Clock Witcher 3 ultra
998 MHz (39%)
Clock Speed - GPU Clock Speed Furmark
848 MHz (34%)

Average Benchmarks Apple M1 8-Core GPU → 100% n=3

Average Benchmarks Intel Iris Plus Graphics 650 → 75% n=3

- Range of benchmark values for this graphics card
red legend - Average benchmark values for this graphics card
* Smaller numbers mean a higher performance
1 This benchmark is not used for the average calculation

Game Benchmarks

The following benchmarks stem from our benchmarks of review laptops. The performance depends on the used graphics memory, clock rate, processor, system settings, drivers, and operating systems. So the results don't have to be representative for all laptops with this GPU. For detailed information on the benchmark results, click on the fps number.

League of Legends: Wild Rift

League of Legends: Wild Rift

2020
ultra
100%
M1 8-Core GPU:
60  fps
Call of Duty Mobile

Call of Duty Mobile

2020
high
100%
M1 8-Core GPU:
59 60 ~ 60 fps
ultra
100%
M1 8-Core GPU:
59 60 60 ~ 60 fps
Genshin Impact

Genshin Impact

2020
ultra
100%
M1 8-Core GPU:
59 60 ~ 60 fps
Armajet

Armajet

2020
high
100%
M1 8-Core GPU:
59 60 ~ 60 fps
low 1280x720
100%
M1 8-Core GPU:
30.4 52.5 54 56.7 ~ 48 fps
med. 1920x1080
100%
M1 8-Core GPU:
20.3 30.7 32.5 33 ~ 29 fps
high 1920x1080
100%
M1 8-Core GPU:
19 20 20.5 ~ 20 fps
low 1280x720
100%
M1 8-Core GPU:
93.4 100 100 100.1 ~ 98 fps
med. 1920x1080
100%
M1 8-Core GPU:
32.2 33 33 42.3 ~ 35 fps
high 1920x1080
100%
M1 8-Core GPU:
20 20.3 20.6 25.5 ~ 22 fps
ultra 1920x1080
100%
M1 8-Core GPU:
15 15 ~ 15 fps
low 1280x720
100%
M1 8-Core GPU:
64 66 78 ~ 69 fps
med. 1920x1080
100%
M1 8-Core GPU:
25 27 45 ~ 32 fps
high 1920x1080
100%
M1 8-Core GPU:
23 25 43 ~ 30 fps
ultra 1920x1080
100%
M1 8-Core GPU:
38  fps
PUBG Mobile

PUBG Mobile

2018
low
100%
M1 8-Core GPU:
39  fps
high
100%
M1 8-Core GPU:
39 39.9 40 ~ 40 fps
ultra
100%
M1 8-Core GPU:
39 44 ~ 42 fps
World of Tanks Blitz

World of Tanks Blitz

2018
high
100%
M1 8-Core GPU:
59  fps
Dirt 4

Dirt 4

2017
low 1280x720
Iris Plus Graphics 650:
64  fps
med. 1920x1080
Iris Plus Graphics 650:
21.3  fps
high 1920x1080
Iris Plus Graphics 650:
14.2  fps
low 1280x720
Iris Plus Graphics 650:
113  fps
med. 1920x1080
Iris Plus Graphics 650:
56.8  fps
high 1920x1080
Iris Plus Graphics 650:
38.9  fps
Prey

Prey

2017
low 1280x720
Iris Plus Graphics 650:
51.4  fps
med. 1920x1080
Iris Plus Graphics 650:
20.2  fps
low 1280x720
Iris Plus Graphics 650:
25.8  fps
med. 1920x1080
Iris Plus Graphics 650:
10.5  fps
low 1280x720
Iris Plus Graphics 650:
17.6  fps
For Honor

For Honor

2017
low 1280x720
Iris Plus Graphics 650:
39.7  fps
med. 1920x1080
Iris Plus Graphics 650:
15.2  fps
low 1280x720
Iris Plus Graphics 650:
15  fps
low 1280x720
Iris Plus Graphics 650:
32.4  fps
low 1280x720
Iris Plus Graphics 650:
54.1  fps
med. 1366x768
Iris Plus Graphics 650:
37.9  fps
high 1920x1080
Iris Plus Graphics 650:
36.8  fps
ultra 1920x1080
Iris Plus Graphics 650:
19.9  fps
low 1280x720
Iris Plus Graphics 650:
46.1  fps
med. 1366x768
Iris Plus Graphics 650:
29.5  fps
low 1024x768
Iris Plus Graphics 650:
42.2  fps
med. 1366x768
Iris Plus Graphics 650:
20.2  fps
low 1280x720
Iris Plus Graphics 650:
19.2  fps
med. 1366x768
Iris Plus Graphics 650:
14.6  fps
high 1920x1080
Iris Plus Graphics 650:
8.2  fps
Overwatch

Overwatch

2016
low 1280x720
Iris Plus Graphics 650:
79.2  fps
med. 1366x768
Iris Plus Graphics 650:
57.4  fps
high 1920x1080
Iris Plus Graphics 650:
25.6  fps
ultra 1920x1080
Iris Plus Graphics 650:
21.4  fps
low 1280x720
Iris Plus Graphics 650:
30  fps
low 1280x720
Iris Plus Graphics 650:
32  fps
med. 1920x1080
Iris Plus Graphics 650:
15  fps
low 1024x768
Iris Plus Graphics 650:
25.9  fps
med. 1366x768
Iris Plus Graphics 650:
18.3  fps
ultra 1920x1080
100%
M1 8-Core GPU:
39.6  fps
low 1024x768
Iris Plus Graphics 650:
54.2  fps
med. 1366x768
Iris Plus Graphics 650:
35.6  fps
high 1920x1080
Iris Plus Graphics 650:
20.8  fps
low 1280x720
Iris Plus Graphics 650:
95  fps
med. 1366x768
Iris Plus Graphics 650:
64  fps
high 1920x1080
Iris Plus Graphics 650:
29.7  fps
ultra 1920x1080
Iris Plus Graphics 650:
25  fps
low 1024x768
Iris Plus Graphics 650:
21.4  fps
GTA V

GTA V

2015
low 1024x768
Iris Plus Graphics 650:
56.5  fps
med. 1366x768
Iris Plus Graphics 650:
49.9  fps
high 1920x1080
Iris Plus Graphics 650:
11.6  fps
ultra 1920x1080
Iris Plus Graphics 650:
5  fps
low 1280x720
Iris Plus Graphics 650:
84  fps
med. 1366x768
Iris Plus Graphics 650:
54.4  fps
high 1366x768
Iris Plus Graphics 650:
46.5  fps
ultra 1920x1080
Iris Plus Graphics 650:
13.3  fps

Average Gaming Apple M1 8-Core GPU → 100%

Average Gaming 30-70 fps → 100%

Apple M1 8-Core GPUIntel Iris Plus Graphics 650
lowmed.highultraQHD4Klowmed.highultraQHD4K
League of Legends: Wild Rift60
Call of Duty Mobile6060
Genshin Impact60
Armajet60
Borderlands 3482920
Total War: Three Kingdoms98352215
Shadow of the Tomb Raider69323038
PUBG Mobile394042
World of Tanks Blitz59
Rise of the Tomb Raider39.625.918.3
Apple M1 8-Core GPUIntel Iris Plus Graphics 650
lowmed.highultraQHD4Klowmed.highultraQHD4K
< 30 fps
< 60 fps
< 120 fps
≥ 120 fps

2
2
1
2

2
3
2
1
3
3


< 30 fps
< 60 fps
< 120 fps
≥ 120 fps
1


1


For more games that might be playable and a list of all games and graphics cards visit our Gaming List

Add one or more devices and compare

In the following list you can select (and also search for) devices that should be added to the comparison. You can select more than one device.

restrict list:
v1.33
log 29. 20:02:58

#0 ran 0s before starting gpusingle class +0s ... 0s

#1 checking url part for id 10552 +0s ... 0s

#2 checking url part for id 7655 +0s ... 0s

#3 redirected to Ajax server, took 1759168978s time from redirect:0 +0s ... 0s

#4 did not recreate cache, as it is less than 5 days old! Created at Mon, 29 Sep 2025 12:07:01 +0200 +0s ... 0s

#5 composed specs +0.003s ... 0.004s

#6 did output specs +0s ... 0.004s

#7 start showIntegratedCPUs +0s ... 0.004s

#8 getting avg benchmarks for device 10552 +0.01s ... 0.014s

#9 got single benchmarks 10552 +0.001s ... 0.014s

#10 getting avg benchmarks for device 7655 +0s ... 0.015s

#11 got single benchmarks 7655 +0.005s ... 0.02s

#12 got avg benchmarks for devices +0s ... 0.02s

#13 No cached benchmark found, getting uncached values +0.004s ... 0.024s

#14 No cached benchmark found, getting uncached values +0s ... 0.024s

#15 min, max, avg, median took s +0.009s ... 0.033s

#16 before gaming benchmark output +0s ... 0.033s

#17 Got 104 rows for game benchmarks. +0.007s ... 0.041s

#18 composed SQL query for gamebenchmarks +0s ... 0.041s

#19 got data and put it in $dataArray +0.001s ... 0.042s

#20 benchmarks composed for output. +0.009s ... 0.051s

#21 calculated avg scores. +0s ... 0.051s

#22 return log +0.001s ... 0.051s

Please share our article, every link counts!
Mail Logo
> Expert Reviews and News on Laptops, Smartphones and Tech Innovations > Benchmarks / Tech > Graphics Card Comparison - Head 2 Head
Redaktion, 2017-09- 8 (Update: 2023-07- 1)