Notebookcheck Logo

Qualcomm Adreno 644 vs IMG BXM-8-256 vs Qualcomm Adreno 690

Qualcomm Adreno 644

► remove from comparison Qualcomm Adreno 644

The Qualcomm Adreno 644 is a smartphone and tablet GPU that is integrated within the Qualcomm Snapdragon 7 Gen 1 SoC. The chip was announced mid 2022 and was available in early 2023 in upper mid-range Android smartphones.

According to Qualcomm, the Adreno 644 GPU offers a 20% improved performance over the Adreno 642, its predecessor, which is integrated in the Snapdragon 780G SoC. This is also thanks to the fast LPDDR5 with 3200 MHz. In our benchmarks with the Mi 13 Lite however, the performance was only on par with the old Adreno 642.

The Adreno 644 supports OpenCL 2.0 FP, OpenGL ES 3.2 and Vulkan 1.1.

The Snapdragon 7 Gen 1 is manufactured in the modern 4nm process with EUV at Samsung that should provide a good power efficiency.

IMG BXM-8-256

► remove from comparison Imagination IMG BXM-8-256

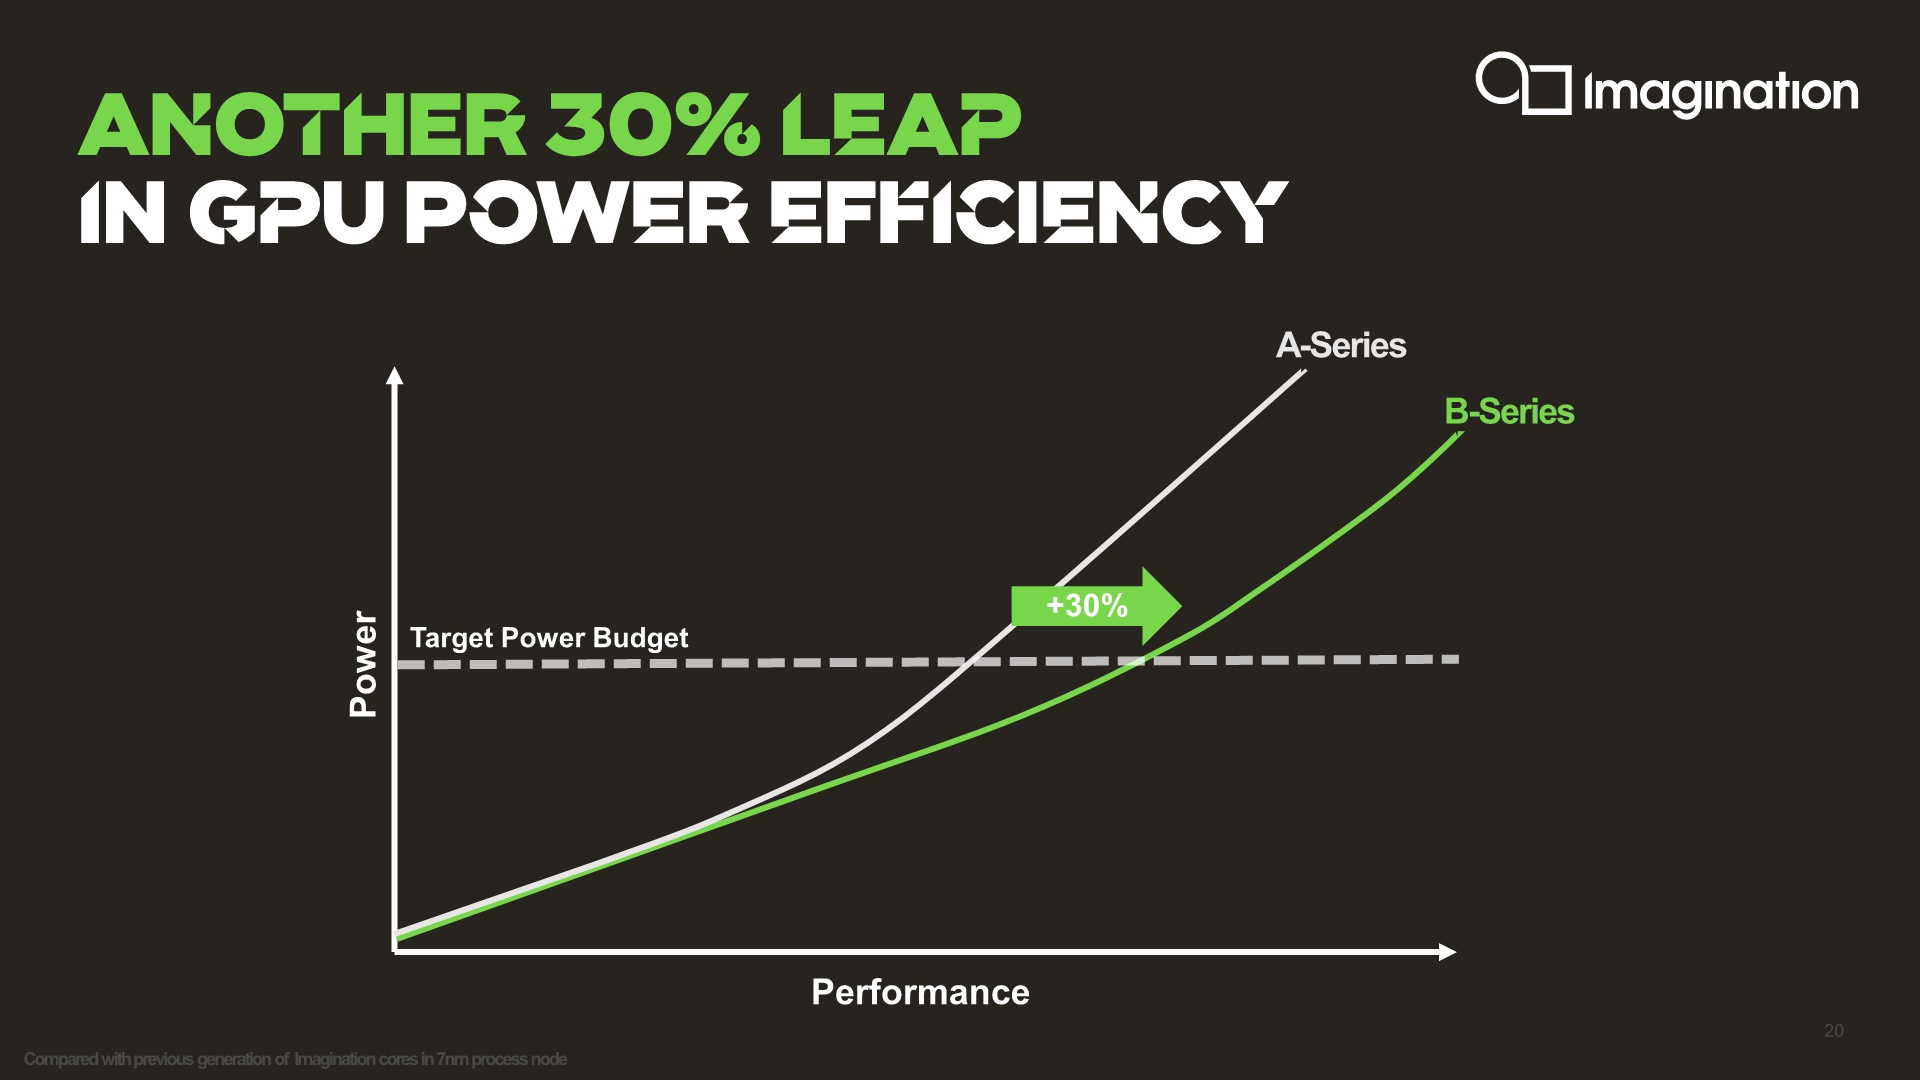
The Imagination IMG BXM-8-256 is an integrated graphics card for ARM-SoCs. It first appeared in the mid-range MediaTek Dimensity 930 (6nm) clocked at up to 900 MHz. The iGPU is based on the B-Series architecture that should be about 30% more power efficient than the previous generation (PowerVR). According to Imagination the BXM-8-256 MC1 (single core) offers 8 texels / clock and 256 FP32 / clock. The wavefront width is 128 Bit.

The GPU supports OpenGL ES 3.X, Vulkan 1.3, OpenCL 3.0, and Android NN HAL.

Qualcomm Adreno 690

► remove from comparison Qualcomm Adreno 690

The Qualcomm Adreno 690 is an integrated graphics card in the Qualcomm Snapdragon 8cx Gen 3 SoC for Windows laptops. According to Qualcomm, the 690 is up to 60% faster than the previous generation. In our tests with the Lenovo ThinkPad X13s, the Adreno 690 was only on par with a low en Intel UHD Graphics iGPU and not well suited for 3D games.

The chip is manufactured in 5nm at Samsung (5LPE) and suited for fanless laptops.

Qualcomm Adreno 644IMG BXM-8-256Qualcomm Adreno 690
Adreno 600 Series
Adreno 660
Adreno 650 @ 0.25 - 0.67 GHz
Adreno 690
Adreno 685
Adreno 680
Adreno 644
Adreno 643 @ 0.81 GHz
Adreno 642
Adreno 642L
Adreno 640
Adreno 630
Adreno 620
Adreno 619
Adreno 619L
Adreno 618
Adreno 616
Adreno 613 @ 0.96 GHz
Adreno 612
Adreno 610
IMG BXM-8-256 @ 0.9 GHz64 Bit
IMG BXM-4-64 MC1
Adreno 660
Adreno 650 @ 0.25 - 0.67 GHz
Adreno 690
Adreno 685
Adreno 680
Adreno 644
Adreno 643 @ 0.81 GHz
Adreno 642
Adreno 642L
Adreno 640
Adreno 630
Adreno 620
Adreno 619
Adreno 619L
Adreno 618
Adreno 616
Adreno 613 @ 0.96 GHz
Adreno 612
Adreno 610
Shared Memoryyesnoyes
APIOpenGL ES 3.2OpenGL ES 3.x, OpenCL 3.0, Vulkan 1.3DirectX 12
technology4 nm6 nm5 nm
FeaturesOpenGL ES 3.2, OpenCL 2.0, DirectX 12, Vulkan 1.1
Date of Announcement07.05.2021 09.09.2014 06.12.2018
PredecessorAdreno 642
CodenameB-Series
ArchitectureB-Series
Core Speed900 MHz
Memory Bus Width64 Bit
Link to Manufacturer Pagewww.imaginationtech.com
Power Consumption7 Watt
CPU in Adreno 644GPU Base SpeedGPU Boost / Turbo
Qualcomm Snapdragon 7 Gen 18 x 1800 MHz? MHz? MHz
CPU in IMG BXM-8-256GPU Base SpeedGPU Boost / Turbo
MediaTek Dimensity 70608 x 2000 MHz? MHz? MHz
MediaTek Dimensity 70258 x 2000 MHz? MHz? MHz
MediaTek Dimensity 70208 x 2000 MHz? MHz? MHz
MediaTek Dimensity 9308 x 2000 MHz? MHz900 MHz
min. - max.? MHz900 MHz
CPU in Adreno 690GPU Base SpeedGPU Boost / Turbo
Qualcomm Snapdragon 8cx Gen 38 x 2400 MHz, 7 W? MHz? MHz

Benchmarks

Performance Rating - 3DMark 11 + Fire Strike + Time Spy - Adreno 690
1.1 pt (3%)
0.05576 -95%
0.0842 -92%
0.192 -82%
0.3143 -71%
Qualcomm Adreno 690
1.097
...
0.3143 -71%
max:
33.3 2936%
0%
100%
Restrict / Search: Model: Max. age: years
3DMark - 3DMark Time Spy Score
909 Points (2%)
3DMark - 3DMark Time Spy Graphics
811 Points (2%)
3DMark - 3DMark Cloud Gate Score
min: 8602     avg: 9818     median: 9818 (9%)     max: 11034 Points
3DMark - 3DMark Cloud Gate Graphics
min: 13768     avg: 16708     median: 16707.5 (4%)     max: 19647 Points
3DMark - 3DMark Fire Strike Standard Score
min: 2758     avg: 2835     median: 2834.5 (4%)     max: 2911 Points
3DMark - 3DMark Fire Strike Standard Graphics
min: 2837     avg: 2933     median: 2932.5 (3%)     max: 3028 Points
3DMark - 3DMark Ice Storm Graphics
14652 Points (2%)
3DMark - 3DMark Sling Shot (ES 3.0) Unlimited
min: 6303     avg: 6921     median: 6953.5 (30%)     max: 7472 Points
min: 3172     avg: 3338     median: 3419 (15%)     max: 3423 Points
3DMark - 3DMark Sling Shot (ES 3.0) Unlimited Graphics
min: 8656     avg: 8893     median: 8751 (19%)     max: 9414 Points
min: 3278     avg: 3365     median: 3404 (7%)     max: 3413 Points
3DMark - 3DMark Sling Shot Extreme (ES 3.1) Unlimited
min: 5501     avg: 6187     median: 6286 (26%)     max: 6466 Points
3DMark - 3DMark Sling Shot Extreme (ES 3.1) Unlimited Graphics
min: 6767     avg: 7042     median: 7023 (17%)     max: 7388 Points
3DMark - 3DMark Sling Shot (ES 3.0)
min: 6114     avg: 6700     median: 6700 (60%)     max: 7285 Points
min: 3172     avg: 3330     median: 3378 (30%)     max: 3440 Points
3DMark - 3DMark Sling Shot (ES 3.0) Graphics
min: 8410     avg: 8641     median: 8487 (51%)     max: 9025 Points
min: 3221     avg: 3385     median: 3445 (21%)     max: 3488 Points
3DMark - 3DMark Sling Shot Extreme (ES 3.1)
min: 5090     avg: 5524     median: 5565 (27%)     max: 5876 Points
min: 2386     avg: 2508     median: 2553 (13%)     max: 2586 Points
3DMark - 3DMark Sling Shot Extreme (ES 3.1) Graphics
min: 5779     avg: 6156     median: 6159.5 (21%)     max: 6524 Points
min: 2368     avg: 2409     median: 2420 (8%)     max: 2440 Points
3DMark - 3DMark Wild Life Unlimited
min: 3035     avg: 3133     median: 3137 (2%)     max: 3184 Points
3DMark - 3DMark Wild Life Extreme Unlimited
min: 825     avg: 832     median: 829 (1%)     max: 854 Points
3067 Points (4%)
3DMark 11 - 3DM11 Performance Score
min: 3063     avg: 3085     median: 3077 (4%)     max: 3115 Points
3DMark 11 - 3DM11 Performance GPU
min: 2898     avg: 2930     median: 2912 (2%)     max: 2979 Points
Cinebench R10 Cinebench R10 Shading (32bit) + Qualcomm Adreno 690
Cinebench R10 - Cinebench R10 Shading (32bit)
558 Points (0%)
Cinebench R15
Cinebench R15 OpenGL 64 Bit + Qualcomm Adreno 690
Cinebench R15 - Cinebench R15 OpenGL 64 Bit
min: 13.4     avg: 13.7     median: 13.7 (1%)     max: 14 fps
Cinebench R15 OpenGL Ref. Match 64 Bit + Qualcomm Adreno 690
Cinebench R15 - Cinebench R15 OpenGL Ref. Match 64 Bit
98 % (98%)
GFXBench - GFXBench 5.0 4K Aztec Ruins High Tier Offscreen
min: 7     avg: 7.4     median: 7.5 (3%)     max: 7.9 fps
GFXBench - GFXBench 5.0 Aztec Ruins High Tier Offscreen
min: 15     avg: 16.4     median: 17 (3%)     max: 18 fps
GFXBench - GFXBench 5.0 Aztec Ruins Normal Tier Offscreen
min: 41     avg: 45.3     median: 46 (3%)     max: 49 fps
GFXBench - GFXBench Car Chase Offscreen
min: 37     avg: 38.2     median: 38 (4%)     max: 40 fps
GFXBench 3.1 - GFXBench Manhattan ES 3.1 Offscreen
min: 52     avg: 62.4     median: 65 (1%)     max: 67 fps
GFXBench 3.0 - GFXBench 3.0 Manhattan Offscreen
min: 86     avg: 89.2     median: 88 (4%)     max: 94 fps
GFXBench (DX / GLBenchmark) 2.7
GFXBench T-Rex HD Offscreen C24Z16 + Qualcomm Adreno 644
GFXBench (DX / GLBenchmark) 2.7 - GFXBench T-Rex HD Offscreen C24Z16
min: 147     avg: 150.2     median: 148 (1%)     max: 158 fps
GFXBench T-Rex HD Offscreen C24Z16 + IMG BXM-8-256
Antutu v9 - AnTuTu v9 GPU
min: 174679     avg: 177977     median: 175343 (18%)     max: 187645 Points
min: 97300     avg: 99703     median: 99542 (10%)     max: 102429 Points
Antutu v10 - AnTuTu v10 GPU
170281 Points (14%)
min: 50589     avg: 60777     median: 52732 (4%)     max: 79011 Points
Basemark GPU 1.2 - Basemark GPU 1.2 Vulkan Official Medium Offscreen 1080
min: 50.74     avg: 51.7     median: 51.7 (1%)     max: 52.63 fps
min: 30.78     avg: 33.7     median: 34.9 (1%)     max: 35.77 fps
Geekbench 6.4 - Geekbench 6.4 GPU OpenCL
min: 2448     avg: 2513     median: 2497 (1%)     max: 2610 Points
min: 139     avg: 151     median: 157 (0%)     max: 157 Points
Geekbench 6.4 - Geekbench 6.4 GPU Vulkan
min: 2650     avg: 2776     median: 2729.5 (1%)     max: 2993 Points
min: 134     avg: 146     median: 152 (0%)     max: 152 Points
PassMark PerformanceTest Mobile V1 - PerformanceTest Mobile V1 2D Graphics Tests
30029 Points (10%)
24737 Points (8%)
PassMark PerformanceTest Mobile V1 - PerformanceTest Mobile V1 3D Graphics Tests
42541 Points (70%)
11252 Points (19%)
Power Consumption - Furmark Stress Test Power Consumption - external Monitor *
min: 17     avg: 19.7     median: 19.7 (3%)     max: 22.3 Watt
Power Consumption - The Witcher 3 Power Consumption - external Monitor *
15.8 Watt (2%)
Power Consumption - Witcher 3 Power Consumption *
16.4 Watt (4%)
Power Consumption - GFXBench Aztec Ruins Normal Tier Offscreen Power Consumption 150cd *
min: 4.19     avg: 4.8     median: 4.6 (2%)     max: 5.9 Watt

Average Benchmarks Qualcomm Adreno 644 → 100% n=1

Average Benchmarks IMG BXM-8-256 → 0% n=1

Average Benchmarks Qualcomm Adreno 690 → 370% n=1

- Range of benchmark values for this graphics card
red legend - Average benchmark values for this graphics card
* Smaller numbers mean a higher performance
1 This benchmark is not used for the average calculation

Game Benchmarks

The following benchmarks stem from our benchmarks of review laptops. The performance depends on the used graphics memory, clock rate, processor, system settings, drivers, and operating systems. So the results don't have to be representative for all laptops with this GPU. For detailed information on the benchmark results, click on the fps number.

F1 22

F1 22

2022
low 1920x1080
Adreno 690:
26  fps
med. 1920x1080
Adreno 690:
22.5  fps
high 1920x1080
Adreno 690:
17  fps
ultra 1920x1080
Adreno 690:
12.6  fps
Diablo Immortal

Diablo Immortal

2022
low Medium
100%
Adreno 644:
42  fps
ultra Ultra
100%
Adreno 644:
45  fps
Genshin Impact

Genshin Impact

2020
low
IMG BXM-8-256:
35 37.9 43.5 ~ 39 fps
ultra
IMG BXM-8-256:
24 24.7 25.9 ~ 25 fps
Armajet

Armajet

2020
high
100%
Adreno 644:
45 89 ~ 67 fps
106%
IMG BXM-8-256:
60 82 ~ 71 fps
PUBG Mobile

PUBG Mobile

2018
low
100%
Adreno 644:
60 60 ~ 60 fps
67%
IMG BXM-8-256:
39.6 39.7 40 ~ 40 fps
med.
100%
Adreno 644:
40  fps
73%
IMG BXM-8-256:
29  fps
high
100%
Adreno 644:
40 40 40 40 40 ~ 40 fps
78%
IMG BXM-8-256:
29.7 29.8 30 30 30 39 ~ 31 fps
low 1280x720
Adreno 690:
0 (!) 20.7 21.3 ~ 14 fps
med. 1920x1080
Adreno 690:
0 (!) 18 18.9 ~ 12 fps
high 1920x1080
Adreno 690:
0 (!) 16.1 16.3 ~ 11 fps
4K 3840x2160
Adreno 690:
0 (!)  fps
low 1280x720
Adreno 690:
19  fps
med. 1920x1080
Adreno 690:
12.3  fps
high 1920x1080
Adreno 690:
7.3  fps
low 1280x720
Adreno 690:
57.1 57.5 58.7 ~ 58 fps
med. 1366x768
Adreno 690:
54.5 54.5 55.2 ~ 55 fps
high 1920x1080
Adreno 690:
38.8 45.9 47 ~ 44 fps
ultra 1920x1080
Adreno 690:
29.4 40.2 40.7 ~ 37 fps
low 1024x768
Adreno 690:
0 (!) 35 38.6 ~ 25 fps
med. 1366x768
Adreno 690:
0 (!) 31.5 ~ 16 fps
high 1920x1080
Adreno 690:
0 (!) 19.1 ~ 10 fps
ultra 1920x1080
Adreno 690:
0 (!) 8.5 ~ 4 fps
4K 3840x2160
Adreno 690:
0 (!)  fps
GTA V

GTA V

2015
low 1024x768
Adreno 690:
29.9  fps
Dead Trigger 2

Dead Trigger 2

2013
high
100%
Adreno 644:
60  fps
192%
IMG BXM-8-256:
115  fps
Asphalt 9: Legends

Asphalt 9: Legends

2013
low
IMG BXM-8-256:
30 59 59.4 ~ 49 fps
high
IMG BXM-8-256:
58.1 59.3 ~ 59 fps
Subway Surfers

Subway Surfers

2012
high
100%
Adreno 644:
60 61 ~ 61 fps
172%
IMG BXM-8-256:
90 120 ~ 105 fps

Average Gaming Qualcomm Adreno 644 → 100%

Average Gaming 30-70 fps → 100%

Average Gaming IMG BXM-8-256 → 114%

Average Gaming 30-70 fps → 72%

Qualcomm Adreno 644IMG BXM-8-256Qualcomm Adreno 690
lowmed.highultraQHD4Klowmed.highultraQHD4Klowmed.highultraQHD4K
F1 222622.51712.6
X-Plane 11.11141211
Final Fantasy XV Benchmark1912.37.29
Dota 2 Reborn58554437
The Witcher 32516104
GTA V29.9
Qualcomm Adreno 644IMG BXM-8-256Qualcomm Adreno 690
lowmed.highultraQHD4Klowmed.highultraQHD4Klowmed.highultraQHD4K
< 30 fps
< 60 fps
< 120 fps
≥ 120 fps


< 30 fps
< 60 fps
< 120 fps
≥ 120 fps


< 30 fps
< 60 fps
< 120 fps
≥ 120 fps
5
1

4
1

4
1

2
1


For more games that might be playable and a list of all games and graphics cards visit our Gaming List

v1.33
log 19. 14:49:21

#0 ran 0s before starting gpusingle class +0s ... 0s

#1 checking url part for id 11580 +0s ... 0s

#2 checking url part for id 11586 +0s ... 0s

#3 checking url part for id 11411 +0s ... 0s

#4 redirected to Ajax server, took 1755607761s time from redirect:0 +0s ... 0s

#5 did not recreate cache, as it is less than 5 days old! Created at Tue, 19 Aug 2025 05:19:58 +0200 +0s ... 0s

#6 composed specs +0.021s ... 0.021s

#7 did output specs +0s ... 0.021s

#8 start showIntegratedCPUs +0s ... 0.021s

#9 getting avg benchmarks for device 11580 +0.02s ... 0.041s

#10 got single benchmarks 11580 +0.008s ... 0.049s

#11 getting avg benchmarks for device 11586 +0s ... 0.049s

#12 got single benchmarks 11586 +0.01s ... 0.059s

#13 getting avg benchmarks for device 11411 +0.006s ... 0.065s

#14 got single benchmarks 11411 +0.005s ... 0.07s

#15 got avg benchmarks for devices +0s ... 0.07s

#16 No cached benchmark found, getting uncached values +0.011s ... 0.081s

#17 No cached benchmark found, getting uncached values +0.001s ... 0.082s

#18 min, max, avg, median took s +0.017s ... 0.099s

#19 before gaming benchmark output +0s ... 0.099s

#20 Got 81 rows for game benchmarks. +0.01s ... 0.109s

#21 composed SQL query for gamebenchmarks +0s ... 0.109s

#22 got data and put it in $dataArray +0.001s ... 0.11s

#23 benchmarks composed for output. +0.005s ... 0.115s

#24 calculated avg scores. +0s ... 0.115s

#25 return log +0s ... 0.116s

Please share our article, every link counts!
Mail Logo
> Expert Reviews and News on Laptops, Smartphones and Tech Innovations > Benchmarks / Tech > Graphics Card Comparison - Head 2 Head
Redaktion, 2017-09- 8 (Update: 2023-07- 1)