Notebookcheck Logo

AMD A12-9720P vs AMD Ryzen 5 2500U

AMD A12-9720P

► remove from comparison AMD A12-9720P

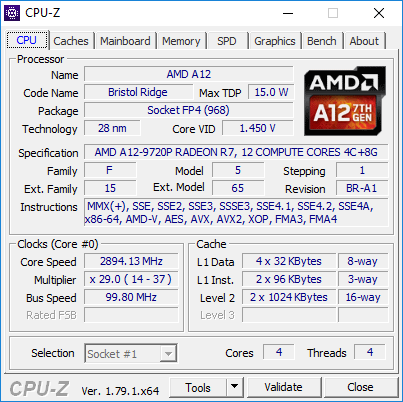
The AMD A12-9720P is a mainstream SoC from the Bristol Ridge APU series for notebooks (7th APU generation), which was introduced in 2017. The ULV chip with a TDP of 15 Watts (can be configured to 12 Watts, not verified) has four CPU cores (two Excavator modules) clocked at 2.7 - 3.8 GHz (4.05 GHz for single core were briefly achievable in our test sample), a Radeon R7 iGPU as well as a dual-channel DDR4-1866 memory controller. Carrizo is a full-fledged SoC and is also equipped with an integrated chipset, which provides all I/0 ports.

Architecture

Bristol Ridge is the successor of the Carrizo architecture and the design is almost identical. Thanks to optimized manufacturing processes and more aggressive Boost behavior, however, the clocks are a bit higher at the same power consumption. The memory controller now also supports DDR4-RAM, in this case up to 1866 MHz. More technical details are available in the following articles:

Performance

The average A12-9720P in our database is in the same league as the Core i5-4210U, as far as multi-thread benchmark scores are concerned, making the former a fairly slow chip that's suitable for basic day-to-day activities only as of late 2022.

Graphics

The integrated Radeon R7 (Bristol Ridge) GPU has 512 active shader units (8 compute cores) clocked at up to 758 MHz. Thanks to the better utilization of the clock range as well as faster DDR4-RAM, the GPU can slightly beat its predecessors Radeon R7 (Carrizo) and competes with a dedicated GeForce 920MX in the best-case scenario (dual-channel memory, low CPU requirements). Many games from 2015/2016 can be played smoothly at low settings.

Power Consumption

AMD specifies the TDP of the A12-9720P with 15 Watts, which is comparable to Intel's ULV models. This means the CPU is a good choice for thin notebooks starting with a 12-inch screen.

AMD Ryzen 5 2500U

► remove from comparison AMD R5 2500U

The AMD Ryzen 5 2500U is a mobile APU for thin and light laptops that was announced in October 2017. It includes four Zen cores clocked at 2 to 3.6 GHz and offers 4 MB L3-Cache. The integrated graphics card is called Radeon RX Vega 8 and offers 8 CUs (512 Shaders) clocked at up to 1100 MHz. The TDP is configurable between 12 and 25 Watt (15 Watt nominal). More information on Raven Ridge can be found in our launch article.

ModelAMD A12-9720PAMD Ryzen 5 2500U
CodenameBristol RidgeZen
SeriesAMD Bristol RidgeAMD Raven Ridge (Ryzen 2000 APU)
Series: Raven Ridge (Ryzen 2000 APU) Zen
AMD FX-9830P compare3 - 3.7 GHz4 / 4 cores
AMD PRO A12-9830B compare3 - 3.7 GHz4 / 4 cores
AMD FX-9800P compare2.7 - 3.6 GHz4 / 4 cores
AMD PRO A12-9800B compare2.7 - 3.6 GHz4 / 4 cores
AMD A12-9720P « 2.7 - 3.6 GHz4 / 4 cores
AMD A12-9700P compare2.5 - 3.4 GHz4 / 4 cores
AMD A10-9620P compare2.5 - 3.4 GHz4 / 4 cores
AMD A10-9600P compare2.4 - 3.3 GHz4 / 4 cores
AMD PRO A8-9600B compare2.4 - 3.3 GHz4 / 4 cores
AMD Ryzen 5 2400G compare3.6 - 3.9 GHz4 / 8 cores4 MB L3
AMD Ryzen 7 2700U compare2.2 - 3.8 GHz4 / 8 cores4 MB L3
AMD Ryzen 7 PRO 2700U compare2.2 - 3.8 GHz4 / 8 cores4 MB L3
AMD Ryzen 3 2200G compare3.5 - 3.7 GHz4 / 4 cores4 MB L3
AMD Ryzen 5 2600H compare3.2 - 3.6 GHz4 / 8 cores4 MB L3
AMD Ryzen 5 2500U « 2 - 3.6 GHz4 / 8 cores4 MB L3
AMD Ryzen 5 PRO 2500U compare2 - 3.6 GHz4 / 8 cores4 MB L3
AMD Ryzen Embedded V1605B compare2 - 3.6 GHz4 / 8 cores4 MB L3
AMD Ryzen 3 2300U compare2 - 3.4 GHz4 / 4 cores4 MB L3
AMD Ryzen 3 PRO 2300U compare2 - 3.4 GHz4 / 4 cores4 MB L3
AMD Ryzen Embedded R1606G compare2.6 - 3.5 GHz2 / 4 cores4 MB L3
AMD Ryzen 3 2200U compare2.5 - 3.4 GHz2 / 4 cores4 MB L3
AMD Ryzen 3 PRO 2200U compare2.5 - 3.4 GHz2 / 4 cores4 MB L3
AMD Ryzen Embedded R1505G compare2.4 - 3.3 GHz2 / 4 cores4 MB L3
AMD Athlon 300U compare2.4 - 3.3 GHz2 / 4 cores4 MB L3
Clock2700 - 3600 MHz2000 - 3600 MHz
L2 Cache2 MB2 MB
Cores / Threads4 / 44 / 8
TDP15 Watt15 Watt
Transistors3100 Million4500 Million
Technology28 nm14 nm
Die Size250 mm2
max. Temp.90 °C
SocketFP4AM4
FeaturesDDR4-1866 RAM, PCIe 3, MMX, SSE, SSE2, SSE3, SSSE3, SSE4A, SSE4.1, SSE4.2, AVX, AVX2, BMI2, ABM, TBM, FMA4, XOP, SMEP, CPB, AES-NI, RDRANDXFR, FMA3, SSE 4.2, AVX2, SMT
iGPUAMD Radeon R7 (Bristol Ridge) ( - 758 MHz)AMD Radeon RX Vega 8 (Ryzen 2000/3000) ( - 1100 MHz)
Architecturex86x86
Announced
L1 Cache384 KB
L3 Cache4 MB

Benchmarks

Performance Rating - CB R15 + R20 + 7-Zip + X265 + Blender + 3DM11 CPU - R5 2500U
24.4 pt (41%)
Restrict / Search: Model: Max. age: years
Cinebench R20 - Cinebench R20 CPU (Single Core)
min: 338     avg: 351     median: 354.5 (39%)     max: 357 Points
Cinebench R20 - Cinebench R20 CPU (Multi Core)
min: 1103     avg: 1267     median: 1298.5 (3%)     max: 1367 Points
Cinebench R15 - Cinebench R15 CPU Multi 64 Bit
min: 229     avg: 234.5     median: 234.5 (1%)     max: 240 Points
min: 510     avg: 598     median: 609 (4%)     max: 642 Points
Cinebench R15 - Cinebench R15 CPU Single 64 Bit
min: 69     avg: 72.5     median: 72.5 (20%)     max: 76 Points
min: 124     avg: 136.2     median: 137 (38%)     max: 142 Points
Cinebench R11.5 - Cinebench R11.5 CPU Multi 64 Bit
min: 2.6     avg: 2.7     median: 2.7 (3%)     max: 2.7 Points
min: 5.71     avg: 6.5     median: 6.6 (9%)     max: 6.91 Points
Cinebench R11.5 - Cinebench R11.5 CPU Single 64 Bit
min: 0.93     avg: 0.9     median: 0.9 (22%)     max: 0.94 Points
min: 1.53     avg: 1.6     median: 1.6 (38%)     max: 1.61 Points
Cinebench R10 - Cinebench R10 Rend. Single (32bit)
min: 2640     avg: 2743     median: 2743 (17%)     max: 2846 Points
min: 4103     avg: 4371     median: 4410.5 (27%)     max: 4473 Points
Cinebench R10 - Cinebench R10 Rend. Multi (32bit)
min: 7200     avg: 7361     median: 7361 (5%)     max: 7522 Points
min: 13850     avg: 15426     median: 15683.5 (11%)     max: 16471 Points
wPrime 2.10 - wPrime 2.0 1024m *
415.5 s (5%)
min: 251.1     avg: 313.5     median: 313.5 (4%)     max: 375.9 s
wPrime 2.10 - wPrime 2.0 32m *
13 s (3%)
min: 7.819     avg: 10.2     median: 10.2 (2%)     max: 12.64 s
WinRAR - WinRAR 4.0
min: 2416     avg: 2426     median: 2425.5 (4%)     max: 2435 Points
7-Zip 18.03 - 7-Zip 18.03 Multi Thread 4 runs
min: 15360     avg: 16200     median: 16251 (9%)     max: 16988 MIPS
7-Zip 18.03 - 7-Zip 18.03 Single Thread 4 runs
min: 2924     avg: 3269     median: 3441 (41%)     max: 3443 MIPS
X264 HD Benchmark 4.0 - x264 Pass 2
min: 33     avg: 34.7     median: 34.7 (1%)     max: 36.4 fps
X264 HD Benchmark 4.0 - x264 Pass 1
min: 118     avg: 121     median: 121 (3%)     max: 124 fps
HWBOT x265 Benchmark v2.2 - HWBOT x265 4k Preset
min: 3.6     avg: 3.7     median: 3.7 (6%)     max: 3.74 fps
TrueCrypt - TrueCrypt Serpent
0.2 GB/s (7%)
min: 0.357     avg: 0.4     median: 0.4 (11%)     max: 0.403 GB/s
TrueCrypt - TrueCrypt Twofish
0.4 GB/s (6%)
min: 0.543     avg: 0.6     median: 0.6 (10%)     max: 0.568 GB/s
TrueCrypt - TrueCrypt AES
1.8 GB/s (5%)
min: 3.2     avg: 3.3     median: 3.3 (9%)     max: 3.4 GB/s
Blender - Blender 2.79 BMW27 CPU *
min: 757     avg: 771     median: 770.5 (5%)     max: 784 Seconds
3DMark 06 - CPU - 3DMark 06 - CPU
min: 4155     avg: 4952     median: 4828 (10%)     max: 5873 Points
Super Pi mod 1.5 XS 1M - Super Pi mod 1.5 XS 1M *
min: 17.77     avg: 19.6     median: 19.6 (4%)     max: 21.4 s
min: 11.77     avg: 17.7     median: 12.3 (3%)     max: 29 s
Super Pi mod 1.5 XS 2M - Super Pi mod 1.5 XS 2M *
min: 39.77     avg: 44.1     median: 44.1 (2%)     max: 48.5 s
min: 26.95     avg: 27.4     median: 27.3 (1%)     max: 28 s
Super Pi Mod 1.5 XS 32M - Super Pi mod 1.5 XS 32M *
min: 864     avg: 902     median: 901.5 (4%)     max: 939 s
min: 685     avg: 696     median: 697 (3%)     max: 706 s
3DMark Vantage - 3DM Vant. Perf. CPU no Physx
min: 14732     avg: 17114     median: 15610 (12%)     max: 21001 Points
3DMark 11 - 3DM11 Performance Physics
2761 Points (7%)
min: 3941     avg: 5637     median: 5973 (15%)     max: 6648 Points
3DMark - 3DMark Ice Storm Physics
25648 Points (21%)
min: 31155     avg: 32374     median: 31862 (26%)     max: 34052 Points
3DMark - 3DMark Ice Storm Extreme Physics
24747 Points (20%)
min: 29317     avg: 32015     median: 32593.5 (26%)     max: 33556 Points
3DMark - 3DMark Ice Storm Unlimited Physics
min: 24457     avg: 27079     median: 27079 (22%)     max: 29701 Points
min: 28284     avg: 32266     median: 32009.5 (26%)     max: 37624 Points
3DMark - 3DMark Cloud Gate Physics
min: 2258     avg: 2330     median: 2329.5 (6%)     max: 2401 Points
min: 1579     avg: 4508     median: 4609.5 (12%)     max: 6591 Points
3DMark - 3DMark Fire Strike Standard Physics
min: 3179     avg: 3265     median: 3264.5 (6%)     max: 3350 Points
min: 4922     avg: 7508     median: 7807 (14%)     max: 9138 Points
3DMark - 3DMark Time Spy CPU
min: 2166     avg: 2523     median: 2566 (11%)     max: 2821 Points
Geekbench 5.5 - Geekbench 5.1 - 5.5 64 Bit Single-Core
831 Points (32%)
Geekbench 5.5 - Geekbench 5.1 - 5.5 64 Bit Multi-Core
2515 Points (5%)
Geekbench 4.4 - Geekbench 4.1 - 4.4 64 Bit Single-Core
min: 3275     avg: 3641     median: 3703 (37%)     max: 3789 Points
Geekbench 4.4 - Geekbench 4.1 - 4.4 64 Bit Multi-Core
min: 9434     avg: 10029     median: 9952 (10%)     max: 10871 Points
Geekbench 4.0 - Geekbench 4.0 64 Bit Single-Core
min: 3558     avg: 3582     median: 3581.5 (40%)     max: 3605 Points
Geekbench 4.0 - Geekbench 4.0 64 Bit Multi-Core
min: 9480     avg: 9548     median: 9548 (13%)     max: 9616 Points
Geekbench 3 - Geekbench 3 32 Bit Multi-Core
min: 10506     avg: 11390     median: 11301 (20%)     max: 12280 Points
Geekbench 3 - Geekbench 3 32 Bit Single-Core
min: 3234     avg: 3379     median: 3383 (44%)     max: 3477 Points
Geekbench 3 - Geekbench 3 64 Bit Multi-Core
min: 11649     avg: 11774     median: 11773.5 (18%)     max: 11898 Points
Geekbench 3 - Geekbench 3 64 Bit Single-Core
min: 3601     avg: 3674     median: 3673.5 (55%)     max: 3746 Points
Geekbench 2 - 32 Bit - Geekbench Stream
7330 Points (39%)
Geekbench 2 - 32 Bit - Geekbench Memory
6320 Points (44%)
Geekbench 2 - 32 Bit - Geekbench Floating Point
13912 Points (27%)
Geekbench 2 - 32 Bit - Geekbench Integer
10715 Points (22%)
Geekbench 2 - 32 Bit - Geekbench Total Score
10616 Points (28%)
Mozilla Kraken 1.1 - Kraken 1.1 Total Score *
2422 ms (3%)
min: 1138     avg: 1349     median: 1411 (2%)     max: 1443 ms
Sunspider - Sunspider 1.0 Total Score *
min: 146.6     avg: 192.1     median: 192.1 (2%)     max: 237.6 ms
min: 110.2     avg: 122     median: 117 (1%)     max: 143.7 ms
Octane V2 - Octane V2 Total Score
min: 14783     avg: 16961     median: 16960.5 (12%)     max: 19138 Points
min: 21539     avg: 25871     median: 26534.5 (19%)     max: 29587 Points
WebXPRT 3 - WebXPRT 3 Score
160 Points (29%)
Power Consumption - Prime95 Power Consumption - external Monitor *
32.6 Watt (6%)
Power Consumption - Cinebench R15 Multi Power Consumption - external Monitor *
39.4 Watt (7%)
Power Consumption - Power Efficiency - Cinebench R15 Multi external Monitor
15.5 Points per Watt (12%)

Average Benchmarks AMD A12-9720P → 100% n=23

Average Benchmarks AMD Ryzen 5 2500U → 173% n=23

- Range of benchmark values for this graphics card
red legend - Average benchmark values for this graphics card
* Smaller numbers mean a higher performance
1 This benchmark is not used for the average calculation

Add one or more devices and compare

In the following list you can select (and also search for) devices that should be added to the comparison. You can select more than one device.

restrict list:
v1.34
log 08. 07:05:03

#0 ran 0s before starting gpusingle class +0s ... 0s

#1 checking url part for id 9192 +0s ... 0s

#2 checking url part for id 9310 +0s ... 0s

#3 redirected to Ajax server, took 1759899903s time from redirect:0 +0s ... 0s

#4 did not recreate cache, as it is less than 5 days old! Created at Tue, 07 Oct 2025 05:18:31 +0200 +0s ... 0s

#5 composed specs +0.007s ... 0.007s

#6 did output specs +0s ... 0.007s

#7 getting avg benchmarks for device 9192 +0.001s ... 0.007s

#8 got single benchmarks 9192 +0.006s ... 0.013s

#9 getting avg benchmarks for device 9310 +0.005s ... 0.018s

#10 got single benchmarks 9310 +0.021s ... 0.039s

#11 got avg benchmarks for devices +0s ... 0.039s

#12 min, max, avg, median took s +0.039s ... 0.079s

#13 return log +0.002s ... 0.08s

Please share our article, every link counts!
Mail Logo
> Expert Reviews and News on Laptops, Smartphones and Tech Innovations > Benchmarks / Tech > Processor Comparison - Head 2 Head
Redaktion, 2017-09- 8 (Update: 2023-07- 1)