Microsoft Surface Laptop Go Review: An Overpriced Netbook
Similar to how the Surface Go tablet is the smaller, gimped version of the regular Surface Pro tablet, the Surface Laptop Go is the smaller, gimped version of the regular Surface Laptop 3. Prices start at only $550 USD for configurations with 65 GB of storage and 4 GB of RAM, but this can quickly rise to $900 USD if you want to double the storage and RAM. All SKUs at the moment come with the Core i5-1035G1 and same 3:2 1536 x 1024 resolution touchscreen.
The Surface Laptop Go is in a class of its own because of its unique combination of a 3:2 form factor and 12.4-inch display. Nonetheless, comparisons against pricier well-known 13-inch subnotebooks like the Huawei MateBook X Pro, Dell XPS 13, MacBook Pro 13, Asus ZenBook S UX393, or Microsoft's own Surface Laptop 3 13 are inevitable.
More Microsoft reviews:
Rating | Date | Model | Weight | Height | Size | Resolution | Price |
|---|---|---|---|---|---|---|---|
| 84.6 % v7 (old) | 10 / 2020 | Microsoft Surface Laptop Go Core i5 i5-1035G1, UHD Graphics G1 (Ice Lake 32 EU) | 1.1 kg | 15.69 mm | 12.40" | 1536x1024 | |
| 85.1 % v7 (old) | 10 / 2020 | Asus Zenbook S UX393JA i7-1065G7, Iris Plus Graphics G7 (Ice Lake 64 EU) | 1.4 kg | 15.7 mm | 13.90" | 3300x2200 | |
| 88.7 % v7 (old) | 09 / 2020 | HP EliteBook 830 G7 i7-10810U, UHD Graphics 620 | 1.3 kg | 18.1 mm | 13.30" | 1920x1080 | |
| 84 % v7 (old) | 02 / 2020 | Microsoft Surface Laptop 3 13 Core i5-1035G7 i5-1035G7, Iris Plus Graphics G7 (Ice Lake 64 EU) | 1.3 kg | 14.5 mm | 13.50" | 2256x1504 | |
| 87.4 % v7 (old) | 06 / 2020 | Huawei MateBook X Pro 2020 i7 i7-10510U, GeForce MX250 | 1.3 kg | 14.6 mm | 13.90" | 3000x2000 | |
| 92.1 % v7 (old) | 06 / 2020 | Apple MacBook Pro 13 2020 2GHz i5 10th-Gen i5-1038NG7, Iris Plus Graphics G7 (Ice Lake 64 EU) | 1.4 kg | 15.6 mm | 13.30" | 2560x1600 |
Case
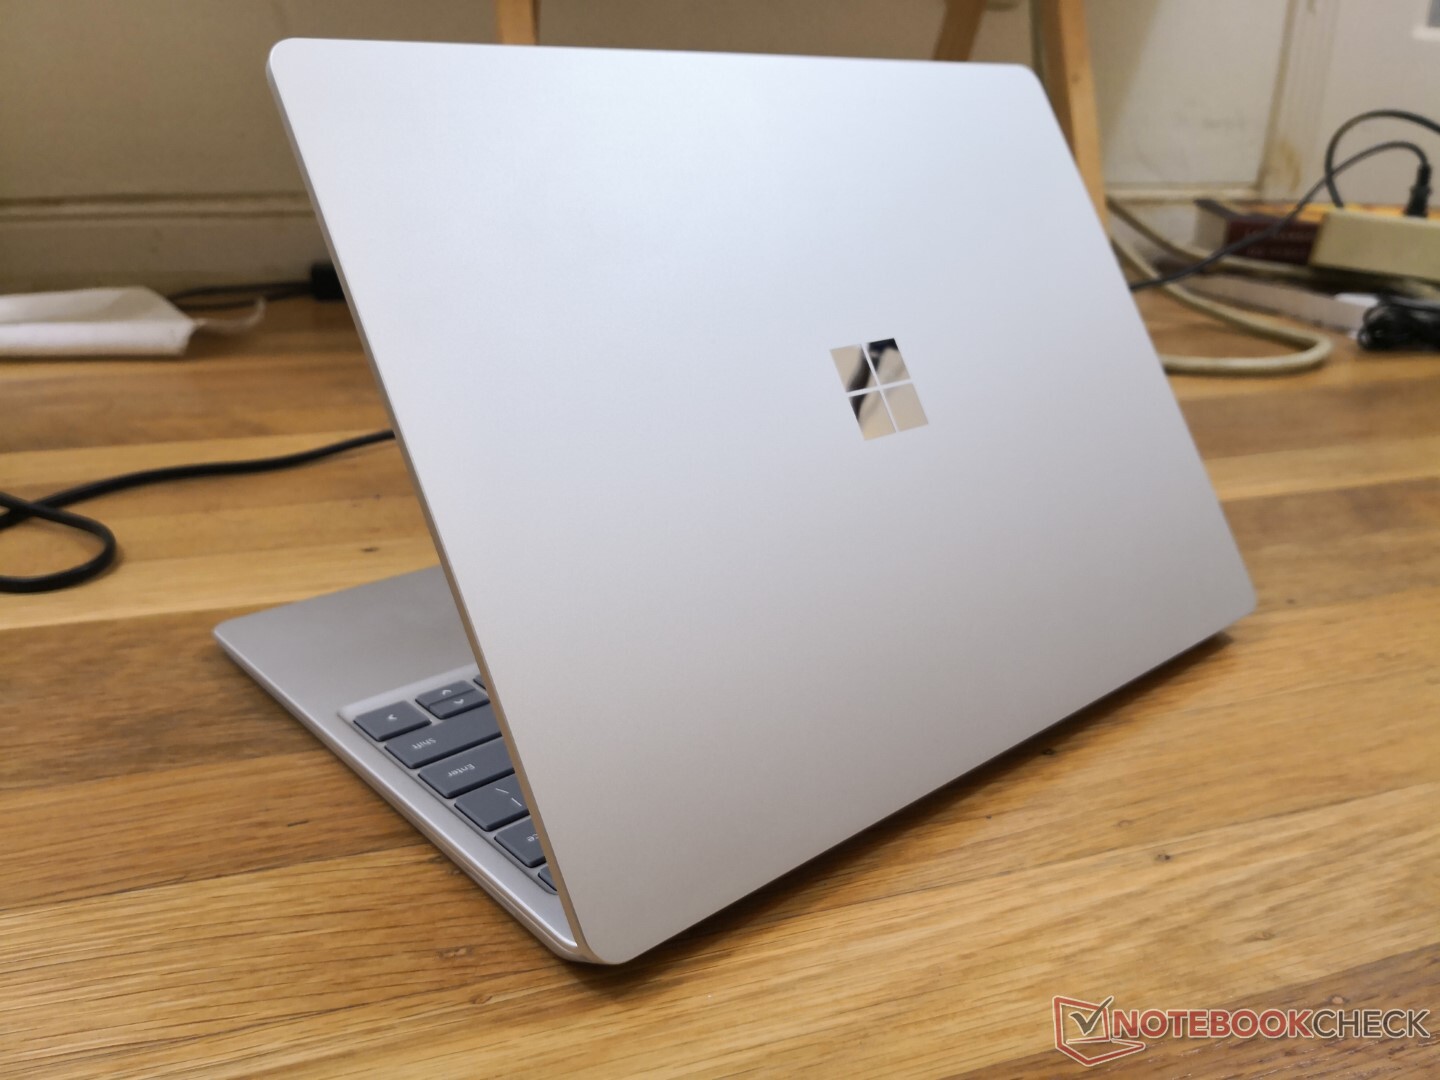
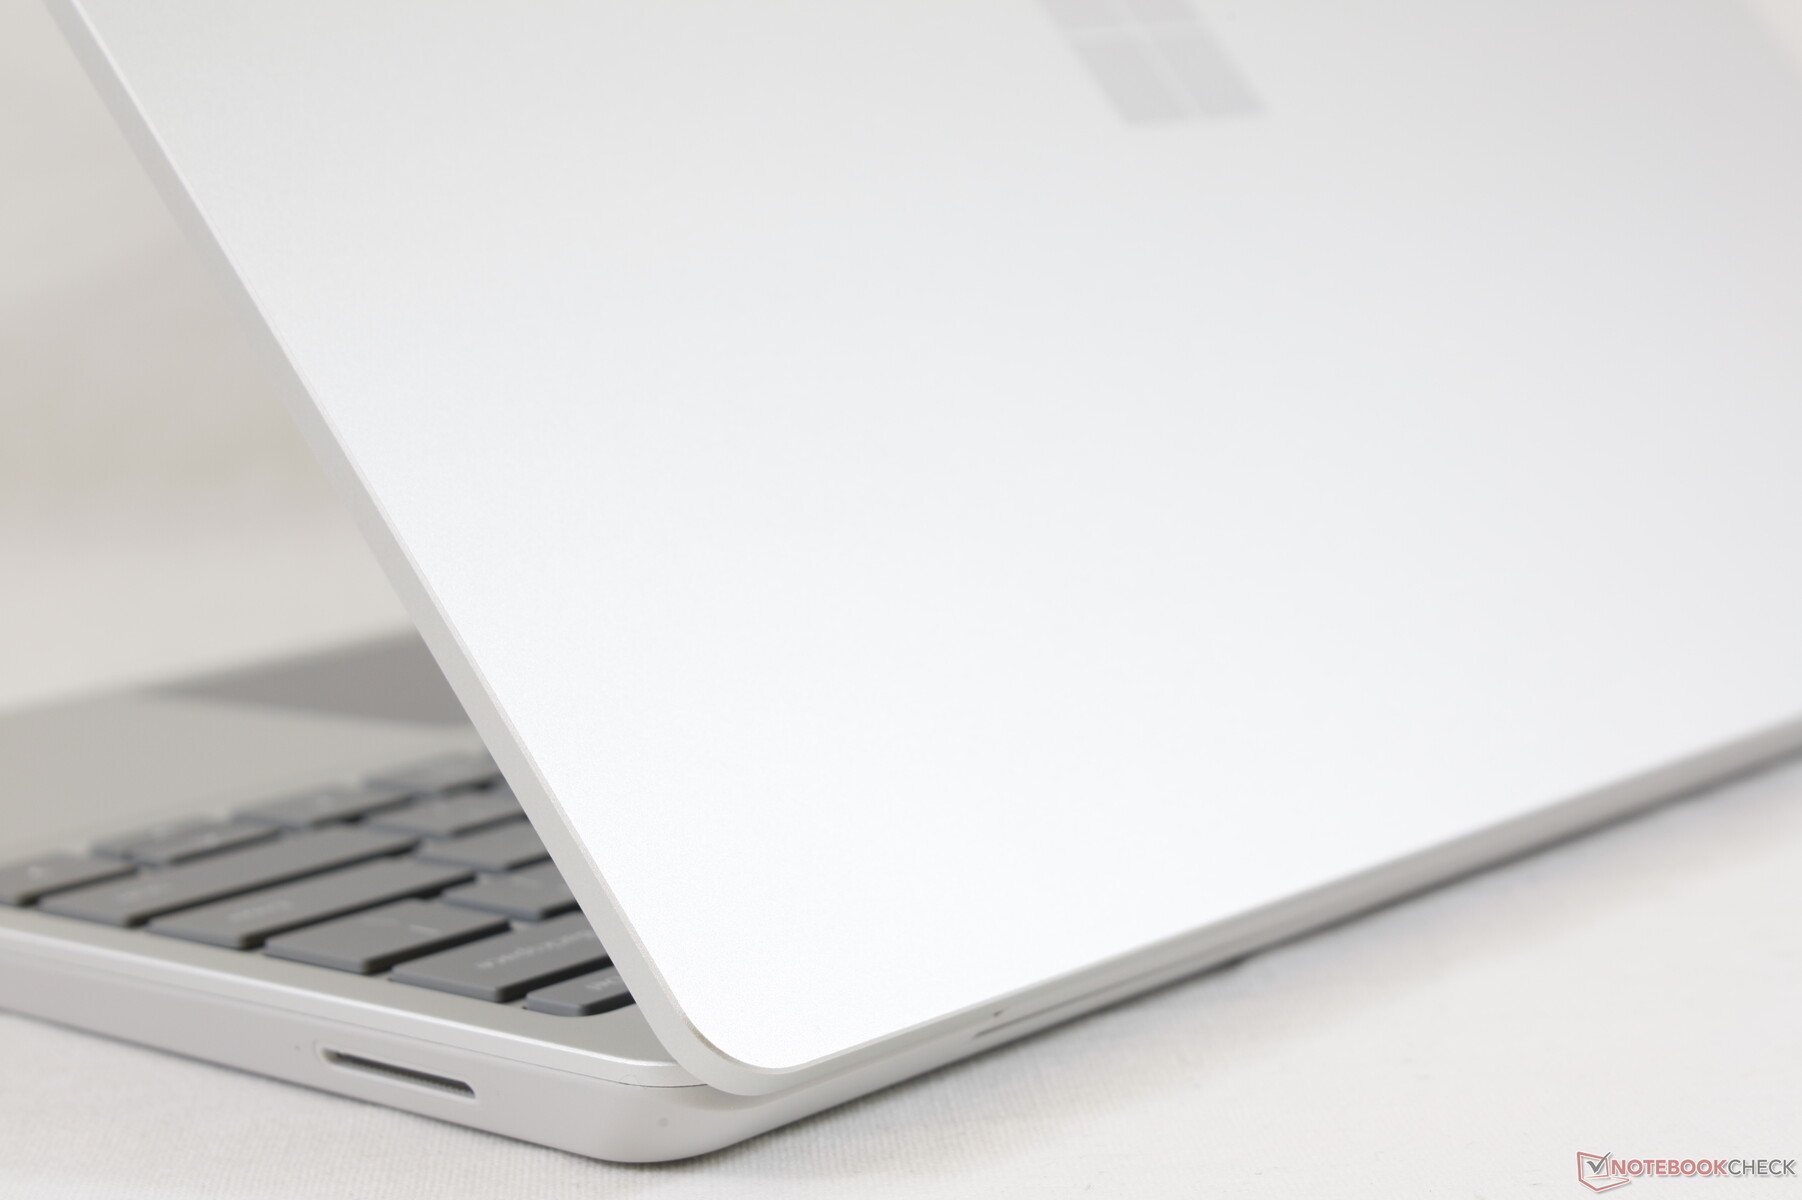
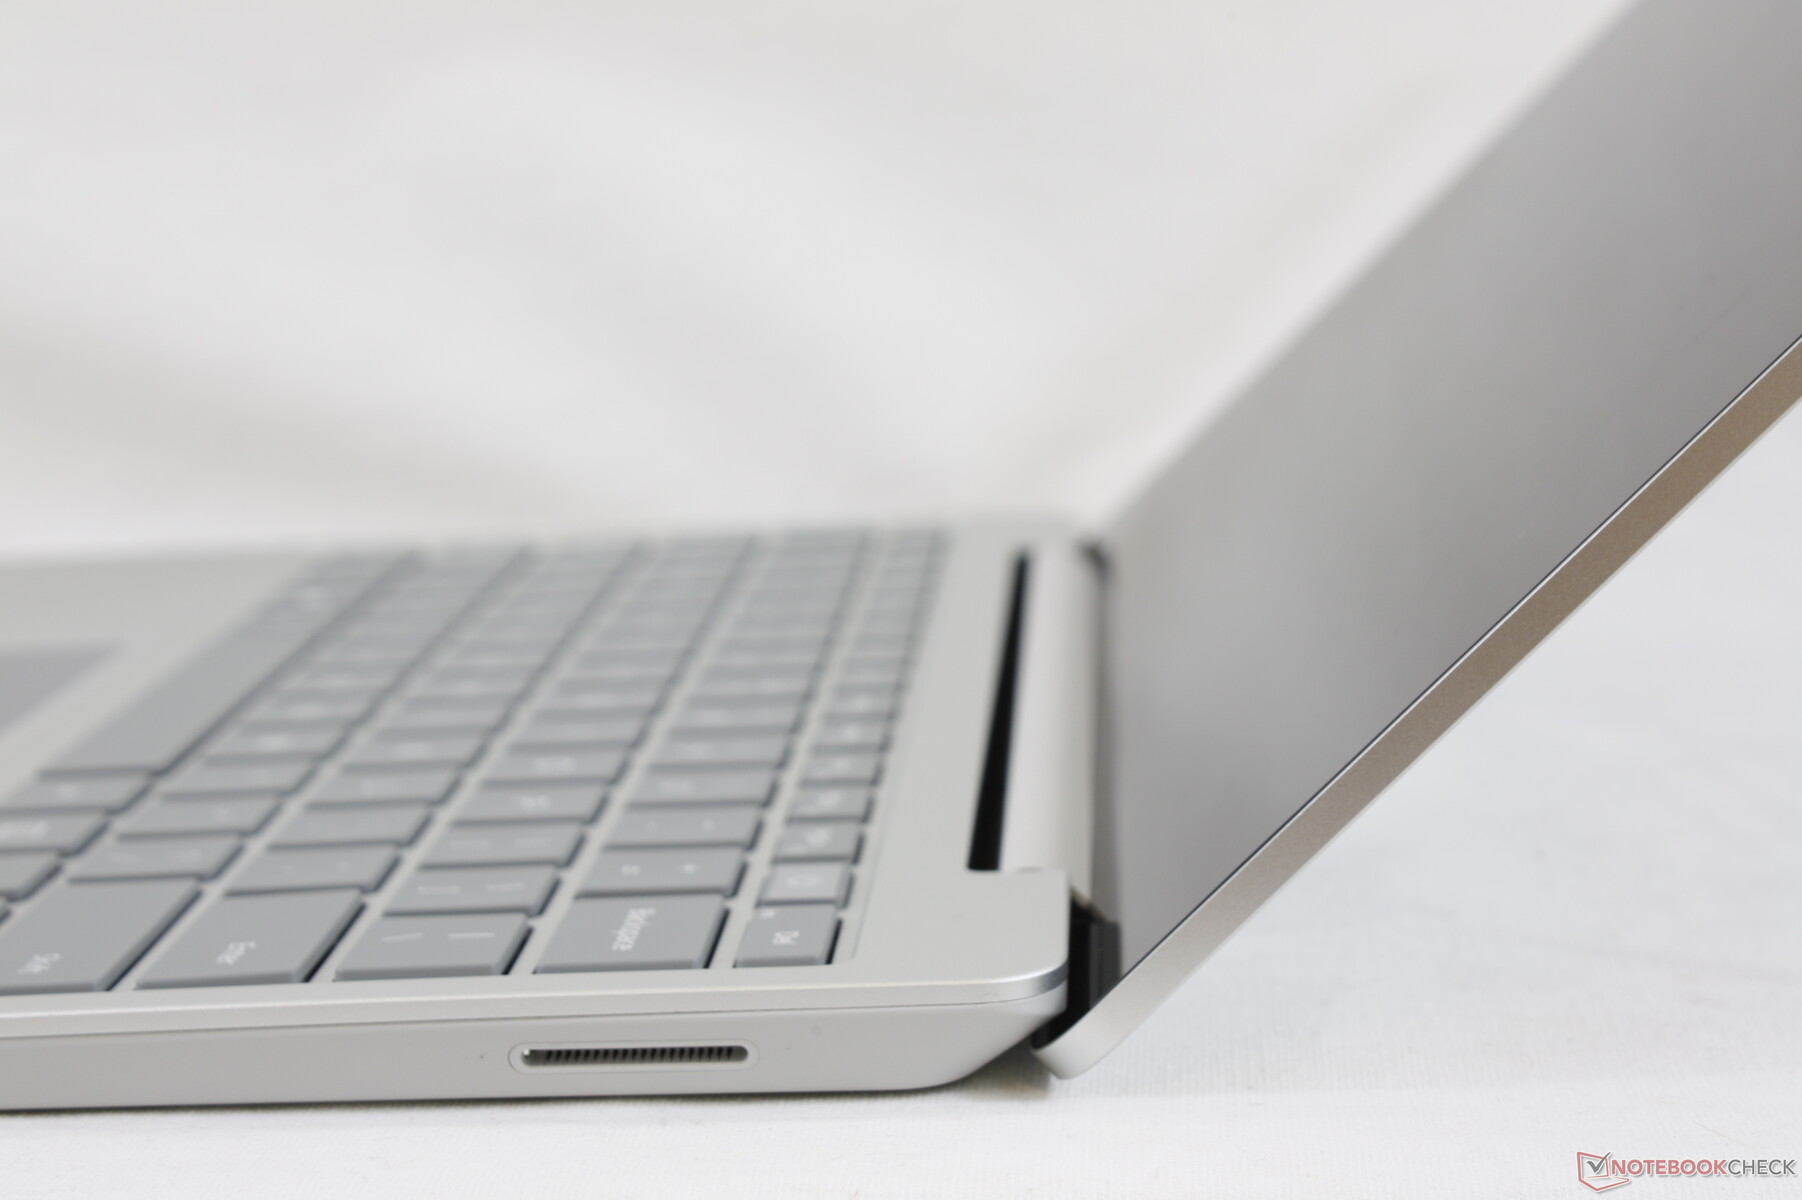
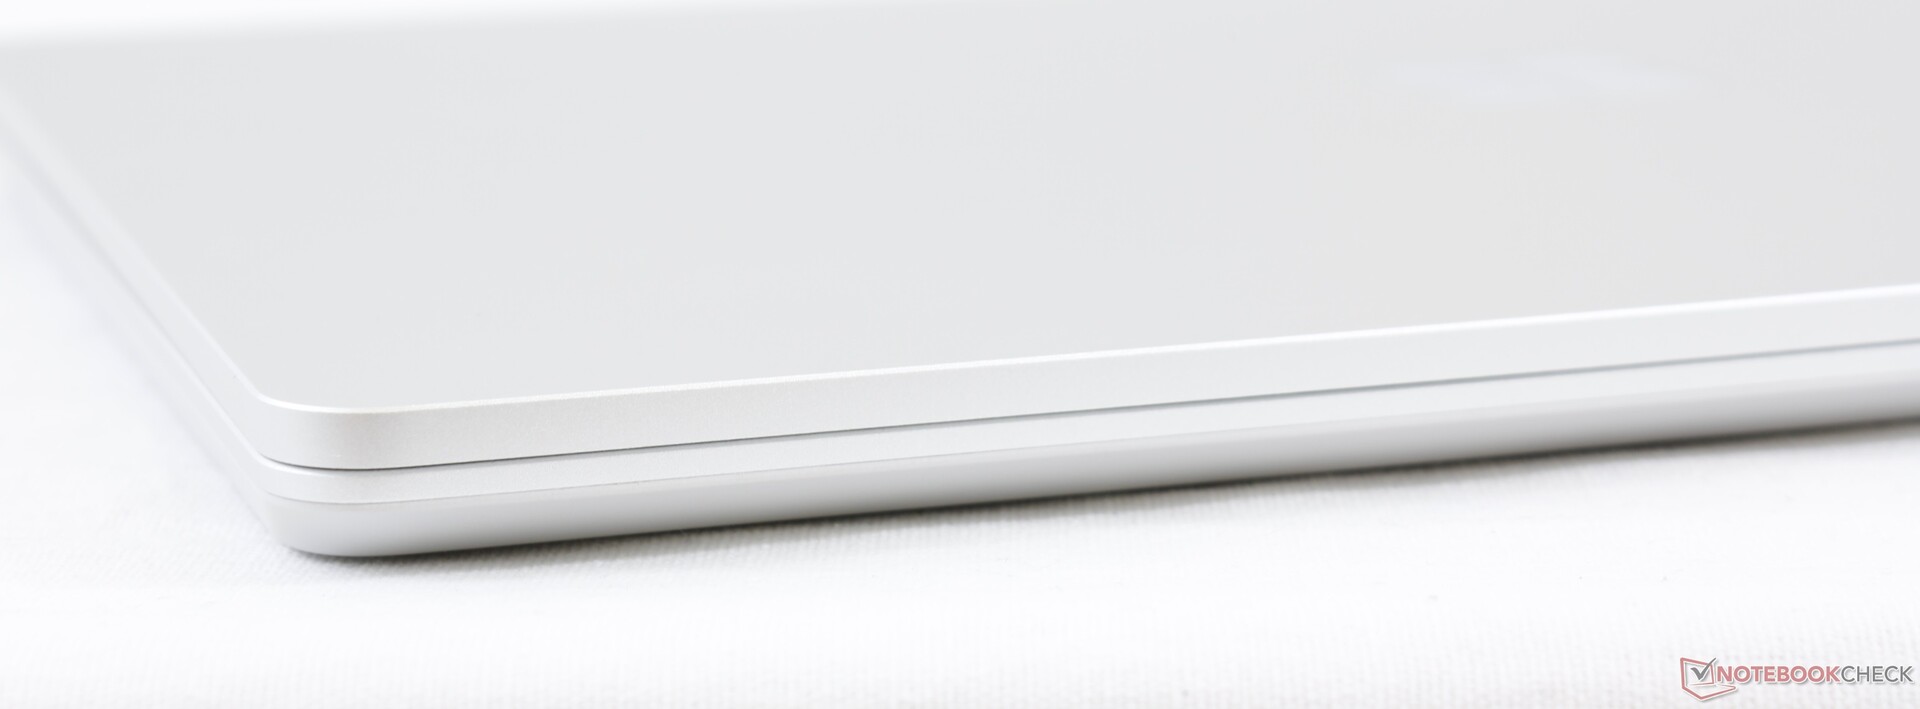
Microsoft's Surface Laptop design translates well to the new 12.4-inch form factor. The metal chassis feels just as good here as it does on the 13.5-inch and 15-inch models with no tangible compromises. Unfortunately, this also means that it suffers from the same drawbacks including an average hinge and a difficult-to-service bottom plate.
A major difference between the 12.4-inch model and its larger versions is the slightly rubberized base. Texture is a bit different as a result, but not any weaker or stronger in terms of flexing or warping. This is probably the most luxurious and high quality laptop you can get for under $600 USD.
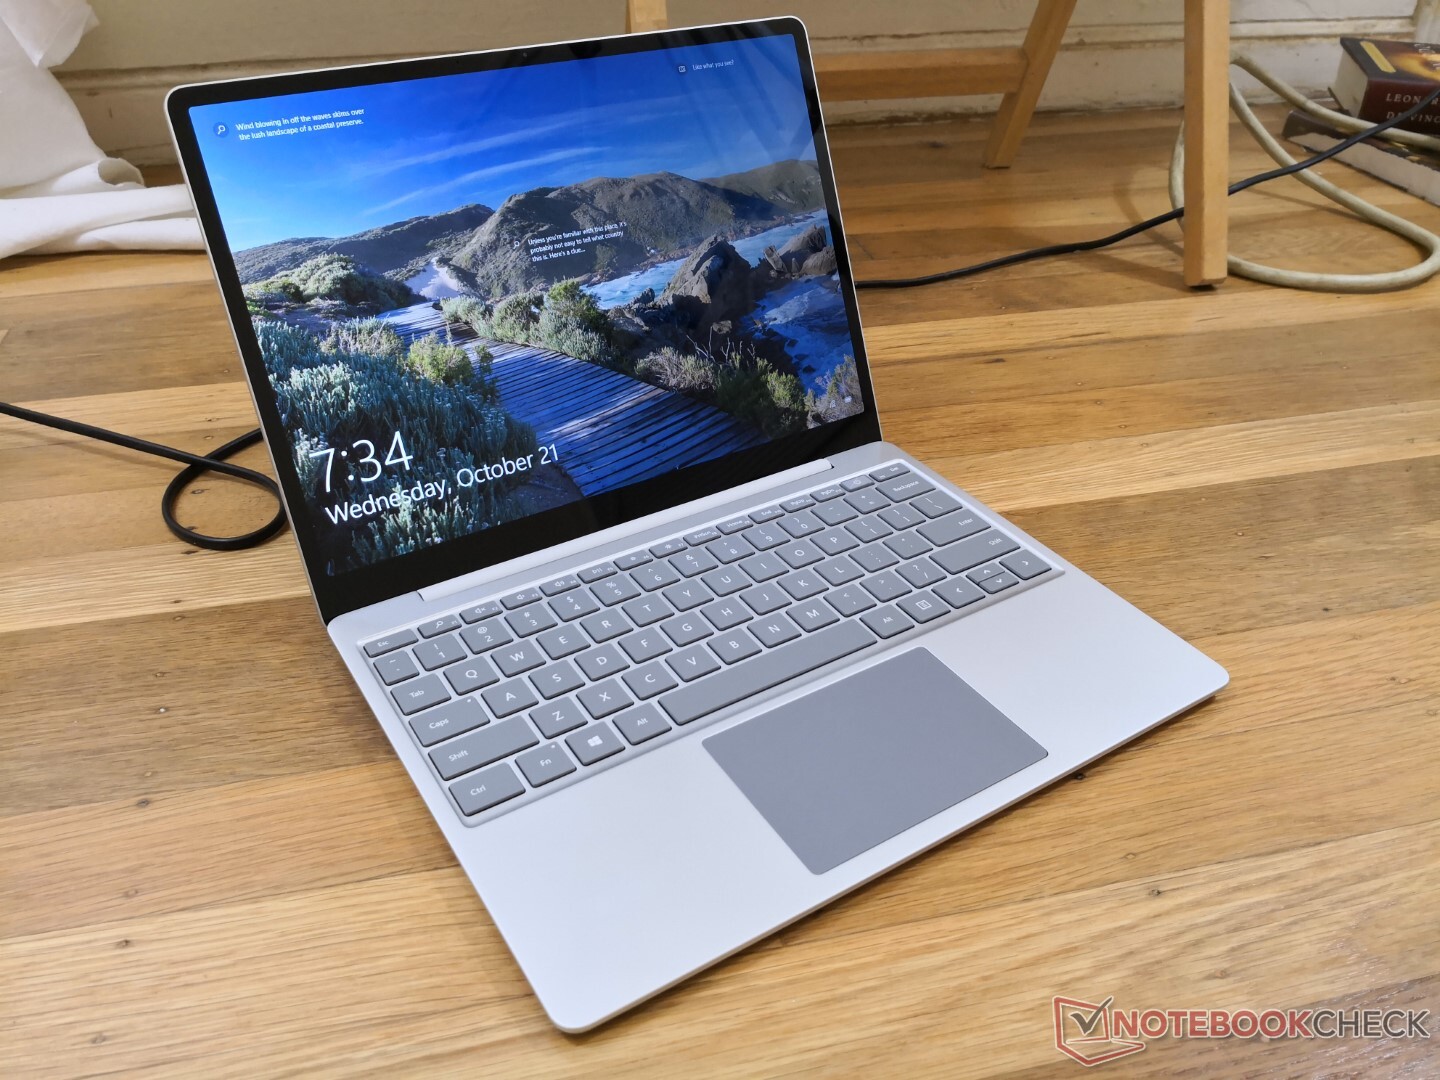
Size and weight are the most noticeable advantages of the Surface Laptop Go. We think the series could be even smaller in the future since its bezels are still a bit thicker than most other subnotebooks including the XPS 13 or Spectre 13.
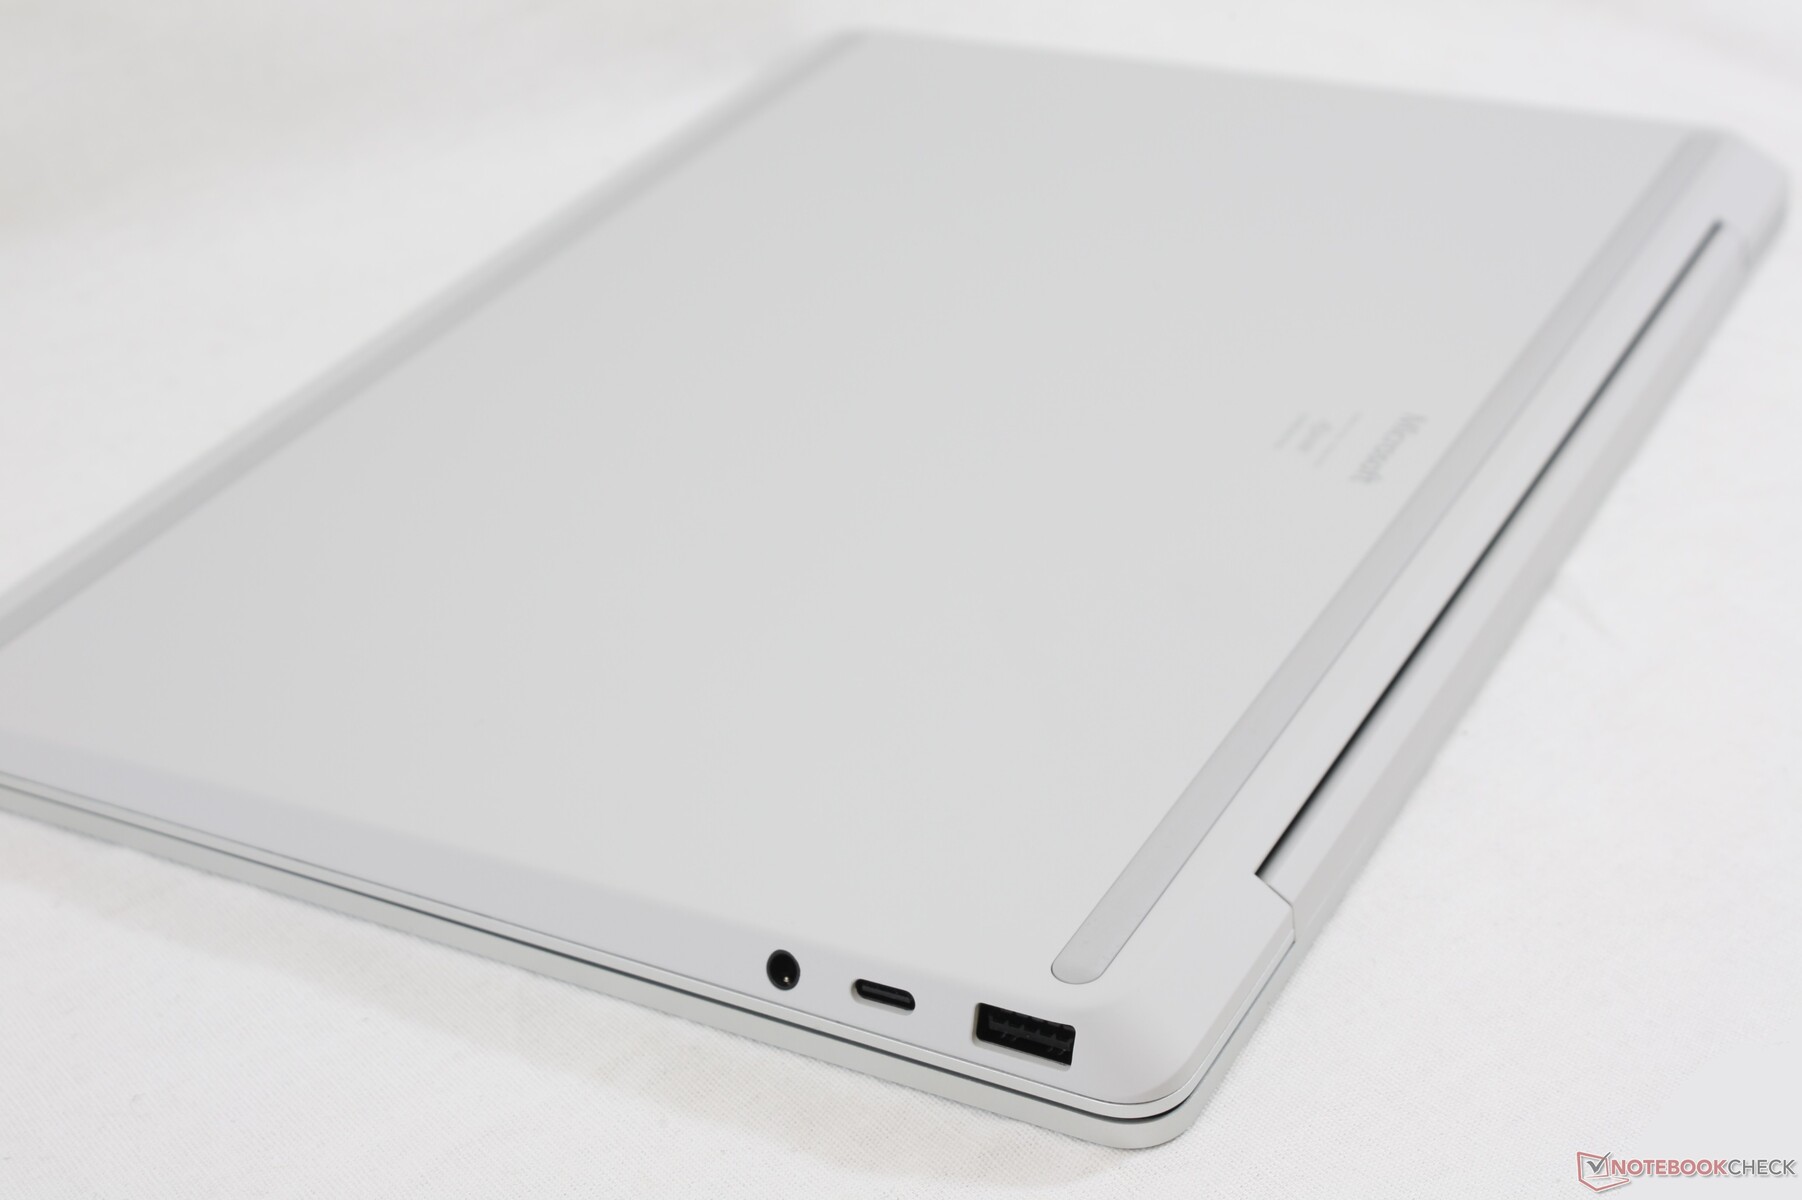
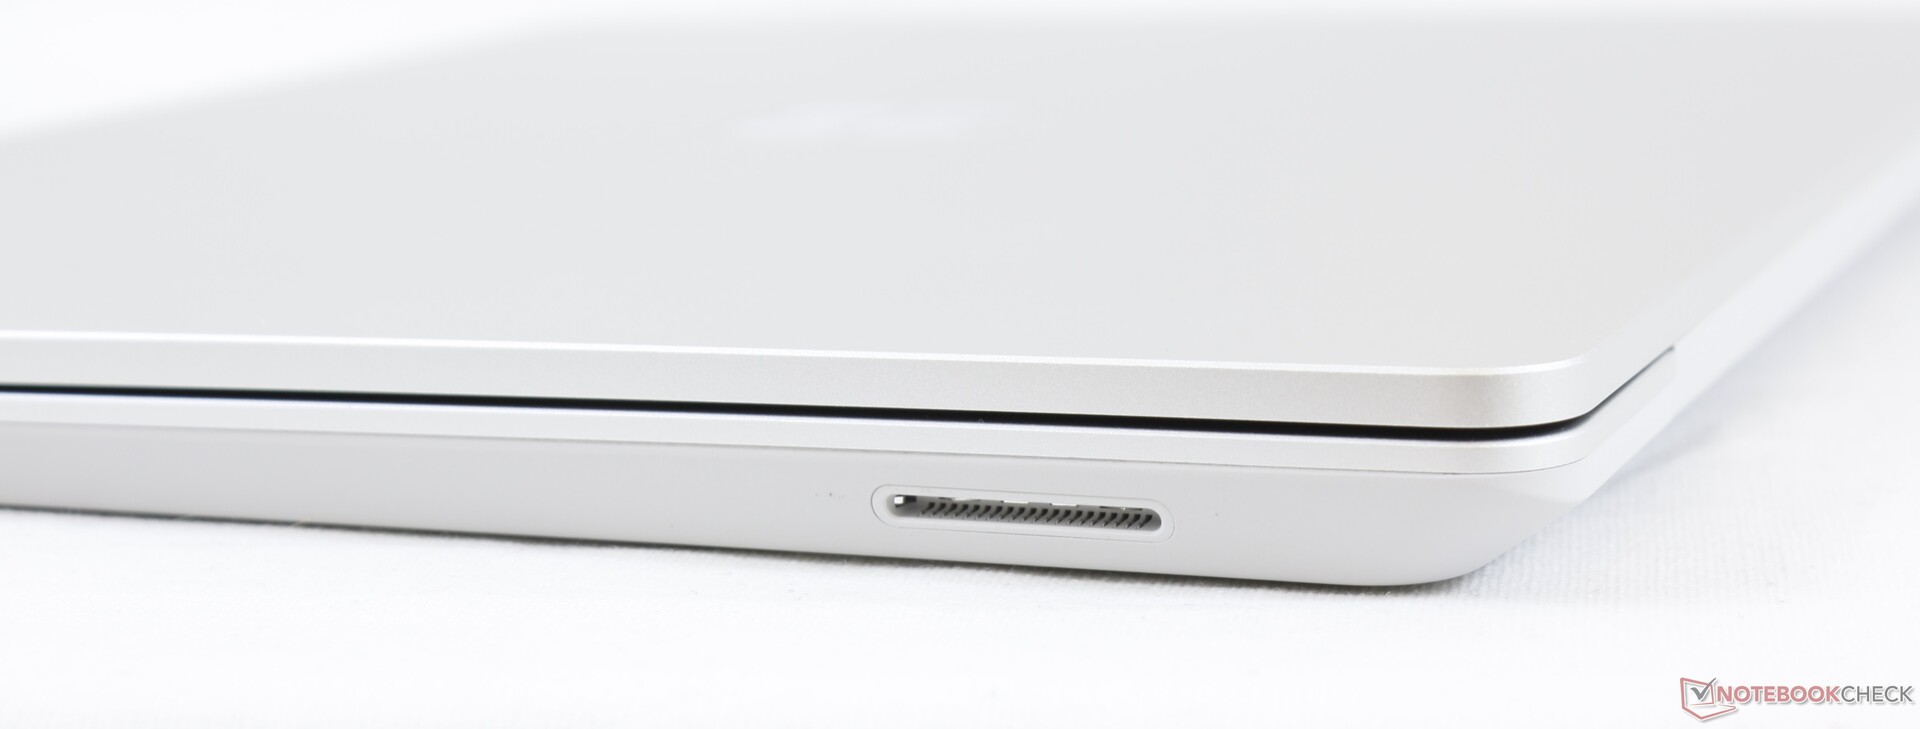
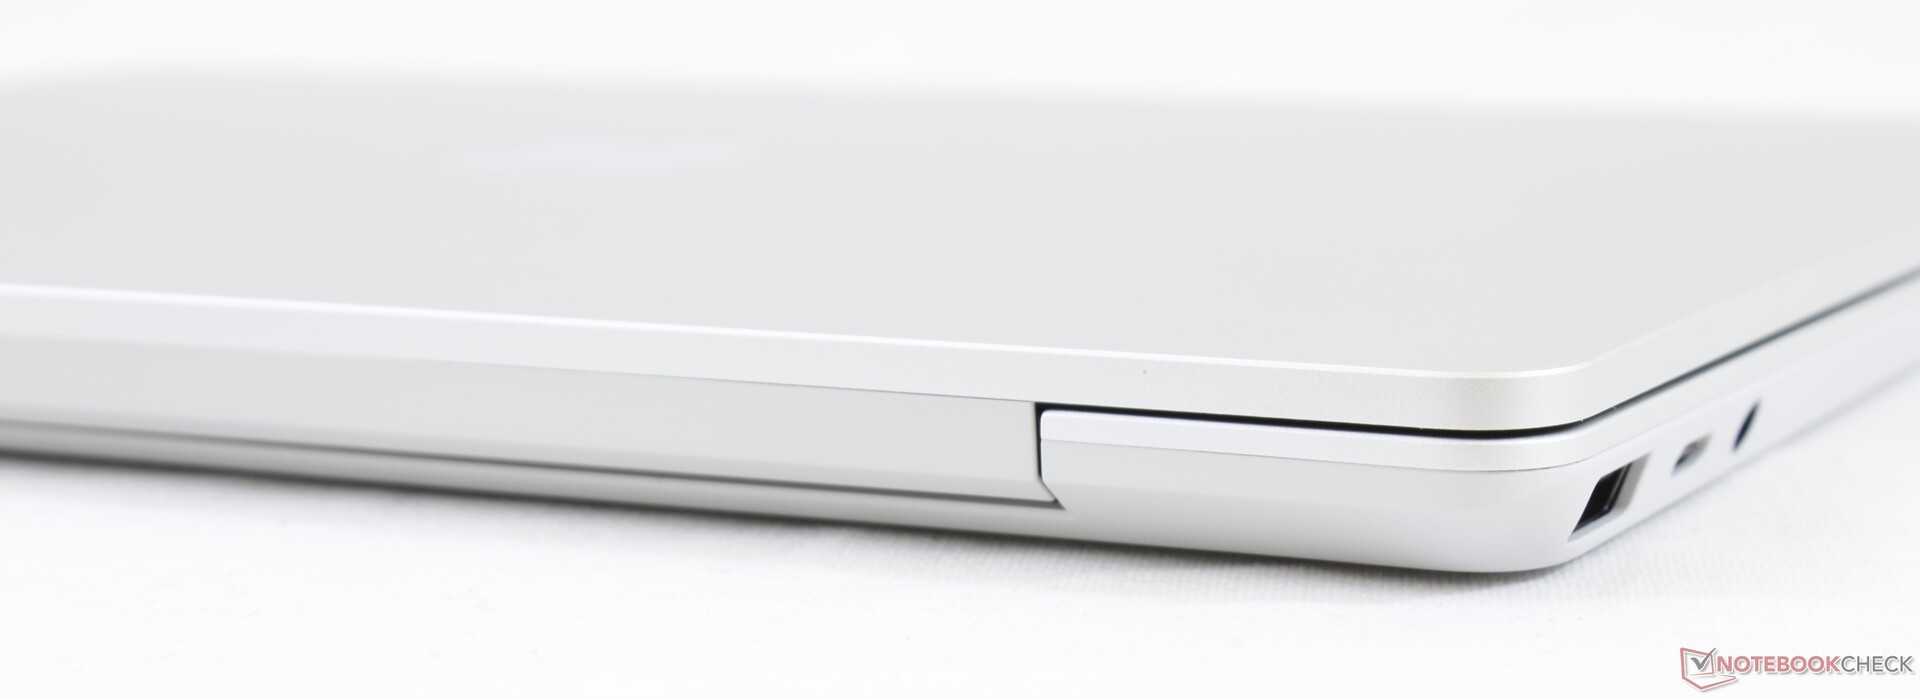
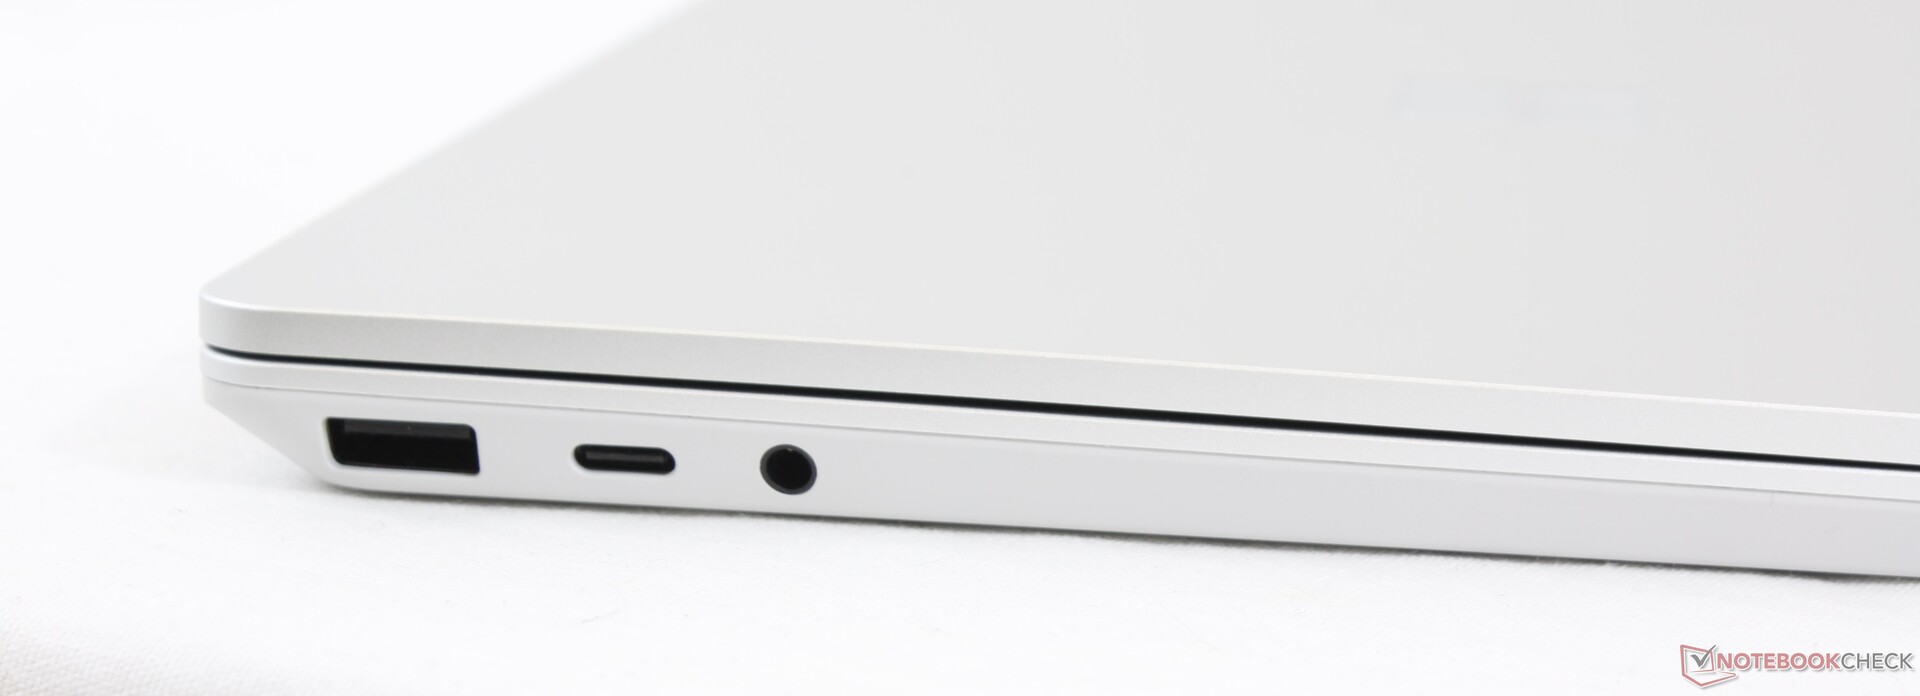
Connectivity
Port options are minimal once again. Thankfully, DisplayPort-over-USB-C is supported to make up for the lack of HDMI.
Communication
The Intel AX201 comes standard for Wi-Fi 6 and Bluetooth 5.1 connecitivty. Our unit would randomly disconnect from our Netgear RAX200 router at times, but a system restart appeared to have solved the issue.
Webcam

, i5-1035G1, SK hynix BC501 HFM256GDGTNG")
, i5-1035G1, SK hynix BC501 HFM256GDGTNG")
Maintenance
Annoyingly, the screws securing the bottom panel are under the glued rubber feet. If you want to do something as simple as a storage upgrade, you'll be at a higher risk of damaging the system or voiding returns compared to more easily serviceable subnotebooks like the XPS 13 or ZenBook S.
Accessories and Warranty
There are no extras in the box other than the Surface Connect AC adapter and paperwork. The usual one-year limited warranty applies.
Input Devices
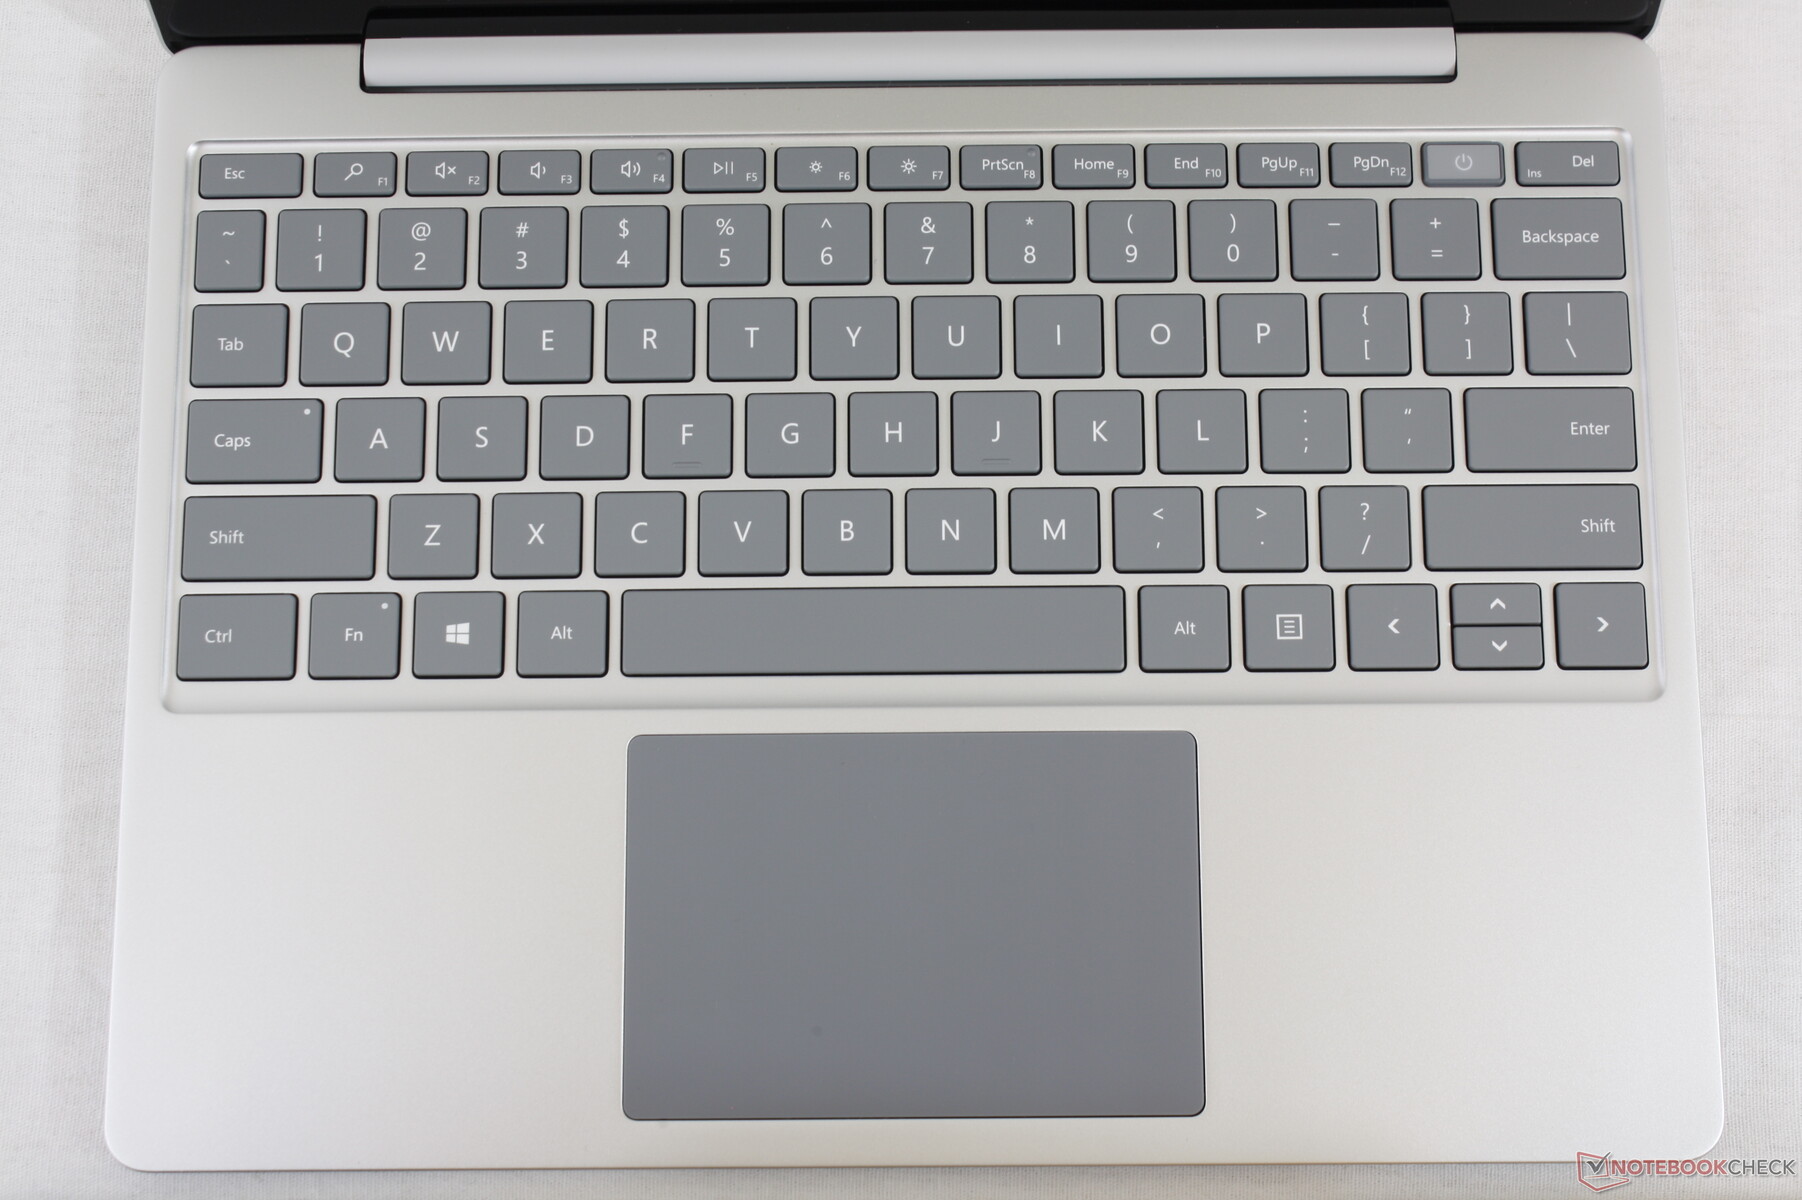
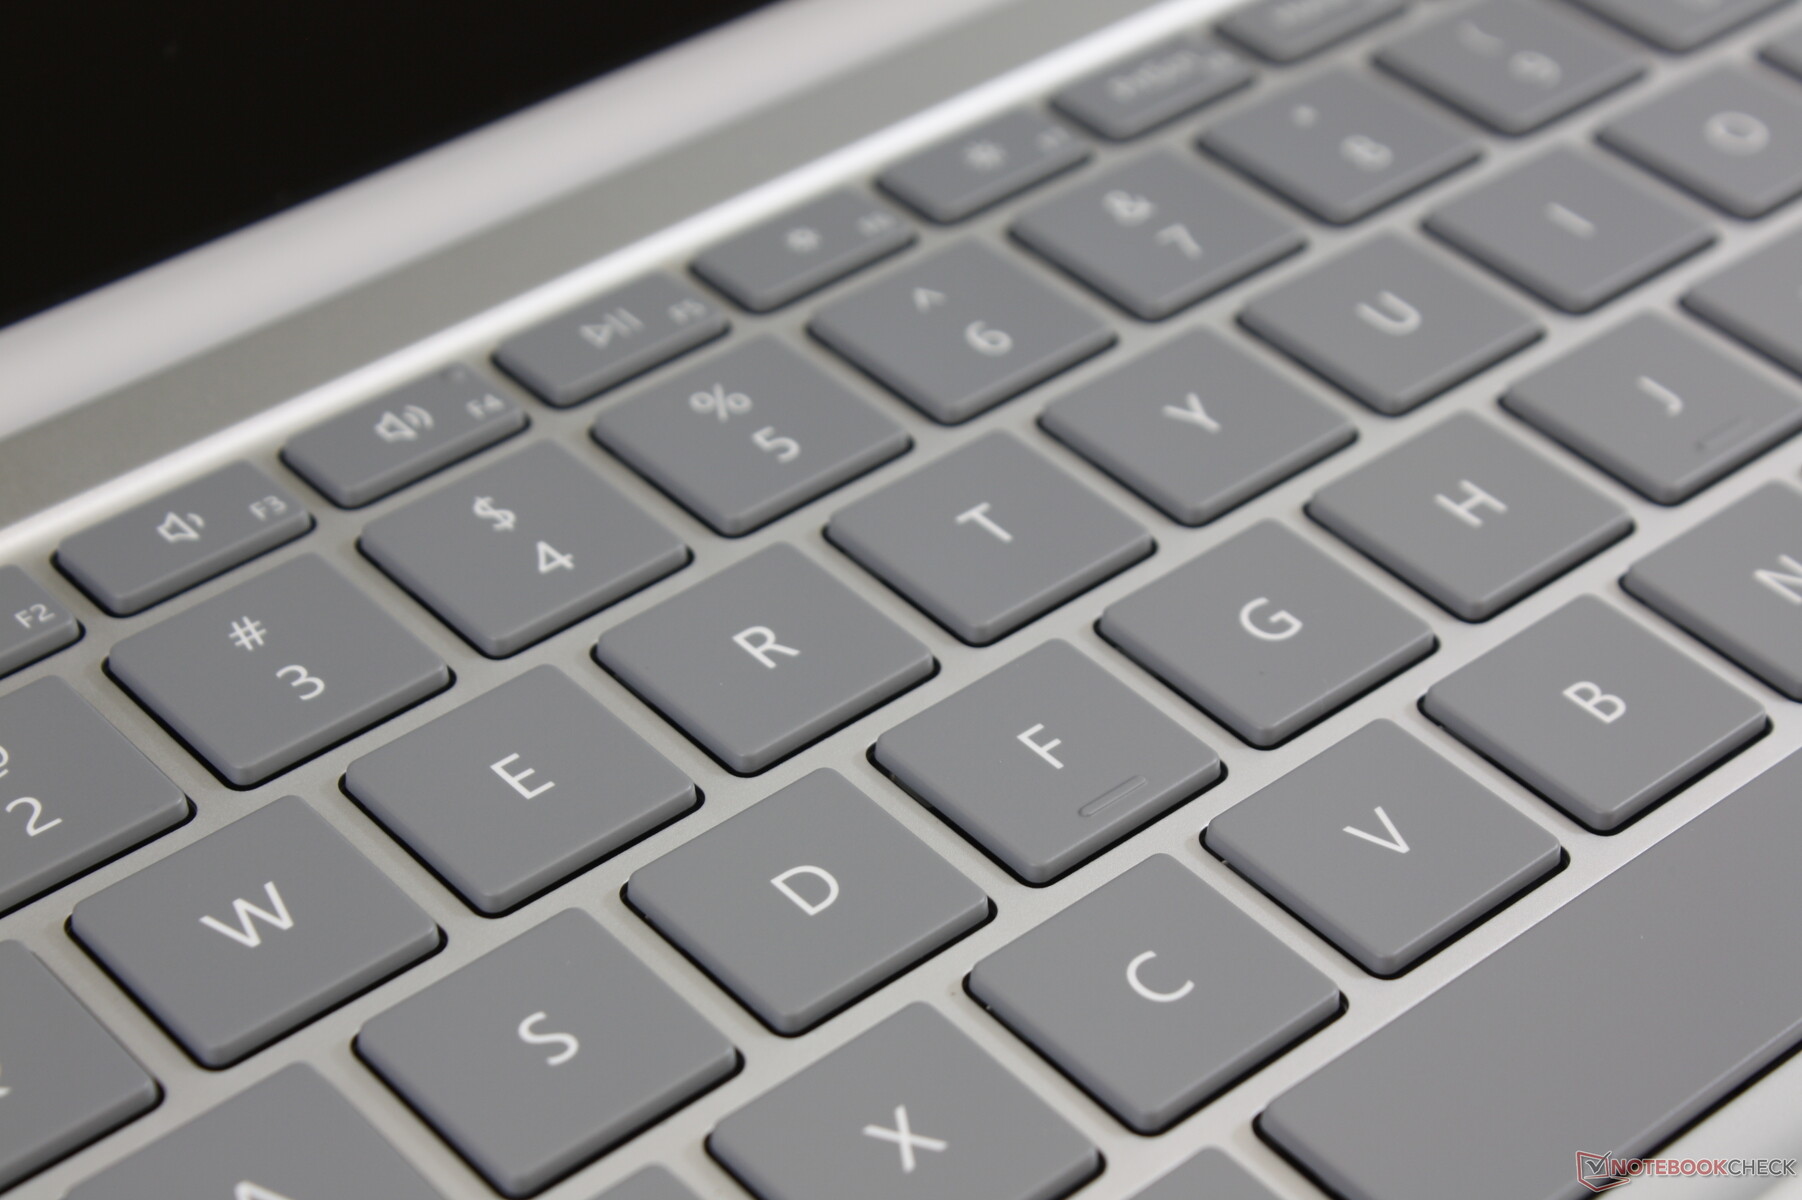
Keyboard
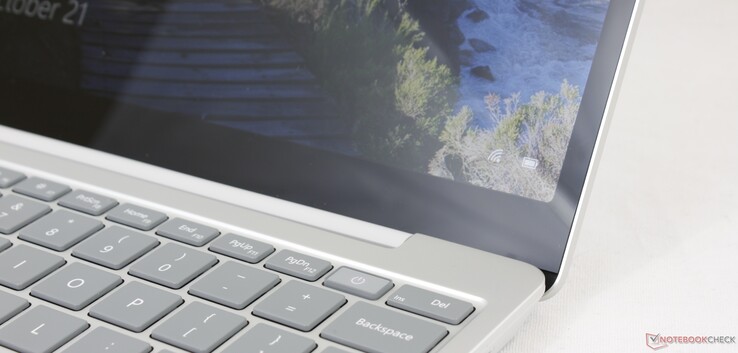
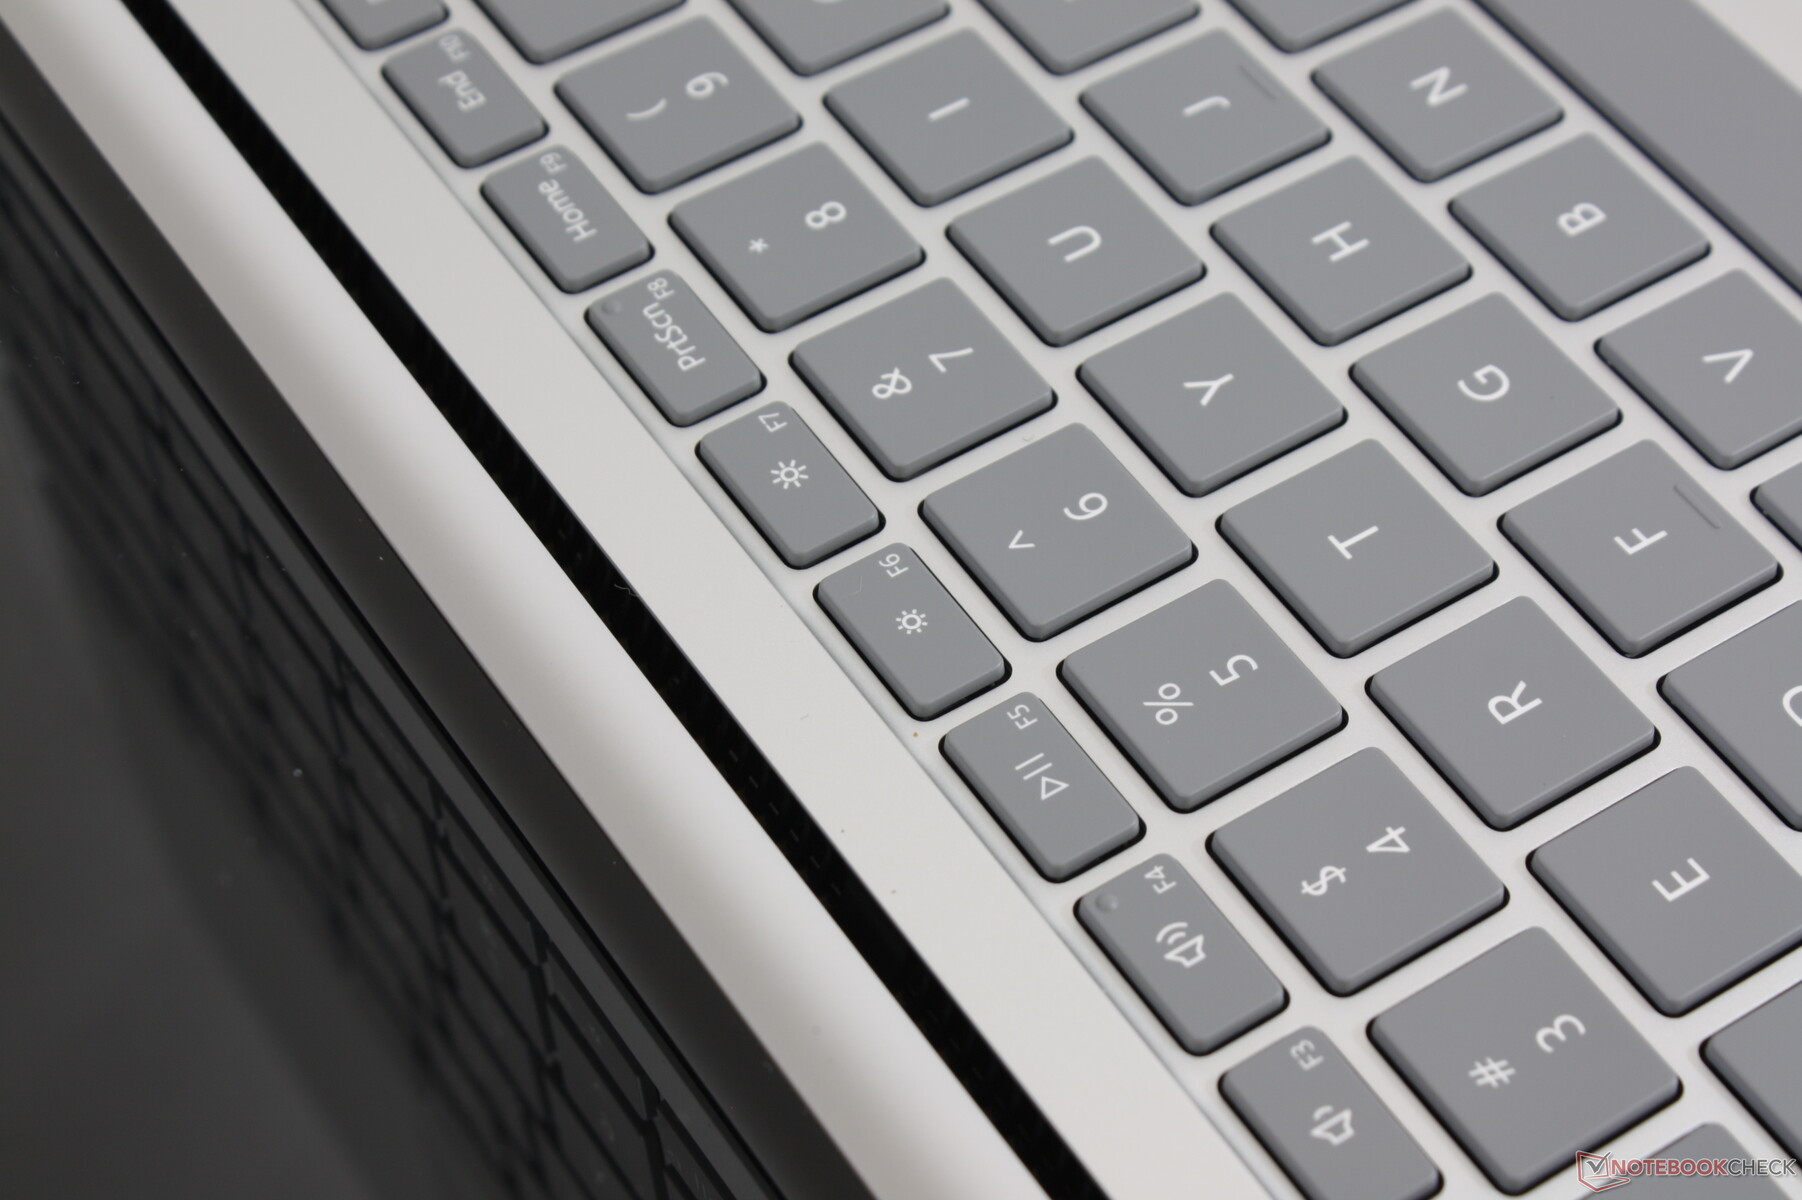
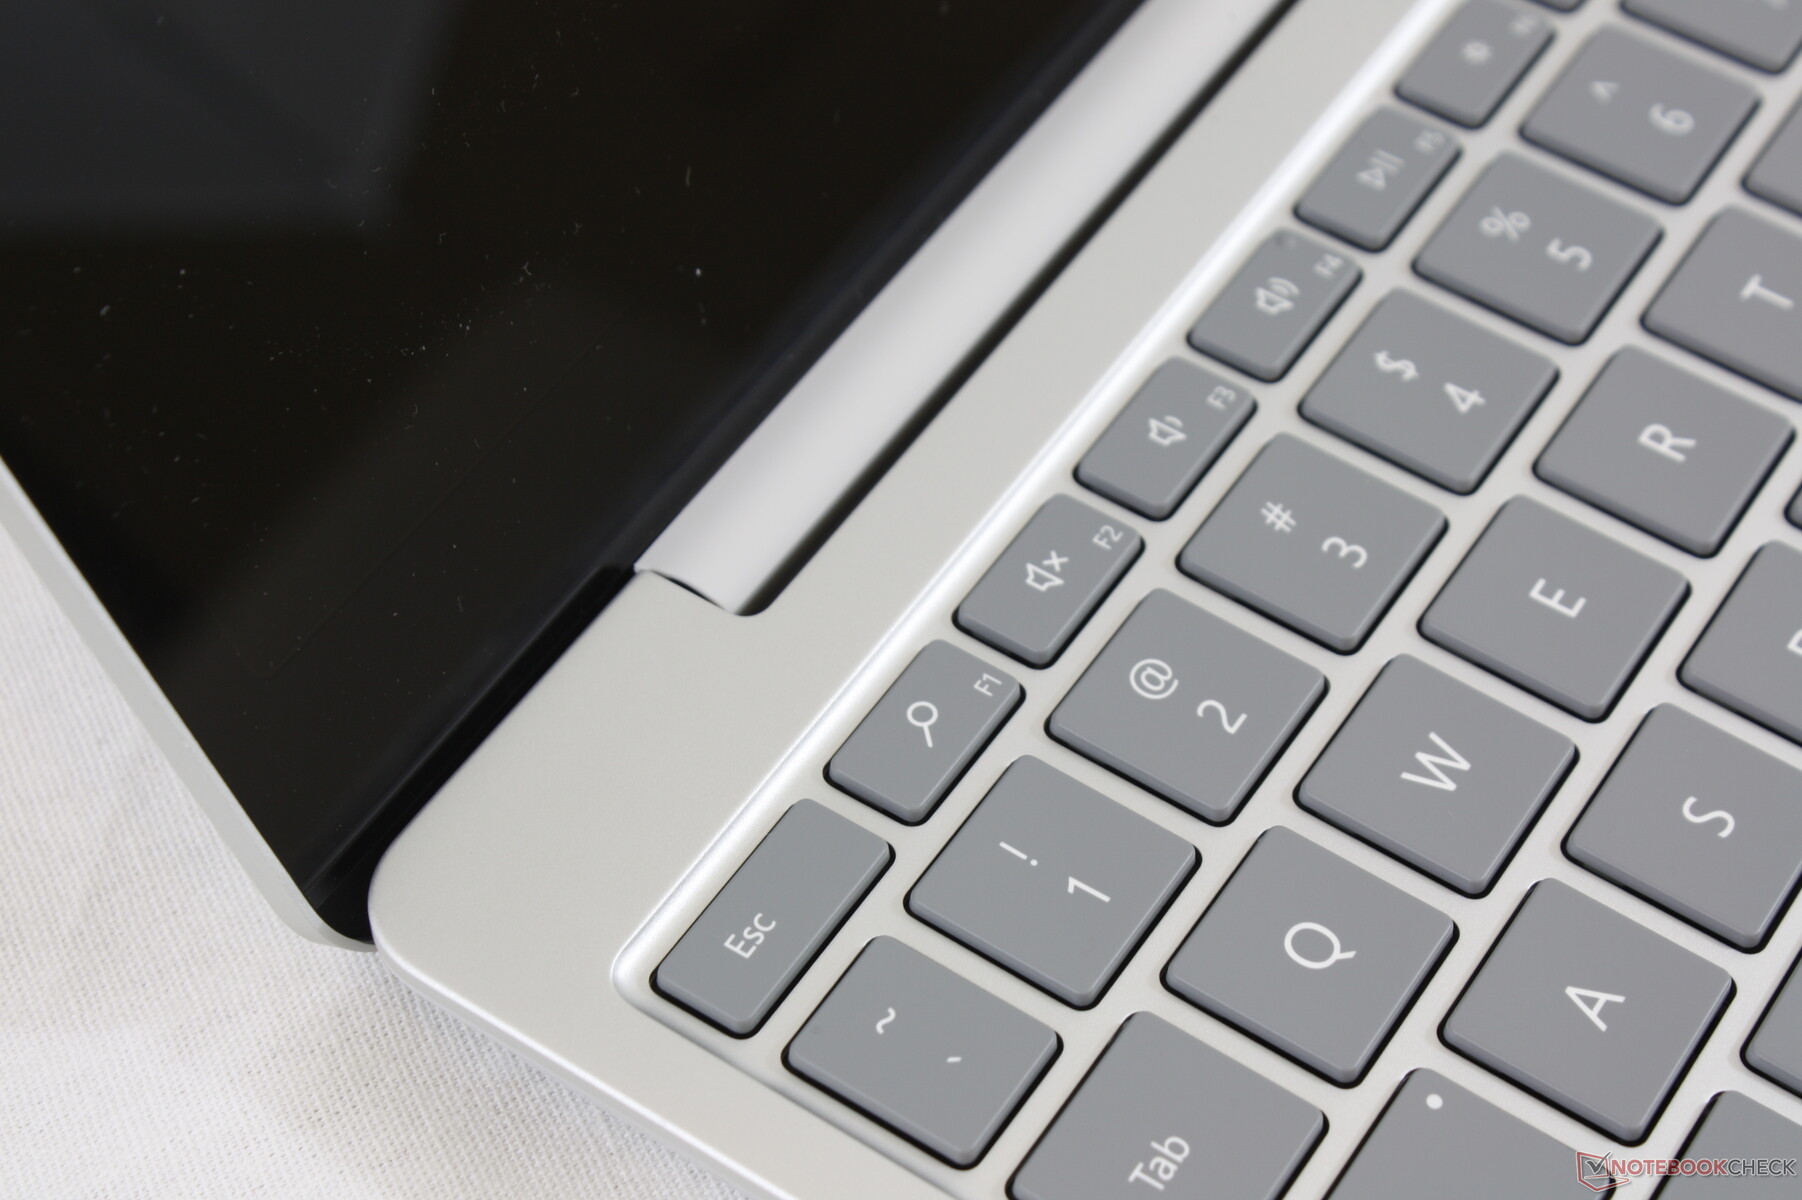
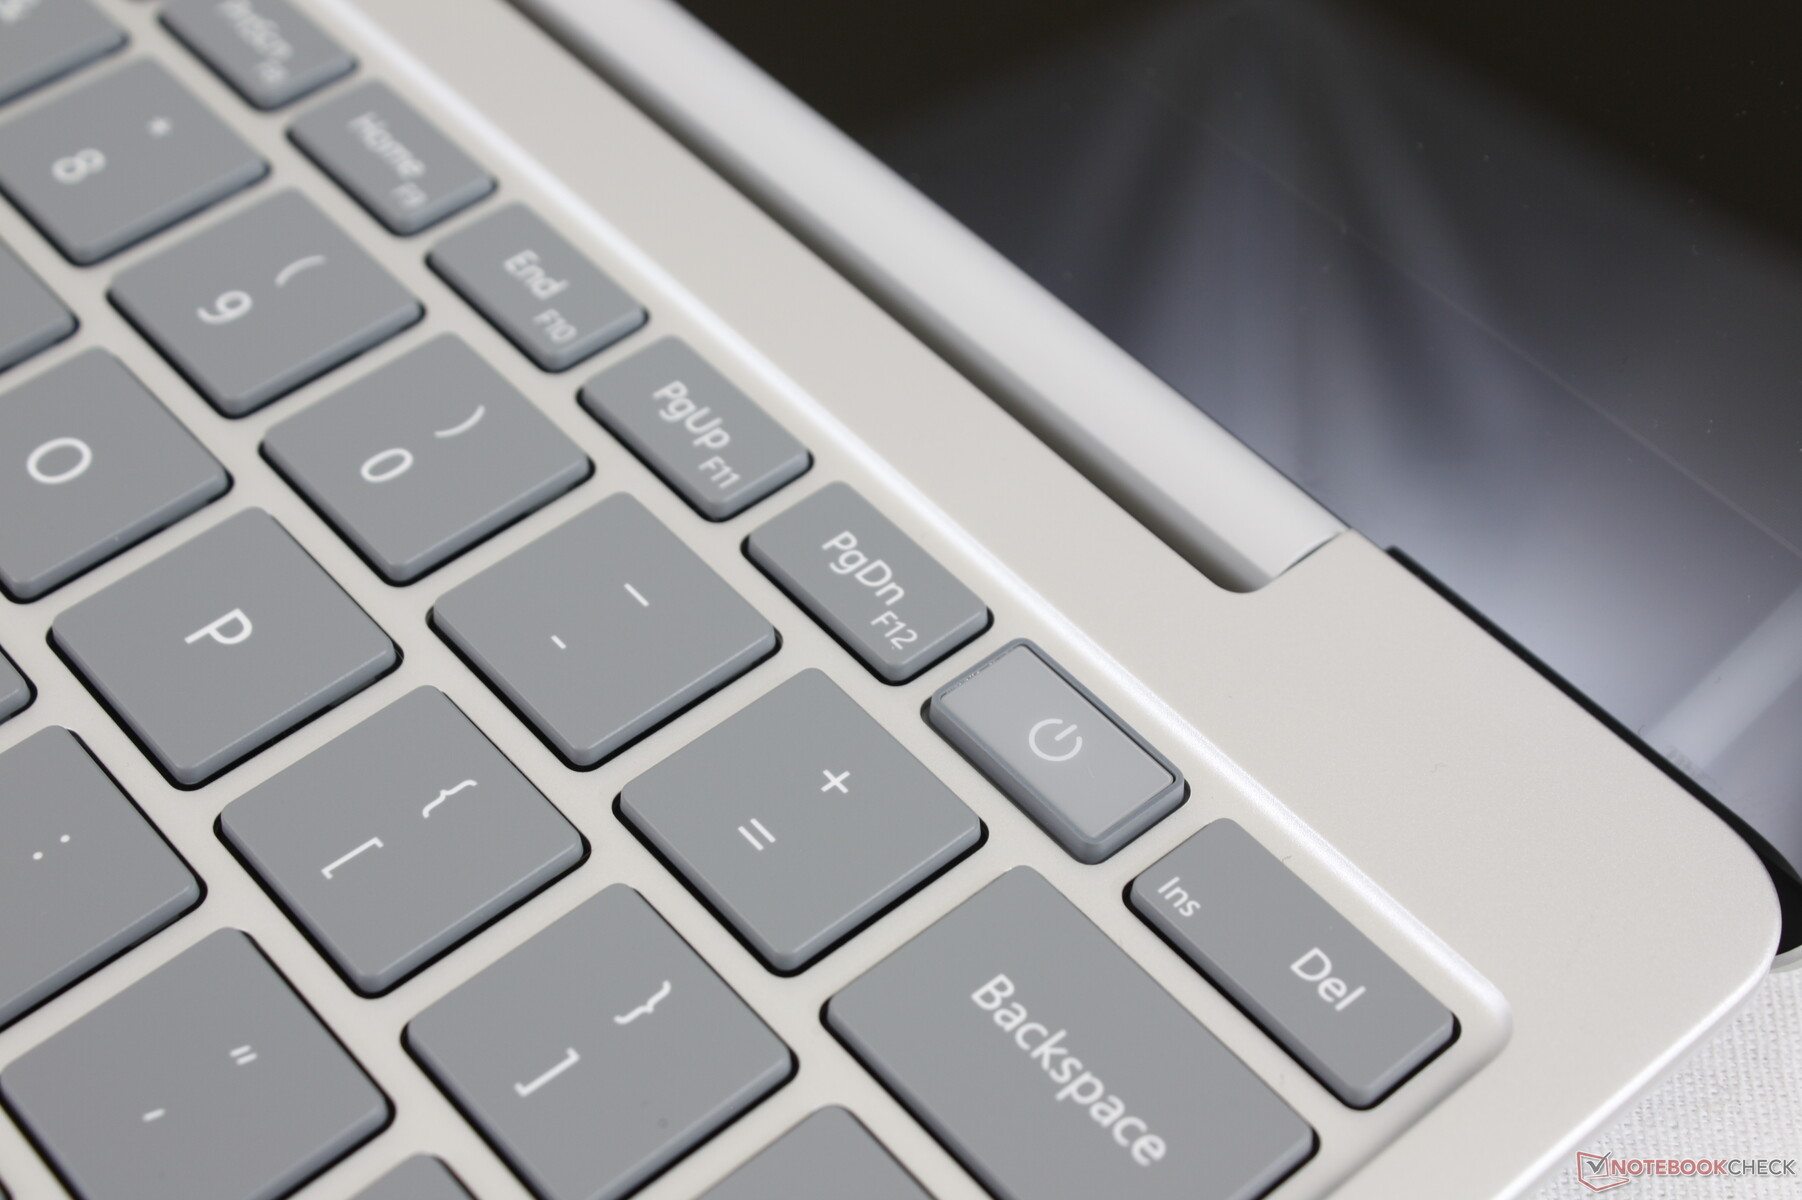
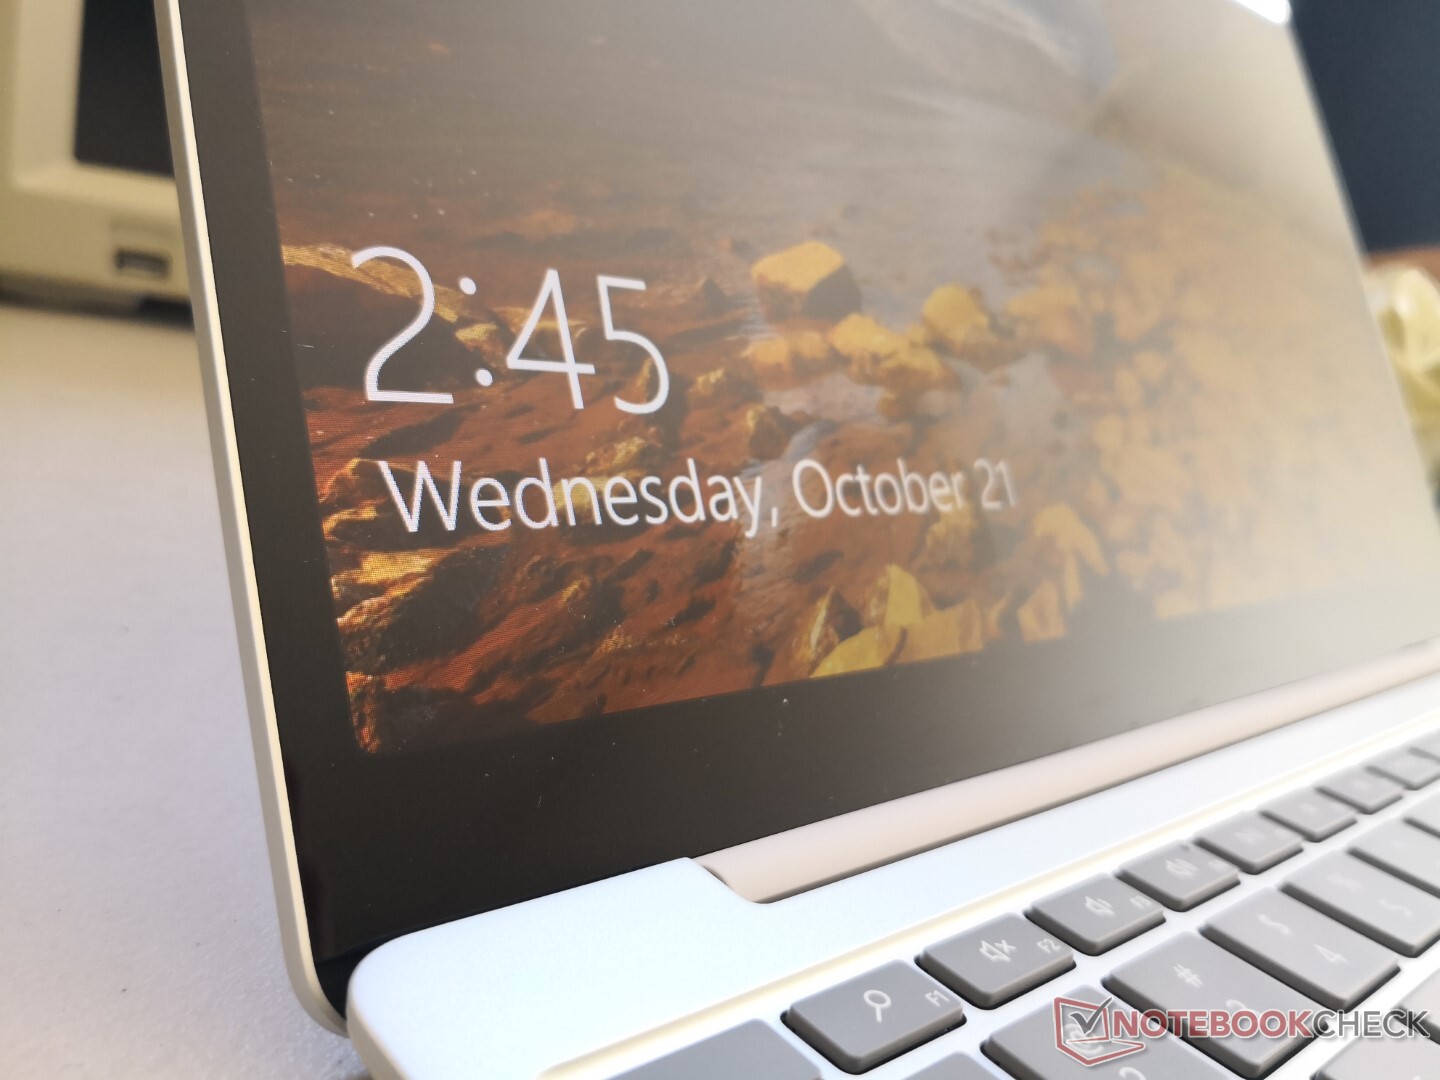
Key feedback feels the same as on the Surface Laptop 3 15 even though some of the keys along the sides are now shorter in order to accommodate the smaller form factor. The system integrates a power button-fingerprint reader but at the cost of a keyboard backlight. The F1 key, for example, is now a search button whereas this same key would have activated the backlight on the Surface Laptop 3 series.
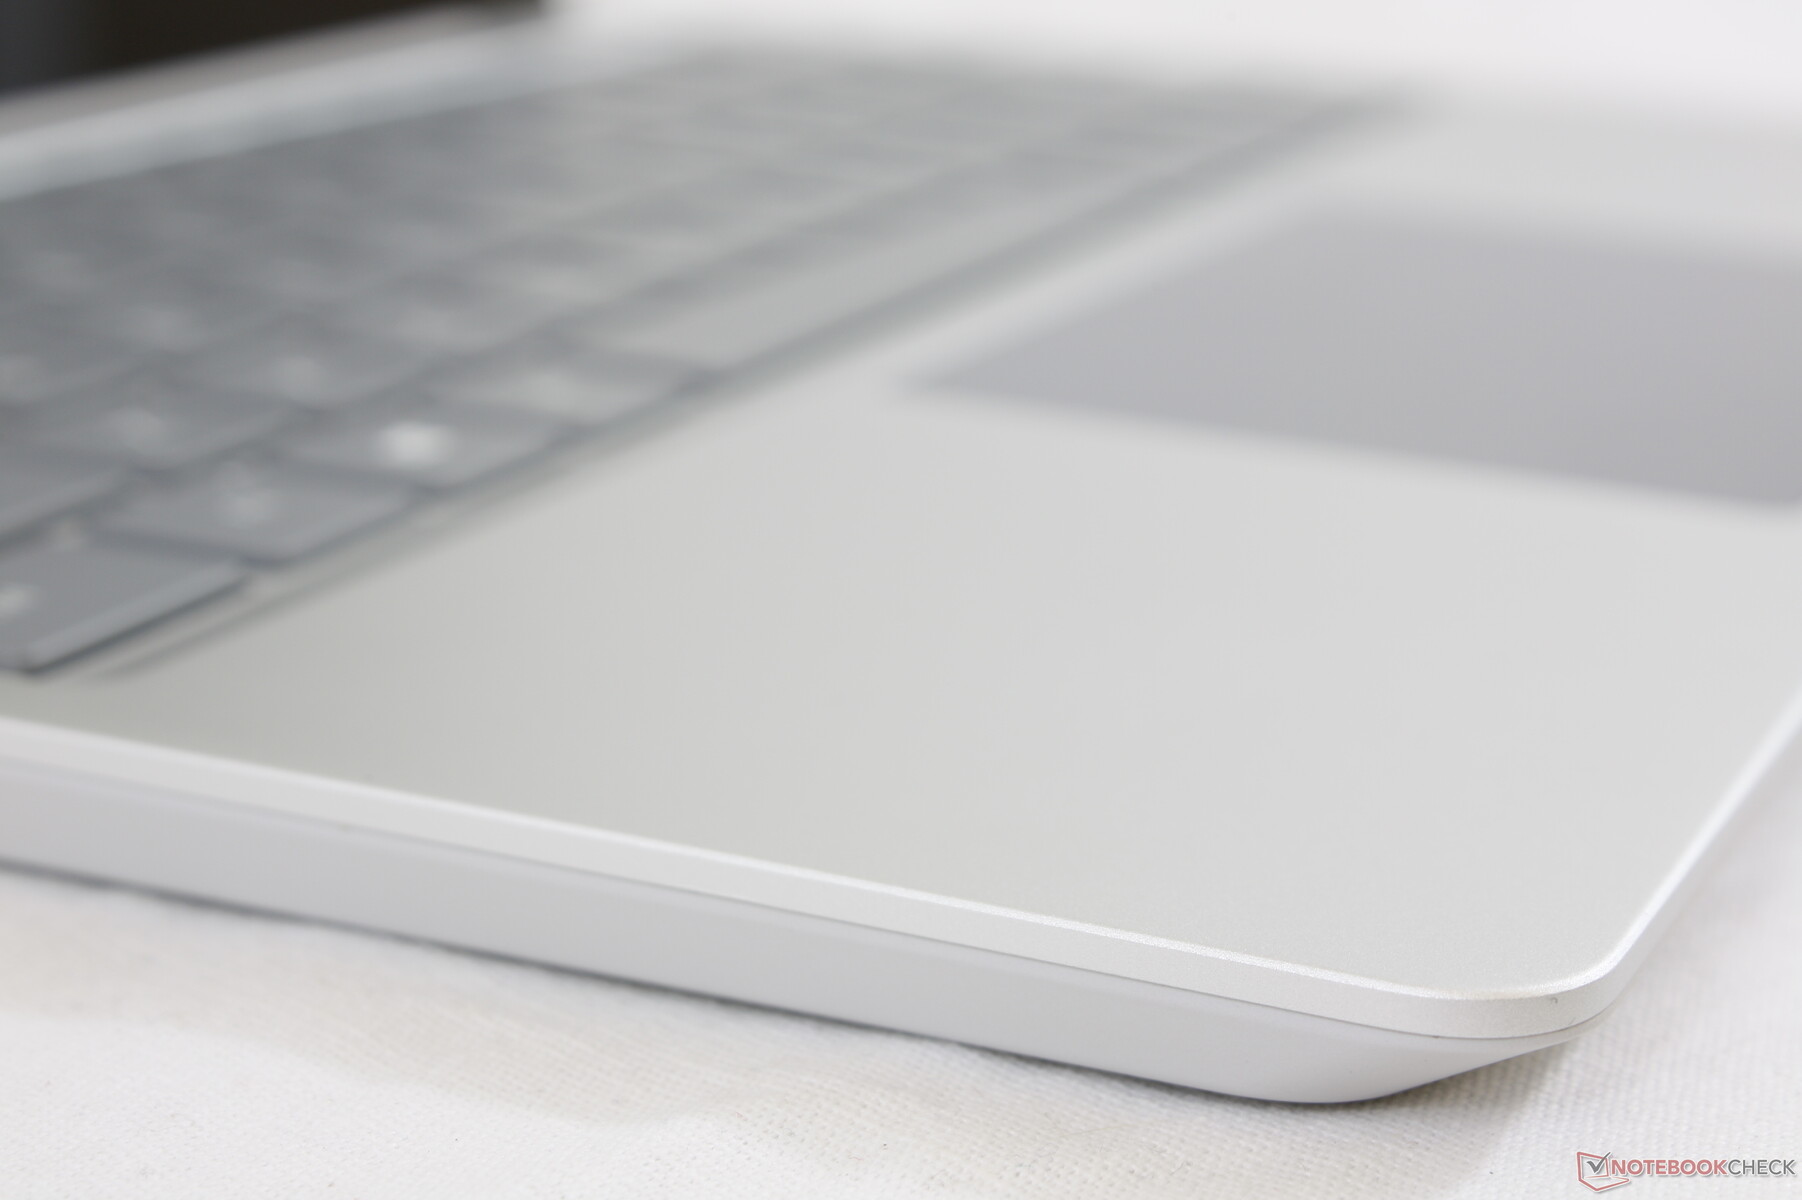
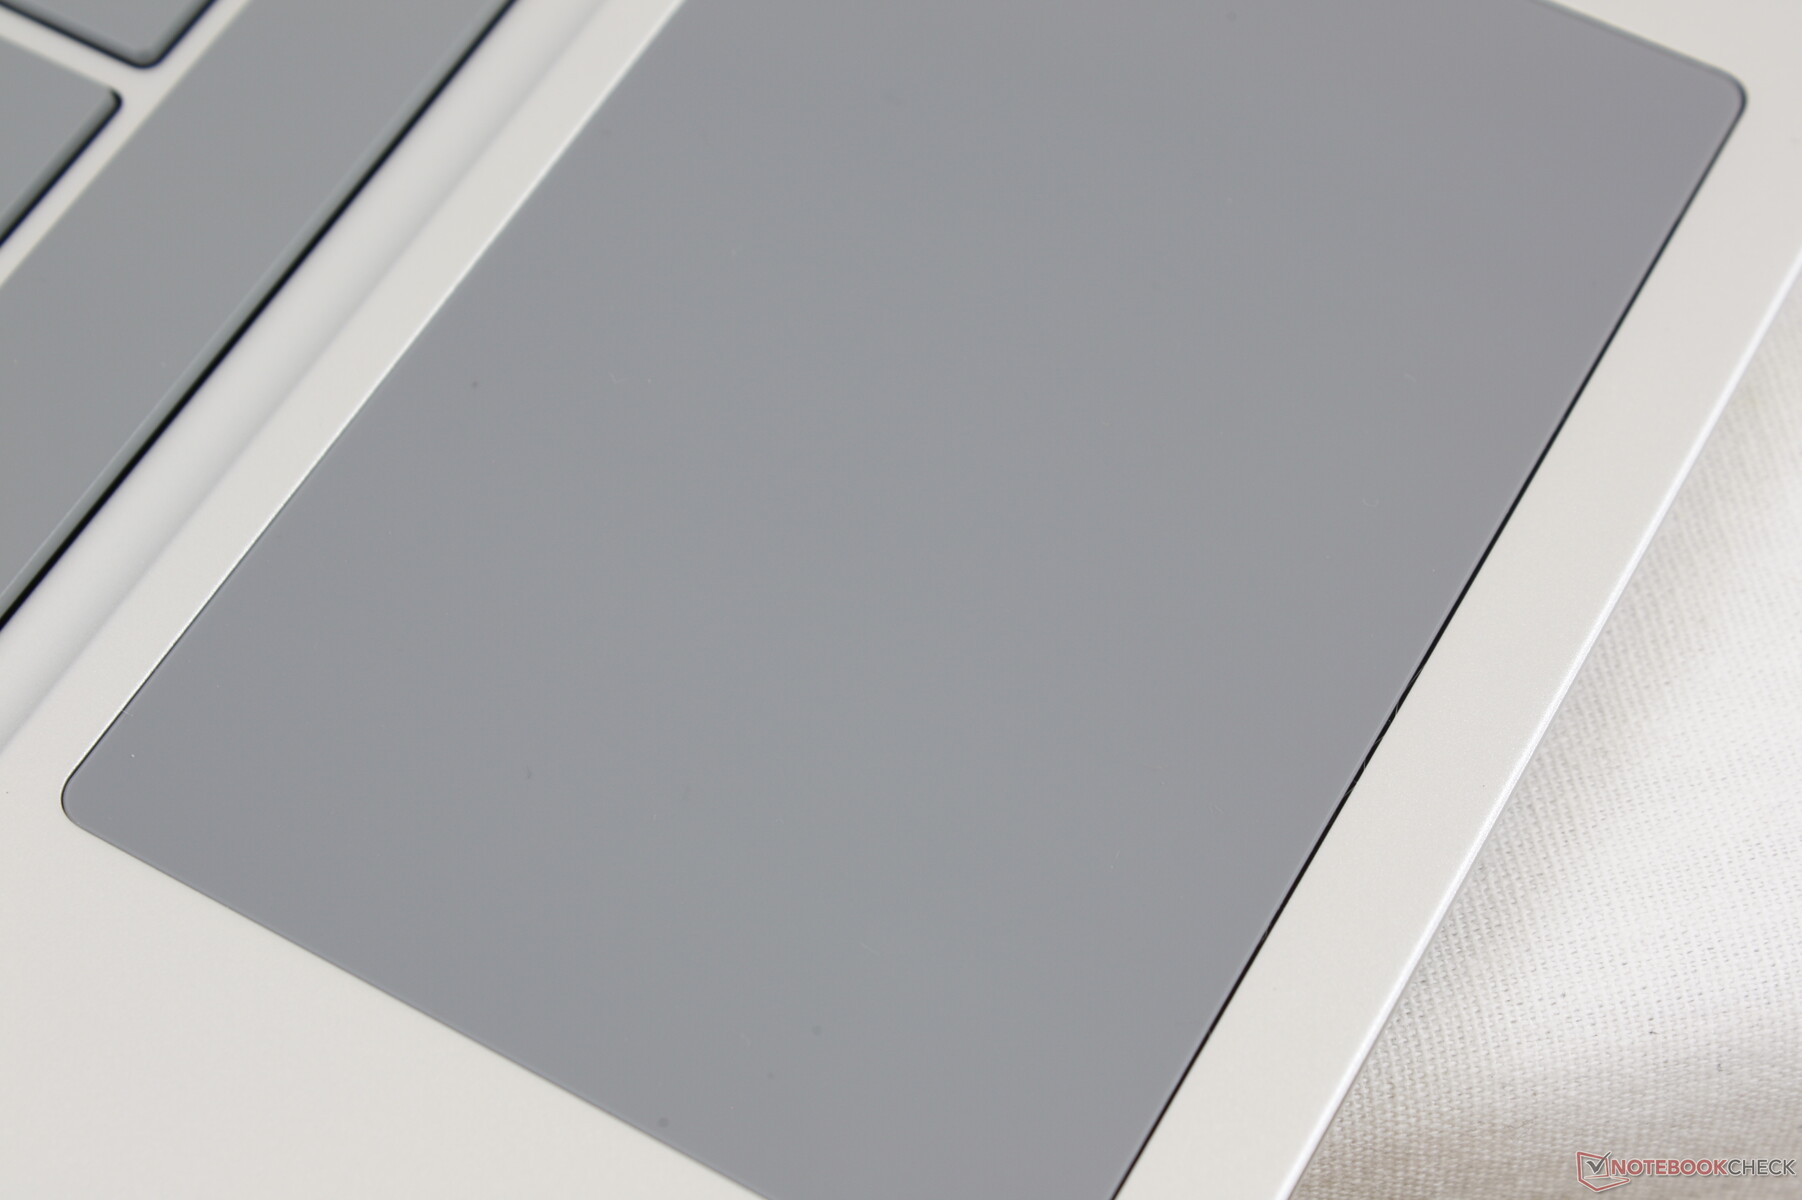
Touchpad
Clickpad surface area is smaller than the clickpad on the Surface Laptop 3 15 (10 x 6.7 cm vs. 11.5 x 7.6 cm). Gliding, however, is smoother on the Surface Laptop Go with less sticking overall. The integrated mouse keys are shallow in travel with adequate feedback and relatively quiet clatter. We find feedback to be slightly firmer and more satisfying than the clickpad on the XPS 13.
Display
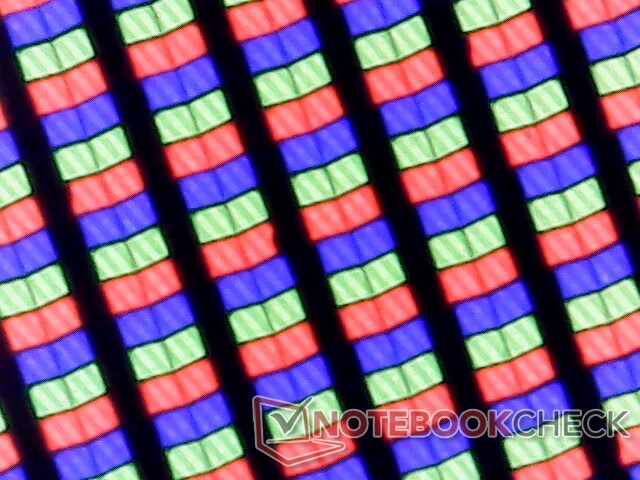
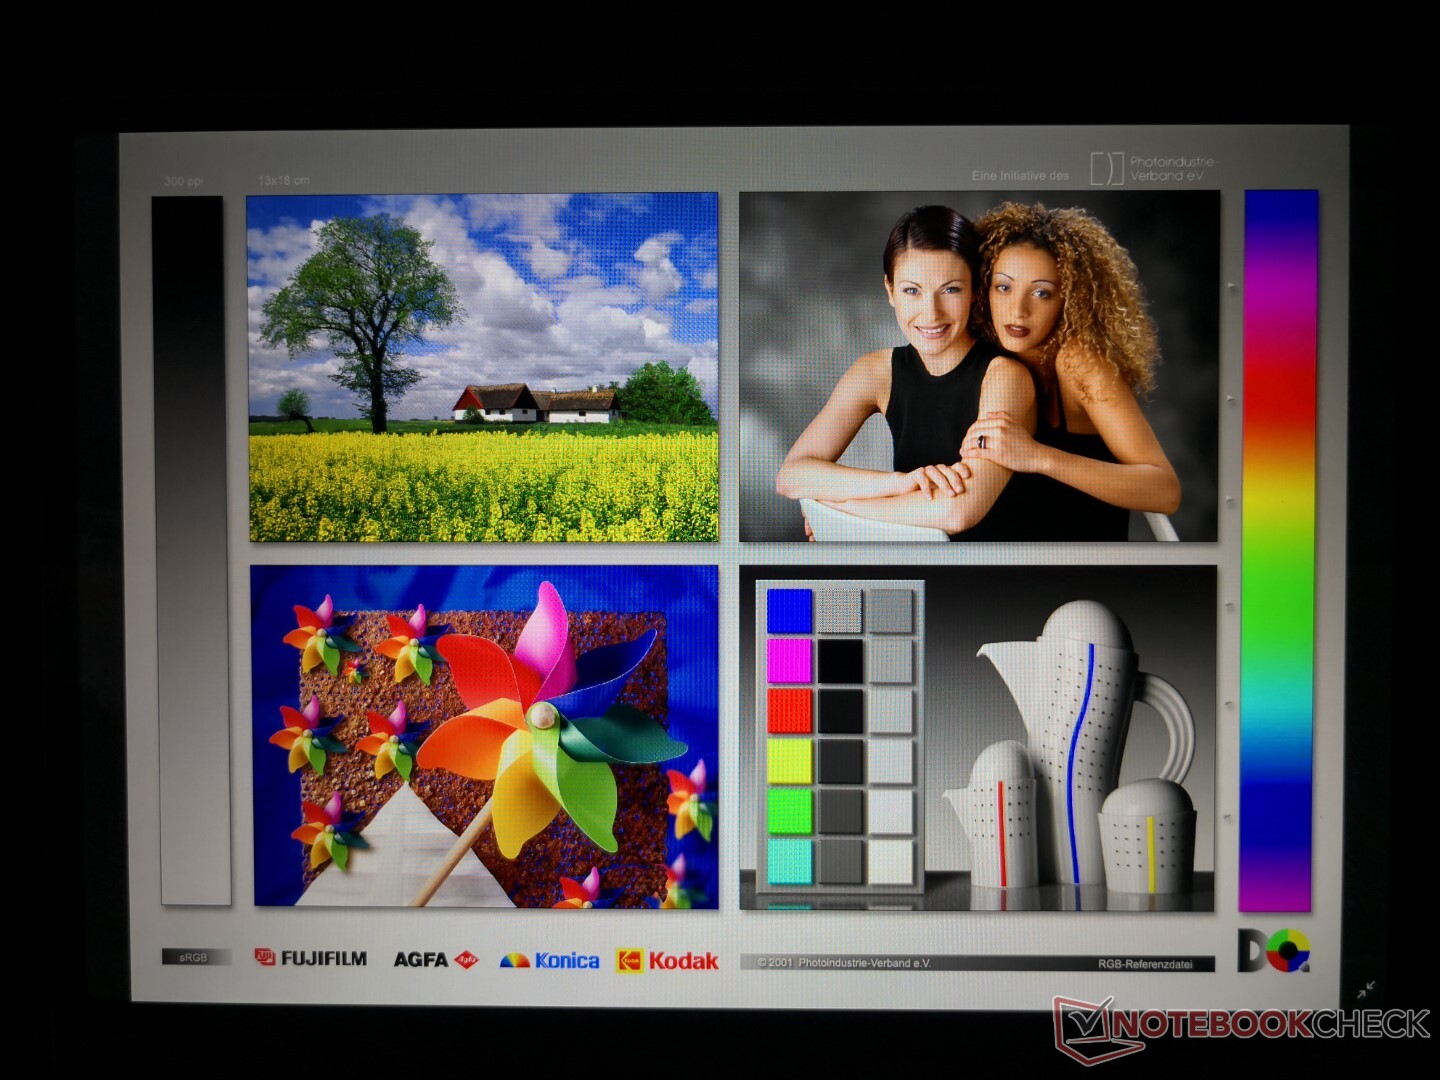
LG Philips is responsible for the display on the Surface Laptop Go whereas the displays on the larger 13.5-inch and 15-inch Surface laptop 3 models are all from Sharp. Contrast, colors, and clarity are thankfully not all that different from the already excellent panels on the larger models. One aspect that's better on the Surface Laptop Go, however, is response time for less noticeable ghosting.

| |||||||||||||||||||||||||
Brightness Distribution: 95 %
Center on Battery: 354.3 cd/m²
Contrast: 1222:1 (Black: 0.29 cd/m²)
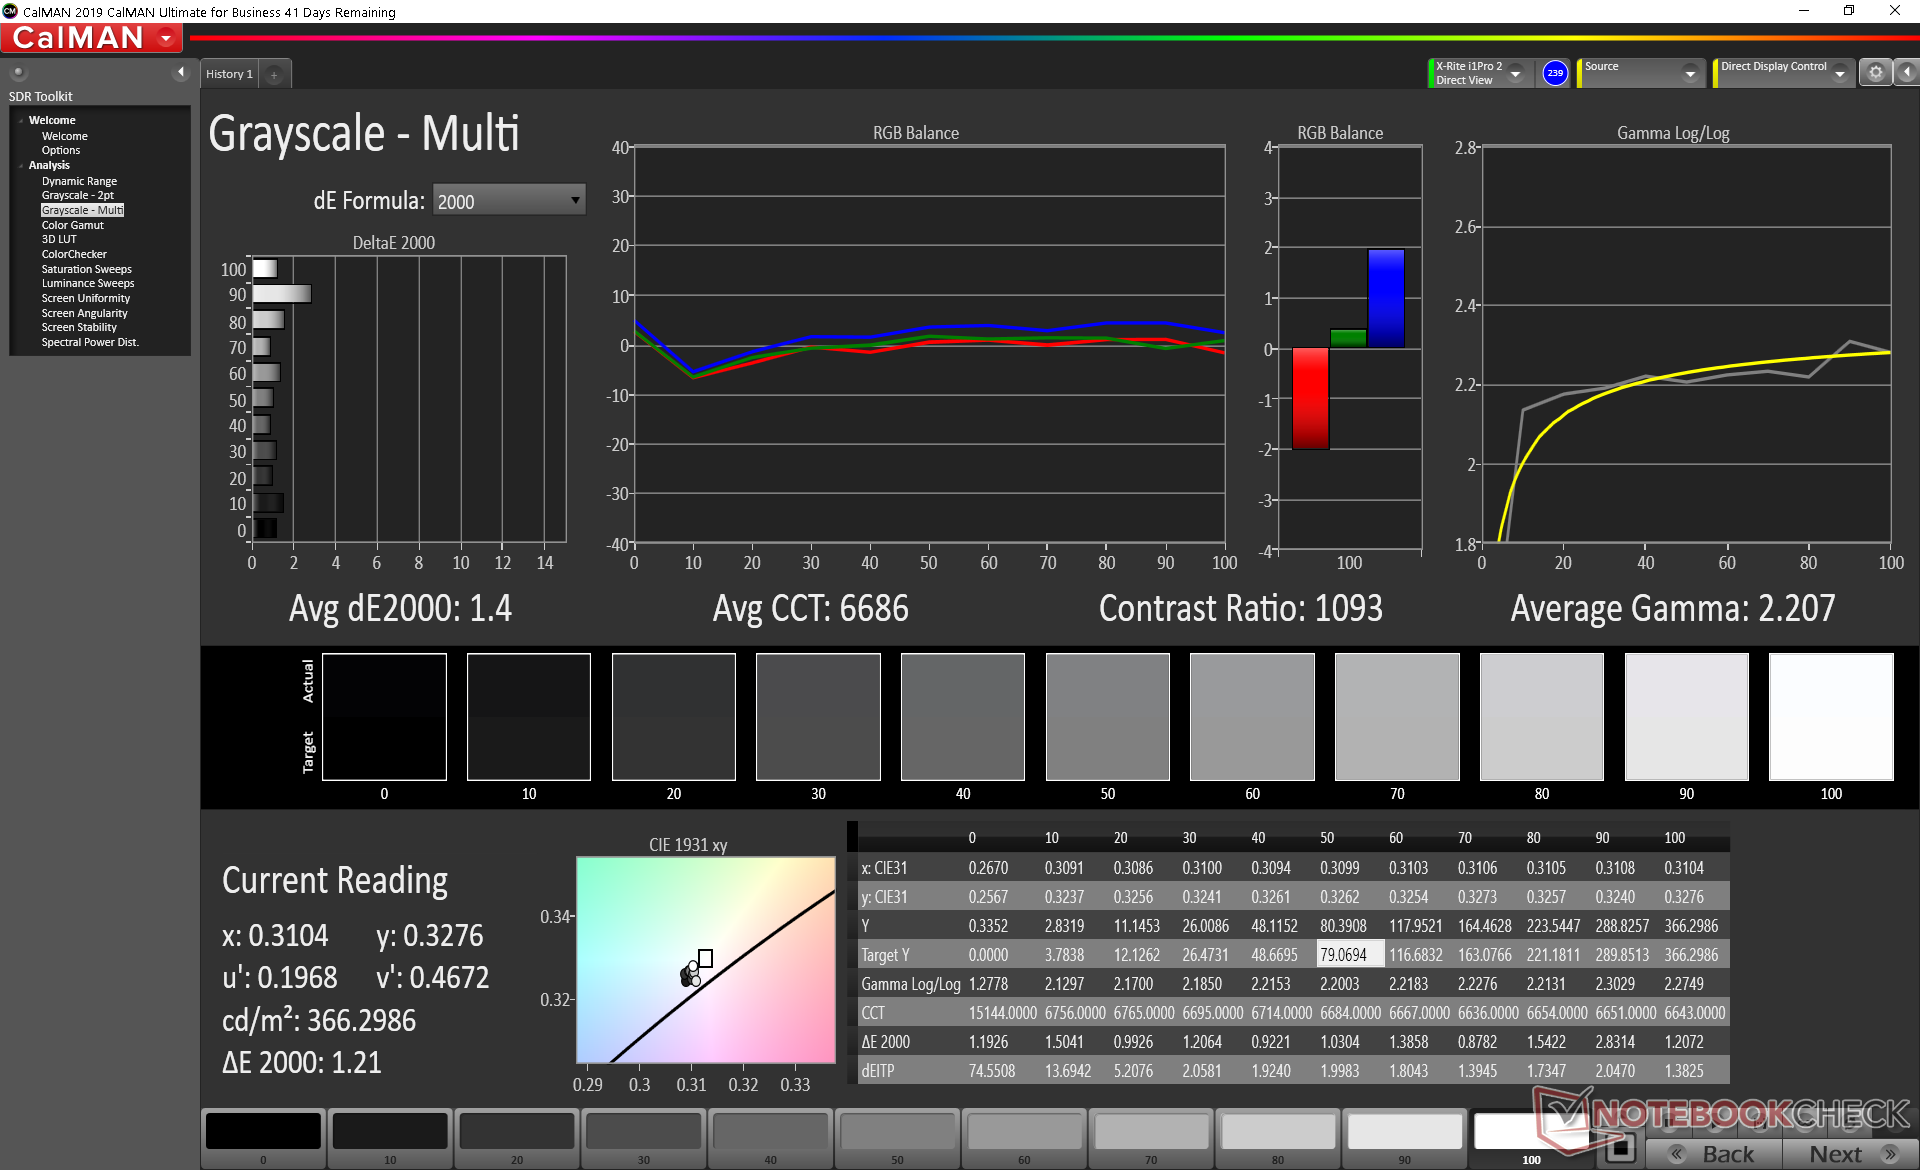
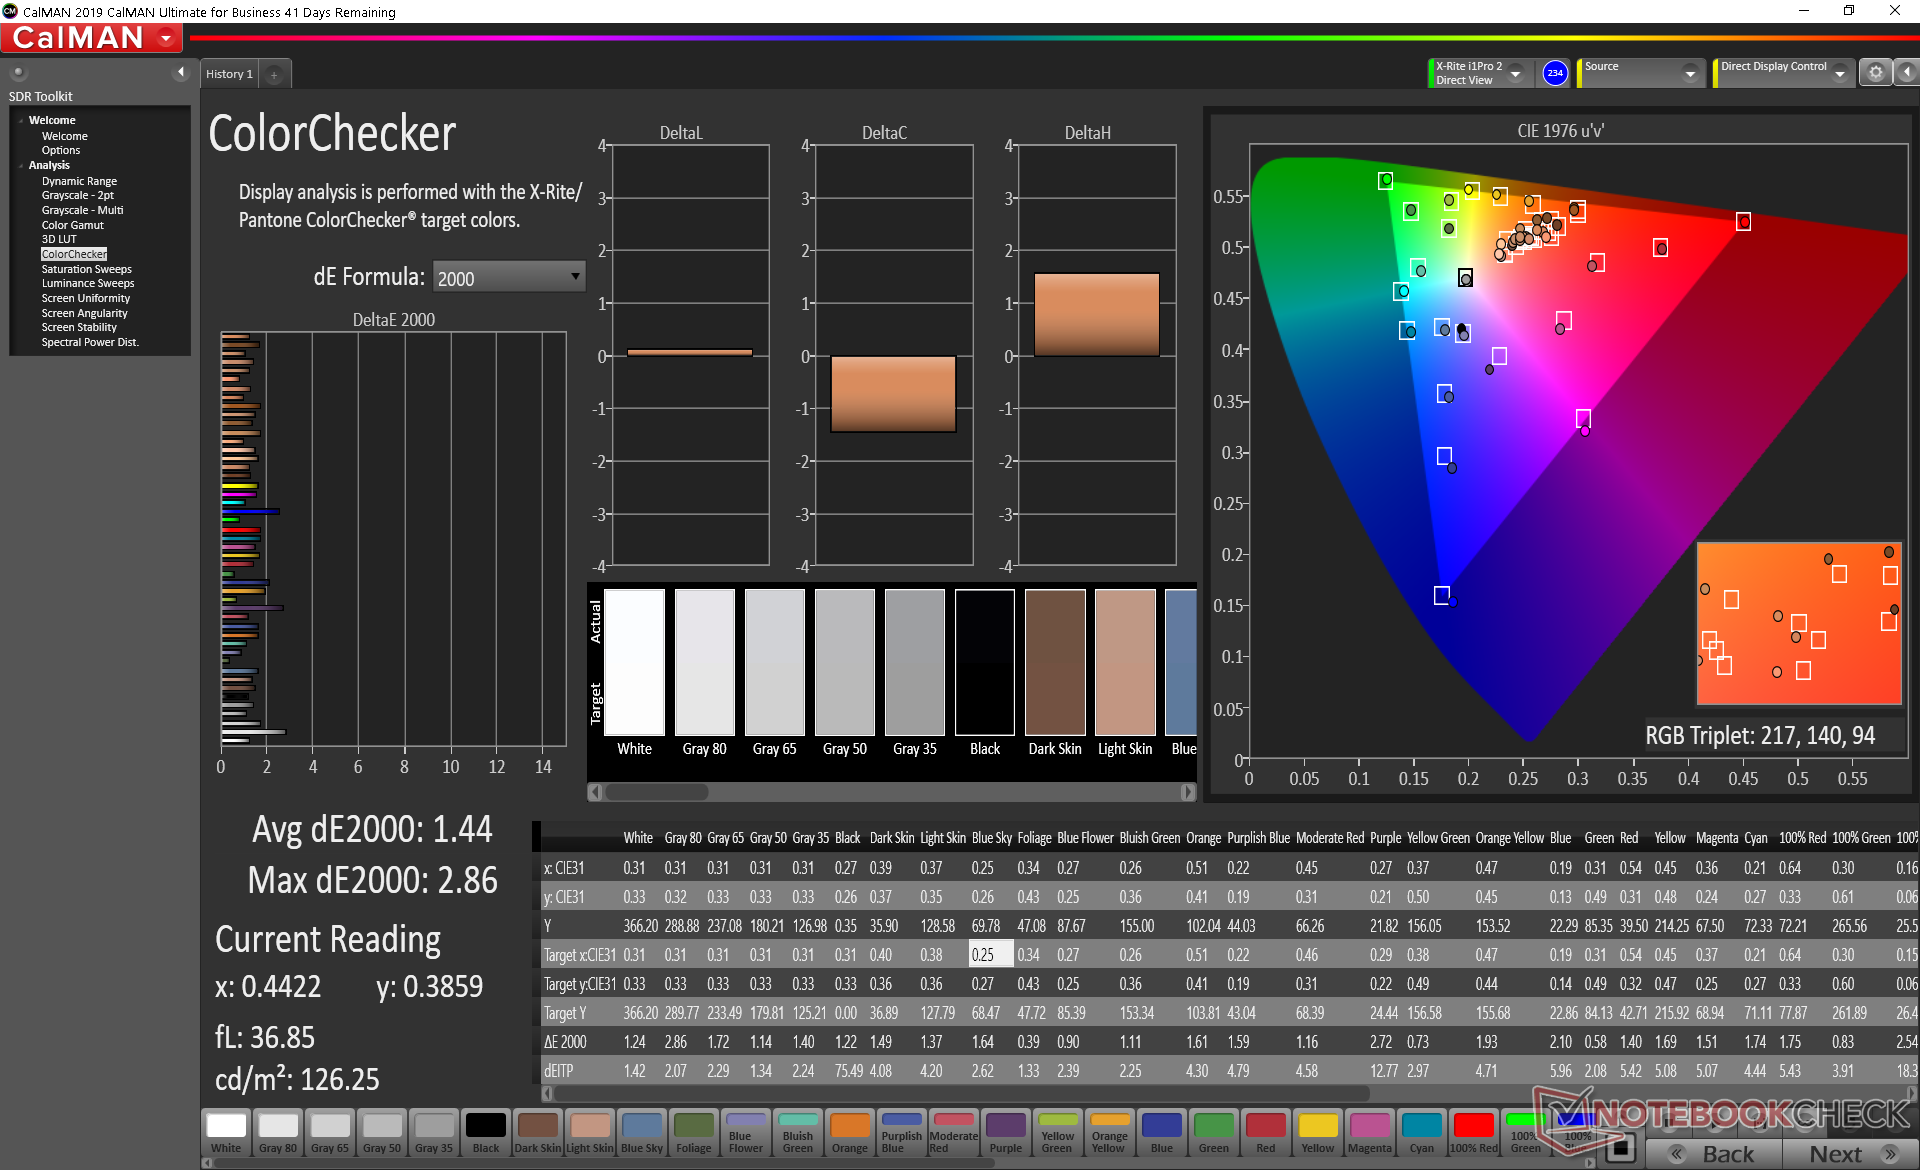
ΔE ColorChecker Calman: 1.41 | ∀{0.5-29.43 Ø4.76}
calibrated: 1.44
ΔE Greyscale Calman: 1.2 | ∀{0.09-98 Ø5}
94.4% sRGB (Argyll 1.6.3 3D)
60.2% AdobeRGB 1998 (Argyll 1.6.3 3D)
65.7% AdobeRGB 1998 (Argyll 3D)
94.6% sRGB (Argyll 3D)
64.4% Display P3 (Argyll 3D)
Gamma: 2.26
CCT: 6600 K
| Microsoft Surface Laptop Go Core i5 LG Philips LP125WX112403, IPS, 12.4", 1536x1024 | Asus Zenbook S UX393JA AU Optronics B139KAN01.0, IPS, 13.9", 3300x2200 | HP EliteBook 830 G7 Chi Mei CMN13A9, IPS, 13.3", 1920x1080 | Microsoft Surface Laptop 3 13 Core i5-1035G7 Sharp LQ135P1JX51, IPS, 13.5", 2256x1504 | Huawei MateBook X Pro 2020 i7 JDI LPM139M422A, LTPS, 13.9", 3000x2000 | Apple MacBook Pro 13 2020 2GHz i5 10th-Gen APPA03D, IPS, 13.3", 2560x1600 | |
|---|---|---|---|---|---|---|
| Display | 30% | 3% | 3% | 4% | 30% | |
| Display P3 Coverage (%) | 64.4 | 97.7 52% | 65.7 2% | 65.7 2% | 66.6 3% | 98.8 53% |
| sRGB Coverage (%) | 94.6 | 99.8 5% | 97.4 3% | 98.6 4% | 99.4 5% | 99.9 6% |
| AdobeRGB 1998 Coverage (%) | 65.7 | 87.9 34% | 67.4 3% | 67.8 3% | 68.6 4% | 86.4 32% |
| Response Times | -48% | -22% | -56% | -24% | -22% | |
| Response Time Grey 50% / Grey 80% * (ms) | 34.8 ? | 56.4 ? -62% | 46.8 ? -34% | 59.2 ? -70% | 49.6 ? -43% | 46 ? -32% |
| Response Time Black / White * (ms) | 29.2 ? | 38.8 ? -33% | 32 ? -10% | 41.6 ? -42% | 30.8 ? -5% | 32.4 ? -11% |
| PWM Frequency (Hz) | 21930 ? | 26600 ? | 21740 ? | 29070 ? | 113600 ? | |
| Screen | -42% | -26% | 9% | 12% | 7% | |
| Brightness middle (cd/m²) | 354.3 | 444.1 25% | 454.5 28% | 403.4 14% | 557 57% | 512 45% |
| Brightness (cd/m²) | 353 | 423 20% | 435 23% | 397 12% | 532 51% | 491 39% |
| Brightness Distribution (%) | 95 | 89 -6% | 91 -4% | 89 -6% | 87 -8% | 91 -4% |
| Black Level * (cd/m²) | 0.29 | 0.37 -28% | 0.27 7% | 0.34 -17% | 0.33 -14% | 0.32 -10% |
| Contrast (:1) | 1222 | 1200 -2% | 1683 38% | 1186 -3% | 1688 38% | 1600 31% |
| Colorchecker dE 2000 * | 1.41 | 2.94 -109% | 3.12 -121% | 0.94 33% | 1.4 1% | 1.7 -21% |
| Colorchecker dE 2000 max. * | 2.96 | 7.37 -149% | 4.85 -64% | 2.92 1% | 2.5 16% | 3.4 -15% |
| Colorchecker dE 2000 calibrated * | 1.44 | 3.05 -112% | 1.97 -37% | 0.99 31% | 0.7 51% | 1 31% |
| Greyscale dE 2000 * | 1.2 | 2.9 -142% | 3.1 -158% | 0.9 25% | 2 -67% | 1.9 -58% |
| Gamma | 2.26 97% | 2.1 105% | 2.01 109% | 2.13 103% | 2.14 103% | 2.19 100% |
| CCT | 6600 98% | 6766 96% | 6902 94% | 6620 98% | 6689 97% | 6817 95% |
| Color Space (Percent of AdobeRGB 1998) (%) | 60.2 | 78.2 30% | 61.5 2% | 62.3 3% | 62.5 4% | 77.4 29% |
| Color Space (Percent of sRGB) (%) | 94.4 | 99.8 6% | 97 3% | 98.7 5% | 99.5 5% | 99.9 6% |
| Total Average (Program / Settings) | -20% /
-29% | -15% /
-20% | -15% /
-0% | -3% /
6% | 5% /
8% |
* ... smaller is better
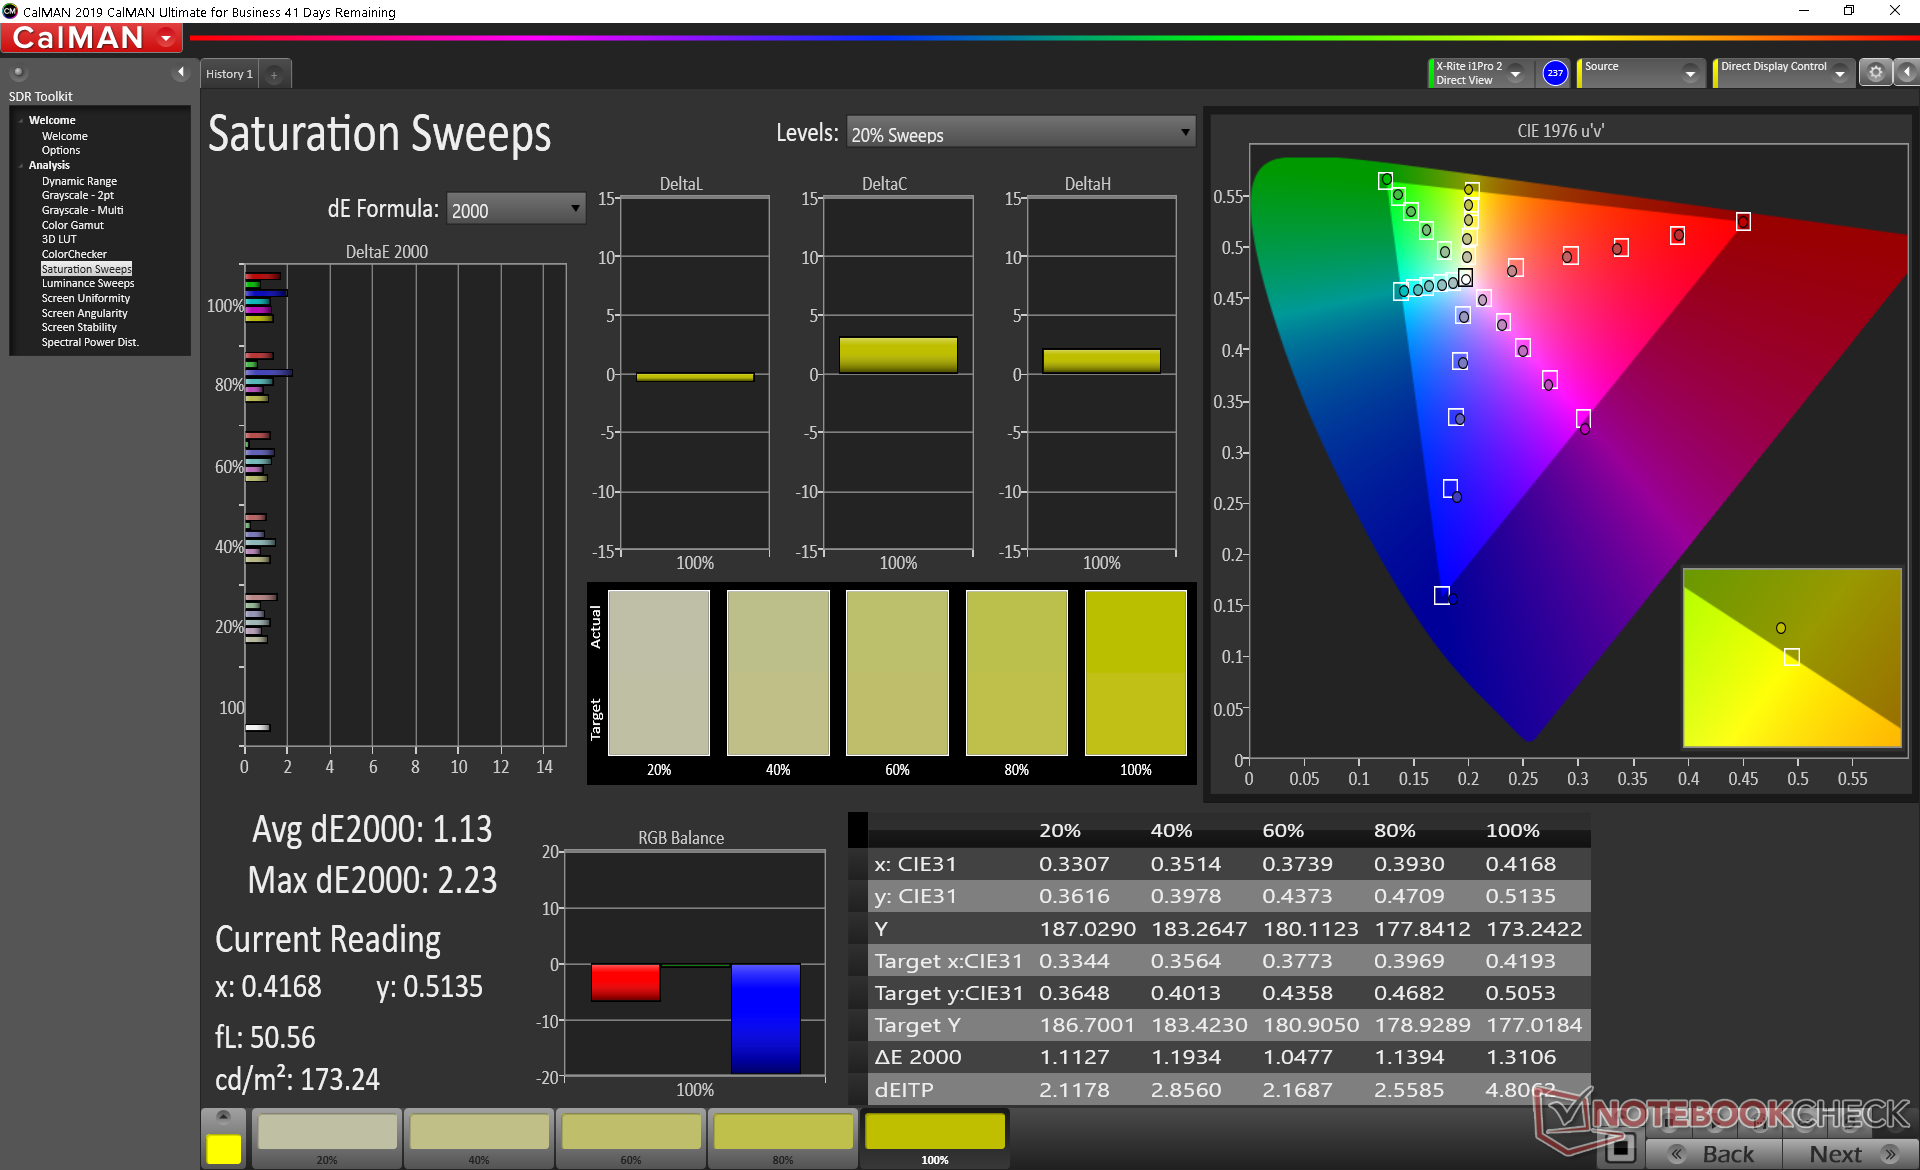
Color space covers 60 percent of AdobeRGB and almost all of sRGB to be adequate for amateur graphics or video editing. Pricier alternatives like the MacBook Pro 13 or Asus ZenBook S are able to offer deeper and more accurate colors.
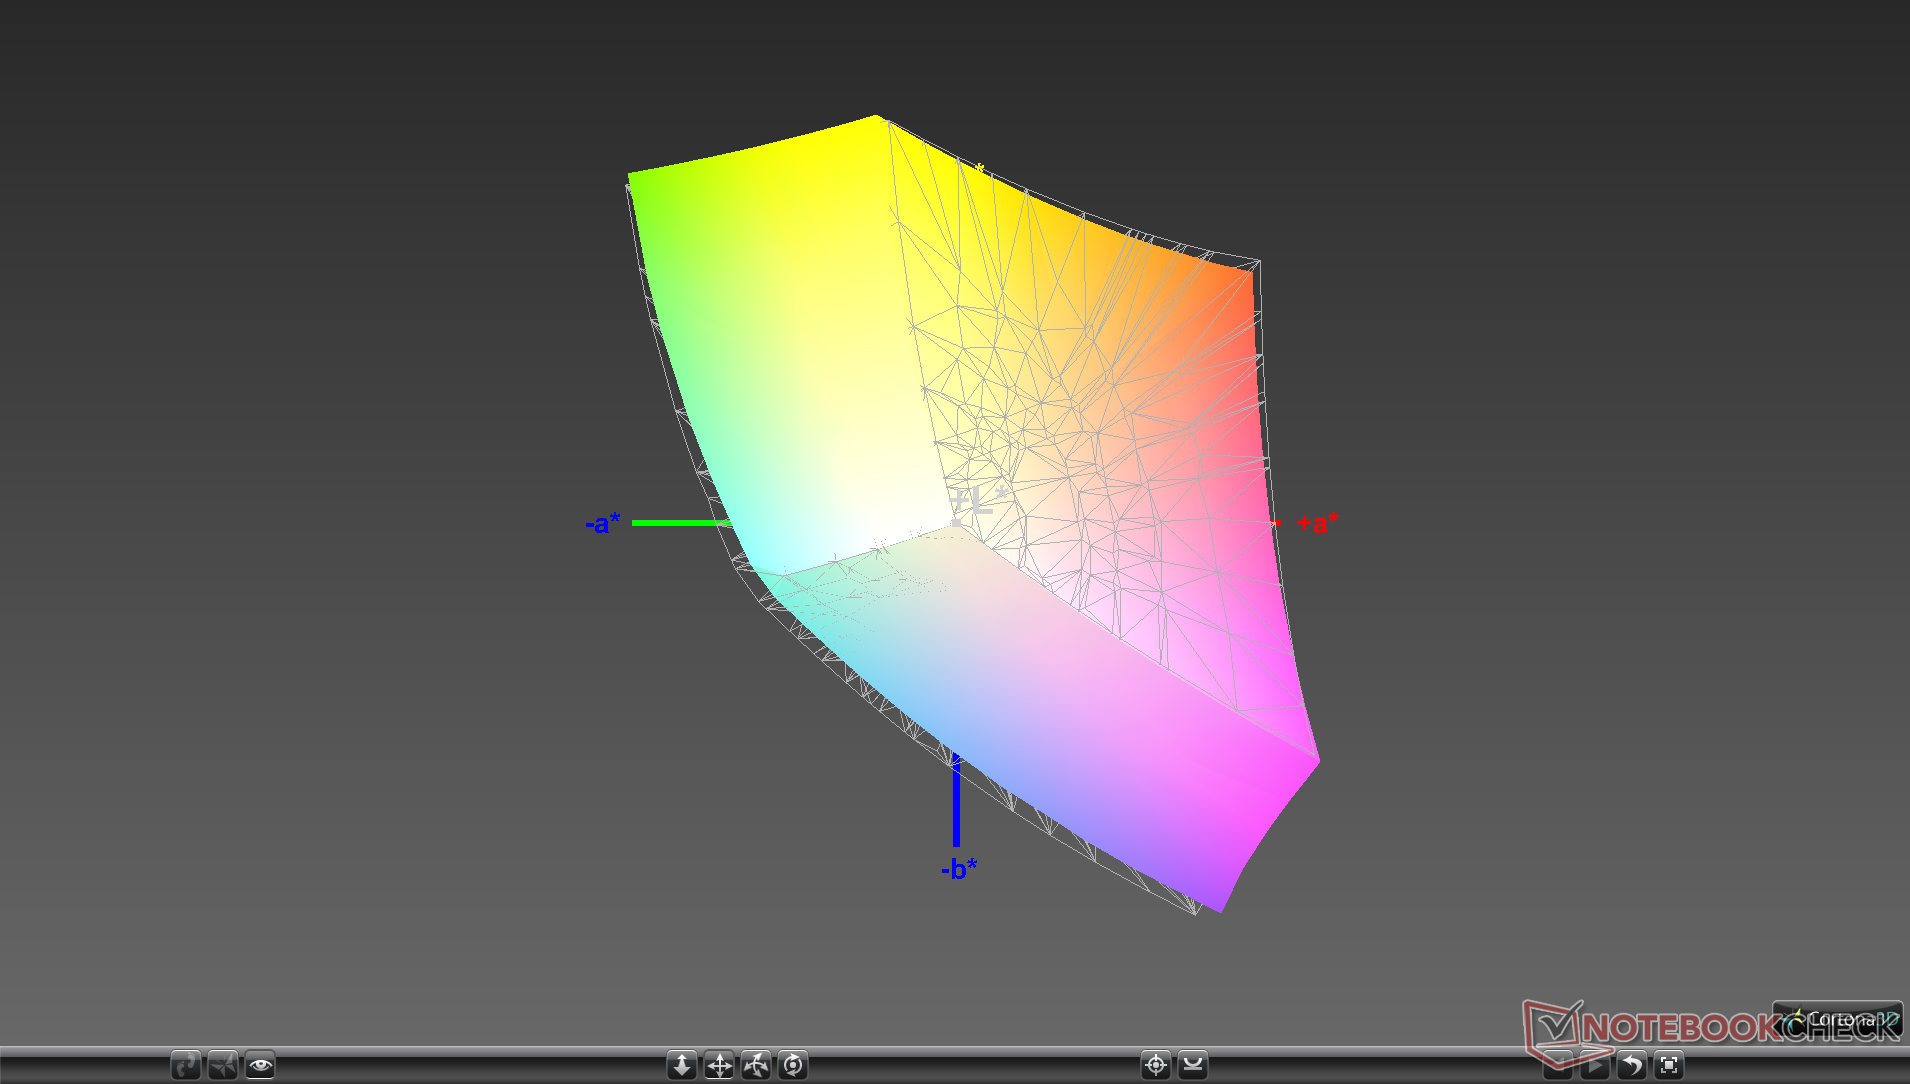
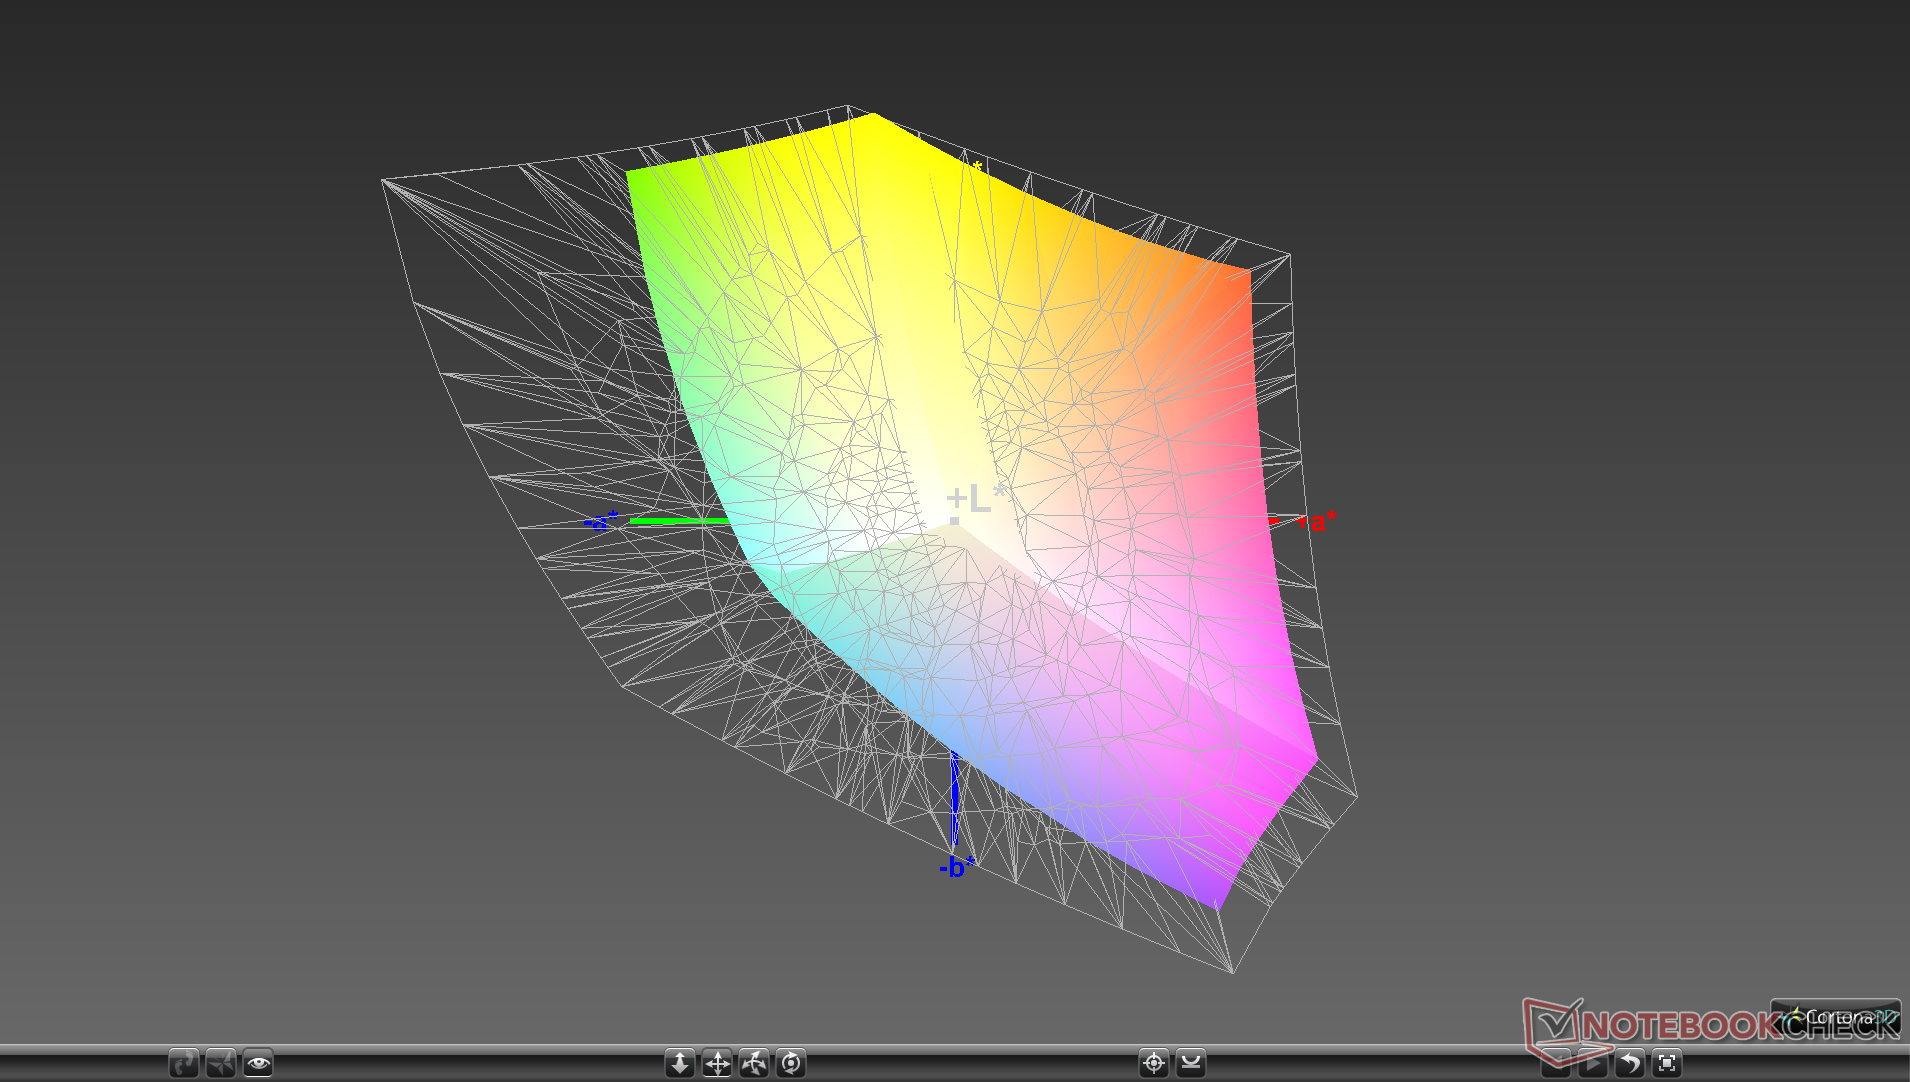
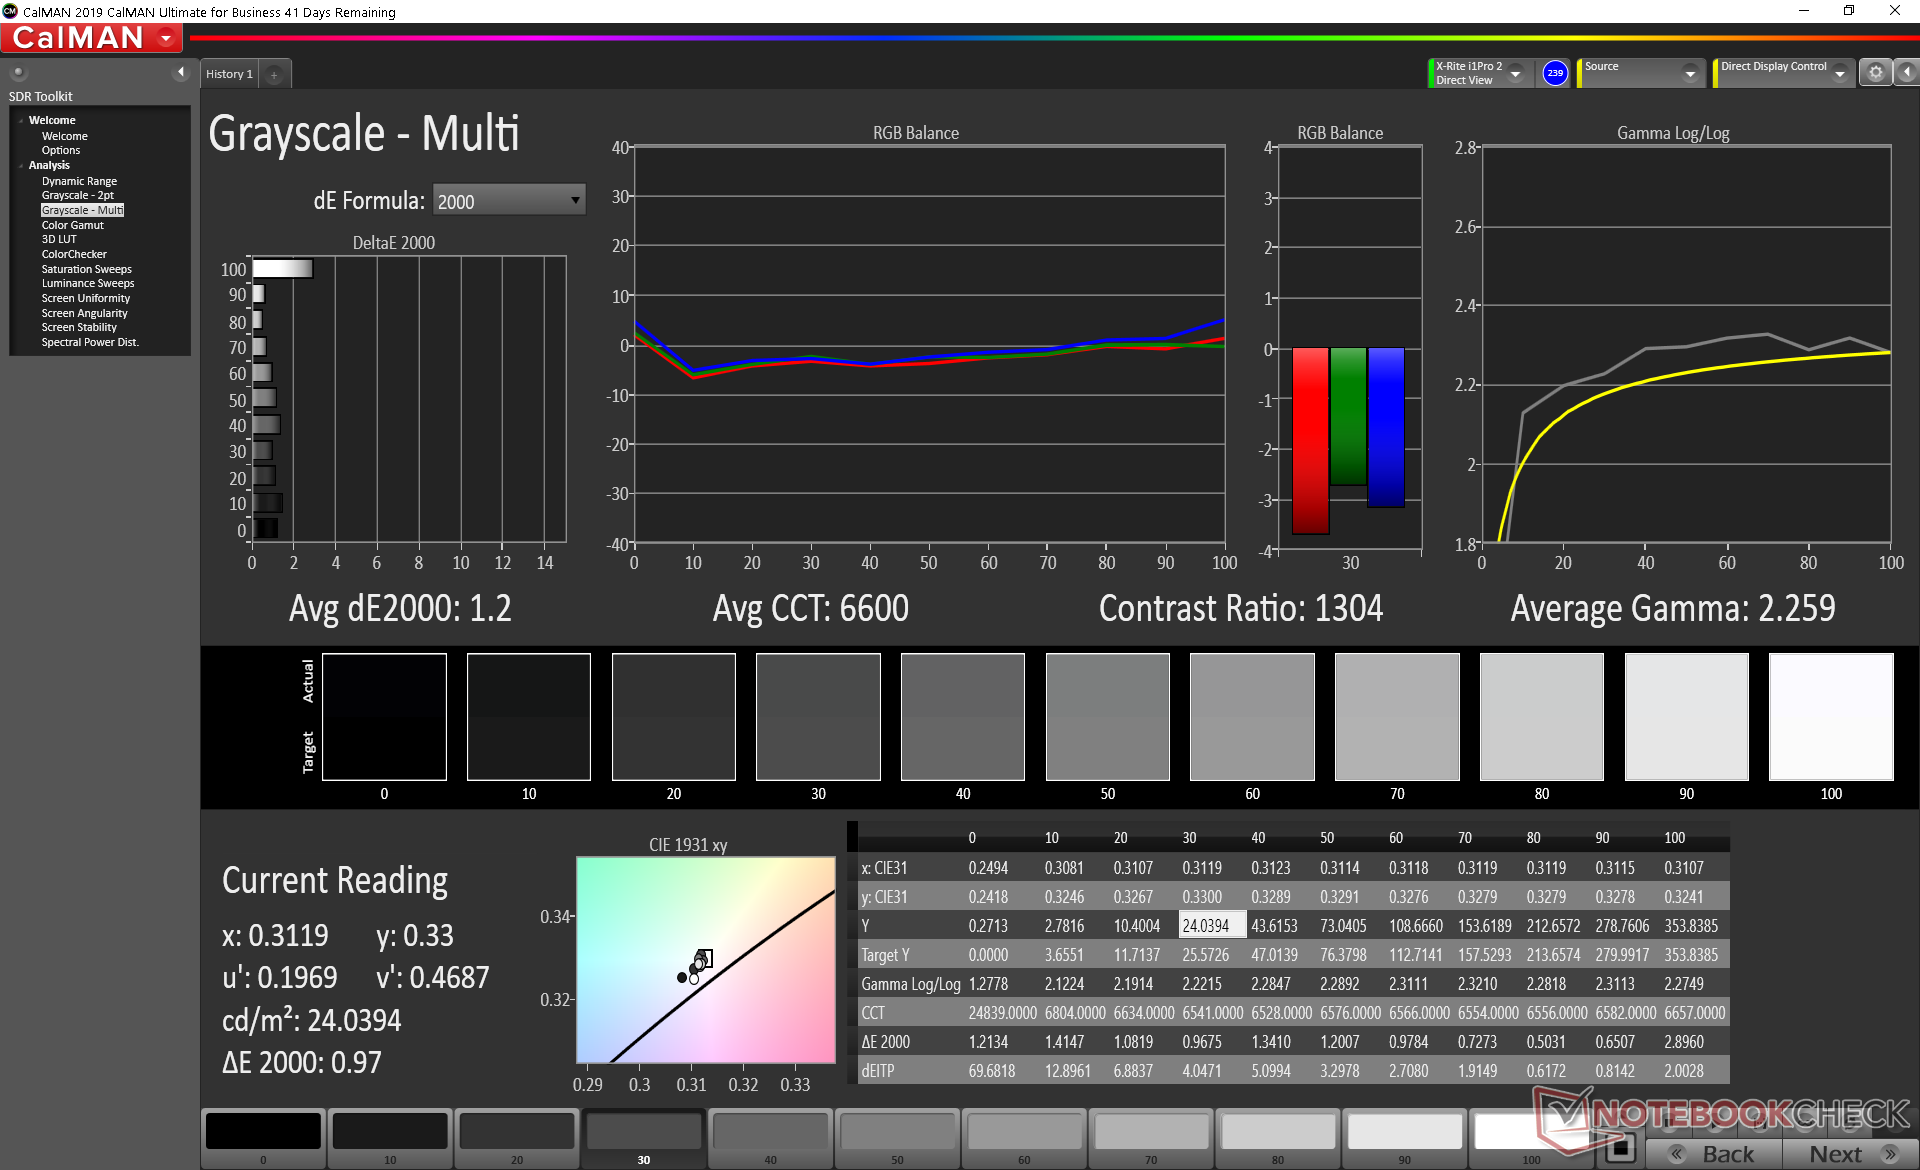
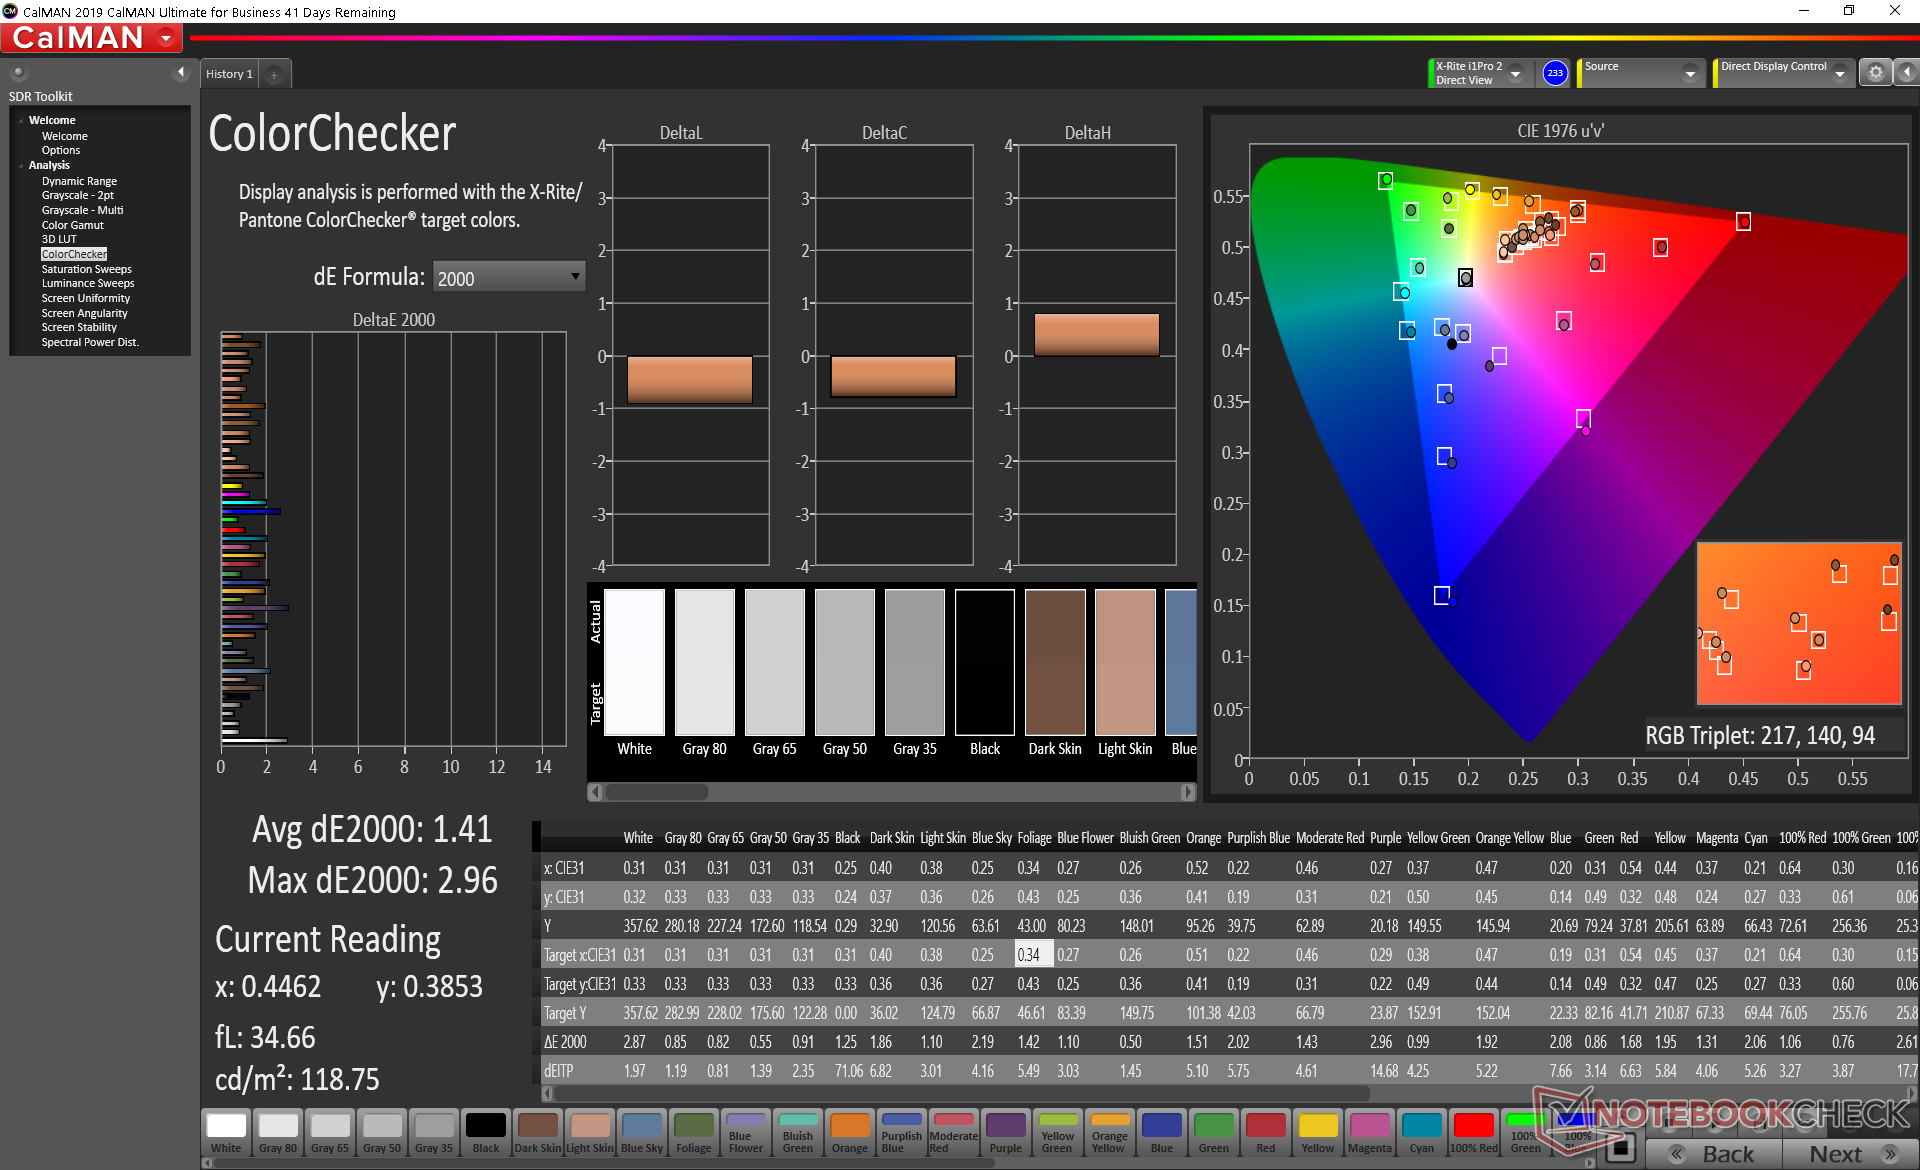
The panel is very well calibrated out of the box with average grayscale and color DeltaE values of only 1.2 and 1.41, respectively. There is no need for an end-user calibration.

Display Response Times
| ↔ Response Time Black to White | ||
|---|---|---|
| 29.2 ms ... rise ↗ and fall ↘ combined | ↗ 17.2 ms rise | 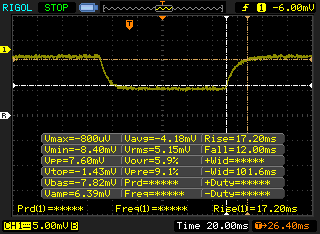 |
| ↘ 12 ms fall | ||
| The screen shows relatively slow response rates in our tests and may be too slow for gamers. In comparison, all tested devices range from 0.1 (minimum) to 240 (maximum) ms. » 77 % of all devices are better. This means that the measured response time is worse than the average of all tested devices (20.1 ms). | ||
| ↔ Response Time 50% Grey to 80% Grey | ||
| 34.8 ms ... rise ↗ and fall ↘ combined | ↗ 19.6 ms rise | 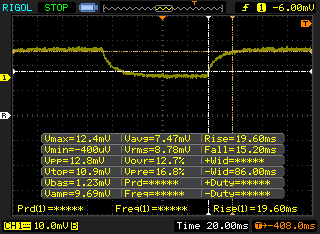 |
| ↘ 15.2 ms fall | ||
| The screen shows slow response rates in our tests and will be unsatisfactory for gamers. In comparison, all tested devices range from 0.165 (minimum) to 636 (maximum) ms. » 48 % of all devices are better. This means that the measured response time is worse than the average of all tested devices (31.4 ms). | ||
Screen Flickering / PWM (Pulse-Width Modulation)
| Screen flickering / PWM detected | 21930 Hz | ≤ 51 % brightness setting | 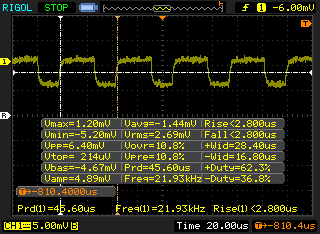 |
The display backlight flickers at 21930 Hz (worst case, e.g., utilizing PWM) Flickering detected at a brightness setting of 51 % and below. There should be no flickering or PWM above this brightness setting. The frequency of 21930 Hz is quite high, so most users sensitive to PWM should not notice any flickering. In comparison: 53 % of all tested devices do not use PWM to dim the display. If PWM was detected, an average of 8002 (minimum: 5 - maximum: 343500) Hz was measured. | |||
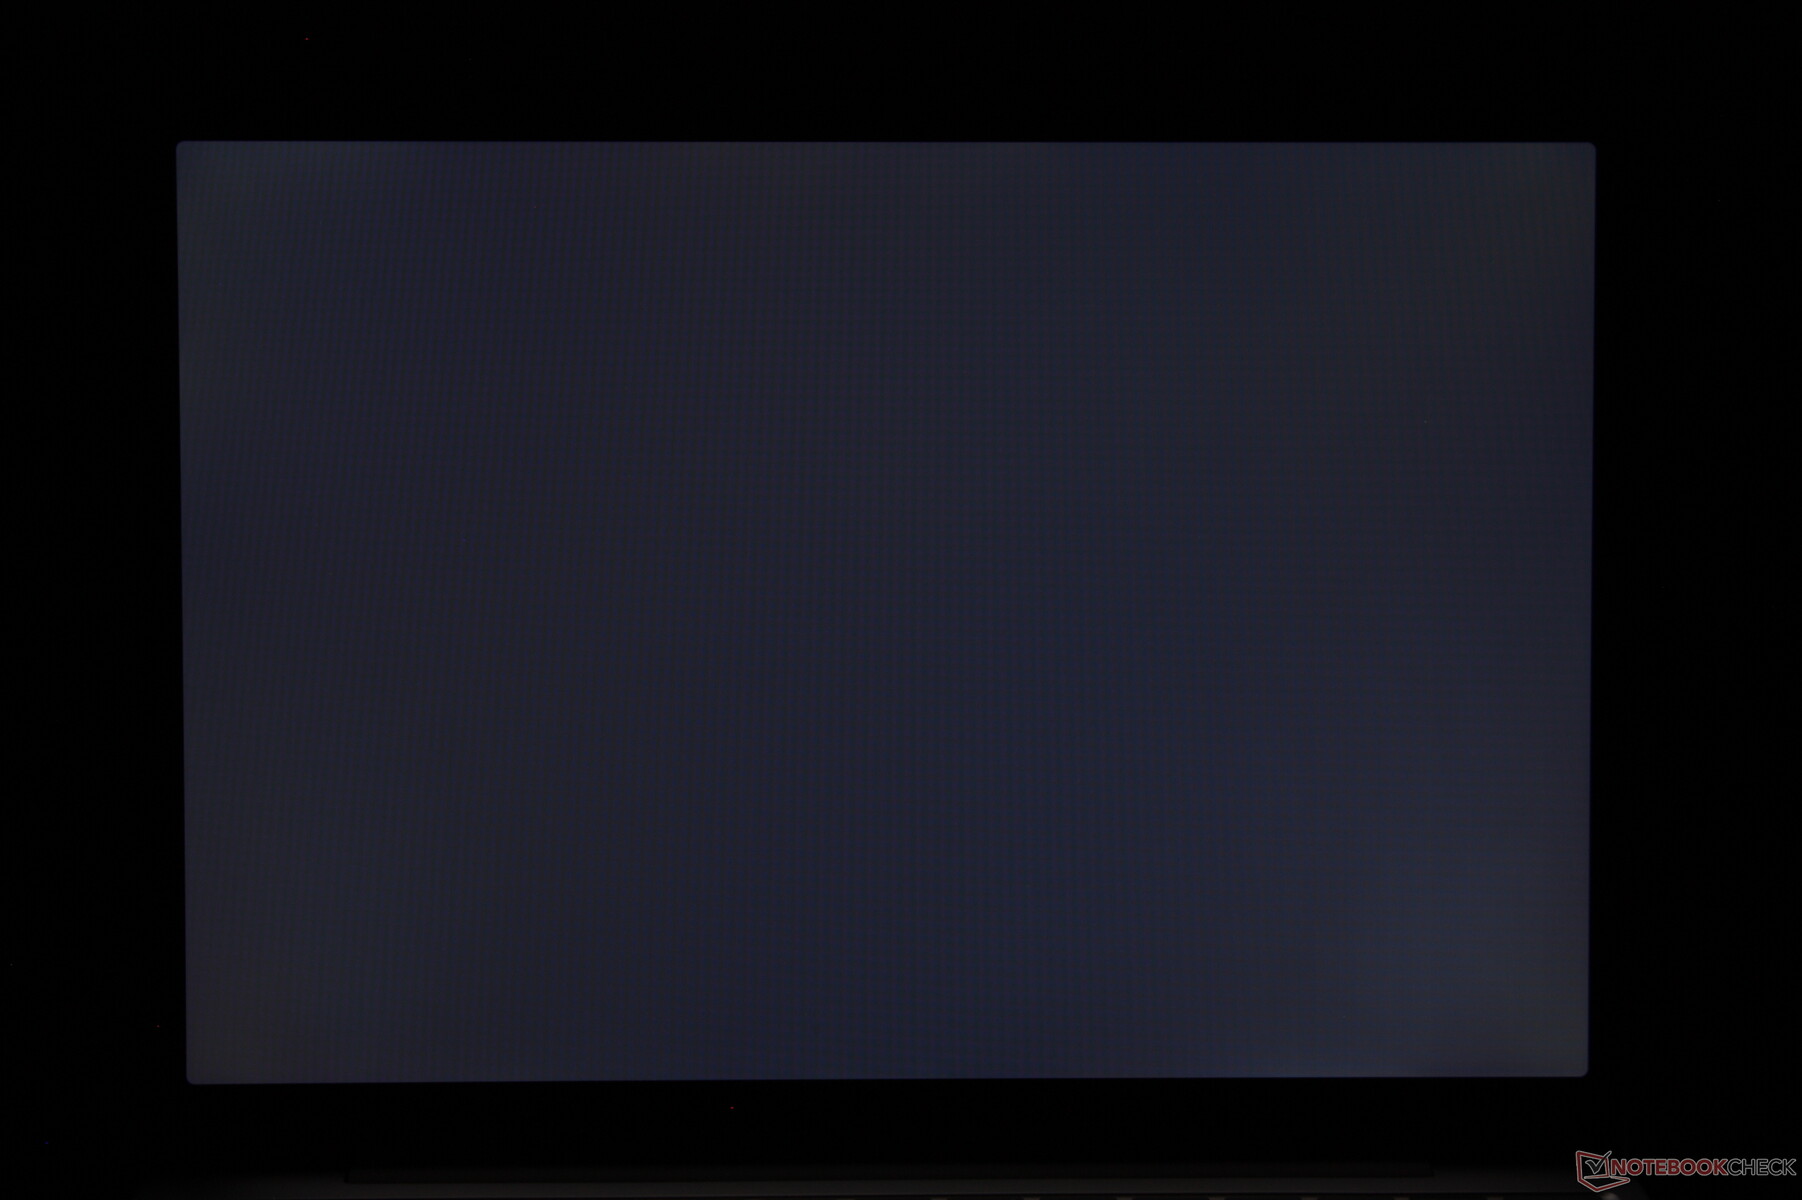
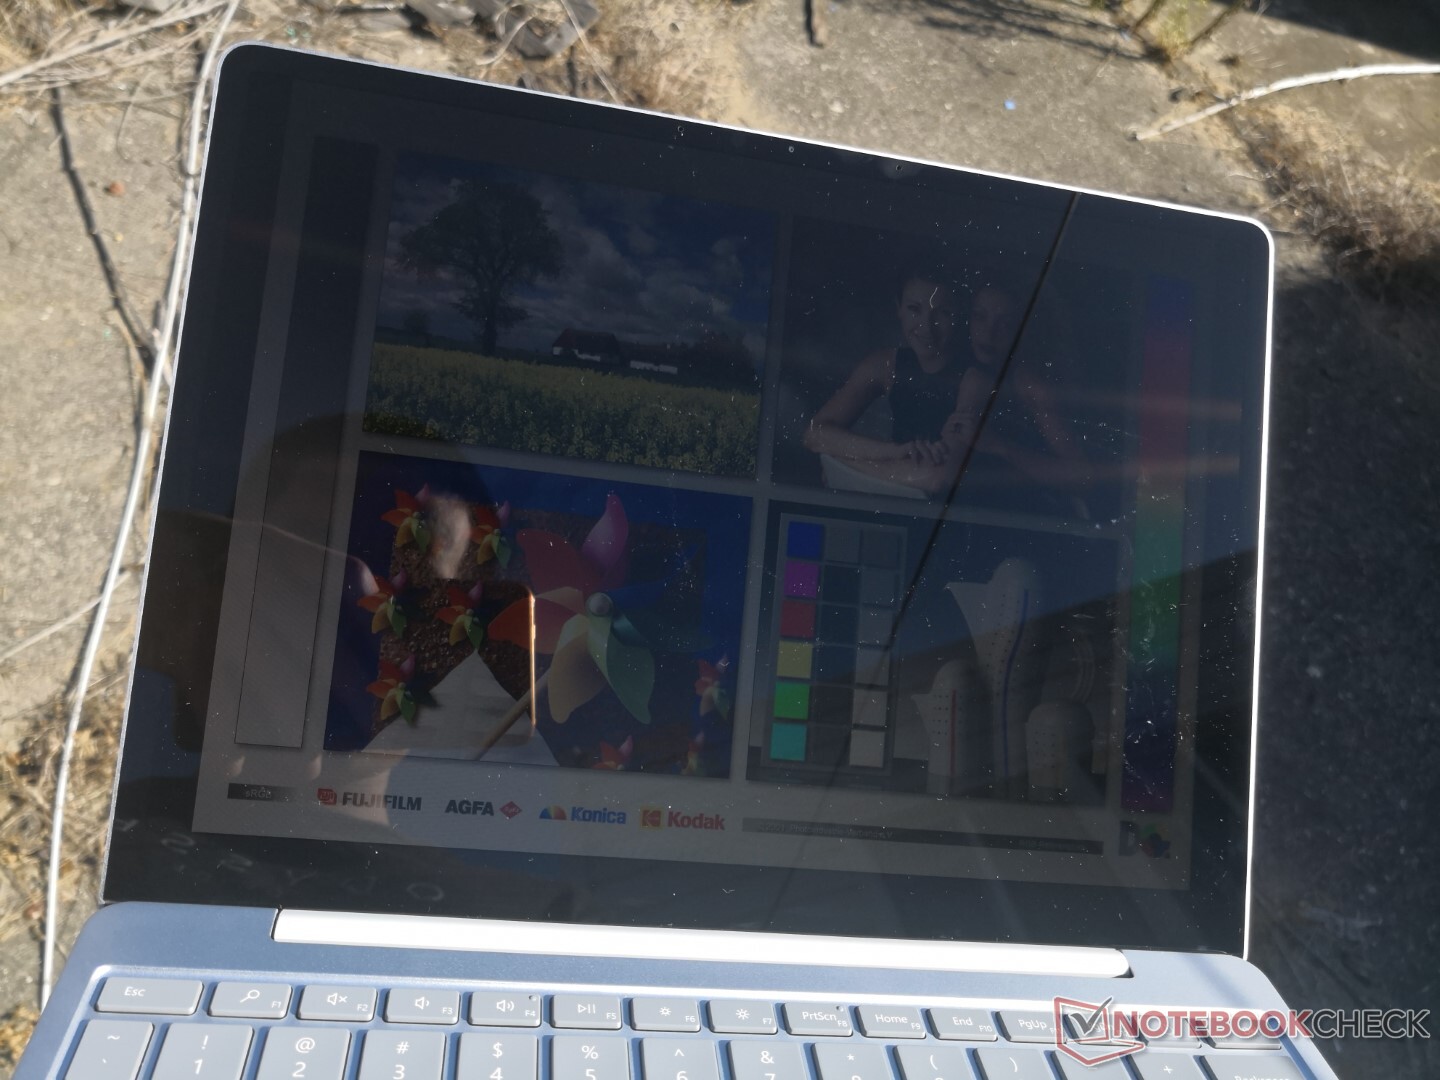
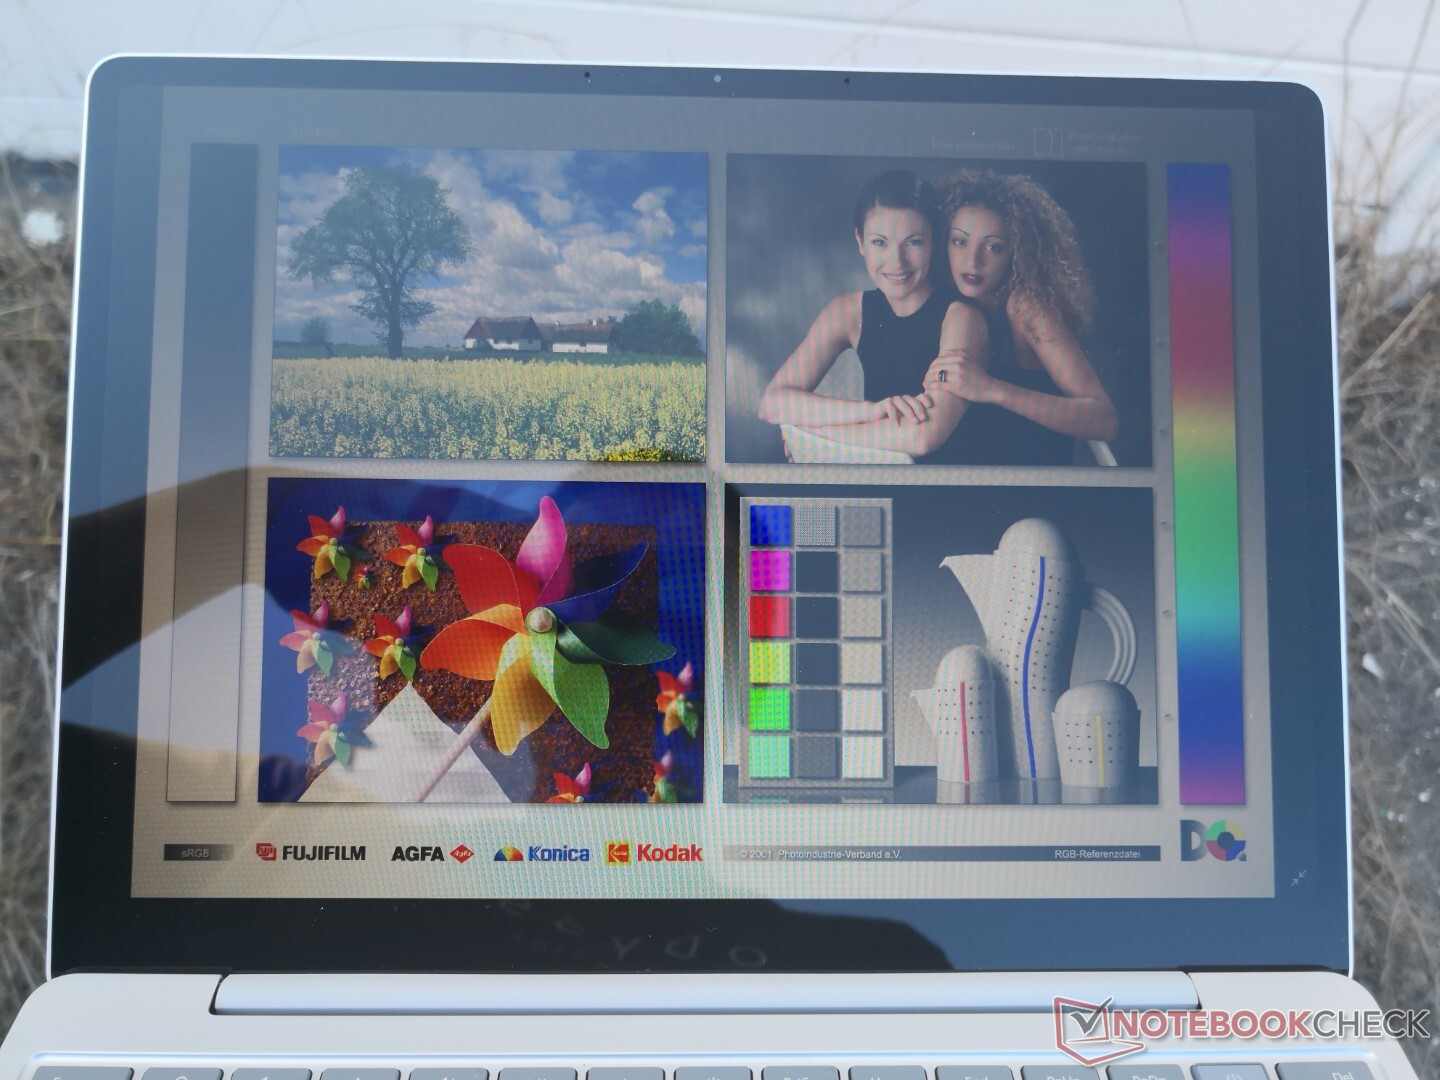
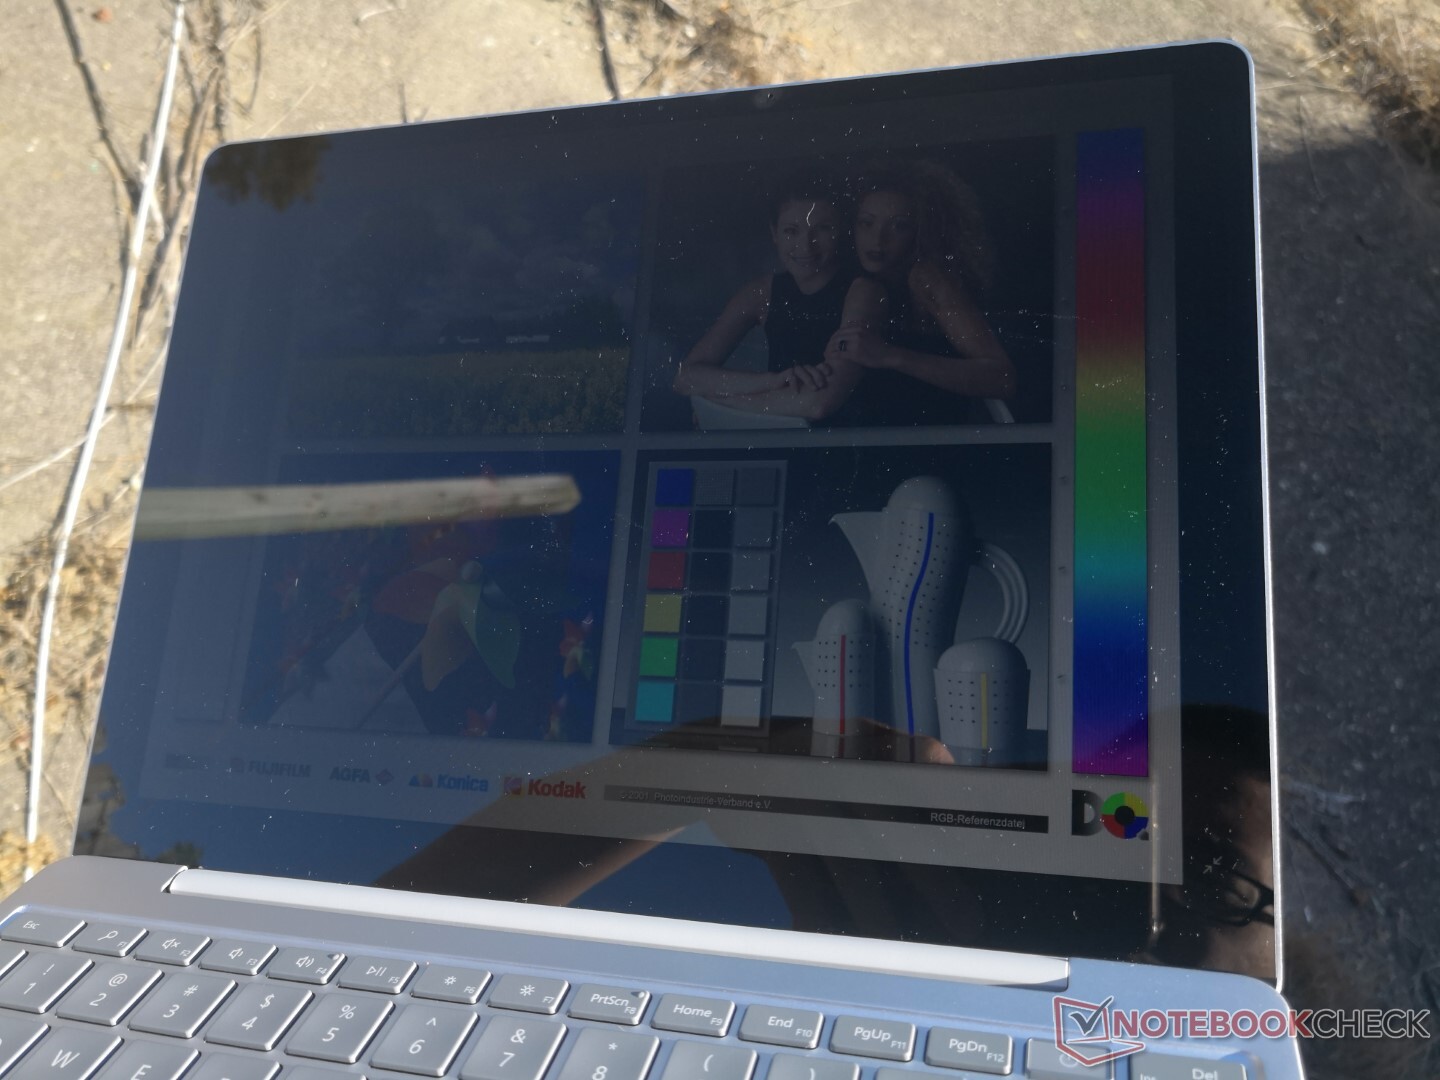
Not only is the display dimmer than the 13.5-inch Surface Laptop 3, but it's dimmer than most other mid-range to high-end subnotebooks including the ZenBook S, MacBook Pro 13, XPS 13, and the MateBook X Pro. Glare is ever present even if working under shade.
Performance
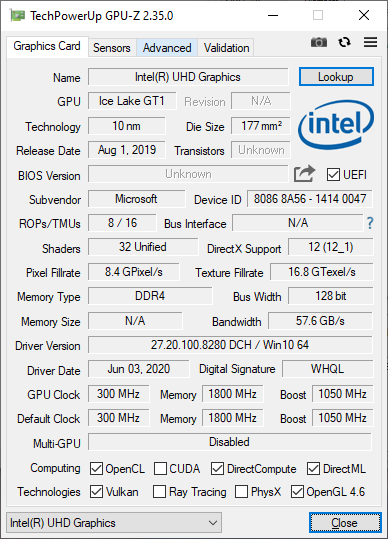
Unlike most other laptops, Surface Laptop Go SKUs are separated by RAM and storage while the Core i5 CPU, UHD Graphics G1 GPU, and display resolution remain fixed. The most affordable configuration comes with only 4 GB of RAM and 64 GB of storage which read like budget tablet specifications. RAM is fixed on all SKUs and so we recommend considering at least 8 GB of RAM.
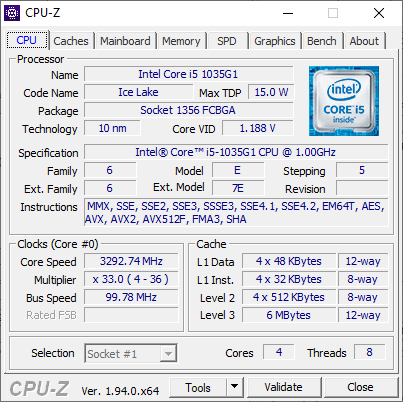

Processor
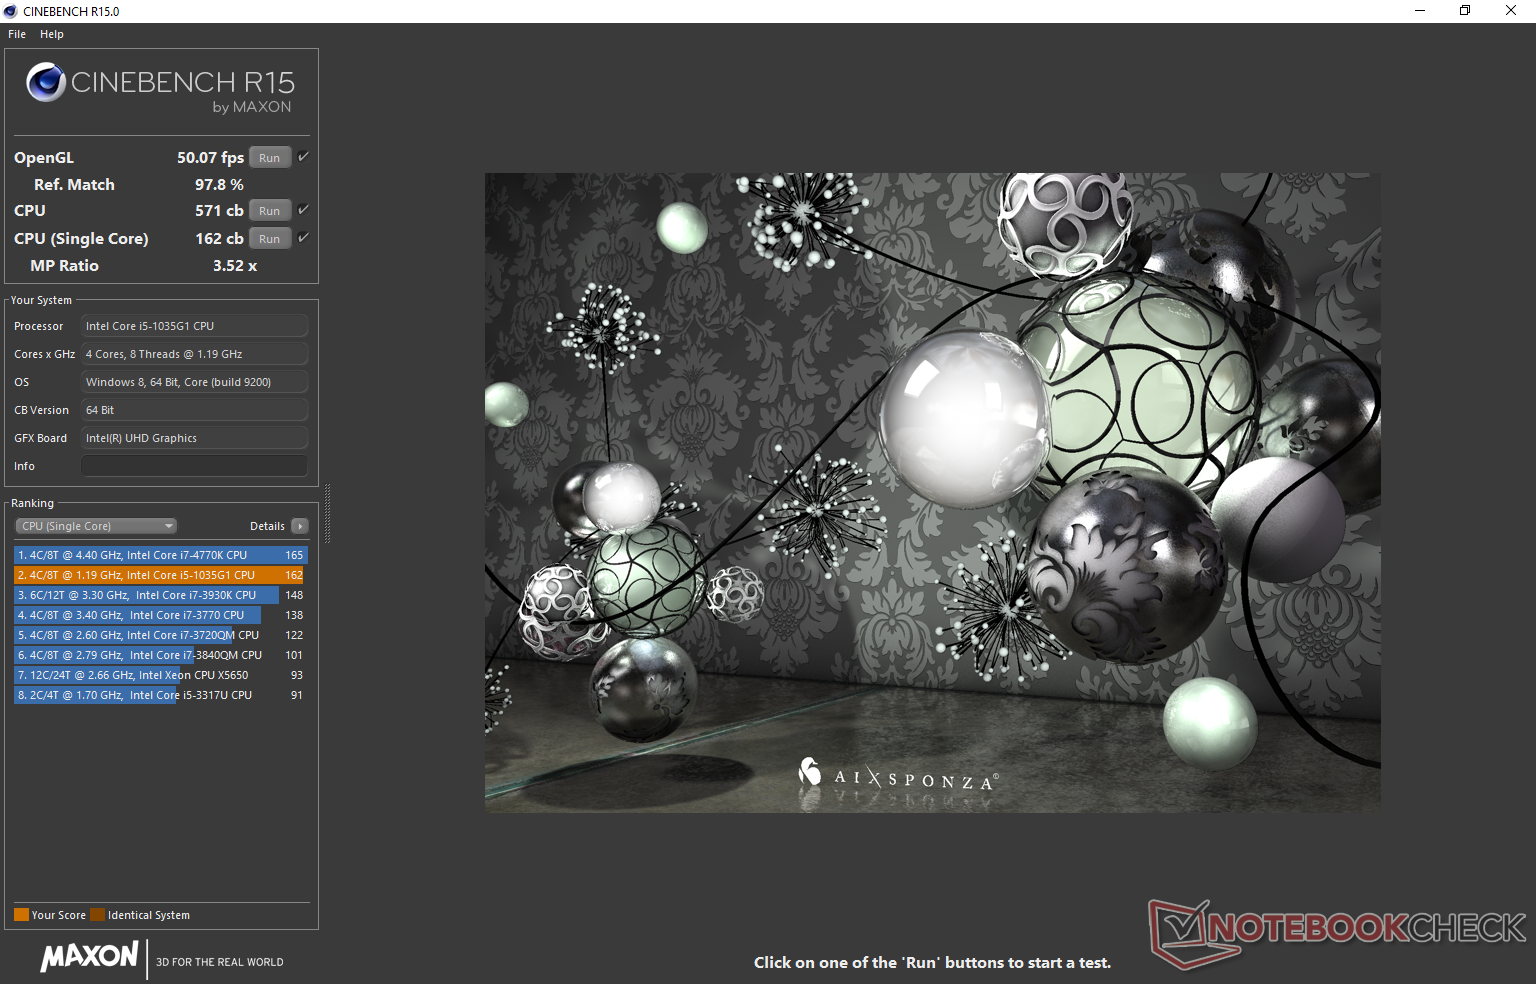
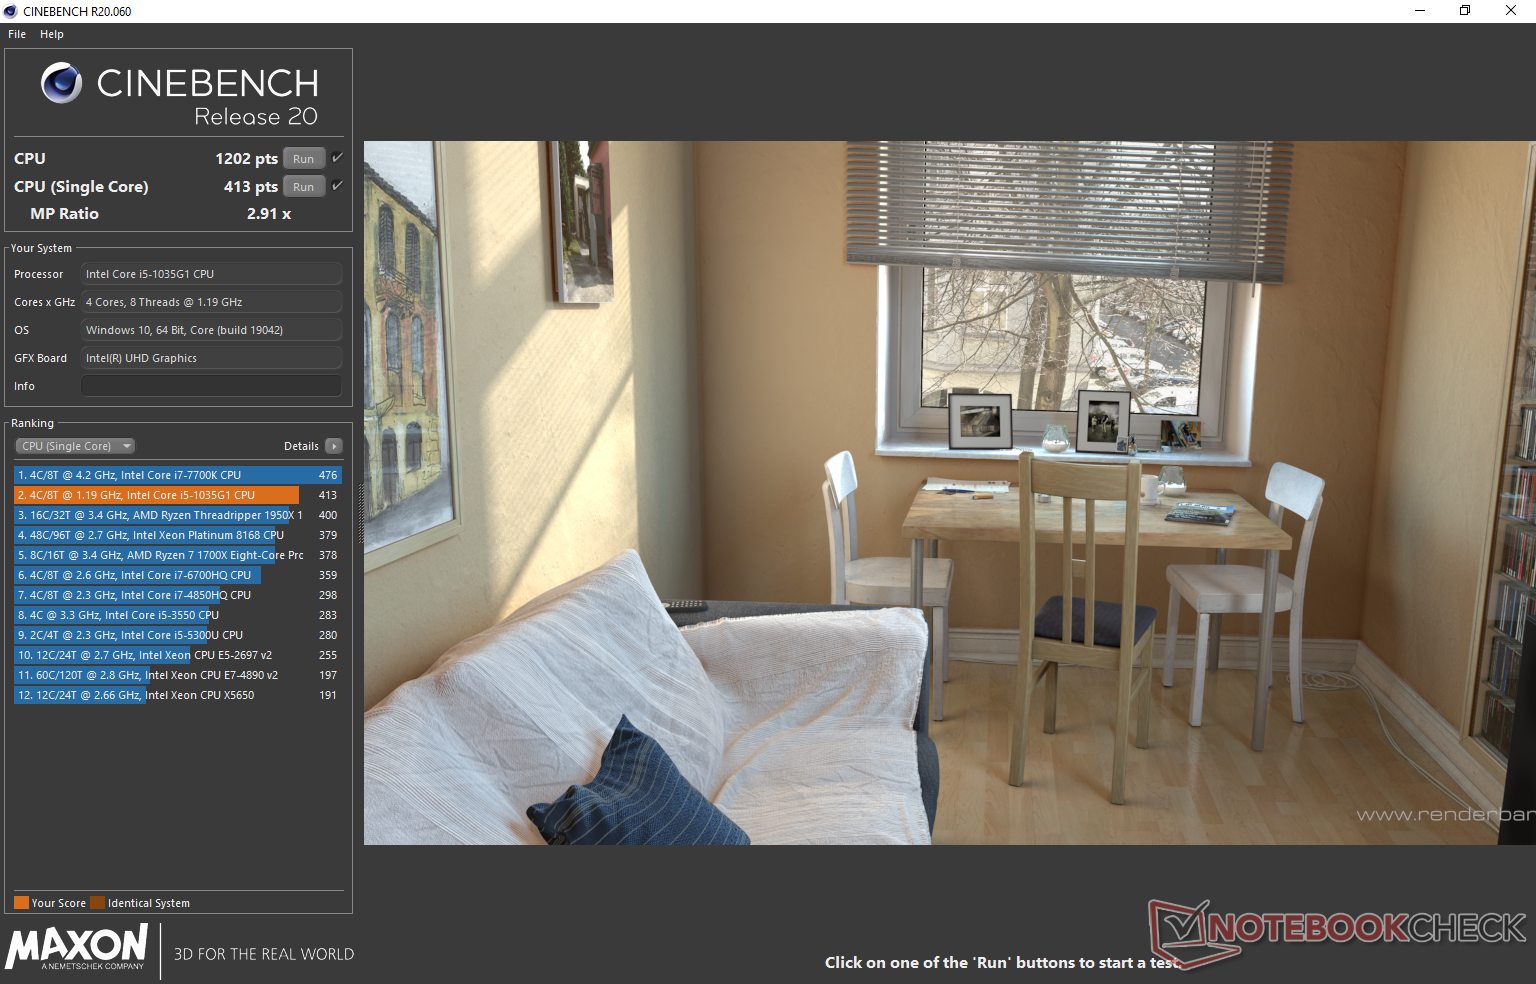
Multi-thread performance is about 15 percent slower than the average laptop in our database equipped with the same Core i5-1035G1 CPU. The underperforming Turbo Boost is to blame here as illustrated by our CineBench R15 xT loop test results below where the initial score of 527 points would fall by almost 11 percent by the second loop. Even the cheaper AMD Ryzen 3 4300U is able to outperform or match the Core i5-1035G1 in our tested benchmarks. Overall performance is still pretty good relatively to Core i7 CPUs like the Core i7-10510U or older Core i7-8565U.
Cinebench R15: CPU Multi 64Bit | CPU Single 64Bit
Blender: v2.79 BMW27 CPU
7-Zip 18.03: 7z b 4 -mmt1 | 7z b 4
Geekbench 5.5: Single-Core | Multi-Core
HWBOT x265 Benchmark v2.2: 4k Preset
LibreOffice : 20 Documents To PDF
R Benchmark 2.5: Overall mean
Cinebench R15: CPU Multi 64Bit | CPU Single 64Bit
Blender: v2.79 BMW27 CPU
7-Zip 18.03: 7z b 4 -mmt1 | 7z b 4
Geekbench 5.5: Single-Core | Multi-Core
HWBOT x265 Benchmark v2.2: 4k Preset
LibreOffice : 20 Documents To PDF
R Benchmark 2.5: Overall mean
* ... smaller is better
System Performance
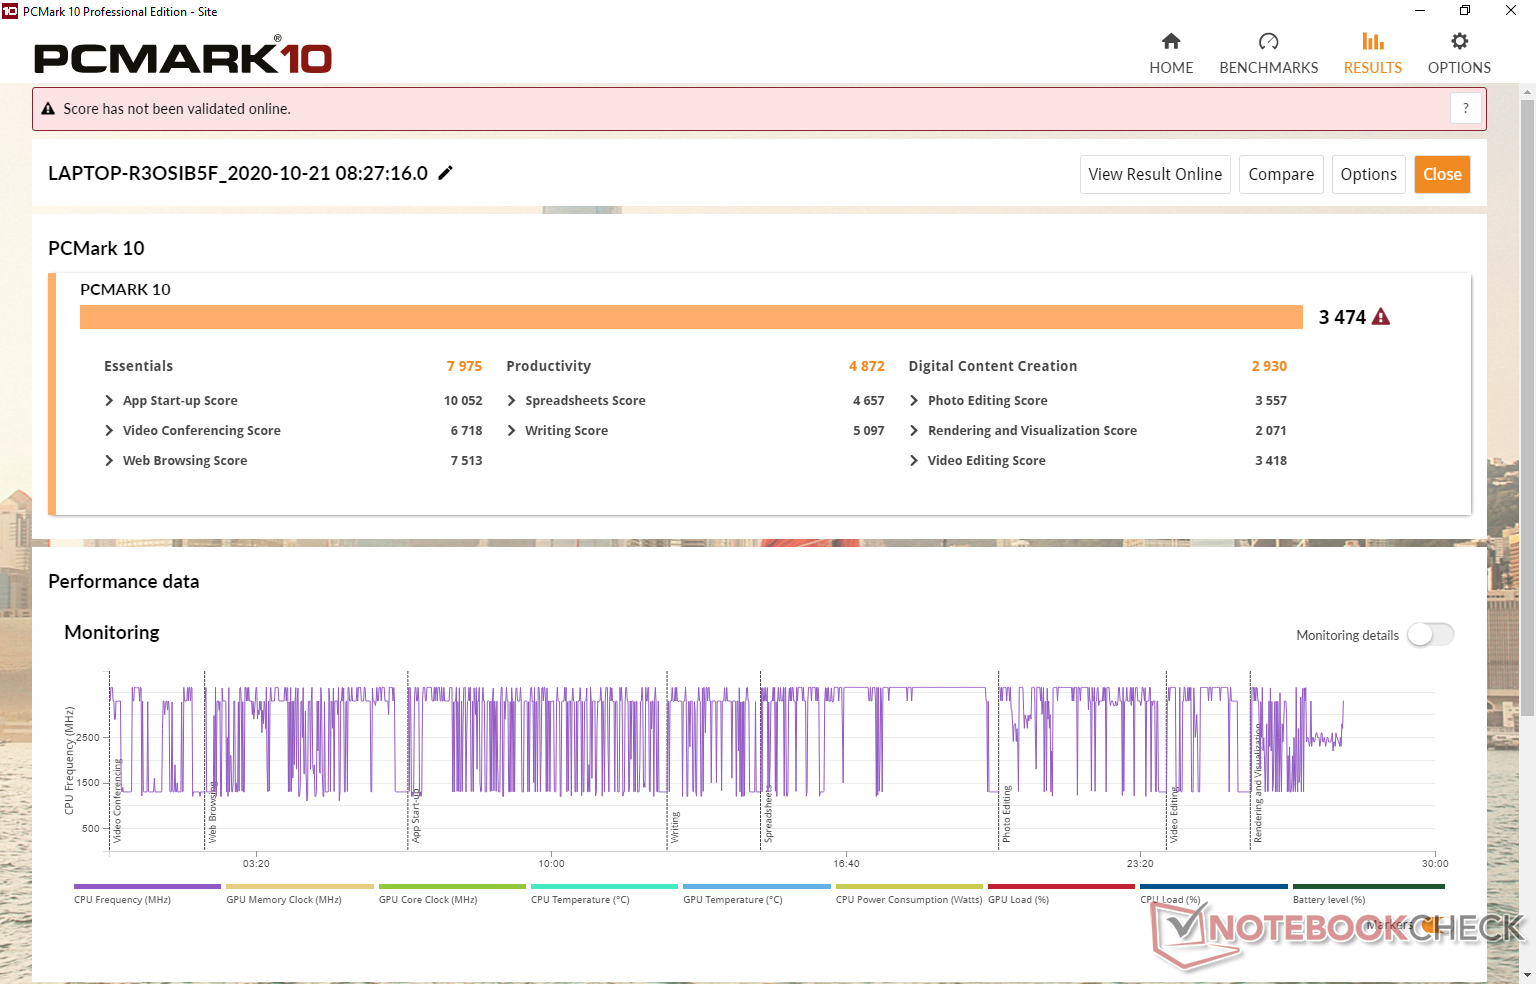
PCMark results are consistently slower than the average laptop in our database equipped with the same Core i5-1035G1 CPU. We suspect that both the slower-than-average CPU and slow NVMe SSD are major contributing factors to the low PCMark numbers.
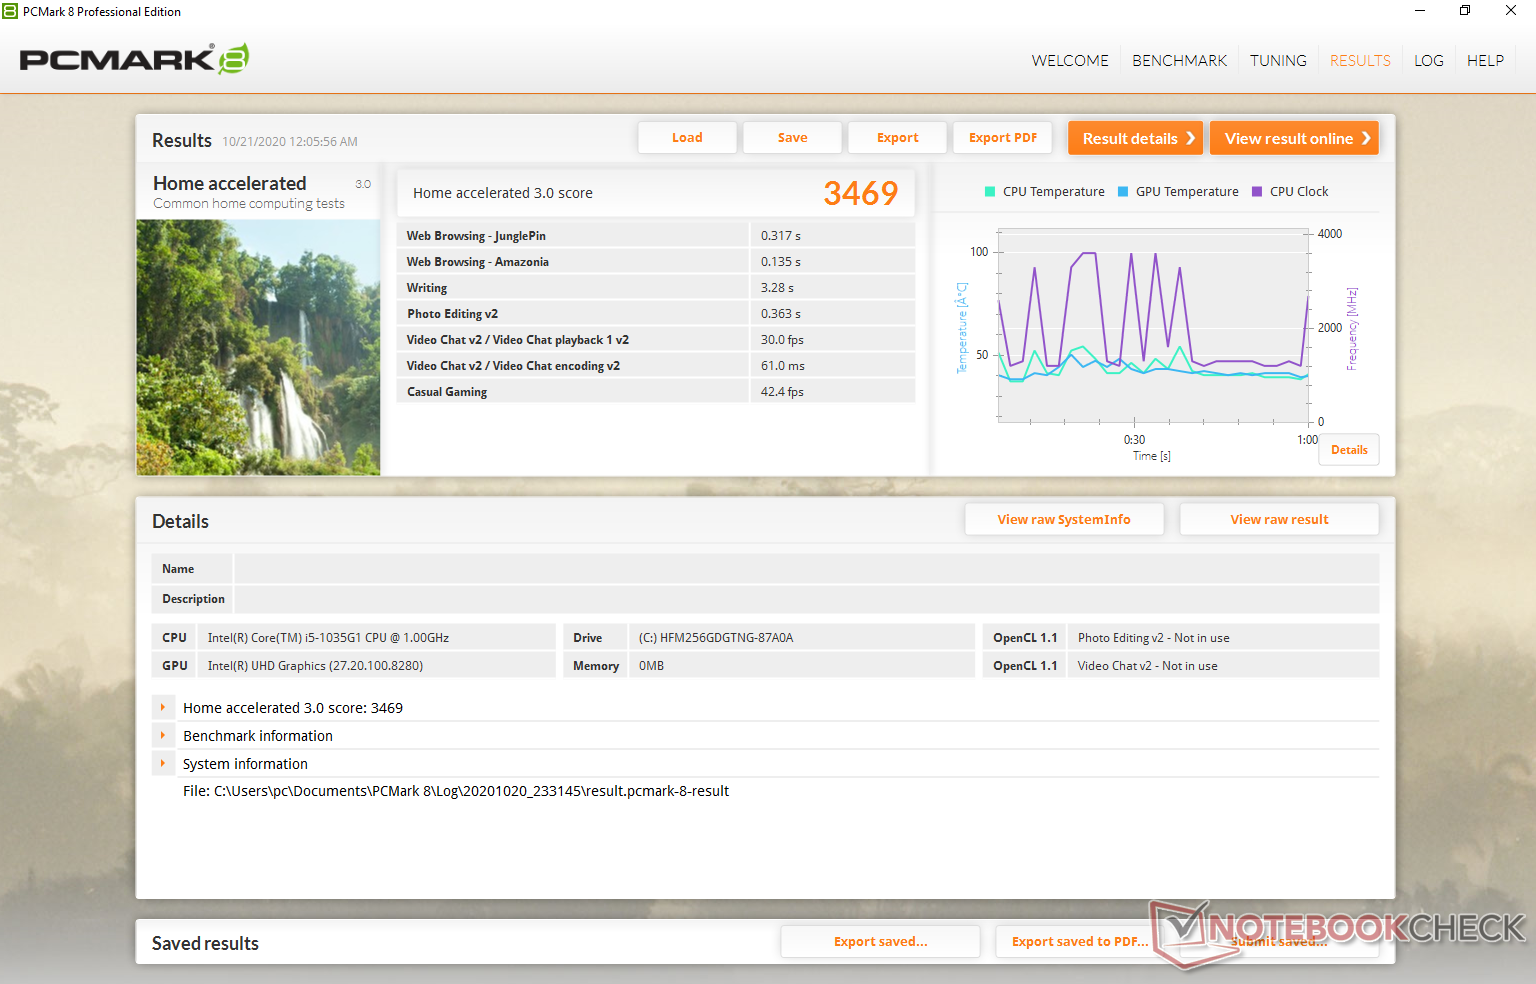

| PCMark 8 Home Score Accelerated v2 | 3469 points | |
| PCMark 8 Work Score Accelerated v2 | 2647 points | |
| PCMark 10 Score | 3474 points | |
Help | ||
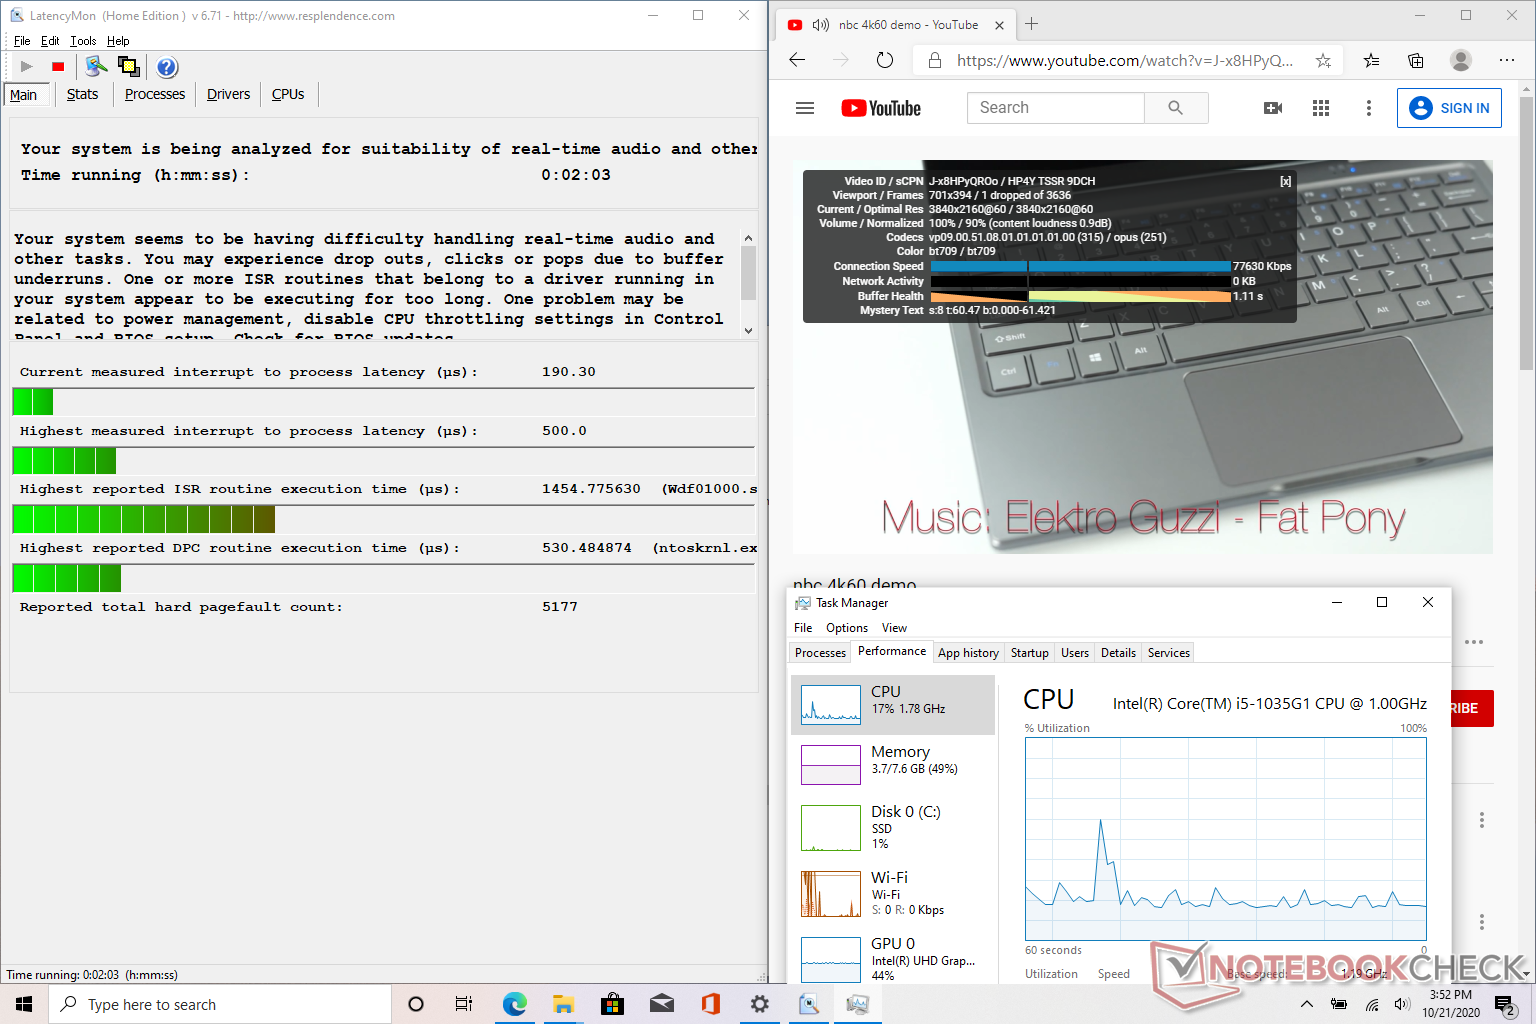
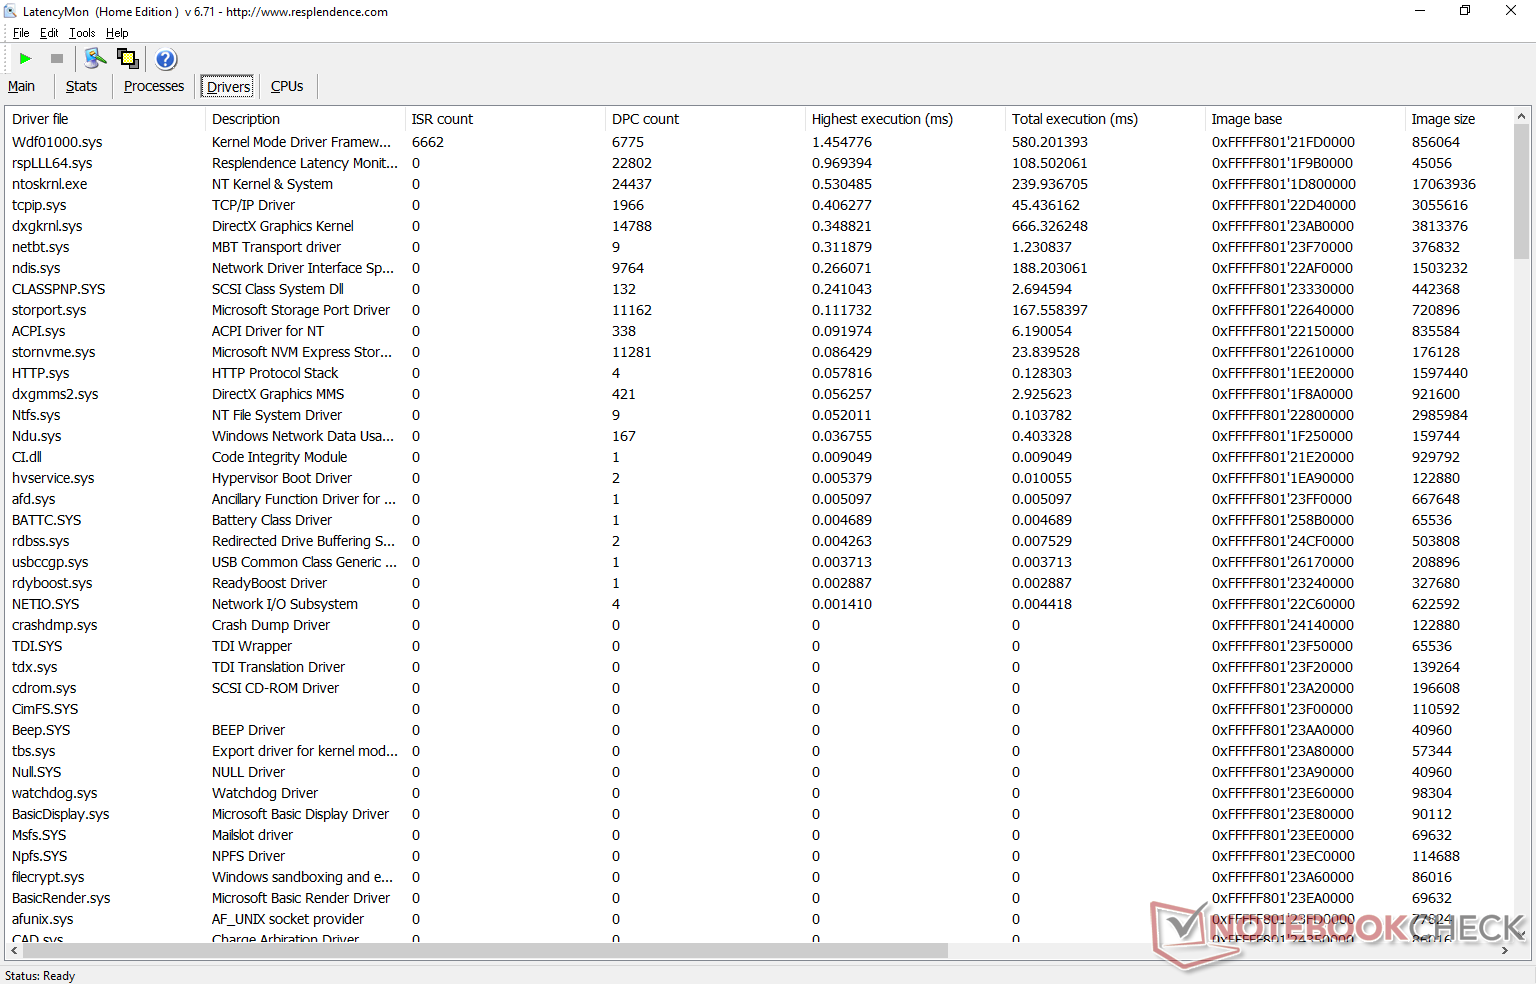
DPC Latency
LatencyMon shows minor DPC latency issues when opening multiple tabs on our homepage. 4KUHD video playback at 60 FPS is otherwise smooth on YouTube with just one dropped frame during our minute-long test.
| DPC Latencies / LatencyMon - interrupt to process latency (max), Web, Youtube, Prime95 | |
| Asus Zenbook S UX393JA | |
| HP EliteBook 830 G7 | |
| Microsoft Surface Laptop Go Core i5 | |
* ... smaller is better
Storage Devices
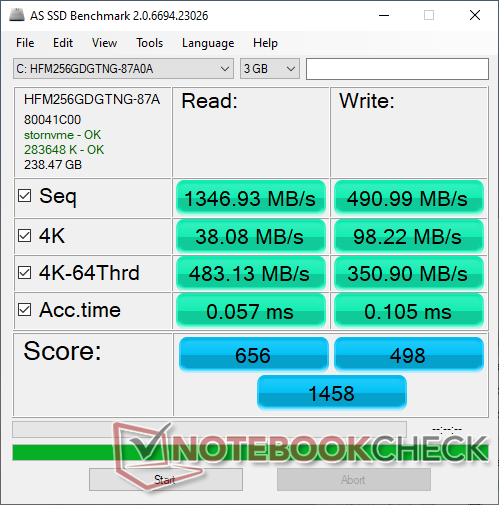
The Surface Laptop Go uses the same SK Hynix 256 GB NVMe SSD as found on the 13.5-inch Surface Laptop 3. While sequential read rates are decent, write rates are slow for its category at only about 500 MB/s. This thankfully won't be a bottleneck considering the Core i5 CPU and weak integrated GPU. See our table of SSDs and HDDs for more benchmark comparisons.
Note that SKUs with 64 GB of storage have soldered SSDs. Thus, users will need to upgrade to at least the 128 GB SKUs for removable M.2 SSDs.

| Microsoft Surface Laptop Go Core i5 SK hynix BC501 HFM256GDGTNG | Asus Zenbook S UX393JA Intel SSD 660p 1TB SSDPEKNW010T8 | Microsoft Surface Laptop 3 13 Core i5-1035G7 SK hynix BC501 HFM256GDGTNG | Huawei MateBook X Pro 2020 i7 Samsung PM981a MZVLB1T0HBLR | Apple MacBook Pro 13 2020 2GHz i5 10th-Gen Apple SSD SM0512F | |
|---|---|---|---|---|---|
| AS SSD | 73% | 4% | 182% | -15% | |
| Seq Read (MB/s) | 1347 | 1405 4% | 1387 3% | 2737 103% | 1300 -3% |
| Seq Write (MB/s) | 491 | 1062 116% | 504 3% | 2530 415% | 1518 209% |
| 4K Read (MB/s) | 38.08 | 50.8 33% | 42.35 11% | 54 42% | 14.09 -63% |
| 4K Write (MB/s) | 98.2 | 124.9 27% | 120 22% | 152.5 55% | 24.25 -75% |
| 4K-64 Read (MB/s) | 483.1 | 590 22% | 497.4 3% | 2011 316% | 725 50% |
| 4K-64 Write (MB/s) | 350.9 | 840 139% | 354.9 1% | 1260 259% | 169.6 -52% |
| Access Time Read * (ms) | 0.057 | 0.041 28% | 0.055 4% | 0.066 -16% | 0.172 -202% |
| Access Time Write * (ms) | 0.105 | 0.118 -12% | 0.093 11% | 0.024 77% | 0.155 -48% |
| Score Read (Points) | 656 | 781 19% | 678 3% | 2339 257% | 869 32% |
| Score Write (Points) | 498 | 1071 115% | 525 5% | 1666 235% | 346 -31% |
| Score Total (Points) | 1458 | 2251 54% | 1520 4% | 5191 256% | 1667 14% |
| Copy ISO MB/s (MB/s) | 765 | 1459 91% | 764 0% | ||
| Copy Program MB/s (MB/s) | 299.6 | 600 100% | 256.1 -15% | ||
| Copy Game MB/s (MB/s) | 371.5 | 1411 280% | 368.4 -1% | ||
| CrystalDiskMark 5.2 / 6 | 53% | 14% | 113% | 29% | |
| Write 4K (MB/s) | 87.6 | 129.5 48% | 112.3 28% | 165.6 89% | 28.16 -68% |
| Read 4K (MB/s) | 40.41 | 54 34% | 42.13 4% | 50.2 24% | 17.5 -57% |
| Write Seq (MB/s) | 601 | 1265 110% | 630 5% | 1905 217% | 1195 99% |
| Read Seq (MB/s) | 1033 | 1410 36% | 1023 -1% | 1669 62% | 1470 42% |
| Write 4K Q32T1 (MB/s) | 269.1 | 420.3 56% | 336.6 25% | 474.6 76% | 205 -24% |
| Read 4K Q32T1 (MB/s) | 261.4 | 357.7 37% | 399.6 53% | 508 94% | 692 165% |
| Write Seq Q32T1 (MB/s) | 818 | 1799 120% | 821 0% | 3007 268% | 1475 80% |
| Read Seq Q32T1 (MB/s) | 2025 | 1616 -20% | 2030 0% | 3556 76% | 1920 -5% |
| Total Average (Program / Settings) | 63% /
65% | 9% /
8% | 148% /
153% | 7% /
3% |
* ... smaller is better

Disk Throttling: DiskSpd Read Loop, Queue Depth 8
GPU Performance
Graphics performance is disappointing. 3DMark ranks the UHD Graphics G1 as being essentially the same as the years-old UHD Graphics 620. If you want the most of Ice Lake, you're going to want to consider a laptop with the Core i5-1035G7 or Core i7-1065G7 instead, like the Surface Laptop 3 15, where graphics performance can be 80 to 90 percent faster. The Surface Laptop Go maxes out at only the Core i5-1035G1.
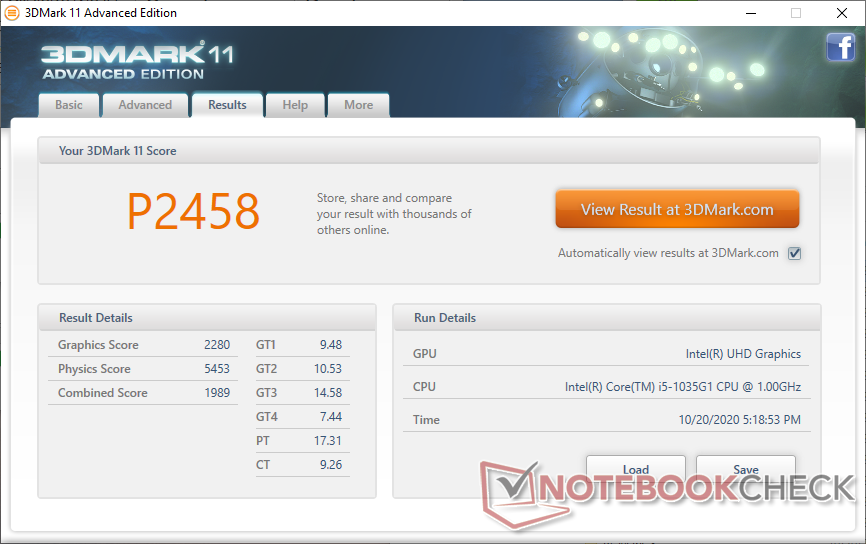
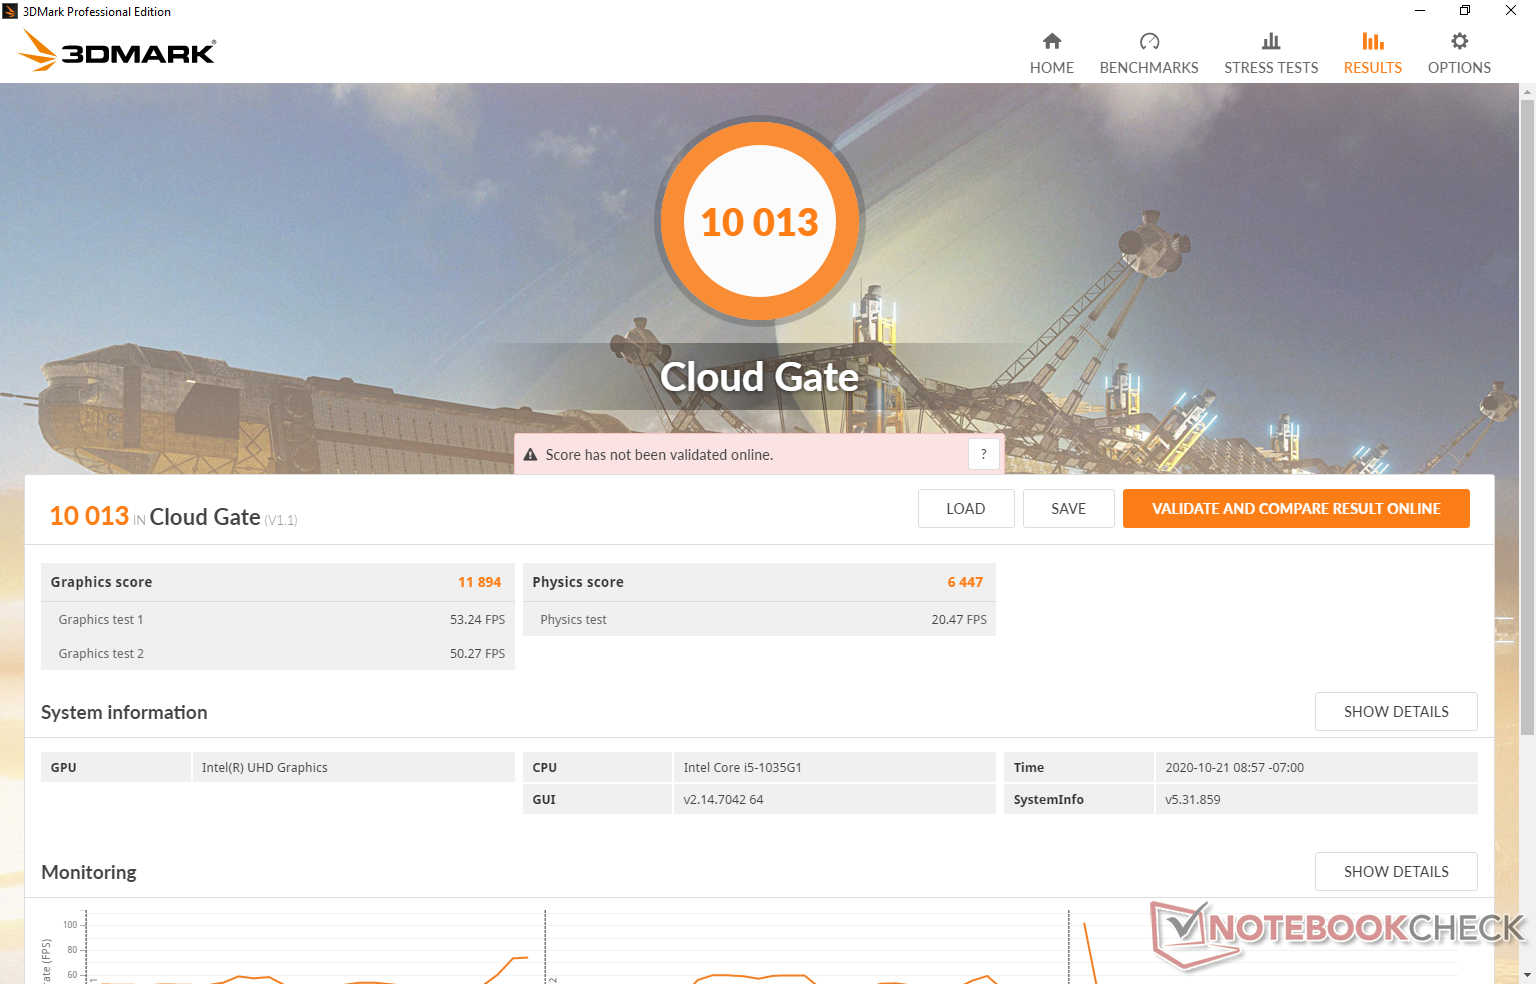
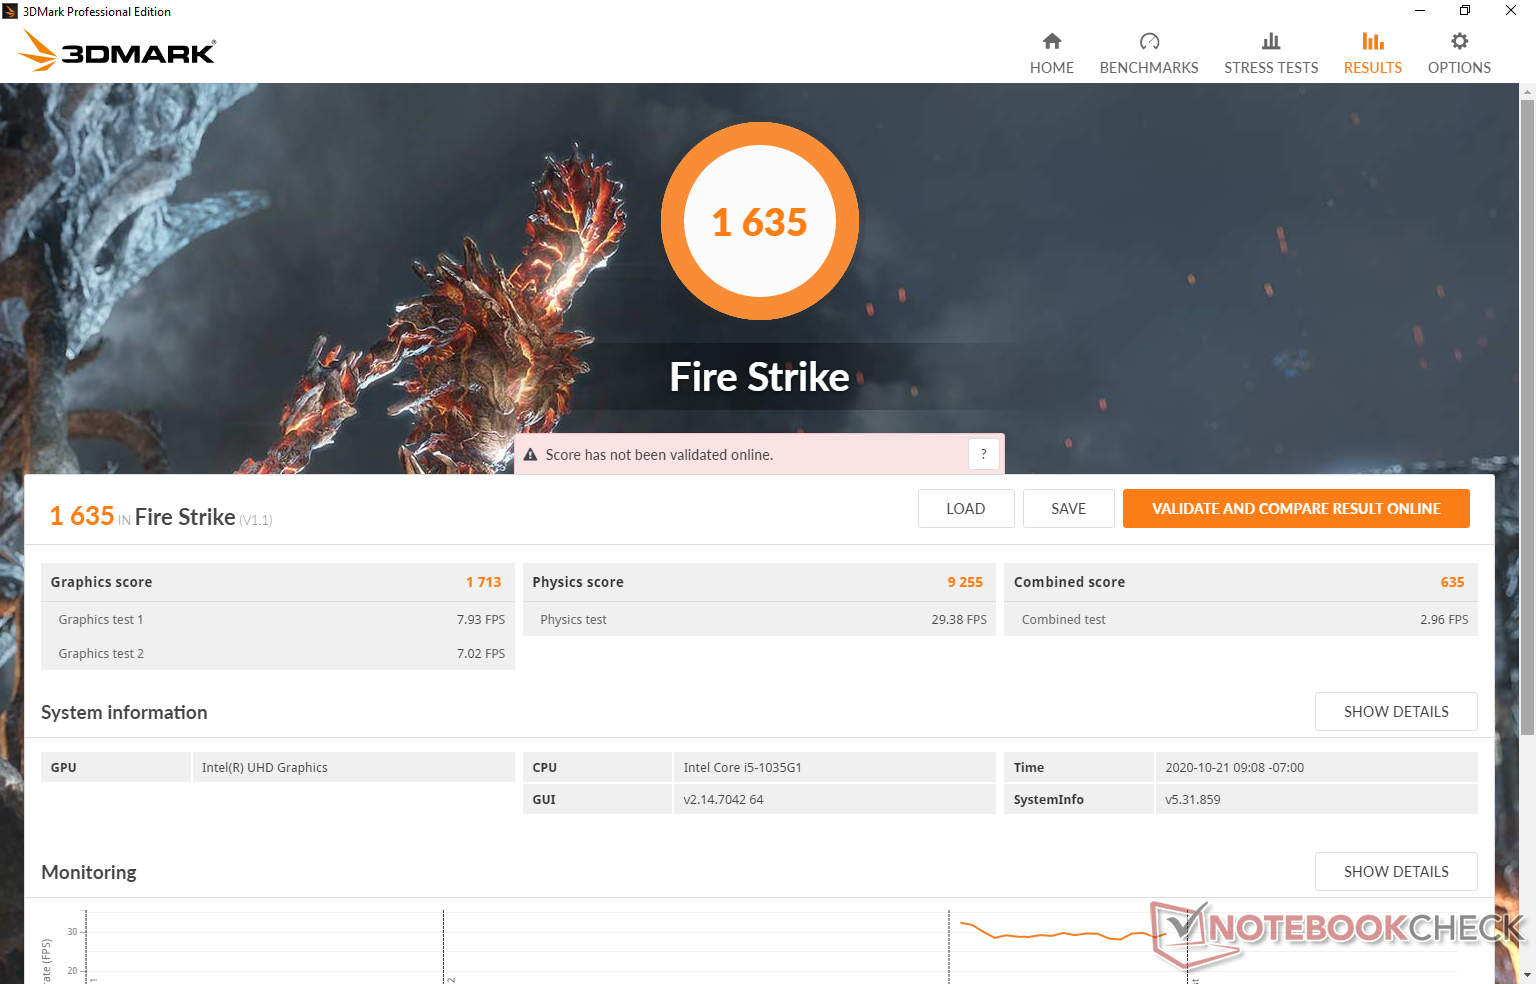
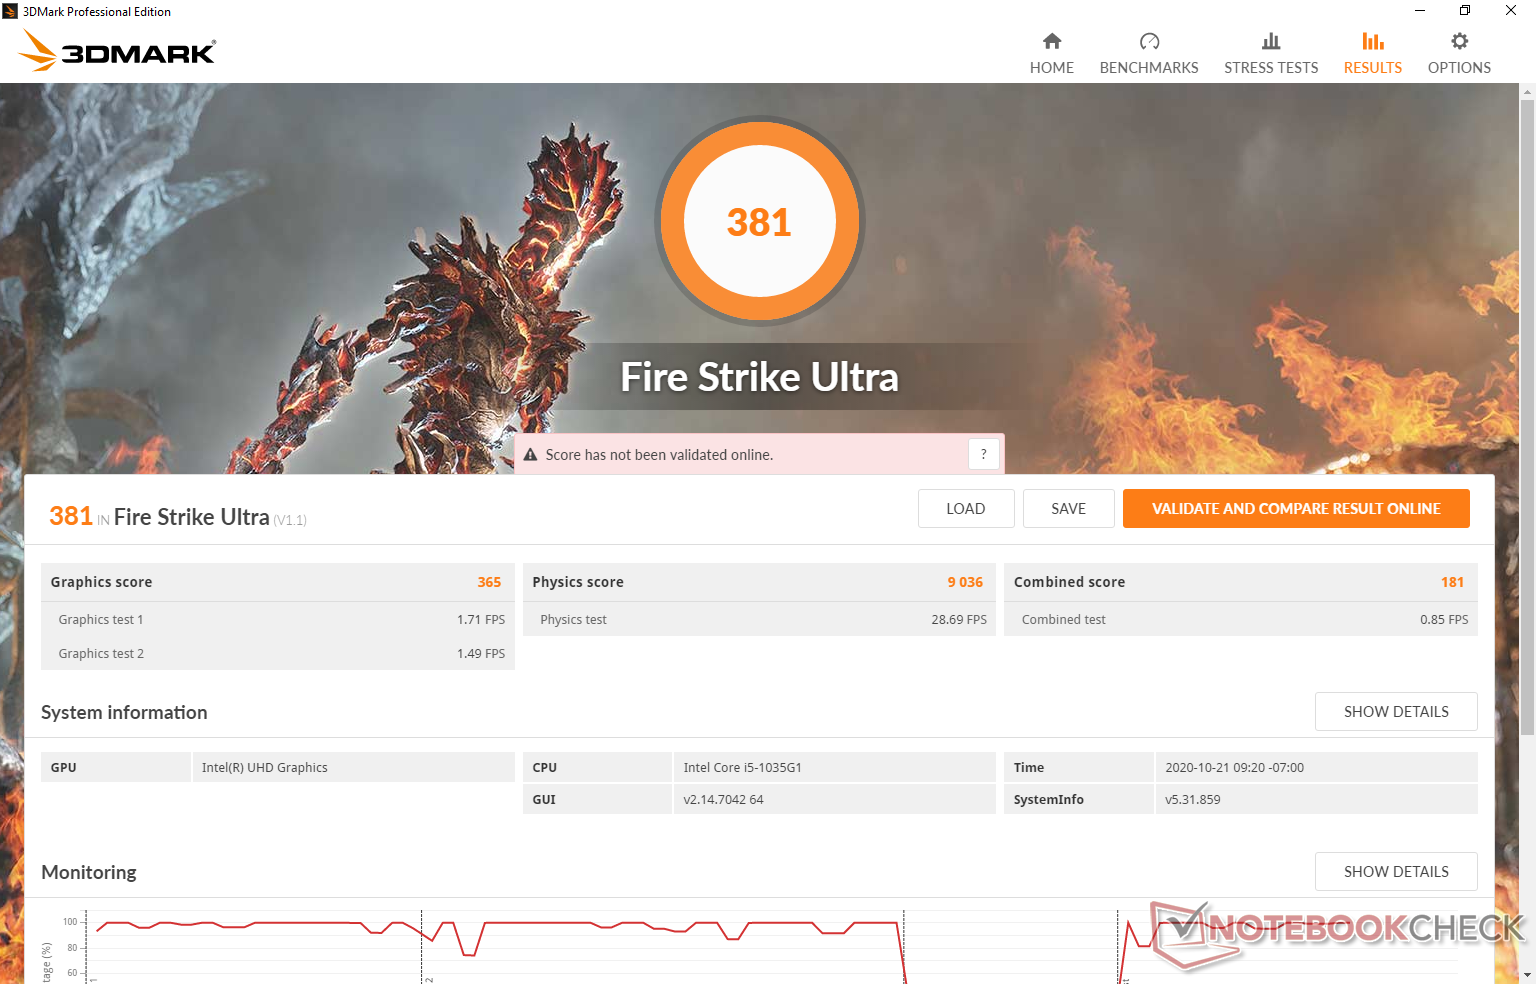
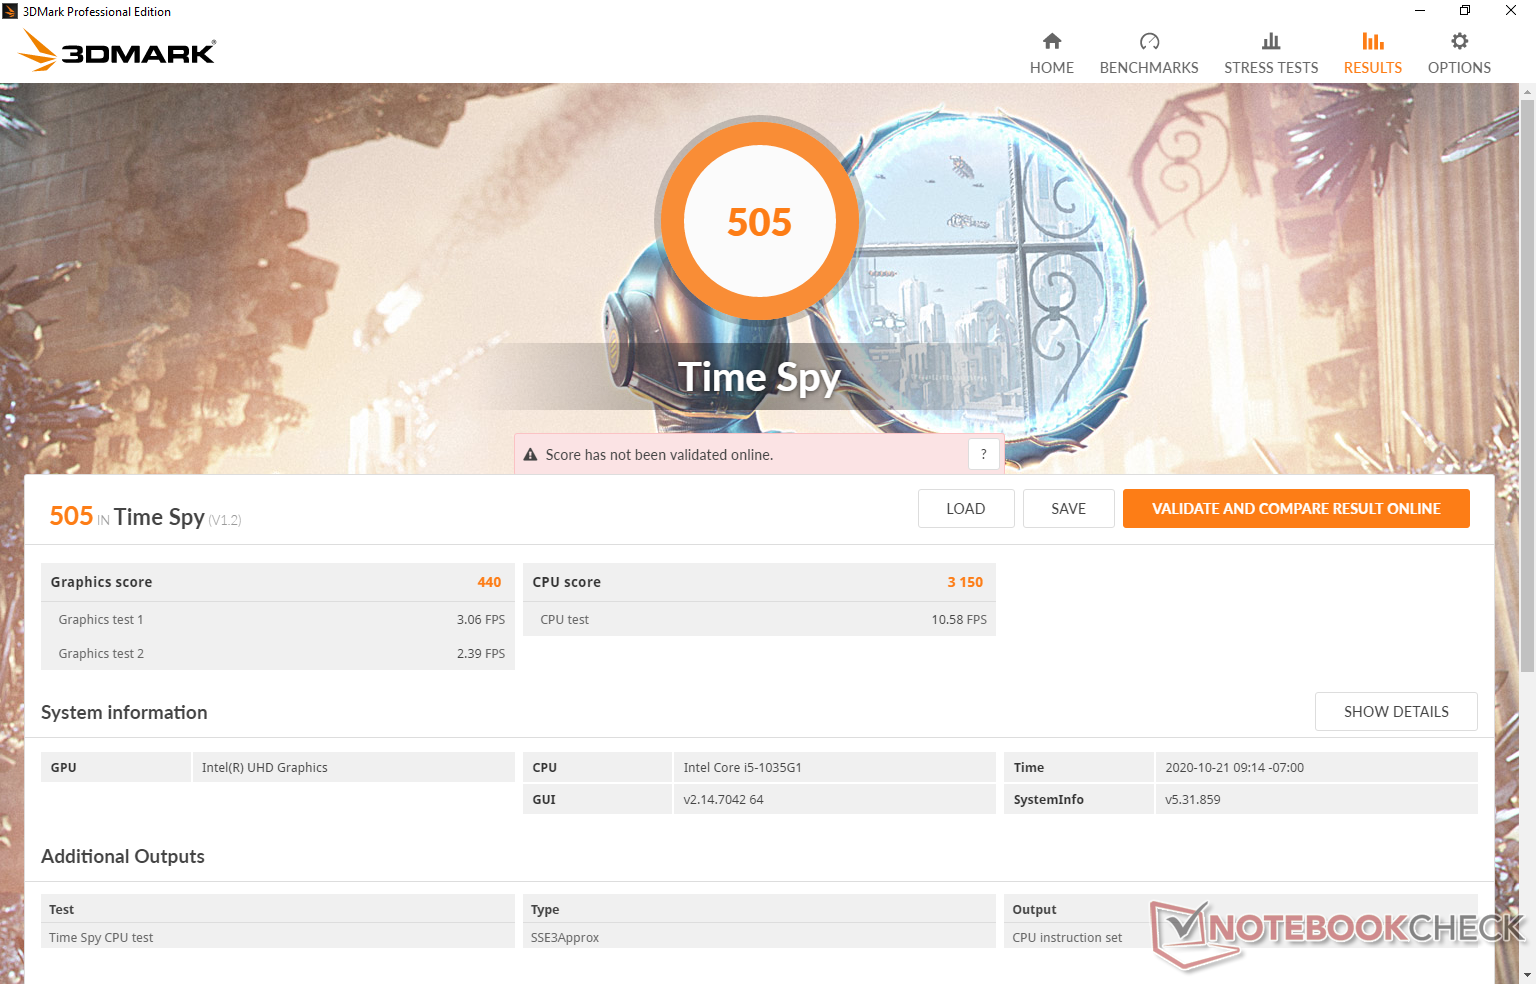
| 3DMark 11 Performance | 2458 points | |
| 3DMark Cloud Gate Standard Score | 10013 points | |
| 3DMark Fire Strike Score | 1635 points | |
| 3DMark Time Spy Score | 505 points | |
Help | ||
| low | med. | high | ultra | |
|---|---|---|---|---|
| Dota 2 Reborn (2015) | 78.1 | 40.1 | 23.5 | 21.4 |
| Final Fantasy XV Benchmark (2018) | 15.1 | 7.49 | 5.21 | |
| X-Plane 11.11 (2018) | 17.3 | 10.4 | 10.8 |
Emissions
System Noise
The internal fan is quiet for most typical workloads like web browsing or emailing. In fact, the system is able to remain silent during the first 90-second benchmark scene of 3DMark 06. Nonetheless, running intensive tasks where CPU utilization is constantly high will cause fan noise to increase up to 44 dB(A) to be slightly louder than we would like.
| Microsoft Surface Laptop Go Core i5 UHD Graphics G1 (Ice Lake 32 EU), i5-1035G1, SK hynix BC501 HFM256GDGTNG | Asus Zenbook S UX393JA Iris Plus Graphics G7 (Ice Lake 64 EU), i7-1065G7, Intel SSD 660p 1TB SSDPEKNW010T8 | Microsoft Surface Laptop 3 13 Core i5-1035G7 Iris Plus Graphics G7 (Ice Lake 64 EU), i5-1035G7, SK hynix BC501 HFM256GDGTNG | Huawei MateBook X Pro 2020 i7 GeForce MX250, i7-10510U, Samsung PM981a MZVLB1T0HBLR | Apple MacBook Pro 13 2020 2GHz i5 10th-Gen Iris Plus Graphics G7 (Ice Lake 64 EU), i5-1038NG7, Apple SSD SM0512F | |
|---|---|---|---|---|---|
| Noise | -3% | 0% | -7% | -6% | |
| off / environment * (dB) | 26.4 | 26.9 -2% | 28.5 -8% | 29.6 -12% | 29.6 -12% |
| Idle Minimum * (dB) | 26.4 | 26.9 -2% | 28.5 -8% | 29.6 -12% | 29.6 -12% |
| Idle Average * (dB) | 26.4 | 29 -10% | 28.5 -8% | 29.6 -12% | 29.6 -12% |
| Idle Maximum * (dB) | 26.4 | 31.1 -18% | 28.5 -8% | 30.3 -15% | 29.6 -12% |
| Load Average * (dB) | 36.9 | 37.7 -2% | 28.5 23% | 38 -3% | 34.4 7% |
| Load Maximum * (dB) | 44.2 | 38.1 14% | 40.4 9% | 38 14% | 42.1 5% |
| Witcher 3 ultra * (dB) | 40.2 | 40.4 | 38 | 36.1 |
* ... smaller is better
Noise level
| Idle |
| 26.4 / 26.4 / 26.4 dB(A) |
| Load |
| 36.9 / 44.2 dB(A) |
 | ||
30 dB silent 40 dB(A) audible 50 dB(A) loud |
||
min: | ||
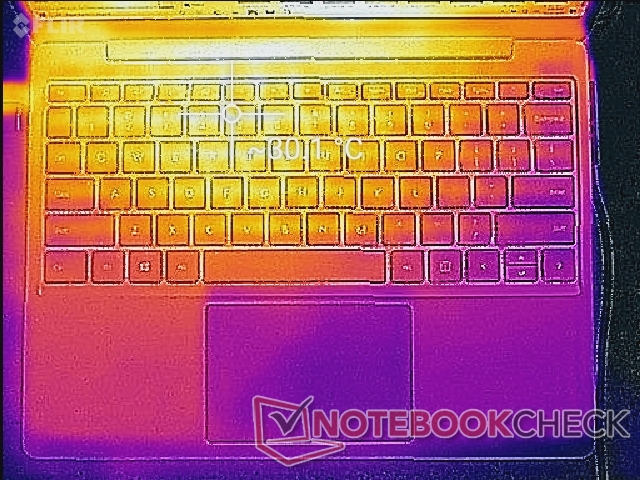
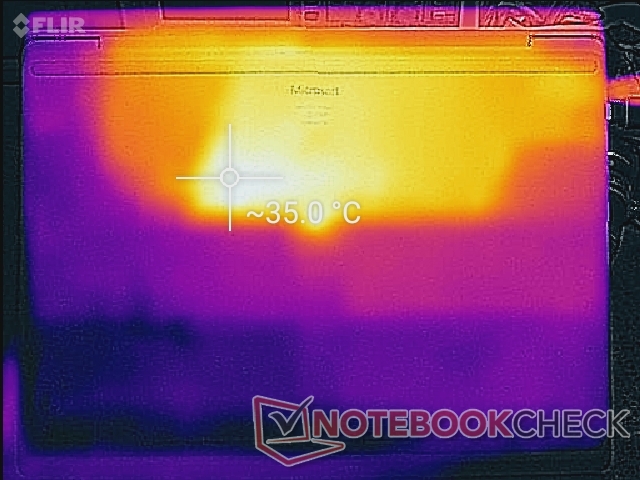
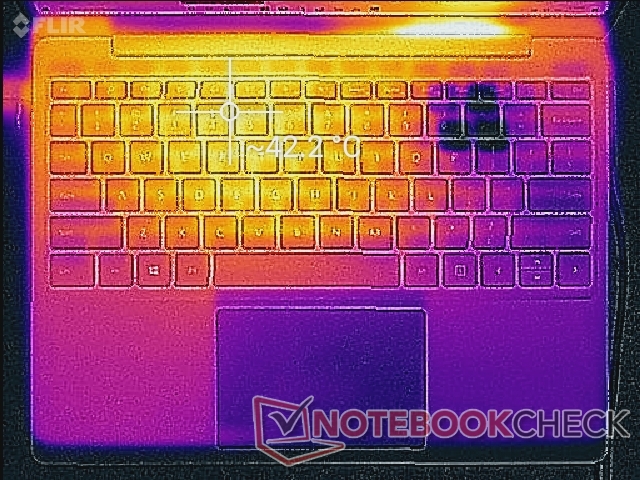
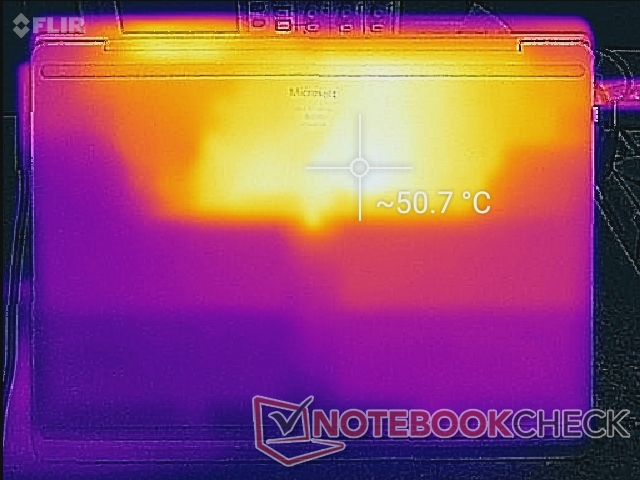
Temperature
Temperature development is similar to the 13.5-inch Surface Laptop 3 in the sense that the hot spots are generally in the same areas. The bottom surface, however, can actually be warmer on the Surface Laptop Go at over 50 C compared to 45 W on the on the 13.5-inch model when under similar stressful conditions. Additional ventilation grilles on the bottom panel would have probably improved surface temperatures, but Microsoft likely insisted on a "clean" minimalist design with no overt grilles.
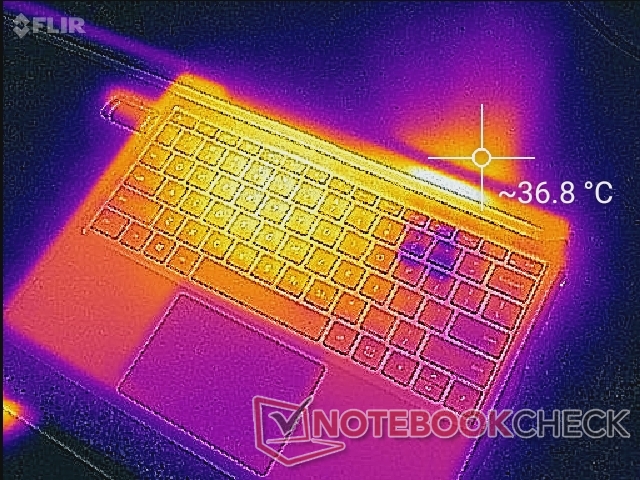
(±) The maximum temperature on the upper side is 42 °C / 108 F, compared to the average of 35.9 °C / 97 F, ranging from 21.4 to 59 °C for the class Subnotebook.
(-) The bottom heats up to a maximum of 51 °C / 124 F, compared to the average of 39.3 °C / 103 F
(+) In idle usage, the average temperature for the upper side is 27.3 °C / 81 F, compared to the device average of 30.8 °C / 87 F.
(+) The palmrests and touchpad are reaching skin temperature as a maximum (32 °C / 89.6 F) and are therefore not hot.
(-) The average temperature of the palmrest area of similar devices was 28.2 °C / 82.8 F (-3.8 °C / -6.8 F).
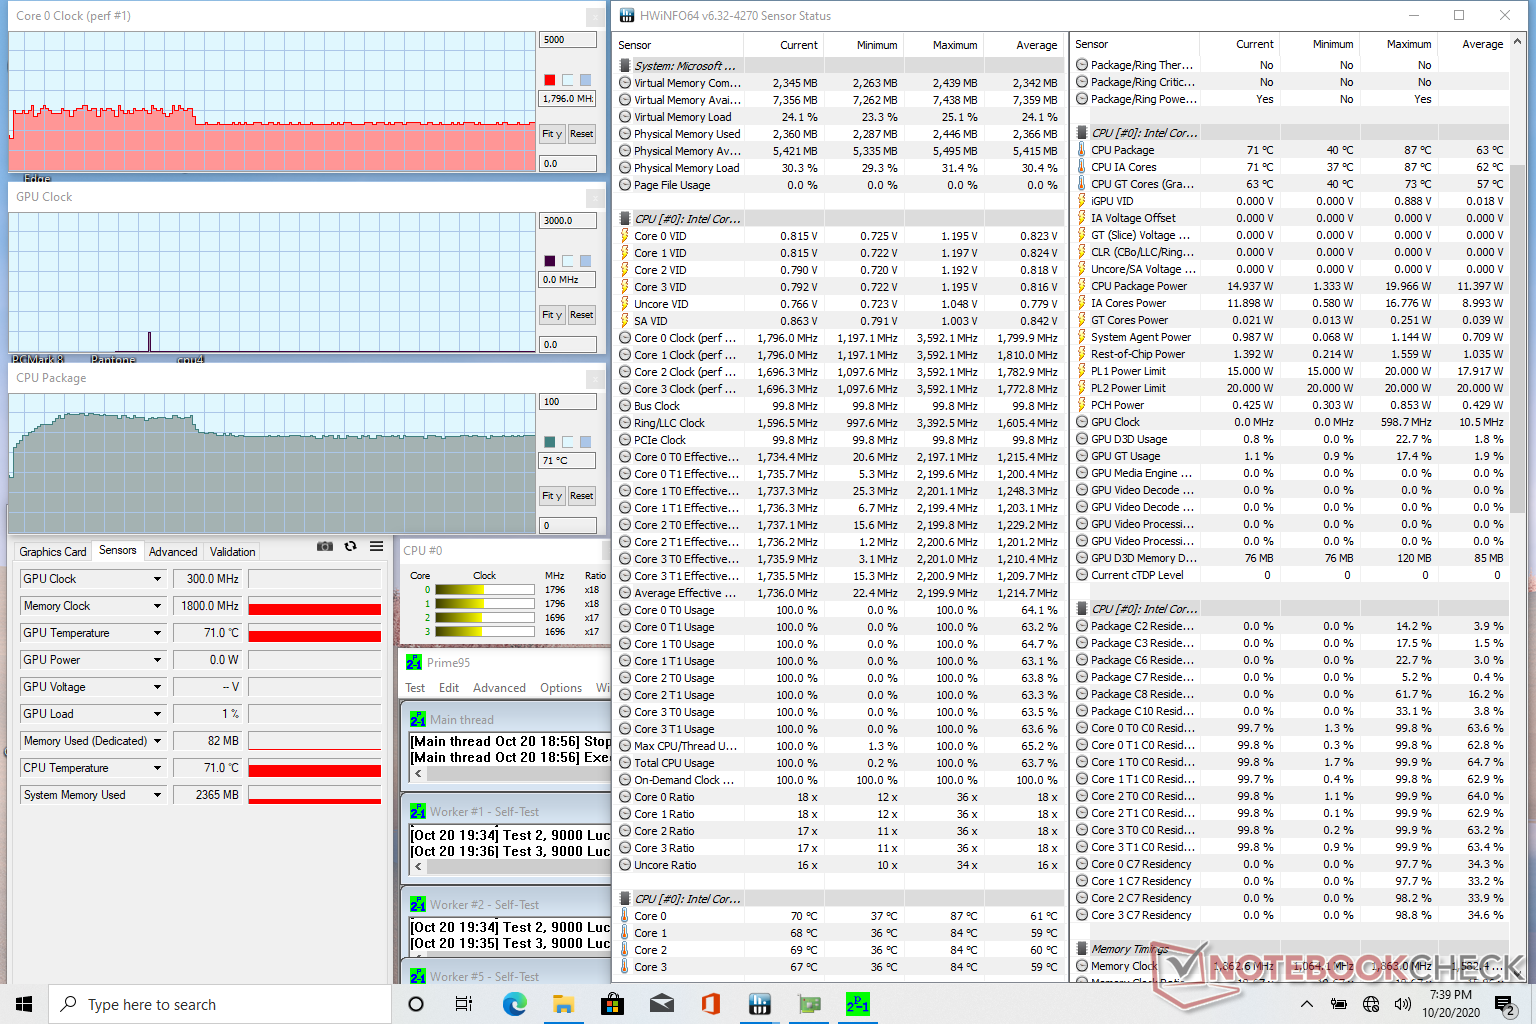
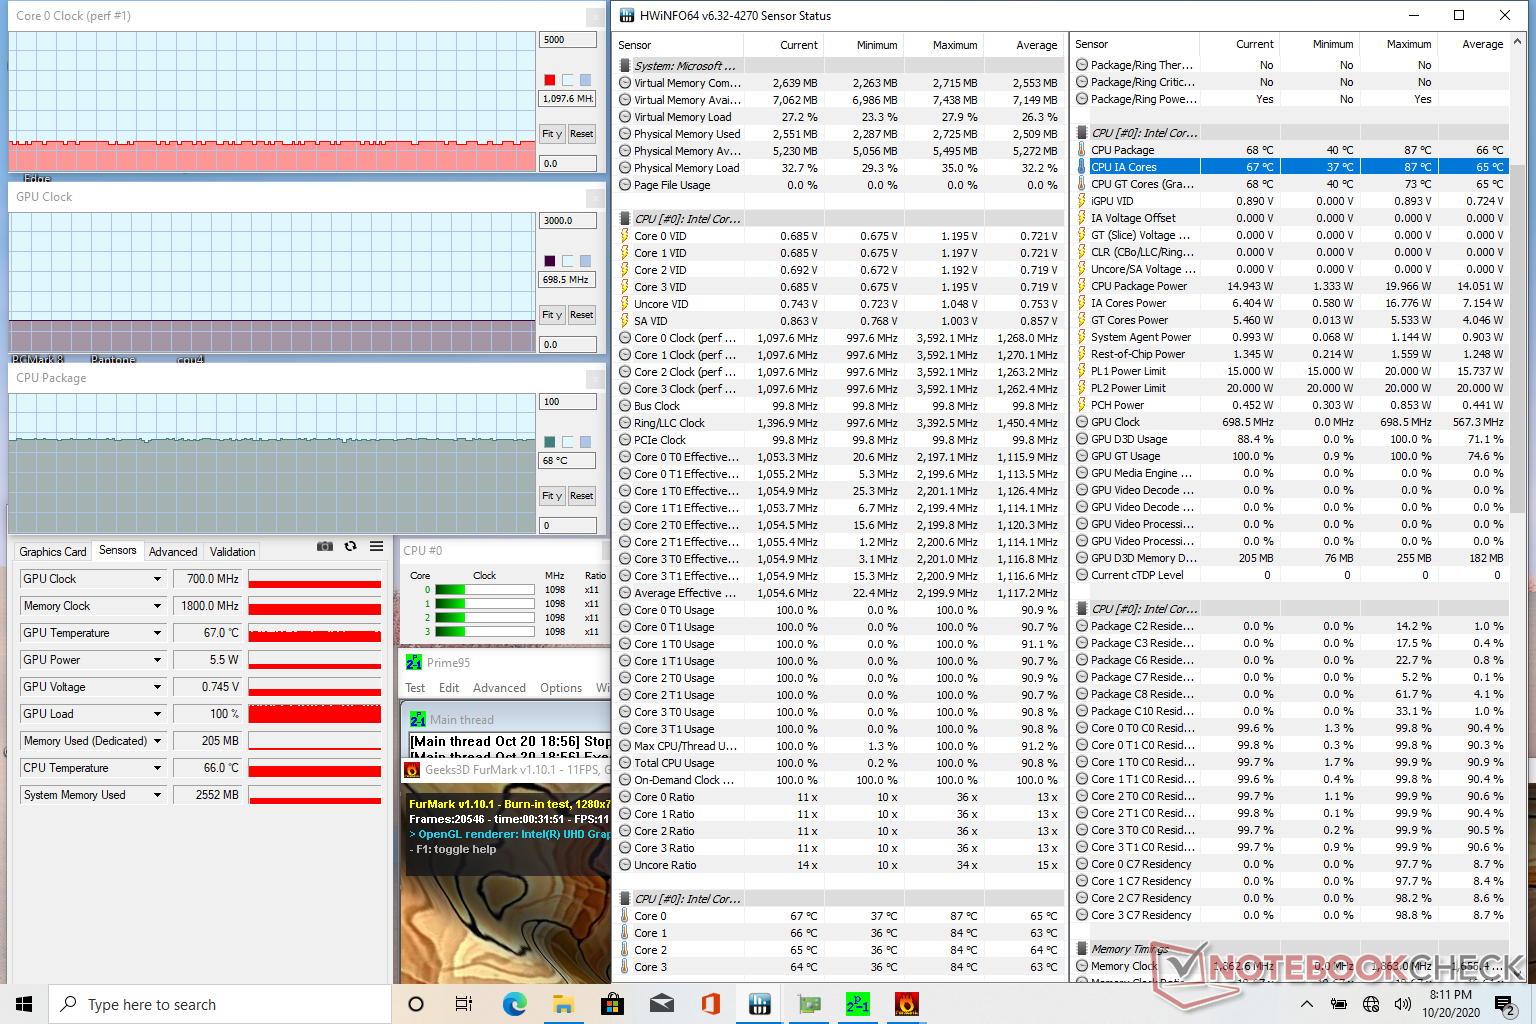
Stress Test
When running Prime95, the CPU would boost to the 2.0 to 2.4 GHz range for about 50 seconds until reaching a core temperature of 87 C. The internal fan reaches its maximum once the core hits 85 C. Nonetheless, clock rates quickly drop to the 1.7 to 1.8 GHz range thereafter in order to maintain a more acceptable core temperature of 71 C.
Running on battery power will not impact performance. A 3DMark 11 test on batteries would return Physics and Graphics scores of 7156 and 2411 points, respectively, compared to 5453 and 2280 points when on mains.
| CPU Clock (GHz) | GPU Clock (MHz) | Average CPU Temperature (°C) | |
| System Idle | -- | -- | 41 |
| Prime95 Stress | 1.7 - 1.8 | -- | 71 |
| Prime95 + FurMark Stress | 0.9 - 1.1 | 700 | 68 |
Speakers

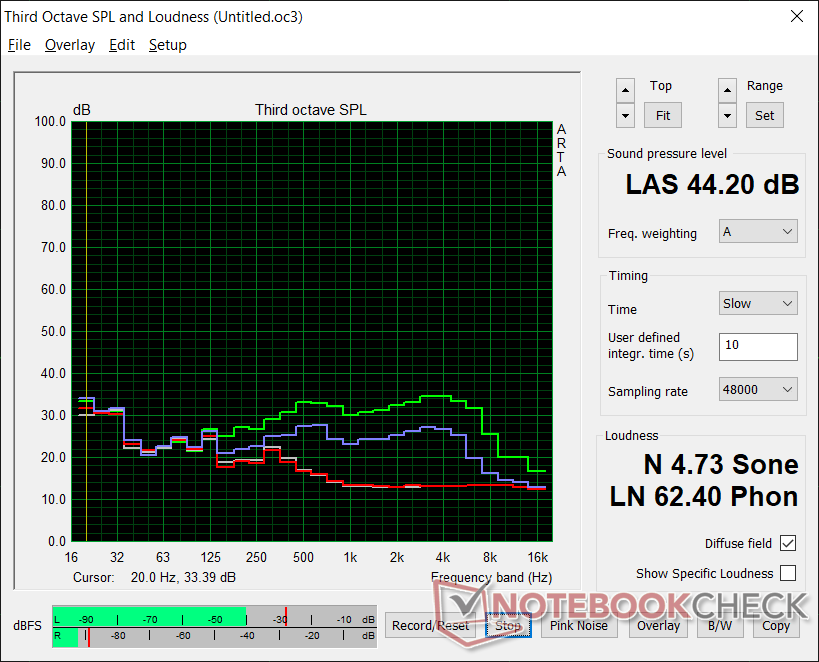
Microsoft Surface Laptop Go Core i5 audio analysis
(±) | speaker loudness is average but good (81.5 dB)
Bass 100 - 315 Hz
(±) | reduced bass - on average 14.6% lower than median
(±) | linearity of bass is average (8.1% delta to prev. frequency)
Mids 400 - 2000 Hz
(+) | balanced mids - only 4.4% away from median
(+) | mids are linear (4.1% delta to prev. frequency)
Highs 2 - 16 kHz
(+) | balanced highs - only 2.8% away from median
(+) | highs are linear (6.7% delta to prev. frequency)
Overall 100 - 16.000 Hz
(+) | overall sound is linear (13.6% difference to median)
Compared to same class
» 23% of all tested devices in this class were better, 6% similar, 72% worse
» The best had a delta of 5%, average was 18%, worst was 53%
Compared to all devices tested
» 14% of all tested devices were better, 4% similar, 82% worse
» The best had a delta of 4%, average was 24%, worst was 134%
Apple MacBook 12 (Early 2016) 1.1 GHz audio analysis
(+) | speakers can play relatively loud (83.6 dB)
Bass 100 - 315 Hz
(±) | reduced bass - on average 11.3% lower than median
(±) | linearity of bass is average (14.2% delta to prev. frequency)
Mids 400 - 2000 Hz
(+) | balanced mids - only 2.4% away from median
(+) | mids are linear (5.5% delta to prev. frequency)
Highs 2 - 16 kHz
(+) | balanced highs - only 2% away from median
(+) | highs are linear (4.5% delta to prev. frequency)
Overall 100 - 16.000 Hz
(+) | overall sound is linear (10.2% difference to median)
Compared to same class
» 7% of all tested devices in this class were better, 2% similar, 91% worse
» The best had a delta of 5%, average was 18%, worst was 53%
Compared to all devices tested
» 4% of all tested devices were better, 1% similar, 94% worse
» The best had a delta of 4%, average was 24%, worst was 134%
Energy Management
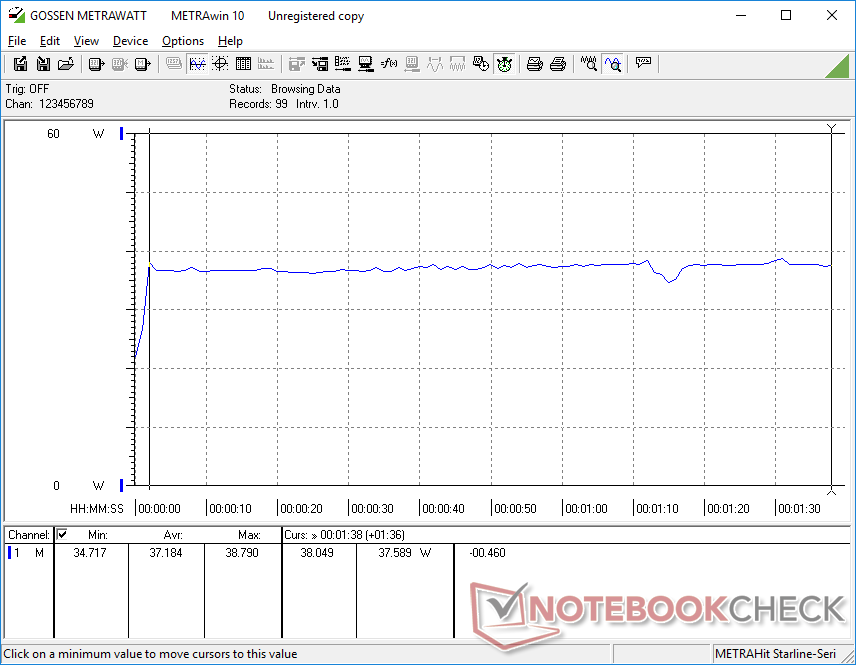
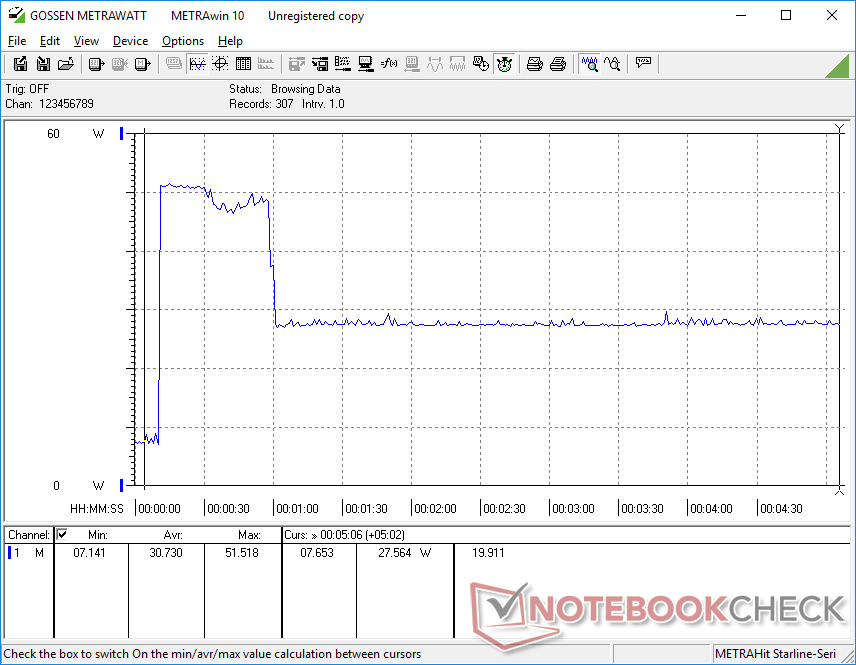
Power Consumption
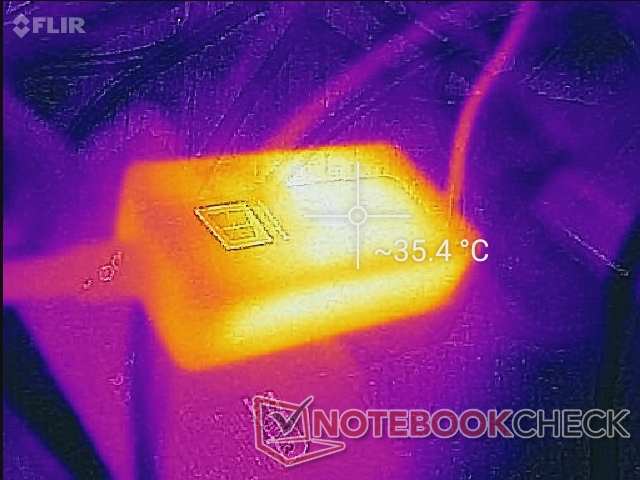
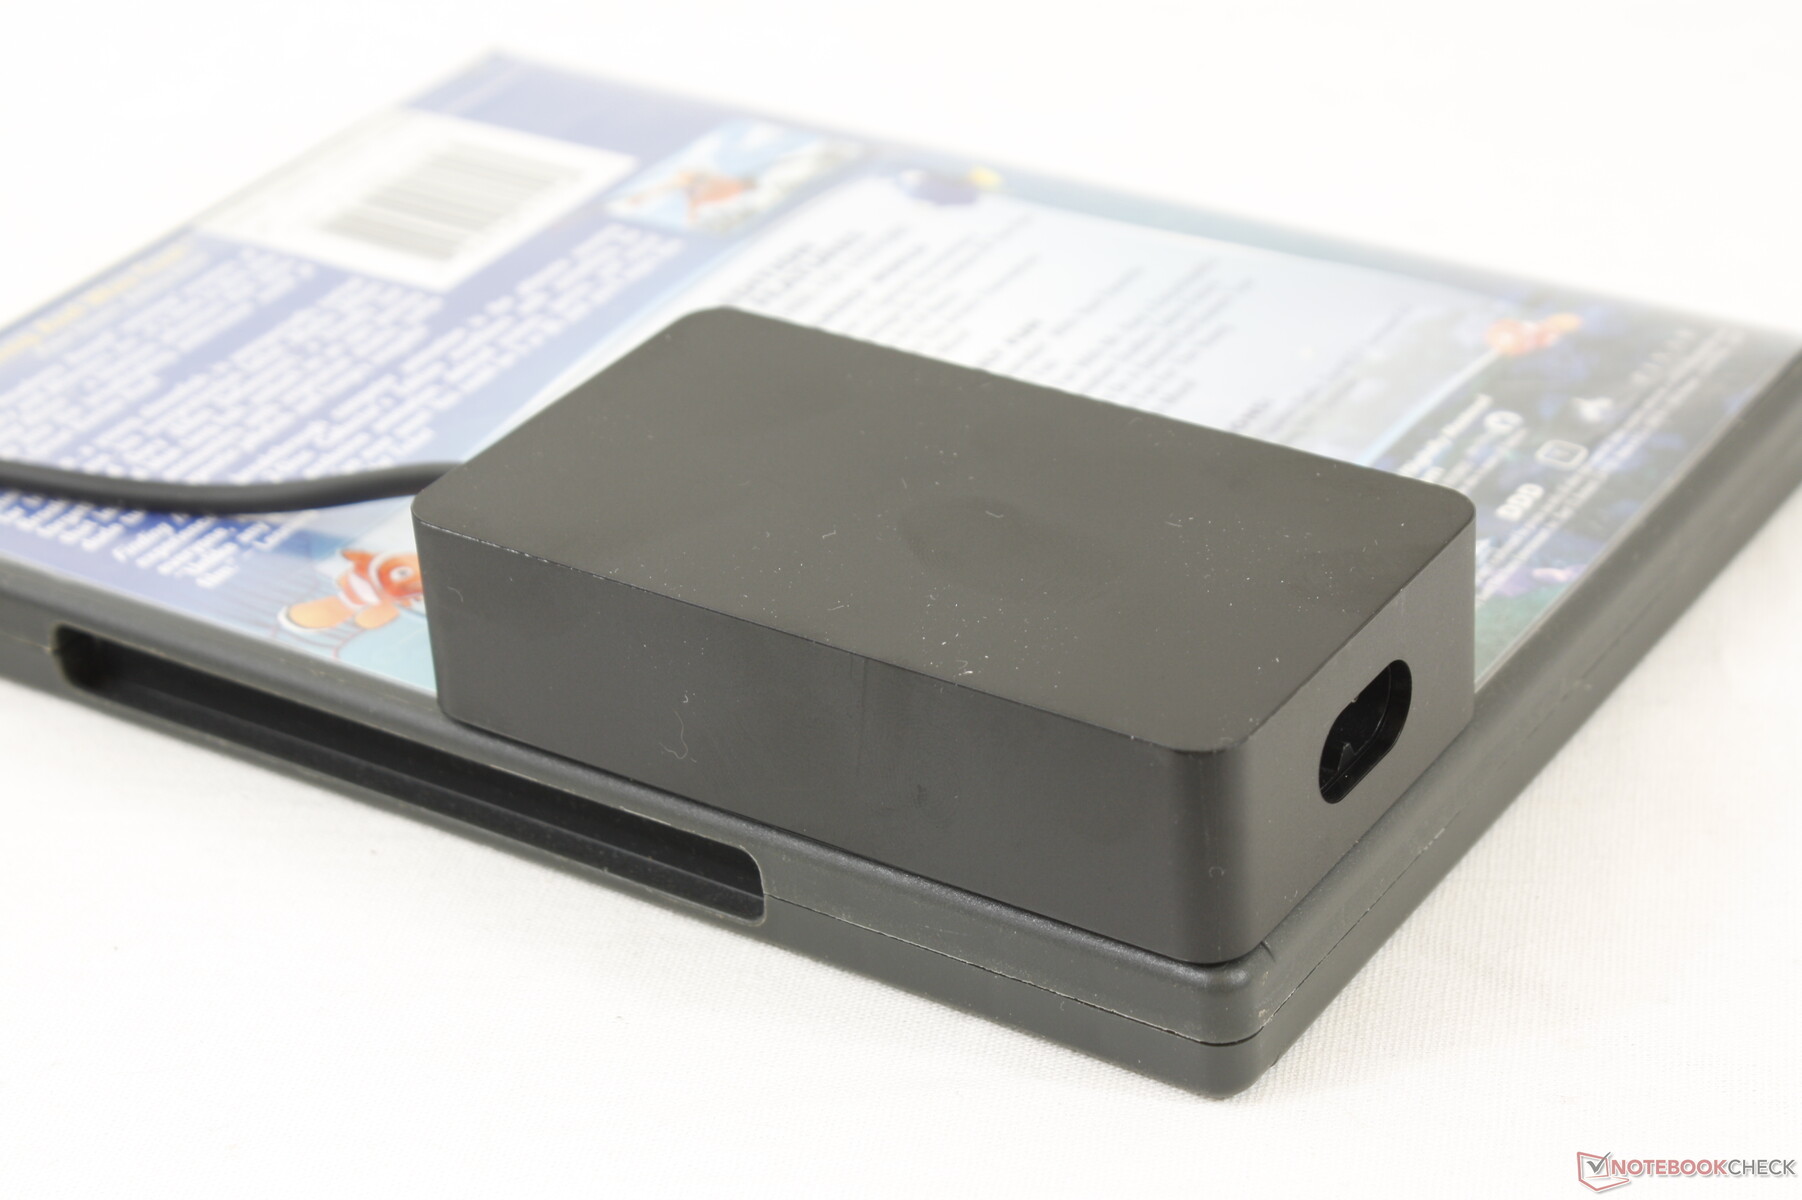
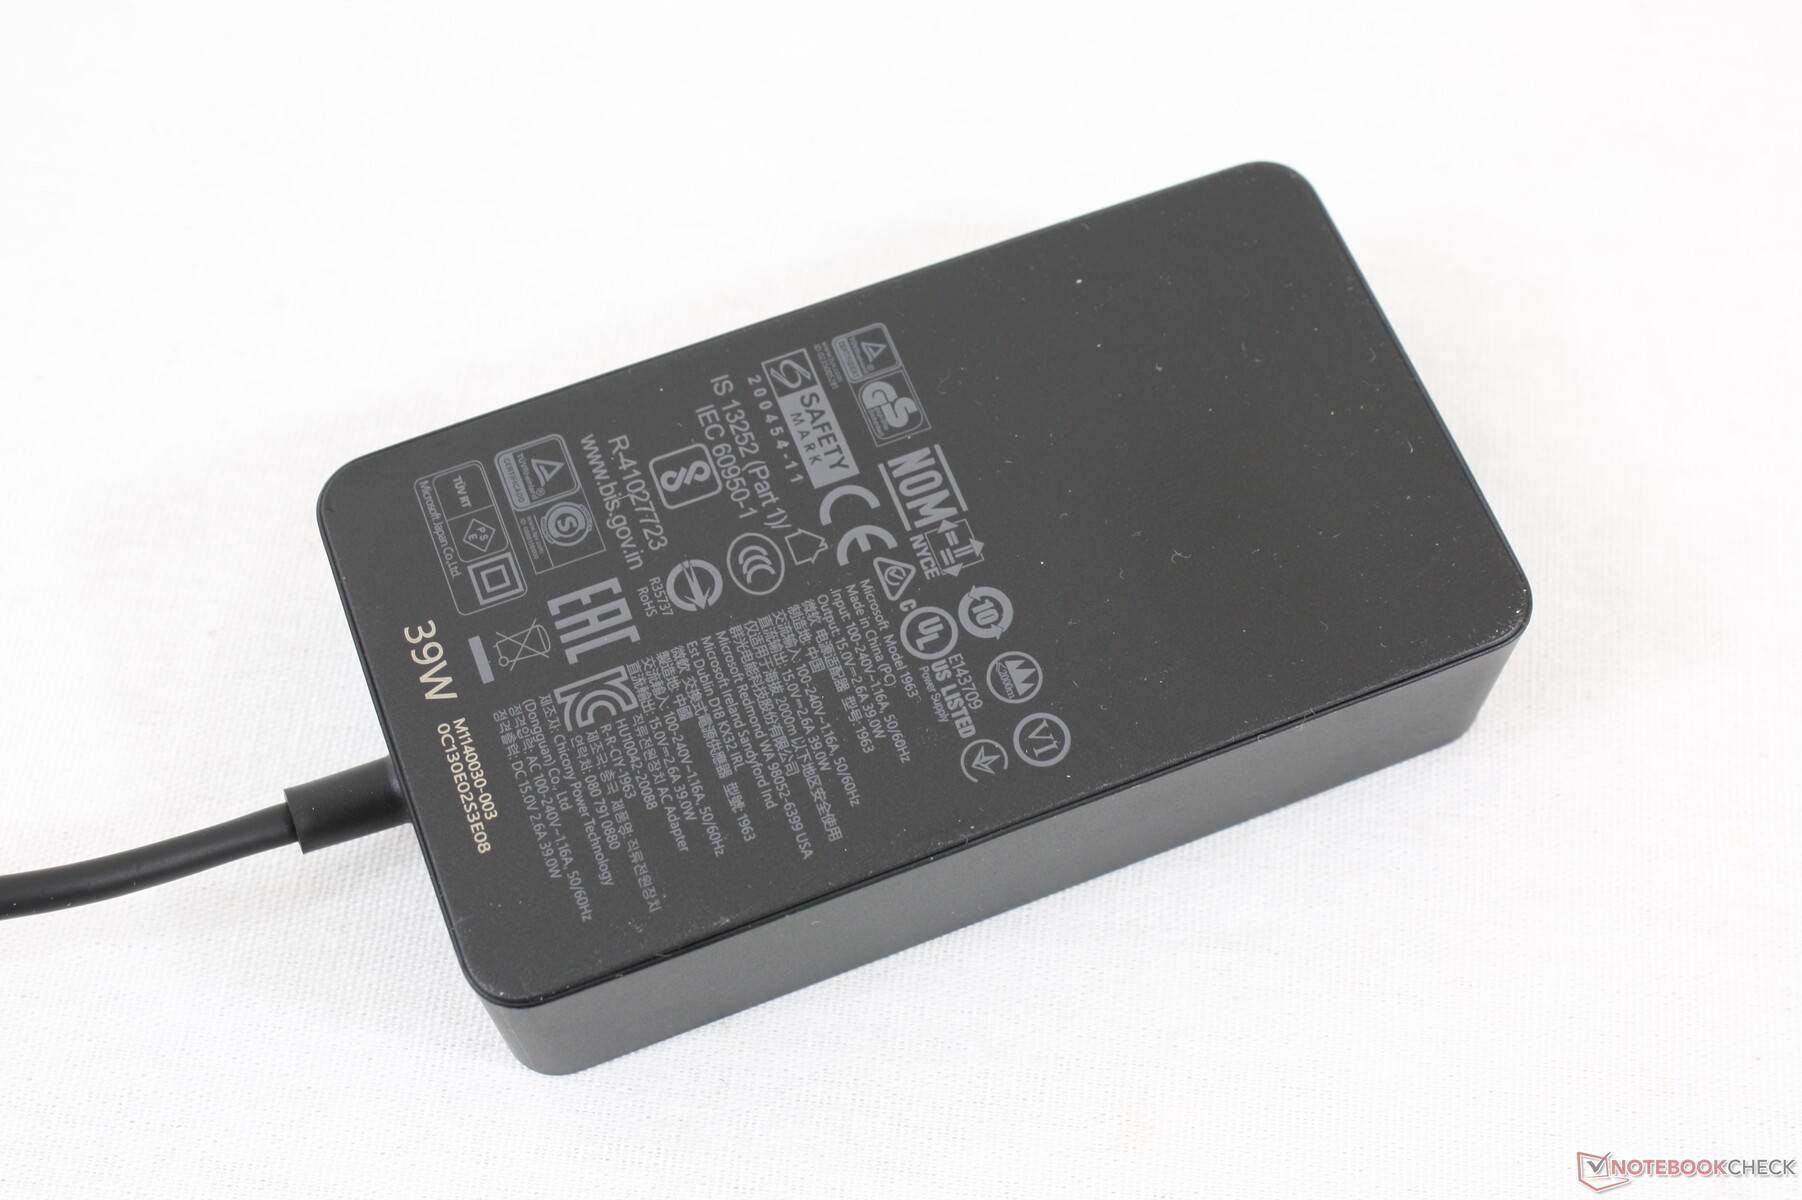
Consumption is slightly lower than the 13.5-inch Surface Laptop 3 when under load and about the same as the Zenbook S UX393JA even though the latter comes with the Core i7-1065G7 that's almost two times more powerful in terms of graphics. Performance-per-Watt is therefore not as good as we had hoped. We're able to measure a temporary maximum consumption of 51.6 W from the small (~8.5 x 9 x 2.2 cm) 39 W AC adapter. Note that the Surface Laptop Go is compatible with the 65 W AC adapters that ship with the larger 15-inch Surface Laptop 3.
| Off / Standby | |
| Idle | |
| Load |
|
Key:
min: | |
| Microsoft Surface Laptop Go Core i5 i5-1035G1, UHD Graphics G1 (Ice Lake 32 EU), SK hynix BC501 HFM256GDGTNG, IPS, 1536x1024, 12.4" | Asus Zenbook S UX393JA i7-1065G7, Iris Plus Graphics G7 (Ice Lake 64 EU), Intel SSD 660p 1TB SSDPEKNW010T8, IPS, 3300x2200, 13.9" | HP EliteBook 830 G7 i7-10810U, UHD Graphics 620, Samsung SSD PM981a MZVLB512HBJQ, IPS, 1920x1080, 13.3" | Microsoft Surface Laptop 3 13 Core i5-1035G7 i5-1035G7, Iris Plus Graphics G7 (Ice Lake 64 EU), SK hynix BC501 HFM256GDGTNG, IPS, 2256x1504, 13.5" | Huawei MateBook X Pro 2020 i7 i7-10510U, GeForce MX250, Samsung PM981a MZVLB1T0HBLR, LTPS, 3000x2000, 13.9" | Apple MacBook Pro 13 2020 2GHz i5 10th-Gen i5-1038NG7, Iris Plus Graphics G7 (Ice Lake 64 EU), Apple SSD SM0512F, IPS, 2560x1600, 13.3" | |
|---|---|---|---|---|---|---|
| Power Consumption | -16% | 2% | -20% | -39% | -31% | |
| Idle Minimum * (Watt) | 2.8 | 4.1 -46% | 3.6 -29% | 4.4 -57% | 4.3 -54% | 3.8 -36% |
| Idle Average * (Watt) | 6.8 | 7.5 -10% | 4.7 31% | 7.5 -10% | 8.5 -25% | 8.6 -26% |
| Idle Maximum * (Watt) | 8 | 8.5 -6% | 5.1 36% | 7.8 2% | 12 -50% | 10.3 -29% |
| Load Average * (Watt) | 37.2 | 36.8 1% | 33.3 10% | 41.9 -13% | 54.8 -47% | 52.1 -40% |
| Load Maximum * (Watt) | 51.6 | 61.6 -19% | 70 -36% | 63.9 -24% | 61.5 -19% | 65.2 -26% |
| Witcher 3 ultra * (Watt) | 39.2 | 40.8 | 47.1 | 48.2 |
* ... smaller is better
Battery Life
Battery capacity is smaller than the 13.5-inch Surface Laptop 3 (39 Wh vs. 45 Wh). Nonetheless, runtimes are almost the same at about 8 hours of real-world WLAN use.
Charging from empty to full capacity is relatively fast at just over an hour with the included AC adapter. USB-C charging is supported.
| Microsoft Surface Laptop Go Core i5 i5-1035G1, UHD Graphics G1 (Ice Lake 32 EU), 39 Wh | Asus Zenbook S UX393JA i7-1065G7, Iris Plus Graphics G7 (Ice Lake 64 EU), 67 Wh | HP EliteBook 830 G7 i7-10810U, UHD Graphics 620, 53 Wh | Microsoft Surface Laptop 3 13 Core i5-1035G7 i5-1035G7, Iris Plus Graphics G7 (Ice Lake 64 EU), 45 Wh | Huawei MateBook X Pro 2020 i7 i7-10510U, GeForce MX250, 57.4 Wh | Apple MacBook Pro 13 2020 2GHz i5 10th-Gen i5-1038NG7, Iris Plus Graphics G7 (Ice Lake 64 EU), 58 Wh | |
|---|---|---|---|---|---|---|
| Battery runtime | 16% | 43% | -1% | 25% | 51% | |
| Reader / Idle (h) | 35 | 38.4 10% | 34.6 -1% | 34.4 -2% | ||
| WiFi v1.3 (h) | 8 | 8.3 4% | 11.5 44% | 8.3 4% | 10.4 30% | 12.1 51% |
| Load (h) | 2 | 2.7 35% | 3.7 85% | 1.9 -5% | 2.4 20% |
Pros
Cons
Verdict
The Surface Laptop Go is an imbalanced machine. On one hand, it's one of the best $550 USD laptops you can find because its 10th gen Core i5 CPU, 3:2 touchscreen, and metal design are better than anything else at this price range. On the other hand, the soldered 4 GB of RAM, 64 GB SSD, difficult serviceability, slow graphics, and lack of port options are abysmal by today's standards. Microsoft is charging an arm and a leg for higher-end SKUs just to have a decent 8 GB of RAM. The barebones features and laughable specifications read like a cheap Acer netbook from half a decade ago.
If you don't mind being stuck with just 4 GB of RAM, then we can see the the appeal of the lower-end SKUs because you'd still be getting a great display and chassis. Otherwise, it's worth looking into other Ultrabooks like the XPS 13, Spectre 13, ZenBook 13, or the Lenovo IdeaPad Slim 7 all of which have sub $1000 SKUs similar to a fully equipped Surface Laptop Go but with more useful features and longer legs.
Microsoft Surface Laptop Go Core i5
- 10/24/2020 v7 (old)
Allen Ngo
Price comparison
