Lenovo ThinkPad P15 Gen 2 laptop review: Traditional workstation with new GPUs
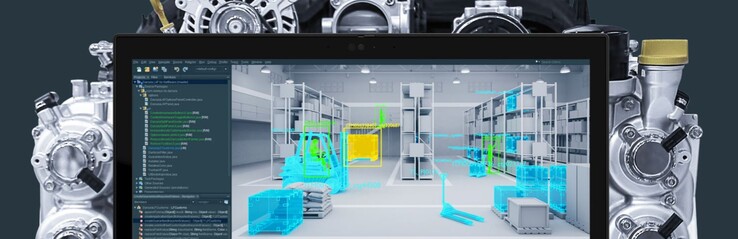
With the ThinkPad P15, Lenovo continues to offer a traditional mobile workstation where high performance and good maintenance options continue to play an important role, rather than achieving the slimmest design possible. Lenovo used a completely new case for the first generation of the ThinkPad P15, and it has now been adopted without changes for the second generation. The processors have been updated to the latest 45-watt CPUs from Intel (Tiger Lake H45 Core i5, i7, i9 or Xeon), and the graphics cards have also been updated to the new RTX A GPUs from Nvidia (successor to the Quadro GPUs).
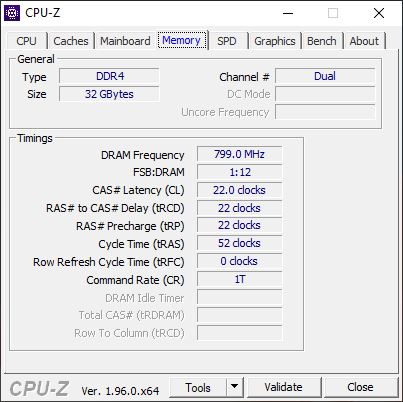
Our test unit with the model number 20YQ001JGE costs 2,850 Euros (~$3,304) (or 2,500 Euros (~$2,898) in the case of the corresponding Campus model), and it's a mid-range configuration equipped with the Core i7-11800H, 32 GB of RAM, a 512 GB PCIe SSD, the new RTX A3000, and a 1080p display with a brightness of 500 cd/m². Users who don't need ISV certifications should take a look at the identically built ThinkPad T15g Gen 2, which is powered by the consumer GeForce GPUs.
Possible contenders in comparison
Rating | Date | Model | Weight | Height | Size | Resolution | Price |
|---|---|---|---|---|---|---|---|
| 87.2 % v7 (old) | 10 / 2021 | Lenovo ThinkPad P15 G2-20YQ001JGE i7-11800H, RTX A3000 Laptop GPU | 2.9 kg | 31.5 mm | 15.60" | 1920x1080 | |
| 87.8 % v7 (old) | 08 / 2021 | HP ZBook Studio 15 G8 i9-11950H, GeForce RTX 3070 Laptop GPU | 1.9 kg | 18 mm | 15.60" | 3840x2160 | |
| 90.2 % v7 (old) | 01 / 2021 | HP ZBook Fury 15 G7 W-10885M, Quadro RTX 5000 Max-Q | 2.4 kg | 25.9 mm | 15.60" | 3840x2160 | |
| 87.8 % v7 (old) | 08 / 2020 | Dell Precision 7550 W-10885M, Quadro RTX 5000 Max-Q | 2.8 kg | 27.36 mm | 15.60" | 3840x2160 | |
| 83.4 % v7 (old) | 08 / 2020 | MSI WS66 10TMT-207US i9-10980HK, Quadro RTX 5000 Max-Q | 2.3 kg | 19.8 mm | 15.60" | 1920x1080 | |
| 85.6 % v7 (old) | 03 / 2021 | Lenovo ThinkPad P15 Gen1-20ST000DGE i7-10750H, Quadro T1000 (Laptop) | 2.7 kg | 31.45 mm | 15.60" | 1920x1080 |
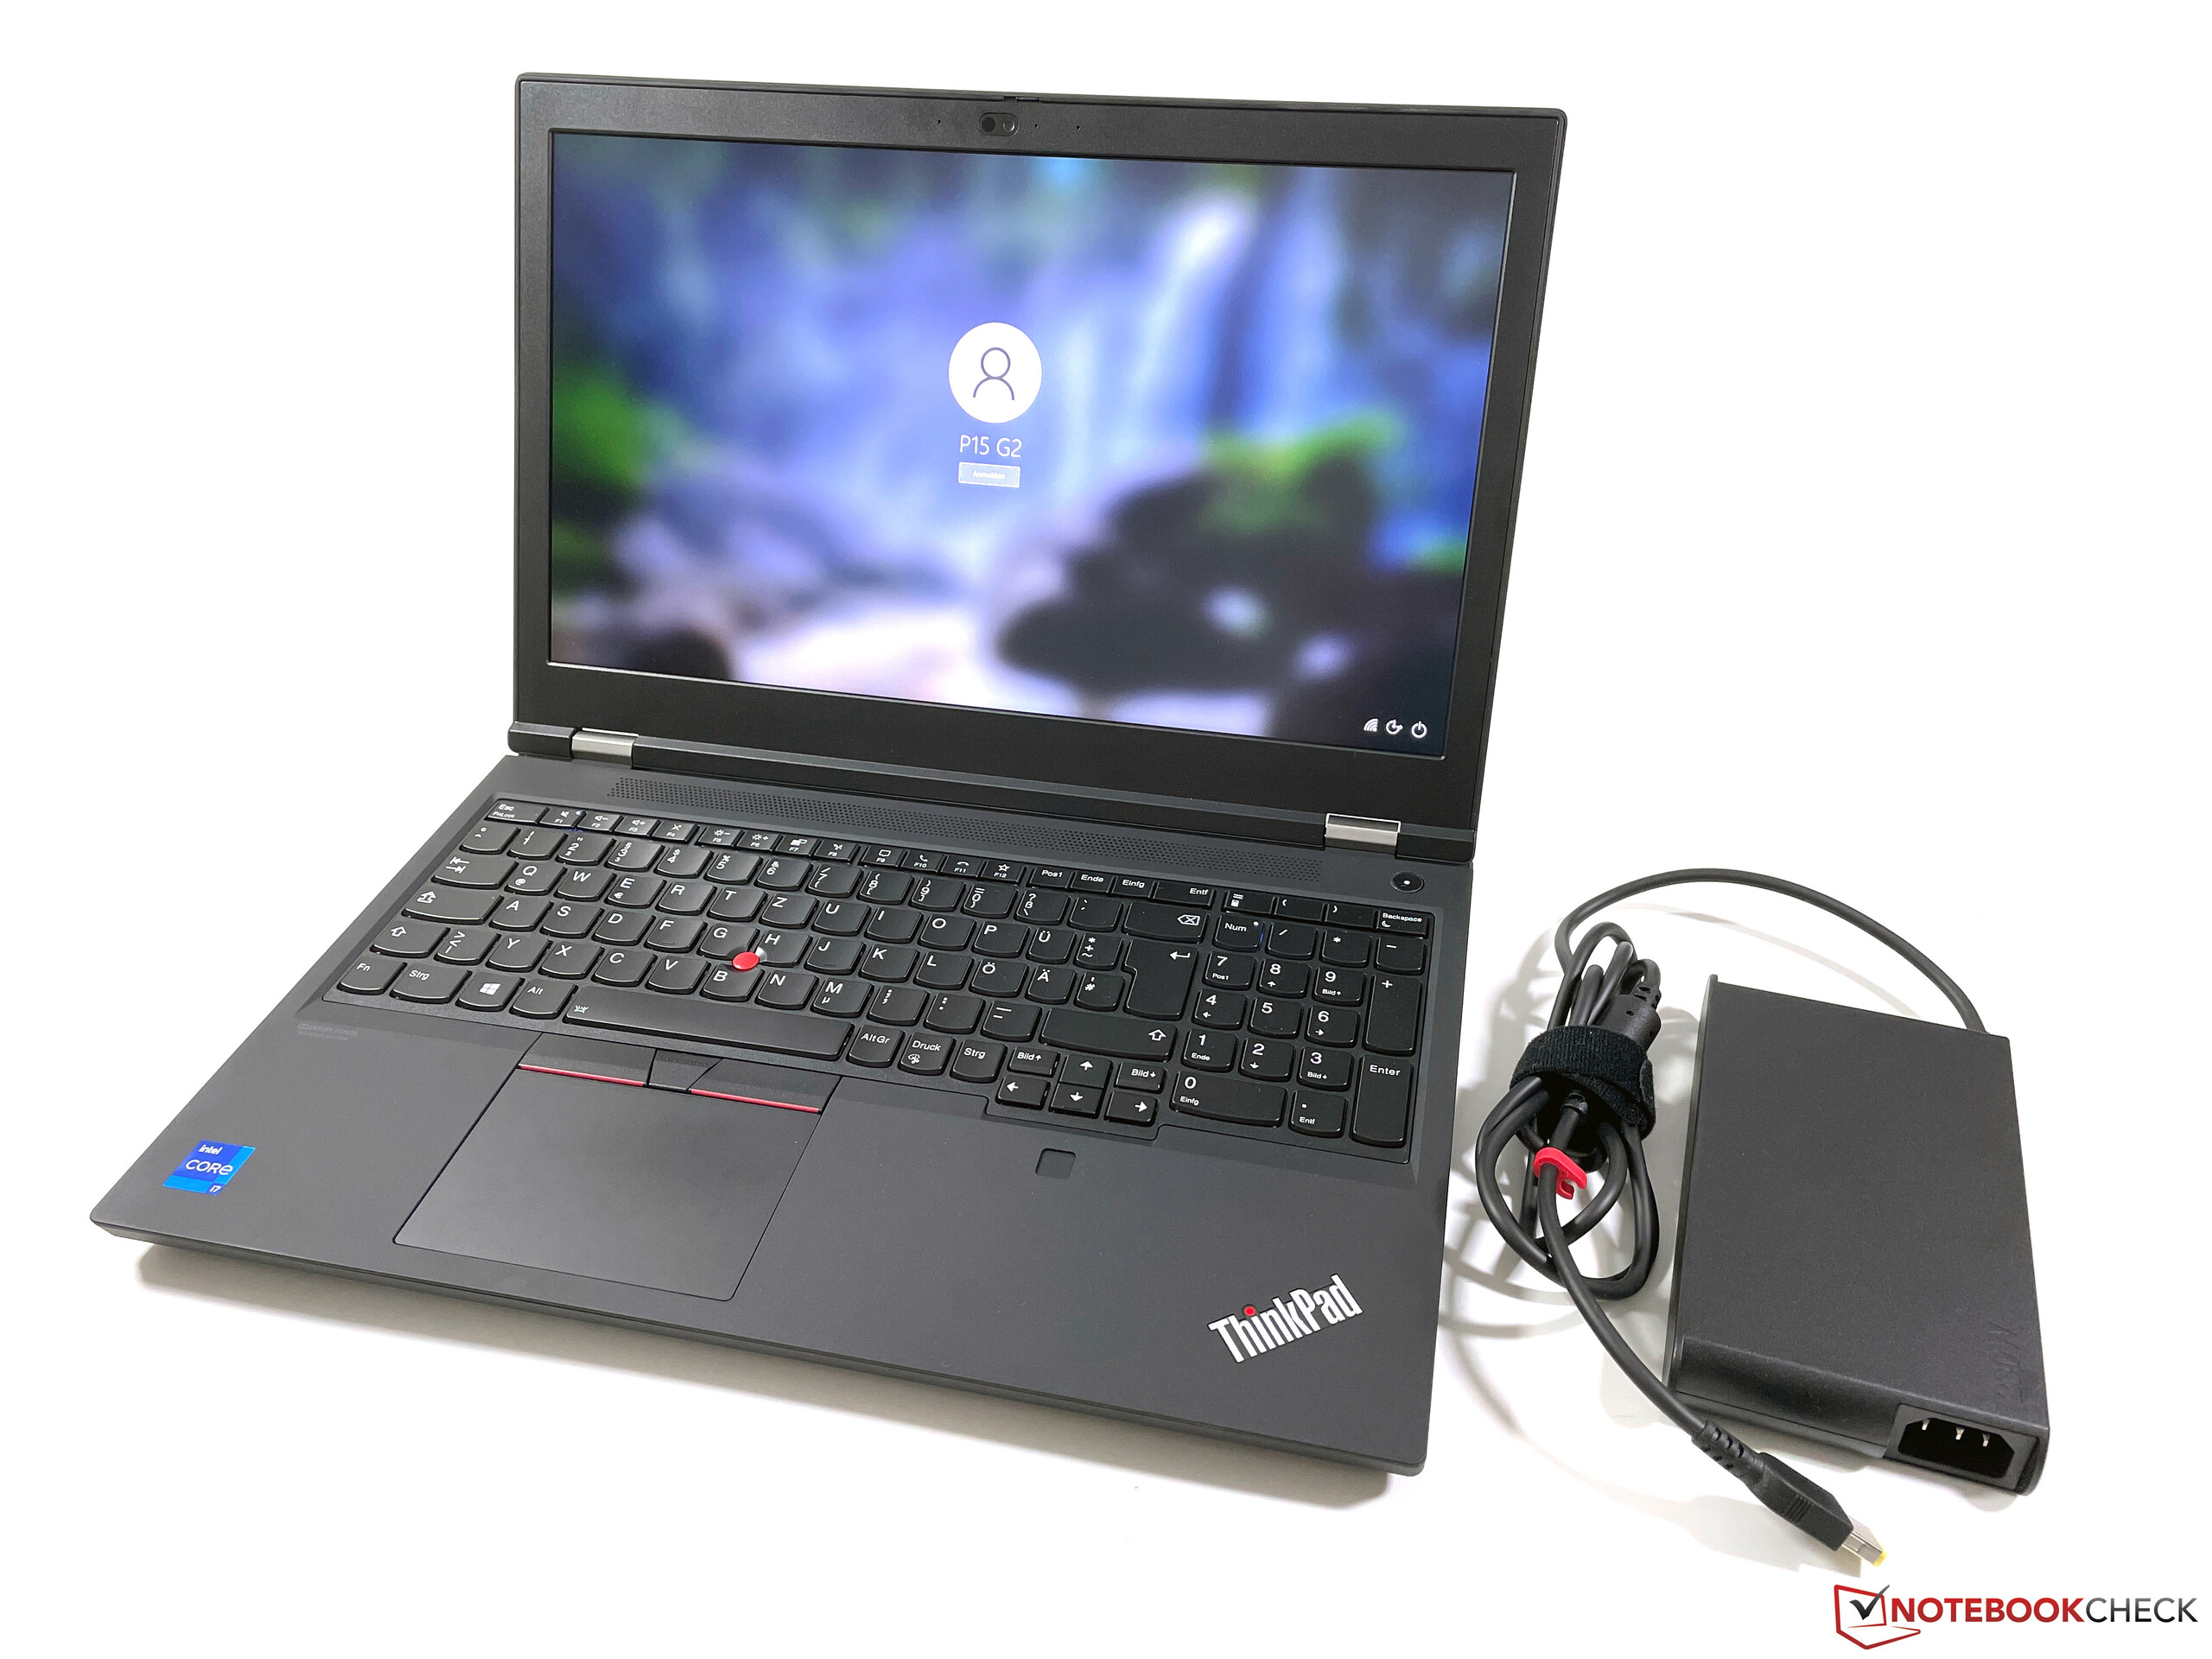
Case - Traditional ThinkPad
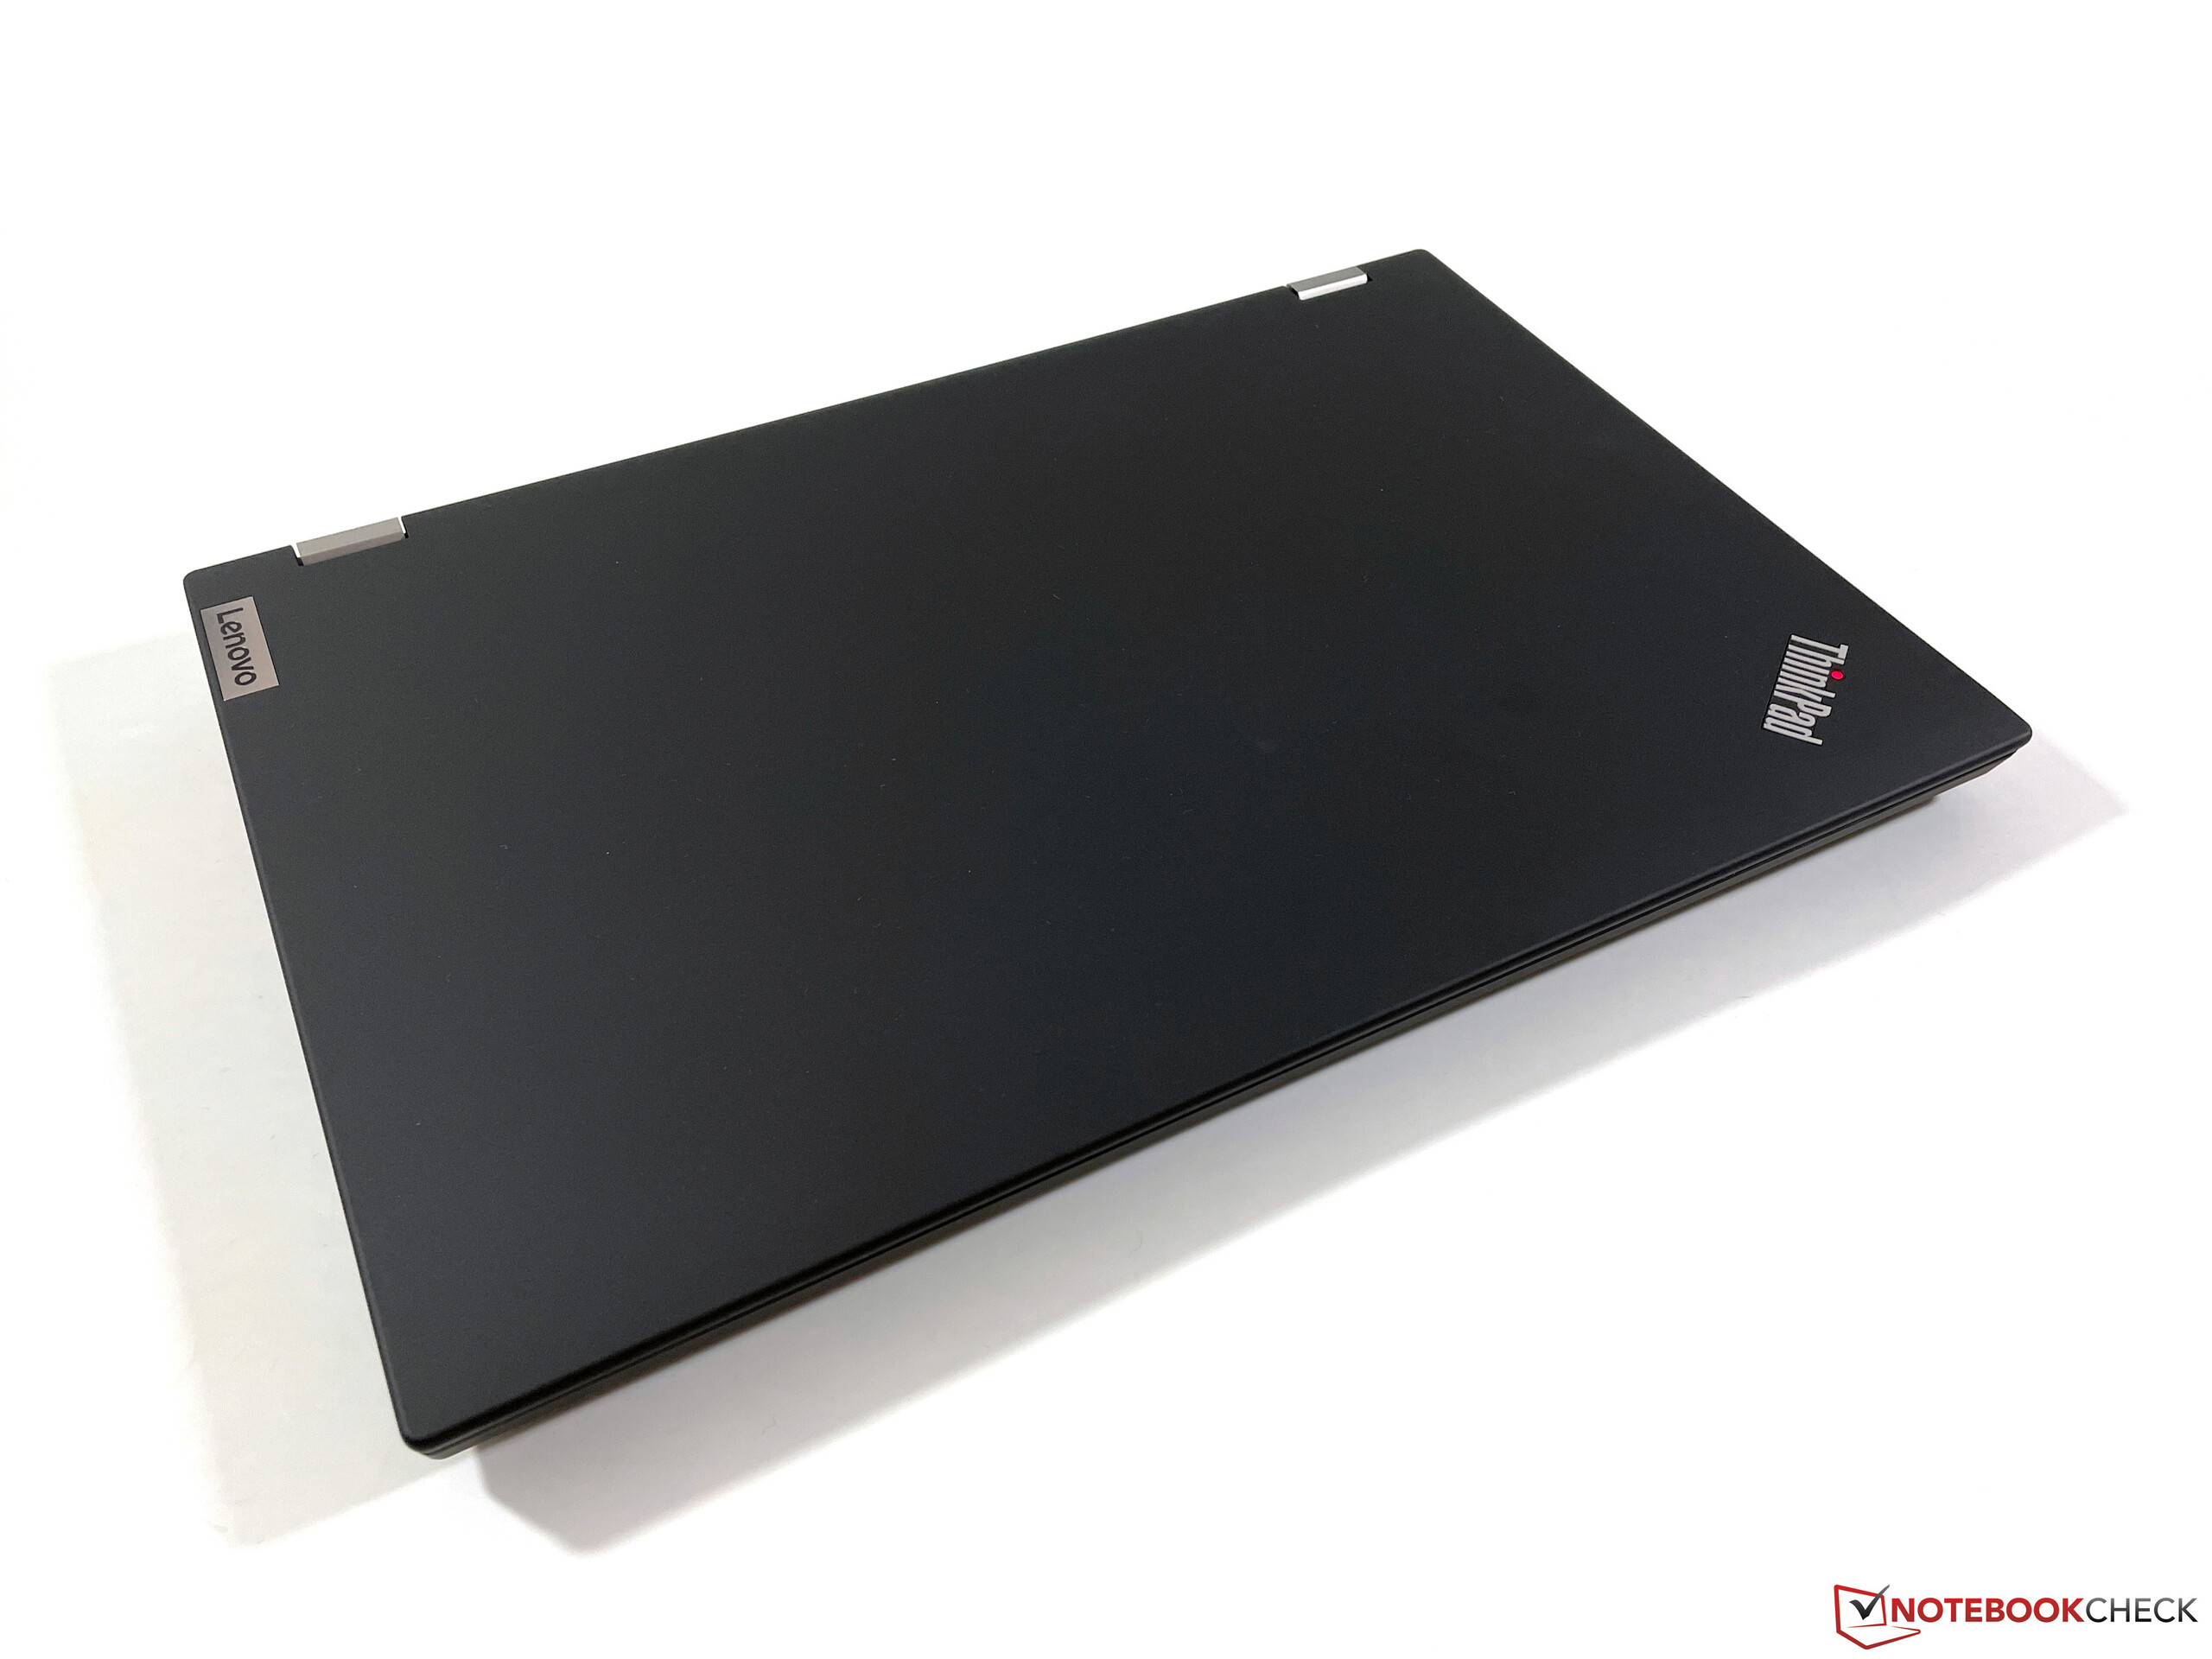
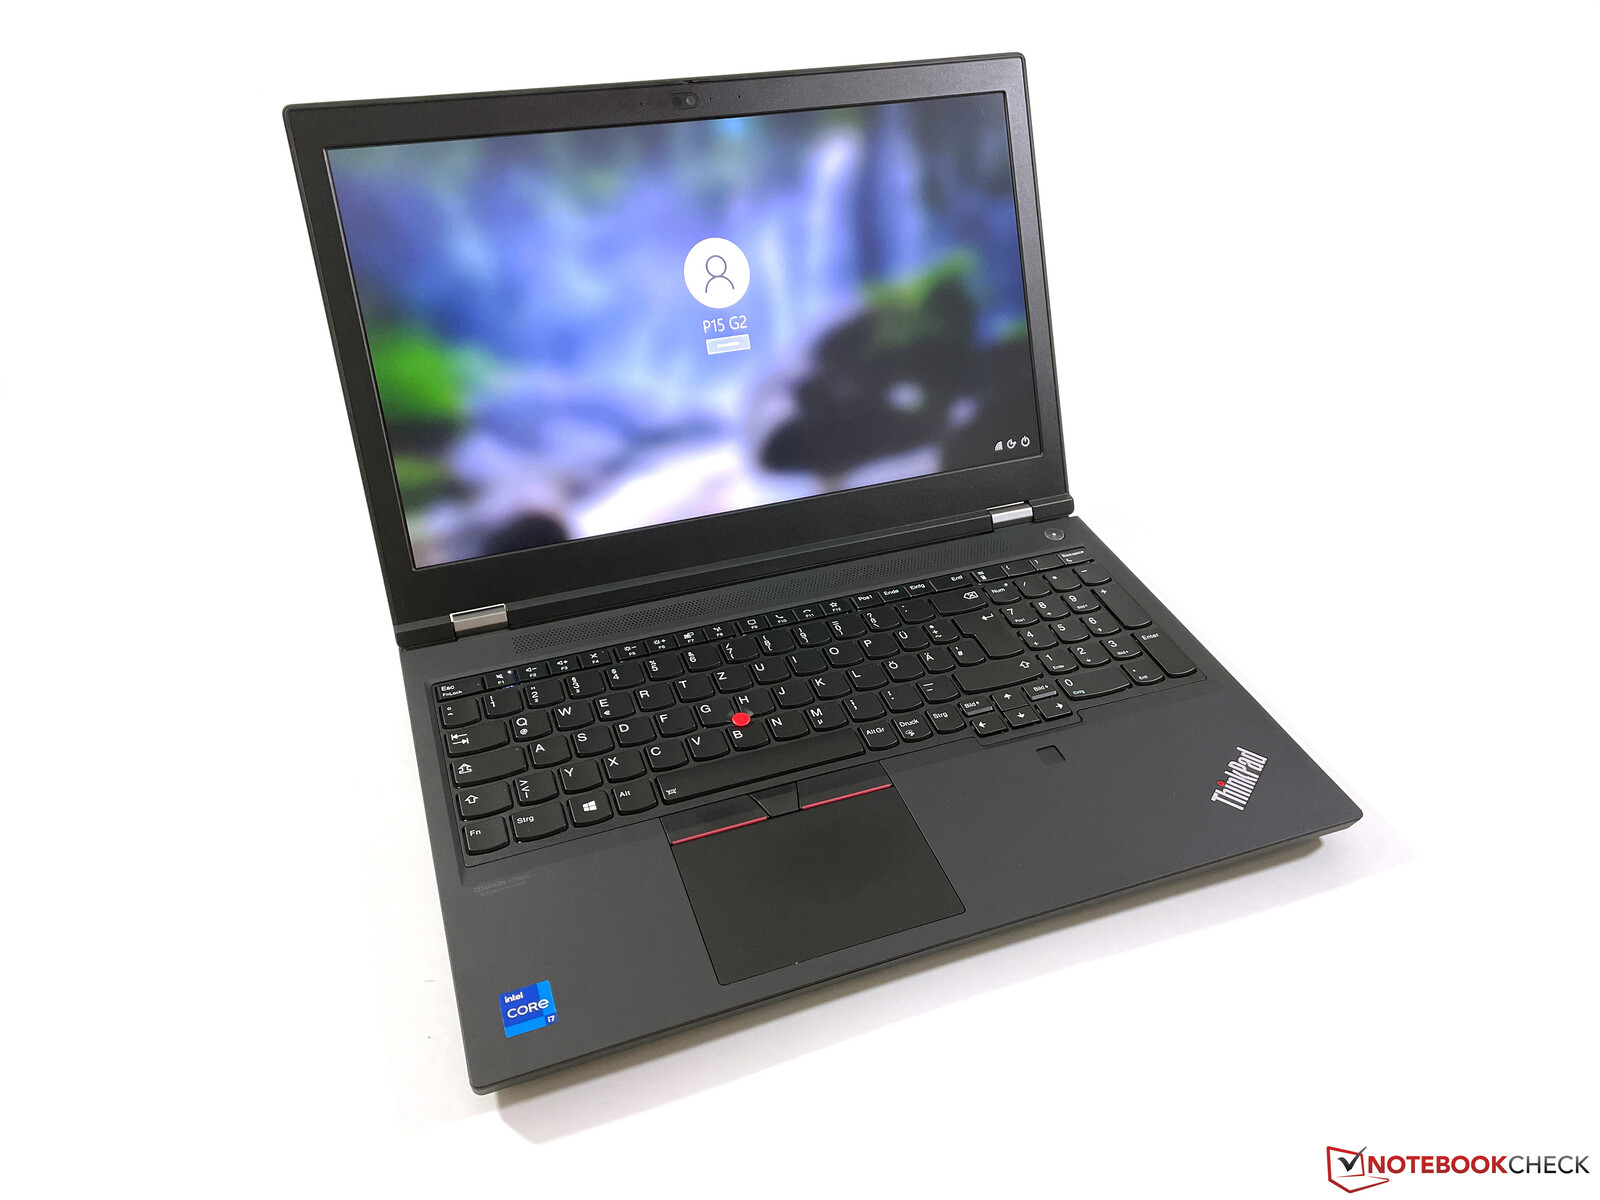
The P15 Gen 2 can still be immediately recognized as a classic ThinkPad, which is probably boring for some users, but it's functional at least. The outside is almost entirely made of plastic, and while it feels quite nice to the touch (not too rough), it's also pretty susceptible to dirt. Subjectively, the quality impression is definitely higher in the competition from Dell or HP.
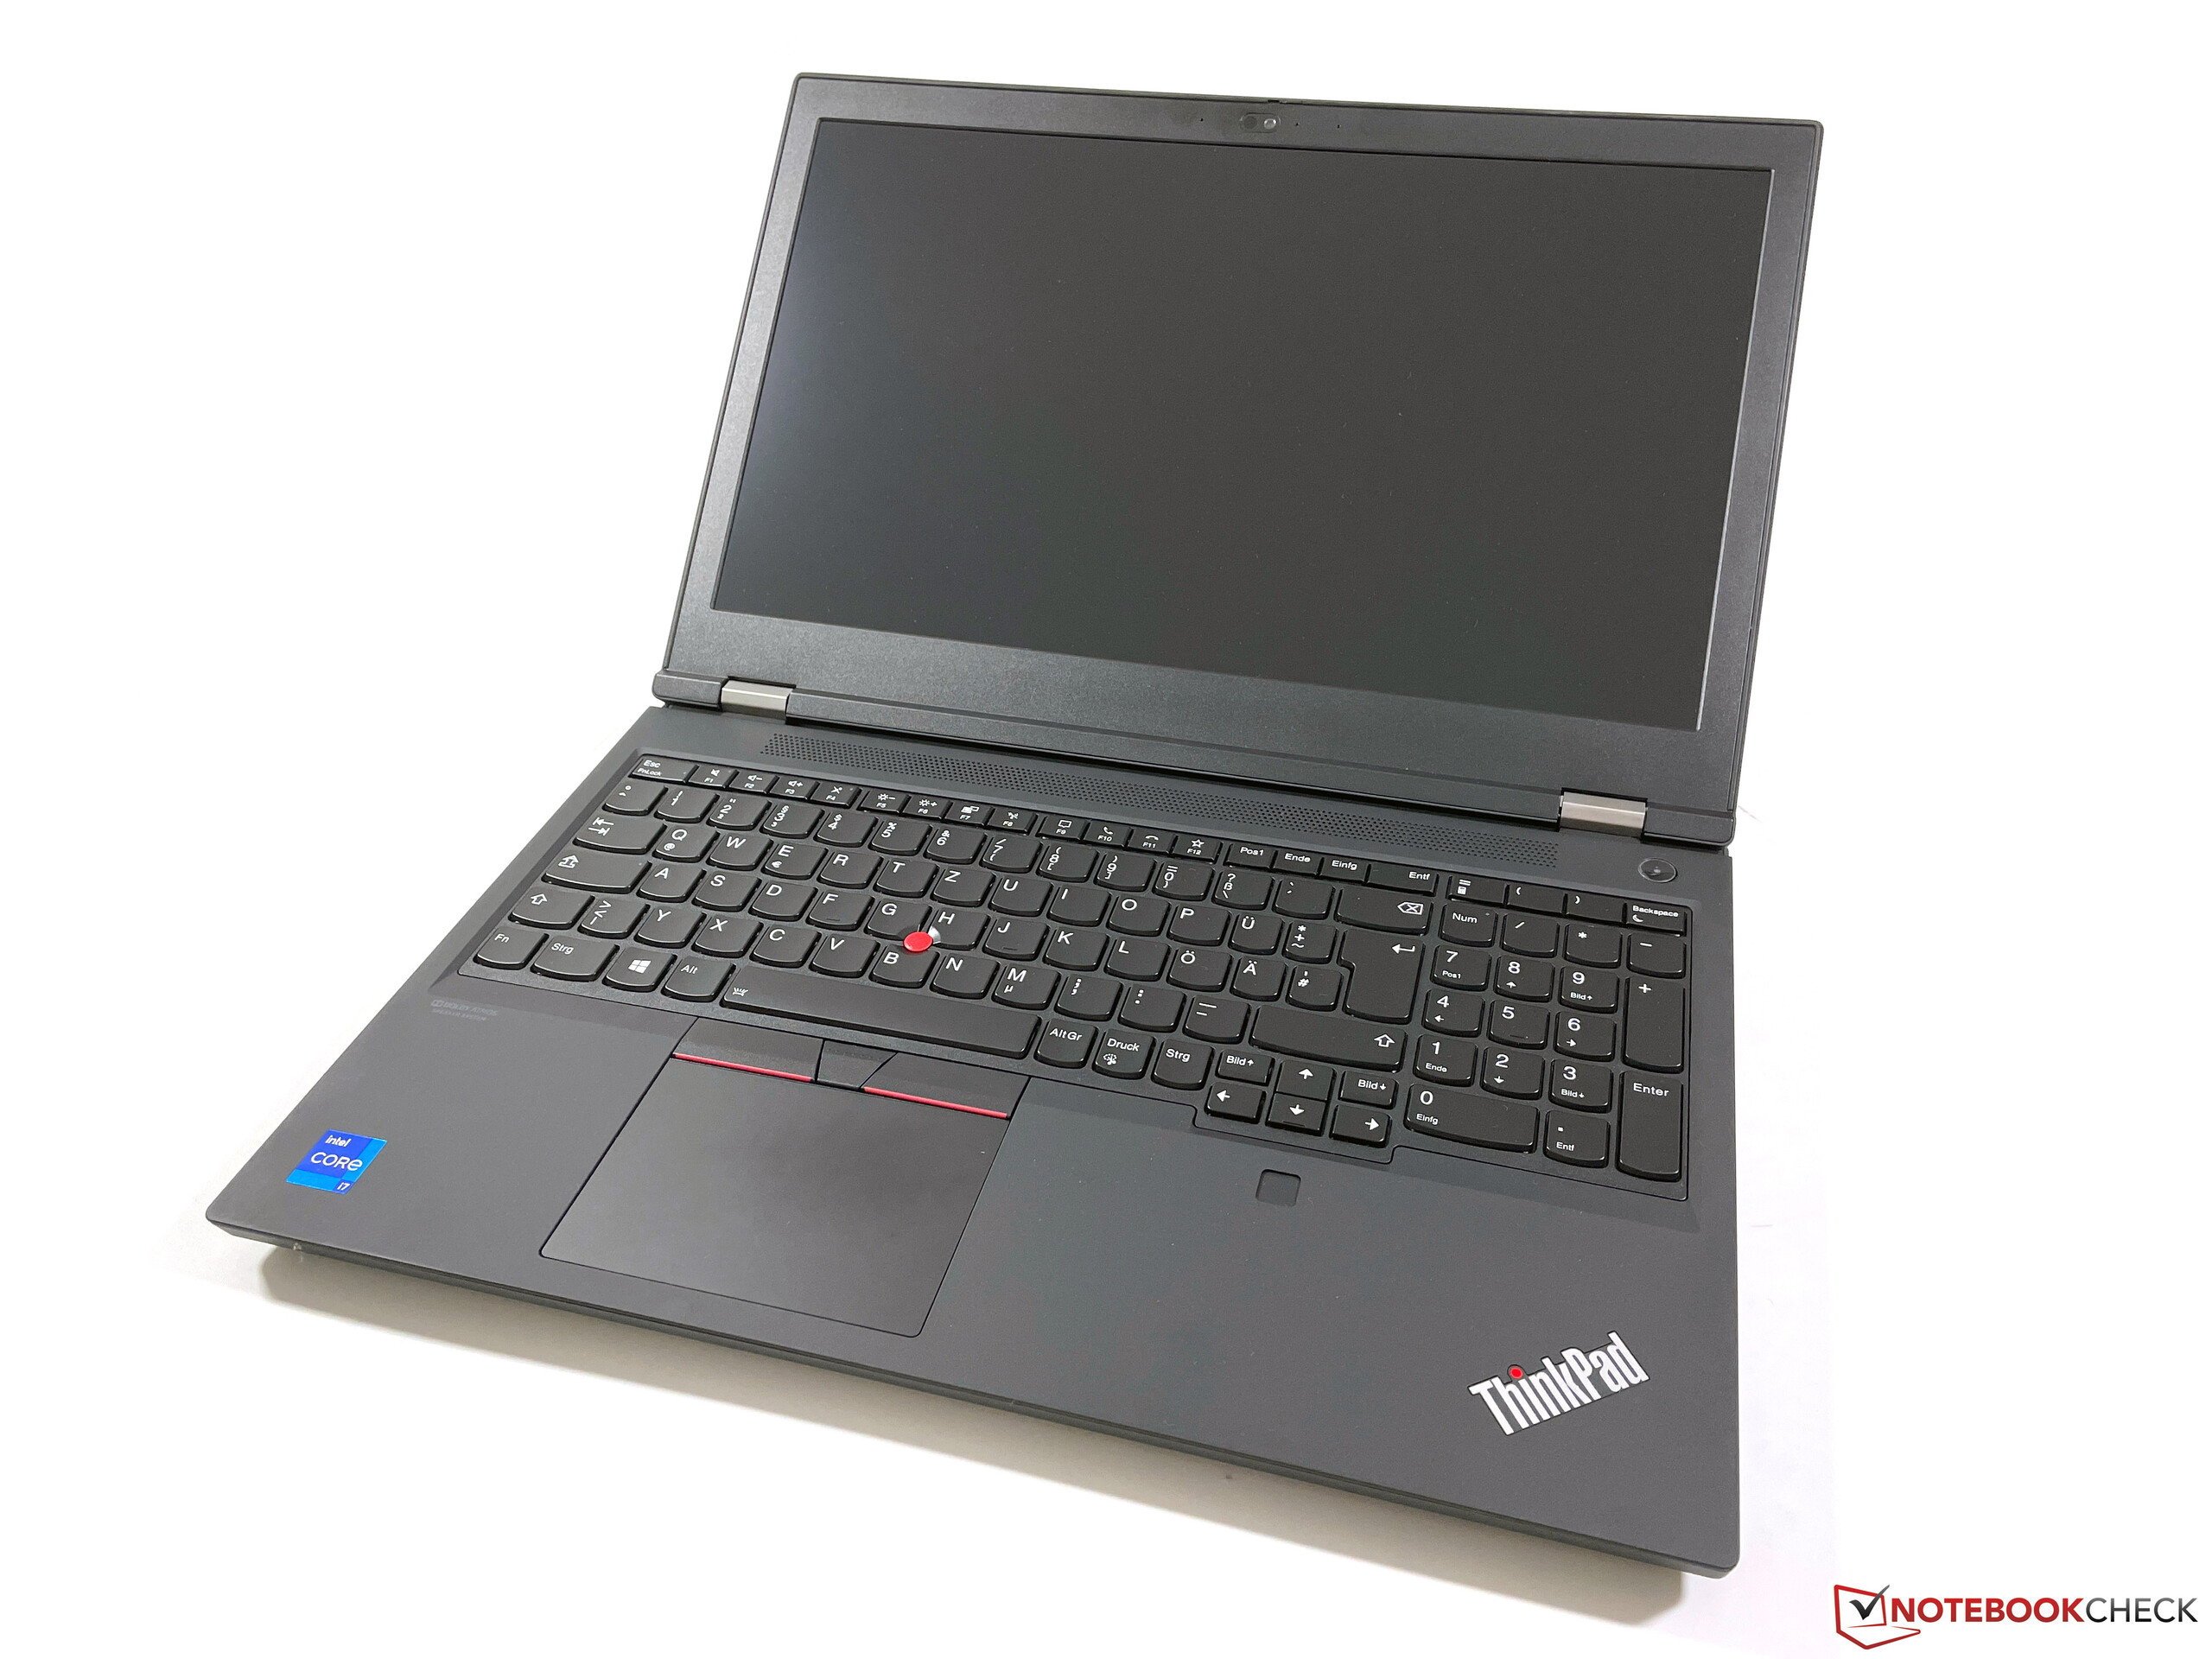
The P15 Gen 2 doesn't look modern at all in terms of design, either. You will probably be surprised by the massive display bezels when opening the lid for the first time. From a design point of view, this could easily be a 2015 laptop. A 16-inch display using a 16:10 aspect ratio could have certainly been installed here. Although the focus is on performance in a mobile workstation, there's definitely still room for improvement when it comes to its design.
The stability of the structure, which is made of plastic and fiberglass and is also reinforced by the familiar magnesium roll cage at the base unit, continues to be very good. it's almost impossible to dent the base unit, and even energetic typing is no problem at all. Only the bottom left of the keyboard yields a bit as in the predecessor, but more about that later. The plastic is also a little flexible above the smart card reader. The two hinges are well aligned (maximum opening angle of 180 degrees), but they are no longer able to support the screen at very narrow angles. On the other hand, the lid itself is very sturdy, and the display doesn't show any problems, even when we apply localized pressure.
When comparing the size of the ThinkPad P15 Gen 2 to other devices, you quickly notice that it's quite bulky, since it's not only the heaviest, but also the largest device in our comparison group. Besides the weight of almost 2.9 kg, you should also factor in about 900 grams for the power adapter when transporting the device.
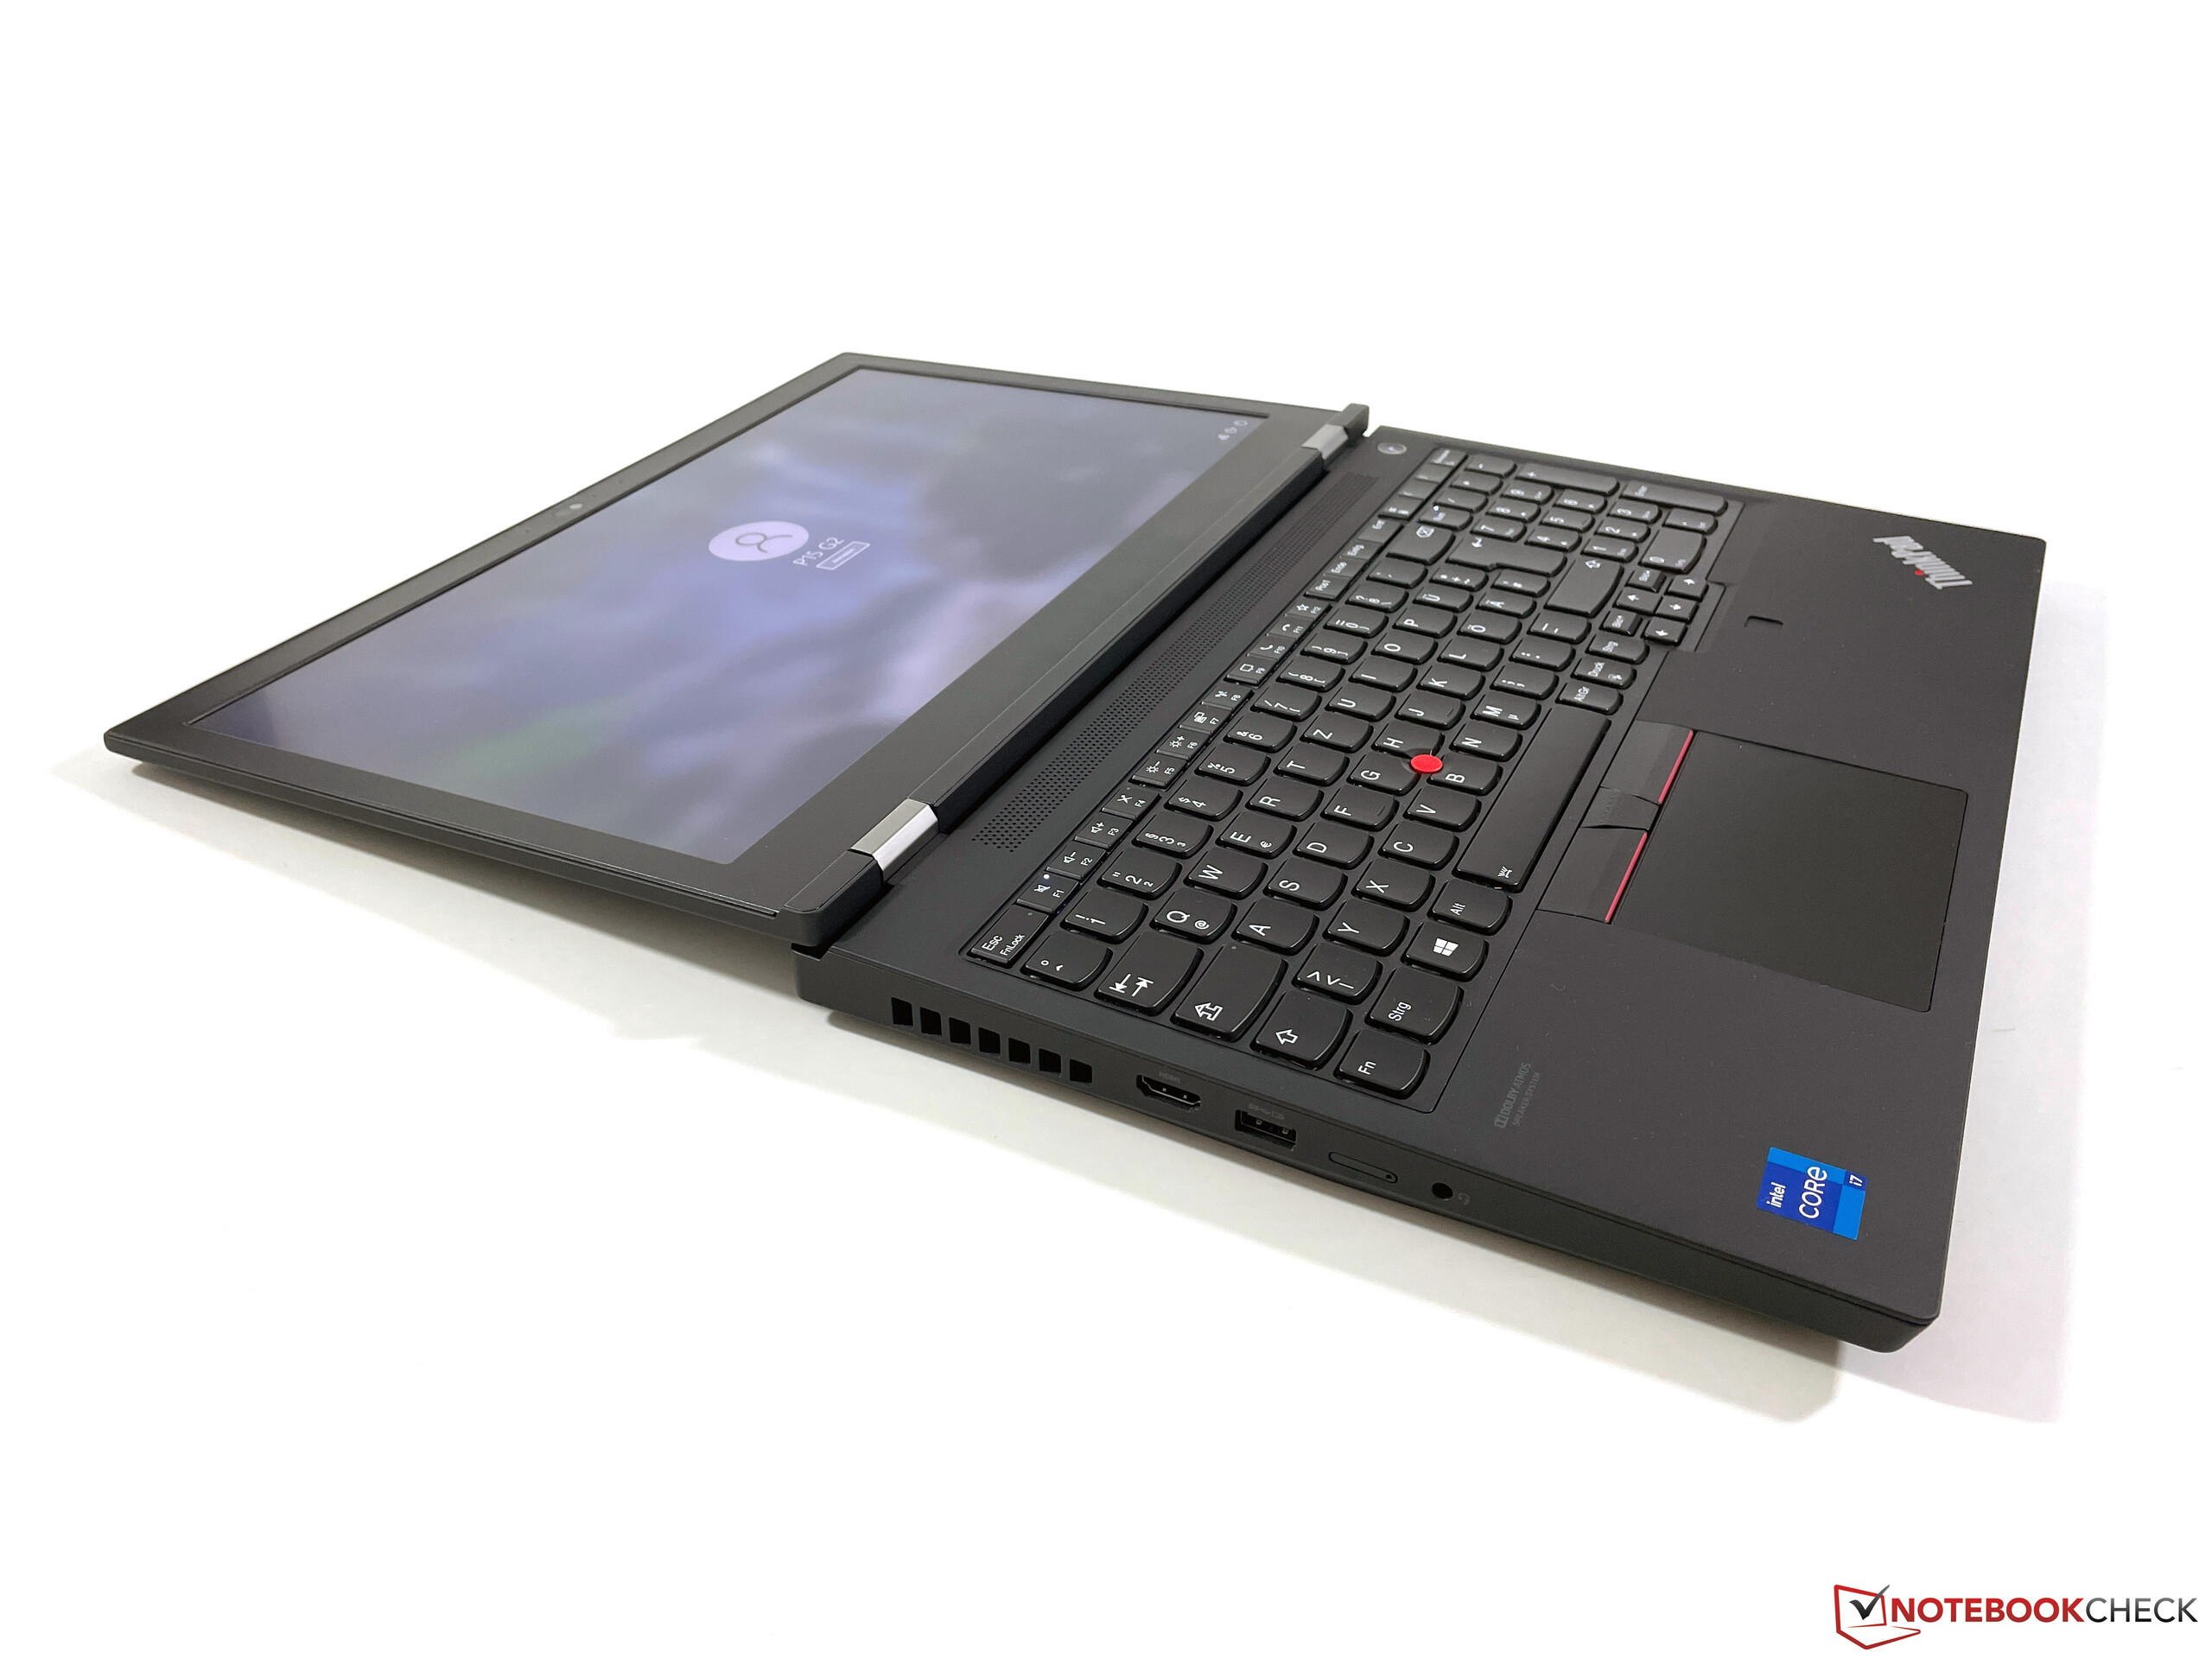
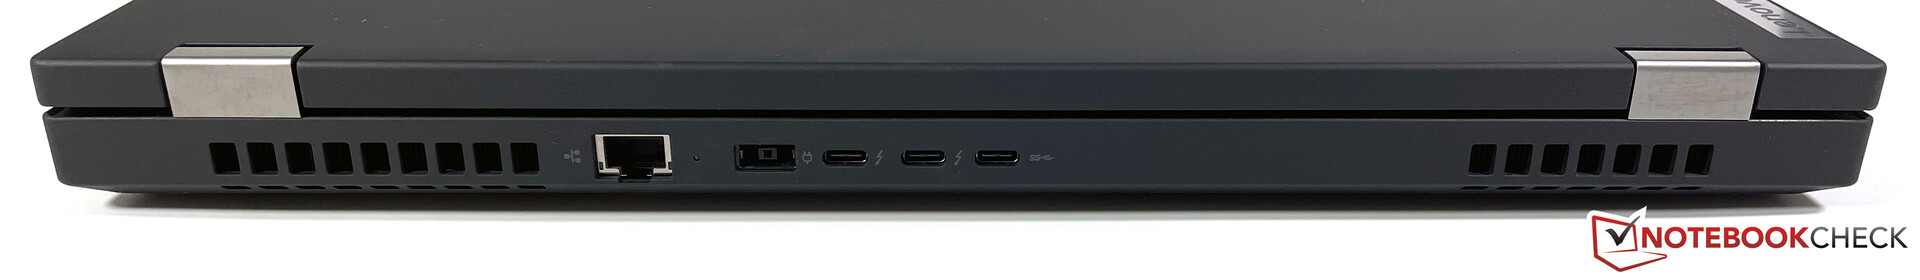
Connectivity - P15 with Thunderbolt 4
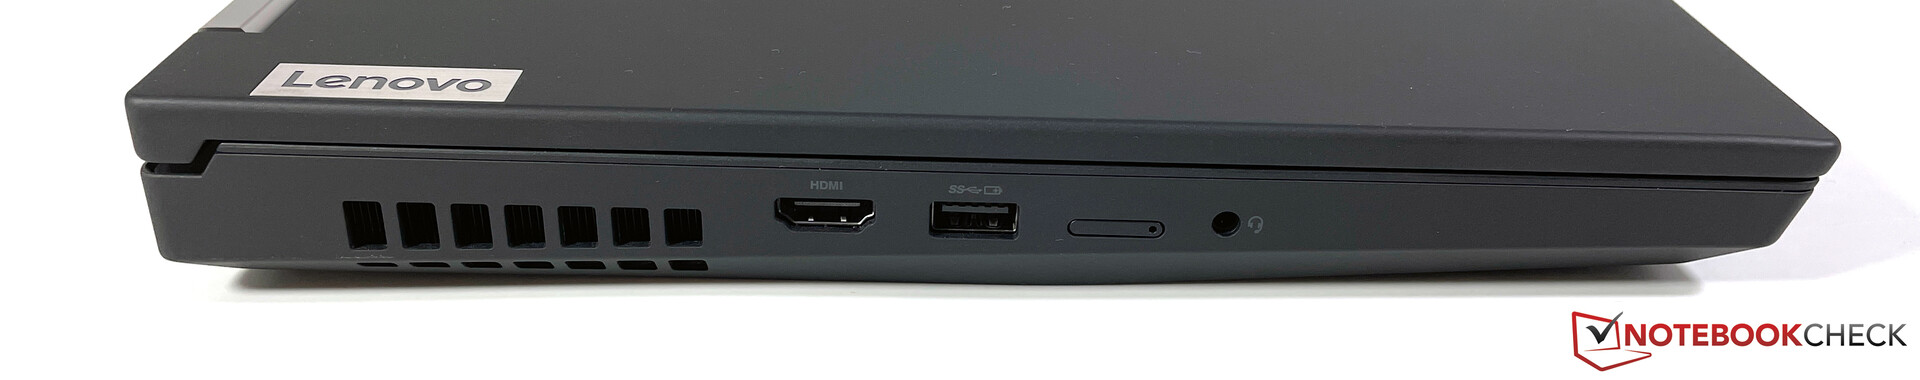
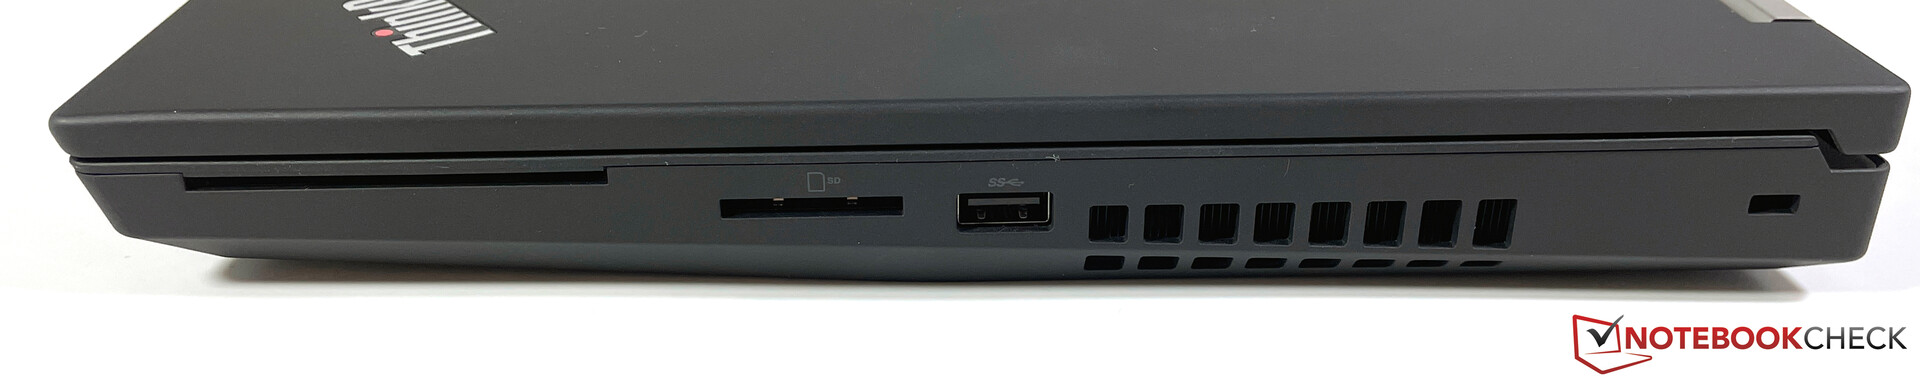
The P15 Gen 2 once again offers plenty of ports. The layout of the ports on the back has undergone a slight change, but it's very similar in principle. Thanks to the new components, however, we now have the faster Thunderbolt 4 ports as well as an HDMI 2.1 output. The layout is good overall, but we would've liked to have at least one of the USB-C ports placed at the side.
SD card reader
The P15 G2 is still equipped with a very fast SD card reader. We measure transfer rates of over 200 MB/s with our reference card (AV Pro V60).
| SD Card Reader | |
| average JPG Copy Test (av. of 3 runs) | |
| MSI WS66 10TMT-207US (Toshiba Exceria Pro SDXC 64 GB UHS-II) | |
| Lenovo ThinkPad P15 G2-20YQ001JGE (AV Pro V60) | |
| Dell Precision 7550 (Toshiba Exceria Pro SDXC 64 GB UHS-II) | |
| HP ZBook Fury 15 G7 (Toshiba Exceria Pro SDXC 64 GB UHS-II) | |
| Average of class Workstation (49.6 - 681, n=13, last 2 years) | |
| Lenovo ThinkPad P15 Gen1-20ST000DGE (Toshiba Exceria Pro SDXC 64 GB UHS-II) | |
| HP ZBook Studio 15 G8 (AV Pro V60) | |
| maximum AS SSD Seq Read Test (1GB) | |
| Average of class Workstation (87.6 - 1455, n=13, last 2 years) | |
| MSI WS66 10TMT-207US (Toshiba Exceria Pro SDXC 64 GB UHS-II) | |
| Lenovo ThinkPad P15 G2-20YQ001JGE (AV Pro V60) | |
| HP ZBook Fury 15 G7 (Toshiba Exceria Pro SDXC 64 GB UHS-II) | |
| Dell Precision 7550 (Toshiba Exceria Pro SDXC 64 GB UHS-II) | |
| Lenovo ThinkPad P15 Gen1-20ST000DGE (Toshiba Exceria Pro SDXC 64 GB UHS-II) | |
| HP ZBook Studio 15 G8 (AV Pro V60) | |
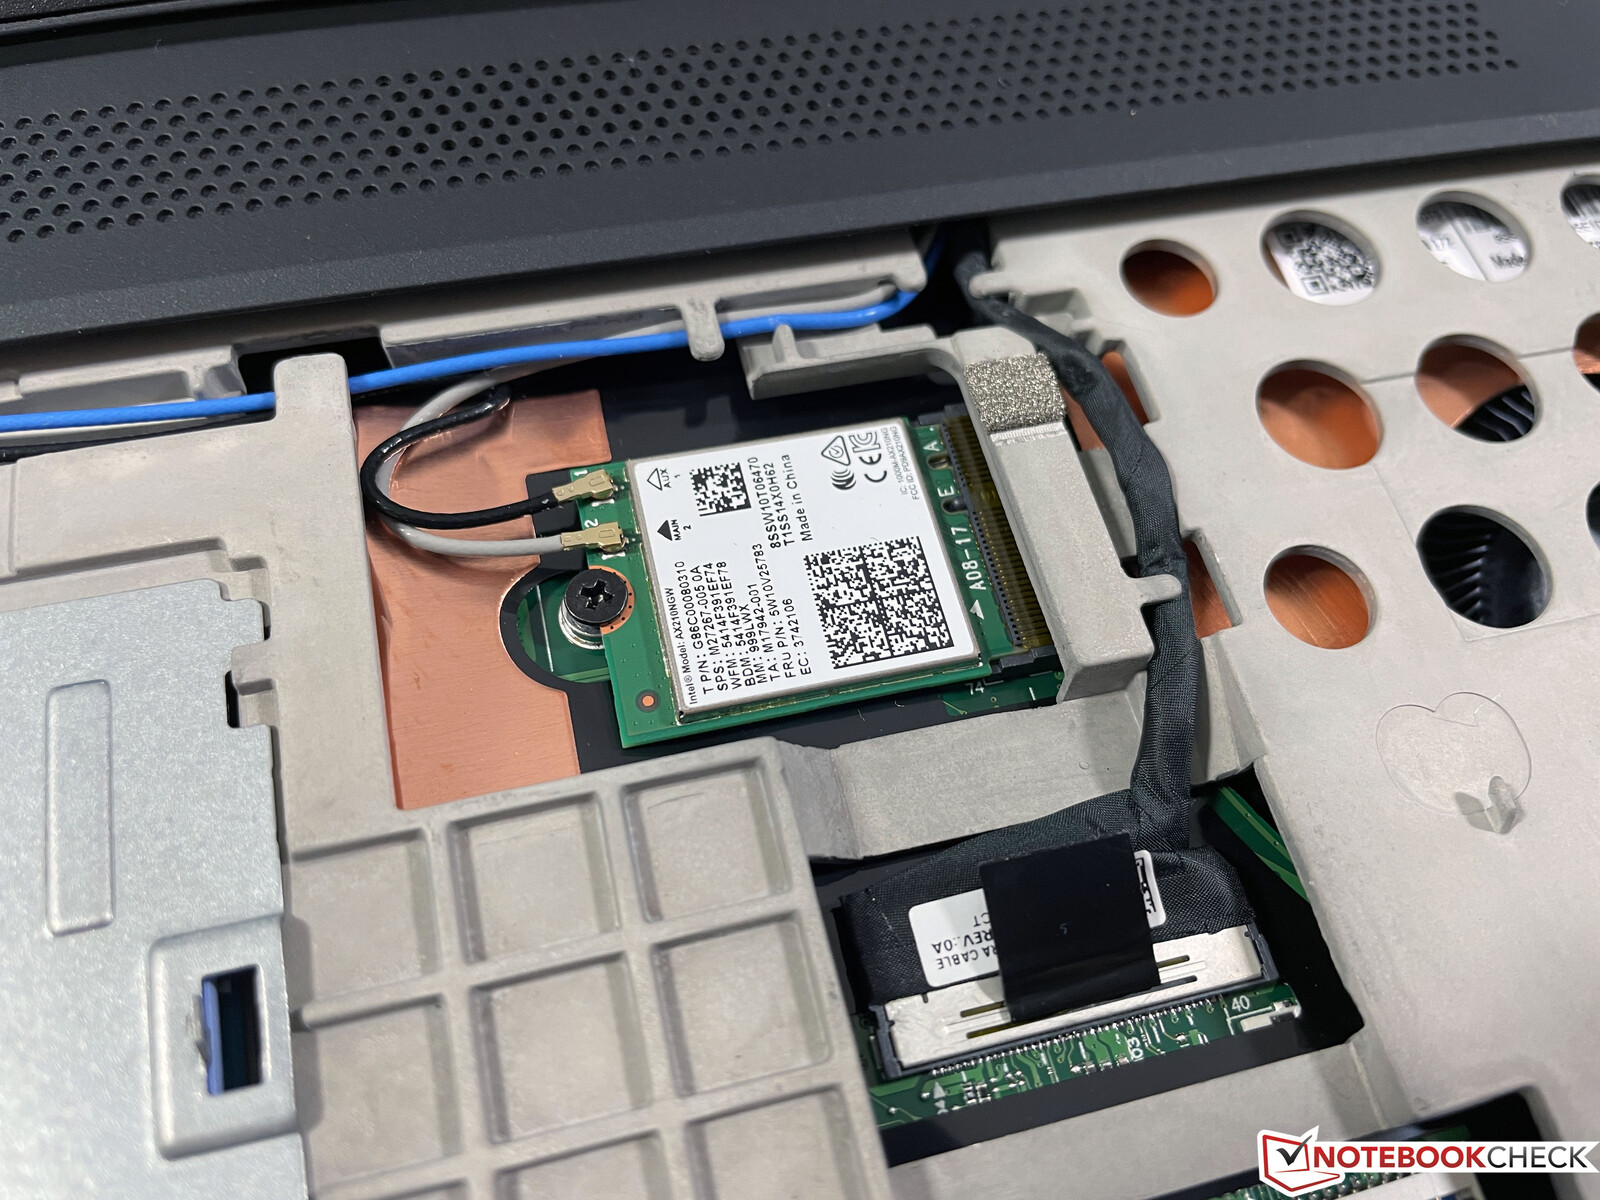
Communication
Besides the faster wired network connection (2.5 Gb/s), Lenovo also equips the P15 Gen 2 with the latest Wi-Fi module from Intel (AX210), which supports the modern Wi-Fi 6E standard as well as Bluetooth 5.2. The transfer rates are very good in our standardized test with the Netgear Nighthawk RAX120 router, and we didn't experience any issues in practice. The necessary antennas for a WWAN module are already installed, but 5G modules are not supported yet.
Webcam
Lenovo continues to use the familiar 720p webcam, which doesn't produce good images even in good lighting conditions. At least there's a mechanical shutter and an IR sensor for facial recognition via Windows Hello.


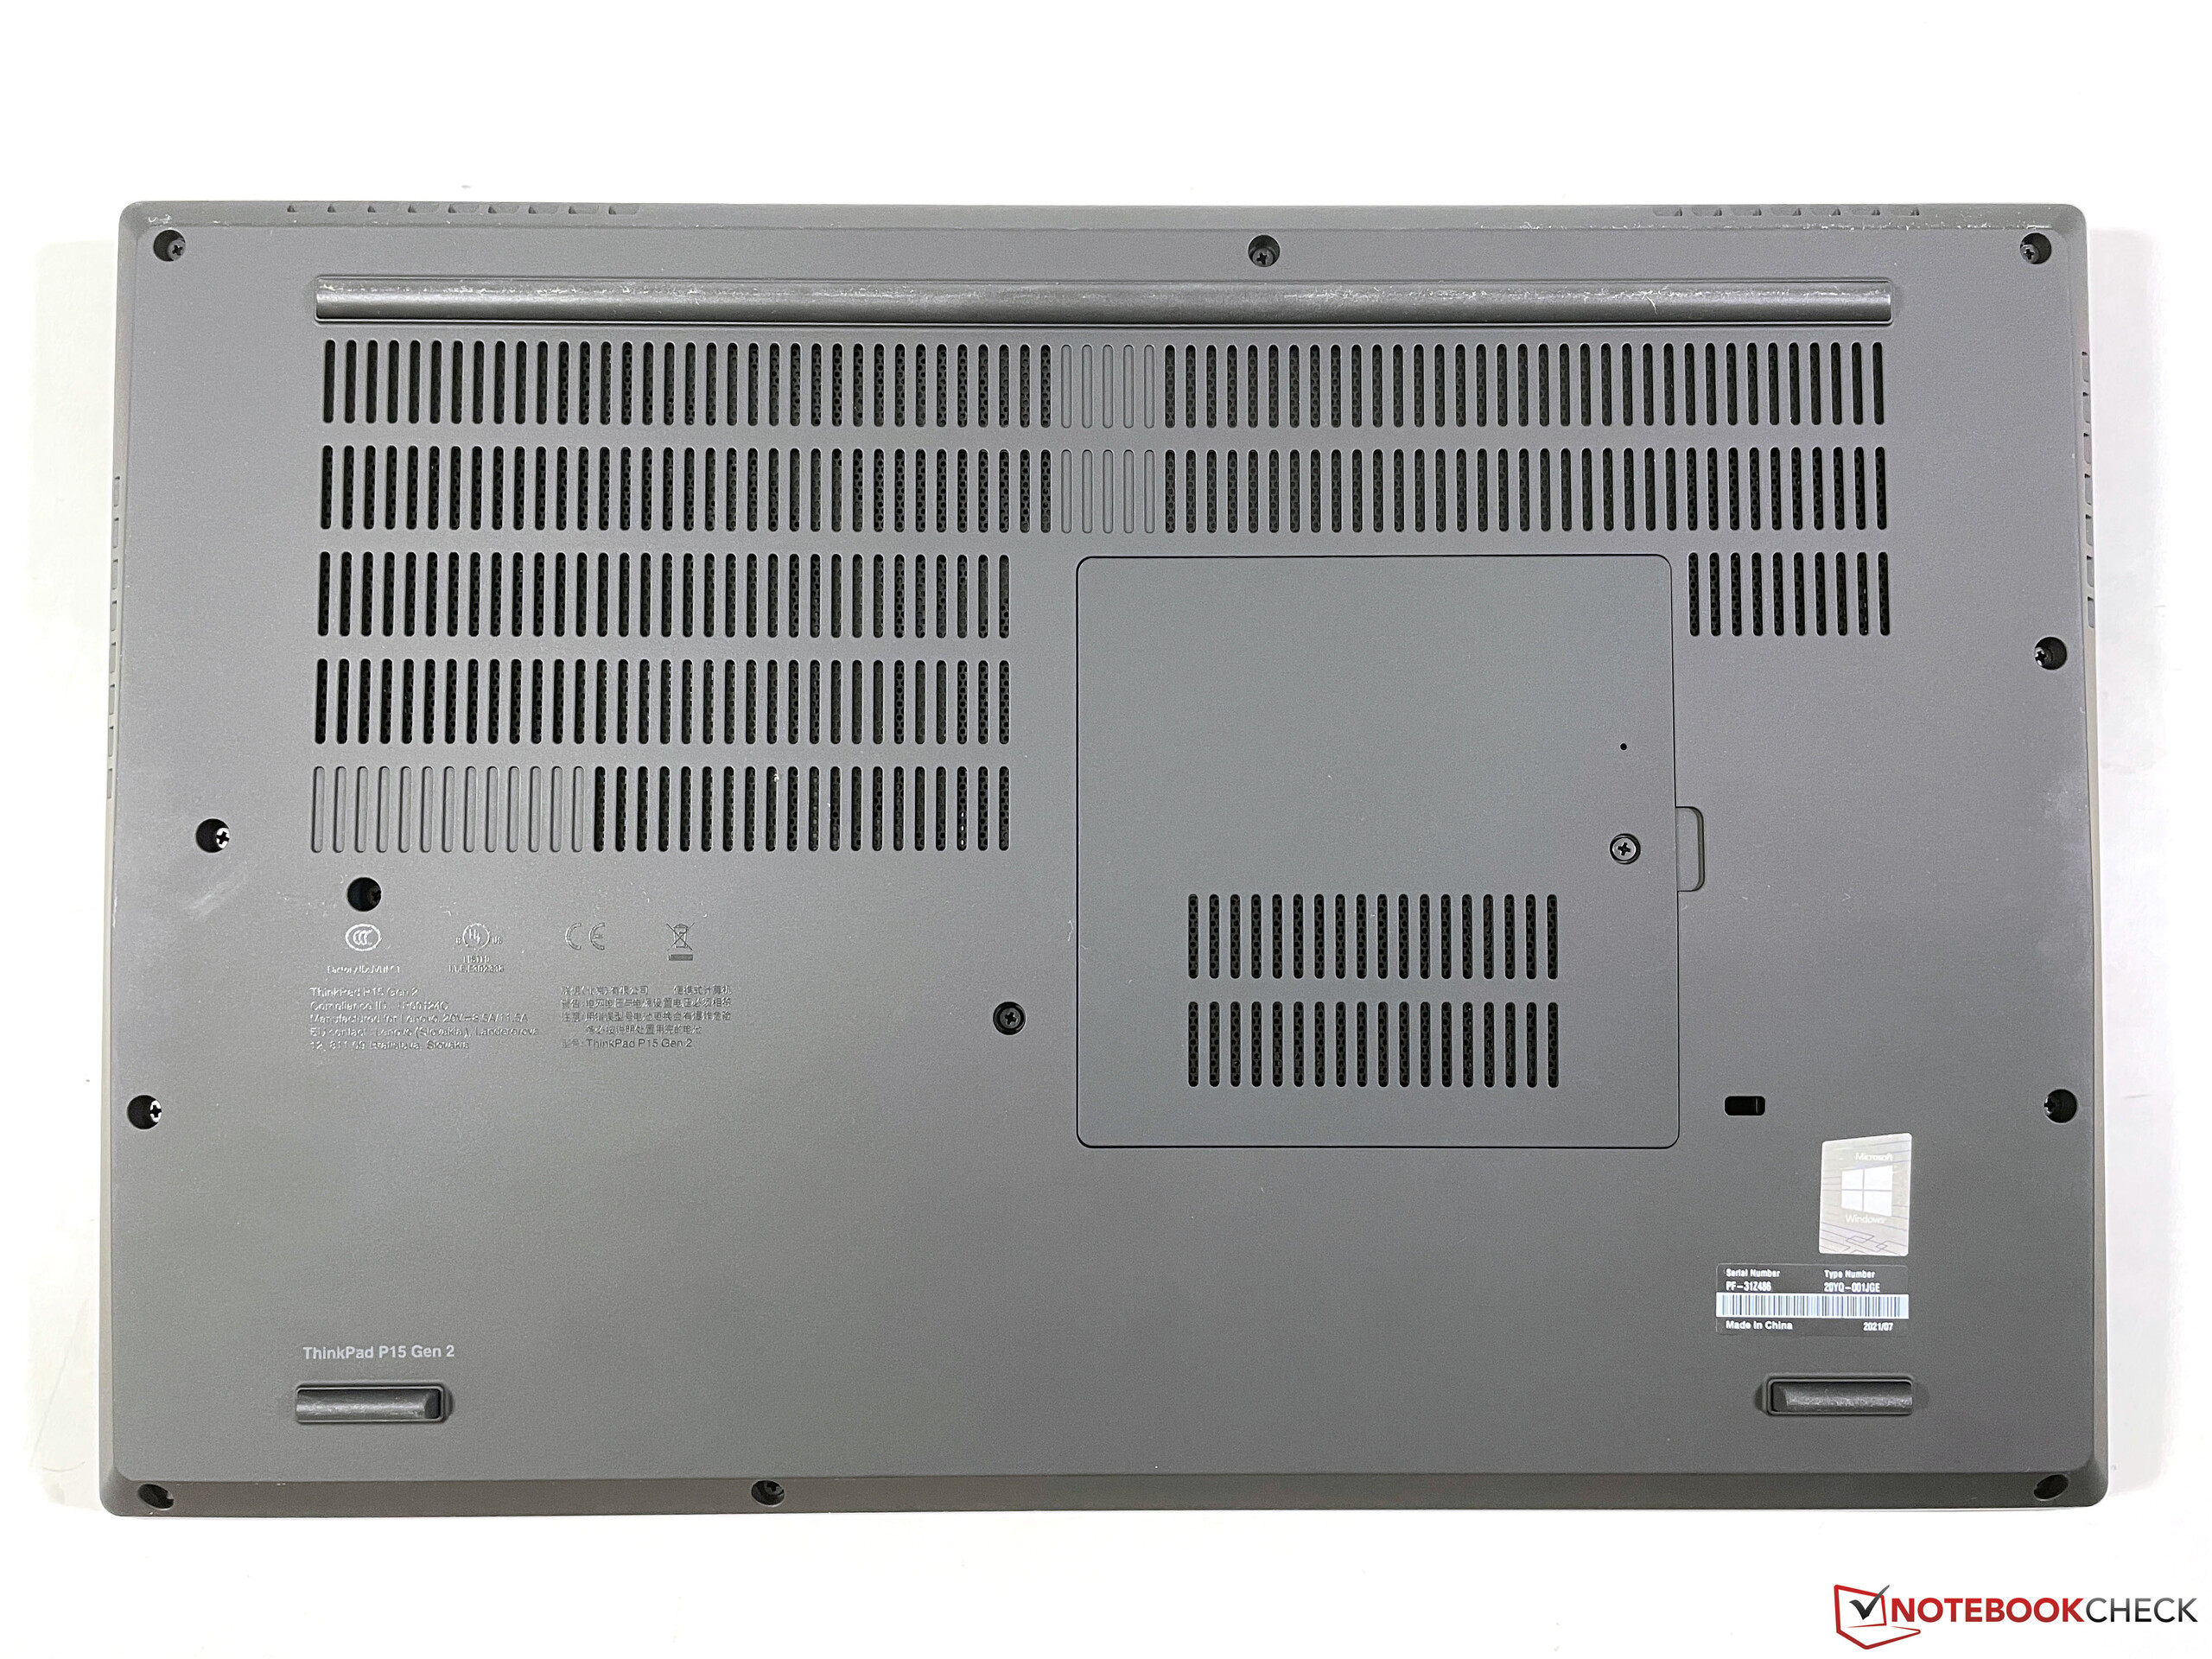
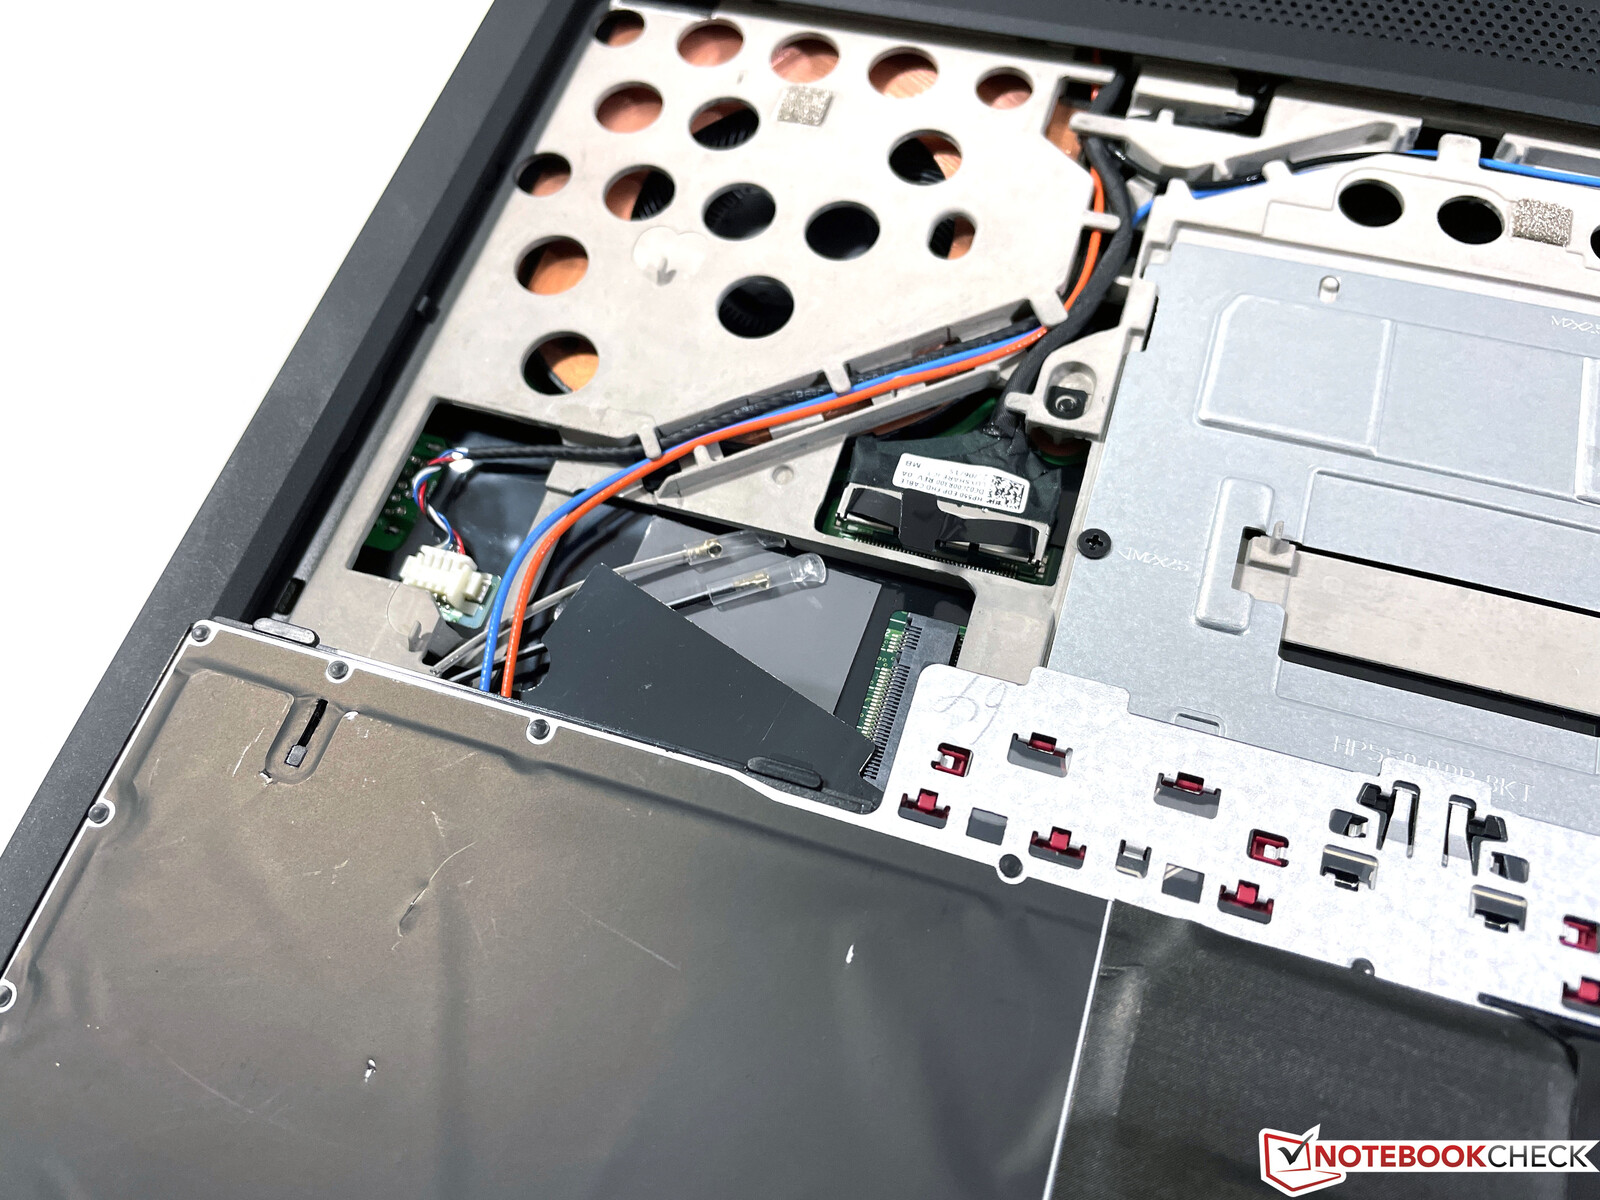
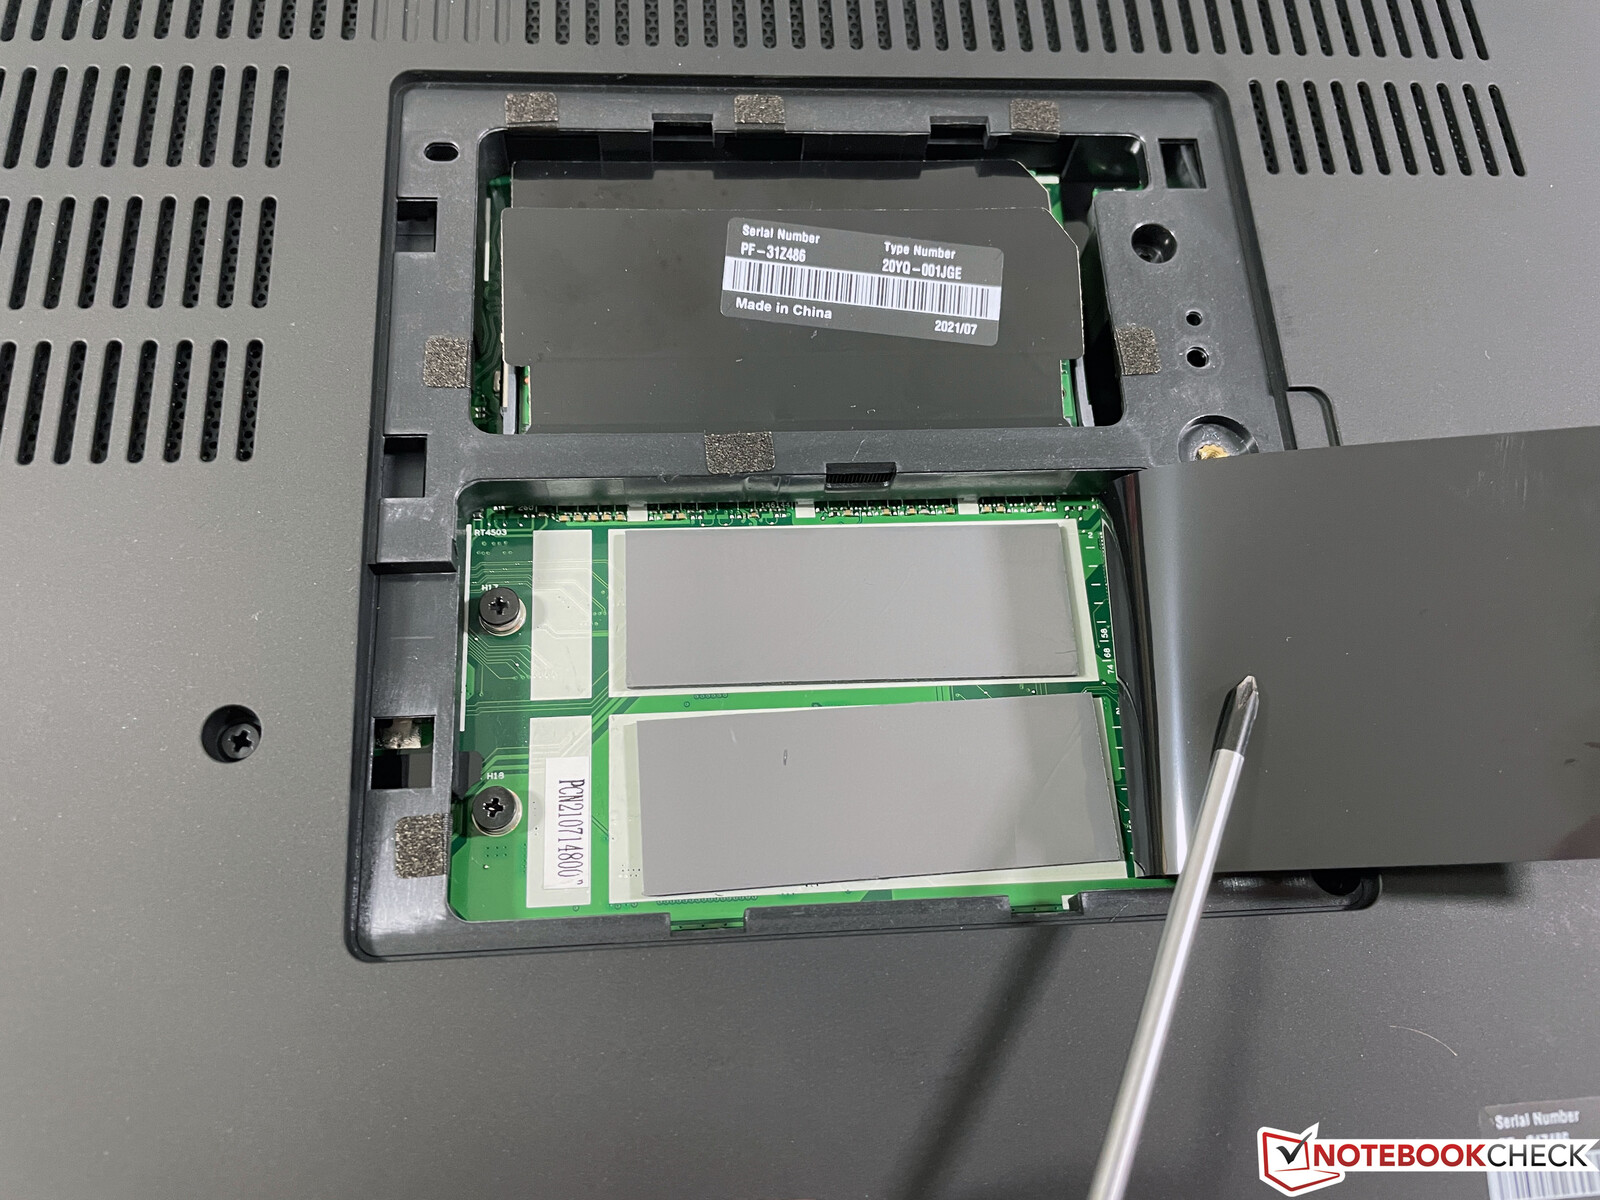
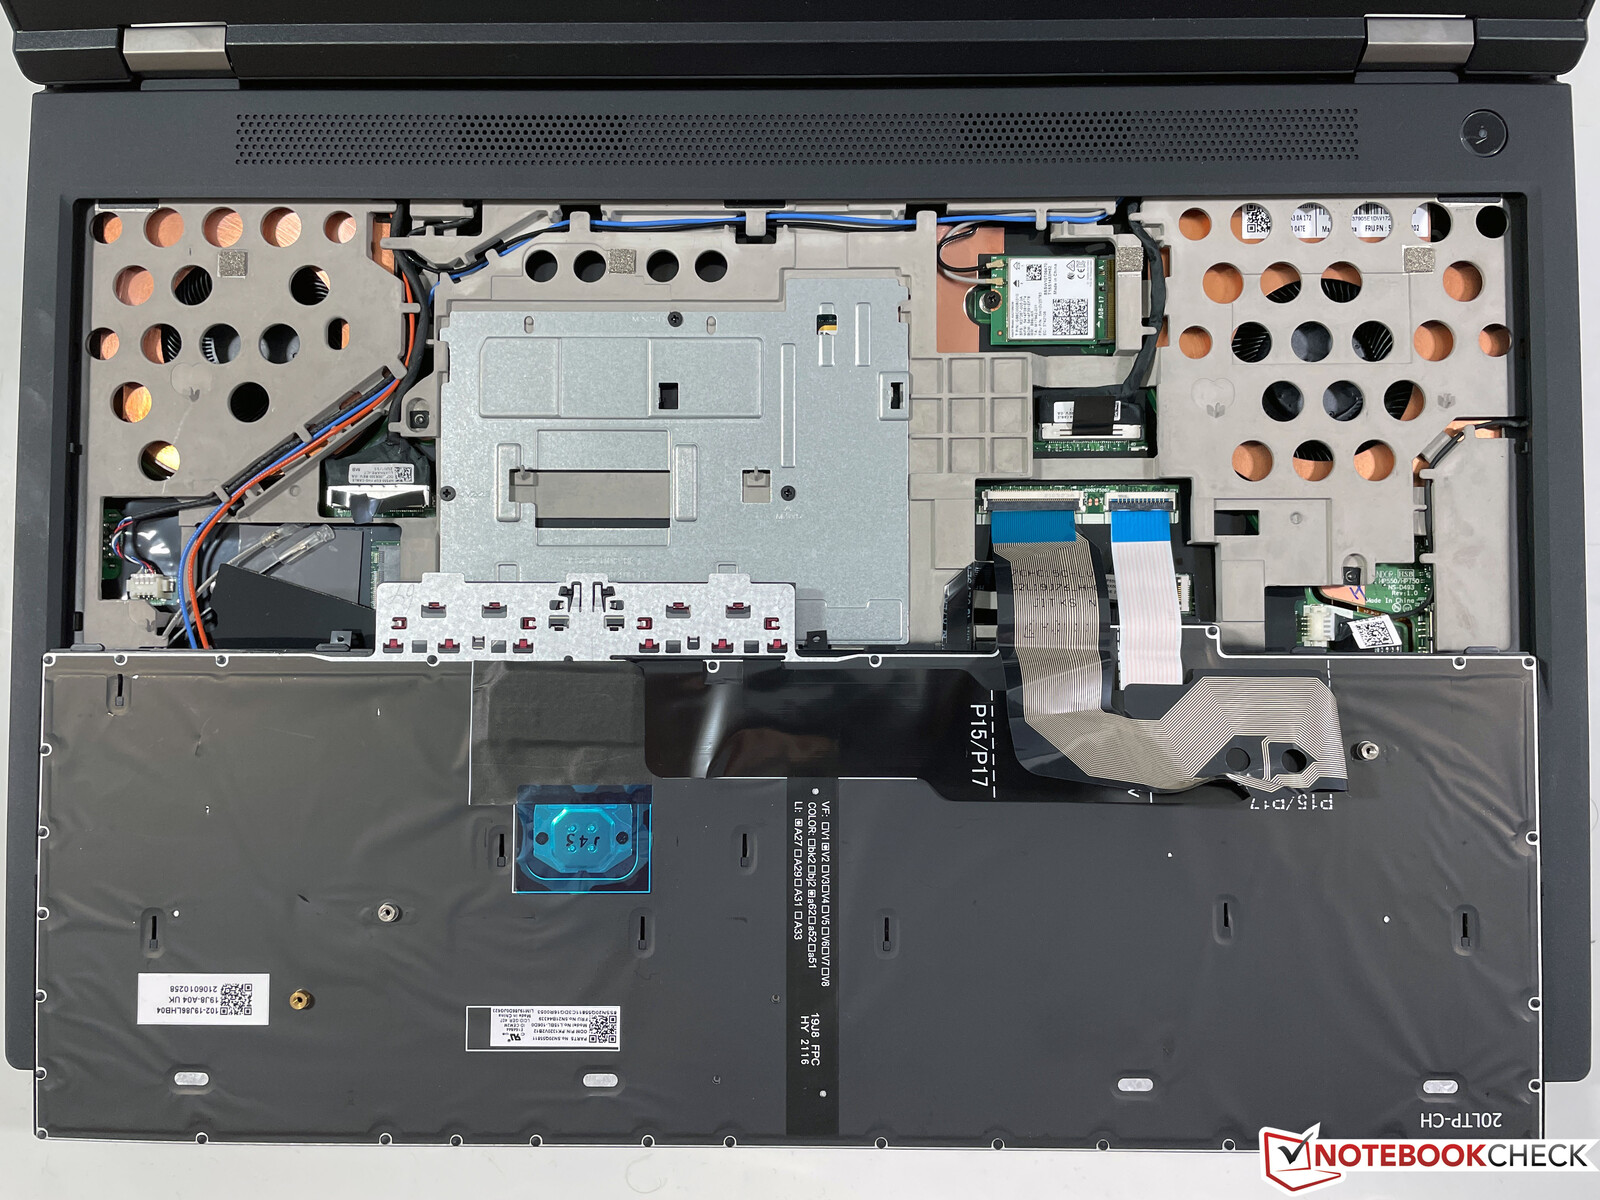
Maintenance
There's a maintenance hatch at the bottom, which allows you to quickly reach two of the four RAM slots and two of the three M.2-2280 slots. In order to access the rest of the components, though, you have to remove the keyboard, which isn't exactly trivial considering that there are additional covers here. To access the fans, the entire bottom cover needs to be removed. All in all, the maintenance options are very good, although it's important to understand what you're doing.
Warranty
The ThinkPad P15 Gen 2 ships with a three-year warranty including on-site service by default. Optionally, you can extend the scope of the warranty as well as the warranty period for an additional charge.
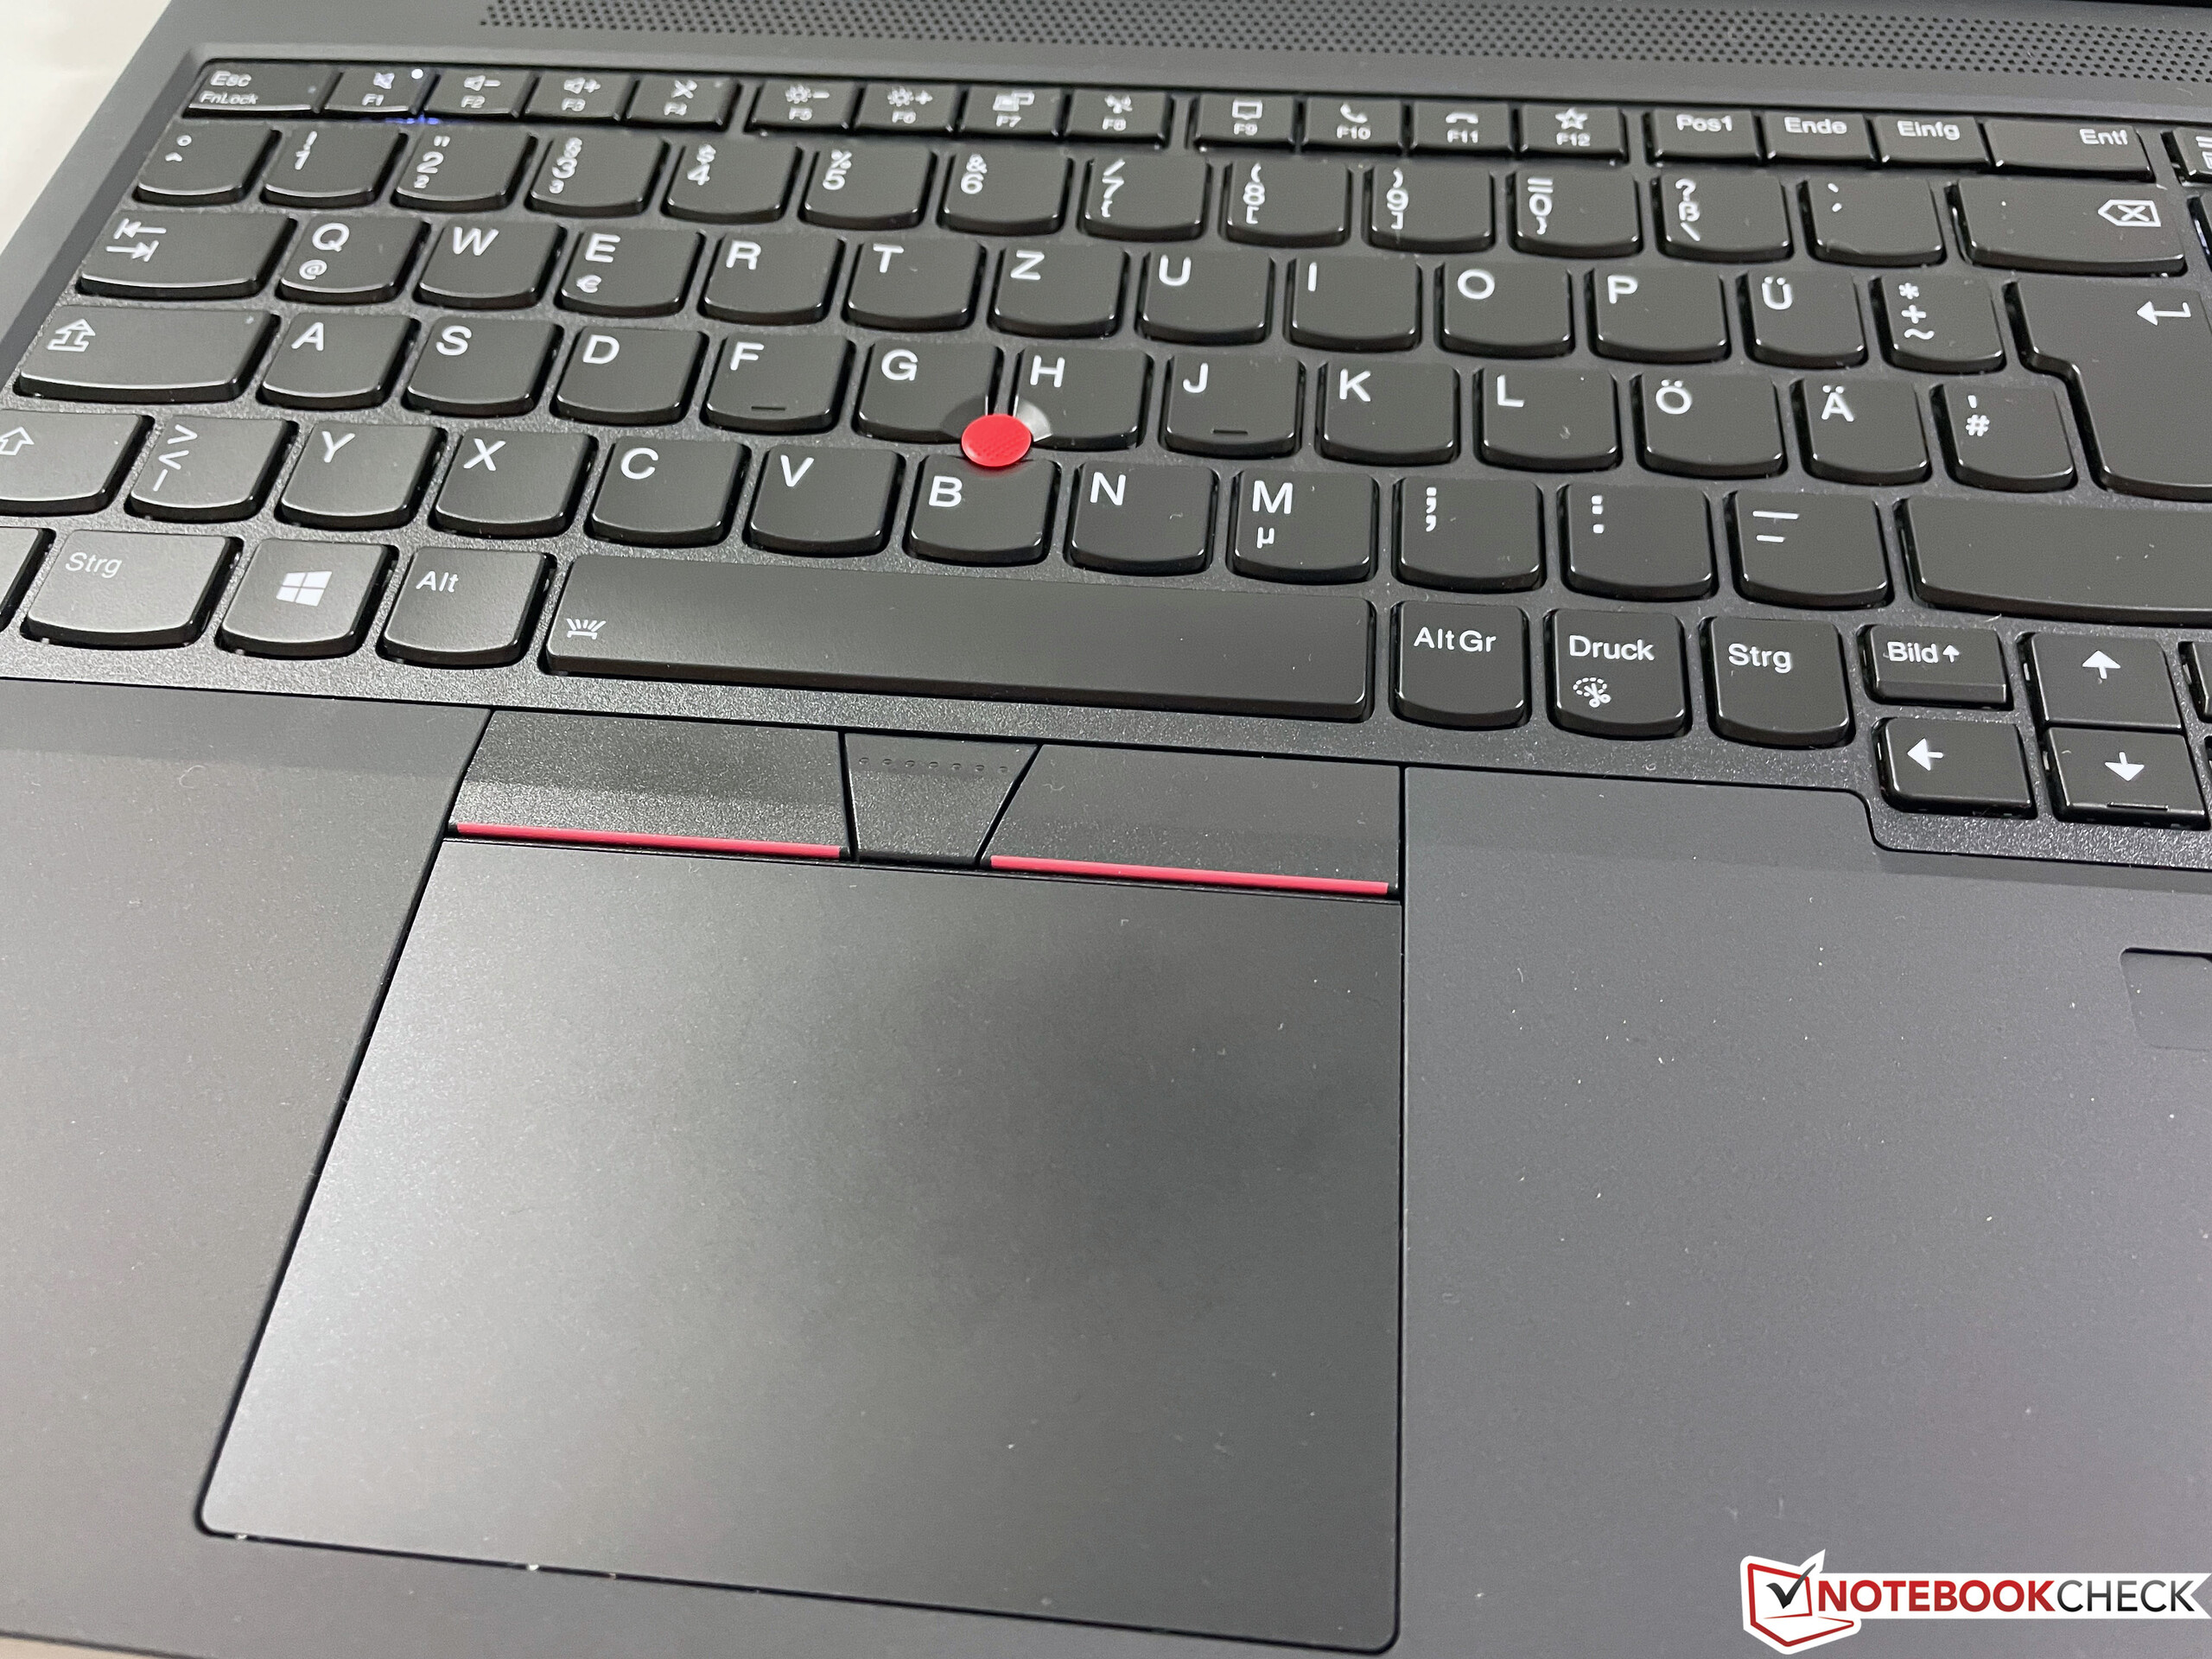
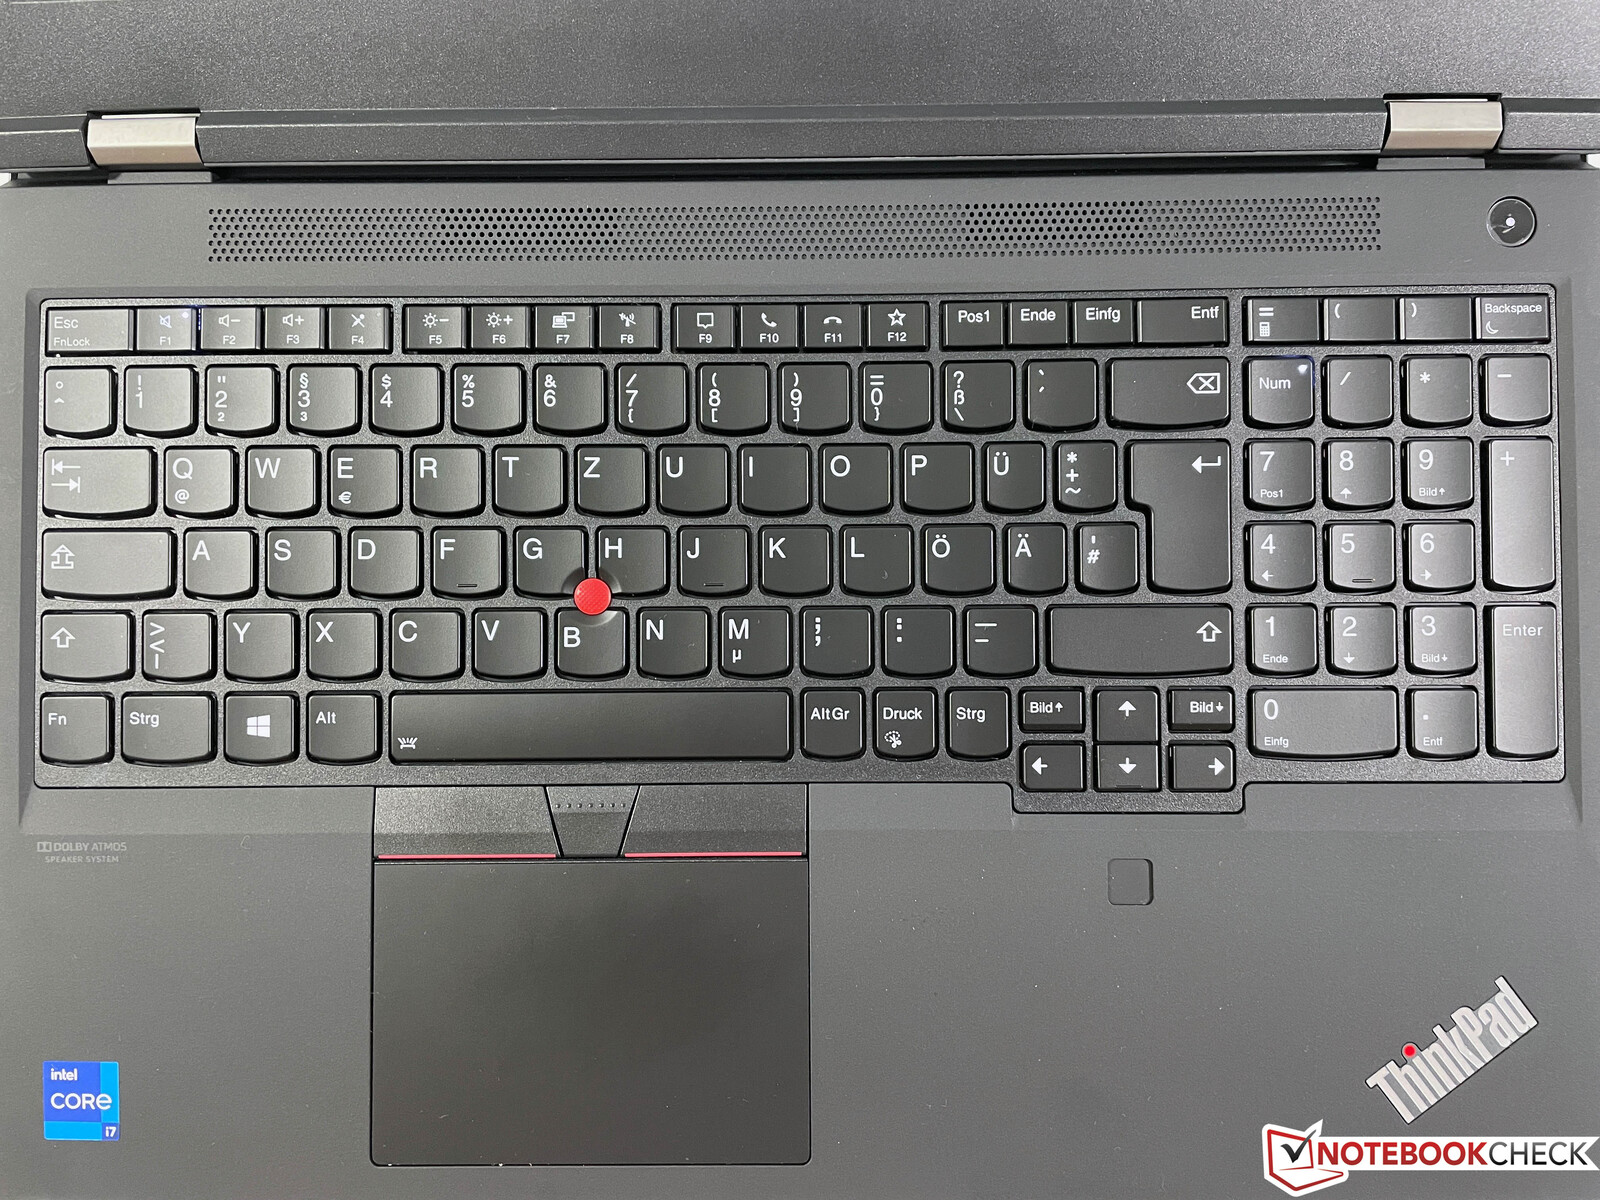
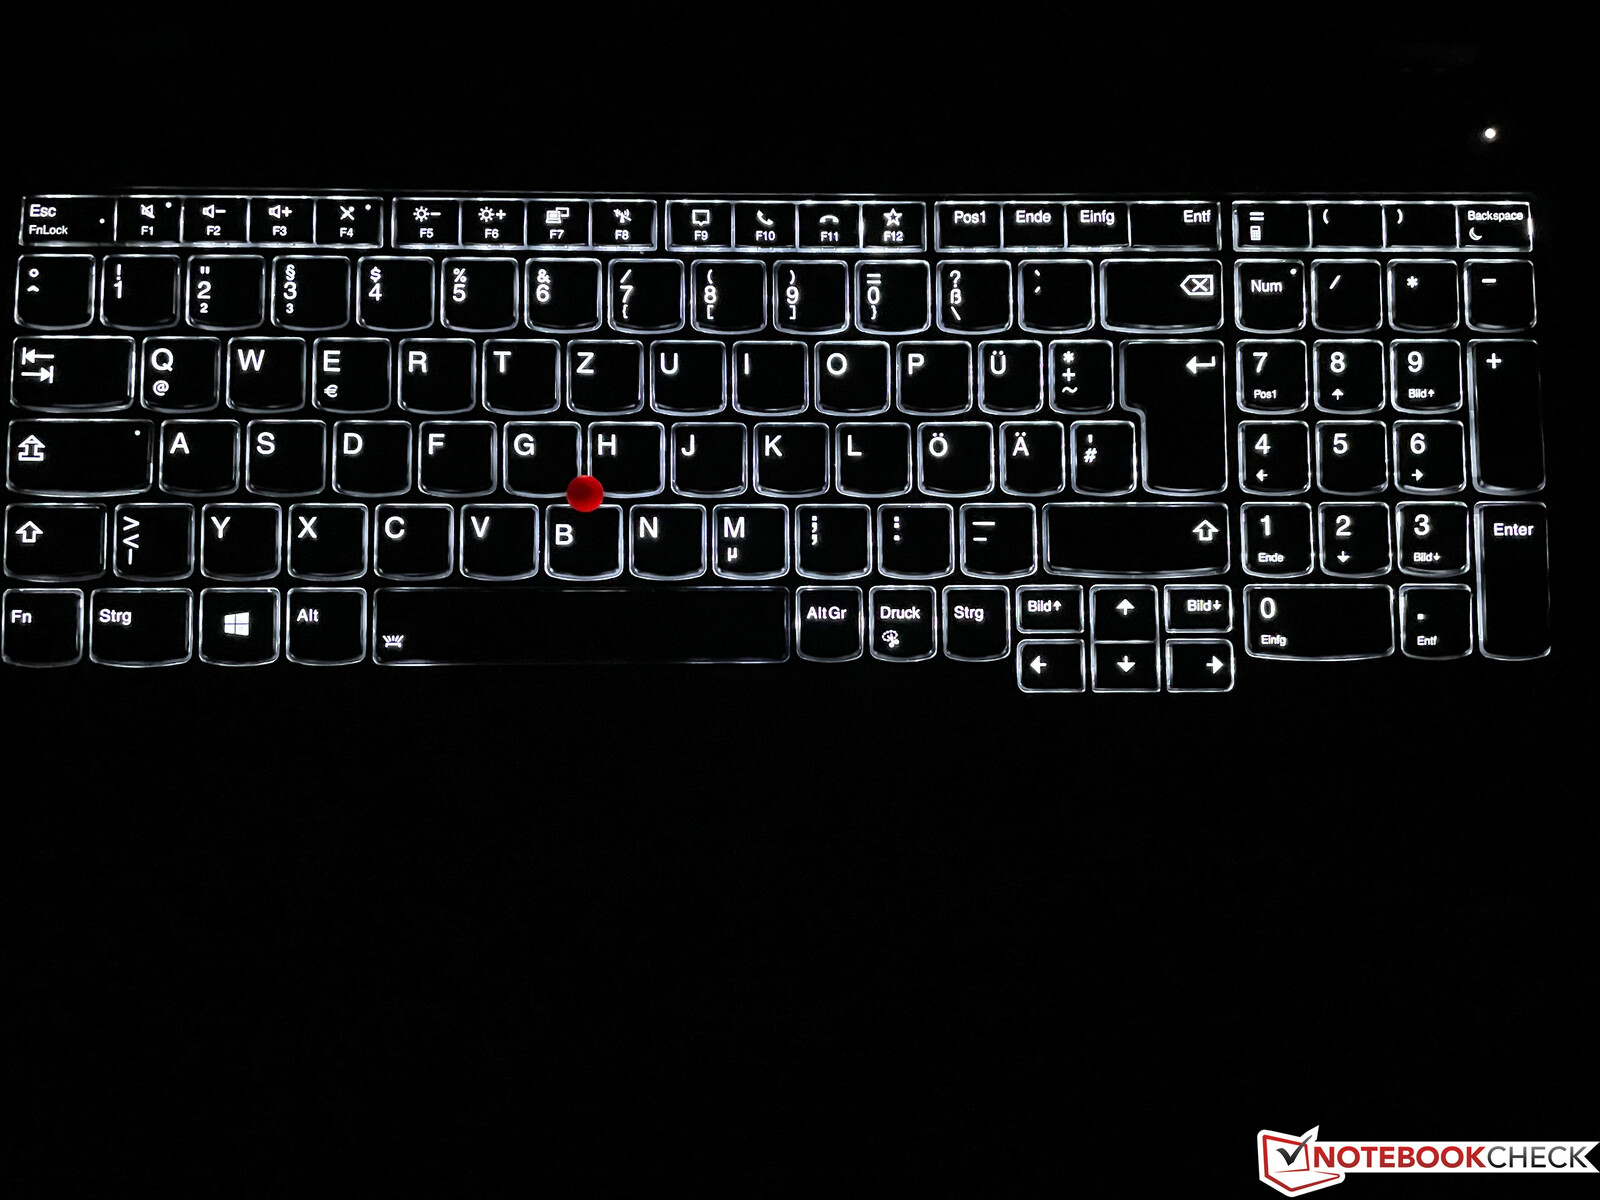
Input devices - The P15 clatters a bit once again
The input devices have also remained unchanged compared to the predecessor. Users still get the same generous key travel (1.8 mm) and therefore one of the best keyboards in the mobile sector. Furthermore, the manufacturer doesn't let the additional space of the base unit go to waste and installs a full-fledged numeric keypad. The two-stage white keyboard backlight allows typing comfortably in darker environments. However, there is one weakness: Just like in the predecessor, the keys in the lower left area rattle slightly, which affects the perceived quality a bit.
The ClickPad is slightly offset to the left and sits centered below the TrackPoint. The dedicated keys have been fitted properly, and they produce a muffled and high-quality clicking sound. The ClickPad itself doesn't rattle, either, and both input options work smoothly overall.
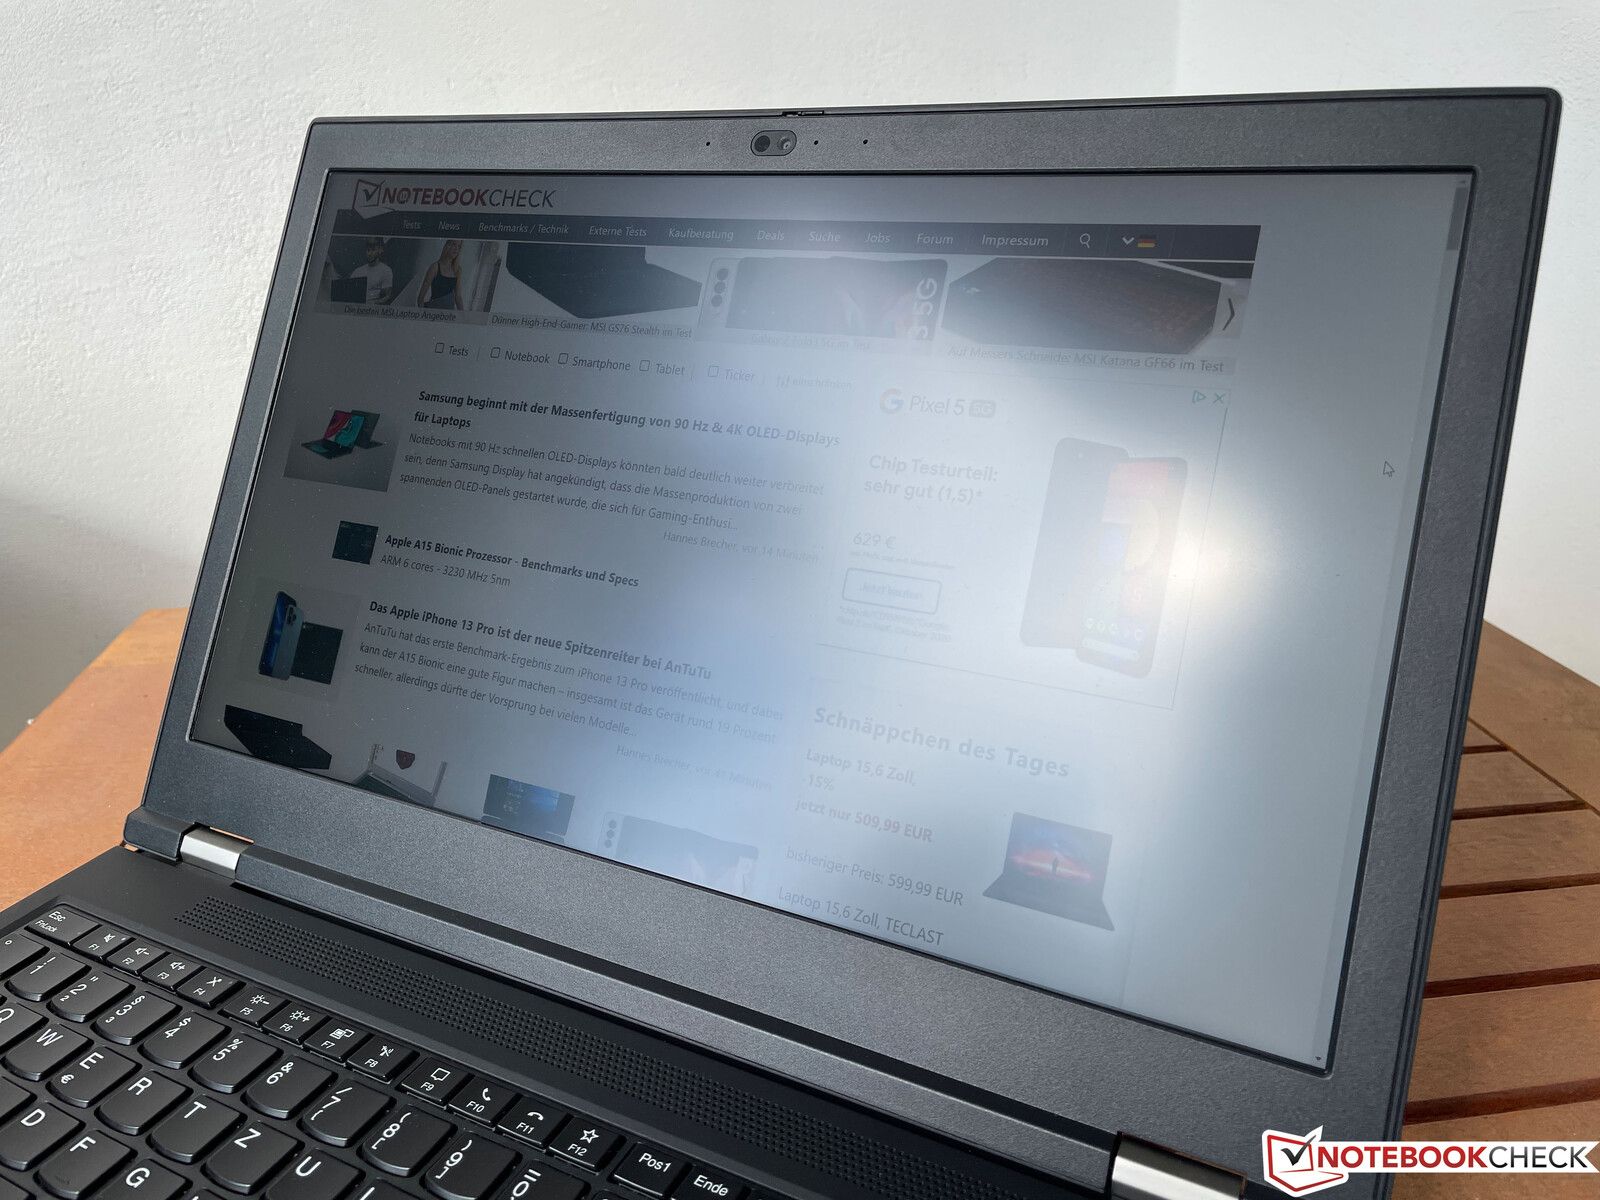
Display - 1080p HDR 500


Our test device is equipped with the optional 1080p panel that has a brightness of 500 cd/m². In addition, there are two 4K displays (IPS or OLED) available. As before, all displays feature the 16:9 aspect ratio. Our test device's subjective image impression is very good because bright surfaces don't look grainy despite the matte surface. Furthermore, response times are decent, meaning that there is no bothersome ghosting to be seen.
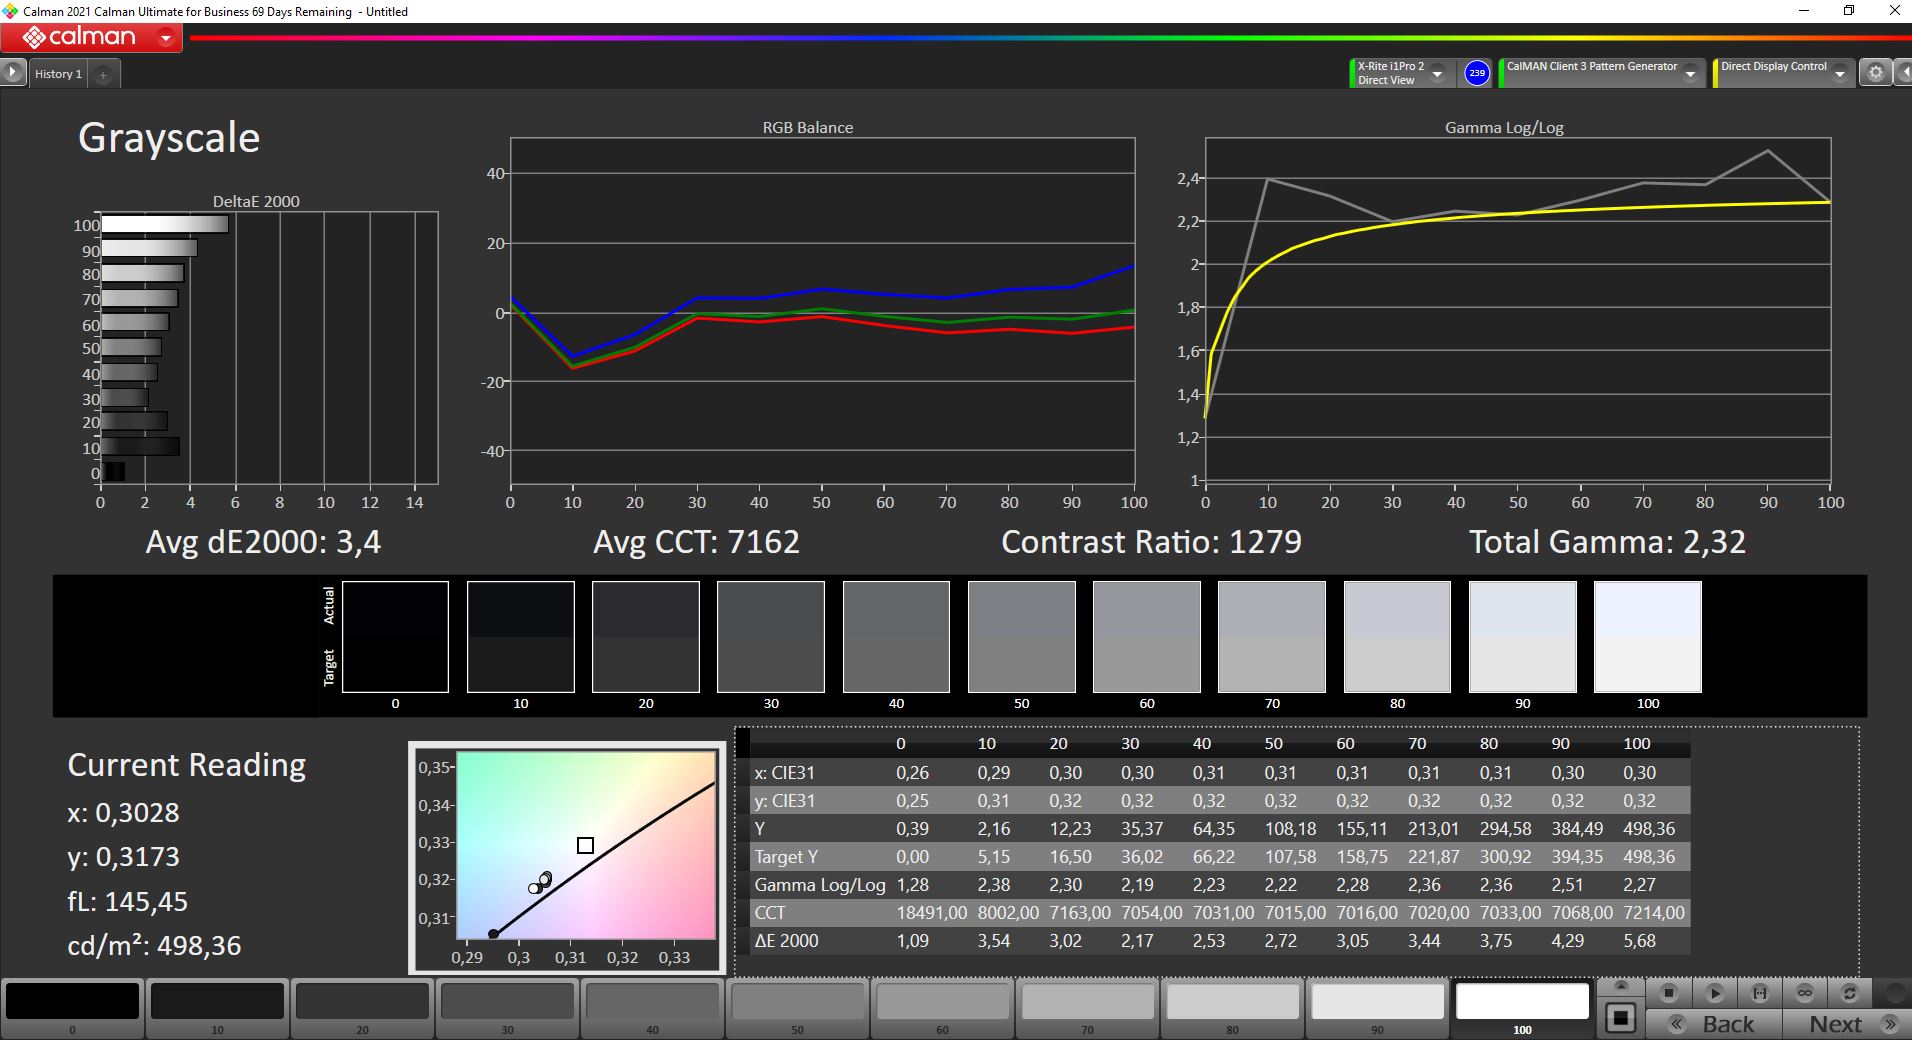
The 500-nit panel also performs much better overall than the standard 300-nit counterpart that we reviewed in the predecessor, P15 Gen 1. The display just misses the advertised brightness with around 490 cd/m², but the black level is slightly high. Nevertheless, the contrast ratio is still good at over 1,200:1.
| |||||||||||||||||||||||||
Brightness Distribution: 95 %
Center on Battery: 499 cd/m²
Contrast: 1277:1 (Black: 0.39 cd/m²)
ΔE ColorChecker Calman: 2.1 | ∀{0.5-29.43 Ø4.75}
calibrated: 0.8
ΔE Greyscale Calman: 3.4 | ∀{0.09-98 Ø5}
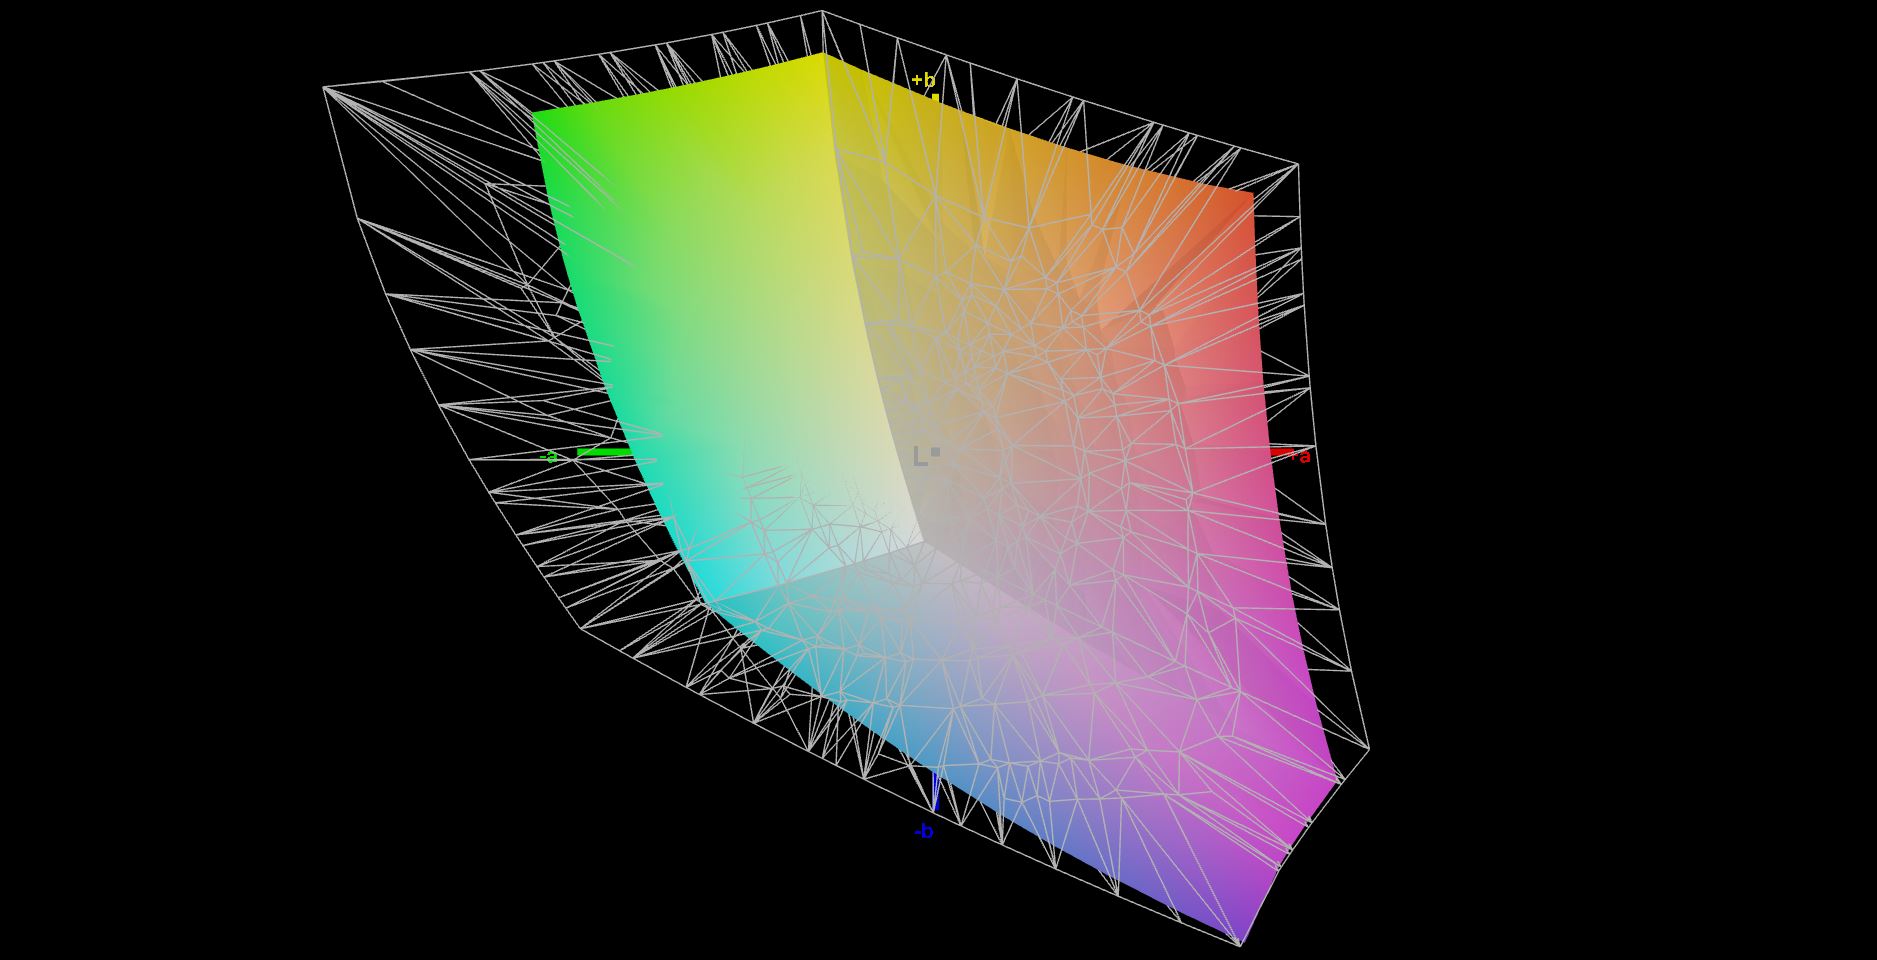
70.6% AdobeRGB 1998 (Argyll 3D)
99.8% sRGB (Argyll 3D)
68.6% Display P3 (Argyll 3D)
Gamma: 2.32
CCT: 7162 K
| Lenovo ThinkPad P15 G2-20YQ001JGE N156HCE_GN1, IPS, 1920x1080, 15.6" | HP ZBook Studio 15 G8 SDC4145, OLED, 3840x2160, 15.6" | HP ZBook Fury 15 G7 LG Philips LGD0661, IPS, 3840x2160, 15.6" | Dell Precision 7550 AU Optronics B156ZAN, IPS, 3840x2160, 15.6" | MSI WS66 10TMT-207US AU Optronics B156HAB03.0, IPS, 1920x1080, 15.6" | Lenovo ThinkPad P15 Gen1-20ST000DGE N156HCE-EN1, a-Si IPS LED, 1920x1080, 15.6" | |
|---|---|---|---|---|---|---|
| Display | 27% | 20% | 19% | -10% | -5% | |
| Display P3 Coverage (%) | 68.6 | 99.9 46% | 95.6 39% | 82.1 20% | 62.8 -8% | 66.6 -3% |
| sRGB Coverage (%) | 99.8 | 100 0% | 99.8 0% | 99.6 0% | 86.9 -13% | 92.3 -8% |
| AdobeRGB 1998 Coverage (%) | 70.6 | 95.3 35% | 84.5 20% | 96.8 37% | 63.6 -10% | 67.1 -5% |
| Response Times | 90% | -87% | -75% | -50% | -58% | |
| Response Time Grey 50% / Grey 80% * (ms) | 37.6 ? | 2.4 ? 94% | 56 ? -49% | 51.2 ? -36% | 44.8 ? -19% | 41.2 ? -10% |
| Response Time Black / White * (ms) | 16 ? | 2.4 ? 85% | 36 ? -125% | 34 ? -113% | 28.8 ? -80% | 32.8 ? -105% |
| PWM Frequency (Hz) | 26040 ? | 240.4 ? | 24270 | |||
| Screen | -71% | -40% | -69% | -73% | -75% | |
| Brightness middle (cd/m²) | 498 | 379.6 -24% | 672.8 35% | 473.5 -5% | 374.5 -25% | 338 -32% |
| Brightness (cd/m²) | 490 | 380 -22% | 674 38% | 461 -6% | 363 -26% | 304 -38% |
| Brightness Distribution (%) | 95 | 95 0% | 89 -6% | 90 -5% | 91 -4% | 81 -15% |
| Black Level * (cd/m²) | 0.39 | 0.5 -28% | 0.55 -41% | 0.42 -8% | 0.45 -15% | |
| Contrast (:1) | 1277 | 1346 5% | 861 -33% | 892 -30% | 751 -41% | |
| Colorchecker dE 2000 * | 2.1 | 5.15 -145% | 3.48 -66% | 4.8 -129% | 4.05 -93% | 5.5 -162% |
| Colorchecker dE 2000 max. * | 5.6 | 7.79 -39% | 9.44 -69% | 8.73 -56% | 8.17 -46% | 11.5 -105% |
| Colorchecker dE 2000 calibrated * | 0.8 | 3.1 -288% | 3.03 -279% | 3.08 -285% | 4.36 -445% | 1.9 -137% |
| Greyscale dE 2000 * | 3.4 | 2.6 24% | 3.1 9% | 5.6 -65% | 2.6 24% | 7.8 -129% |
| Gamma | 2.32 95% | 1.99 111% | 2.04 108% | 2.34 94% | 2.21 100% | 2.24 98% |
| CCT | 7162 91% | 6166 105% | 6380 102% | 7549 86% | 7027 93% | 6764 96% |
| Color Space (Percent of AdobeRGB 1998) (%) | 75.2 | 86.4 | 56.4 | 60 | ||
| Color Space (Percent of sRGB) (%) | 100 | 99.7 | 86.3 | 92.1 | ||
| Total Average (Program / Settings) | 15% /
-20% | -36% /
-34% | -42% /
-51% | -44% /
-56% | -46% /
-58% |
* ... smaller is better
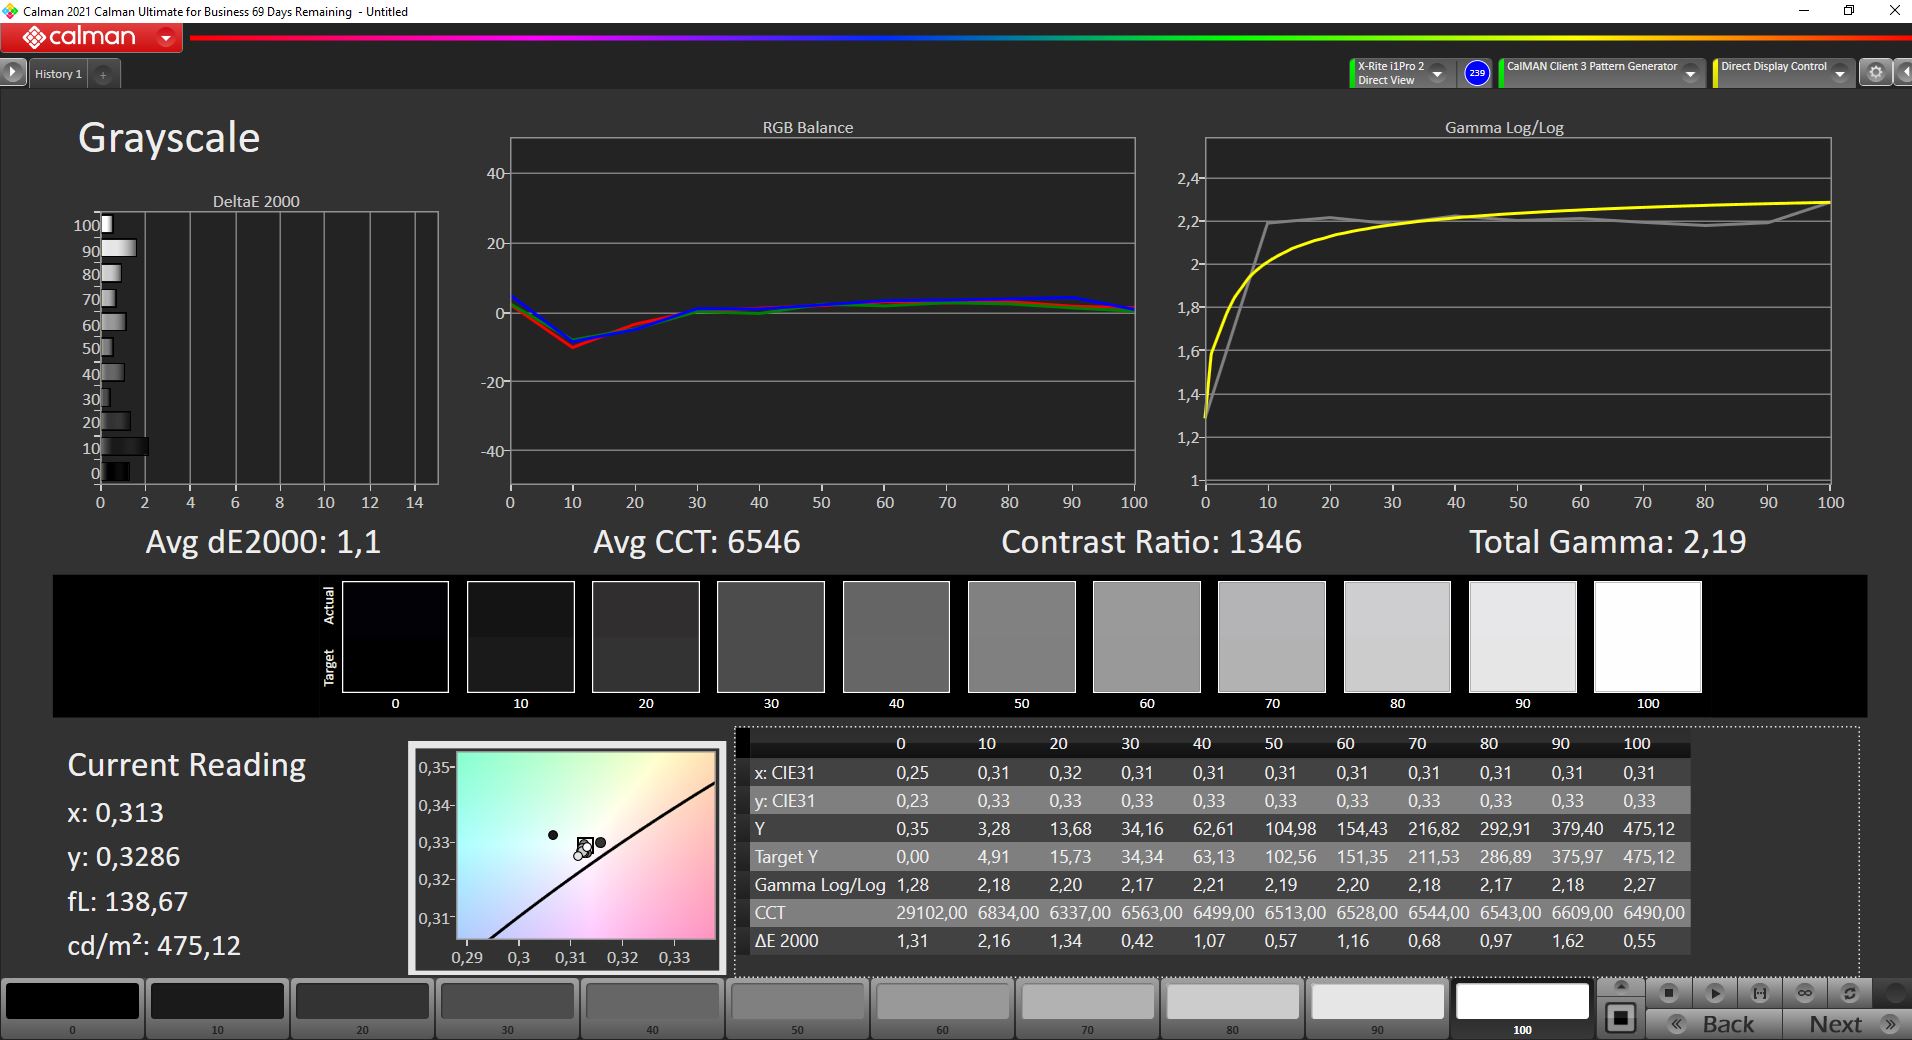
The factory calibration is decent, but we can see a slight blue tint in grayscales, and the color temperature is also a bit too cool. This "trick" is frequently used to increase the brightness. After our calibration (CalMAN and X-Rite i1 Pro 2), brightness drops slightly (~475 cd/m²), but there's no longer a color tint in return.
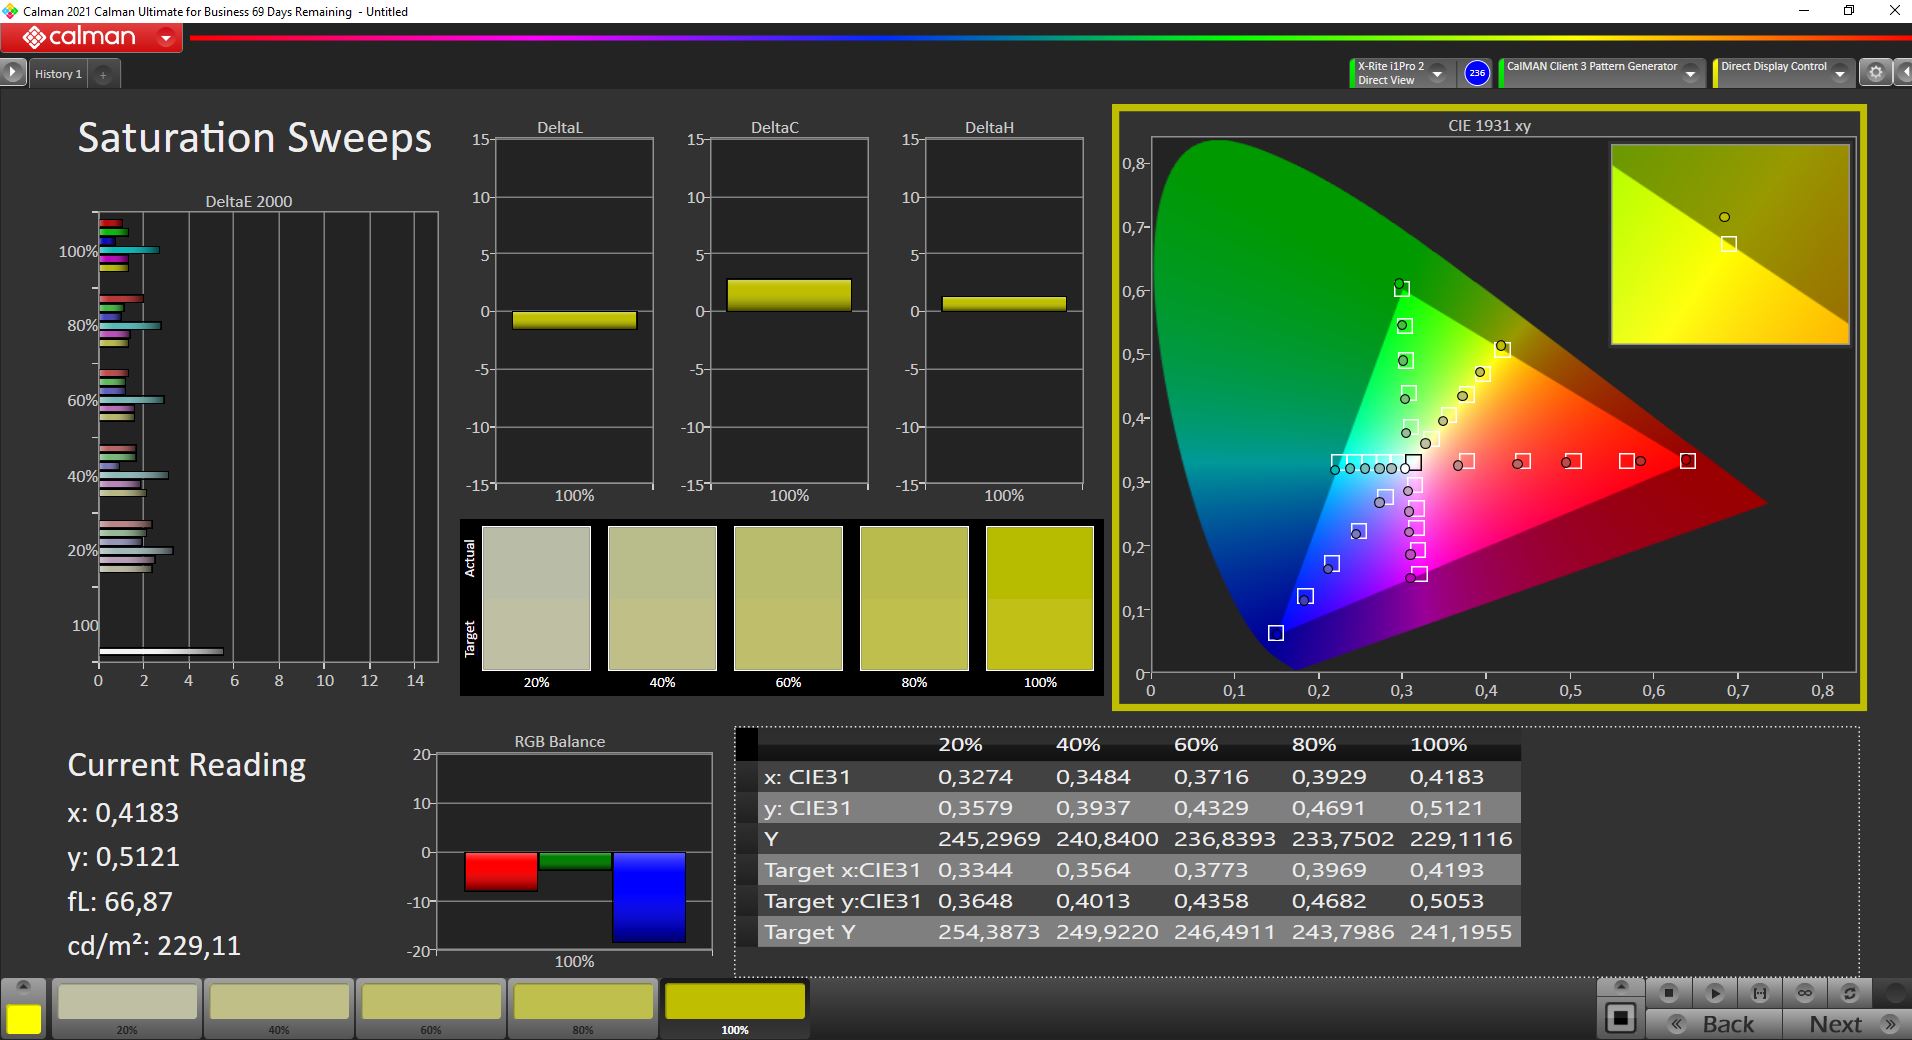
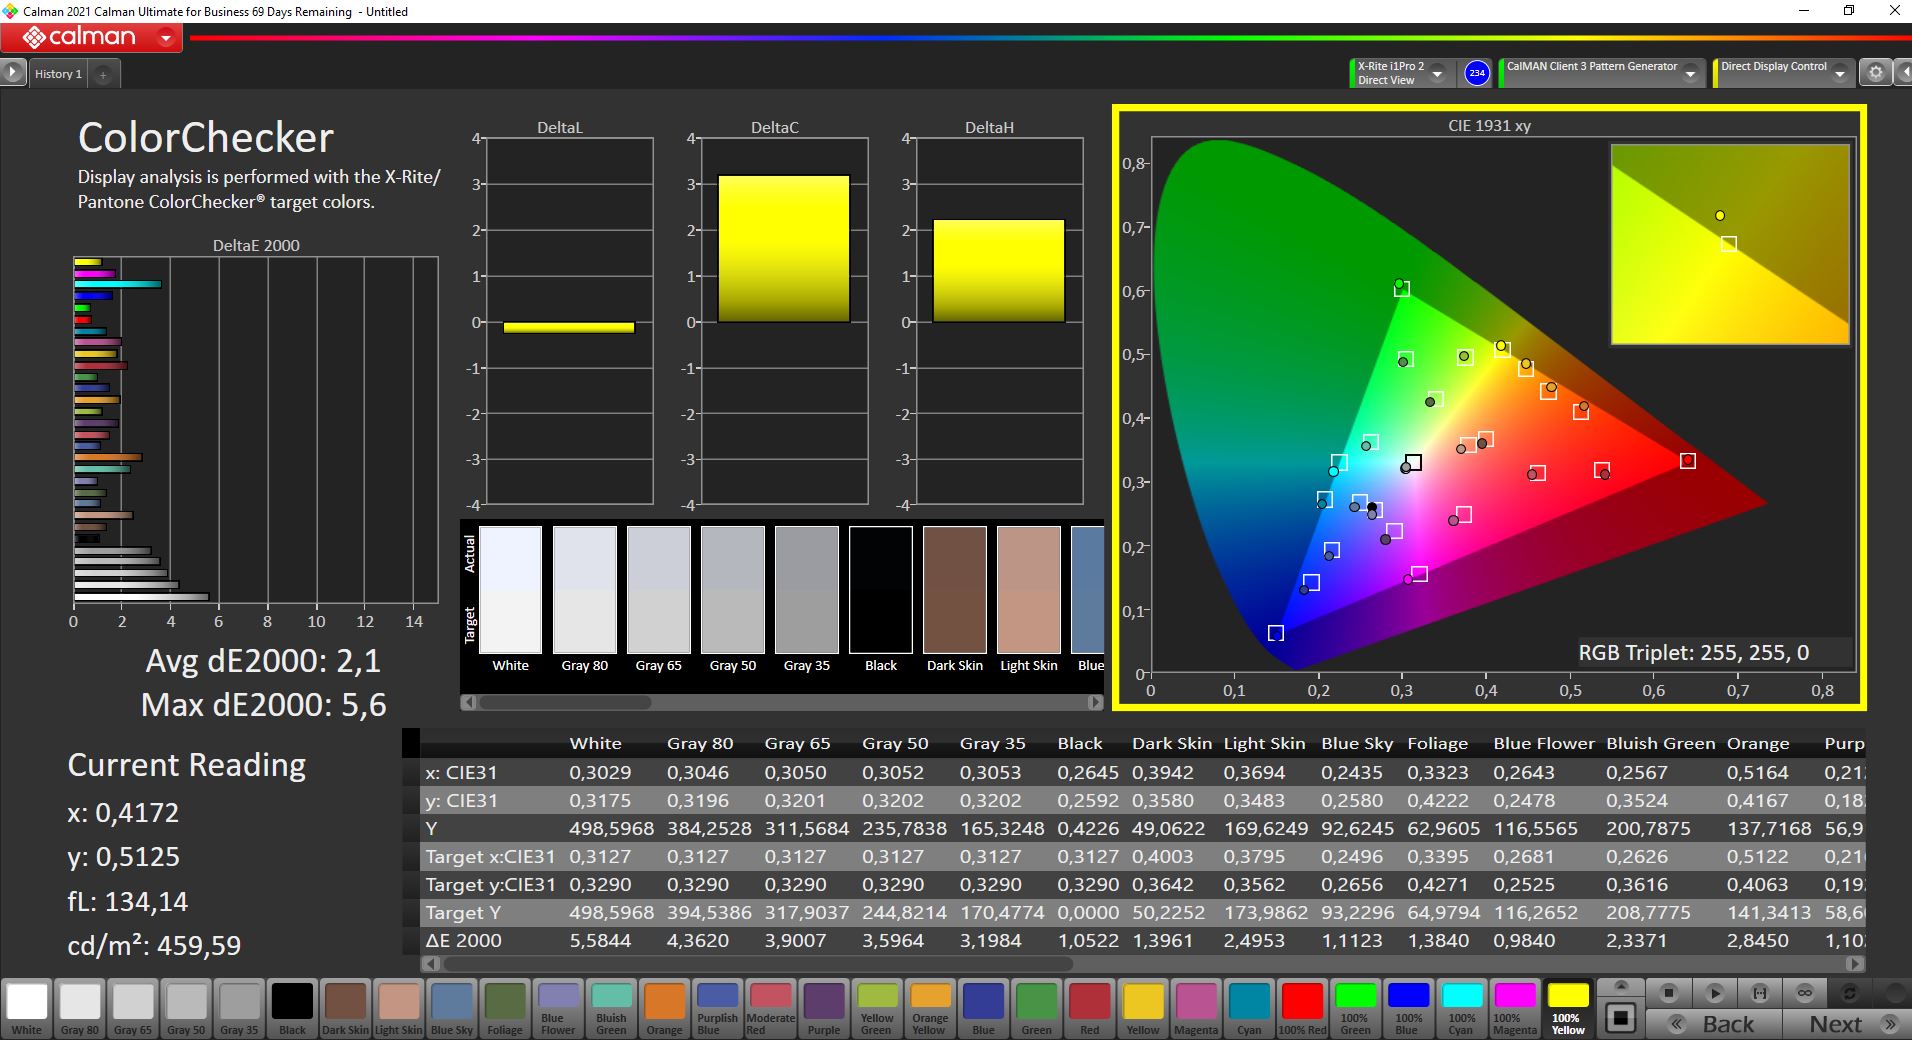
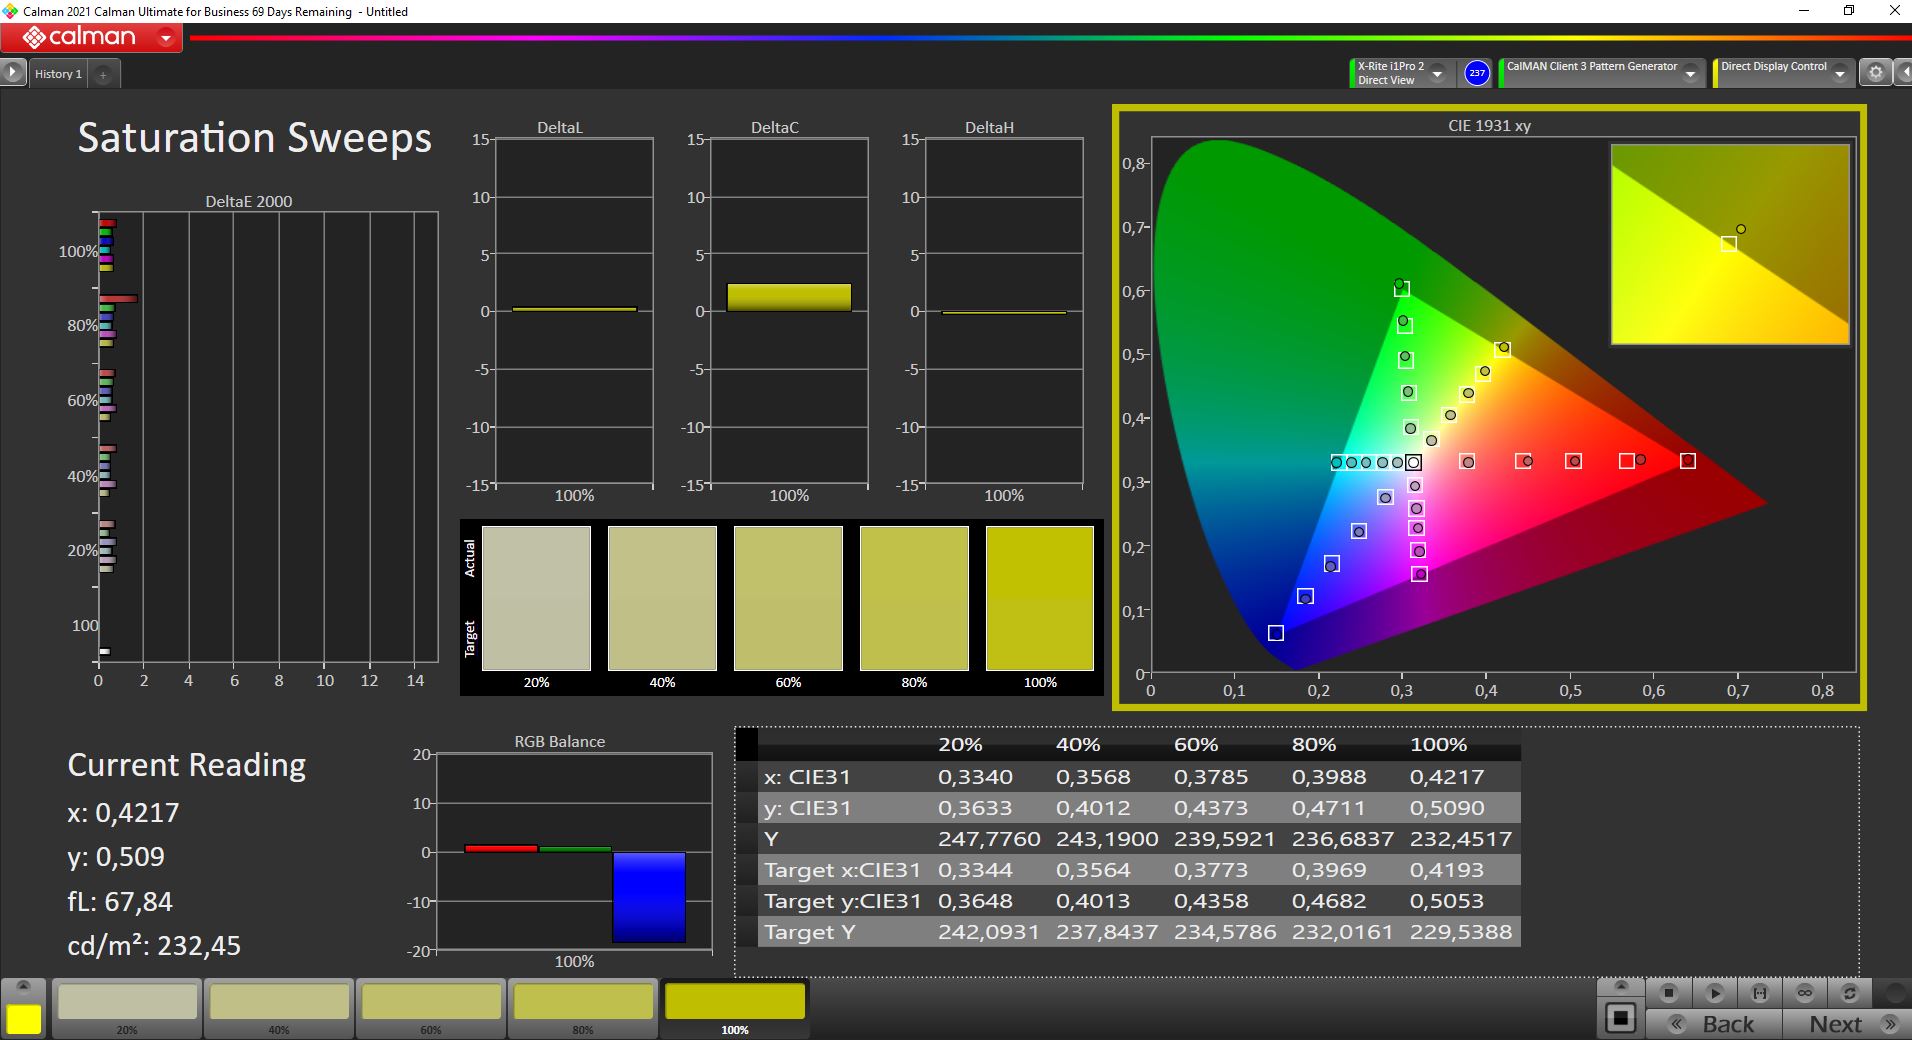
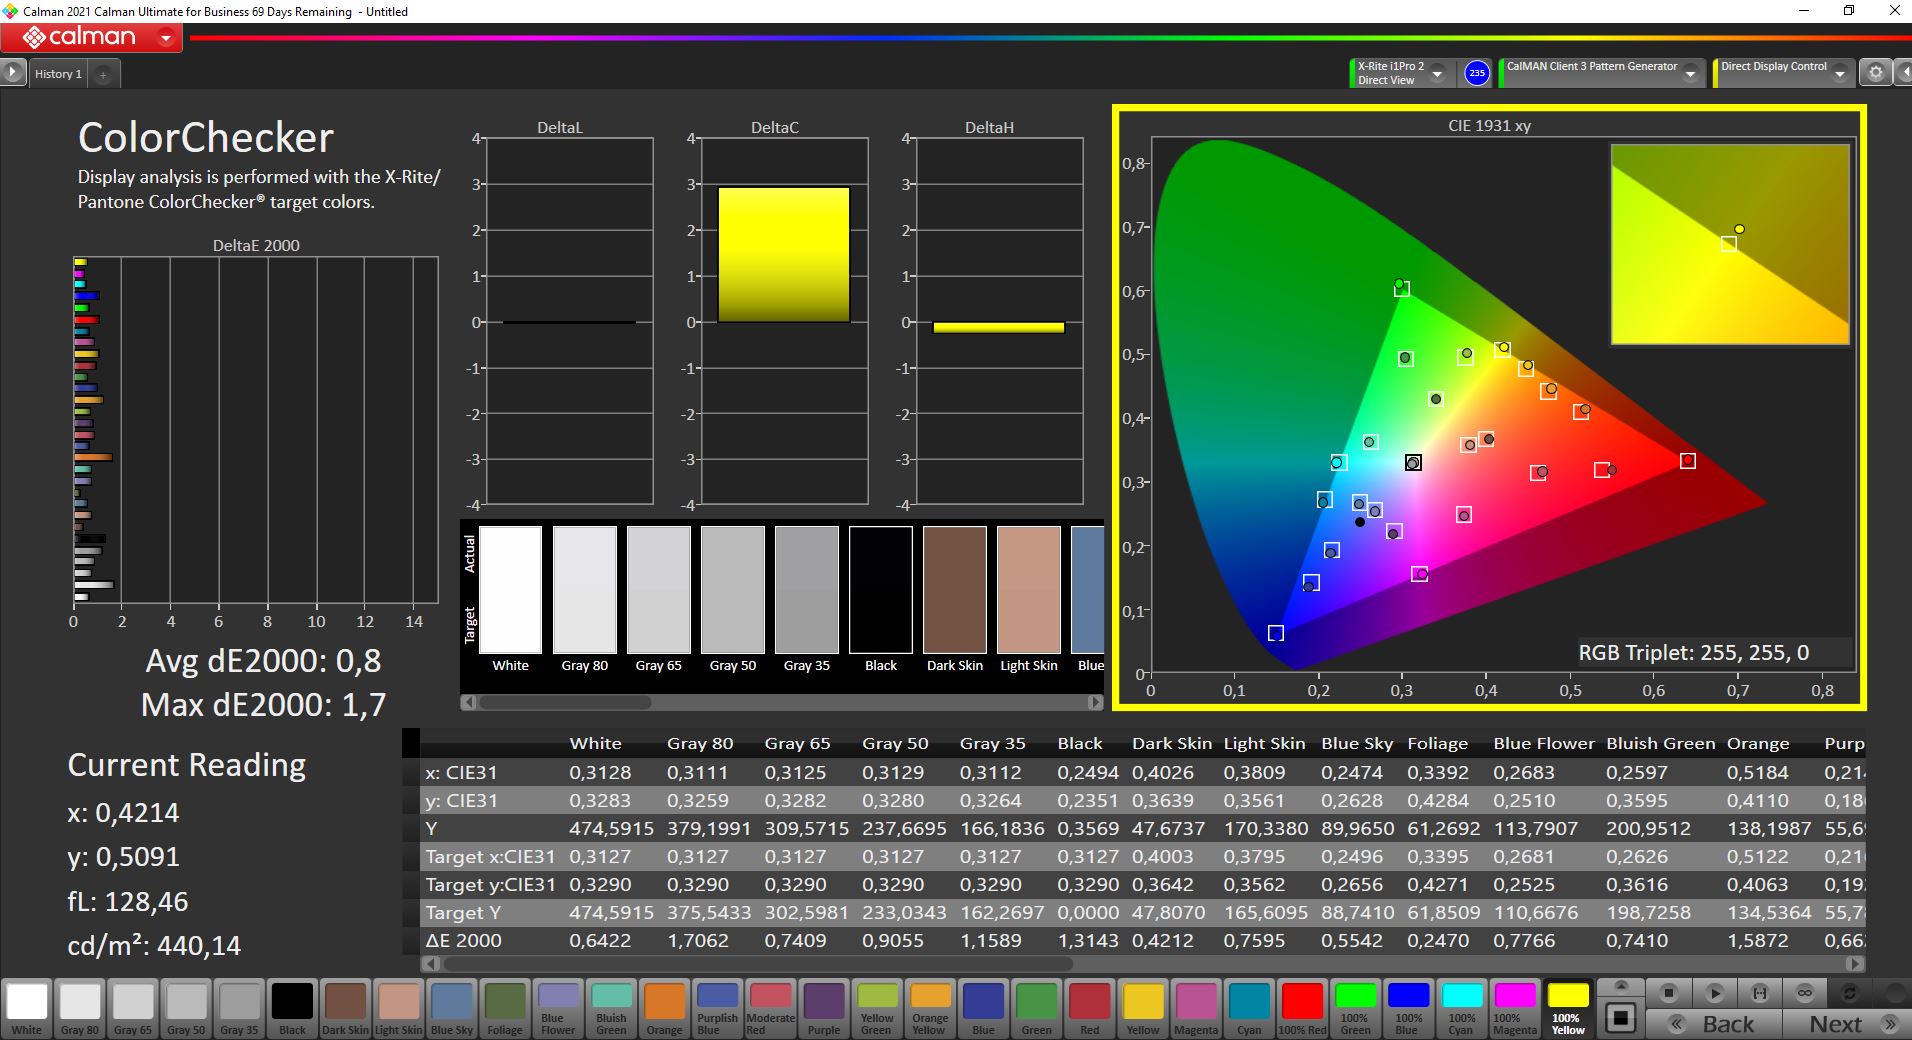
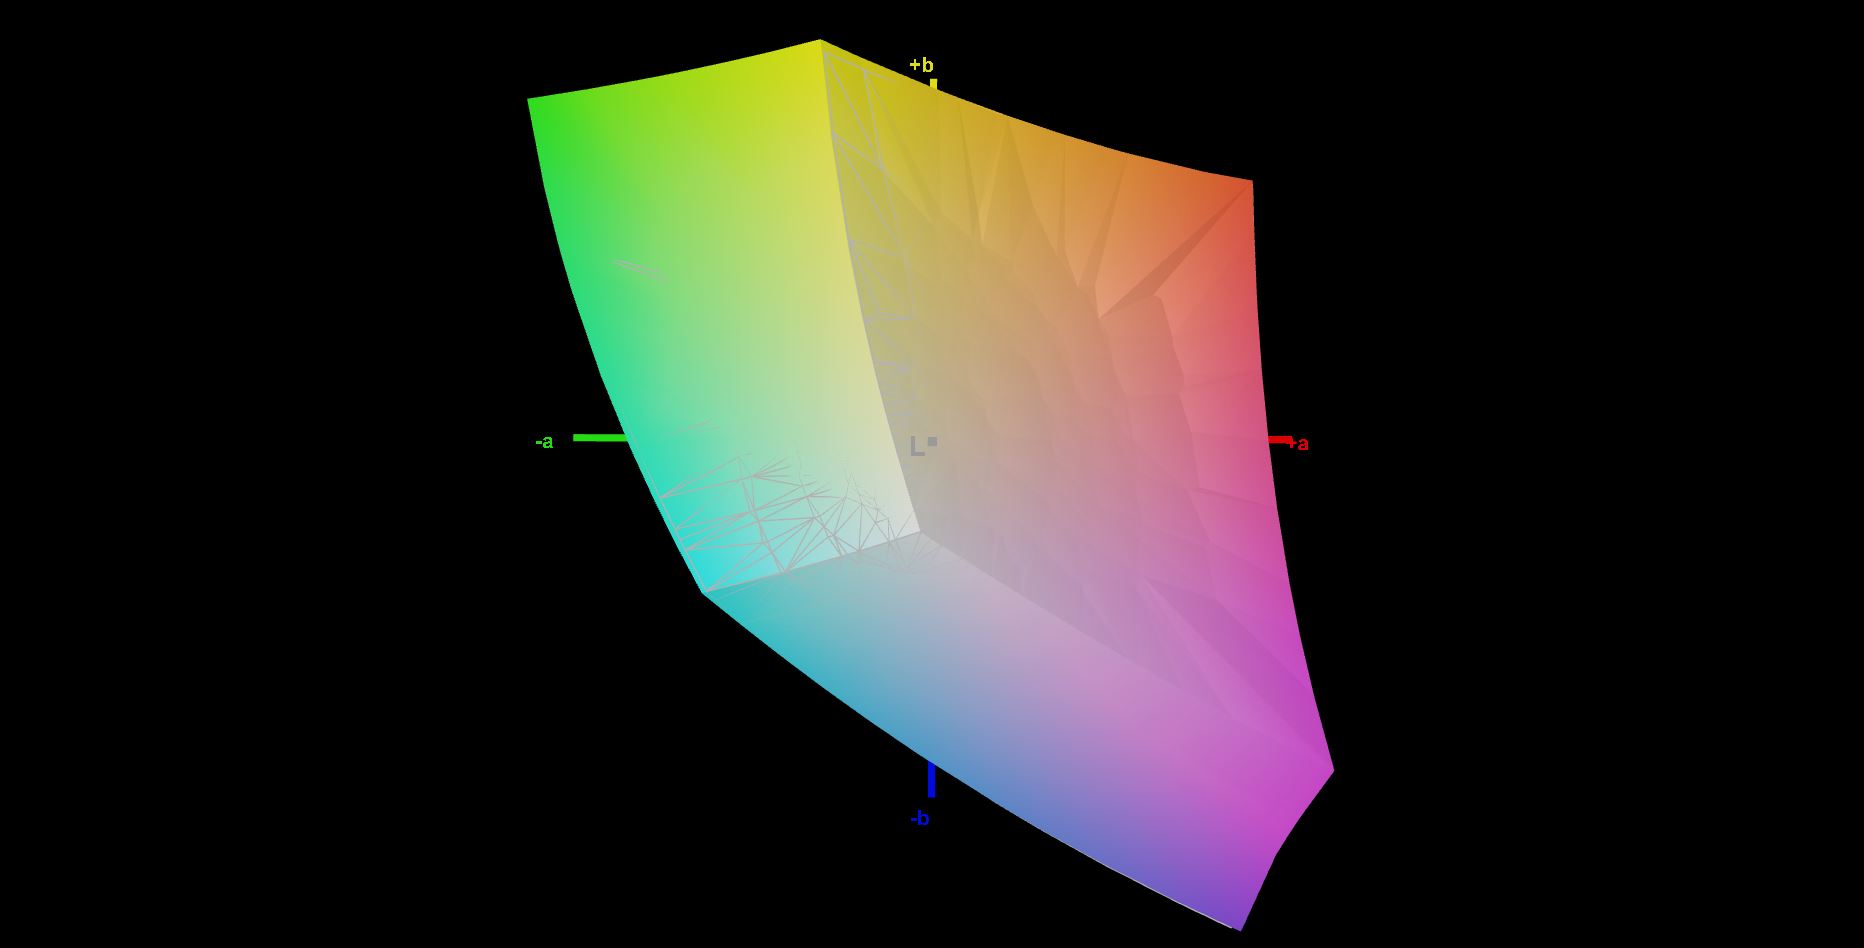
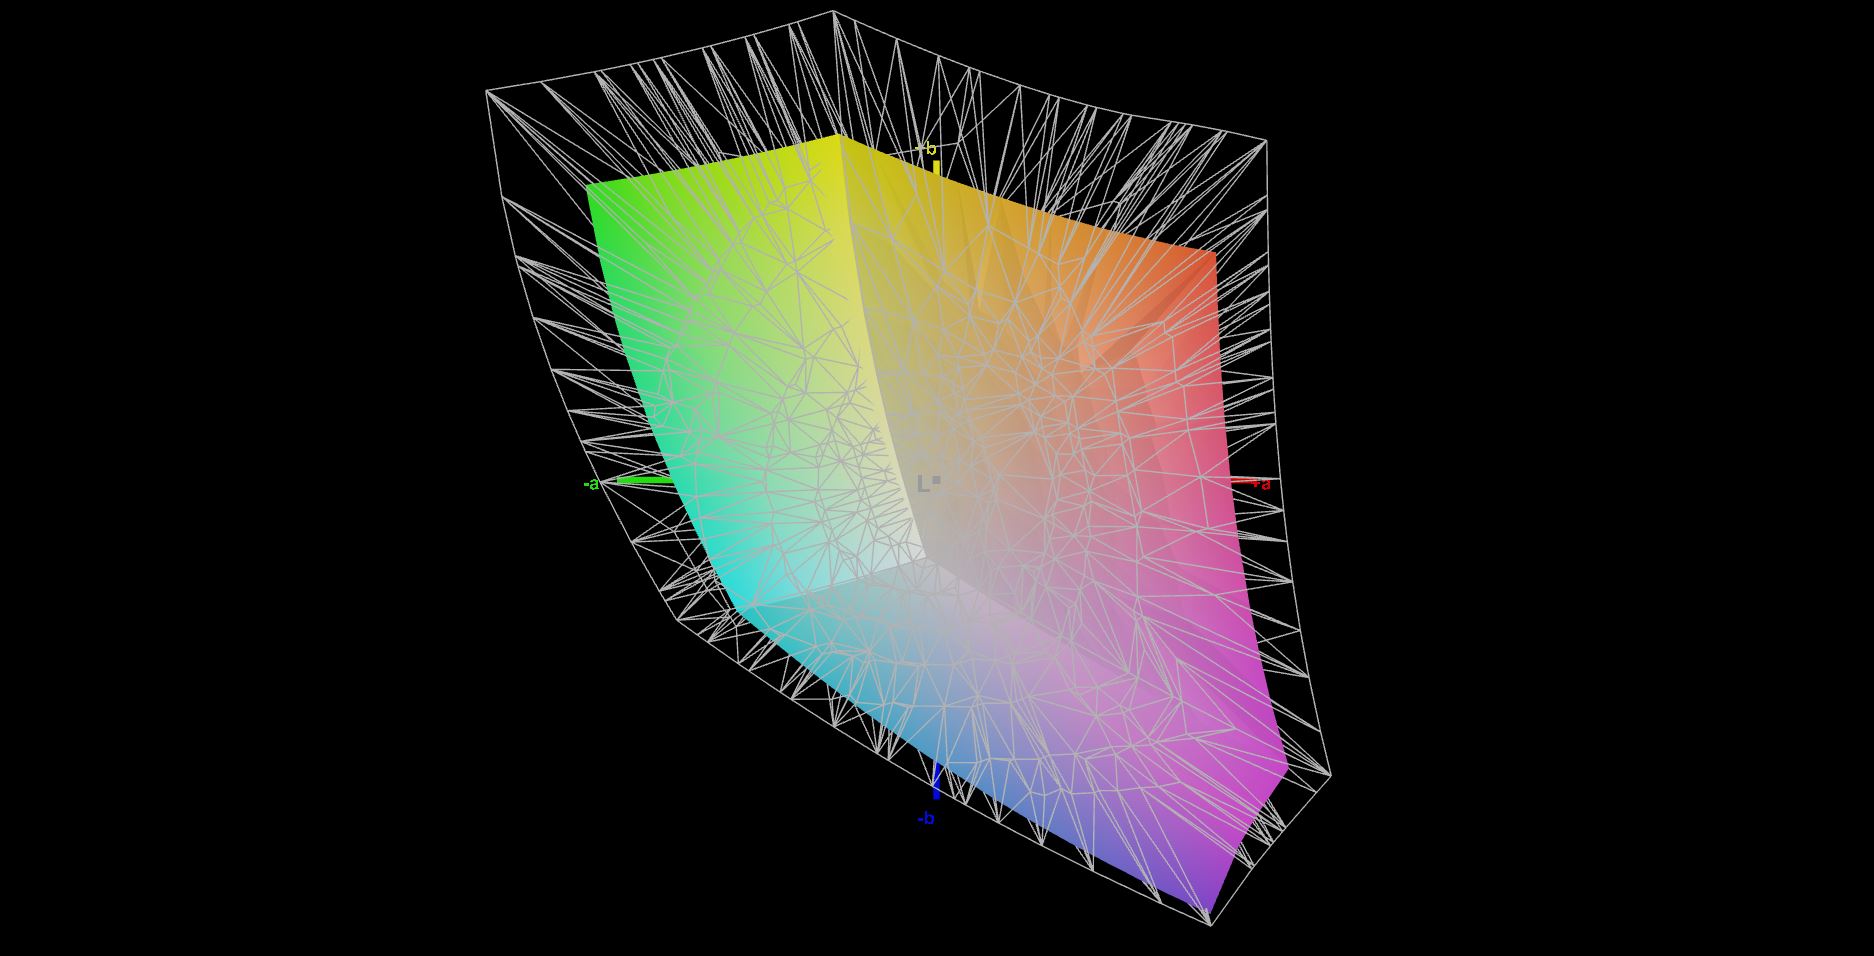
The 1080p panel covers the small sRGB color space entirely, and thanks to the low color deviations, this display is suitable for editing pictures/videos in this color space with color accuracy. Users who need a larger color space will inevitably have to go for one of the two 4K displays, which will then cover either the DCI-P3 (OLED) or AdobeRGB (IPS) color spaces.
Display Response Times
| ↔ Response Time Black to White | ||
|---|---|---|
| 16 ms ... rise ↗ and fall ↘ combined | ↗ 6 ms rise | 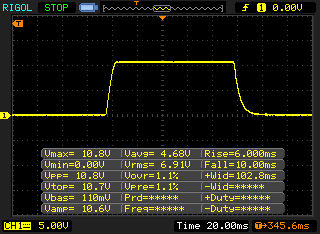 |
| ↘ 10 ms fall | ||
| The screen shows good response rates in our tests, but may be too slow for competitive gamers. In comparison, all tested devices range from 0.1 (minimum) to 240 (maximum) ms. » 37 % of all devices are better. This means that the measured response time is better than the average of all tested devices (20.1 ms). | ||
| ↔ Response Time 50% Grey to 80% Grey | ||
| 37.6 ms ... rise ↗ and fall ↘ combined | ↗ 18 ms rise | 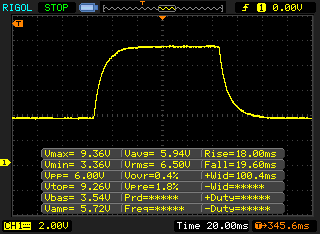 |
| ↘ 19.6 ms fall | ||
| The screen shows slow response rates in our tests and will be unsatisfactory for gamers. In comparison, all tested devices range from 0.165 (minimum) to 636 (maximum) ms. » 54 % of all devices are better. This means that the measured response time is worse than the average of all tested devices (31.4 ms). | ||
Screen Flickering / PWM (Pulse-Width Modulation)
| Screen flickering / PWM detected | 26040 Hz | ≤ 50 % brightness setting | 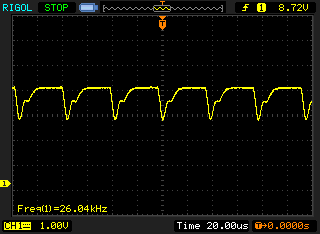 |
| ≤ 118 cd/m² brightness | |||
The display backlight flickers at 26040 Hz (worst case, e.g., utilizing PWM) Flickering detected at a brightness setting of 50 % (118 cd/m²) and below. There should be no flickering or PWM above this brightness setting. The frequency of 26040 Hz is quite high, so most users sensitive to PWM should not notice any flickering. Flickering occurs at relatively low brightness settings, so extended use at this brightness setting or lower can cause eyestrain. In comparison: 53 % of all tested devices do not use PWM to dim the display. If PWM was detected, an average of 7979 (minimum: 5 - maximum: 343500) Hz was measured. | |||
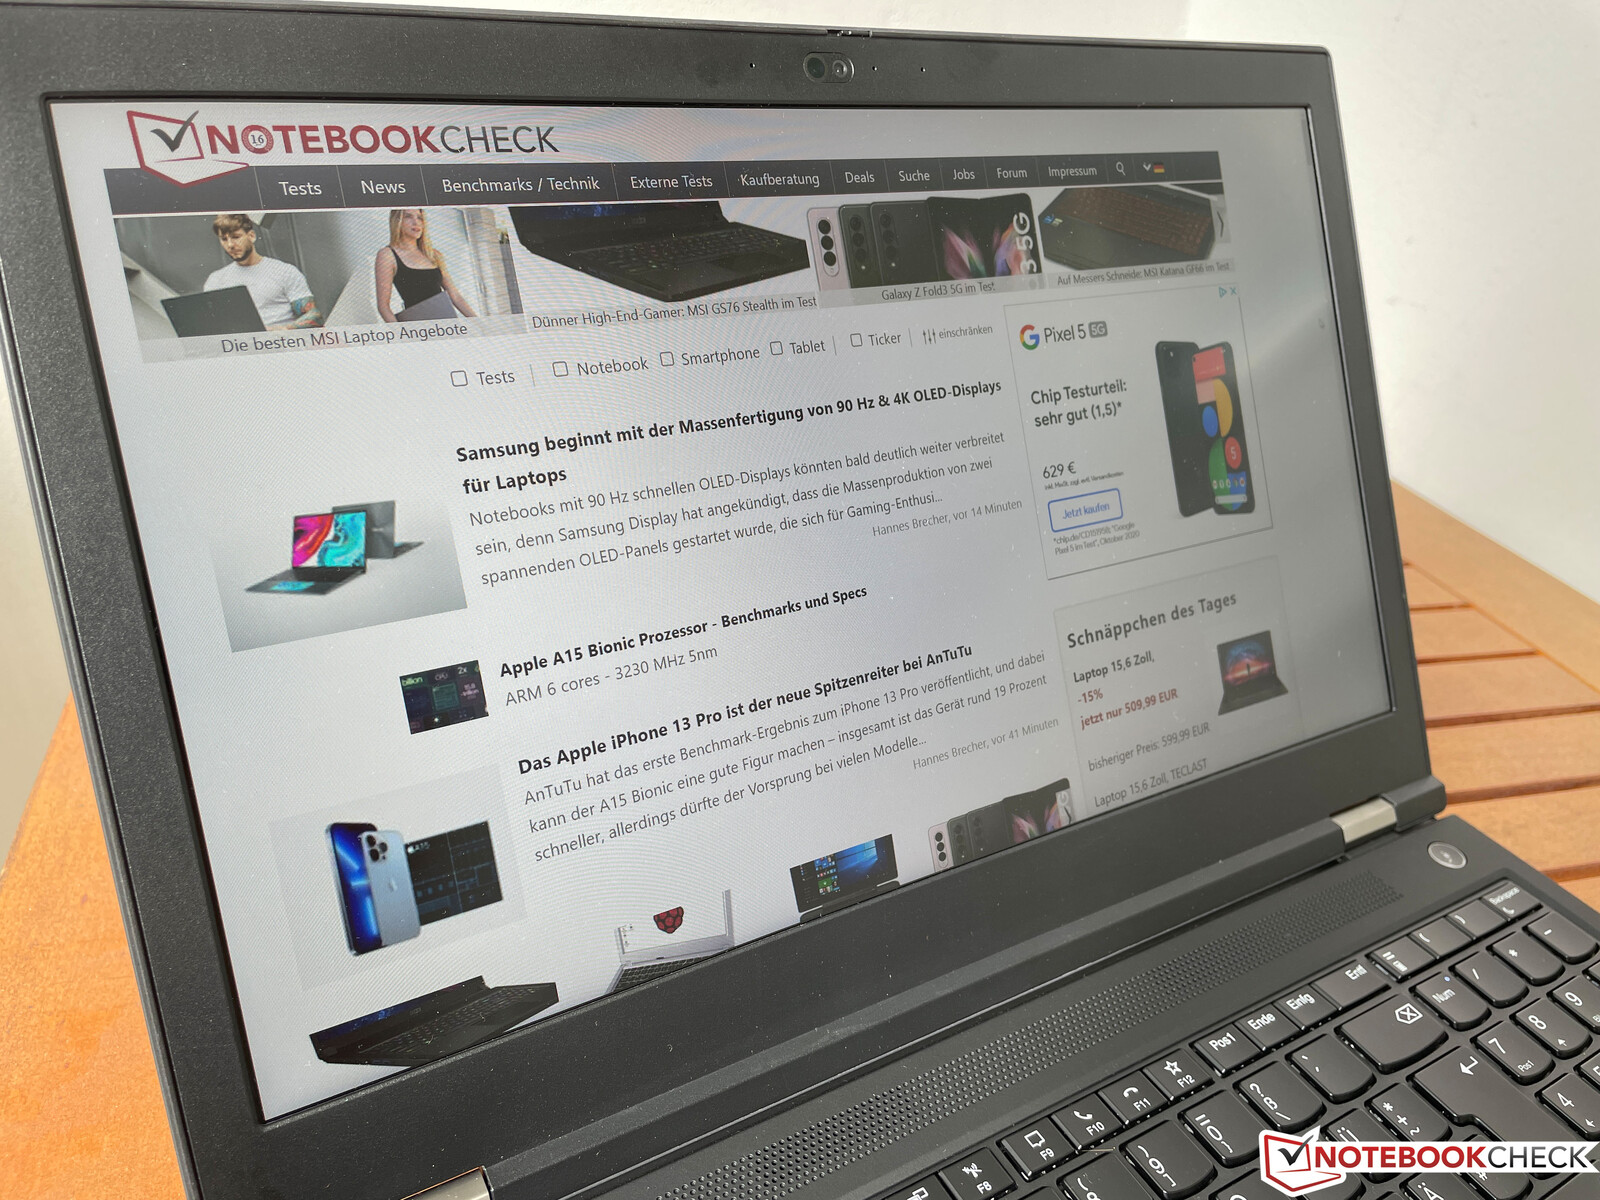
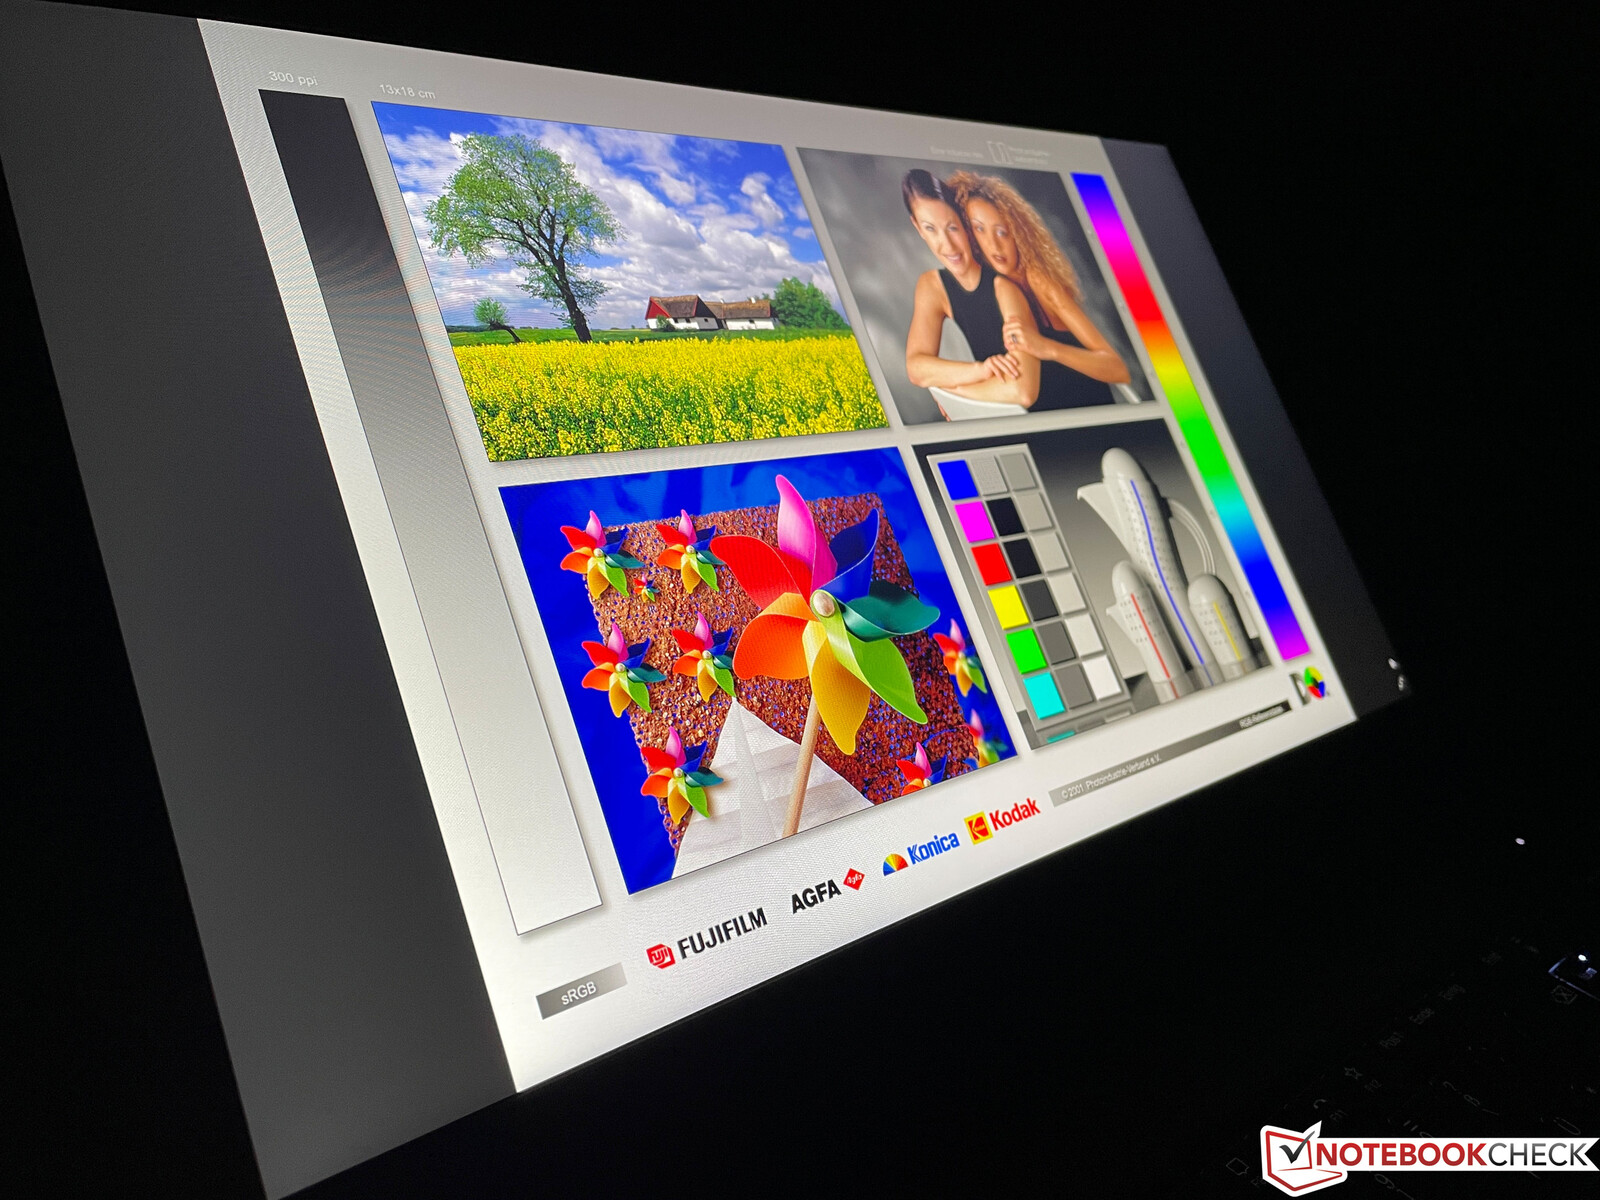
Due to its size and weight, the P15 Gen 2 is certainly not the perfect travel companion, but you can work quite comfortably outdoors thanks to the matte and bright panel. The IPS panel's viewing-angle stability is very good as well.
Performance - Tiger Lake H45 and Nvidia RTX
Besides the latest 45-watt CPUs from Intel (Tiger Lake H), Lenovo also uses the new professional RTX GPUs from Nvidia as an option; AMD CPUs or graphics cards are not available. Lenovo doesn't provide its own performance modes and integrates the controls into the normal Windows performance slider (left-click on the battery icon in the taskbar). We'll still go into the exact configuration, but in general, Lenovo grants more importance to the graphics card now, reducing the processor's TDP values a bit.
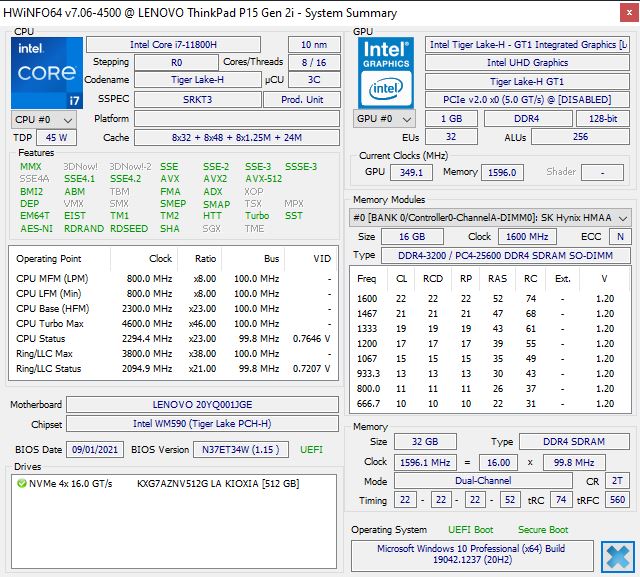
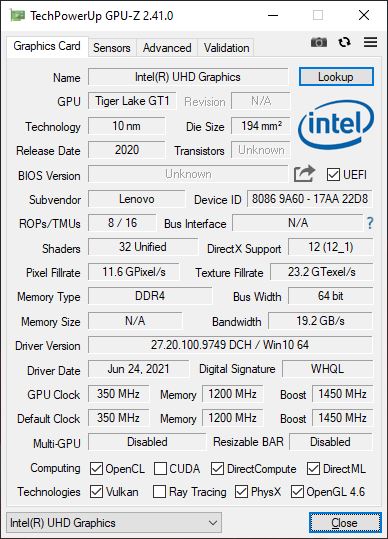
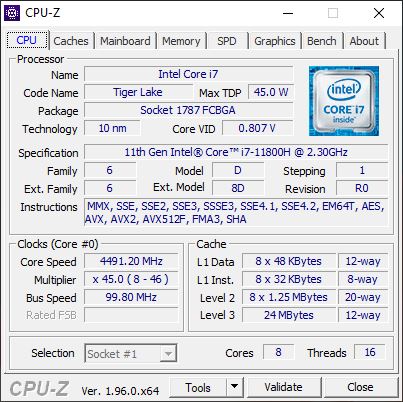
Processor - Core i7-11800H
Intel's Core i7-11800H CPU offers eight cores (16 threads) and reaches a maximum clock speed of 4.6 GHz or 4.2 GHz for all cores. The power limits are 80 and 60 watts and therefore slightly lower than in the predecessor. The overall performance output is decent, but we would've liked to see more leeway here. Generally, users who buy a mobile workstation also want the highest possible performance. However, gaming laptops, among others, often provide better performance, and that's without mentioning the latest AMD CPUs. This means that users who want the highest possible CPU performance won't find what they're looking for here.
Nevertheless, the ThinkPad P15 Gen 2 can position itself at the top of our comparison group, since the slim ZBook Studio 15 G8 is the only one that we have tested with the latest CPUs so far. The CPU performance remains consistent on battery power. Further CPU benchmarks are available in our database.
Cinebench R15 Multi endurance test
Cinebench R20: CPU (Multi Core) | CPU (Single Core)
Cinebench R15: CPU Multi 64Bit | CPU Single 64Bit
Blender: v2.79 BMW27 CPU
7-Zip 18.03: 7z b 4 | 7z b 4 -mmt1
Geekbench 5.5: Multi-Core | Single-Core
HWBOT x265 Benchmark v2.2: 4k Preset
LibreOffice : 20 Documents To PDF
R Benchmark 2.5: Overall mean
| Cinebench R23 / Multi Core | |
| Average of class Workstation (14055 - 38520, n=28, last 2 years) | |
| HP ZBook Studio 15 G8 | |
| Average Intel Core i7-11800H (6508 - 14088, n=48) | |
| Lenovo ThinkPad P15 G2-20YQ001JGE | |
| Lenovo ThinkPad P15 Gen1-20ST000DGE | |
| HP ZBook Fury 15 G7 | |
| Cinebench R23 / Single Core | |
| Average of class Workstation (1712 - 2228, n=28, last 2 years) | |
| HP ZBook Studio 15 G8 | |
| Lenovo ThinkPad P15 G2-20YQ001JGE | |
| Average Intel Core i7-11800H (1386 - 1522, n=45) | |
| HP ZBook Fury 15 G7 | |
| Lenovo ThinkPad P15 Gen1-20ST000DGE | |
| Cinebench R20 / CPU (Multi Core) | |
| Average of class Workstation (5471 - 15043, n=28, last 2 years) | |
| HP ZBook Studio 15 G8 | |
| Average Intel Core i7-11800H (2498 - 5408, n=50) | |
| Lenovo ThinkPad P15 G2-20YQ001JGE | |
| MSI WS66 10TMT-207US | |
| Dell Precision 7550 | |
| HP ZBook Fury 15 G7 | |
| HP ZBook Fury 15 G7 | |
| Lenovo ThinkPad P15 Gen1-20ST000DGE | |
| Cinebench R20 / CPU (Single Core) | |
| Average of class Workstation (671 - 857, n=28, last 2 years) | |
| HP ZBook Studio 15 G8 | |
| Lenovo ThinkPad P15 G2-20YQ001JGE | |
| Average Intel Core i7-11800H (520 - 586, n=47) | |
| HP ZBook Fury 15 G7 | |
| HP ZBook Fury 15 G7 | |
| MSI WS66 10TMT-207US | |
| Lenovo ThinkPad P15 Gen1-20ST000DGE | |
| Dell Precision 7550 | |
| Cinebench R15 / CPU Multi 64Bit | |
| Average of class Workstation (2404 - 5810, n=28, last 2 years) | |
| Average Intel Core i7-11800H (1342 - 2173, n=50) | |
| Lenovo ThinkPad P15 G2-20YQ001JGE | |
| HP ZBook Studio 15 G8 | |
| MSI WS66 10TMT-207US | |
| Dell Precision 7550 | |
| HP ZBook Fury 15 G7 | |
| HP ZBook Fury 15 G7 | |
| Lenovo ThinkPad P15 Gen1-20ST000DGE | |
| Cinebench R15 / CPU Single 64Bit | |
| Average of class Workstation (191.4 - 328, n=28, last 2 years) | |
| HP ZBook Studio 15 G8 | |
| Lenovo ThinkPad P15 G2-20YQ001JGE | |
| Average Intel Core i7-11800H (201 - 231, n=46) | |
| HP ZBook Fury 15 G7 | |
| HP ZBook Fury 15 G7 | |
| MSI WS66 10TMT-207US | |
| Dell Precision 7550 | |
| Lenovo ThinkPad P15 Gen1-20ST000DGE | |
| Blender / v2.79 BMW27 CPU | |
| HP ZBook Fury 15 G7 | |
| Lenovo ThinkPad P15 Gen1-20ST000DGE | |
| Dell Precision 7550 | |
| Average Intel Core i7-11800H (217 - 454, n=46) | |
| MSI WS66 10TMT-207US | |
| Lenovo ThinkPad P15 G2-20YQ001JGE | |
| HP ZBook Studio 15 G8 | |
| Average of class Workstation (91 - 261, n=28, last 2 years) | |
| 7-Zip 18.03 / 7z b 4 | |
| Average of class Workstation (53407 - 116969, n=28, last 2 years) | |
| HP ZBook Studio 15 G8 | |
| Lenovo ThinkPad P15 G2-20YQ001JGE | |
| MSI WS66 10TMT-207US | |
| Average Intel Core i7-11800H (33718 - 56758, n=46) | |
| Dell Precision 7550 | |
| Lenovo ThinkPad P15 Gen1-20ST000DGE | |
| HP ZBook Fury 15 G7 | |
| 7-Zip 18.03 / 7z b 4 -mmt1 | |
| Average of class Workstation (4981 - 6960, n=28, last 2 years) | |
| HP ZBook Studio 15 G8 | |
| HP ZBook Fury 15 G7 | |
| Dell Precision 7550 | |
| Average Intel Core i7-11800H (5138 - 5732, n=46) | |
| Lenovo ThinkPad P15 G2-20YQ001JGE | |
| MSI WS66 10TMT-207US | |
| Lenovo ThinkPad P15 Gen1-20ST000DGE | |
| Geekbench 5.5 / Multi-Core | |
| Average of class Workstation (11542 - 25554, n=28, last 2 years) | |
| Lenovo ThinkPad P15 G2-20YQ001JGE | |
| Average Intel Core i7-11800H (4655 - 9851, n=40) | |
| Dell Precision 7550 | |
| MSI WS66 10TMT-207US | |
| HP ZBook Studio 15 G8 | |
| HP ZBook Fury 15 G7 | |
| Lenovo ThinkPad P15 Gen1-20ST000DGE | |
| Geekbench 5.5 / Single-Core | |
| Average of class Workstation (1759 - 2183, n=28, last 2 years) | |
| HP ZBook Studio 15 G8 | |
| Lenovo ThinkPad P15 G2-20YQ001JGE | |
| Average Intel Core i7-11800H (1429 - 1625, n=40) | |
| MSI WS66 10TMT-207US | |
| HP ZBook Fury 15 G7 | |
| Dell Precision 7550 | |
| Lenovo ThinkPad P15 Gen1-20ST000DGE | |
| HWBOT x265 Benchmark v2.2 / 4k Preset | |
| Average of class Workstation (14.4 - 40.5, n=28, last 2 years) | |
| HP ZBook Studio 15 G8 | |
| Lenovo ThinkPad P15 G2-20YQ001JGE | |
| Average Intel Core i7-11800H (7.38 - 17.4, n=46) | |
| Dell Precision 7550 | |
| MSI WS66 10TMT-207US | |
| Lenovo ThinkPad P15 Gen1-20ST000DGE | |
| HP ZBook Fury 15 G7 | |
| LibreOffice / 20 Documents To PDF | |
| HP ZBook Fury 15 G7 | |
| Lenovo ThinkPad P15 Gen1-20ST000DGE | |
| HP ZBook Studio 15 G8 | |
| Lenovo ThinkPad P15 G2-20YQ001JGE | |
| Average of class Workstation (37.1 - 74.7, n=28, last 2 years) | |
| Dell Precision 7550 | |
| Average Intel Core i7-11800H (38.6 - 59.9, n=45) | |
| MSI WS66 10TMT-207US | |
| R Benchmark 2.5 / Overall mean | |
| Lenovo ThinkPad P15 Gen1-20ST000DGE | |
| MSI WS66 10TMT-207US | |
| Dell Precision 7550 | |
| Lenovo ThinkPad P15 G2-20YQ001JGE | |
| Average Intel Core i7-11800H (0.548 - 0.615, n=46) | |
| HP ZBook Fury 15 G7 | |
| HP ZBook Studio 15 G8 | |
| Average of class Workstation (0.3825 - 0.603, n=28, last 2 years) | |
* ... smaller is better
System performance
The system performance is excellent, which is confirmed by both our subjective impression of performance as well as by the benchmarks. The P15 Gen 2 benefits from the fast PCIe 4.0 SSD and the powerful graphics card, and there are no bottlenecks. In practice, all commands are executed immediately, and there are no constraints when switching graphics (Optimus), either.
| PCMark 10 / Score | |
| Average of class Workstation (6436 - 10409, n=23, last 2 years) | |
| HP ZBook Studio 15 G8 | |
| Lenovo ThinkPad P15 G2-20YQ001JGE | |
| Average Intel Core i7-11800H, NVIDIA RTX A3000 Laptop GPU (n=1) | |
| Dell Precision 7550 | |
| MSI WS66 10TMT-207US | |
| HP ZBook Fury 15 G7 | |
| Lenovo ThinkPad P15 Gen1-20ST000DGE | |
| PCMark 10 / Essentials | |
| MSI WS66 10TMT-207US | |
| Average of class Workstation (9622 - 11157, n=23, last 2 years) | |
| Lenovo ThinkPad P15 G2-20YQ001JGE | |
| Average Intel Core i7-11800H, NVIDIA RTX A3000 Laptop GPU (n=1) | |
| HP ZBook Studio 15 G8 | |
| Lenovo ThinkPad P15 Gen1-20ST000DGE | |
| Dell Precision 7550 | |
| HP ZBook Fury 15 G7 | |
| PCMark 10 / Productivity | |
| Average of class Workstation (8789 - 20616, n=23, last 2 years) | |
| MSI WS66 10TMT-207US | |
| HP ZBook Studio 15 G8 | |
| Lenovo ThinkPad P15 G2-20YQ001JGE | |
| Average Intel Core i7-11800H, NVIDIA RTX A3000 Laptop GPU (n=1) | |
| Lenovo ThinkPad P15 Gen1-20ST000DGE | |
| Dell Precision 7550 | |
| HP ZBook Fury 15 G7 | |
| PCMark 10 / Digital Content Creation | |
| Average of class Workstation (7744 - 15631, n=23, last 2 years) | |
| HP ZBook Studio 15 G8 | |
| Lenovo ThinkPad P15 G2-20YQ001JGE | |
| Average Intel Core i7-11800H, NVIDIA RTX A3000 Laptop GPU (n=1) | |
| Dell Precision 7550 | |
| HP ZBook Fury 15 G7 | |
| Lenovo ThinkPad P15 Gen1-20ST000DGE | |
| MSI WS66 10TMT-207US | |
| PCMark 10 Score | 6564 points | |
Help | ||
DPC latencies
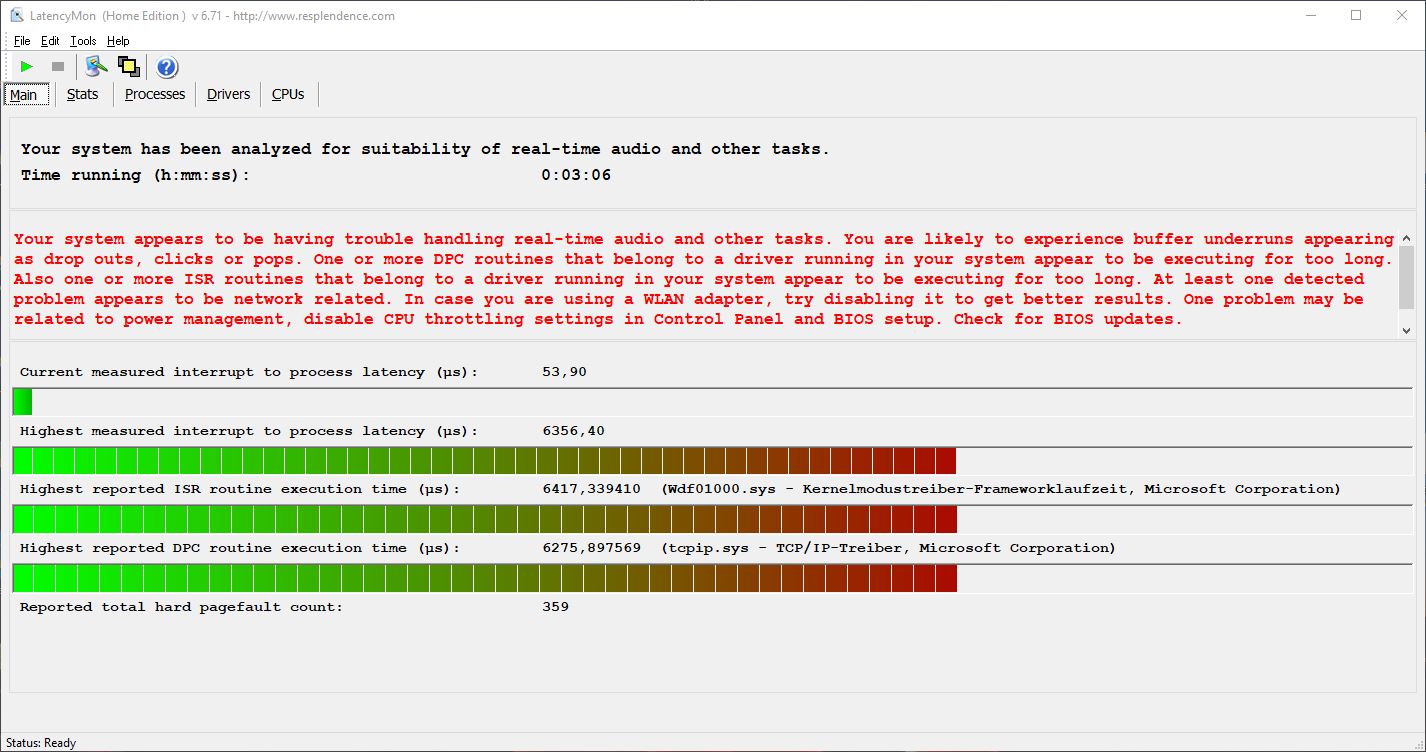
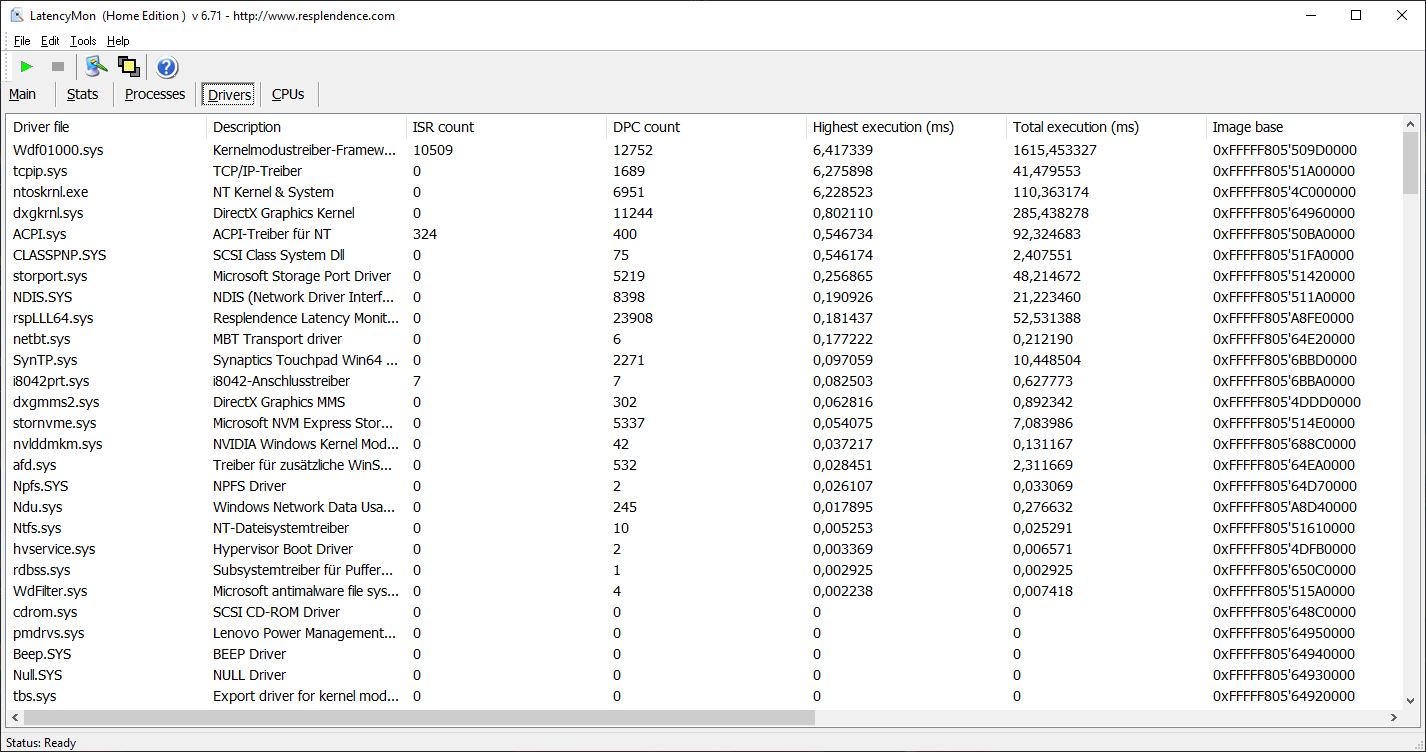
With the current BIOS version, the ThinkPad P15 Gen 2 shows significant issues in our standardized latency test. Interestingly, the P15 Gen 1 predecessor performed very well here, so we suspect that there's a driver problem that can hopefully be fixed quickly.
| DPC Latencies / LatencyMon - interrupt to process latency (max), Web, Youtube, Prime95 | |
| Dell Precision 7550 | |
| Lenovo ThinkPad P15 G2-20YQ001JGE | |
| MSI WS66 10TMT-207US | |
| HP ZBook Fury 15 G7 | |
| HP ZBook Studio 15 G8 | |
| Lenovo ThinkPad P15 Gen1-20ST000DGE | |
* ... smaller is better
Storage
The P15 Gen 2 can accommodate a total of three M.2-2280 SSDs. The fast PCIe 4.0 slot, which has been occupied by a correspondingly fast drive (Kioxia XG7) in our test device, is located under the keyboard. The two slots under the maintenance hatch at the bottom support the somewhat slower PCIe 3.0 x4 standard.
Our test device comes with a 512 GB PCIe 4.0 SSD that reaches very high transfer rates of over 5 GB/s. After the initial boot, there's still 422 GB available. Additional SSD benchmarks can be found here.
| Lenovo ThinkPad P15 G2-20YQ001JGE Kioxia XG7 KXG7AZNV512G | HP ZBook Studio 15 G8 Samsung PM981a MZVLB2T0HALB | HP ZBook Fury 15 G7 Samsung PM981a MZVLB1T0HBLR | Dell Precision 7550 SK Hynix PC601A NVMe 1TB | MSI WS66 10TMT-207US WDC PC SN730 SDBPNTY-1T00 | Lenovo ThinkPad P15 Gen1-20ST000DGE Toshiba XG6 KXG6AZNV512G | Average Kioxia XG7 KXG7AZNV512G | |
|---|---|---|---|---|---|---|---|
| CrystalDiskMark 5.2 / 6 | -21% | -19% | -27% | -10% | -17% | 0% | |
| Write 4K (MB/s) | 141.1 | 110.5 -22% | 114.1 -19% | 121 -14% | 185.8 32% | 129.5 -8% | 141.1 ? 0% |
| Read 4K (MB/s) | 58.8 | 51.8 -12% | 57.2 -3% | 42.16 -28% | 47.21 -20% | 49.54 -16% | 58.8 ? 0% |
| Write Seq (MB/s) | 3320 | 2071 -38% | 2580 -22% | 2150 -35% | 2874 -13% | 2379 -28% | 3320 ? 0% |
| Read Seq (MB/s) | 2994 | 2505 -16% | 2527 -16% | 1755 -41% | 1786 -40% | 1989 -34% | 2994 ? 0% |
| Write 4K Q32T1 (MB/s) | 626 | 429.8 -31% | 480.2 -23% | 395.3 -37% | 466.8 -25% | 663 6% | 626 ? 0% |
| Read 4K Q32T1 (MB/s) | 401.8 | 418.3 4% | 387.6 -4% | 381.8 -5% | 563 40% | 425.2 6% | 402 ? 0% |
| Write Seq Q32T1 (MB/s) | 3742 | 3060 -18% | 2996 -20% | 2730 -27% | 3091 -17% | 2960 -21% | 3742 ? 0% |
| Read Seq Q32T1 (MB/s) | 5097 | 3539 -31% | 2853 -44% | 3468 -32% | 3395 -33% | 3182 -38% | 5097 ? 0% |
| AS SSD | -20% | -34% | -40% | -3% | -25% | -9% | |
| Seq Read (MB/s) | 5105 | 2953 -42% | 2127 -58% | 2028 -60% | 2321 -55% | 2747 -46% | 4551 ? -11% |
| Seq Write (MB/s) | 1815 | 1691 -7% | 1296 -29% | 1193 -34% | 2620 44% | 1192 -34% | 1432 ? -21% |
| 4K Read (MB/s) | 47.46 | 43.98 -7% | 54.8 15% | 42.31 -11% | 48.57 2% | 46.49 -2% | 46.2 ? -3% |
| 4K Write (MB/s) | 137.3 | 105.4 -23% | 110.8 -19% | 105.5 -23% | 165.1 20% | 131.9 -4% | 126.3 ? -8% |
| 4K-64 Read (MB/s) | 2112 | 1065 -50% | 1420 -33% | 1128 -47% | 1712 -19% | 1431 -32% | 2136 ? 1% |
| 4K-64 Write (MB/s) | 1702 | 1957 15% | 2012 18% | 1537 -10% | 2174 28% | 1437 -16% | 1700 ? 0% |
| Access Time Read * (ms) | 0.065 | 0.04 38% | 0.046 29% | 0.069 -6% | 0.057 12% | 0.102 -57% | 0.1105 ? -70% |
| Access Time Write * (ms) | 0.03 | 0.105 -250% | 0.099 -230% | 0.106 -253% | 0.068 -127% | 0.031 -3% | 0.033 ? -10% |
| Score Read (Points) | 2670 | 1404 -47% | 1687 -37% | 1373 -49% | 1993 -25% | 1752 -34% | 2638 ? -1% |
| Score Write (Points) | 2021 | 2232 10% | 2253 11% | 1762 -13% | 2601 29% | 1688 -16% | 1970 ? -3% |
| Score Total (Points) | 5885 | 4297 -27% | 4770 -19% | 3801 -35% | 5630 -4% | 4261 -28% | 5793 ? -2% |
| Copy ISO MB/s (MB/s) | 2054 | 2474 20% | 2779 35% | 1768 -14% | 2589 26% | 2054 ? 0% | |
| Copy Program MB/s (MB/s) | 714 | 1074 50% | 123.3 -83% | 627 -12% | 791 11% | 714 ? 0% | |
| Copy Game MB/s (MB/s) | 1431 | 1929 35% | 440.8 -69% | 1477 3% | 1625 14% | 1431 ? 0% | |
| Total Average (Program / Settings) | -21% /
-20% | -27% /
-28% | -34% /
-36% | -7% /
-5% | -21% /
-21% | -5% /
-6% |
* ... smaller is better

Continuous load read: DiskSpd Read Loop, Queue Depth 8
Graphics card - Nvidia RTX A3000
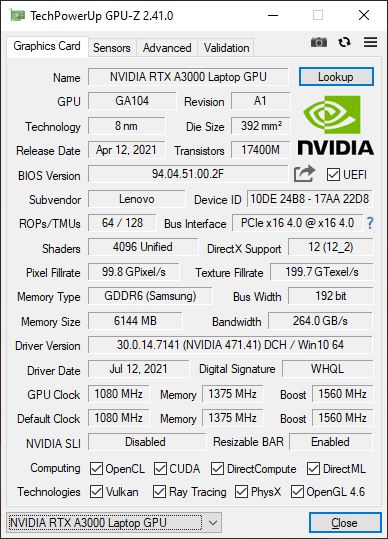
The new Nvidia RTX A3000 is based on the GA104 chip and offers 256 CUDA cores more than the consumer version, the GeForce RTX 3060. In the P15 Gen 2, the GPU operates with a TGP of 110 watts, which makes it one of the fastest models (a maximum of 130 watts is possible). However, the biggest difference to the consumer GPUs are the special drivers along with the software certifications that ensure that the corresponding applications run smoothly.
In the normal DirectX benchmarks (e.g. 3DMark), everything depends on the GPU's performance. At times, the RTX A3000 is almost on par with the RTX 3070 and also ahead of the old high-end Quadro RTX 5000 Max-Q GPU, but a fast RTX 3060 with 130 watts (like in the Legion 5), for example, is still a few percentage points ahead. On the other hand, the old RTX 3000 is clearly outperformed (+50%).
In the professional SPECviewperf benchmarks, the new RTX A3000 also does very well, and depending on the scenario, it can once again overtake the old Quadro RTX 5000 Max-Q.
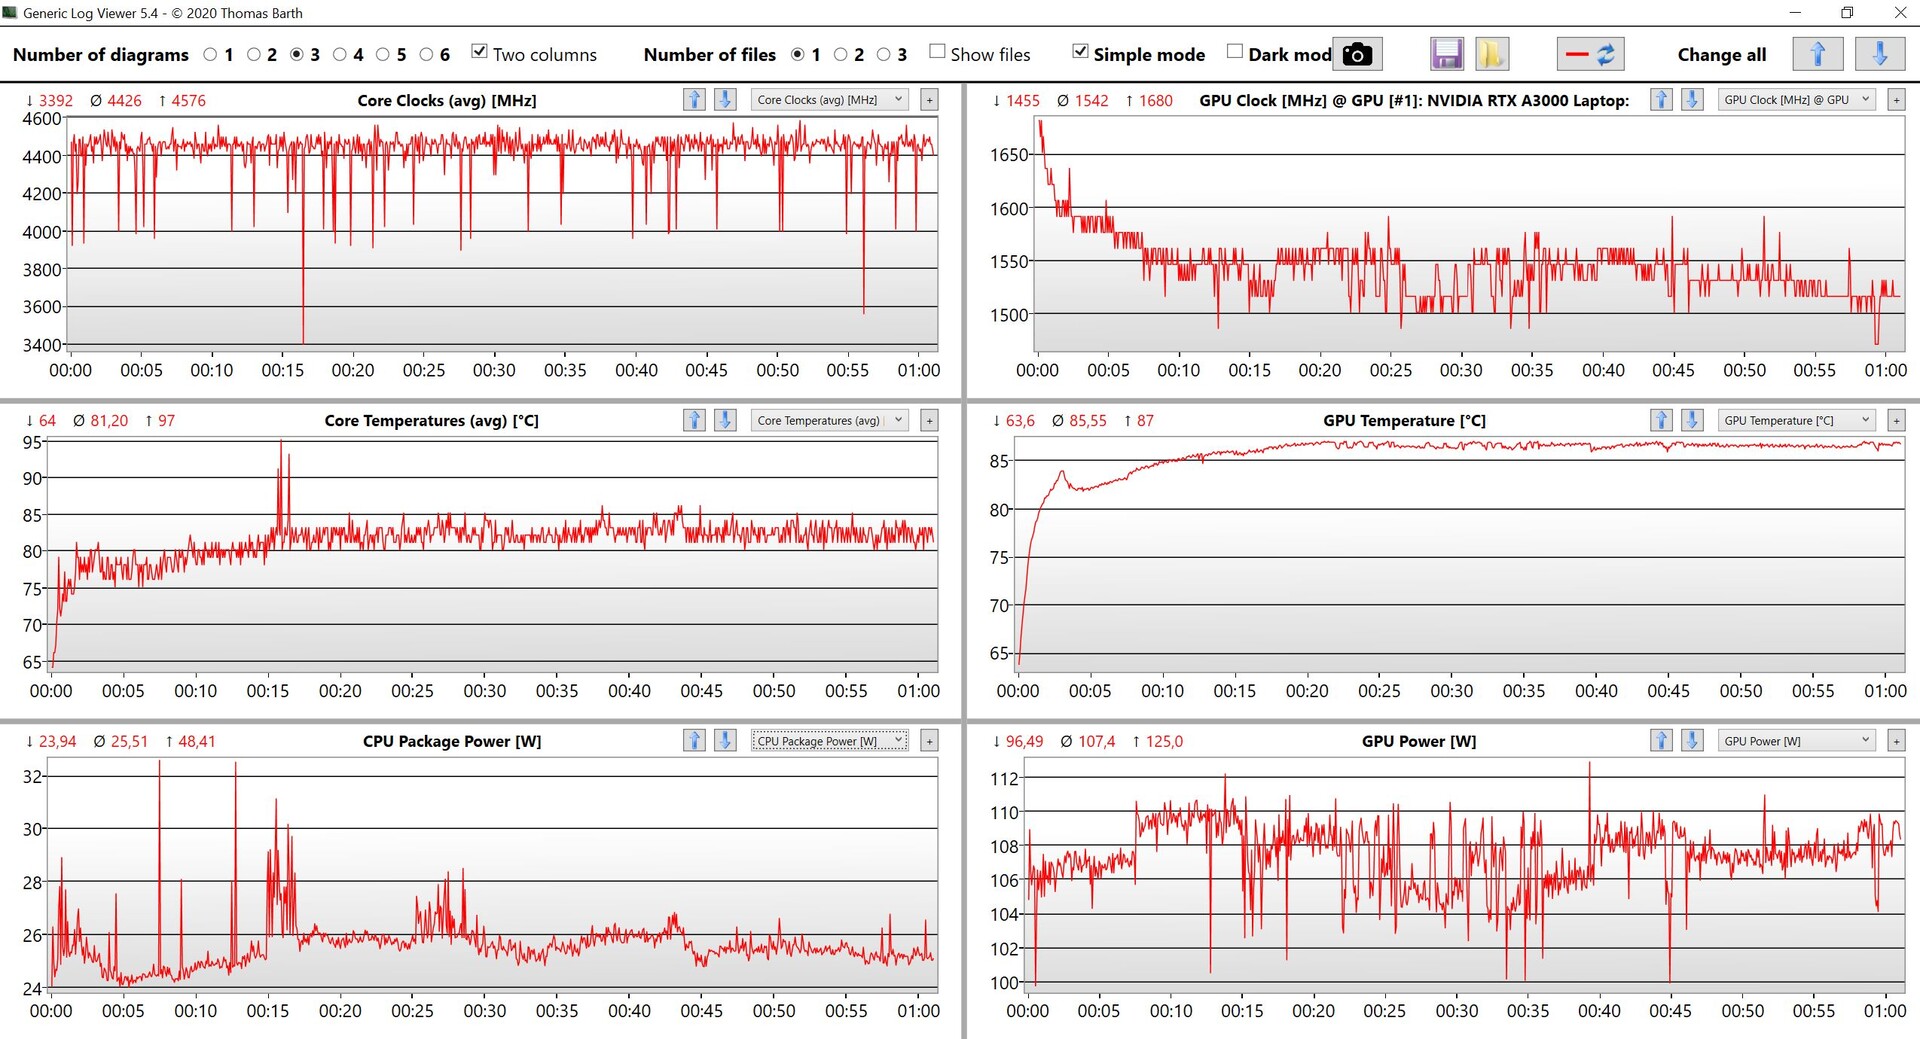
The GPU performance remains stable even under continuous load, but you have to deal with a deficit of about 25% on battery power, since the GPU's power consumption is limited to 50 watts here. Further comparisons with other graphics cards are available in our GPU Benchmarks article.
| 3DMark Vantage P Result | 71308 points | |
| 3DMark 11 Performance | 23888 points | |
| 3DMark Fire Strike Score | 18291 points | |
| 3DMark Time Spy Score | 7779 points | |
Help | ||
Gaming performance
Gaming is also possible without issues using the professional GPU drivers, and we didn't experience any hiccups in our benchmarks. Overall, gaming performance is very good, and even modern games run at the native 1080p resolution using the highest settings. More gaming benchmarks are available here.
The Witcher 3 FPS diagram
| low | med. | high | ultra | |
|---|---|---|---|---|
| GTA V (2015) | 180 | 174 | 158 | 90.1 |
| The Witcher 3 (2015) | 335 | 222 | 152 | 69.8 |
| Dota 2 Reborn (2015) | 164 | 148 | 142 | 132 |
| Final Fantasy XV Benchmark (2018) | 160 | 101 | 75.1 | |
| X-Plane 11.11 (2018) | 124 | 105 | 85.1 | |
| Far Cry 5 (2018) | 115 | 111 | 103 | |
| Strange Brigade (2018) | 365 | 183 | 151 | 114 |
| Far Cry New Dawn (2019) | 127 | 103 | 98 | 87 |
| Borderlands 3 (2019) | 129 | 115 | 87 | 69 |
| Gears Tactics (2020) | 306 | 173 | 123 | 87 |
| F1 2020 (2020) | 264 | 164 | 151 | 114 |
| Death Stranding (2020) | 159 | 133 | 124 | 120 |
| Horizon Zero Dawn (2020) | 139 | 104 | 94 | 83 |
| Watch Dogs Legion (2020) | 98 | 93 | 86 | 39 |
| Dirt 5 (2020) | 183 | 111 | 89 | 72 |
| Assassin´s Creed Valhalla (2020) | 110 | 79 | 68 | 51 |
| Immortals Fenyx Rising (2020) | 133 | 90 | 82 | 77 |
| Cyberpunk 2077 1.0 (2020) | 110 | 71 | 60 | 51 |
| Hitman 3 (2021) | 227 | 146 | 129 | 118 |
| F1 2021 (2021) | 266 | 172 | 154 | 82.9 |
Emissions - The P15 works up a sweat
Noise emissions
The two fans in the P15 Gen 2 are often completely turned off when doing less demanding activities, and you won't be bothered by electronic noises or coil whine, either. However, as soon as you put the device under more load, the fans quickly kick in and also reach levels of over 45 dB(A). When gaming and under dedicated CPU or GPU load, noise is often in the range between 45 and 47 dB(A), but under combined load or with very demanding games, a maximum of 54.9 dB(A) can quickly be reached. This makes the new P15 Gen 2 very loud and even louder than the predecessor, which was admittedly only equipped with the weaker Quadro T1000 GPU in the test.
Noise level
| Idle |
| 24.3 / 24.3 / 28.6 dB(A) |
| Load |
| 47.5 / 54.9 dB(A) |
 | ||
30 dB silent 40 dB(A) audible 50 dB(A) loud |
||
min: | ||
| Lenovo ThinkPad P15 G2-20YQ001JGE RTX A3000 Laptop GPU, i7-11800H, Kioxia XG7 KXG7AZNV512G | HP ZBook Studio 15 G8 GeForce RTX 3070 Laptop GPU, i9-11950H, Samsung PM981a MZVLB2T0HALB | HP ZBook Fury 15 G7 Quadro RTX 5000 Max-Q, W-10885M, Samsung PM981a MZVLB1T0HBLR | Dell Precision 7550 Quadro RTX 5000 Max-Q, W-10885M, SK Hynix PC601A NVMe 1TB | MSI WS66 10TMT-207US Quadro RTX 5000 Max-Q, i9-10980HK, WDC PC SN730 SDBPNTY-1T00 | Lenovo ThinkPad P15 Gen1-20ST000DGE Quadro T1000 (Laptop), i7-10750H, Toshiba XG6 KXG6AZNV512G | |
|---|---|---|---|---|---|---|
| Noise | 5% | 5% | -2% | -13% | 6% | |
| off / environment * (dB) | 24.3 | 23.5 3% | 26.4 -9% | 25.8 -6% | 26 -7% | 24.9 -2% |
| Idle Minimum * (dB) | 24.3 | 25.3 -4% | 26.4 -9% | 25.8 -6% | 32 -32% | 24.9 -2% |
| Idle Average * (dB) | 24.3 | 25.3 -4% | 26.4 -9% | 25.8 -6% | 32 -32% | 24.9 -2% |
| Idle Maximum * (dB) | 28.6 | 25.3 12% | 26.4 8% | 25.9 9% | 32 -12% | 28.8 -1% |
| Load Average * (dB) | 47.5 | 41.2 13% | 31.7 33% | 51.2 -8% | 42 12% | 37.7 21% |
| Load Maximum * (dB) | 54.9 | 49.4 10% | 47 14% | 51.9 5% | 59.7 -9% | 44.6 19% |
| Witcher 3 ultra * (dB) | 49.4 | 47 | 51.9 | 47.4 | 37.7 |
* ... smaller is better
Temperature
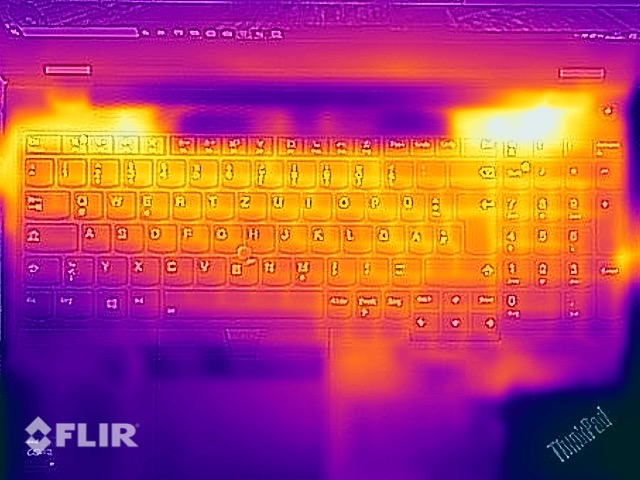
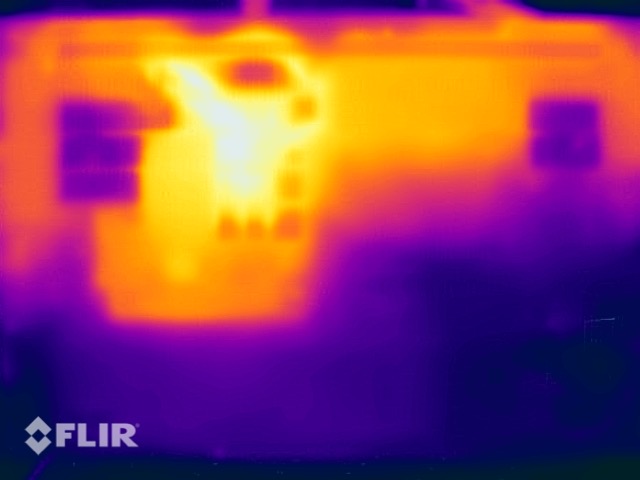
Despite the high noise levels, the P15 Gen 2 struggles with very high case temperatures, and it definitely shouldn't be placed on the lap when under load. We measured over 50 °C (~122 °F) at several points at the bottom under high load, and even more than 60 °C (~140 °F) at one measuring point. The top of the base unit also gets noticeably warm, but only in the two upper corners, which is why there are no problems when typing.
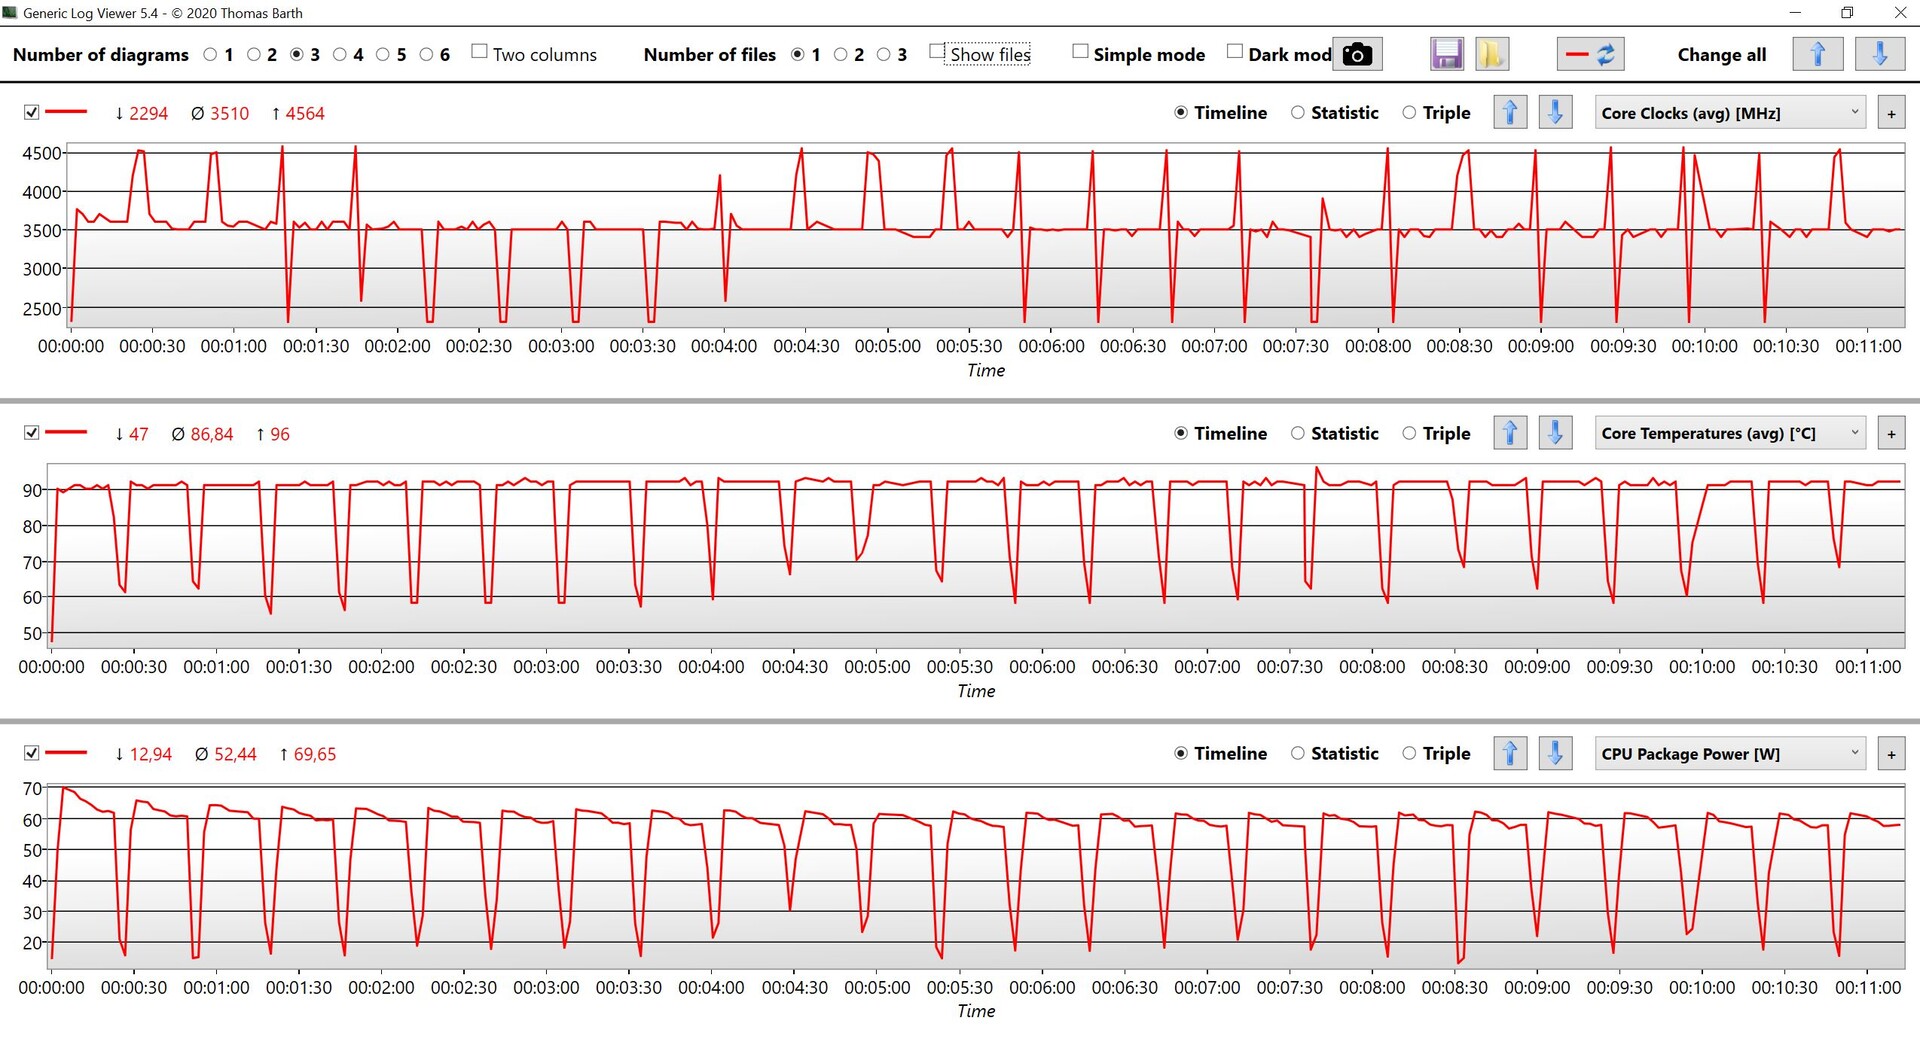
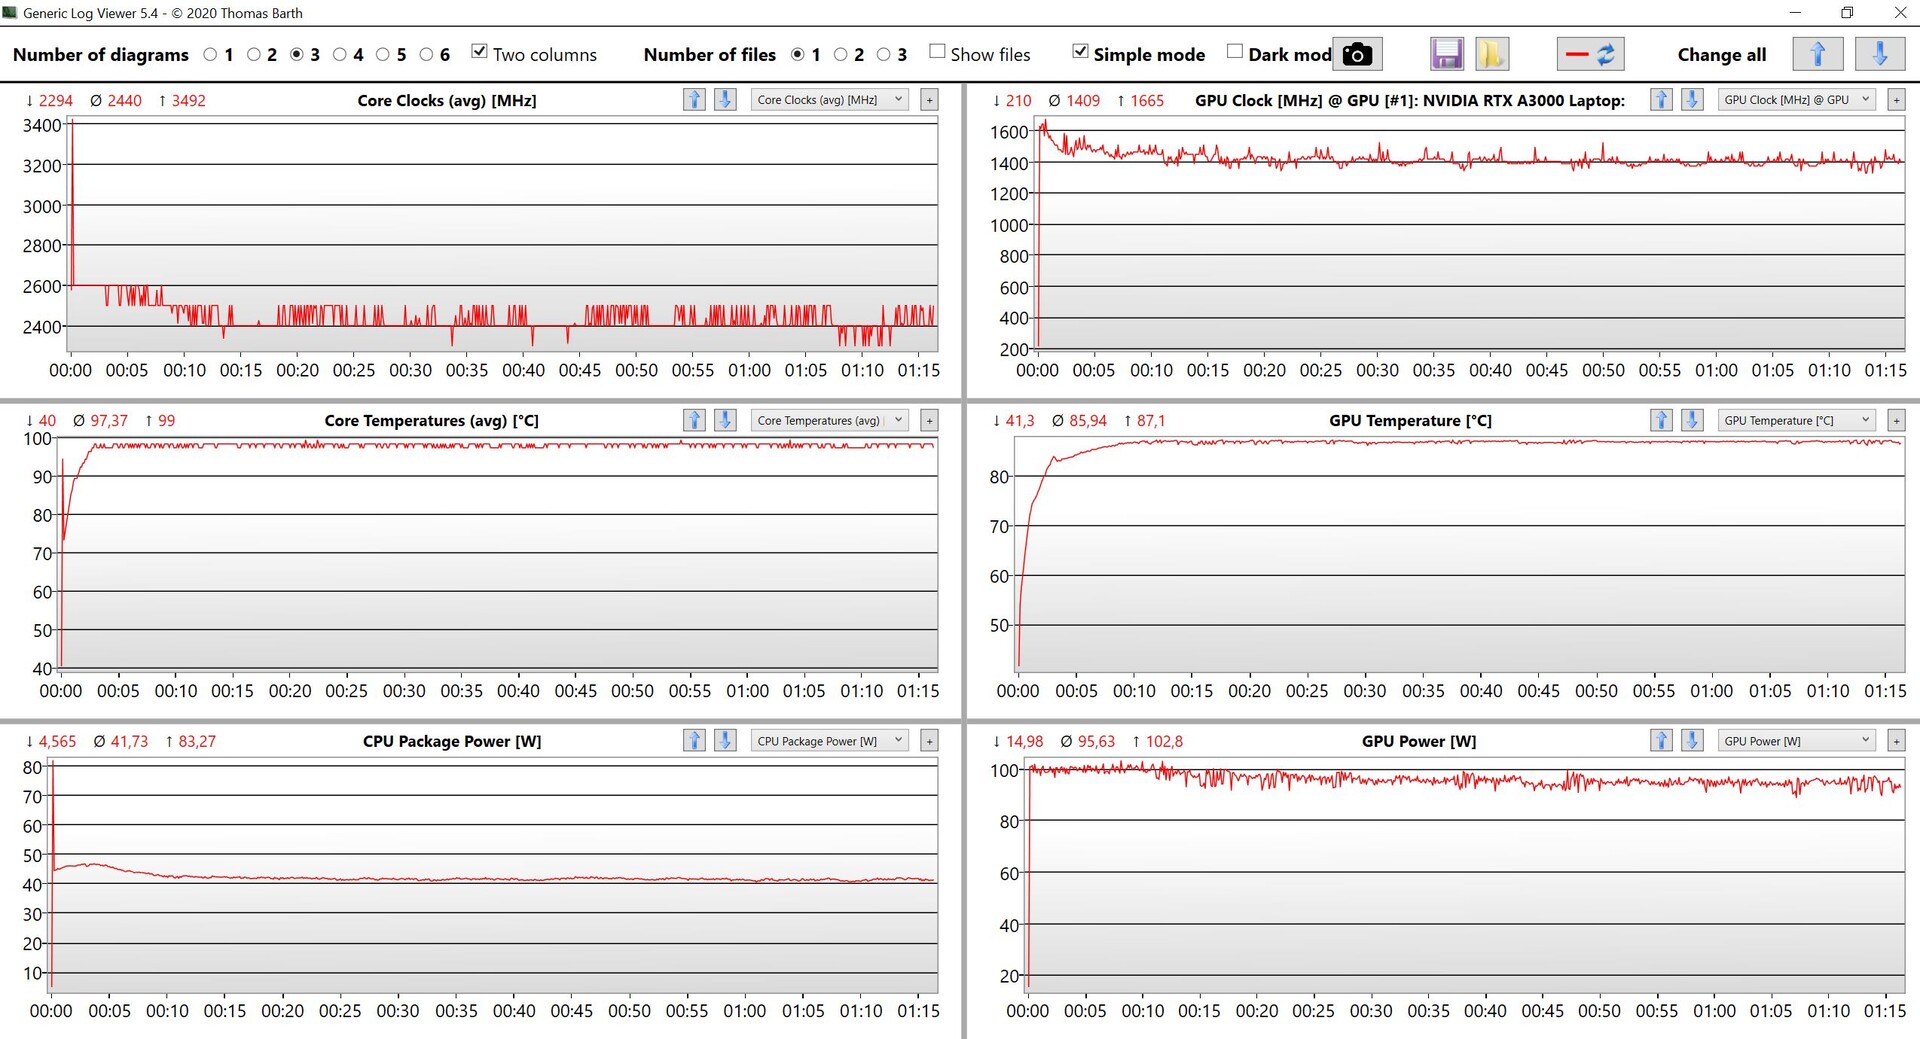
We are a bit disappointed by the results of the stress test. Although the GPU performance remains almost stable, the CPU doesn't even work at the nominal 45 watts. One has to wonder here what Lenovo is doing with the P15 Gen 2's cooling when there are thinner (and significantly cheaper) gaming laptops like the in-house Legion 5 15 with better cooling (45 watts for the CPU and 115 watts for the GPU in the stress test) and even lower temperatures. Moreover, it's doubtful that the P15 Gen 2's cooling is not further overtaxed due to the more powerful components (especially the GPUs).
(-) The maximum temperature on the upper side is 49.7 °C / 121 F, compared to the average of 38.2 °C / 101 F, ranging from 22.2 to 69.8 °C for the class Workstation.
(-) The bottom heats up to a maximum of 63.2 °C / 146 F, compared to the average of 41.1 °C / 106 F
(+) In idle usage, the average temperature for the upper side is 26.3 °C / 79 F, compared to the device average of 32 °C / 90 F.
(±) Playing The Witcher 3, the average temperature for the upper side is 37.9 °C / 100 F, compared to the device average of 32 °C / 90 F.
(+) The palmrests and touchpad are reaching skin temperature as a maximum (35.1 °C / 95.2 F) and are therefore not hot.
(-) The average temperature of the palmrest area of similar devices was 27.8 °C / 82 F (-7.3 °C / -13.2 F).
Speakers
Lenovo ThinkPad P15 G2-20YQ001JGE audio analysis
(±) | speaker loudness is average but good (78 dB)
Bass 100 - 315 Hz
(-) | nearly no bass - on average 15.5% lower than median
(±) | linearity of bass is average (9.6% delta to prev. frequency)
Mids 400 - 2000 Hz
(±) | higher mids - on average 7.5% higher than median
(+) | mids are linear (6.6% delta to prev. frequency)
Highs 2 - 16 kHz
(+) | balanced highs - only 2.4% away from median
(+) | highs are linear (5.8% delta to prev. frequency)
Overall 100 - 16.000 Hz
(±) | linearity of overall sound is average (20.6% difference to median)
Compared to same class
» 74% of all tested devices in this class were better, 6% similar, 21% worse
» The best had a delta of 7%, average was 17%, worst was 35%
Compared to all devices tested
» 55% of all tested devices were better, 8% similar, 37% worse
» The best had a delta of 4%, average was 24%, worst was 134%
HP ZBook Fury 15 G7 audio analysis
(±) | speaker loudness is average but good (80.1 dB)
Bass 100 - 315 Hz
(±) | reduced bass - on average 8% lower than median
(±) | linearity of bass is average (9.5% delta to prev. frequency)
Mids 400 - 2000 Hz
(+) | balanced mids - only 3.3% away from median
(+) | mids are linear (4.8% delta to prev. frequency)
Highs 2 - 16 kHz
(+) | balanced highs - only 2.2% away from median
(+) | highs are linear (3.5% delta to prev. frequency)
Overall 100 - 16.000 Hz
(+) | overall sound is linear (10.1% difference to median)
Compared to same class
» 6% of all tested devices in this class were better, 4% similar, 90% worse
» The best had a delta of 7%, average was 17%, worst was 35%
Compared to all devices tested
» 4% of all tested devices were better, 1% similar, 94% worse
» The best had a delta of 4%, average was 24%, worst was 134%
Dell Precision 7550 audio analysis
(+) | speakers can play relatively loud (83.6 dB)
Bass 100 - 315 Hz
(±) | reduced bass - on average 11.5% lower than median
(±) | linearity of bass is average (11.6% delta to prev. frequency)
Mids 400 - 2000 Hz
(±) | higher mids - on average 5.7% higher than median
(+) | mids are linear (4.5% delta to prev. frequency)
Highs 2 - 16 kHz
(+) | balanced highs - only 3.2% away from median
(+) | highs are linear (5.4% delta to prev. frequency)
Overall 100 - 16.000 Hz
(+) | overall sound is linear (12.6% difference to median)
Compared to same class
» 21% of all tested devices in this class were better, 4% similar, 75% worse
» The best had a delta of 7%, average was 17%, worst was 35%
Compared to all devices tested
» 11% of all tested devices were better, 2% similar, 86% worse
» The best had a delta of 4%, average was 24%, worst was 134%
Energy management - ThinkPad with good endurance
Energy consumption
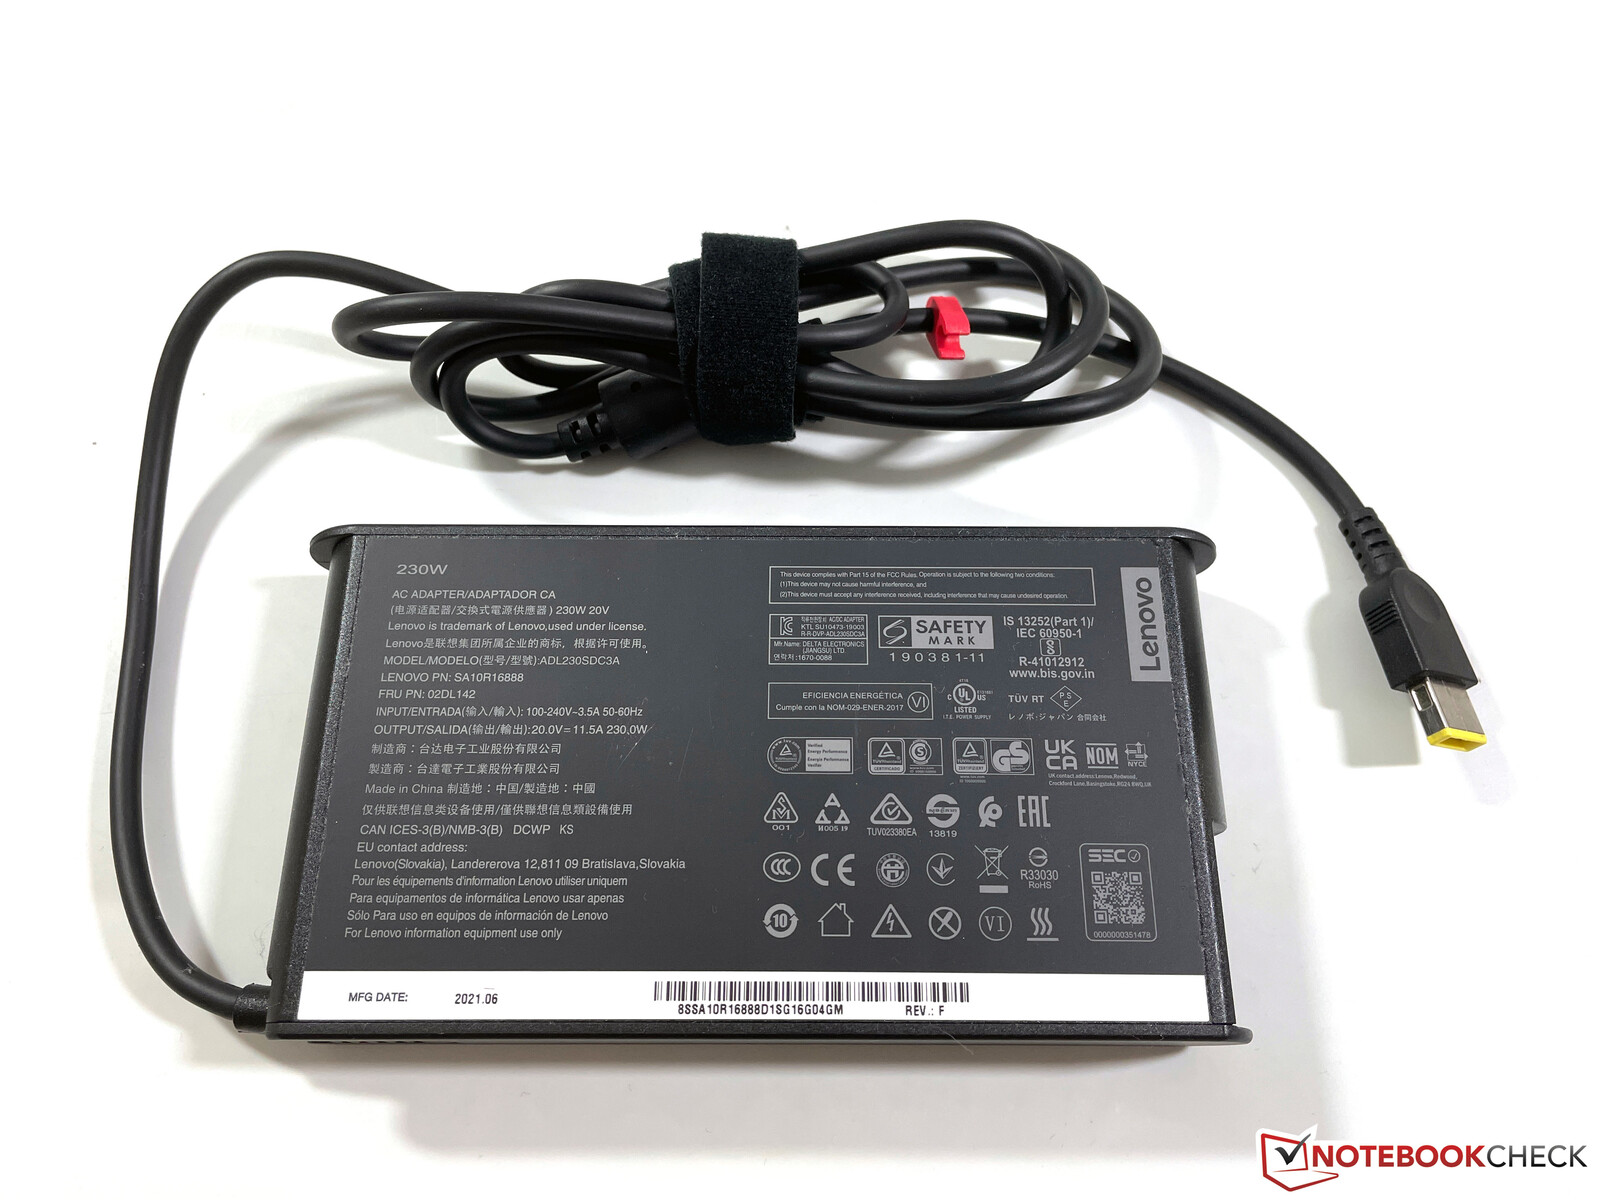
Lenovo was able to reduce idle consumption a bit, and the bright 500 cd/m² panel doesn't seem to have a massive impact on consumption rates, either. There are no surprises under load, and the included 230-watt power adapter is definitely sufficient and even has enough headroom left to charge the battery under load.
| Off / Standby | |
| Idle | |
| Load |
|
Key:
min: | |
| Lenovo ThinkPad P15 G2-20YQ001JGE i7-11800H, RTX A3000 Laptop GPU, Kioxia XG7 KXG7AZNV512G, IPS, 1920x1080, 15.6" | HP ZBook Studio 15 G8 i9-11950H, GeForce RTX 3070 Laptop GPU, Samsung PM981a MZVLB2T0HALB, OLED, 3840x2160, 15.6" | HP ZBook Fury 15 G7 W-10885M, Quadro RTX 5000 Max-Q, Samsung PM981a MZVLB1T0HBLR, IPS, 3840x2160, 15.6" | Dell Precision 7550 W-10885M, Quadro RTX 5000 Max-Q, SK Hynix PC601A NVMe 1TB, IPS, 3840x2160, 15.6" | MSI WS66 10TMT-207US i9-10980HK, Quadro RTX 5000 Max-Q, WDC PC SN730 SDBPNTY-1T00, IPS, 1920x1080, 15.6" | Lenovo ThinkPad P15 Gen1-20ST000DGE i7-10750H, Quadro T1000 (Laptop), Toshiba XG6 KXG6AZNV512G, a-Si IPS LED, 1920x1080, 15.6" | Average NVIDIA RTX A3000 Laptop GPU | Average of class Workstation | |
|---|---|---|---|---|---|---|---|---|
| Power Consumption | -51% | -16% | -38% | -78% | -2% | -21% | -19% | |
| Idle Minimum * (Watt) | 6.3 | 11 -75% | 4.6 27% | 8.2 -30% | 13.8 -119% | 8.4 -33% | 8.23 ? -31% | 8.89 ? -41% |
| Idle Average * (Watt) | 10.7 | 18.8 -76% | 13.6 -27% | 16.8 -57% | 18.4 -72% | 12.3 -15% | 14.6 ? -36% | 13.5 ? -26% |
| Idle Maximum * (Watt) | 11.6 | 31.7 -173% | 21.5 -85% | 24.4 -110% | 41.5 -258% | 14.2 -22% | 15.3 ? -32% | 17.6 ? -52% |
| Load Average * (Watt) | 99.3 | 105.2 -6% | 113.1 -14% | 131 -32% | 110.5 -11% | 96 3% | 109.3 ? -10% | 93.9 ? 5% |
| Witcher 3 ultra * (Watt) | 154 | 148 4% | 157.5 -2% | 156.6 -2% | 151.6 2% | 95 38% | ||
| Load Maximum * (Watt) | 210 | 171.8 18% | 199 5% | 201.8 4% | 227.1 -8% | 168.8 20% | 196.5 ? 6% | 171.1 ? 19% |
* ... smaller is better
Energy consumption during The Witcher 3 / stress test
Battery life
With the large 94 Wh battery, real-world runtimes of about 10 hours are possible in our Wi-Fi and video tests (both with 150 cd/m²). Battery life is reduced to just under 6.5 hours in the Wi-Fi test when we the display's brightness is set to maximum. On the other hand, the laptop's battery dies after about 80 minutes under load. It takes 110 minutes to completely charge the device when it's turned on, but 50% of the capacity is available again after about 26 minutes.
| Lenovo ThinkPad P15 G2-20YQ001JGE i7-11800H, RTX A3000 Laptop GPU, 94 Wh | HP ZBook Studio 15 G8 i9-11950H, GeForce RTX 3070 Laptop GPU, 83 Wh | HP ZBook Fury 15 G7 W-10885M, Quadro RTX 5000 Max-Q, 94 Wh | Dell Precision 7550 W-10885M, Quadro RTX 5000 Max-Q, 95 Wh | MSI WS66 10TMT-207US i9-10980HK, Quadro RTX 5000 Max-Q, 99.99 Wh | Average of class Workstation | |
|---|---|---|---|---|---|---|
| Battery runtime | 1% | -7% | -17% | -15% | -5% | |
| H.264 (h) | 10 | 9.51 ? -5% | ||||
| WiFi v1.3 (h) | 9.9 | 6.2 -37% | 8.6 -13% | 8.9 -10% | 7.8 -21% | 8.55 ? -14% |
| Load (h) | 1.3 | 1.8 38% | 1.3 0% | 1 -23% | 1.2 -8% | 1.364 ? 5% |
Pros
Cons
Verdict - The P15 Gen 2 shows particular weaknesses in its cooling system

Traditionally, mobile workstations offer the highest performance and are easy to maintain. In return, users are happy to put up with larger and thicker cases. However, this no longer applies in full. Yes, the maintenance options of the current ThinkPad P15 Gen 2 are excellent, but the expensive workstation suffers especially in terms of performance and cooling. Inevitably, you have to ask yourself why you still need such a thick case nowadays when the performance (both of the CPU and the GPU) as well as the temperatures are worse than in modern gaming laptops or even thinner mobile workstations at times. For the CPU, we would've also wished for a slightly more dynamic management (higher TDP under CPU-only load).
The ThinkPad P15 Gen 2 is very disappointing, and it struggles with high temperatures and loud fans under load. However, the new RTX A3000 delivers good performance and provides a significant boost compared to the old Quadro GPUs.
Overall, the concept of the P15 Gen 2 seems a bit outdated by now, partly due to the massive screen bezels. The manufacturer could have easily installed a 16-inch display (16:10) here as in the new ThinkPad P1 Gen 4, for example.
The P15 Gen 2 offers a pleasing range of ports, maintenance options, and input devices, and the bright 1080p display does a good job, but we would've liked to see a better cooling system. However, especially because of the high performance in graphics and professional applications, the P15 Gen 2 still gets a good score. We're already eager to see how the new workstation models from Dell, HP, and MSI will perform.
Price and availability
At the time of writing, you can find multiple configurations of the ThinkPad P15 Gen 2 on Lenovo's online store. There are currently two versions that feature the RTX A300 GPU: One with the Core i7-11800H CPU, 64 GB of RAM, a 1 TB PCIe SSD, and an HDR 400 Dolby Vision 600-nit UHD (3840x2160) IPS display ($4,799), and the second one that only differs in terms of the CPU with the Core i9-11950H, and the RAM with only 32 GB ($5,109.00).
If you can do with less graphics performance, there are other models to suit your needs with prices starting at around $2,949.
Lenovo ThinkPad P15 G2-20YQ001JGE
- 09/29/2021 v7 (old)
Andreas Osthoff
Price comparison

