

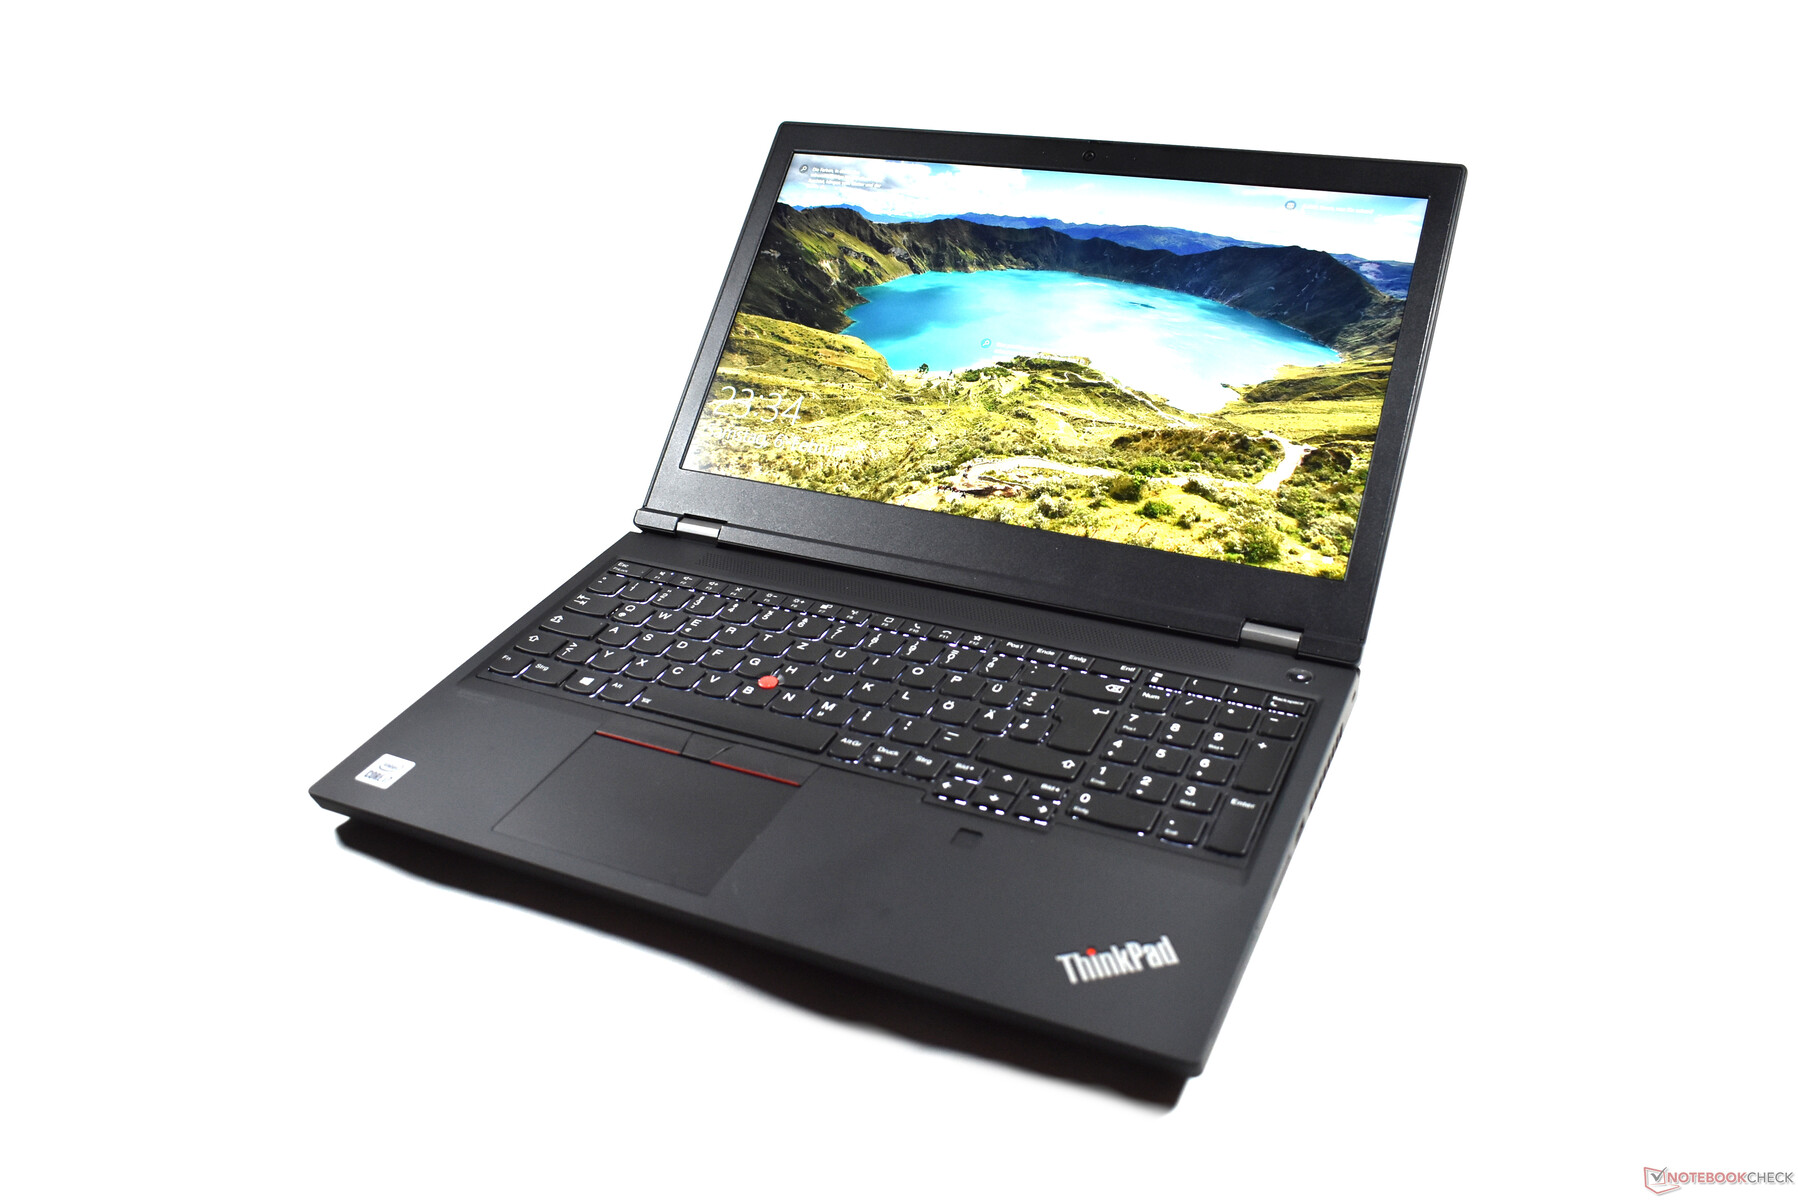
Lenovo ThinkPad P15 Gen 1 laptop review: Mobile workstation with a weak spot in the keyboard
When Lenovo introduced the ThinkPad P50 into the market in 2015, it was the first model of the new ThinkPad P series, which was supposed to form the workstation branch instead of the W series. Since then, Lenovo has expanded the series, but the classic workstations still represent the core of the workstation portfolio. Last year's 15-inch model of this branch was called Lenovo ThinkPad P53. The current successor is not called ThinkPad P54 but Lenovo ThinkPad P15 Gen 1, following the new ThinkPad naming scheme.
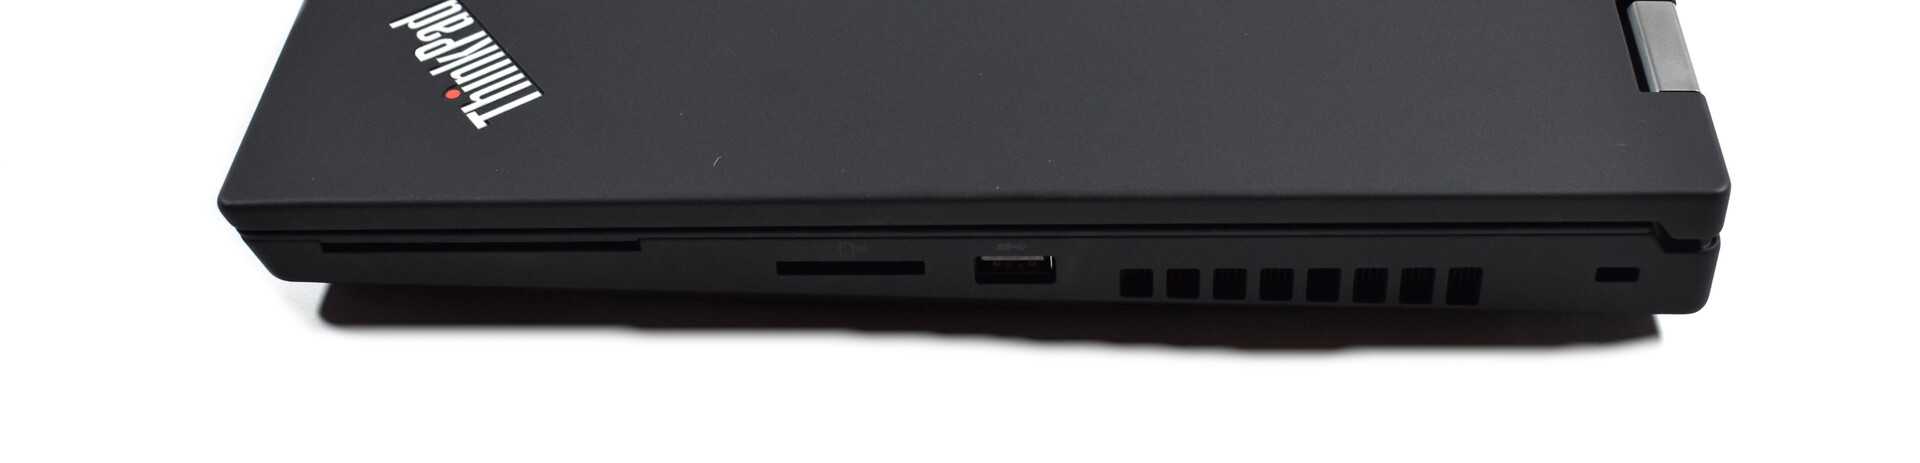
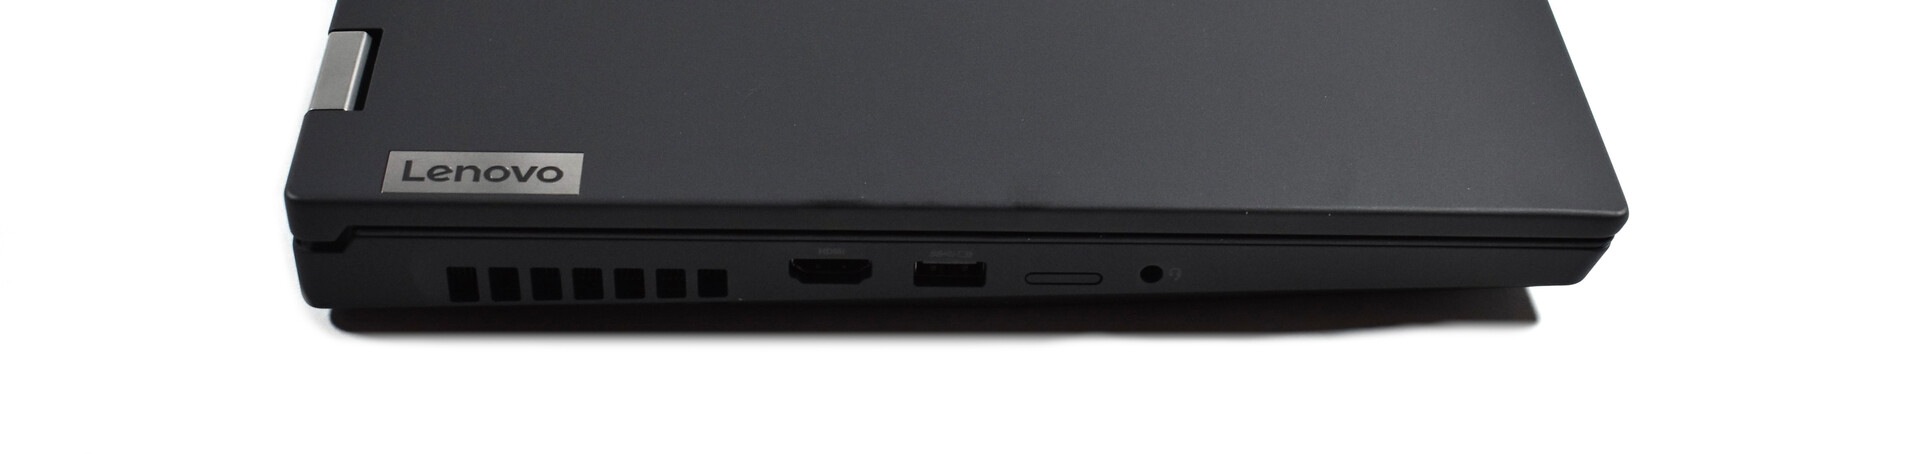
Lenovo is not only introducing a new naming scheme with the ThinkPad P15, but also a new case design. But since it shares the same build with the Lenovo ThinkPad T15g Gen 1, we will not report here on the aspects of the design, features, and input devices in detail. You can find more information on these areas in our ThinkPad T15g review.
Possible competitors in our comparison
Rating | Date | Model | Weight | Height | Size | Resolution | Price |
|---|---|---|---|---|---|---|---|
| 85.6 % v7 (old) | 03 / 2021 | Lenovo ThinkPad P15 Gen1-20ST000DGE i7-10750H, Quadro T1000 (Laptop) | 2.7 kg | 31.45 mm | 15.60" | 1920x1080 | |
| 89.8 % v7 (old) | 11 / 2019 | Lenovo ThinkPad P53-20QN000YGE i7-9850H, Quadro RTX 5000 Max-Q | 2.7 kg | 29.4 mm | 15.60" | 1920x1080 | |
| 86.3 % v7 (old) | 03 / 2021 | Lenovo ThinkPad T15g-20UR000GGE i7-10750H, GeForce RTX 2070 Super Max-Q | 2.8 kg | 31.45 mm | 15.60" | 1920x1080 | |
| 86.6 % v7 (old) | 02 / 2021 | Lenovo ThinkPad T15p-20TN0006GE i7-10750H, GeForce GTX 1050 Mobile | 2.2 kg | 22.7 mm | 15.60" | 3840x2160 | |
| 87.8 % v7 (old) | 08 / 2020 | Dell Precision 7550 W-10885M, Quadro RTX 5000 Max-Q | 2.8 kg | 27.36 mm | 15.60" | 3840x2160 | |
| 90.2 % v7 (old) | 01 / 2021 | HP ZBook Fury 15 G7 W-10885M, Quadro RTX 5000 Max-Q | 2.4 kg | 25.9 mm | 15.60" | 3840x2160 |
Most important changes from the Lenovo ThinkPad P53
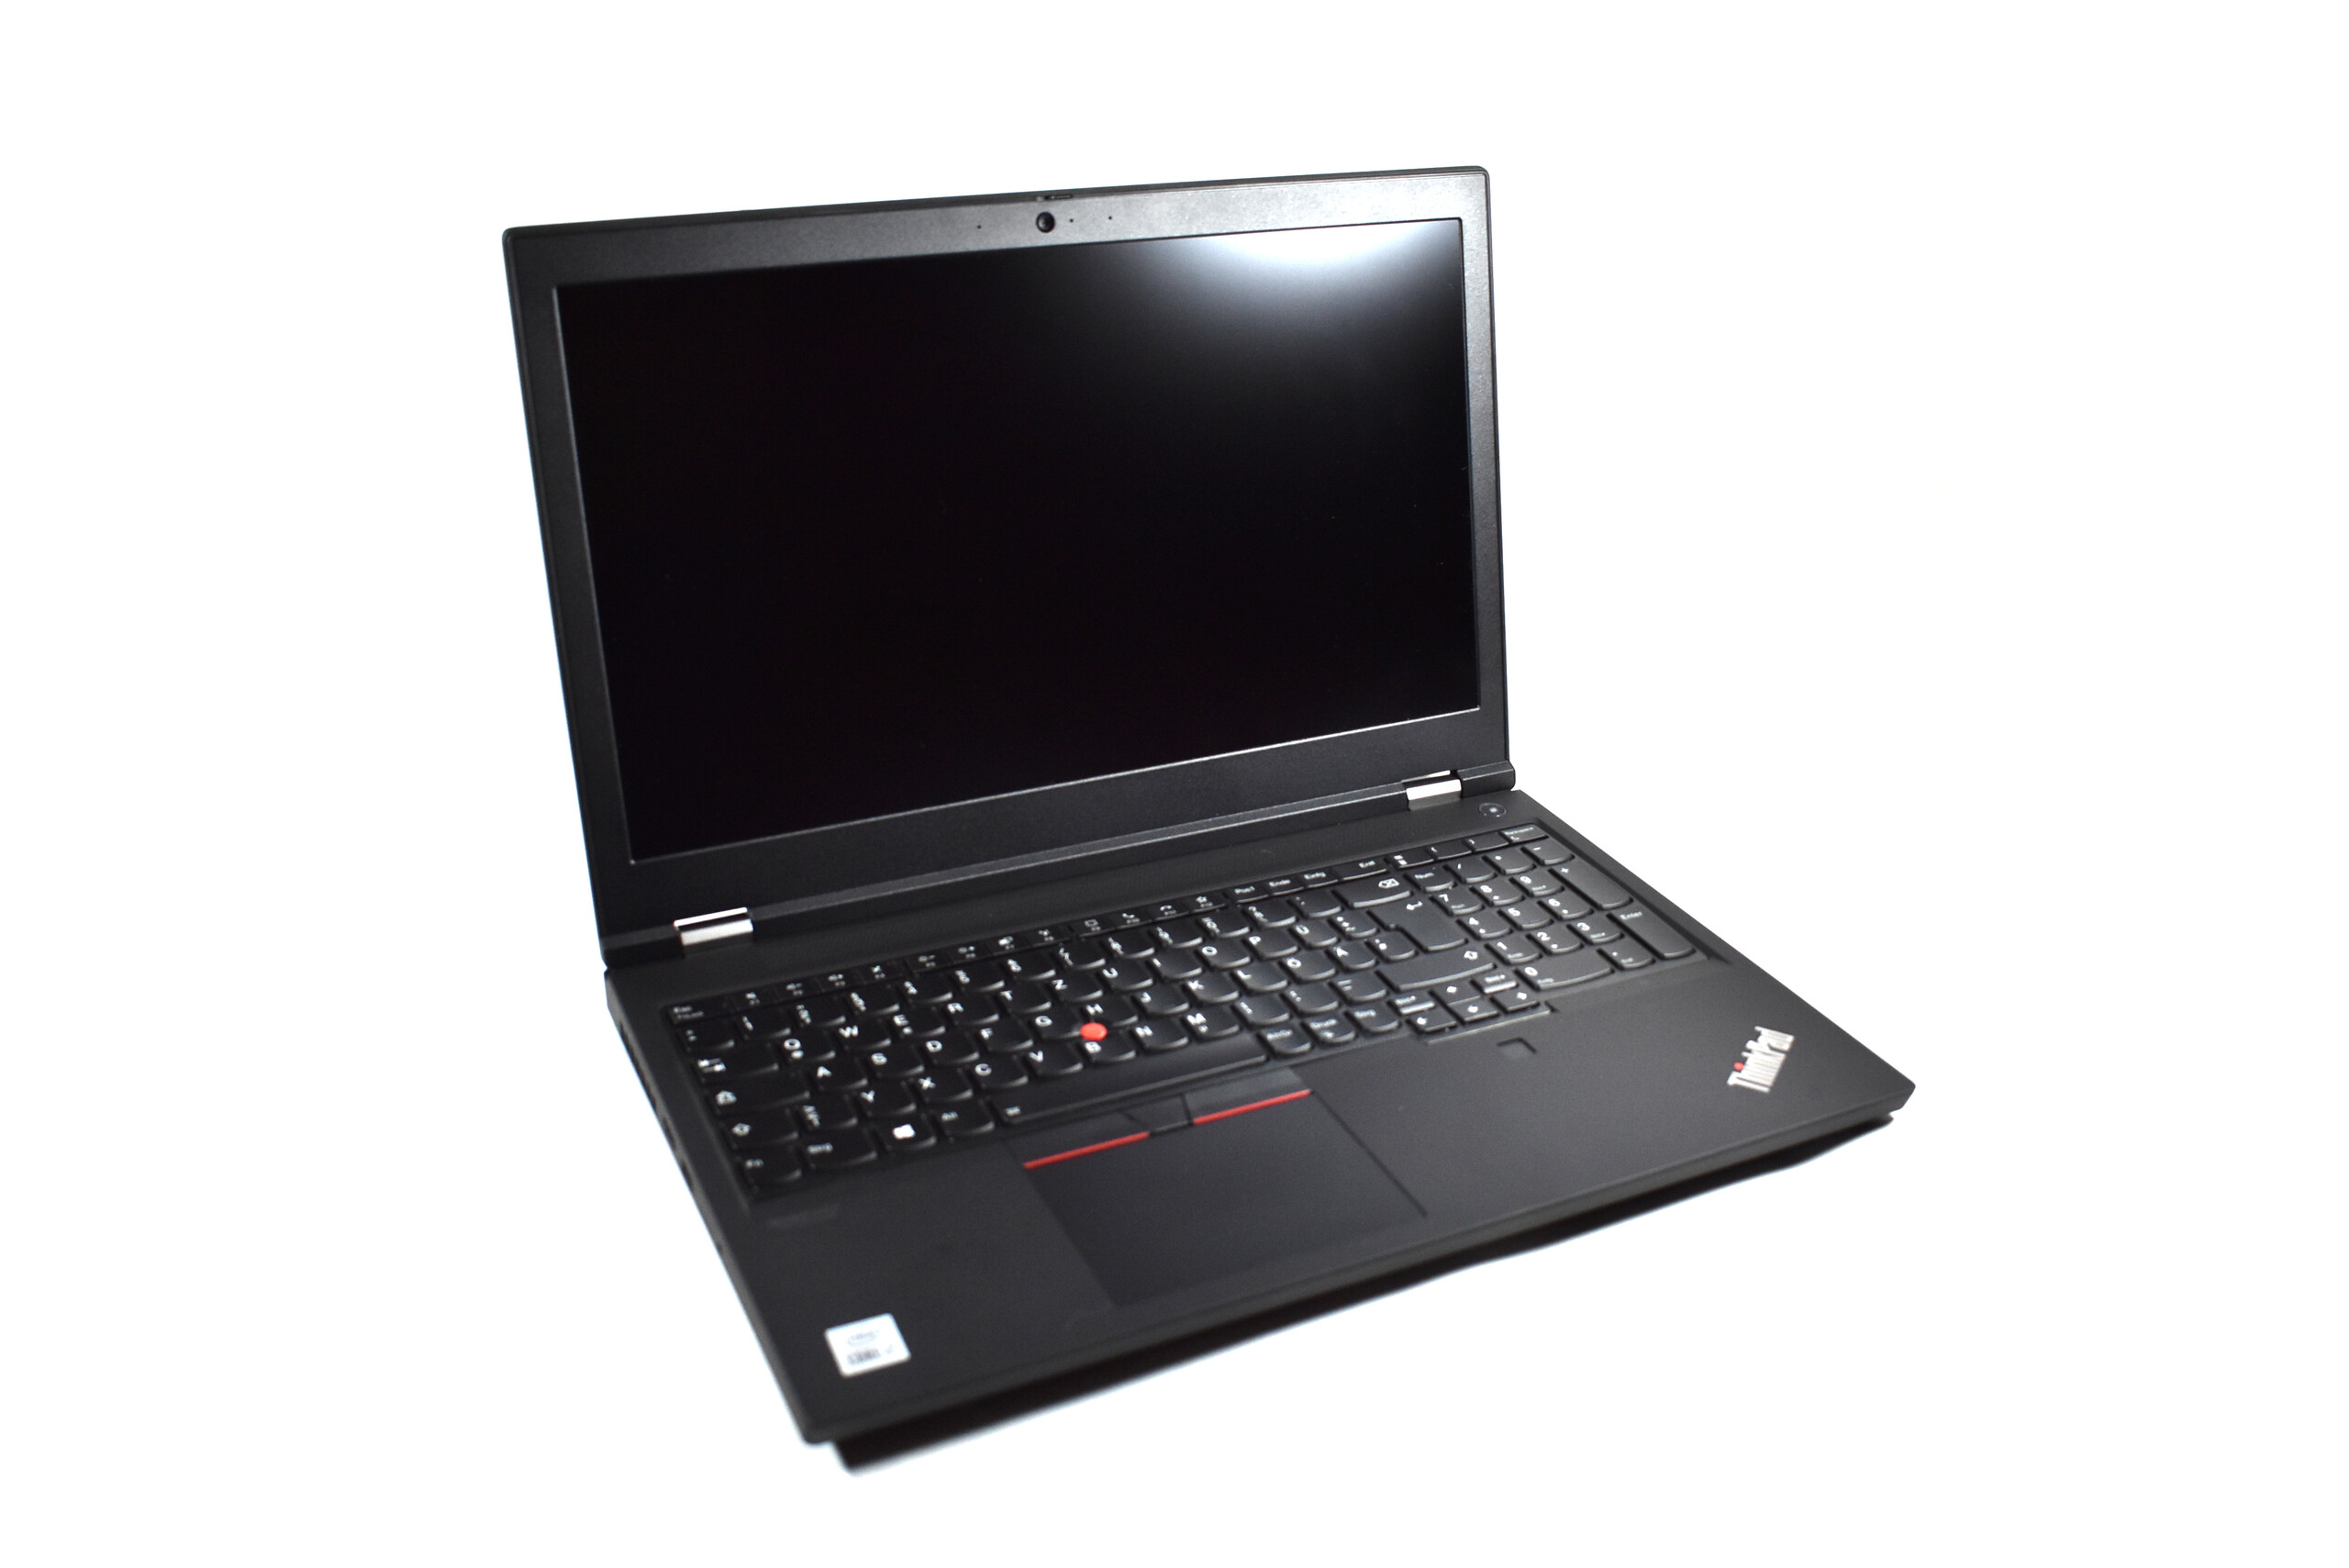
Externally, the Lenovo ThinkPad P15 Gen 1 looks very similar to its predecessor. However, under the hood and in the black case, many things have changed from the ThinkPad P53. Except for the magnesium frame inside, the case of the ThinkPad P15 is now completely made of glass-fiber plastic, whereas the case bottom was still made from a magnesium-aluminum alloy in the P53. While the general stability does not suffer from this, the haptics in some sense do, since you can just feel the difference between metal and plastic.
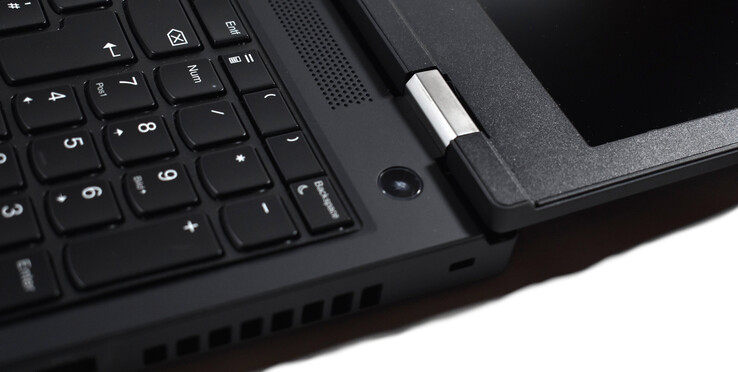
Surprisingly, Lenovo makes a big blunder in terms of the workmanship: As in the ThinkPad T15g, the keyboard has some noticeable give in the left bottom corner. Also, not all the design changes are positive: the two status LEDs below the display have been removed, just like the dedicated touchpad keys.
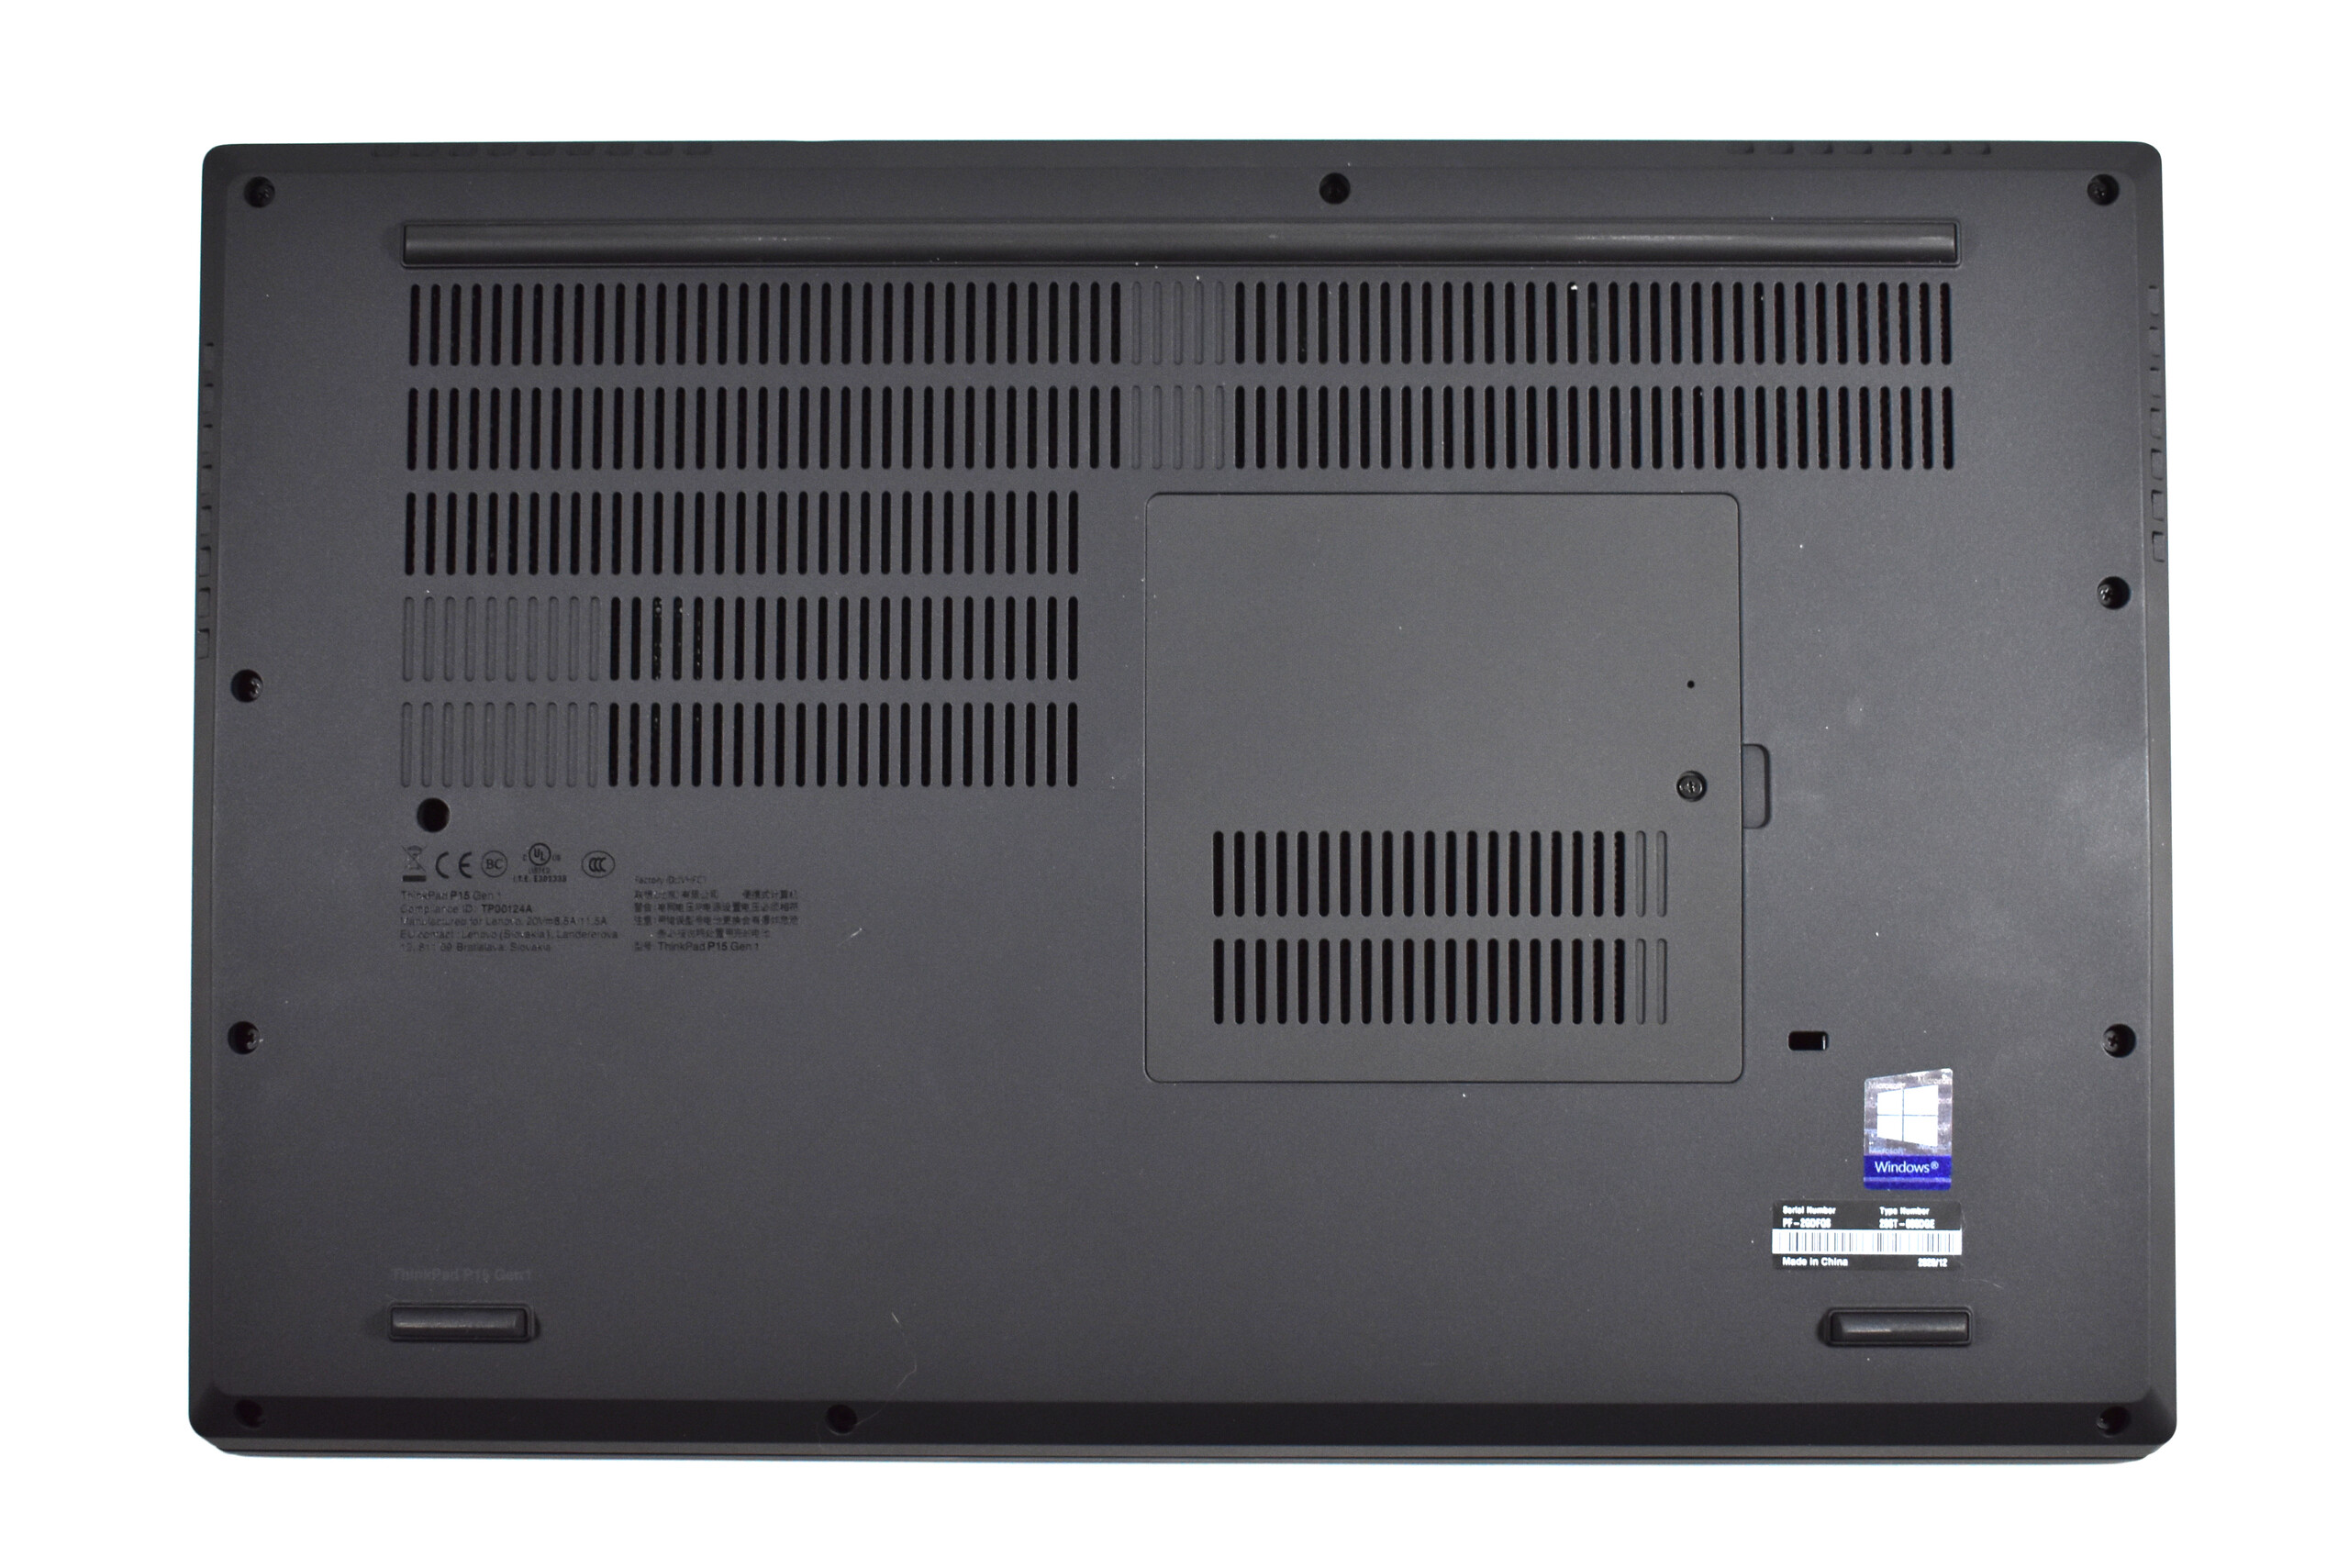
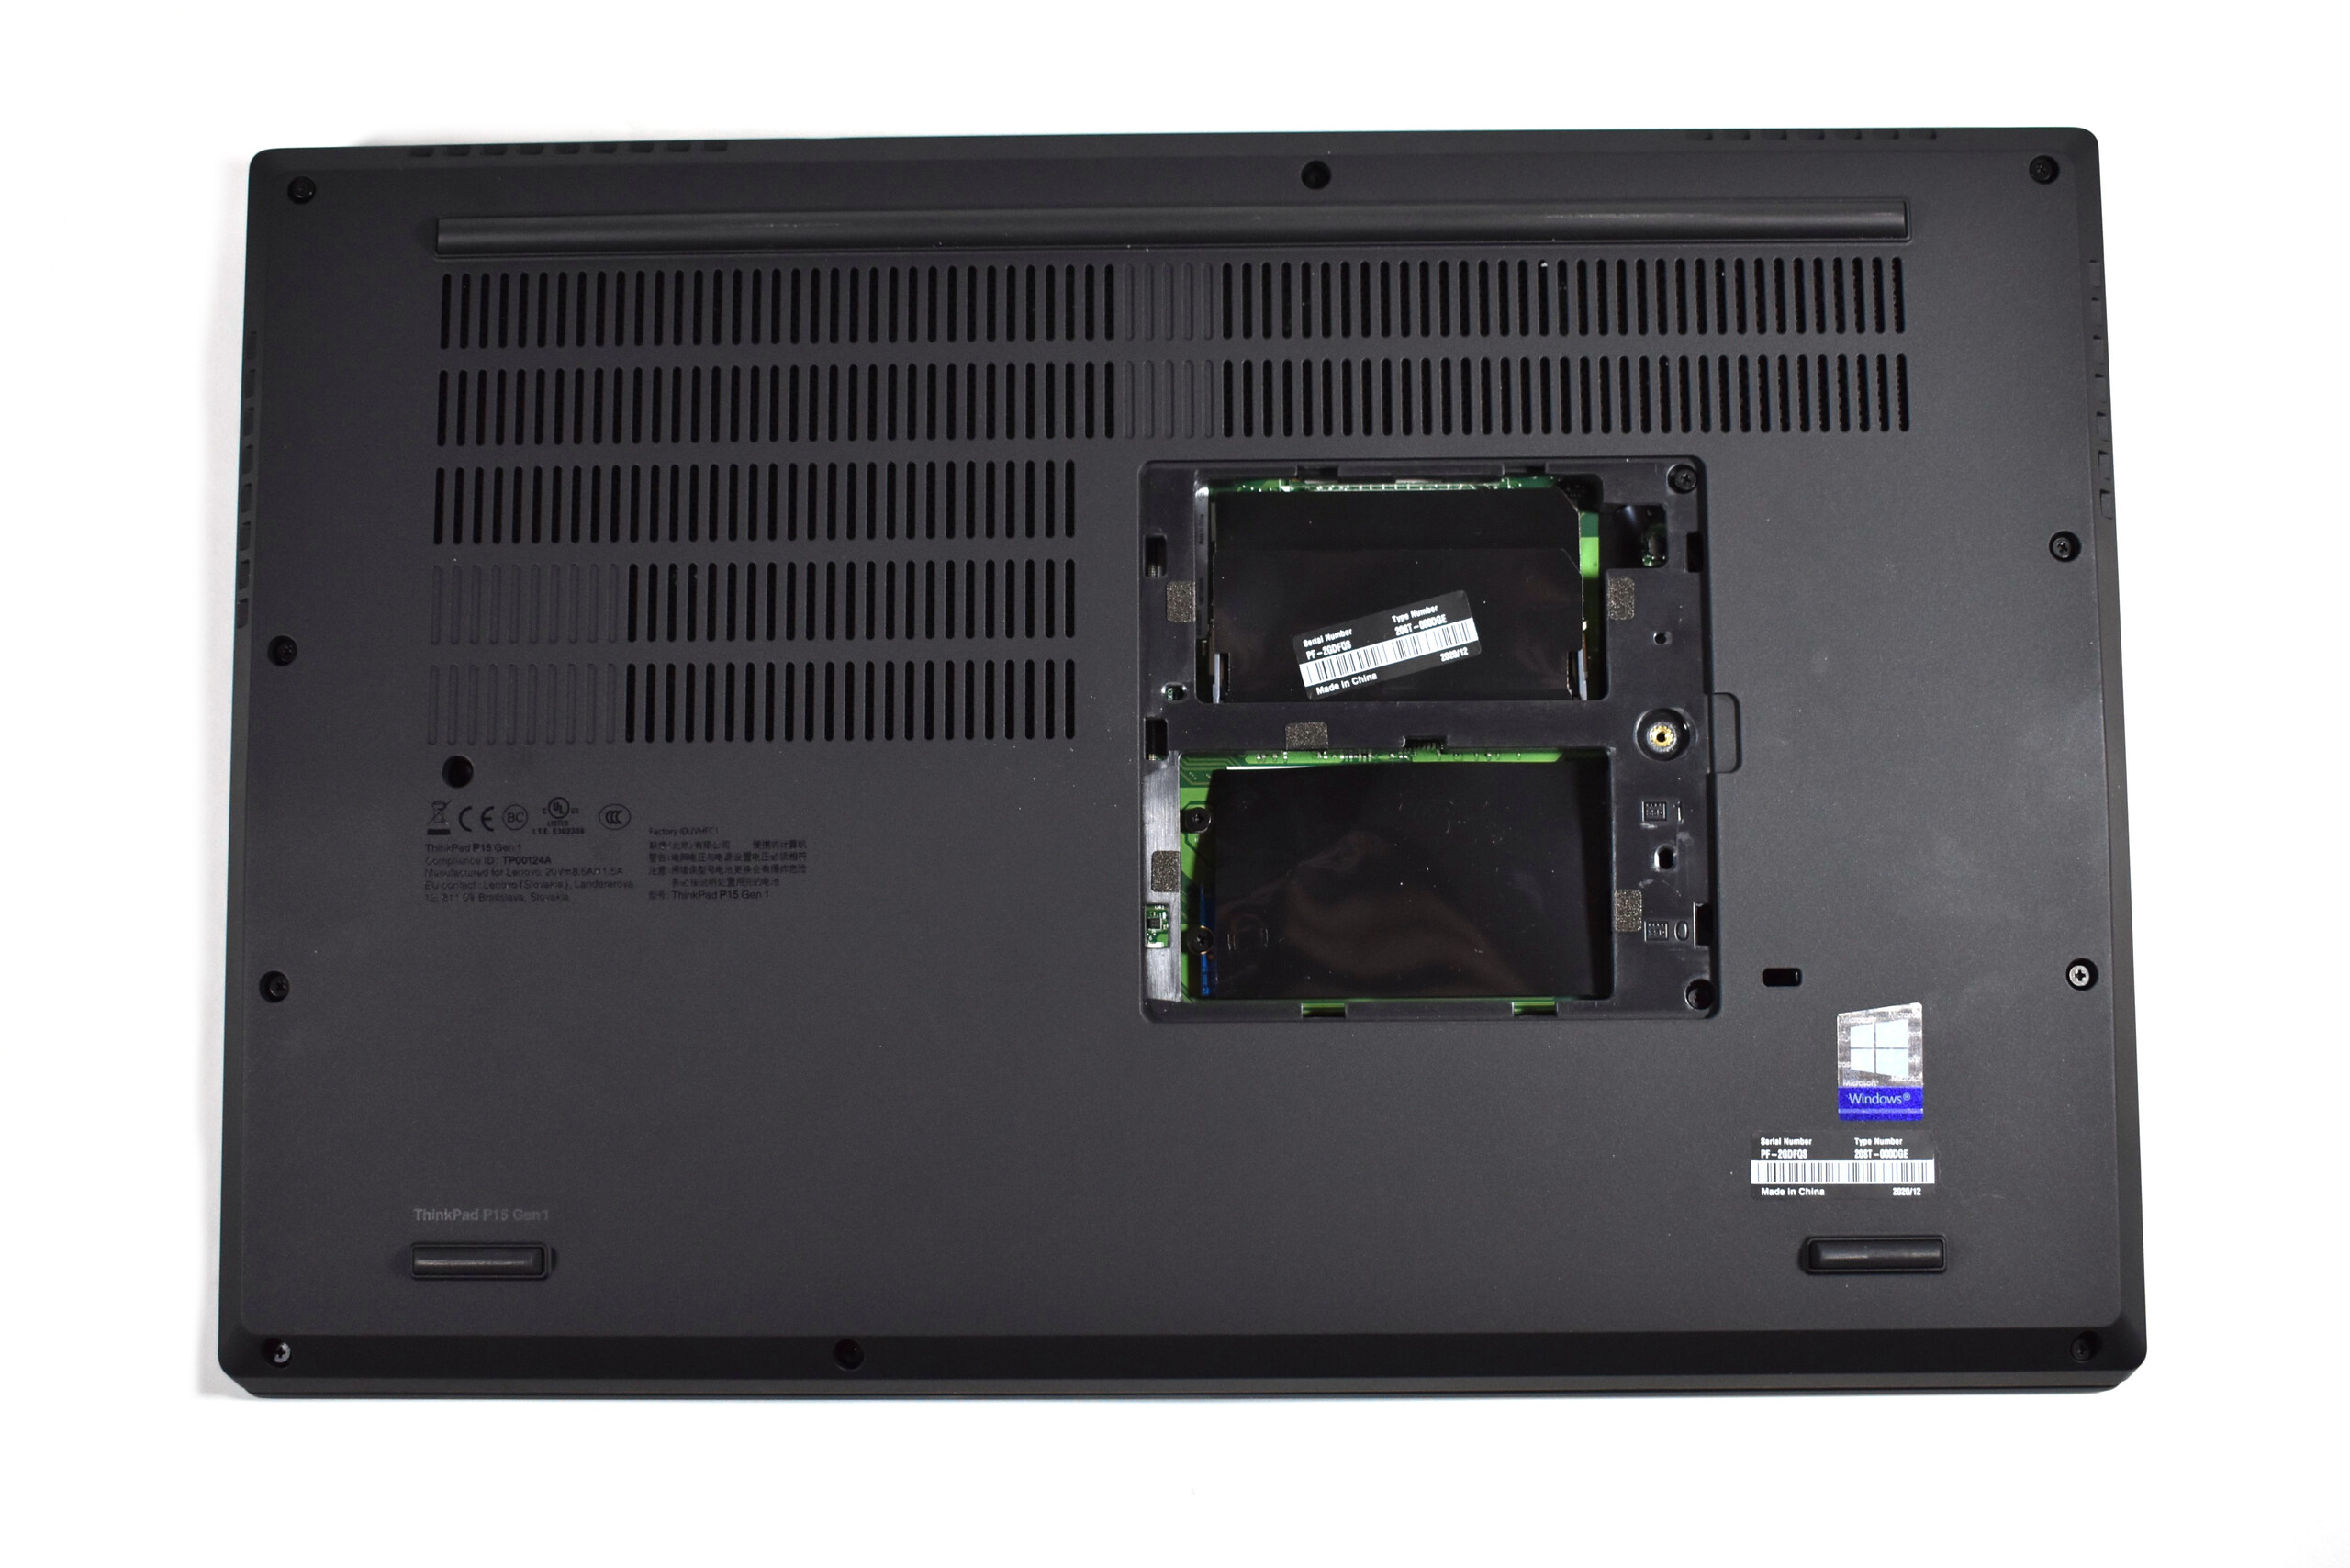
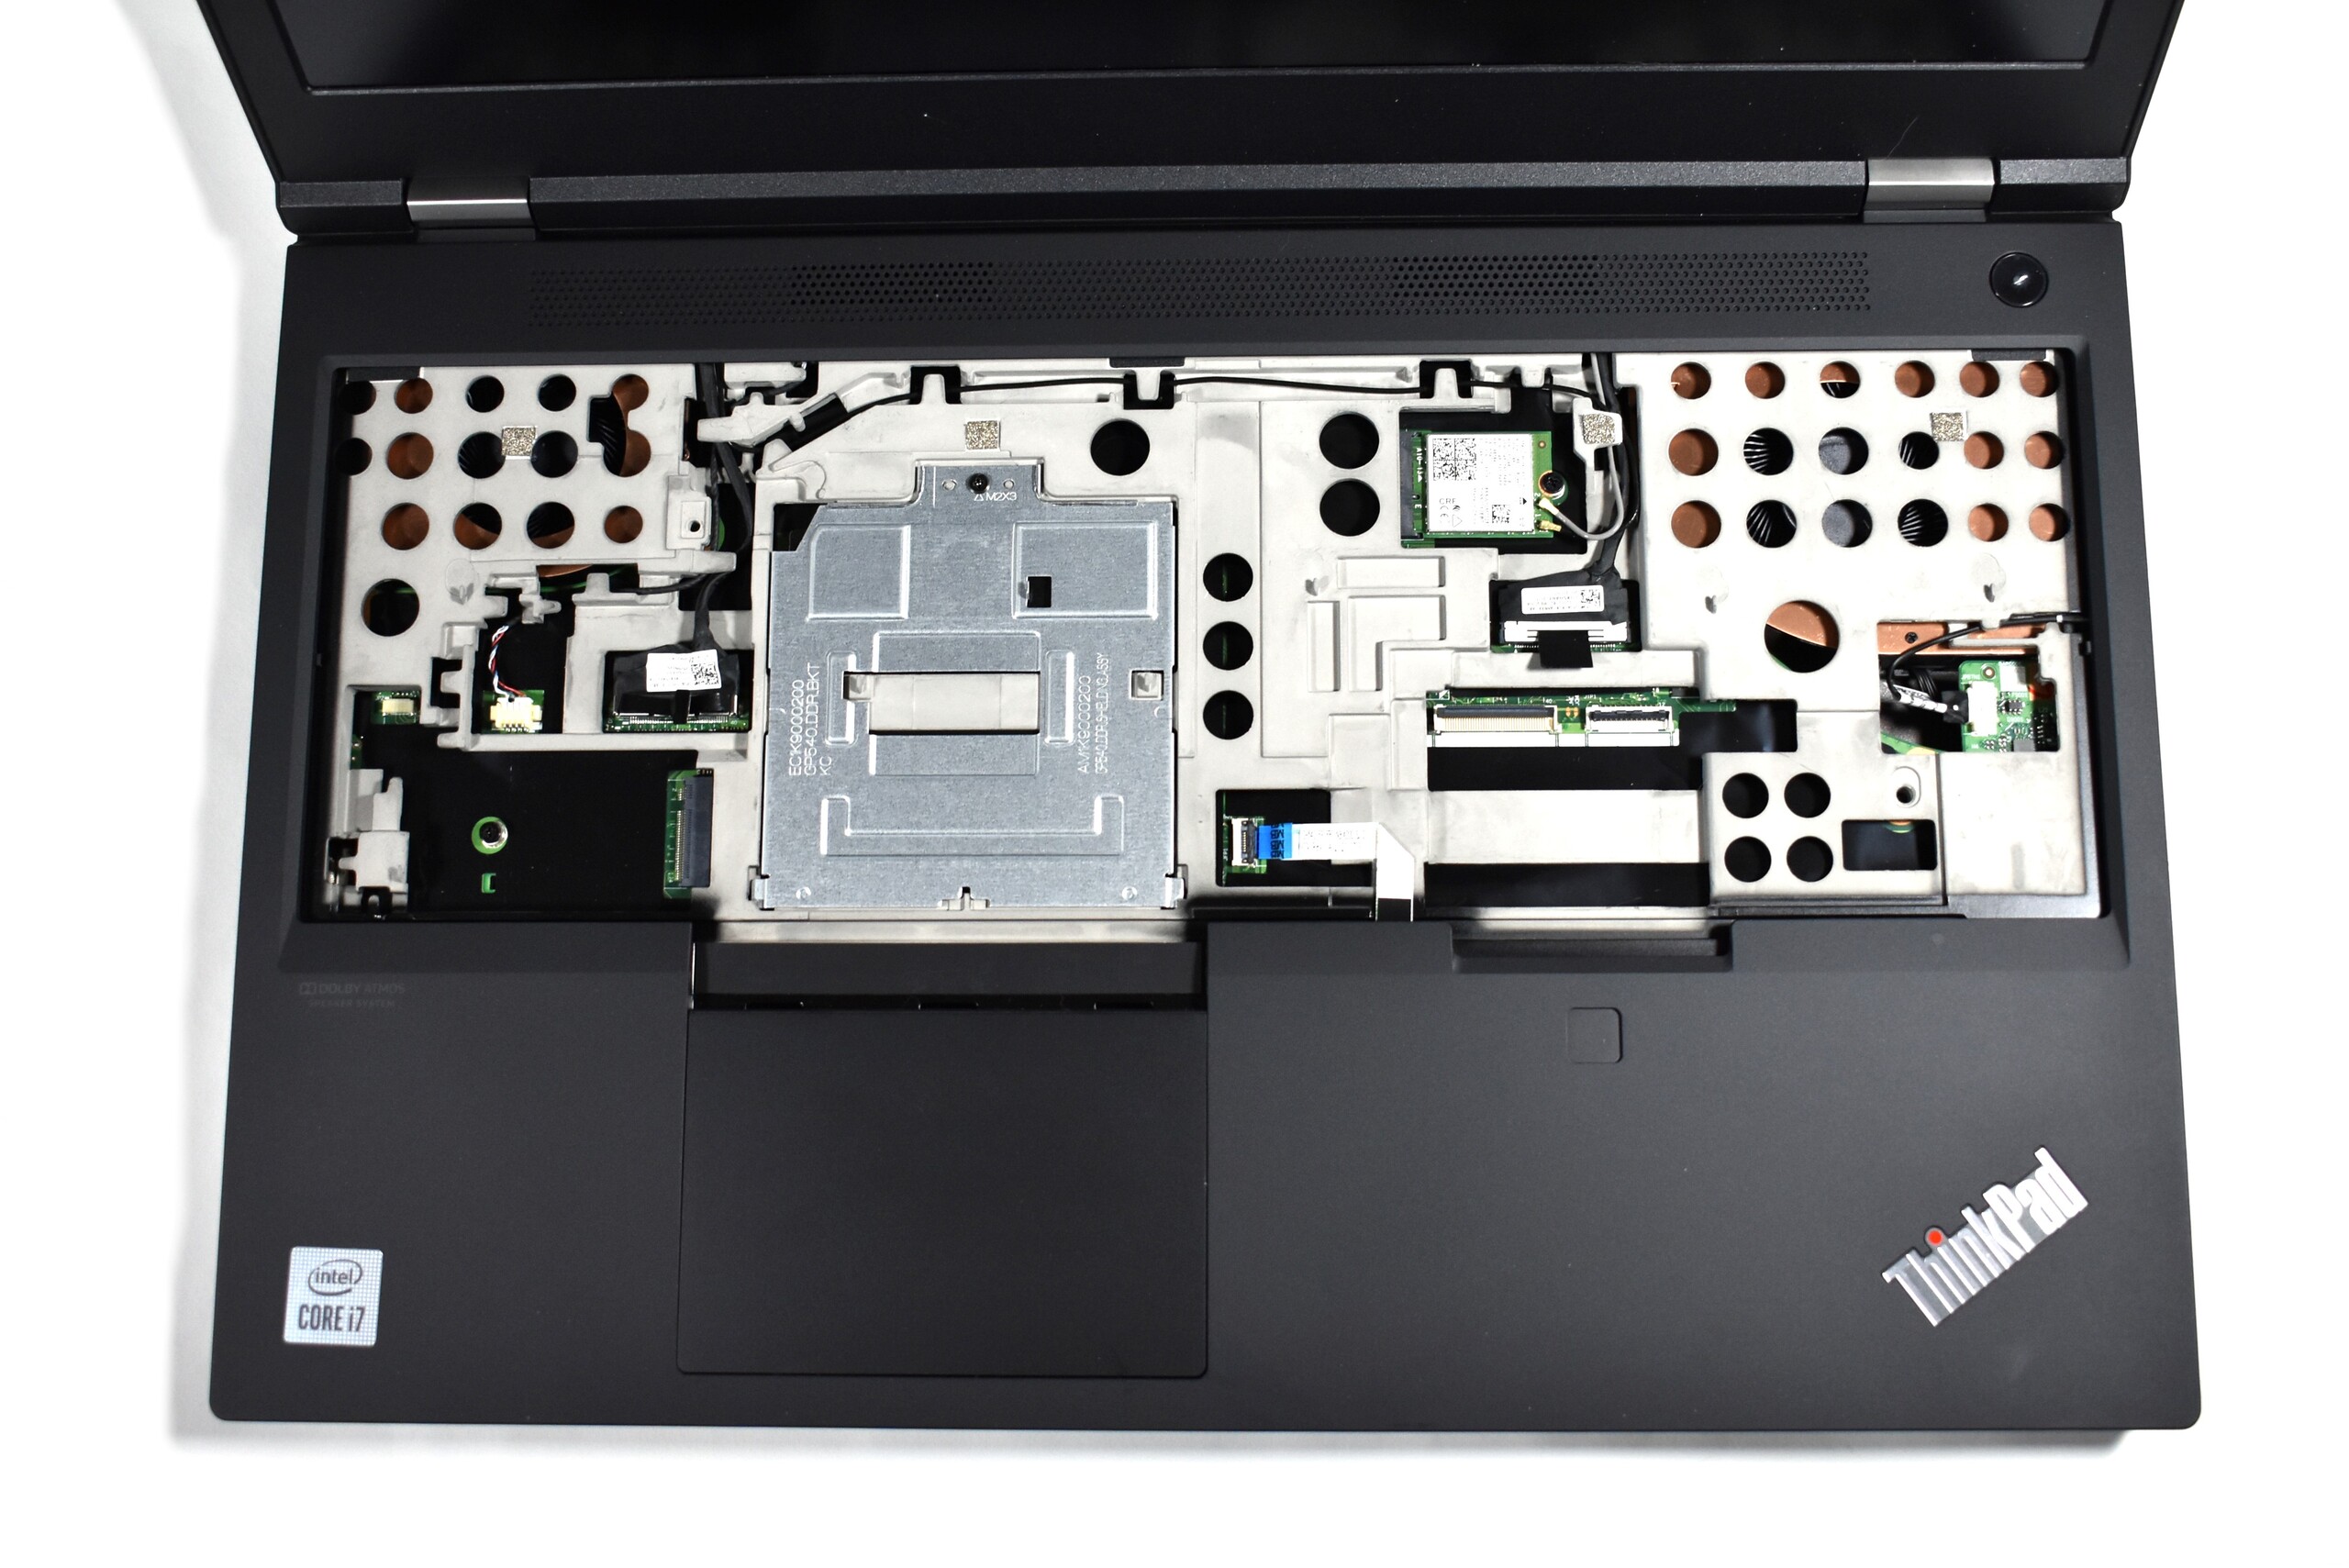
While some of these changes leave us rather concerned, we for sure like the improved maintenance options and increased modularity. In the predecessor, you still had to take apart the whole case in order to access the cooling system, but in the ThinkPad P15, it is sufficient to just remove the bottom plate. Removing the keyboard with number pad is similarly easy, giving access to two of the four RAM slots.
| SD Card Reader | |
| average JPG Copy Test (av. of 3 runs) | |
| Dell Precision 7550 (Toshiba Exceria Pro SDXC 64 GB UHS-II) | |
| Lenovo ThinkPad P53-20QN000YGE (Toshiba Exceria Pro SDXC 64 GB UHS-II) | |
| HP ZBook Fury 15 G7 (Toshiba Exceria Pro SDXC 64 GB UHS-II) | |
| Lenovo ThinkPad T15p-20TN0006GE (Toshiba Exceria Pro SDXC 64 GB UHS-II) | |
| Lenovo ThinkPad P15 Gen1-20ST000DGE (Toshiba Exceria Pro SDXC 64 GB UHS-II) | |
| Average of class Workstation (49.6 - 174.2, n=9, last 2 years) | |
| maximum AS SSD Seq Read Test (1GB) | |
| HP ZBook Fury 15 G7 (Toshiba Exceria Pro SDXC 64 GB UHS-II) | |
| Lenovo ThinkPad P53-20QN000YGE (Toshiba Exceria Pro SDXC 64 GB UHS-II) | |
| Dell Precision 7550 (Toshiba Exceria Pro SDXC 64 GB UHS-II) | |
| Lenovo ThinkPad T15p-20TN0006GE (Toshiba Exceria Pro SDXC 64 GB UHS-II) | |
| Lenovo ThinkPad P15 Gen1-20ST000DGE (Toshiba Exceria Pro SDXC 64 GB UHS-II) | |
| Average of class Workstation (85.1 - 227, n=9, last 2 years) | |
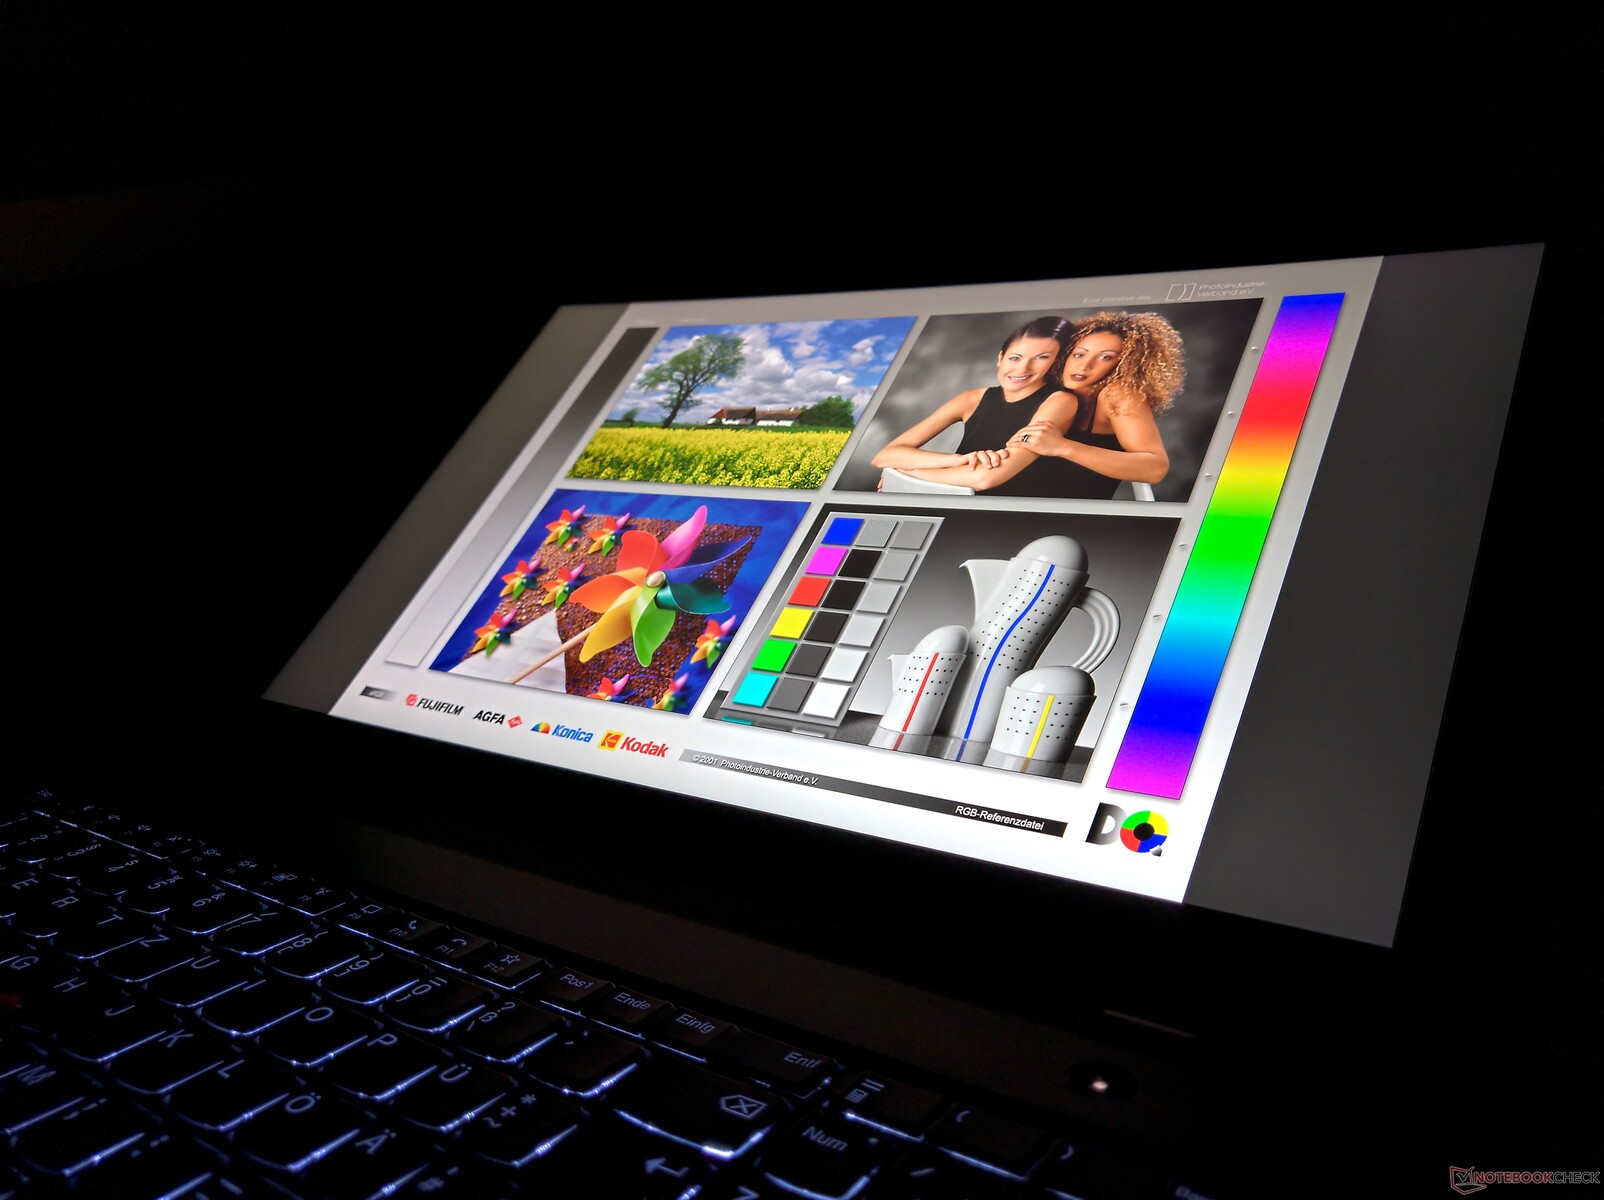
Display: Testing the entry-level panel of the Lenovo ThinkPad P15

Like many other ThinkPad laptops, the Lenovo ThinkPad P15 Gen 1 also offers a selection of available displays that all have the 15.6-inch diagonal and 16:9 format in common:
- Full-HD (1920 x 1080), IPS LCD, 300 cd/m², 72% NTSC, matte
- Full-HD (1920 x 1080), IPS LCD, 500 cd/m², 72% NTSC, matte, Dolby Vision
- 4K-UHD (3840 x 2160), IPS LCD, 600 cd/m², 100% AdobeRGB, matte, Dolby Vision
- 4K-UHD (3840 x 2160), OLED, 400 cd/m² (peak 500 cd/m²), 100% DCI-P3, glossy, Dolby Vision, touchscreen
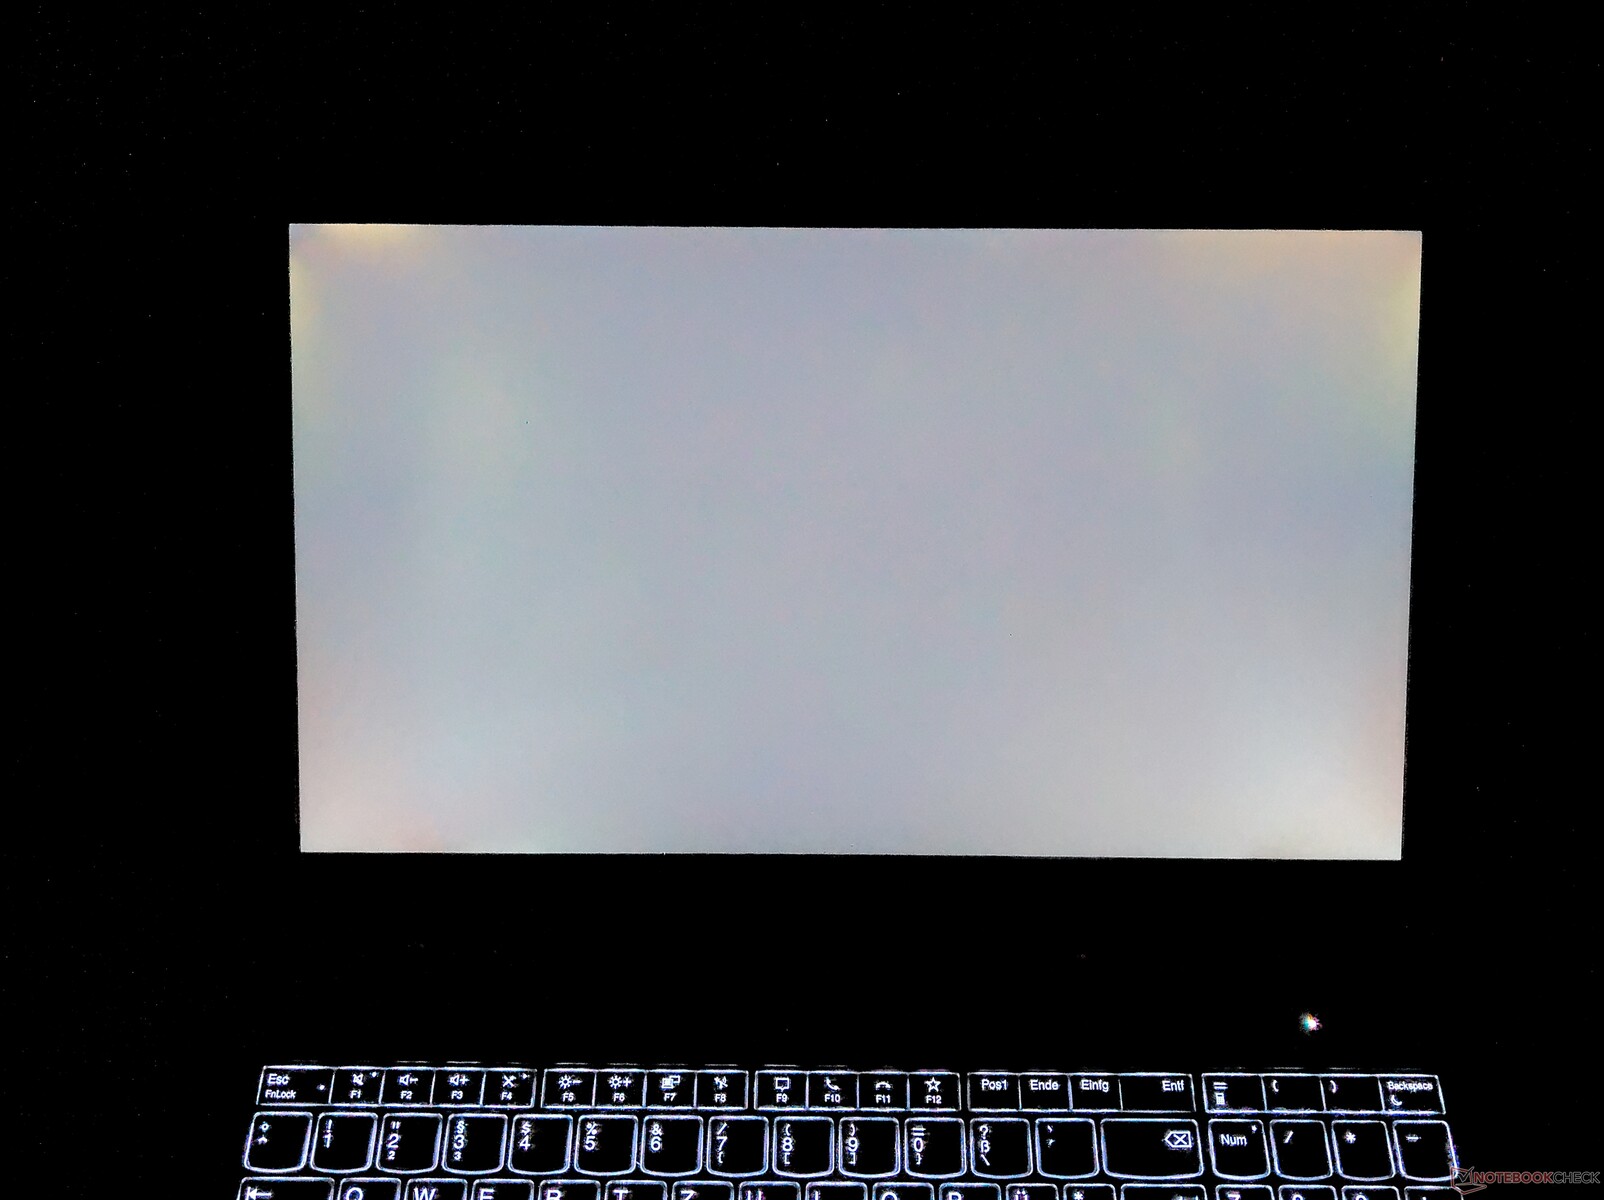
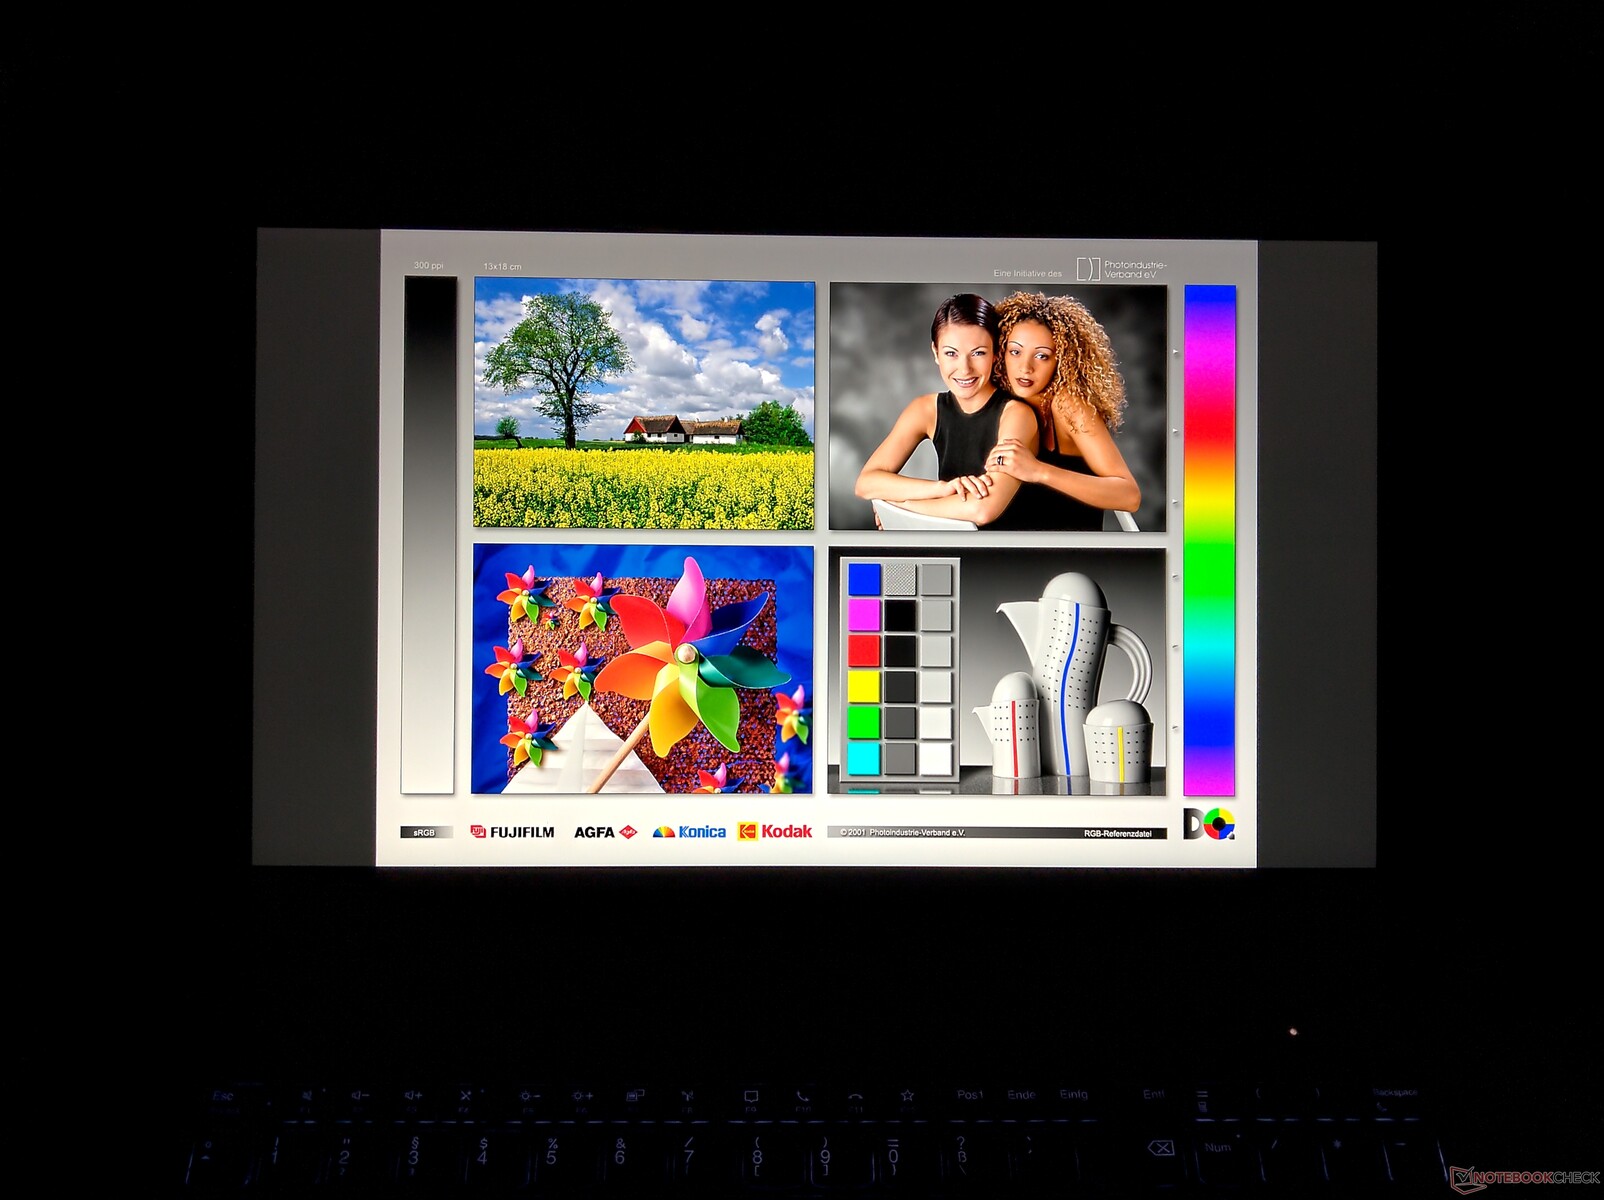
At a measured average brightness of 304 cd/m², the entry-level display in our test unit achieves the promised brightness value. While this makes the display the darkest of our comparison, this is not surprising, since the other workstations are equipped with 4K UHD displays and the ThinkPad P53 had the brighter Full-HD LCD.
The below-average brightness distribution stands out, but there is no noticeable shading looking with your naked eyes.
| |||||||||||||||||||||||||
Brightness Distribution: 81 %
Center on Battery: 336 cd/m²
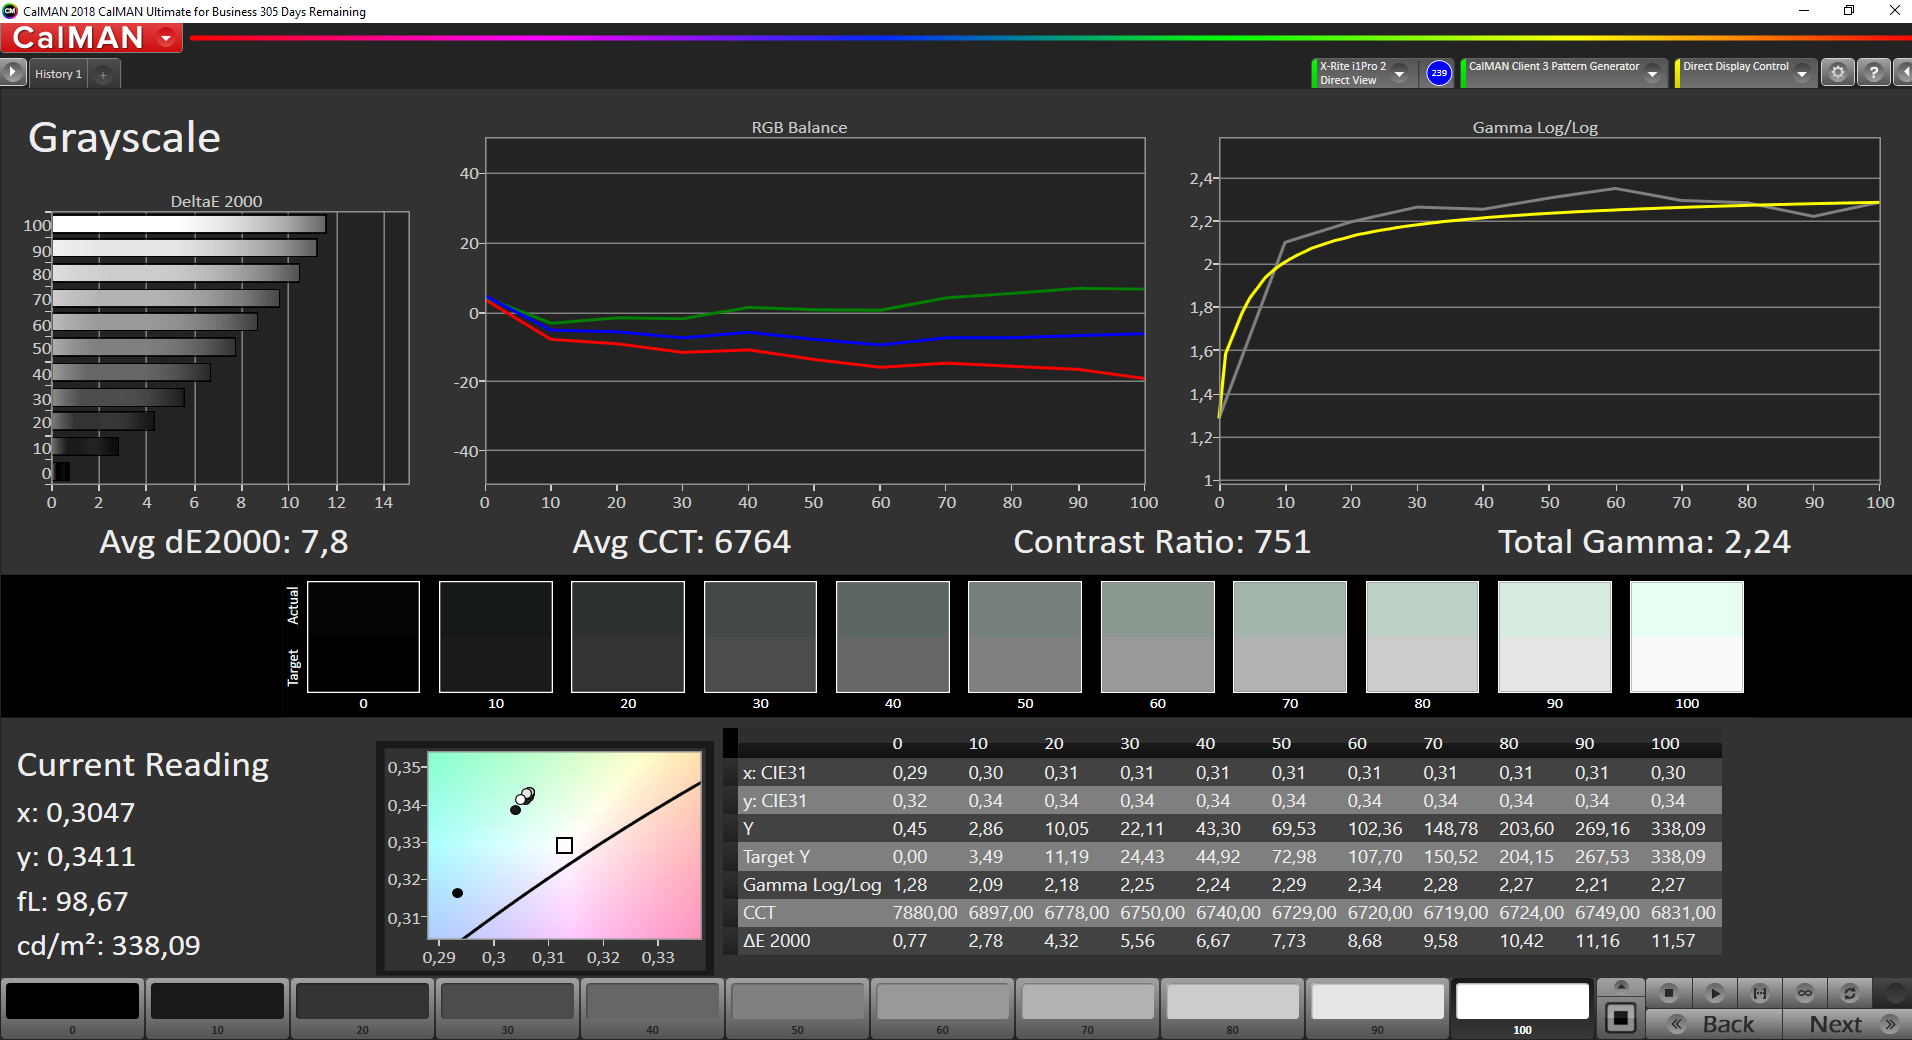
Contrast: 751:1 (Black: 0.45 cd/m²)
ΔE ColorChecker Calman: 5.5 | ∀{0.5-29.43 Ø4.81}
calibrated: 1.9
ΔE Greyscale Calman: 7.8 | ∀{0.09-98 Ø5.1}
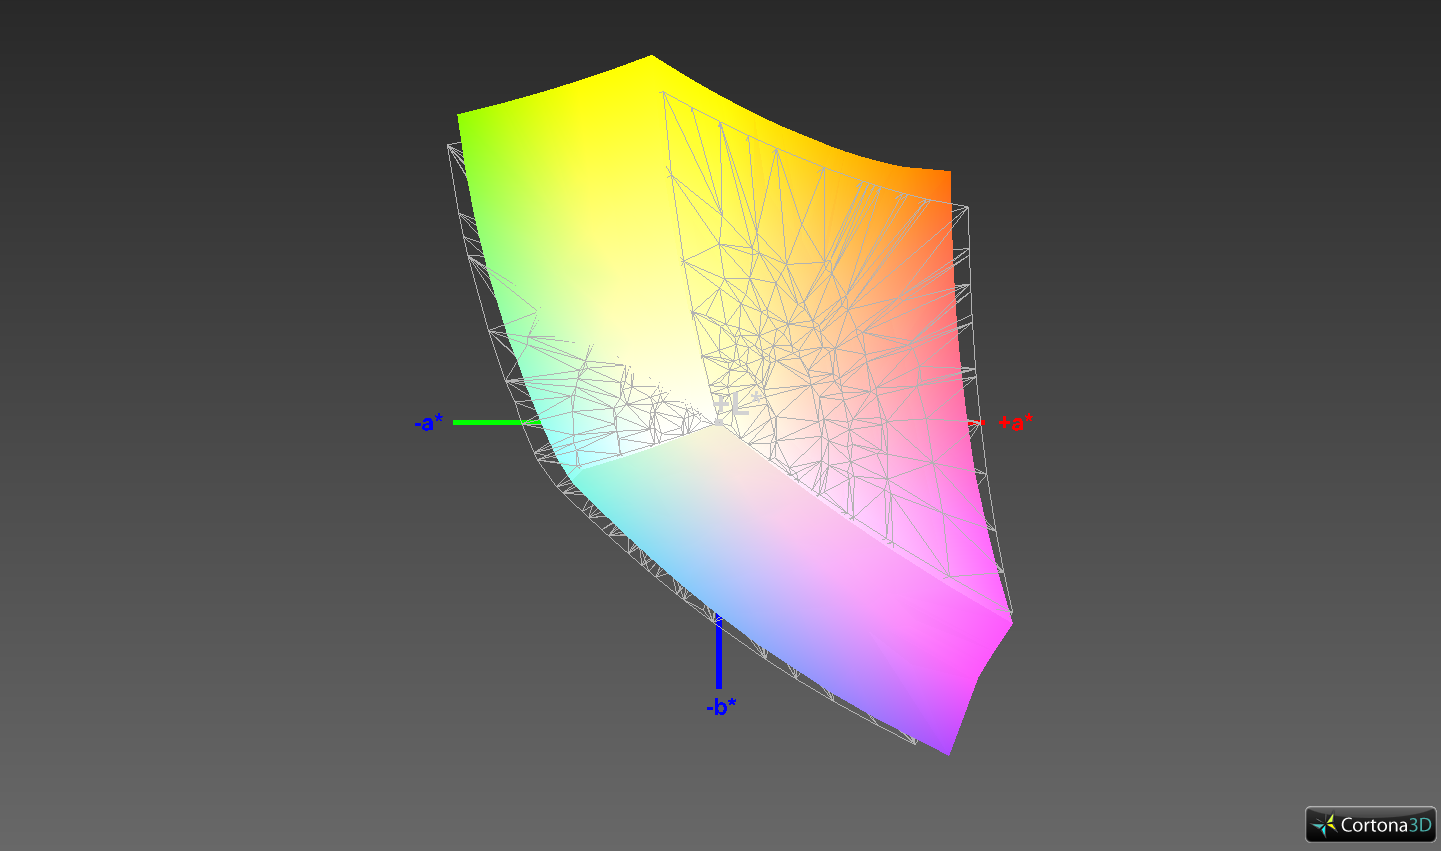
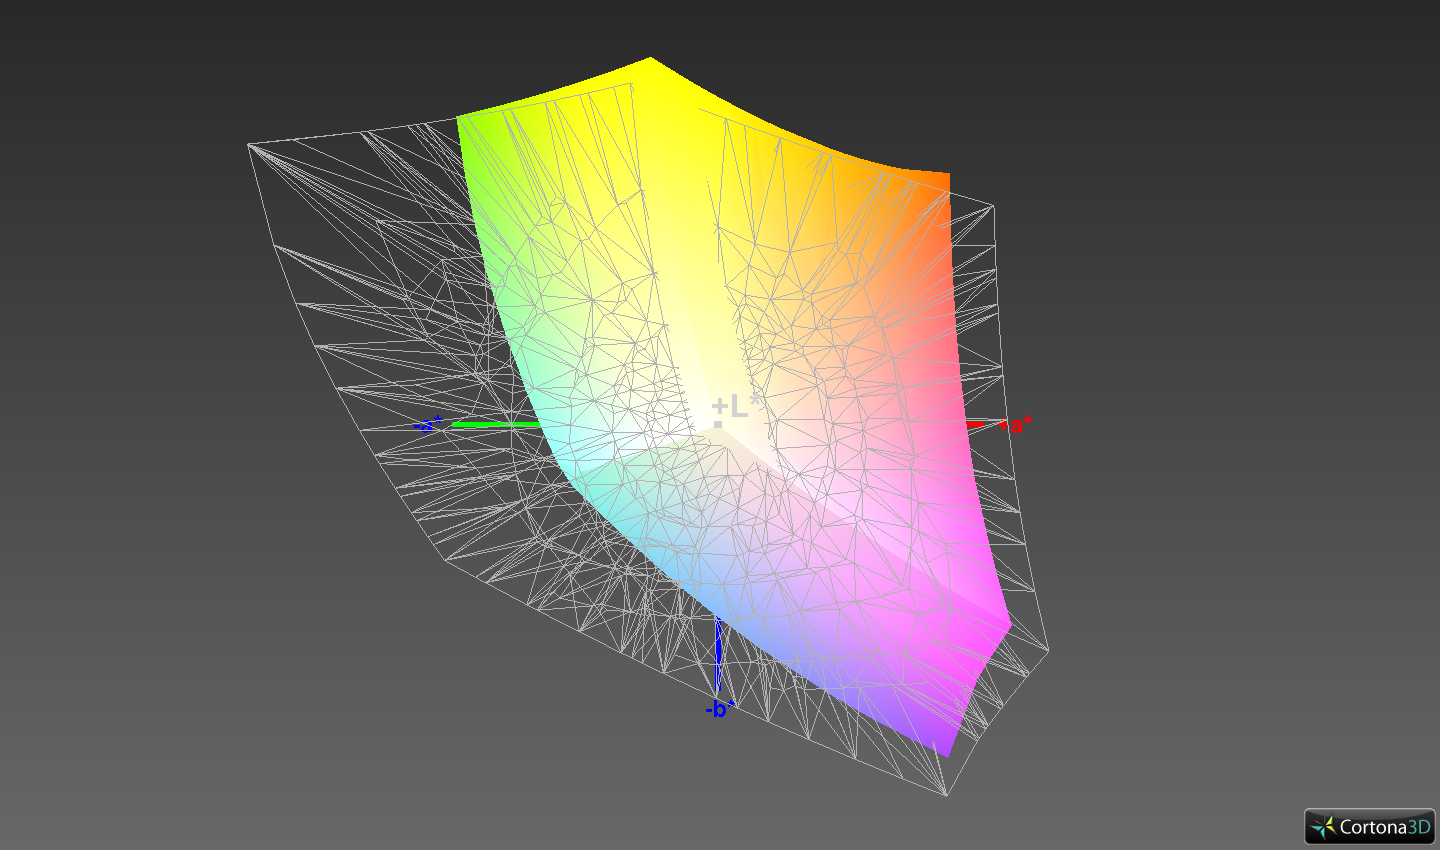
92.1% sRGB (Argyll 1.6.3 3D)
60% AdobeRGB 1998 (Argyll 1.6.3 3D)
67.1% AdobeRGB 1998 (Argyll 3D)
92.3% sRGB (Argyll 3D)
66.6% Display P3 (Argyll 3D)
Gamma: 2.24
CCT: 6764 K
| Lenovo ThinkPad P15 Gen1-20ST000DGE N156HCE-EN1, a-Si IPS LED, 1920x1080, 15.6" | Lenovo ThinkPad P53-20QN000YGE N156HCE-GN1, IPS, 1920x1080, 15.6" | Lenovo ThinkPad T15p-20TN0006GE MNF601EA1-1, IPS LED, 3840x2160, 15.6" | Dell Precision 7550 AU Optronics B156ZAN, IPS, 3840x2160, 15.6" | HP ZBook Fury 15 G7 LG Philips LGD0661, IPS, 3840x2160, 15.6" | |
|---|---|---|---|---|---|
| Display | -3% | 28% | 25% | 26% | |
| Display P3 Coverage (%) | 66.6 | 63.2 -5% | 86.8 30% | 82.1 23% | 95.6 44% |
| sRGB Coverage (%) | 92.3 | 92.9 1% | 99.3 8% | 99.6 8% | 99.8 8% |
| AdobeRGB 1998 Coverage (%) | 67.1 | 64.3 -4% | 98.5 47% | 96.8 44% | 84.5 26% |
| Response Times | 15% | 17% | -14% | -23% | |
| Response Time Grey 50% / Grey 80% * (ms) | 41.2 ? | 38.4 ? 7% | 41.6 ? -1% | 51.2 ? -24% | 56 ? -36% |
| Response Time Black / White * (ms) | 32.8 ? | 25.2 ? 23% | 21.2 ? 35% | 34 ? -4% | 36 ? -10% |
| PWM Frequency (Hz) | 24270 | 26040 ? | |||
| Screen | 39% | 64% | 14% | 35% | |
| Brightness middle (cd/m²) | 338 | 510 51% | 595 76% | 473.5 40% | 672.8 99% |
| Brightness (cd/m²) | 304 | 468 54% | 594 95% | 461 52% | 674 122% |
| Brightness Distribution (%) | 81 | 89 10% | 94 16% | 90 11% | 89 10% |
| Black Level * (cd/m²) | 0.45 | 0.36 20% | 0.32 29% | 0.55 -22% | 0.5 -11% |
| Contrast (:1) | 751 | 1417 89% | 1859 148% | 861 15% | 1346 79% |
| Colorchecker dE 2000 * | 5.5 | 2.3 58% | 1.2 78% | 4.8 13% | 3.48 37% |
| Colorchecker dE 2000 max. * | 11.5 | 5.5 52% | 2.5 78% | 8.73 24% | 9.44 18% |
| Colorchecker dE 2000 calibrated * | 1.9 | 1.2 37% | 1 47% | 3.08 -62% | 3.03 -59% |
| Greyscale dE 2000 * | 7.8 | 3.2 59% | 1.4 82% | 5.6 28% | 3.1 60% |
| Gamma | 2.24 98% | 2.34 94% | 2.1 105% | 2.34 94% | 2.04 108% |
| CCT | 6764 96% | 7036 92% | 6492 100% | 7549 86% | 6380 102% |
| Color Space (Percent of AdobeRGB 1998) (%) | 60 | 59.4 -1% | 85.3 42% | 86.4 44% | 75.2 25% |
| Color Space (Percent of sRGB) (%) | 92.1 | 93.1 1% | 99.2 8% | 99.7 8% | 100 9% |
| Total Average (Program / Settings) | 17% /
28% | 36% /
51% | 8% /
12% | 13% /
26% |
* ... smaller is better
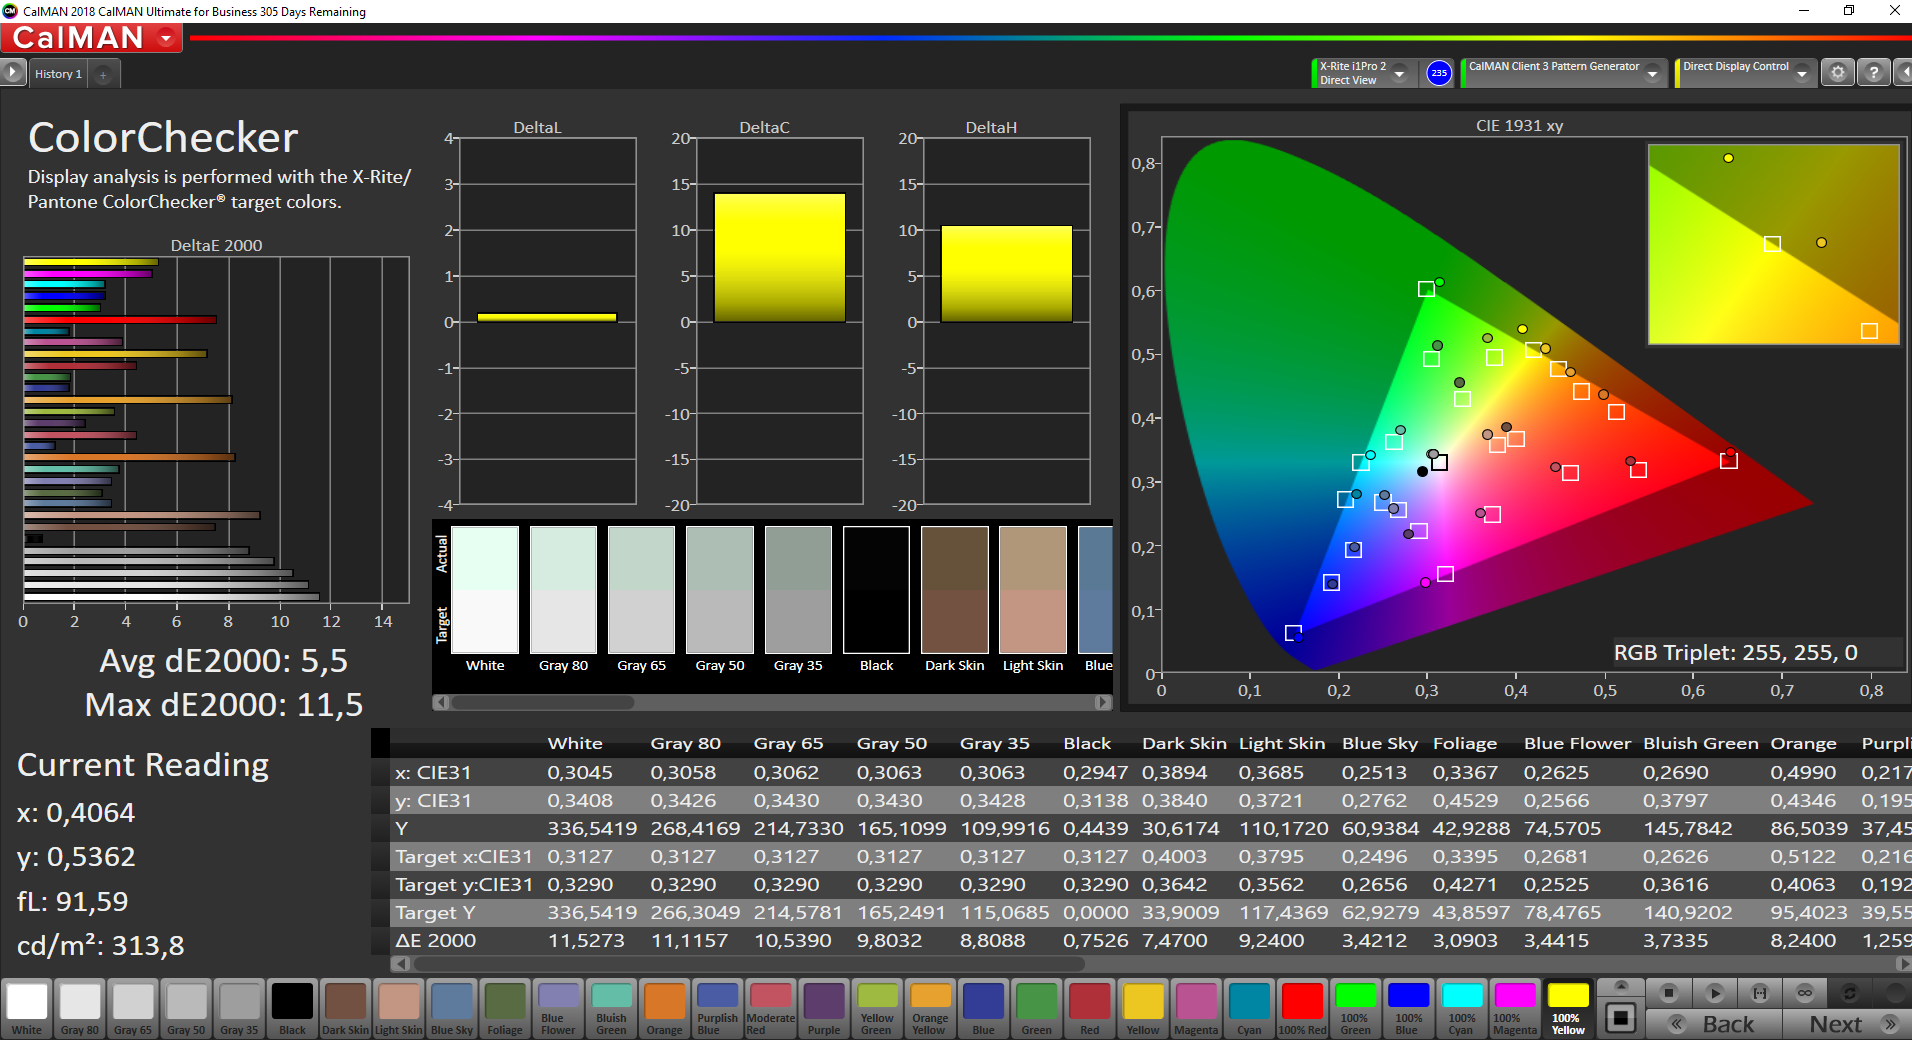
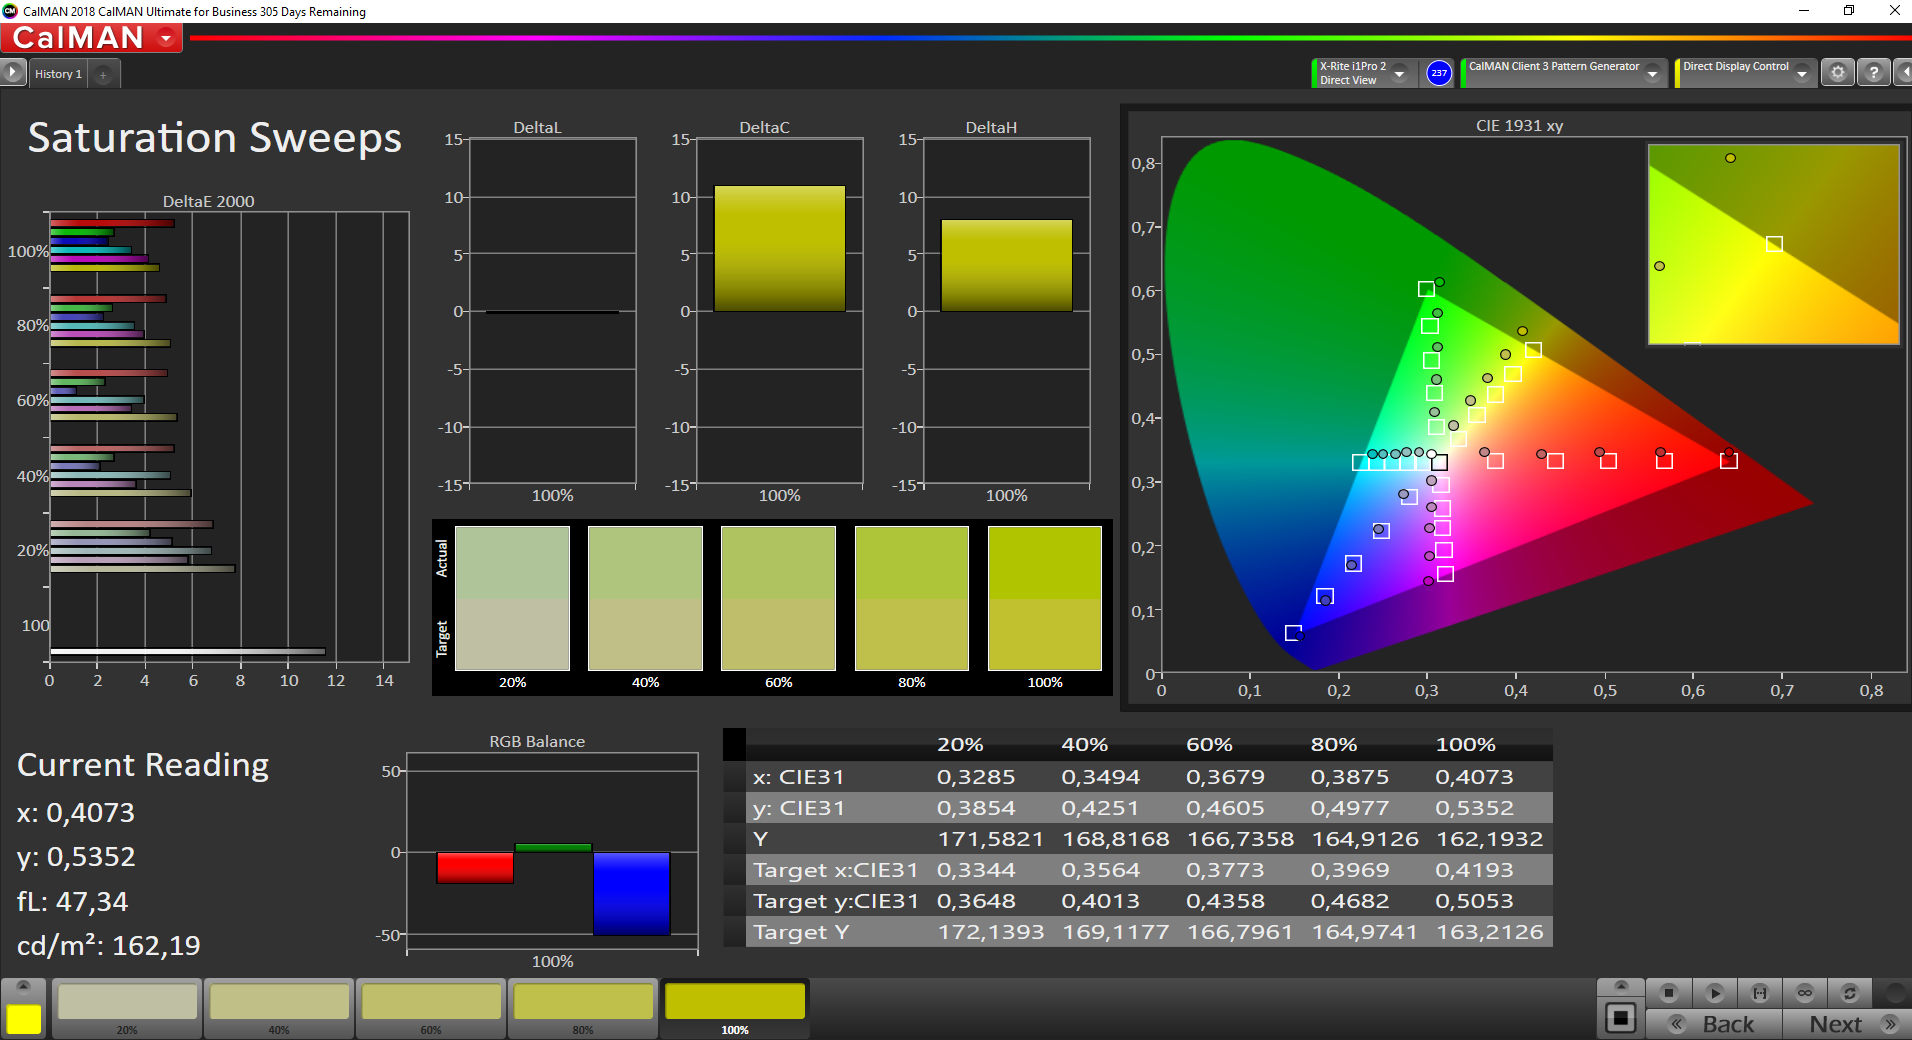
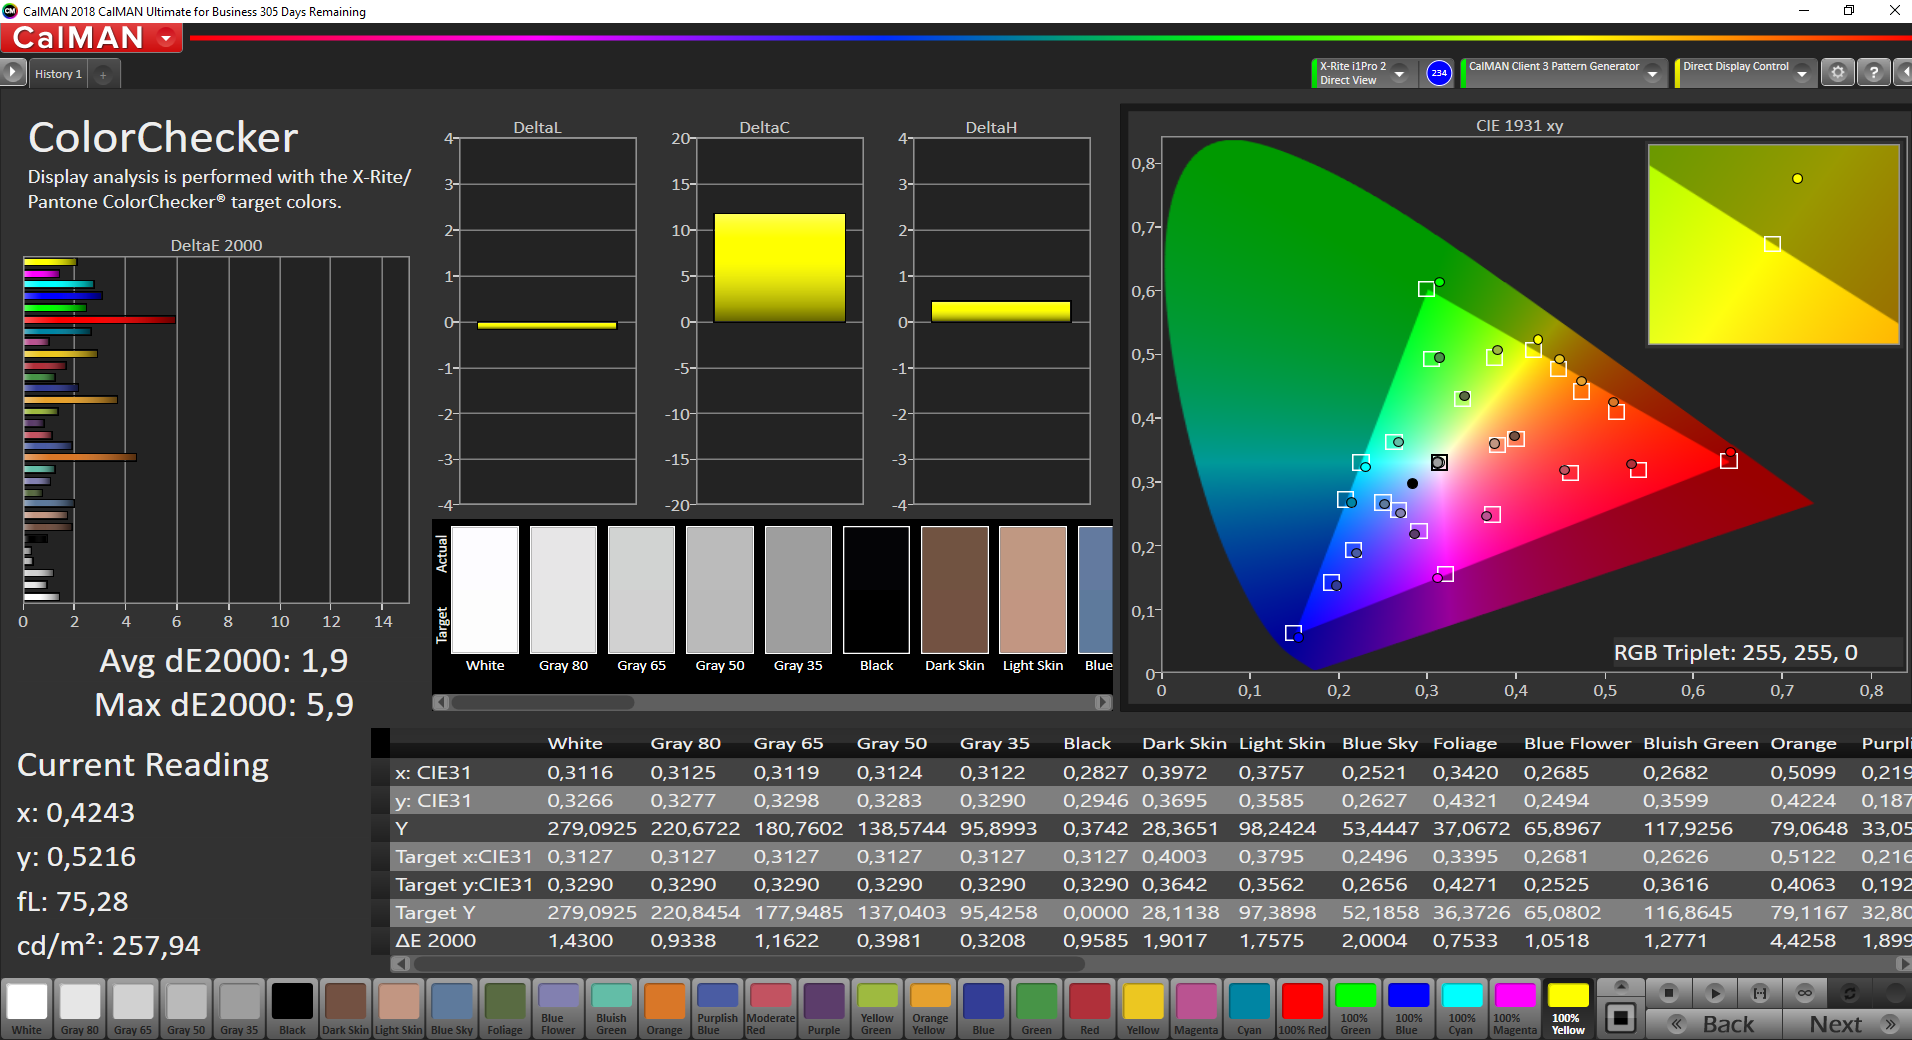
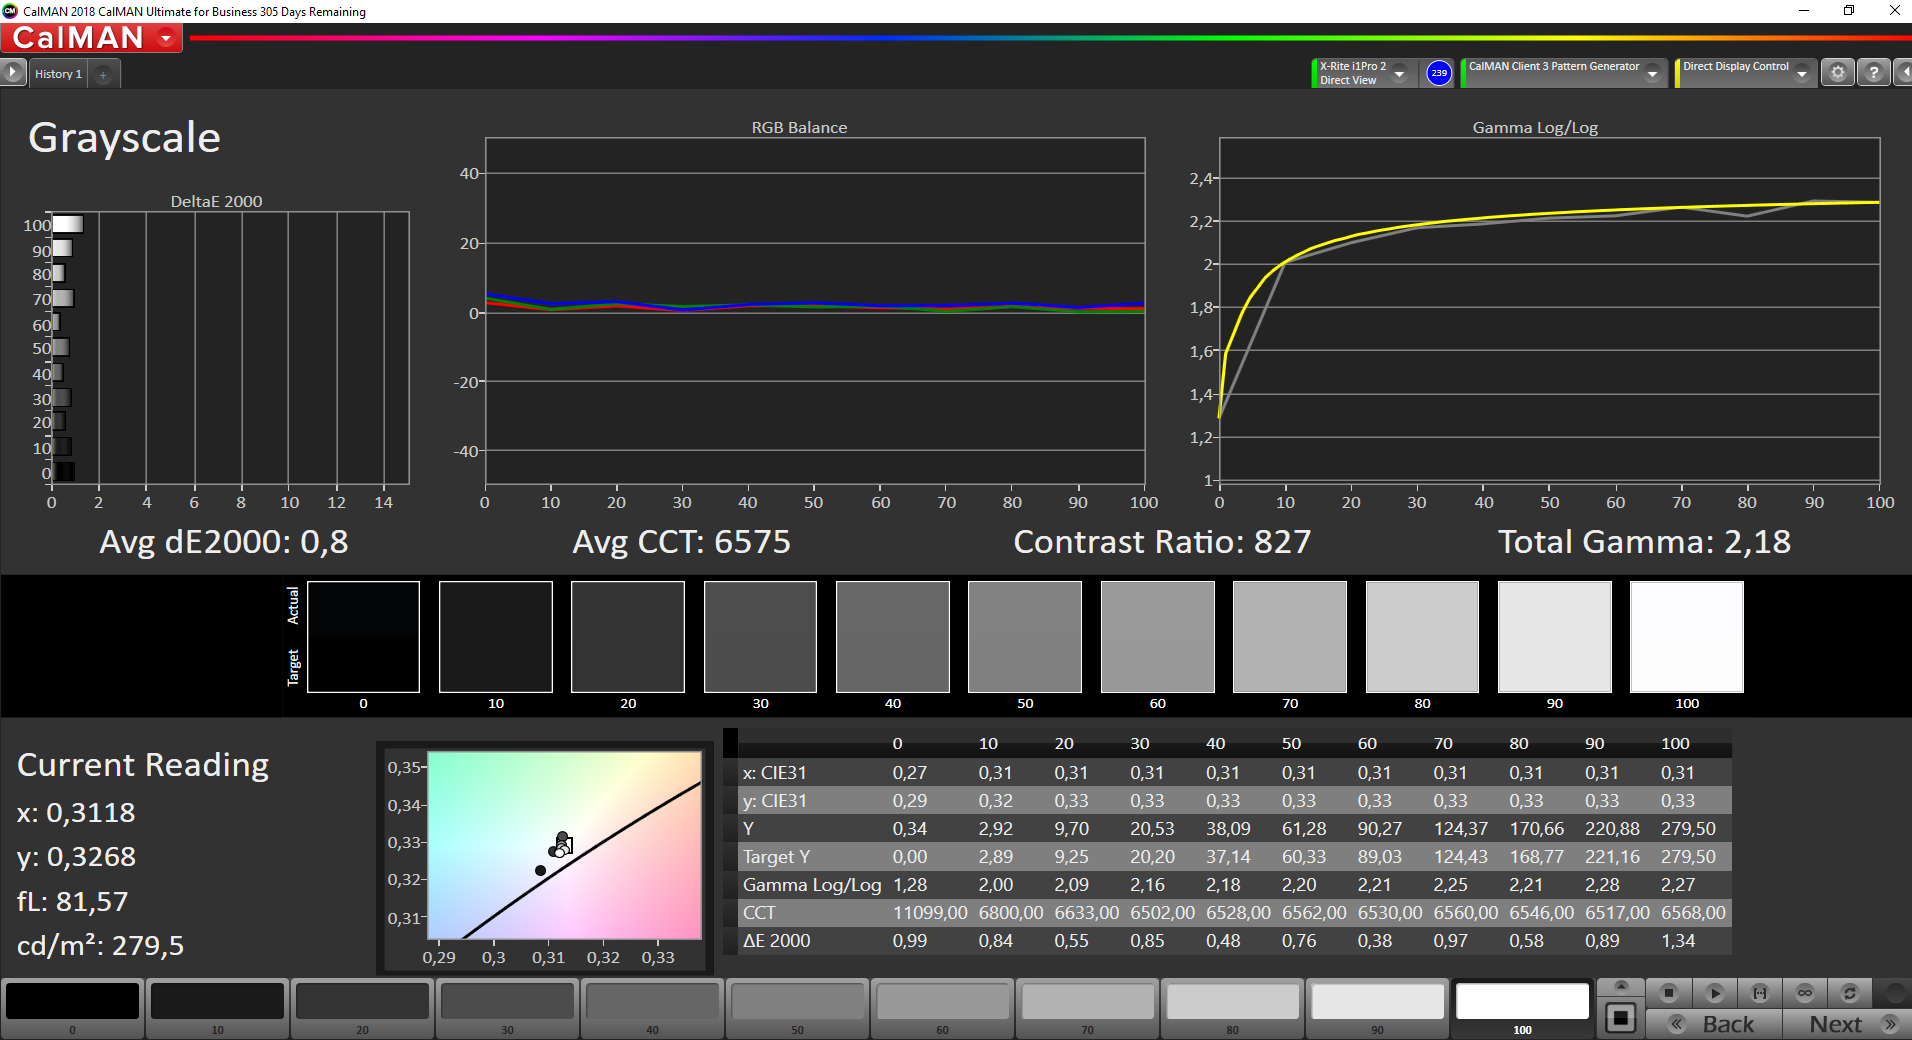
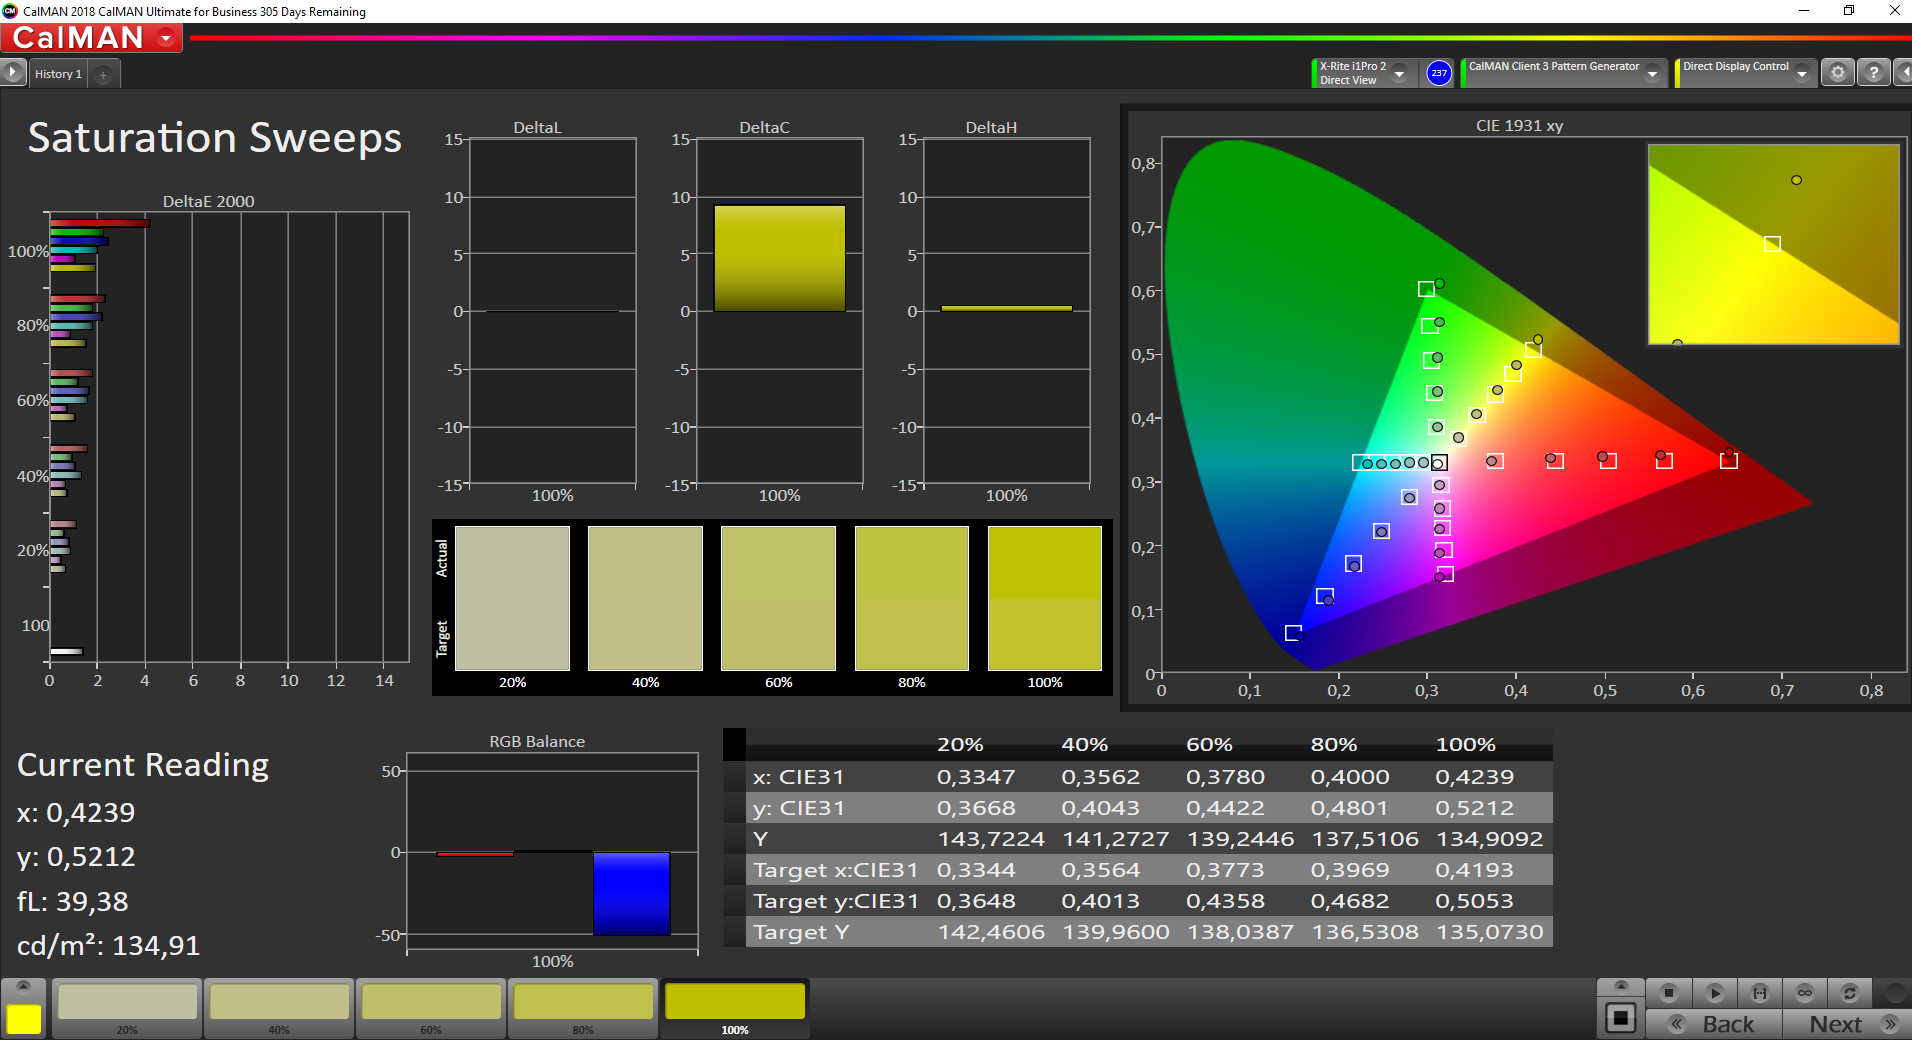
In the state of delivery, the display is not calibrated well, which can clearly be seen in the values we measured with CalMan and the X-Rite i1 Pro 2 color meter: The ThinkPad LCD has a green tint. A decent calibration will remedy this, and we are offering the corresponding color profile as a free download. However, due to the calibration, the maximum brightness in the center of the LCD panel will drop by about 60 cd/m².
We are a bit disappointed about the contrast value. While 751:1 is not extremely bad, it is also not a good value. There are also some percentage points missing to fully cover the sRGB color space, but this was also the case in the ThinkPad P53 with the 500-cd/m² display.
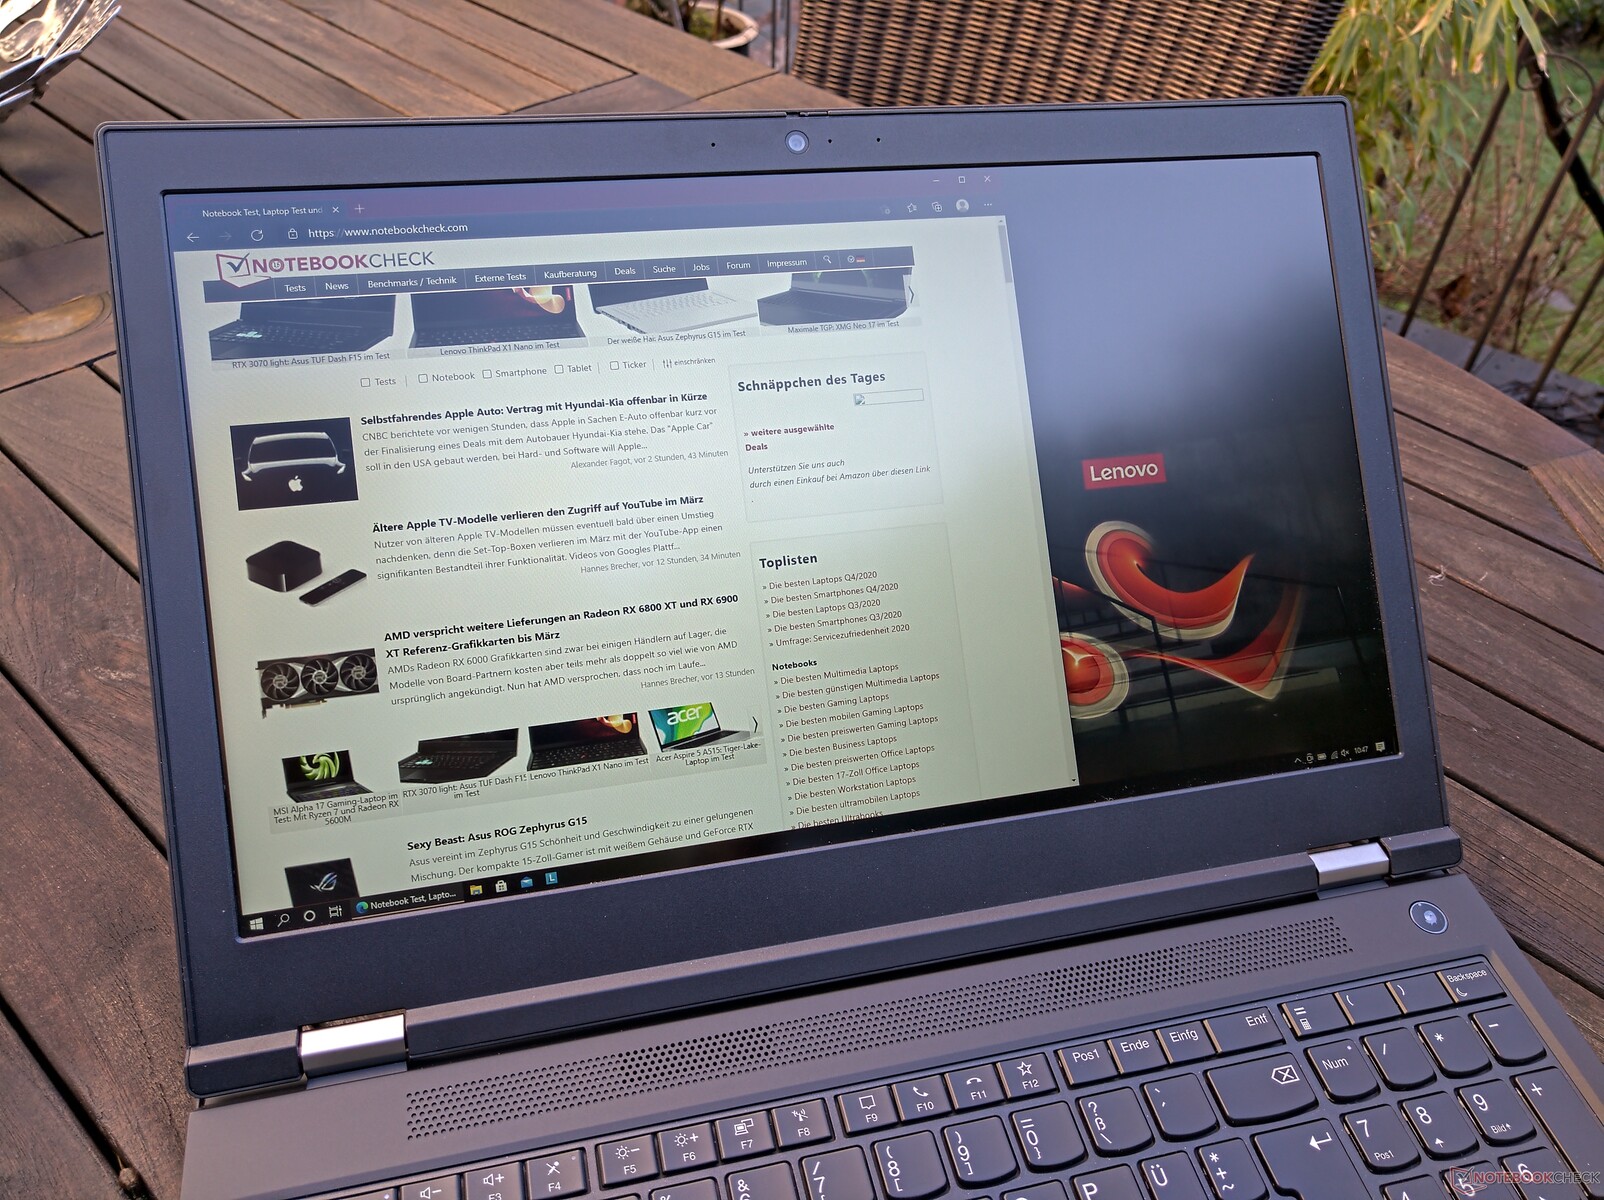
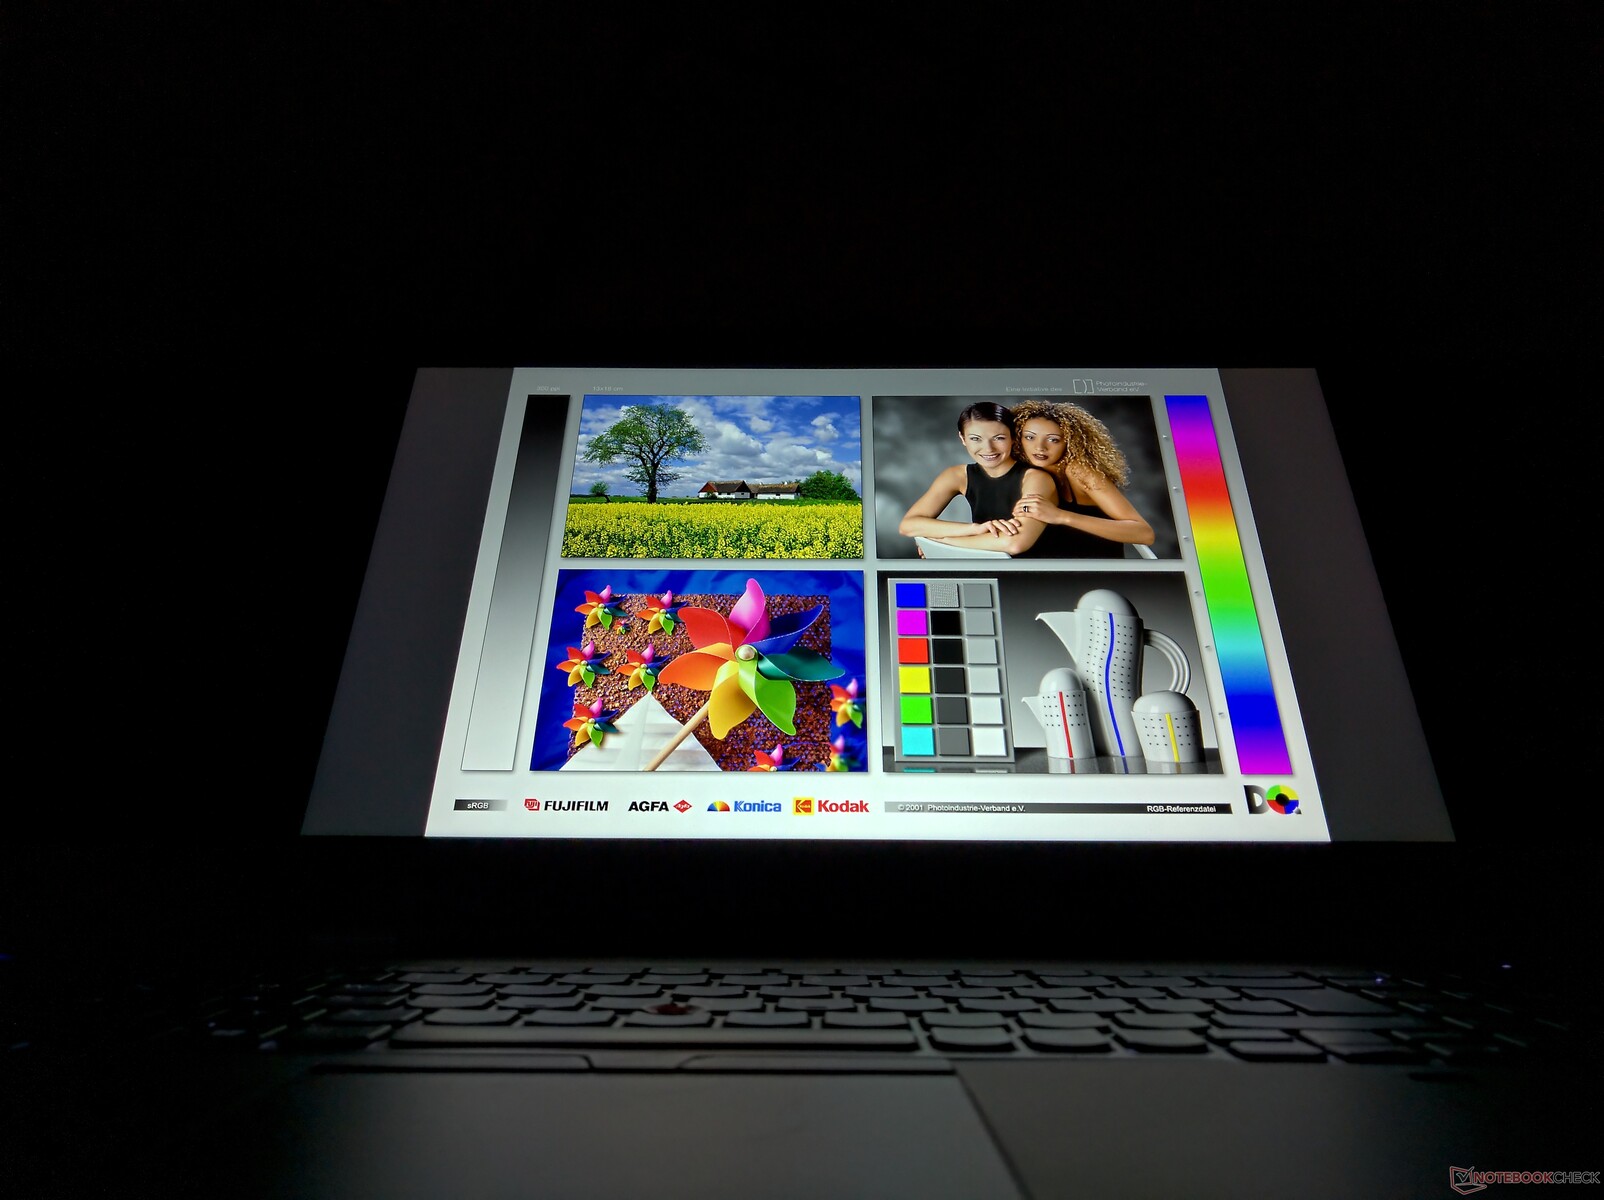
While you can generally also use the Lenovo ThinkPad P15 Gen 1 outdoors, this is only the case in the shade or on cloudy days. For direct sunlight, it would need a higher brightness.
Display Response Times
| ↔ Response Time Black to White | ||
|---|---|---|
| 32.8 ms ... rise ↗ and fall ↘ combined | ↗ 18.8 ms rise | 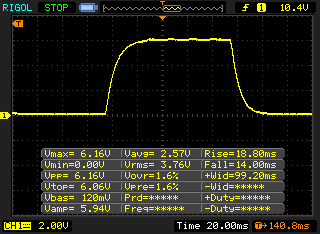 |
| ↘ 14 ms fall | ||
| The screen shows slow response rates in our tests and will be unsatisfactory for gamers. In comparison, all tested devices range from 0.1 (minimum) to 240 (maximum) ms. » 88 % of all devices are better. This means that the measured response time is worse than the average of all tested devices (20.4 ms). | ||
| ↔ Response Time 50% Grey to 80% Grey | ||
| 41.2 ms ... rise ↗ and fall ↘ combined | ↗ 22 ms rise | 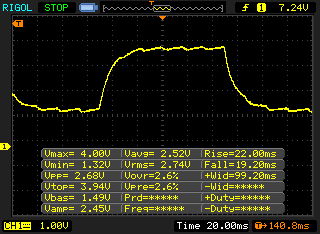 |
| ↘ 19.2 ms fall | ||
| The screen shows slow response rates in our tests and will be unsatisfactory for gamers. In comparison, all tested devices range from 0.165 (minimum) to 636 (maximum) ms. » 65 % of all devices are better. This means that the measured response time is worse than the average of all tested devices (31.8 ms). | ||
Screen Flickering / PWM (Pulse-Width Modulation)
| Screen flickering / PWM detected | 24270 Hz | 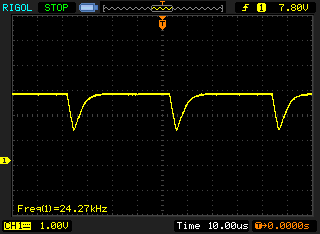 | |
The display backlight flickers at 24270 Hz (worst case, e.g., utilizing PWM) . The frequency of 24270 Hz is quite high, so most users sensitive to PWM should not notice any flickering. In comparison: 53 % of all tested devices do not use PWM to dim the display. If PWM was detected, an average of 8224 (minimum: 5 - maximum: 343500) Hz was measured. | |||
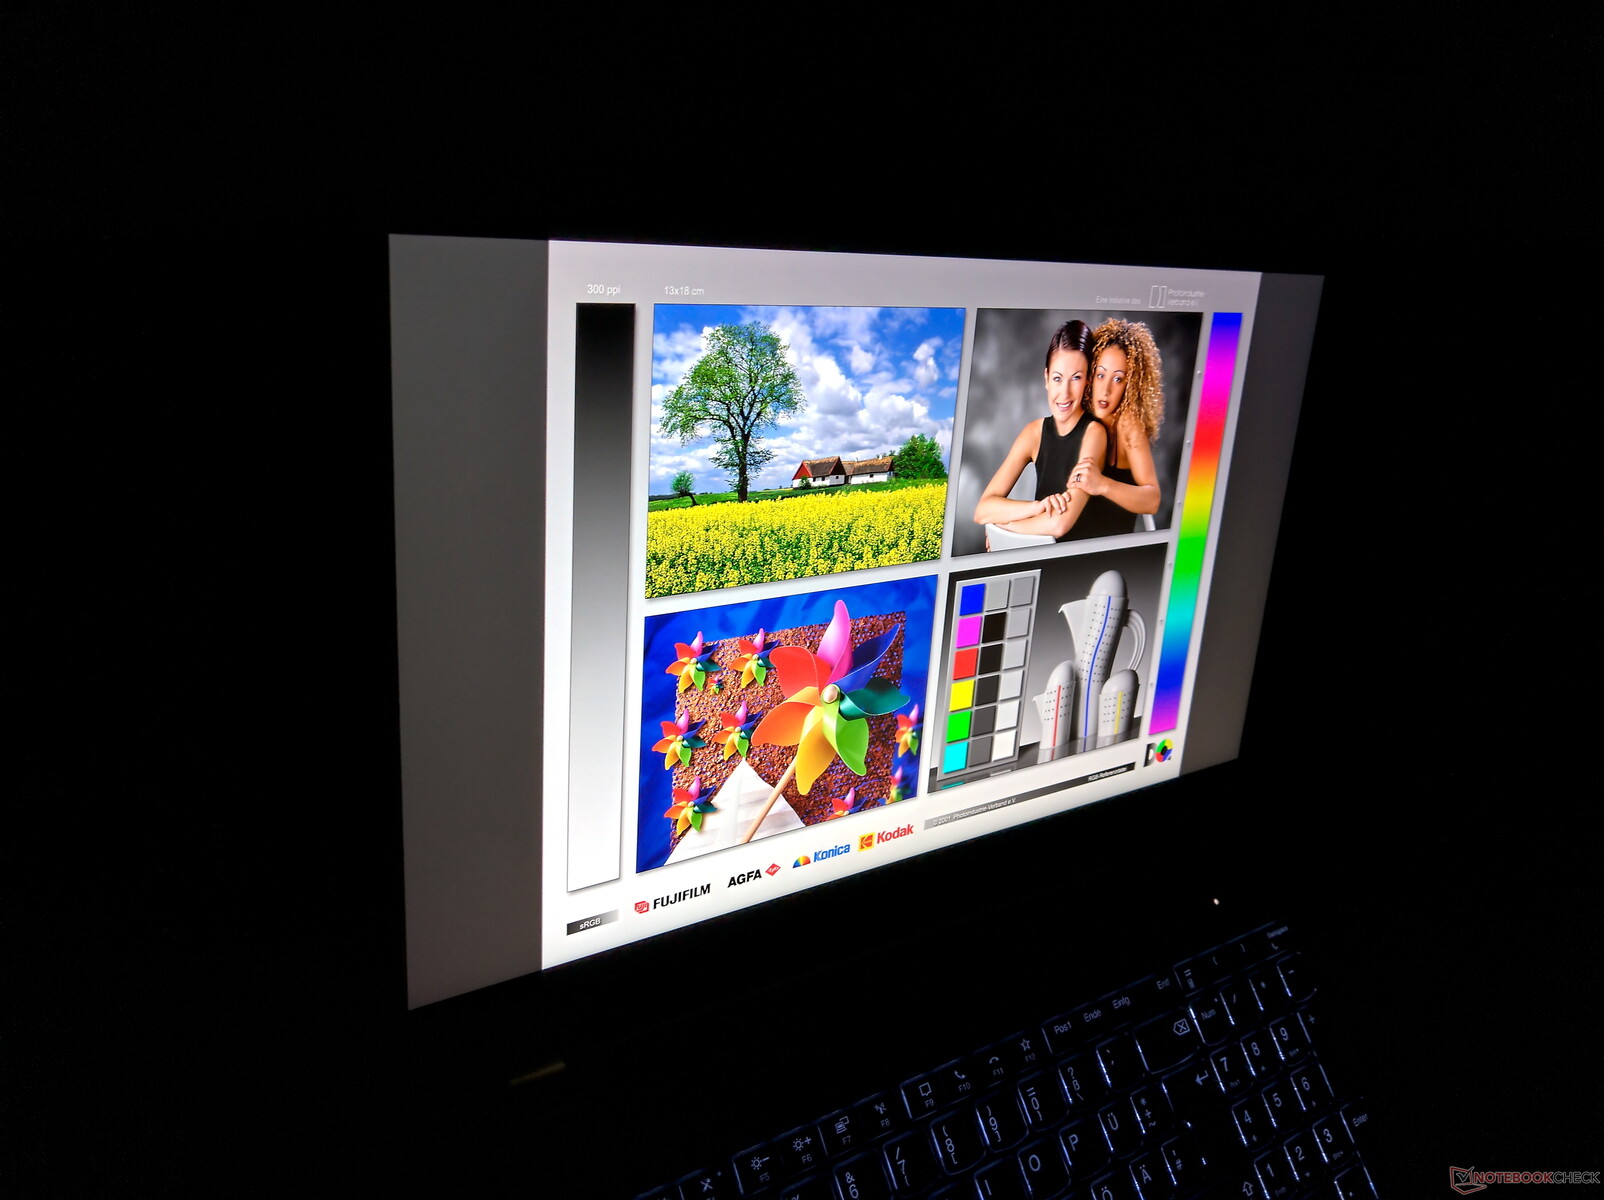
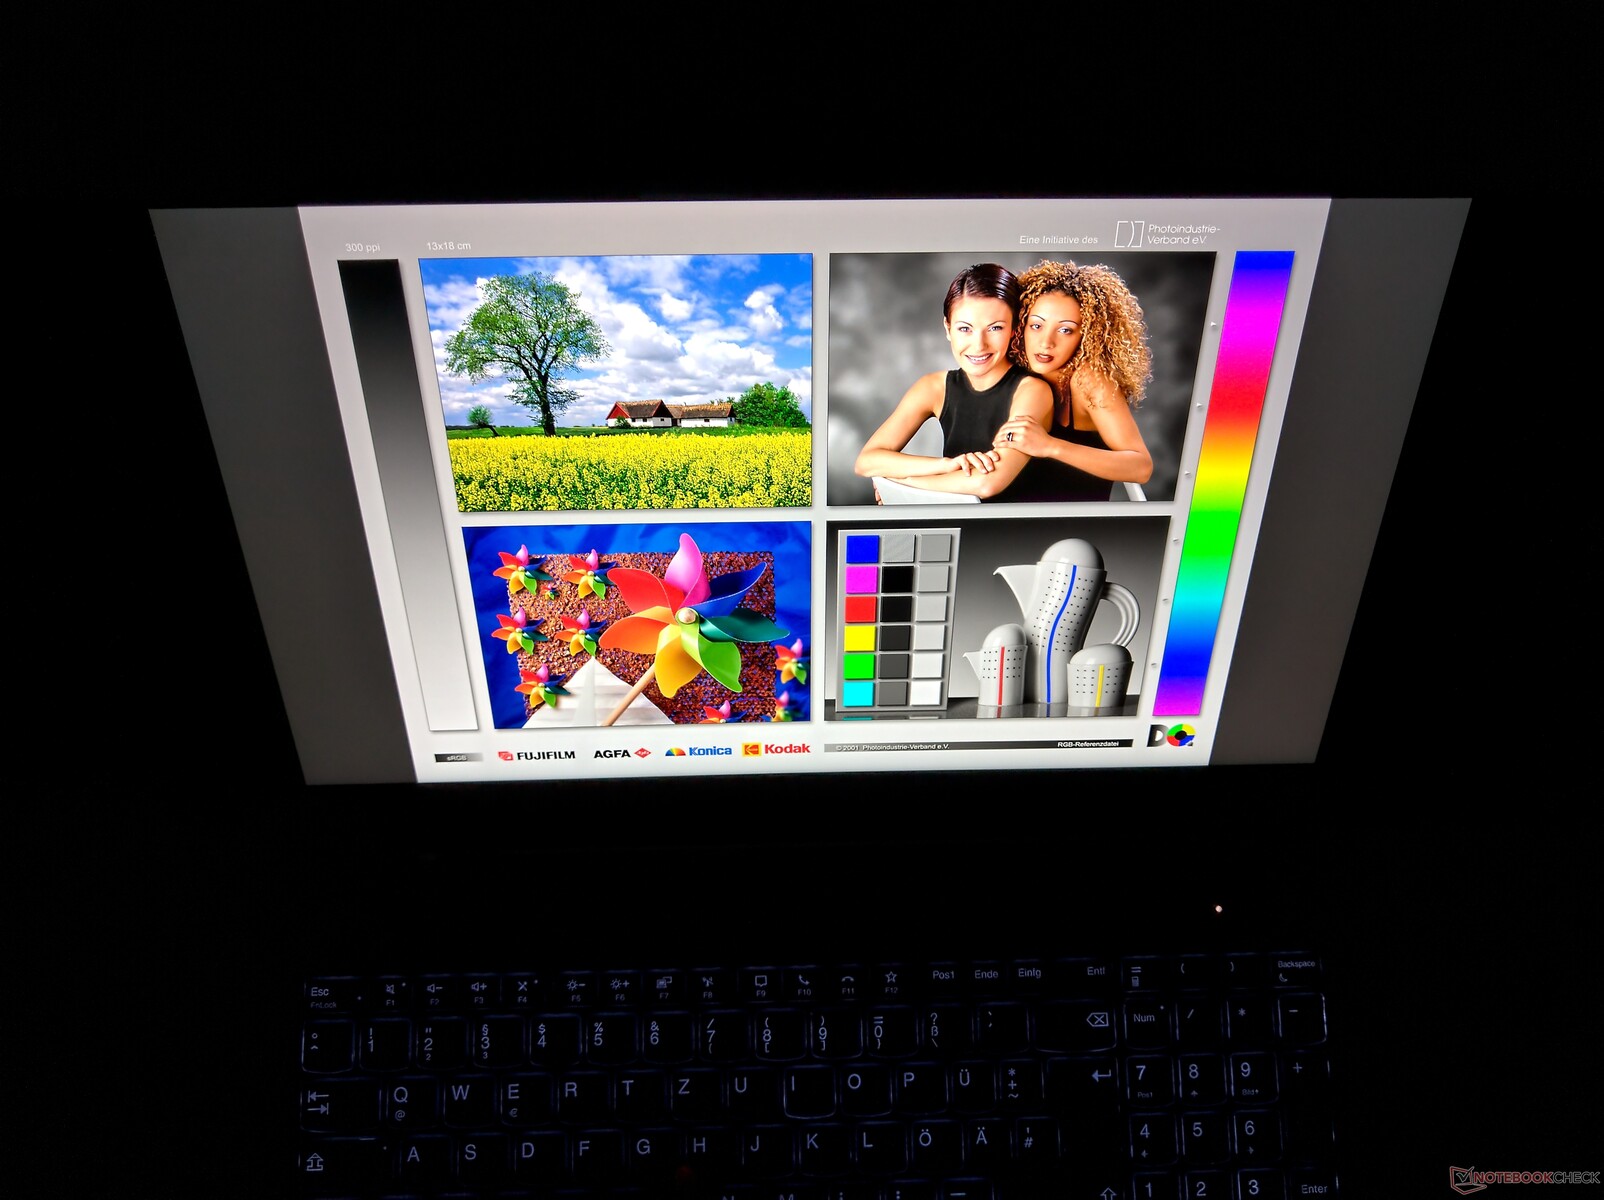
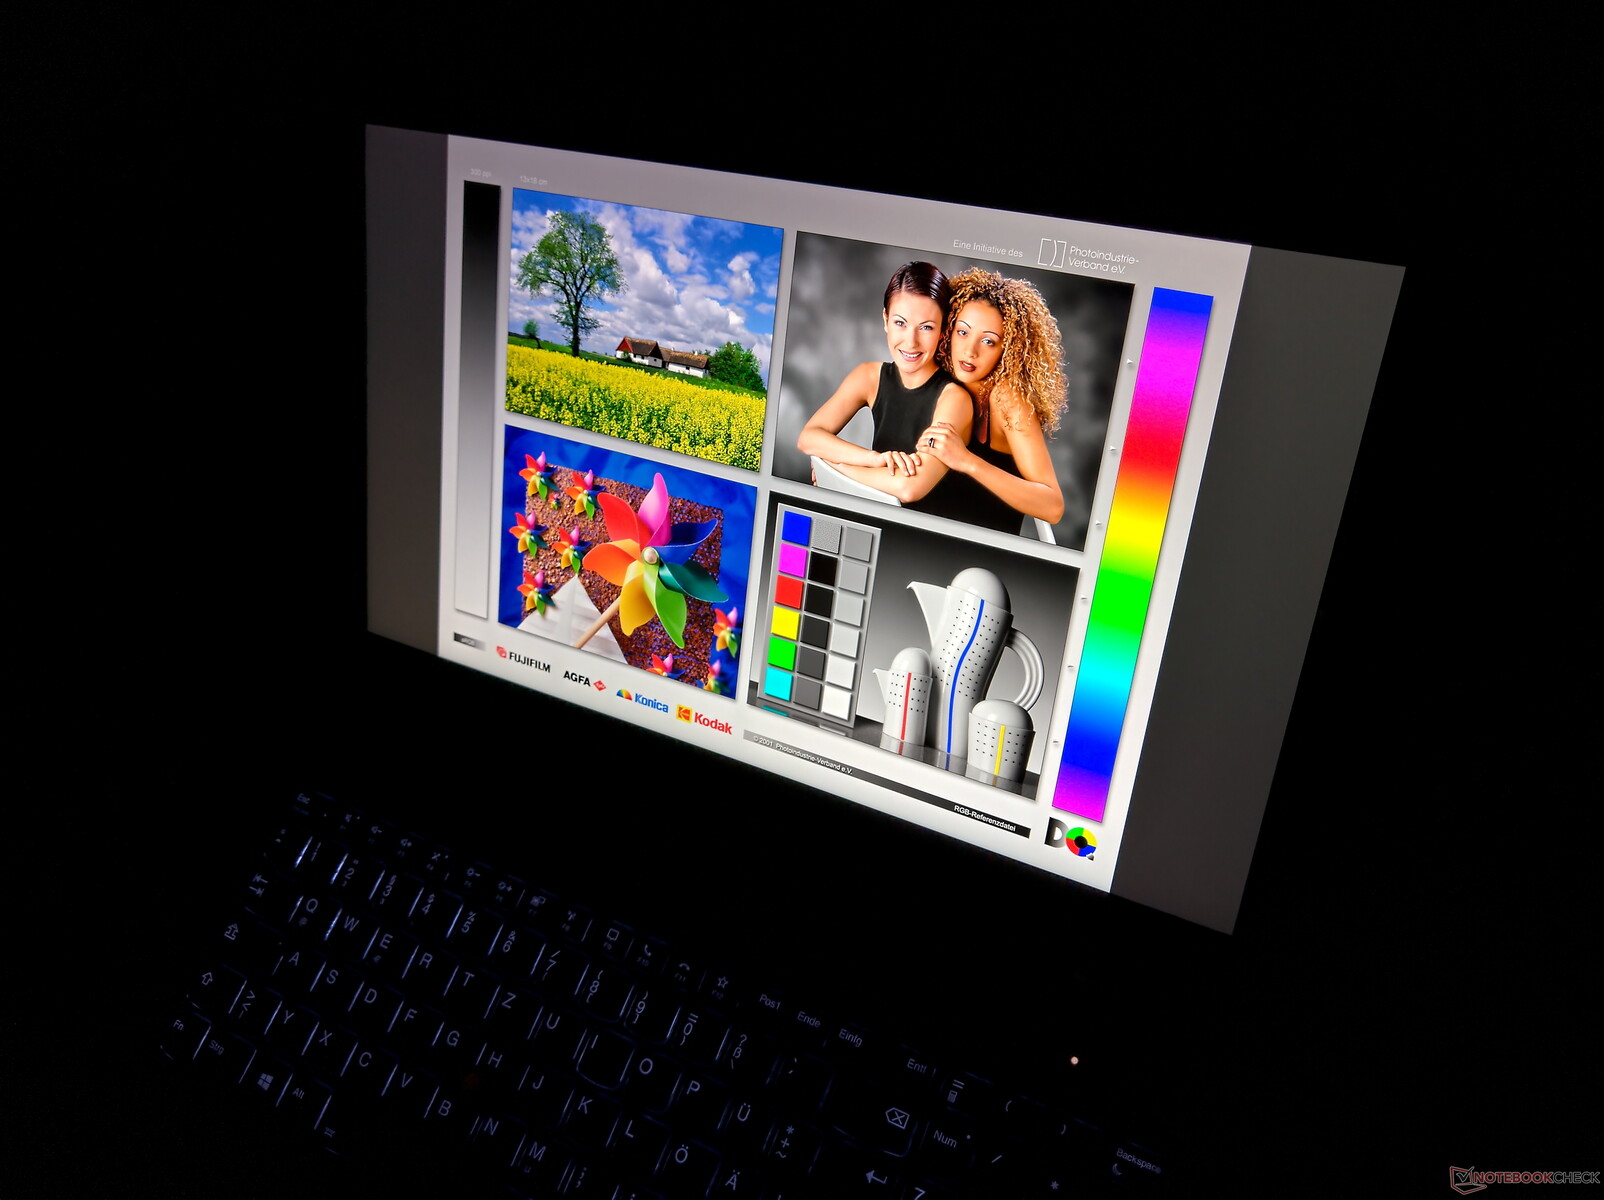
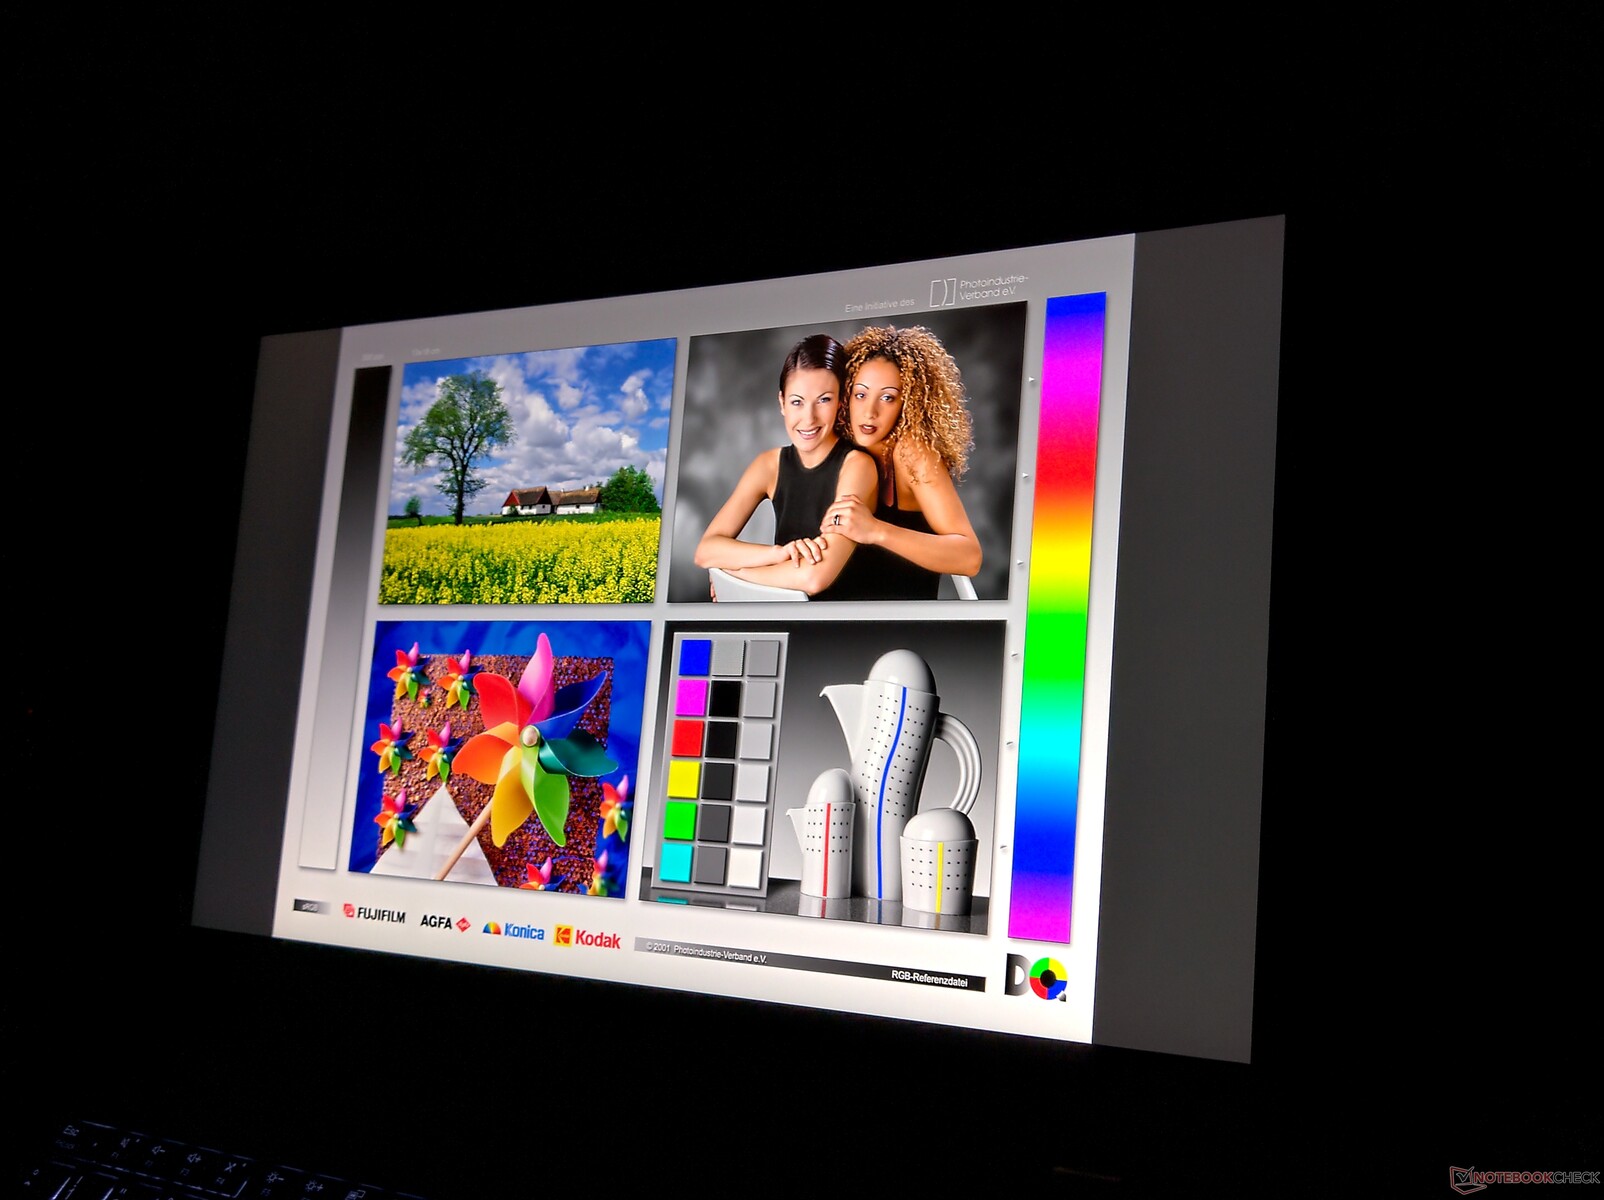
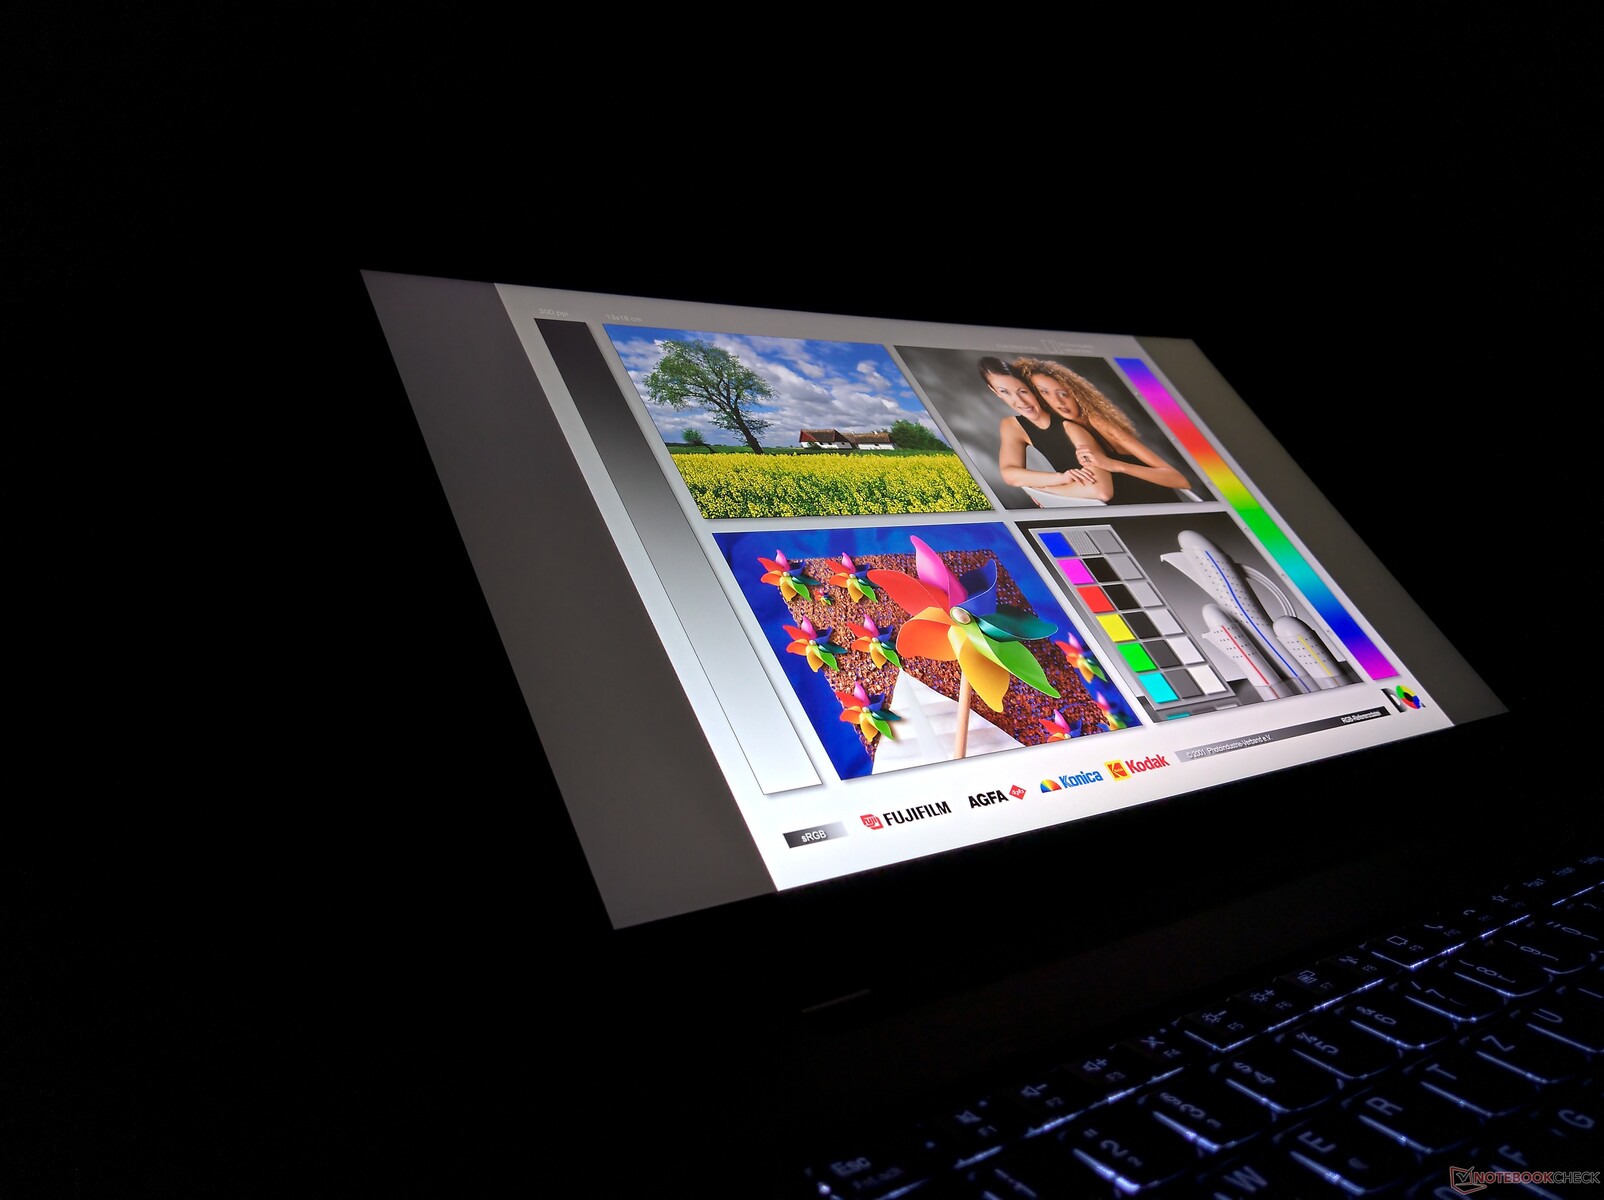
The viewing angle stability of the IPS display offers no reason for complaint.

Performance: The CPU of the Lenovo laptop can consume more than 100 watts
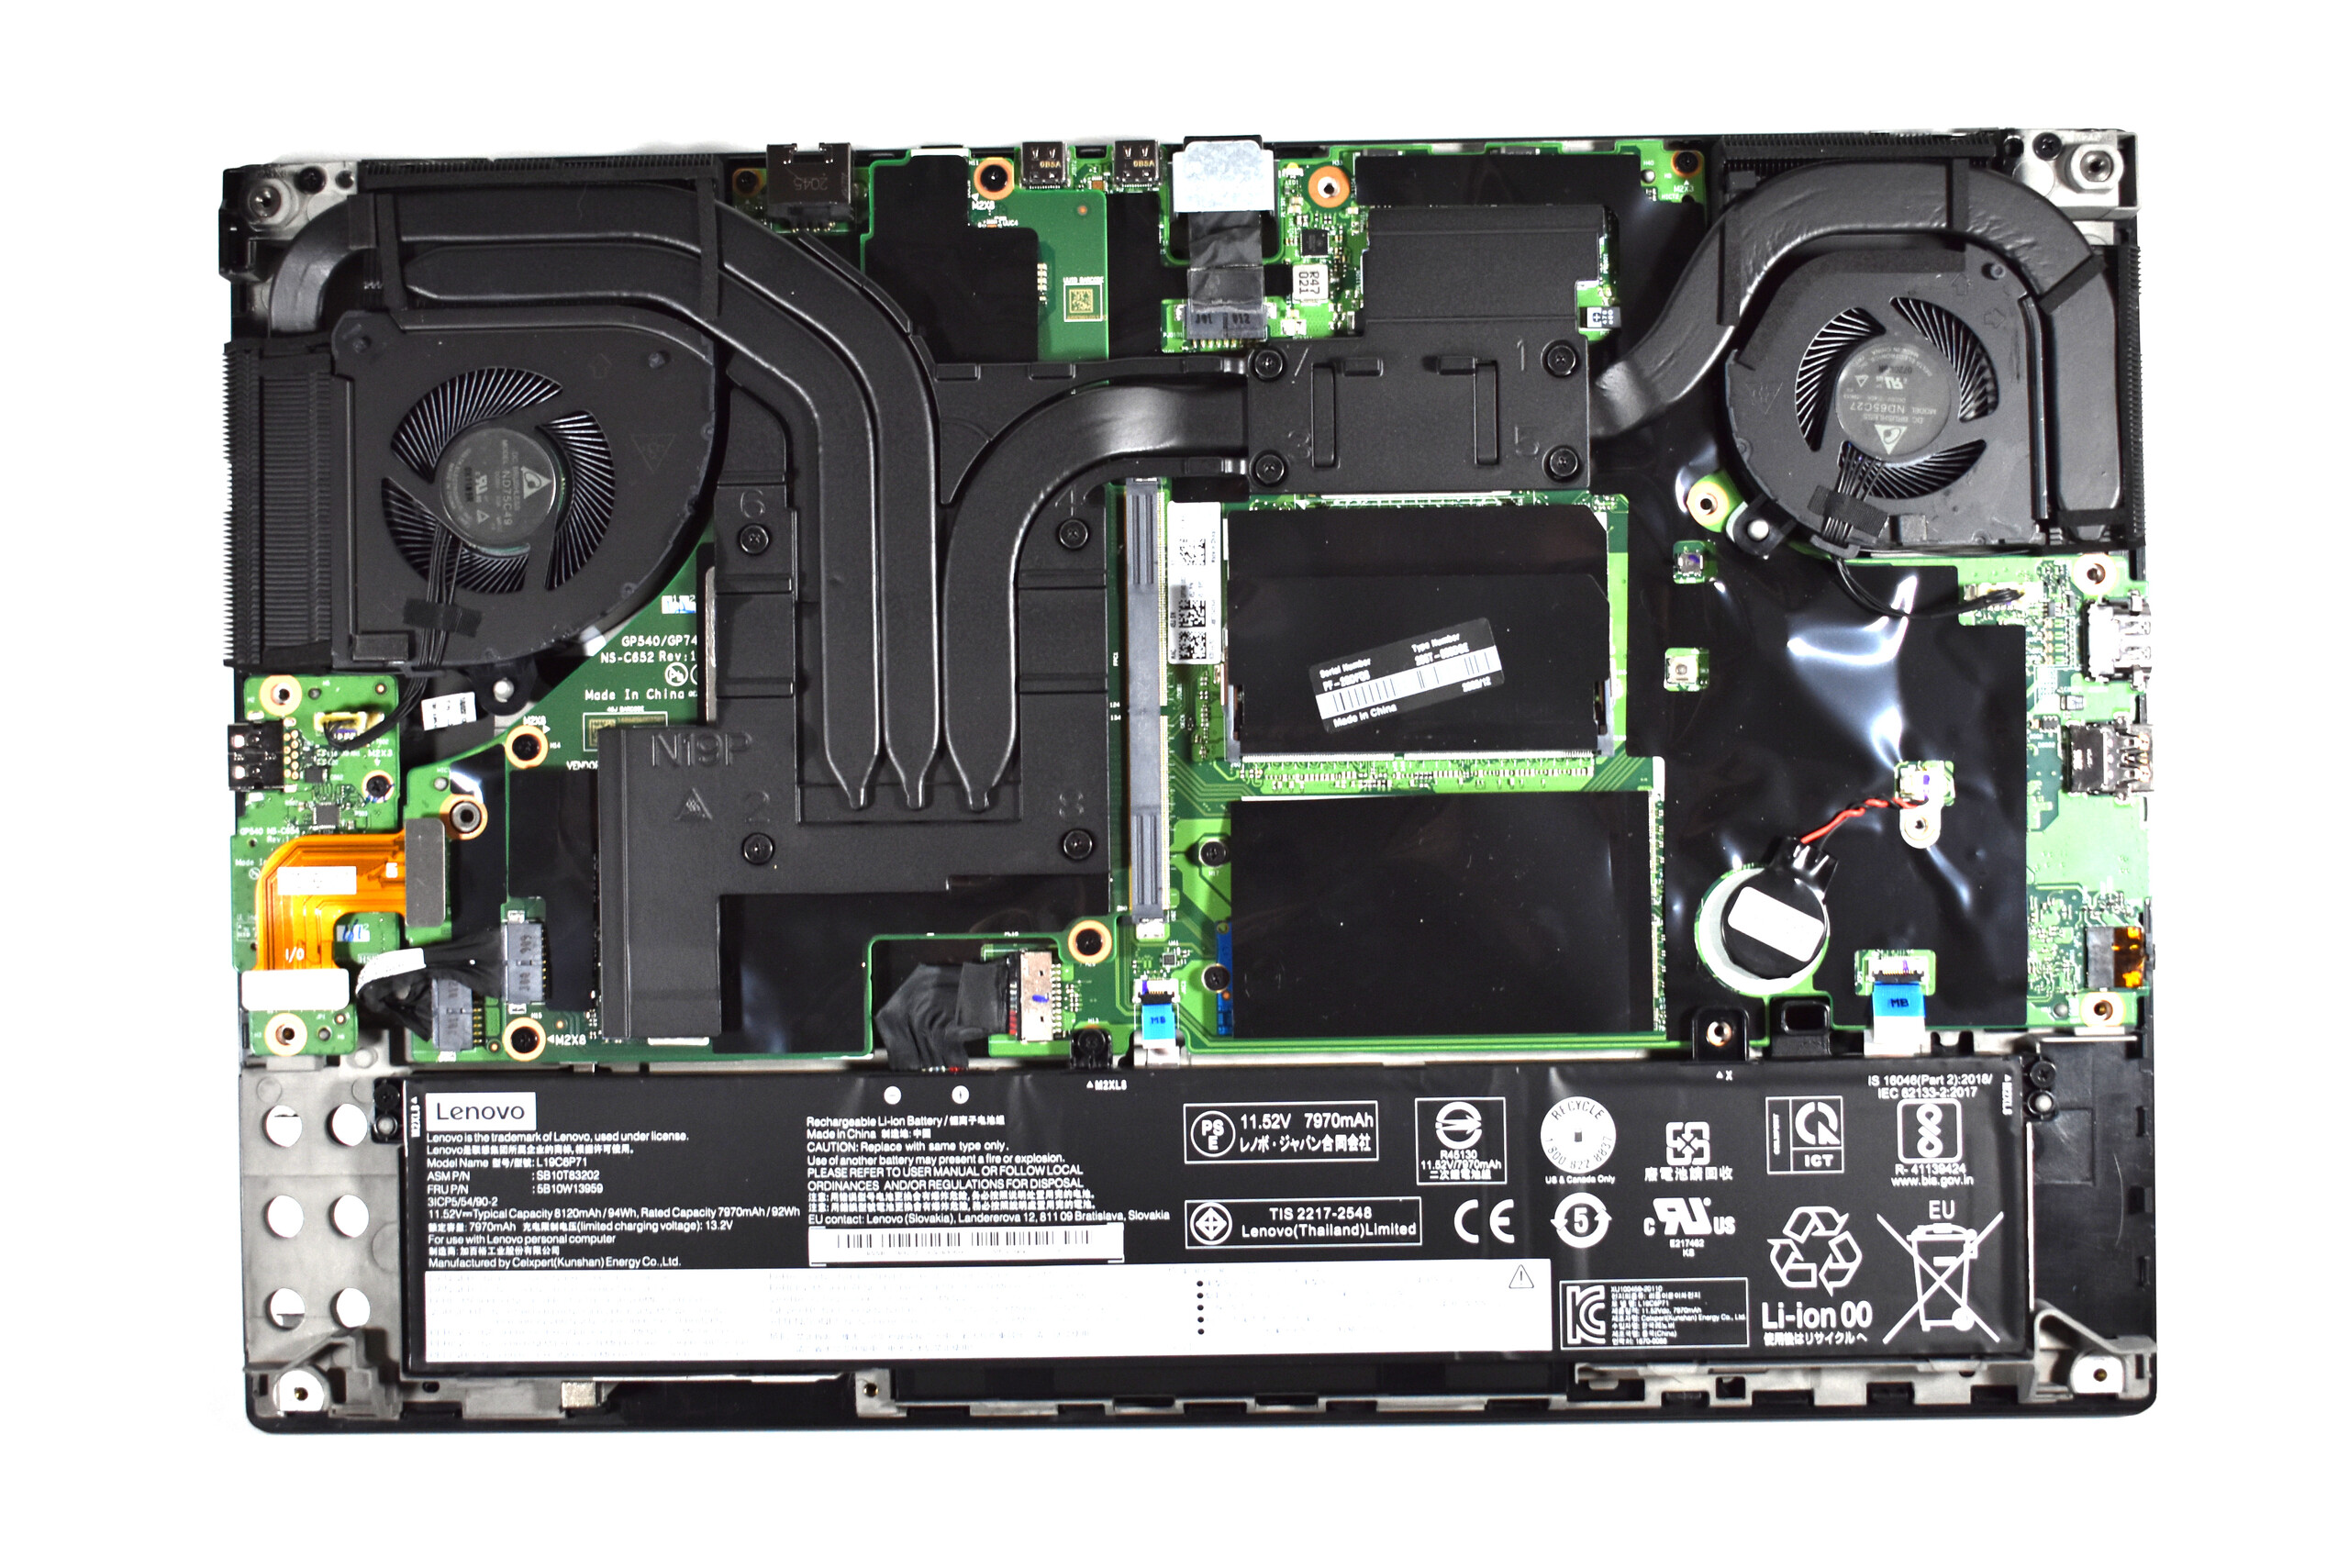
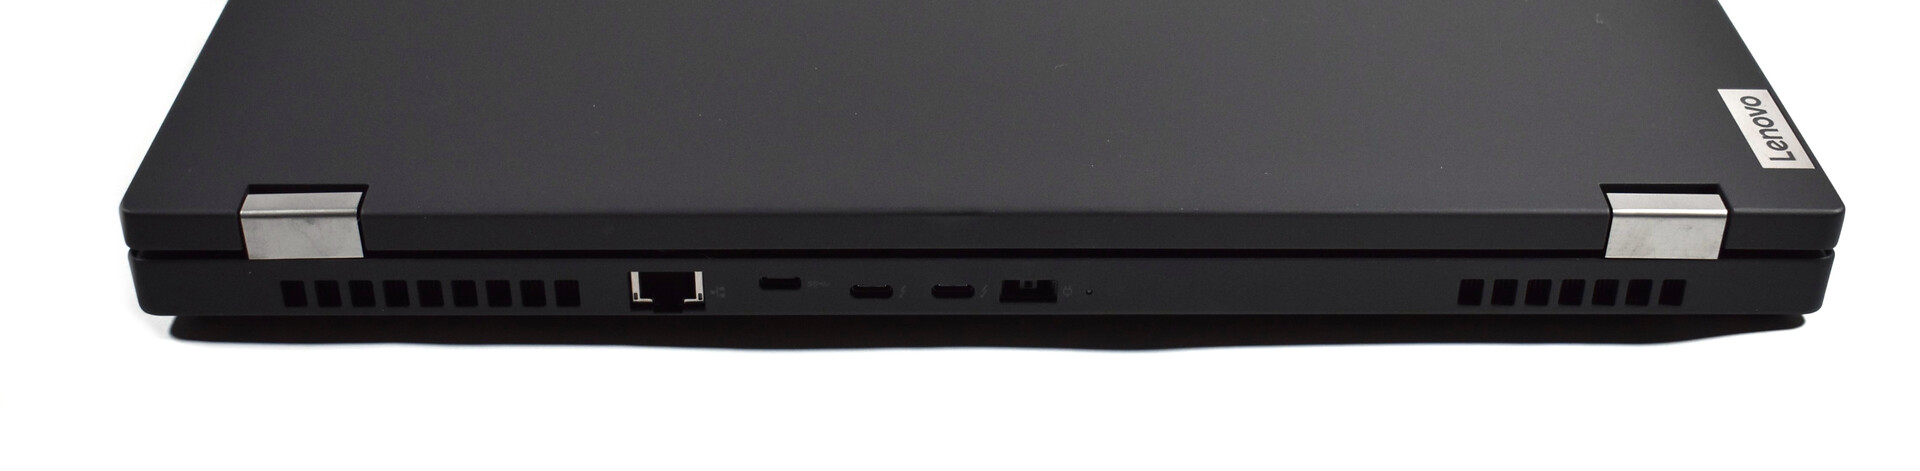
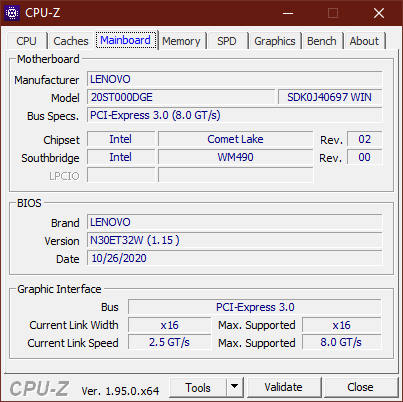
A central improvement compared to the ThinkPad P53 is the fact that the GPU options are not tied to the CPUs anymore, because the graphics chips are not soldered onto the mainboard but integrated via a separate daughter board now. This means that any of the professional GPUs of the Nvidia Turing generation (Quadro T1000, T2000, RTX 3000, RTX 4000 Max-Q, RTX 5000 Max-Q) can be combined with all the available Intel CPUs from the "Comet Lake H" series (Core i5-10400H, i7-10750H, i7-10850H, i7-10875H, i9-10885H, i9-10980HK, Xeon W-10855M, W-10885M).
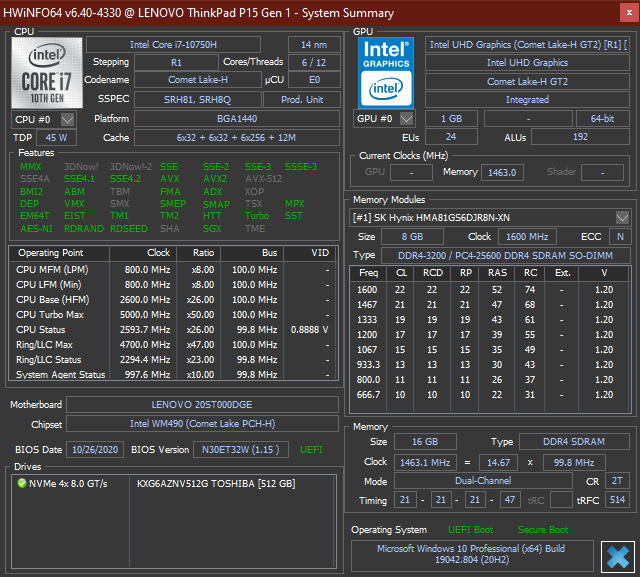
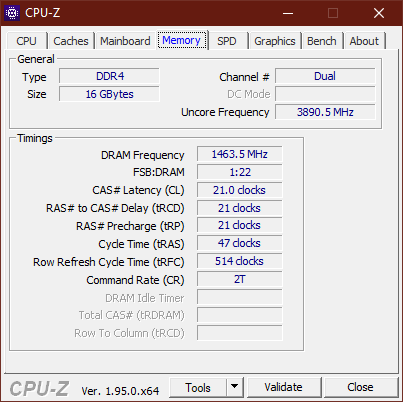
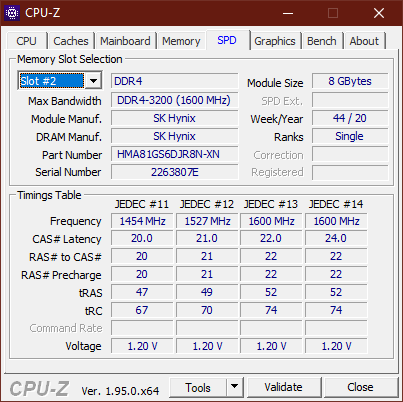
The RAM can be completely upgraded, and the four DDR4-2933 SO-DIMM slots allow for a maximum of 128 GB - in the Xeon models even as ECC storage. In terms of the storage solution, there are only two M.2-2280 SSDs left, while the predecessor still allowed for three as well as offering some HDD options for some models.
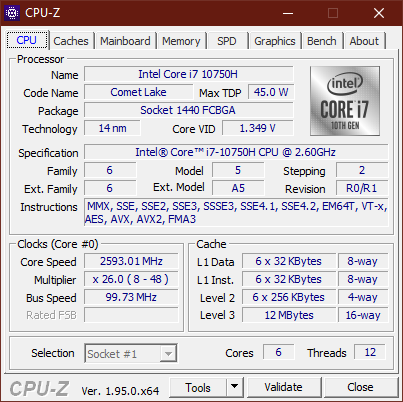
Processor
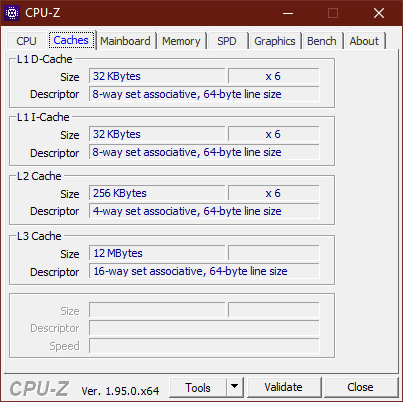
The Intel Core i7-10750H belongs to the "Comet Lake H" series from Intel and is probably one of the last 14-nanometer chips in a laptop. The six cores with a nominal TDP of 45 watts have a theoretical maximum clock speed of 5 GHz (basic clock speed: 2.6 GHz). Our CPU list can help you to compare additional benchmarks.
With almost 130 watts (short boost) and 75 watts (constant) under multicore load, the processor in the ThinkPad P15 can consume significantly more than 45 watts. While this contributes to a good CPU performance, it still cannot compete with octa-core CPUs. In addition, the CPU is fairly inefficient, and the considerably more efficient AMD Ryzen 7 Pro 4750U in the affordable ThinkPad L15 is faster under load on all cores.
In battery operation, the CPU performance is throttled with a maximum consumption of 65 watts. At 1172 points, the CB15 multicore result turns out about 10% lower.
Cinebench R15: CPU Single 64Bit | CPU Multi 64Bit
Blender: v2.79 BMW27 CPU
7-Zip 18.03: 7z b 4 -mmt1 | 7z b 4
Geekbench 5.5: Single-Core | Multi-Core
HWBOT x265 Benchmark v2.2: 4k Preset
LibreOffice : 20 Documents To PDF
R Benchmark 2.5: Overall mean
| Cinebench R20 / CPU (Single Core) | |
| Average of class Workstation (651 - 849, n=24, last 2 years) | |
| HP ZBook Fury 15 G7 | |
| HP ZBook Fury 15 G7 | |
| Lenovo ThinkPad P15 Gen1-20ST000DGE | |
| Dell Precision 7550 | |
| Lenovo ThinkPad T15g-20UR000GGE | |
| Average Intel Core i7-10750H (431 - 504, n=43) | |
| Lenovo ThinkPad T15p-20TN0006GE | |
| Cinebench R20 / CPU (Multi Core) | |
| Average of class Workstation (5327 - 14341, n=24, last 2 years) | |
| Dell Precision 7550 | |
| HP ZBook Fury 15 G7 | |
| HP ZBook Fury 15 G7 | |
| Lenovo ThinkPad P15 Gen1-20ST000DGE | |
| Lenovo ThinkPad T15p-20TN0006GE | |
| Lenovo ThinkPad T15g-20UR000GGE | |
| Average Intel Core i7-10750H (1749 - 3325, n=43) | |
| Cinebench R15 / CPU Single 64Bit | |
| Average of class Workstation (191.4 - 324, n=24, last 2 years) | |
| HP ZBook Fury 15 G7 | |
| HP ZBook Fury 15 G7 | |
| Dell Precision 7550 | |
| Lenovo ThinkPad P15 Gen1-20ST000DGE | |
| Lenovo ThinkPad T15g-20UR000GGE | |
| Lenovo ThinkPad T15p-20TN0006GE | |
| Average Intel Core i7-10750H (184 - 213, n=45) | |
| Lenovo ThinkPad P53-20QN000YGE | |
| Cinebench R15 / CPU Multi 64Bit | |
| Average of class Workstation (2240 - 5509, n=24, last 2 years) | |
| Dell Precision 7550 | |
| HP ZBook Fury 15 G7 | |
| HP ZBook Fury 15 G7 | |
| Lenovo ThinkPad P15 Gen1-20ST000DGE | |
| Lenovo ThinkPad T15g-20UR000GGE | |
| Lenovo ThinkPad T15p-20TN0006GE | |
| Average Intel Core i7-10750H (804 - 1418, n=50) | |
| Lenovo ThinkPad P53-20QN000YGE | |
| Blender / v2.79 BMW27 CPU | |
| Lenovo ThinkPad P53-20QN000YGE | |
| HP ZBook Fury 15 G7 | |
| Average Intel Core i7-10750H (322 - 587, n=43) | |
| Lenovo ThinkPad T15p-20TN0006GE | |
| Lenovo ThinkPad P15 Gen1-20ST000DGE | |
| Lenovo ThinkPad T15g-20UR000GGE | |
| Dell Precision 7550 | |
| Average of class Workstation (91 - 261, n=24, last 2 years) | |
| 7-Zip 18.03 / 7z b 4 -mmt1 | |
| Average of class Workstation (4981 - 6960, n=24, last 2 years) | |
| HP ZBook Fury 15 G7 | |
| Dell Precision 7550 | |
| Lenovo ThinkPad T15g-20UR000GGE | |
| Lenovo ThinkPad P15 Gen1-20ST000DGE | |
| Average Intel Core i7-10750H (4504 - 5470, n=43) | |
| Lenovo ThinkPad P53-20QN000YGE | |
| Lenovo ThinkPad T15p-20TN0006GE | |
| 7-Zip 18.03 / 7z b 4 | |
| Average of class Workstation (53407 - 109760, n=24, last 2 years) | |
| Dell Precision 7550 | |
| Lenovo ThinkPad T15g-20UR000GGE | |
| Lenovo ThinkPad P15 Gen1-20ST000DGE | |
| HP ZBook Fury 15 G7 | |
| Lenovo ThinkPad T15p-20TN0006GE | |
| Average Intel Core i7-10750H (26040 - 37345, n=43) | |
| Lenovo ThinkPad P53-20QN000YGE | |
| Geekbench 5.5 / Single-Core | |
| Average of class Workstation (1740 - 2115, n=24, last 2 years) | |
| HP ZBook Fury 15 G7 | |
| Dell Precision 7550 | |
| Lenovo ThinkPad T15g-20UR000GGE | |
| Lenovo ThinkPad P15 Gen1-20ST000DGE | |
| Average Intel Core i7-10750H (1114 - 1333, n=43) | |
| Lenovo ThinkPad T15p-20TN0006GE | |
| Geekbench 5.5 / Multi-Core | |
| Average of class Workstation (9968 - 19382, n=24, last 2 years) | |
| Dell Precision 7550 | |
| HP ZBook Fury 15 G7 | |
| Lenovo ThinkPad T15g-20UR000GGE | |
| Lenovo ThinkPad P15 Gen1-20ST000DGE | |
| Average Intel Core i7-10750H (4443 - 6674, n=43) | |
| Lenovo ThinkPad T15p-20TN0006GE | |
| HWBOT x265 Benchmark v2.2 / 4k Preset | |
| Average of class Workstation (14.4 - 36.8, n=24, last 2 years) | |
| Dell Precision 7550 | |
| Lenovo ThinkPad T15g-20UR000GGE | |
| Lenovo ThinkPad P15 Gen1-20ST000DGE | |
| Average Intel Core i7-10750H (5.54 - 11.6, n=43) | |
| Lenovo ThinkPad T15p-20TN0006GE | |
| Lenovo ThinkPad P53-20QN000YGE | |
| HP ZBook Fury 15 G7 | |
| LibreOffice / 20 Documents To PDF | |
| HP ZBook Fury 15 G7 | |
| Lenovo ThinkPad P15 Gen1-20ST000DGE | |
| Average Intel Core i7-10750H (43.1 - 99.2, n=43) | |
| Lenovo ThinkPad T15g-20UR000GGE | |
| Average of class Workstation (37.1 - 54.7, n=24, last 2 years) | |
| Dell Precision 7550 | |
| Lenovo ThinkPad T15p-20TN0006GE | |
| R Benchmark 2.5 / Overall mean | |
| Lenovo ThinkPad T15p-20TN0006GE | |
| Lenovo ThinkPad P15 Gen1-20ST000DGE | |
| Average Intel Core i7-10750H (0.578 - 0.708, n=42) | |
| Lenovo ThinkPad T15g-20UR000GGE | |
| Dell Precision 7550 | |
| HP ZBook Fury 15 G7 | |
| Average of class Workstation (0.3825 - 0.4807, n=24, last 2 years) | |
* ... smaller is better
System Performance
With its powerful components, the ThinkPad P15 does not show any weaknesses in the system performance.
| PCMark 10 Score | 5620 points | |
Help | ||
DPC Latencies
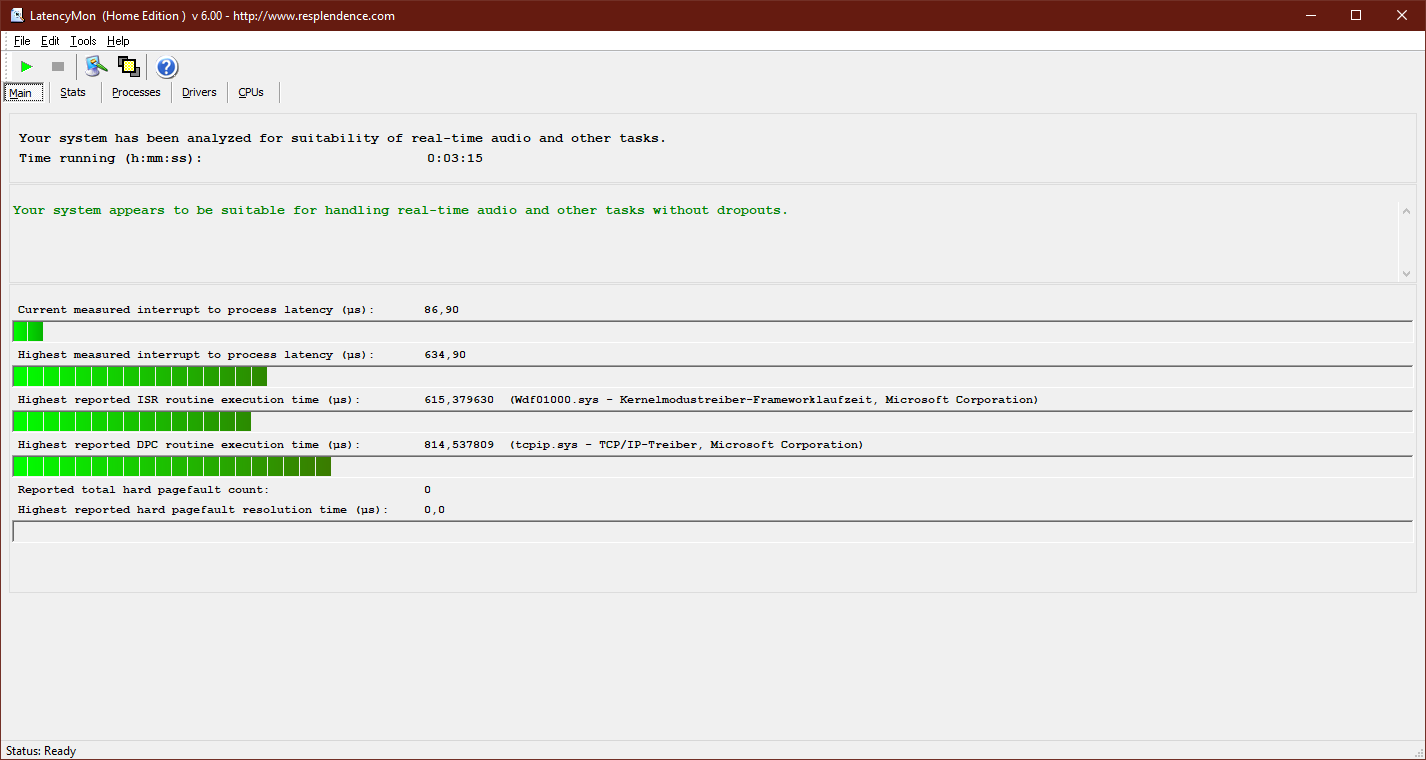
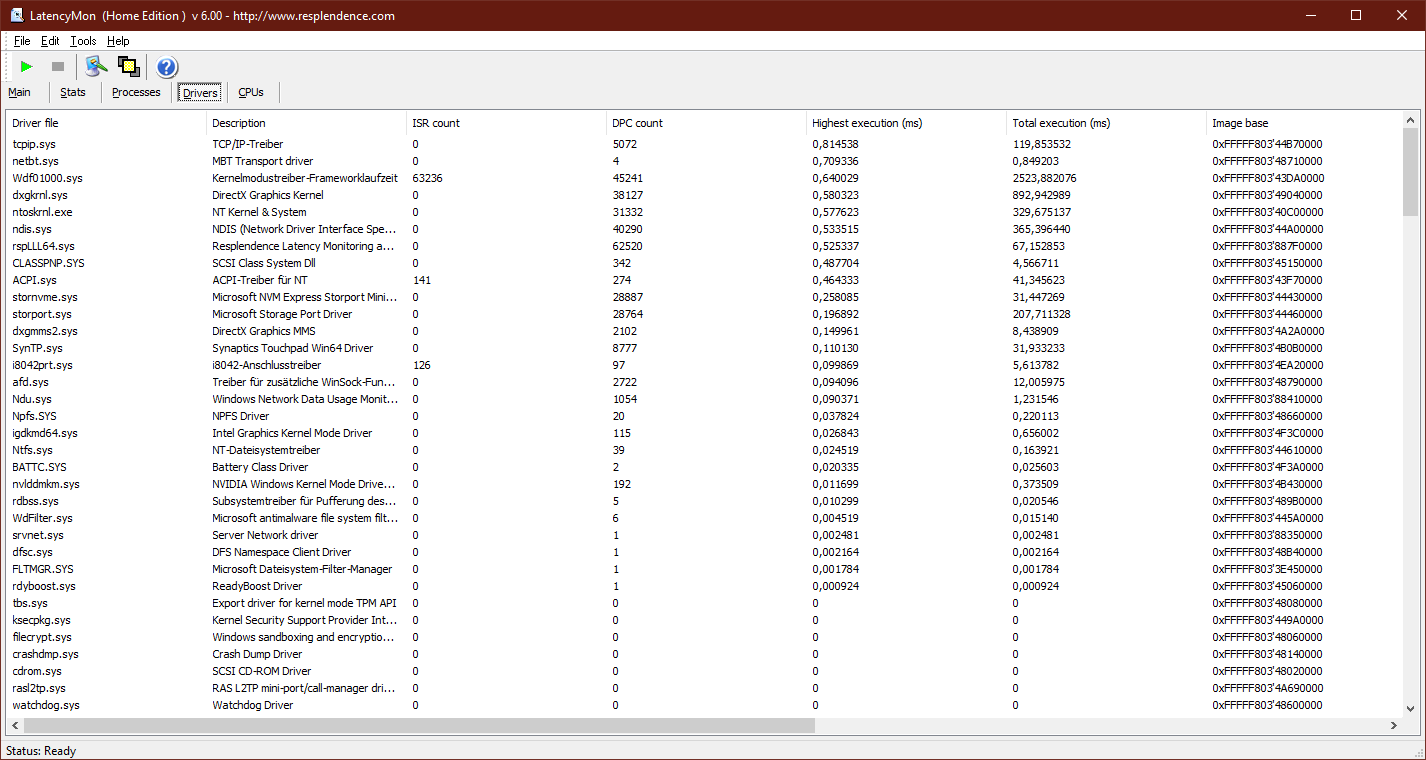
| DPC Latencies / LatencyMon - interrupt to process latency (max), Web, Youtube, Prime95 | |
| Lenovo ThinkPad P15 Gen1-20ST000DGE | |
* ... smaller is better
Storage Solution
The M.2 2280 SSD delivers very good results in the benchmarks. It is made by Toshiba, offers a capacity of 512 GB, and is connected via PCIe NVMe.
| Lenovo ThinkPad P15 Gen1-20ST000DGE Toshiba XG6 KXG6AZNV512G | Lenovo ThinkPad P53-20QN000YGE Samsung PM981a MZVLB1T0HBLR | Lenovo ThinkPad T15g-20UR000GGE SK Hynix PC401 512GB M.2 (HFS512GD9TNG) | Lenovo ThinkPad T15p-20TN0006GE WDC PC SN730 SDBQNTY-512GB | Dell Precision 7550 SK Hynix PC601A NVMe 1TB | HP ZBook Fury 15 G7 Samsung PM981a MZVLB1T0HBLR | Average Toshiba XG6 KXG6AZNV512G | |
|---|---|---|---|---|---|---|---|
| CrystalDiskMark 5.2 / 6 | -4% | 2% | 0% | -12% | -1% | -12% | |
| Write 4K (MB/s) | 129.5 | 147 14% | 154 19% | 141.8 9% | 121 -7% | 114.1 -12% | 139 ? 7% |
| Read 4K (MB/s) | 49.54 | 48.3 -3% | 46.01 -7% | 47.39 -4% | 42.16 -15% | 57.2 15% | 45.8 ? -8% |
| Write Seq (MB/s) | 2379 | 1402 -41% | 2561 8% | 2404 1% | 2150 -10% | 2580 8% | 1628 ? -32% |
| Read Seq (MB/s) | 1989 | 1503 -24% | 1799 -10% | 2124 7% | 1755 -12% | 2527 27% | 1647 ? -17% |
| Write 4K Q32T1 (MB/s) | 663 | 475.2 -28% | 452.2 -32% | 637 -4% | 395.3 -40% | 480.2 -28% | 547 ? -17% |
| Read 4K Q32T1 (MB/s) | 425.2 | 581 37% | 570 34% | 414.8 -2% | 381.8 -10% | 387.6 -9% | 436 ? 3% |
| Write Seq Q32T1 (MB/s) | 2960 | 2936 -1% | 2736 -8% | 2706 -9% | 2730 -8% | 2996 1% | 2522 ? -15% |
| Read Seq Q32T1 (MB/s) | 3182 | 3539 11% | 3468 9% | 3319 4% | 3468 9% | 2853 -10% | 2739 ? -14% |

Constant Performance Reads: DiskSpd Read Loop, Queue Depth 8
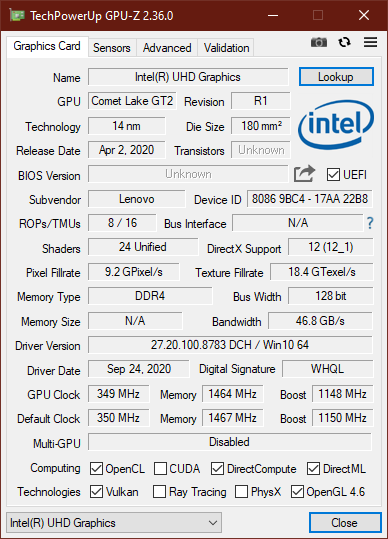
Graphics Card
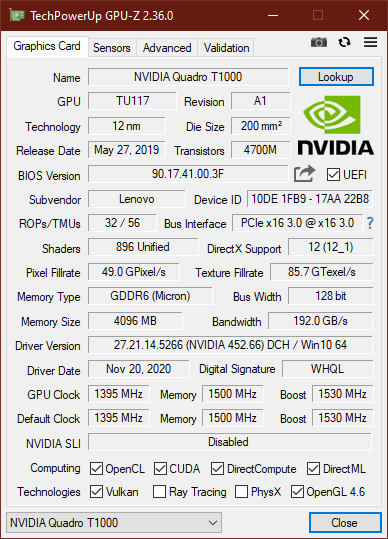
The Nvidia Quadro T1000 represents the entry-level option in the Lenovo ThinkPad P15. Of course, the Nvidia Quadro RTX 5000 Max-Q in the ThinkPad P53 predecessor is considerably faster, but this is no surprise. A more interesting comparison is the Nvidia GeForce GTX 1050 of the Lenovo ThinkPad T15p. Depending on the test, the T1000 has an advantage of between about 50 to 75%, here. So if you want a lot of graphics performance, even the entry-level configuration of the ThinkPad P15 is a better choice than the ThinkPad T15p. Additional comparisons are available in our GPU comparison list.
As in the processor, a slight performance reduction in battery mode can also be determined here. At 9654 points in the 3DMark 11 GPU test, the performance turned out about 15% lower.
| 3DMark 11 Performance | 11592 points | |
| 3DMark Fire Strike Score | 8173 points | |
| 3DMark Time Spy Score | 3565 points | |
Help | ||
Gaming Performance
Generally, workstations are not meant for gaming, but they are not completely unsuitable. The P15 is also able to display modern games smoothly in Full-HD resolution and at high detail settings. However for 4K gaming, the ThinkPad T15g with a GeForce RTX would be more suitable.
| The Witcher 3 - 1920x1080 High Graphics & Postprocessing (Nvidia HairWorks Off) | |
| Lenovo ThinkPad T15g-20UR000GGE | |
| Average of class Workstation (46 - 259, n=12, last 2 years) | |
| Lenovo ThinkPad P15 Gen1-20ST000DGE | |
| Average NVIDIA Quadro T1000 (Laptop) (52.7 - 62.9, n=3) | |
| Lenovo ThinkPad T15p-20TN0006GE | |
| low | med. | high | ultra | |
|---|---|---|---|---|
| The Witcher 3 (2015) | 189 | 114 | 62.9 | 35 |
| Dota 2 Reborn (2015) | 151 | 136 | 123 | 115 |
| X-Plane 11.11 (2018) | 108 | 96 | 80.1 | |
| Shadow of the Tomb Raider (2018) | 111 | 56.7 | 54.1 | 46 |
| Total War: Three Kingdoms (2019) | 189 | 60.4 | 39.1 | 24.7 |
Emissions: The fans can become louder in the ThinkPad P15
Noise Emissions
In idle operation, Lenovo manages to leave the fans turned off most of the time, and if they do run, they are hardly audible at 28,8 dB(a). Under load, the situation changes: A noise level of 37.7 dB(a) can be easily noticed, and the maximum noise level of 44.6 dB(a) can become annoying. Compared to the ThinkPad P53, the two fans can become significantly louder here.
We did not notice any coil whine.
Noise level
| Idle |
| 24.9 / 24.9 / 28.8 dB(A) |
| Load |
| 37.7 / 44.6 dB(A) |
 | ||
30 dB silent 40 dB(A) audible 50 dB(A) loud |
||
min: | ||
Temperature
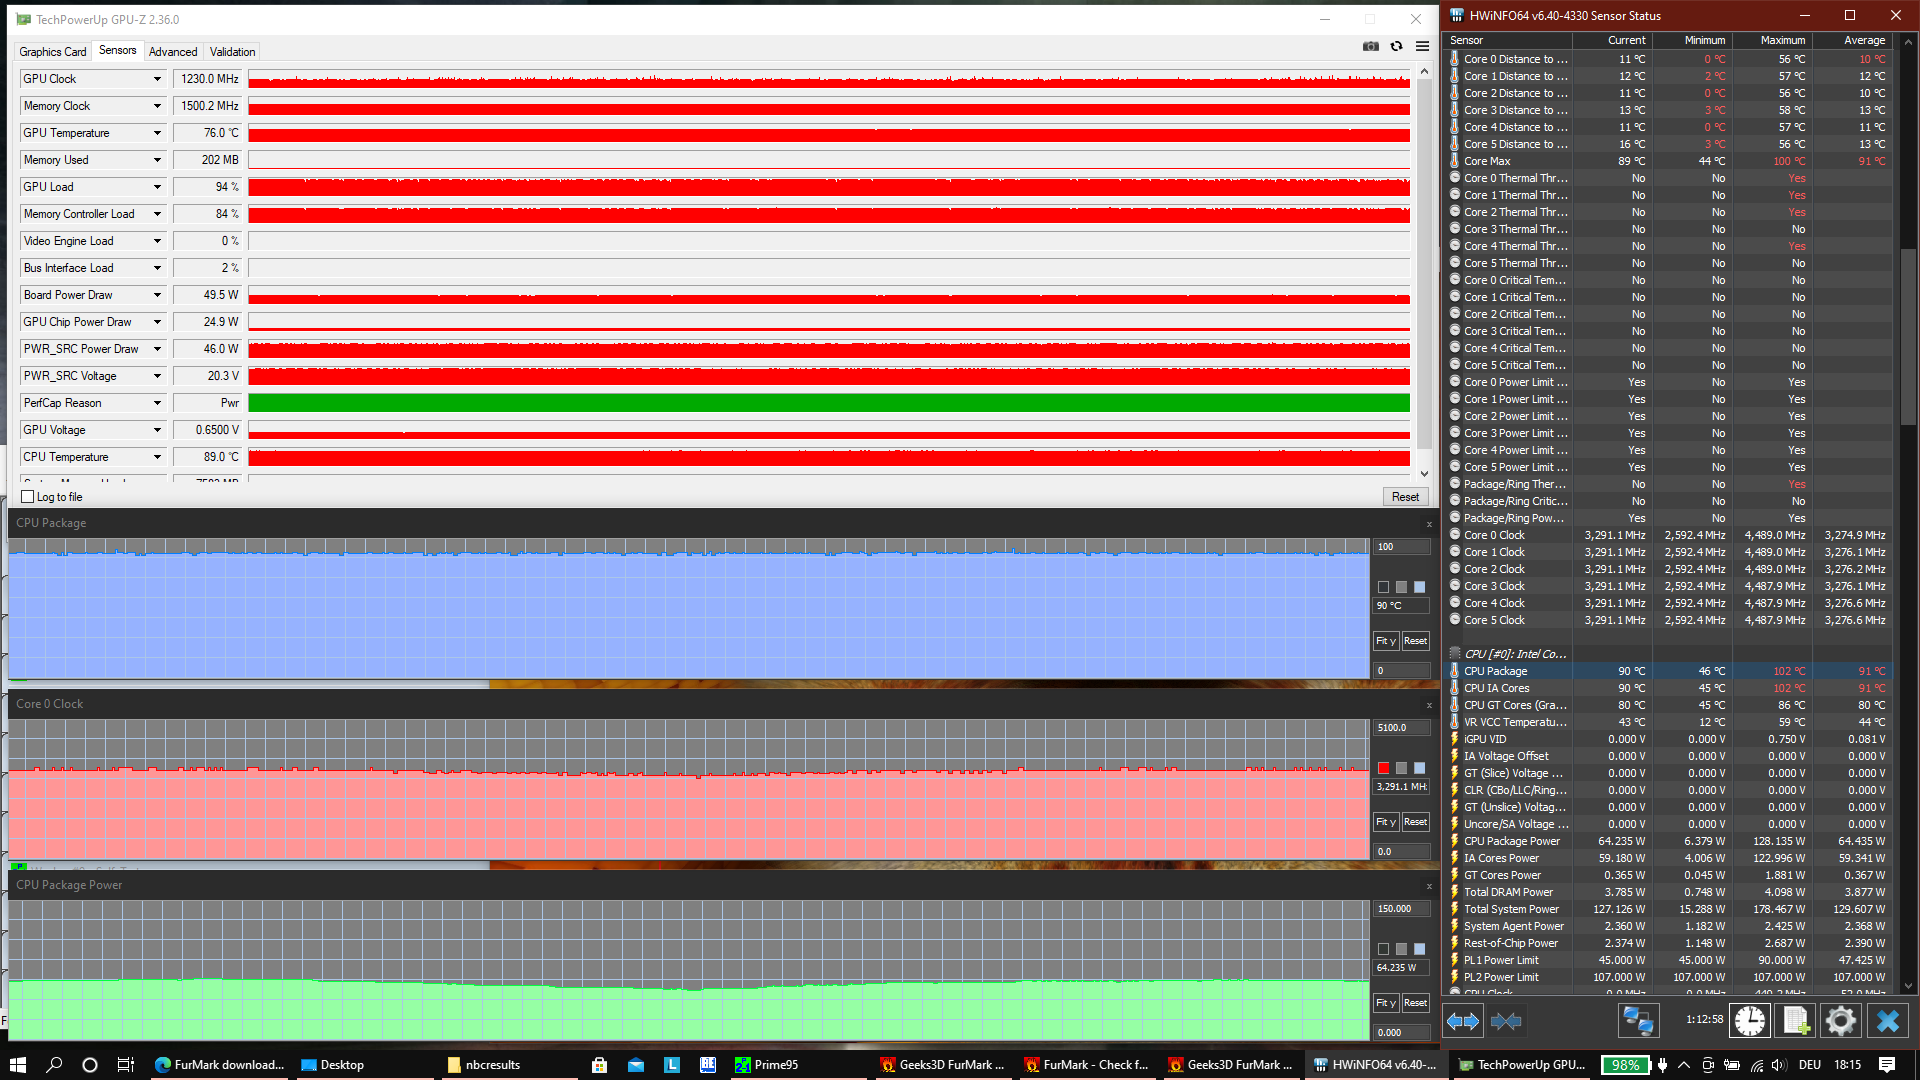
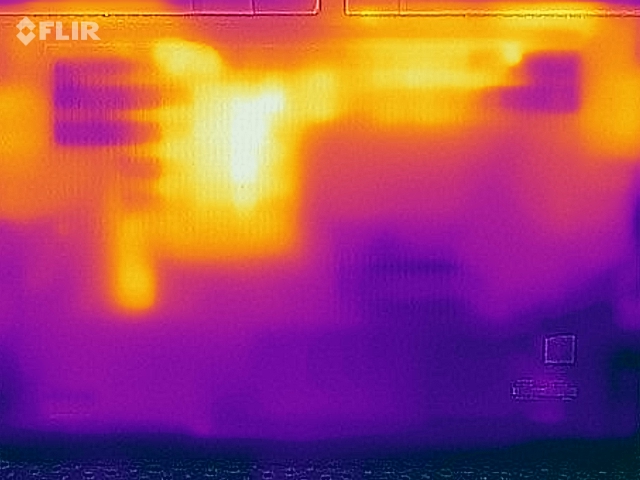
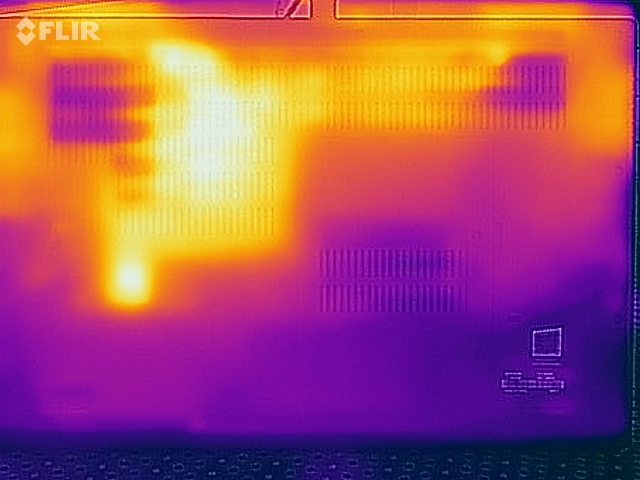
The high CPU consumption values come at a price: the external temperatures rise up to 60 °C (140 °F) on the bottom - and that in an entry-level model! With more powerful CPUs and GPUs, the temperatures might rise even higher.
Of course the stress test represents an extreme scenario. After one hour in the stress test, neither the CPU nor the GPU show any throttling due to high temperatures. The graphics chip is able to consume 50 watts, and the CPU 65 watts - the cooling performance appears to have improved compared to the Lenovo ThinkPad P53 laptop.
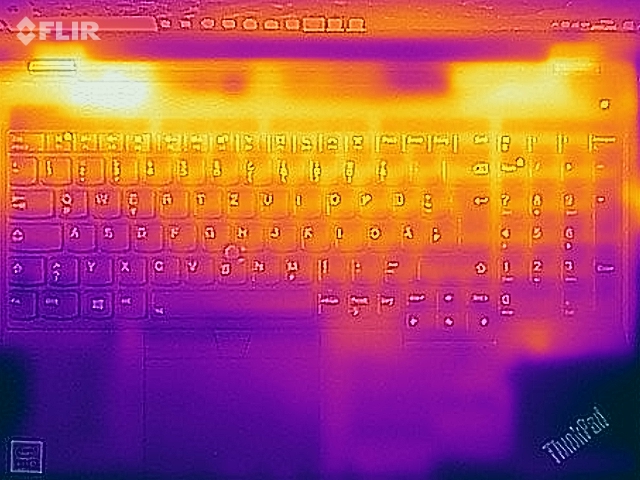
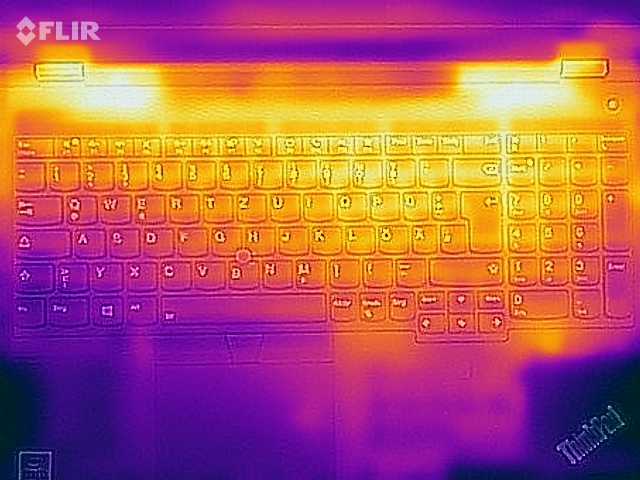
(-) The maximum temperature on the upper side is 45.4 °C / 114 F, compared to the average of 38.2 °C / 101 F, ranging from 22.2 to 69.8 °C for the class Workstation.
(-) The bottom heats up to a maximum of 60.6 °C / 141 F, compared to the average of 41.2 °C / 106 F
(+) In idle usage, the average temperature for the upper side is 25.8 °C / 78 F, compared to the device average of 32 °C / 90 F.
(±) Playing The Witcher 3, the average temperature for the upper side is 36.1 °C / 97 F, compared to the device average of 32 °C / 90 F.
(+) The palmrests and touchpad are reaching skin temperature as a maximum (32.5 °C / 90.5 F) and are therefore not hot.
(-) The average temperature of the palmrest area of similar devices was 27.9 °C / 82.2 F (-4.6 °C / -8.3 F).
Speakers
Lenovo ThinkPad P15 Gen1-20ST000DGE audio analysis
(±) | speaker loudness is average but good (80.7 dB)
Bass 100 - 315 Hz
(-) | nearly no bass - on average 15.1% lower than median
(±) | linearity of bass is average (11.4% delta to prev. frequency)
Mids 400 - 2000 Hz
(±) | higher mids - on average 7.6% higher than median
(+) | mids are linear (5.4% delta to prev. frequency)
Highs 2 - 16 kHz
(+) | balanced highs - only 3.4% away from median
(+) | highs are linear (6.9% delta to prev. frequency)
Overall 100 - 16.000 Hz
(±) | linearity of overall sound is average (18.2% difference to median)
Compared to same class
» 55% of all tested devices in this class were better, 11% similar, 34% worse
» The best had a delta of 7%, average was 18%, worst was 35%
Compared to all devices tested
» 37% of all tested devices were better, 8% similar, 55% worse
» The best had a delta of 4%, average was 24%, worst was 134%
Lenovo ThinkPad T15p-20TN0006GE audio analysis
(±) | speaker loudness is average but good (74.7 dB)
Bass 100 - 315 Hz
(-) | nearly no bass - on average 22.8% lower than median
(±) | linearity of bass is average (12.2% delta to prev. frequency)
Mids 400 - 2000 Hz
(±) | higher mids - on average 6.4% higher than median
(±) | linearity of mids is average (8.5% delta to prev. frequency)
Highs 2 - 16 kHz
(+) | balanced highs - only 3.6% away from median
(+) | highs are linear (6.3% delta to prev. frequency)
Overall 100 - 16.000 Hz
(±) | linearity of overall sound is average (29.3% difference to median)
Compared to same class
» 95% of all tested devices in this class were better, 2% similar, 4% worse
» The best had a delta of 5%, average was 18%, worst was 45%
Compared to all devices tested
» 87% of all tested devices were better, 3% similar, 11% worse
» The best had a delta of 4%, average was 24%, worst was 134%
Power Management: A ThinkPad workstation with a large battery
Power Consumption
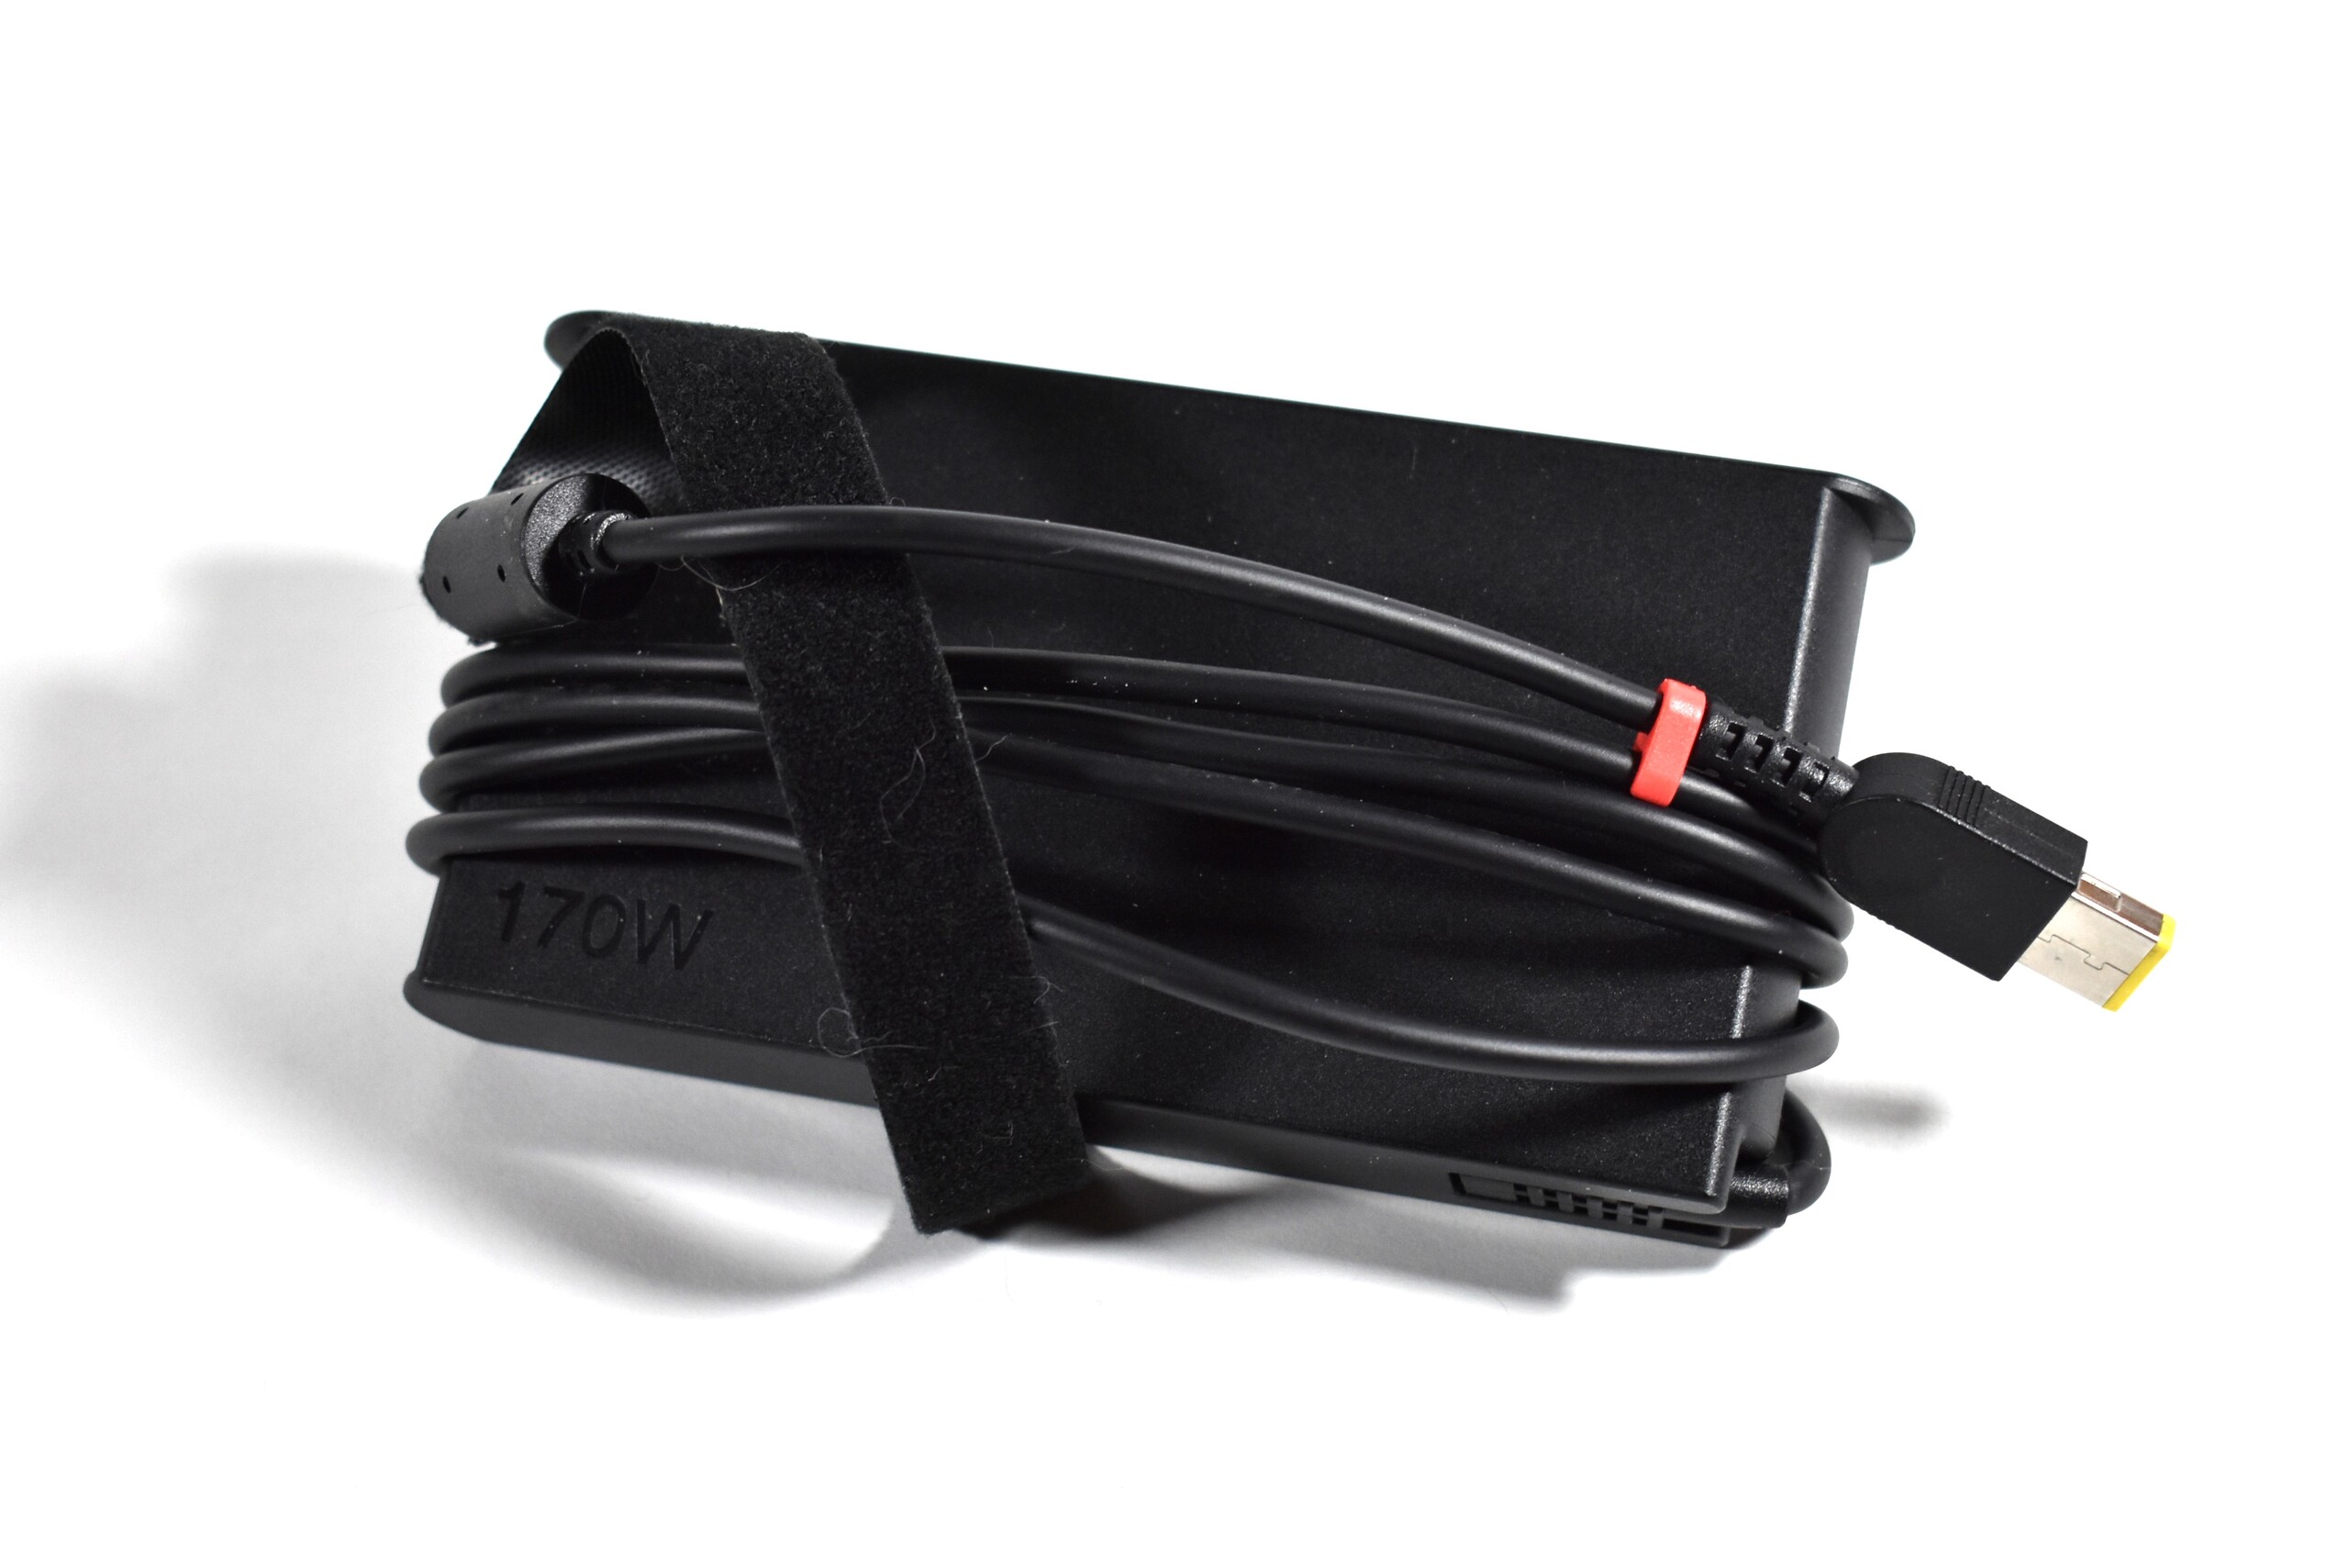
Nothing much has changed compared to the Lenovo ThinkPad P53 in terms of the power consumption, at least in idle operation. Under load, the consumption is significantly lower, which can be attributed to the weaker GPU. The maximum consumption is child's play for the 170-Watt power supply.
| Off / Standby | |
| Idle | |
| Load |
|
Key:
min: | |
| Lenovo ThinkPad P15 Gen1-20ST000DGE i7-10750H, Quadro T1000 (Laptop), Toshiba XG6 KXG6AZNV512G, a-Si IPS LED, 1920x1080, 15.6" | Lenovo ThinkPad P53-20QN000YGE i7-9850H, Quadro RTX 5000 Max-Q, Samsung PM981a MZVLB1T0HBLR, IPS, 1920x1080, 15.6" | Lenovo ThinkPad T15g-20UR000GGE i7-10750H, GeForce RTX 2070 Super Max-Q, SK Hynix PC401 512GB M.2 (HFS512GD9TNG), IPS, 1920x1080, 15.6" | Lenovo ThinkPad T15p-20TN0006GE i7-10750H, GeForce GTX 1050 Mobile, WDC PC SN730 SDBQNTY-512GB, IPS LED, 3840x2160, 15.6" | Dell Precision 7550 W-10885M, Quadro RTX 5000 Max-Q, SK Hynix PC601A NVMe 1TB, IPS, 3840x2160, 15.6" | HP ZBook Fury 15 G7 W-10885M, Quadro RTX 5000 Max-Q, Samsung PM981a MZVLB1T0HBLR, IPS, 3840x2160, 15.6" | Average NVIDIA Quadro T1000 (Laptop) | Average of class Workstation | |
|---|---|---|---|---|---|---|---|---|
| Power Consumption | -13% | -8% | 8% | -38% | -20% | 6% | 5% | |
| Idle Minimum * (Watt) | 8.4 | 7.9 6% | 5.8 31% | 6 29% | 8.2 2% | 4.6 45% | 8.33 ? 1% | 7.54 ? 10% |
| Idle Average * (Watt) | 12.3 | 11.8 4% | 11.4 7% | 12.8 -4% | 16.8 -37% | 13.6 -11% | 11.8 ? 4% | 11.5 ? 7% |
| Idle Maximum * (Watt) | 14.2 | 14.9 -5% | 13.9 2% | 16.1 -13% | 24.4 -72% | 21.5 -51% | 15.2 ? -7% | 15.2 ? -7% |
| Load Average * (Watt) | 96 | 96 -0% | 93.2 3% | 95.6 -0% | 131 -36% | 113.1 -18% | 86.4 ? 10% | 86.9 ? 9% |
| Witcher 3 ultra * (Watt) | 95 | 149 -57% | 145 -53% | 84 12% | 156.6 -65% | 157.5 -66% | ||
| Load Maximum * (Watt) | 168.8 | 207.8 -23% | 234 -39% | 131.1 22% | 201.8 -20% | 199 -18% | 131.1 ? 22% | 158.9 ? 6% |
* ... smaller is better
Battery Life
At 94 Wh, the Lenovo ThinkPad P15 Gen 1 has the currently largest battery of a 15-inch ThinkPad. It is even 4 Wh larger than that of the ThinkPad P53 predecessor. With the low consumption of the Full-HD display, Lenovo achieves a long battery life, lasting almost 14 hours in the Wi-Fi test (150 cd/m²), which is excellent. And almost 10 hours in the same test at maximum brightness are also an achievement.
| Lenovo ThinkPad P15 Gen1-20ST000DGE i7-10750H, Quadro T1000 (Laptop), 94 Wh | Lenovo ThinkPad P53-20QN000YGE i7-9850H, Quadro RTX 5000 Max-Q, 90 Wh | Lenovo ThinkPad T15g-20UR000GGE i7-10750H, GeForce RTX 2070 Super Max-Q, 94 Wh | Lenovo ThinkPad T15p-20TN0006GE i7-10750H, GeForce GTX 1050 Mobile, 68 Wh | Dell Precision 7550 W-10885M, Quadro RTX 5000 Max-Q, 95 Wh | HP ZBook Fury 15 G7 W-10885M, Quadro RTX 5000 Max-Q, 94 Wh | Average of class Workstation | |
|---|---|---|---|---|---|---|---|
| Battery runtime | 6% | -10% | -34% | -27% | -16% | -16% | |
| H.264 (h) | 13.9 | 9.8 -29% | 12.7 -9% | 7.7 -45% | 12.2 ? -12% | ||
| WiFi v1.3 (h) | 14.1 | 11.1 -21% | 11.2 -21% | 7.3 -48% | 8.9 -37% | 8.6 -39% | 8.32 ? -41% |
| Load (h) | 1.2 | 2 67% | 1.2 0% | 1.1 -8% | 1 -17% | 1.3 8% | 1.271 ? 6% |
Pros
Cons
Verdict: A mixed impression for the Lenovo ThinkPad P15 Gen 1
Even if it doesn't look like that at first glance, Lenovo has changed a few things in the ThinkPad P15 Gen 1 compared to the ThinkPad P53 predecessor model. While there are several improvements, the new ThinkPad notebook is worse in other aspects.
One aspect is the case, which does not feel as good haptically. This also includes a stability problem in the keyboard area, which clatters at the bottom left. We also dislike that some features such as the dedicated touchpad keys were removed. We do not see any valid reason why Lenove would have to make some cuts in such an expensive professional device. The contrast of the entry-level display option of the P15 could also be higher. And there is also one M.2 slot less than in the predecessor.
The positive changes concern the build and the cooling. The ThinkPad P15 Gen 1 is easier to maintain, because the cooling system is more accessible. The latter is also improved compared to the predecessor and there is no throttling, although the fans can get louder. The result is an improved CPU performance. Compared to the P53, the battery size has also increased, resulting in a better battery life.
Overall, the ThinkPad P15 Gen 1 is a well-equipped workstation with several weaknesses that Lenovo could perhaps remedy in the successor (keyword: clattering keyboard).
We would have some difficulties in recommending the Lenovo ThinkPad P15 Gen 1. One one hand, because of the weak point in the keyboard, and on the other hand because the CPUs used are simply inefficient. A ThinkPad P15 Gen 2 with 10-nm CPUs from Intel might run significantly cooler and quieter with the same performance capabilities.
Price and Availability
In the tested configuration, the Lenovo ThinkPad P15 Gen 1 costs about 1980 Euros (~$2371) in Germany. In the US, the ThinkPad P15 Gen 1 is available at Amazon starting from $1545.
Lenovo ThinkPad P15 Gen1-20ST000DGE
- 03/04/2021 v7 (old)
Benjamin Herzig
More articles related to this device
Lenovo ThinkPad P15 Gen1-20ST000DGE (ThinkPad P15 Gen1 Series)Related Articles


Price comparison

