 Deutsch
 English
 Español
 Français
 Italiano
 Nederlands
 Polski
 Português
 Русский
 Türkçe
 Svenska
 Chinese
 Magyar
Lenovo ThinkPad T15g Laptop Review: A Gaming ThinkPad or a mobile workstation?
Lenovo's current naming scheme can be pretty confusing. Our test unit, the ThinkPad T15g for example, has nothing in common with the regular ThinkPad T15 or the T15p. The ThinkPad T15g is basically the mobile workstation ThinkPad P15, but it lacks the Quadro GPU and therefore the ISV certifications. It is therefore not a gaming notebook (which you might think when you see the T15g designation), but a mobile workstation with a regular GeForce GPU from Nvidia. We want to find out whether the T15g is a good choice when you do not need the (expensive) ISV certifications and have a bigger focus on 3D or VR applications.
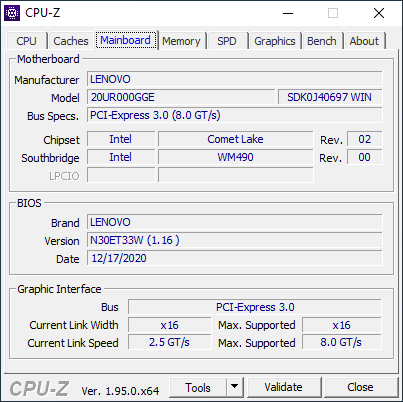
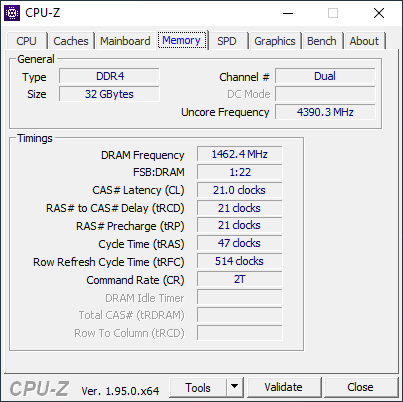
Our test unit has the designation 20UR000GGE for about 2900 Euros and is equipped with a Core i7 processor from Intel, a 1080p panel with HDR400 support, Nvidia's GeForce RTX 2070 Super Max-Q, 32 GB RAM, and a 512 GB SSD. Customers with access to Lenovo's campus program can save around 300 Euros.
Possible competitors
Rating | Date | Model | Weight | Height | Size | Resolution | Best Price |
|---|---|---|---|---|---|---|---|
| 86.3 % | 03/2021 | Lenovo ThinkPad T15g-20UR000GGE i7-10750H, GeForce RTX 2070 Super Max-Q | 2.8 kg | 31.45 mm | 15.60" | 1920x1080 | |
| 87.8 % | 08/2020 | Dell Precision 7550 W-10885M, Quadro RTX 5000 Max-Q | 2.8 kg | 27.36 mm | 15.60" | 3840x2160 | |
| 90.2 % | 01/2021 | HP ZBook Fury 15 G7 W-10885M, Quadro RTX 5000 Max-Q | 2.4 kg | 25.9 mm | 15.60" | 3840x2160 | |
| 85.9 % | 11/2020 | SCHENKER XMG Neo 15 Comet Lake i7-10875H, GeForce RTX 2070 Super Mobile | 2.2 kg | 23 mm | 15.60" | 1920x1080 |
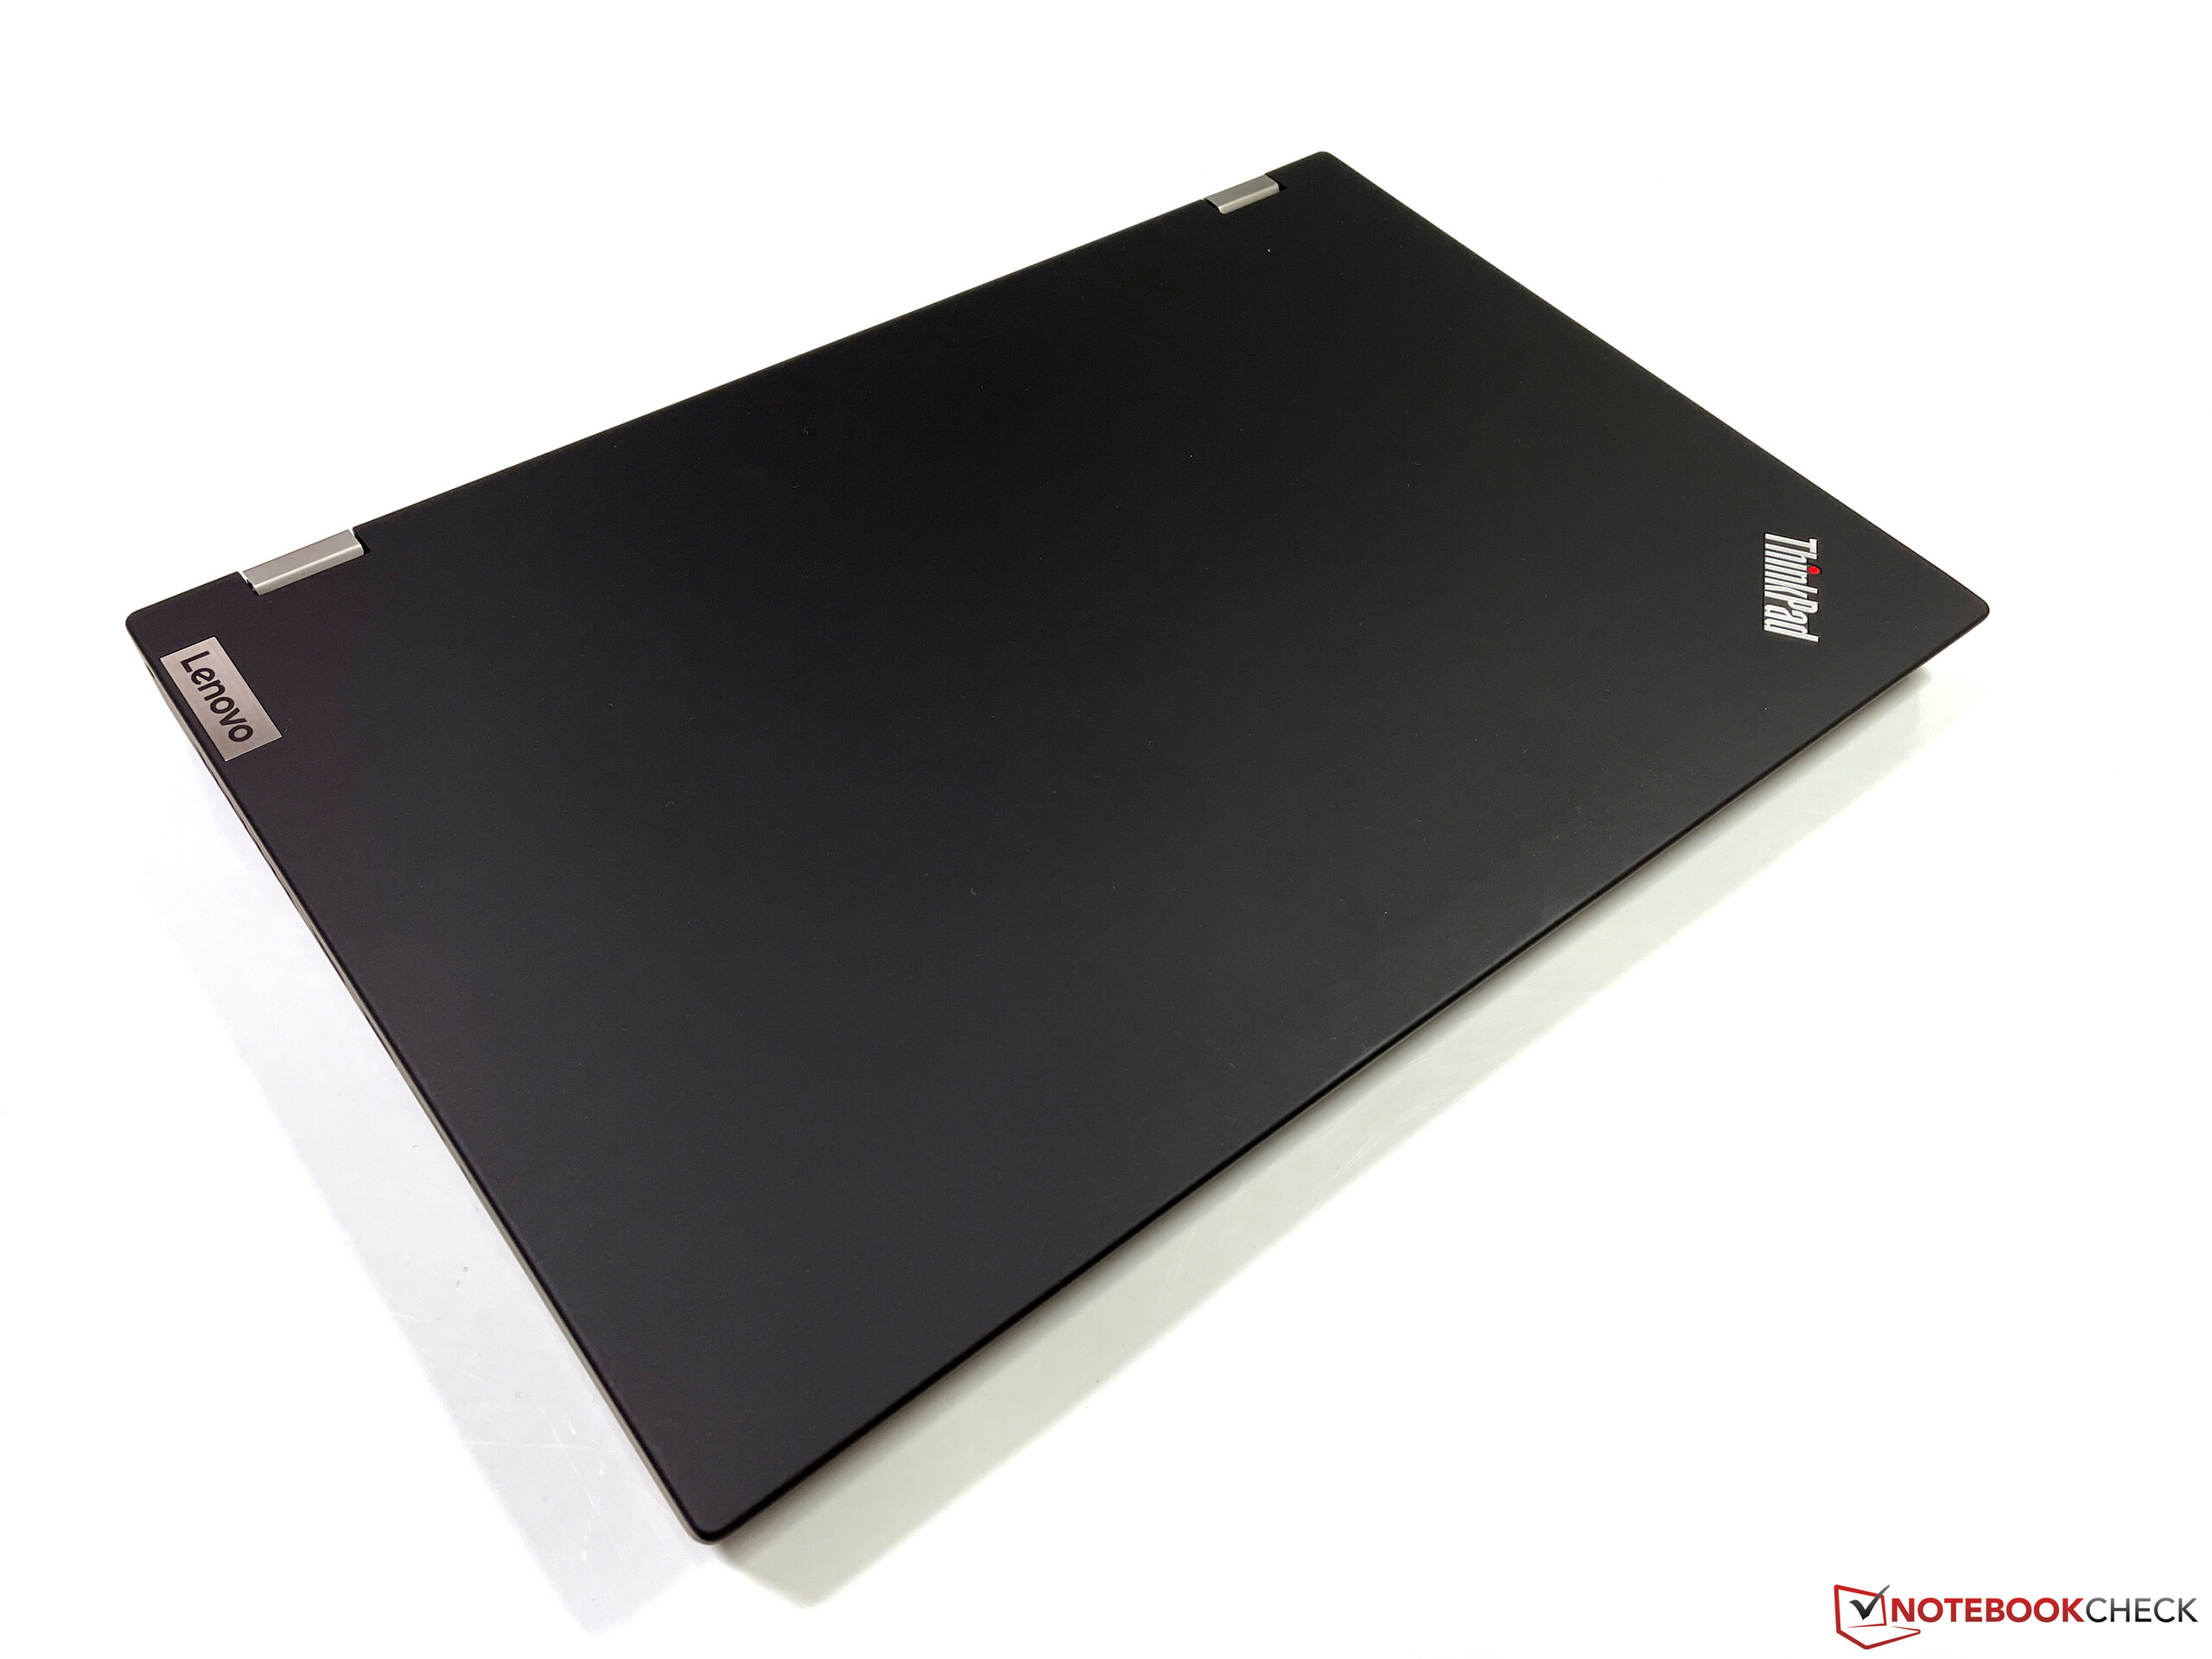
Case - Classic workstation
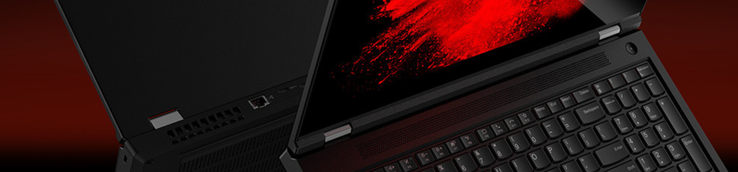
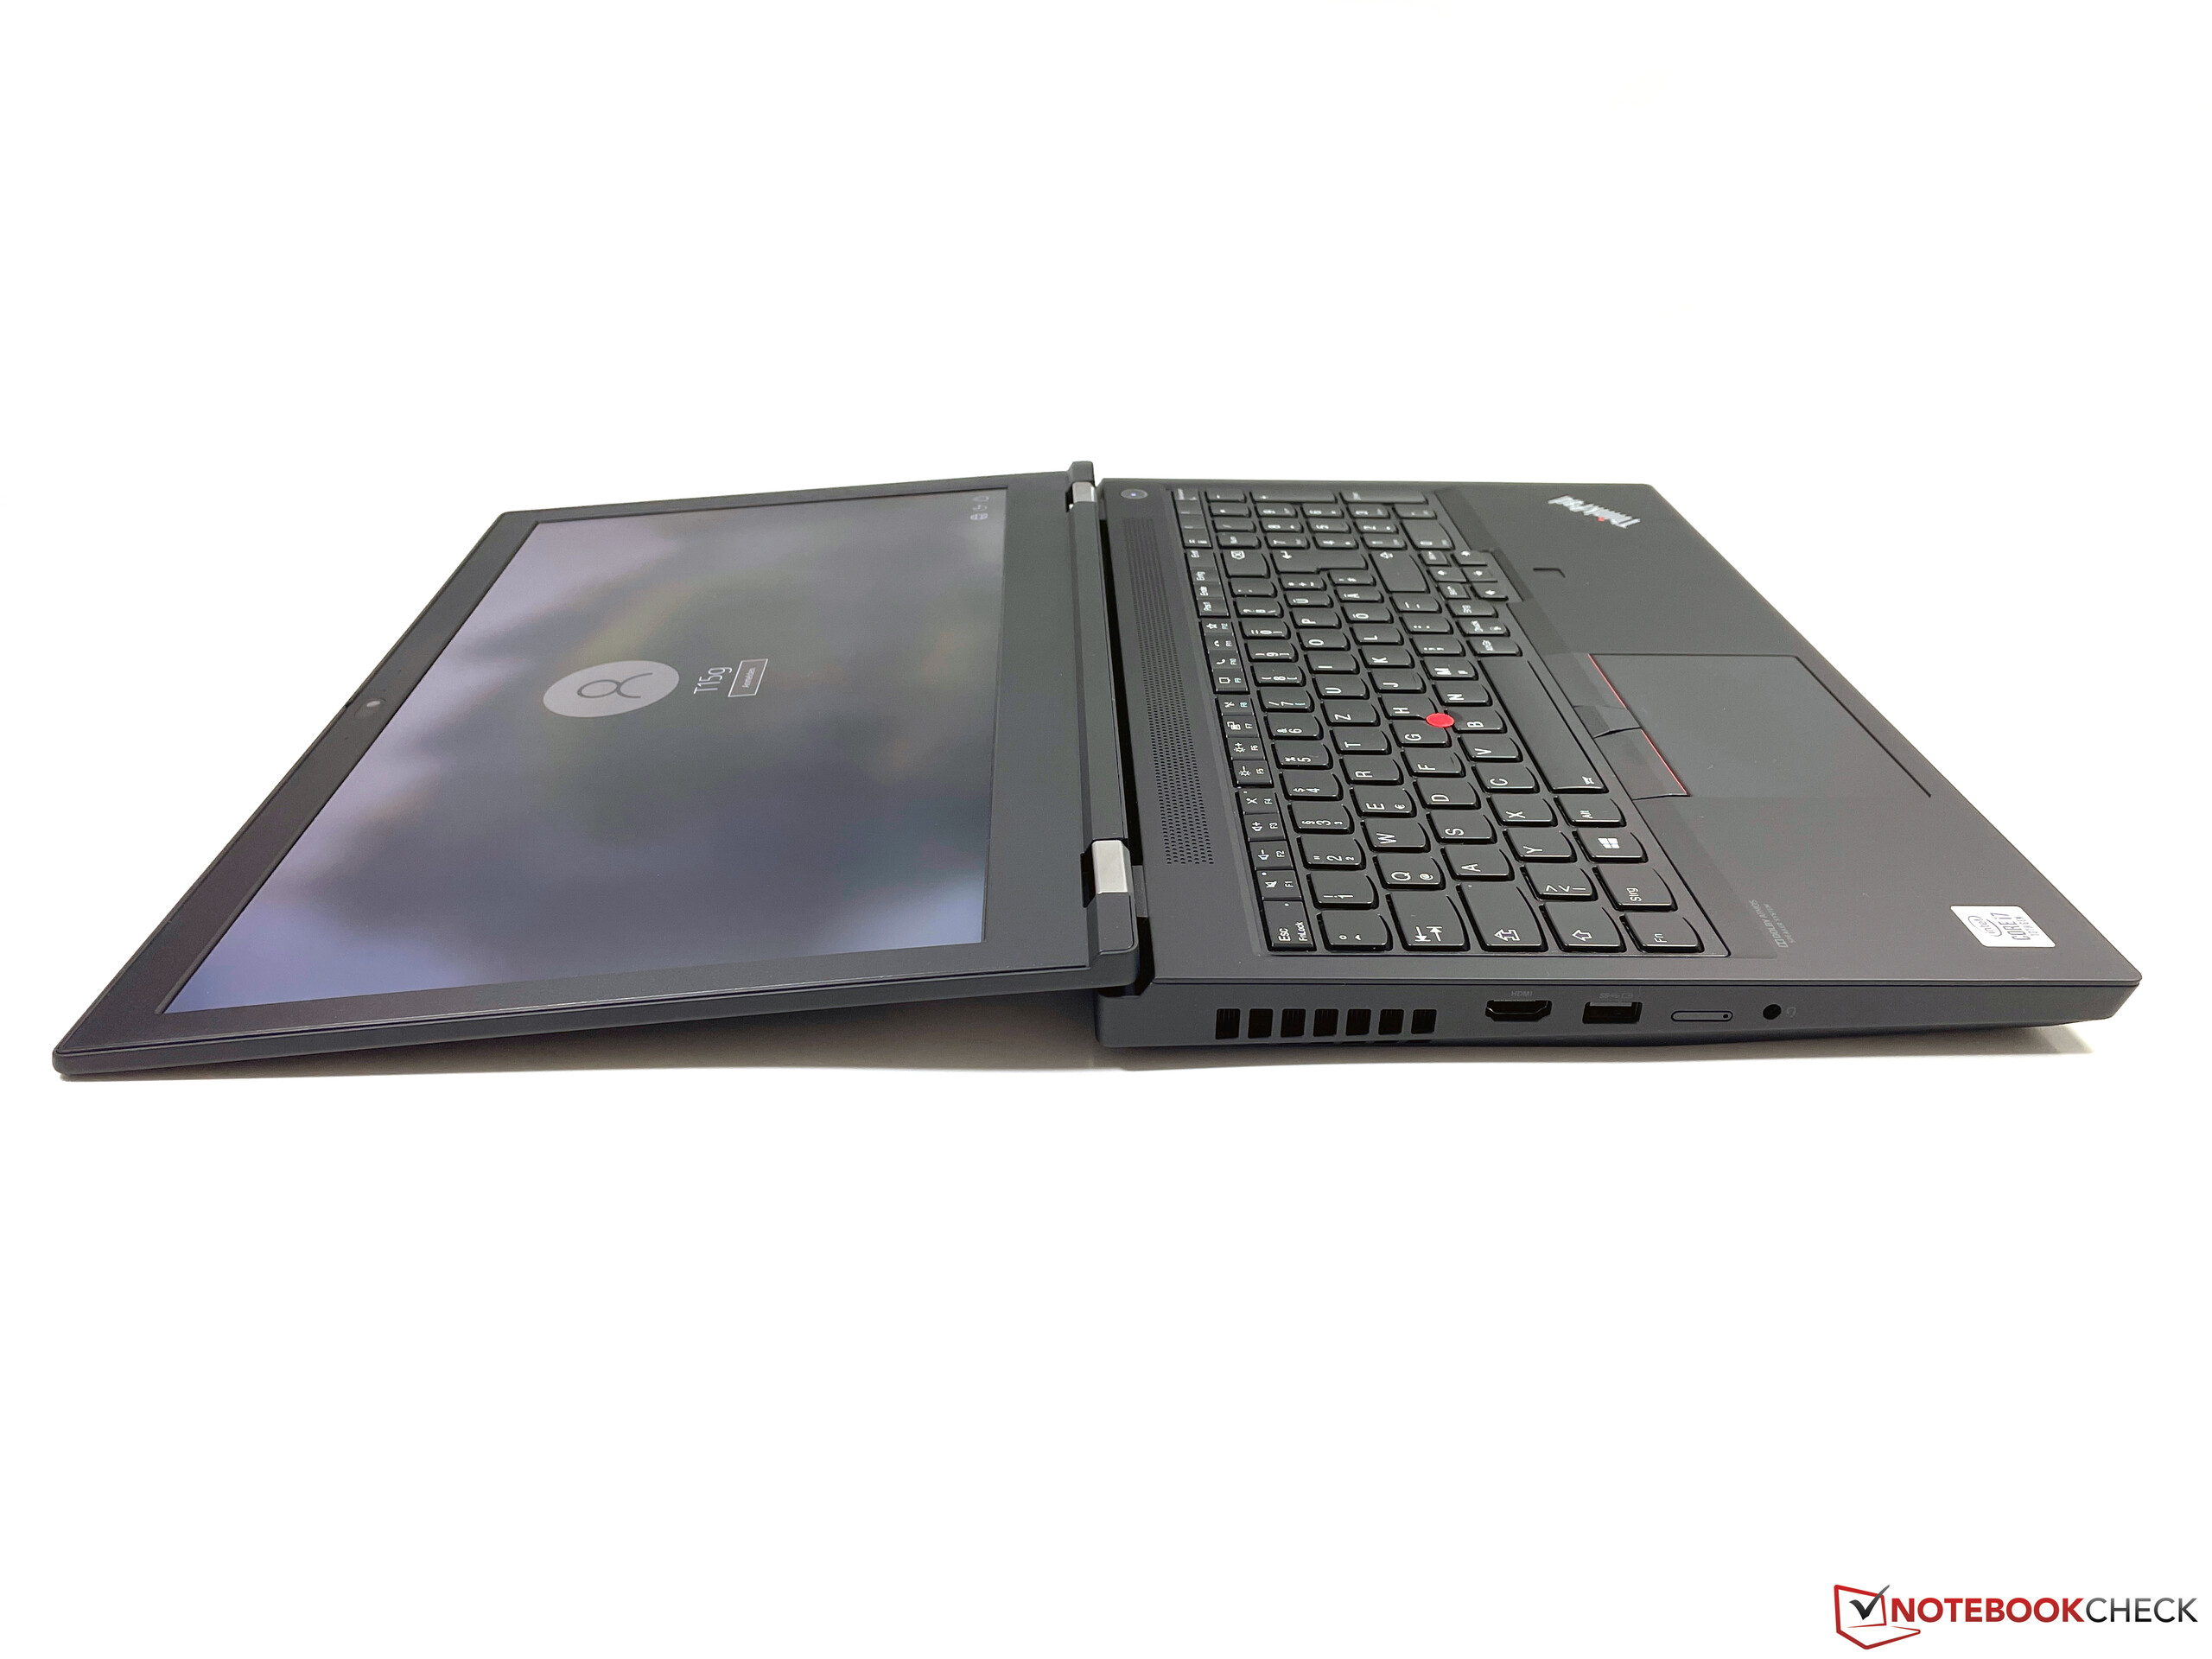
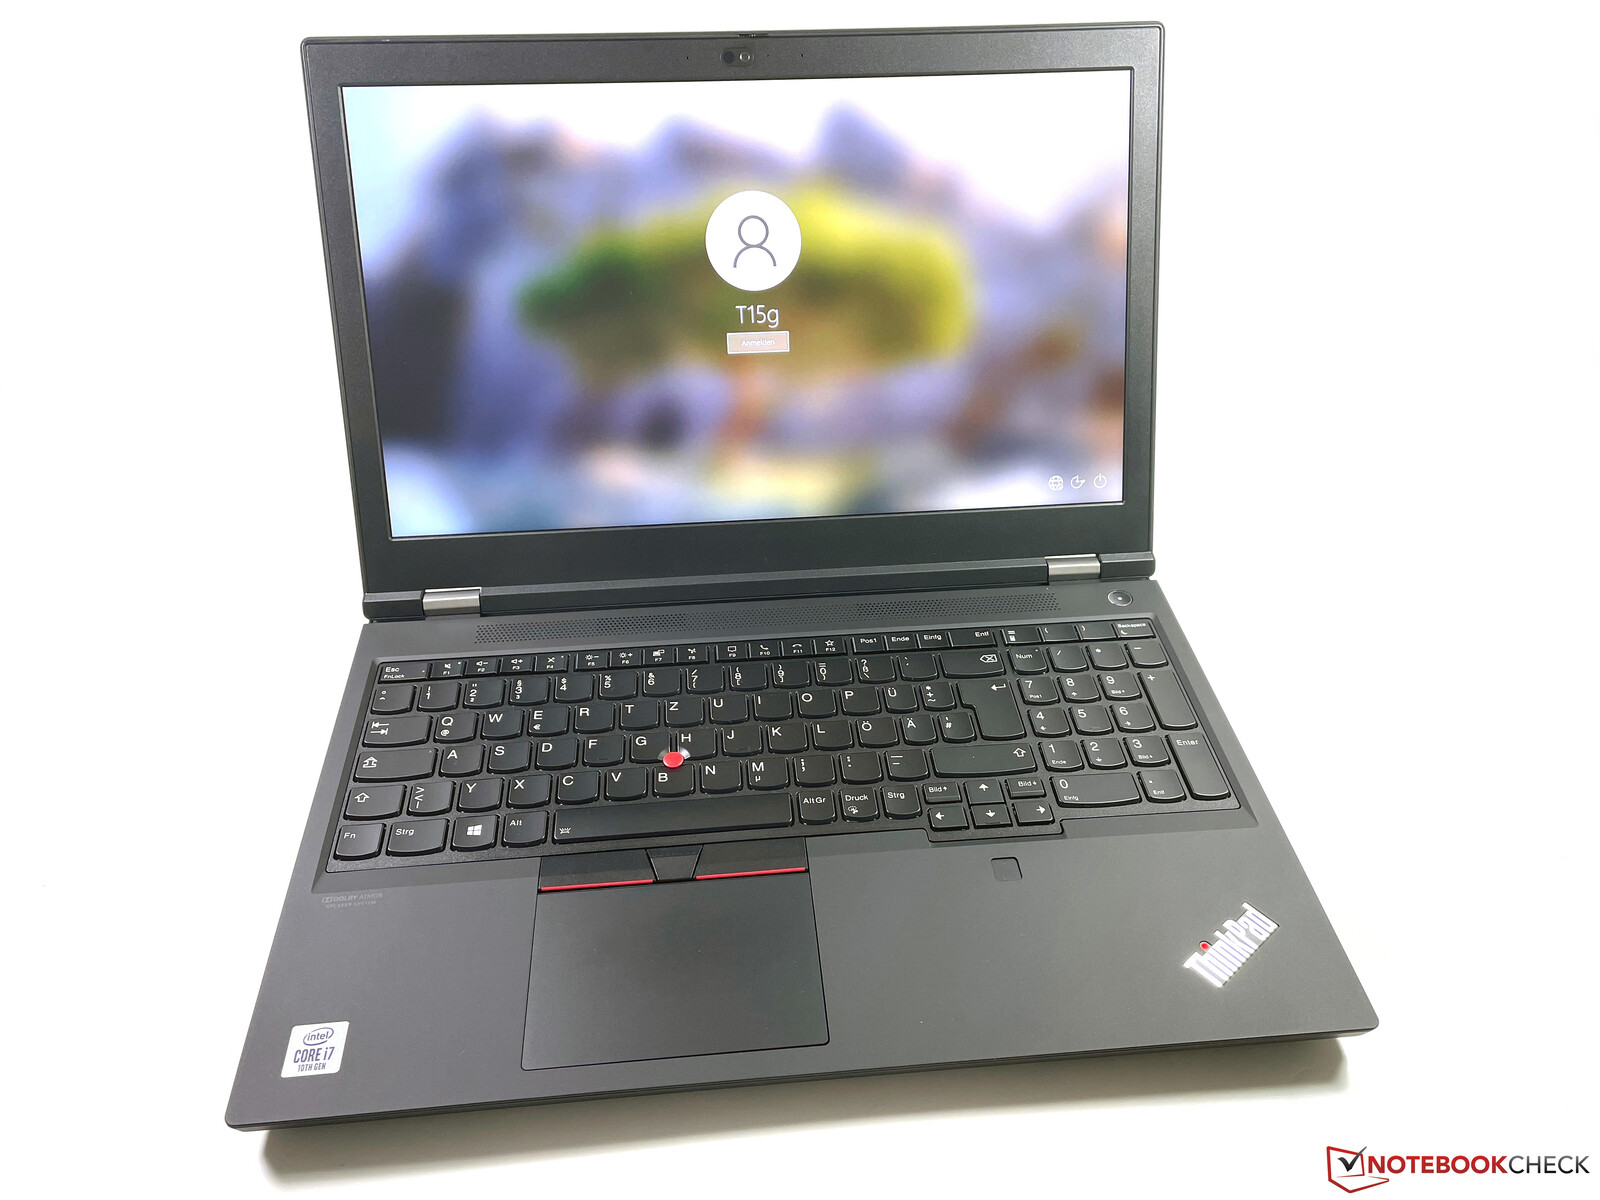
The T15g is not a slim and portable workstation like the ThinkPad T15g. Just like the similarly constructed ThinkPad P15, the T15g is a conventional mobile workstation with a bulky and high chassis (more than 3.5 cm high with support feet). The design itself does not offer any surprises, because you still get the typical black ThinkPad design. Once you open the lid, however, the device appears pretty outdated due to the massive display bezels. The lid would easily accommodate a 16-inch panel (16:10).
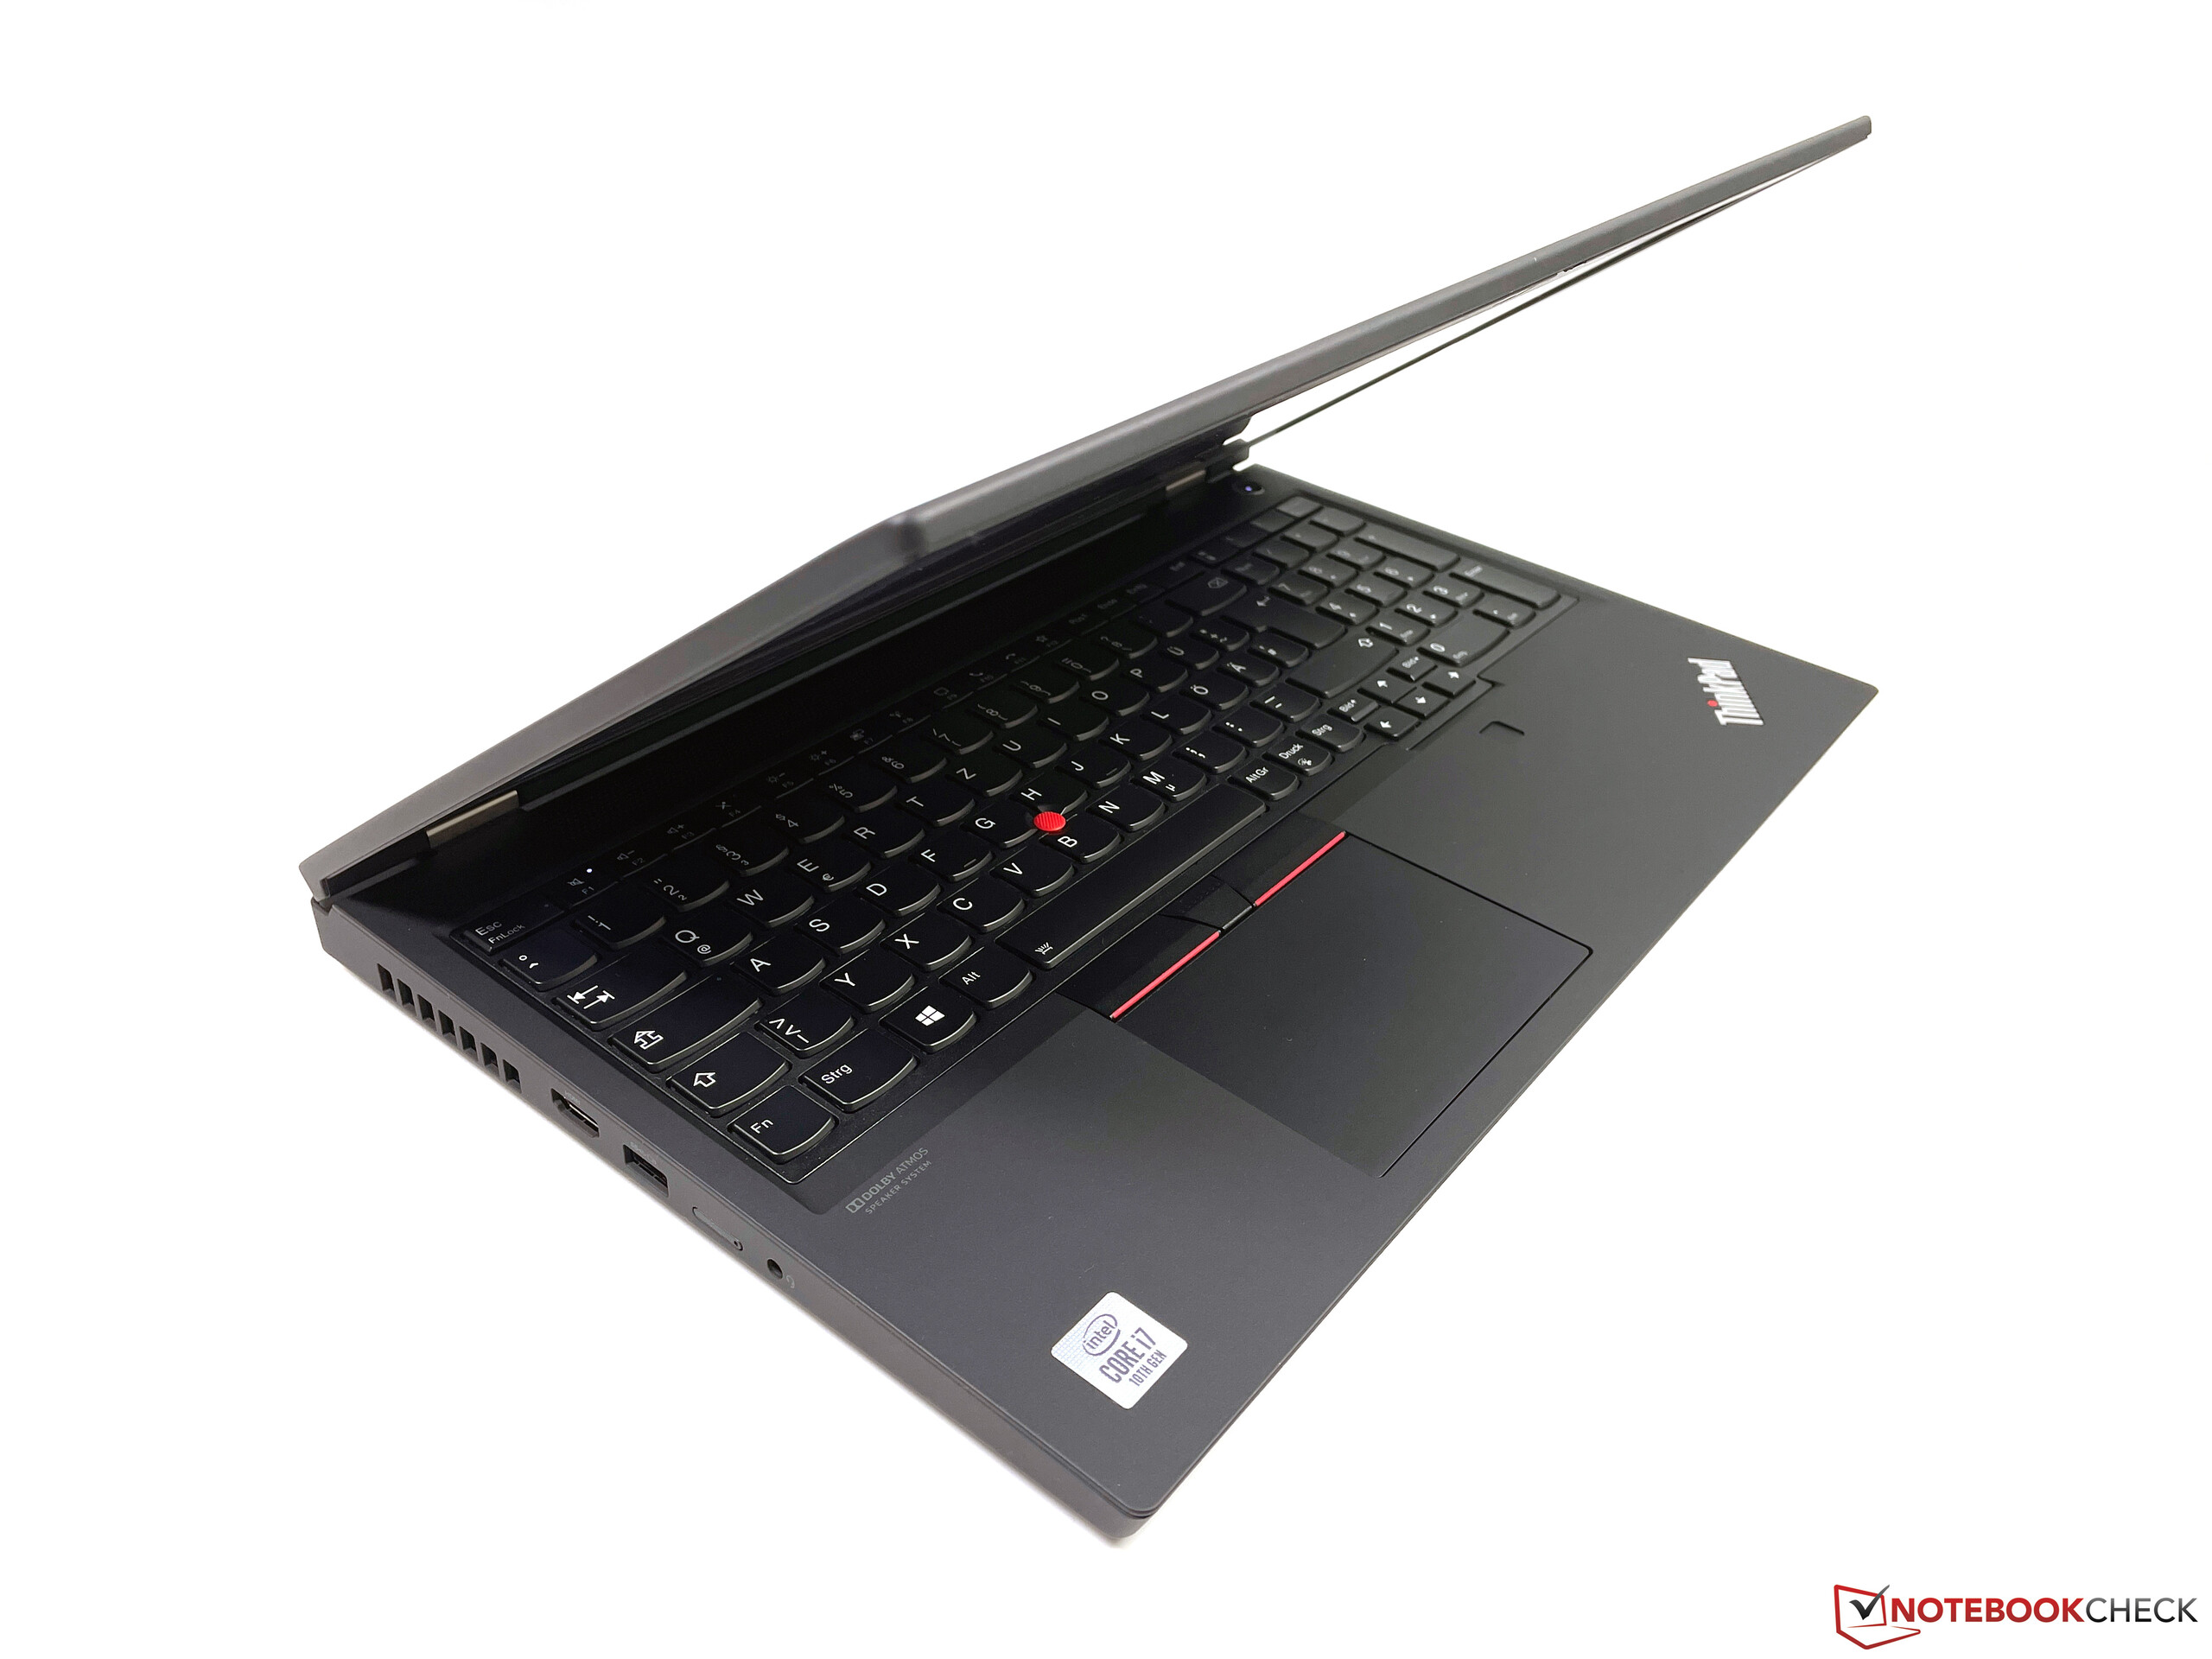
The advantage of the bulky construction is definitely the stability. Lenovo uses a plastic glass-fiber combination for both the base unit as well as the lid. The base in particular is very sturdy and cannot be twisted or pushed in. The keyboard is also very sturdy and does not flex even under a lot of pressure. The lid itself is a bit more flexible when you twist it, but there are no problems and we cannot provoke any picture distortions. The two hinges keep the display well in position and allow a maximum opening angle of more than 180 degrees, but you can still open the lid with one hand.
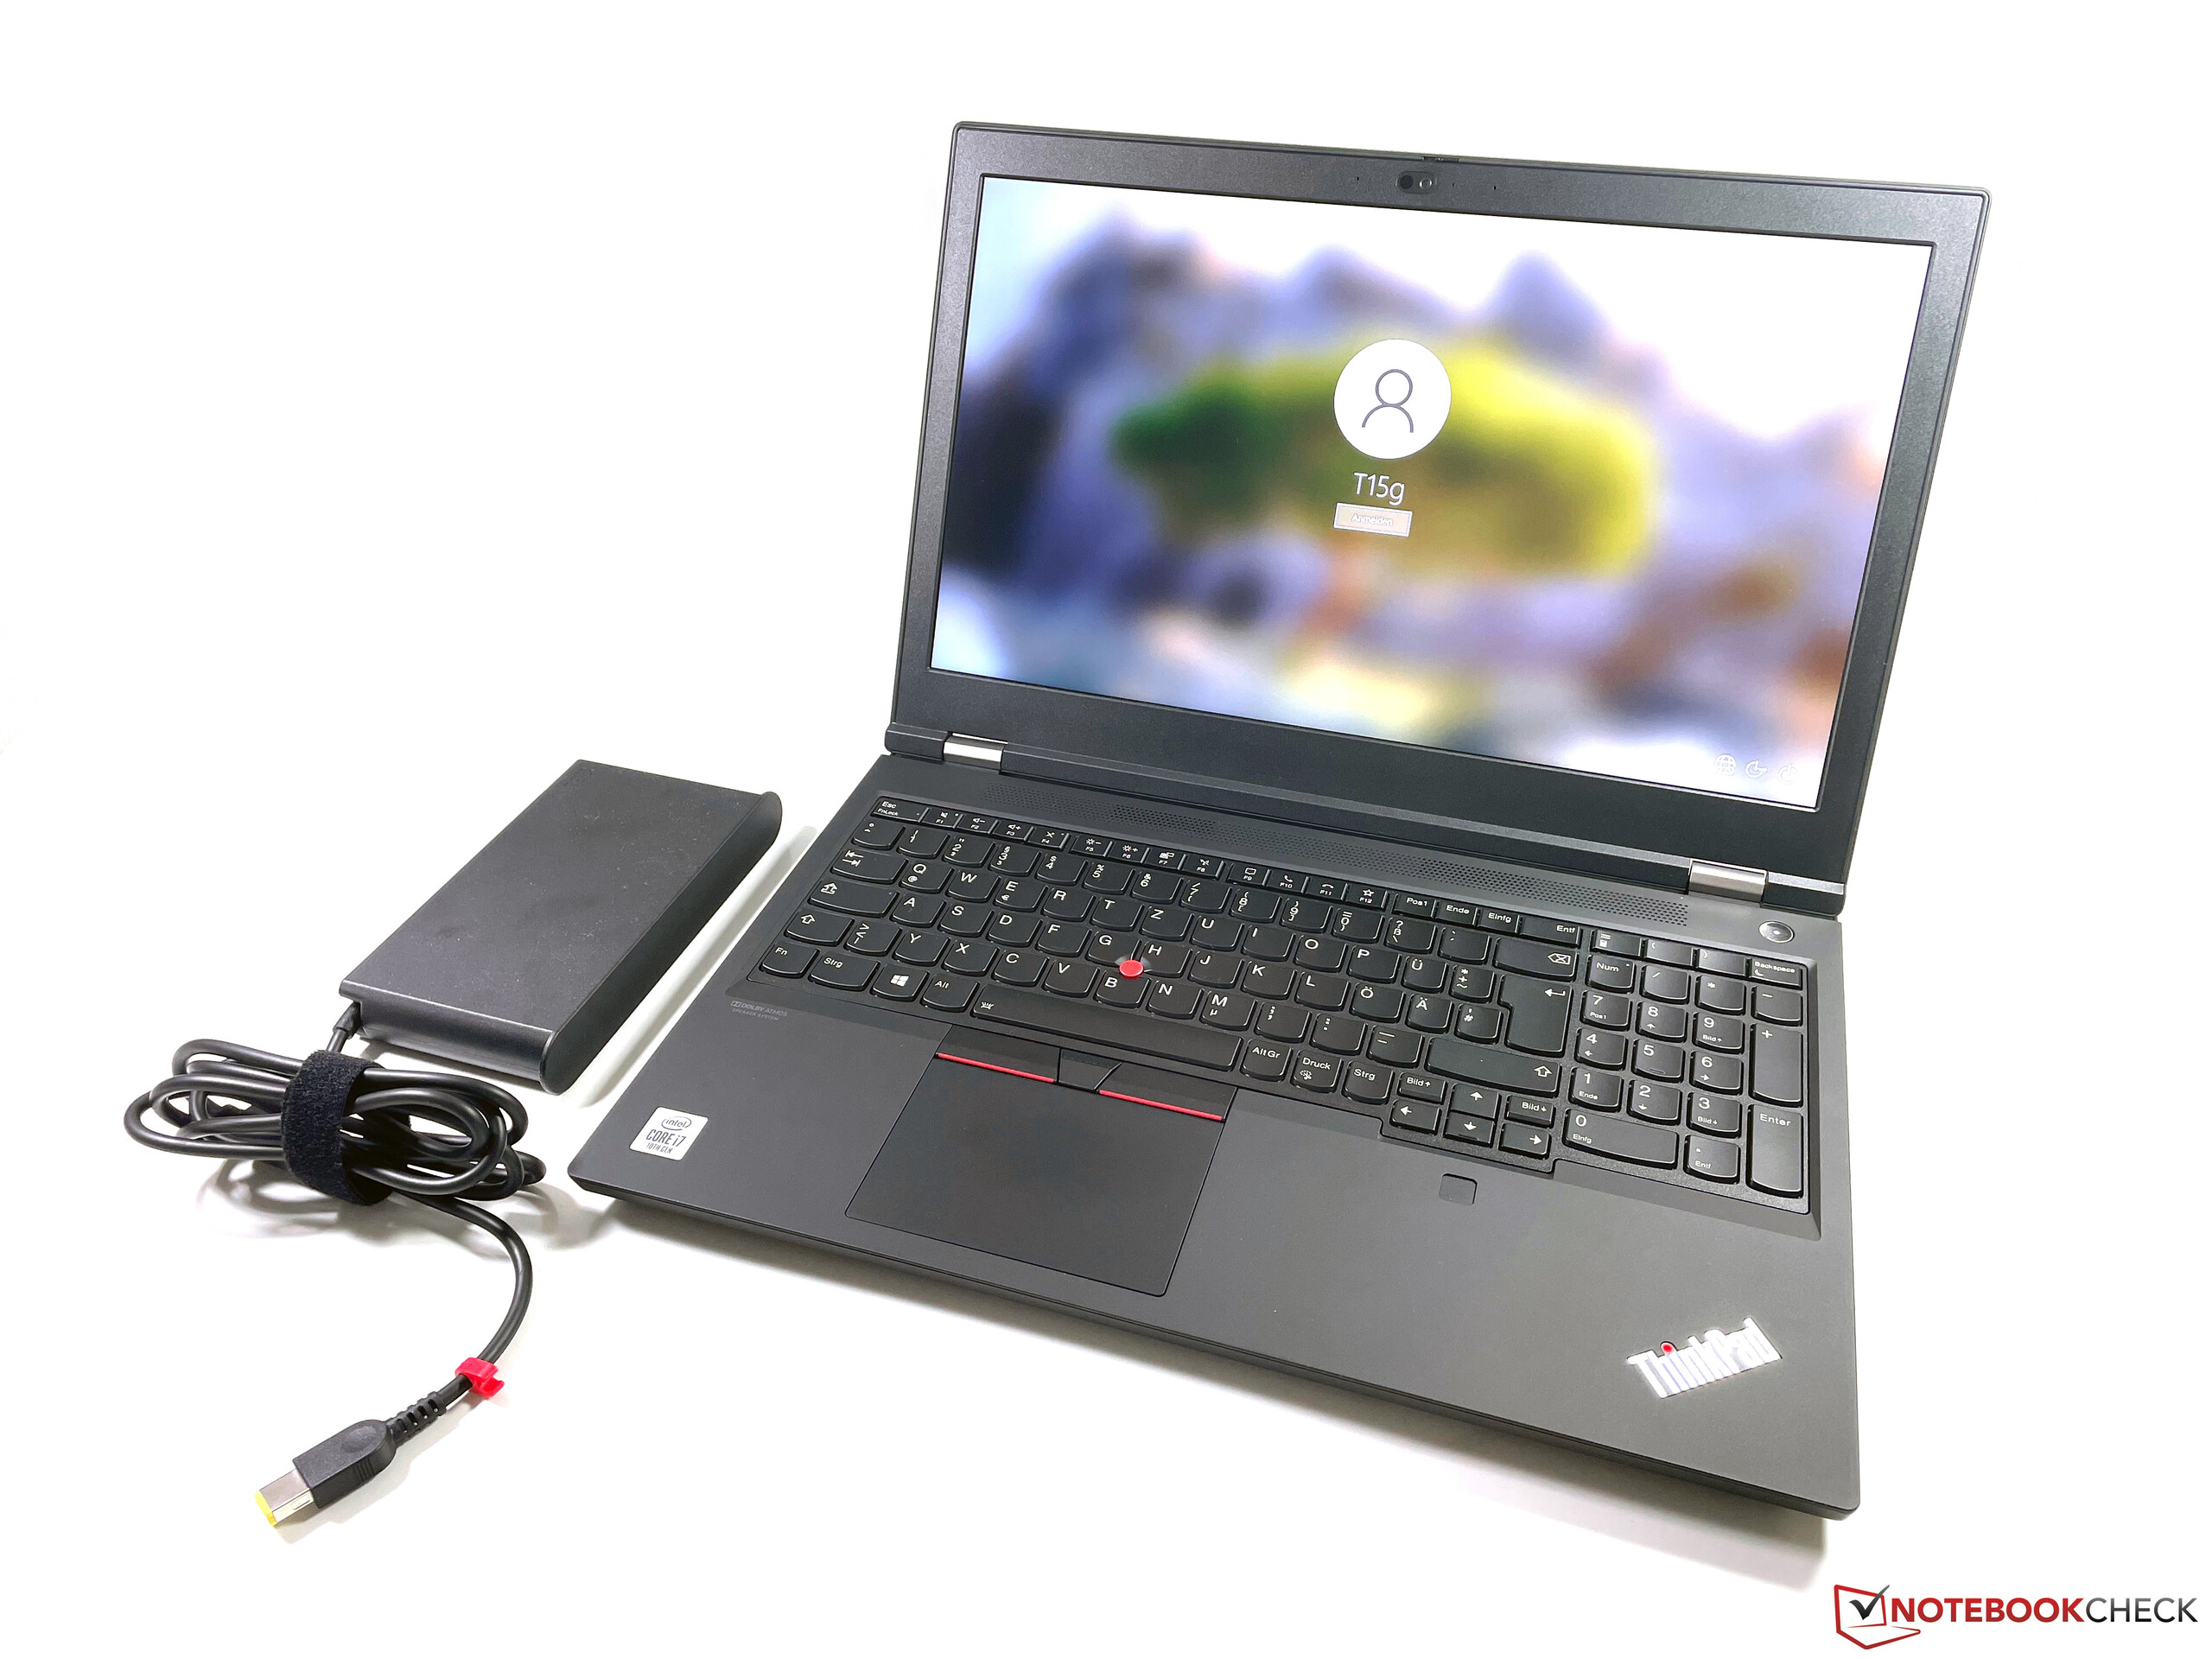
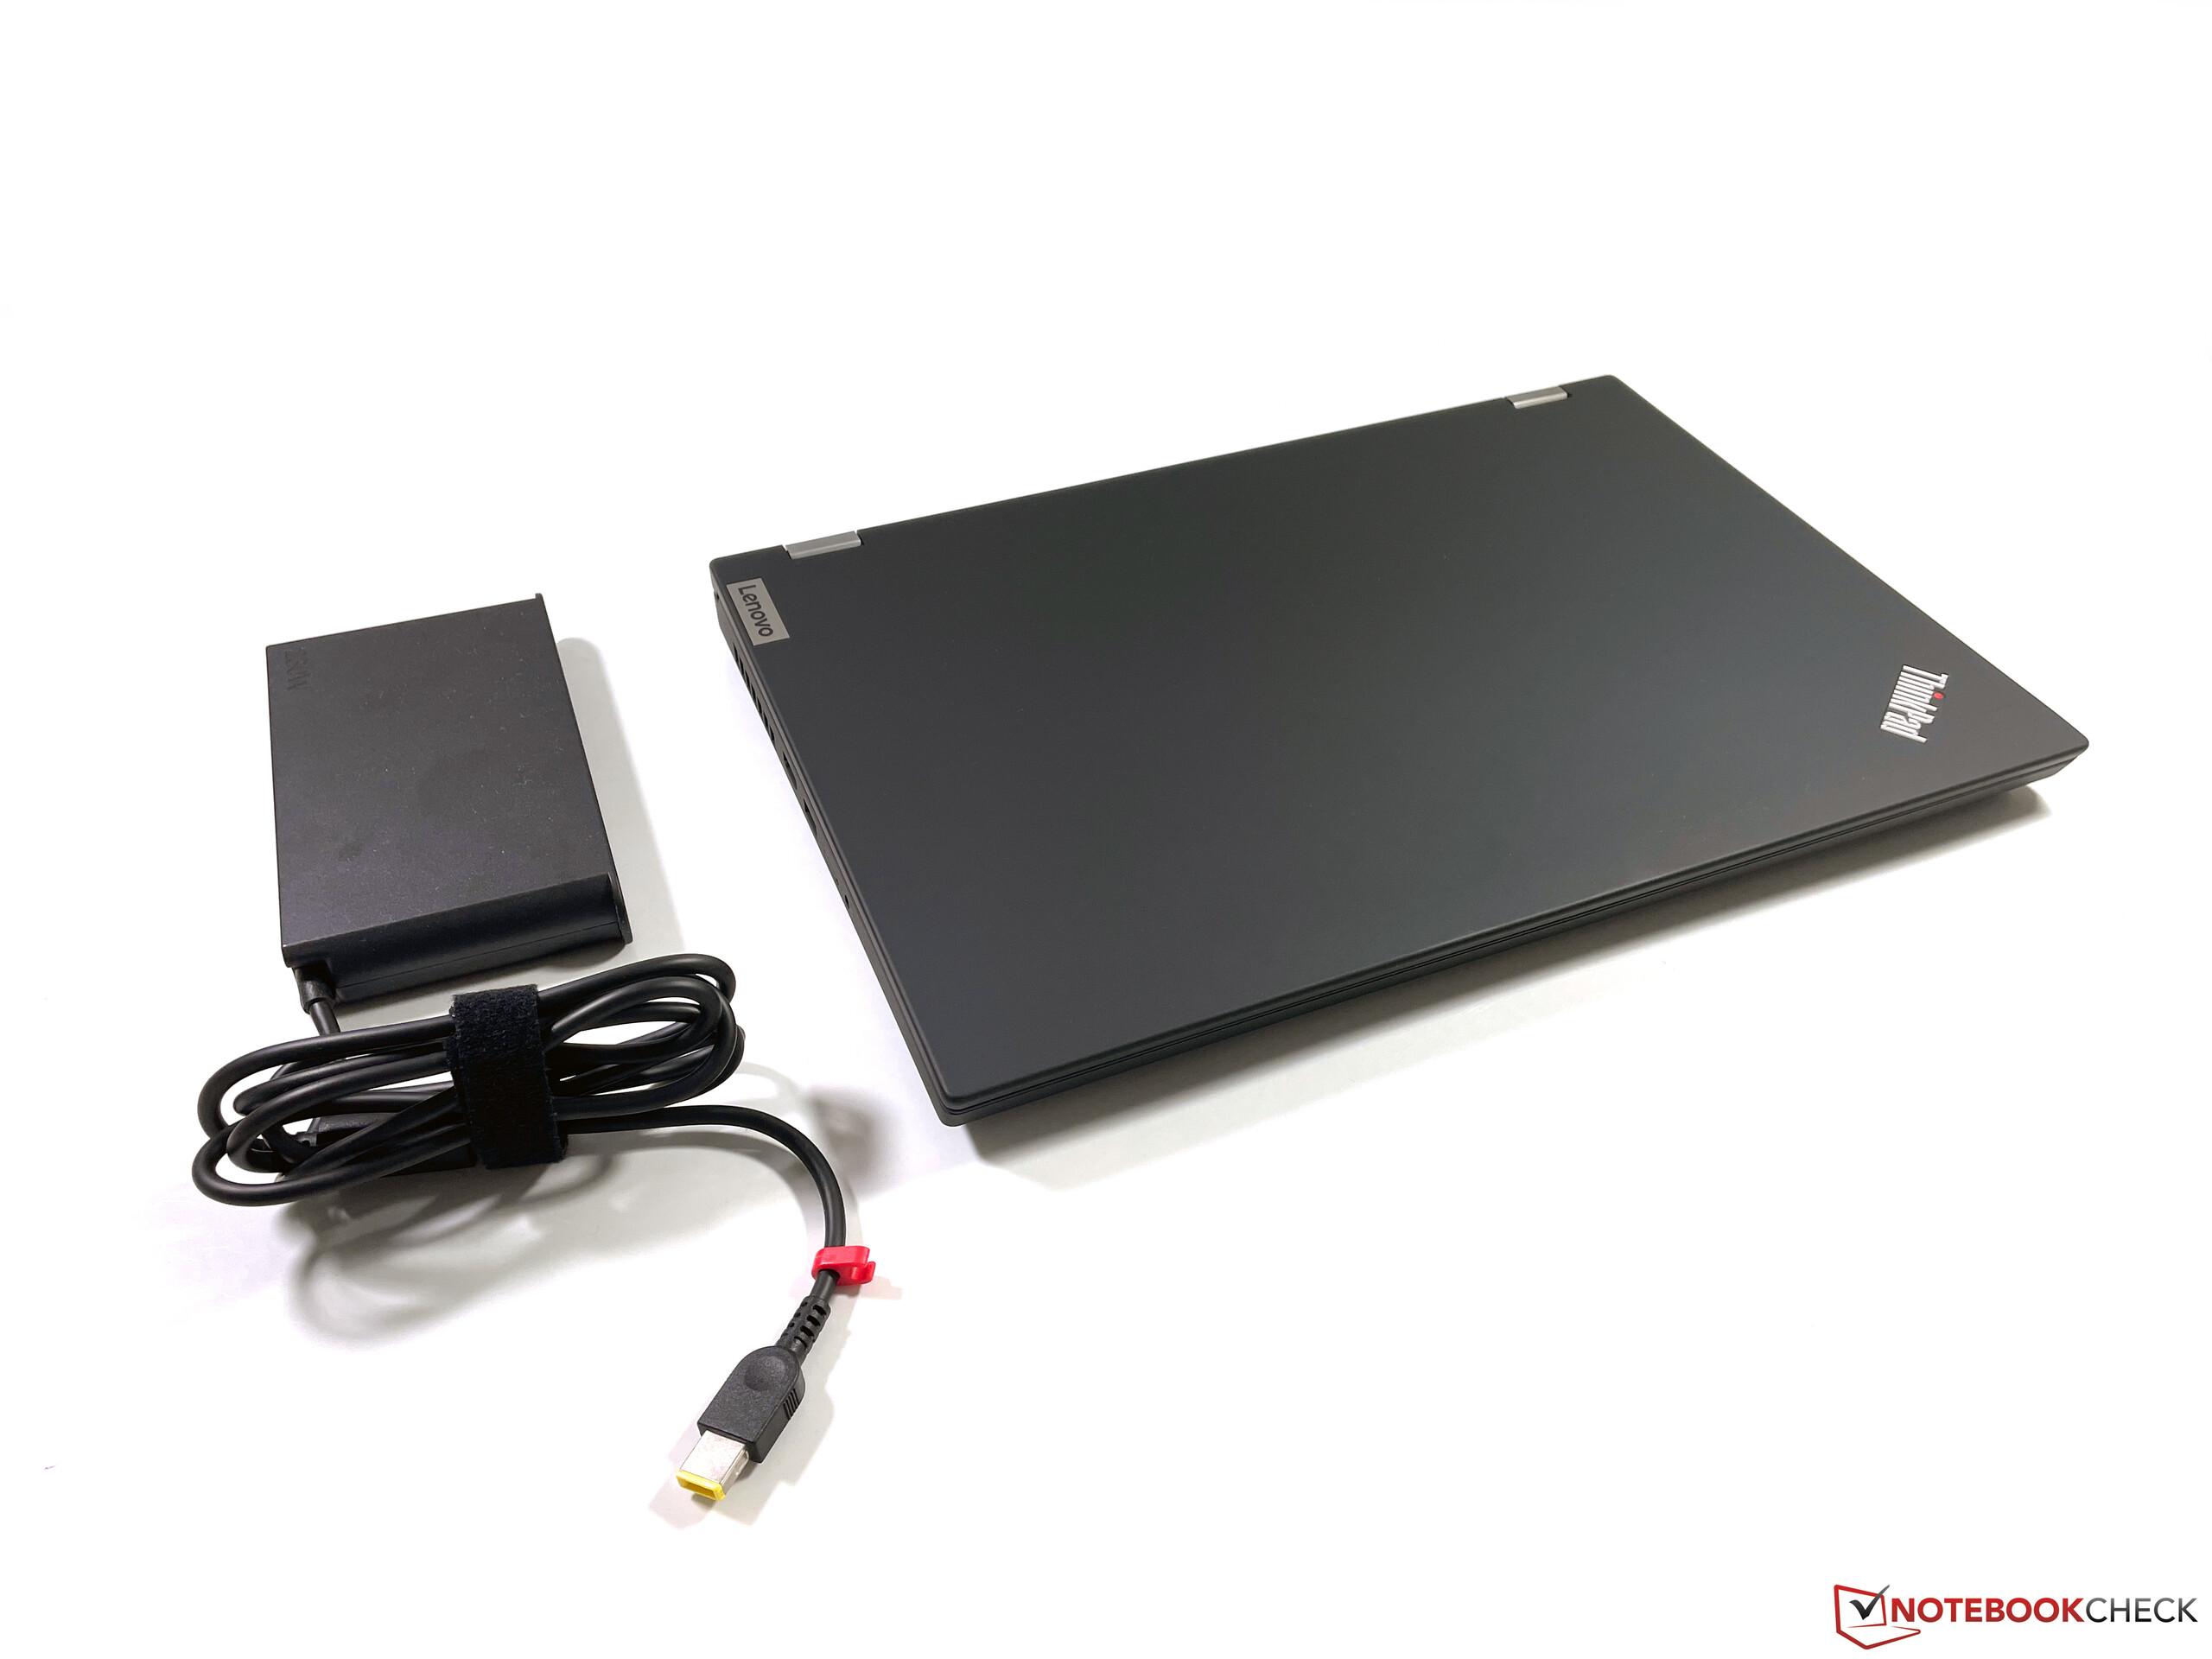

If we compare the ThinkPad with workstations from Dell and HP, the T15g is clearly the biggest device. You should also consider the bulky power adapter with a weight of almost 1 kg when you transport the notebook.
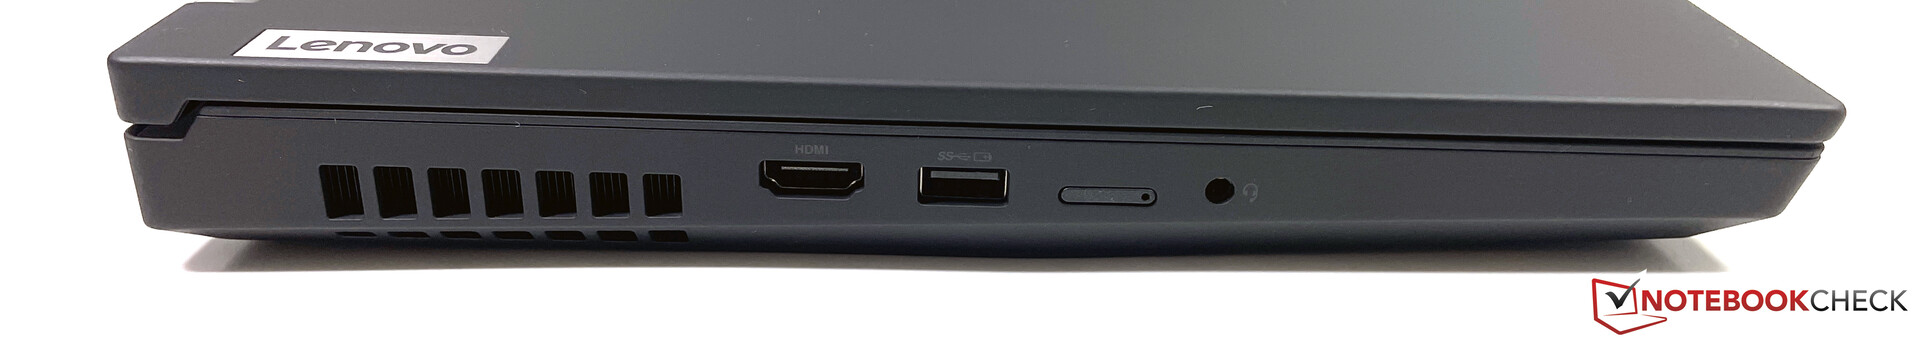
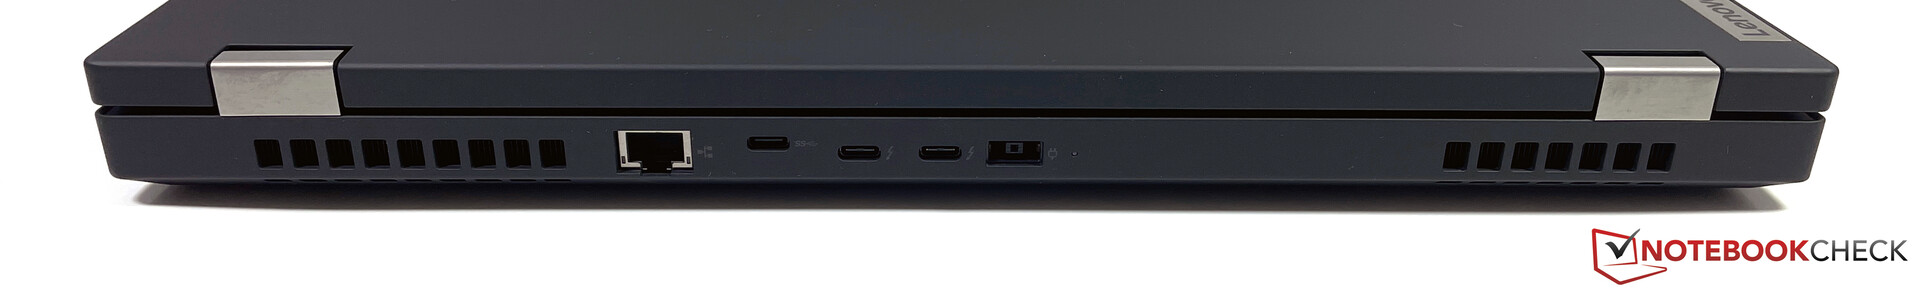
Connectivity - T15g with Thunderbolt 3
There is definitely no lack of space at the edges of the T15g and you get plenty of ports, even though the port layout is not ideal. The majority of ports is located at the center of the rear, including all USB-C ports. We would have liked to see at least one USB-C port at one of the sides to attach an external drive, for example. All three USB-C ports can also be used to attach external displays (2x DisplayPort Alt 1.4, 1x DisplayPort Alt 1.2) and there is a full-size HDMI 2.0 output. All in all, the T15g can drive 5 individual displays (internal + 4 external).
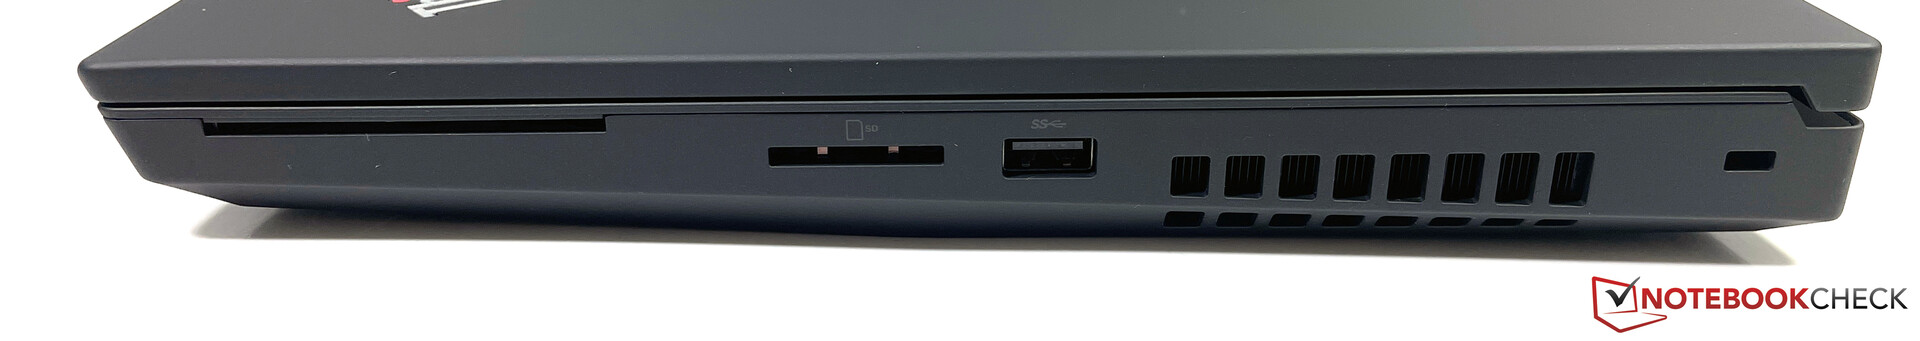
SDCardreader
The T15g has a full-size SD reader. We measure transfer speeds of around 200 MB/s with our reference card from Toshiba (Exceria Pro SDXC 64 GB UHS-II).
| SD Card Reader | |
| average JPG Copy Test (av. of 3 runs) | |
| Lenovo ThinkPad T15g-20UR000GGE (Toshiba Exceria Pro SDXC 64 GB UHS-II) | |
| Dell Precision 7550 (Toshiba Exceria Pro SDXC 64 GB UHS-II) | |
| HP ZBook Fury 15 G7 (Toshiba Exceria Pro SDXC 64 GB UHS-II) | |
| Average of class Workstation (54.8 - 200, n=16, last 2 years) | |
| SCHENKER XMG Neo 15 Comet Lake (Toshiba Exceria Pro SDXC 64 GB UHS-II) | |
| maximum AS SSD Seq Read Test (1GB) | |
| HP ZBook Fury 15 G7 (Toshiba Exceria Pro SDXC 64 GB UHS-II) | |
| Lenovo ThinkPad T15g-20UR000GGE (Toshiba Exceria Pro SDXC 64 GB UHS-II) | |
| Dell Precision 7550 (Toshiba Exceria Pro SDXC 64 GB UHS-II) | |
| Average of class Workstation (78.6 - 226, n=16, last 2 years) | |
| SCHENKER XMG Neo 15 Comet Lake (Toshiba Exceria Pro SDXC 64 GB UHS-II) | |
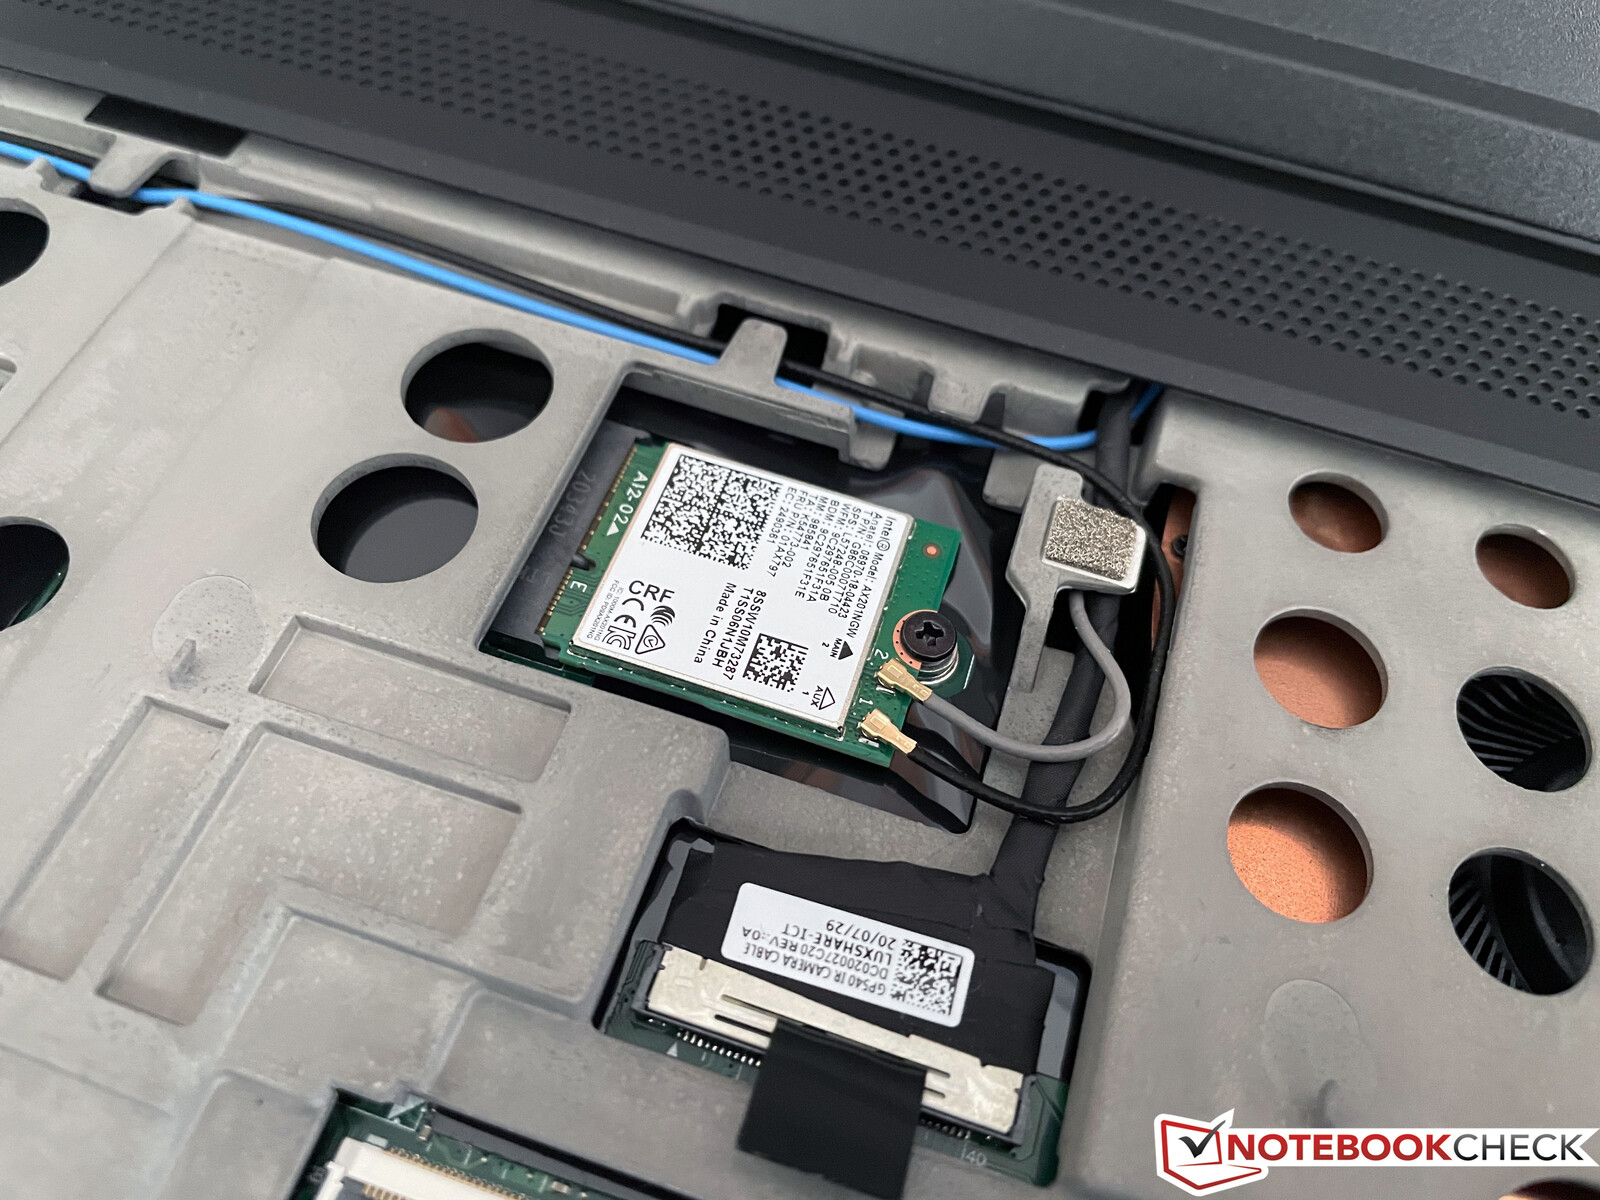
Communication - Wi-Fi 6 and WWAN-ready
The ThinkPad T15g is equipped with Intel's AX201 module with Wi-Fi 6 support. The transfer rates in our test with the router Netgear Nighthawk RAX120 are very good. It is also WWAN ready since the necessary antennas are already implemented.
Webcam
")
")
Security
A look at the security features also shows that the ThinkPad T15g is a mobile workstation. In addition to common features like the TPM module and the fingerprint scanner, our review unit is also equipped with a SmartCard reader.
Maintenance
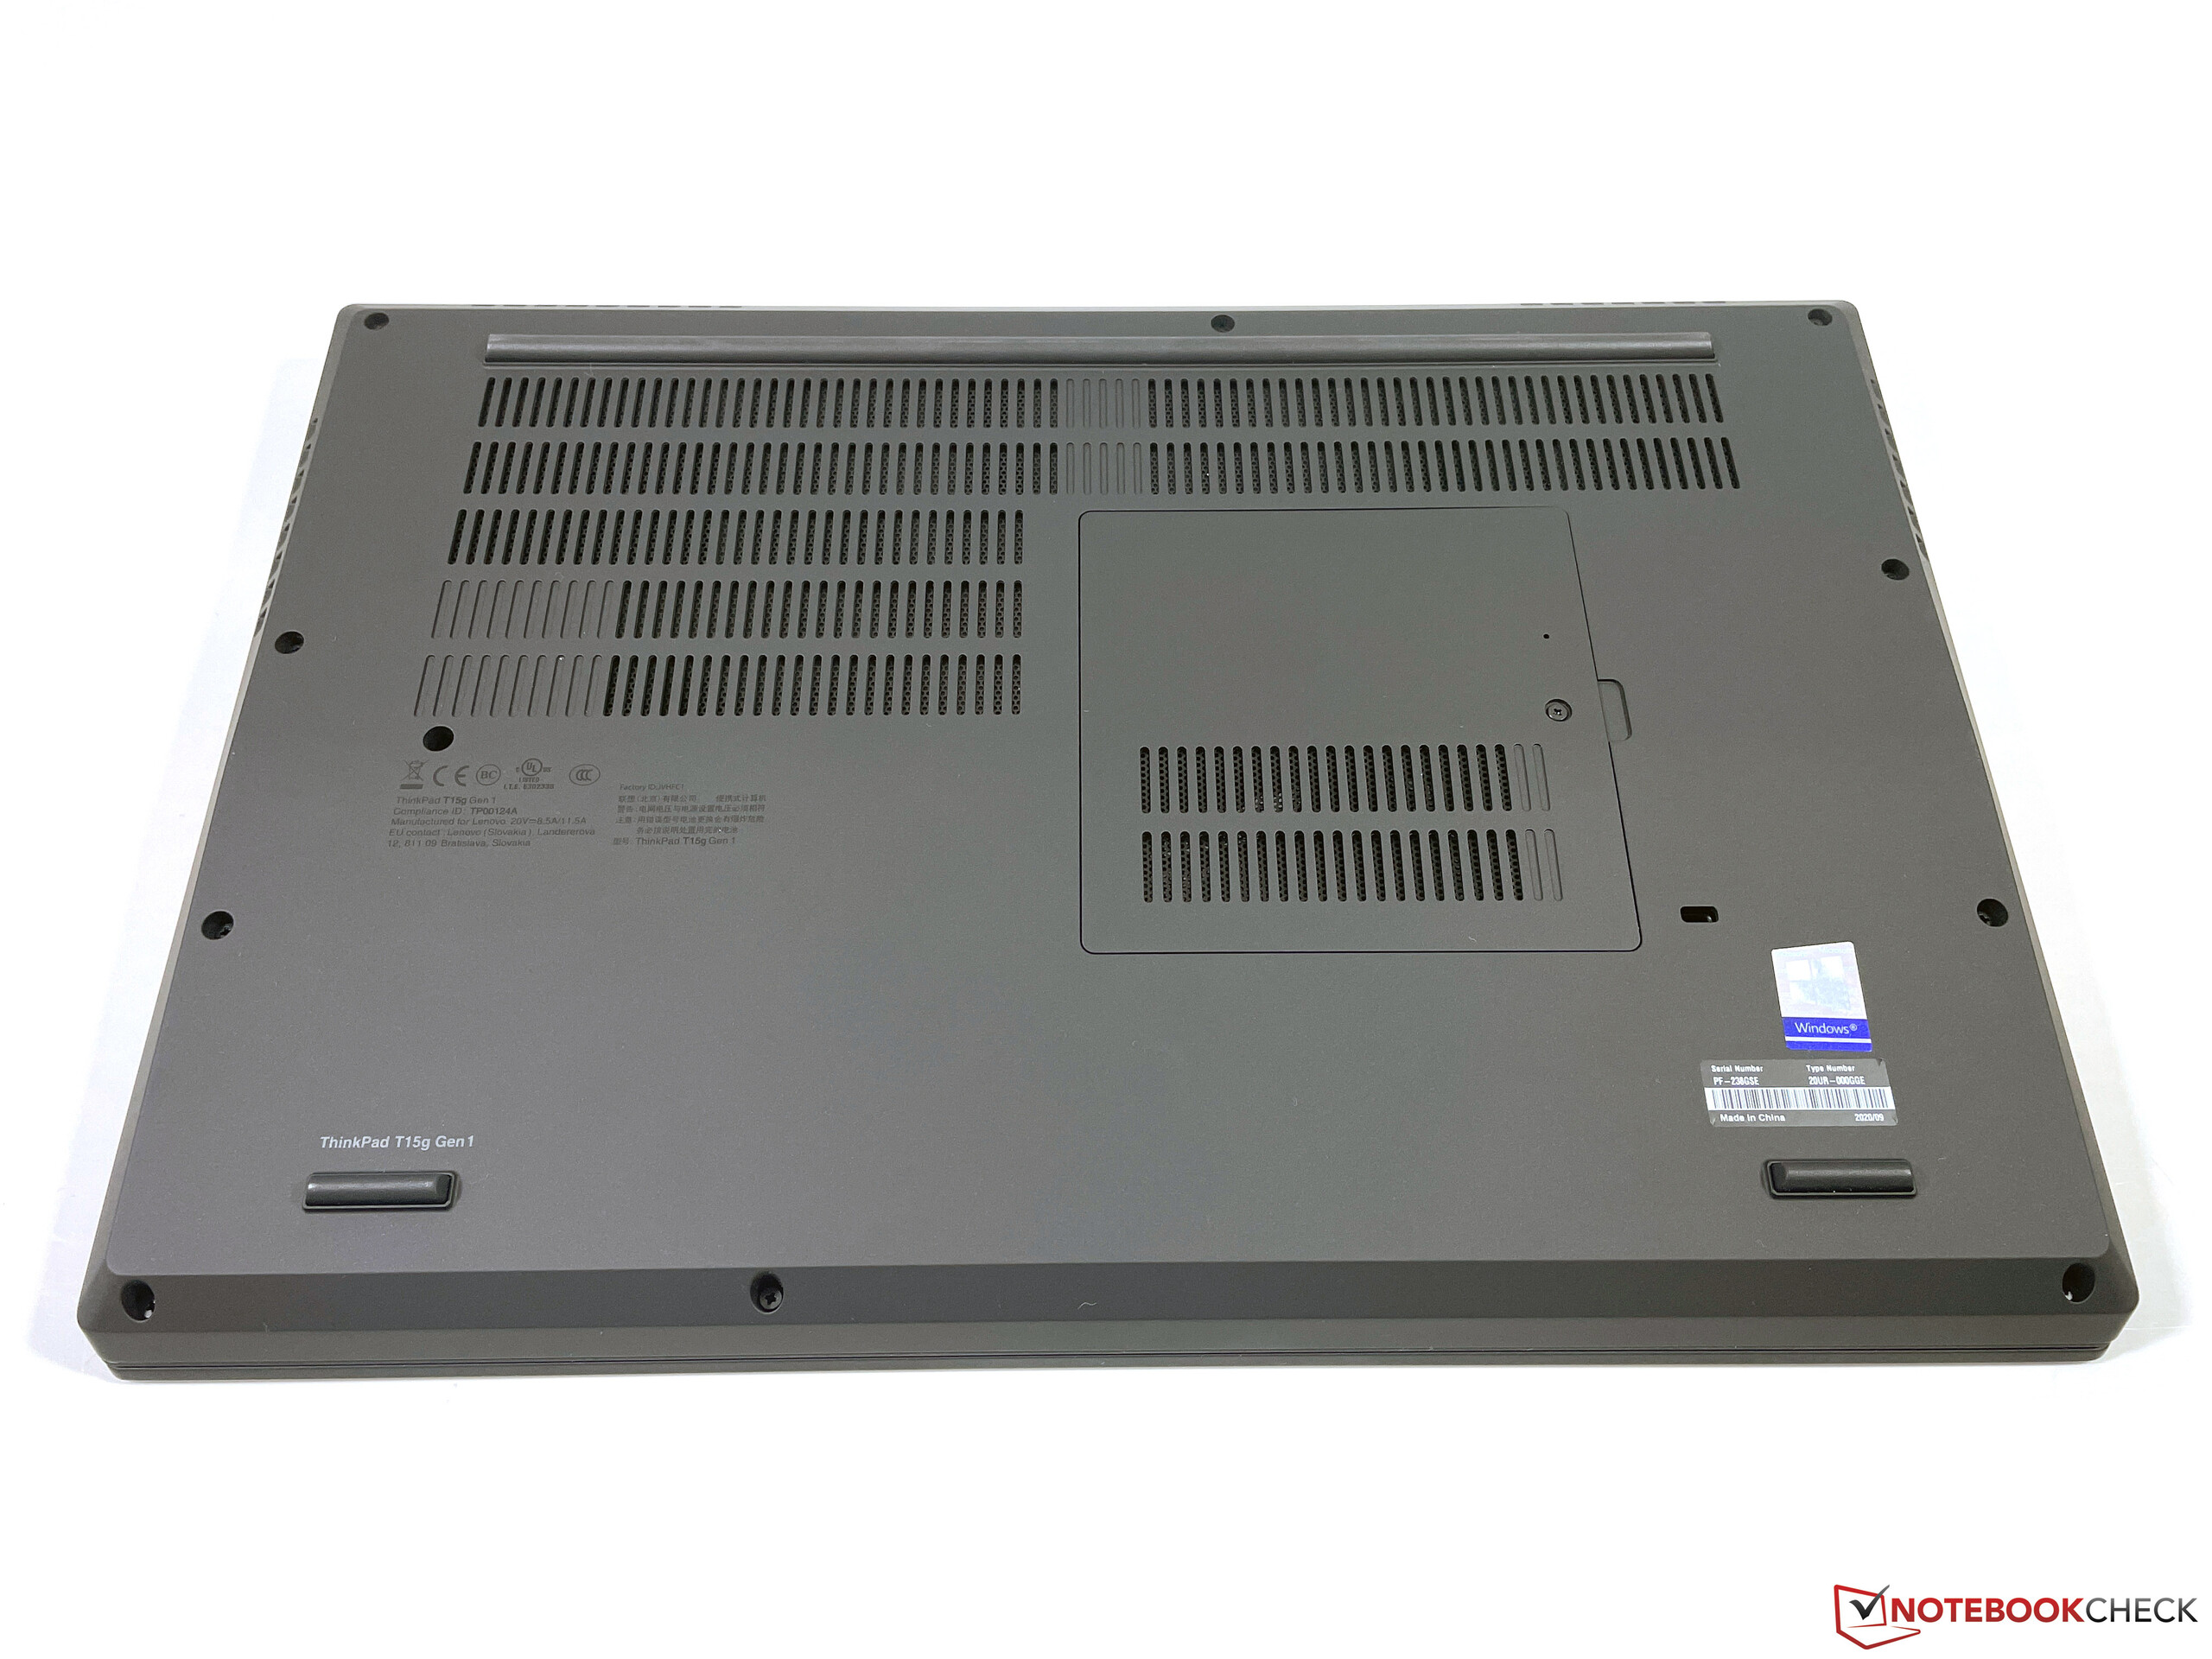
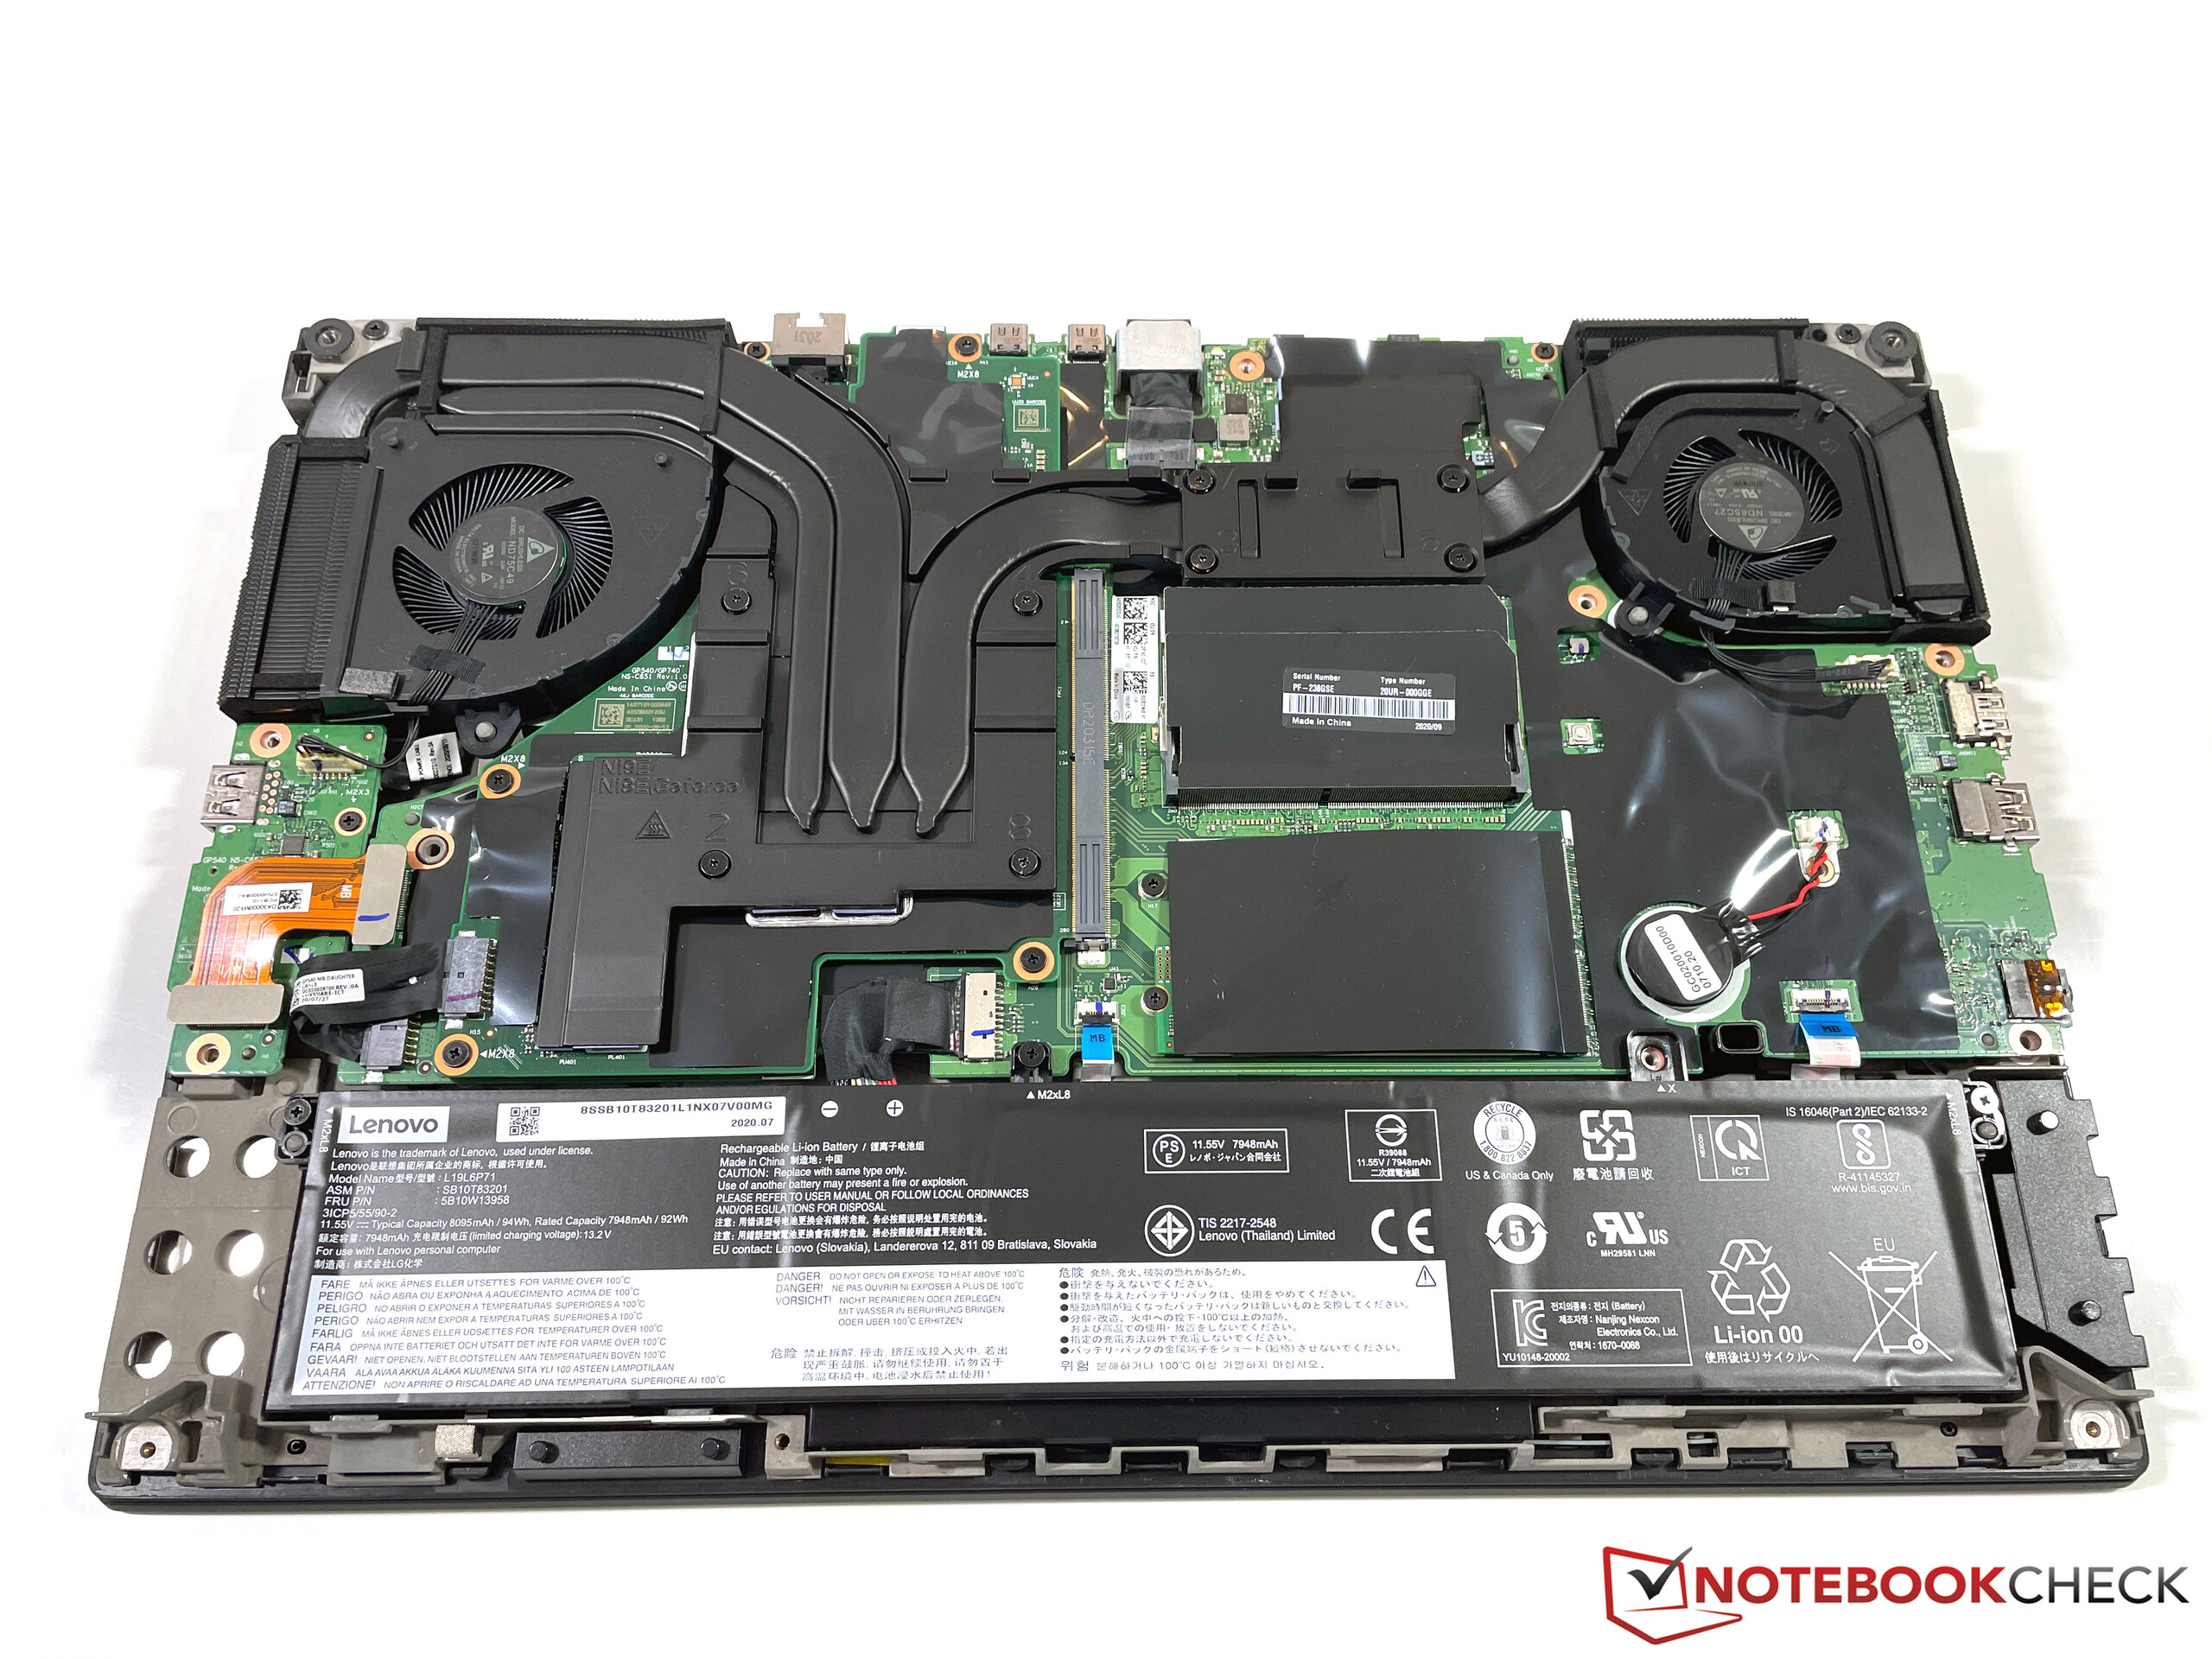
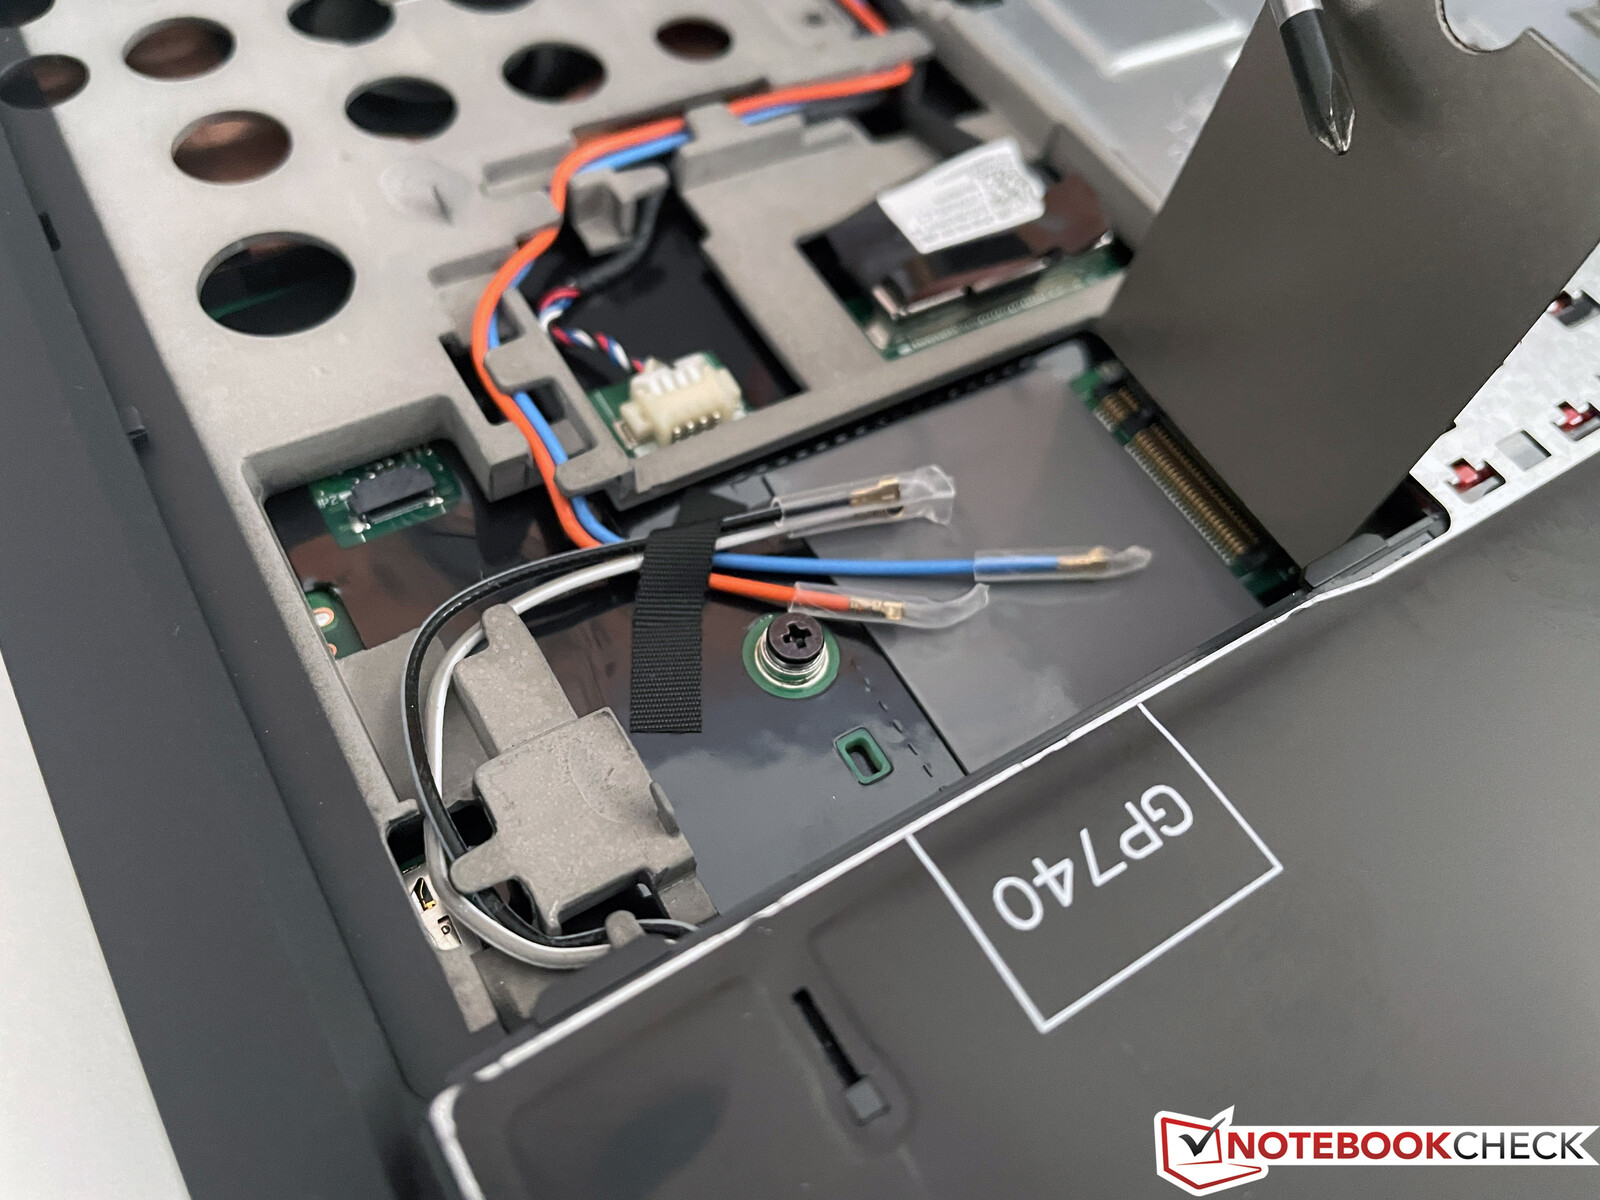
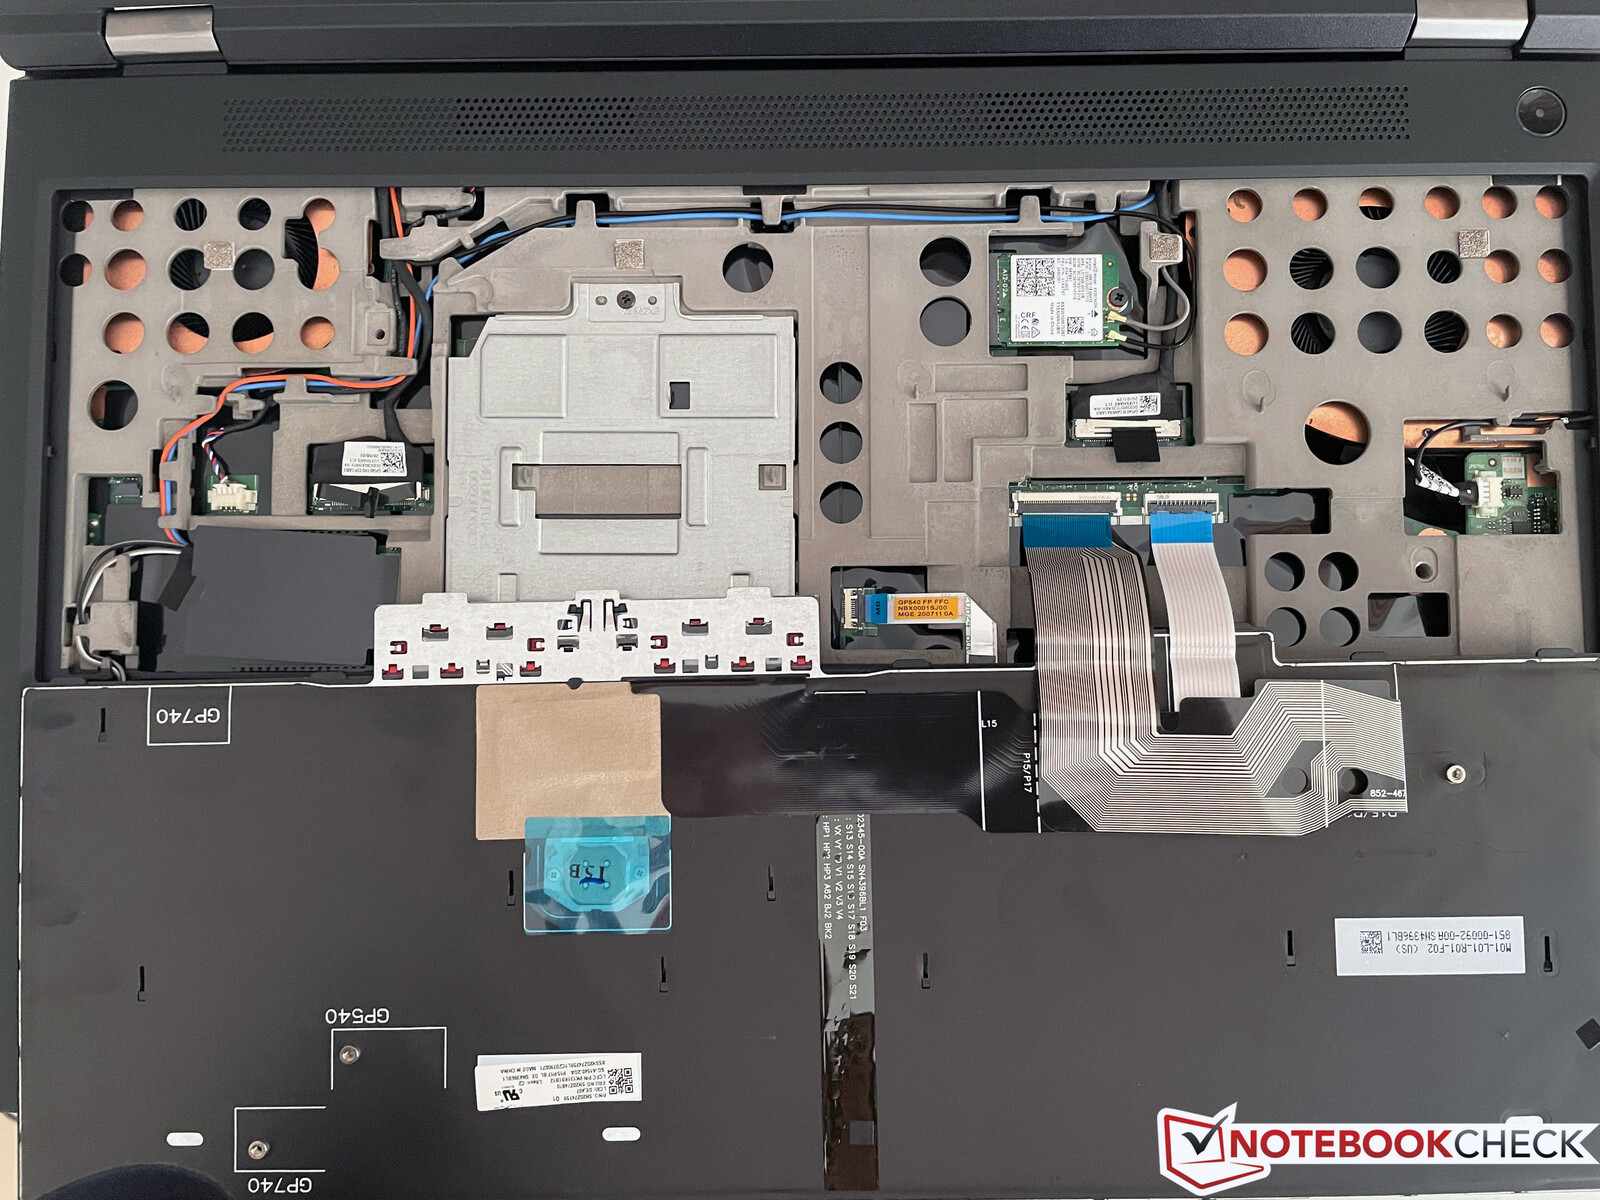
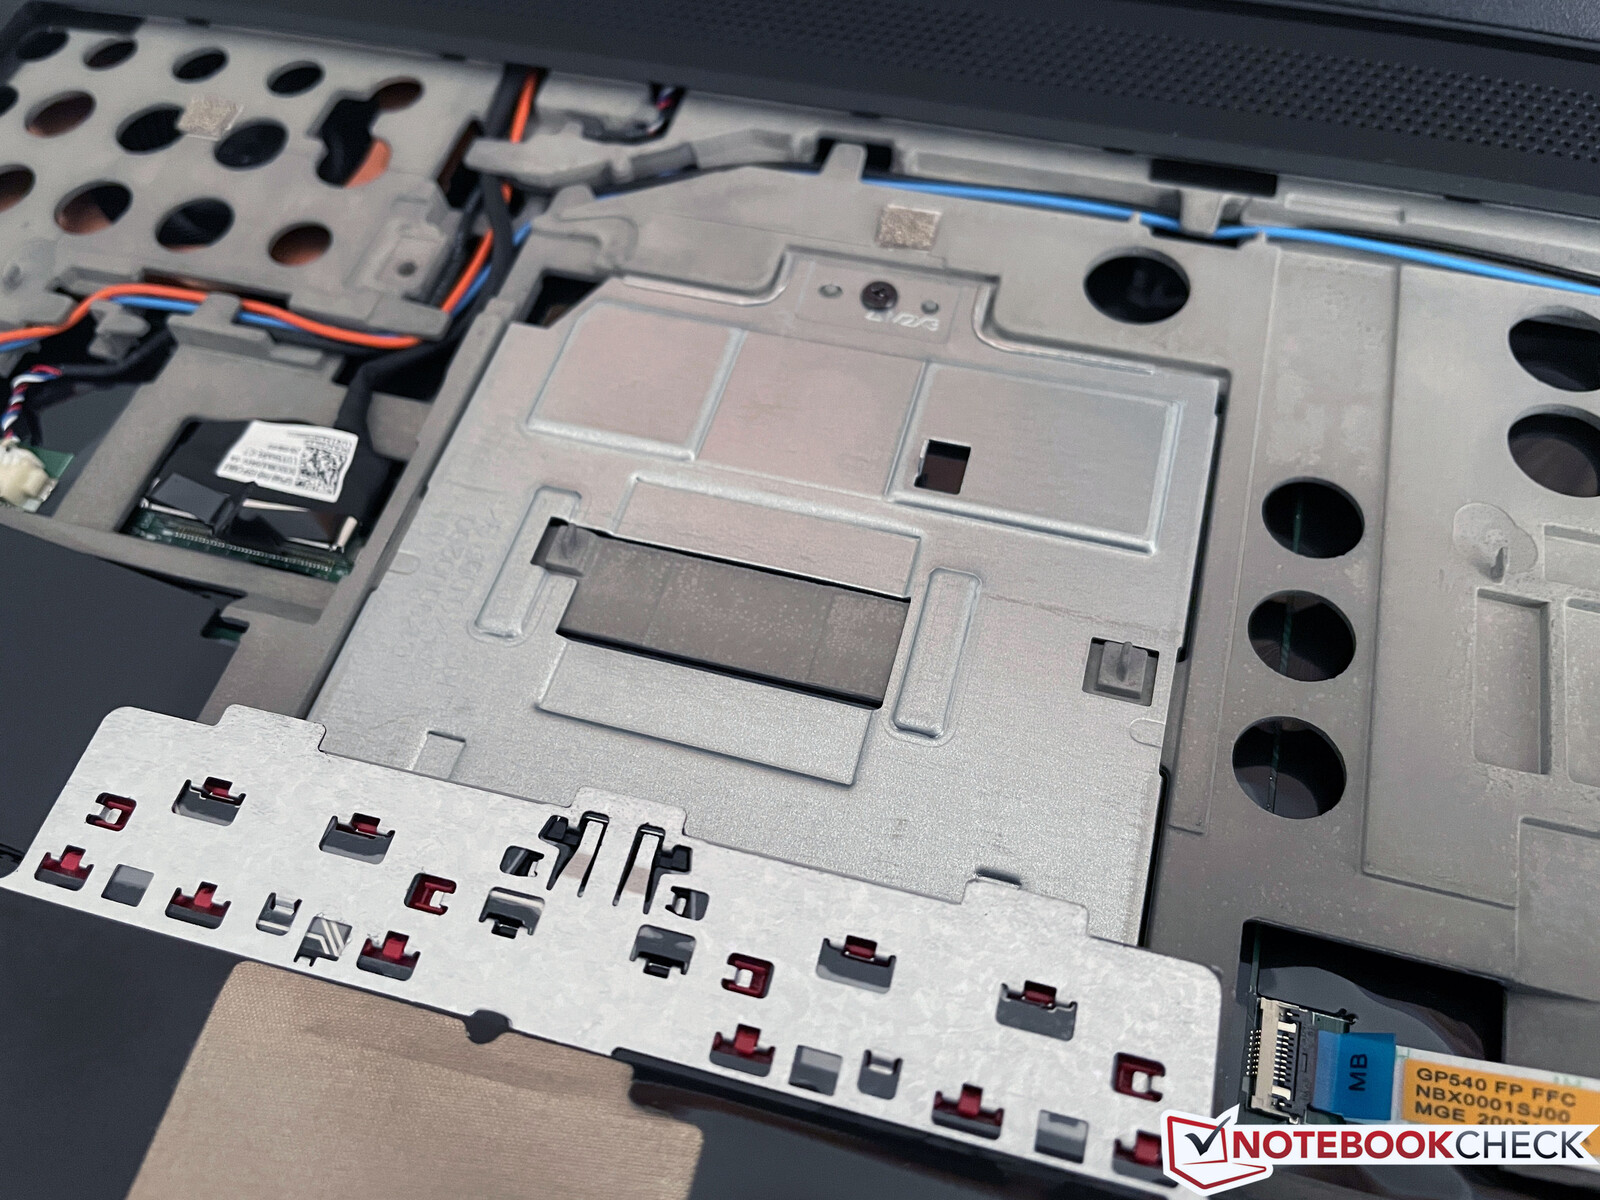
There is a maintenance hatch at the bottom, which is only secured by a single Philips screw. It reveals two M.2-2280 slots for SSDs and two of the four memory slots, so an expansion is very simple. The other two memory slots (under an additional cover), and the optional WWAN module (antennas are prepared) are sitting underneath the keyboard, which is very simple. We recommend Lenovo's Hardware Maintenance Manual, where all the necessary steps are described.

Input Devices - Keyboard with weaknesses
Keyboard
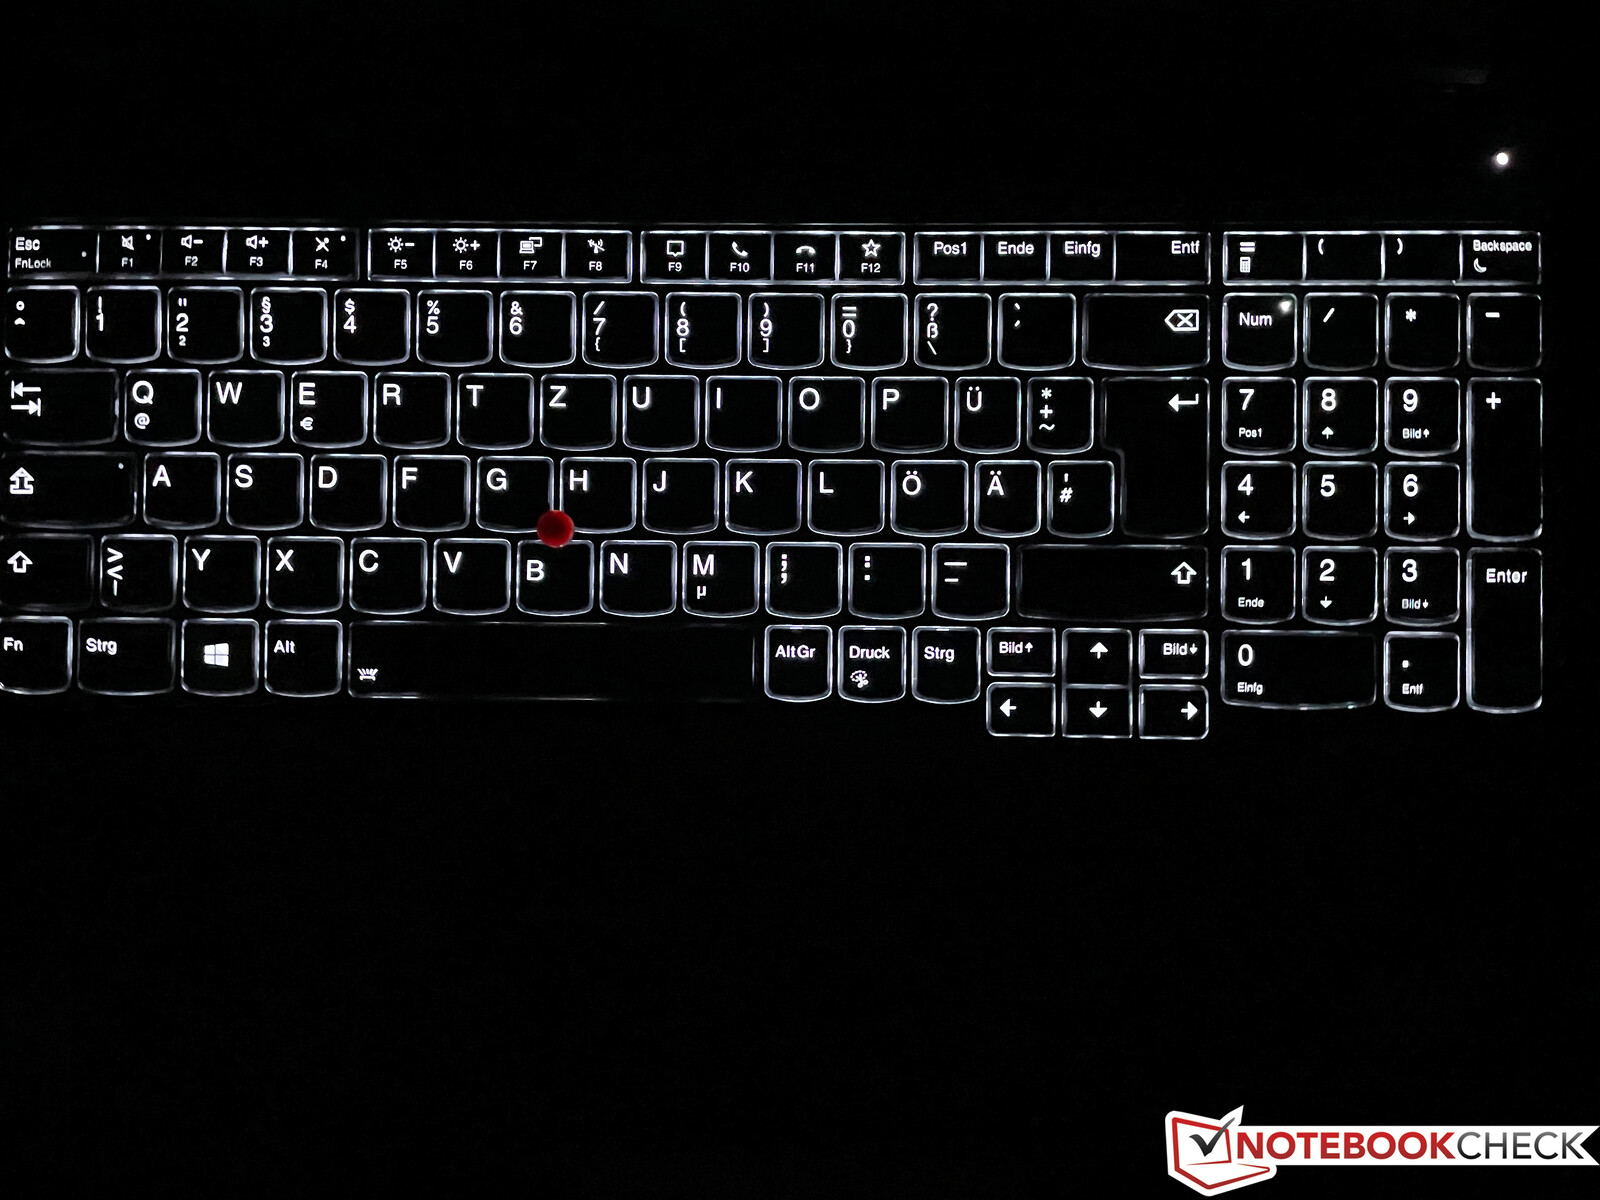
We can keep it short in this section because the keyboard is basically identical compared to the ThinkPad P53. It offers 1.8 mm key travel and a very rich typing experience, so it is great for longer texts. The only problem is the lower left corner of the keyboard, which is a it clattery. We noticed the same issue on our review unit of the ThinkPad P15, so it seems to be a general issue. The keyboard offers a two-stage white background illumination.
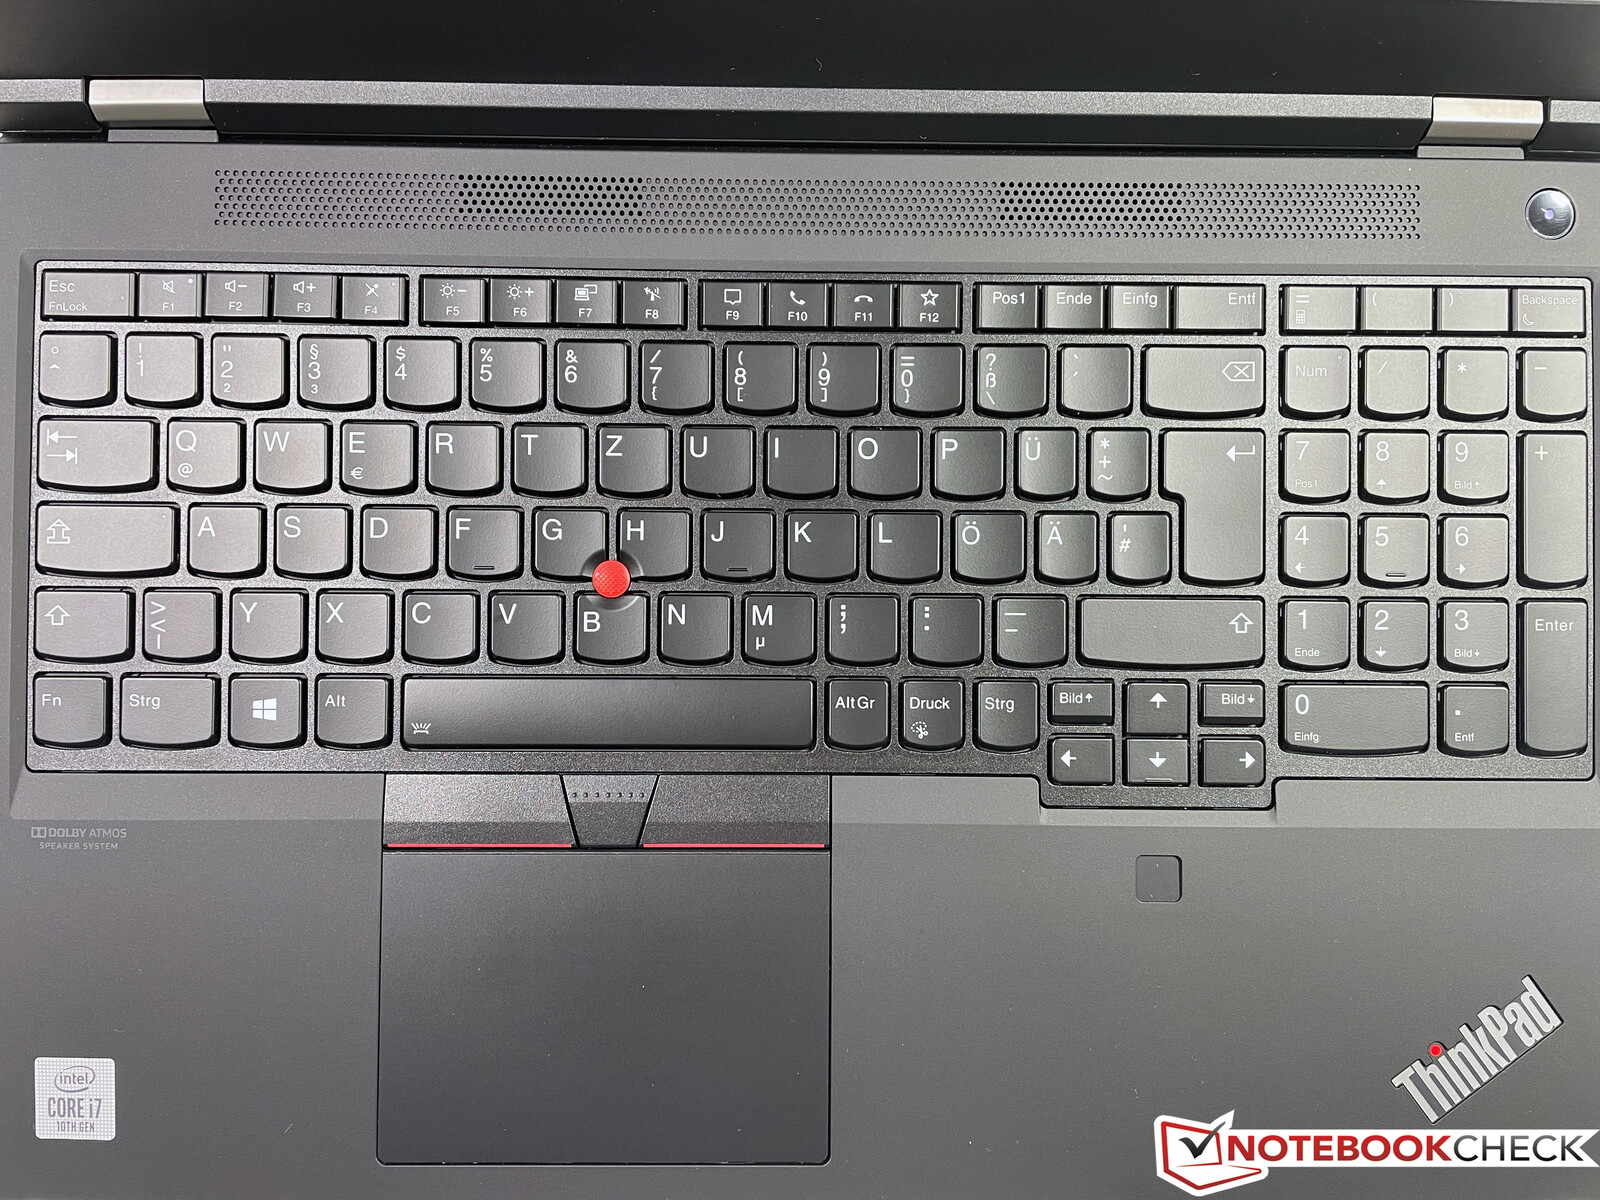
Touchpad & TrackPoint
You can use both the touchpad as well as the Trackpoint and its dedicated buttons for cursor movements. The touchpad size is sufficient for gestures with up to four fingers and we did not notice any problems. The dedicated mouse buttons could have a slightly richer key stroke. Compared to the previous model, the dedicated mouse buttons for the touchpad were removed.
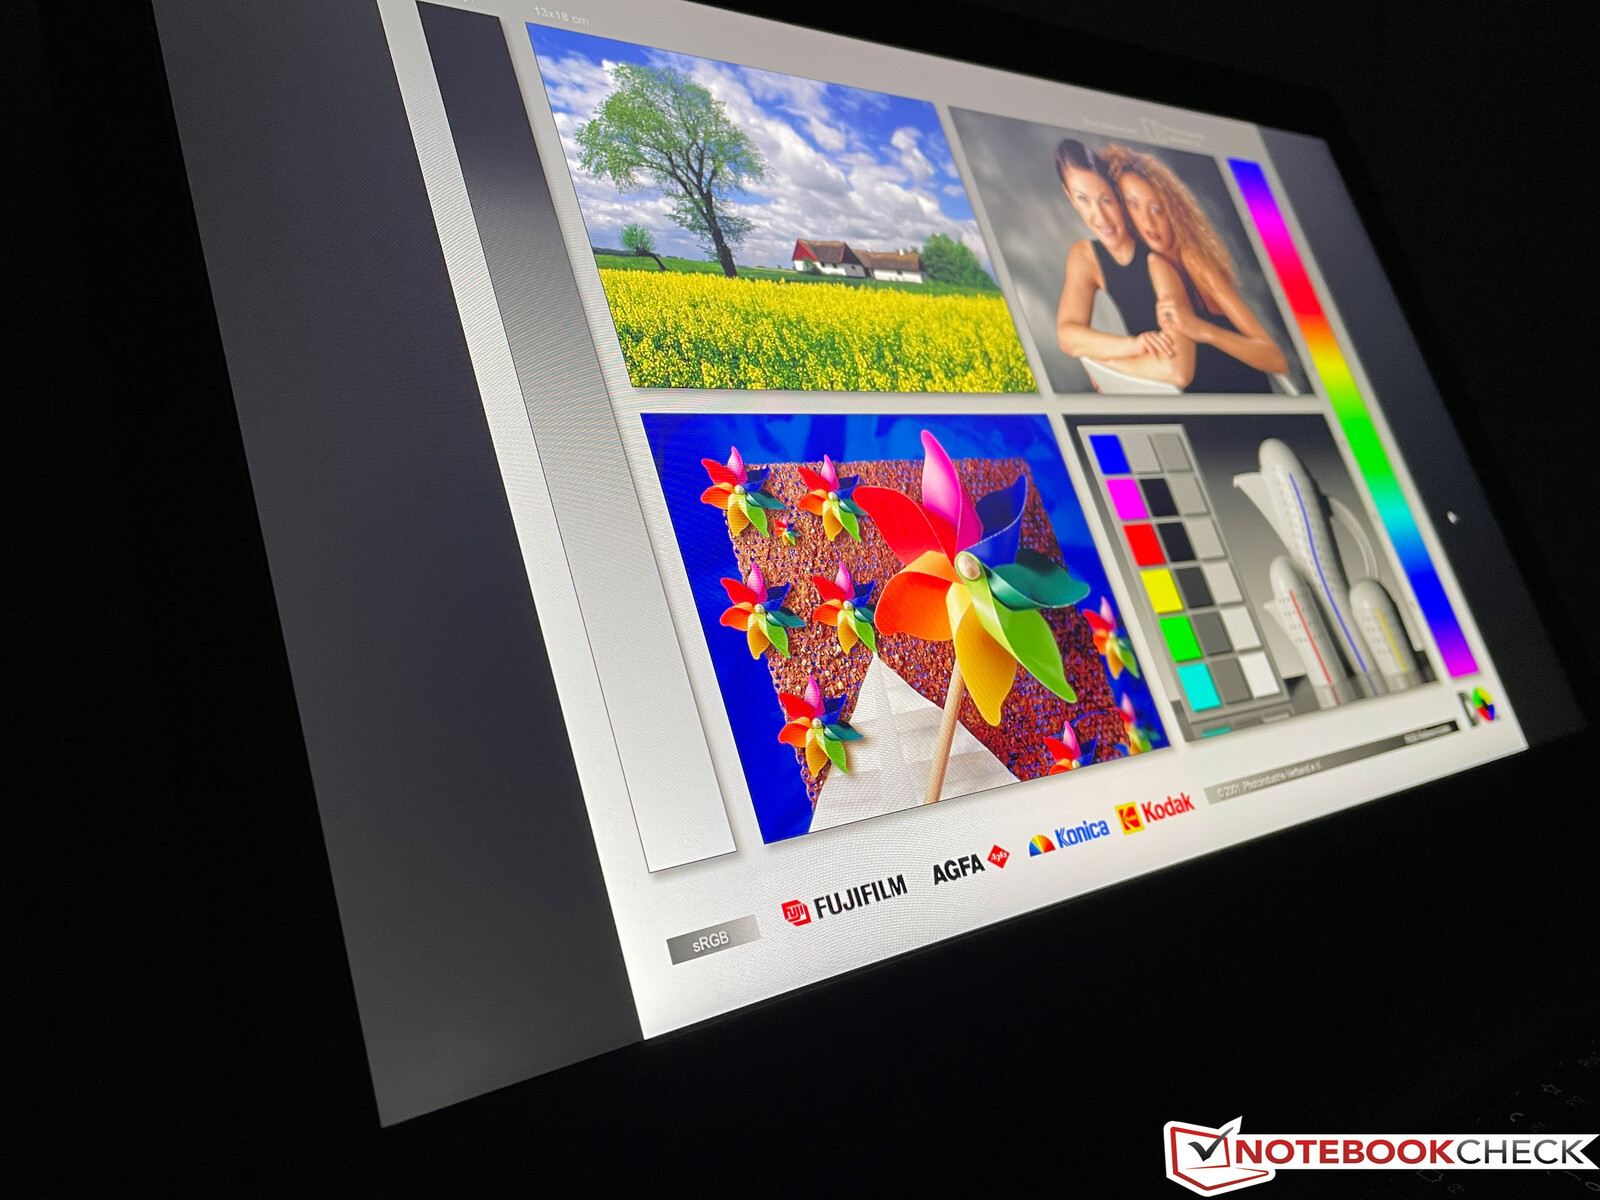
Display - ThinkPad mit HDR400

Lenovo uses a 15.6-inch IPS panel with the 1080p resolution (1920 x 1080 pixels). The subjective picture impression is good, but bright areas appear a bit grainy. The manufacturer advertises a brightness of 500 cd/m², but we can only confirm this value in the center of the screen. The other results a re a bit lower, which results in an average brightness of ~475 cd/m². The black value is still okay at 0.34 cd/m², which results in a very good contrast ratio of almost 1500:1.
The response times are okay for an IPS screen, but this once again shows this is not a dedicated gaming laptops. PWM flickering is detectable at brightness levels of 50% or lower, but the frequency is very high at 26 kHz an should not cause any issues. You can see backlight bleeding on dark backgrounds and high brightness levels.
| |||||||||||||||||||||||||
Brightness Distribution: 90 %
Center on Battery: 503 cd/m²
Contrast: 1482:1 (Black: 0.34 cd/m²)
ΔE Color 2.9 | 0.5-29.43 Ø5, calibrated: 1.3
ΔE Greyscale 4.3 | 0.57-98 Ø5.3
90.8% sRGB (Argyll 1.6.3 3D)
57.7% AdobeRGB 1998 (Argyll 1.6.3 3D)
62.3% AdobeRGB 1998 (Argyll 2.2.0 3D)
90.5% sRGB (Argyll 2.2.0 3D)
61.3% Display P3 (Argyll 2.2.0 3D)
Gamma: 2.25
| Lenovo ThinkPad T15g-20UR000GGE N156HCE-GN1, IPS, 1920x1080, 15.60 | Dell Precision 7550 AU Optronics B156ZAN, IPS, 3840x2160, 15.60 | HP ZBook Fury 15 G7 LG Philips LGD0661, IPS, 3840x2160, 15.60 | SCHENKER XMG Neo 15 Comet Lake IPS, 1920x1080, 15.60 | |
|---|---|---|---|---|
| Display | 33% | 34% | 11% | |
| Display P3 Coverage | 61.3 | 82.1 34% | 95.6 56% | 69.5 13% 67.9 11% |
| sRGB Coverage | 90.5 | 99.6 10% | 99.8 10% | 99.2 10% 98.7 9% |
| AdobeRGB 1998 Coverage | 62.3 | 96.8 55% | 84.5 36% | 70.7 13% 68.8 10% |
| Response Times | -69% | -81% | 30% | |
| Response Time Grey 50% / Grey 80% * | 38 ? | 51.2 ? -35% | 56 ? -47% | 15.2 ? 60% |
| Response Time Black / White * | 16.8 ? | 34 ? -102% | 36 ? -114% | 10.4 ? 38% |
| PWM Frequency | 26040 ? | 23580 ? -9% | ||
| Screen | -28% | -9% | -4% | |
| Brightness middle | 504 | 473.5 -6% | 672.8 33% | 308 -39% |
| Brightness | 476 | 461 -3% | 674 42% | 284 -40% |
| Brightness Distribution | 90 | 90 0% | 89 -1% | 87 -3% |
| Black Level * | 0.34 | 0.55 -62% | 0.5 -47% | 0.32 6% |
| Contrast | 1482 | 861 -42% | 1346 -9% | 963 -35% |
| Colorchecker dE 2000 * | 2.9 | 4.8 -66% | 3.48 -20% | 2.45 16% |
| Colorchecker dE 2000 max. * | 7.1 | 8.73 -23% | 9.44 -33% | 7.74 -9% |
| Colorchecker dE 2000 calibrated * | 1.3 | 3.08 -137% | 3.03 -133% | 0.83 36% |
| Greyscale dE 2000 * | 4.3 | 5.6 -30% | 3.1 28% | 3.9 9% |
| Gamma | 2.25 98% | 2.34 94% | 2.04 108% | 2.211 100% |
| CCT | 7265 89% | 7549 86% | 6380 102% | 7434 87% |
| Color Space (Percent of AdobeRGB 1998) | 57.7 | 86.4 50% | 75.2 30% | 69 20% |
| Color Space (Percent of sRGB) | 90.8 | 99.7 10% | 100 10% | 91 0% |
| Total Average (Program / Settings) | -21% /
-22% | -19% /
-10% | 12% /
6% |
* ... smaller is better
The calibration is not perfect ex-works. Our analysis with the professional CalMAN software and the X-Rite i1 Pro 2 spectrophotometer shows a slight blue cast in combination with a slightly too cool color temperature. Some of the colors also have a deviation >3.
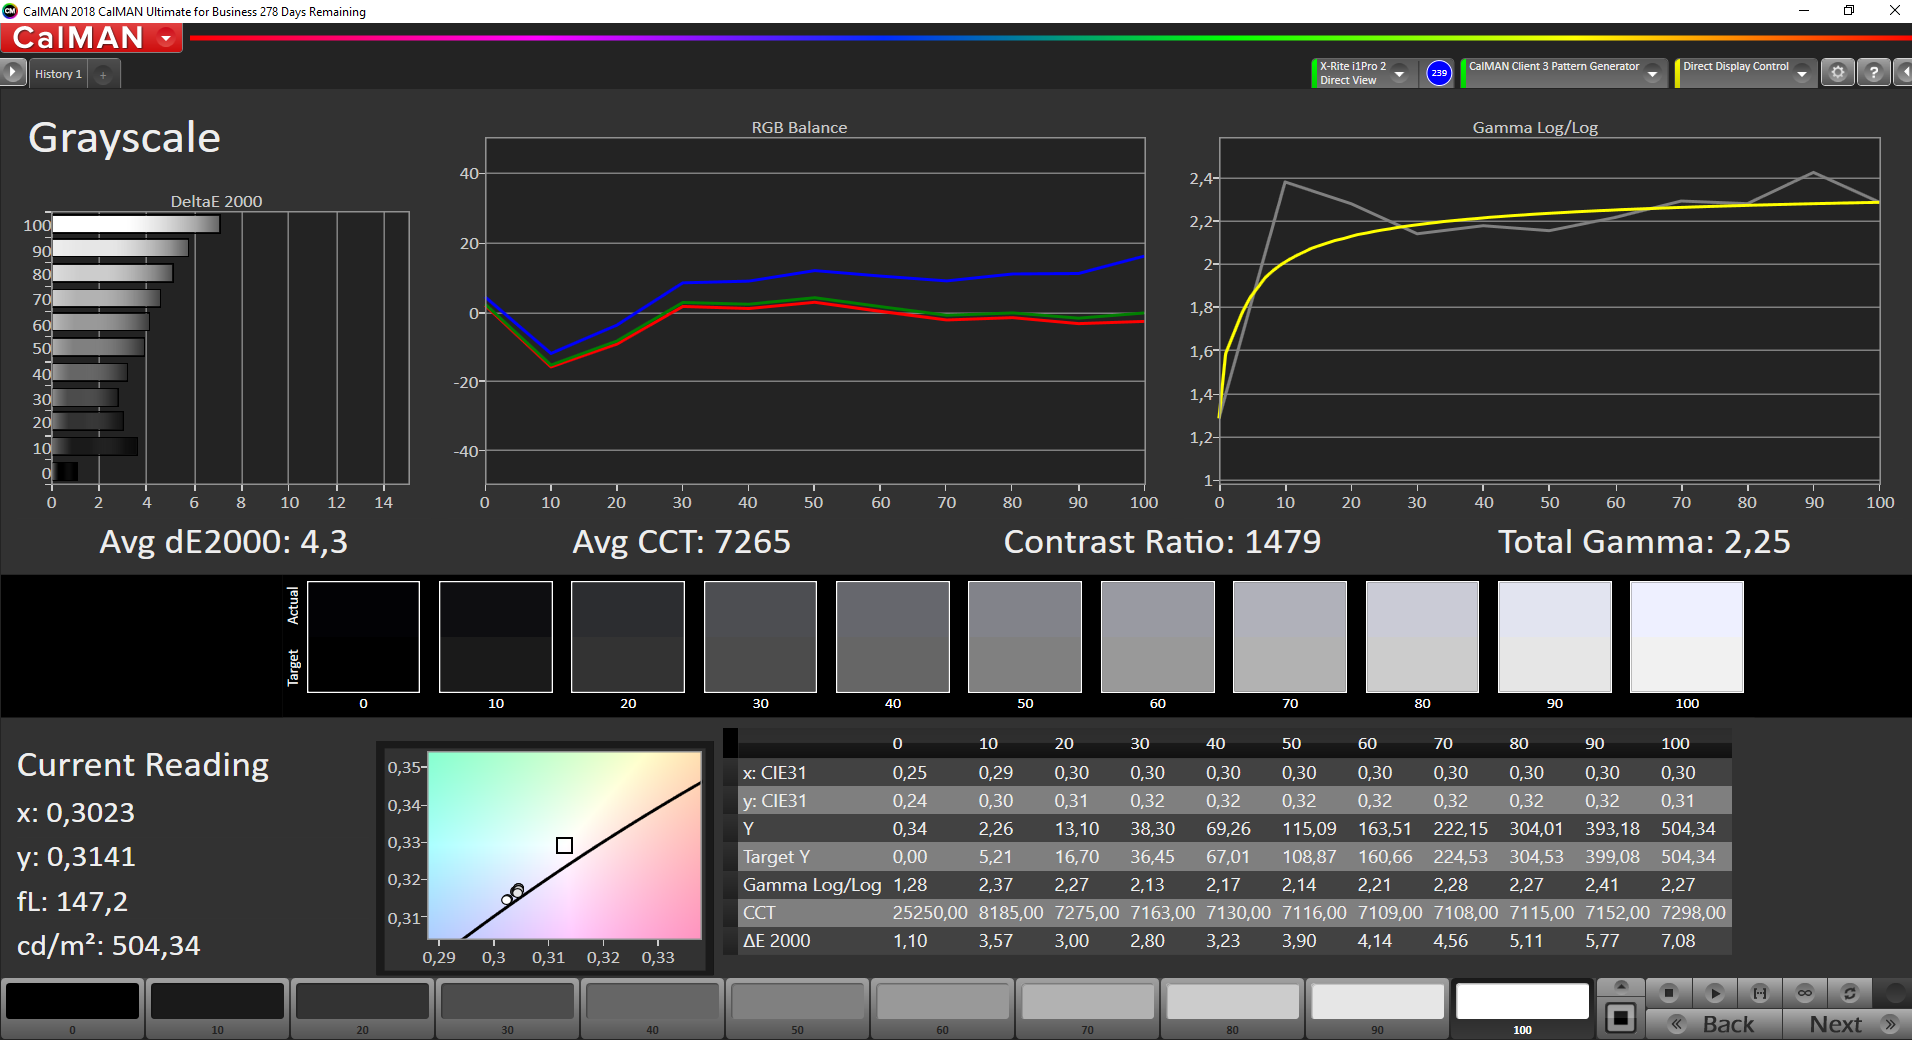
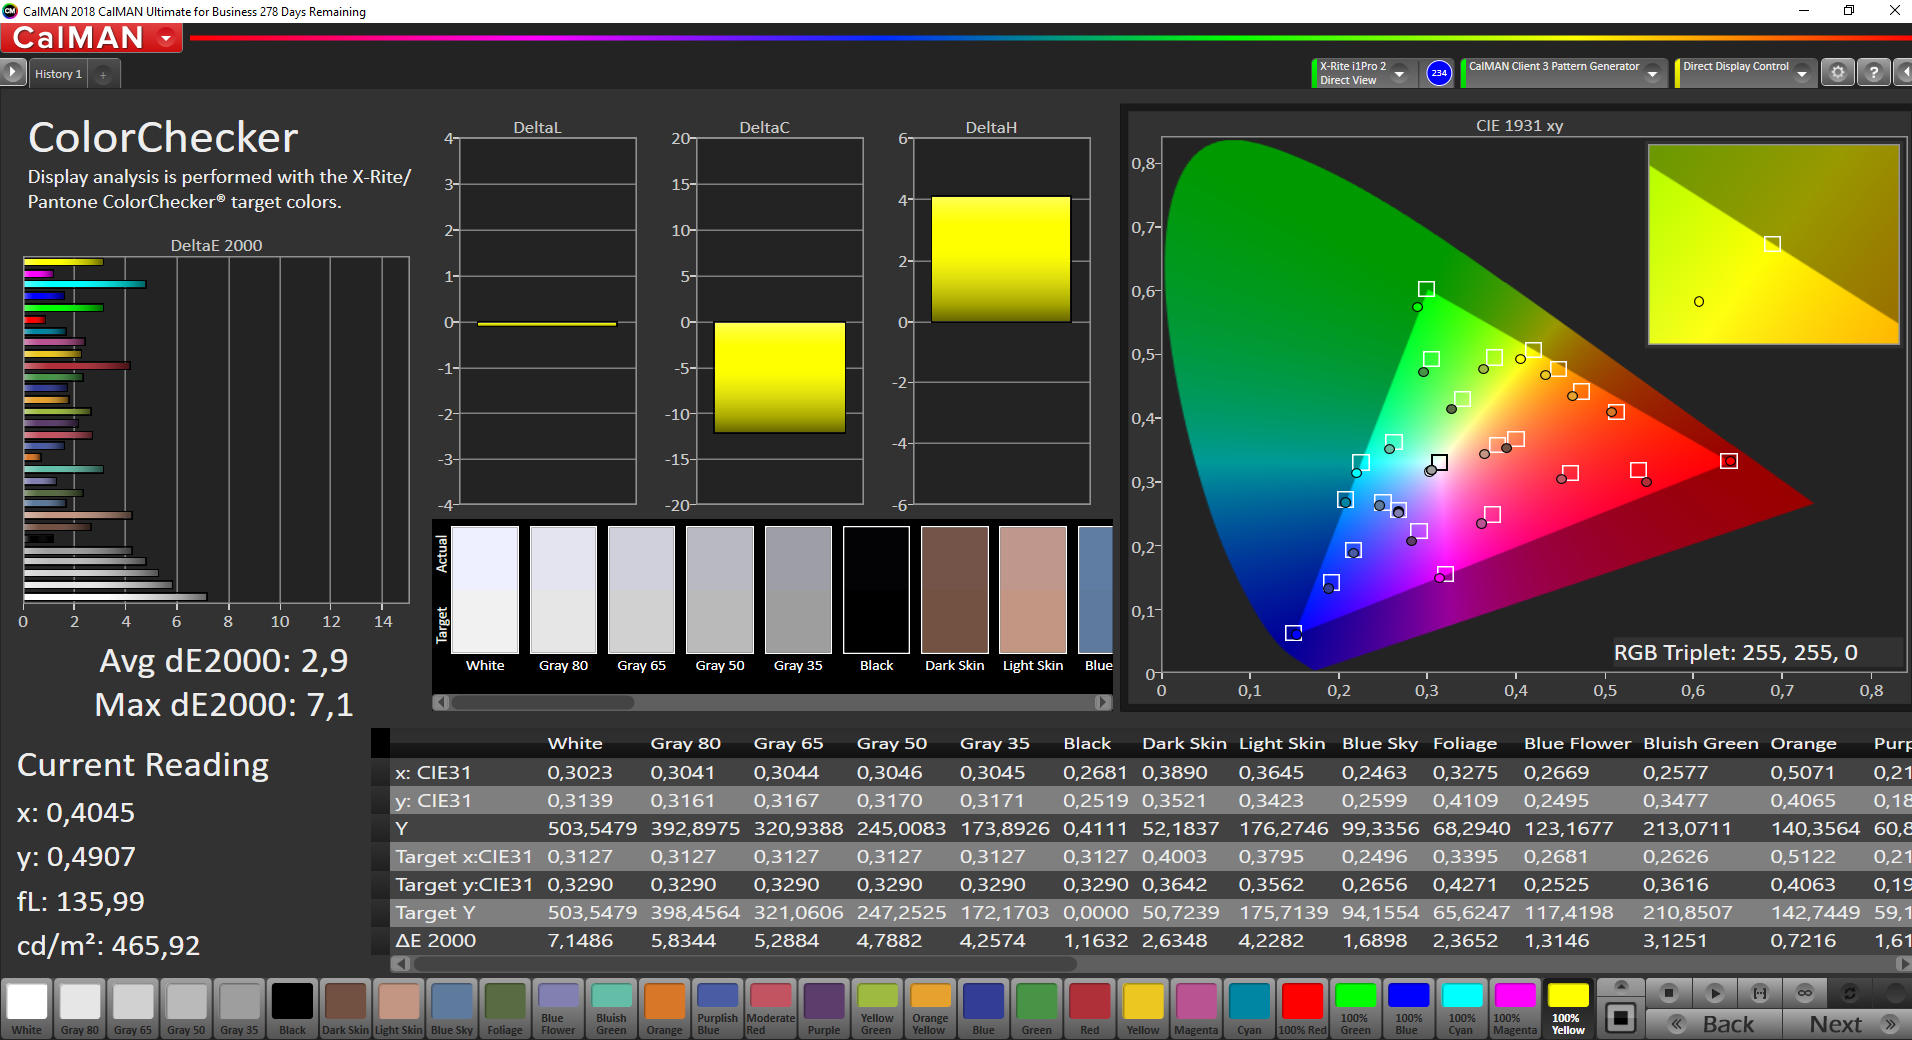
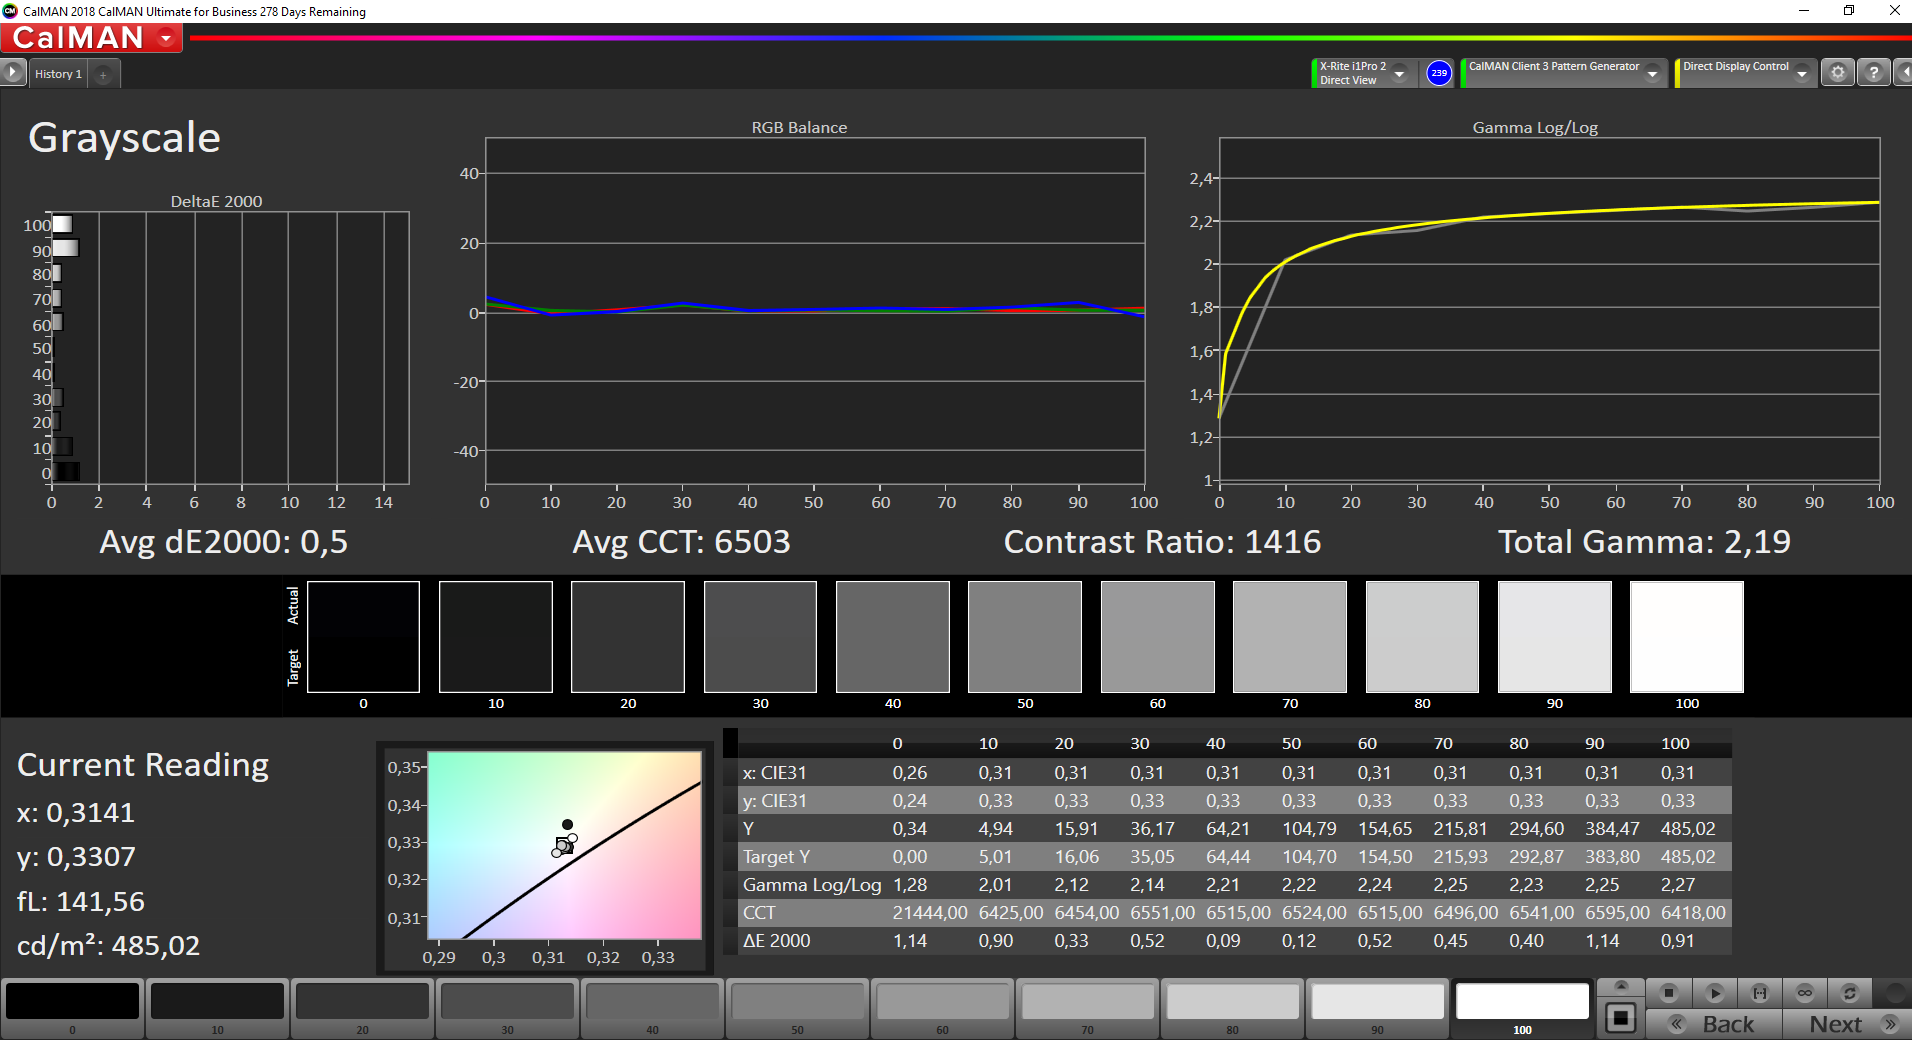
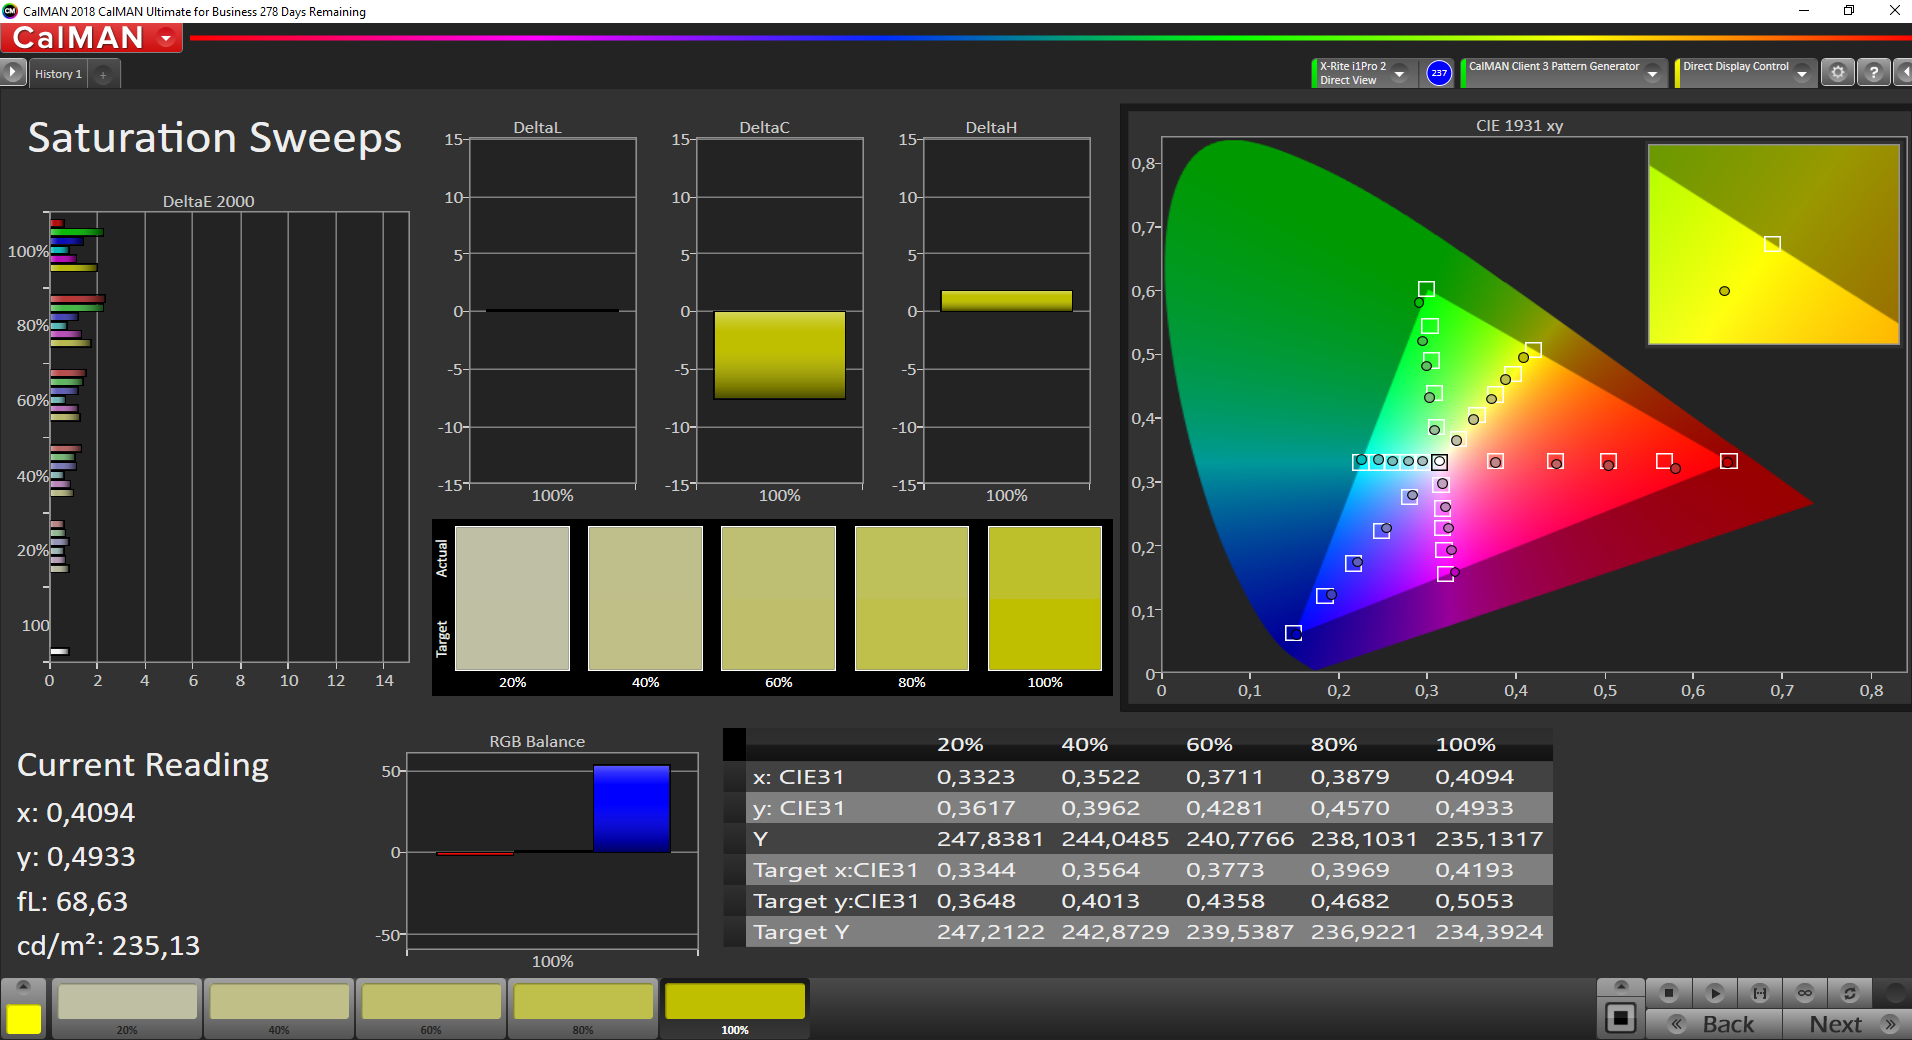
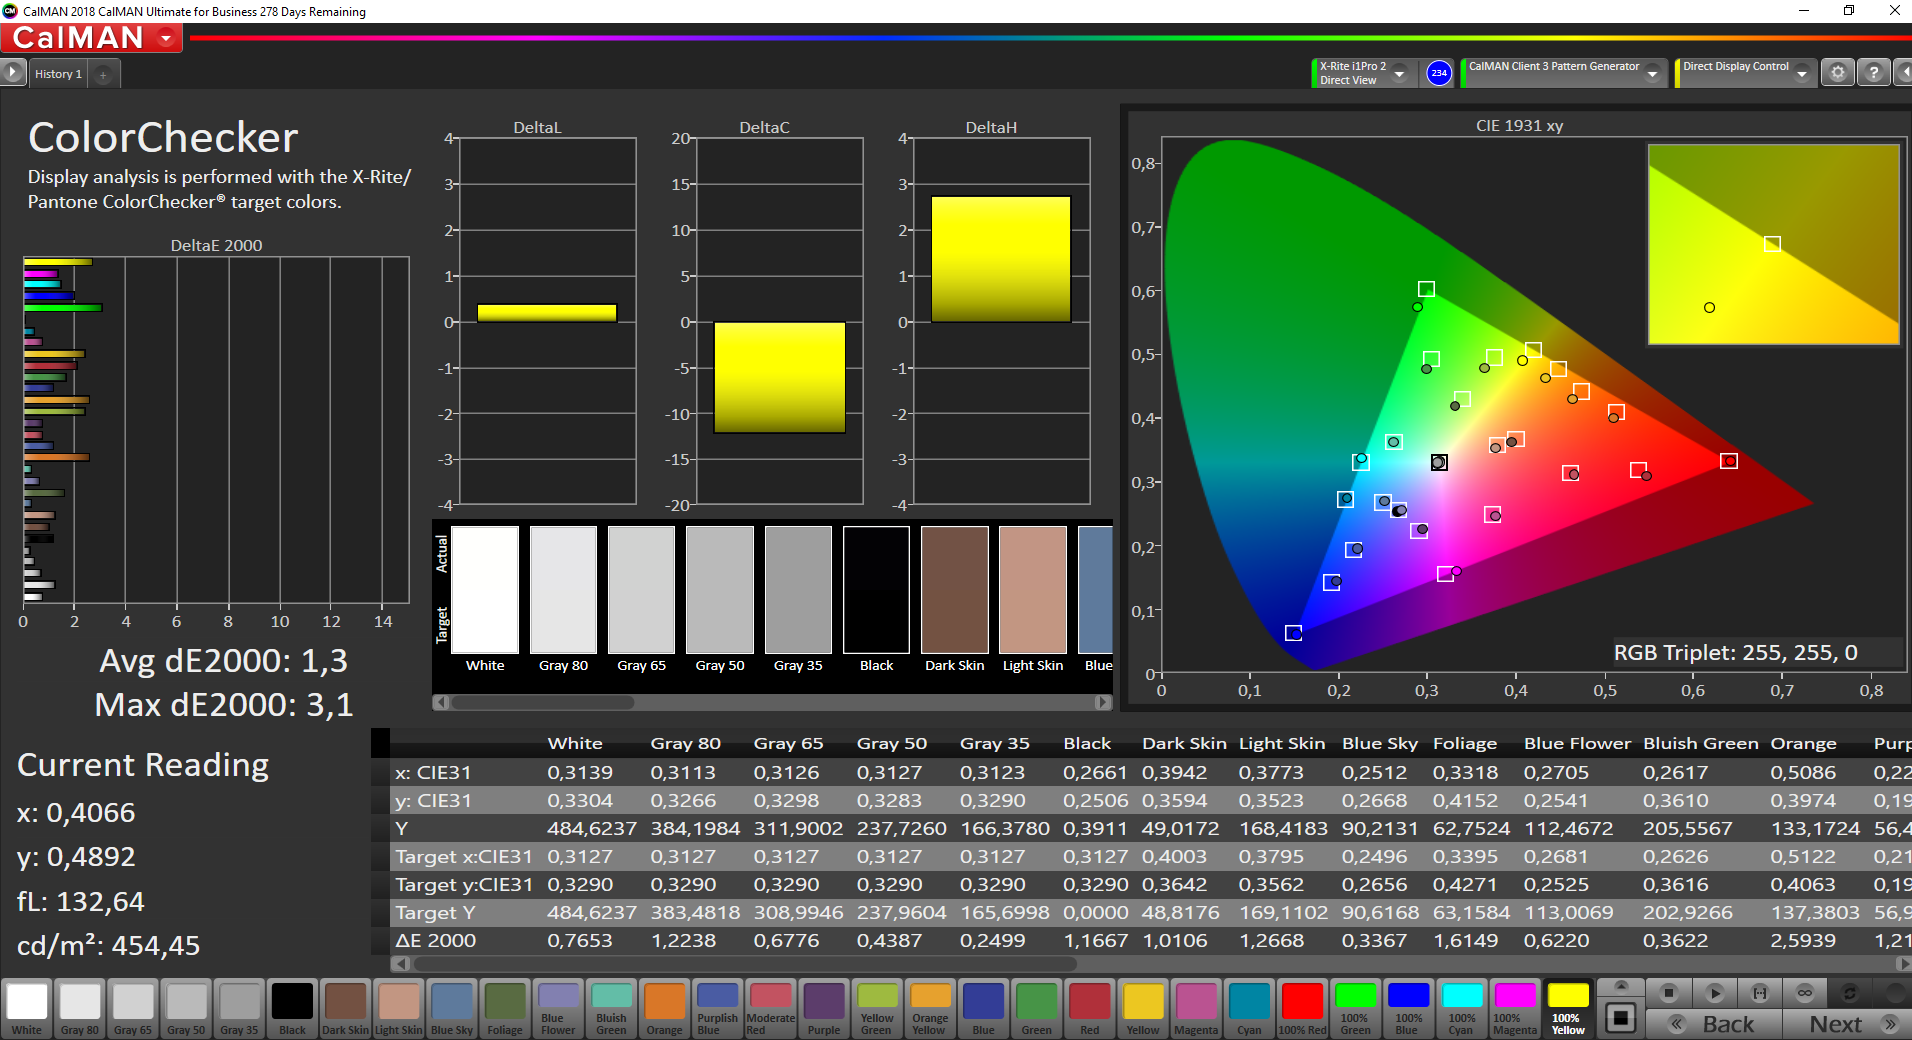
The performance is much better after our calibration. The blue cast is gone and the maximum brightness only dropped a bit. The color performance improved as well and only one value is above 3. This means the panel is basically capable of picture/video editing, but the sRGB color gamut is not fully covered.
Display Response Times
| ↔ Response Time Black to White | ||
|---|---|---|
| 16.8 ms ... rise ↗ and fall ↘ combined | ↗ 6 ms rise | 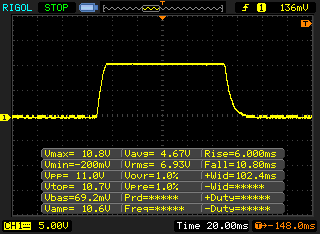 |
| ↘ 10.8 ms fall | ||
| The screen shows good response rates in our tests, but may be too slow for competitive gamers. In comparison, all tested devices range from 0.1 (minimum) to 240 (maximum) ms. » 33 % of all devices are better. This means that the measured response time is better than the average of all tested devices (21.5 ms). | ||
| ↔ Response Time 50% Grey to 80% Grey | ||
| 38 ms ... rise ↗ and fall ↘ combined | ↗ 18.4 ms rise | 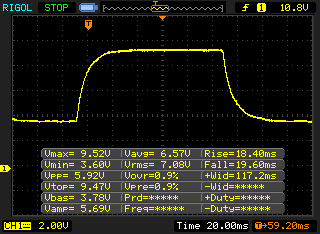 |
| ↘ 19.6 ms fall | ||
| The screen shows slow response rates in our tests and will be unsatisfactory for gamers. In comparison, all tested devices range from 0.2 (minimum) to 636 (maximum) ms. » 49 % of all devices are better. This means that the measured response time is worse than the average of all tested devices (33.7 ms). | ||
Screen Flickering / PWM (Pulse-Width Modulation)
| Screen flickering / PWM detected | 26040 Hz | ≤ 50 % brightness setting | 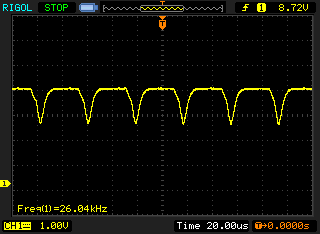 |
The display backlight flickers at 26040 Hz (worst case, e.g., utilizing PWM) Flickering detected at a brightness setting of 50 % and below. There should be no flickering or PWM above this brightness setting. The frequency of 26040 Hz is quite high, so most users sensitive to PWM should not notice any flickering. In comparison: 53 % of all tested devices do not use PWM to dim the display. If PWM was detected, an average of 17900 (minimum: 5 - maximum: 3846000) Hz was measured. | |||
Thanks to the matte surface and the good brightness, you can use the T15g comfortably outdoors as long as you avoid direct reflections from light sources. There is no criticism for the viewing angle stability of the IPS panel.
Performance - ThinkPad with Core i7 and a lot of RAM
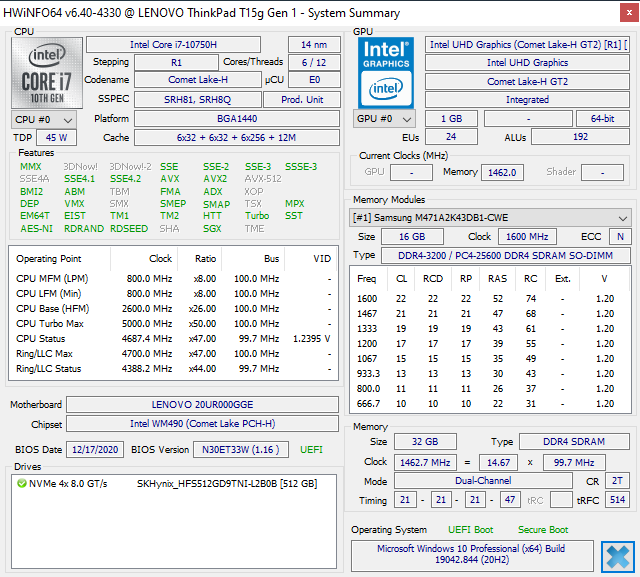
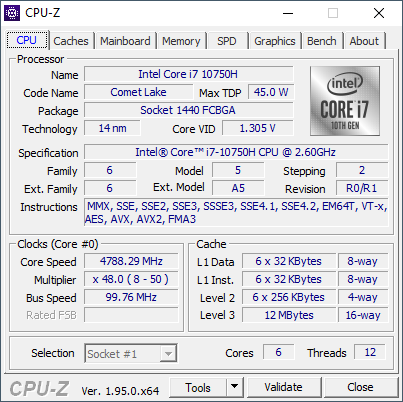
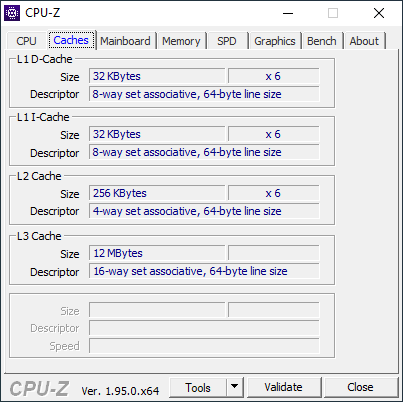
Processor - Core i7-10750H with 6 cores
You still get the familiar Intel Coffee Lake processors from Intel, which are still manufactured in a 14nm process. Lenovo is very generous with the power limits at 107/90W, and the T15g can maintain this level under sustained workloads. The Core i7-10750H (6 cores) runs at the full 4.2 GHz at 90W.
The benchmark results are okay, but the 8 core CPUs from Intel and especially the AMD processor are more powerful. The performance of the CPU is slightly reduced on battery power (70W, 3.8-4.0 GHz), which results in a deficit of around ~10%.
Cinebench R15: CPU Single 64Bit | CPU Multi 64Bit
Blender: v2.79 BMW27 CPU
7-Zip 18.03: 7z b 4 -mmt1 | 7z b 4
Geekbench 5.5: Single-Core | Multi-Core
HWBOT x265 Benchmark v2.2: 4k Preset
LibreOffice : 20 Documents To PDF
R Benchmark 2.5: Overall mean
Cinebench R23: Single Core | Multi Core
| Cinebench R20 / CPU (Single Core) | |
| Average of class Workstation (528 - 816, n=29, last 2 years) | |
| HP ZBook Fury 15 G7 | |
| HP ZBook Fury 15 G7 | |
| Dell Precision 7550 | |
| Lenovo ThinkPad T15g-20UR000GGE | |
| SCHENKER XMG Neo 15 Comet Lake | |
| Average Intel Core i7-10750H (431 - 504, n=43) | |
| Cinebench R20 / CPU (Multi Core) | |
| Average of class Workstation (1669 - 9329, n=29, last 2 years) | |
| SCHENKER XMG Neo 15 Comet Lake | |
| Dell Precision 7550 | |
| HP ZBook Fury 15 G7 | |
| HP ZBook Fury 15 G7 | |
| Lenovo ThinkPad T15g-20UR000GGE | |
| Average Intel Core i7-10750H (1749 - 3325, n=43) | |
| Cinebench R15 / CPU Single 64Bit | |
| Average of class Workstation (166.2 - 301, n=28, last 2 years) | |
| HP ZBook Fury 15 G7 | |
| HP ZBook Fury 15 G7 | |
| Dell Precision 7550 | |
| Lenovo ThinkPad T15g-20UR000GGE | |
| SCHENKER XMG Neo 15 Comet Lake | |
| Average Intel Core i7-10750H (184 - 213, n=45) | |
| Cinebench R15 / CPU Multi 64Bit | |
| Average of class Workstation (706 - 3625, n=28, last 2 years) | |
| SCHENKER XMG Neo 15 Comet Lake | |
| Dell Precision 7550 | |
| HP ZBook Fury 15 G7 | |
| HP ZBook Fury 15 G7 | |
| Lenovo ThinkPad T15g-20UR000GGE | |
| Average Intel Core i7-10750H (804 - 1418, n=50) | |
| Blender / v2.79 BMW27 CPU | |
| HP ZBook Fury 15 G7 | |
| Average Intel Core i7-10750H (322 - 587, n=43) | |
| Lenovo ThinkPad T15g-20UR000GGE | |
| Dell Precision 7550 | |
| SCHENKER XMG Neo 15 Comet Lake | |
| Average of class Workstation (137 - 684, n=28, last 2 years) | |
| 7-Zip 18.03 / 7z b 4 -mmt1 | |
| Average of class Workstation (4777 - 6670, n=28, last 2 years) | |
| HP ZBook Fury 15 G7 | |
| Dell Precision 7550 | |
| Lenovo ThinkPad T15g-20UR000GGE | |
| Average Intel Core i7-10750H (4504 - 5470, n=43) | |
| SCHENKER XMG Neo 15 Comet Lake | |
| 7-Zip 18.03 / 7z b 4 | |
| Average of class Workstation (20087 - 99351, n=28, last 2 years) | |
| SCHENKER XMG Neo 15 Comet Lake | |
| Dell Precision 7550 | |
| Lenovo ThinkPad T15g-20UR000GGE | |
| HP ZBook Fury 15 G7 | |
| Average Intel Core i7-10750H (26040 - 37345, n=43) | |
| Geekbench 5.5 / Single-Core | |
| Average of class Workstation (1474 - 2095, n=28, last 2 years) | |
| HP ZBook Fury 15 G7 | |
| Dell Precision 7550 | |
| Lenovo ThinkPad T15g-20UR000GGE | |
| SCHENKER XMG Neo 15 Comet Lake | |
| Average Intel Core i7-10750H (1114 - 1333, n=43) | |
| Geekbench 5.5 / Multi-Core | |
| Average of class Workstation (5022 - 17487, n=28, last 2 years) | |
| Dell Precision 7550 | |
| SCHENKER XMG Neo 15 Comet Lake | |
| HP ZBook Fury 15 G7 | |
| Lenovo ThinkPad T15g-20UR000GGE | |
| Average Intel Core i7-10750H (4443 - 6674, n=43) | |
| HWBOT x265 Benchmark v2.2 / 4k Preset | |
| Average of class Workstation (5.09 - 26, n=28, last 2 years) | |
| SCHENKER XMG Neo 15 Comet Lake | |
| Dell Precision 7550 | |
| Lenovo ThinkPad T15g-20UR000GGE | |
| Average Intel Core i7-10750H (5.54 - 11.6, n=43) | |
| HP ZBook Fury 15 G7 | |
| LibreOffice / 20 Documents To PDF | |
| HP ZBook Fury 15 G7 | |
| Average Intel Core i7-10750H (43.1 - 99.2, n=43) | |
| Lenovo ThinkPad T15g-20UR000GGE | |
| Average of class Workstation (36.5 - 95.2, n=28, last 2 years) | |
| Dell Precision 7550 | |
| SCHENKER XMG Neo 15 Comet Lake | |
| R Benchmark 2.5 / Overall mean | |
| Average Intel Core i7-10750H (0.578 - 0.708, n=42) | |
| SCHENKER XMG Neo 15 Comet Lake | |
| Lenovo ThinkPad T15g-20UR000GGE | |
| Dell Precision 7550 | |
| HP ZBook Fury 15 G7 | |
| Average of class Workstation (0.3876 - 0.544, n=28, last 2 years) | |
| Cinebench R23 / Single Core | |
| Average of class Workstation (1144 - 2106, n=28, last 2 years) | |
| HP ZBook Fury 15 G7 | |
| Average Intel Core i7-10750H (1136 - 1271, n=16) | |
| Lenovo ThinkPad T15g-20UR000GGE | |
| Cinebench R23 / Multi Core | |
| Average of class Workstation (4332 - 24560, n=28, last 2 years) | |
| Lenovo ThinkPad T15g-20UR000GGE | |
| Average Intel Core i7-10750H (4807 - 8585, n=16) | |
| HP ZBook Fury 15 G7 | |
* ... smaller is better
System Performance
The T15g is a very fast system and we did not notice any problems during our review period. Our synthetic benchmarks confirm the high performance impression.
| PCMark 10 Score | 6093 points | |
Help | ||
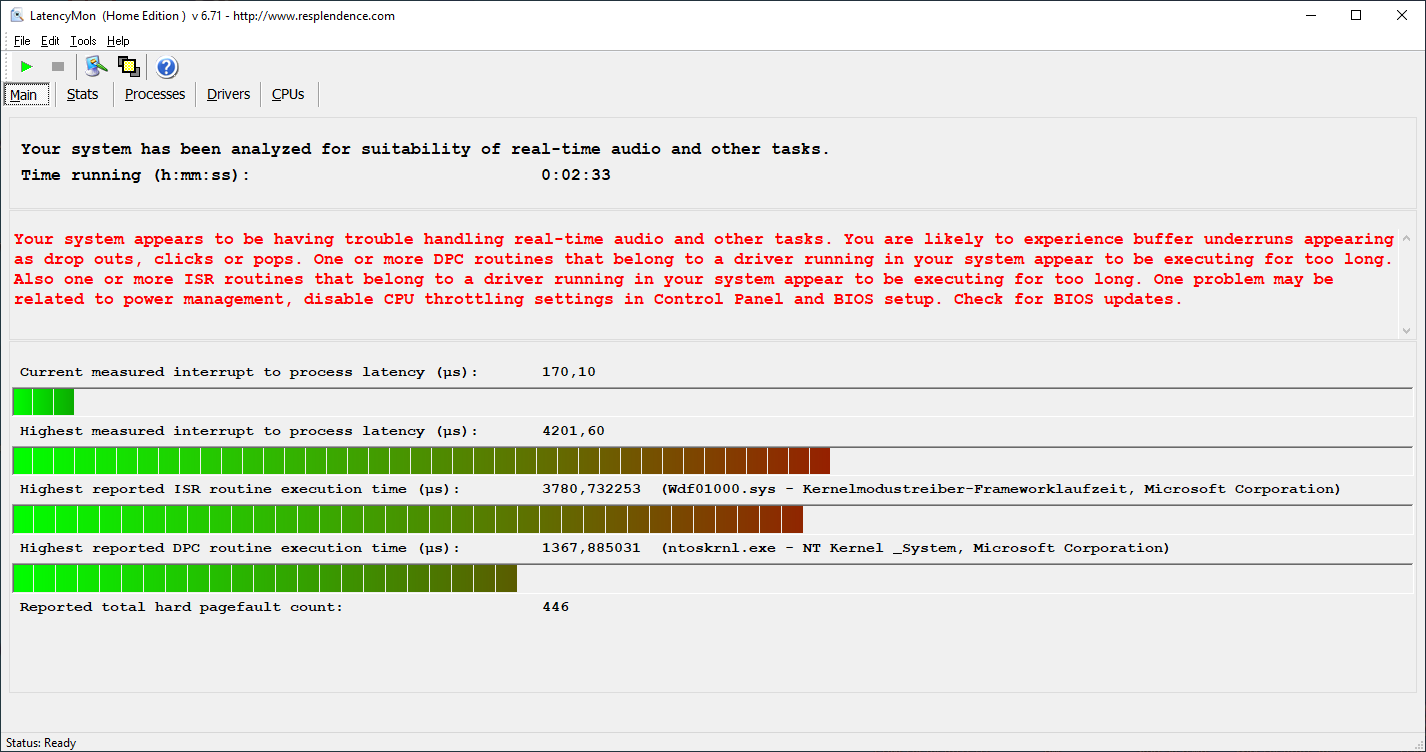
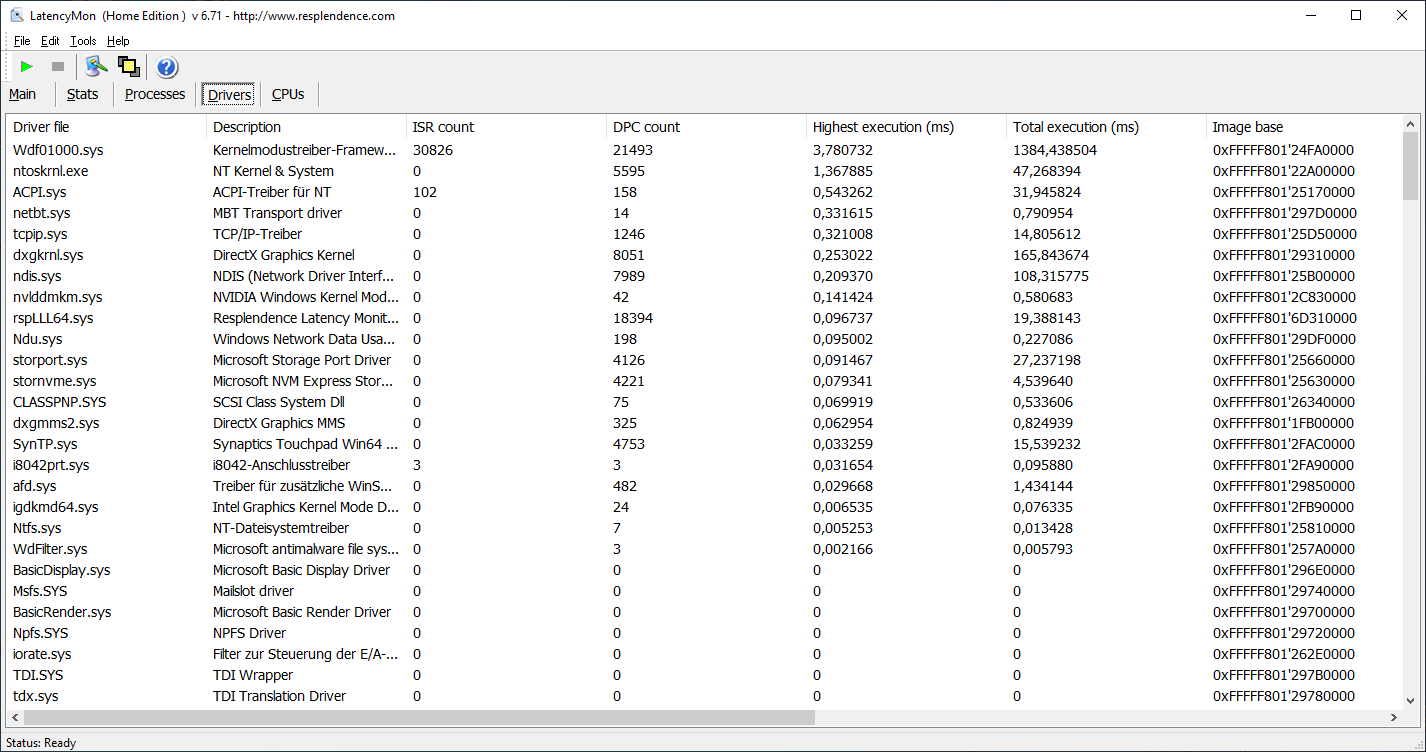
DPC Latency
Our DPC Latency test with the T15g reveals some issues and the device is not suited for real-time audio applications.
| DPC Latencies / LatencyMon - interrupt to process latency (max), Web, Youtube, Prime95 | |
| Dell Precision 7550 | |
| Lenovo ThinkPad T15g-20UR000GGE | |
| HP ZBook Fury 15 G7 | |
| SCHENKER XMG Neo 15 Comet Lake | |
* ... smaller is better
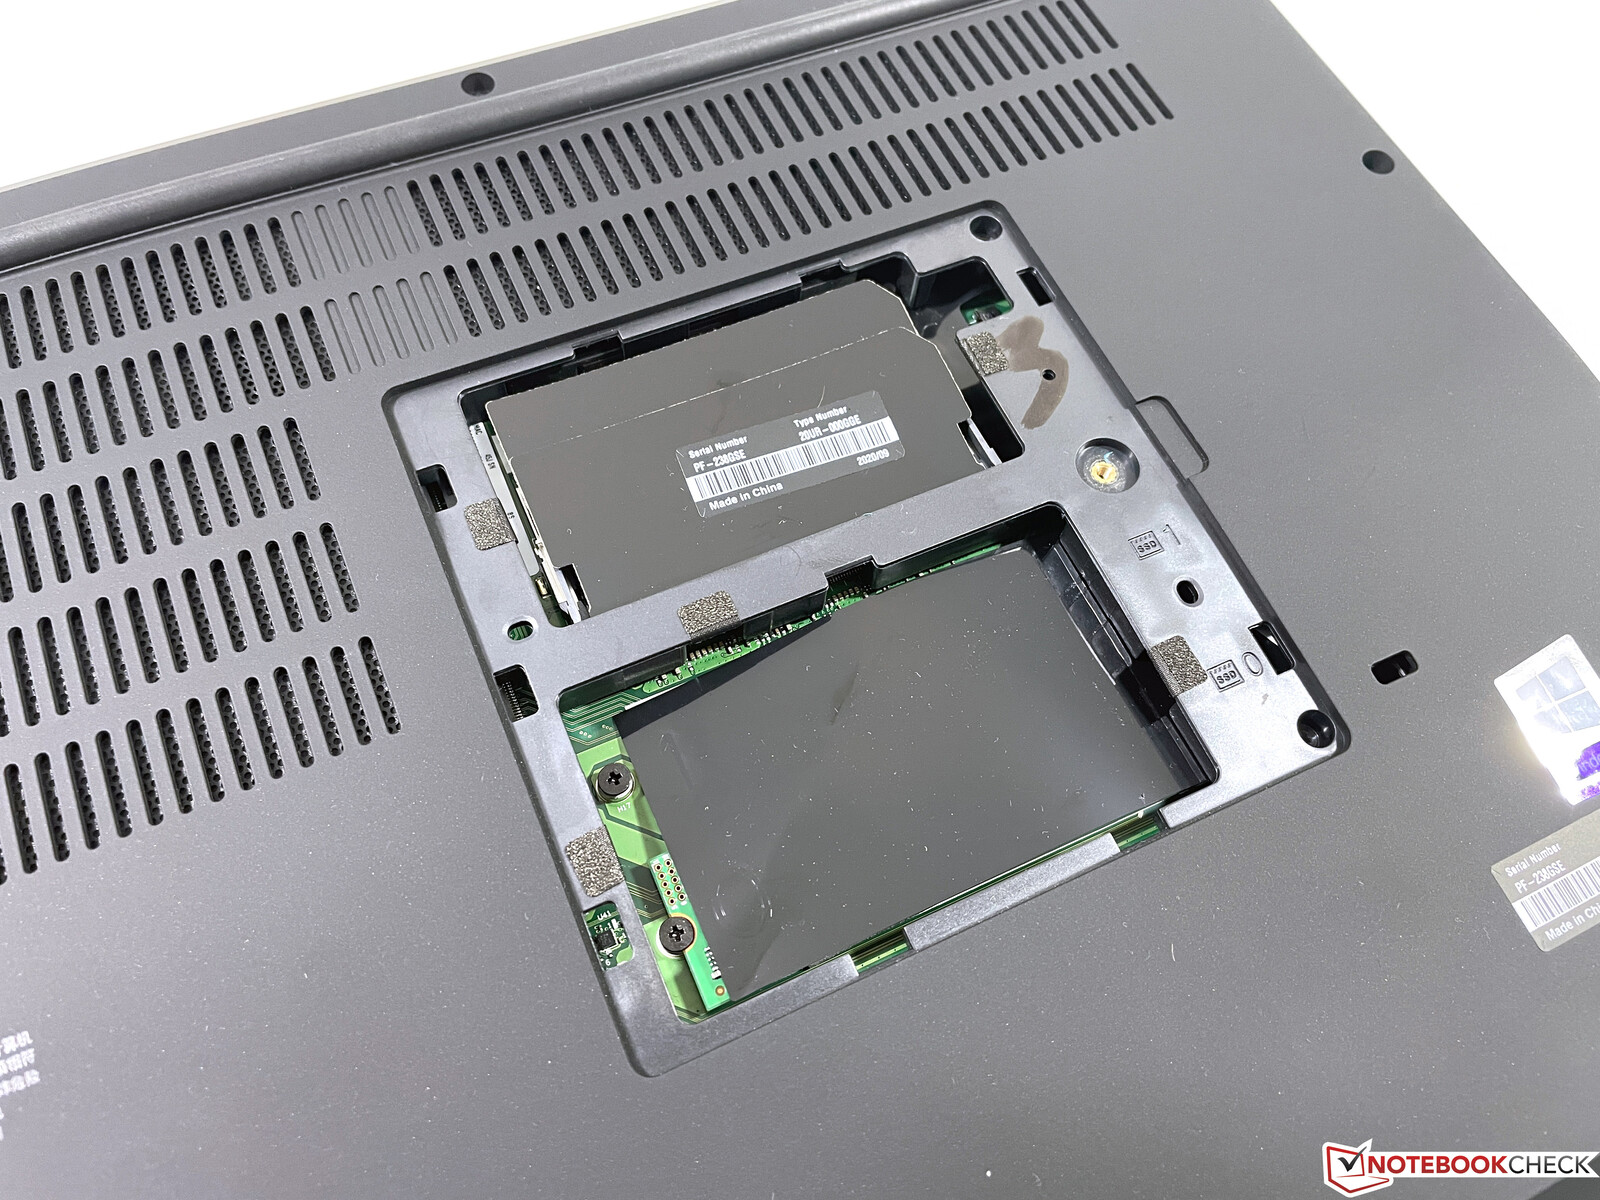
Storage Devices - 2x M.2-2280
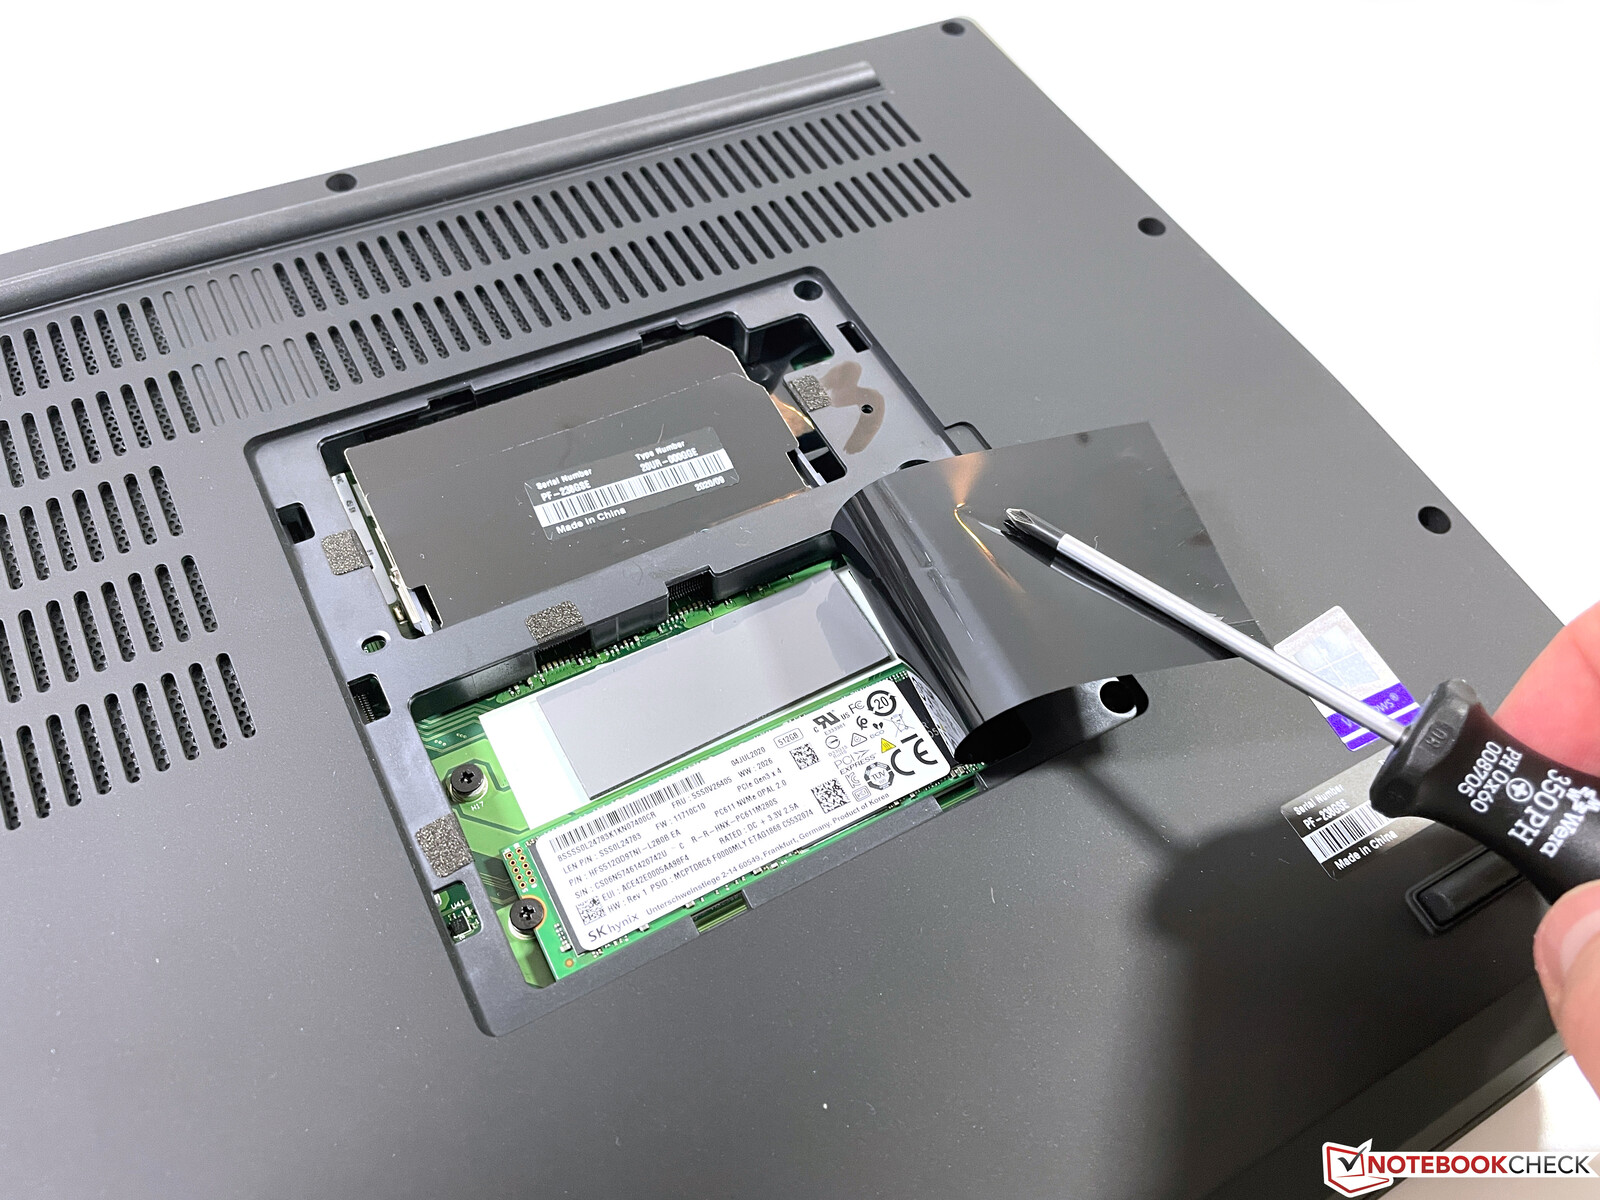
The ThinkPad T15g offers two full M.2-2280 slots for SSDs, which are easily accessible via maintenance hatch. The previous model still had three slots. The SSDs are still attached via PCIe-x4 3.0; PCIe 4.0 is not supported yet. Our test unit is equipped with a 512 GB NVMe-SSD from SK Hynix with decent benchmark results. After the initial setup, you can use 432 GB for your own files/applications.
| Lenovo ThinkPad T15g-20UR000GGE SK Hynix PC401 512GB M.2 (HFS512GD9TNG) | Dell Precision 7550 SK Hynix PC601A NVMe 1TB | HP ZBook Fury 15 G7 Samsung PM981a MZVLB1T0HBLR | SCHENKER XMG Neo 15 Comet Lake Samsung SSD 970 EVO Plus 1TB | Average SK Hynix PC401 512GB M.2 (HFS512GD9TNG) | |
|---|---|---|---|---|---|
| CrystalDiskMark 5.2 / 6 | -12% | 1% | 18% | -17% | |
| Write 4K | 154 | 121 -21% | 114.1 -26% | 182.6 19% | 143.3 ? -7% |
| Read 4K | 46.01 | 42.16 -8% | 57.2 24% | 53.5 16% | 45.3 ? -2% |
| Write Seq | 2561 | 2150 -16% | 2580 1% | 3035 19% | 1514 ? -41% |
| Read Seq | 1799 | 1755 -2% | 2527 40% | 2520 40% | 1758 ? -2% |
| Write 4K Q32T1 | 452.2 | 395.3 -13% | 480.2 6% | 524 16% | 425 ? -6% |
| Read 4K Q32T1 | 570 | 381.8 -33% | 387.6 -32% | 617 8% | 459 ? -19% |
| Write Seq Q32T1 | 2736 | 2730 0% | 2996 10% | 3316 21% | 1531 ? -44% |
| Read Seq Q32T1 | 3468 | 3468 0% | 2853 -18% | 3548 2% | 2895 ? -17% |
| AS SSD | -44% | -37% | 15% | -39% | |
| Seq Read | 2889 | 2028 -30% | 2127 -26% | 2970 3% | 2266 ? -22% |
| Seq Write | 2424 | 1193 -51% | 1296 -47% | 2559 6% | 1137 ? -53% |
| 4K Read | 55.6 | 42.31 -24% | 54.8 -1% | 56.6 2% | 43.2 ? -22% |
| 4K Write | 144.6 | 105.5 -27% | 110.8 -23% | 145 0% | 118.8 ? -18% |
| 4K-64 Read | 1569 | 1128 -28% | 1420 -9% | 1938 24% | 819 ? -48% |
| 4K-64 Write | 1922 | 1537 -20% | 2012 5% | 2307 20% | 956 ? -50% |
| Access Time Read * | 0.07 | 0.069 1% | 0.046 34% | 0.035 50% | 0.04909 ? 30% |
| Access Time Write * | 0.026 | 0.106 -308% | 0.099 -281% | 0.025 4% | 0.04845 ? -86% |
| Score Read | 1914 | 1373 -28% | 1687 -12% | 2291 20% | 1089 ? -43% |
| Score Write | 2309 | 1762 -24% | 2253 -2% | 2708 17% | 1188 ? -49% |
| Score Total | 5185 | 3801 -27% | 4770 -8% | 6152 19% | 2787 ? -46% |
| Copy ISO MB/s | 2489 | 1768 -29% | 2779 12% | 1286 ? -48% | |
| Copy Program MB/s | 728 | 627 -14% | 123.3 -83% | 470 ? -35% | |
| Copy Game MB/s | 1670 | 1477 -12% | 440.8 -74% | 837 ? -50% | |
| Total Average (Program / Settings) | -28% /
-32% | -18% /
-23% | 17% /
16% | -28% /
-31% |
* ... smaller is better

DiskSpd Read Loop, Queue Depth 8
GPU Performance - T15g with GeForce RTX Super
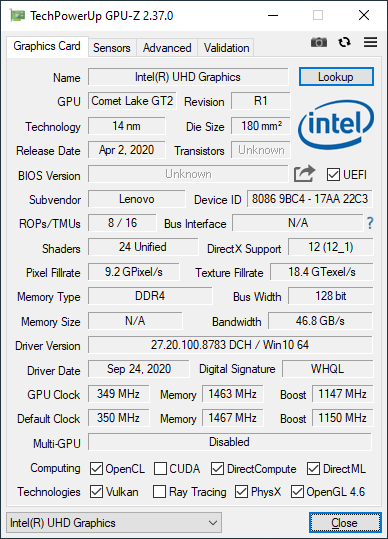
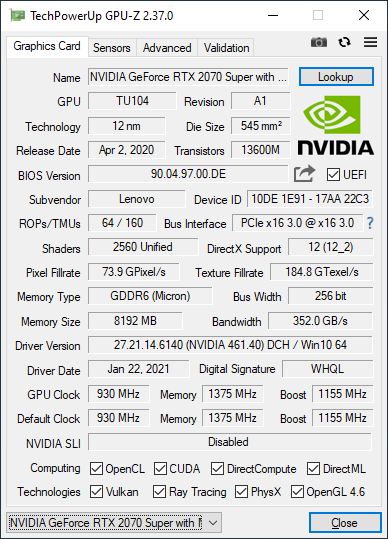
Lenovo uses the Nvidia GeForce RTX 2070 Super Max-Q. It is the slowest version with a TGP of 80W, so the performance is slightly below our expectations. The RTX 2070 Super Max-Q is roughly comparable to the professional RTX 4000 Max-Q in the ThinkPad P15. The maximum core clock in the benchmarks is ~1700 MHz.
The performance of the GPU is stable even during sustained workloads; the demanding 3DMark Time Spy stress test is passed at 97%.
The performance and the power consumption are significantly reduced on battery power (1170 MHz @30W), which reduces the performance by around 66% (Time Spy Graphics: 7142 vs. 2359 points). Simple workloads are handled by the integrated UHD Graphics of the processor.
| 3DMark 11 Performance | 20666 points | |
| 3DMark Fire Strike Score | 16950 points | |
| 3DMark Time Spy Score | 7199 points | |
Help | ||
Workstation Performance
There is no Quadro GPU in the T15g, but the RTX 2070 Super Max-Q can also handle professional workloads. There are some areas in the SPECviewperf 13 benchmark where the 2070 can keep up pretty well with the Quadro GPUs. There is only one test (Siemens NX) where the GeForce is noticeably slower.
Gaming Performance
Gaming is obviously possible as well with the ThinkPad T15g. The RTX 2070 Super Max-Q is powerful enough even for demanding titles like Cyberpunk 2077 with maximum details, and the performance is also stable for longer gaming sessions.
| low | med. | high | ultra | 4K | |
| The Witcher 3 (2015) | 312 | 235 | 141 | 62.7 | |
| Dota 2 Reborn (2015) | 148 | 137 | 132 | 125 | 103 |
| X-Plane 11.11 (2018) | 119 | 107 | 88.1 | 75.4 | |
| Far Cry 5 (2018) | 149 | 118 | 111 | 104 | |
| Cyberpunk 2077 1.0 (2020) | 117.8 | 67.7 | 56.7 | 48.5 |
Emissions - Louder fans
System Noise
The two fans of the ThinkPad T15g are usually deactivated while idling. Under load, it mainly depends on the CPU load. Medium workloads result in 36 dB(A), but the fans quickly reach their maximum noise level of 46 dB(A) during the stress test, which is comparable to the HP ZBook Fury 15 G7 and a bit quieter than the Dell Precision 7550. You can expect between 42-46 dB(A) during gaming.
We noticed electronic sounds during the GPU benchmarks and during gaming, which are very annoying. Our review unit of the ThinkPad P15 did not have this problem, so we expect an isolated problem of our particular unit and not a general issue of the series.
Noise Level
| Idle |
| 24 / 24 / 24 dB(A) |
| Load |
| 36.1 / 46 dB(A) |
 | ||
30 dB silent 40 dB(A) audible 50 dB(A) loud |
||
min: | ||
| Lenovo ThinkPad T15g-20UR000GGE GeForce RTX 2070 Super Max-Q, i7-10750H, SK Hynix PC401 512GB M.2 (HFS512GD9TNG) | Dell Precision 7550 Quadro RTX 5000 Max-Q, W-10885M, SK Hynix PC601A NVMe 1TB | HP ZBook Fury 15 G7 Quadro RTX 5000 Max-Q, W-10885M, Samsung PM981a MZVLB1T0HBLR | SCHENKER XMG Neo 15 Comet Lake GeForce RTX 2070 Super Mobile, i7-10875H, Samsung SSD 970 EVO Plus 1TB | |
|---|---|---|---|---|
| Noise | -14% | -5% | -22% | |
| off / environment * | 24 | 25.8 -8% | 26.4 -10% | 25 -4% |
| Idle Minimum * | 24 | 25.8 -8% | 26.4 -10% | 26 -8% |
| Idle Average * | 24 | 25.8 -8% | 26.4 -10% | 28 -17% |
| Idle Maximum * | 24 | 25.9 -8% | 26.4 -10% | 33 -38% |
| Load Average * | 36.1 | 51.2 -42% | 31.7 12% | 52 -44% |
| Witcher 3 ultra * | 46 | 51.9 -13% | 47 -2% | 55 -20% |
| Load Maximum * | 46 | 51.9 -13% | 47 -2% | 56 -22% |
* ... smaller is better
Temperature
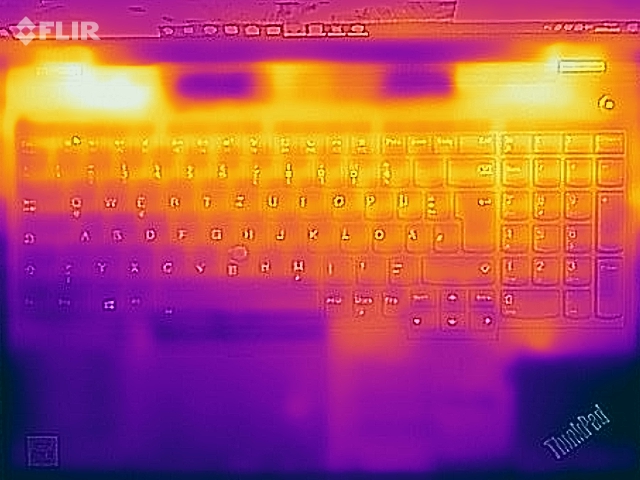
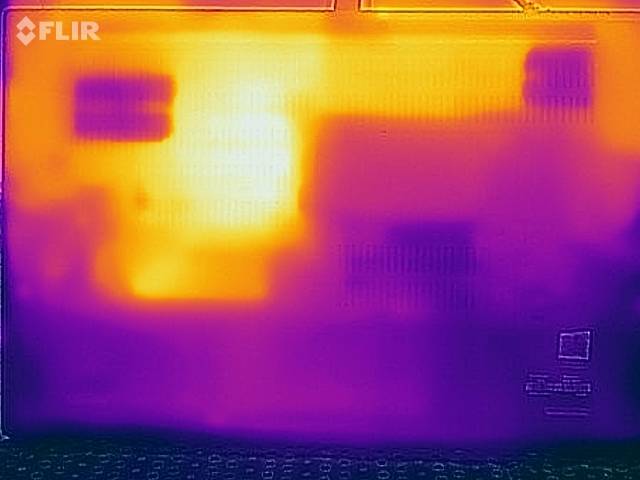
The ThinkPad T15g gets very warm under load and you should not put it on your lap (even though this is unlikely due to the size anyway). We can measure more than 60 °C at the bottom during the stress test. The top of the base unit stays comparatively cool and there are no limitations when you type. The temperatures are a bit lower during gaming (Witcher 3).
The CPU performance is stable in the stress test, but the processor drops to around 3 GHz (~41W) after a a couple of minutes. The CPU temperature still stays at 100 °C, so the cooling solution is hitting its limitations. This also means the optional more powerful components would not have a big advantage when you stress CPU and GPU at the same time.
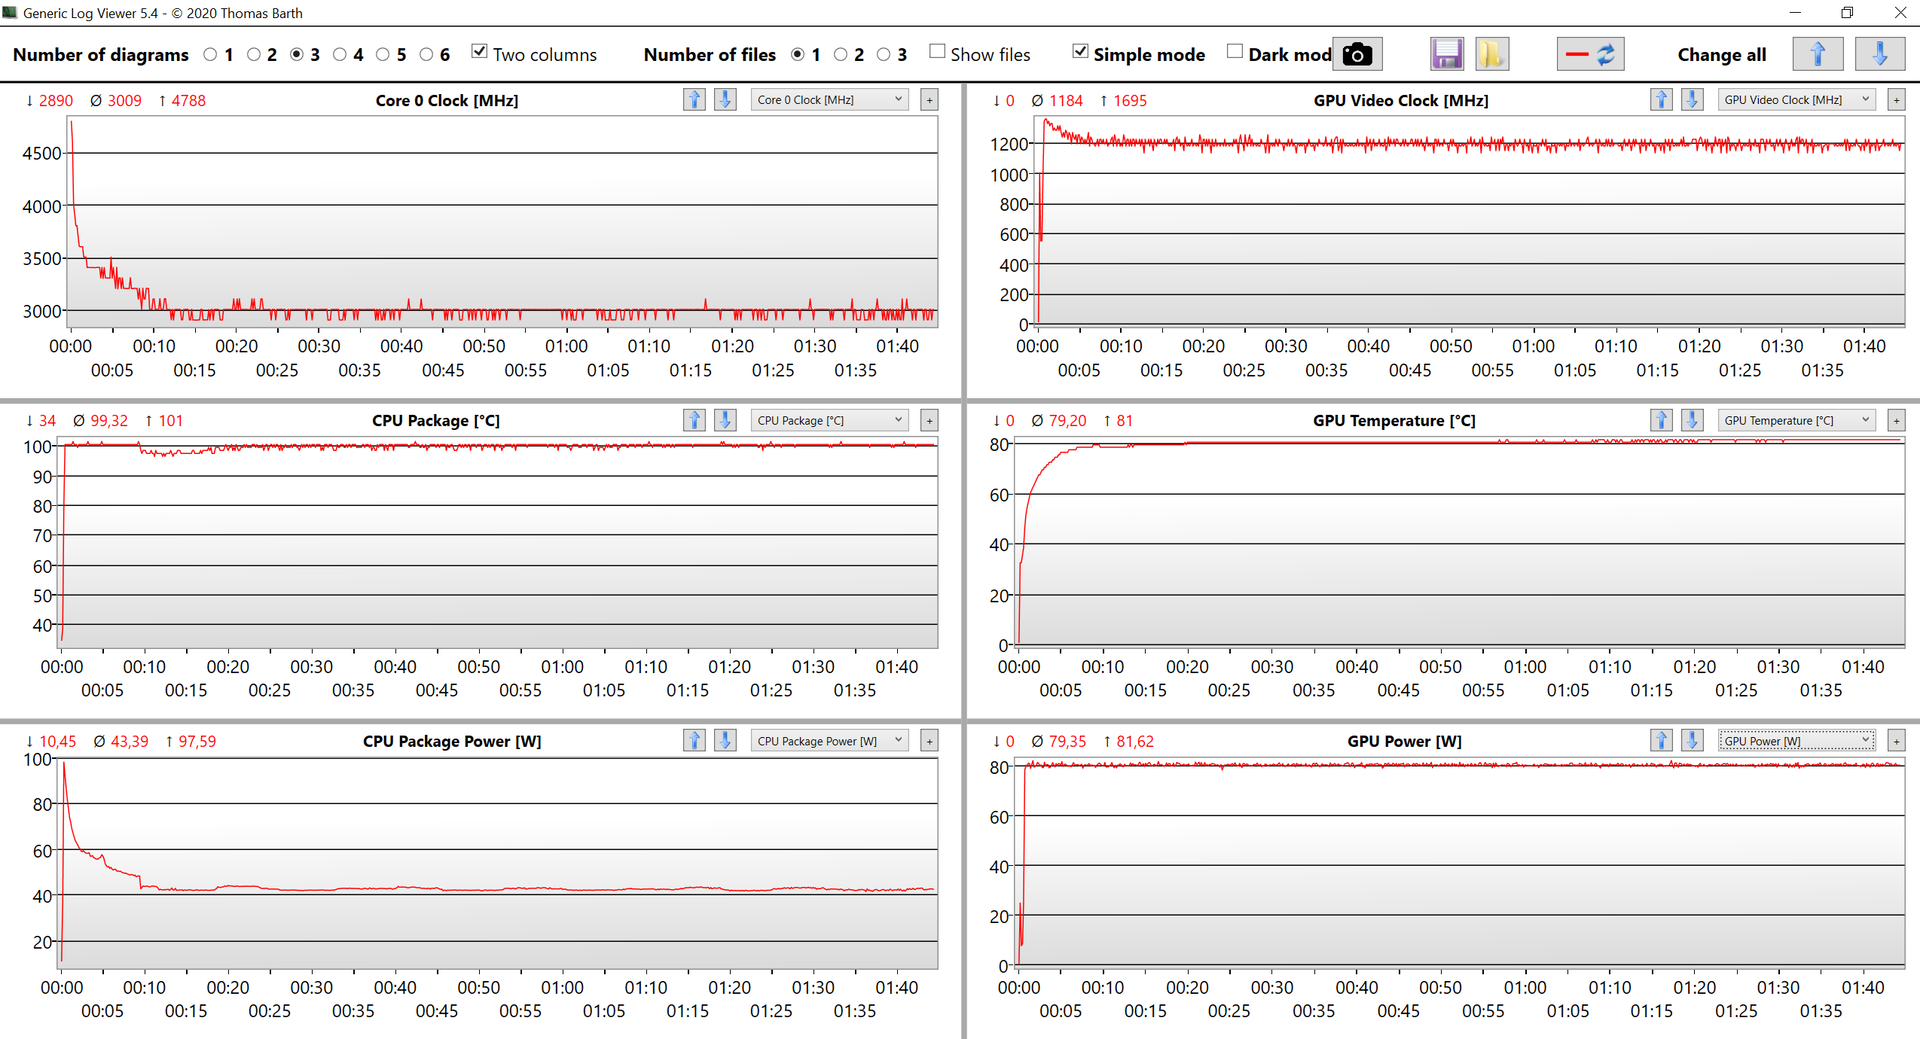
(-) The maximum temperature on the upper side is 47.7 °C / 118 F, compared to the average of 38.1 °C / 101 F, ranging from 22.2 to 69.8 °C for the class Workstation.
(-) The bottom heats up to a maximum of 62.1 °C / 144 F, compared to the average of 41.3 °C / 106 F
(+) In idle usage, the average temperature for the upper side is 28.7 °C / 84 F, compared to the device average of 32 °C / 90 F.
(±) Playing The Witcher 3, the average temperature for the upper side is 34.8 °C / 95 F, compared to the device average of 32 °C / 90 F.
(+) The palmrests and touchpad are reaching skin temperature as a maximum (32.9 °C / 91.2 F) and are therefore not hot.
(-) The average temperature of the palmrest area of similar devices was 27.8 °C / 82 F (-5.1 °C / -9.2 F).
Speakers
Lenovo implements two speakers above the keyboard area, so the sound cannot be muffled by the underground and the overall performance of the two modules is okay. They can get pretty loud and produce clear high tones. They are definitely sufficient for conferences and occasional video playback, but there is still a lot of room for improvements (more speakers like on the X1 series or a dedicated subwoofer).
Lenovo ThinkPad T15g-20UR000GGE audio analysis
(±) | speaker loudness is average but good (81 dB)
Bass 100 - 315 Hz
(±) | reduced bass - on average 13.6% lower than median
(±) | linearity of bass is average (10.7% delta to prev. frequency)
Mids 400 - 2000 Hz
(±) | higher mids - on average 7.9% higher than median
(+) | mids are linear (5.6% delta to prev. frequency)
Highs 2 - 16 kHz
(+) | balanced highs - only 2.5% away from median
(+) | highs are linear (5.7% delta to prev. frequency)
Overall 100 - 16.000 Hz
(±) | linearity of overall sound is average (17.1% difference to median)
Compared to same class
» 41% of all tested devices in this class were better, 10% similar, 50% worse
» The best had a delta of 7%, average was 18%, worst was 35%
Compared to all devices tested
» 26% of all tested devices were better, 8% similar, 66% worse
» The best had a delta of 4%, average was 25%, worst was 134%
HP ZBook Fury 15 G7 audio analysis
(±) | speaker loudness is average but good (80.1 dB)
Bass 100 - 315 Hz
(±) | reduced bass - on average 8% lower than median
(±) | linearity of bass is average (9.5% delta to prev. frequency)
Mids 400 - 2000 Hz
(+) | balanced mids - only 3.3% away from median
(+) | mids are linear (4.8% delta to prev. frequency)
Highs 2 - 16 kHz
(+) | balanced highs - only 2.2% away from median
(+) | highs are linear (3.5% delta to prev. frequency)
Overall 100 - 16.000 Hz
(+) | overall sound is linear (10.1% difference to median)
Compared to same class
» 4% of all tested devices in this class were better, 2% similar, 94% worse
» The best had a delta of 7%, average was 18%, worst was 35%
Compared to all devices tested
» 3% of all tested devices were better, 1% similar, 96% worse
» The best had a delta of 4%, average was 25%, worst was 134%
Energy Management
Power Consumption
Thanks to the 1080p screen and the integrated graphics card, the idle consumption is better compared to the rivals. We can measure up to 234 Watts under load, but this value will quickly level off at ~166 Watts, so the included 230W power supply unit is completely sufficient.
| Off / Standby | |
| Idle | |
| Load |
|
| Lenovo ThinkPad T15g-20UR000GGE i7-10750H, GeForce RTX 2070 Super Max-Q, SK Hynix PC401 512GB M.2 (HFS512GD9TNG), IPS, 1920x1080, 15.60 | Dell Precision 7550 W-10885M, Quadro RTX 5000 Max-Q, SK Hynix PC601A NVMe 1TB, IPS, 3840x2160, 15.60 | HP ZBook Fury 15 G7 W-10885M, Quadro RTX 5000 Max-Q, Samsung PM981a MZVLB1T0HBLR, IPS, 3840x2160, 15.60 | SCHENKER XMG Neo 15 Comet Lake i7-10875H, GeForce RTX 2070 Super Mobile, Samsung SSD 970 EVO Plus 1TB, IPS, 1920x1080, 15.60 | Average NVIDIA GeForce RTX 2070 Super Max-Q | Average of class Workstation | |
|---|---|---|---|---|---|---|
| Power Consumption | -33% | -11% | -72% | -75% | -11% | |
| Idle Minimum * | 5.8 | 8.2 -41% | 4.6 21% | 17 -193% | 15.3 ? -164% | 7.82 ? -35% |
| Idle Average * | 11.4 | 16.8 -47% | 13.6 -19% | 19 -67% | 19.3 ? -69% | 12.7 ? -11% |
| Idle Maximum * | 13.9 | 24.4 -76% | 21.5 -55% | 29 -109% | 30.5 ? -119% | 18.7 ? -35% |
| Load Average * | 93.2 | 131 -41% | 113.1 -21% | 120 -29% | 108.5 ? -16% | 96.5 ? -4% |
| Witcher 3 ultra * | 145 | 156.6 -8% | 157.5 -9% | 186 -28% | ||
| Load Maximum * | 234 | 201.8 14% | 199 15% | 250 -7% | 246 ? -5% | 158.9 ? 32% |
* ... smaller is better
Battery Runtime
The large 94Wh battery manages very long battery runtimes. It is drained after little more than one hour under load (despite the reduced performance), but our more practical Wi-Fi test (150 cd/m²) runs for more than 11 hours and still around 7.5 hours at the maximum brightness. We record more than 12.5 hours for video playback.
| Lenovo ThinkPad T15g-20UR000GGE i7-10750H, GeForce RTX 2070 Super Max-Q, 94 Wh | Dell Precision 7550 W-10885M, Quadro RTX 5000 Max-Q, 95 Wh | HP ZBook Fury 15 G7 W-10885M, Quadro RTX 5000 Max-Q, 94 Wh | SCHENKER XMG Neo 15 Comet Lake i7-10875H, GeForce RTX 2070 Super Mobile, 93 Wh | Average of class Workstation | |
|---|---|---|---|---|---|
| Battery Runtime | -17% | -6% | -33% | -4% | |
| H.264 | 761 | 717 ? -6% | |||
| WiFi v1.3 | 673 | 534 -21% | 515 -23% | 448 -33% | 541 ? -20% |
| Load | 71 | 62 -13% | 79 11% | 81.3 ? 15% | |
| Reader / Idle | 666 | 794 | 700 ? |
Pros
Cons
Verdict - T15g is a conventional workstation
Despite the somewhat unfortunate naming scheme, the ThinkPad T15g is a conventional workstation. The case is identical to the ThinkPad P15 and there are no dedicated gaming features like a very fast display. Instead of the Quadro GPU, you get a regular GeForce RTX 2070 Super Max-Q, which also offers good performance in many workstation applications.
The processor performance is very good, but there is no denying that modern AMD CPUs are just more powerful. Lenovo also uses the slowest version of the RTX 2070 Super Max-Q (80W TGP), which is a bit disappointing considering the bulky chassis. The cooling solution is also at its limits under combined workloads, so we cannot recommend the faster optional components.
The ThinkPad T15g is based on the mobile workstation ThinkPad P15 and replaces the Quadro GPU with a regular GeForce GPU. If you do not need the expensive ISV certifications, you will get many ports, good performance utilization, and good input devices.
The bright and matte 1080p screen offers good subjective picture quality and the colors are very accurate after a calibration. Lenovo also offers a 4K screen, which will affect the battery runtime, but this is most likely not a major factor for such a big and heavy device anyway. We also expect 16:10 panel for the next generation, there is definitely enough room.
Both the ThinkPad T15g and ThinkPad P15 have problems with a clattery keyboard in the lower left corner, so Lenovo should definitely address the problem.
Price and Availability
Lenovo ThinkPad T15g-20UR000GGE
-
03/03/2021 v7
Andreas Osthoff
More articles related to this device
Lenovo ThinkPad T15g-20UR000GGE (ThinkPad T15g Series)Related Articles


Pricecompare
