HP Omen 16 laptop review: Powerful RTX 3070 gaming laptop with unnecessary drawbacks
The HP Omen 16 has been newly introduced this year. The older Omen 15 still has not seen a direct successor. Instead, HP has fitted a 15.6-inch chassis with a 16.1-inch display. As a result, the bezels are now smaller and there are small differences in the construction of the case. Compared to last year's model, there are of course also CPU (Tiger Lake) and GPU (RTX 3000) upgrades.
Naturally, we will compare our test device with its predecessor, the HP Omen 15 (Ryzen 4000 and RTX 2060), and its new sibling, the HP Victus 16 (Ryzen 5000 and RTX 3060). Additionally, we selected the similarly equipped Lenovo Legion 5 Pro 16, the more expensive Alienware x15 R1 and the MSI Katana GF66 11UG as devices for our comparison.
Potential competitors in comparison
Rating | Date | Model | Weight | Height | Size | Resolution | Price |
|---|---|---|---|---|---|---|---|
| 86.6 % v7 (old) | 10 / 2021 | HP Omen 16-b0085ng i7-11800H, GeForce RTX 3070 Laptop GPU | 2.4 kg | 23 mm | 16.10" | 1920x1080 | |
| 82.8 % v7 (old) | 01 / 2021 | HP Omen 15-en0375ng R7 4800H, GeForce RTX 2060 Mobile | 2.2 kg | 23 mm | 15.60" | 1920x1080 | |
| 84.3 % v7 (old) | 09 / 2021 | HP Victus 16-e0179ng R7 5800H, GeForce RTX 3060 Laptop GPU | 2.5 kg | 23.5 mm | 16.10" | 1920x1080 | |
| 87.4 % v7 (old) | 08 / 2021 | Lenovo Legion 5 Pro 16ACH6H (82JQ001PGE) R7 5800H, GeForce RTX 3070 Laptop GPU | 2.6 kg | 26.85 mm | 16.00" | 2560x1600 | |
| 87.2 % v7 (old) | 09 / 2021 | Alienware x15 RTX 3070 P111F i7-11800H, GeForce RTX 3070 Laptop GPU | 2.4 kg | 15.9 mm | 15.60" | 2560x1440 | |
| 79.2 % v7 (old) | 09 / 2021 | MSI Katana GF66 11UG-220 i7-11800H, GeForce RTX 3070 Laptop GPU | 2.3 kg | 25 mm | 15.60" | 1920x1080 |
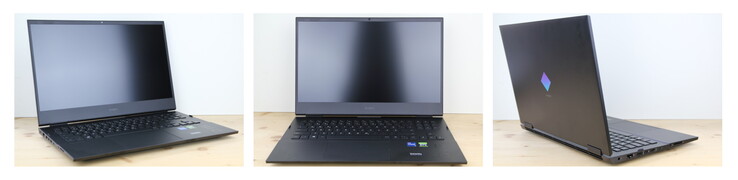
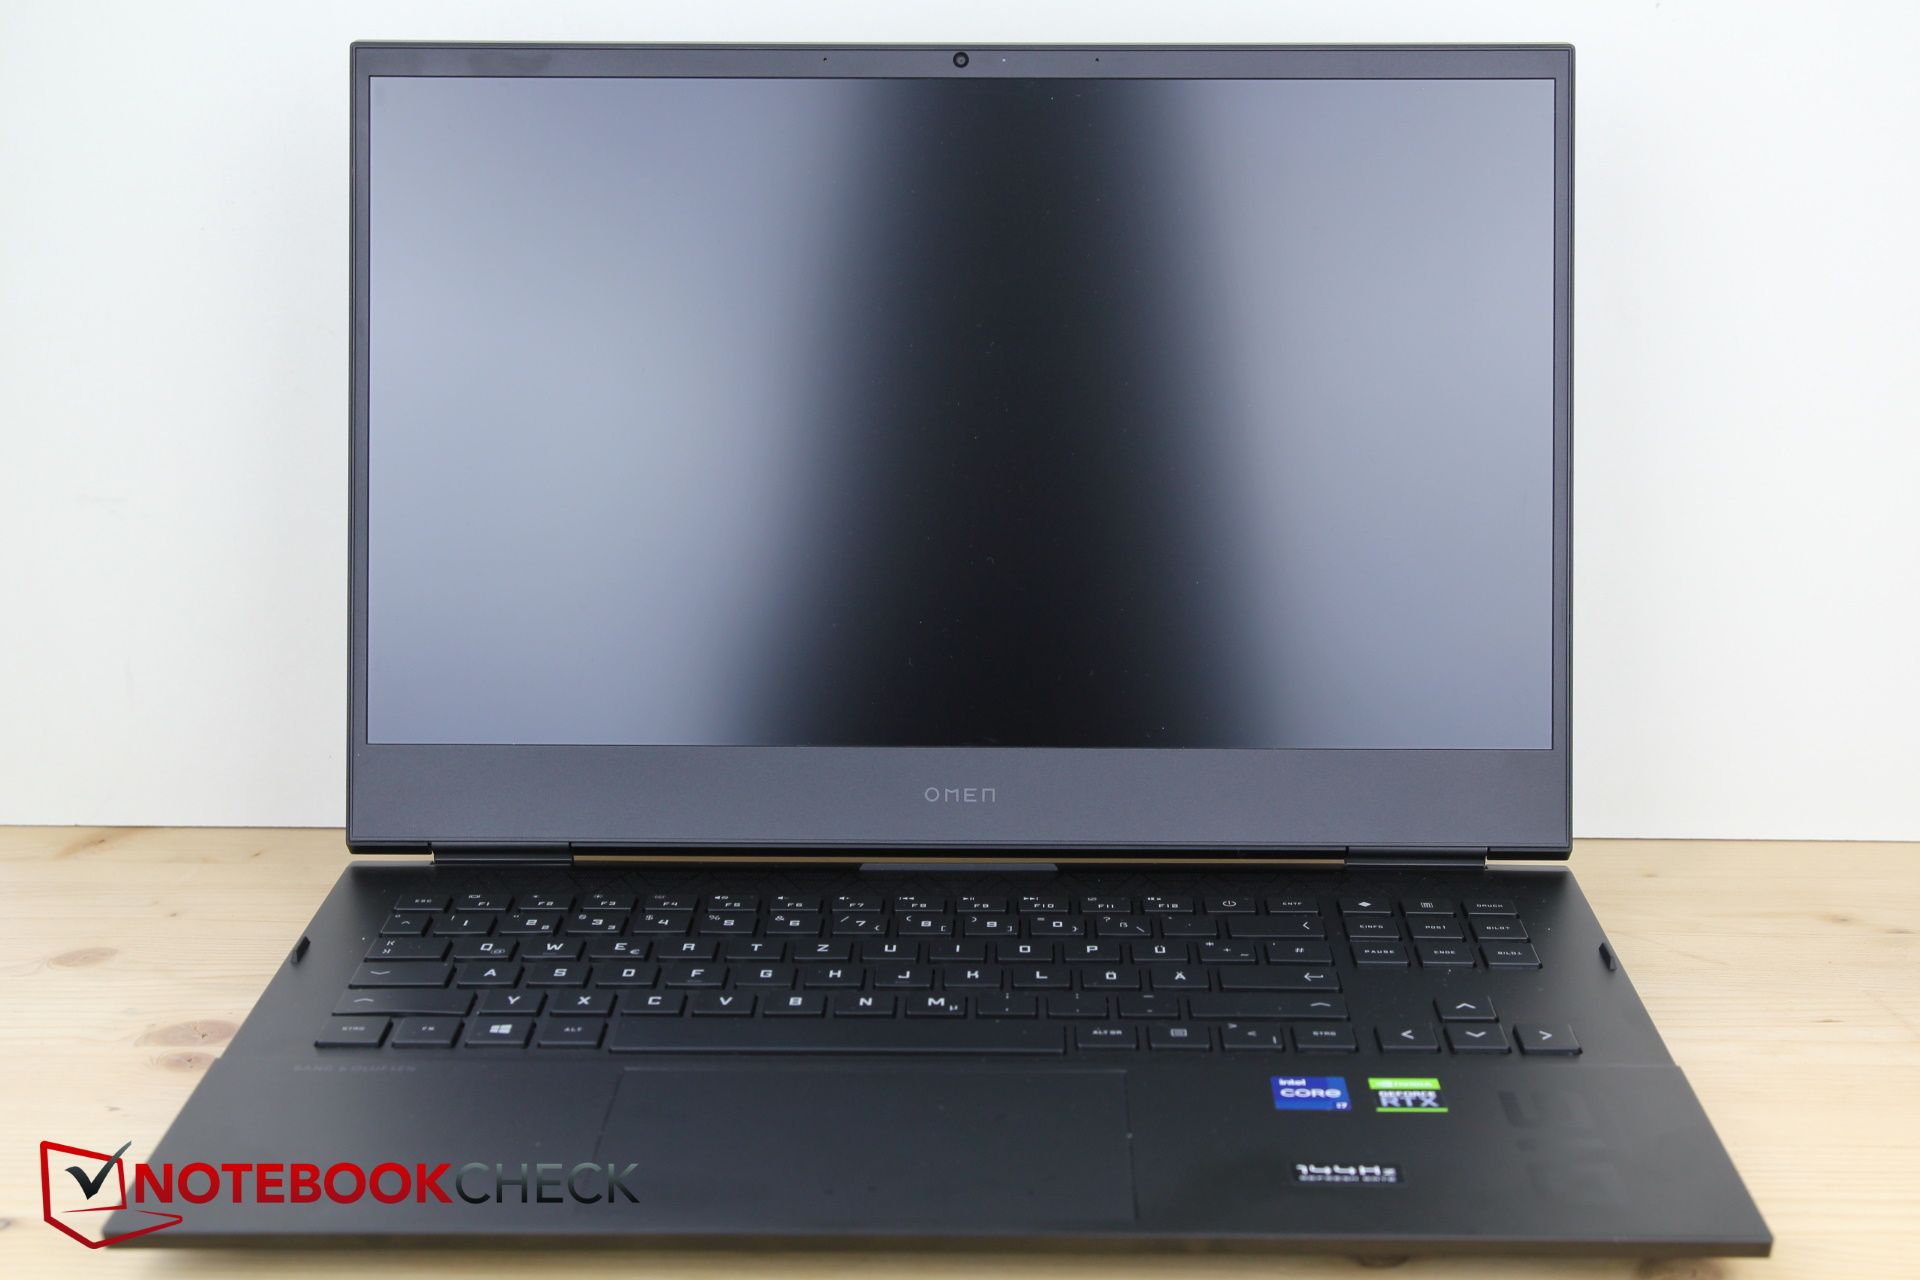
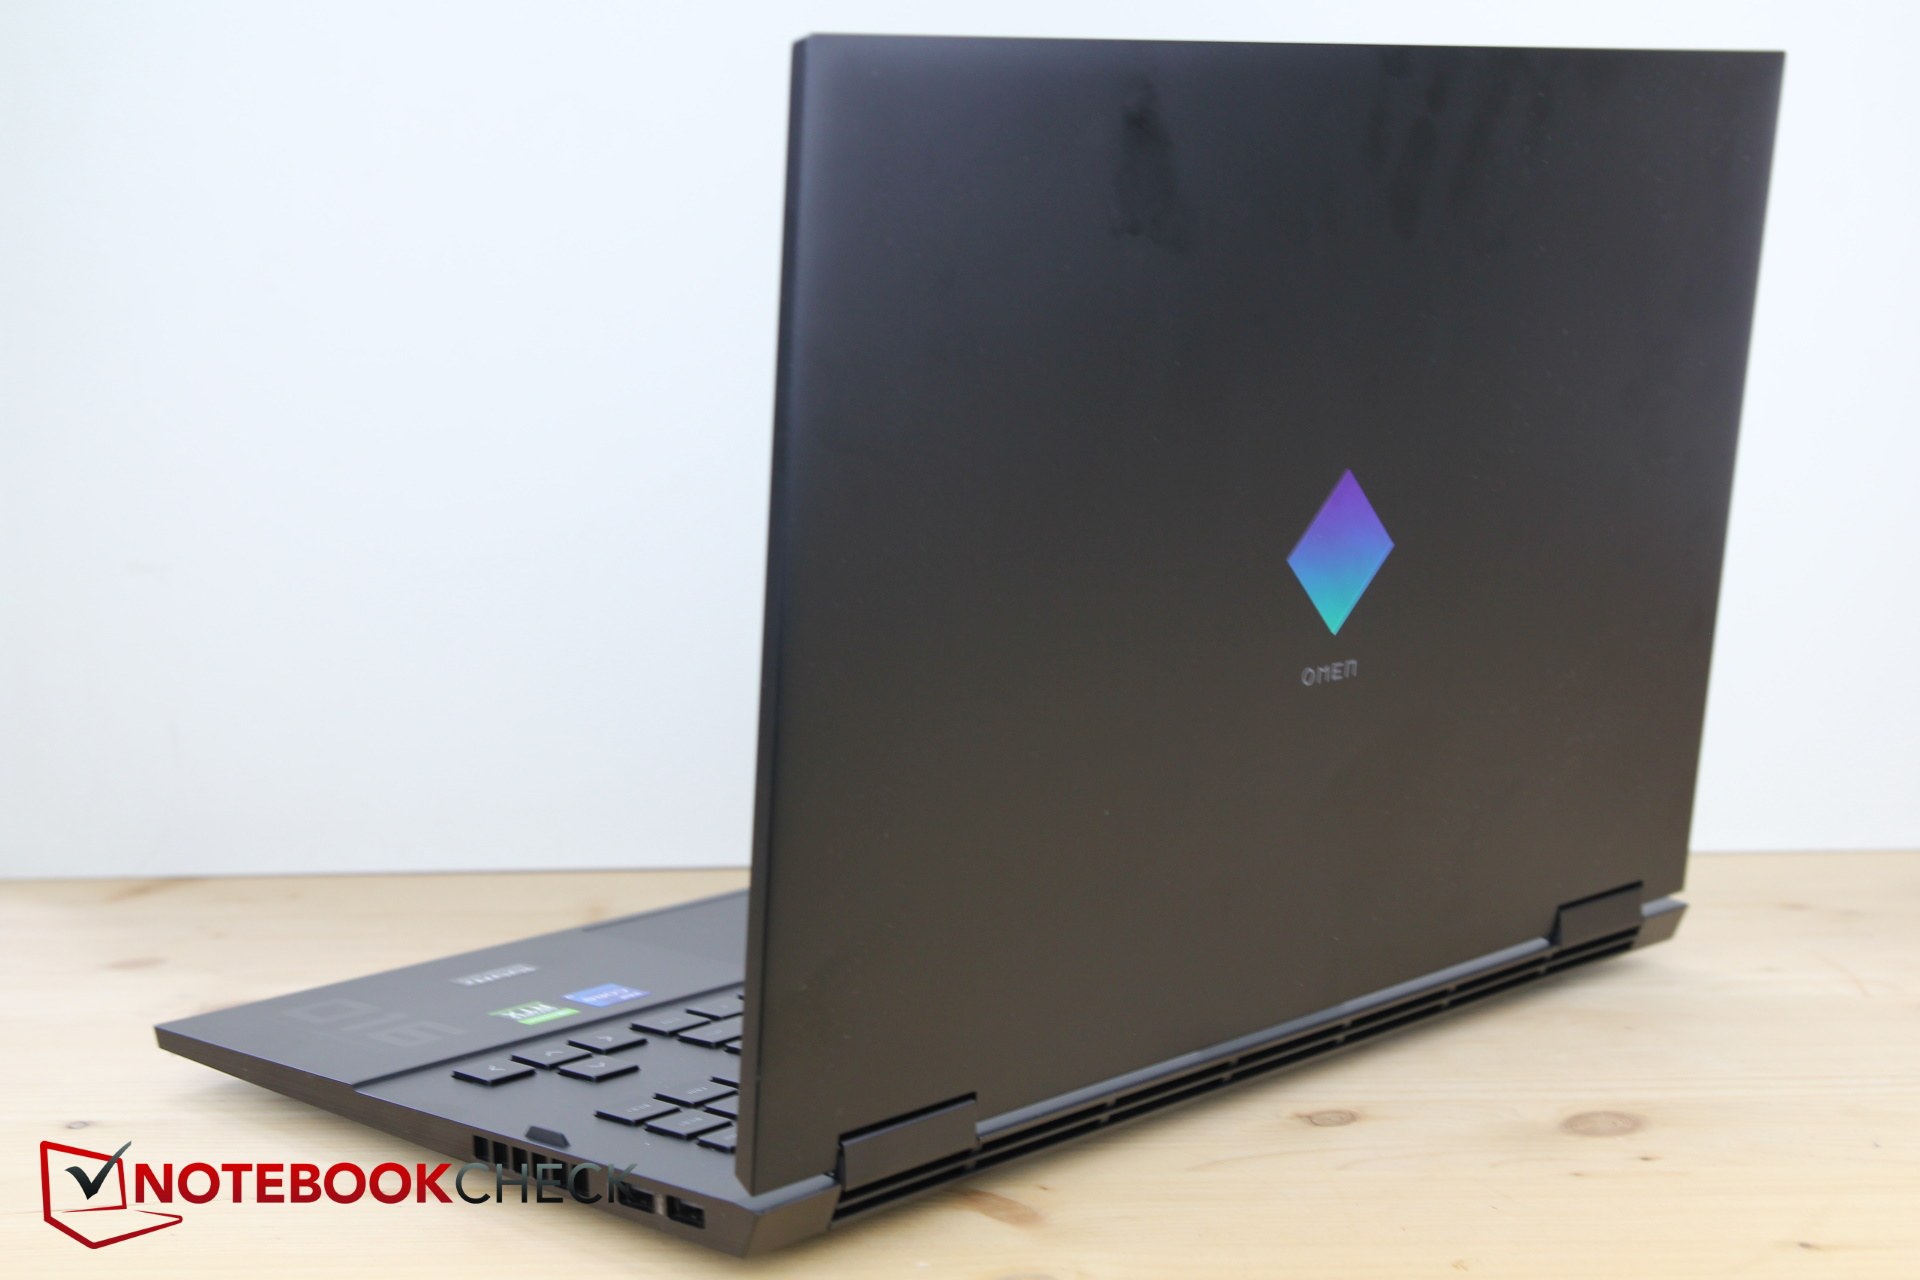
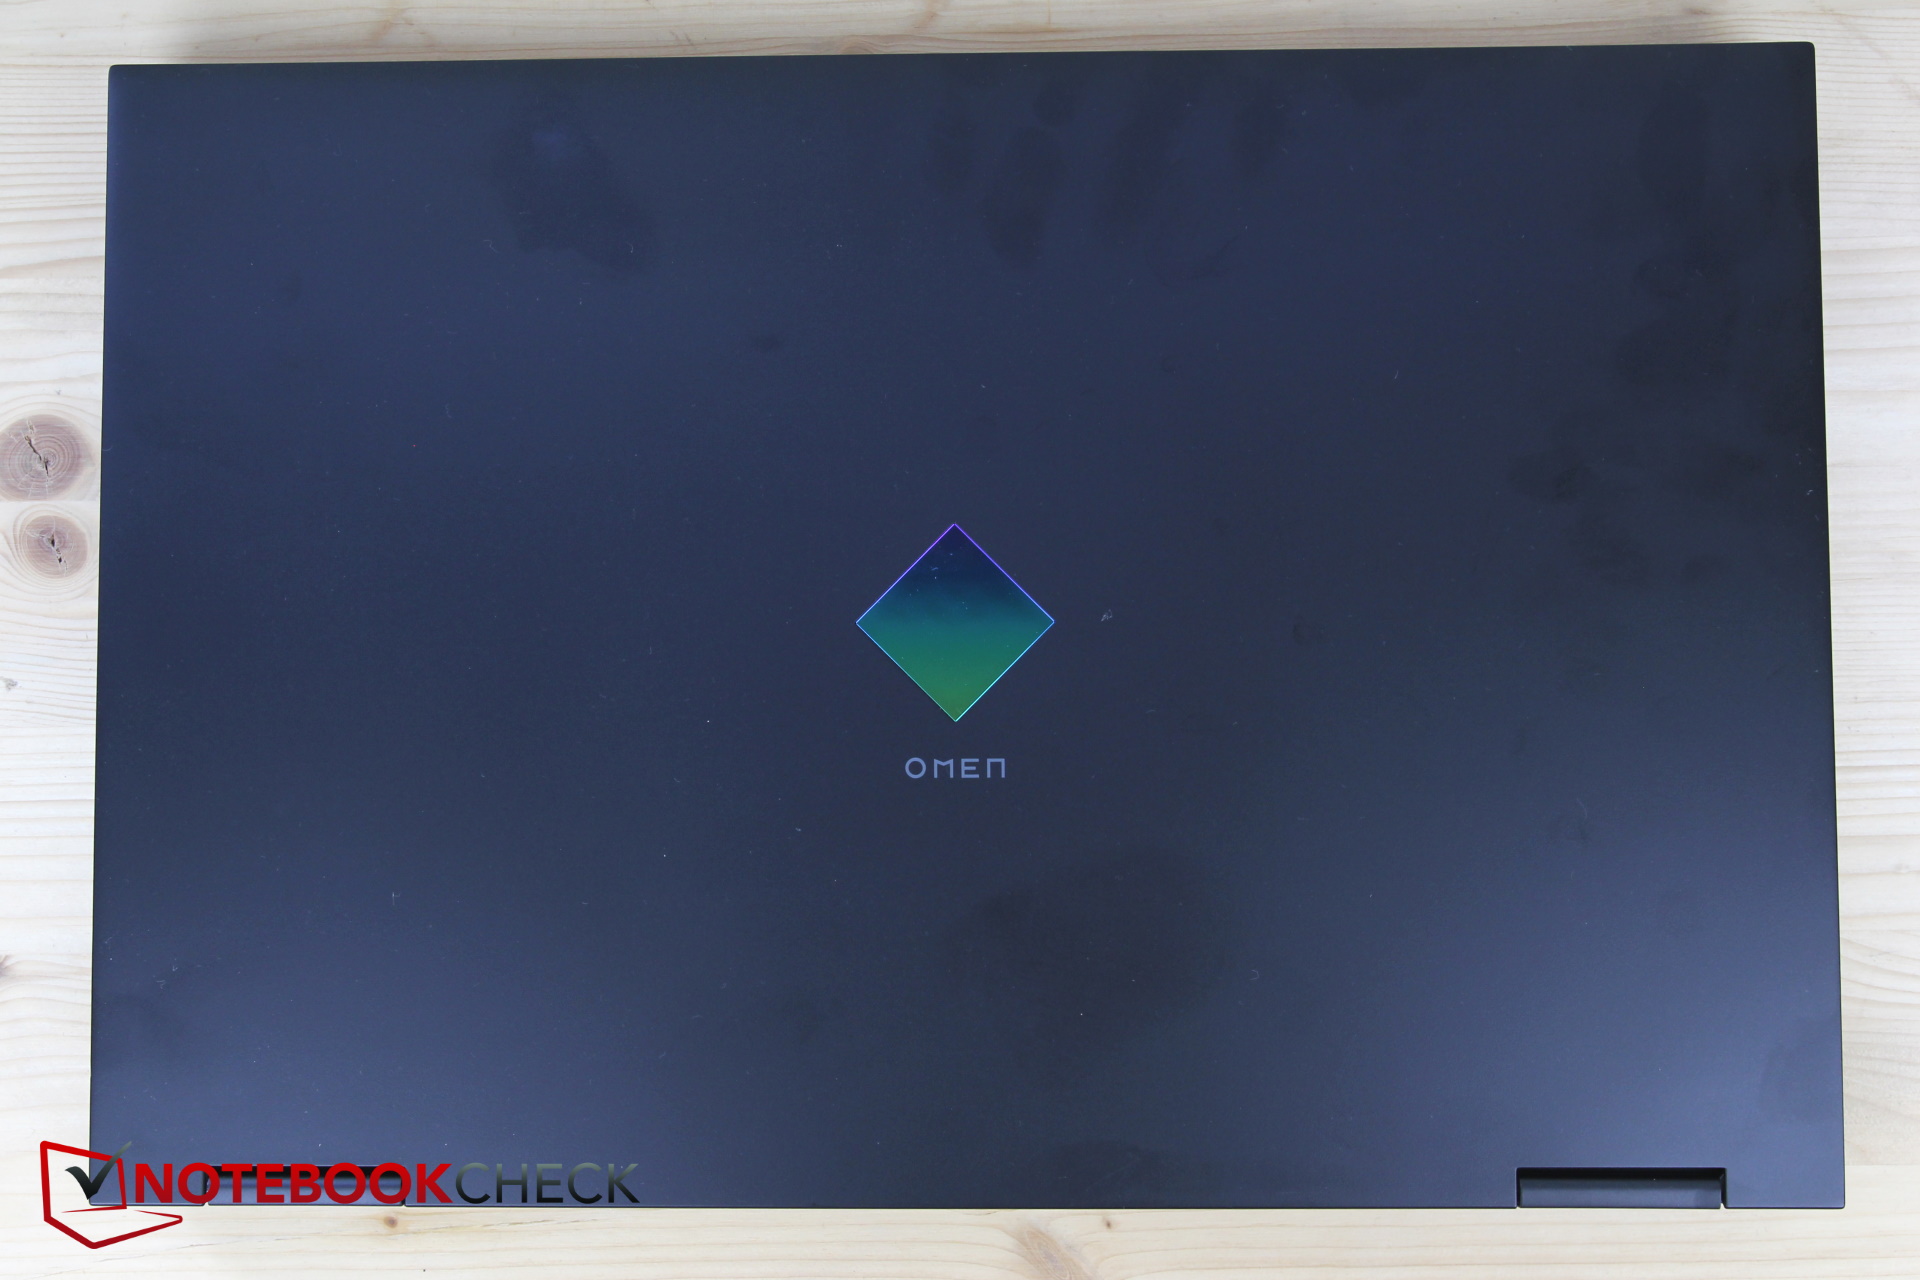
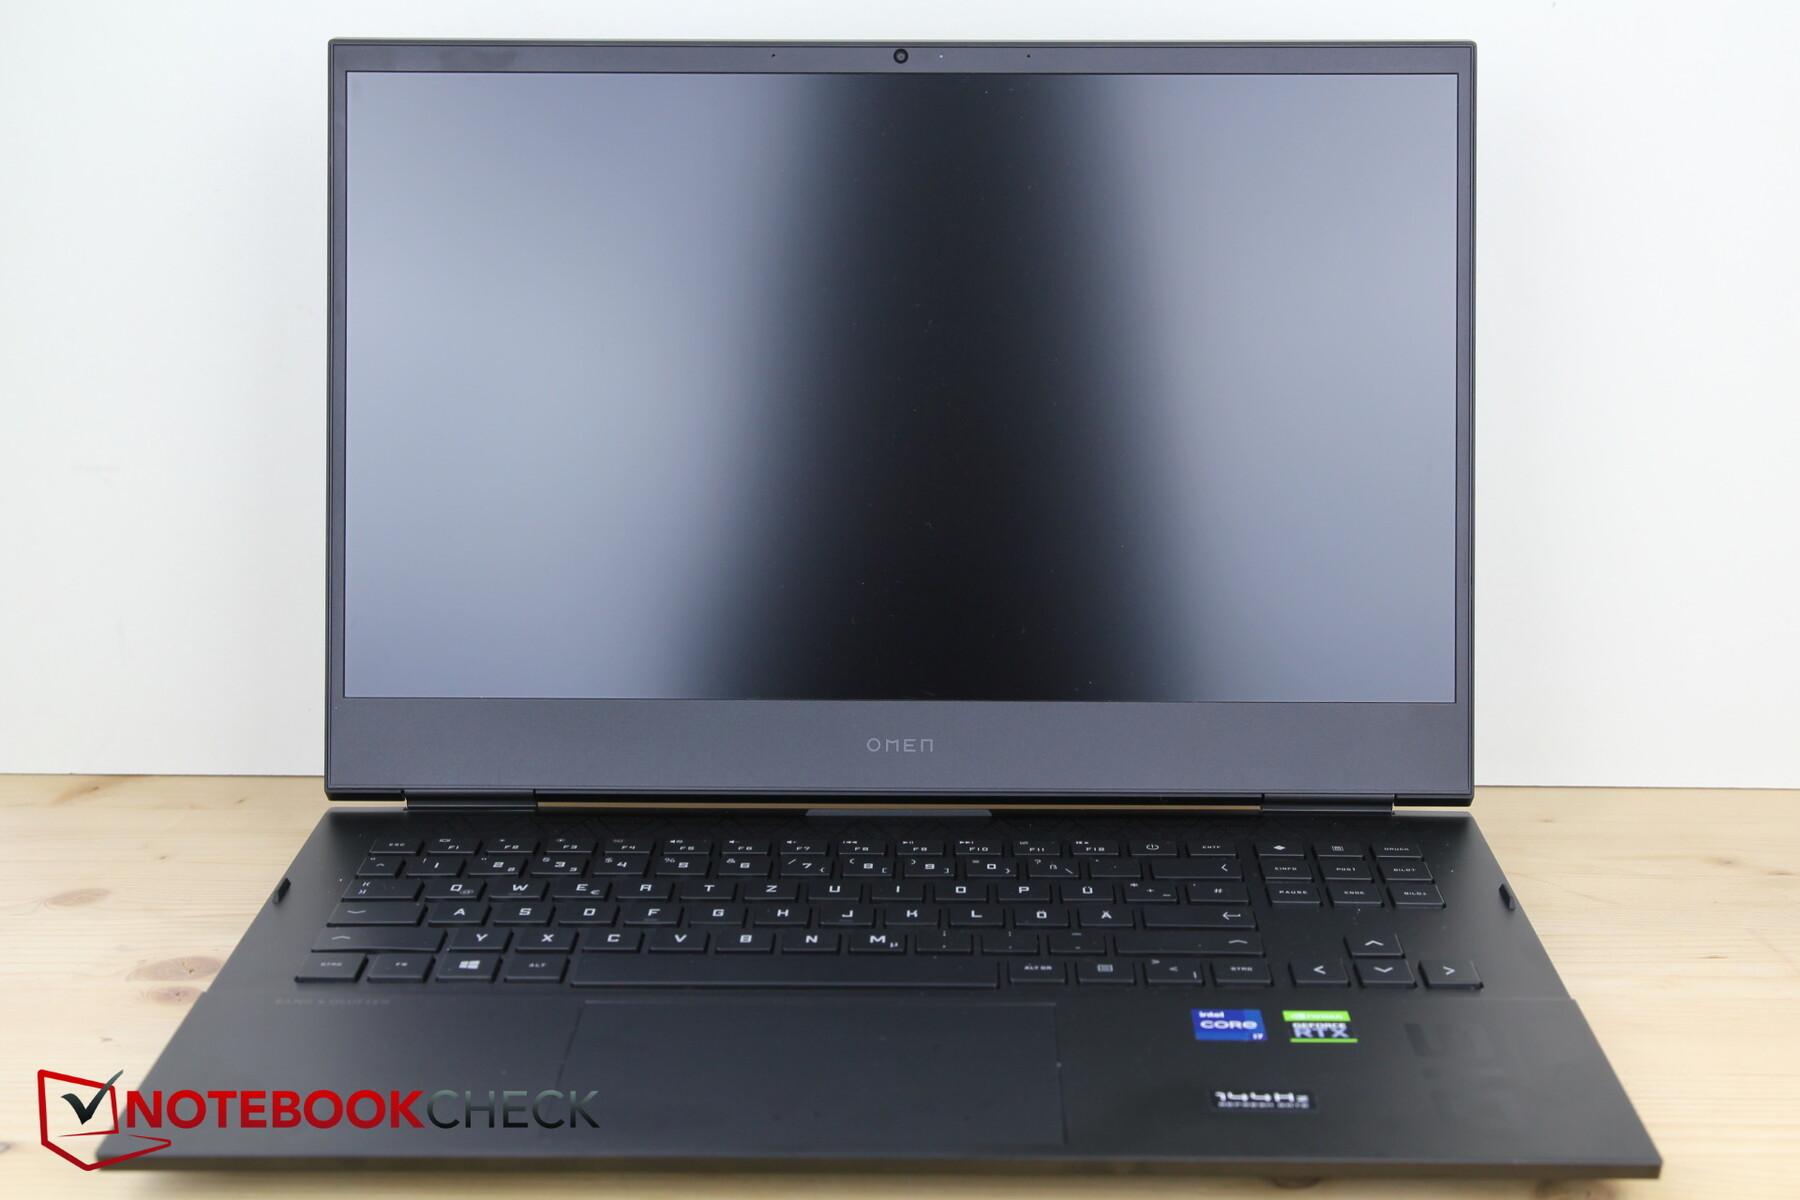
Chassis - Small Updates to the HP Omen
The chassis barely differs from that of last year's model. The differences in, for example, the materials, the port layout, or design changes only become apparent upon closer inspection.
The base now consists almost exclusively of blackened metal and the display frame is made of hard plastic, whereas the bezels are made of softer plastic that is a real fingerprint magnet. While the metal base yields slightly under small amounts of pressure and the display is fairly susceptible to twisting, which then causes heavy light bleeding on the IPS screen, it makes a very solid impression overall.
Although the lid can be opened one-handed, the two hinges could have been firmer to better prevent teetering.
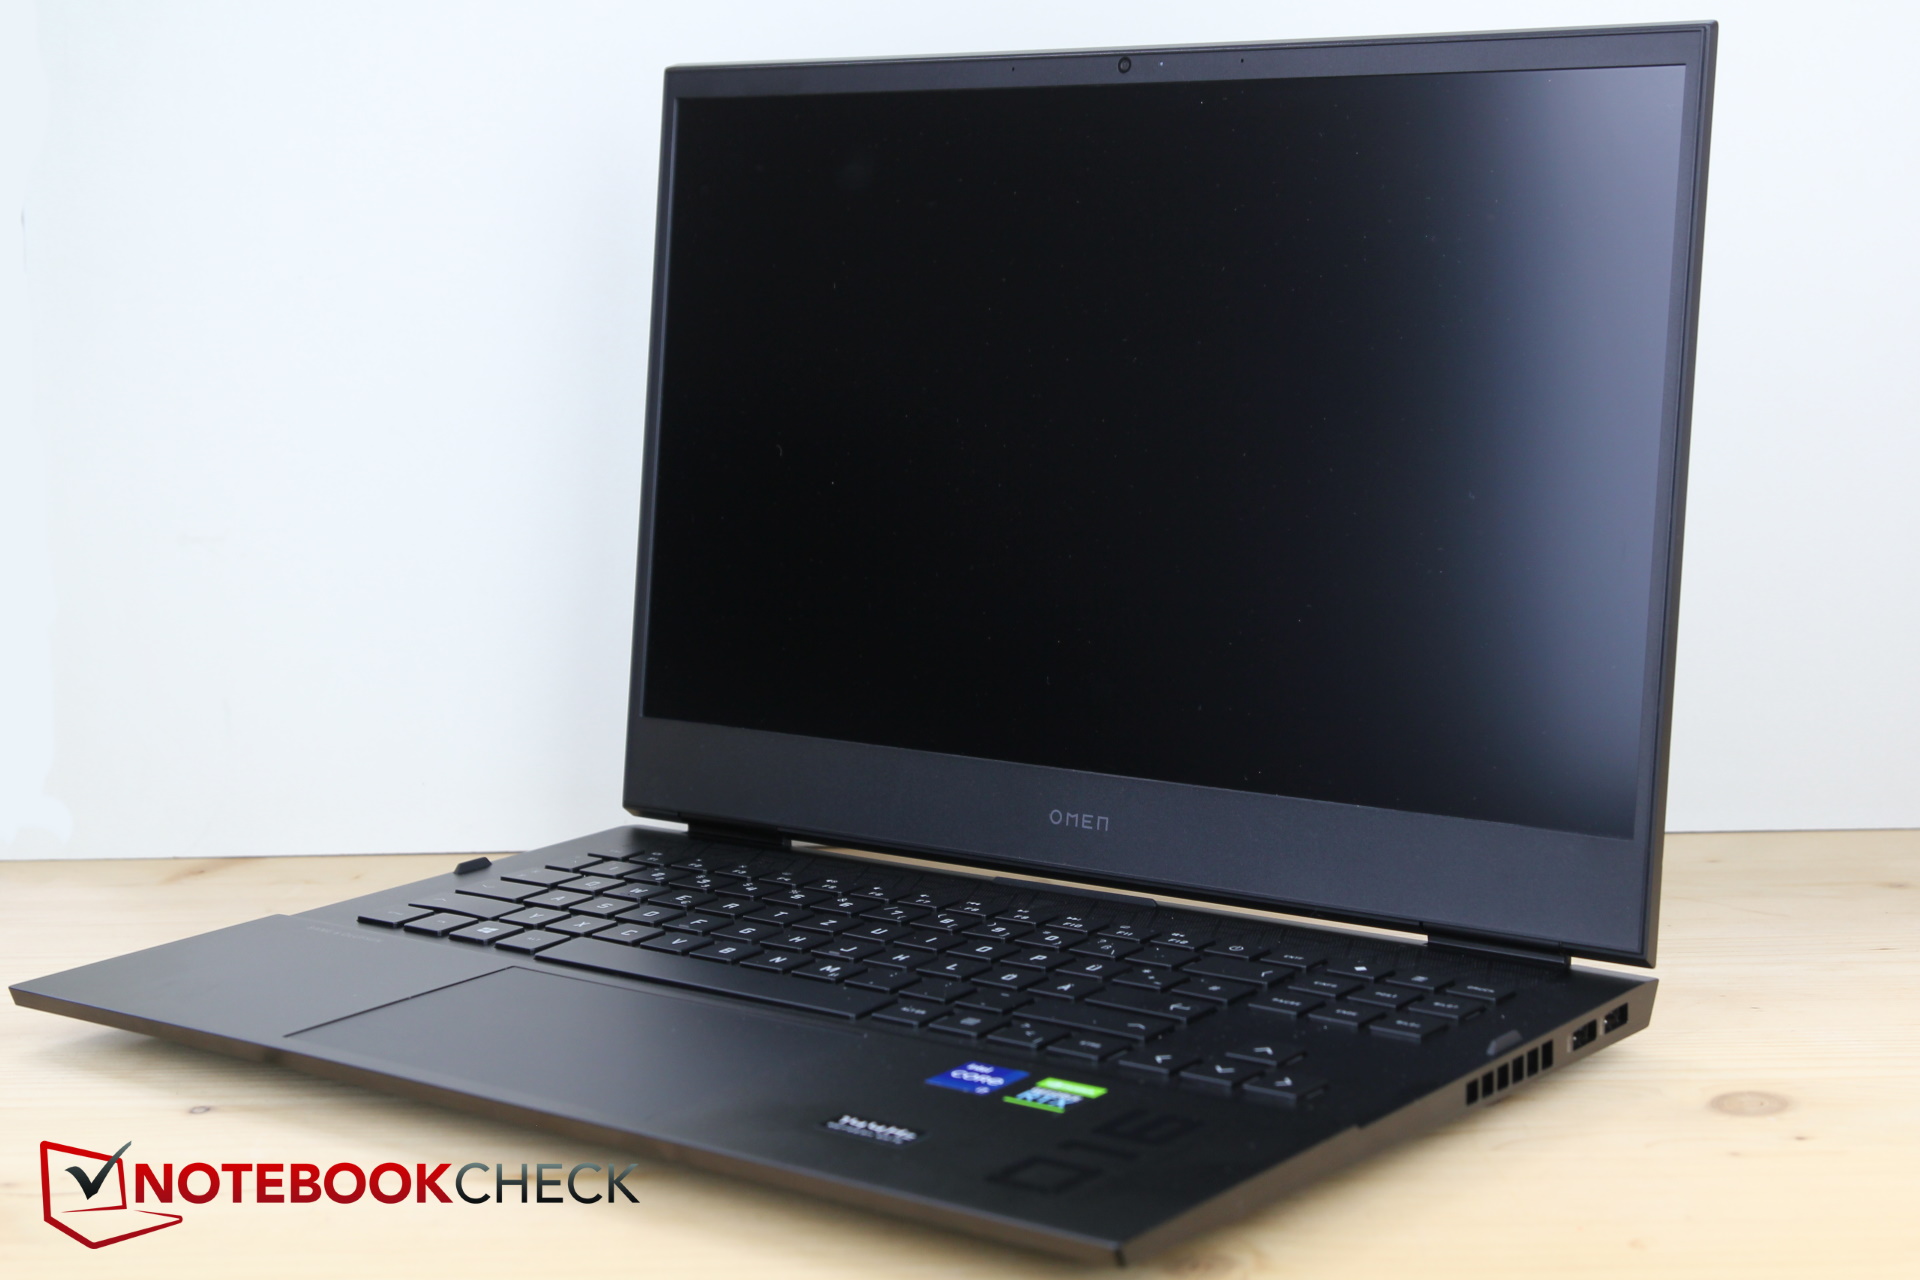
Compared to the Omen 15, the Omen 16 is slightly wider and deeper. While being around the same width, the HP Victus is longer in depth by around 1 cm. However, other 15-inch competitors are not necessarily more compact. While the Omen 16 and Victus 16 are wider than the 15-inch models, both the Legion 5 Pro and the Alienware are longer in depth.
Finally, the Omen 16 has gained 200 g (~7 oz) compared to the Omen 15, which still makes it lighter than most competitors.
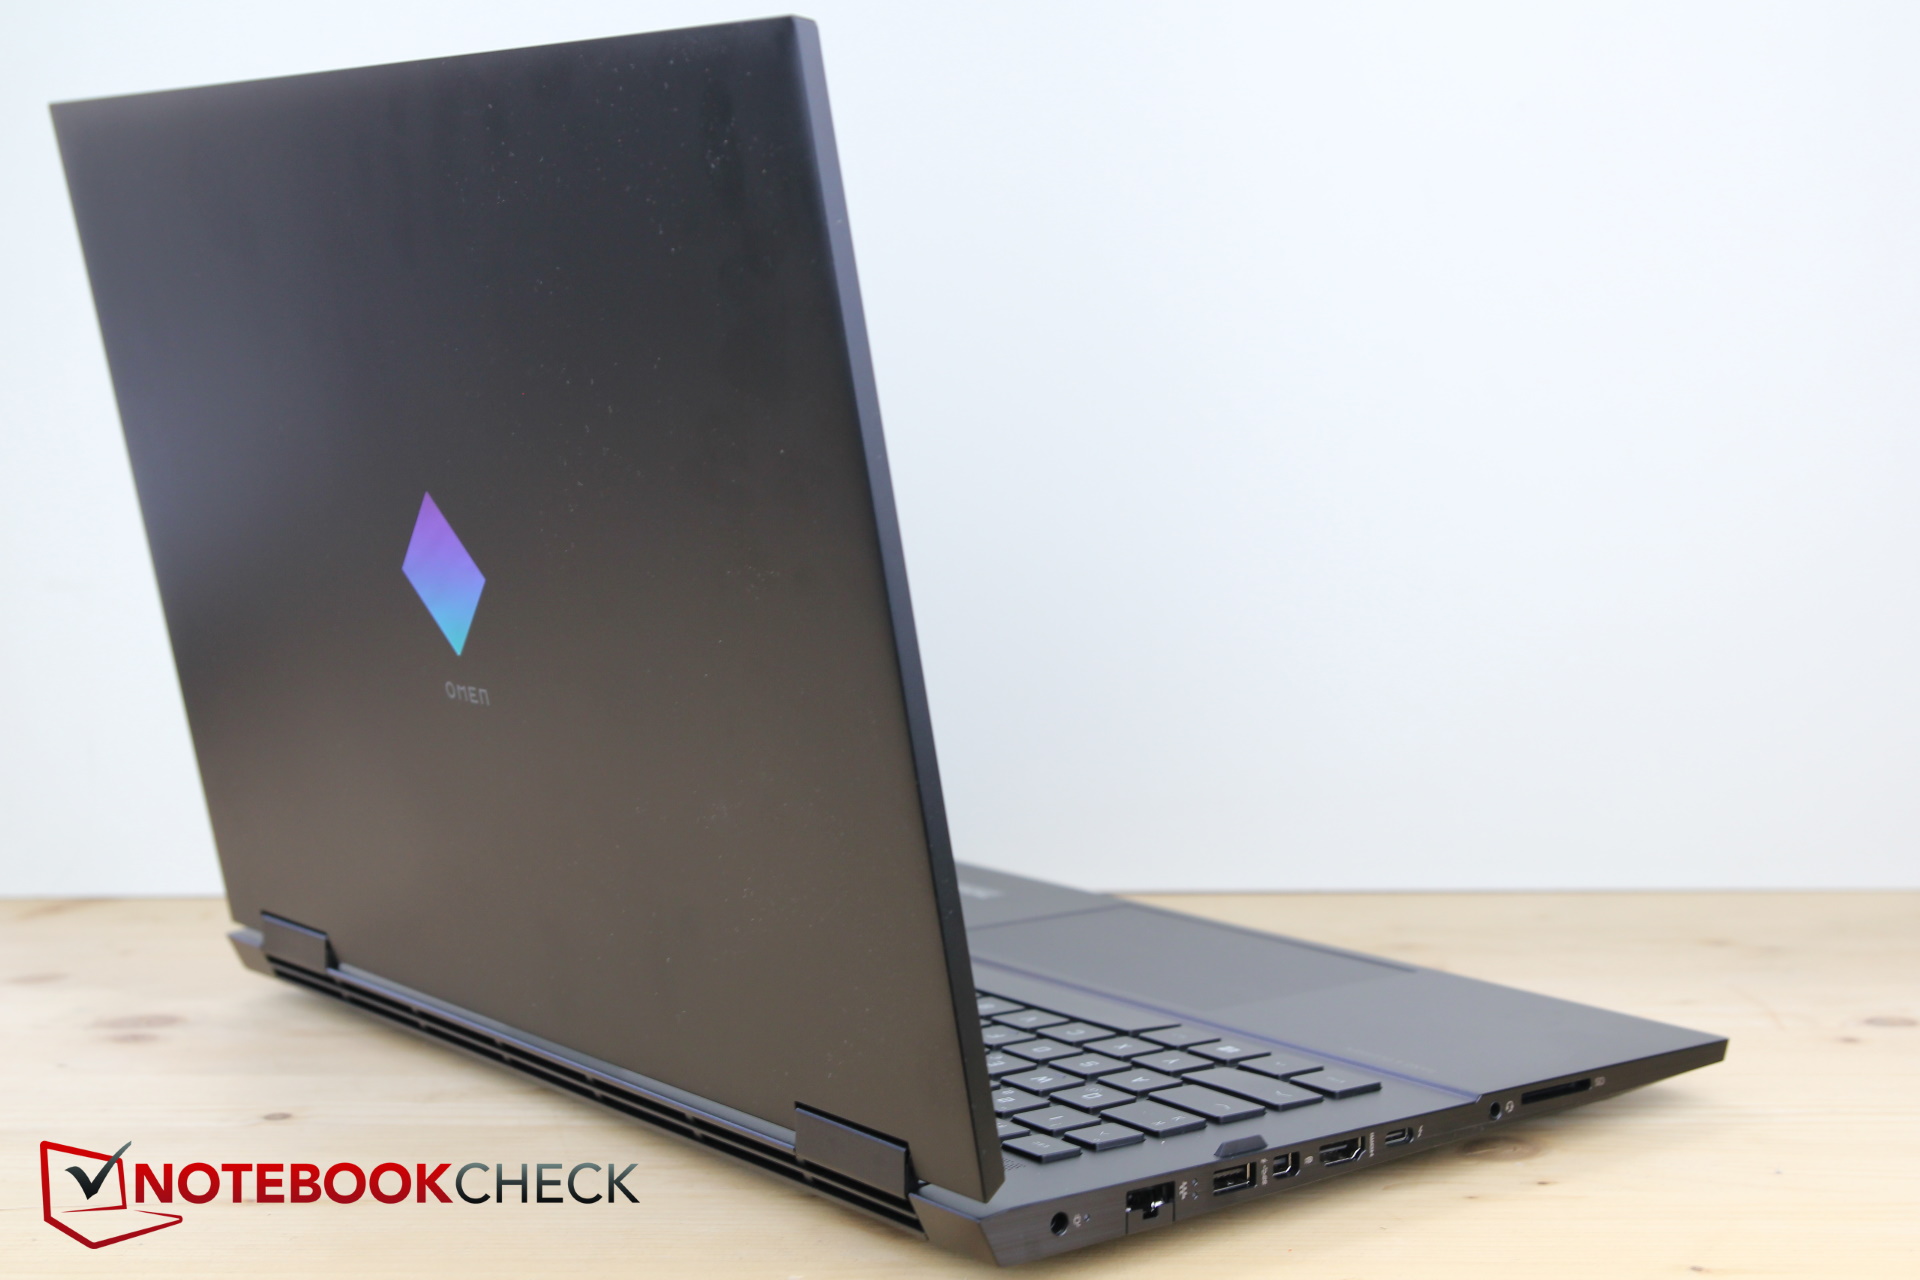
Connectivity - Thunderbolt 4, Otherwise Only USB 3.0
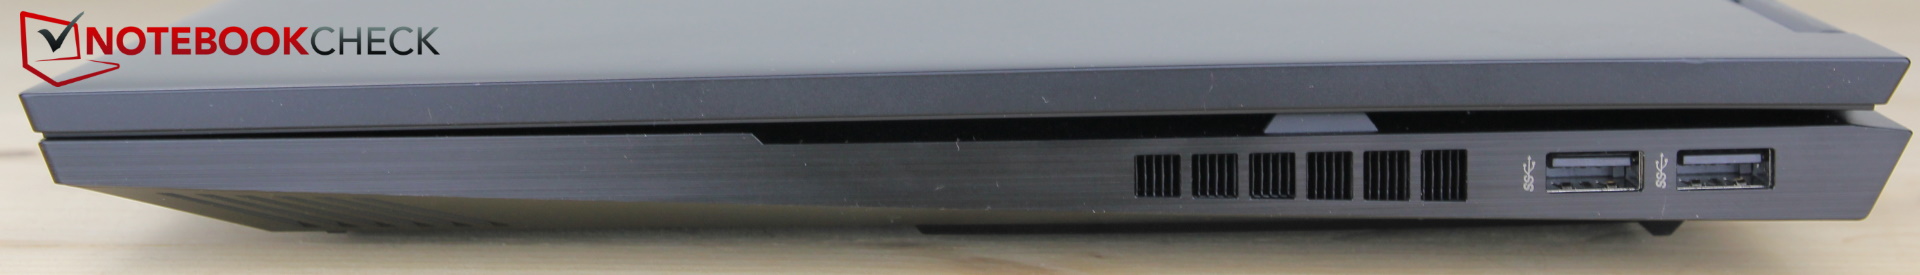
Although right-handed users will be happy to hear that there are only two USB-A ports at the very top of the chassis' right side, there is so little space between them that even just a small slider USB flash drive would not fit next to an even smaller USB mouse cable.
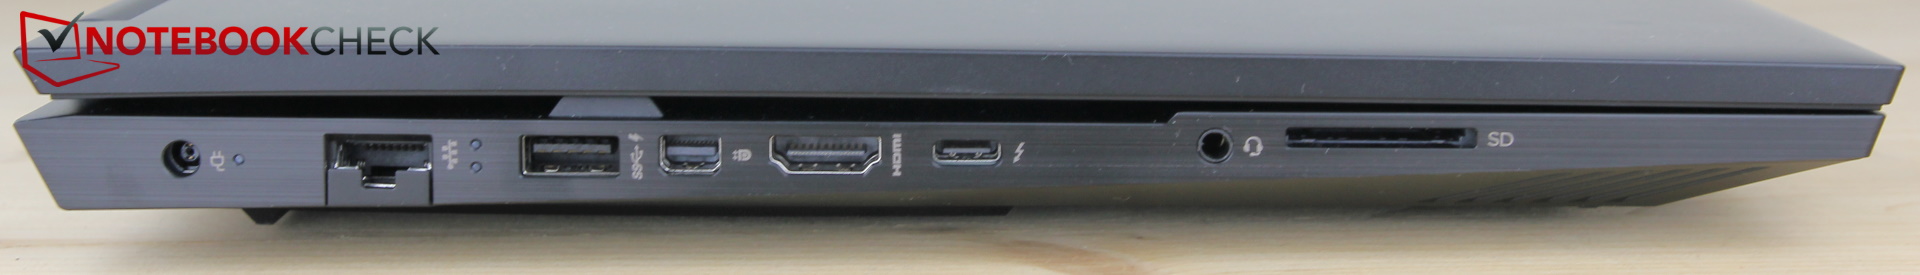
The remainder of the ports are located on the left and very tightly spaced as well, which may result in cables obstructing nearby interfaces. Thankfully, the distribution (such as miniDP next to USB-A) should mostly counteract this problem. There are no ports on the front or back.
The USB 4 port with Thunderbolt 4 and type-C form factor is a plus. Even though the remaining three USB-A ports have been labeled "Superspeed" by HP, they only support the 3.0 standard.
The spring-loaded card reader accepts full-size SD cards. They disappear almost fully inside the case and do not unnecessarily protrude from the it.
SD Card Reader
The SD card reader's transfer speeds tend to be below-average. Copying 1 GB of pictures from our reference memory card, the AV PRO microSD 128 GB V60, to the desktop takes almost 18 seconds. On average, gaming laptops from our database are equipped with significantly faster models with the more expensive Alienware showing what is possible in terms of speeds. On the other end of the spectrum there are the Lenovo and the MSI, both of which come without an SD card reader.
| SD Card Reader | |
| average JPG Copy Test (av. of 3 runs) | |
| Alienware x15 RTX 3070 P111F (AV Pro V60) | |
| Average of class Gaming (20 - 210, n=63, last 2 years) | |
| HP Victus 16-e0179ng (AV PRO microSD 128 GB V60) | |
| HP Omen 15-en0375ng (Toshiba Exceria Pro SDXC 64 GB UHS-II) | |
| HP Omen 16-b0085ng (AV PRO microSD 128 GB V60) | |
| maximum AS SSD Seq Read Test (1GB) | |
| Alienware x15 RTX 3070 P111F (AV Pro V60) | |
| Average of class Gaming (25.5 - 261, n=60, last 2 years) | |
| HP Omen 15-en0375ng (Toshiba Exceria Pro SDXC 64 GB UHS-II) | |
| HP Omen 16-b0085ng (AV PRO microSD 128 GB V60) | |
| HP Victus 16-e0179ng (AV PRO microSD 128 GB V60) | |
Communication
Aside from 1-Gbps LAN, the Omen 16 also supports Wi-Fi 6E via its Intel AX210 module. The latter is capable of Gigabit speeds and only falls short of our expectations by a small margin.
Webcam
HP has settled for a 720p webcam. With HP Wide Vision, the camera captures an 88 degree angle, resulting in a lot of the environment being visible instead of one person filling the screen. This may or may not be desirable for video calls.
The quality otherwise matches the low market standards with a relatively grainy image and washed-out colors. The auto brightness acts strangely, initially overexposing faces only to harshly adjust the brightness profile a moment later, which makes backgrounds in particular look far too dark.

")
")
Security
The Omen 16 lacks a Kensington lock and a fingerprint sensor. Thanks to the CPU, TPM 2.0 is of course supported.
Accessories and Warranty
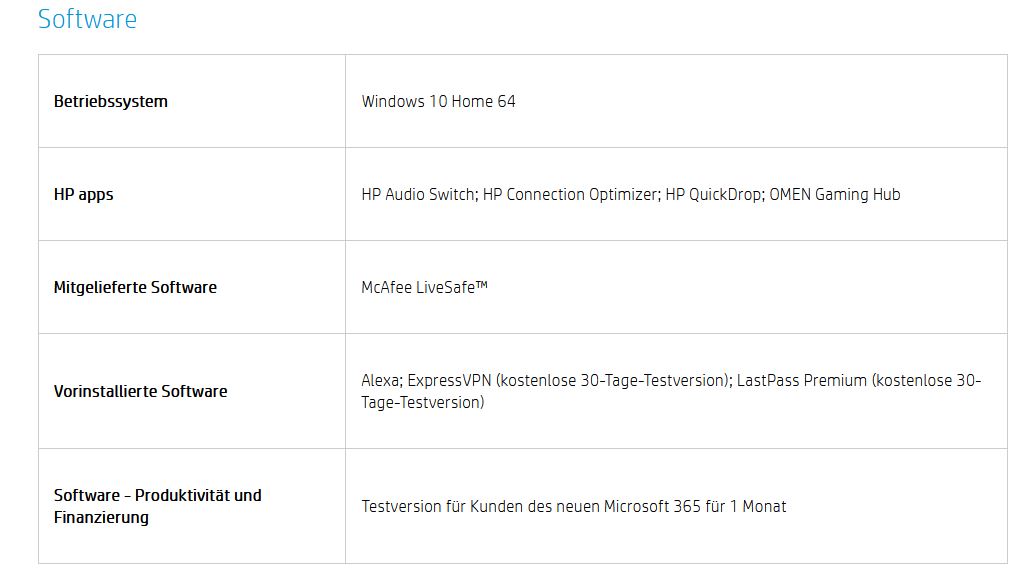
The package contained no additional accessories. The Omen 16 unnecessarily includes preinstalled software trial versions by default such as ExpressVPN (free 30-day trial version), LastPass Premium (free 30-day trial version) and a 1-month license for Microsoft 365. Users annoyed by this will have to manually uninstall the applications.
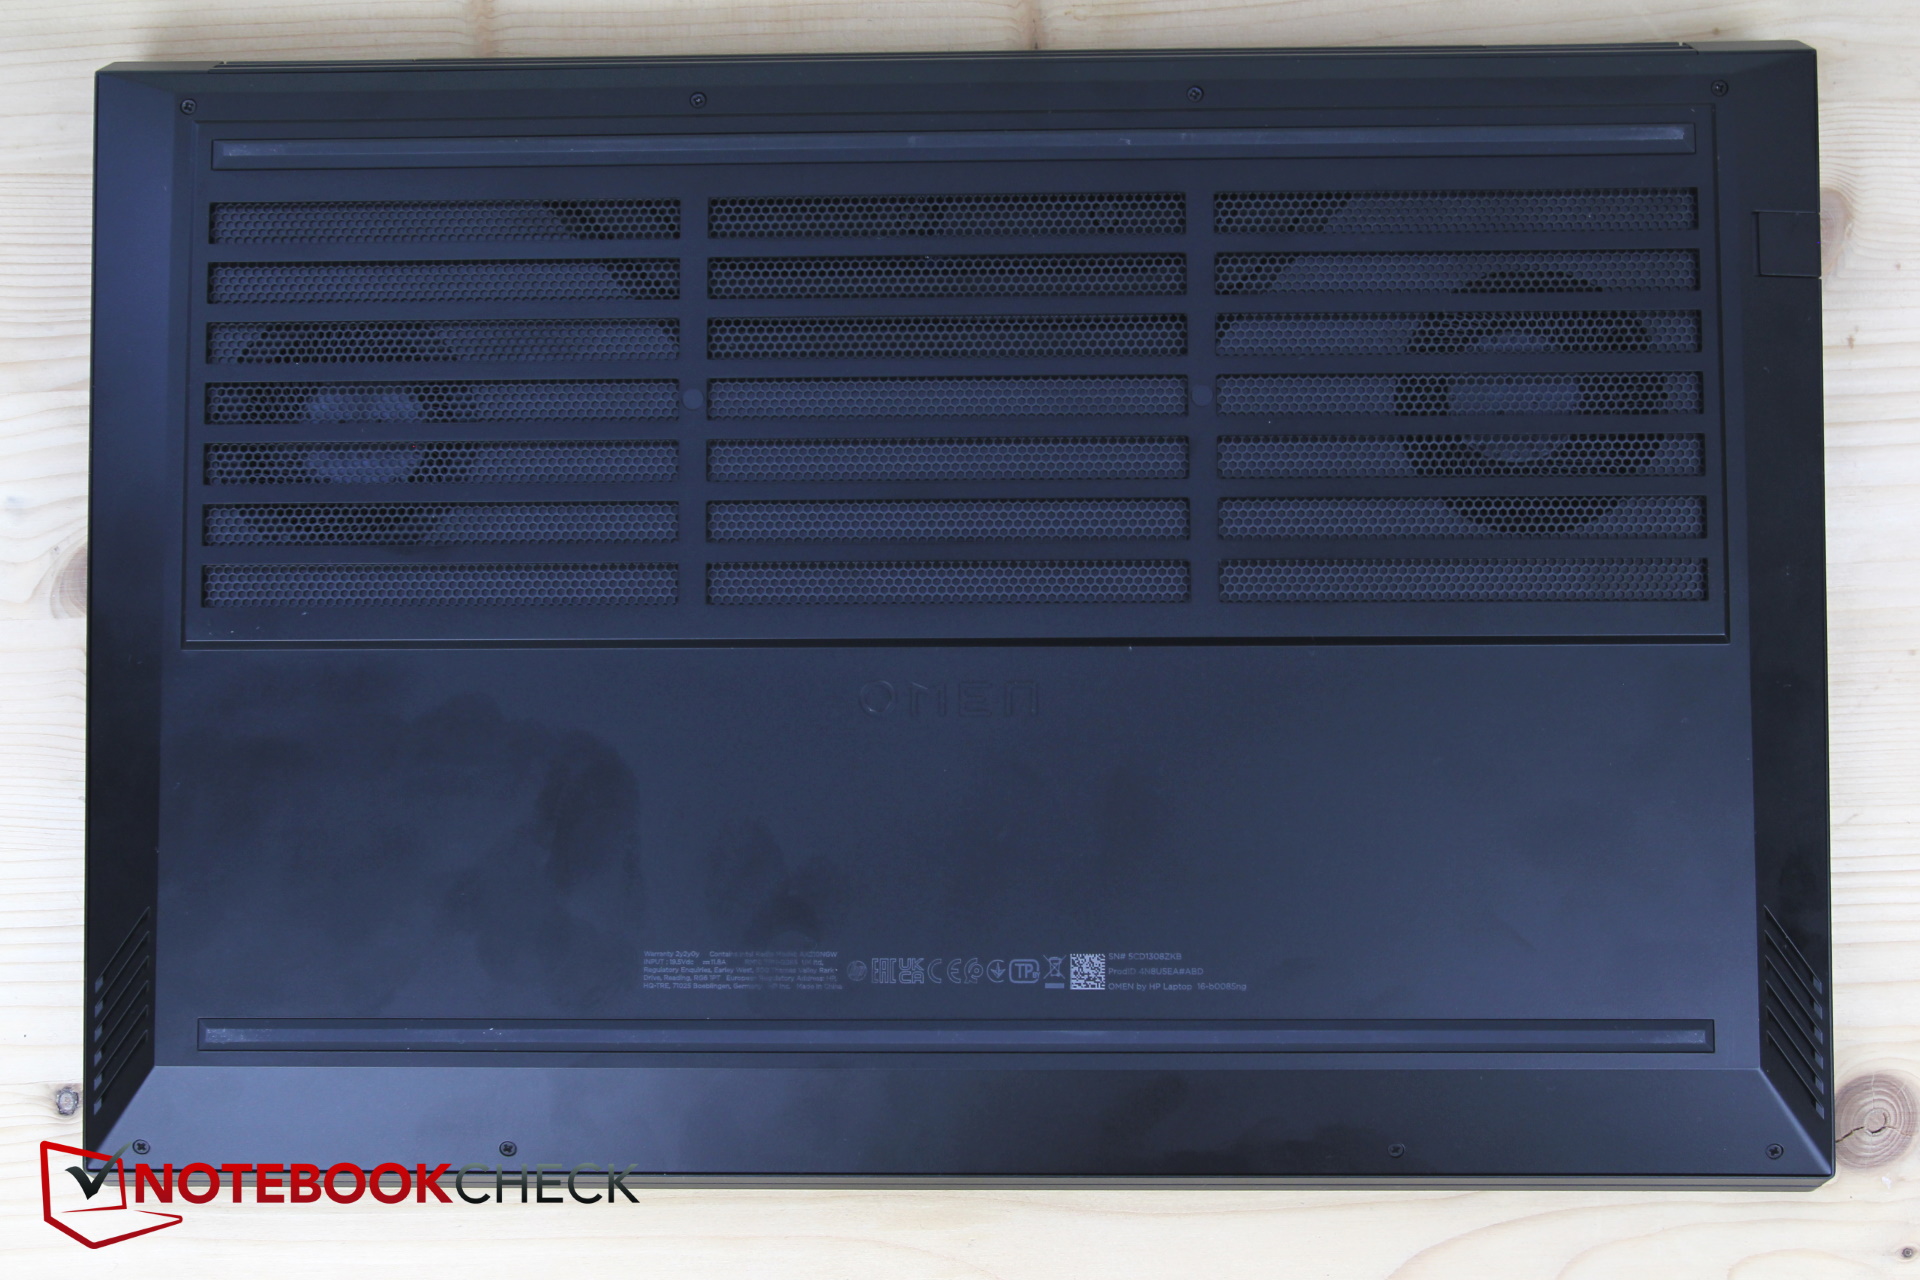
Maintenance
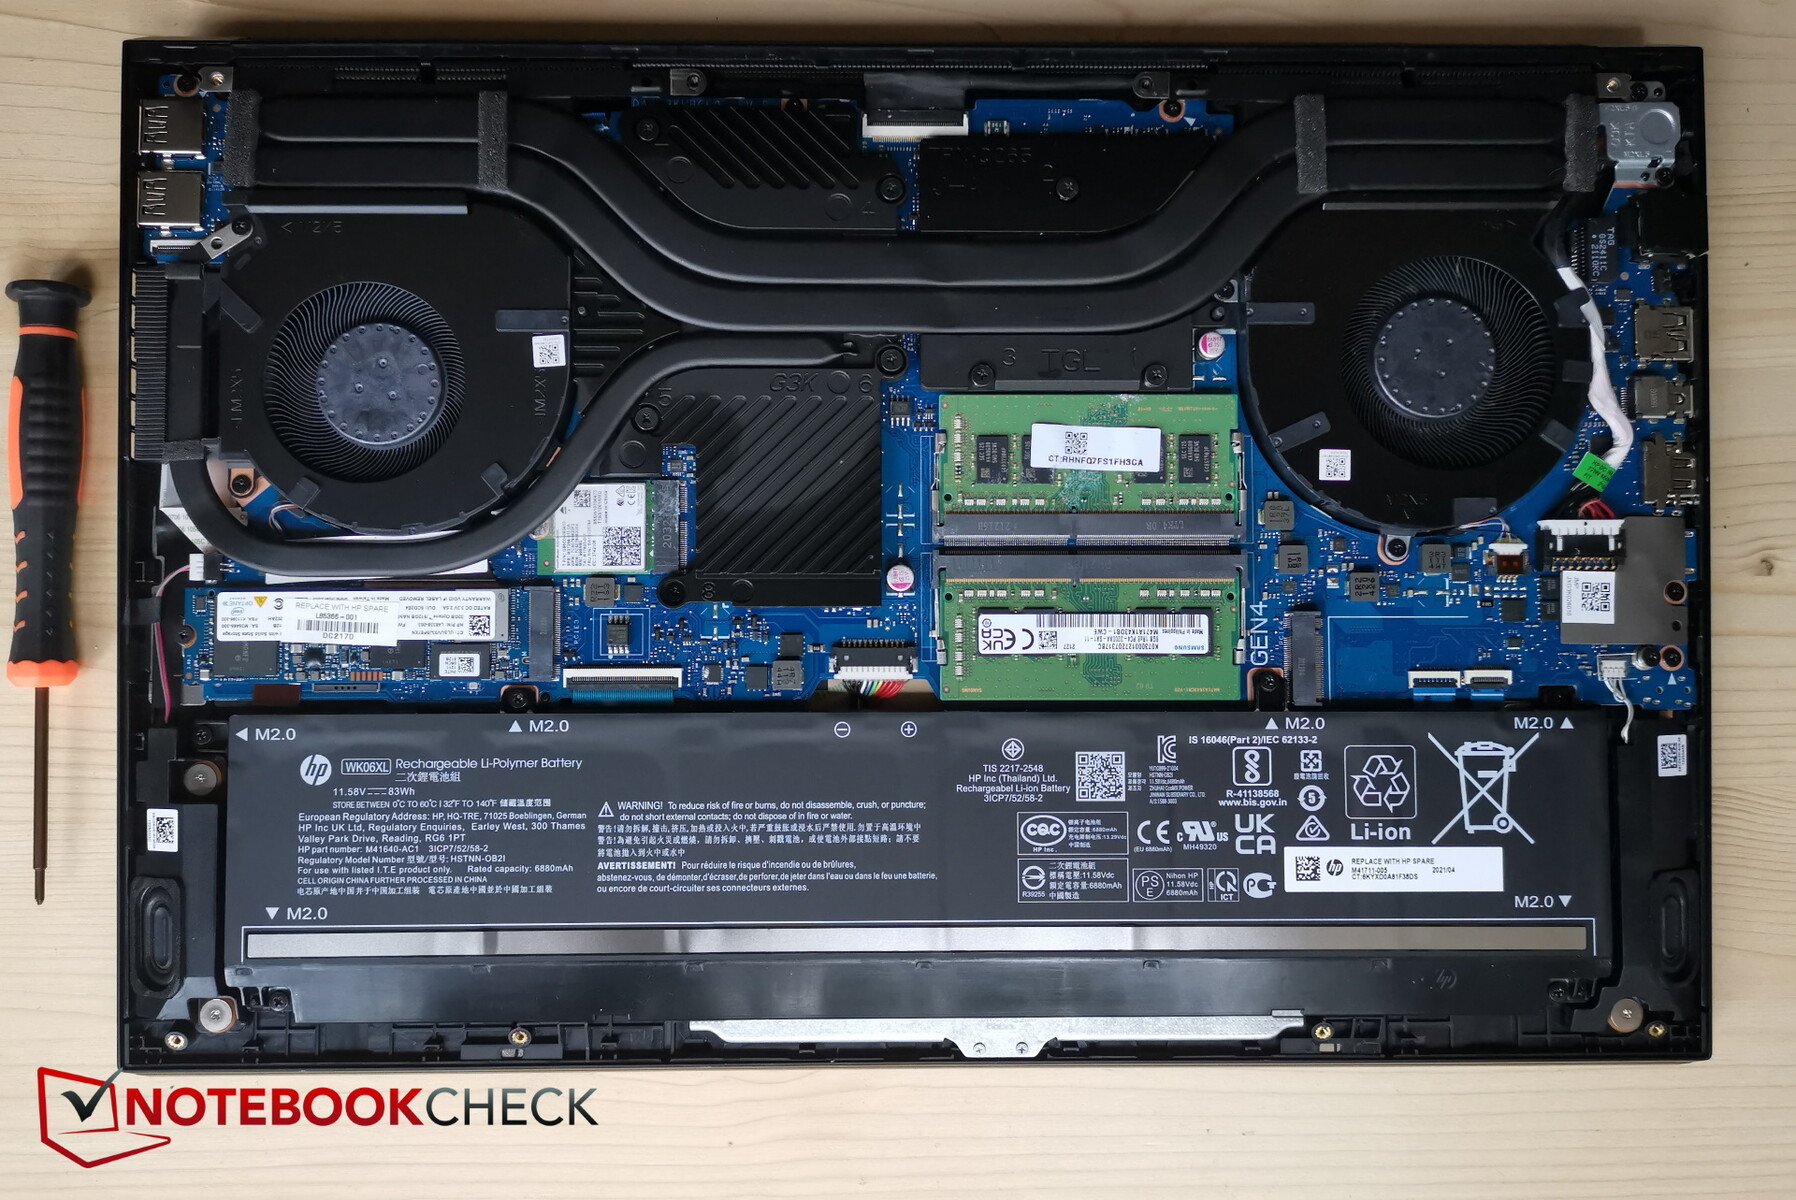
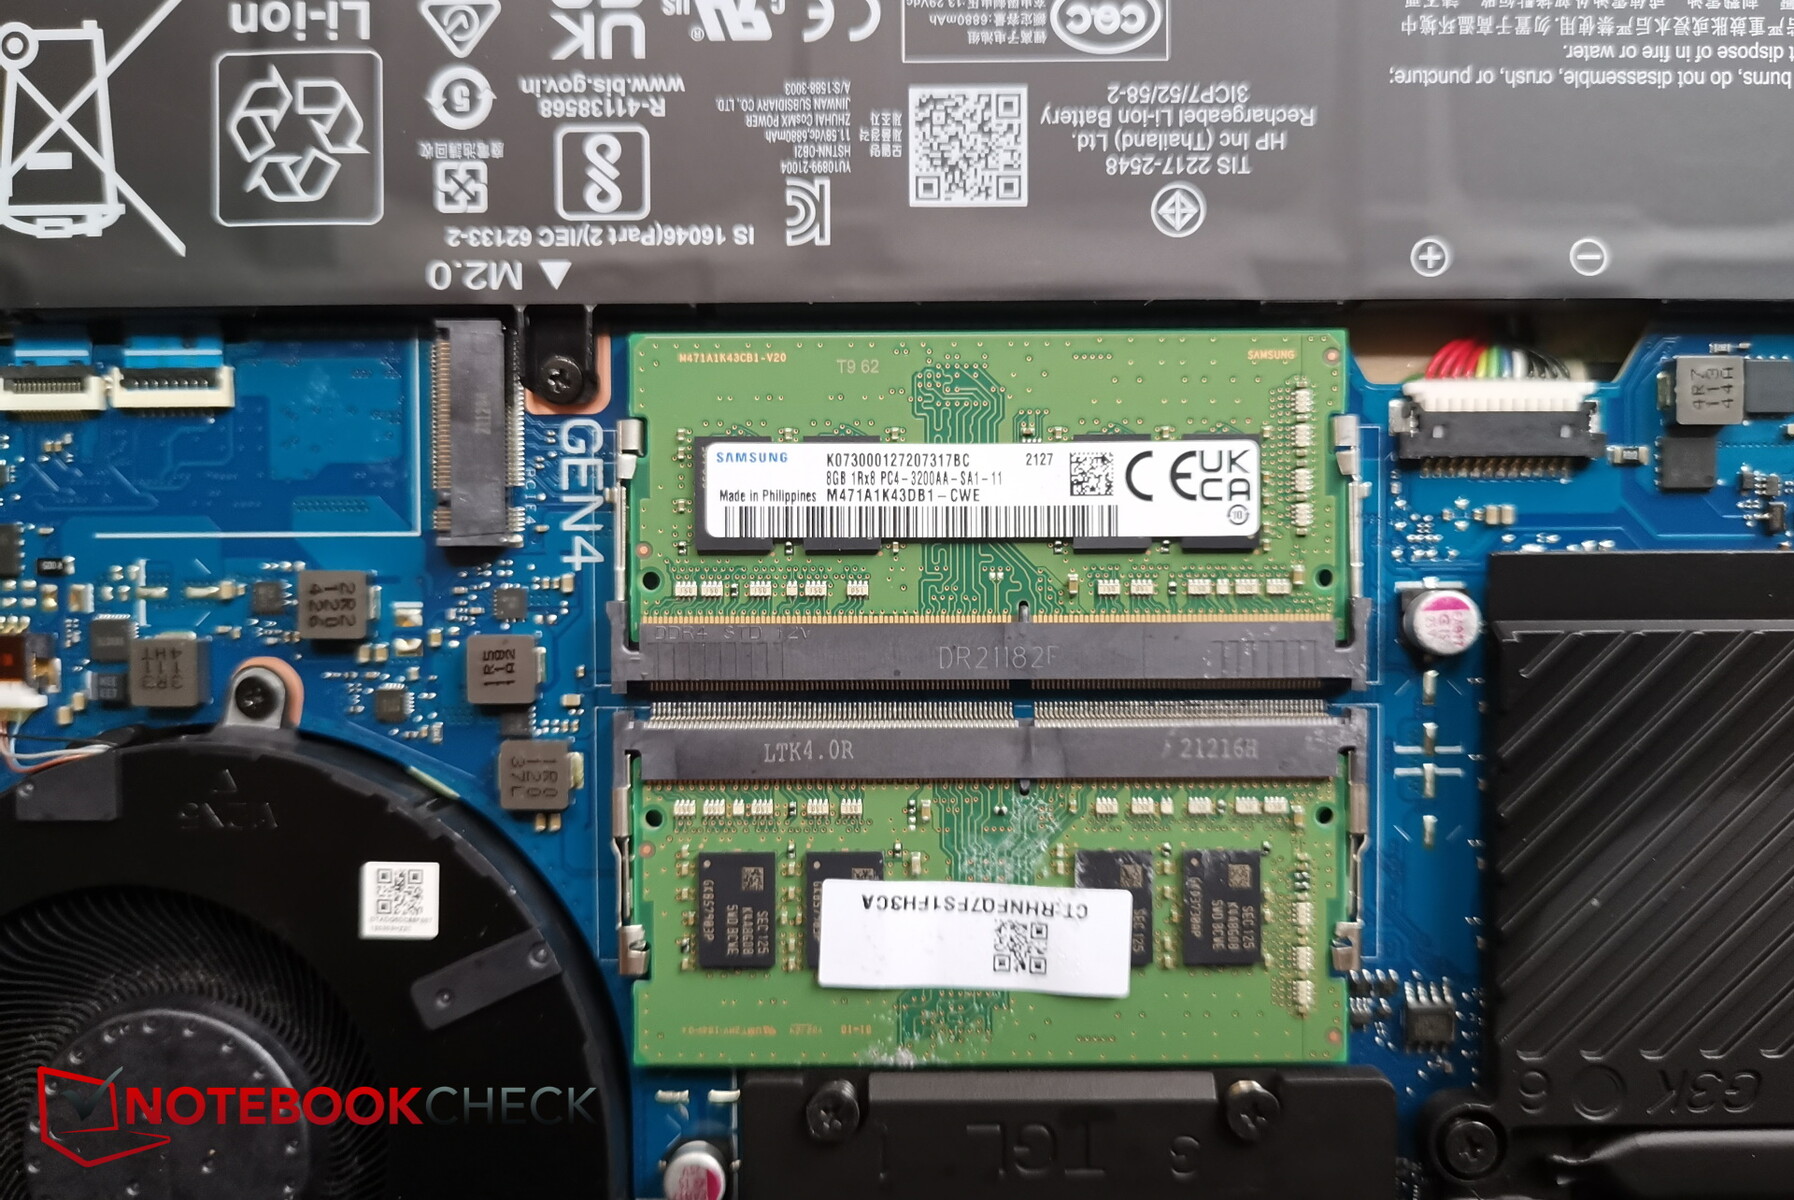
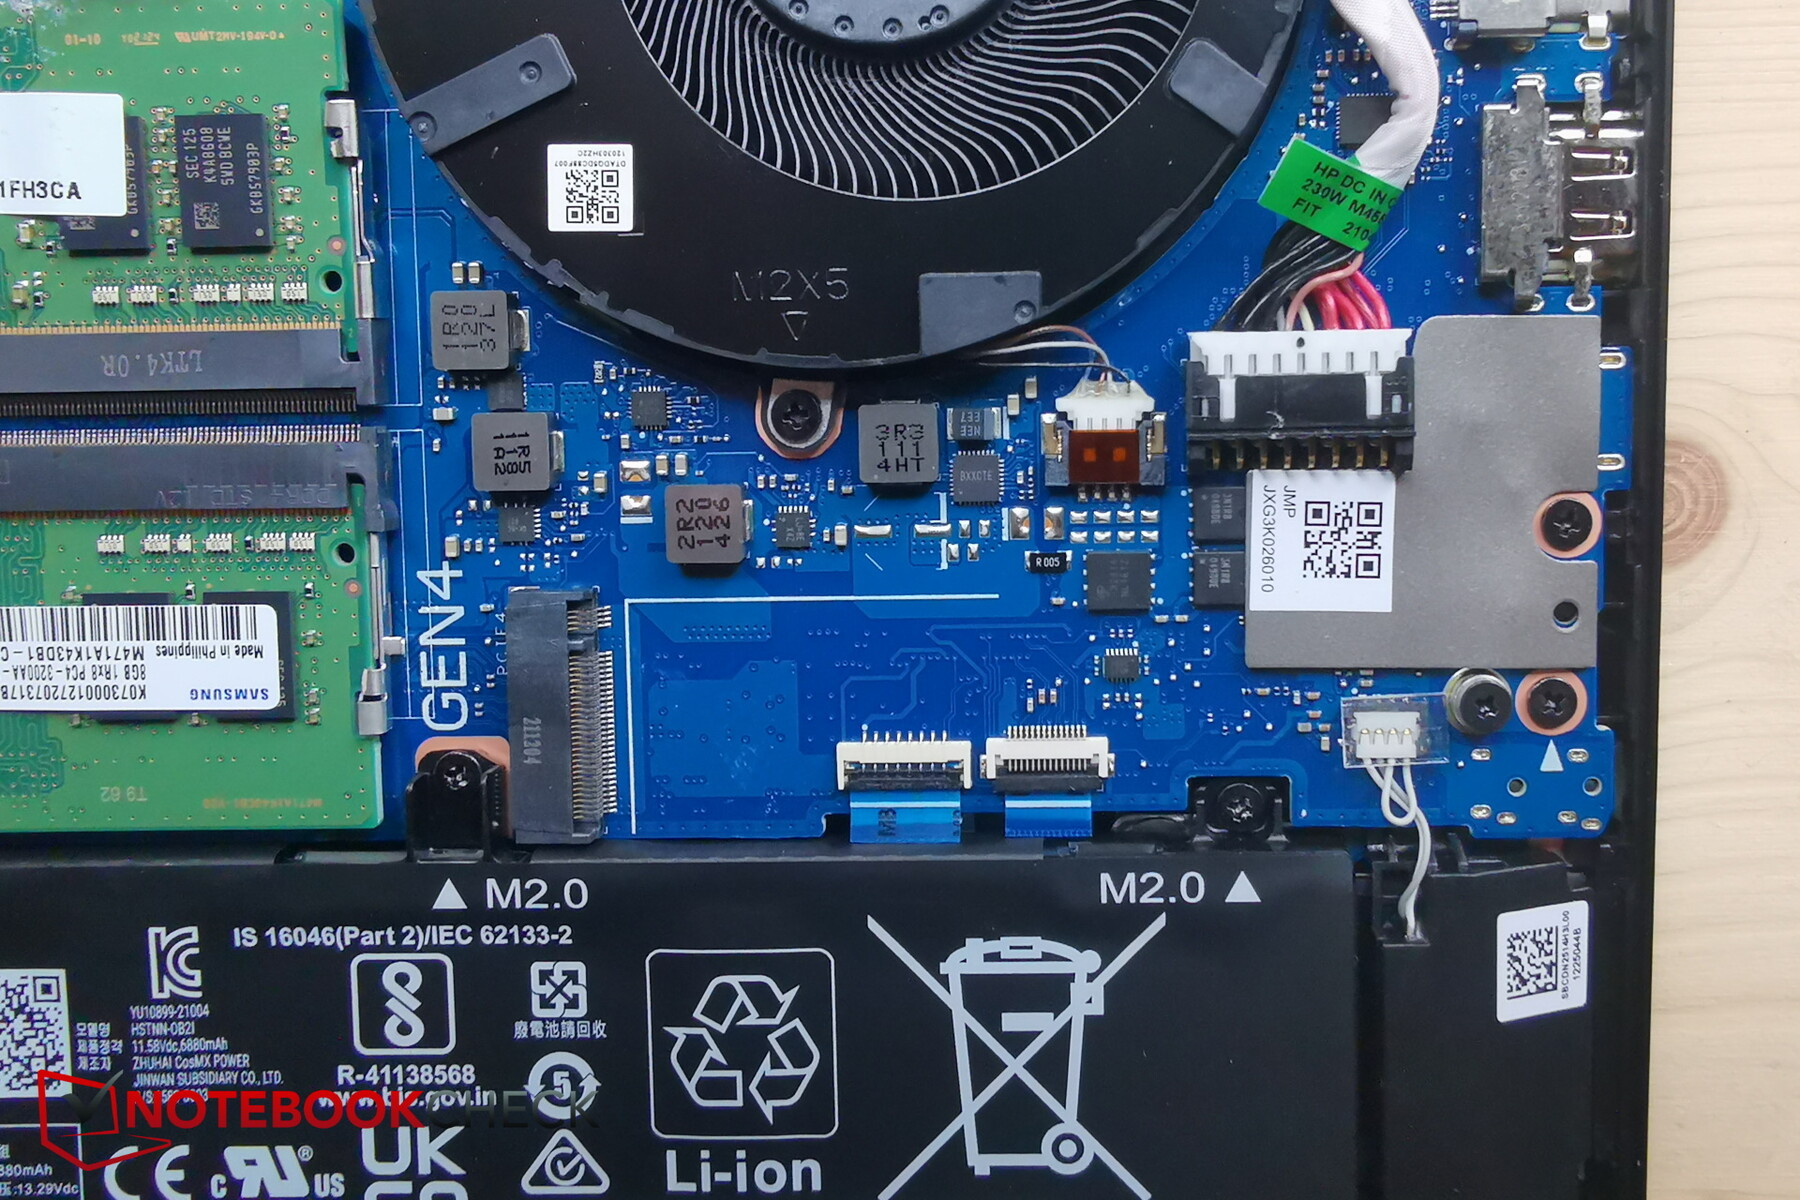
The bottom plate is secured with 8 different sizes of Phillips screws and various clips. Despite the plastic clips, the bottom plate can be removed without any tools - great! Subsequently, users have access to both fans, RAM slots, the Wi-Fi module (partially covered by heatpipes), the battery, the SSD and an additional, unoccupied SSD slot.
Warranty
HP offers a standard 12-month limited hardware warranty with 1 year of limited technical support for software and initial setup. The warranty can be extended with options such as on-site hardware support, if desired.
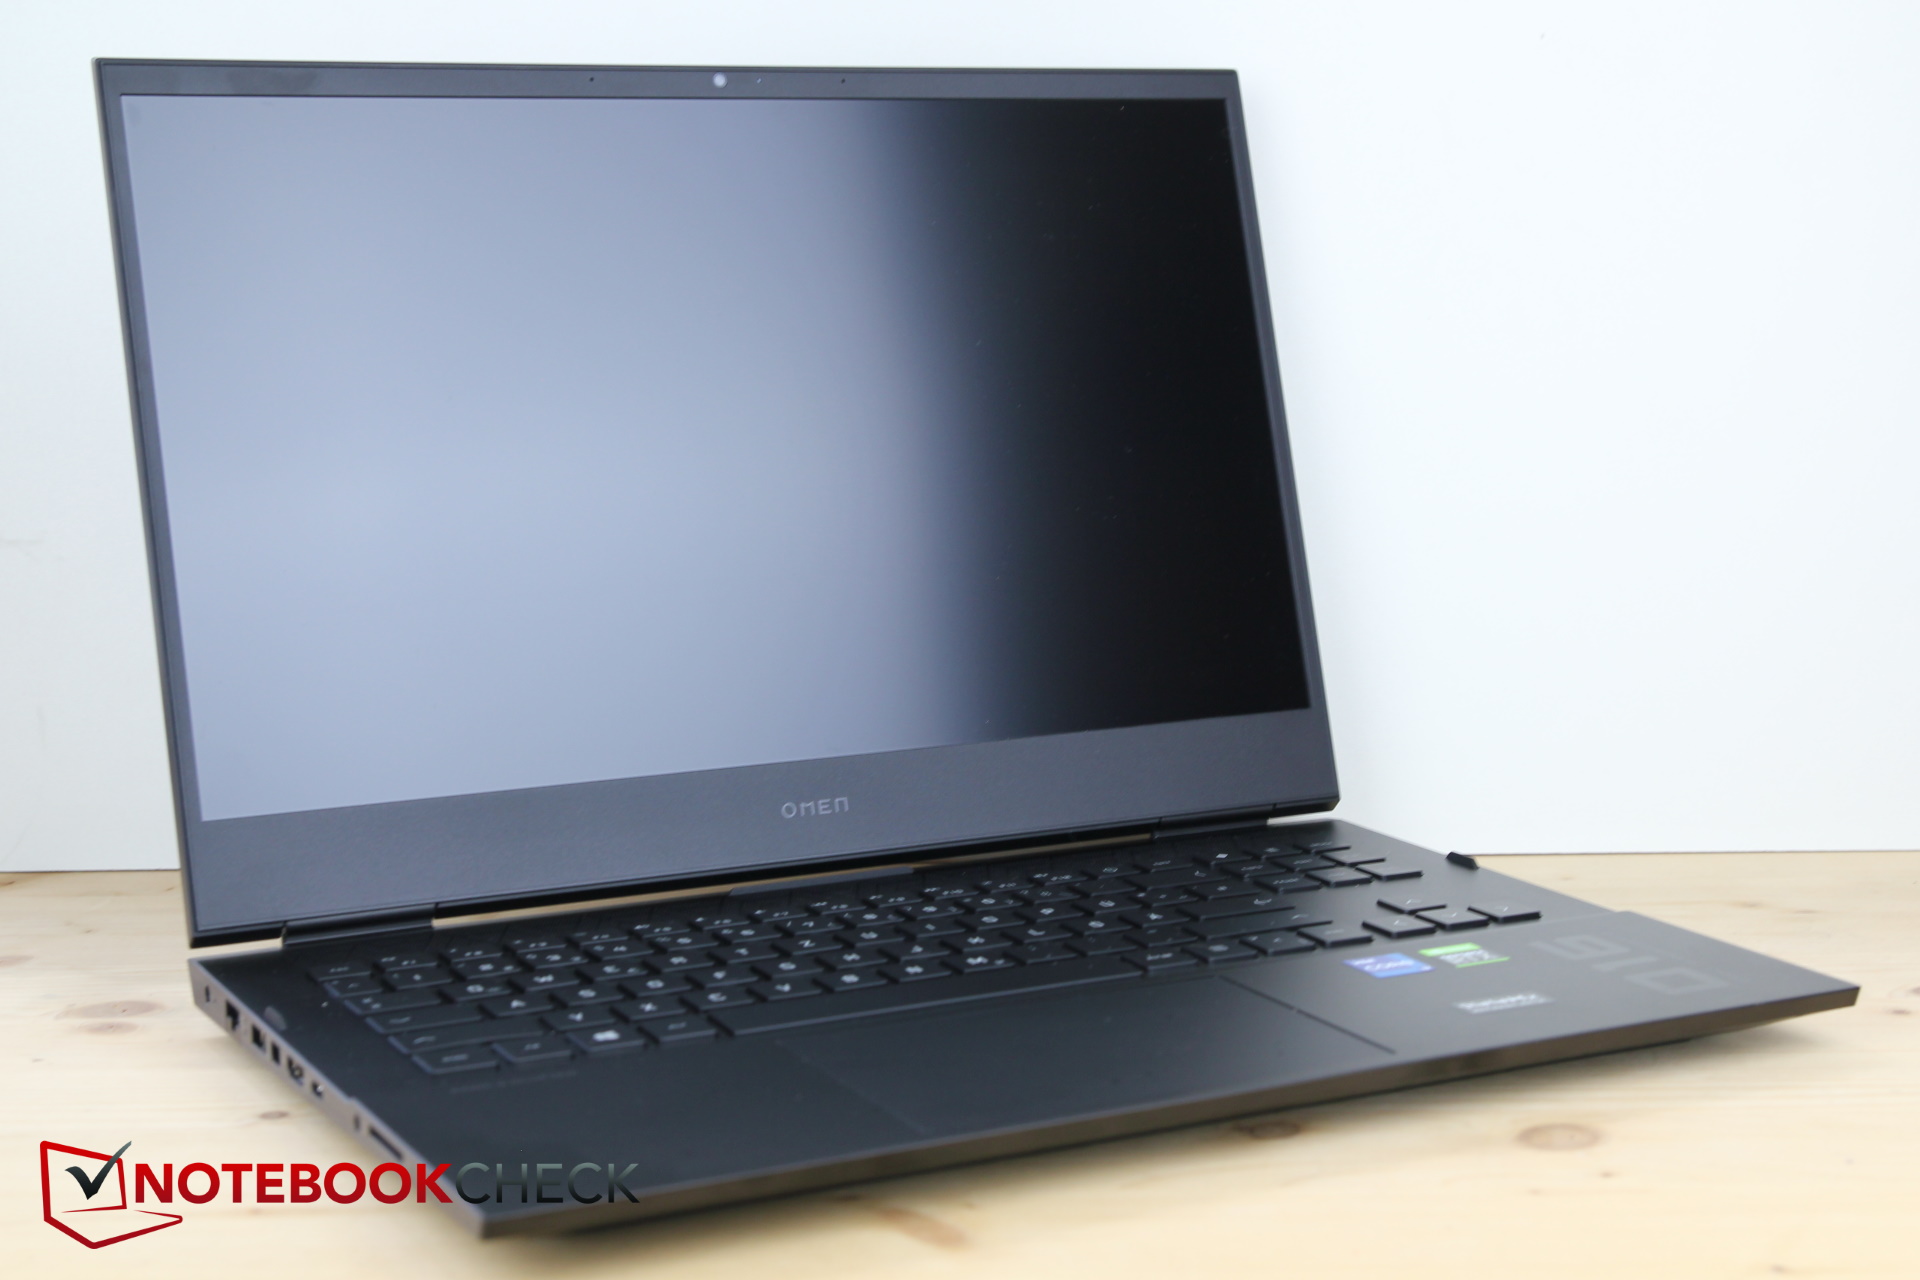
Input Devices - User to Touchpad, Please Respond!
Keyboard
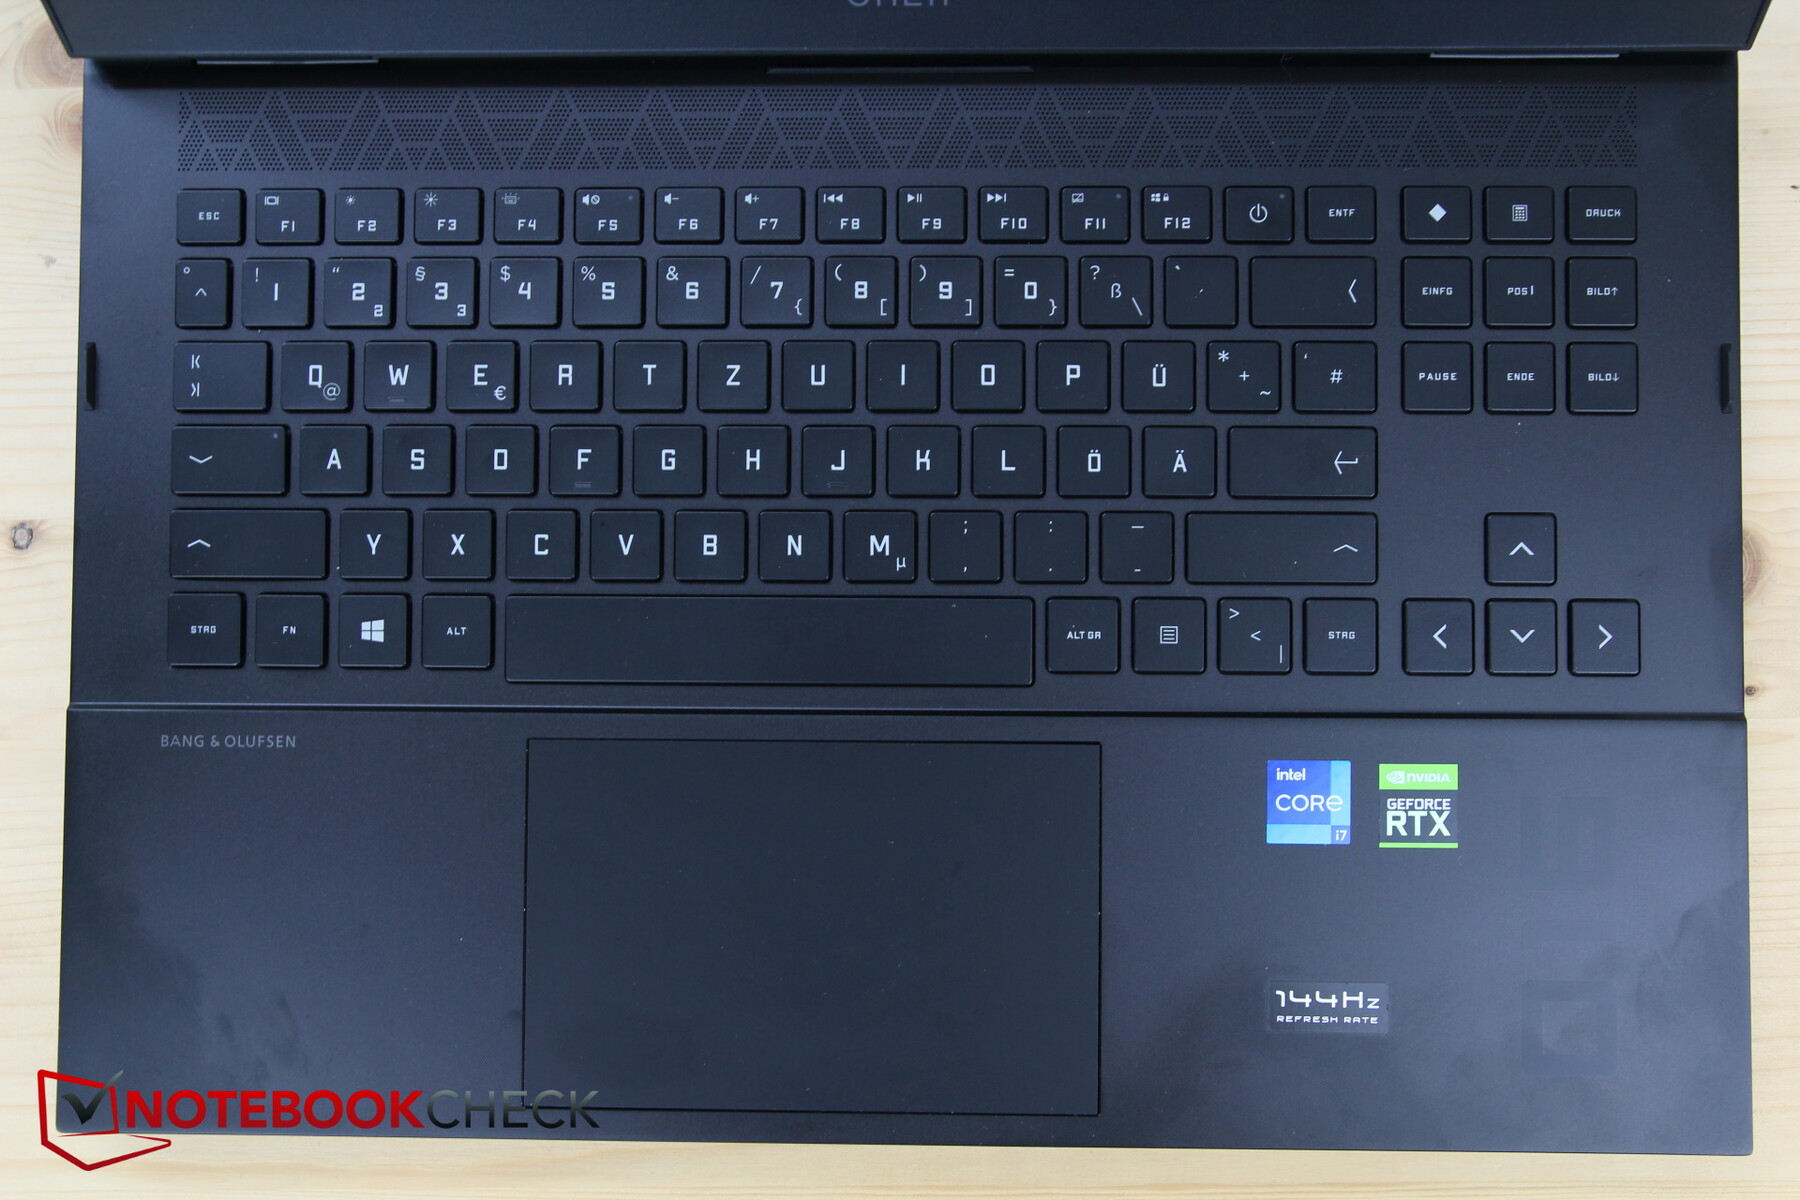
Unlike the HP Victus 16, the Omen 16 does not come with a numpad, which means there is more space for the arrow, pos1, end, and other keys as well as the dedicated print screen key to the top right, which is very convenient for taking screenshots. The keyboard layout looks very organized otherwise, which may be a consequence of the available space, and the key symbols are easy to read. There is a special key for launching the Omen Gaming Hub, where the performance settings can be adjusted (fans, performance profile).
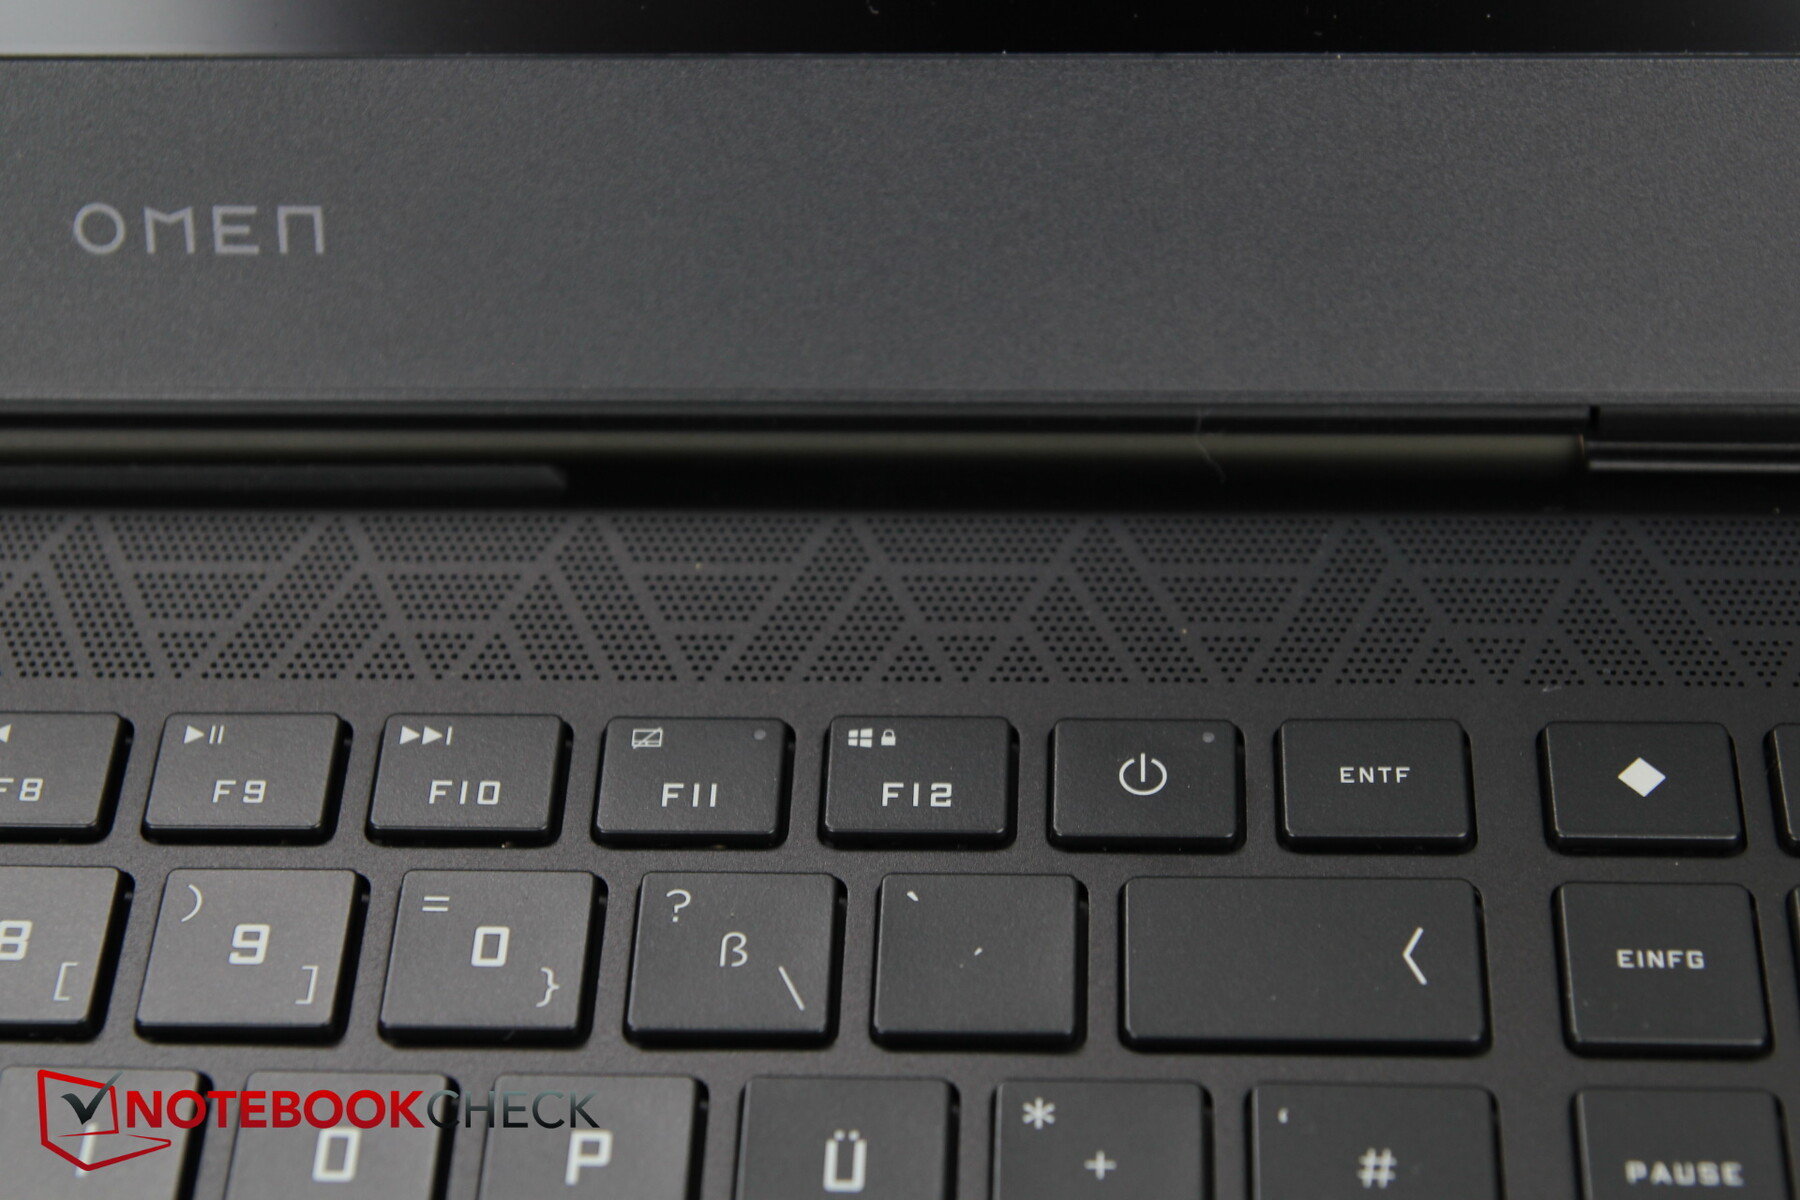
The location of the power button in the upper special key row between the F12 and Del keys does not appear to be optimal, but it did not cause any problems during our testing.
The keys offer mediocre travel and a solid feedback. The distinct actuation point is reached very quickly and the remaining key press feels soft for comfortable and fast typing. The key clatter is moderate.
HP has installed RGB backlighting with four zones. In practice, there are three large zones with the WASD keys that are often used while gaming as the fourth zone. The colors can be customized via the Gaming Hub.
Touchpad
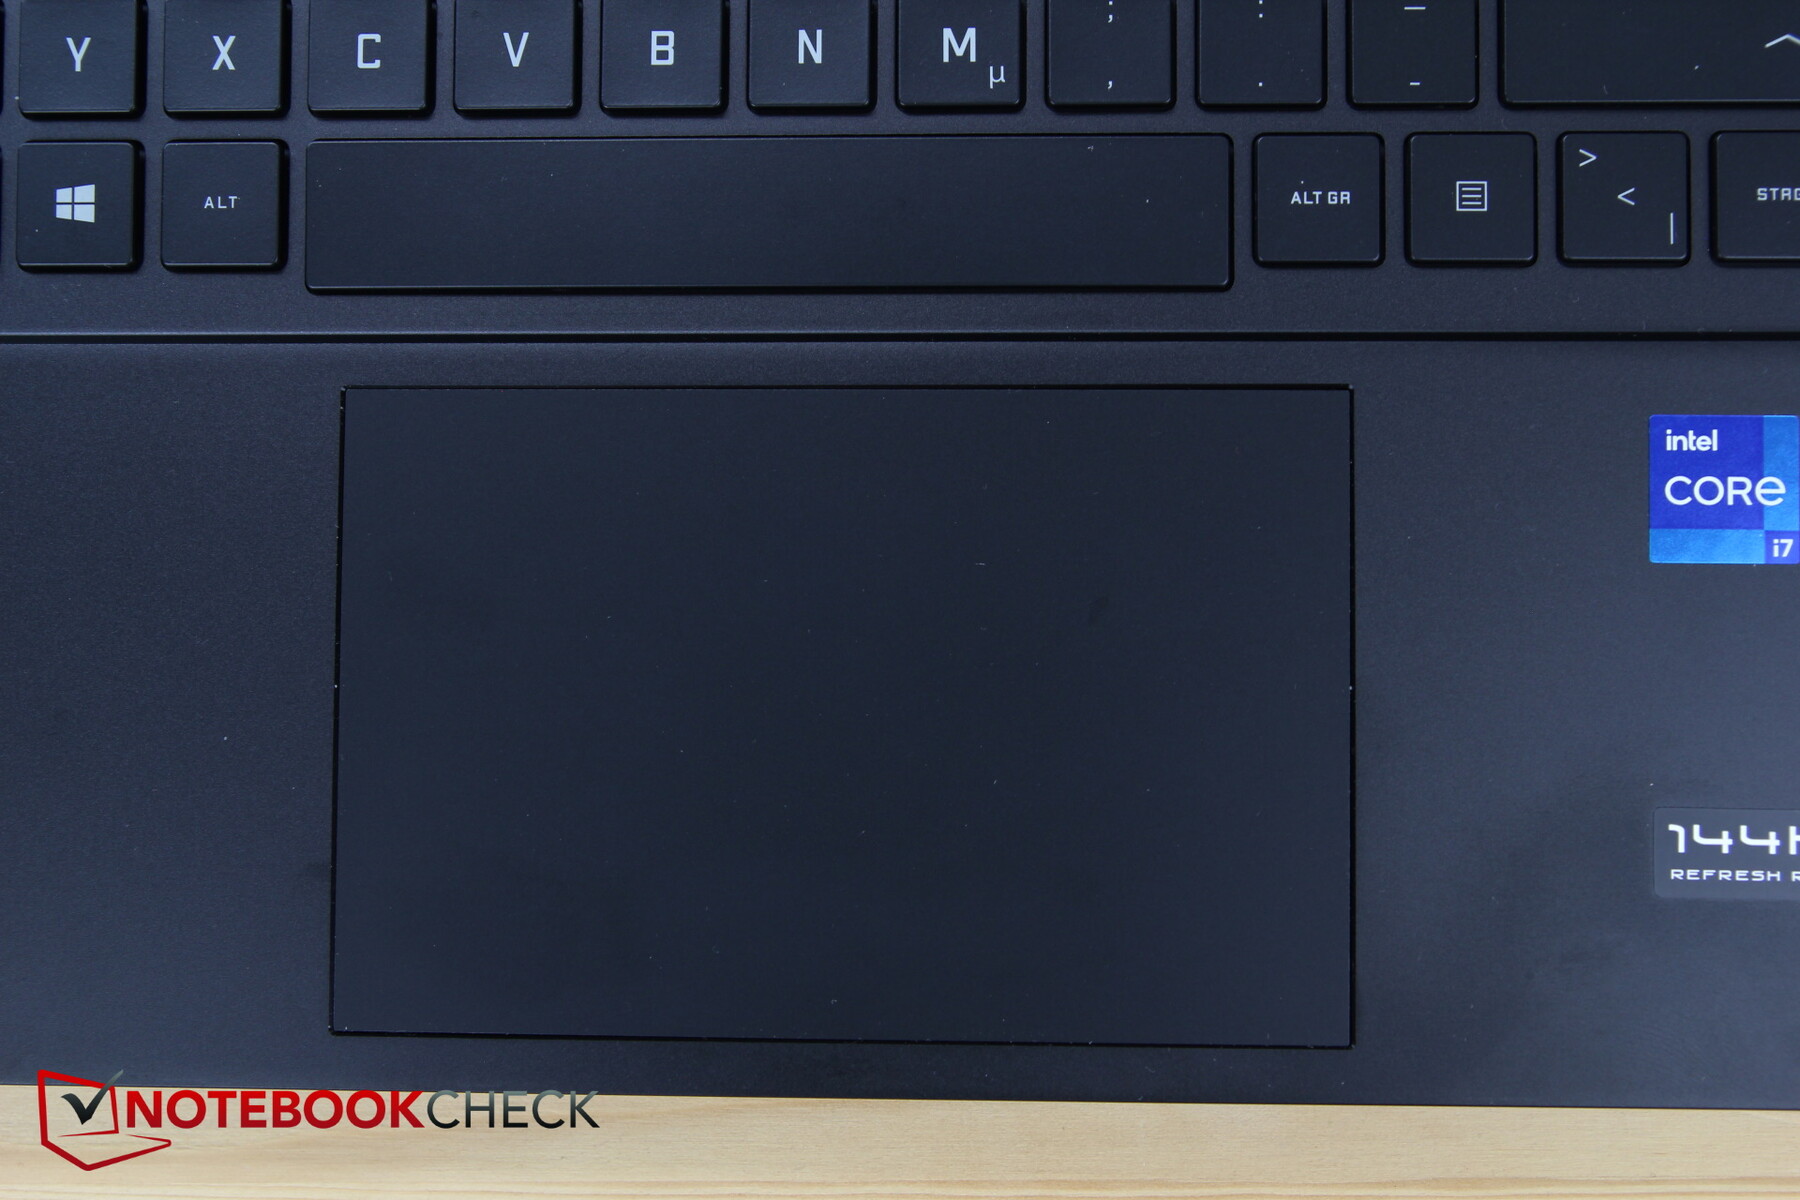
We experienced a couple of issues with the touchpad, which may in fact be faulty and complicate a rating at this point. Even after uninstalling and reinstalling the drivers, there were various dropouts. Both clicks and movements sometimes simply were not recognized.
By contrast, we have no criticisms when it comes to the clickpad's size or texture, since the gliding properties are very good even at slow speeds and the clicks produce a moderate acoustic feedback.
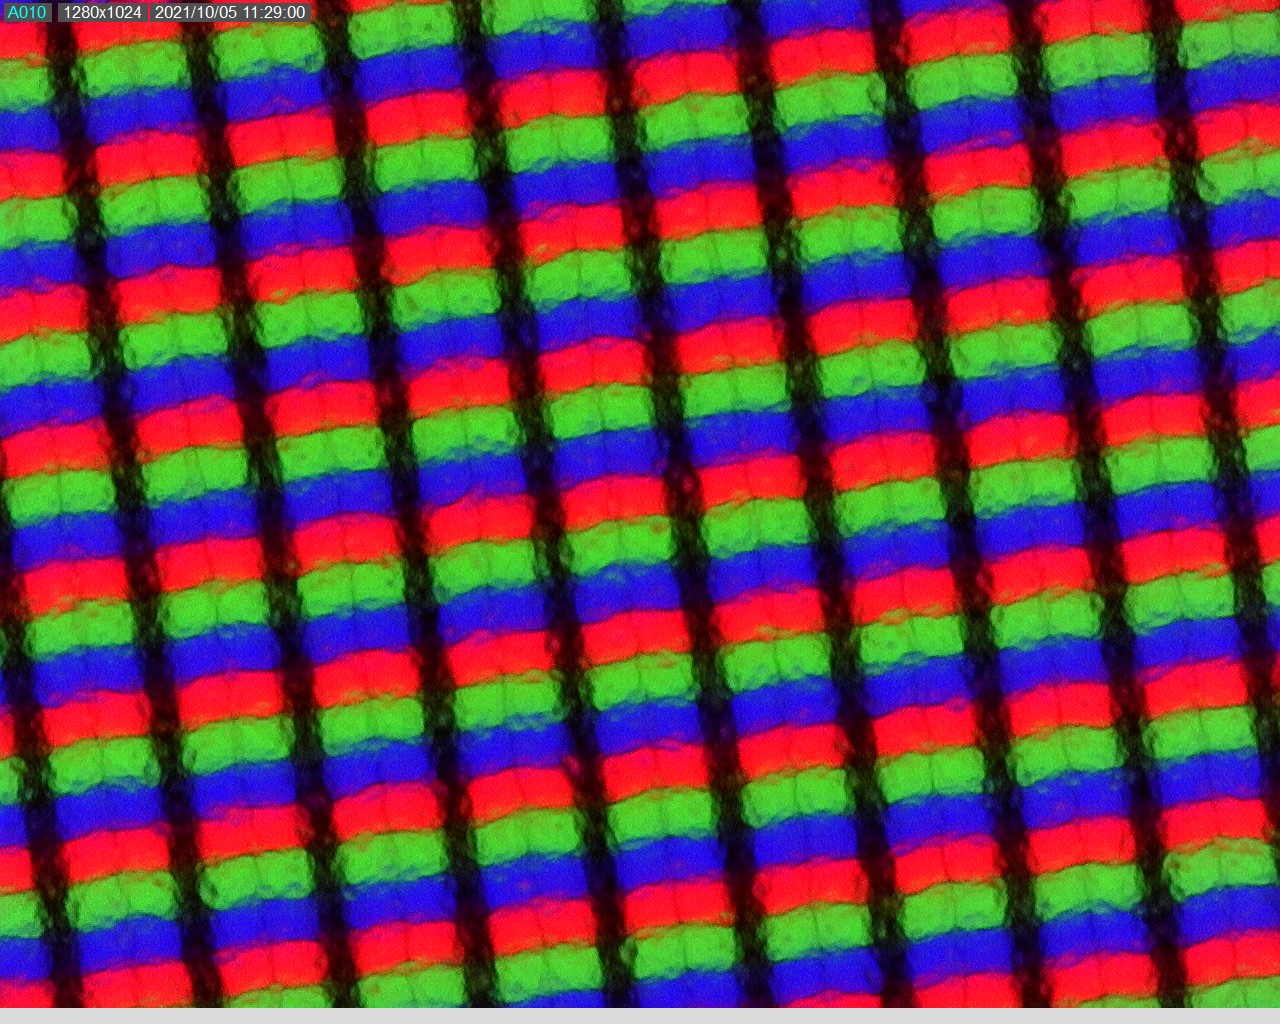
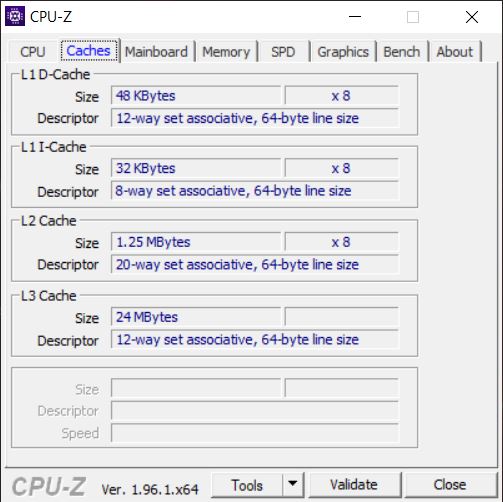
Display - Good Full HD Model with 144 Hz
The Omen 16 uses the same 16.1-inch, matte FHD 144-Hz BOE IPS panel as the Victus 16. Thus, the results are similar. The display reaches a brightness level of almost 400 nits with an illumination of 87 percent - a decent result. Compared to the older Omen 15, this is a significant improvement.
Although the panel does suffer from some backlight bleeding along the edges, it only becomes apparent under very dark ambient lighting conditions.
The very short response times match the expectations for this class and the display does not use PWM for brightness adjustments.

| |||||||||||||||||||||||||
Brightness Distribution: 87 %
Center on Battery: 407 cd/m²
Contrast: 1191:1 (Black: 0.34 cd/m²)
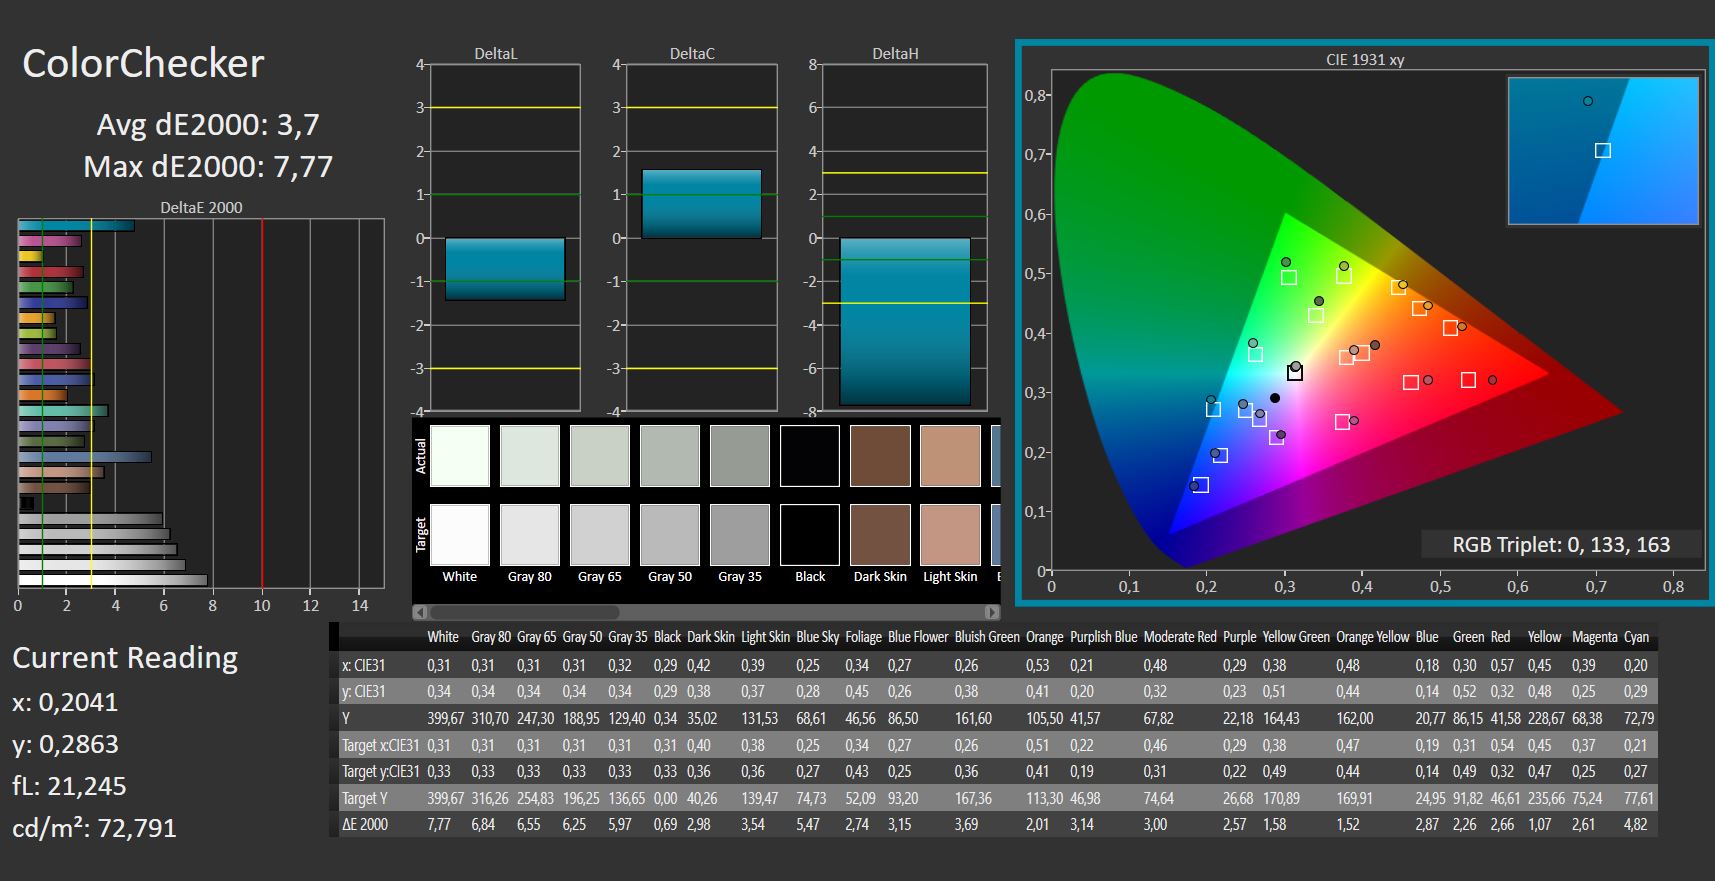
ΔE ColorChecker Calman: 3.7 | ∀{0.5-29.43 Ø4.75}
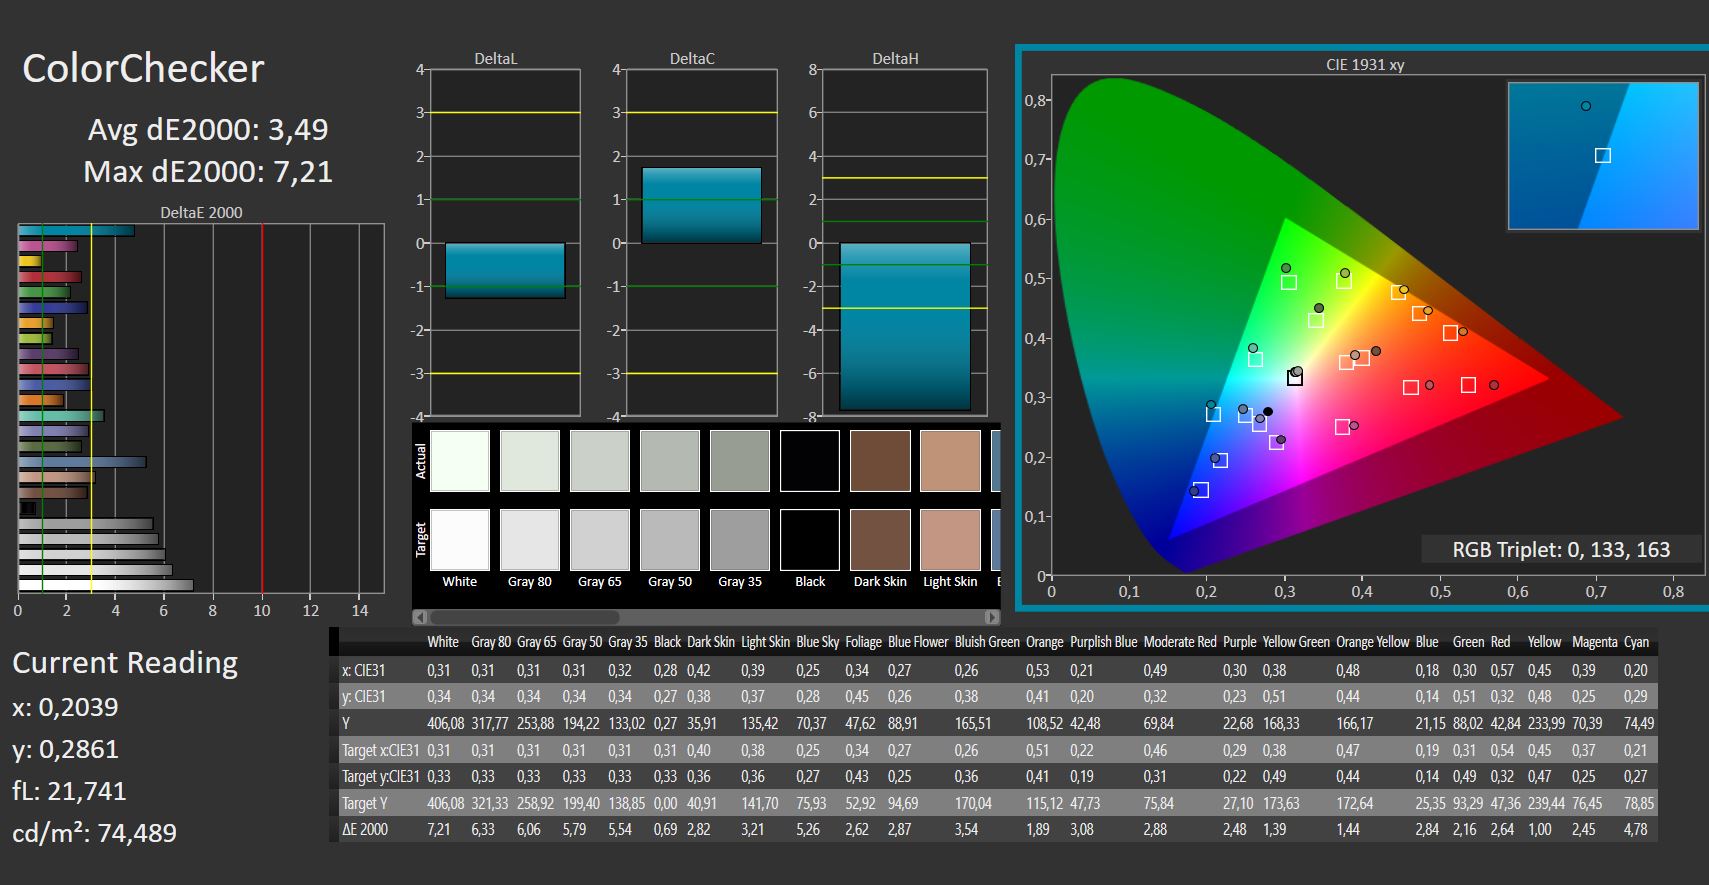
calibrated: 3.49
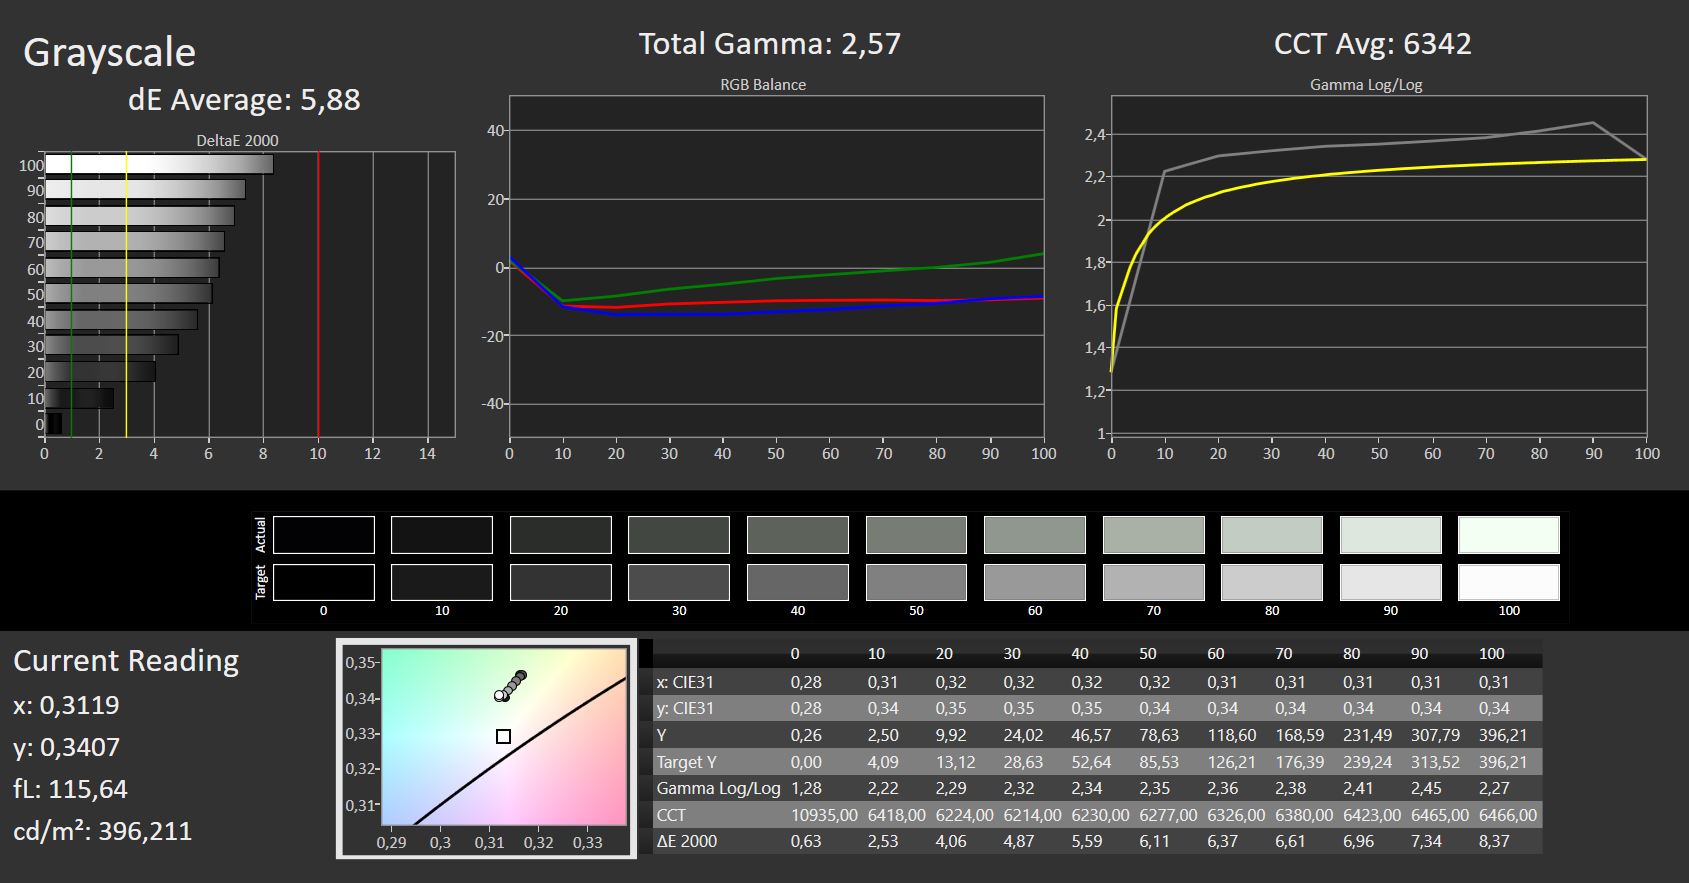
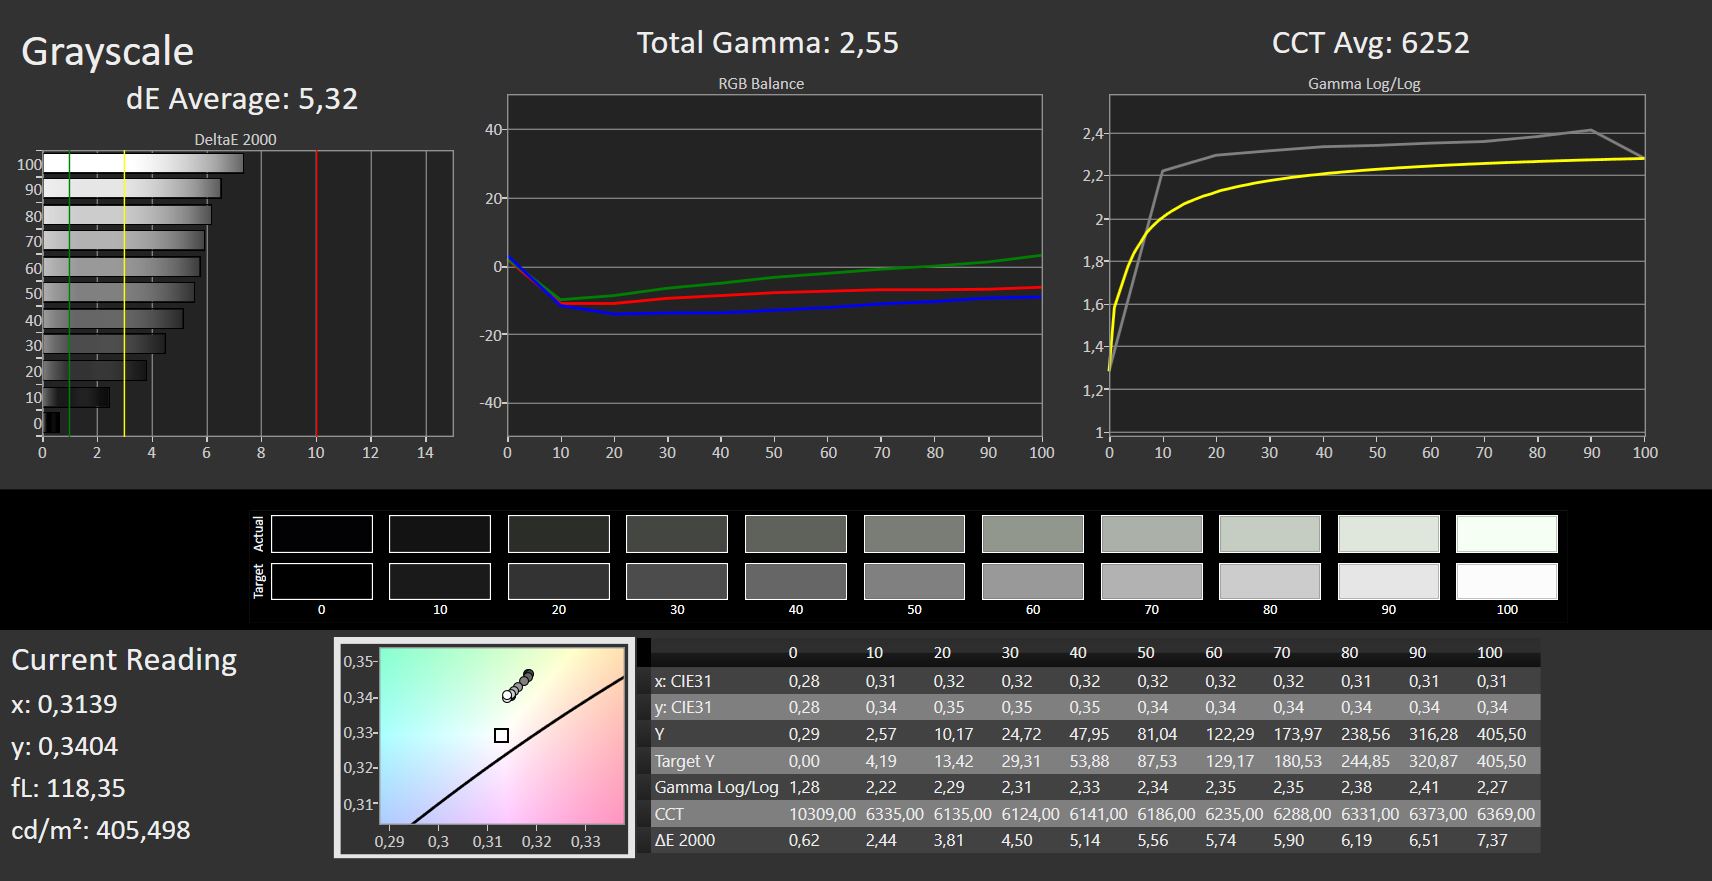
ΔE Greyscale Calman: 5.88 | ∀{0.09-98 Ø5}
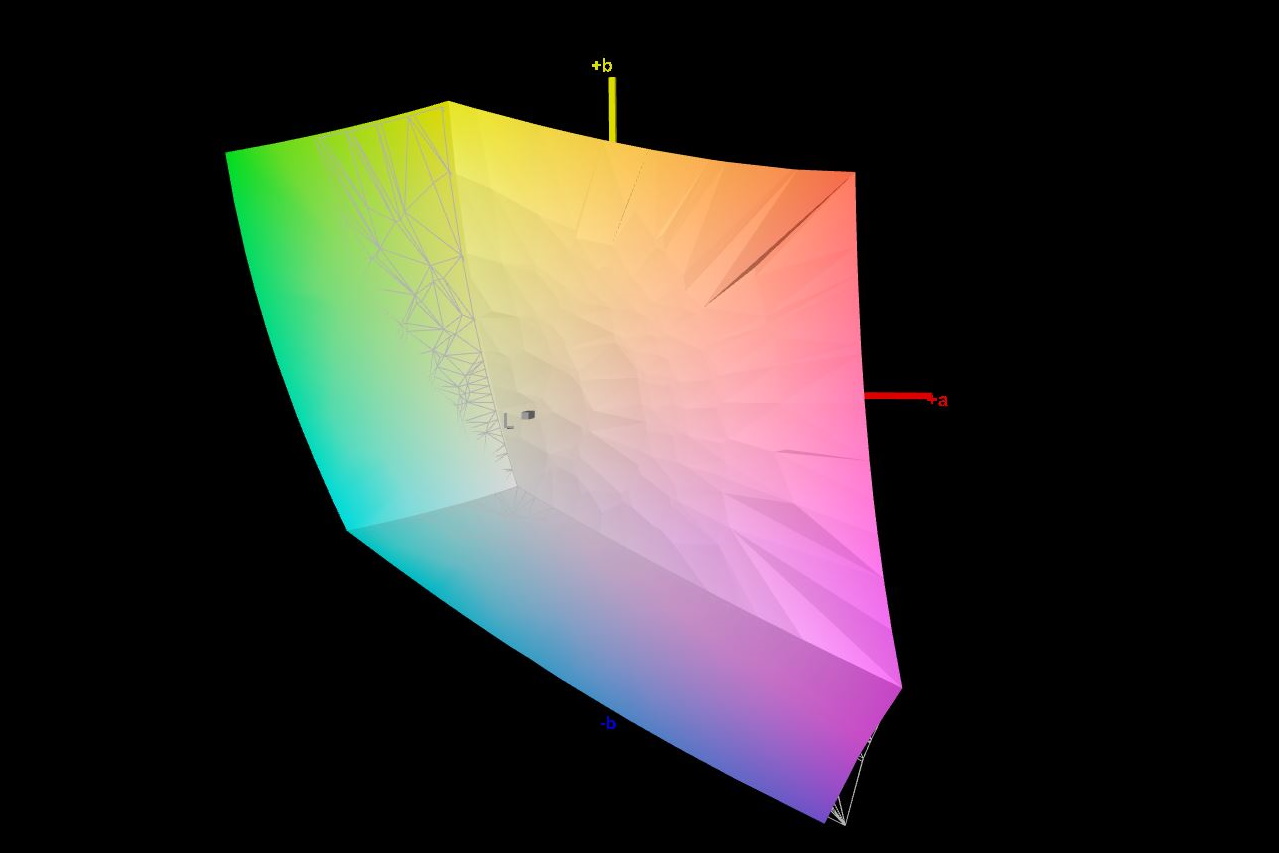
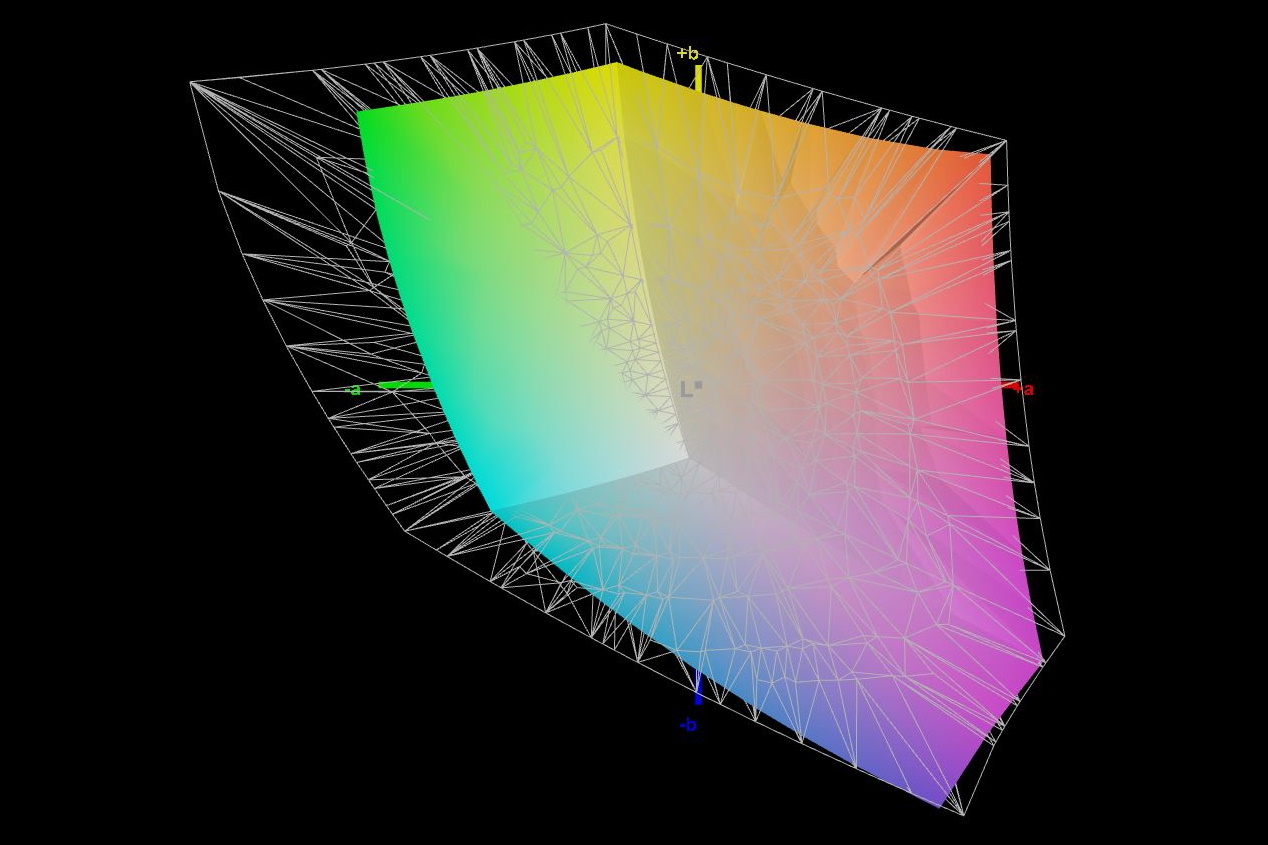
99.47% sRGB (Calman 2D)
99.47% sRGB (Argyll 1.6.3 3D)
73.76% AdobeRGB 1998 (Argyll 1.6.3 3D)
73.8% AdobeRGB 1998 (Argyll 3D)
99.5% sRGB (Argyll 3D)
72.3% Display P3 (Argyll 3D)
Gamma: 2.57
CCT: 6342 K
| HP Omen 16-b0085ng BOE09BE, IPS, 1920x1080, 16.1" | HP Omen 15-en0375ng BOE0852, IPS, 1920x1080, 15.6" | HP Victus 16-e0179ng BOE09BE, IPS, 1920x1080, 16.1" | Lenovo Legion 5 Pro 16ACH6H (82JQ001PGE) CSOT T3 MNG007DA1-1, IPS, 2560x1600, 16" | Alienware x15 RTX 3070 P111F LG Philips 156QHG, IPS, 2560x1440, 15.6" | MSI Katana GF66 11UG-220 AU Optronics B156HAN08.0, IPS, 1920x1080, 15.6" | |
|---|---|---|---|---|---|---|
| Display | -44% | 0% | -1% | 18% | -9% | |
| Display P3 Coverage (%) | 72.3 | 39.12 -46% | 72.6 0% | 97.8 35% | 65.4 -10% | |
| sRGB Coverage (%) | 99.5 | 57.6 -42% | 100 1% | 99 -1% | 99.9 0% | 91.3 -8% |
| AdobeRGB 1998 Coverage (%) | 73.8 | 40.42 -45% | 73.5 0% | 73 -1% | 66.7 -10% | |
| Response Times | -174% | -18% | 23% | -17% | 9% | |
| Response Time Grey 50% / Grey 80% * (ms) | 8 ? | 30.4 ? -280% | 9.6 ? -20% | 9.2 ? -15% | 12 ? -50% | 7.4 ? 7% |
| Response Time Black / White * (ms) | 12.4 ? | 20.8 ? -68% | 14.4 ? -16% | 4.8 61% | 10.4 ? 16% | 11.2 ? 10% |
| PWM Frequency (Hz) | 200 ? | |||||
| Screen | -27% | 15% | 22% | 6% | 0% | |
| Brightness middle (cd/m²) | 405 | 297 -27% | 361 -11% | 551 36% | 409.5 1% | 307 -24% |
| Brightness (cd/m²) | 378 | 275 -27% | 341 -10% | 523 38% | 390 3% | 321 -15% |
| Brightness Distribution (%) | 87 | 88 1% | 88 1% | 88 1% | 88 1% | 83 -5% |
| Black Level * (cd/m²) | 0.34 | 0.33 3% | 0.3 12% | 0.54 -59% | 0.47 -38% | 0.27 21% |
| Contrast (:1) | 1191 | 900 -24% | 1203 1% | 1020 -14% | 871 -27% | 1137 -5% |
| Colorchecker dE 2000 * | 3.7 | 4.54 -23% | 2.44 34% | 1.8 51% | 3.48 6% | 4.67 -26% |
| Colorchecker dE 2000 max. * | 7.77 | 18.92 -144% | 6.37 18% | 2.53 67% | 6.31 19% | 7.53 3% |
| Colorchecker dE 2000 calibrated * | 3.49 | 4.66 -34% | 1.26 64% | 1.66 52% | 0.89 74% | 2.41 31% |
| Greyscale dE 2000 * | 5.88 | 2.1 64% | 4.6 22% | 1.85 69% | 5 15% | 4.5 23% |
| Gamma | 2.57 86% | 2.066 106% | 2.268 97% | 2.3 96% | 2.16 102% | 2.276 97% |
| CCT | 6342 102% | 6291 103% | 6609 98% | 6338 103% | 6591 99% | 6824 95% |
| Color Space (Percent of AdobeRGB 1998) (%) | 73.76 | 40 -46% | 72.81 -1% | |||
| Color Space (Percent of sRGB) (%) | 99.47 | 58 -42% | 99.41 0% | |||
| Total Average (Program / Settings) | -82% /
-49% | -1% /
7% | 15% /
19% | 2% /
4% | 0% /
-1% |
* ... smaller is better
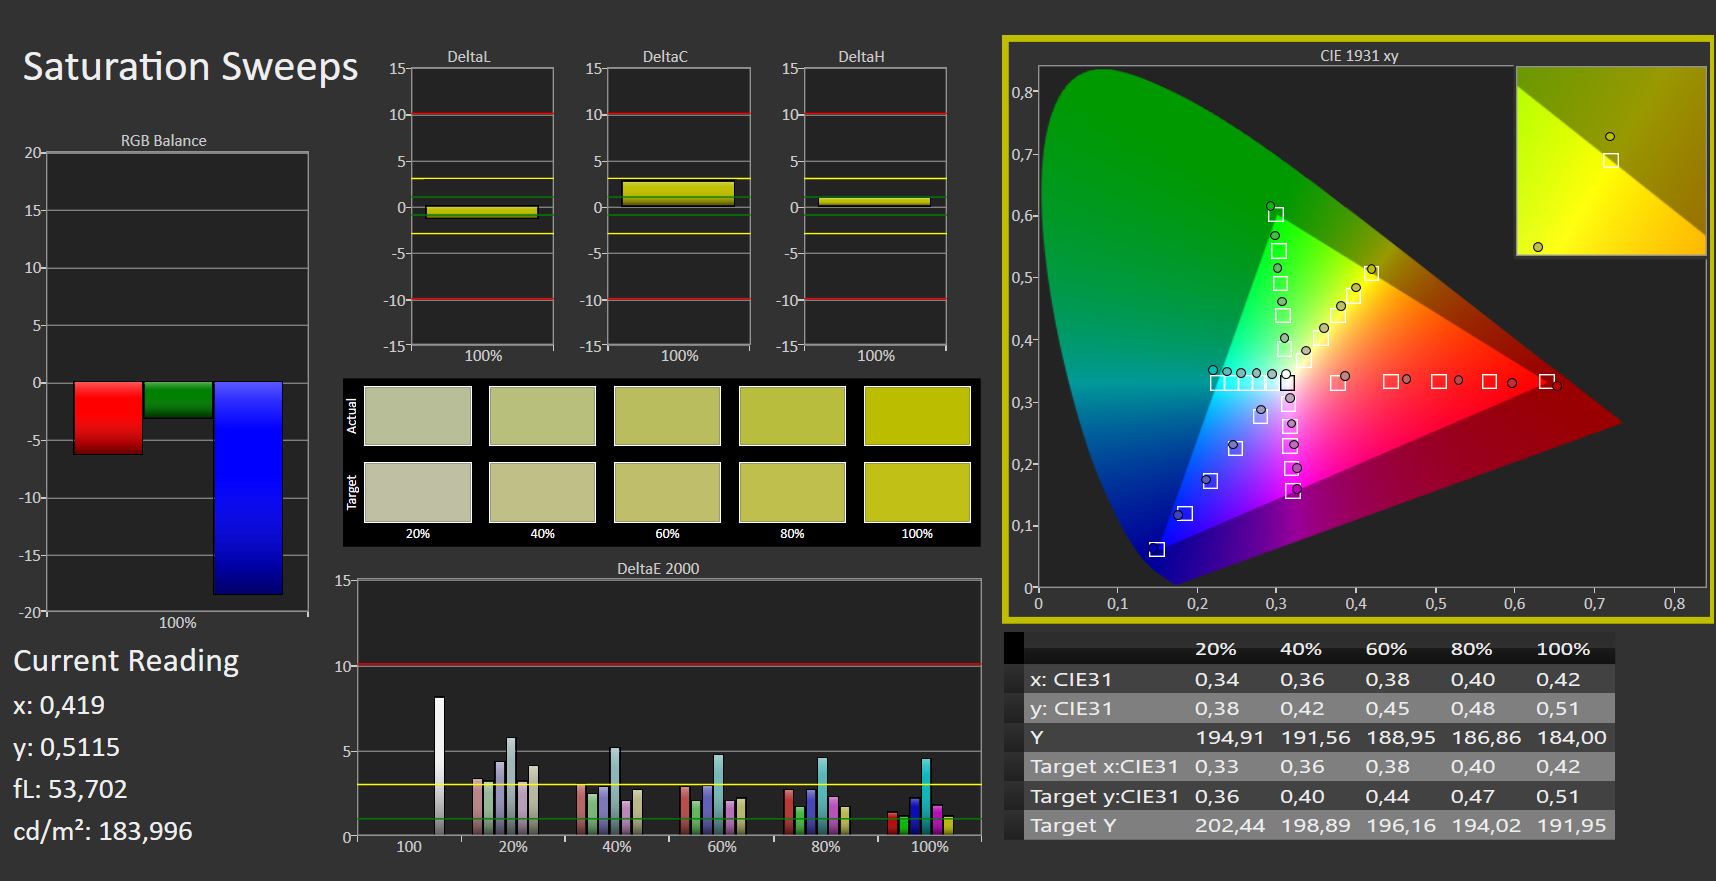
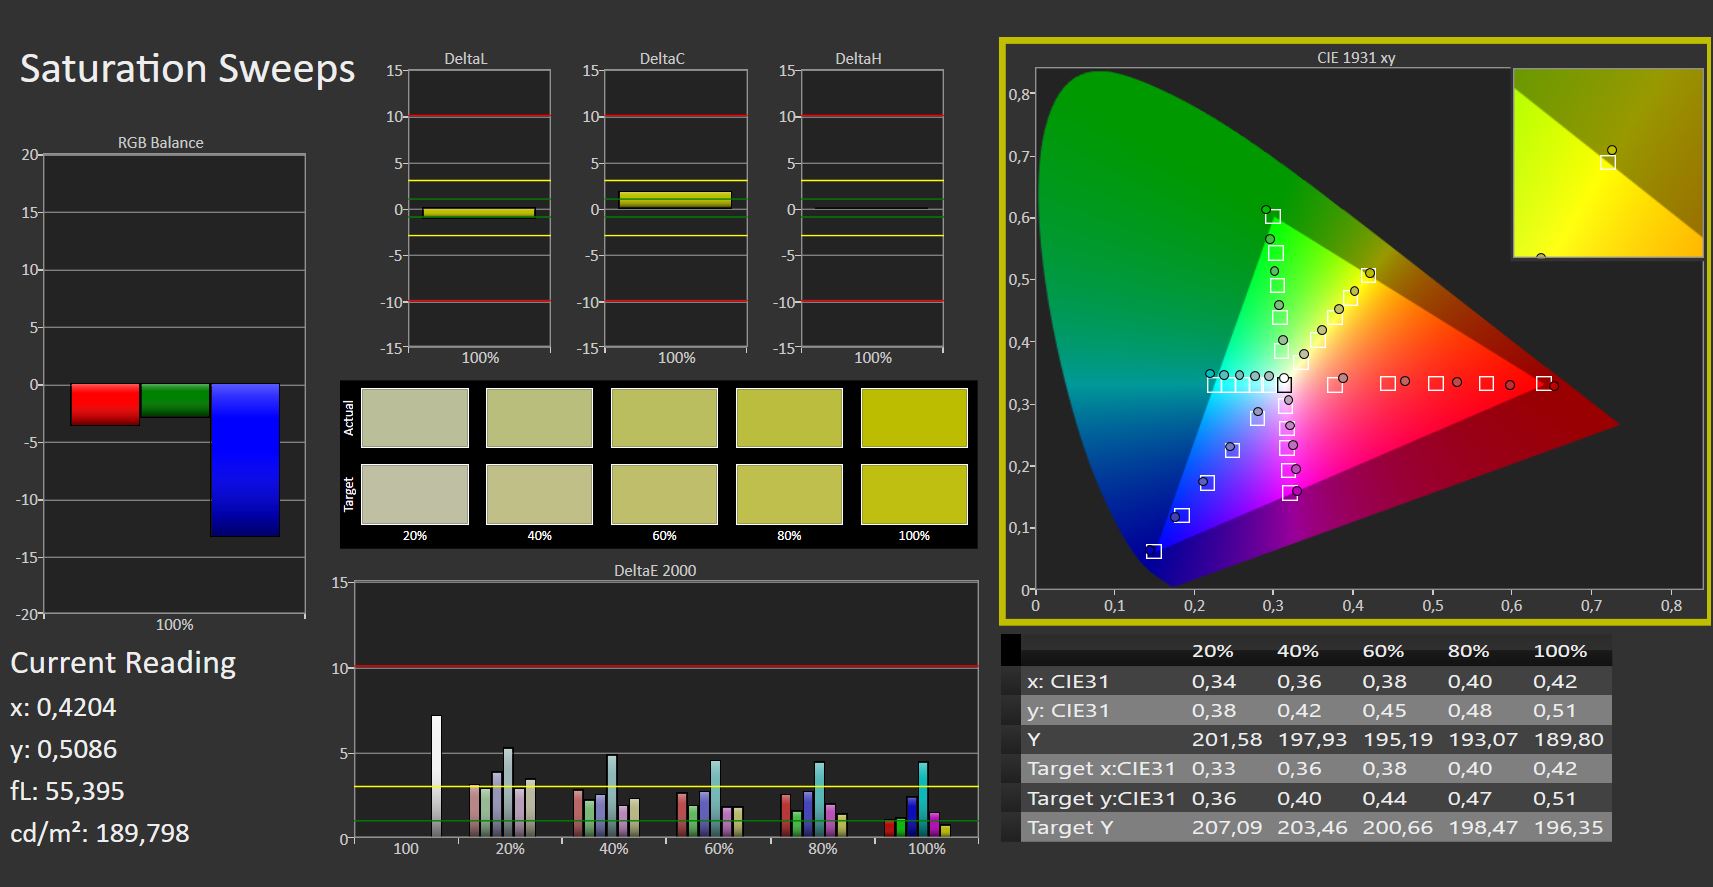
The contrast ratio and black values are competitive compared to the class averages and the sRGB color space is essentially fully covered. Meanwhile, the display still covers 73 percent of the AdobeRGB and DCI-P3 color spaces.
Although the display is well calibrated ex-factory, we were able to further improve the colors by performing a manual calibration of the display.
The matte overlay prevents a majority of glare and reflections and the brightness is sufficient for outdoor use. As usual, reflections become troublesome when looking at the display from an angle.


Display Response Times
| ↔ Response Time Black to White | ||
|---|---|---|
| 12.4 ms ... rise ↗ and fall ↘ combined | ↗ 6.6 ms rise | 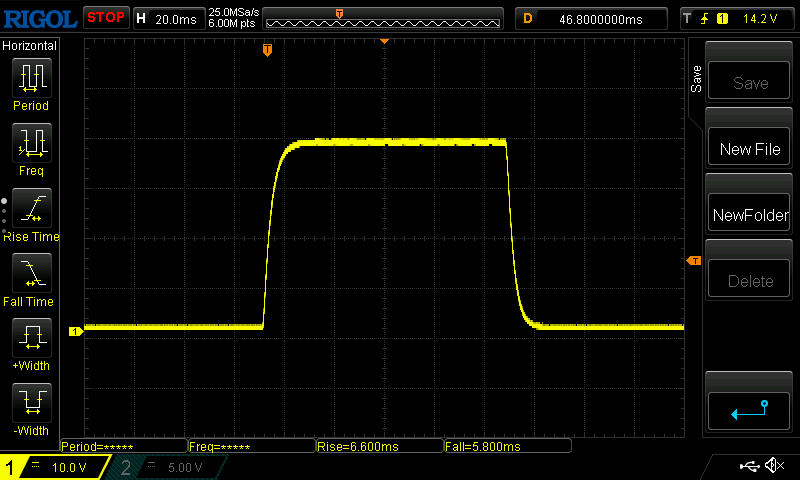 |
| ↘ 5.8 ms fall | ||
| The screen shows good response rates in our tests, but may be too slow for competitive gamers. In comparison, all tested devices range from 0.1 (minimum) to 240 (maximum) ms. » 32 % of all devices are better. This means that the measured response time is better than the average of all tested devices (20.1 ms). | ||
| ↔ Response Time 50% Grey to 80% Grey | ||
| 8 ms ... rise ↗ and fall ↘ combined | ↗ 4.2 ms rise | 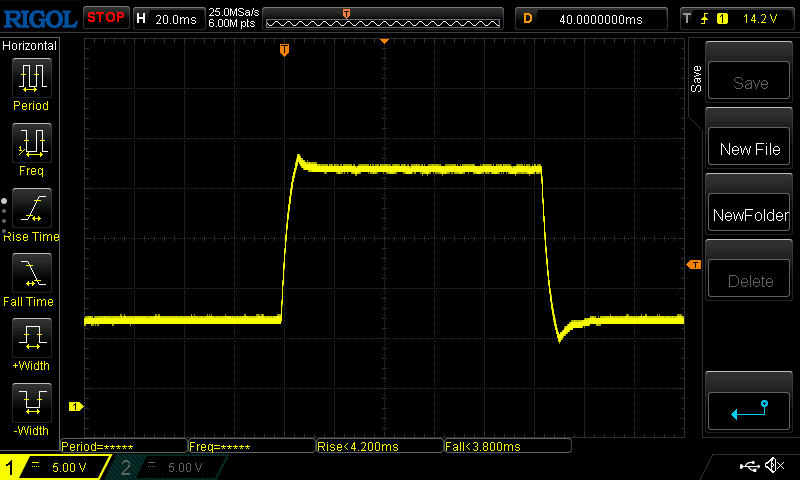 |
| ↘ 3.8 ms fall | ||
| The screen shows fast response rates in our tests and should be suited for gaming. In comparison, all tested devices range from 0.165 (minimum) to 636 (maximum) ms. » 20 % of all devices are better. This means that the measured response time is better than the average of all tested devices (31.4 ms). | ||
Screen Flickering / PWM (Pulse-Width Modulation)
| Screen flickering / PWM not detected | ||
In comparison: 53 % of all tested devices do not use PWM to dim the display. If PWM was detected, an average of 7996 (minimum: 5 - maximum: 343500) Hz was measured. | ||
Considering that this is an IPS display, the perceived brightness level drops fairly drastically when viewed from extreme angles and perhaps even more than usual. However, this is barely noticeable under normal conditions.

Performance - Fast!
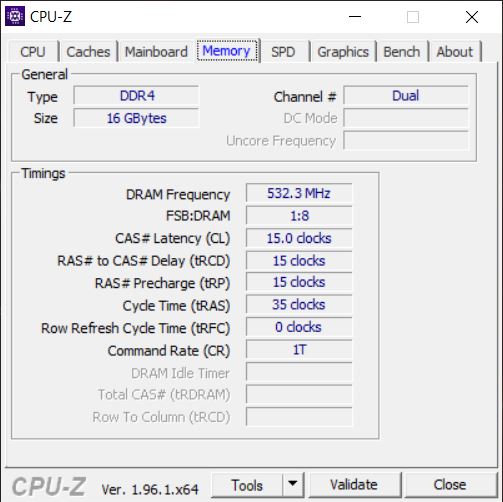
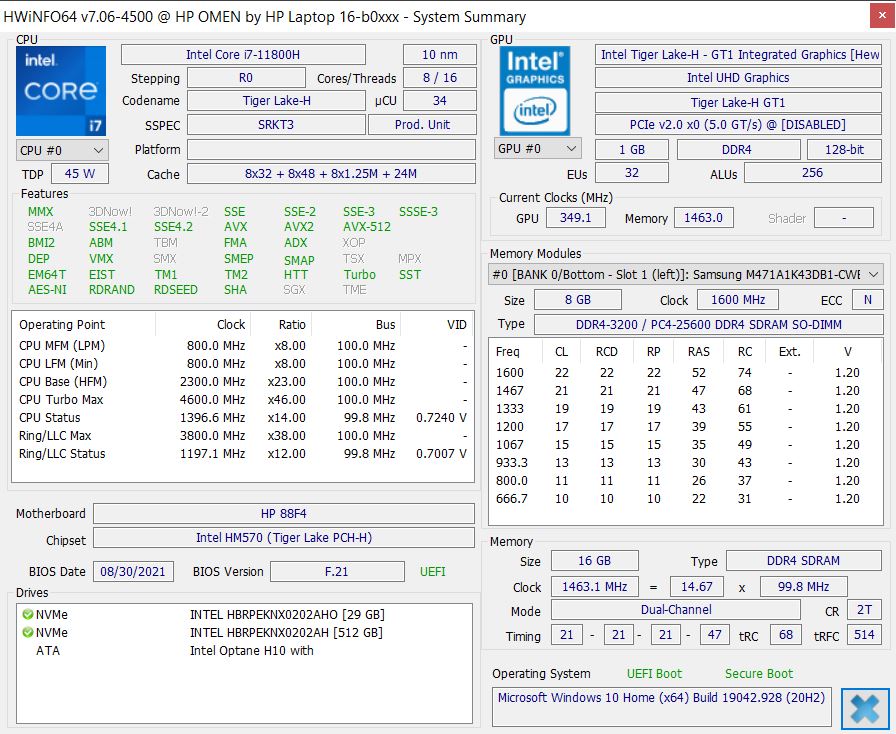
The Omen 16 is a gaming system. The octa-core Intel Core i7-11800H and, more importantly, the NVIDIA GeForce RTX 3070 Laptop GPU as well as the 144-Hz display are fairly obvious clues in this regard. At 16 GB, the RAM capacity should also be sufficient. With its sleek, but subtle design, the Omen was mainly made for gamers who prefer a more laid-back design over the more common, tacky exterior.
In the Omen Gaming Hub, users can choose between a few default performance profiles. For the raw performance benchmarks, we selected the performance profile "Performance" and set the graphics switcher to dedicated, to ensure that the dedicated GPU is always enabled. We then switched back to hybrid mode (Optimus) for the battery tests.
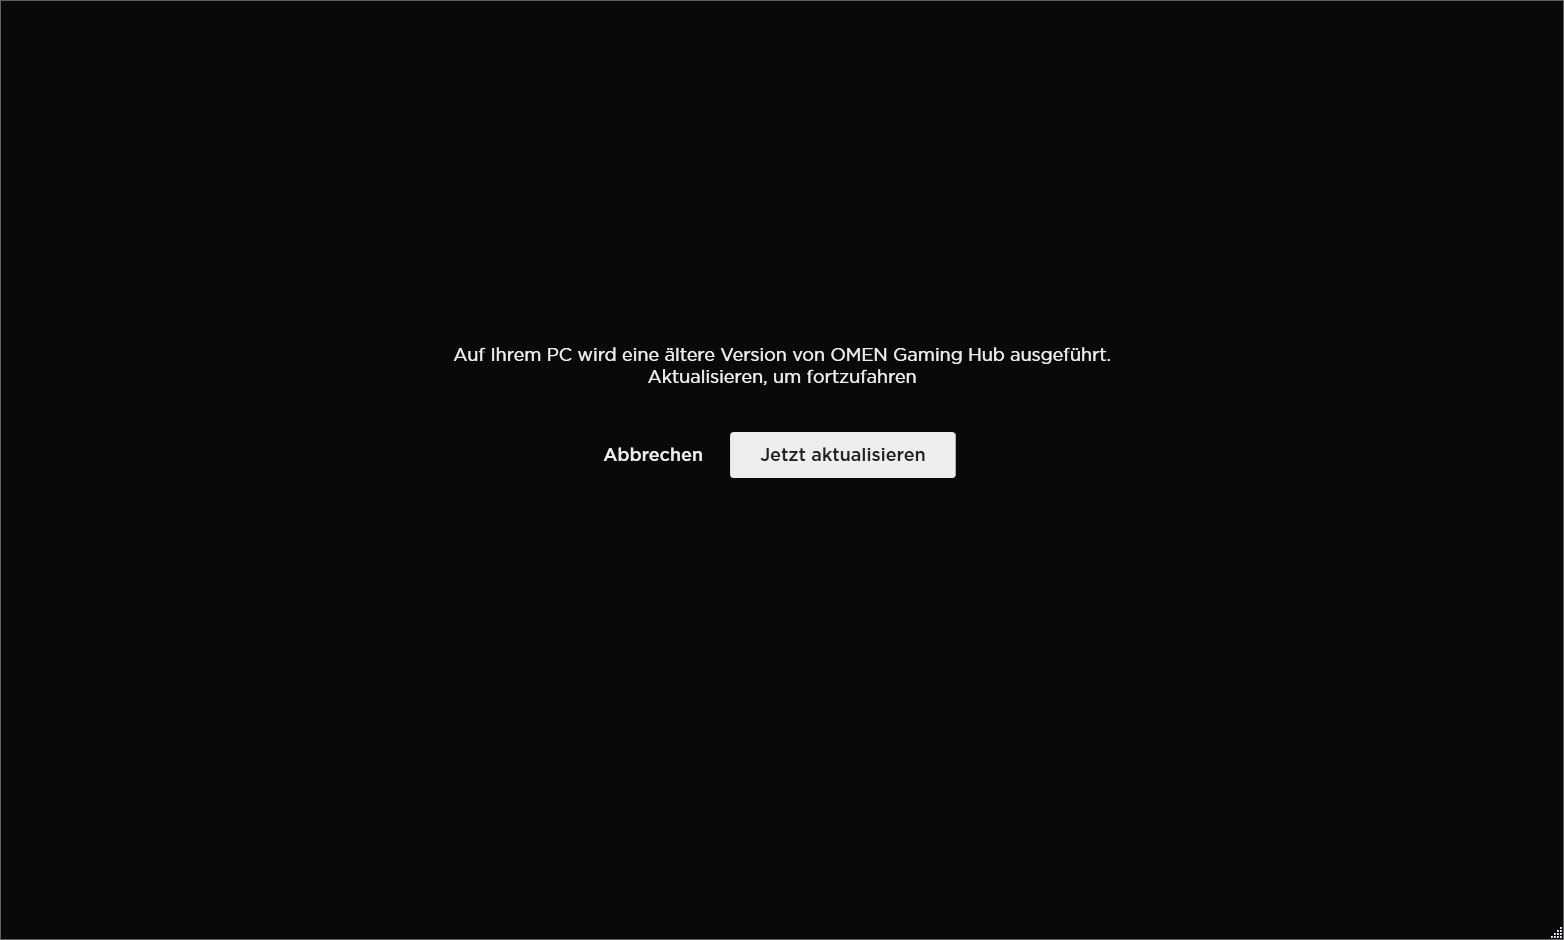
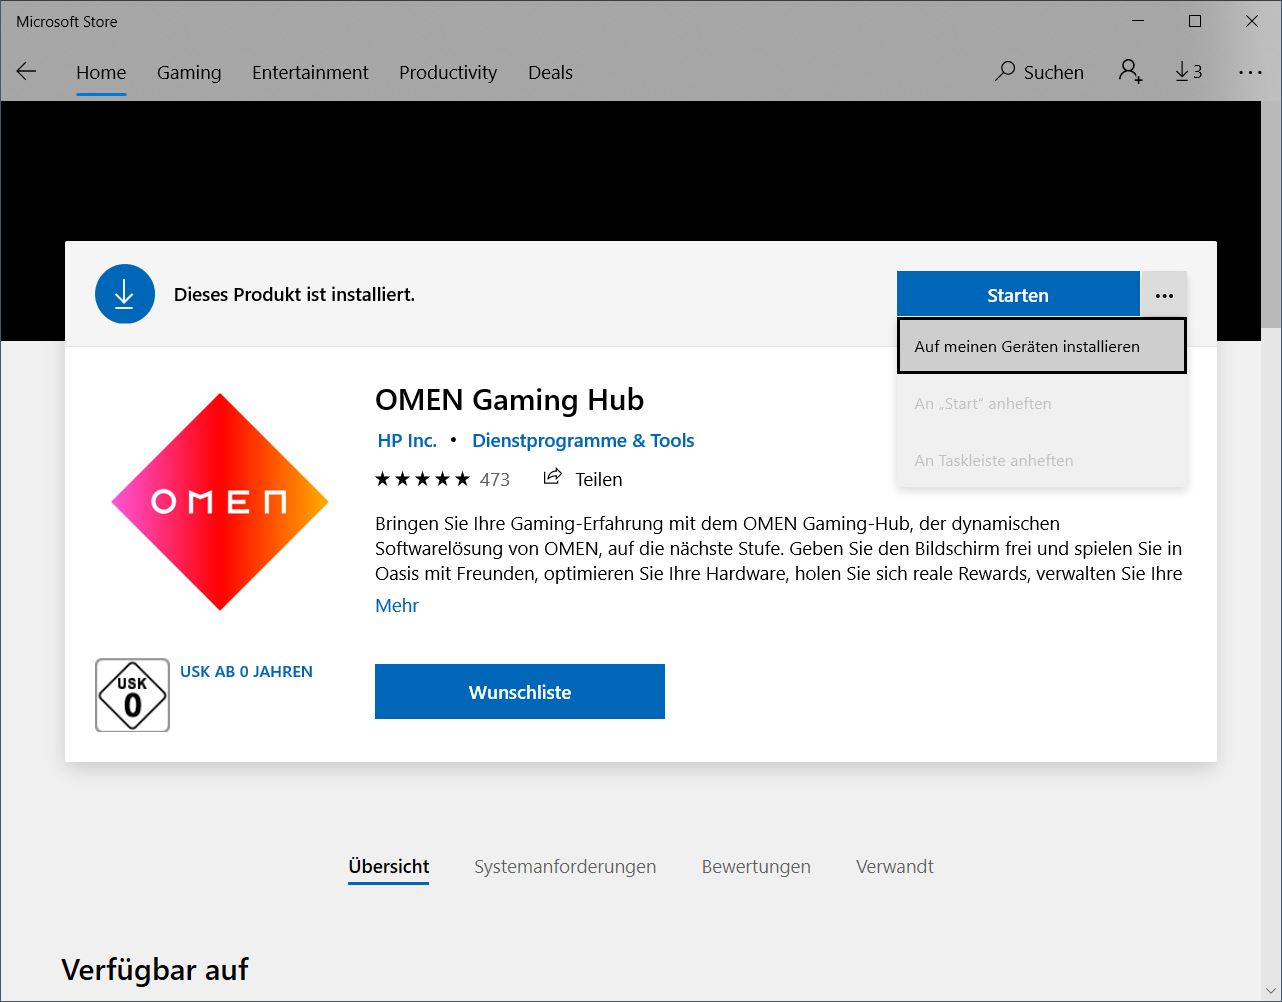
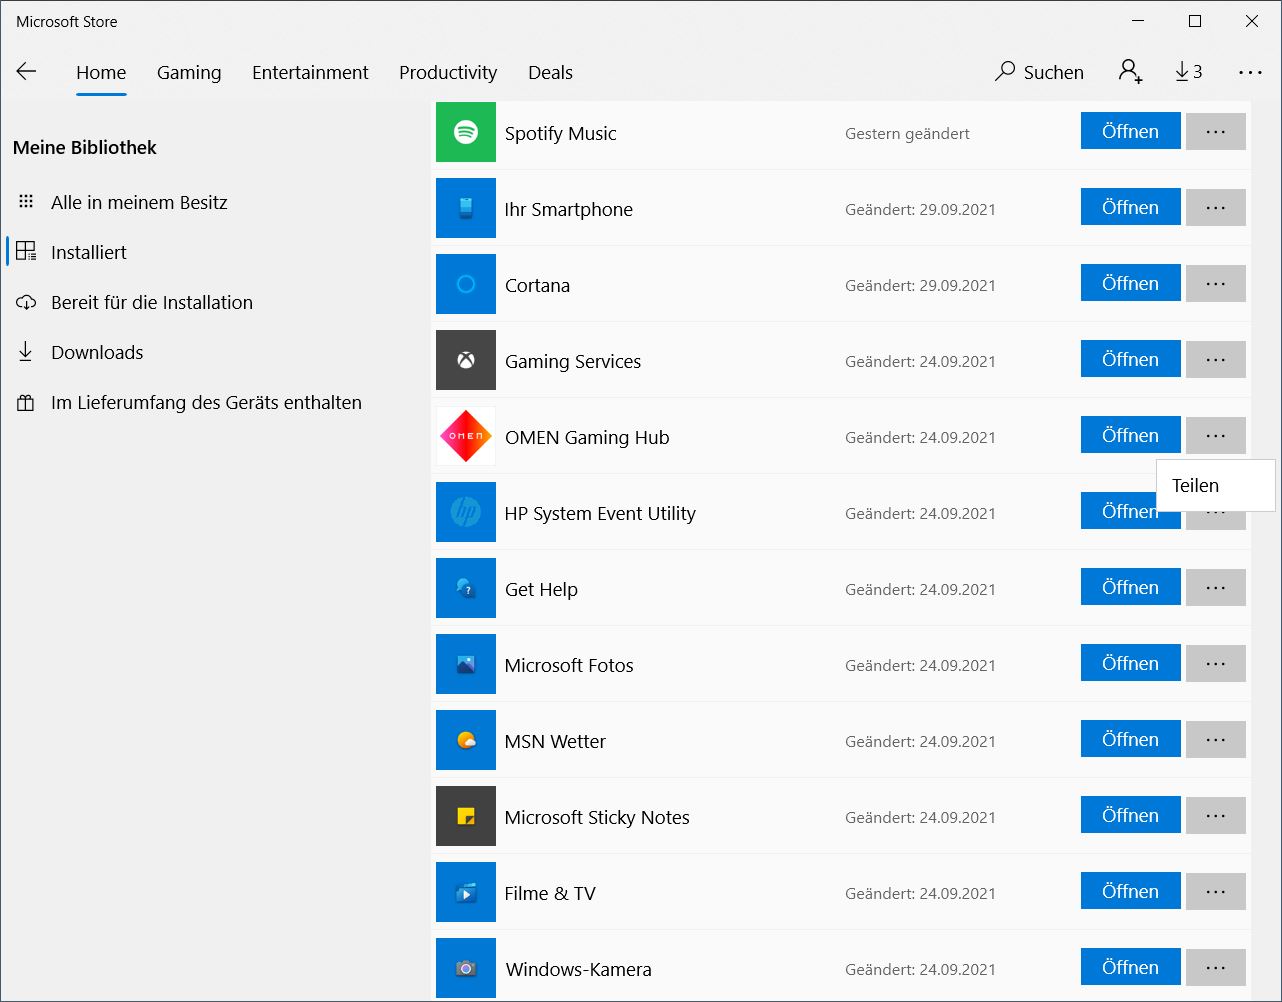
We encountered an frustrating issue with the Gaming Hub software, which reminded us that we were using an old version on every launch. However, trying to update would redirect us to the Windows Store. Here, the software shows up as "already installed" with no option for any updates.
Processor
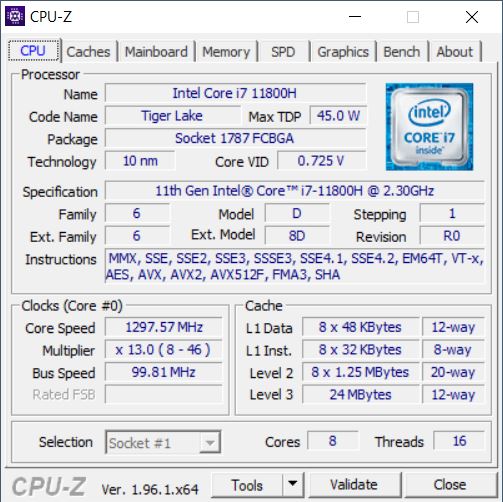
The Omen comes with an Intel Core i7-11800H, an octa-core processor with theoretical clock speeds of 2.3 to 4.6 GHz. It features Thunderbolt 4, which is notably still absent on AMD's competing platforms.
During our Cinebench R15 loop, the performance remains very consistent with no initial dip. While the TDP starts at above 95 W, it falls off after the second loop and remains relatively constant at around 80 W. The performance is similar to the Legion 5 Pro and the Alienware x15 and matches our expectations. The cheaper Victus is about 15 percent slower in the Cinebench benchmarks.
Across all benchmarks, the CPU performance is fast and similar to that of the Legion 5 Pro with the Alienware being slightly faster in some benchmarks. By contrast, the Omen places first in Geekbench and a few other benchmarks.
In battery mode, the CPU performance drops by a full 40 percent.
Cinebench R15 Multi Endurance test
Cinebench R20: CPU (Multi Core) | CPU (Single Core)
Cinebench R15: CPU Multi 64Bit | CPU Single 64Bit
Blender: v2.79 BMW27 CPU
7-Zip 18.03: 7z b 4 | 7z b 4 -mmt1
Geekbench 5.5: Multi-Core | Single-Core
HWBOT x265 Benchmark v2.2: 4k Preset
LibreOffice : 20 Documents To PDF
R Benchmark 2.5: Overall mean
| Cinebench R23 / Multi Core | |
| Average of class Gaming (9107 - 40970, n=130, last 2 years) | |
| Alienware x15 RTX 3070 P111F | |
| Lenovo Legion 5 Pro 16ACH6H (82JQ001PGE) | |
| Lenovo Legion 5 Pro 16ACH6H (82JQ001PGE) | |
| HP Omen 16-b0085ng | |
| Average Intel Core i7-11800H (6508 - 14088, n=48) | |
| HP Omen 15-en0375ng | |
| HP Victus 16-e0179ng | |
| MSI Katana GF66 11UG-220 | |
| Cinebench R23 / Single Core | |
| Average of class Gaming (1166 - 2267, n=130, last 2 years) | |
| MSI Katana GF66 11UG-220 | |
| HP Omen 16-b0085ng | |
| Alienware x15 RTX 3070 P111F | |
| Average Intel Core i7-11800H (1386 - 1522, n=45) | |
| HP Victus 16-e0179ng | |
| Lenovo Legion 5 Pro 16ACH6H (82JQ001PGE) | |
| Lenovo Legion 5 Pro 16ACH6H (82JQ001PGE) | |
| HP Omen 15-en0375ng | |
| Cinebench R20 / CPU (Multi Core) | |
| Average of class Gaming (3504 - 16108, n=129, last 2 years) | |
| Alienware x15 RTX 3070 P111F | |
| Lenovo Legion 5 Pro 16ACH6H (82JQ001PGE) | |
| Lenovo Legion 5 Pro 16ACH6H (82JQ001PGE) | |
| HP Omen 16-b0085ng | |
| Average Intel Core i7-11800H (2498 - 5408, n=50) | |
| HP Omen 15-en0375ng | |
| HP Victus 16-e0179ng | |
| MSI Katana GF66 11UG-220 | |
| Cinebench R20 / CPU (Single Core) | |
| Average of class Gaming (442 - 870, n=129, last 2 years) | |
| HP Omen 16-b0085ng | |
| MSI Katana GF66 11UG-220 | |
| Alienware x15 RTX 3070 P111F | |
| Average Intel Core i7-11800H (520 - 586, n=47) | |
| HP Victus 16-e0179ng | |
| Lenovo Legion 5 Pro 16ACH6H (82JQ001PGE) | |
| Lenovo Legion 5 Pro 16ACH6H (82JQ001PGE) | |
| HP Omen 15-en0375ng | |
| Cinebench R15 / CPU Multi 64Bit | |
| Average of class Gaming (1537 - 6271, n=130, last 2 years) | |
| Alienware x15 RTX 3070 P111F | |
| HP Omen 16-b0085ng | |
| MSI Katana GF66 11UG-220 | |
| MSI Katana GF66 11UG-220 | |
| Lenovo Legion 5 Pro 16ACH6H (82JQ001PGE) | |
| HP Victus 16-e0179ng | |
| HP Omen 15-en0375ng | |
| Average Intel Core i7-11800H (1342 - 2173, n=50) | |
| Cinebench R15 / CPU Single 64Bit | |
| Average of class Gaming (188.8 - 343, n=129, last 2 years) | |
| HP Victus 16-e0179ng | |
| Lenovo Legion 5 Pro 16ACH6H (82JQ001PGE) | |
| Lenovo Legion 5 Pro 16ACH6H (82JQ001PGE) | |
| MSI Katana GF66 11UG-220 | |
| MSI Katana GF66 11UG-220 | |
| HP Omen 16-b0085ng | |
| Alienware x15 RTX 3070 P111F | |
| Average Intel Core i7-11800H (201 - 231, n=46) | |
| HP Omen 15-en0375ng | |
| Blender / v2.79 BMW27 CPU | |
| MSI Katana GF66 11UG-220 | |
| Average Intel Core i7-11800H (217 - 454, n=46) | |
| HP Omen 15-en0375ng | |
| HP Victus 16-e0179ng | |
| Lenovo Legion 5 Pro 16ACH6H (82JQ001PGE) | |
| Lenovo Legion 5 Pro 16ACH6H (82JQ001PGE) | |
| HP Omen 16-b0085ng | |
| Alienware x15 RTX 3070 P111F | |
| Average of class Gaming (80 - 334, n=126, last 2 years) | |
| 7-Zip 18.03 / 7z b 4 | |
| Average of class Gaming (33491 - 148086, n=127, last 2 years) | |
| HP Victus 16-e0179ng | |
| Lenovo Legion 5 Pro 16ACH6H (82JQ001PGE) | |
| Lenovo Legion 5 Pro 16ACH6H (82JQ001PGE) | |
| HP Omen 16-b0085ng | |
| Alienware x15 RTX 3070 P111F | |
| HP Omen 15-en0375ng | |
| Average Intel Core i7-11800H (33718 - 56758, n=46) | |
| MSI Katana GF66 11UG-220 | |
| 7-Zip 18.03 / 7z b 4 -mmt1 | |
| Average of class Gaming (4199 - 7508, n=127, last 2 years) | |
| HP Omen 16-b0085ng | |
| HP Victus 16-e0179ng | |
| MSI Katana GF66 11UG-220 | |
| Lenovo Legion 5 Pro 16ACH6H (82JQ001PGE) | |
| Lenovo Legion 5 Pro 16ACH6H (82JQ001PGE) | |
| Average Intel Core i7-11800H (5138 - 5732, n=46) | |
| Alienware x15 RTX 3070 P111F | |
| HP Omen 15-en0375ng | |
| Geekbench 5.5 / Multi-Core | |
| Average of class Gaming (5847 - 27010, n=127, last 2 years) | |
| HP Omen 16-b0085ng | |
| Average Intel Core i7-11800H (4655 - 9851, n=40) | |
| Lenovo Legion 5 Pro 16ACH6H (82JQ001PGE) | |
| Lenovo Legion 5 Pro 16ACH6H (82JQ001PGE) | |
| HP Omen 15-en0375ng | |
| HP Victus 16-e0179ng | |
| MSI Katana GF66 11UG-220 | |
| Geekbench 5.5 / Single-Core | |
| Average of class Gaming (986 - 2474, n=127, last 2 years) | |
| HP Omen 16-b0085ng | |
| MSI Katana GF66 11UG-220 | |
| Average Intel Core i7-11800H (1429 - 1625, n=40) | |
| HP Victus 16-e0179ng | |
| Lenovo Legion 5 Pro 16ACH6H (82JQ001PGE) | |
| Lenovo Legion 5 Pro 16ACH6H (82JQ001PGE) | |
| HP Omen 15-en0375ng | |
| HWBOT x265 Benchmark v2.2 / 4k Preset | |
| Average of class Gaming (11 - 44.3, n=127, last 2 years) | |
| HP Omen 16-b0085ng | |
| Alienware x15 RTX 3070 P111F | |
| Lenovo Legion 5 Pro 16ACH6H (82JQ001PGE) | |
| Lenovo Legion 5 Pro 16ACH6H (82JQ001PGE) | |
| HP Victus 16-e0179ng | |
| Average Intel Core i7-11800H (7.38 - 17.4, n=46) | |
| HP Omen 15-en0375ng | |
| MSI Katana GF66 11UG-220 | |
| LibreOffice / 20 Documents To PDF | |
| Lenovo Legion 5 Pro 16ACH6H (82JQ001PGE) | |
| Lenovo Legion 5 Pro 16ACH6H (82JQ001PGE) | |
| HP Omen 15-en0375ng | |
| HP Victus 16-e0179ng | |
| MSI Katana GF66 11UG-220 | |
| Alienware x15 RTX 3070 P111F | |
| Average of class Gaming (19 - 88.8, n=127, last 2 years) | |
| Average Intel Core i7-11800H (38.6 - 59.9, n=45) | |
| HP Omen 16-b0085ng | |
| R Benchmark 2.5 / Overall mean | |
| HP Omen 15-en0375ng | |
| Alienware x15 RTX 3070 P111F | |
| Average Intel Core i7-11800H (0.548 - 0.615, n=46) | |
| Lenovo Legion 5 Pro 16ACH6H (82JQ001PGE) | |
| Lenovo Legion 5 Pro 16ACH6H (82JQ001PGE) | |
| HP Omen 16-b0085ng | |
| MSI Katana GF66 11UG-220 | |
| HP Victus 16-e0179ng | |
| Average of class Gaming (0.3439 - 0.759, n=128, last 2 years) | |
* ... smaller is better
System Performance
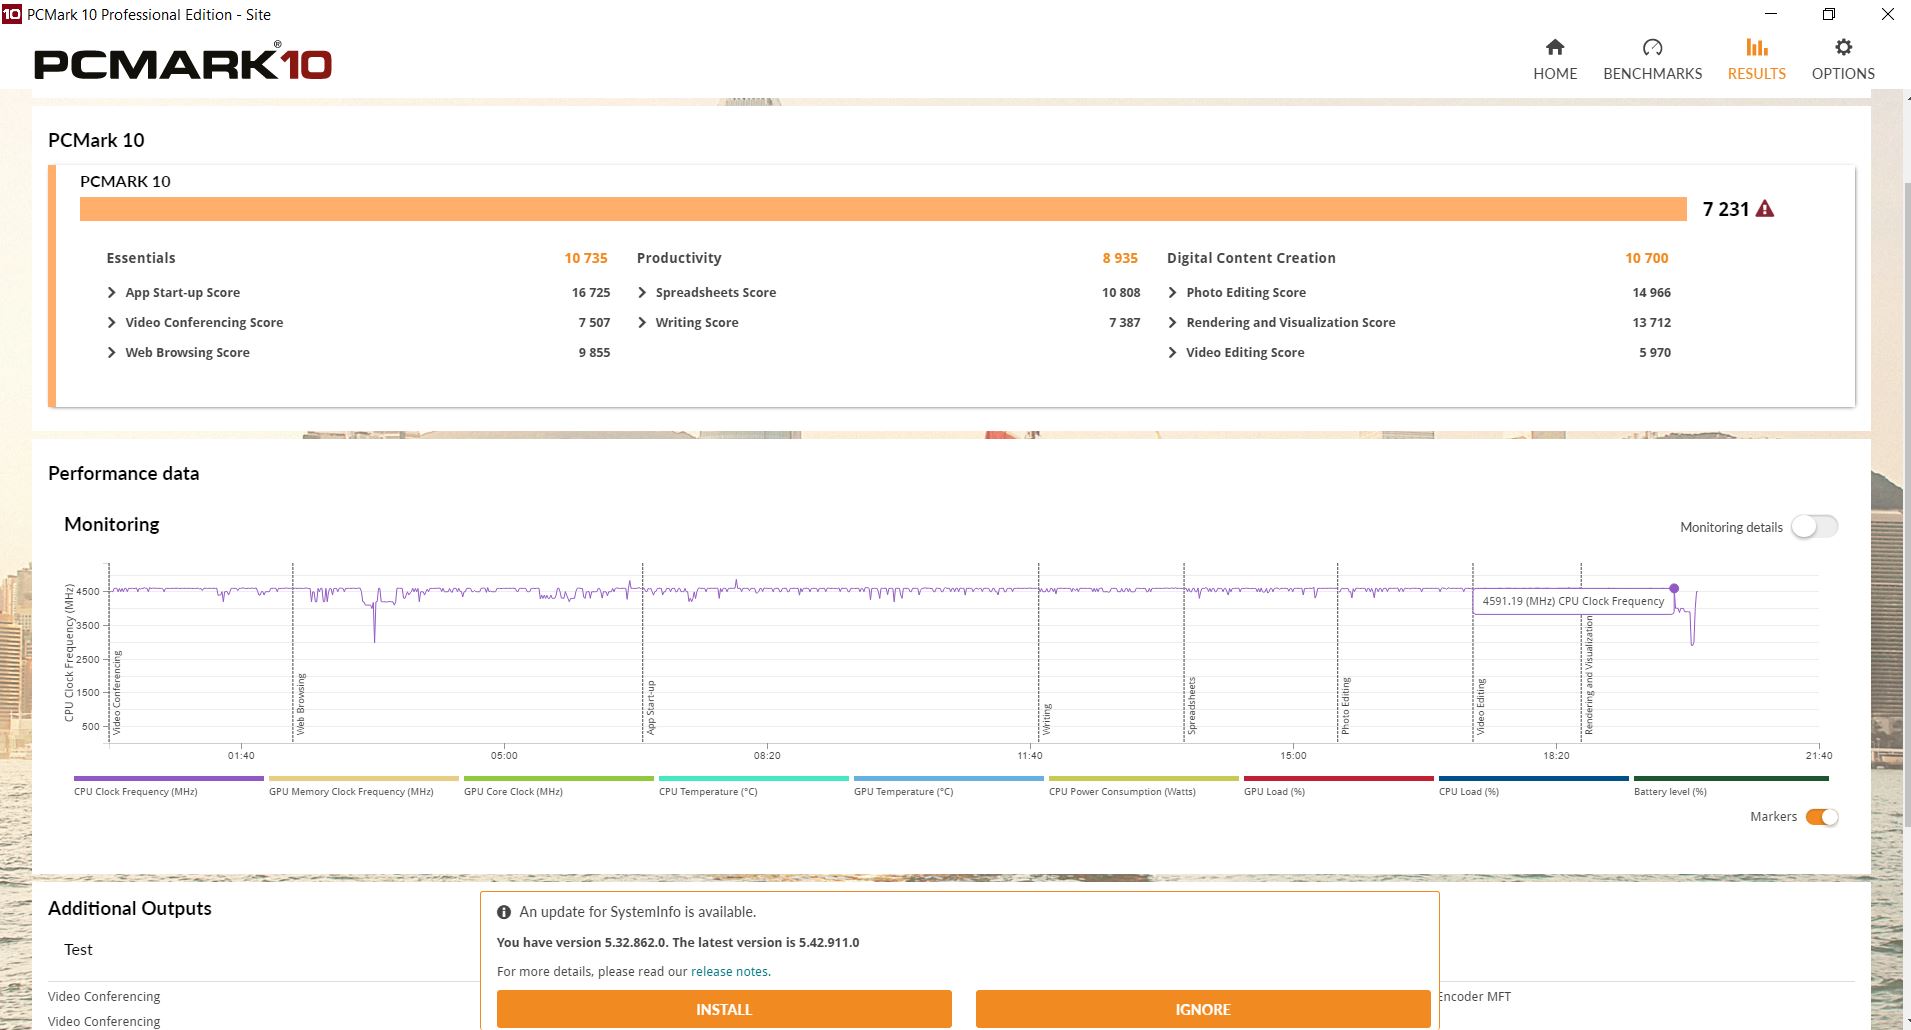
The Omen 16 achieves good system performance (PCMark 10) results and manages to place first in the overall and Essentials categories.
That being said, the differences are relatively minor.
| PCMark 10 / Score | |
| Average of class Gaming (5828 - 10060, n=108, last 2 years) | |
| HP Omen 16-b0085ng | |
| Alienware x15 RTX 3070 P111F | |
| Average Intel Core i7-11800H, NVIDIA GeForce RTX 3070 Laptop GPU (6126 - 7311, n=11) | |
| Lenovo Legion 5 Pro 16ACH6H (82JQ001PGE) | |
| MSI Katana GF66 11UG-220 | |
| HP Victus 16-e0179ng | |
| HP Omen 15-en0375ng | |
| PCMark 10 / Essentials | |
| HP Omen 16-b0085ng | |
| Average of class Gaming (8810 - 12600, n=112, last 2 years) | |
| Alienware x15 RTX 3070 P111F | |
| Average Intel Core i7-11800H, NVIDIA GeForce RTX 3070 Laptop GPU (9248 - 10832, n=11) | |
| HP Victus 16-e0179ng | |
| Lenovo Legion 5 Pro 16ACH6H (82JQ001PGE) | |
| MSI Katana GF66 11UG-220 | |
| HP Omen 15-en0375ng | |
| PCMark 10 / Productivity | |
| Average of class Gaming (6662 - 16716, n=110, last 2 years) | |
| MSI Katana GF66 11UG-220 | |
| Average Intel Core i7-11800H, NVIDIA GeForce RTX 3070 Laptop GPU (8571 - 9669, n=11) | |
| Alienware x15 RTX 3070 P111F | |
| HP Omen 16-b0085ng | |
| HP Victus 16-e0179ng | |
| Lenovo Legion 5 Pro 16ACH6H (82JQ001PGE) | |
| HP Omen 15-en0375ng | |
| PCMark 10 / Digital Content Creation | |
| Average of class Gaming (7505 - 19351, n=110, last 2 years) | |
| Alienware x15 RTX 3070 P111F | |
| HP Omen 16-b0085ng | |
| Average Intel Core i7-11800H, NVIDIA GeForce RTX 3070 Laptop GPU (7627 - 10851, n=11) | |
| Lenovo Legion 5 Pro 16ACH6H (82JQ001PGE) | |
| MSI Katana GF66 11UG-220 | |
| HP Victus 16-e0179ng | |
| HP Omen 15-en0375ng | |
| PCMark 10 Score | 7231 points | |
Help | ||
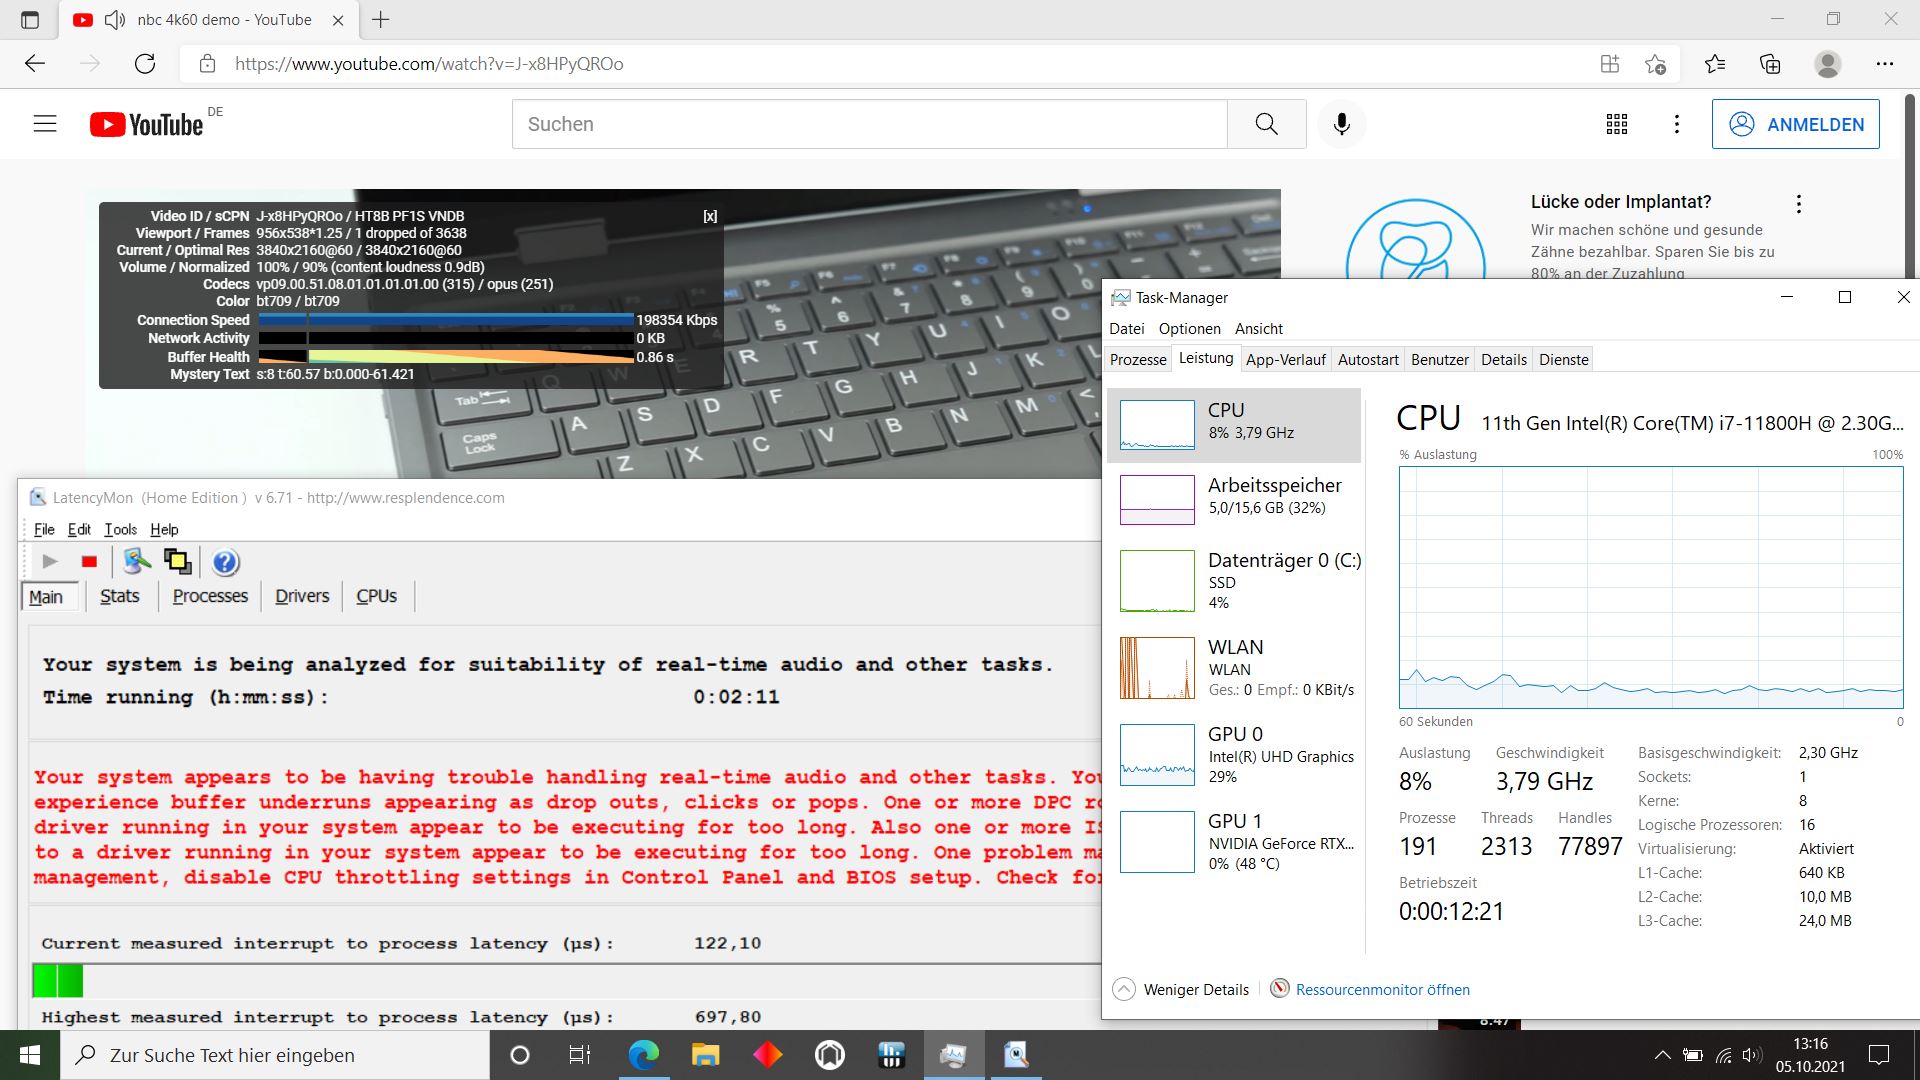
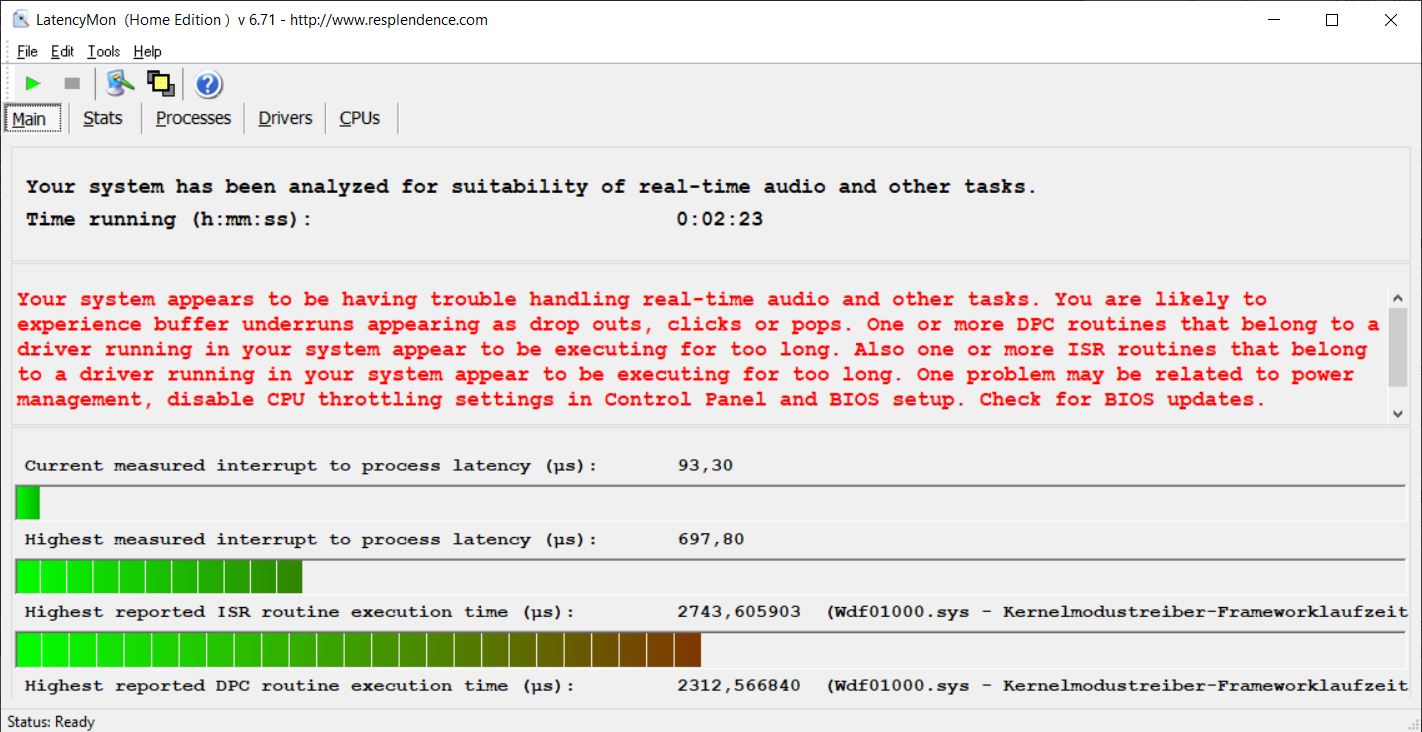
DPC Latencies
Even just opening our homepage in the Edge browser causes problematic DPC latencies according to LatencyMon. At least only 1 frame was dropped while playing our 4K60FPS YouTube video. We hope HP will take a second look at their drivers and release updated versions.
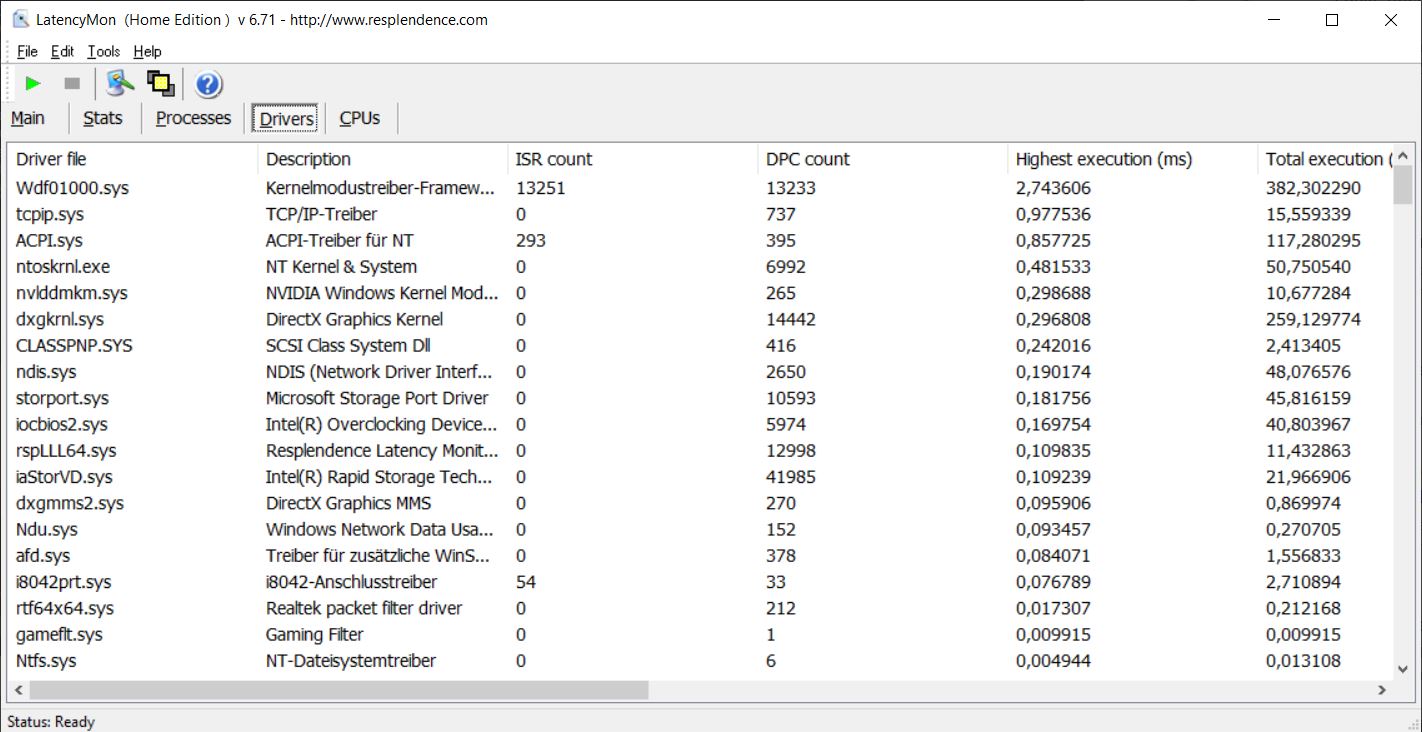
| DPC Latencies / LatencyMon - interrupt to process latency (max), Web, Youtube, Prime95 | |
| HP Omen 16-b0085ng | |
* ... smaller is better
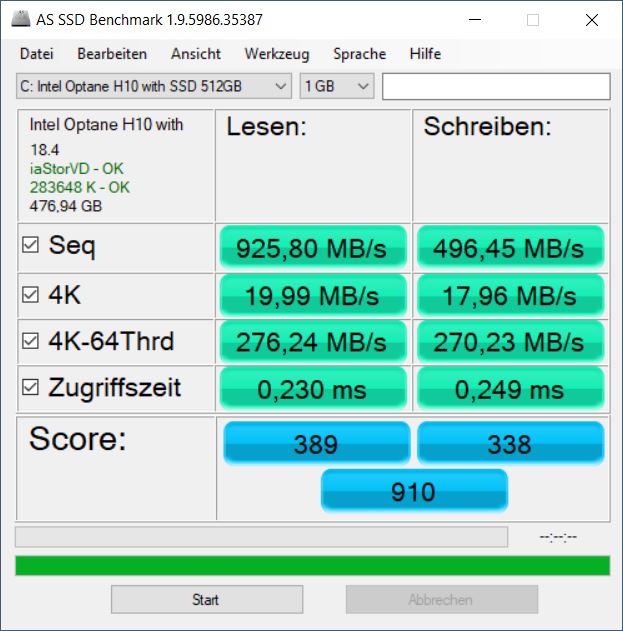
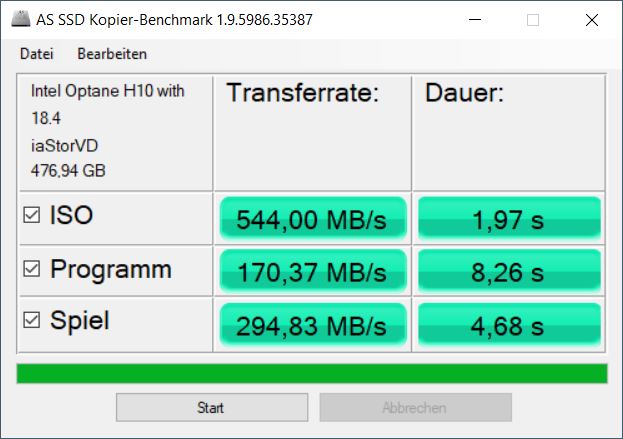
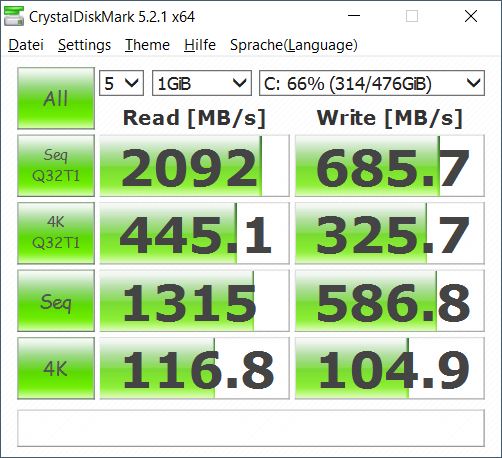
Storage Solution
When it comes to the storage solution, our test device uses a combined solution consisting of the Intel Optane Memory H10 32GB + 512GB. 32 GB of Optane cache is only advantageous after repeated executions of the same workload and the Intel SSD does not exactly perform spectacularly otherwise - some competitors are up to twice as fast.
With that in mind, the excellent system performance results are somewhat surprising. Perhaps, the ultra-fast Optane memory is able to offset the performance disadvantages of the installed primary SSD. In our HDD/SSD table, the SSD's poor synthetic measurements place it at rank 262.
| HP Omen 16-b0085ng Intel Optane Memory H10 with Solid State Storage 32GB + 512GB HBRPEKNX0202A(L/H) | HP Omen 15-en0375ng WDC PC SN730 SDBPNTY-512G | HP Victus 16-e0179ng WDC PC SN730 SDBPNTY-1T00 | Lenovo Legion 5 Pro 16ACH6H (82JQ001PGE) WDC PC SN730 SDBPNTY-1T00 | Alienware x15 RTX 3070 P111F WDC PC SN730 SDBPNTY-512G | MSI Katana GF66 11UG-220 Kingston OM8PDP3512B-AI1 | Average Intel Optane Memory H10 with Solid State Storage 32GB + 512GB HBRPEKNX0202A(L/H) | |
|---|---|---|---|---|---|---|---|
| CrystalDiskMark 5.2 / 6 | 96% | 113% | 57% | 89% | -14% | 13% | |
| Write 4K (MB/s) | 104.9 | 119.6 14% | 157.3 50% | 89.9 -14% | 179.6 71% | 138.2 32% | 110.3 ? 5% |
| Read 4K (MB/s) | 116.8 | 47.4 -59% | 49 -58% | 30.98 -73% | 49.21 -58% | 31.31 -73% | 131.9 ? 13% |
| Write Seq (MB/s) | 587 | 2677 356% | 2983 408% | 2062 251% | 459.3 -22% | 569 ? -3% | |
| Read Seq (MB/s) | 1316 | 2220 69% | 2247 71% | 1849 41% | 1283 -3% | 1372 ? 4% | |
| Write 4K Q32T1 (MB/s) | 325.7 | 427.4 31% | 395 21% | 371.6 14% | 462.9 42% | 321 -1% | 387 ? 19% |
| Read 4K Q32T1 (MB/s) | 445.1 | 549 23% | 557 25% | 470.6 6% | 470.2 6% | 394.5 -11% | 375 ? -16% |
| Write Seq Q32T1 (MB/s) | 686 | 2706 294% | 3094 351% | 3065 347% | 2702 294% | 436 -36% | 1141 ? 66% |
| Read Seq Q32T1 (MB/s) | 2092 | 2869 37% | 2871 37% | 3370 61% | 3371 61% | 2222 6% | 2439 ? 17% |
| Write 4K Q8T8 (MB/s) | 1619 | ||||||
| Read 4K Q8T8 (MB/s) | 1670 | ||||||
| AS SSD | 377% | 377% | 176% | 249% | 48% | 119% | |
| Seq Read (MB/s) | 925 | 2255 144% | 2383 158% | 2695 191% | 2871 210% | 1978 114% | 1056 ? 14% |
| Seq Write (MB/s) | 496 | 2129 329% | 2466 397% | 2384 381% | 1511 205% | 308.3 -38% | 429 ? -14% |
| 4K Read (MB/s) | 19.99 | 49.5 148% | 44.14 121% | 29.75 49% | 44.3 122% | 24.04 20% | 61.9 ? 210% |
| 4K Write (MB/s) | 17.96 | 175.1 875% | 117.5 554% | 52 190% | 162 802% | 113.7 533% | 105 ? 485% |
| 4K-64 Read (MB/s) | 276.2 | 1463 430% | 1734 528% | 1193 332% | 1038 276% | 256.5 -7% | 459 ? 66% |
| 4K-64 Write (MB/s) | 270.2 | 2061 663% | 2088 673% | 1107 310% | 966 258% | 242.8 -10% | 644 ? 138% |
| Access Time Read * (ms) | 0.23 | 0.138 40% | 0.049 79% | 0.136 41% | 0.077 67% | 0.15 35% | 0.1019 ? 56% |
| Access Time Write * (ms) | 0.249 | 0.022 91% | 0.032 87% | 0.36 -45% | 0.066 73% | 0.353 -42% | 0.09417 ? 62% |
| Score Read (Points) | 389 | 1738 347% | 2017 419% | 1493 284% | 1370 252% | 478 23% | 627 ? 61% |
| Score Write (Points) | 338 | 2449 625% | 2452 625% | 1397 313% | 1279 278% | 387 14% | 792 ? 134% |
| Score Total (Points) | 910 | 5075 458% | 5503 505% | 3636 300% | 3288 261% | 1033 14% | 1732 ? 90% |
| Copy ISO MB/s (MB/s) | 544 | 1007 85% | 1962 261% | 278.1 -49% | 782 ? 44% | ||
| Copy Program MB/s (MB/s) | 170.4 | 43.11 -75% | 407.9 139% | 282.3 66% | 464 ? 172% | ||
| Copy Game MB/s (MB/s) | 294.8 | 621 111% | 1105 275% | 284.2 -4% | 722 ? 145% | ||
| Total Average (Program / Settings) | 237% /
259% | 245% /
266% | 117% /
140% | 169% /
190% | 17% /
26% | 66% /
80% |
* ... smaller is better

Continuous reading: DiskSpd Read Loop, Queue Depth 8
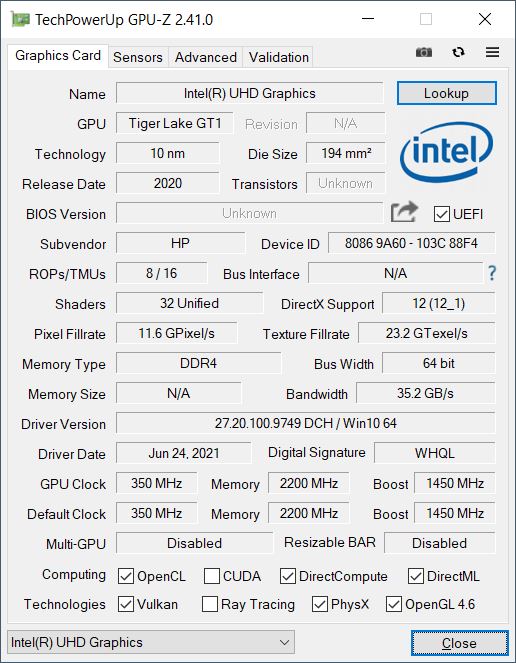
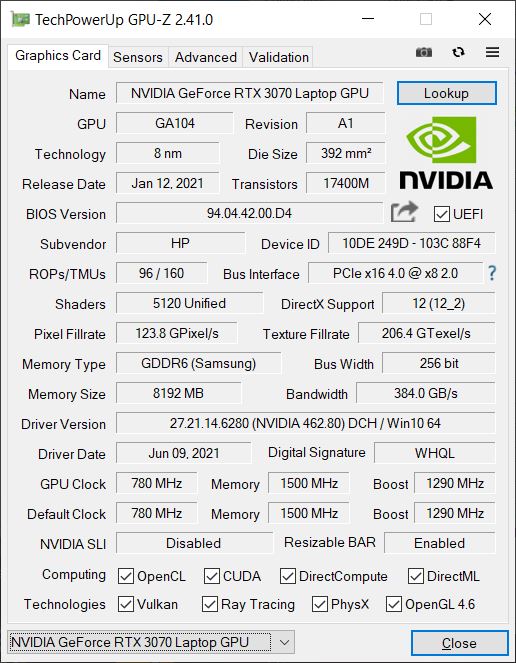
GPU Performance
In hybrid mode, the integrated UHD Graphics and the dedicated NVIDIA GeForce RTX 3070 laptop GPU with 8 GB of VRAM take turns depending on the load. The TGP of the latter is set to 115 W. With a possible spectrum of 80 W to 125 W it belongs to the high-performance category. Alternatively, an Omen 16 with an RTX 3060 is also available.
The 3DMark results of the Omen 16 are good and very similar to those of the Alienware and the Legion 5 Pro. Meanwhile, the RTX 3060 inside the HP Victus is around 30 percent slower.
In battery mode, the system's graphics performance drops by a full 64 percent.
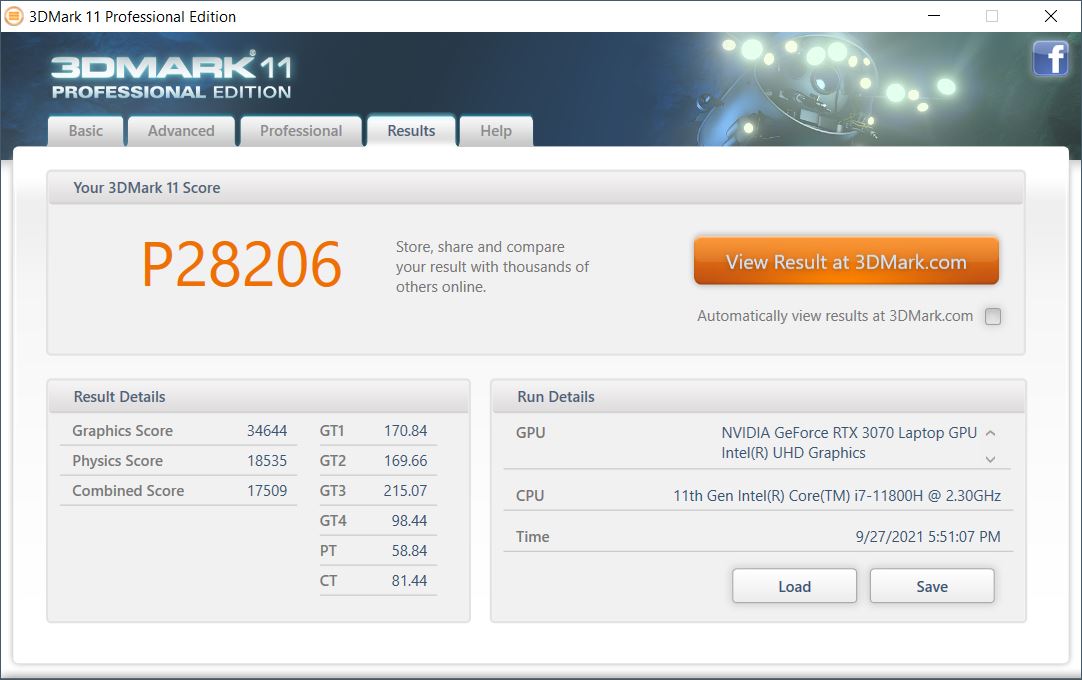
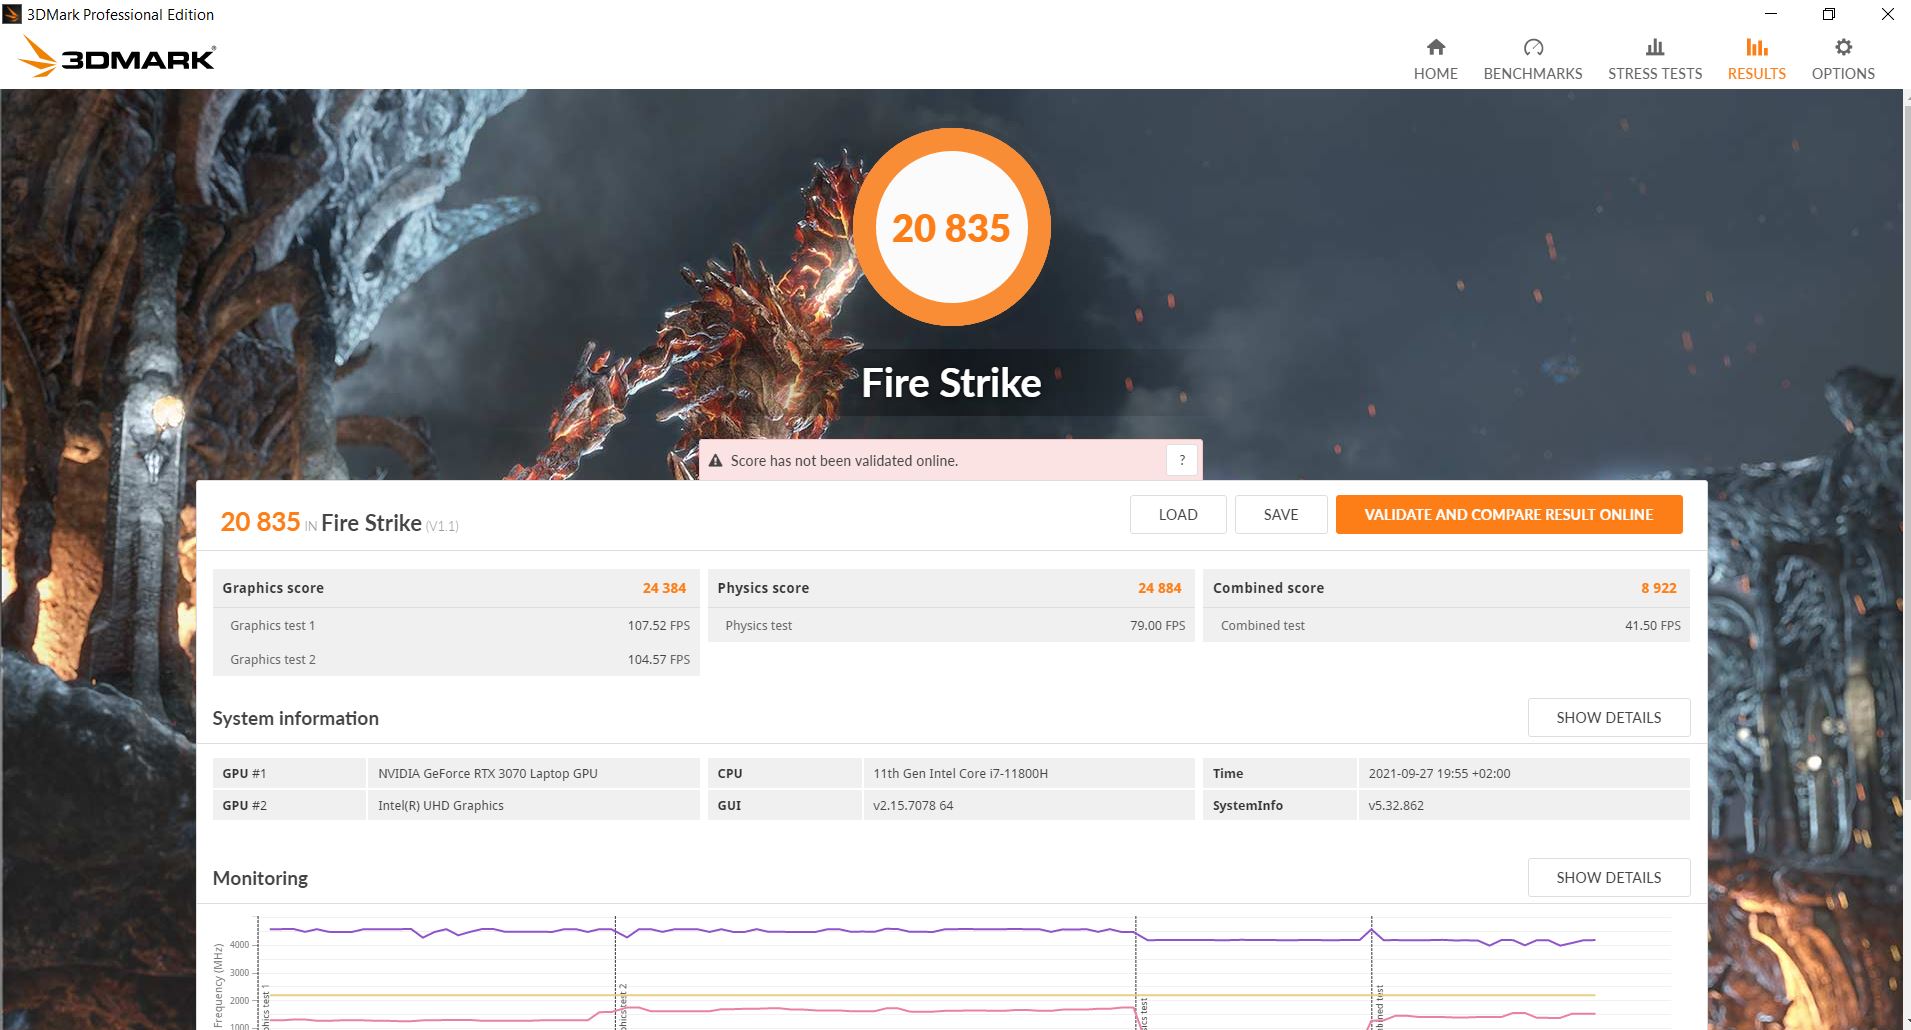
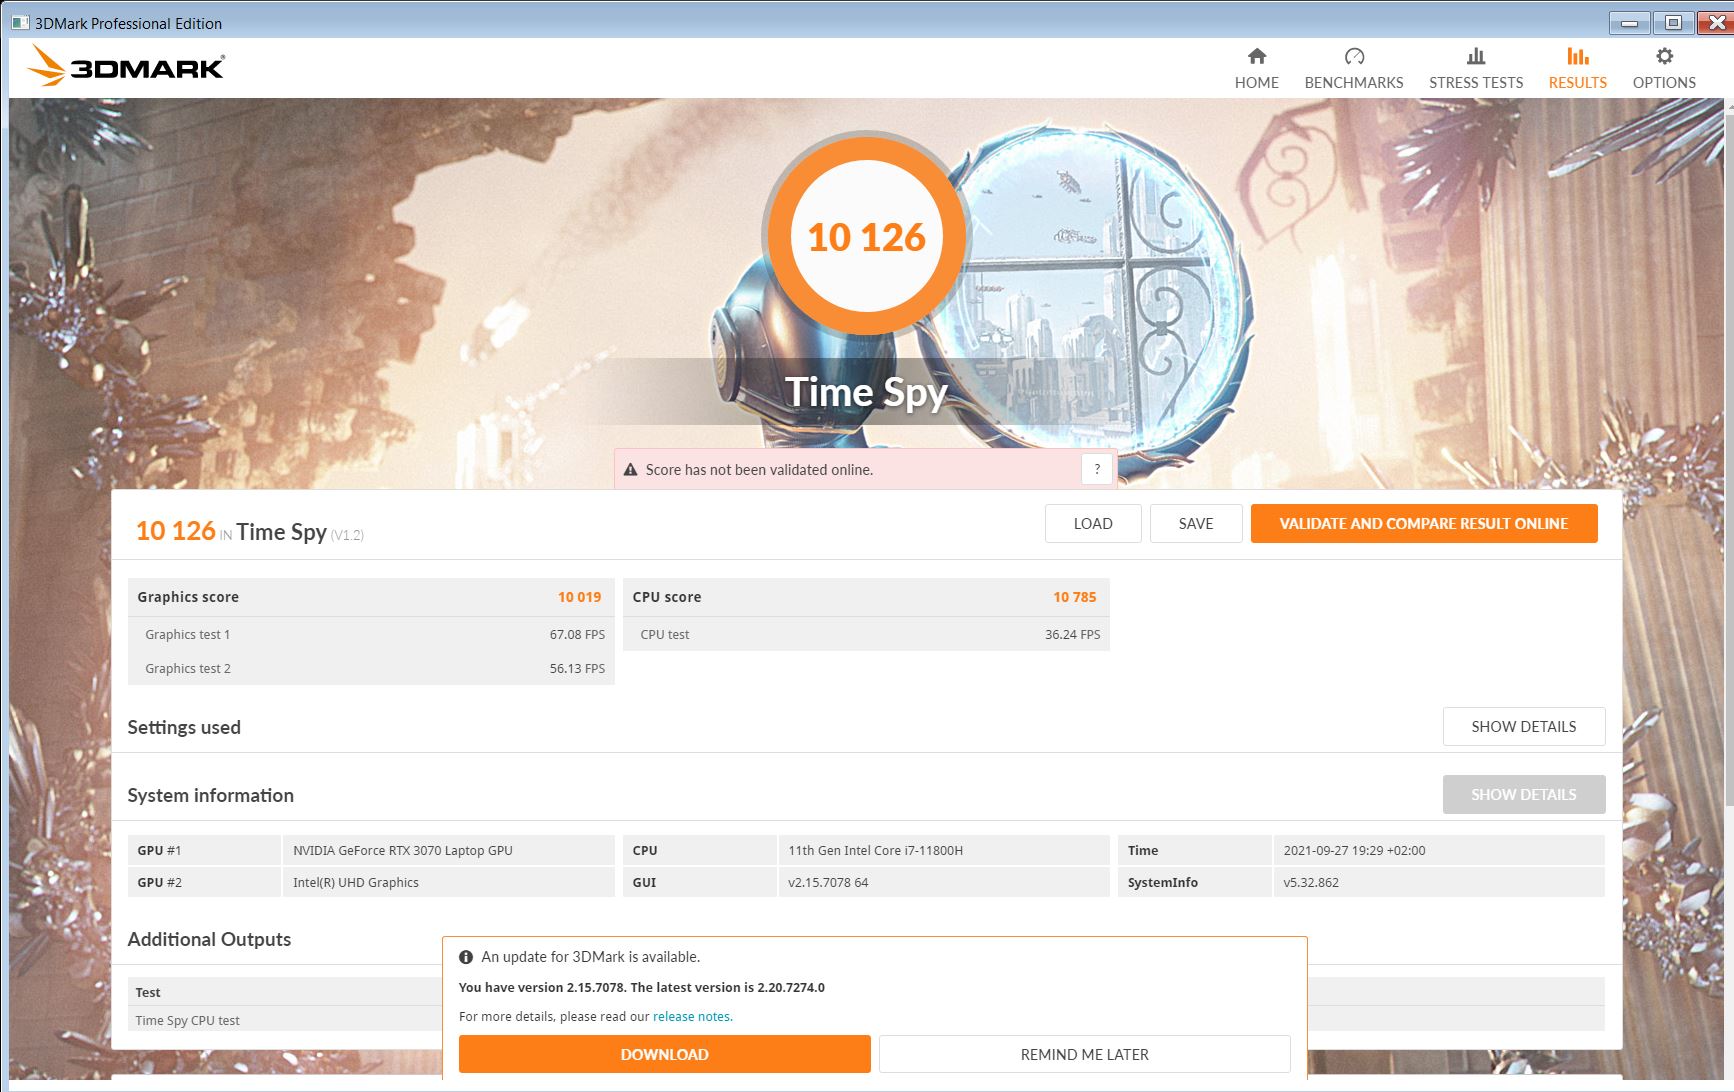
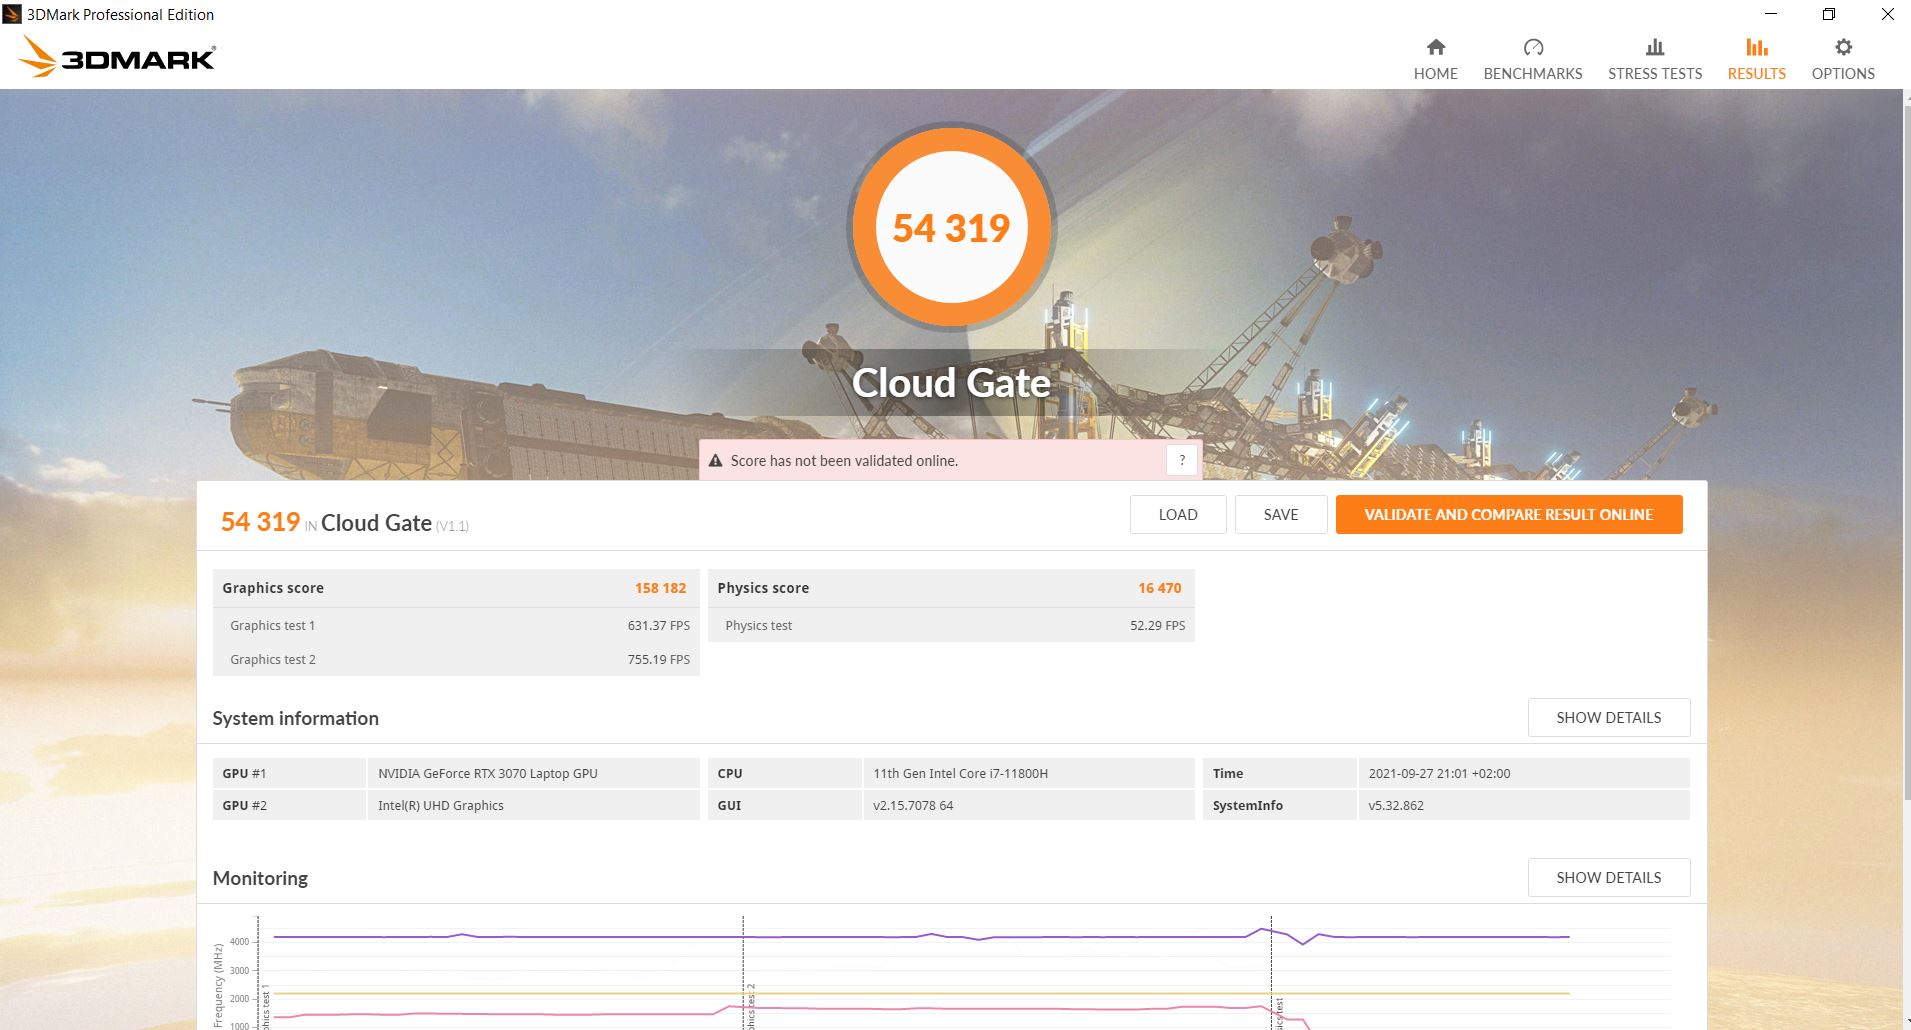
| 3DMark 11 Performance | 28206 points | |
| 3DMark Cloud Gate Standard Score | 54319 points | |
| 3DMark Fire Strike Score | 20835 points | |
| 3DMark Time Spy Score | 10126 points | |
Help | ||
Gaming Performance
The Omen 16 is a heavyweight when it comes to our gaming benchmarks and competes for the first place with the Alienware. However, the latter tends to outperform our Omen 16 by a small margin, particularly at higher resolutions and quality settings.
| New World | |
| 1920x1080 Low Video Quality | |
| HP Omen 16-b0085ng | |
| Average NVIDIA GeForce RTX 3070 Laptop GPU (99.8 - 120.5, n=3) | |
| 1920x1080 Medium Video Quality | |
| HP Omen 16-b0085ng | |
| Average NVIDIA GeForce RTX 3070 Laptop GPU (84.6 - 96.8, n=4) | |
| 1920x1080 High Video Quality | |
| HP Omen 16-b0085ng | |
| Average NVIDIA GeForce RTX 3070 Laptop GPU (81.7 - 94.8, n=4) | |
| 1920x1080 Very High Video Quality | |
| Average NVIDIA GeForce RTX 3070 Laptop GPU (79.4 - 86.8, n=4) | |
| HP Omen 16-b0085ng | |
During our 60-minute Witcher 3 idle test, the frame rates are not entirely constant. Here, the performance fluctuates slightly, although the graph does not show a significant long-term decrease in performance.
Witcher 3 FPS-Diagram
| low | med. | high | ultra | |
|---|---|---|---|---|
| GTA V (2015) | 185 | 181 | 172 | 103 |
| The Witcher 3 (2015) | 416 | 304.5 | 184.4 | 98.6 |
| Dota 2 Reborn (2015) | 171 | 151 | 145 | 137 |
| X-Plane 11.11 (2018) | 136 | 121 | 96.7 | |
| Far Cry 5 (2018) | 156 | 129 | 123 | 115 |
| Strange Brigade (2018) | 482 | 254 | 205 | 178 |
| Shadow of the Tomb Raider (2018) | 159 | 140 | 135 | 126 |
| New World (2021) | 128 | 96.8 | 94.8 | 81.8 |
Emissions - Strong Omens Cannot be Ignored
System Noise
In hybrid mode, the fans tend to not turn on during system idle. After selecting the performance mode from within the Gaming Hub software, the fans mostly - but not always - rotate quietly. Under load, both fans become very loud with noise levels that exceed those of the competition. Subjectively, however, the laptop is not noticeably louder than its competitors.
That being said, there is some coil whine that occurs sporadically. This appears to corellate with high load scenarios such as launching Witcher 3 at high resoutions and quality settings. Thankfully, the relatively quiet, electronic noises are temporary and only sometimes noticeable.
Noise level
| Idle |
| 23 / 23 / 34.81 dB(A) |
| Load |
| 35.02 / 56 dB(A) |
 | ||
30 dB silent 40 dB(A) audible 50 dB(A) loud |
||
min: | ||
| HP Omen 16-b0085ng GeForce RTX 3070 Laptop GPU, i7-11800H, Intel Optane Memory H10 with Solid State Storage 32GB + 512GB HBRPEKNX0202A(L/H) | HP Omen 15-en0375ng GeForce RTX 2060 Mobile, R7 4800H, WDC PC SN730 SDBPNTY-512G | HP Victus 16-e0179ng GeForce RTX 3060 Laptop GPU, R7 5800H, WDC PC SN730 SDBPNTY-1T00 | Lenovo Legion 5 Pro 16ACH6H (82JQ001PGE) GeForce RTX 3070 Laptop GPU, R7 5800H, WDC PC SN730 SDBPNTY-1T00 | Alienware x15 RTX 3070 P111F GeForce RTX 3070 Laptop GPU, i7-11800H, WDC PC SN730 SDBPNTY-512G | MSI Katana GF66 11UG-220 GeForce RTX 3070 Laptop GPU, i7-11800H, Kingston OM8PDP3512B-AI1 | |
|---|---|---|---|---|---|---|
| Noise | -5% | -4% | 4% | 1% | -18% | |
| off / environment * (dB) | 23 | 24 -4% | 24 -4% | 23 -0% | 24.1 -5% | 25 -9% |
| Idle Minimum * (dB) | 23 | 24 -4% | 24 -4% | 25 -9% | 26.6 -16% | 34 -48% |
| Idle Average * (dB) | 23 | 25 -9% | 25 -9% | 25 -9% | 26.6 -16% | 35 -52% |
| Idle Maximum * (dB) | 34.81 | 37 -6% | 34 2% | 25 28% | 26.6 24% | 36 -3% |
| Load Average * (dB) | 35.02 | 45 -28% | 44 -26% | 35.5 -1% | 30.9 12% | 48 -37% |
| Witcher 3 ultra * (dB) | 52 | 48 8% | 50 4% | 46.67 10% | 49.9 4% | 46 12% |
| Load Maximum * (dB) | 56 | 51 9% | 52 7% | 50.35 10% | 53.5 4% | 49 12% |
* ... smaller is better
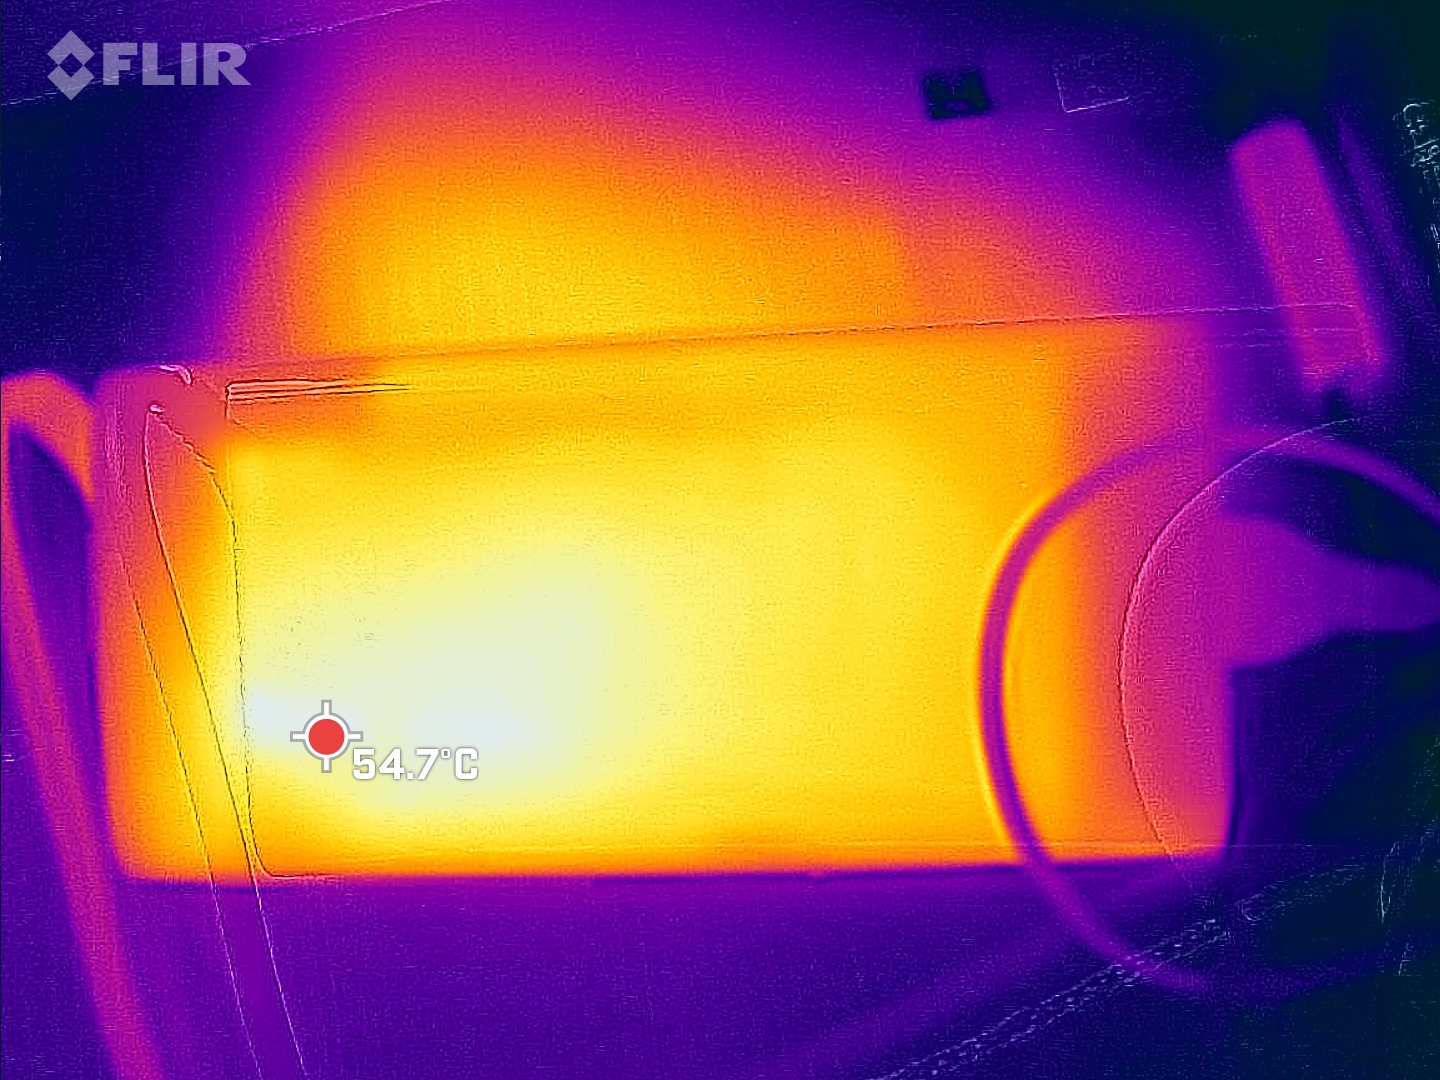
Temperature
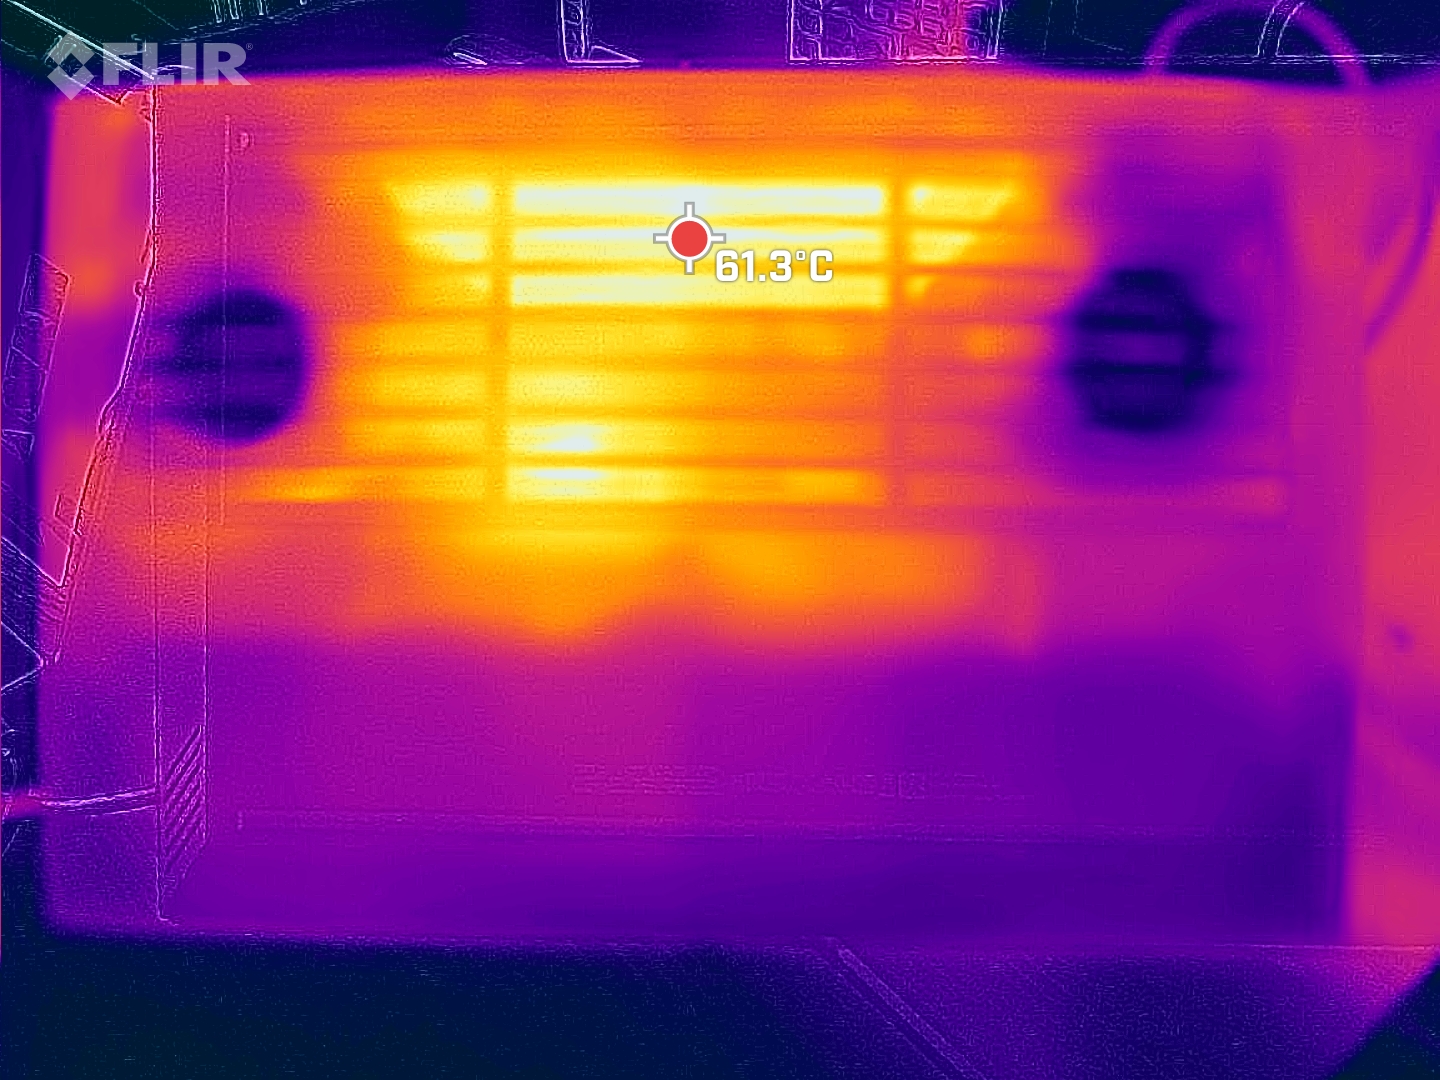
The Omen 16 primarily heats up on the bottom, where extensive grilles serve both as an intake and a heat dissipation outlet.
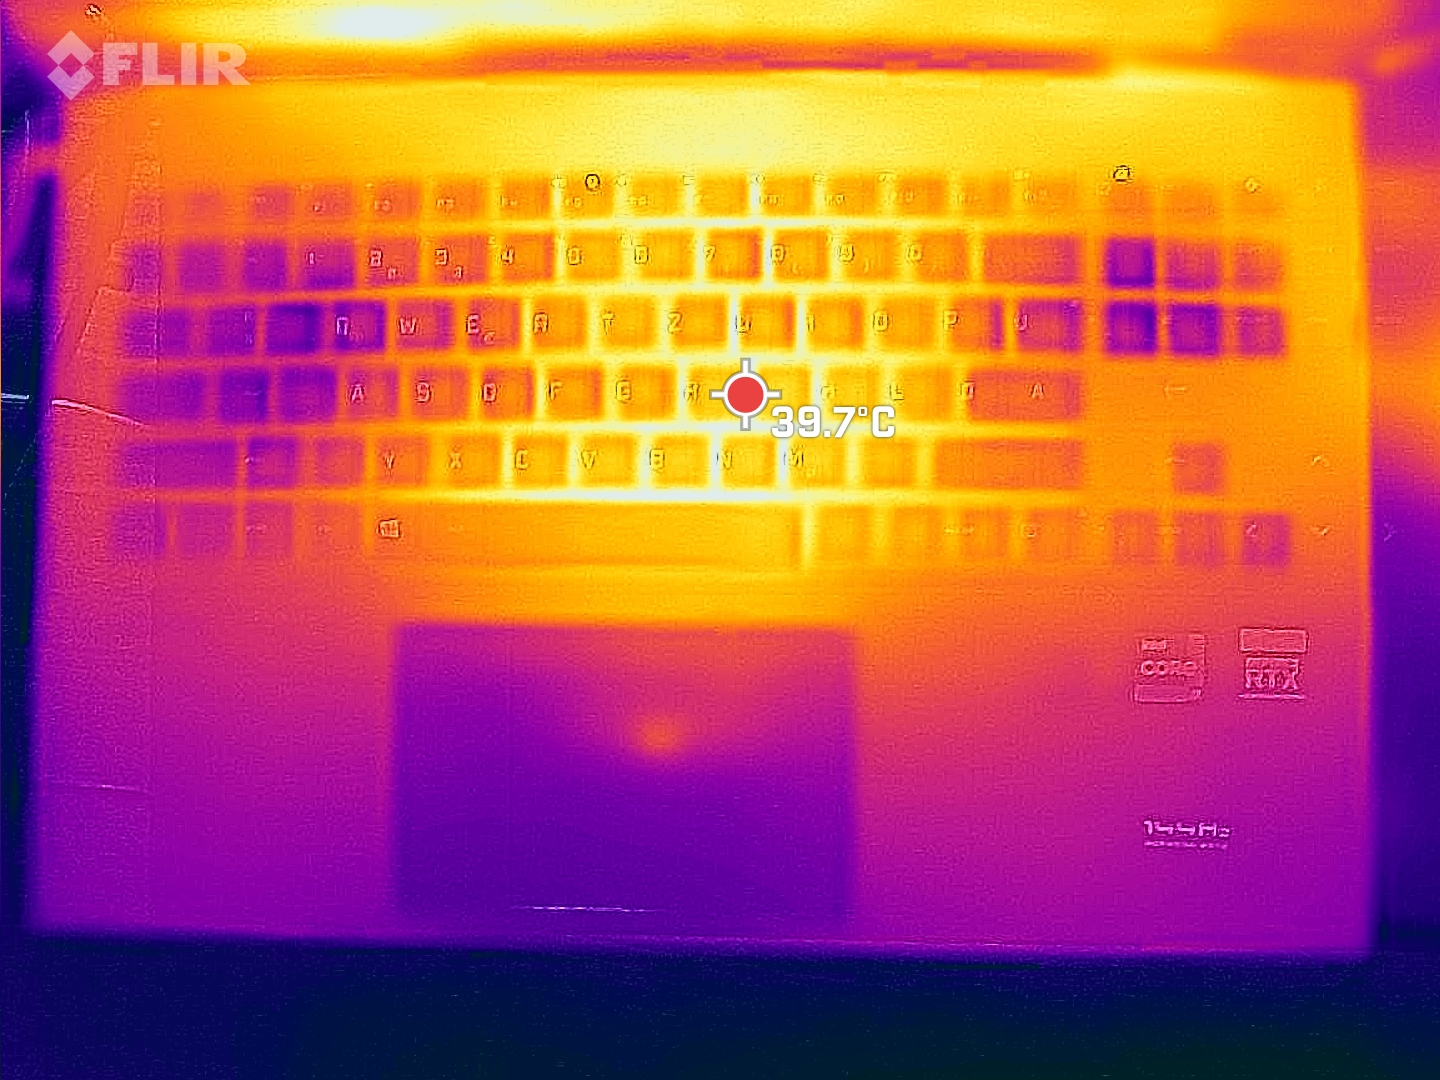
On the top, the Omen remains relatively cool. Hot spots on the bottom reach up to 55 °C (131 °F), which is fairly tame comparatively. Here, the highly dynamic cooling solution with high noise levels under full load demonstrates what it is capable of. Despite being equipped with an even more spacious cooling solution, the Alienware reaches even higher temperatures, while achieving only marginally faster performance.
The palm rests remain comfortably cool and even the temperature of the WASD keys is surprisingly low. In that regard, HP has successfully managed to balance the heat distribution in a way that should make gamers happy.
(-) The maximum temperature on the upper side is 48 °C / 118 F, compared to the average of 40.4 °C / 105 F, ranging from 21.2 to 68.8 °C for the class Gaming.
(-) The bottom heats up to a maximum of 55 °C / 131 F, compared to the average of 43.3 °C / 110 F
(+) In idle usage, the average temperature for the upper side is 30.9 °C / 88 F, compared to the device average of 33.9 °C / 93 F.
(±) Playing The Witcher 3, the average temperature for the upper side is 36.2 °C / 97 F, compared to the device average of 33.9 °C / 93 F.
(+) The palmrests and touchpad are reaching skin temperature as a maximum (33 °C / 91.4 F) and are therefore not hot.
(-) The average temperature of the palmrest area of similar devices was 28.8 °C / 83.8 F (-4.2 °C / -7.6 F).
| HP Omen 16-b0085ng GeForce RTX 3070 Laptop GPU, i7-11800H, Intel Optane Memory H10 with Solid State Storage 32GB + 512GB HBRPEKNX0202A(L/H) | HP Omen 15-en0375ng GeForce RTX 2060 Mobile, R7 4800H, WDC PC SN730 SDBPNTY-512G | HP Victus 16-e0179ng GeForce RTX 3060 Laptop GPU, R7 5800H, WDC PC SN730 SDBPNTY-1T00 | Lenovo Legion 5 Pro 16ACH6H (82JQ001PGE) GeForce RTX 3070 Laptop GPU, R7 5800H, WDC PC SN730 SDBPNTY-1T00 | Alienware x15 RTX 3070 P111F GeForce RTX 3070 Laptop GPU, i7-11800H, WDC PC SN730 SDBPNTY-512G | MSI Katana GF66 11UG-220 GeForce RTX 3070 Laptop GPU, i7-11800H, Kingston OM8PDP3512B-AI1 | |
|---|---|---|---|---|---|---|
| Heat | 14% | -11% | -1% | 3% | 3% | |
| Maximum Upper Side * (°C) | 48 | 42 12% | 51 -6% | 50 -4% | 59.2 -23% | 56 -17% |
| Maximum Bottom * (°C) | 55 | 54 2% | 52 5% | 55 -0% | 58 -5% | 49 11% |
| Idle Upper Side * (°C) | 33 | 28 15% | 46 -39% | 34 -3% | 28.4 14% | 36 -9% |
| Idle Bottom * (°C) | 39 | 29 26% | 41 -5% | 37 5% | 29 26% | 28 28% |
* ... smaller is better
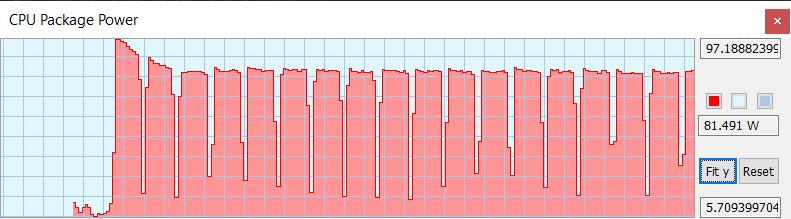
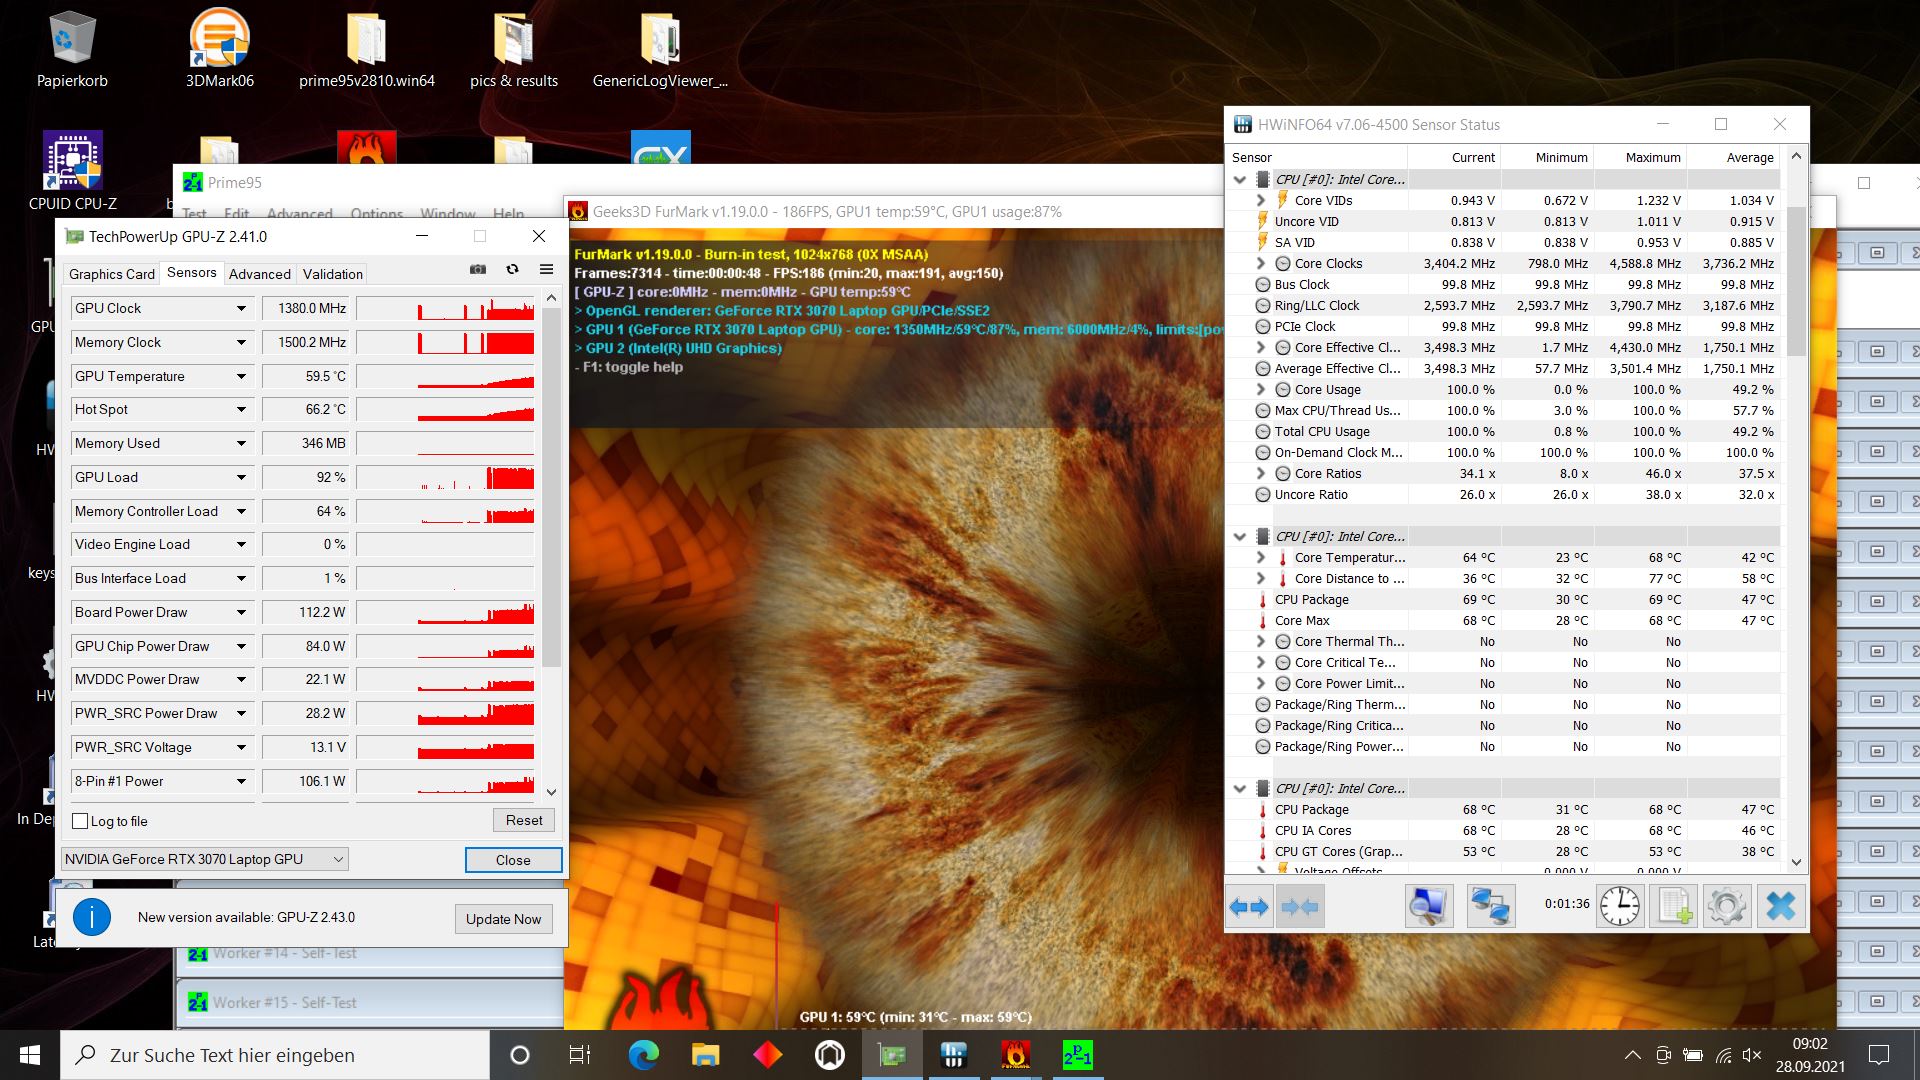
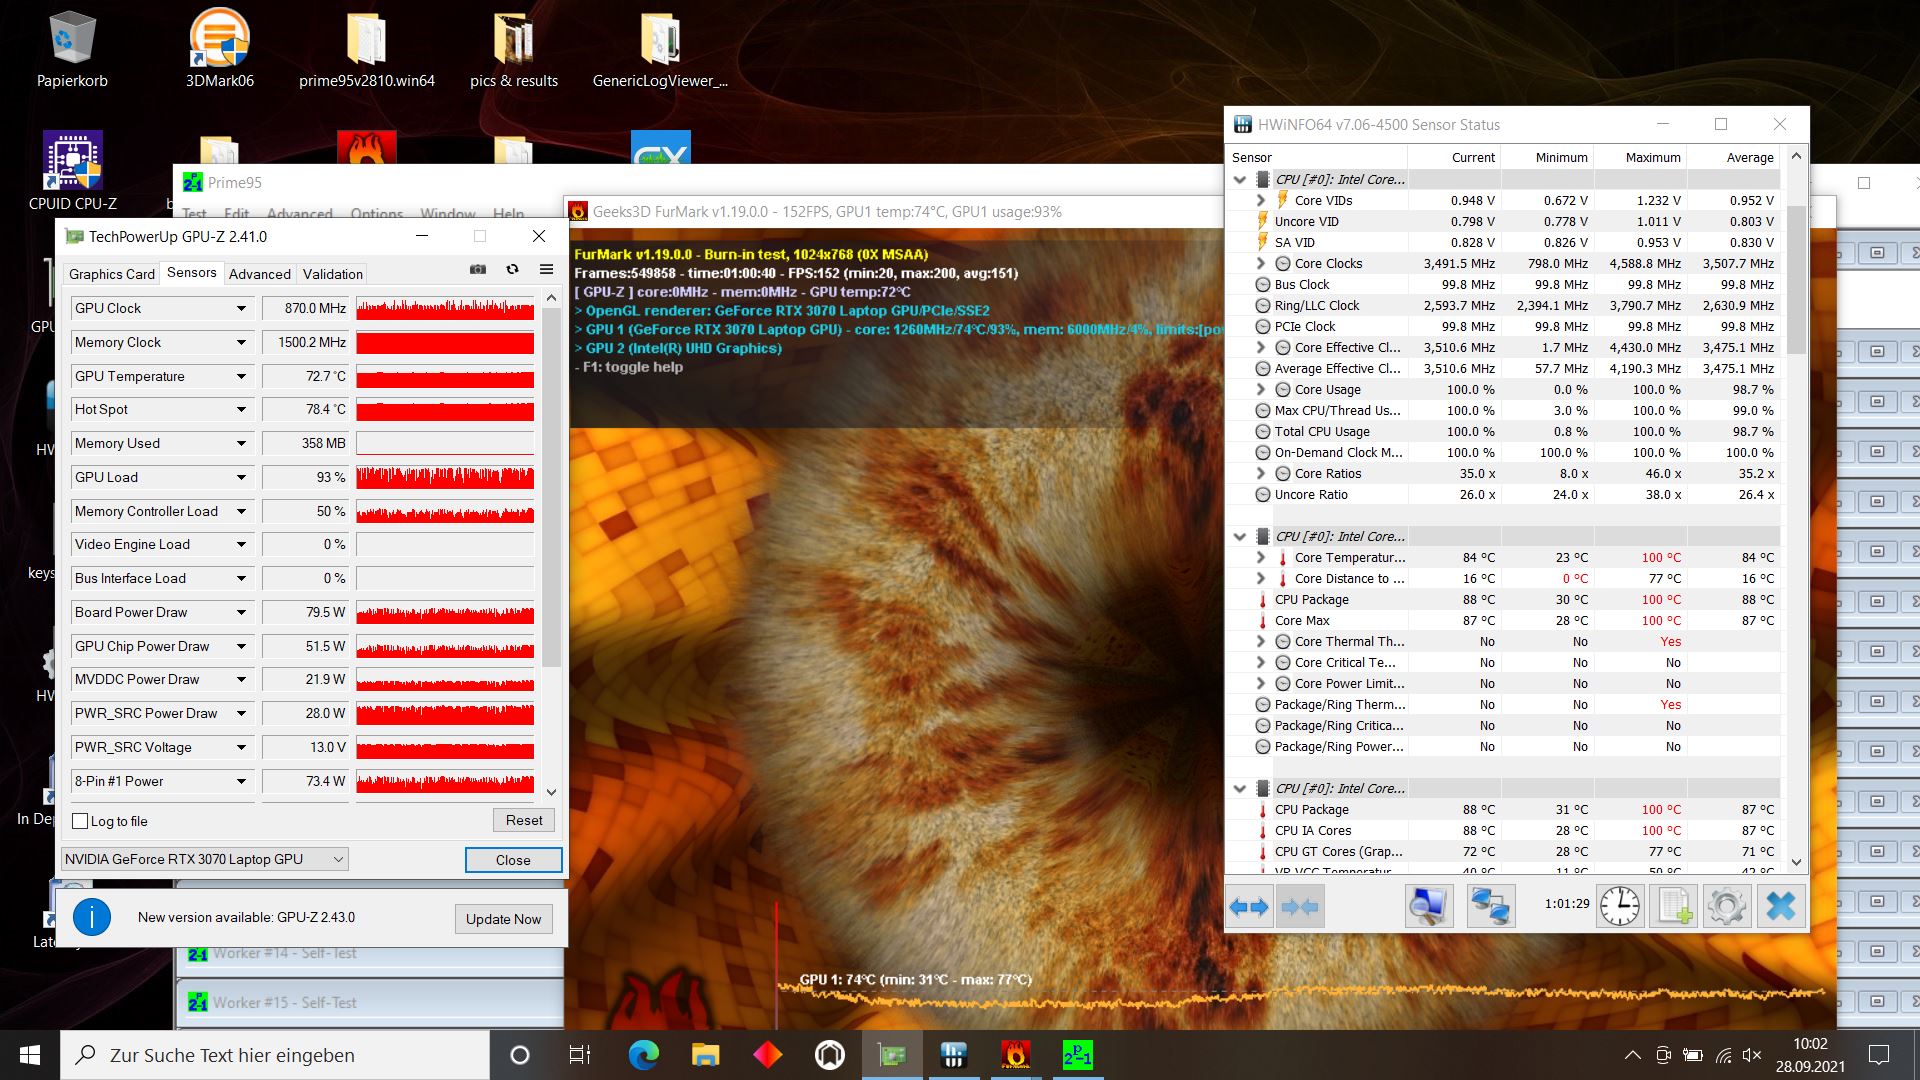
The CPU begins our stress test at approximately 4.2 GHz. After less than one minute, the clock speeds drop to 3.5 GHz. This performance level is then maintained throughout the remainder of the stress test despite fluctuating temperatures. They averaged 84 °C (183.2 °F) with short, temporary spikes to 100 °C (212 °F) that may cause the clock speeds to decrease slightly and (more likely) the cooling solution to ramp up.
In contrast, the GPU cycles heavily throughout the entire duration of the stress test with recorded clock speeds that range from 690 to 1425 MHz, even after an hour has passed. Apparently, the GPU thermally throttles temporarily when reaching 75 °C (167 °F).
Speakers
The stereo speakers can get fairly loud and offer balanced mids and treble. Naturally, they are lacking in terms of bass. The only analog output on the laptop is a combined headset jack.
HP Omen 16-b0085ng audio analysis
(+) | speakers can play relatively loud (84.4 dB)
Bass 100 - 315 Hz
(-) | nearly no bass - on average 17.4% lower than median
(±) | linearity of bass is average (13.9% delta to prev. frequency)
Mids 400 - 2000 Hz
(+) | balanced mids - only 3.2% away from median
(+) | mids are linear (2.9% delta to prev. frequency)
Highs 2 - 16 kHz
(+) | balanced highs - only 1.5% away from median
(+) | highs are linear (3.9% delta to prev. frequency)
Overall 100 - 16.000 Hz
(+) | overall sound is linear (12.1% difference to median)
Compared to same class
» 12% of all tested devices in this class were better, 4% similar, 84% worse
» The best had a delta of 6%, average was 18%, worst was 132%
Compared to all devices tested
» 9% of all tested devices were better, 2% similar, 88% worse
» The best had a delta of 4%, average was 24%, worst was 134%
Lenovo Legion 5 Pro 16ACH6H (82JQ001PGE) audio analysis
(±) | speaker loudness is average but good (76.1 dB)
Bass 100 - 315 Hz
(±) | reduced bass - on average 10.8% lower than median
(±) | linearity of bass is average (14.7% delta to prev. frequency)
Mids 400 - 2000 Hz
(±) | higher mids - on average 6.7% higher than median
(±) | linearity of mids is average (7.8% delta to prev. frequency)
Highs 2 - 16 kHz
(±) | reduced highs - on average 5.2% lower than median
(±) | linearity of highs is average (8.6% delta to prev. frequency)
Overall 100 - 16.000 Hz
(±) | linearity of overall sound is average (17.4% difference to median)
Compared to same class
» 48% of all tested devices in this class were better, 12% similar, 40% worse
» The best had a delta of 6%, average was 18%, worst was 132%
Compared to all devices tested
» 32% of all tested devices were better, 8% similar, 59% worse
» The best had a delta of 4%, average was 24%, worst was 134%
Energy Management - Good Battery Life
Energy Consumption
During idle, similarly equipped competitors show similar consumption values with the Alienware drawing slightly more and the Lenovo Legion Pro drawing slightly less power. When playing Witcher 3, the Omen's power draw is lower and during the stress test slightly higher compared to its competitors. The consumption values match our expectations overall.
| Idle | |
| Load |
|
Key:
min: | |
| HP Omen 16-b0085ng i7-11800H, GeForce RTX 3070 Laptop GPU, Intel Optane Memory H10 with Solid State Storage 32GB + 512GB HBRPEKNX0202A(L/H), IPS, 1920x1080, 16.1" | HP Omen 15-en0375ng R7 4800H, GeForce RTX 2060 Mobile, WDC PC SN730 SDBPNTY-512G, IPS, 1920x1080, 15.6" | HP Victus 16-e0179ng R7 5800H, GeForce RTX 3060 Laptop GPU, WDC PC SN730 SDBPNTY-1T00, IPS, 1920x1080, 16.1" | Lenovo Legion 5 Pro 16ACH6H (82JQ001PGE) R7 5800H, GeForce RTX 3070 Laptop GPU, WDC PC SN730 SDBPNTY-1T00, IPS, 2560x1600, 16" | Alienware x15 RTX 3070 P111F i7-11800H, GeForce RTX 3070 Laptop GPU, WDC PC SN730 SDBPNTY-512G, IPS, 2560x1440, 15.6" | MSI Katana GF66 11UG-220 i7-11800H, GeForce RTX 3070 Laptop GPU, Kingston OM8PDP3512B-AI1, IPS, 1920x1080, 15.6" | Average NVIDIA GeForce RTX 3070 Laptop GPU | Average of class Gaming | |
|---|---|---|---|---|---|---|---|---|
| Power Consumption | 22% | 16% | 2% | -26% | 12% | -22% | -17% | |
| Idle Minimum * (Watt) | 12 | 4 67% | 5 58% | 10.45 13% | 15.7 -31% | 8 33% | 15.6 ? -30% | 13.5 ? -13% |
| Idle Average * (Watt) | 18 | 9 50% | 10 44% | 14.92 17% | 20.3 -13% | 12 33% | 20.1 ? -12% | 19.3 ? -7% |
| Idle Maximum * (Watt) | 21 | 22 -5% | 20 5% | 16.02 24% | 43 -105% | 22 -5% | 29.4 ? -40% | 24.9 ? -19% |
| Load Average * (Watt) | 94 | 102 -9% | 108 -15% | 119.65 -27% | 94.4 -0% | 98 -4% | 110.8 ? -18% | 110 ? -17% |
| Witcher 3 ultra * (Watt) | 147 | 119 19% | 145 1% | 174.9 -19% | 167 -14% | 152 -3% | ||
| Load Maximum * (Watt) | 199 | 182 9% | 189 5% | 187.26 6% | 183.4 8% | 162 19% | 214 ? -8% | 256 ? -29% |
* ... smaller is better
Energy Consumption Witcher 3 / Stress Test
Battery Life
HP has installed an 83-Wh battery. For the battery tests, we switched to the hybrid mode, enabling Optimus. Despite being equipped with slightly bigger batteries in some cases, neither the Alienware, nor the Legion, nor the MSI Katana last as long as our Omen. The Victus comes with a smaller 70-Wh battery and significantly shorter battery life despite its weaker hardware.
Our test device allows for around 7.5 hours of Wi-Fi browsing at reduced brightness and at 5.5 hours, movie nights are not a problem either. For a gaming device, the battery runtimes are decent and almost match the class averages, which are not usually met by laptops in this price category, as the direct competition shows.
| HP Omen 16-b0085ng i7-11800H, GeForce RTX 3070 Laptop GPU, 83 Wh | HP Omen 15-en0375ng R7 4800H, GeForce RTX 2060 Mobile, 70.9 Wh | HP Victus 16-e0179ng R7 5800H, GeForce RTX 3060 Laptop GPU, 70 Wh | Lenovo Legion 5 Pro 16ACH6H (82JQ001PGE) R7 5800H, GeForce RTX 3070 Laptop GPU, 80 Wh | Alienware x15 RTX 3070 P111F i7-11800H, GeForce RTX 3070 Laptop GPU, 87 Wh | MSI Katana GF66 11UG-220 i7-11800H, GeForce RTX 3070 Laptop GPU, 90 Wh | Average of class Gaming | |
|---|---|---|---|---|---|---|---|
| Battery runtime | 34% | -15% | -29% | -28% | -22% | 14% | |
| H.264 (h) | 5.4 | 7.93 ? 47% | |||||
| WiFi v1.3 (h) | 7.6 | 10.5 38% | 5.9 -22% | 7 -8% | 6.1 -20% | 5.3 -30% | 6.73 ? -11% |
| Load (h) | 1.4 | 1.8 29% | 1.3 -7% | 0.7 -50% | 0.9 -36% | 1.2 -14% | 1.502 ? 7% |
| Reader / Idle (h) | 20 | 8.5 | 9.1 | 9.7 | 9.1 | 8.99 ? |
Pros
Cons
Verdict - Strong Performer with Small Mistakes
The Omen 16 has proven to be a fairly good mid-range gaming laptop with all-around improvements compared to the Omen 15. The high overall performance level across all use cases, the long battery life, and the good FHD display constitute the main advantages of this HP laptop. The main drawbacks are the faulty touchpad (one-off?) and the high latencies that can be observed even after just opening the browser. Furthermore, the useless, preinstalled 30-day trial versions of various software also fall under the category "unnecessary".
The Omen 16 is a good gaming laptop overall and reaches a very high performance level. However, there is still work to be done when it comes to the drivers and the touchpad.
Compared to HP's own, cheaper Victus 16, the Omen 16's price premium may be justifiable due to its metal base, better connectivity (USB 4 with Thunderbolt 4), an around 30 percent faster GPU performance, better keyboard layout (albeit without numpad) and slightly more lightweight build despite the more potent hardware. Meanwhile, both models share a good display and a similar CPU performance.
Price and availability
An HP Omen 16 configuration similar to ours with an RTX 3070 is listed on BestBuy for around $1800 USD and expected to become available in the coming weeks.
HP Omen 16-b0085ng
- 10/06/2021 v7 (old)
Christian Hintze
Price comparison

